state mussel watch program
TRANSCRIPT


STATE MUSSEL WATCH PROGRAM
1993 – 1995 DATA REPORT
96-2WQ
Prepared by Del Rasmussen
Division of Water Quality
Field and Laboratory Operations Conducted by the Moss Landing Laboratory and
Water Pollution Control Laboratory California Department of Fish and Game
STATE WATER RESOURCES CONTROL BOARD CALIFORNIA ENVIRONMENTAL PROTECTION AGENCY

ii
ACKNOWLEDGEMENTS The State Water Resources Control Board wishes to acknowledge the contributions of the following individuals to the 1993-95 State Mussel Watch Program: Department of Fish and Game, Moss Landing and Water Pollution Control Laboratories Project Director: Mark Stephenson Field Support: Gary Ichikawa Jon Goetzl Laboratory Support: Dave Crane Jim Kanihan Gary Munoz Kim Paulson Mark Pranger Kathleen Regalado Laurie Smith State Water Resources Control Board Graphic Support: Dale Oliver

iii
State Mussel Watch Program - 1993-95 Data Report
TABLE OF CONTENTS
Page Acknowledgements ........................................................................................................................................... ii List of Appendices ............................................................................................................................................. iv List of Tables .....................................................................................................................................................v List of Abbreviations ..........................................................................................................................................vii 1. 1993 - 1995 PROGRAM Introduction ........................................................................................................................................................1 Summary 1 2. FIELD AND LABORATORY OPERATIONS ..................................................................................3 Substances Measured.......................................................................................................................................3 Sample Size and Collection ..............................................................................................................................3 Dry, Wet, and Lipid Weight Measurements......................................................................................................4 3. ADMINISTRATIVE AND COMPARATIVE CRITERIA ...................................................................5 FDA Action Levels and NAS Guidelines ...........................................................................................................5 Maximum Tissue Residue Levels (MTRLs)......................................................................................................5 Median International Standards (MIS) for Trace Elements ..............................................................................6 Elevated Data Levels (EDLs) ............................................................................................................................6 4. LITERATURE CITED.......................................................................................................................16

iv
State Mussel Watch Program - 1993-95 Data Report
APPENDICES
Page Appendix A - Maps Showing 1993-95 Station Locations .......................................................................... A-1 Appendix B - 1993-95 Sampling Stations - Latitude and Longitude ......................................................... B-1 Appendix C - 1993-95 Sample Information ............................................................................................... C-1 Appendix D - Station Sampling History...................................................................................................... D-1 Appendix E - Summary of 1993-95 Data: Organic Chemicals
Exceeding Selected Criteria (ppb, wet weight) .................................................................... E-1 Appendix F - Summary of 1993-95 Data: Organic Chemicals Exceeding
Maximum Tissue Residue Levels (MTRLs) in Ocean Waters (ppb, wet weight) .................................................................................................................. F-1
Appendix G - Summary of 1993-95 Data: Organic Chemicals Exceeding
Maximum Tissue Residue Levels (MTRLs) in Enclosed Bays and Estuaries (ppb, wet weight).................................................................................. G-1
Appendix H - Summary of 1993-95 Data: Trace Elements Exceeding the
Median International Standards (MIS) (ppm, wet weight) ................................................................................................................. H-1
Appendix I - Summary of 1993-95 Data: Trace Elements
Exceeding Elevated Data Levels (EDLs) (ppm, wet weight) ................................................................................................................. I-1
Appendix J - Summary of 1993-95 Data: Trace Elements in Mussels
and Sediment (ppm, wet weight) ......................................................................................... J-1 Appendix K - Summary of 1993-95 Data: Trace Elements in Mussels
and Sediment (ppm, dry weight) .......................................................................................... K-1 Appendix L - Summary of 1993-95 Data: Organic Chemicals in Mussels
and Sediment (ppb, wet weight) .......................................................................................... L-1 Appendix M - Summary of 1993-95 Data: Organic Chemicals in Mussels
and Sediment (ppb, dry weight) ........................................................................................... M-1

v
State Mussel Watch Program - 1993-95 Data Report
APPENDICES (continued)
Page Appendix N - Summary of 1993-95 Data: Organic Chemicals in Mussels
(ppb, lipid weight) ................................................................................................................. N-1 Appendix O - Summary of 1993-95 Data: PAHs in Mussels
and Sediment (ppb, wet weight) .......................................................................................... O-1 Appendix P - Summary of 1993-95 Data: PAHs in Mussels
and Sediment (ppb, dry weight) ........................................................................................... P-1 Appendix Q - Summary of 1993-95 Data: PAHs in Mussels
(ppb, lipid weight) ................................................................................................................. Q-1 Appendix R - Field and Laboratory Operations ......................................................................................... R-1 Appendix S - Median International Standards ........................................................................................... S-1 Appendix T - Elevated Data Levels ........................................................................................................... T-1
LIST OF TABLES Table 1. NAS Guidelines and FDA Action Levels For
Toxic Chemicals in Shellfish (wet weight)............................................................................ 7 Table 2. Maximum Tissue Residue Levels (MTRLs) For
Carcinogens in Ocean Waters............................................................................................. 8 Table 3. Maximum Tissue Residue Levels (MTRLs) in
Enclosed Bays and Estuaries .............................................................................................. 9 Table 4. Median International Standards for Trace
Elements (edible portion, ppm, wet weight)......................................................................... 10 Table 5. SMWP EDL 85 and EDL 95 for Trace Elements in
California Mussels (Mytilus californianus). Calculated Using 1977-1995 Data (ppm, wet weight) ......................................................... 11

vi
State Mussel Watch Program - 1993-95 Data Report
LIST OF TABLES (continued)
Page Table 6. SMWP EDL 85 and EDL 95 for Trace Elements in
Bay Mussels (Mytilus edulis) Calculated Using 1977-1995 Data (ppm, wet weight) ......................................................... 12
Table 7. SMWP EDL 85 and EDL 95 for Organic Chemicals in
Resident California Mussels (Mytilus californianus). Calculated Using 1977-1995 Data (ppb, wet weight) .......................................................... 13
Table 8. SMWP EDL 85 and EDL 95 for Organic Chemicals in
Transplanted California Mussels (Mytilus californianus). Calculated Using 1977-1995 Data (ppb, wet weight) .......................................................... 14
Table 9. SMWP EDL 85 and EDL 95 for Organic Chemicals in
Resident Bay Mussels (Mytilus edulis) Calculated Using 1977-1995 Data (ppb, wet weight) .......................................................... 15

vii
State Mussel Watch Program - 1993-95 Data Report
LIST OF ABBREVIATIONS
DDD Dichlorodiphenyldichloroethane DDE Dichlorodiphenyldichloroethylene DDT Dichlorodiphenyltrichloroethane DDMS Dichlorodiphenylmonochlorosaturatedethane DDMU Dichlorodiphenylmonochlorounsaturatedethane DFG California Department of Fish and Game EDL Elevated Data Level(s) FDA or (USFDA) United States Food and Drug Administration HCH Hexachlorocyclohexane MIS Median International Standard(s) MTRL Maximum Tissue Residue Level(s) NAS National Academy of Sciences PAH Polynuclear Aromatic Hydrocarbon(s) PCB Polychlorinated Biphenyl(s) PCP Pentachlorophenol PCT Polychlorinated Terphenyl ppb Parts Per Billion (ng/g) ppm Parts Per Million (�g/g) RWQCB Regional Water Quality Control Board(s) SMWP State Mussel Watch Program SWRCB State Water Resources Control Board TCP Tetrachlorophenol TBT Tributyltin USEPA United States Environmental Protection Agency

1
1. STATE MUSSEL WATCH PROGRAM 1993 - 1995
Introduction The California State Mussel Watch Program (SMWP), initiated in 1977 by the State Water Resources Control Board (SWRCB), was organized to provide a uniform statewide approach to the detection and evaluation of the occurrence of toxic substances in the waters of California’s bays, harbors, and estuaries. This is accomplished through the analysis of transplanted and resident mussels and clams. The SMWP primarily targets areas with known or suspected impaired water quality and is not intended to give an overall water quality assessment. The California Department of Fish and Game (DFG) carries out the statewide SMWP for the SWRCB by collecting and analyzing samples. The SWRCB provides funding under an ongoing interagency agreement with the DFG. Sampling stations are selected primarily by the six coastal Regional Water Quality Control Boards (RWQCB) which are identified on the inside back cover. The DFG reports annual sampling results to the SWRCB which distributes the information to the coastal RWQCBs and to other federal, State, and local agencies through annual preliminary data reports. These preliminary data reports are also routinely transmitted to the Office of Environmental Health Hazard Assessment of the California Environmental Protection Agency which has responsibility for evaluating pollutant levels based on human health concerns and issuing consumption health advisories if indicated. This report is the formal report presenting the results of the 1993-94 and 1994-95 sampling and analysis programs. Information collected in the SMWP is used by the SWRCB, RWQCB, and other agencies to identify waters impacted by toxic pollutants. Through the SWRCB’s statewide Water Quality Assessment, SMWP results are used to help classify water bodies from good to impaired water quality relative to each other. SMWP results are also used in the SWRCB’s Bay Protection Program in helping identify “Toxic Hot Spots”. Lastly, SMWP results are used in the normal regulatory activities of the RWQCBs and other State agencies such as the Department of Pesticide Regulation. Summary Appendix A shows area map locations for each station sampled from September 1993 through April 1995. Also included are map locations of five stations in the San Francisco Bay Region (Region 2) where archive samples collected in 1982, 1985, and 1988 were analyzed. Appendix B contains station location information such as latitude and longitude, county, and region identification. A total of 67 samples from 43 stations were analyzed (Appendix C) including eight archive mussel samples and four sediment samples. Samples were analyzed for trace elements (metals), organic chemicals (pesticides and PCBs), polynuclear aromatic hydrocarbons (PAHs), and tributyltin (TBT). Forty-six of the samples were transplanted California mussels (Mytilus californianus), 15 were resident California mussels samples, and two were resident bay mussels (Mytilus edulis) samples. No freshwater clams were collected or analyzed in the 1993-94 and 1994-95 programs. A complete station sampling history of the SMWP from 1978 to 1995 is provided in Appendix D.

2
Wet weight sampling results were compared to the following criteria: U.S. Food and Drug Administration (FDA) criteria, Maximum Tissue Residue Levels (MTRLs), Median International Standards (MIS), and Elevated Data Levels (EDLs). Data were not compared to the National Academy of Sciences (NAS) recommended guidelines for predator protection since no freshwater shellfish were collected in 1993-95. A discussion of each criterion can be found in Section 3, Administrative and Comparative Criteria on Page 5. The MTRL criterion was developed from water quality objectives from the 1990 California Ocean Plan (SWRCB 1990a), the Draft November 26, 1990 Functional Equivalent Document - Development of Water Quality Plans For: Inland Surface Waters of California and Enclosed Bays and Estuaries of California (SWRCB 1990b), and the Draft April 9, 1991 Supplement to the Functional Equivalent Document (SWRCB 1991). Only one sample collected from 1993 to 1995 exceeded FDA criteria (Appendix E). Transplanted California mussels collected in 1995 from San Diego Bay/Harbor Island/East Basin/Storm Drain contained 2,305 ppb PCBs which exceeded the FDA tolerance level of 2,000 ppb for PCBs. A similar sample collected in 1988 from the same location also exceeded the FDA tolerance level for PCBs containing 2,738 ppb PCBs. MTRL criteria for ocean waters were exceeded in 16 samples from 9 stations (Appendix F). MTRLs for enclosed bays and estuaries were exceeded in 39 samples from 26 stations (Appendix G) including all eight archive samples from five stations in Region 2. The MIS for trace elements were exceeded in 59 samples from 40 stations including at least one sample from all archive stations (Appendix H). Samples exceeding EDLs for trace elements and organic chemicals can be found in Appendices I and E. Tabular summaries of all chemistry data are provided in Appendices J through Q. Summaries of all trace element data are provided in Appendix J (wet weight) and Appendix K (dry weight). Summaries of all organic chemical data are provided in Appendix L (wet weight), Appendix M (dry weight), and Appendix N (lipid weight). PAH data summaries can be found in Appendix O (wet weight), Appendix P (dry weight), and Appendix Q (lipid weight).

3
2. FIELD AND LABORATORY OPERATIONS
The presence of many toxic substances in the State’s waters is determined by analyzing tissues from aquatic organisms. Concentrations of these substances in water are often too low or transitory to be reliably detected through the more traditional methods of analysis of water samples. Also, many toxic substances are not water soluble, but can be found associated with sediment or organic matter. Aquatic organisms are sampled because they bioaccumulate and bioconcentrate toxic substances to levels which may be many hundreds of times the levels actually in the water. This concentration factor facilitates detection of toxic pollutants. Mussels are excellent subjects for this purpose because they (1) are sessile, (2) are long-lived, (3) can be successfully transplanted to and maintained in areas where they do not naturally occur, and (4) reliably concentrate toxic pollutants from the water. The following is a general overall discussion of field and laboratory procedures. A detailed discussion is provided in Appendix R. Substances Measured Samples are regularly analyzed for up to 13 trace elements (Table R-1) and approximately 45 synthetic organic chemicals including pesticides and PCBs (Table R-6). Arsenic, nickel, selenium, polynuclear aromatic hydrocarbons (PAHs), pentachlorophenol (PCP), and tetrachlorophenol (TCP), and tributyltin (TBT) are looked for on a request basis only. Not every sample is analyzed for all trace elements or organic chemicals. Each sample at each station is handled individually. The requesting agency, usually the RWQCBs, will specify the type of analysis for each sample. Sample Size and Collection Forty-five mussels or clams are composited and analyzed for organic chemicals. Three analytical replicates of 15 individuals each of mussels or clams are analyzed for trace elements (trace element results reported herein are mean values). Concentrations in bivalves of certain trace elements and organic chemicals can be directly correlated with several variables such as size of the animal, location of habitation within the tidal zone, and season of collection (Stephenson et al. 1987). In the SMWP, mussels of 55 to 65 mm in length are collected whenever possible in order to reduce size-related effects. In an attempt to minimize variability introduced by location of collection within the intertidal zone, mussels are collected from the highest point in the zone where adequate numbers occur. Mussels are transplanted where a suitable resident population does not exist and where sampling can be accomplished using scuba equipment. The mussel transplant system used is one of the following three systems; 1) In an area of deep water and no structures, a bottom anchored submerged buoy system is used; 2) In areas with structures (i.e. pilings, floating docks, etc.), a polypropylene line may be tied between two pilings or a line hung beneath a dock; 3) In areas of shallow water, samples may be placed on PVC or wooden stakes that are pounded into the substrate. A two month transplant period is adequate in most cases where pollutant uptake rates are expected to be high, but for trace elements in less contaminated environments a six month interval may be necessary for an adequate sample (Stephenson et al. 1980). A four to six month transplant interval is used for organic chemicals to be consistent with transplant periods for trace elements. Transplanted mussels (M. californianus) were collected from Trinidad Head and Bodega Head.

4
Dry, Wet, and Lipid Weight Measurements Metal data are presented in parts per million (ppm) while organic chemical data are presented in parts per billion (ppb). Tissue concentrations of trace elements and organic chemicals are measured on a dry weight basis to reduce data variability due to moisture content. Wet and lipid data are back calculated from dry weight measurements. Wet weight data are used to compare to wet weight or fresh weight criteria listed in this report (see Section 3, Administrative and Comparative Criteria). In addition, organic chemicals are expressed on a lipid weight basis. Lipid weight measurements offer several advantages. Because chlorinated hydrocarbons are much more soluble in lipids (fat tissues) than in water, they partition into lipid-rich tissues of aquatic organisms (Stout and Beezhold 1981). Animals with higher proportions of lipid in their tissue usually have had higher concentrations of chlorinated hydrocarbon pollutants (Phillips 1980). Factors such as season, water temperature, health of the organism, stress on the organism, and type of species can affect the lipid levels of samples collected for analysis and can, therefore, cause variability in results. Use of lipid weight measurements may reduce this source of variability, although disadvantages have also been noted (Phillips 1980). As a result, lipid weight values may represent a more realistic measure of environmental availability of chlorinated hydrocarbons than wet weight values. Wet weight measures, however, remain the preferred measure for most readers because all criteria for human health and for predator protection are based on wet weight measures. Also, wet weight measures better reflect the exposure of predators or humans to the actual concentration in fresh mussels or clams.

5
3. ADMINISTRATIVE AND COMPARATIVE CRITERIA In this report the term “criteria” is used to refer to the criteria against which a particular trace element or organic chemical is being compared. More than one criterion may apply to any one metal or organic compound. In general, FDA action levels, Maximum Tissue Residue Levels (MTRLs), and Median International Standards (MIS), all human health-related criteria, are considered more important or critical. Following human health criteria are NAS guidelines for predator protection and Elevated Data Levels (EDLs). All five criteria are discussed below. In interpreting the SMWP data by any of the criteria provided, the reader is cautioned that there is no simple relationship between concentrations of toxic substances observed in tissue samples and actual concentrations in water. Different aquatic organisms tend to bioaccumulate a given toxic substance in water to different levels; however, the differences usually do not prevent a general interpretation of the data. The reader is cautioned that the limited number of samples obtained and analyzed at each station in a single year is generally too small to provide a statistically sound basis for making absolute statements on toxic substance concentrations. The values reported herein should be accepted as indicators of relative levels of toxic pollution in water, not as absolute values. In this sense, trends over time and ranking values of a toxic substance provide only an indication of areas where mussels are evidently accumulating concentrations which are above normal. FDA Action Levels and NAS Guidelines The FDA has established maximum concentration levels for some toxic substances in human foods (USFDA 1985). The levels are based on specific assumptions of the quantities of food consumed by humans and the frequency of their consumption. The FDA limits are intended to protect humans from the chronic effects of toxic substances consumed in foodstuffs. The National Academy of Sciences (NAS) has established recommended maximum concentrations of toxic substances in animals (NAS 1973). They were established not only to protect the organisms containing the toxic compounds, but also to protect the species that consume these contaminated organisms. The NAS has set guidelines for marine fish but not for marine shellfish. Only two guidelines apply to freshwater clams. The FDA limits and NAS guidelines are shown in Table 1. Maximum Tissue Residue Levels (MTRLs) MTRLs were developed by SWRCB staff from human health water quality objectives in the 1990 California Ocean Plan (SWRCB 1990a), the Draft November 26, 1990 Functional Equivalent Document - Development of Water Quality Plans For: Inland Surface Waters of California and Enclosed Bays and Estuaries of California (SWRCB 1990b), and the Draft April 9, 1991 Supplement to the Functional Equivalent Document (SWRCB 1991). The objectives represent concentrations in water that protect against consumption of fish, shellfish, and water (freshwater only) that contain substances at levels which could result in significant human health problems. MTRLs are used as alert levels or guidelines indicating water bodies with potential human health concerns and are an assessment tool and not compliance or enforcement criteria. Tables 2 and 3 lists MTRLs for those substances monitored in ocean waters and enclosed bays and estuaries. The MTRLs for a number of substances listed as carcinogens in the MTRL tables are below the current tissue detection limit for those substances. Detection limits can be found in

6
Tables R-1, R-6, and R-10 in Appendix R. The MTRLs were calculated by multiplying the human health water quality objectives by the bioconcentration factor (BCF) for each substance as recommended in the USEPA Draft Assessment and Control of Bioconcentratable Contaminants in Surface Waters (USEPA 1991). BCFs were taken from the USEPA 1980 Ambient Water Quality Criteria Documents for each substance. MTRLs were not calculated for objectives that are based on maximum contaminant levels (MCLs) or taste and odor criteria. Median International Standards (MIS) for Trace Elements The MIS is an in-house criterion developed from a Food and Agriculture Organization of the United Nations publication of a survey of health protection criteria used by member nations (Nauen 1983). A description of how the Median International Standards were compiled by SWRCB staff is provided in Appendix S. These criteria vary somewhat in the tissues to be analyzed or the level of protection desired but may be compared qualitatively. Table 4 summarizes these standards as an indication of what other countries have determined to be unsafe levels of trace elements. Though the standards do not apply within the United States, they provide an indication of what other nations consider to be an elevated concentration of trace elements in shellfish. Elevated Data Levels The “elevated data level” (EDL) was introduced by SWRCB staff in 1983 as an internal comparative measure which ranks a given concentration of a particular substance with previous data from the SMWP. The EDL is calculated by ranking all of the results for a species and exposure condition (resident or transplant) and a given chemical from the highest concentration measured down to and including those records where the chemical was not detected. From this, a cumulative distribution is constructed and percentile rankings are calculated. For example, the 50th percentile corresponds to the median or “middle” value rather than to the mean. With a large number of records, the median can be approximately compared to the mean. The 85th percentile (EDL 85) was chosen as an indication that a chemical is markedly elevated from the median. The 85th percentile corresponds to measures used by the U.S. Fish and Wildlife Service in its National Contaminant Biomonitoring Program and would represent approximately one and one-half standard deviations from the mean, if the data were normally distributed. The 95th percentile (EDL 95) was chosen to indicate values that are highly elevated above the median. The 95th percentile would represent two standard deviations from the mean, if the data were normally distributed. When used along with other information, these measures provide a useful guideline to determine if a chemical has been found in unusually high concentrations. A more detailed description of EDL rankings is provided in Appendix T. The reader is cautioned that EDLs are not directly related to potentially adverse human or animal health effects; they are only a way to compare findings in a particular area with the larger data base of findings from all over the state. The 1977-95 EDLs and the number of data points used to calculate each EDL are provided in Tables 5 through 9.

7
TABLE 1
NAS Guidelines and FDA Action Levels for Toxic Chemicals in Shellfish (wet weight)
NASa FDAb Recommended Guideline Action Level for for Freshwater Shellfish Freshwater and Marine Shellfish Chemical �g/g (ppm) ng/g (ppb) �g/g (ppm) ng/g (ppb) Mercury - - 1.0c 1,000 DDT (total) 1.0 1,000 - - PCB (total) 0.5 500 2.0d 2,000 aldrin - - 0.3 300 dieldrin - - 0.3 300 endrin - - 0.3 300 heptachlor - - 0.3 300 heptachlor epoxide - - 0.3 300
a National Academy of Sciences-National Academy of Engineering. 1973. Water Quality Criteria, 1972 (Blue Book).
U.S. Environmental Protection Agency, Ecological Research Series. b U. S. Food and Drug Administration. 1984. Shellfish Sanitation Interpretation: Action Levels for Chemical and
Poisonous Substances, June 21, 1984. U.S.F.D.A., Shellfish Sanitation Branch, Washington, D.C. c As methyl mercury. d A tolerance, rather than an action level, has been established for PCBs (21CFR 109, published May 29, 1984). An
action level is revoked when a regulation establishes a tolerance for the same substance and use.

8
TABLE 2
Maximum Tissue Residue Levels (MTRLs) in Ocean Waters
Carcinogens a Water Quality Objective b BCF c MTRL d Substance (�g/l) (l/kg) (�g/kg, ppb wet weight) aldrin 0.000022 e 0.1 chlordane (total) 0.000023 14100 0.32 DDT (total) 0.00017 53600 9.1 dieldrin 0.00004 4670 0.2 heptachlor 0.00072 11200 8.1 hexachlorobenzene (HCB) 0.00021 8690 2.0 PAHs (total) 0.0088 30 0.26 PCBs (total) 0.000019 31200 0.6 toxaphene 0.00021 13100 2.75 a. The SMWP does not analyze for any of the non-carcinogens listed in the human health section of Table B of the 1990
Ocean Plan. b. From Table B, Objectives for Human Health, “California Ocean Plan” (SWRCB 1990a). c. Bioconcentration Factors taken from the USEPA 1980 Ambient Water Quality Criteria Documents for each substance. d. MTRLs were calculated by multiplying the Water Quality Objective by the BCF, except for aldrin. e. Aldrin MTRL is derived from a combination of aldrin and dieldrin risk factors and BCFs as recommended in the USEPA
1980 “Ambient Water Quality Criteria for Aldrin/Dieldrin” (USEPA 1980).

9
TABLE 3
Maximum Tissue Residue Levels (MTRLs) in Enclosed Bays and Estuaries
Carcinogens
Water Quality Objective a BCF b MTRL c Substance (�g/l) (l/kg) (�g/kg, ppb) aldrin 0.00014 d 0.33 chlordane (total) 0.000081 14100 1.2 DDT (total) 0.0006 53600 32.0 dieldrin 0.00014 4670 0.7 heptachlor 0.00017 11200 1.9 heptachlor epoxide 0.00007 11200 0.8 hexachlorobenzene (HCB) 0.00069 8690 6.0 hexachlorocyclohexane (HCH), alpha 0.0013 130 1.7 hexachlorocyclohexane (HCH), beta 0.046 130 6.0 hexachlorocyclohexane (HCH), gamma 0.062 130 8.1 PAHs (total) 0.031 30 0.93 PCBs (total) 0.00007 31200 2.2 pentachlorophenol (PCP) 8.2 11 90.0 toxaphene 0.00069 13100 9.0
Non-carcinogens
Water Quality Objective a BCF b MTRL c Substance (mg/l) (l/kg) (mg/kg, ppm) endosulfan (total) 0.002 270 0.5 (500 ppb) endrin 0.0008 3970 3.2 (3,200 ppb) mercury 0.000025 e 1.0 nickel 4.6 47 220.0 a. From the Draft November 26, 1990 Functional Equivalent Document - Development of Water Quality Plans For: Inland
Surface Waters of California and Enclosed Bays and Estuaries of California (SWRCB 1990b), the Draft April 9, 1991 Supplement to the Functional Equivalent Document (SWRCB 1991).
b. Bioconcentration Factors taken from the USEPA 1980 Ambient Water Quality Criteria Documents for each substance. c. MTRLs were calculated by multiplying the Water Quality Objective by the BCF, except for aldrin and mercury. d. Aldrin MTRL is derived from a combination of aldrin and dieldrin risk factors and BCFs as recommended in the USEPA
1980 “Ambient Water Quality Criteria for Aldrin/Dieldrin” (USEPA 1980). e. The MTRL for mercury is the FDA action level. The water quality objective for mercury in the Enclosed Bays and
Estuaries Plan is based on the FDA action level as recommended in the USEPA 1985 “Ambient Water Quality Criteria for Mercury” (USEPA 1985).

10
TABLE 4
Median International Standards for Trace Elementsa (edible portion, ppm, wet weight)
Freshwater Number of Countries Element Fish Shellfish Range with Standards
Arsenic 1.5 1.4 0.1 to 5.0 11 Cadmium 0.3 1.0 0.05 to 2.0 10 Chromium 1.0 1.0 1.0 1 Copper 20.0 20.0 10 to 100 8 Lead 2.0 2.0 0.5 to 10.0 19 Mercury 0.5 0.5 0.1 to 1.0 28 Selenium 2.0 0.3 0.3 to 2.0 3 Zinc 45.0 70.0 40 to 100 6
a Based on: Nauen, C. C., Compilation of Legal Limits for Hazardous Substances in Fish and Fishery Products, Food and Agriculture Organization of the United Nations, 1983.

11
TABLE 5 State Mussel Watch Program
EDL 85 and EDL 95 for Trace Elements in California Mussels (Mytilus californianus) Calculated Using 1977 - 1995 Data
(ppm, wet weight)
Resident Number of Element EDL 85 EDL 95 Samples Aluminum 77.90 127.96 589 Arsenic 3.79 4.94 133 Cadmium 1.50 2.03 589 Chromium 0.53 0.93 588 Copper 1.55 2.01 589 Lead 0.96 2.49 588 Manganese 2.06 2.80 589 Mercury 0.06 0.11 586 Nickel 0.62 0.82 277 Selenium 0.53 0.83 51 Silver 0.45 1.55 589 Titanium 5.71 9.95 167 Zinc 33.67 38.87 589
Transplanted
Number of Element EDL 85 EDL 95 Samples Aluminum 130.00 224.27 906 Arsenic 2.24 3.39 214 Cadmium 1.59 1.93 906 Chromium 0.63 1.36 905 Copper 5.00 11.82 906 Lead 1.57 2.72 914 Manganese 4.53 6.09 906 Mercury 0.06 0.08 896 Nickel 0.72 0.99 214 Selenium 0.61 0.87 136 Silver 0.10 0.19 906 Titanium 7.55 14.65 139 Zinc 54.48 76.86 906

12
TABLE 6 State Mussel Watch Program
EDL 85 and EDL 95 for Trace Elements in Bay Mussels (Mytilus edulis) Calculated Using 1977 - 1995 Data
(ppm, wet weight)
Resident
Number of Element EDL 85 EDL 95 Samples Aluminum 134.53 189.92 88 Arsenic IS IS 6 Cadmium 1.02 1.25 88 Chromium 0.52 1.18 88 Copper 2.15 3.76 88 Lead 1.85 4.39 88 Manganese 5.08 6.53 88 Mercury 0.05 0.09 87 Nickel 0.74 0.97 22 Selenium IS IS 7 Silver 0.06 0.16 88 Titanium IS IS 1 Zinc 43.14 53.86 88
IS = Insufficient number of samples to calculate an EDL.

13
TABLE 7 State Mussel Watch Program
EDL 85 and EDL 95 for Organic Chemicals in Resident California Mussels (Mytilus californianus) Calculated Using 1977 - 1995 Data
(ppb, wet weight) Number of Chemical EDL 85 EDL 95 Samples Aldrin ND ND 165 Chlordene, alpha ND ND 136 Chlordene, gamma ND ND 135 cis-Chlordane 1.6 3.2 165 cis-Nonachlor 0.2 1.2 141 Oxychlordane 0.2 0.3 165 trans-Chlordane 1.3 2.2 165 trans-Nonachlor 1.4 2.3 165 Total Chlordane 4.4 7.6 175 Chlorbenside ND 0.5 130 Chlorpyrifos ND ND 164 Dacthal ND 0.4 164 DDD, o,p’ 1.2 2.0 287 DDD, p,p’ 3.1 7.5 287 DDE, o,p’ 5.8 12.3 168 DDE, p,p’ 30.3 105.1 287 DDMS, p,p’ ND 2.4 153 DDMU, p,p’ 4.4 8.9 168 DDT, o,p’ 0.4 1.2 287 DDT, p,p’ 1.8 3.4 287 Total DDT 46.0 128.9 297 Diazinon ND ND 138 Dichlorobenzophenone, p,p’ ND ND 80 Dicofol ND ND 54 Dieldrin 1.6 2.5 164 Endosulfan I 0.4 1.3 165 Endosulfan II ND ND 69 Endosulfan Sulfate ND ND 69 Total Endosulfan 0.3 1.3 175 Endrin ND ND 165 Ethion ND ND 80 HCH, alpha 1.3 1.7 165 HCH, beta ND 1.2 164 HCH, delta ND ND 164 HCH, gamma 0.2 0.3 164 Heptachlor ND ND 165 Heptachlor Epoxide ND ND 164 Hexachlorobenzene ND 0.03 165 Methoxychlor ND ND 164 Oxadiazon ND 0.5 55 Parathion, ethyl ND ND 137 Parathion, methyl ND ND 137 PCB 1248 ND ND 391 PCB 1254 14.6 33.3 391 PCB 1260 ND ND 391 Total PCB 15.1 34.9 391 PCT 5460 ND ND 69 Pentachlorophenol 1.2 2.7 14 Phenol 0.3 0.4 14 Tetrachlorophenol 1.1 3.0 14 Tetradifon ND ND 137 Toxaphene ND ND 165 Tributyltin ND ND 23
ND = EDL lies below the detection limit.

14
TABLE 8 State Mussel Watch Program
EDL 85 and EDL 95 for Organic Chemicals in Transplanted California Mussels (Mytilus californianus) Calculated Using 1977 - 1995 Data
(ppb, wet weight)
Number of Chemical EDL 85 EDL 95 Samples Aldrin ND ND 540 Chlordene, alpha 0.5 1.0 486 Chlordene, gamma 0.2 0.4 486 cis-Chlordane 7.3 13.4 543 cis-Nonachlor 2.2 3.9 493 Oxychlordane 0.4 0.9 543 trans-Chlordane 6.1 9.9 543 trans-Nonachlor 5.4 9.9 543 Total Chlordane 21.6 35.9 552 Chlorbenside ND 1.7 437 Chlorpyrifos 0.4 1.5 538 Dacthal 0.7 6.4 519 DDD, o,p’ 6.0 12.7 564 DDD, p,p’ 23.9 67.4 564 DDE, o,p’ 6.1 10.5 564 DDE, p,p’ 97.5 170.1 564 DDMS, p,p’ 3.4 6.2 533 DDMU, p,p’ 6.5 10.4 564 DDT, o,p’ 2.4 8.6 564 DDT, p,p’ 7.8 32.6 564 Total DDT 152.5 311.5 573 Diazinon ND ND 438 Dichlorobenzophenone, p,p’ ND ND 279 Dicofol ND ND 196 Dieldrin 6.0 18.2 520 Endosulfan I 1.2 23.5 524 Endosulfan II 1.4 15.4 270 Endosulfan Sulfate 8.4 26.8 271 Total Endosulfan 1.6 46.5 533 Endrin ND 1.4 517 Ethion ND ND 279 HCH, alpha 0.6 1.1 535 HCH, beta ND ND 519 HCH, delta ND ND 518 HCH, gamma 0.4 0.7 518 Heptachlor ND 0.03 535 Heptachlor Epoxide 0.2 0.5 535 Hexachlorobenzene ND 0.1 535 Methoxychlor ND ND 520 Oxadiazon 1.1 2.3 181 Parathion, ethyl ND ND 417 Parathion, methyl ND ND 417 PCB 1248 ND 28.3 704 PCB 1254 170.0 374.3 704 PCB 1260 ND ND 704 Total PCB 176.1 426.1 704 PCT 5460 ND ND 189 Pentachlorophenol 22.6 34.0 90 Phenol 0.5 0.9 37 Tetrachlorophenol 2.0 5.4 90 Tetradifon ND ND 423 Toxaphene ND 83.3 543 Tributyltin 1474.5 2639.3 150
ND = EDL lies below the detection limit.

15
TABLE 9 State Mussel Watch Program
EDL 85 and EDL 95 for Organic Chemicals in Resident Bay Mussels (Mytilus edulis) Calculated Using 1977 - 1995 Data
(ppb, wet weight) Number of Chemical EDL 85 EDL 95 Samples Aldrin ND 0.3 63 Chlordene, alpha 0.4 1.1 42 Chlordene, gamma 0.5 1.2 42 cis-Chlordane 11.9 17.9 64 cis-Nonachlor 2.8 4.5 53 Oxychlordane 0.5 0.9 64 trans-Chlordane 13.1 17.2 64 trans-Nonachlor 11.3 16.5 64 Total Chlordane 38.8 56.2 64 Chlorbenside ND 5.8 55 Chlorpyrifos ND 1.0 64 Dacthal 9.2 21.2 62 DDD, o,p’ 12.1 23.6 83 DDD, p,p’ 45.3 83.3 83 DDE, o,p’ 7.9 15.6 76 DDE, p,p’ 173.9 321.8 83 DDMS, p,p’ 3.1 5.3 74 DDMU, p,p’ 7.0 11.3 76 DDT, o,p’ 7.2 23.1 83 DDT, p,p’ 32.2 96.7 83 Total DDT 297.8 496.9 83 Diazinon ND ND 54 Dichlorobenzophenone, p,p’ ND ND 16 Dicofol IS IS 9 Dieldrin 12.2 22.2 61 Endosulfan I 93.6 125.9 64 Endosulfan II 53.1 74.3 27 Endosulfan Sulfate 48.7 72.6 26 Total Endosulfan 119.5 231.8 64 Endrin 2.4 4.1 62 Ethion ND ND 16 HCH, alpha 0.4 0.5 63 HCH, beta ND 0.3 62 HCH, delta ND ND 62 HCH, gamma 0.3 0.4 62 Heptachlor 0.2 0.6 63 Heptachlor Epoxide 0.2 0.5 63 Hexachlorobenzene 0.1 0.2 63 Methoxychlor ND ND 62 Oxadiazon 0.7 1.9 12 Parathion, ethyl ND ND 54 Parathion, methyl ND ND 54 PCB 1248 ND 14.0 88 PCB 1254 127.9 192.7 88 PCB 1260 ND ND 88 Total PCB 130.5 192.7 88 PCT 5460 ND ND 12 Pentachlorophenol IS IS 1 Phenol IS IS 0 Tetrachlorophenol IS IS 1 Tetradifon ND ND 53 Toxaphene 108.6 238.7 66 Tributyltin IS IS 5
ND = EDL lies below the detection limit. IS = Insufficient number of samples to calculate an EDL.

16
4. LITERATURE CITED (DFG) Department of Fish and Game. 1990. Laboratory Quality Assurance Program Plan (October 12,
1992 update). Environmental Services Division, California Department of Fish and Game. Sacramento, California.
Goldberg, E.D. 1980. The International Mussel Watch. National Academy of Sciences Publ.,
Washington,D.C. (NAS) National Academy of Sciences-National Academy of Engineering. 1973. Water Quality Criteria 1972
(Blue Book). EPA Ecological Research Series. EPA-R3-73-033. U.S. Environmental Protection Agency, Washington, D.C.
Nauen, C.E. 1983. Compilation of Legal Limits for Hazardous Substances in Fish and Fishery Products,
Circular No. 764. FIRI/C764, Food and Agricultural Organization of the United Nations. Phillips, D.J.H. 1980. Quantitative Aquatic Biological Indicators. Applied Science Publishers Ltd, Ripple
Road, Barking, Essex, England. Pages 38-90. Risebrough, R.W., B.W. deLappe, E.F. Letterman, J.L. Lane, M. Firestone-Gilles, A.M. Springer, and W.
Walker II. 1980. California State Mussel Watch 1977-1978. Volume III. Organic Pollutants in Mussels, Mytilus californianus and Mytilus edulis, along the California Coast. Water Quality Monitoring Report No. 79-22 . State Water Resources Control Board, California Environmental Protection Agency, Sacramento, California.
(SWRCB) State Water Resources Control Board. 1991. Draft Supplement Functional Equivalent Document - Development of Statewide Water Quality Control Plans: (1). Inland Surface Waters of
California and (2). Enclosed Bays and Estuaries of California. April 9, 1991. State Water Resources Control Board, California Environmental Protection Agency, Sacramento, California.
(SWRCB) State Water Resources Control Board. 1990a. California Ocean Plan - Water Quality Control
Plan, Ocean Waters of California. March 22, 1990. State Water Resources Control Board, California Environmental Protection Agency, Sacramento, California.
(SWRCB) State Water Resources Control Board. 1990b. Draft Functional Equivalent Document
Development of Water Quality Plans For: Inland Surface Waters of California and Enclosed Bays and Estuaries of California. November 26, 1990. State Water Resources Control Board, California Environmental Protection Agency, Sacramento, California.
Stephenson, M.D., D. Smith, G. Ichikawa, J. Goetzl, W. Laurendine, and M. Martin. 1987. State
MusselWatch Program Preliminary Data Report 1986-1987. California Department of Fish and Game, Monterey, California

17
LITERATURE CITED (continued) Stephenson, M.D., S.L. Coale, M. Martin, and J. H. Martin. 1980. California State Mussel Watch 1979-
1980. Trace metal concentrations in the California mussel, Mytilus californianus, and the Bay Mussel, Mytilus edulis, along the California coast and selected harbors and bays. Water Quality Monitoring Report No. 79-22. State Water Resources Control Board, California Environmental Protection Agency, Sacramento, California
Stout, V.F. and F.L. Beezhold. 1981. Chlorinated hydrocarbon levels in fishes and shellfishes of the
northeastern Pacific Ocean including the Hawaiian Islands. Mar. Fish. Rev. 43:1:1-12. (USEPA) U.S. Environmental Protection Agency. 1991. “Draft” Assessment and Control of
Bioconcentratable Contaminants in Surface Waters. March 1991. Office of Water, U.S. EPA, Washington, D.C.
(USEPA) U.S. Environmental Protection Agency. 1980. Ambient Water Quality Criteria for Aldrin/Dieldrin.
EPA 440/5-80-019. U.S. EPA, Office of Water Regulations and Standards, Washington, D.C. (USFDA) U.S. Food and Drug Administration, Bureau of Foods. 1985. Action Levels for Poisonous or
Deleterious Substances in Human Food and Animal Feed. USFDA, Washington, D.C.

B-1
APPENDIX B
1993-95 Sampling Stations - Latitude and Longitude

B-2
APPENDIX B State Mussel Watch Program
1993-95 Sampling Stations - Latitude and Longitude ______________________________________________________________________________________________ Station Station Region County Latitude Longitude Number Name (o ' ") (o ' ") ______________________________________________________________________________________________ 10.0 Trinidad Head 1 Humboldt 41 03 30 124 09 00 100.0 Mad River Slough 1 Humboldt 40 51 56 124 08 53 101.0 Samoa Bridge/West 1 Humboldt 40 49 24 124 10 10 103.0 Eureka Channel 1 Humboldt 40 47 20 124 11 17 202.0 Bodega Head 1 Sonoma 38 18 42 123 04 07 302.0 Point Pinole 2 Contra Costa 38 01 00 122 21 48 308.0 San Francisco Bay/Hunter's Point 2 San Francisco 37 41 42 122 20 27 309.0 San Mateo Bridge/8B 2 San Mateo 37 36 21 122 17 20 313.0 San Francisco Bay/near Redwood Cr 2 San Mateo 37 33 09 122 11 45 321.0 Dumbarton Bridge/Channel Marker 14 2 San Mateo 37 30 50 122 07 58 404.0 Sandholdt Bridge 3 Monterey 36 48 01 121 47 12 414.0 Pacific Grove 3 Monterey 36 38 18 121 55 46 420.0 Monterey Harbor/Coast Guard Jetty 3 Monterey 36 36 34 121 53 30 420.3 Monterey Harbor/C G Jetty/Inner 3 Monterey 36 36 30 121 53 31 421.0 Monterey Harbor/Slag Pile 3 Monterey 36 36 23 121 53 24 507.3 Mugu Lagoon/Calleguas Creek 4 Ventura 34 06 24 119 05 15 508.1 Mugu Drainage 1 4 Ventura 34 06 03 119 04 55 601.0 LA Harbor/National Stee 4 Los Angeles 33 45 41 118 15 07 602.0 LA Harbor/West Basin 4 Los Angeles 33 46 03 118 16 43 605.0 LA Harbor/Cabrillo Pier 4 Los Angeles 33 42 29 118 16 31 616.0 LA Harbor/Consolidated Slip 4 Los Angeles 33 46 36 118 14 30 618.0 LA Harbor/Angels Gate 4 Los Angeles 33 42 30 118 15 00 648.0 Malibu 4 Los Angeles 34 01 48 118 40 48 650.0 Santa Monica 4 Los Angeles 34 00 48 118 30 18 662.0 Royal Palms 4 Los Angeles 33 43 00 118 19 15 664.0 Cabrillo Beach 4 Los Angeles 33 42 22 118 17 11 682.0 Catalina Island/Ribbon Rock 4 Los Angeles 33 26 18 118 34 18 713.0 Huntington Harbour/Edinger Street 8 Orange 33 44 00 118 04 12 715.0 Huntington Harbour/Warner Ave Brdg 8 Orange 33 42 40 118 03 35 723.4 Newport Bay/Turning Basin 8 Orange 33 37 13 117 55 38 724.0 Newport Bay/Highway 1 Bridge 8 Orange 33 36 57 117 54 19 725.0 Newport Bay/Crows Nest 8 Orange 33 36 43 117 55 38 726.4 Newport Bay/Rhine Channel/End 8 Orange 33 36 51 117 55 35 750.0 Oceanside 9 San Diego 33 11 35 117 23 15 868.5 Mission Bay/Landfill 1 9 San Diego 32 45 00 117 13 22 868.6 Mission Bay/Landfill 2 9 San Diego 32 47 19 117 13 27 882.0 24th St Maritime Terminal/South 9 San Diego 32 39 24 117 07 18 883.1 San Diego Bay/Chollas Creek 9 San Diego 32 41 16 117 07 58 883.4 San Diego Bay/Continental Maritime 9 San Diego 32 41 38 117 08 58 883.5 San Diego Bay/Tuna Docks 9 San Diego 32 42 08 117 09 25 883.8 San Diego Bay/Switzer Creek 9 San Diego 32 41 54 117 09 29 894.0 SD Bay/Harbor Is/E Basin/Storm Dr 9 San Diego 32 43 38 117 11 05 899.0 San Diego Bay/Shelter Is/Fshg Pier 9 San Diego 32 42 42 117 13 42 ______________________________________________________________________________________________

�
C-1
APPENDIX C
1993-95 Sample Information

C-2
�
�
APPENDIX C State Mussel Watch Program 1993-95 Sample Information
_________________________________________________________________________________________________________________ Transplant Percent Percent Length Sample Station Station Sample Sample Duration Water Lipid (mm) Analysis Number Name Type* Date** (months) TE/SO TE/SO Type*** _________________________________________________________________________________________________________________ 10.0 Trinidad Head RCM 10/14/93 NA 80.7/84.1 0.78 52.2/57.7 TESO 10.0 Trinidad Head RCM 11/28/94 NA 81.3/79.9 0.87 52.2/56.7 TESO 100.0 Mad River Slough TCM 02/24/94 4.4 86.2/89.5 0.45 63.1/60.3 TESO 101.0 Samoa Bridge/West TCM 02/24/94 4.4 84.5/NA NA 52.8/NA TE 103.0 Eureka Channel TCM 02/24/94 4.4 84.1/84.0 0.87 56.0/56.9 TESO 202.0 Bodega Head RCM 09/16/93 NA 82.1/83.9 0.79 52.1/53.9 TESO 202.0 Bodega Head RCM 09/19/94 NA 85.6/85.0 0.53 50.8/55.2 TESO 302.0 Point Pinole TCM 02/02/82 5.7 NA/85.3 0.96 NA/62.3 SO 308.0 San Francisco Bay/Hunter's Point TCM 01/15/88 4.6 81.8/81.4 1.42 55.9/55.9 TESO 309.0 San Mateo Bridge/8B TCM 02/12/85 5.3 82.3/83.3 1.22 61.5/58.3 TESO 313.0 San Francisco Bay/near Redwood Cr TCM 02/12/85 5.3 84.6/85.1 1.22 62.5/62.5 TESO 313.0 San Francisco Bay/near Redwood Cr TCM 01/15/88 4.6 82.5/83.2 1.12 49.7/49.7 TESO 321.0 Dumbarton Bridge/Channel Marker 14 TCM 01/18/82 5.3 NA/88.0 0.98 NA/62.3 SO 321.0 Dumbarton Bridge/Channel Marker 14 TCM 02/12/85 5.3 86.2/85.3 1.02 62.7/64.7 TESO 321.0 Dumbarton Bridge/Channel Marker 14 TCM 01/15/88 4.6 NA/85.1 0.79 NA/58.3 SO 404.0 Sandholdt Bridge TCM 03/07/94 5.3 84.4/82.7 0.92 68.2/56.9 TESO 404.0 Sandholdt Bridge TCM 02/22/95 5.1 86.4/85.9 0.84 55.6/59.9 TESO 414.0 Pacific Grove RCM 04/14/94 NA 86.4/84.9 0.52 54.5/55.7 TESO 414.0 Pacific Grove RCM 04/19/95 NA 83.9/85.6 0.54 57.8/63.8 TESO 420.0 Monterey Harbor/Coast Guard Jetty TCM 05/26/94 1.4 78.9/80.4 0.59 57.3/51.9 TESO 420.3 Monterey Harbor/C G Jetty/Inner TCM 05/26/94 1.4 78.6/NA NA 54.1/NA TE 421.0 Monterey Harbor/Slag Pile TCM 05/26/94 1.4 84.1/NA NA 64.5/NA TE 507.3 Mugu Lagoon/Calleguas Creek TCM 02/08/94 4.2 85.2/87.0 0.64 57.2/54.7 TESO 508.1 Mugu Drainage 1 SED 01/31/95 NA 41.1/NA NA NA/NA TE 601.0 LA Harbor/National Steel SED 11/09/93 NA 45.5/46.2 NA NA/NA TESO 601.0 LA Harbor/National Steel TCM 02/08/94 4.2 88.2/89.9 0.50 54.7/57.0 TESO 601.0 LA Harbor/National Steel TCM 01/31/95 4.0 89.5/91.5 0.17 47.5/56.2 TESO 602.0 LA Harbor/West Basin TCM 02/08/94 4.2 87.3/89.2 0.46 51.9/54.9 TESO 605.0 LA Harbor/Cabrillo Pier SED 11/09/93 NA 48.0/52.1 NA NA/NA TESO 605.0 LA Harbor/Cabrillo Pier TCM 02/08/94 4.2 78.9/81.7 1.04 63.4/63.7 TESO 605.0 LA Harbor/Cabrillo Pier TCM 01/31/95 4.0 82.8/83.5 0.64 57.7/58.9 TESO 616.0 LA Harbor/Consolidated Slip SED 11/09/93 NA 52.5/54.2 NA NA/NA TESO 616.0 LA Harbor/Consolidated Slip TCM 02/08/94 4.2 87.2/90.1 0.42 57.3/56.5 TESO 616.0 LA Harbor/Consolidated Slip TCM 01/31/95 4.0 89.4/90.4 0.29 48.5/56.2 TESO 618.0 LA Harbor/Angels Gate RCM 02/08/94 NA 81.6/84.8 0.82 63.5/66.3 TESO 618.0 LA Harbor/Angels Gate RCM 01/31/95 NA 84.7/84.9 0.86 64.6/63.1 TESO 648.0 Malibu RBM 02/07/94 NA 82.2/83.4 1.76 47.7/48.9 TESO 648.0 Malibu RBM 01/31/95 NA 83.3/82.8 1.51 35.1/44.8 TESO _________________________________________________________________________________________________________________ * RCM = Resident California Mussel SED = Sediment *** TE = Trace Elements NA = Not Analyzed TCM = Transplanted California Mussel SO = Synthetic Organics RBM = Resident Bay Mussel TESO = Trace Elements & Synthetic Organics ** Samples with a collection date prior to 1993 are archive samples.
C-3
�
�
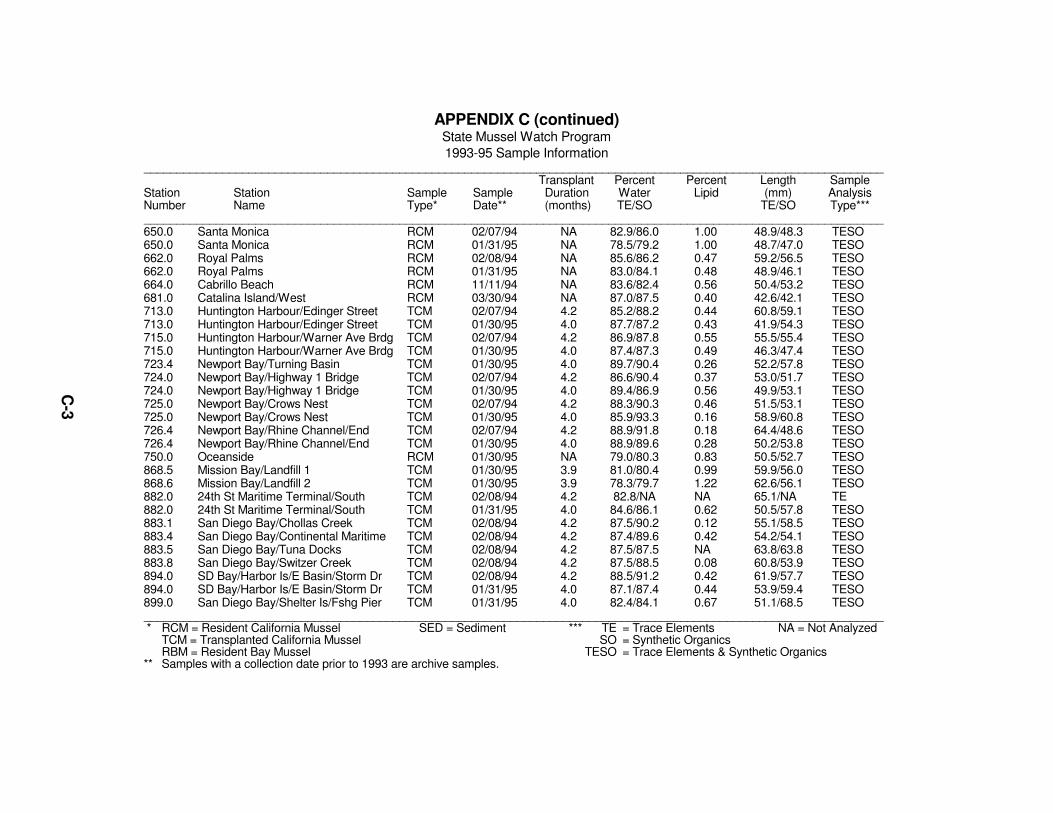
APPENDIX C (continued) State Mussel Watch Program 1993-95 Sample Information
_________________________________________________________________________________________________________________ Transplant Percent Percent Length Sample Station Station Sample Sample Duration Water Lipid (mm) Analysis Number Name Type* Date** (months) TE/SO TE/SO Type*** _________________________________________________________________________________________________________________ 650.0 Santa Monica RCM 02/07/94 NA 82.9/86.0 1.00 48.9/48.3 TESO 650.0 Santa Monica RCM 01/31/95 NA 78.5/79.2 1.00 48.7/47.0 TESO 662.0 Royal Palms RCM 02/08/94 NA 85.6/86.2 0.47 59.2/56.5 TESO 662.0 Royal Palms RCM 01/31/95 NA 83.0/84.1 0.48 48.9/46.1 TESO 664.0 Cabrillo Beach RCM 11/11/94 NA 83.6/82.4 0.56 50.4/53.2 TESO 681.0 Catalina Island/West RCM 03/30/94 NA 87.0/87.5 0.40 42.6/42.1 TESO 713.0 Huntington Harbour/Edinger Street TCM 02/07/94 4.2 85.2/88.2 0.44 60.8/59.1 TESO 713.0 Huntington Harbour/Edinger Street TCM 01/30/95 4.0 87.7/87.2 0.43 41.9/54.3 TESO 715.0 Huntington Harbour/Warner Ave Brdg TCM 02/07/94 4.2 86.9/87.8 0.55 55.5/55.4 TESO 715.0 Huntington Harbour/Warner Ave Brdg TCM 01/30/95 4.0 87.4/87.3 0.49 46.3/47.4 TESO 723.4 Newport Bay/Turning Basin TCM 01/30/95 4.0 89.7/90.4 0.26 52.2/57.8 TESO 724.0 Newport Bay/Highway 1 Bridge TCM 02/07/94 4.2 86.6/90.4 0.37 53.0/51.7 TESO 724.0 Newport Bay/Highway 1 Bridge TCM 01/30/95 4.0 89.4/86.9 0.56 49.9/53.1 TESO 725.0 Newport Bay/Crows Nest TCM 02/07/94 4.2 88.3/90.3 0.46 51.5/53.1 TESO 725.0 Newport Bay/Crows Nest TCM 01/30/95 4.0 85.9/93.3 0.16 58.9/60.8 TESO 726.4 Newport Bay/Rhine Channel/End TCM 02/07/94 4.2 88.9/91.8 0.18 64.4/48.6 TESO 726.4 Newport Bay/Rhine Channel/End TCM 01/30/95 4.0 88.9/89.6 0.28 50.2/53.8 TESO 750.0 Oceanside RCM 01/30/95 NA 79.0/80.3 0.83 50.5/52.7 TESO 868.5 Mission Bay/Landfill 1 TCM 01/30/95 3.9 81.0/80.4 0.99 59.9/56.0 TESO 868.6 Mission Bay/Landfill 2 TCM 01/30/95 3.9 78.3/79.7 1.22 62.6/56.1 TESO 882.0 24th St Maritime Terminal/South TCM 02/08/94 4.2 82.8/NA NA 65.1/NA TE 882.0 24th St Maritime Terminal/South TCM 01/31/95 4.0 84.6/86.1 0.62 50.5/57.8 TESO 883.1 San Diego Bay/Chollas Creek TCM 02/08/94 4.2 87.5/90.2 0.12 55.1/58.5 TESO 883.4 San Diego Bay/Continental Maritime TCM 02/08/94 4.2 87.4/89.6 0.42 54.2/54.1 TESO 883.5 San Diego Bay/Tuna Docks TCM 02/08/94 4.2 87.5/87.5 NA 63.8/63.8 TESO 883.8 San Diego Bay/Switzer Creek TCM 02/08/94 4.2 87.5/88.5 0.08 60.8/53.9 TESO 894.0 SD Bay/Harbor Is/E Basin/Storm Dr TCM 02/08/94 4.2 88.5/91.2 0.42 61.9/57.7 TESO 894.0 SD Bay/Harbor Is/E Basin/Storm Dr TCM 01/31/95 4.0 87.1/87.4 0.44 53.9/59.4 TESO 899.0 San Diego Bay/Shelter Is/Fshg Pier TCM 01/31/95 4.0 82.4/84.1 0.67 51.1/68.5 TESO _________________________________________________________________________________________________________________ * RCM = Resident California Mussel SED = Sediment *** TE = Trace Elements NA = Not Analyzed TCM = Transplanted California Mussel SO = Synthetic Organics RBM = Resident Bay Mussel TESO = Trace Elements & Synthetic Organics ** Samples with a collection date prior to 1993 are archive samples. �

D-1
APPENDIX D
Station Sampling History

D-2
APPENDIX D State Mussel Watch Program
Station Sampling history _______________________________________________________________________________________________________________________________________________ Station Station Sample Year* Number Name 1978 1979 1980 1981 1982 1983 1984 1985 1986 1987 1988 1989 1990 1991 1992 1993 1994 1995 _______________________________________________________________________________________________________________________________________________ 1.0 Crescent City Harbor -- -- TE -- -- -- -- -- -- -- -- -- -- -- SO -- -- -- 2.0 Crescent City/STP Outfall -- -- -- -- -- TESO TESO TESO TESO TESO TESO TESO TESO TESO TESO -- -- -- 2.1 Crescent City Harbor Jetty -- -- -- -- -- -- -- -- -- -- -- -- SO -- -- -- -- -- 3.0 Crescent City/Control -- -- -- -- -- TESO TESO TESO TESO TESO TESO TESO TESO TESO TESO -- -- -- 5.0 Redwoods/North TESO TESO -- -- -- -- -- -- -- -- -- -- -- -- -- -- -- 7.0 Redwoods/South TESO -- -- -- -- -- -- -- -- -- -- -- -- -- -- -- -- -- 10.0 Trinidad Head TESO TESO SO TESO TESO TESO TESO TESO TESO TESO TESO TESO TESO TESO TESO TESO TESO TESO 95.0 McDaniel Slough -- -- -- -- -- -- -- -- -- -- -- -- SO SO SO -- -- -- 99.0 Mad River/Oyster Docks -- -- -- -- -- -- -- -- -- -- SO -- -- -- -- -- -- -- 100.0 Mad River Slough -- -- -- -- -- TESO TESO TESO TESO TESO SO SO SO SO TESO -- TESO -- 100.5 Arcata Dock -- -- -- -- -- -- TESO SO SO SO -- -- -- SO SO -- -- -- 100.6 Mad River/Oyster Bed -- -- -- -- -- -- SO -- -- -- -- -- SO -- -- -- -- -- 100.8 Bird Island -- -- -- -- -- -- -- -- -- -- -- -- SO -- -- -- -- -- 101.0 Samoa Bridge/West -- -- TESO TESO TESO TESO TESO TESO -- TESO SO -- -- TESO -- -- TE -- 101.2 Arcata Bay/Channel Marker -- -- -- -- -- -- -- SO -- -- -- -- -- -- -- -- -- -- 102.0 Samoa Bridge/East -- SO TESO TESO TESO -- -- -- -- -- -- TESO -- SO TESO -- -- -- 102.5 Woodley Island -- -- -- -- -- -- TESO TESO TESO TESO SO -- -- -- -- -- -- -- 103.0 Eureka Channel -- -- TESO TESO TESO TESO -- -- -- -- -- TESO SO SO TESO TESO TESO -- 103.2 Louisiana Pacific Dock -- -- -- -- -- -- -- TESO TESO TESO TESO -- -- -- -- -- -- -- 103.3 E Street -- -- -- -- -- -- -- -- -- -- -- -- -- SO TESO -- -- -- 103.4 Humboldt Del Norte Pier -- -- -- -- -- -- -- SO -- -- -- -- -- -- -- -- -- -- 103.6 Simpson Dock -- -- -- -- -- -- -- TESO TESO TESO -- -- -- -- -- -- -- -- 103.7 Eda Dock -- -- -- -- -- -- -- -- -- -- -- -- -- SO TE -- -- -- 104.0 Eureka STP/Outfall -- -- -- -- -- -- TESO TESO -- TESO TESO -- TESO TESO TESO -- -- -- 104.5 Eureka STP/Control -- -- -- -- -- -- TESO TESO TESO TESO TESO TESO TESO TESO TESO TESO -- -- 105.0 Humboldt Bay/Entrance TESO TESO -- -- -- -- -- -- -- -- -- -- -- -- -- -- -- -- 106.0 Fields Landing -- -- -- -- TESO -- -- TESO TE TE -- -- -- SO TESO -- -- -- 130.0 Shelter Cove TESO TESO -- -- -- -- -- -- -- -- -- -- -- -- -- -- -- -- 150.0 Glass Beach -- -- -- -- SO -- -- -- -- -- -- -- -- -- -- -- -- -- 150.4 Noyo Harbor -- -- -- -- -- -- -- -- -- -- -- -- SO -- -- TESO -- -- 151.0 Shell Beach -- -- -- -- SO -- -- -- -- -- -- -- -- -- -- -- -- -- 152.0 Pudding Creek -- -- -- -- SO -- -- -- -- -- -- -- -- -- -- -- -- -- 153.0 Pygmy Forest TESO TESO SO SO SO -- -- -- -- -- -- -- -- -- -- -- -- -- 155.1 Lake Pillsbury 1 -- -- -- -- -- -- -- -- -- -- -- -- -- -- -- TESO -- -- 155.3 Lake Pillsbury 2 -- -- -- -- -- -- -- -- -- -- -- -- -- -- -- TESO -- --
_______________________________________________________________________________________________________________________________________________ * Sample Year = State Fiscal Year (July 1 - June 30). For example, Sample Year 1978 = 1977-78 Fiscal Year. -- = Not Sampled. SO = Synthetic Organics Only. TE = Trace Elements Only. TESO = Trace Elements and Synthetic Organics.

D-3
APPENDIX D (continued) State Mussel Watch Program
Station Sampling history _______________________________________________________________________________________________________________________________________________ Station Station Sample Year* Number Name 1978 1979 1980 1981 1982 1983 1984 1985 1986 1987 1988 1989 1990 1991 1992 1993 1994 1995 _______________________________________________________________________________________________________________________________________________ 159.0 Russian River West Fork -- -- -- -- -- -- -- -- -- -- -- -- TE TE TESO TESO -- -- 160.0 Lake Mendocino -- -- -- -- -- -- -- -- -- -- -- -- TESO -- -- -- -- -- 165.0 Russian River Below Ukiah -- -- -- -- -- -- -- -- -- -- -- -- TESO -- TESO TESO -- -- 170.0 Gerstle Cove TESO TESO SO -- -- -- -- -- -- -- -- -- -- -- -- -- -- -- 175.0 Big Sulfur Creek -- -- -- -- -- -- -- -- -- -- -- -- TE TE -- TESO -- -- 176.0 Lake Sonoma -- -- -- -- -- -- -- -- -- -- -- -- -- -- -- TESO -- -- 190.0 Estero Americano -- -- -- -- -- -- -- -- -- -- -- TESO TESO TESO TESO -- -- -- 200.0 Russian River/N Goat Rock -- -- -- -- -- -- TESO -- -- -- -- -- -- -- -- -- -- -- 201.0 Bodega Bay -- -- TESO TESO -- -- -- -- -- -- -- -- -- -- -- -- -- -- 202.0 Bodega Head TESO TESO TE TESO TESO TESO TE TESO TESO TESO TESO TESO TESO TESO TESO TESO TESO TESO 203.0 Tomales Bay -- SO TESO TESO TESO -- -- -- -- -- -- -- -- TESO TESO -- -- -- 204.0 Estero De San Antonio -- -- -- -- -- -- -- -- -- -- -- -- -- -- -- TESO -- -- 205.0 Bodega Harbor/Spud Point Marina -- -- -- -- -- -- -- -- -- -- -- TESO SO TESO TESO TESO -- -- 207.0 Point Reyes TESO TESO -- -- -- -- -- -- -- -- -- -- -- TESO -- -- -- -- 208.0 Bolinas -- -- TESO TESO -- -- -- -- -- -- -- -- -- -- -- -- -- -- 280.0 Russian River/S Goat Rock -- -- -- -- -- -- -- -- -- TE TE TE -- -- -- TESO -- -- 290.0 Russian River/near Moscow -- -- -- -- -- -- -- -- TESO TE TE -- -- -- -- TESO -- -- 292.0 Gualala River/Twin Bridge -- -- -- -- -- -- -- -- -- TE -- -- -- -- -- -- -- -- 294.1 Mark West Creek/Slusser Road -- -- -- -- -- -- -- -- -- -- -- -- -- -- TE -- -- -- 294.2 Windsor Creek/Mark West Station Rd -- -- -- -- -- -- -- -- -- -- -- -- -- -- TESO -- -- -- 294.5 Green Valley Creek 1 -- -- -- -- -- -- -- -- -- -- -- -- -- -- -- TESO -- -- 294.6 Green Valley Creek 2 -- -- -- -- -- -- -- -- -- -- -- -- -- -- -- TESO -- -- 295.1 Santa Rosa Fl Con Ch/Willowside Rd -- -- -- -- -- -- -- -- -- -- -- TESO TESO TESO -- -- -- -- 295.2 Laguna de Santa Rosa/Stony Point -- -- -- -- -- -- -- -- -- -- -- TESO TESO TESO TE -- -- -- 295.3 Mark West Creek/Wholer Road -- -- -- -- -- -- -- -- -- -- -- TESO TESO -- TESO -- -- -- 295.4 Russian River/Wholer Bridge -- -- -- -- -- -- -- -- -- -- -- TESO TESO TESO TESO -- -- -- 295.5 Russian River/Hacienda Bridge -- -- -- -- -- -- -- -- -- -- -- TESO TESO -- TESO -- -- -- 297.0 Putah Creek -- -- -- -- -- -- -- -- -- -- -- -- SO -- -- -- -- -- 298.0 Brannan Island -- -- -- -- -- -- -- -- -- TESO TESO TESO -- -- -- -- -- -- 298.3 Concord Naval/Pier 4 -- -- -- -- -- -- -- -- -- -- TE -- -- -- -- -- -- -- 298.4 Concord Naval/Seal Island -- -- -- -- -- -- -- -- -- -- TESO -- -- -- -- -- -- -- 299.1 Selby Slag 4 -- -- -- -- -- -- -- -- -- -- TE -- -- -- -- -- -- -- 299.2 Selby Slag 5 -- -- -- -- -- -- -- -- -- -- TE -- -- -- -- -- -- -- 299.3 Selby Slag 6 -- -- -- -- -- -- -- -- -- -- TE -- -- -- -- -- -- -- 299.4 Selby Slag 7 -- -- -- -- -- -- -- -- -- -- TE -- -- -- -- -- -- --
_______________________________________________________________________________________________________________________________________________ * Sample Year = State Fiscal Year (July 1 - June 30). For example, Sample Year 1978 = 1977-78 Fiscal Year. -- = Not Sampled. SO = Synthetic Organics Only. TE = Trace Elements Only. TESO = Trace Elements and Synthetic Organics.

D-4
APPENDIX D (continued) State Mussel Watch Program
Station Sampling history _______________________________________________________________________________________________________________________________________________ Station Station Sample Year* Number Name 1978 1979 1980 1981 1982 1983 1984 1985 1986 1987 1988 1989 1990 1991 1992 1993 1994 1995 _______________________________________________________________________________________________________________________________________________ 300.2 Mare Island -- -- -- -- -- -- -- TESO TESO TESO TESO TESO -- -- -- -- -- -- 301.0 Davis Point -- -- TE -- -- TESO -- -- -- -- TE -- -- -- -- -- -- -- 301.4 Union Oil Outfall -- -- -- -- -- -- -- -- -- -- TE TE -- -- -- -- -- -- 302.0 Point Pinole -- -- TE TESO TESO TESO TESO TESO TESO TESO TESO TESO TESO TESO TESO TESO -- SO 302.4 Castro Cove Bridge -- -- -- -- -- -- -- -- -- -- TESO TESO SO -- -- -- -- -- 303.0 Richmond/San Rafael Bridge -- -- TESO TESO TESO TESO -- -- -- -- -- -- -- -- -- -- -- -- 303.1 Santa Fe Channel/Mouth -- -- -- -- -- -- -- -- TESO -- -- -- -- TESO -- -- -- -- 303.2 Lauritzen Canal/Mouth -- -- -- -- -- -- -- SO SO SO SO -- -- -- -- -- -- -- 303.3 Lauritzen Canal/End -- -- -- -- -- -- -- -- SO SO SO -- -- TESO -- -- -- -- 303.4 Santa Fe Channel/End -- -- -- -- -- -- -- SO SO SO -- -- -- TESO -- -- -- -- 303.6 Richmond Inner Harbor Basin -- -- -- -- -- -- -- TE SO TESO TESO TESO -- -- -- -- -- -- 304.0 Staufer's -- -- -- -- TE -- -- -- -- -- -- -- -- -- -- -- -- -- 304.4 Serl Intake -- -- -- -- -- -- -- -- -- -- -- -- -- TESO -- -- -- -- 304.6 Point Isabel -- -- -- -- -- -- -- -- -- -- TE -- -- -- -- -- -- -- 305.0 San Francisco Bay/Angel Island -- -- TESO TESO TE TESO -- -- -- -- -- -- -- -- -- -- -- -- 306.0 San Francisco Bay/Fort Baker -- -- -- TESO -- TESO -- -- -- -- -- -- -- TESO TESO TESO -- -- 306.5 Alcatraz Island -- -- -- -- -- -- -- -- -- -- -- TESO -- -- -- -- -- -- 307.0 San Francisco Bay/Treasure Is -- SO TESO TESO TESO TESO TESO TESO TE TESO TESO TESO TESO TESO TESO TESO -- -- 307.2 Alameda Yacht Harbor -- -- -- -- -- -- -- TE TESO TESO TESO TESO -- -- -- -- -- -- 307.3 Oakland Inner Harbor/West -- -- -- -- -- -- -- -- TESO TESO -- -- -- -- -- -- -- -- 307.4 Oakland Inner Hbr/Embarcadero Cove -- -- -- -- -- -- -- SO TESO TESO TESO TESO -- TESO TESO TESO -- -- 307.5 Lake Merritt -- -- -- -- -- -- -- -- -- -- -- -- -- -- TESO TESO -- -- 307.6 Oakland Back Harbor -- -- -- -- -- -- -- SO TESO TESO TESO -- -- -- -- -- -- -- 307.8 San Francisco Outfall -- -- -- -- -- -- -- -- -- -- -- TESO -- -- -- -- -- -- 307.9 San Francisco/Islais Channel -- -- -- -- -- -- -- -- -- TESO TESO -- -- -- -- -- -- -- 308.0 San Francisco Bay/Hunter's Point -- -- -- TESO TESO TESO -- -- -- -- -- -- -- TESO TESO TESO -- TESO 308.2 Hunter's Point/Shipyard -- -- -- -- -- -- -- -- -- -- TESO TESO -- -- -- -- -- -- 309.0 San Mateo Bridge/8B -- -- TE TESO TESO TESO TESO TE TE TE -- -- TE TESO TESO TESO -- TESO 310.0 San Mateo Bridge/8A -- -- -- -- TESO -- -- -- -- -- -- -- -- -- -- -- -- -- 311.0 San Mateo Old Bridge -- -- -- -- TE -- -- -- -- -- -- -- -- -- -- -- -- -- 312.0 Belmont Slough -- -- -- -- TE -- -- -- -- -- -- -- -- -- -- -- -- -- 313.0 San Francisco Bay/near Redwood Cr -- -- -- TESO TESO TESO TESO TE -- -- -- -- -- TESO TESO TESO -- TESO 314.0 Redwood Creek/Channel Marker 10 -- -- -- -- TE -- -- -- -- -- -- -- -- -- -- -- -- -- 315.0 Redwood Creek/Towers -- -- -- -- TE TE -- -- -- -- -- -- -- -- -- -- -- -- 316.0 Redwood Creek/Tradewinds -- -- TESO -- TE TE -- -- -- -- -- -- -- -- -- -- -- --
_______________________________________________________________________________________________________________________________________________ * Sample Year = State Fiscal Year (July 1 - June 30). For example, Sample Year 1978 = 1977-78 Fiscal Year. -- = Not Sampled. SO = Synthetic Organics Only. TE = Trace Elements Only. TESO = Trace Elements and Synthetic Organics.

D-5
APPENDIX D (continued) State Mussel Watch Program
Station Sampling history _______________________________________________________________________________________________________________________________________________ Station Station Sample Year* Number Name 1978 1979 1980 1981 1982 1983 1984 1985 1986 1987 1988 1989 1990 1991 1992 1993 1994 1995 _______________________________________________________________________________________________________________________________________________ 317.0 Redwood City/STP Outfall -- -- -- -- -- TE -- -- -- -- -- -- -- -- -- -- -- --
318.0 Redwood Creek/Pete's Marina -- -- -- -- -- TE -- -- -- -- -- -- -- -- -- -- -- --
318.4 Redwood Creek/Bair Island -- -- -- -- -- -- -- -- -- TESO -- -- -- -- -- -- -- --
319.0 Redwood Creek/Pulgas -- -- -- -- -- TE -- -- -- -- -- -- -- -- -- -- -- --
320.0 San Francisco Airport -- -- -- -- -- TE -- -- -- -- -- -- -- -- -- -- -- --
321.0 Dumbarton Bridge/Channel Marker 14 -- -- TE TESO TESO TE TESO TE TE TE TE TESO -- TESO TESO -- -- TESO
323.3 Palo Alto Outfall -- -- -- -- -- -- -- -- -- -- -- TESO TESO -- -- -- -- --
324.0 Newark Slough -- -- -- -- TE -- -- -- -- -- -- -- -- -- -- -- -- --
325.0 Channel Marker 17 -- -- -- -- TE -- -- -- -- -- -- -- -- -- -- -- -- --
326.0 Palo Alto/Channel Marker 8 -- -- -- -- TE TE -- -- -- -- -- -- -- TESO TESO TESO -- --
327.0 Palo Alto/Yacht Club -- -- -- -- TE -- -- -- -- -- -- -- -- -- -- -- -- --
328.0 Alviso Slough -- -- -- -- TE -- -- -- -- -- -- -- -- -- -- -- -- --
330.0 Duxbury Reef -- -- TESO SO -- -- -- -- -- -- -- -- -- -- -- -- -- --
331.0 Muir Beach -- -- TE -- -- -- -- -- -- -- -- -- -- -- -- -- -- --
332.0 Point Bonita -- -- TE -- -- -- -- -- -- -- -- -- -- -- -- -- -- --
333.0 Farallon Islands TESO TESO TE -- -- -- -- -- -- -- -- -- -- -- -- -- -- --
334.0 Cliff House -- -- TE -- -- -- -- -- -- -- -- -- -- -- -- -- -- --
335.0 Pacifica -- -- TE -- -- -- -- -- -- -- -- -- -- -- -- -- -- --
336.0 J. Fitzgerald TESO TESO SO SO -- -- -- -- -- -- -- -- -- TESO -- -- -- --
399.2 Pescadero Creek -- -- -- -- -- -- -- -- -- -- SO SO -- -- -- -- -- --
399.3 Waddell Creek -- -- -- -- -- -- -- -- -- -- SO SO -- -- -- -- -- --
399.5 San Lorenzo River -- -- -- -- -- -- -- -- -- -- -- -- -- TESO -- -- -- --
399.7 San Lorenzo River/Felton -- -- -- -- -- -- -- -- -- -- -- -- -- TESO -- -- -- --
400.0 Ano Nuevo Island TESO TESO TE -- -- TESO -- -- -- -- -- -- -- -- -- -- -- --
400.2 Younger Lagoon -- -- -- -- -- -- -- -- -- -- -- -- -- -- -- TESO -- --
400.5 Santa Cruz/Long Marine Laboratory -- -- -- -- -- TE -- -- -- -- -- -- -- -- -- -- -- --
400.6 Santa Cruz/Natural Bridges -- -- -- -- -- -- -- -- -- TE TE TE -- -- -- -- -- --
400.8 Aptos Creek -- -- -- -- -- -- -- -- -- -- -- -- TESO TESO TESO -- -- --
401.0 Santa Cruz Harbor -- -- TESO TESO -- -- -- -- -- -- -- -- -- -- -- -- -- --
401.1 Santa Cruz/T Dock -- -- -- -- -- -- -- -- -- -- -- TESO -- -- -- -- -- --
401.2 Watsonville Slough/Mouth -- -- -- -- -- SO SO -- SO -- -- -- -- -- -- -- -- --
401.3 Moss Landing/Yacht Harbor -- -- -- -- -- -- TESO -- -- TESO -- SO -- -- -- -- -- --
401.4 Elkhorn Slough -- -- -- -- -- SO SO -- -- -- -- -- -- -- -- -- -- --
401.5 Watsonville Slough/Bridge -- -- -- -- -- -- -- -- -- -- SO -- -- -- -- SO -- --
401.6 Harkins Slough Bridge -- -- -- -- -- -- -- -- -- SO SO -- -- -- -- -- -- --
_______________________________________________________________________________________________________________________________________________ * Sample Year = State Fiscal Year (July 1 - June 30). For example, Sample Year 1978 = 1977-78 Fiscal Year. -- = Not Sampled. SO = Synthetic Organics Only. TE = Trace Elements Only. TESO = Trace Elements and Synthetic Organics.

D-6
APPENDIX D (continued) State Mussel Watch Program
Station Sampling history _______________________________________________________________________________________________________________________________________________ Station Station Sample Year* Number Name 1978 1979 1980 1981 1982 1983 1984 1985 1986 1987 1988 1989 1990 1991 1992 1993 1994 1995 _______________________________________________________________________________________________________________________________________________ 401.8 San Andreas Road -- -- -- -- -- -- -- -- SO SO SO -- -- -- -- -- -- --
401.9 Pajaro River Estuary -- -- -- -- -- -- -- -- -- -- -- -- -- -- -- SO -- --
402.0 Elkhorn Slough/Duck Club -- -- -- -- SO -- TE -- -- -- -- -- -- -- -- -- -- --
402.1 Azevedo Pond -- -- -- -- -- -- -- -- -- -- -- -- -- -- -- TESO -- --
402.2 Parson's Slough -- -- -- -- -- SO SO SO SO SO SO SO -- -- -- TESO -- --
402.3 Elkhorn Slough/Pacific Mariculture -- SO TE SO -- -- SO SO -- -- -- SO -- -- -- -- -- --
402.4 Elkhorn Slough/PG & E -- -- -- -- -- SO -- -- -- -- -- -- -- -- -- -- -- --
402.5 Elkhorn Slough/Tidal Pond -- -- -- -- -- -- -- -- -- -- -- -- -- -- -- TESO -- --
402.8 Elkhorn Slough/Skippers -- -- -- -- -- -- SO -- -- -- -- -- -- -- -- -- -- --
403.0 Elkhorn Slough/Highway 1 Bridge -- -- TESO TESO -- -- -- SO SO SO SO SO -- -- -- -- -- --
403.2 Moro Cojo -- -- -- -- -- SO -- -- -- -- -- SO -- -- -- -- -- --
403.5 Moss Landing/South Harbor -- -- -- -- -- -- -- -- -- -- TESO TESO -- -- -- -- -- --
403.6 Moro Cojo Slough -- -- -- -- -- -- -- -- -- -- SO -- -- -- -- -- -- --
404.0 Sandholdt Bridge -- -- -- -- SO SO SO SO SO TESO TESO TESO TESO TESO TESO TESO TESO TESO
405.0 Espinosa Slough -- -- -- -- -- -- SO -- -- -- -- -- -- -- -- -- -- --
405.2 Old Salinas River 2 -- -- -- -- -- -- -- -- -- -- -- -- -- -- TESO SO -- --
405.3 Old Salinas River 1 -- -- -- -- -- -- -- -- -- -- -- -- -- -- TESO SO -- --
405.4 Old Salinas River Channel 1 -- -- -- -- -- -- SO -- -- -- -- -- -- -- -- -- -- --
405.6 Salinas River Lag 1 -- -- -- -- -- -- -- -- -- -- -- -- -- -- TESO SO -- --
405.7 Salinas River Lag 2 -- -- -- -- -- -- -- -- -- -- -- -- -- -- TESO -- -- --
405.8 Salinas River Lagoon -- -- -- -- -- -- SO -- -- -- -- -- -- -- -- -- -- --
406.0 Westley Station -- -- -- -- -- -- SO -- -- -- -- SO -- -- -- -- -- --
406.5 Tembladero Slough -- -- -- -- -- -- -- -- -- -- -- -- -- -- -- SO -- --
407.1 Moss Landing/Ag Drain/Old River -- -- -- -- -- -- -- TESO -- -- -- -- -- -- -- -- -- --
407.2 Moss Landing/Ag Drain/Espinosa -- -- -- -- -- -- -- TESO -- SO -- -- -- -- -- -- -- --
407.3 Moss Landing/Ag Drain/Davis Rd -- -- -- -- -- -- -- -- SO SO -- -- -- -- -- -- -- --
407.4 Blanco Pump/West -- -- -- -- -- -- -- TESO SO -- -- -- -- -- -- SO -- --
407.5 Blanco Pump/East -- -- -- -- -- -- -- TESO SO SO -- -- -- -- -- -- -- --
407.6 Moss Landing/Ag Drain/Blanco dstrm -- -- -- -- -- -- -- TESO -- -- -- -- -- -- -- -- -- --
407.8 Blanco/Hitchcock -- -- -- -- -- -- -- -- SO SO -- -- -- -- -- -- -- --
407.9 Salinas Sewage Treatment Plant -- -- -- -- -- -- -- -- SO -- -- -- -- -- -- -- -- --
408.0 Pacific Grove/Offshore -- -- TE -- -- -- -- -- -- -- -- -- -- -- -- -- -- --
408.1 Canal Airport -- -- -- -- -- -- -- -- SO -- -- -- -- -- -- -- -- --
408.2 Produce Wash/Downstream/West -- -- -- -- -- -- -- -- SO -- -- -- -- -- -- -- -- --
408.3 Produce Wash/Downstream/East -- -- -- -- -- -- -- -- SO -- -- -- -- -- -- -- -- --
_______________________________________________________________________________________________________________________________________________ * Sample Year = State Fiscal Year (July 1 - June 30). For example, Sample Year 1978 = 1977-78 Fiscal Year. -- = Not Sampled. SO = Synthetic Organics Only. TE = Trace Elements Only. TESO = Trace Elements and Synthetic Organics.

D-7
APPENDIX D (continued) State Mussel Watch Program
Station Sampling history _______________________________________________________________________________________________________________________________________________ Station Station Sample Year* Number Name 1978 1979 1980 1981 1982 1983 1984 1985 1986 1987 1988 1989 1990 1991 1992 1993 1994 1995 _______________________________________________________________________________________________________________________________________________ 408.5 Associated Chemicals -- -- -- -- -- -- -- -- SO -- -- -- -- -- -- -- -- -- 408.8 Salinas/Reclamation Canal 2 -- -- -- -- -- -- -- -- SO -- -- -- -- -- -- -- -- -- 408.9 Salinas/Reclamation Canal 3 -- -- -- -- -- -- -- -- SO SO SO -- -- -- -- -- -- -- 409.0 Salinas/Reclamation Canal 4 -- -- -- -- -- -- -- -- SO SO SO -- -- -- -- -- -- -- 410.0 Monterey Bay/Point Pinos/Shallow -- -- -- -- -- SO -- -- -- -- -- -- -- -- -- -- -- -- 411.0 Monterey Bay/Point Pinos -- -- TE TE TE TESO TE -- TE TE -- -- -- -- -- -- -- -- 413.0 Monterey Bay/Asilomar -- -- -- TE -- TESO -- -- -- -- -- -- -- -- -- -- -- -- 414.0 Pacific Grove TESO TESO TESO TESO TE TESO TESO TESO TESO TESO TESO TESO TESO TESO TESO TESO TESO TESO 415.0 Lover's Point -- -- -- -- TE TESO -- -- -- -- -- -- -- -- -- -- -- -- 416.0 Monterey Bay/Hopkins Marine Lab -- -- TE TE TE TESO -- -- -- -- -- -- -- -- -- -- -- -- 417.0 Monterey Bay/Aquarium -- -- -- -- -- -- -- TE -- TE -- -- -- -- -- -- -- -- 418.0 Pacific Grove/Outrigger -- -- -- TE TE -- -- -- -- -- -- -- -- -- -- -- -- -- 418.8 Monterey Bay/Charthouse -- -- -- -- -- -- -- TE -- -- -- -- -- -- -- -- -- -- 419.0 Coast Guard Jetty/South Rocks -- -- -- TE TE TESO -- -- -- -- -- -- -- -- -- -- -- -- 420.0 Monterey Harbor/Coast Guard Jetty -- -- -- TE -- -- TE -- -- -- -- -- -- -- -- -- TESO -- 420.2 Monterey/Coast Guard Jetty/Outer -- -- -- -- -- -- -- TE -- -- -- -- -- -- -- -- -- -- 420.3 Monterey Harbor/C G Jetty/Inner -- -- -- -- -- -- -- -- -- -- -- -- -- -- -- -- TE -- 421.0 Monterey Harbor/Slag Pile -- -- -- -- -- -- TE -- -- -- -- -- -- -- -- -- TE -- 421.1 Monterey Harbor/Slag Heap -- -- -- -- -- -- -- TE -- -- -- -- -- -- -- -- -- -- 421.3 Monterey Harbor/Restaurant Wharf -- -- -- -- -- -- TE TE -- -- -- -- -- -- -- -- -- -- 421.4 Monterey Harbor/Commercial Wharf -- -- -- -- -- -- TE TE -- -- -- -- -- -- -- -- -- -- 421.5 Monterey/Coast Guard Jetty/Docks -- -- -- -- -- -- -- TE -- -- -- -- -- -- -- -- -- -- 421.6 Monterey/Coast Guard Jetty/End -- -- -- -- -- -- -- TE -- -- -- -- -- -- -- -- -- -- 421.7 Monterey Harbor/Marina -- -- -- -- -- -- -- -- -- TESO TESO TESO -- -- -- -- -- -- 421.8 Monterey Harbor/Marina/Pier B -- -- -- -- -- -- -- -- -- -- SO SO -- -- -- -- -- -- 422.0 Monterey Bay/Holiday Inn -- -- -- -- -- -- -- TE -- -- -- -- -- -- -- -- -- -- 422.5 Cypress Point -- -- TE -- -- -- -- -- -- -- -- -- -- -- -- -- -- -- 423.0 Carmel Bay TESO TESO -- -- -- TESO -- -- -- -- -- -- -- -- -- -- -- -- 423.1 Carmel Bay/New Control -- -- -- -- -- -- -- -- -- -- -- -- -- -- TE -- -- -- 423.2 Carmel STP/Control -- -- -- -- -- -- TESO TE TE TE TE TE -- -- -- -- -- -- 423.3 Carmel River -- -- -- -- -- -- -- TE TE TE -- TE -- -- -- -- -- -- 423.4 Carmel STP/10m North -- -- -- -- -- -- TESO TE TE TE TE TE -- -- -- -- -- -- 423.5 Carmel STP/30m South -- -- -- -- -- -- -- -- -- -- -- -- -- TE TE -- -- -- 423.6 Carmel STP/10m South -- -- -- -- -- -- TESO TE -- TE TE TE -- -- -- -- -- -- 423.7 Carmel STP/100m South -- -- -- -- -- -- -- -- -- -- -- -- -- TE TE -- -- --
_______________________________________________________________________________________________________________________________________________ * Sample Year = State Fiscal Year (July 1 - June 30). For example, Sample Year 1978 = 1977-78 Fiscal Year. -- = Not Sampled. SO = Synthetic Organics Only. TE = Trace Elements Only. TESO = Trace Elements and Synthetic Organics.

D-8
APPENDIX D (continued) State Mussel Watch Program
Station Sampling history _______________________________________________________________________________________________________________________________________________ Station Station Sample Year* Number Name 1978 1979 1980 1981 1982 1983 1984 1985 1986 1987 1988 1989 1990 1991 1992 1993 1994 1995 _______________________________________________________________________________________________________________________________________________ 423.8 Carmel River/Upstream -- -- -- -- -- -- -- -- TE TE -- -- -- -- -- -- -- -- 423.9 Carmel STP/300m South -- -- -- -- -- -- -- -- -- -- -- -- -- TE TE -- -- -- 424.0 Soberanes Point TESO TESO -- -- -- TESO -- -- -- -- -- -- -- -- -- -- -- -- 424.5 Granite Canyon/Control -- -- -- -- -- -- -- -- -- -- -- TE -- -- -- -- -- -- 425.0 J.P. Burns TESO TESO SO SO -- TESO -- -- -- -- -- -- -- -- -- -- -- -- 425.4 Lake San Antonio/Buoy -- -- -- -- -- -- -- TESO TESO TESO TESO -- -- -- -- -- -- -- 425.6 Lake San Antonio -- -- -- -- -- -- -- TESO TESO TESO TESO TESO TESO -- TESO -- -- -- 425.7 Nacimiento/East -- -- -- -- -- -- -- TE -- -- -- -- -- -- -- -- -- -- 425.8 Nacimiento/West -- -- -- -- -- -- -- TE -- -- -- -- -- -- -- -- -- -- 426.0 Salmon Creek TESO TESO -- -- -- -- -- -- -- -- -- -- -- -- -- -- -- -- 426.5 Cayucos Pier -- -- -- -- -- -- TE TESO TESO TESO TESO TESO TESO TESO -- -- -- -- 427.0 Morro Bay/Upper -- -- TESO TESO -- -- -- -- -- -- -- -- -- -- -- -- -- -- 428.0 Cayucos -- -- -- -- -- -- TE TE TE TE TE TE TE TE TE -- -- -- 428.5 Morro Bay/Virg's -- SO TESO TESO -- -- -- -- -- -- -- -- -- -- -- -- -- -- 429.0 Morro Rock -- -- -- -- TE TE -- -- -- -- -- -- -- -- -- -- -- -- 429.2 Morro Bay/Boat Works -- -- -- -- -- -- -- -- -- TE TESO TESO TESO -- -- TE -- -- 430.0 Montana De Oro -- -- TE -- TE TESO TESO TESO TESO TESO TESO TESO TESO TESO TESO -- -- -- 430.1 Montana De Oro/South TESO TESO -- -- -- -- -- -- -- -- -- -- -- -- -- -- -- -- 430.2 Montana De Oro 1 -- -- -- -- -- -- -- -- -- -- -- -- -- TESO TESO -- -- -- 430.4 Montana De Oro 2 -- -- -- -- -- -- -- -- -- -- -- -- -- TESO TESO -- -- -- 431.0 Lion Rock -- -- -- -- TE TE TE TE TE TE TE TE TE -- -- -- -- -- 432.0 Pup Rock -- -- -- -- TE TE TE TE TE TE TE TE TE -- -- -- -- -- 433.0 Diablo Cove/North -- -- -- -- TE TESO TE TE TE TE TE TE TE TE TE -- -- -- 434.0 Diablo Cove/South -- -- -- -- TE TESO TESO TESO TESO TESO TESO TESO TESO TESO TESO -- -- -- 435.0 Intake Cove -- -- -- -- TE TESO TESO TESO TESO TESO TESO TESO TESO TESO TESO -- -- -- 436.0 Pecho Rock -- -- -- -- TE TESO TESO TESO TESO TESO TESO TESO TESO -- -- -- -- -- 437.0 Point San Luis -- -- -- -- TE TE TESO TESO TESO TESO TESO TESO TESO TESO TESO -- -- -- 438.0 Avila -- -- -- -- TE TESO TE TESO TESO TESO TE TE TE TE TE -- -- -- 440.0 Lion Rock/Transplant -- -- -- -- -- TESO TE TESO TESO TESO TE TESO TESO TE TE -- -- -- 441.0 Lion/Diablo/Transplant -- -- -- -- -- TESO TESO TESO TESO TESO TESO TESO TESO TE TE -- -- -- 442.0 Diablo Cove/North/Transplant -- -- -- -- -- -- TE TESO TESO TE TESO TESO TESO TE TE -- -- -- 442.1 Diablo Cove/N/Transplant/Shallow -- -- -- -- -- -- -- -- -- -- -- -- -- TE TE -- -- -- 443.0 Diablo Cove/South/Transplant -- -- -- -- -- TESO TESO TESO TESO TESO TESO TESO TESO TESO TESO -- -- -- 443.1 Diablo Cove/S/Transplant/Shallow -- -- -- -- -- -- -- -- -- -- -- -- -- TESO TESO -- -- -- 444.0 Intake Cove/Transplant -- -- -- -- -- -- TESO TESO TESO TESO TESO TESO TESO TESO TESO -- -- --
_______________________________________________________________________________________________________________________________________________ * Sample Year = State Fiscal Year (July 1 - June 30). For example, Sample Year 1978 = 1977-78 Fiscal Year. -- = Not Sampled. SO = Synthetic Organics Only. TE = Trace Elements Only. TESO = Trace Elements and Synthetic Organics.

D-9
APPENDIX D (continued) State Mussel Watch Program
Station Sampling history _______________________________________________________________________________________________________________________________________________ Station Station Sample Year* Number Name 1978 1979 1980 1981 1982 1983 1984 1985 1986 1987 1988 1989 1990 1991 1992 1993 1994 1995 _______________________________________________________________________________________________________________________________________________ 445.0 San Luis Harbor/Transplant -- -- -- -- -- TESO TESO TESO TESO TESO TESO TESO TESO TESO TESO -- -- --
446.0 San Luis Obispo Creek 1 -- -- -- -- -- -- -- -- -- -- -- -- -- TESO -- -- -- --
446.1 San Luis Obispo/Creek 2 -- -- -- -- -- -- -- -- -- -- -- -- -- -- TESO -- -- --
446.2 San Luis Obispo Creek 3 -- -- -- -- -- -- -- -- -- -- -- -- -- TE TESO -- -- --
446.4 San Luis Obispo/Creek 4 -- -- -- -- -- -- -- -- -- -- -- -- -- -- TESO -- -- --
449.0 Point Arguello TESO TESO -- -- -- -- -- -- -- -- -- -- -- -- -- -- -- --
450.0 Point Conception TESO TESO -- -- -- -- -- -- -- -- -- TE TE TESO -- -- -- --
455.0 Gaviota -- -- -- -- -- -- -- -- -- -- TESO TESO TE -- -- -- -- --
460.0 Goleta Slough 1 -- -- -- -- -- -- -- -- -- -- -- TESO TESO TESO -- -- -- --
460.1 Goleta Slough 2 -- -- -- -- -- -- -- -- -- -- -- -- TESO TESO -- -- -- --
460.2 Goleta Slough 3 -- -- -- -- -- -- -- -- -- -- -- -- -- TESO -- -- -- --
460.3 Goleta Slough 4 -- -- -- -- -- -- -- -- -- -- -- -- -- TESO -- -- -- --
470.0 Santa Barbara Harbor -- -- -- -- -- -- -- -- -- -- TESO TESO -- -- -- -- -- --
471.0 Mission Creek -- -- -- -- -- -- -- -- -- -- -- -- -- TESO -- -- -- --
472.0 Waste Slough/Laguna Drainage -- -- -- -- -- -- -- -- -- -- -- -- -- TESO -- -- -- --
475.0 Carpinteria Marsh -- -- -- -- -- -- -- -- -- -- SO SO -- -- -- -- -- --
480.0 Lake Isabella -- -- -- -- -- -- -- -- -- -- -- -- -- -- -- TESO -- --
485.0 Ventura Marina -- -- -- -- -- -- -- -- -- -- TESO -- -- -- -- -- -- --
485.2 Ventura River Estuary -- -- -- -- -- -- -- -- -- -- -- -- -- -- SO -- -- --
487.1 Santa Clara River Estuary 1 -- -- -- -- -- -- -- -- -- -- -- -- -- -- SO -- -- --
487.3 Santa Clara River Estuary 2 -- -- -- -- -- -- -- -- -- -- -- -- -- -- SO -- -- --
500.0 San Miguel Island/West TESO TESO -- -- -- -- -- -- -- -- -- -- -- -- -- -- -- --
501.0 San Miguel Island/East TESO TESO -- -- -- -- -- -- -- -- -- -- -- -- -- -- -- --
502.0 Santa Cruz Island TESO TESO -- -- -- -- -- -- -- -- -- -- -- -- -- -- -- --
503.0 Anacapa Island TESO TESO TESO TESO -- -- -- -- -- -- -- -- -- -- -- -- -- --
504.0 Santa Barbara Island TESO TESO -- -- -- -- -- -- -- -- -- -- -- -- -- -- -- --
505.0 Channel Island Harbor -- -- TE TESO SO -- -- -- -- -- -- -- -- -- -- -- -- --
505.2 Channel Island Harbor/North -- -- -- -- -- -- -- -- -- TESO -- -- -- -- -- -- -- --
506.0 Port Hueneme -- -- TESO TESO SO -- -- -- -- -- -- -- -- -- -- -- -- --
506.1 Port Hueneme/Wharf B -- -- -- -- -- -- -- -- SO SO TESO SO -- -- -- -- -- --
506.2 Port Hueneme/Wharf 1 -- -- -- -- -- -- -- -- SO TESO TESO SO -- -- -- -- -- --
506.3 Port Hueneme/Entrance -- -- -- -- -- -- -- -- -- -- TESO -- -- -- -- -- -- --
507.0 Point Mugu TESO TESO -- -- -- -- -- -- -- -- -- -- -- -- -- -- -- --
507.1 Mugu Lagoon/L Street -- -- -- -- -- -- -- -- -- TESO -- -- -- SO -- -- -- --
507.2 Mugu Lagoon/Laguna Road -- -- -- -- -- -- -- -- SO TESO -- -- -- SO -- -- -- --
_______________________________________________________________________________________________________________________________________________ * Sample Year = State Fiscal Year (July 1 - June 30). For example, Sample Year 1978 = 1977-78 Fiscal Year. -- = Not Sampled. SO = Synthetic Organics Only. TE = Trace Elements Only. TESO = Trace Elements and Synthetic Organics.

D-1
0
APPENDIX D (continued) State Mussel Watch Program
Station Sampling history _______________________________________________________________________________________________________________________________________________ Station Station Sample Year* Number Name 1978 1979 1980 1981 1982 1983 1984 1985 1986 1987 1988 1989 1990 1991 1992 1993 1994 1995 _______________________________________________________________________________________________________________________________________________ 507.3 Mugu Lagoon/Calleguas Creek -- -- -- -- -- -- -- -- SO TESO -- TESO SO SO SO SO TESO --
507.4 Ag Drain/Etting Road -- -- -- -- -- -- -- -- -- -- -- -- -- SO -- -- -- --
507.6 Ag Drain/Pleasant Valley Road -- -- -- -- -- -- -- -- -- -- -- -- -- SO -- -- -- --
507.7 Revolon Slough/Las Posas Rd -- -- -- -- -- -- -- -- -- -- -- -- -- SO -- -- -- --
507.8 Revolon Slough -- -- -- -- -- -- -- -- -- TESO SO SO SO SO -- -- -- --
508.1 Mugu Drainage 1 -- -- -- -- -- -- -- -- -- -- -- -- SO -- -- -- -- TE
508.2 Mugu Drainage 2 -- -- -- -- -- -- -- -- -- -- -- -- SO -- -- -- -- --
508.3 Mugu Drainage 3 -- -- -- -- -- -- -- -- -- -- -- -- SO -- -- -- -- --
508.4 Mugu Drainage 4 -- -- -- -- -- -- -- -- -- -- -- -- SO -- -- -- -- --
508.5 Mugu Drainage 5 -- -- -- -- -- -- -- -- -- -- -- -- SO -- -- -- -- --
508.6 Mugu Drainage 6 -- -- -- -- -- -- -- -- -- -- -- -- SO -- -- -- -- --
508.7 Mugu Drainage 7 -- -- -- -- -- -- -- -- -- -- -- -- SO -- -- -- -- --
509.0 Calleguas -- -- -- -- -- -- -- -- -- -- -- -- SO -- -- -- -- --
553.0 Marina Del Rey/Entrance -- -- -- -- -- -- -- -- -- -- -- TESO -- -- -- -- -- --
554.0 Marina Del Rey/Harbor Patrol Docks -- -- -- -- -- -- -- -- TESO -- TESO TESO -- -- -- -- -- --
555.0 Marina Del Rey/Basin G -- -- -- -- -- -- -- -- TESO TESO TESO TESO -- -- -- -- -- --
555.2 Marina Del Rey/Basin D -- -- -- -- -- -- -- -- -- -- TESO -- -- -- -- -- -- --
556.0 Marina Del Rey/Basin E -- -- -- -- -- -- -- -- TESO TESO TESO TESO -- -- -- -- -- --
557.0 Marina Del Rey/Ballona Creek -- -- -- -- -- -- -- -- TESO TESO TESO -- -- -- -- -- -- --
559.0 King Harbor -- -- -- -- -- -- -- -- -- -- TESO -- -- -- -- -- -- --
601.0 LA Harbor/National Steel -- -- -- -- TESO -- TESO TESO TESO TESO TESO TESO SO SO TESO TESO TESO TESO
602.0 LA Harbor/West Basin -- -- -- -- TESO -- TE TESO TESO TESO TESO -- -- -- -- -- TESO --
602.5 LA Harbor/Todd Shipyards -- -- -- -- -- -- -- TESO TESO -- TESO TESO SO SO -- -- -- --
602.6 LA Harbor/Berth 50 -- -- -- -- -- -- -- -- -- -- -- -- TE -- -- -- -- --
602.7 LA Harbor/Pacific Ave/Storm Drain -- -- -- -- -- -- -- -- -- -- TESO -- -- -- -- -- -- --
602.8 LA Harbor/Berth 49 -- -- -- -- -- -- -- -- -- TESO TESO TE TE TE -- -- -- --
602.9 LA Harbor/Berth 51 -- -- -- -- -- -- -- -- -- -- -- -- TE -- -- -- -- --
603.0 LA Harbor/Berth 151 -- -- -- -- TESO -- TESO TESO TESO -- TESO SO -- -- -- -- -- --
603.6 LA Harbor/Slip 240 -- -- -- -- -- -- -- -- -- TESO TESO -- -- -- -- -- -- --
603.8 LA Harbor/West Channel -- -- -- -- -- -- -- -- -- TESO TESO -- -- -- -- -- -- --
604.0 LA Harbor/GATX Terminal -- -- -- SO TESO SO -- -- TESO -- -- -- -- -- -- -- -- --
604.5 LA Harbor/Berth 212 -- -- -- -- -- -- -- -- -- -- -- TE -- -- -- -- -- --
605.0 LA Harbor/Cabrillo Pier -- SO SO -- TESO -- TESO -- -- -- -- TESO -- -- SO SO TESO TESO
606.0 LA Harbor/Fish Harbor/Outer -- -- -- -- TESO -- -- -- -- -- -- -- -- -- -- -- -- --
606.2 LA Harbor/Fish Harbor -- -- -- -- -- -- -- -- -- TESO TESO -- -- -- -- -- -- --
_______________________________________________________________________________________________________________________________________________ * Sample Year = State Fiscal Year (July 1 - June 30). For example, Sample Year 1978 = 1977-78 Fiscal Year. -- = Not Sampled. SO = Synthetic Organics Only. TE = Trace Elements Only. TESO = Trace Elements and Synthetic Organics.

D-1
1
APPENDIX D (continued) State Mussel Watch Program
Station Sampling history _______________________________________________________________________________________________________________________________________________ Station Station Sample Year* Number Name 1978 1979 1980 1981 1982 1983 1984 1985 1986 1987 1988 1989 1990 1991 1992 1993 1994 1995 _______________________________________________________________________________________________________________________________________________ 606.3 LA Harbor/Watchorn Basin -- -- -- -- -- -- -- -- -- -- TESO -- -- -- -- -- -- --
607.0 LA Harbor/Terminal Island -- -- -- SO TESO -- TE -- TESO -- -- -- -- -- -- -- -- --
607.4 LB Harbor/Berth 214 -- -- -- -- -- -- -- -- -- TESO -- -- -- -- -- -- -- --
607.6 LB Harbor/Channel 2 -- -- -- -- -- -- -- -- -- TESO -- -- -- -- -- -- -- --
607.7 LB Harbor/Navy Mole Jetty -- -- -- -- -- -- -- -- -- SO -- -- -- -- -- -- -- --
607.8 LB Harbor/Pier J -- -- -- -- -- -- -- -- -- TESO -- -- -- -- -- -- -- --
608.0 LB Harbor/Navy Mole -- -- -- TESO -- SO -- -- -- -- -- -- -- -- -- -- -- --
609.0 LB Harbor/Tide Gauge -- -- TESO TESO TESO SO TESO -- TESO -- SO -- -- -- -- -- -- --
609.4 Long Beach/Queensway Bay -- -- -- -- -- -- -- -- -- TESO -- -- -- -- -- -- -- --
610.0 LA River/Mouth -- -- -- SO -- SO -- TESO -- -- -- -- -- -- -- -- -- --
611.0 LB Harbor/Pier F -- -- -- -- TESO -- -- -- -- -- -- -- -- -- -- -- -- --
611.5 LB Harbor/LAPD Ramp -- -- -- SO -- -- -- -- -- -- -- -- -- -- -- -- -- --
612.0 LB Harbor/Navy Channel -- -- -- SO -- SO -- -- -- -- -- -- -- -- -- -- -- --
613.0 LB Harbor/Southern Calif Edison -- -- -- -- TESO -- TESO -- TESO -- -- -- -- -- -- -- -- --
614.0 LB Harbor/Channel 3 -- -- -- -- TESO -- -- -- -- -- -- -- -- -- -- -- -- --
615.0 LB Harbor/Henry Ford Bridge -- -- -- -- TESO -- -- -- TESO TESO -- -- -- -- -- -- -- --
616.0 LA Harbor/Consolidated Slip -- -- -- -- TESO SO SO TESO TESO TESO TESO TESO SO SO TESO TESO TESO TESO
617.0 White's Point -- -- -- -- TESO -- -- -- -- -- -- -- -- -- -- -- -- --
617.6 Point Fermin -- -- -- -- -- -- -- -- -- -- -- -- -- -- -- SO -- --
617.9 Cabrillo Beach/Ocean Side -- -- -- -- -- -- -- -- -- -- -- -- -- -- -- SO -- --
618.0 LA Harbor/Angels Gate -- -- -- -- -- -- -- -- -- -- -- -- -- TESO SO SO TESO TESO
619.0 LA Harbor/San Pedro Boatworks -- -- -- -- -- -- -- -- -- -- -- -- -- TESO -- -- -- --
619.2 San Pedro Breakwater -- -- -- -- -- -- -- -- -- -- -- -- -- -- -- SO -- --
620.0 LB Harbor/JH Baxter 80 -- -- -- -- -- -- -- -- -- -- -- -- -- SO -- -- -- --
620.5 LA River/Upstream -- -- -- -- -- -- -- -- SO -- -- -- -- -- -- -- -- --
621.0 LA Harbor/Berth 120 -- -- -- -- -- -- -- -- -- -- -- -- -- SO -- -- -- --
622.0 LA Harbor/Commer Marine -- -- -- -- -- -- -- -- -- -- -- -- -- TESO -- -- -- --
625.0 Alamitos Bay/West 2nd Street -- -- -- -- -- -- -- -- TESO -- -- -- -- -- -- -- -- --
626.0 Alamitos Bay/Cerritos Channel -- -- -- -- -- -- -- -- TESO -- -- -- -- -- -- -- -- --
627.0 Alamitos Bay/Marine Stadium -- -- -- -- -- -- -- -- TESO -- -- -- -- -- -- -- -- --
627.4 Alamitos Bay/Marine Stadium/North -- -- -- -- -- -- -- -- -- TESO -- -- -- -- -- -- -- --
647.0 Point Dume -- -- -- TE -- -- -- -- -- -- -- -- -- -- -- -- -- --
648.0 Malibu -- -- -- TE -- -- -- -- -- -- -- -- -- TESO -- TESO TESO TESO
648.1 Malibu Lagoon/Channel A -- -- -- -- -- -- -- -- -- -- -- -- -- -- TESO TESO -- --
648.3 Malibu Lagoon/Channel C -- -- -- -- -- -- -- -- -- -- -- -- -- -- TESO TESO -- --
_______________________________________________________________________________________________________________________________________________ * Sample Year = State Fiscal Year (July 1 - June 30). For example, Sample Year 1978 = 1977-78 Fiscal Year. -- = Not Sampled. SO = Synthetic Organics Only. TE = Trace Elements Only. TESO = Trace Elements and Synthetic Organics.

D-1
2
APPENDIX D (continued) State Mussel Watch Program
Station Sampling history _______________________________________________________________________________________________________________________________________________ Station Station Sample Year* Number Name 1978 1979 1980 1981 1982 1983 1984 1985 1986 1987 1988 1989 1990 1991 1992 1993 1994 1995 _______________________________________________________________________________________________________________________________________________ 648.5 Malibu Lagoon/PCH -- -- -- -- -- -- -- -- -- -- -- -- -- -- TESO TESO -- --
649.0 Big Rock Beach -- -- -- TE -- -- -- -- -- -- -- -- -- -- -- -- -- --
650.0 Santa Monica -- -- -- TE -- -- -- -- -- -- -- TE -- TESO -- TESO TESO TESO
651.0 Marina Del Rey/North Docks -- -- TE TESO -- -- -- -- -- -- -- -- -- -- -- -- -- --
652.0 Marina Del Rey/North Docks Jetty -- -- TE -- -- -- -- -- -- -- -- -- -- -- -- -- -- --
653.0 Marina Del Rey/South Docks Jetty -- -- -- -- TESO -- -- -- -- -- -- -- -- -- -- -- -- --
654.0 Playa Del Rey -- -- -- TE -- -- -- -- -- -- -- -- -- -- -- -- -- --
655.0 El Segundo/Grand Avenue -- -- -- TE -- -- -- -- -- -- -- -- -- -- -- -- -- --
656.0 Manhattan Beach -- -- -- TE -- -- -- -- -- -- -- TE -- -- -- -- -- --
657.0 Hermosa Beach -- -- -- TE -- -- -- -- -- -- -- -- -- -- -- -- -- --
658.0 Redondo Beach -- -- -- TE -- -- -- -- -- -- -- TE -- -- -- -- -- --
659.0 Palos Verdes Point -- -- -- TE -- -- -- -- -- -- -- -- -- -- -- -- -- --
660.0 Point Vicente -- -- TE TESO -- -- -- -- -- -- -- -- -- -- -- -- -- --
661.0 Royal Palms/North -- -- TE TE -- -- -- -- -- -- -- -- -- -- -- -- -- --
662.0 Royal Palms TESO TESO TESO SO TESO TESO TESO TESO TESO TESO TESO TESO TESO TESO TESO TESO TESO TESO
663.0 Royal Palms/South -- -- TE -- -- -- -- -- -- -- -- -- -- -- -- -- -- --
664.0 Cabrillo Beach -- -- TE SO -- -- -- -- -- -- -- -- -- -- SO -- -- TESO
664.2 Cabrillo Beach Buoy -- -- -- -- -- -- -- -- -- -- -- -- -- -- -- SO -- --
680.0 Catalina Island/East -- TESO TE TESO -- -- -- -- -- -- -- -- -- -- -- -- -- --
681.0 Catalina Island/West TESO TESO TE TE -- -- -- -- -- -- -- -- -- -- TE -- -- --
682.0 Catalina Island/Ribbon Rock -- -- -- TE -- -- -- -- -- -- -- -- -- TE -- TESO TESO --
683.0 Catalina Island/Ben Weston -- -- -- TESO -- -- -- -- -- -- -- -- -- -- -- -- -- --
684.0 Catalina Island/Silver Canyon -- -- -- TE -- -- -- -- -- -- -- -- -- -- -- -- -- --
685.0 Catalina Island/Church Rock -- -- -- TE -- -- -- -- -- -- -- -- -- -- -- -- -- --
701.0 Colorado Lagoon/West -- -- -- -- TESO -- -- TESO TESO -- -- -- -- -- -- -- -- --
701.2 Colorado Lagoon/East -- -- -- -- -- -- -- -- -- TESO -- -- -- -- -- -- -- --
703.0 Alamitos Bay/Pier 22 -- -- -- -- SO -- -- -- -- -- -- -- -- -- -- -- -- --
707.0 Anaheim Bay/Navy Harbor -- -- -- -- -- -- TESO -- TESO TESO TESO TESO TESO TESO TESO -- -- --
708.0 Anaheim Bay/Navy Marsh -- -- -- -- -- -- TESO -- -- TESO TESO -- TESO TESO TESO -- -- --
708.5 Anaheim Bay/Navy Marsh 2 -- -- -- -- -- -- -- -- -- -- -- -- -- TESO TESO -- -- --
709.0 Anaheim Bay/Entrance -- -- -- TE SO -- -- -- -- -- -- -- -- -- -- -- -- --
710.0 Anaheim Bay/Fuel Docks/North -- -- TESO SO -- -- -- -- -- -- -- -- -- -- -- -- -- --
710.2 Anaheim Bay/Fuel Docks/South -- -- -- -- -- -- -- TESO TESO TESO TESO TESO TESO -- -- -- -- --
711.0 Huntington Harbour/Launch Ramp Dks -- -- -- -- SO -- -- -- -- -- -- -- -- -- -- -- -- --
712.0 Huntington Harbour/Peter's Landing -- -- -- -- TESO -- -- -- -- -- -- -- -- -- -- -- -- --
_______________________________________________________________________________________________________________________________________________ * Sample Year = State Fiscal Year (July 1 - June 30). For example, Sample Year 1978 = 1977-78 Fiscal Year. -- = Not Sampled. SO = Synthetic Organics Only. TE = Trace Elements Only. TESO = Trace Elements and Synthetic Organics.

D-1
3
APPENDIX D (continued) State Mussel Watch Program
Station Sampling history _______________________________________________________________________________________________________________________________________________ Station Station Sample Year* Number Name 1978 1979 1980 1981 1982 1983 1984 1985 1986 1987 1988 1989 1990 1991 1992 1993 1994 1995 _______________________________________________________________________________________________________________________________________________ 713.0 Huntington Harbour/Edinger Street -- -- -- -- -- -- TESO -- TESO TESO TESO -- TESO TESO TESO -- TESO TESO
715.0 Huntington Harbour/Warner Ave Brdg -- -- -- -- -- -- TESO TESO TESO TESO TESO TESO TESO TESO TESO TESO TESO TESO
717.0 Huntington Harbour/Harbor Lane -- -- -- -- -- -- -- -- TESO TESO TESO TESO -- -- TESO -- -- --
719.1 Santa Ana River/Prado Dam -- -- -- -- -- -- -- -- -- -- -- -- -- -- TESO TESO -- --
719.8 Temescal Creek/Nichols Road -- -- -- -- -- -- -- -- -- -- -- -- -- -- TE -- -- --
720.0 Newport Pier -- -- -- -- -- -- -- -- -- SO -- -- -- -- -- -- -- --
720.5 Newport Bay/Offshore Ref -- -- -- -- -- -- -- -- -- -- -- -- -- TESO -- -- -- --
721.0 Newport Bay/Entrance -- -- -- -- TE TESO TESO TESO TESO TESO TESO TESO TESO TESO -- -- -- --
722.0 Newport Bay/Police Docks -- -- TESO TESO TE TESO -- -- SO -- -- -- -- -- -- -- -- --
722.4 Newport Bay/El Paseo Drive -- -- -- -- -- -- -- -- -- TESO -- -- -- -- -- -- -- --
723.0 Newport Bay/Bay Island -- -- -- -- TESO TESO SO TESO TESO TESO TESO -- TESO TESO TESO -- -- --
723.4 Newport Bay/Turning Basin -- -- -- -- -- -- -- -- -- TESO TESO TESO TESO TESO TESO -- -- TESO
724.0 Newport Bay/Highway 1 Bridge -- -- -- -- -- TESO TESO TESO TESO TESO TESO TESO TESO TESO TESO TESO TESO TESO
724.4 Newport Bay/Dunes Dock -- -- -- -- -- -- -- -- -- TESO -- -- -- -- -- -- -- --
725.0 Newport Bay/Crows Nest -- -- -- -- TESO TESO TESO TESO TESO TESO TESO TESO TESO TESO TESO TESO TESO TESO
726.0 Newport Bay/Rhine Channel/Upper -- -- -- -- -- TESO TESO TESO TESO TESO TESO TESO -- -- -- -- -- --
726.2 Newport Bay/Rhine Channel/26th Ave -- -- -- -- -- -- -- -- -- TESO -- TESO -- -- -- -- -- --
726.4 Newport Bay/Rhine Channel/End -- -- -- -- -- -- -- -- -- TESO TESO TESO TESO TESO TESO TESO TESO TESO
727.0 Garden Grove/Wintersburg Channel -- -- -- -- -- -- -- -- -- -- -- -- -- TESO -- TESO -- --
728.4 Upper Newport Bay/MacArthur -- -- -- -- -- -- -- TESO TESO TESO TESO TESO TESO TESO -- TESO -- --
728.5 Upper Newport Bay/Drain 2 -- -- -- -- -- -- -- -- -- -- -- -- TESO -- -- -- -- --
728.6 Upper Newport Bay/San Diego Cr 1 -- -- -- -- -- -- -- -- -- -- TESO -- -- -- -- -- -- --
728.7 Upper Newport Bay/Drain 4 -- -- -- -- -- -- -- -- -- -- -- -- TE TESO -- TESO -- --
728.8 Upper Newport Bay/San Diego Cr 2 -- -- -- -- -- -- -- -- -- -- TESO -- -- -- -- -- -- --
728.9 Upper Newport Bay/Drain 5 -- -- -- -- -- -- -- -- -- -- -- -- TESO TESO -- -- -- --
730.0 Huntington Beach Pier -- -- TE -- -- -- -- -- -- -- -- -- -- TE -- -- -- --
731.0 Newport Beach Pier -- -- -- TE -- -- -- -- -- -- -- -- -- -- -- -- -- --
732.0 Newport Bay/Entrance/West Jetty -- -- TE TE -- -- -- -- -- -- -- -- -- -- -- -- -- --
733.0 Newport Bay/Entrance/W Jetty/End -- -- -- TE -- -- -- -- -- -- -- -- -- -- -- -- -- --
734.0 Newport Bay/Entrance/East Jetty -- -- -- TE -- -- -- -- -- -- -- -- -- -- -- -- -- --
735.0 Corona Del Mar TESO TESO TESO SO -- -- -- -- -- -- -- -- -- TESO TESO -- -- --
736.0 Little Corona City Beach -- -- TE -- -- -- -- -- -- -- -- -- -- -- -- -- -- --
737.0 Crescent Bay Beach -- -- TE -- -- -- -- -- -- -- -- -- -- -- -- -- -- --
740.0 Dana Point Harbor/Boat Yard -- -- -- -- -- -- -- -- TE -- -- -- -- TESO TESO TESO -- --
744.0 San Onofre Nuclear Plant Outfall -- -- -- -- -- -- -- -- TE -- -- -- -- -- -- -- -- --
_______________________________________________________________________________________________________________________________________________ * Sample Year = State Fiscal Year (July 1 - June 30). For example, Sample Year 1978 = 1977-78 Fiscal Year. -- = Not Sampled. SO = Synthetic Organics Only. TE = Trace Elements Only. TESO = Trace Elements and Synthetic Organics.

D-1
4
APPENDIX D (continued) State Mussel Watch Program
Station Sampling history _______________________________________________________________________________________________________________________________________________ Station Station Sample Year* Number Name 1978 1979 1980 1981 1982 1983 1984 1985 1986 1987 1988 1989 1990 1991 1992 1993 1994 1995 _______________________________________________________________________________________________________________________________________________ 744.1 San Onofre 1 -- -- -- -- -- -- -- -- -- -- -- TESO -- TESO TESO -- -- --
744.2 San Onofre 2 -- -- -- -- -- -- -- -- -- -- -- TESO TESO TESO TESO -- -- --
744.3 San Onofre 3 -- -- -- -- -- -- -- -- -- -- -- -- TESO TESO TESO -- -- --
744.4 San Onofre 4 -- -- -- -- -- -- -- -- -- -- -- TESO TESO TESO TESO -- -- --
744.5 San Onofre 5 -- -- -- -- -- -- -- -- -- -- -- TESO TESO TESO TESO -- -- --
744.6 San Onofre 6 -- -- -- -- -- -- -- -- -- -- -- TESO TESO TESO TESO -- -- --
748.0 Oceanside/Harbor -- -- -- -- -- -- -- TE TE TE TE -- -- -- -- TESO -- --
750.0 Oceanside TESO TESO TESO TESO TESO TESO TESO TESO TESO TESO TESO TESO TESO TESO TESO TESO -- TESO
751.0 Oceanside/Transplant -- -- -- TE -- -- -- -- -- -- -- -- -- TESO -- -- -- --
753.0 Inner Agua Hedionda -- -- -- -- -- -- -- -- -- TESO SO -- -- -- -- -- -- --
800.0 Ingraham Street/North -- -- TE -- -- -- -- -- -- -- -- -- -- -- -- -- -- --
830.0 Torrey Pines -- -- TE -- -- -- -- -- -- -- -- -- -- -- -- -- -- --
831.0 Scripps Oceanographic Inst Pier -- -- TE -- -- -- -- -- -- -- -- -- -- -- -- -- -- --
832.0 La Jolla TESO TESO TESO -- -- -- -- -- -- -- -- -- -- TESO TESO TESO -- --
833.0 Boomers Point -- -- TE -- -- -- -- -- -- -- -- -- -- -- -- -- -- --
834.0 Bird Rock -- -- TE TE -- -- -- -- -- -- -- -- -- -- -- -- -- --
835.0 Pacific Beach -- -- -- TE -- -- -- -- -- -- -- -- -- -- -- -- -- --
836.0 Mission Bay/North Jetty -- -- -- TE -- -- -- -- -- -- -- -- -- -- -- -- -- --
837.0 Mission Bay/South Jetty -- -- -- TE TE -- -- -- -- -- -- -- -- -- -- -- -- --
838.0 Crystal Pier -- -- -- -- TE -- -- -- -- -- -- -- -- -- -- -- -- --
838.2 Point Loma/Sunset Cliffs -- -- -- -- -- -- -- -- TE TE TE TE TE TESO TE TE -- --
839.0 Point Loma/Pink House -- -- -- TE TESO -- -- -- -- -- -- -- -- -- -- -- -- --
839.2 Point Loma/STP Outfall -- -- -- -- -- -- -- -- TE TE -- -- -- -- -- -- -- --
840.0 Naval Ocean Sys Cntr/Dolphin Tanks -- -- -- TE TE TESO -- TESO TE -- -- TE -- -- -- TE -- --
840.2 Point Loma/Coast Guard Station -- -- -- -- -- -- -- -- TE -- -- -- -- -- -- -- -- --
841.0 Coronado Hotel -- -- -- TE -- -- -- -- -- -- -- -- -- -- -- -- -- --
842.0 Imperial Beach -- -- -- TE -- -- -- -- -- -- -- -- -- -- -- -- -- --
849.0 Point Loma/A9d -- -- -- -- -- TE -- -- -- -- -- -- -- -- -- -- -- --
849.5 Point Loma/A9s -- -- -- -- -- TE -- -- -- -- -- -- -- -- -- -- -- --
850.0 Point Loma/STP/A8s -- -- -- -- TE -- -- -- -- -- -- -- -- -- -- -- -- --
850.5 Point Loma -- -- -- -- -- TE -- -- -- -- -- -- -- -- -- -- -- --
852.0 Point Loma/A10s -- -- -- -- -- TE -- -- -- -- -- -- -- -- -- -- -- --
864.0 Mission Bay/Yacht Club -- -- -- -- -- -- TE -- -- -- -- -- -- -- -- -- -- --
865.0 Mission Bay/Hilton Docks -- -- -- -- TE -- TESO -- -- -- -- -- TESO -- -- -- -- --
866.0 Fisherman Channel -- -- -- -- TE -- TE -- TE -- -- -- -- TESO -- -- -- --
_______________________________________________________________________________________________________________________________________________ * Sample Year = State Fiscal Year (July 1 - June 30). For example, Sample Year 1978 = 1977-78 Fiscal Year. -- = Not Sampled. SO = Synthetic Organics Only. TE = Trace Elements Only. TESO = Trace Elements and Synthetic Organics.

D-1
5
APPENDIX D (continued) State Mussel Watch Program
Station Sampling history _______________________________________________________________________________________________________________________________________________ Station Station Sample Year* Number Name 1978 1979 1980 1981 1982 1983 1984 1985 1986 1987 1988 1989 1990 1991 1992 1993 1994 1995 _______________________________________________________________________________________________________________________________________________ 867.0 Ingraham Street -- -- SO -- TESO -- -- -- -- -- -- -- -- -- -- -- -- --
868.0 West Mission Bay Drive -- -- -- -- TE -- -- -- -- -- -- -- -- -- -- -- -- --
868.5 Mission Bay/Landfill 1 -- -- -- -- -- -- -- -- -- -- -- -- TESO TESO TESO -- -- TESO
868.6 Mission Bay/Landfill 2 -- -- -- -- -- -- -- -- -- -- -- -- -- TESO TESO -- -- TESO
869.0 Mission Bay/Seaworld Tower -- -- -- -- -- -- TESO -- -- -- -- -- -- -- -- -- -- --
870.0 Mission Bay/South Shore/Rock 1 -- -- -- -- -- -- SO -- -- -- -- -- -- -- -- -- -- --
872.0 Mission Bay/South Shore/Rock 3 -- -- -- -- -- -- SO -- -- -- -- -- -- -- -- -- -- --
872.2 Rose Creek -- -- -- -- -- -- -- -- TESO -- -- -- -- -- -- -- -- --
872.4 Mission Bay/Kendall-Frost Reserve -- -- -- -- -- -- -- -- -- -- -- -- -- -- -- TE -- --
873.0 Mission Bay/Entrance -- -- -- TESO -- -- -- -- -- -- -- -- -- -- -- -- -- --
873.5 Mission Bay/Harbor Police -- -- -- -- -- -- TE -- -- -- -- -- -- -- -- TE -- --
874.0 San Diego River/Channel -- -- -- -- -- -- TESO -- -- -- -- -- -- -- -- -- -- --
874.2 Tecolote Creek -- -- -- -- -- -- -- -- SO -- -- -- -- -- -- -- -- --
874.5 San Diego River -- -- -- -- -- -- -- TESO -- -- -- -- -- -- -- -- -- --
880.0 National City -- -- -- SO -- -- -- -- -- -- -- -- -- -- -- -- -- --
881.0 San Diego Bay/Sweetwater Marsh -- -- -- -- -- TESO -- -- -- -- -- TE -- -- -- -- -- --
881.1 San Diego Bay/California Crane -- -- -- -- -- TE -- -- -- -- -- -- -- -- -- -- -- --
881.3 Sweetwater River/Mouth 1 -- -- -- -- -- -- -- -- -- -- -- -- -- TESO TESO -- -- --
881.4 Sweetwater River/Mouth 2 -- -- -- -- -- -- -- -- -- -- -- -- -- -- TESO -- -- --
881.5 San Diego Bay/Rohr Channel Mouth -- -- -- -- -- -- -- -- -- -- -- -- -- -- -- TE -- --
882.0 24th St Maritime Terminal/South -- -- -- -- TESO TE TE TE TE TE TE -- -- -- TE -- TE TESO
882.2 24Th St Maritime Terminal/North -- -- -- -- -- TE -- -- -- -- -- TE TE -- -- TE -- --
882.4 San Diego Bay/Navy Pier 13 -- -- -- -- -- TE TE TE -- -- -- -- -- -- -- -- -- --
882.5 San Diego Bay/NASSCO Pier 12 -- -- -- -- -- -- -- -- -- -- TESO -- -- -- -- -- -- --
882.6 San Diego Bay/Sampson St Extension -- -- -- -- -- -- -- -- TESO -- -- -- -- -- -- -- -- --
882.7 San Diego Bay/Sampson Street Pier -- -- -- -- -- -- -- -- -- SO TESO TESO -- -- -- TESO -- --
882.8 San Diego Bay/KELCO Pier -- -- -- -- -- -- -- -- -- SO -- TESO -- -- TESO -- -- --
882.9 San Diego Bay/Coronado Brdg/East -- -- -- -- -- -- -- -- -- SO -- TESO -- -- -- -- -- --
883.0 San Diego Bay/Navy Amphibious Base -- -- -- SO SO TE -- -- -- -- -- -- -- -- -- -- -- --
883.1 San Diego Bay/Chollas Creek -- -- -- -- -- -- -- -- -- -- -- TESO -- -- -- -- TESO --
883.4 San Diego Bay/Continental Maritime -- -- -- -- -- -- -- -- -- -- -- TE -- -- -- TESO TESO --
883.5 San Diego Bay/Tuna Docks -- -- -- -- -- -- -- -- -- SO -- TE -- -- -- -- TESO --
883.6 San Diego Bay/7th Street Channel -- -- -- -- -- -- -- -- -- -- TESO TESO -- TESO TESO -- -- --
883.7 San Diego Bay/Terminal S-10th St -- -- -- -- -- -- -- -- -- -- -- -- -- -- -- TESO -- --
883.8 San Diego Bay/Switzer Creek -- -- -- -- -- -- -- -- -- -- -- -- -- -- -- -- TESO --
_______________________________________________________________________________________________________________________________________________ * Sample Year = State Fiscal Year (July 1 - June 30). For example, Sample Year 1978 = 1977-78 Fiscal Year. -- = Not Sampled. SO = Synthetic Organics Only. TE = Trace Elements Only. TESO = Trace Elements and Synthetic Organics.

D-1
6
APPENDIX D (continued) State Mussel Watch Program
Station Sampling history _______________________________________________________________________________________________________________________________________________ Station Station Sample Year* Number Name 1978 1979 1980 1981 1982 1983 1984 1985 1986 1987 1988 1989 1990 1991 1992 1993 1994 1995 _______________________________________________________________________________________________________________________________________________ 884.0 San Diego Bay/Glorietta Bay -- -- -- -- TESO -- -- -- -- -- -- -- -- -- -- -- -- --
885.0 San Diego Bay/Buoy 30 -- -- -- -- SO -- -- -- -- -- -- -- -- -- -- -- -- --
885.2 San Diego Bay/32nd Street -- -- -- -- -- -- -- -- -- -- -- TESO -- -- -- -- -- --
885.4 San Diego Bay/NASSCO 28th St Pier -- -- -- -- -- -- -- -- -- -- -- SO -- -- -- -- -- --
886.0 San Diego Bay/NASSCO -- -- -- -- -- TE -- -- -- -- -- -- -- -- -- -- -- --
886.2 San Diego Gas&Electric Silvergate -- -- -- -- -- -- -- -- -- -- -- TESO -- -- -- -- -- --
887.0 San Diego Bay/Evans Street -- -- -- -- TESO TESO -- -- -- -- -- -- -- TESO TESO TESO -- --
888.0 San Diego Bay/Coronado Bridge -- -- TESO TESO -- -- -- -- -- -- -- -- -- -- TESO TESO -- --
889.0 San Diego Bay/Coronado Island -- -- -- -- SO -- -- -- -- -- -- -- -- -- -- -- -- --
890.0 San Diego Bay/8th Avenue -- -- -- -- SO TESO -- -- -- -- -- -- -- -- -- -- -- --
891.0 San Diego Bay/G Street Pier -- -- TE TESO TESO SO -- -- -- -- TE -- -- -- -- -- -- --
892.0 San Diego Bay/N Island/Boathouse -- -- -- -- -- -- -- TESO -- -- -- -- -- -- -- -- -- --
893.0 San Diego Bay/Laurel Street -- -- -- -- -- -- -- SO -- -- -- -- -- -- -- TESO -- --
894.0 SD Bay/Harbor Is/E Basin/Storm Dr -- -- -- -- SO TESO -- SO TESO -- TESO TESO TESO TESO TESO TESO TESO TESO
894.1 SD Bay/Harbor Is/E Basin/Storm Dr2 -- -- -- -- -- -- TESO -- -- -- -- TESO -- -- -- -- -- --
894.2 SD Bay/Harbor Is/E Basin/E End Doc -- -- -- -- -- -- -- -- -- -- -- TESO -- -- -- -- -- --
894.3 SD Bay/Harbor Is/E Basin/Mid Chan -- -- -- -- -- -- -- -- -- -- -- TESO -- -- -- -- -- --
894.5 SD Bay/Harbor Is/E Basin/W End Doc -- -- -- -- -- SO TESO -- -- -- -- -- -- -- -- -- -- --
894.6 SD Bay/Harbor Is/E Basin/W End -- -- -- -- -- -- -- -- -- TESO -- -- -- -- -- -- -- --
894.8 Laurel Street Storm Drain -- -- -- -- -- -- -- -- -- -- -- TESO -- -- -- -- -- --
895.0 Harbor Island Drive/East -- -- -- -- TE SO -- -- -- -- -- -- -- -- -- -- -- --
895.2 Harbor Island/West Bay/East -- -- -- -- -- -- -- TE -- -- -- -- -- -- -- -- -- --
895.4 Harbor Island/West Bay/West -- -- -- -- -- -- -- TE -- -- -- -- -- -- -- -- -- --
895.6 San Diego Bay/Grape St Storm Drain -- -- -- -- -- -- -- -- -- -- -- -- -- -- -- TESO -- --
896.0 San Diego Bay/N Island/Runway 36 -- -- -- -- -- -- -- TESO -- -- -- -- -- -- -- -- -- --
896.2 San Diego Bay/N Is/DPDO Dumpsite -- -- -- -- -- -- -- TESO TESO -- -- -- -- -- -- -- -- --
897.0 San Diego Bay/Shelter Is/East -- -- -- -- TE TESO -- -- -- -- -- -- -- -- -- -- -- --
897.5 Commercial Basin/North Harbor Dr -- -- -- -- -- SO -- -- TESO TESO TESO -- -- -- -- -- -- --
898.0 Commercial Basin/Carlton Street -- -- -- -- SO TESO -- -- -- -- -- TESO TESO -- -- TESO -- --
898.2 San Diego Bay/N Is/Launch Docks -- -- -- -- -- -- TESO -- -- -- -- -- -- -- -- -- -- --
898.4 San Diego Bay/North Island Plat -- -- -- -- -- -- TE -- -- -- -- -- -- -- -- -- -- --
899.0 San Diego Bay/Shelter Is/Fshg Pier -- SO TESO TESO -- -- -- -- -- -- -- TE TE -- TESO TESO -- TESO
899.1 San Diego Bay/Shelter Is/Duffy's -- -- -- -- -- -- -- -- -- TE -- -- -- -- -- -- -- --
899.2 San Diego Bay/Shelter Island -- -- -- -- -- -- -- TE -- -- -- -- -- -- -- TESO -- --
899.4 San Diego Bay/Shelter Is/Fuel Dock -- -- -- -- -- -- -- -- -- TESO TESO -- -- -- -- -- -- -- _______________________________________________________________________________________________________________________________________________ * Sample Year = State Fiscal Year (July 1 - June 30). For example, Sample Year 1978 = 1977-78 Fiscal Year. -- = Not Sampled. SO = Synthetic Organics Only. TE = Trace Elements Only. TESO = Trace Elements and Synthetic Organics.

D-1
7
APPENDIX D (continued) State Mussel Watch Program
Station Sampling history _______________________________________________________________________________________________________________________________________________ Station Station Sample Year* Number Name 1978 1979 1980 1981 1982 1983 1984 1985 1986 1987 1988 1989 1990 1991 1992 1993 1994 1995 _______________________________________________________________________________________________________________________________________________ 900.0 San Diego Bay/Range Marker -- -- -- -- -- -- -- TE -- -- -- -- -- -- -- -- -- --
900.5 San Diego Bay/Bait Tanks -- -- -- -- -- -- -- TE -- -- -- -- -- -- -- -- -- --
901.0 San Diego Bay/Degausing Station -- -- -- -- TESO TESO -- -- -- -- -- -- -- TESO TESO -- -- --
901.2 San Diego Bay/N Island/Ammo Pier -- -- -- -- -- -- -- TESO -- -- -- -- -- -- -- -- -- --
902.0 Zuniga Jetty/Buoy -- -- -- SO -- -- -- -- -- -- -- -- -- -- -- -- -- --
903.0 Zuniga Jetty -- -- -- -- -- -- TESO TE TESO -- -- -- -- -- -- -- -- --
904.0 Imperial Beach/Pier -- -- -- -- -- -- TE -- -- -- -- -- -- TESO -- -- -- --
904.8 Tijuana River/Imperial Beach -- -- -- -- -- -- -- TESO TESO -- -- -- -- -- -- -- -- --
905.0 Tijuana River -- -- -- -- -- -- TESO -- -- -- -- -- -- -- -- -- -- --
906.0 Mexican Border -- -- -- -- -- -- -- -- TESO -- -- -- -- -- -- -- -- --
_______________________________________________________________________________________________________________________________________________ * Sample Year = State Fiscal Year (July 1 - June 30). For example, Sample Year 1978 = 1977-78 Fiscal Year. -- = Not Sampled. SO = Synthetic Organics Only. TE = Trace Elements Only. TESO = Trace Elements and Synthetic Organics.

�
E-1
APPENDIX E
Summary of 1993-95 Data
Organic Chemicals Exceeding Selected Criteria
(ppb, wet weight)

E-2
��
�
Appendix E State Mussel Watch Program
Summary of 1993-95 Data: Organic Chemicals Exceeding Selected Criteria (ppb, wet weight)
______________________________________________________________________________________________________________________ Total Chlor- Dacthal Total Dieldrin Station Station Sample Sample Chlor- pyrifos DDT Number Name Type+ Date++ dane ______________________________________________________________________________________________________________________ 302.0 Point Pinole TCM 02/02/82 308.0 San Francisco Bay/Hunter's Point TCM 01/15/88 10.4* 309.0 San Mateo Bridge/8B TCM 02/12/85 22.2** 313.0 San Francisco Bay/near Redwood Cr TCM 02/12/85 16.1* 313.0 San Francisco Bay/near Redwood Cr TCM 01/15/88 7.2* 321.0 Dumbarton Bridge/Channel Marker 14 TCM 01/18/82 9.5* 321.0 Dumbarton Bridge/Channel Marker 14 TCM 02/12/85 16.9* 321.0 Dumbarton Bridge/Channel Marker 14 TCM 01/15/88 8.9* 404.0 Sandholdt Bridge TCM 03/07/94 5.0** 39.8** 647.9** 36.3** 404.0 Sandholdt Bridge TCM 02/22/95 2.5** 19.3** 442.7** 41.9** 414.0 Pacific Grove RCM 04/19/95 1.8* 420.0 Monterey Harbor/Coast Guard Jetty TCM 05/26/94 507.3 Mugu Lagoon/Calleguas Creek TCM 02/08/94 28.5* 10.4** 62.4** 556.9** 601.0 LA Harbor/National Steel TCM 01/31/95 605.0 LA Harbor/Cabrillo Pier TCM 02/08/94 227.3* ______________________________________________________________________________________________________________________ Total Endrin alpha- beta- Gamma- Hepta- Hepta- Oxa- Total Toxaphene Station Endo- HCH HCH HCH chlor chlor- diazon PCB Number sulfan epoxide ______________________________________________________________________________________________________________________ 302.0 0.2* 308.0 0.2* 552.4** 309.0 0.6* 1.0** 0.4* 313.0 0.9** 0.5* 313.0 3.0** 0.4* 2.3* 321.0 1.0* 1.7** 0.6** 321.0 1.0** 0.4* 321.0 0.8** 0.3* 404.0 23.0* 4.5** 0.4* 147.1** 404.0 15.7* 3.1** 0.5** 122.4** 414.0 420.0 0.9* 1.0** 507.3 1.1* 0.9** 468.0** 601.0 10.5* 605.0 ______________________________________________________________________________________________________________________ + RCM = Resident California Mussel * = Equals or exceeds EDL 85. TCM = Transplanted California Mussel ** = Equals or exceeds EDL 95. RBM = Resident Bay Mussel ++ = Samples with a collection date prior to 1993 are archive samples.

E-3
�
�
Appendix E (continued) State Mussel Watch Program
Summary of 1993-95 Data: Organic Chemicals Exceeding Selected Criteria (ppb, wet weight)
______________________________________________________________________________________________________________________ Total Chlor- Dacthal Total Dieldrin Station Station Sample Sample Chlor- pyrifos DDT Number Name Type+ Date dane ______________________________________________________________________________________________________________________ 605.0 LA Harbor/Cabrillo Pier TCM 01/31/95 616.0 LA Harbor/Consolidated Slip TCM 02/08/94 1.4* 616.0 LA Harbor/Consolidated Slip TCM 01/31/95 0.6* 618.0 LA Harbor/Angels Gate RCM 02/08/94 238.0** 618.0 LA Harbor/Angels Gate RCM 01/31/95 16.5** 0.6** 146.5** 648.0 Malibu RBM 02/07/94 1.5** 648.0 Malibu RBM 01/31/95 650.0 Santa Monica RCM 02/07/94 5.1* 53.1* 650.0 Santa Monica RCM 01/31/95 19.9** 0.7** 50.3* 3.0** 662.0 Royal Palms RCM 02/08/94 106.4* 662.0 Royal Palms RCM 01/31/95 4.8* 122.1* 664.0 Cabrillo Beach RCM 11/11/94 5.9* 120.2* 713.0 Huntington Harbour/Edinger Street TCM 02/07/94 1.3* 2.2* 713.0 Huntington Harbour/Edinger Street TCM 01/30/95 0.9* 715.0 Huntington Harbour/Warner Ave Brdg TCM 02/07/94 1.3* ______________________________________________________________________________________________________________________ Total Endrin alpha- beta- Gamma- Hepta- Hepta- Oxa- Total Toxaphene Station Endo- HCH HCH HCH chlor chlor- diazon PCB Number sulfan epoxide ______________________________________________________________________________________________________________________ 605.0 0.2* 16.7* 616.0 616.0 30.7* 618.0 67.6** 618.0 0.2** 1.3** 77.8** 41.4** 648.0 648.0 0.2* 2.8** 650.0 0.5** 650.0 0.2** 20.3* 662.0 662.0 15.3* 664.0 16.5* 713.0 713.0 0.2* 15.1* 715.0 1.5* ______________________________________________________________________________________________________________________ + RCM = Resident California Mussel * = Equals or exceeds EDL 85. TCM = Transplanted California Mussel ** = Equals or exceeds EDL 95. RBM = Resident Bay Mussel

E-4
�
�
Appendix E (continued) State Mussel Watch Program
Summary of 1993-95 Data: Organic Chemicals Exceeding Selected Criteria (ppb, wet weight)
______________________________________________________________________________________________________________________ Total Chlor- Dacthal Total Dieldrin Station Station Sample Sample Chlor- pyrifos DDT Number Name Type+ Date dane ______________________________________________________________________________________________________________________ 715.0 Huntington Harbour/Warner Ave Brdg TCM 01/30/95 1.1* 723.4 Newport Bay/Turning Basin TCM 01/30/95 0.7* 724.0 Newport Bay/Highway 1 Bridge TCM 02/07/94 1.4* 724.0 Newport Bay/Highway 1 Bridge TCM 01/30/95 2.9** 1.2* 725.0 Newport Bay/Crows Nest TCM 02/07/94 0.6* 725.0 Newport Bay/Crows Nest TCM 01/30/95 726.4 Newport Bay/Rhine Channel/End TCM 02/07/94 1.6** 726.4 Newport Bay/Rhine Channel/End TCM 01/30/95 0.7* 750.0 Oceanside RCM 01/30/95 6.2* 0.6** 868.5 Mission Bay/Landfill 1 TCM 01/30/95 868.6 Mission Bay/Landfill 2 TCM 01/30/95 894.0 SD Bay/Harbor Is/E Basin/Storm Dr TCM 02/08/94 894.0 SD Bay/Harbor Is/E Basin/Storm Dr TCM 01/31/95 ______________________________________________________________________________________________________________________ Total Endrin alpha- beta- Gamma- Hepta- Hepta- Oxa- Total Toxaphene Station Endo- HCH HCH HCH chlor chlor- diazon PCB Number sulfan epoxide ______________________________________________________________________________________________________________________ 715.0 0.2* 20.7* 723.4 1.6* 15.6* 724.0 724.0 0.2* 4.0** 43.4* 725.0 725.0 10.8* 726.4 726.4 1.9* 22.1* 750.0 0.7** 26.4** 868.5 0.3* 1.3* 868.6 0.3* 1.3* 894.0 0.1** 651.2** 894.0 0.2** 0.2* 2305.8## ______________________________________________________________________________________________________________________ + RCM = Resident California Mussel * = Equals or exceeds EDL 85. TCM = Transplanted California Mussel ** = Equals or exceeds EDL 95. RBM = Resident Bay Mussel ## = Equals or exceeds FDA Action Level.

�
F-1
APPENDIX F
Summary of 1993-95 Data
Organic Chemicals Exceeding
Maximum Tissue Residue Levels (MTRLs) in
Ocean Waters
(ppb, wet weight)

F-2
�
�
APPENDIX F State Mussel Watch Program
Summary of 1993-95 Data: Organic Chemicals Exceeding Maximum Tissue Residue Levels (MTRLs) in Ocean Waters (ppb, wet weight)
___________________________________________________________________________________________________________________________________________________ Station Station Sample Sample Total Total Dieldrin Total Toxaphene Number Name Type* Date Chlor- DDT PCB dane ________________________________________________________________________________________________________________________ 10.0 Trinidad Head RCM 10/14/93 0.8 10.0 Trinidad Head RCM 11/28/94 0.6 2.2 202.0 Bodega Head RCM 09/16/93 0.5 1.1 202.0 Bodega Head RCM 09/19/94 1.0 4.3 414.0 Pacific Grove RCM 04/19/95 1.0 1.8 1.5 414.0 Pacific Grove RCM 04/14/94 0.8 0.9 618.0 LA Harbor/Angels Gate RCM 02/08/94 2.0 238.0 67.6 618.0 LA Harbor/Angels Gate RCM 01/31/95 16.5 146.5 1.5 77.8 41.4 648.0 Malibu RBM 02/07/94 14.5 79.7 26.6 648.0 Malibu RBM 01/31/95 10.8 47.0 1.2 12.3 650.0 Santa Monica RCM 02/07/94 5.1 53.1 9.2 650.0 Santa Monica RCM 01/31/95 19.9 50.3 3.0 20.3 662.0 Royal Palms RCM 02/08/94 1.3 106.4 8.6 662.0 Royal Palms RCM 01/31/95 4.8 122.1 1.4 15.3 664.0 Cabrillo Beach RCM 11/11/94 5.9 120.2 1.0 16.5 750.0 Oceanside RCM 01/30/95 6.2 41.8 1.2 4.3 26.4 ___________________________________________________________________________________________________________________________________________________ * RCM = Resident California Mussel RBM = Resident Bay Mussel

H-1
APPENDIX H
Summary of 1993-95 Data
Trace Elements Exceeding the
Median International Standards (MIS)
(ppm, wet weight)

H-2
APPENDIX H State Mussel Watch Program
Summary of 1993-95 Data: Trace Elements Excdeeding the Median International Standards (MIS) (ppm, wet weight)
________________________________________________________________________________________________________________________________________________________________________ Station Station Sample Sample Arsenic Cadmium Chromium Copper Lead Selenium Zinc Number Name Type* Date** (1.4) (1.0) (1.0) (20.0) (2.0) (0.3) (70.0) ________________________________________________________________________________________________________________________________________________________________________
10.0 Trinidad Head RCM 10/14/93 1.6 1.6 1.0 10.0 Trinidad Head RCM 11/28/94 9.7 101.0 Samoa Bridge/West TCM 02/24/94 1.6 1.1 0.35 103.0 Eureka Channel TCM 02/24/94 1.4 1.1 202.0 Bodega Head RCM 09/16/93 1.9 202.0 Bodega Head RCM 09/19/94 1.6 2.9 1.4 308.0 San Francisco Bay/Hunter's Point TCM 01/15/88 1.3 2.6 0.49 309.0 San Mateo Bridge/8B TCM 02/12/85 1.3 1.8 0.43 313.0 San Francisco Bay/near Redwood Cr TCM 02/12/85 1.5 4.2 0.42 313.0 San Francisco Bay/near Redwood Cr TCM 01/15/88 1.4 3.2 0.60 321.0 Dumbarton Bridge/Channel Marker 14 TCM 02/12/85 1.3 3.5 0.30 404.0 Sandholdt Bridge TCM 03/07/94 1.0 404.0 Sandholdt Bridge TCM 02/22/95 1.2 414.0 Pacific Grove RCM 04/14/94 1.4 414.0 Pacific Grove RCM 04/19/95 1.2 1.5 420.0 Monterey Harbor/Coast Guard Jetty TCM 05/26/94 2.4 420.3 Monterey Harbor/C G Jetty/Inner TCM 05/26/94 2.3 421.0 Monterey Harbor/Slag Pile TCM 05/26/94 1.7 3.3 507.3 Mugu Lagoon/Calleguas Creek TCM 02/08/94 1.5 1.7 0.51 601.0 LA Harbor/National Steel TCM 02/08/94 1.4 601.0 LA Harbor/National Steel TCM 01/31/95 1.7 602.0 LA Harbor/West Basin TCM 02/08/94 1.6 605.0 LA Harbor/Cabrillo Pier TCM 02/08/94 0.74 605.0 LA Harbor/Cabrillo Pier TCM 01/31/95 0.46 616.0 LA Harbor/Consolidated Slip TCM 02/08/94 1.8 2.3 0.43 616.0 LA Harbor/Consolidated Slip TCM 01/31/95 1.6 2.1 618.0 LA Harbor/Angels Gate RCM 02/08/94 0.80 618.0 LA Harbor/Angels Gate RCM 01/31/95 0.50 648.0 Malibu RBM 02/07/94 1.5 0.85 648.0 Malibu RBM 01/31/95 8.3 0.58 650.0 Santa Monica RCM 02/07/94 0.73 650.0 Santa Monica RCM 01/31/95 4.5 0.99 662.0 Royal Palms RCM 02/08/94 0.53 662.0 Royal Palms RCM 01/31/95 5.1 0.47 664.0 Cabrillo Beach RCM 11/11/94 1.6 0.54 681.0 Catalina Island/West RCM 03/30/94 1.2 3.5 0.36 713.0 Huntington Harbour/Edinger Street TCM 02/07/94 1.6 1.3 0.40 713.0 Huntington Harbour/Edinger Street TCM 01/30/95 1.5 18.0 715.0 Huntington Harbour/Warner Ave Brdg TCM 02/07/94 1.5 1.4 0.37 715.0 Huntington Harbour/Warner Ave Brdg TCM 01/30/95 1.2 15.0 ________________________________________________________________________________________________________________________________________________________________________
* RCM = Resident California Mussel ( ) Median International Standard in Parentheses. TCM = Transplanted California Mussel ** Samples with a collection date prior to 1993 are archive samps. RBM = Resident Bay Mussel

H-3
APPENDIX H (continued) State Mussel Watch Program
Summary of 1993-95 Data: Trace Elements Excdeeding the Median International Standards (MIS) (ppm, wet weight)
________________________________________________________________________________________________________________________________________________________________________ Station Station Sample Sample Arsenic Cadmium Chromium Copper Lead Selenium Zinc Number Name Type* Date (1.4) (1.0) (1.0) (20.0) (2.0) (0.3) (70.0) ________________________________________________________________________________________________________________________________________________________________________
723.4 Newport Bay/Turning Basin TCM 01/30/95 1.7 1.9 724.0 Newport Bay/Highway 1 Bridge TCM 02/07/94 1.5 1.4 724.0 Newport Bay/Highway 1 Bridge TCM 01/30/95 1.4 75.0 725.0 Newport Bay/Crows Nest TCM 02/07/94 1.5 1.7 21.0 0.31 81.0 725.0 Newport Bay/Crows Nest TCM 01/30/95 1.2 2.5 726.4 Newport Bay/Rhine Channel/End TCM 02/07/94 1.4 1.5 26.0 88.0 726.4 Newport Bay/Rhine Channel/End TCM 01/30/95 1.6 72.0 750.0 Oceanside RCM 01/30/95 2.3 868.5 Mission Bay/Landfill 1 TCM 01/30/95 1.1 1.1 0.30 868.6 Mission Bay/Landfill 2 TCM 01/30/95 1.6 1.6 0.43 882.0 24th St Maritime Terminal/South TCM 02/08/94 1.4 1.2 81.0 882.0 24th St Maritime Terminal/South TCM 01/31/95 2.0 1.7 71.0 883.1 San Diego Bay/Chollas Creek TCM 02/08/94 1.7 75.0 883.4 San Diego Bay/Continental Maritime TCM 02/08/94 1.2 71.0 883.5 San Diego Bay/Tuna Docks TCM 02/08/94 1.2 883.8 San Diego Bay/Switzer Creek TCM 02/08/94 1.2 894.0 SD Bay/Harbor Is/E Basin/Storm Dr TCM 02/08/94 1.4 1.7 2.0 86.0 894.0 SD Bay/Harbor Is/E Basin/Storm Dr TCM 01/31/95 1.4 3.4 3.4 97.0 899.0 San Diego Bay/Shelter Is/Fshg Pier TCM 01/31/95 4.4 ___________________________________________________________________________________________________________________________________________________________________
* RCM = Resident California Mussel ( ) Median International Standard in Parentheses. TCM = Transplanted California Mussel RBM = Resident Bay Mussel

I-1
APPENDIX I
Summary of 1993-95 Data
Trace Elements Exceeding Elevated Data Levels (EDL)
(ppm, wet weight)

I-2
�
�
APPENDIX I State Mussel Watch Program
Summary of 1993-95 Data: Trace Elements Exceeding Elevated Data Levels (EDL) (ppm, wet weight)
_________________________________________________________________________________________________________________________________________________________ Station Station Sample Sample Aluminum Cadmium Copper Manganese Nickel Silver Number Name Type+ Date++ Arsenic Chromium Lead Mercury Selenium Zinc _________________________________________________________________________________________________________________________________________________________ 10.0 Trinidad Head RCM 10/14/93 200.0** 1.60* 1.00** 3.50** 0.83** 10.0 Trinidad Head RCM 11/28/94 160.0** 9.70** 1.70* 3.70** 100.0 Mad River Slough TCM 02/24/94 140.0* 1.10** 101.0 Samoa Bridge/West TCM 02/24/94 380.0** 0.95* 4.90* 1.50** 103.0 Eureka Channel TCM 02/24/94 340.0** 0.85* 1.20** 202.0 Bodega Head RCM 09/16/93 1.90* 202.0 Bodega Head RCM 09/19/94 2.90** 1.40** 1.20** 308.0 San Francisco Bay/Hunter's Point TCM 01/15/88 400.0** 2.60** 4.70* 0.07* 309.0 San Mateo Bridge/8B TCM 02/12/85 350.0** 1.80** 12.00** 0.09** 313.0 San Francisco Bay/near Redwood Cr TCM 02/12/85 400.0** 4.20** 11.00** 0.10** 0.18* 313.0 San Francisco Bay/near Redwood Cr TCM 01/15/88 130.0* 3.20** 0.07* 0.47** 321.0 Dumbarton Bridge/Channel Marker 14 TCM 02/12/85 370.0** 3.50** 8.30** 0.08* 0.13* 404.0 Sandholdt Bridge TCM 03/07/94 250.0** 404.0 Sandholdt Bridge TCM 02/22/95 190.0* 0.69* 414.0 Pacific Grove RCM 04/14/94 41.0** 414.0 Pacific Grove RCM 04/19/95 1.50** 420.0 Monterey Harbor/Coast Guard Jetty TCM 05/26/94 2.40** 420.3 Monterey Harbor/C G Jetty/Inner TCM 05/26/94 2.30** 421.0 Monterey Harbor/Slag Pile TCM 05/26/94 1.70* 3.30** 507.3 Mugu Lagoon/Calleguas Creek TCM 02/08/94 140.0* 1.70* 601.0 LA Harbor/National Steel TCM 02/08/94 140.0* 5.50* 5.70* 60.0* 601.0 LA Harbor/National Steel TCM 01/31/95 1.70* 0.75* 602.0 LA Harbor/West Basin TCM 02/08/94 1.60* 605.0 LA Harbor/Cabrillo Pier TCM 02/08/94 160.0* 0.74* 616.0 LA Harbor/Consolidated Slip TCM 02/08/94 130.0* 1.80* 2.30* 59.0* 616.0 LA Harbor/Consolidated Slip TCM 01/31/95 1.60* 2.10** 60.0* 618.0 LA Harbor/Angels Gate RCM 02/08/94 170.0** 2.10** 2.80** 0.80* 618.0 LA Harbor/Angels Gate RCM 01/31/95 130.0** 1.70* 2.90** 648.0 Malibu RBM 02/07/94 220.0** 2.50* 0.29** 648.0 Malibu RBM 01/31/95 280.0** 8.30** 5.30* 650.0 Santa Monica RCM 02/07/94 410.0** 8.80** 0.73* 650.0 Santa Monica RCM 01/31/95 120.0* 4.50** 2.60** 2.60* 0.99** 0.67* 34.0* 662.0 Royal Palms RCM 02/08/94 190.0** 6.10** 662.0 Royal Palms RCM 01/31/95 110.0* 5.10** 1.60* 2.90** 664.0 Cabrillo Beach RCM 11/11/94 120.0* 1.60** 2.00* 2.60* 0.54* 0.72* 34.0* 681.0 Catalina Island/West RCM 03/30/94 3.50** 37.0* 713.0 Huntington Harbour/Edinger Street TCM 02/07/94 190.0* 713.0 Huntington Harbour/Edinger Street TCM 01/30/95 250.0** 18.00** 6.20** 715.0 Huntington Harbour/Warner Ave Brdg TCM 02/07/94 190.0* 1.70* 5.90* 63.0* 715.0 Huntington Harbour/Warner Ave Brdg TCM 01/30/95 200.0* 15.00** 5.90* 55.0* _________________________________________________________________________________________________________________________________________________________ + RCM = Resident California Mussel * = Equals or exceeds EDL 85. TCM = Transplanted California Mussel ** = Equals or exceeds EDL 95. RBM = Resident Bay Mussel ++ = Samples with a collection date prior to 1993 are archive samples.

I-3
�
�
APPENDIX I (continued) State Mussel Watch Program
Summary of 1993-95 Data: Trace Elements Exceeding Elevated Data Levels (EDL) (ppm, wet weight)
_________________________________________________________________________________________________________________________________________________________ Station Station Sample Sample Aluminum Cadmium Copper Manganese Nickel Silver Number Name Type+ Date Arsenic Chromium Lead Mercury Selenium Zinc _________________________________________________________________________________________________________________________________________________________ 723.4 Newport Bay/Turning Basin TCM 01/30/95 1.70* 1.90** 55.0* 724.0 Newport Bay/Highway 1 Bridge TCM 02/07/94 150.0* 7.50** 724.0 Newport Bay/Highway 1 Bridge TCM 01/30/95 7.00* 6.90** 0.06* 75.0* 725.0 Newport Bay/Crows Nest TCM 02/07/94 1.70* 21.00** 4.80* 0.09** 81.0** 725.0 Newport Bay/Crows Nest TCM 01/30/95 280.0** 2.50** 726.4 Newport Bay/Rhine Channel/End TCM 02/07/94 26.00** 12.00** 0.07* 88.0** 726.4 Newport Bay/Rhine Channel/End TCM 01/30/95 1.60* 11.00* 6.10** 0.06* 72.0* 750.0 Oceanside RCM 01/30/95 230.0** 2.30** 1.70* 3.60** 868.5 Mission Bay/Landfill 1 TCM 01/30/95 250.0** 1.10* 1.10** 868.6 Mission Bay/Landfill 2 TCM 01/30/95 240.0** 1.60* 0.72* 882.0 24th St Maritime Terminal/South TCM 02/08/94 170.0* 11.00* 5.60* 81.0** 882.0 24th St Maritime Terminal/South TCM 01/31/95 150.0* 2.00** 1.70** 6.90* 71.0* 883.1 San Diego Bay/Chollas Creek TCM 02/08/94 170.0* 1.70* 5.30* 5.40* 75.0* 883.4 San Diego Bay/Continental Maritime TCM 02/08/94 160.0* 9.20* 10.00** 71.0* 883.5 San Diego Bay/Tuna Docks TCM 02/08/94 62.0* 883.8 San Diego Bay/Switzer Creek TCM 02/08/94 5.80* 4.70* 894.0 SD Bay/Harbor Is/E Basin/Storm Dr TCM 02/08/94 1.70* 8.00* 2.00* 0.14* 86.0** 894.0 SD Bay/Harbor Is/E Basin/Storm Dr TCM 01/31/95 130.0* 3.40** 5.30* 3.40** 0.11* 97.0** 899.0 San Diego Bay/Shelter Is/Fshg Pier TCM 01/31/95 180.0* 4.40** 62.0* _________________________________________________________________________________________________________________________________________________________ + RCM = Resident California Mussel * = Equals or exceeds EDL 85. TCM = Transplanted California Mussel ** = Equals or exceeds EDL 95. RBM = Resident Bay Mussel�

J-1
APPENDIX J
Summary of 1993-95 Data
Trace Elements in Mussels and Sediment
(ppm, wet weight)

J-2
APPENDIX J State Mussel Watch Program
Summary of 1993-95 Data: Trace Elements in Mussels and Sediment
(ppm, wet weight) _________________________________________________________________________________________________________________________________________________________ Station Station Sample Sample Aluminum Cadmium Copper Manganese Nickel Silver Number Name Type* Date** Arsenic Chromium Lead Mercury Selenium Zinc _________________________________________________________________________________________________________________________________________________________ 10.0 Trinidad Head RCM 10/14/93 200.0 1.6 1.6 1.00 1.40 0.30 3.50 0.036 0.83 0.27 0.006 28.0 10.0 Trinidad Head RCM 11/28/94 160.0 NA 1.0 9.70 1.70 0.21 3.70 0.024 NA NA 0.006 26.0 100.0 Mad River Slough TCM 02/24/94 140.0 1.3 1.0 0.43 1.30 0.28 2.60 0.032 1.10 0.24 0.004 32.0 101.0 Samoa Bridge/West TCM 02/24/94 380.0 1.6 1.1 0.95 1.70 0.28 4.90 0.042 1.50 0.35 0.008 36.0 103.0 Eureka Channel TCM 02/24/94 340.0 1.4 1.1 0.85 1.60 0.38 4.20 0.033 1.20 0.26 0.006 33.0 202.0 Bodega Head RCM 09/16/93 64.0 NA 1.9 0.27 1.10 0.25 1.50 0.037 NA NA 0.019 24.0 202.0 Bodega Head RCM 09/19/94 29.0 1.6 2.9 1.40 1.10 0.19 1.00 0.036 1.20 0.20 0.013 29.0 308.0 San Francisco Bay/Hunter's Point TCM 01/15/88 400.0 NA 1.3 2.60 3.30 0.53 4.70 0.067 NA 0.49 0.097 38.0 309.0 San Mateo Bridge/8B TCM 02/12/85 350.0 NA 1.3 1.80 3.50 0.28 12.00 0.089 NA 0.43 0.092 34.0 313.0 San Francisco Bay/near Redwood Cr TCM 02/12/85 400.0 NA 1.5 4.20 2.90 0.26 11.00 0.100 NA 0.42 0.180 31.0 313.0 San Francisco Bay/near Redwood Cr TCM 01/15/88 130.0 NA 1.4 3.20 4.00 0.18 4.20 0.067 NA 0.60 0.470 30.0 321.0 Dumbarton Bridge/Channel Marker 14 TCM 02/12/85 370.0 NA 1.3 3.50 2.10 0.29 8.30 0.075 NA 0.30 0.130 32.0 404.0 Sandholdt Bridge TCM 03/07/94 250.0 NA 1.0 0.36 1.70 0.26 3.10 0.041 NA NA 0.007 42.0 404.0 Sandholdt Bridge TCM 02/22/95 190.0 NA 1.2 0.69 1.50 0.30 2.70 0.037 NA NA 0.003 41.0 414.0 Pacific Grove RCM 04/14/94 19.0 NA 1.4 0.11 0.91 0.52 0.67 0.025 NA NA 0.040 41.0 414.0 Pacific Grove RCM 04/19/95 42.0 NA 1.2 1.50 1.30 0.42 1.10 0.024 NA NA 0.016 31.0 420.0 Monterey Harbor/Coast Guard Jetty TCM 05/26/94 11.0 NA 2.4 0.08 1.50 0.56 0.93 0.021 NA NA 0.026 29.0 420.3 Monterey Harbor/C G Jetty/Inner TCM 05/26/94 13.0 NA 2.3 0.06 2.10 1.10 0.86 0.026 NA NA 0.017 34.0 421.0 Monterey Harbor/Slag Pile TCM 05/26/94 52.0 NA 1.7 0.26 3.60 3.30 0.86 0.043 NA NA 0.032 52.0 507.3 Mugu Lagoon/Calleguas Creek TCM 02/08/94 140.0 1.5 1.7 0.26 1.70 0.34 3.50 0.029 0.37 0.51 0.028 31.0 508.1 Mugu Drainage 1 SED 01/31/95 NA NA NA NA NA NA NA NA NA 0.55 NA NA 601.0 LA Harbor/National Steel SED 11/09/93 17000.0 NA 1.0 47.00 58.00 40.00 370.00 0.220 23.00 0.20 0.230 140.0 601.0 LA Harbor/National Steel TCM 02/08/94 140.0 NA 1.4 0.38 5.50 1.50 5.70 0.039 0.27 0.27 0.020 60.0 601.0 LA Harbor/National Steel TCM 01/31/95 57.0 NA 1.7 0.75 1.50 1.00 2.30 0.034 NA 0.20 0.007 53.0 602.0 LA Harbor/West Basin TCM 02/08/94 80.0 1.3 1.6 0.28 3.90 0.86 3.00 0.034 0.24 0.28 0.014 44.0 605.0 LA Harbor/Cabrillo Pier SED 11/09/93 13000.0 NA 1.0 43.00 74.00 18.00 220.00 0.110 23.00 0.41 0.240 78.0 605.0 LA Harbor/Cabrillo Pier TCM 02/08/94 160.0 NA 0.9 0.35 3.20 0.96 4.40 0.032 0.26 0.74 0.022 39.0 605.0 LA Harbor/Cabrillo Pier TCM 01/31/95 120.0 NA 0.9 NA 2.20 NA 4.50 0.026 NA 0.46 0.033 41.0 616.0 LA Harbor/Consolidated Slip SED 11/09/93 11000.0 NA 5.7 47.00 65.00 56.00 220.00 0.130 21.00 0.20 0.380 240.0 616.0 LA Harbor/Consolidated Slip TCM 02/08/94 130.0 NA 1.8 0.39 3.40 2.30 3.70 0.033 0.28 0.43 0.014 59.0 616.0 LA Harbor/Consolidated Slip TCM 01/31/95 96.0 NA 1.6 2.10 1.70 1.50 3.40 0.028 NA ND 0.010 60.0 618.0 LA Harbor/Angels Gate RCM 02/08/94 170.0 1.3 0.2 0.26 2.10 0.31 2.80 0.015 0.16 0.80 0.012 20.0 618.0 LA Harbor/Angels Gate RCM 01/31/95 130.0 NA 0.4 NA 1.70 NA 2.90 0.014 NA 0.50 0.009 17.0 648.0 Malibu RBM 02/07/94 220.0 1.5 0.2 0.33 2.50 0.79 4.00 0.023 0.37 0.85 0.290 18.0 648.0 Malibu RBM 01/31/95 280.0 NA 0.4 8.30 1.50 0.15 5.30 0.014 NA 0.58 0.048 16.0 650.0 Santa Monica RCM 02/07/94 410.0 1.3 0.3 0.44 1.30 0.31 8.80 0.017 0.61 0.73 0.057 12.0 650.0 Santa Monica RCM 01/31/95 120.0 NA 0.3 4.50 2.60 0.75 2.60 0.026 NA 0.99 0.670 34.0 662.0 Royal Palms RCM 02/08/94 190.0 NA 0.3 0.42 1.50 0.32 6.10 0.017 0.53 0.53 0.400 20.0 662.0 Royal Palms RCM 01/31/95 110.0 NA 0.4 5.10 1.60 0.32 2.90 0.024 NA 0.47 0.290 27.0 664.0 Cabrillo Beach RCM 11/11/94 120.0 NA 0.4 1.60 2.00 0.43 2.60 0.036 NA 0.54 0.720 34.0 _________________________________________________________________________________________________________________________________________________________ * RCM = Resident California Mussel RBM = Resident Bay Mussel NA = Not Analyzed TCM = Transplanted California Mussel SED = Sediment ND = Not Detected ** Samples with a collection date prior to 1993 are archive samples.

J-3
APPENDIX J (continued) State Mussel Watch Program
Summary of 1993-95 Data: Trace Elements in Mussels and Sediment
(ppm, wet weight) _________________________________________________________________________________________________________________________________________________________ Station Station Sample Sample Aluminum Cadmium Copper Manganese Nickel Silver Number Name Type* Date Arsenic Chromium Lead Mercury Selenium Zinc _________________________________________________________________________________________________________________________________________________________ 681.0 Catalina Island/West RCM 03/30/94 27.0 NA 1.2 0.30 0.68 3.50 1.30 0.031 0.35 0.36 0.150 37.0 713.0 Huntington Harbour/Edinger Street TCM 02/07/94 190.0 1.6 1.3 0.28 2.50 0.89 4.20 0.055 0.26 0.40 0.007 53.0 713.0 Huntington Harbour/Edinger Street TCM 01/30/95 250.0 NA 1.5 18.00 2.10 0.90 6.20 0.036 NA NA 0.012 46.0 715.0 Huntington Harbour/Warner Ave Brdg TCM 02/07/94 190.0 1.5 1.4 0.33 2.50 1.70 5.90 0.036 0.34 0.37 0.009 63.0 715.0 Huntington Harbour/Warner Ave Brdg TCM 01/30/95 200.0 NA 1.2 15.00 2.60 1.50 5.90 0.032 NA NA 0.014 55.0 723.4 Newport Bay/Turning Basin TCM 01/30/95 95.0 NA 1.7 1.90 2.40 0.54 4.50 0.044 NA NA 0.009 55.0 724.0 Newport Bay/Highway 1 Bridge TCM 02/07/94 150.0 1.5 1.4 0.32 2.70 0.54 7.50 0.037 0.58 0.27 0.008 46.0 724.0 Newport Bay/Highway 1 Bridge TCM 01/30/95 110.0 NA 1.4 0.52 7.00 0.70 6.90 0.065 NA NA 0.010 75.0 725.0 Newport Bay/Crows Nest TCM 02/07/94 110.0 1.5 1.7 0.29 21.00 1.00 4.80 0.085 0.58 0.31 0.011 81.0 725.0 Newport Bay/Crows Nest TCM 01/30/95 280.0 NA 1.2 2.50 2.10 0.49 4.50 0.034 NA NA 0.006 42.0 726.4 Newport Bay/Rhine Channel/End TCM 02/07/94 120.0 1.4 1.5 0.45 26.00 0.92 12.00 0.069 0.62 0.27 0.014 88.0 726.4 Newport Bay/Rhine Channel/End TCM 01/30/95 100.0 NA 1.6 0.57 11.00 0.58 6.10 0.063 NA NA 0.009 72.0 750.0 Oceanside RCM 01/30/95 230.0 NA 0.3 2.30 1.70 0.11 3.60 0.012 NA NA 0.015 23.0 868.5 Mission Bay/Landfill 1 TCM 01/30/95 250.0 1.2 1.1 1.10 1.70 0.27 4.00 0.030 1.10 0.30 0.015 34.0 868.6 Mission Bay/Landfill 2 TCM 01/30/95 240.0 1.6 1.6 0.54 2.10 0.24 3.30 0.037 0.72 0.43 0.015 37.0 882.0 24th St Maritime Terminal/South TCM 02/08/94 170.0 1.4 1.2 0.31 11.00 0.67 5.60 0.047 0.47 0.28 0.094 81.0 882.0 24th St Maritime Terminal/South TCM 01/31/95 150.0 NA 2.0 1.70 6.90 0.60 4.50 0.045 NA NA 0.042 71.0 883.1 San Diego Bay/Chollas Creek TCM 02/08/94 170.0 1.3 1.7 0.31 5.30 1.30 5.40 0.044 0.21 0.26 0.040 75.0 883.4 San Diego Bay/Continental Maritime TCM 02/08/94 160.0 1.3 1.2 0.32 9.20 0.70 10.00 0.039 0.21 0.27 0.060 71.0 883.5 San Diego Bay/Tuna Docks TCM 02/08/94 110.0 1.3 1.2 0.23 4.80 0.94 2.80 0.030 0.16 0.22 0.039 62.0 883.8 San Diego Bay/Switzer Creek TCM 02/08/94 120.0 1.3 1.2 0.28 5.80 0.67 4.70 0.037 0.25 0.24 0.043 53.0 894.0 SD Bay/Harbor Is/E Basin/Storm Dr TCM 02/08/94 87.0 1.4 1.7 0.43 8.00 2.00 2.30 0.030 0.21 0.23 0.140 86.0 894.0 SD Bay/Harbor Is/E Basin/Storm Dr TCM 01/31/95 130.0 NA 1.4 3.40 5.30 3.40 3.00 0.036 NA NA 0.110 97.0 899.0 San Diego Bay/Shelter Is/Fshg Pier TCM 01/31/95 180.0 NA 1.0 4.40 2.60 0.79 3.00 0.035 NA NA 0.012 62.0 _________________________________________________________________________________________________________________________________________________________ * RCM = Resident California Mussel RBM = Resident Bay Mussel NA = Not Analyzed TCM = Transplanted California Mussel SED = Sediment ND = Not Detected

K-1�
APPENDIX K
Summary of 1993-95 Data
Trace Elements in Mussels and Sediment
(ppm, dry weight)

K-2
��
�
APPENDIX K State Mussel Watch Program
Summary of 1993-95 Data: Trace Elements in Mussels and Sediment (ppm, dry weight)
_________________________________________________________________________________________________________________________________________________________ Station Station Sample Sample Aluminum Cadmium Copper Manganese Nickel Silver Number Name Type* Date Arsenic Chromium Lead Mercury Selenium Zinc _________________________________________________________________________________________________________________________________________________________ 10.0 Trinidad Head RCM 10/14/93 1100.0 8.4 8.5 5.2 7.1 1.6 18.0 0.190 4.3 1.4 0.029 150.0 10.0 Trinidad Head RCM 11/28/94 870.0 NA 5.2 52.0 9.1 1.1 20.0 0.130 NA NA 0.032 140.0 100.0 Mad River Slough TCM 02/24/94 1000.0 9.5 6.9 3.2 9.4 2.1 19.0 0.230 8.1 1.8 0.031 230.0 101.0 Samoa Bridge/West TCM 02/24/94 2500.0 11.0 7.1 6.2 11.0 1.8 32.0 0.270 9.9 2.3 0.052 230.0 103.0 Eureka Channel TCM 02/24/94 2200.0 9.1 6.6 5.3 10.0 2.4 26.0 0.210 7.2 1.6 0.036 210.0 202.0 Bodega Head RCM 09/16/93 360.0 NA 11.0 1.5 6.4 1.4 8.7 0.210 NA NA 0.110 130.0 202.0 Bodega Head RCM 09/19/94 200.0 11.0 20.0 9.6 7.9 1.3 7.1 0.250 8.7 1.4 0.090 200.0 308.0 San Francisco Bay/Hunter's Point TCM 01/15/88 2200.0 NA 7.2 14.0 18.0 2.9 26.0 0.370 NA 2.7 0.530 210.0 309.0 San Mateo Bridge/8B TCM 02/12/85 2000.0 NA 7.6 10.0 20.0 1.6 66.0 0.500 NA 2.4 0.520 190.0 313.0 San Francisco Bay/near Redwood Cr TCM 02/12/85 2600.0 NA 9.5 27.0 19.0 1.7 70.0 0.650 NA 2.7 1.200 200.0 313.0 San Francisco Bay/near Redwood Cr TCM 01/15/88 750.0 NA 7.9 18.0 23.0 1.0 24.0 0.380 NA 3.4 2.700 170.0 321.0 Dumbarton Bridge/Channel Marker 14 TCM 02/12/85 2700.0 NA 9.6 25.0 15.0 2.1 60.0 0.540 NA 2.2 0.920 230.0 404.0 Sandholdt Bridge TCM 03/07/94 1600.0 NA 6.4 2.3 11.0 1.6 20.0 0.260 NA NA 0.041 270.0 404.0 Sandholdt Bridge TCM 02/22/95 1400.0 NA 8.5 5.1 11.0 2.2 20.0 0.270 NA NA 0.021 300.0 414.0 Pacific Grove RCM 04/14/94 140.0 NA 11.0 0.8 6.7 3.8 5.0 0.190 NA NA 0.300 300.0 414.0 Pacific Grove RCM 04/19/95 260.0 NA 7.7 9.6 8.0 2.6 6.6 0.150 NA NA 0.097 190.0 420.0 Monterey Harbor/Coast Guard Jetty TCM 05/26/94 50.0 NA 11.0 0.4 7.3 2.7 4.4 0.098 NA NA 0.130 140.0 420.3 Monterey Harbor/C G Jetty/Inner TCM 05/26/94 63.0 NA 11.0 0.3 9.8 5.2 4.0 0.120 NA NA 0.078 160.0 421.0 Monterey Harbor/Slag Pile TCM 05/26/94 330.0 NA 11.0 1.6 23.0 21.0 5.4 0.270 NA NA 0.200 330.0 507.3 Mugu Lagoon/Calleguas Creek TCM 02/08/94 920.0 9.9 12.0 1.8 12.0 2.3 24.0 0.200 2.5 3.4 0.190 210.0 508.1 Mugu Drainage 1 SED 01/31/95 NA NA NA NA NA NA NA NA NA 0.9 NA NA 601.0 LA Harbor/National Steel SED 11/09/93 30000.0 NA 1.8 87.0 110.0 73.0 670.0 0.400 43.0 0.4 0.420 250.0 601.0 LA Harbor/National Steel TCM 02/08/94 1200.0 NA 12.0 3.3 47.0 13.0 48.0 0.330 2.3 2.3 0.170 510.0 601.0 LA Harbor/National Steel TCM 01/31/95 540.0 NA 16.0 7.2 14.0 10.0 22.0 0.320 NA 1.9 0.067 510.0 602.0 LA Harbor/West Basin TCM 02/08/94 630.0 10.0 13.0 2.2 31.0 6.7 24.0 0.270 1.9 2.2 0.110 340.0 605.0 LA Harbor/Cabrillo Pier SED 11/09/93 26000.0 NA 2.0 82.0 140.0 35.0 420.0 0.200 45.0 0.8 0.470 150.0 605.0 LA Harbor/Cabrillo Pier TCM 02/08/94 750.0 NA 4.4 1.7 15.0 4.6 21.0 0.150 1.2 3.5 0.100 190.0 605.0 LA Harbor/Cabrillo Pier TCM 01/31/95 710.0 NA 5.0 NA 13.0 NA 26.0 0.150 NA 2.7 0.190 240.0 616.0 LA Harbor/Consolidated Slip SED 11/09/93 24000.0 NA 12.0 100.0 140.0 120.0 450.0 0.270 44.0 0.4 0.810 510.0 616.0 LA Harbor/Consolidated Slip TCM 02/08/94 1000.0 NA 14.0 3.0 26.0 18.0 29.0 0.260 2.2 3.3 0.110 460.0 616.0 LA Harbor/Consolidated Slip TCM 01/31/95 910.0 NA 15.0 20.0 16.0 14.0 32.0 0.260 NA ND 0.093 570.0 618.0 LA Harbor/Angels Gate RCM 02/08/94 900.0 7.3 1.1 1.4 12.0 1.7 15.0 0.082 0.9 4.3 0.064 110.0 618.0 LA Harbor/Angels Gate RCM 01/31/95 860.0 NA 2.4 NA 11.0 NA 19.0 0.092 NA 3.3 0.062 110.0 648.0 Malibu RBM 02/07/94 1200.0 8.3 1.2 1.9 14.0 4.4 23.0 0.130 2.1 4.8 1.600 100.0 648.0 Malibu RBM 01/31/95 1700.0 NA 2.4 50.0 9.0 0.9 32.0 0.086 NA 3.5 0.290 98.0 650.0 Santa Monica RCM 02/07/94 2400.0 7.3 1.8 2.6 7.4 1.8 52.0 0.097 3.5 4.3 0.330 70.0 650.0 Santa Monica RCM 01/31/95 550.0 NA 1.5 21.0 12.0 3.5 12.0 0.120 NA 4.6 3.100 160.0 662.0 Royal Palms RCM 02/08/94 1300.0 NA 1.8 2.9 11.0 2.2 43.0 0.120 3.7 3.7 2.800 140.0 662.0 Royal Palms RCM 01/31/95 650.0 NA 2.4 30.0 9.7 1.9 17.0 0.140 NA 2.8 1.700 160.0 664.0 Cabrillo Beach RCM 11/11/94 710.0 NA 2.4 9.5 12.0 2.6 16.0 0.220 NA 3.3 4.400 210.0 _________________________________________________________________________________________________________________________________________________________ * RCM = Resident California Mussel RBM = Resident Bay Mussel NA = Not Analyzed TCM = Transplanted California Mussel SED = Sediment ND = Not Detected ** Samples with a collection date prior to 1993 are archive samples.

K-3
��
�
APPENDIX K (continued) State Mussel Watch Program
Summary of 1993-95 Data: Trace Elements in Mussels and Sediment (ppm, dry weight)
_________________________________________________________________________________________________________________________________________________________ Station Station Sample Sample Aluminum Cadmium Copper Manganese Nickel Silver Number Name Type* Date Arsenic Chromium Lead Mercury Selenium Zinc _________________________________________________________________________________________________________________________________________________________ 681.0 Catalina Island/West RCM 03/30/94 210.0 NA 9.4 2.3 5.2 27.0 9.6 0.240 2.7 2.8 1.200 290.0 713.0 Huntington Harbour/Edinger Street TCM 02/07/94 1300.0 11.0 8.6 1.9 17.0 6.0 29.0 0.370 1.7 2.7 0.046 360.0 713.0 Huntington Harbour/Edinger Street TCM 01/30/95 2000.0 NA 12.0 150.0 17.0 7.3 50.0 0.290 NA NA 0.100 370.0 715.0 Huntington Harbour/Warner Ave Brdg TCM 02/07/94 1400.0 12.0 10.0 2.5 19.0 13.0 45.0 0.270 2.6 2.8 0.067 480.0 715.0 Huntington Harbour/Warner Ave Brdg TCM 01/30/95 1600.0 NA 9.4 120.0 21.0 12.0 47.0 0.250 NA NA 0.110 440.0 723.4 Newport Bay/Turning Basin TCM 01/30/95 920.0 NA 16.0 18.0 23.0 5.2 44.0 0.430 NA NA 0.084 530.0 724.0 Newport Bay/Highway 1 Bridge TCM 02/07/94 1100.0 11.0 11.0 2.4 20.0 4.0 56.0 0.280 4.3 2.0 0.057 340.0 724.0 Newport Bay/Highway 1 Bridge TCM 01/30/95 1000.0 NA 13.0 4.9 66.0 6.6 65.0 0.610 NA NA 0.094 710.0 725.0 Newport Bay/Crows Nest TCM 02/07/94 940.0 13.0 14.0 2.5 180.0 8.7 41.0 0.730 4.9 2.7 0.097 690.0 725.0 Newport Bay/Crows Nest TCM 01/30/95 2000.0 NA 8.6 18.0 15.0 3.5 32.0 0.240 NA NA 0.041 300.0 726.4 Newport Bay/Rhine Channel/End TCM 02/07/94 1100.0 13.0 14.0 4.1 240.0 8.3 110.0 0.620 5.6 2.4 0.130 800.0 726.4 Newport Bay/Rhine Channel/End TCM 01/30/95 930.0 NA 14.0 5.1 100.0 5.2 55.0 0.570 NA NA 0.078 650.0 750.0 Oceanside RCM 01/30/95 1100.0 NA 1.5 11.0 7.9 0.5 17.0 0.055 NA NA 0.073 110.0 868.5 Mission Bay/Landfill 1 TCM 01/30/95 1300.0 6.1 5.7 5.8 9.1 1.4 21.0 0.160 5.8 1.6 0.080 180.0 868.6 Mission Bay/Landfill 2 TCM 01/30/95 1100.0 7.4 7.3 2.5 9.8 1.1 15.0 0.170 3.3 2.0 0.067 170.0 882.0 24th St Maritime Terminal/South TCM 02/08/94 1000.0 8.0 6.7 1.8 63.0 3.9 33.0 0.270 2.7 1.6 0.550 470.0 882.0 24th St Maritime Terminal/South TCM 01/31/95 1000.0 NA 13.0 11.0 45.0 3.9 29.0 0.290 NA NA 0.270 460.0 883.1 San Diego Bay/Chollas Creek TCM 02/08/94 1400.0 10.0 13.0 2.5 43.0 10.0 43.0 0.350 1.7 2.1 0.320 600.0 883.4 San Diego Bay/Continental Maritime TCM 02/08/94 1300.0 10.0 9.3 2.5 73.0 5.5 79.0 0.310 1.7 2.1 0.480 560.0 883.5 San Diego Bay/Tuna Docks TCM 02/08/94 850.0 11.0 9.4 1.9 38.0 7.5 22.0 0.240 1.3 1.7 0.310 490.0 883.8 San Diego Bay/Switzer Creek TCM 02/08/94 950.0 10.0 10.0 2.3 46.0 5.4 38.0 0.290 2.0 2.0 0.350 420.0 894.0 SD Bay/Harbor Is/E Basin/Storm Dr TCM 02/08/94 760.0 12.0 15.0 3.8 70.0 17.0 20.0 0.260 1.8 2.0 1.300 750.0 894.0 SD Bay/Harbor Is/E Basin/Storm Dr TCM 01/31/95 990.0 NA 11.0 26.0 41.0 26.0 23.0 0.280 NA NA 0.840 750.0 899.0 San Diego Bay/Shelter Is/Fshg Pier TCM 01/31/95 1000.0 NA 5.5 25.0 15.0 4.5 17.0 0.200 NA NA 0.066 350.0 _________________________________________________________________________________________________________________________________________________________ * RCM = Resident California Mussel RBM = Resident Bay Mussel NA = Not Analyzed TCM = Transplanted California Mussel SED = Sediment ND = Not Detected

L-1
APPENDIX L
Summary of 1993-95 Data
Organic Chemicals in Mussels and Sediment
(ppb, wet weight)

L-2 L-2
��
�
APPENDIX L State Mussel Watch Program
Summary of 1993-95 Data: Organic Chemicals in Mussels and Sediment (ppb, wet weight) ____________________________________________________________________________________________________________________________________________________________________________________________ Aldrin Chlor- alpha- cis- gamma- trans- cis- trans- Oxy- Total Chlor- Dacthal Diaz- Station Station Sample Sample ben- Chlor- Chlor- Chlor- Chlor- Nona- Nona- chlor- Chlor- pyrifos inon Number Name Type* Date** side dene dane dene dane chlor chlor dane dane ____________________________________________________________________________________________________________________________________________________________________________________________ 10.0 Trinidad Head RCM 10/14/93 ND ND ND 0.2 ND ND ND ND ND 0.2 ND ND ND 10.0 Trinidad Head RCM 11/28/94 ND NA ND 0.2 ND ND ND ND ND 0.2 ND ND ND 100.0 Mad River Slough TCM 02/24/94 ND ND ND 0.2 ND 0.1 ND ND 0.6 0.9 ND ND ND 103.0 Eureka Channel TCM 02/24/94 ND ND ND 0.3 ND 0.2 ND ND 0.7 1.2 ND ND ND 202.0 Bodega Head RCM 09/16/93 ND ND ND 0.3 ND 0.2 ND ND ND 0.5 ND ND ND 202.0 Bodega Head RCM 09/19/94 ND NA ND 0.3 ND ND ND ND ND 0.3 ND ND ND 302.0 Point Pinole TCM 02/02/82 ND NA ND 3.2 0.2 1.3 2.4 2.4 0.2 9.7 ND ND ND 308.0 San Francisco Bay/Hunter's Point TCM 01/15/88 ND NA 0.2 5.8 0.3 1.4 3.4 3.4 0.3 14.9 ND ND ND 309.0 San Mateo Bridge/8B TCM 02/12/85 ND NA ND 4.0 0.2 1.3 1.8 1.8 0.3 9.3 ND 0.4 ND 313.0 San Francisco Bay/near Redwood Cr TCM 02/12/85 ND NA 0.2 4.5 0.3 1.6 3.2 3.2 0.2 13.1 ND 0.3 ND ____________________________________________________________________________________________________________________________________________________________________________________________ o,p' p,p' o,p' p,p' o,p' p,p' p,p' p,p' Total Di- Dicofol Diel- Endo- Endo- Endo- Total Endrin Ethion alpha- Station DDD DDD DDE DDE DDT DDT DDMS DDMU DDT Chloro- drin sulfan sulfan sulfan Endo- HCH Number Benzophenone I II sulfate sulfan _________________________________________________________________________________________________________________________________________________________
10.0 ND ND ND 0.6 ND ND NA ND 0.6 ND ND 0.8 ND ND ND ND ND ND 0.8 10.0 ND ND ND 0.6 ND ND NA ND 0.6 ND ND 0.6 ND ND ND ND ND ND 0.8 100.0 ND ND ND 0.4 ND ND NA ND 0.4 ND ND 0.8 ND ND ND ND ND ND 0.2 103.0 ND ND ND 1.0 ND ND NA ND 1.0 ND ND 0.6 ND ND ND ND ND ND 0.3 202.0 ND ND ND 1.0 ND ND NA ND 1.0 ND ND 1.1 ND ND ND ND ND ND 0.5 202.0 ND ND ND 0.8 ND ND NA ND 0.8 ND ND 1.0 ND ND ND ND ND ND 0.2 302.0 1.8 8.0 ND 8.2 ND 1.5 NA 0.9 20.4 ND ND 4.0 0.3 ND ND 0.3 ND ND 0.5 308.0 4.0 11.7 1.1 21.4 1.0 7.3 NA 2.2 48.5 ND ND 10.4 0.4 ND ND 0.4 ND ND 0.4 309.0 3.2 11.2 ND 7.8 ND 1.0 NA ND 23.2 ND ND 22.2 0.3 ND ND 0.3 ND ND 0.6 313.0 2.5 8.8 ND 9.7 ND 1.3 NA 0.8 23.1 ND ND 16.1 0.3 ND ND 0.3 ND ND 0.4 _________________________________________________________________________________________________________________________________________________________
beta- delta- gamma- Hepta- Hepta- Hexa- Methoxy- Ethyl- Methyl- Oxa- Phenol PCB PCB PCB Total PCT Tetra- Toxa- Tri- Station HCH HCH HCH chlor chlor- chloro- chlor para- para- diazon 1248 1254 1260 PCB 5460 difon phene butyl- Number (Lindane) epoxide benzene thion thion tin _________________________________________________________________________________________________________________________________________________________
10.0 ND ND ND ND ND ND ND ND ND ND NA ND ND ND ND ND ND ND ND 10.0 ND ND ND ND ND ND ND ND ND ND NA ND 2.2 ND 2.2 ND ND ND ND 100.0 ND ND 0.2 ND ND ND ND ND ND ND NA ND ND ND ND ND ND ND NA 103.0 ND ND 0.1 ND ND ND ND ND ND ND NA ND ND ND ND ND ND ND NA 202.0 ND ND ND ND ND ND ND ND ND ND NA ND ND ND ND ND ND ND ND 202.0 ND ND ND ND ND ND ND ND ND ND NA ND 4.3 ND 4.3 ND ND ND ND 302.0 ND ND 0.3 ND 0.2 ND ND ND ND ND NA 8.6 28.7 4.2 41.5 NA ND ND NA 308.0 ND ND 0.4 ND 0.2 ND ND ND ND 0.7 NA 9.8 424.3 119.0 552.4 NA ND ND NA 309.0 ND ND 1.0 ND 0.4 ND ND ND ND 0.4 NA ND 34.6 9.9 44.6 NA ND ND NA 313.0 ND ND 0.9 ND 0.5 ND ND ND ND 0.6 NA 9.3 42.8 8.9 61.1 NA ND ND NA ____________________________________________________________________________________________________________________________________________________________________________________________
* RCM = Resident California Mussel SED = Sediment NA = Not Analyzed RBM = Resident Bay Mussel ND = Not Detected TCM = Transplanted California Mussel ** Samples with a collection date prior to 1993 are archive samples.

L-3 L-3
�
�
APPENDIX L (continued) State Mussel Watch Program
Summary of 1993-95 Data: Organic Chemicals in Mussels and Sediment (ppb, wet weight) ____________________________________________________________________________________________________________________________________________________________________________________________ Aldrin Chlor- alpha- cis- gamma- trans- cis- trans- Oxy- Total Chlor- Dacthal Diaz- Station Station Sample Sample ben- Chlor- Chlor- Chlor- Chlor- Nona- Nona- chlor- Chlor- pyrifos inon Number Name Type* Date** side dene dane dene dane chlor chlor dane dane _____________________________________________________________________________________________________________________________________________
313.0 San Francisco Bay/near Redwood Cr TCM 01/15/88 ND NA 0.3 5.3 0.4 1.4 3.9 3.9 0.3 15.5 ND 0.6 ND 321.0 Dumbarton Bridge/Channel Marker 14 TCM 01/18/82 ND NA 0.2 5.4 0.3 2.2 3.5 3.5 0.4 15.5 ND 0.5 ND 321.0 Dumbarton Bridge/Channel Marker 14 TCM 02/12/85 ND NA 0.2 4.3 0.2 1.4 2.9 2.9 0.3 12.2 ND 0.4 ND 321.0 Dumbarton Bridge/Channel Marker 14 TCM 01/15/88 ND NA ND 3.5 ND 1.0 1.8 1.8 0.2 8.4 ND 0.4 ND 404.0 Sandholdt Bridge TCM 03/07/94 ND ND ND 5.4 ND 4.8 2.8 4.2 0.3 17.4 5.0 39.8 ND 404.0 Sandholdt Bridge TCM 02/22/95 ND NA 0.2 4.3 0.2 2.2 5.1 5.1 0.2 17.2 2.5 19.3 ND 414.0 Pacific Grove RCM 04/14/94 ND ND ND 0.4 ND 0.3 ND 0.2 ND 0.8 ND ND ND 414.0 Pacific Grove RCM 04/19/95 ND NA ND 0.4 ND ND 0.3 0.3 ND 1.0 ND ND ND 420.0 Monterey Harbor/Coast Guard Jetty TCM 05/26/94 ND ND ND 0.6 ND 0.4 ND ND ND 1.0 ND ND ND 507.3 Mugu Lagoon/Calleguas Creek TCM 02/08/94 ND ND 0.4 9.4 0.2 7.3 4.2 6.6 0.4 28.5 10.4 62.4 ND _____________________________________________________________________________________________________________________________________________
o,p' p,p' o,p' p,p' o,p' p,p' p,p' p,p' Total Di- Dicofol Diel- Endo- Endo- Endo- Total Endrin Ethion alpha- Station DDD DDD DDE DDE DDT DDT DDMS DDMU DDT Chloro- drin sulfan sulfan sulfan Endo- HCH Number Benzophenone I II sulfate sulfan _____________________________________________________________________________________________________________________________________________
313.0 1.4 4.0 0.3 10.0 ND 0.7 NA ND 16.3 ND ND 7.2 0.5 ND ND 0.5 ND ND 0.2 321.0 1.5 5.5 ND 8.8 ND 1.1 NA 0.9 17.8 ND ND 9.5 0.6 ND ND 0.6 ND ND 1.0 321.0 2.2 8.0 ND 9.0 ND 0.9 NA 1.0 21.2 ND ND 16.9 0.4 ND ND 0.4 ND ND 0.5 321.0 0.8 3.0 ND 7.1 ND 0.7 NA ND 11.6 ND ND 8.9 0.4 ND ND 0.4 ND ND 0.3 404.0 22.5 90.0 7.4 328.7 34.6 154.0 NA 10.7 647.9 ND ND 36.3 1.6 4.3 17.1 23.0 4.5 ND 0.2 404.0 14.1 56.1 5.9 234.2 28.6 96.4 NA 7.7 442.7 ND ND 41.9 0.9 3.1 11.6 15.7 3.1 ND ND 414.0 ND ND ND 3.6 ND 0.8 NA ND 4.4 ND ND 0.9 ND ND ND ND ND ND 0.2 414.0 ND ND ND 4.1 ND 1.4 NA ND 5.5 ND ND 1.8 ND ND ND ND ND ND 0.2 420.0 ND ND ND 4.3 ND ND NA ND 4.3 ND ND 1.0 ND ND ND ND ND ND 0.9 507.3 12.4 54.6 6.5 325.0 31.2 120.9 NA 6.4 556.9 ND ND 4.7 ND ND ND ND 1.1 ND 0.2 _____________________________________________________________________________________________________________________________________________
beta- delta- gamma- Hepta- Hepta- Hexa- Methoxy- Ethyl- Methyl- Oxa- Phenol PCB PCB PCB Total PCT Tetra- Toxa- Tri- Station HCH HCH HCH chlor chlor- chloro- chlor para- para- diazon 1248 1254 1260 PCB 5460 difon phene butyl- Number (Lindane) epoxide benzene thion thion tin _____________________________________________________________________________________________________________________________________________
313.0 ND ND 3.0 ND 0.4 ND ND ND ND 2.3 NA ND 40.7 4.7 45.4 NA ND ND NA 321.0 ND ND 1.7 ND 0.6 ND ND ND ND 0.7 NA 7.0 49.7 6.2 62.8 NA ND ND NA 321.0 ND ND 1.0 ND 0.4 ND ND ND ND 0.4 NA ND 35.1 8.7 43.8 NA ND ND NA 321.0 ND ND 0.8 ND 0.3 ND ND ND ND 1.1 NA ND 32.0 7.8 39.9 NA ND ND NA 404.0 ND ND 0.3 ND 0.4 ND ND ND ND ND NA ND 31.1 ND 31.1 ND ND 147.1 NA 404.0 ND ND 0.1 ND 0.5 ND ND ND ND 1.0 NA ND 36.8 2.6 39.3 ND ND 122.4 NA 414.0 ND ND ND ND ND ND ND ND ND ND NA ND ND ND ND ND ND ND ND 414.0 ND ND ND ND ND ND ND ND ND ND NA ND 1.5 ND 1.5 ND ND ND NA 420.0 1.0 ND ND ND ND ND ND ND ND ND NA ND ND ND ND ND ND ND NA 507.3 ND ND 0.2 ND 0.9 ND ND ND ND ND NA ND 11.6 5.2 16.8 ND ND 468.0 NA ____________________________________________________________________________________________________________________________________________________________________________________________
* RCM = Resident California Mussel SED = Sediment NA = Not Analyzed RBM = Resident Bay Mussel ND = Not Detected TCM = Transplanted California Mussel ** Samples with a collection date prior to 1993 are archive samples.

L-4
�
�
APPENDIX L (continued) State Mussel Watch Program
Summary of 1993-95 Data: Organic Chemicals in Mussels and Sediment (ppb, wet weight) ____________________________________________________________________________________________________________________________________________________________________________________________ Aldrin Chlor- alpha- cis- gamma- trans- cis- trans- Oxy- Total Chlor- Dacthal Diaz- Station Station Sample Sample ben- Chlor- Chlor- Chlor- Chlor- Nona- Nona- chlor- Chlor- pyrifos inon Number Name Type* Date** side dene dane dene dane chlor chlor dane dane _____________________________________________________________________________________________________________________________________________
601.0 LA Harbor/National Steel SED 11/09/93 ND ND ND 1.7 ND 2.6 1.1 2.2 ND 13.9 ND ND ND 601.0 LA Harbor/National Steel TCM 02/08/94 ND ND ND 2.3 ND 2.2 1.0 1.8 ND 7.4 ND ND ND 601.0 LA Harbor/National Steel TCM 01/31/95 ND NA 0.1 1.6 ND 0.9 1.1 1.1 0.1 5.0 ND ND ND 602.0 LA Harbor/West Basin TCM 02/08/94 ND ND ND 2.5 ND 1.9 1.0 1.7 ND 7.2 ND ND ND 605.0 LA Harbor/Cabrillo Pier SED 11/09/93 ND ND ND ND ND ND ND 1.2 ND 2.6 ND ND ND 605.0 LA Harbor/Cabrillo Pier TCM 02/08/94 ND ND ND 2.0 ND 1.7 0.8 1.5 ND 6.0 ND ND ND 605.0 LA Harbor/Cabrillo Pier TCM 01/31/95 ND NA 0.2 3.0 0.2 1.1 2.2 2.2 0.2 8.9 ND ND ND 616.0 LA Harbor/Consolidated Slip SED 11/09/93 0.6 ND 1.6 11.0 1.0 13.3 4.6 9.6 0.8 92.9 8.2 1.0 ND 616.0 LA Harbor/Consolidated Slip TCM 02/08/94 ND ND 0.3 3.3 0.2 3.0 1.6 3.1 ND 11.3 1.4 ND ND 616.0 LA Harbor/Consolidated Slip TCM 01/31/95 ND NA 0.2 2.5 0.2 1.4 1.8 1.8 0.1 8.1 0.6 ND ND ____________________________________________________________________________________________________________________________________________________________________________________________ o,p' p,p' o,p' p,p' o,p' p,p' p,p' p,p' Total Di- Dicofol Diel- Endo- Endo- Endo- Total Endrin Ethion alpha- Station DDD DDD DDE DDE DDT DDT DDMS DDMU DDT Chloro- drin sulfan sulfan sulfan Endo- HCH Number Benzophenone I II sulfate sulfan _________________________________________________________________________________________________________________________________________________________
601.0 4.6 14.0 3.3 38.2 ND 33.9 NA ND 94.2 ND ND 1.0 ND ND ND ND ND ND ND 601.0 2.4 8.4 4.2 39.4 ND 2.0 NA 2.7 59.2 ND ND ND ND ND ND ND ND ND ND 601.0 1.4 5.9 2.4 24.1 0.5 2.6 NA 1.4 38.3 ND ND 0.9 ND ND ND ND ND ND ND 602.0 2.3 9.2 6.5 51.8 0.5 2.7 NA 2.7 75.7 ND ND 0.4 ND ND ND ND ND ND ND 605.0 3.6 8.1 16.3 100.6 ND 2.2 NA 11.0 141.8 ND ND ND ND ND ND ND ND ND ND 605.0 2.7 8.8 20.1 179.3 ND 2.2 NA 14.1 227.3 ND ND 0.6 ND ND ND ND ND ND 0.2 605.0 2.1 7.4 11.5 91.9 1.3 4.9 NA 7.7 126.7 ND ND 2.1 ND ND ND ND ND ND ND 616.0 13.7 59.5 5.0 100.8 5.5 36.2 NA 5.5 226.3 ND ND 6.0 ND ND ND ND 4.3 ND ND 616.0 3.0 12.9 3.7 40.6 0.6 3.6 NA 2.9 67.1 ND ND 0.3 ND ND ND ND ND ND ND 616.0 2.0 6.9 1.7 22.0 1.7 6.0 NA 1.1 41.3 ND ND 1.3 ND ND ND ND ND ND ND _____________________________________________________________________________________________________________________________________________
beta- delta- gamma- Hepta- Hepta- Hexa- Methoxy- Ethyl- Methyl- Oxa- Phenol PCB PCB PCB Total PCT Tetra- Toxa- Tri- Station HCH HCH HCH chlor chlor- chloro- chlor para- para- diazon 1248 1254 1260 PCB 5460 difon phene butyl- Number (Lindane) epoxide benzene thion thion tin _____________________________________________________________________________________________________________________________________________
601.0 ND ND ND ND 0.6 ND ND ND ND ND NA 39.3 51.6 96.8 187.7 ND ND 91.5 190.0 601.0 ND ND ND ND ND ND ND ND ND ND NA 7.3 52.5 ND 59.8 ND ND ND 830.0 601.0 ND ND ND ND ND ND ND ND ND 0.3 NA 4.3 40.9 3.0 48.3 ND ND 10.5 NA 602.0 ND ND ND ND ND ND ND ND ND ND NA ND 90.7 ND 90.7 ND ND ND NA 605.0 ND ND ND ND ND ND ND ND ND ND NA ND 26.8 ND 26.8 ND ND ND NA 605.0 ND ND ND ND ND ND ND ND ND ND NA ND 45.8 ND 45.8 ND ND ND NA 605.0 ND ND ND ND 0.2 ND ND ND ND 0.8 NA 8.8 44.1 ND 52.8 ND ND 16.7 NA 616.0 ND ND ND ND 3.3 0.5 ND ND ND 5.5 NA 59.5 79.7 178.6 317.8 ND ND 265.6 130.0 616.0 ND ND ND ND ND ND ND ND ND 0.3 NA 9.6 49.5 ND 59.1 ND ND ND 390.0 616.0 ND ND ND ND ND ND ND ND ND 0.8 NA 7.2 32.3 2.9 42.5 ND ND 30.7 0.3 ____________________________________________________________________________________________________________________________________________________________________________________________
* RCM = Resident California Mussel SED = Sediment NA = Not Analyzed RBM = Resident Bay Mussel ND = Not Detected TCM = Transplanted California Mussel

L-5
�
�
APPENDIX L (continued) State Mussel Watch Program
Summary of 1993-95 Data: Organic Chemicals in Mussels and Sediment (ppb, wet weight) ____________________________________________________________________________________________________________________________________________________________________________________________ Aldrin Chlor- alpha- cis- gamma- trans- cis- trans- Oxy- Total Chlor- Dacthal Diaz- Station Station Sample Sample ben- Chlor- Chlor- Chlor- Chlor- Nona- Nona- chlor- Chlor- pyrifos inon Number Name Type* Date** side dene dane dene dane chlor chlor dane dane _____________________________________________________________________________________________________________________________________________
618.0 LA Harbor/Angels Gate RCM 02/08/94 ND ND ND ND 0.2 ND ND 1.7 0.2 2.0 ND ND ND 618.0 LA Harbor/Angels Gate RCM 01/31/95 ND NA 0.2 4.6 0.4 1.6 4.7 4.7 0.3 16.5 0.6 ND ND 648.0 Malibu RBM 02/07/94 ND ND 0.2 4.2 0.5 3.7 1.5 4.5 ND 14.5 1.5 ND ND 648.0 Malibu RBM 01/31/95 ND NA ND 3.1 ND 1.1 3.2 3.2 0.2 10.8 ND 0.4 ND 650.0 Santa Monica RCM 02/07/94 ND ND ND 1.5 ND 1.4 0.6 1.4 0.2 5.1 ND ND ND650.0 Santa Monica RCM 01/31/95 ND NA 0.3 6.4 ND 1.9 5.5 5.5 0.3 19.9 ND 0.7 ND 662.0 Royal Palms RCM 02/08/94 ND ND ND 0.4 ND 0.4 0.1 0.4 ND 1.3 ND ND ND 662.0 Royal Palms RCM 01/31/95 ND NA ND 1.4 ND 0.4 1.5 1.5 ND 4.8 ND ND ND 664.0 Cabrillo Beach RCM 11/11/94 ND NA ND 1.4 ND 0.6 1.9 1.9 0.2 5.9 ND ND ND 681.0 Catalina Island/West RCM 03/30/94 ND ND ND ND ND ND ND ND ND ND ND ND ND _____________________________________________________________________________________________________________________________________________
o,p' p,p' o,p' p,p' o,p' p,p' p,p' p,p' Total Di- Dicofol Diel- Endo- Endo- Endo- Total Endrin Ethion alpha- Station DDD DDD DDE DDE DDT DDT DDMS DDMU DDT Chloro- drin sulfan sulfan sulfan Endo- HCH Number Benzophenone I II sulfate sulfan _____________________________________________________________________________________________________________________________________________
618.0 ND ND 24.3 197.6 ND 0.9 NA 15.2 238.0 ND ND ND ND ND ND ND ND ND ND 618.0 3.3 10.2 12.6 96.8 2.8 12.3 NA 8.5 146.5 ND ND 1.5 ND ND ND ND ND ND ND 648.0 2.2 5.8 6.6 51.5 3.7 3.0 NA 7.0 79.7 ND ND ND ND ND ND ND ND ND 0.3 648.0 1.2 3.2 3.6 30.8 0.8 3.7 NA 3.6 47.0 ND ND 1.2 ND ND ND ND ND ND ND 650.0 1.1 3.4 4.3 37.8 ND 1.5 NA 4.9 53.1 ND ND ND ND ND ND ND ND ND 0.2 650.0 1.6 4.3 3.9 32.0 ND 4.2 NA 4.3 50.3 ND ND 3.0 ND ND ND ND ND ND 0.3 662.0 1.5 5.1 8.1 81.4 ND 1.8 NA 8.4 106.4 ND ND ND ND ND ND ND ND ND ND 662.0 1.9 6.6 9.8 92.4 ND 2.1 NA 9.4 122.1 ND ND 1.4 ND ND ND ND ND ND ND 664.0 1.8 6.2 10.1 90.8 ND 2.3 NA 9.0 120.2 ND ND 1.0 ND ND ND ND ND ND ND 681.0 ND ND ND 2.0 ND ND NA ND 2.0 ND ND ND ND ND ND ND ND ND ND _____________________________________________________________________________________________________________________________________________
beta- delta- gamma- Hepta- Hepta- Hexa- Methoxy- Ethyl- Methyl- Oxa- Phenol PCB PCB PCB Total PCT Tetra- Toxa- Tri- Station HCH HCH HCH chlor chlor- chloro- chlor para- para- diazon 1248 1254 1260 PCB 5460 difon phene butyl- Number (Lindane) epoxide benzene thion thion tin _____________________________________________________________________________________________________________________________________________
618.0 ND ND ND ND ND ND ND ND ND ND NA 11.4 56.2 ND 67.6 ND ND ND NA 618.0 ND ND ND ND 0.2 ND ND ND ND 1.3 NA 12.7 63.0 2.1 77.8 ND ND 41.4 NA 648.0 ND ND 0.1 ND ND ND ND ND ND ND NA ND 26.6 ND 26.6 ND ND ND NA 648.0 ND ND ND ND 0.2 ND ND ND ND 2.8 NA ND 12.3 ND 12.3 ND ND ND NA 650.0 ND ND ND ND ND ND ND ND ND 0.5 NA ND 9.2 ND 9.2 ND ND ND NA 650.0 ND ND ND ND 0.2 ND ND ND ND ND NA ND 20.3 ND 20.3 ND ND ND NA 662.0 ND ND ND ND ND ND ND ND ND ND NA ND 8.6 ND 8.6 ND ND ND NA 662.0 ND ND ND ND ND ND ND ND ND ND NA ND 15.3 ND 15.3 ND ND ND NA 664.0 ND ND ND ND ND ND ND ND ND ND NA ND 16.5 ND 16.5 ND ND ND NA 681.0 ND ND ND ND ND ND ND ND ND ND NA ND ND ND ND ND ND ND NA ____________________________________________________________________________________________________________________________________________________________________________________________
* RCM = Resident California Mussel SED = Sediment NA = Not Analyzed RBM = Resident Bay Mussel ND = Not Detected TCM = Transplanted California Mussel

L-6
�
�
APPENDIX L (continued) State Mussel Watch Program
Summary of 1993-95 Data: Organic Chemicals in Mussels and Sediment (ppb, wet weight) ____________________________________________________________________________________________________________________________________________________________________________________________ Aldrin Chlor- alpha- cis- gamma- trans- cis- trans- Oxy- Total Chlor- Dacthal Diaz- Station Station Sample Sample ben- Chlor- Chlor- Chlor- Chlor- Nona- Nona- chlor- Chlor- pyrifos inon Number Name Type* Date** side dene dane dene dane chlor chlor dane dane _____________________________________________________________________________________________________________________________________________
713.0 Huntington Harbour/Edinger Street TCM 02/07/94 ND ND 0.2 2.6 ND 2.4 1.3 2.4 0.1 8.9 1.3 2.2 ND 713.0 Huntington Harbour/Edinger Street TCM 01/30/95 ND NA 0.2 3.5 0.1 1.6 3.7 3.7 0.3 13.1 0.9 ND ND 715.0 Huntington Harbour/Warner Ave Brdg TCM 02/07/94 ND ND 0.3 4.8 ND 4.3 2.8 4.4 0.2 16.7 1.3 0.4 ND 715.0 Huntington Harbour/Warner Ave Brdg TCM 01/30/95 ND NA 0.4 4.6 0.2 2.4 4.9 4.9 0.4 17.9 1.1 ND ND 723.4 Newport Bay/Turning Basin TCM 01/30/95 ND NA ND 1.9 ND 1.0 1.5 1.5 0.3 6.3 0.7 0.3 ND 724.0 Newport Bay/Highway 1 Bridge TCM 02/07/94 ND ND 0.2 3.0 ND 2.5 1.5 2.9 0.3 10.4 1.4 ND ND 724.0 Newport Bay/Highway 1 Bridge TCM 01/30/95 ND NA 0.2 4.8 0.1 2.5 4.5 4.5 0.4 17.0 2.9 1.2 ND 725.0 Newport Bay/Crows Nest TCM 02/07/94 ND ND ND 2.2 ND 1.7 1.6 1.9 0.5 8.1 0.6 ND ND 725.0 Newport Bay/Crows Nest TCM 01/30/95 ND NA 0.1 2.0 ND 1.3 1.4 1.4 0.1 6.3 0.3 0.3 ND 726.4 Newport Bay/Rhine Channel/End TCM 02/07/94 ND ND ND 2.1 ND 1.4 1.4 1.6 0.2 6.6 1.6 ND ND _____________________________________________________________________________________________________________________________________________
o,p' p,p' o,p' p,p' o,p' p,p' p,p' p,p' Total Di- Dicofol Diel- Endo- Endo- Endo- Total Endrin Ethion alpha- Station DDD DDD DDE DDE DDT DDT DDMS DDMU DDT Chloro- drin sulfan sulfan sulfan Endo- HCH Number Benzophenone I II sulfate sulfan _____________________________________________________________________________________________________________________________________________
713.0 1.3 4.0 1.4 26.0 ND 1.8 NA 1.8 36.2 ND ND 1.5 ND ND ND ND ND ND ND 713.0 1.7 4.5 1.6 41.1 3.0 10.2 NA 1.4 63.5 ND ND 2.7 ND ND ND ND ND ND ND 715.0 1.7 5.7 1.5 40.3 ND 1.7 NA 2.0 52.8 ND ND 1.7 ND ND ND ND ND ND ND 715.0 1.8 5.5 1.6 50.8 2.1 7.2 NA 1.6 70.6 ND ND 2.8 ND ND ND ND ND ND ND 723.4 0.5 2.0 0.4 17.3 1.0 4.1 NA ND 25.2 ND ND 1.7 ND ND ND ND ND ND ND 724.0 1.8 8.8 1.2 57.6 ND 1.6 NA 1.8 72.9 ND ND 1.6 ND ND ND ND ND ND ND 724.0 1.9 9.4 1.6 75.1 5.4 24.1 NA 1.7 119.2 ND ND 1.9 0.1 ND ND 0.1 ND ND ND 725.0 1.2 5.2 0.9 41.7 1.6 1.1 NA 1.6 53.2 ND ND 1.5 ND ND ND ND ND ND ND 725.0 0.9 3.4 0.6 27.4 0.7 2.9 NA 0.7 36.6 ND ND 2.1 ND ND ND ND ND ND ND 726.4 0.8 4.0 0.6 27.9 1.1 0.9 NA 1.0 36.3 ND ND 2.1 ND ND ND ND ND ND ND _____________________________________________________________________________________________________________________________________________
beta- delta- gamma- Hepta- Hepta- Hexa- Methoxy- Ethyl- Methyl- Oxa- Phenol PCB PCB PCB Total PCT Tetra- Toxa- Tri- Station HCH HCH HCH chlor chlor- chloro- chlor para- para- diazon 1248 1254 1260 PCB 5460 difon phene butyl- Number (Lindane) epoxide benzene thion thion tin _____________________________________________________________________________________________________________________________________________
713.0 ND ND ND ND ND ND ND ND ND ND NA ND 11.8 ND 11.8 ND ND ND 110.0 713.0 ND ND ND ND 0.2 ND ND ND ND 0.9 NA ND 15.5 ND 15.5 ND ND 15.1 NA 715.0 ND ND ND ND ND ND ND ND ND 1.5 NA ND 17.1 ND 17.1 ND ND ND 130.0 715.0 ND ND ND ND 0.2 ND ND ND ND 0.7 NA 6.4 23.5 2.5 32.4 ND ND 20.7 NA 723.4 ND ND ND ND ND ND ND ND ND 1.6 NA ND 8.6 ND 8.6 ND ND 15.6 NA 724.0 ND ND ND ND ND ND ND ND ND ND NA ND 11.5 ND 11.5 ND ND ND 330.0 724.0 ND ND ND ND 0.2 ND ND ND ND 4.0 NA ND 16.9 ND 16.9 ND ND 43.4 NA 725.0 ND ND ND ND ND ND ND ND ND ND NA 14.6 61.1 ND 75.7 ND ND ND 690.0 725.0 ND ND ND ND ND ND ND ND ND 0.8 NA 6.8 35.8 1.5 44.1 ND ND 10.8 NA 726.4 ND ND ND ND ND ND ND ND ND 0.5 NA 10.7 51.7 ND 62.3 ND ND ND 630.0 ____________________________________________________________________________________________________________________________________________________________________________________________
* RCM = Resident California Mussel SED = Sediment NA = Not Analyzed RBM = Resident Bay Mussel ND = Not Detected TCM = Transplanted California Mussel

L-7
�
�
APPENDIX L (continued) State Mussel Watch Program
Summary of 1993-95 Data: Organic Chemicals in Mussels and Sediment (ppb, wet weight) ____________________________________________________________________________________________________________________________________________________________________________________________ Aldrin Chlor- alpha- cis- gamma- trans- cis- trans- Oxy- Total Chlor- Dacthal Diaz- Station Station Sample Sample ben- Chlor- Chlor- Chlor- Chlor- Nona- Nona- chlor- Chlor- pyrifos inon Number Name Type* Date** side dene dane dene dane chlor chlor dane dane _____________________________________________________________________________________________________________________________________________
726.4 Newport Bay/Rhine Channel/End TCM 01/30/95 ND NA 0.1 2.8 0.2 1.7 2.3 2.3 0.3 9.6 0.7 0.6 ND 750.0 Oceanside RCM 01/30/95 ND NA ND 1.6 ND 0.9 1.7 1.7 0.2 6.2 ND 0.6 ND 868.5 Mission Bay/Landfill 1 TCM 01/30/95 ND NA ND 2.8 ND 1.2 2.7 2.7 ND 9.5 ND ND ND 868.6 Mission Bay/Landfill 2 TCM 01/30/95 ND NA ND 3.6 ND 1.4 3.3 3.3 ND 11.6 ND ND ND 882.0 24th St Maritime Terminal/South TCM 01/31/95 ND NA ND 1.8 ND 0.9 1.1 1.1 0.2 5.2 ND ND ND 883.4 San Diego Bay/Continental Maritime TCM 02/08/94 ND ND ND 1.0 ND 0.8 0.7 0.9 ND 3.5 ND ND ND 883.5 San Diego Bay/Tuna Docks TCM 02/08/94 NA NA NA NA NA NA NA NA NA NA NA NA NA 894.0 SD Bay/Harbor Is/E Basin/Storm Dr TCM 02/08/94 ND ND 0.1 1.7 ND 1.7 0.7 1.6 ND 5.7 ND ND ND 894.0 SD Bay/Harbor Is/E Basin/Storm Dr TCM 01/31/95 ND NA 0.3 3.1 0.3 1.1 1.8 1.8 0.7 9.0 ND ND ND 899.0 San Diego Bay/Shelter Is/Fshg Pier TCM 01/31/95 ND NA ND 1.1 ND 0.4 0.8 0.8 0.5 3.7 ND ND ND _____________________________________________________________________________________________________________________________________________
o,p' p,p' o,p' p,p' o,p' p,p' p,p' p,p' Total Di- Dicofol Diel- Endo- Endo- Endo- Total Endrin Ethion alpha- Station DDD DDD DDE DDE DDT DDT DDMS DDMU DDT Chloro- drin sulfan sulfan sulfan Endo- HCH Number Benzophenone I II sulfate sulfan _____________________________________________________________________________________________________________________________________________
726.4 1.0 3.7 0.7 28.2 1.2 5.5 NA 0.6 40.9 ND ND 1.9 ND ND ND ND ND ND ND 750.0 1.7 3.6 1.2 26.4 1.9 5.9 NA 1.1 41.8 ND ND 1.2 ND ND ND ND ND ND 0.3 868.5 ND 0.8 ND 6.7 ND ND NA ND 7.4 ND ND 2.7 ND ND ND ND ND ND ND 868.6 ND ND ND 8.2 ND 1.8 NA ND 9.9 ND ND 3.4 ND ND ND ND ND ND ND 882.0 ND 1.2 ND 6.8 ND 1.5 NA ND 9.5 ND ND 1.0 ND ND ND ND ND ND ND 883.4 ND 0.9 ND 4.5 ND 1.0 NA ND 6.4 ND ND 0.3 ND ND ND ND ND ND ND 883.5 NA NA NA NA NA NA NA NA NA NA NA NA NA NA NA NA NA NA NA 894.0 2.8 8.8 ND 3.1 0.5 2.4 NA 1.3 18.8 ND ND 0.2 ND ND ND ND ND ND ND 894.0 5.9 17.0 ND 3.8 1.1 4.0 NA 2.8 34.7 ND ND 0.8 ND ND ND ND ND ND ND 899.0 ND 1.1 ND 8.6 ND ND NA 0.9 10.7 ND ND 0.8 ND ND ND ND ND ND ND _____________________________________________________________________________________________________________________________________________
beta- delta- gamma- Hepta- Hepta- Hexa- Methoxy- Ethyl- Methyl- Oxa- Phenol PCB PCB PCB Total PCT Tetra- Toxa- Tri- Station HCH HCH HCH chlor chlor- chloro- chlor para- para- diazon 1248 1254 1260 PCB 5460 difon phene butyl- Number (Lindane) epoxide benzene thion thion tin _____________________________________________________________________________________________________________________________________________
726.4 ND ND ND ND ND ND ND ND ND 1.9 NA 6.5 37.4 1.3 45.2 ND ND 22.1 0.6 750.0 ND ND ND ND ND ND ND ND ND 0.7 NA ND 4.3 ND 4.3 ND ND 26.4 NA 868.5 ND ND ND ND 0.3 ND ND ND ND 1.3 NA ND 20.0 ND 20.0 ND ND ND NA 868.6 ND ND ND ND 0.3 ND ND ND ND 1.3 NA ND 22.7 ND 22.7 ND ND ND NA 882.0 ND ND ND ND ND ND ND ND ND 1.0 NA ND 38.6 4.6 43.2 ND ND ND NA 883.4 ND ND ND ND ND ND ND ND ND ND NA ND 30.2 ND 30.2 ND ND ND 310.0 883.5 NA NA NA NA NA NA NA NA NA NA NA NA NA NA NA NA NA NA 660.0 894.0 ND ND 0.1 0.1 ND ND ND ND ND ND NA 404.8 246.4 ND 651.2 ND ND ND 88.0 894.0 ND ND ND 0.2 0.2 ND ND ND ND 0.3 NA 1407.8 869.9 26.1 2305.8 ND ND ND 0.2 899.0 ND ND ND ND ND ND ND ND ND ND NA ND 26.7 2.1 28.8 ND ND ND 0.1 ____________________________________________________________________________________________________________________________________________________________________________________________
* RCM = Resident California Mussel SED = Sediment NA = Not Analyzed RBM = Resident Bay Mussel ND = Not Detected TCM = Transplanted California Mussel

M-1
APPENDIX M
Summary of 1993-95 Data
Organic Chemicals in Mussels and Sediment
(ppb, dry weight)

M-2
APPENDIX M State Mussel Watch Program
Summary of 1993-95 Data: Organic Chemicals in Mussels and Sediment (ppb, dry weight) ____________________________________________________________________________________________________________________________________________________________________________________________ Aldrin Chlor- alpha- cis- gamma- trans- cis- trans- Oxy- Total Chlor- Dacthal Diaz- Station Station Sample Sample ben- Chlor- Chlor- Chlor- Chlor- Nona- Nona- chlor- Chlor- pyrifos inon Number Name Type* Date** side dene dane dene dane chlor chlor dane dane ____________________________________________________________________________________________________________________________________________________________________________________________ 10.0 Trinidad Head RCM 10/14/93 ND ND ND 1.3 ND ND ND ND ND 1.3 ND ND ND 10.0 Trinidad Head RCM 11/28/94 ND NA ND 1.1 ND ND ND ND ND 1.1 ND ND ND 100.0 Mad River Slough TCM 02/24/94 ND ND ND 2.2 ND 1.3 ND ND 5.3 8.8 ND ND ND 103.0 Eureka Channel TCM 02/24/94 ND ND ND 2.1 ND 1.2 ND ND 4.2 7.5 ND ND ND 202.0 Bodega Head RCM 09/16/93 ND ND ND 2.0 ND 1.0 ND ND ND 3.0 ND ND ND 202.0 Bodega Head RCM 09/19/94 ND NA ND 1.9 ND ND ND ND ND 1.9 ND ND ND 302.0 Point Pinole TCM 02/02/82 ND NA ND 21.9 1.2 8.8 16.6 16.6 1.1 66.2 ND ND ND 308.0 San Francisco Bay/Hunter's Point TCM 01/15/88 ND NA 1.2 31.3 1.6 7.6 18.5 18.5 1.4 80.0 ND ND ND 309.0 San Mateo Bridge/8B TCM 02/12/85 ND NA ND 23.7 1.3 8.1 10.6 10.6 1.6 55.9 ND 2.6 ND 313.0 San Francisco Bay/near Redwood Cr TCM 02/12/85 ND NA 1.2 29.9 2.2 10.5 21.4 21.4 1.2 87.7 ND 2.0 ND ____________________________________________________________________________________________________________________________________________________________________________________________ o,p' p,p' o,p' p,p' o,p' p,p' p,p' p,p' Total Di- Dicofol Diel- Endo- Endo- Endo- Total Endrin Ethion alpha- Station DDD DDD DDE DDE DDT DDT DDMS DDMU DDT Chloro- drin sulfan sulfan sulfan Endo- HCH Number Benzophenone I II sulfate sulfan _________________________________________________________________________________________________________________________________________________________
10.0 ND ND ND 3.8 ND ND NA ND 3.8 ND ND 4.9 ND ND ND ND ND ND 4.8 10.0 ND ND ND 3.2 ND ND NA ND 3.2 ND ND 3.0 ND ND ND ND ND ND 3.9 100.0 ND ND ND 4.2 ND ND NA ND 4.2 ND ND 7.4 ND ND ND ND ND ND 1.5 103.0 ND ND ND 6.5 ND ND NA ND 6.5 ND ND 3.7 ND ND ND ND ND ND 1.6 202.0 ND ND ND 6.4 ND ND NA ND 6.4 ND ND 7.1 ND ND ND ND ND ND 2.9 202.0 ND ND ND 5.0 ND ND NA ND 5.0 ND ND 6.7 ND ND ND ND ND ND 1.4 302.0 12.4 54.5 ND 55.5 ND 10.0 NA 6.2 139.0 ND ND 27.2 2.0 ND ND 2.0 ND ND 3.6 308.0 21.4 62.9 5.8 115.0 5.2 39.0 NA 11.6 261.0 ND ND 55.7 2.0 ND ND 2.0 ND ND 1.9 309.0 18.9 66.9 ND 46.5 ND 6.3 NA ND 139.0 ND ND 133.0 1.6 ND ND 1.6 ND ND 3.6 313.0 17.0 58.8 ND 65.3 ND 8.7 NA 5.4 155.0 ND ND 108.0 1.9 ND ND 1.9 ND ND 3.0 _________________________________________________________________________________________________________________________________________________________
beta- delta- gamma- Hepta- Hepta- Hexa- Meth- Ethyl- Methyl- Oxa- Phenol PCB PCB PCB Total PCT Tetra- Toxa- Tri- Station HCH HCH HCH chlor chlor- chloro- oxy- para- para- diazon 1248 1254 1260 PCB 5460 difon phene butyl- Number (Lindane) epoxide benzene chlor thion thion tin _________________________________________________________________________________________________________________________________________________________
10.0 ND ND ND ND ND ND ND ND ND ND NA ND ND ND ND ND ND ND ND 10.0 ND ND ND ND ND ND ND ND ND ND NA ND 11.0 ND 11.0 ND ND ND ND 100.0 ND ND 1.7 ND ND ND ND ND ND ND NA ND ND ND ND ND ND ND NA 103.0 ND ND 0.8 ND ND ND ND ND ND ND NA ND ND ND ND ND ND ND NA 202.0 ND ND ND ND ND ND ND ND ND ND NA ND ND ND ND ND ND ND ND 202.0 ND ND ND ND ND ND ND ND ND ND NA ND 28.8 ND 28.8 ND ND ND ND 302.0 ND ND 2.0 ND 1.5 ND ND ND ND ND NA 58.5 195.0 28.3 282.0 NA ND ND NA 308.0 ND ND 2.0 ND 1.3 ND ND ND ND 3.9 NA 52.4 2281.0 640.0 2970.0 NA ND ND NA 309.0 ND ND 6.0 ND 2.7 ND ND ND ND 2.5 NA ND 207.0 59.6 267.0 NA ND ND NA 313.0 ND ND 6.0 ND 3.1 ND ND ND ND 4.0 NA 62.7 287.0 60.0 410.0 NA ND ND NA _________________________________________________________________________________________________________________________________________________________ * RCM = Resident California Mussel SED = Sediment NA = Not Analyzed RBM = Resident Bay Mussel ND = Not Detected TCM = Transplanted California Mussel ** Samples with a collection date prior to 1993 are archive samples.

M-3
APPENDIX M (continued) State Mussel Watch Program
Summary of 1993-95 Data: Organic Chemicals in Mussels and Sediment (ppb, dry weight) ____________________________________________________________________________________________________________________________________________________________________________________________ Aldrin Chlor- alpha- cis- gamma- trans- cis- trans- Oxy- Total Chlor- Dacthal Diaz- Station Station Sample Sample ben- Chlor- Chlor- Chlor- Chlor- Nona- Nona- chlor- Chlor- pyrifos inon Number Name Type* Date** side dene dane dene dane chlor chlor dane dane ____________________________________________________________________________________________________________________________________________________________________________________________ 313.0 San Francisco Bay/near Redwood Cr TCM 01/15/88 ND NA 1.5 31.6 2.3 8.6 23.2 23.2 1.6 92.0 ND 3.7 ND 321.0 Dumbarton Bridge/Channel Marker 14 TCM 01/18/82 ND NA 1.8 44.6 2.3 18.3 29.1 29.1 3.3 129.0 ND 4.6 ND 321.0 Dumbarton Bridge/Channel Marker 14 TCM 02/12/85 ND NA 1.0 29.5 1.5 9.3 19.7 19.7 1.9 82.7 ND 2.7 ND 321.0 Dumbarton Bridge/Channel Marker 14 TCM 01/15/88 ND NA ND 23.7 ND 6.9 12.3 12.3 1.4 56.6 ND 2.6 ND 404.0 Sandholdt Bridge TCM 03/07/94 ND ND ND 31.0 ND 28.0 16.0 24.0 1.7 100.7 29.0 230.0 ND 404.0 Sandholdt Bridge TCM 02/22/95 ND NA 1.4 30.8 1.2 15.4 35.9 35.9 1.3 122.0 17.4 137.0 ND 414.0 Pacific Grove RCM 04/14/94 ND ND ND 2.4 ND 1.9 ND 1.2 ND 5.5 ND ND ND 414.0 Pacific Grove RCM 04/19/95 ND NA ND 2.8 ND ND 2.2 2.2 ND 7.3 ND ND ND 420.0 Monterey Harbor/Coast Guard Jetty TCM 05/26/94 ND ND ND 3.3 ND 2.0 ND ND ND 5.3 ND ND ND 507.3 Mugu Lagoon/Calleguas Creek TCM 02/08/94 ND ND 3.2 72.0 1.9 56.0 32.0 51.0 3.2 219.3 80.0 480.0 ND _____________________________________________________________________________________________________________________________________________
o,p' p,p' o,p' p,p' o,p' p,p' p,p' p,p' Total Di- Dicofol Diel- Endo- Endo- Endo- Total Endrin Ethion alpha- Station DDD DDD DDE DDE DDT DDT DDMS DDMU DDT Chloro- drin sulfan sulfan sulfan Endo- HCH Number Benzophenone I II sulfate sulfan _____________________________________________________________________________________________________________________________________________
313.0 8.1 23.9 1.6 59.6 ND 4.3 NA ND 97.0 ND ND 42.9 3.1 ND ND 3.1 ND ND 1.3 321.0 12.9 45.6 ND 73.7 ND 8.9 NA 7.2 148.0 ND ND 78.9 4.9 ND ND 4.9 ND ND 8.0 321.0 14.8 54.7 ND 61.3 ND 6.3 NA 6.9 144.0 ND ND 115.0 2.4 ND ND 2.4 ND ND 3.3 321.0 5.3 20.3 ND 47.6 ND 4.8 NA ND 78.0 ND ND 59.8 2.6 ND ND 2.6 ND ND 1.8 404.0 130.0 520.0 43.0 1900.0 200.0 890.0 NA 62.0 3745.0 ND ND 210.0 9.0 25.0 99.0 133.0 26.0 ND 1.4 404.0 99.7 398.0 42.2 1661.0 203.0 684.0 NA 54.7 3140.0 ND ND 297.0 6.7 22.3 82.1 111.0 22.1 ND ND 414.0 ND ND ND 24.0 ND 5.0 NA ND 29.0 ND ND 5.9 ND ND ND ND ND ND 1.3 414.0 ND ND ND 28.5 ND 10.0 NA ND 38.0 ND ND 12.2 ND ND ND ND ND ND 1.2 420.0 ND ND ND 22.0 ND ND NA ND 22.0 ND ND 5.1 ND ND ND ND ND ND 4.8 507.3 95.0 420.0 50.0 2500.0 240.0 930.0 NA 49.0 4284.0 ND ND 36.0 ND ND ND ND 8.3 ND 1.3 _____________________________________________________________________________________________________________________________________________
beta- delta- gamma- Hepta- Hepta- Hexa- Meth- Ethyl- Methyl- Oxa- Phenol PCB PCB PCB Total PCT Tetra- Toxa- Tri- Station HCH HCH HCH chlor chlor- chloro- oxy- para- para- diazon 1248 1254 1260 PCB 5460 difon phene butyl- Number (Lindane) epoxide benzene chlor thion thion tin _____________________________________________________________________________________________________________________________________________
313.0 ND ND 18.0 ND 2.5 ND ND ND ND 13.5 NA ND 242.0 27.8 270.0 NA ND ND NA 321.0 ND ND 14.0 ND 5.1 ND ND ND ND 5.7 NA 58.1 414.0 51.3 523.0 NA ND ND NA 321.0 ND ND 7.0 ND 3.0 ND ND ND ND 2.5 NA ND 239.0 59.2 298.0 NA ND ND NA 321.0 ND ND 5.0 ND 2.0 ND ND ND ND 7.3 NA ND 215.0 52.6 268.0 NA ND ND NA 404.0 ND ND 1.7 ND 2.3 ND ND ND ND ND NA ND 180.0 ND 180.0 ND ND 850.0 NA 404.0 ND ND 1.0 ND 3.8 ND ND ND ND 7.3 NA ND 261.0 18.2 279.0 ND ND 868.0 NA 414.0 ND ND ND ND ND ND ND ND ND ND NA ND ND ND ND ND ND ND ND 414.0 ND ND ND ND ND ND ND ND ND ND NA ND 10.2 ND 10.2 ND ND ND NA 420.0 5.1 ND ND ND ND ND ND ND ND ND NA ND ND ND ND ND ND ND NA 507.3 ND ND 1.5 ND 7.2 ND ND ND ND ND NA ND 89.0 40.0 129.0 ND ND 3600.0 NA _________________________________________________________________________________________________________________________________________________________ * RCM = Resident California Mussel SED = Sediment NA = Not Analyzed RBM = Resident Bay Mussel ND = Not Detected TCM = Transplanted California Mussel ** Samples with a collection date prior to 1993 are archive samples.

M-4
APPENDIX M (continued) State Mussel Watch Program
Summary of 1993-95 Data: Organic Chemicals in Mussels and Sediment (ppb, dry weight) ____________________________________________________________________________________________________________________________________________________________________________________________ Aldrin Chlor- alpha- cis- gamma- trans- cis- trans- Oxy- Total Chlor- Dacthal Diaz- Station Station Sample Sample ben- Chlor- Chlor- Chlor- Chlor- Nona- Nona- chlor- Chlor- pyrifos inon Number Name Type* Date side dene dane dene dane chlor chlor dane dane ____________________________________________________________________________________________________________________________________________________________________________________________ 601.0 LA Harbor/National Steel SED 11/09/93 ND ND ND 3.1 ND 4.8 2.0 4.0 ND 13.9 ND ND ND 601.0 LA Harbor/National Steel TCM 02/08/94 ND ND ND 23.0 ND 22.0 10.0 18.0 ND 73.0 ND ND ND 601.0 LA Harbor/National Steel TCM 01/31/95 ND NA 1.3 18.5 ND 10.3 13.3 13.3 1.7 58.4 ND ND ND 602.0 LA Harbor/West Basin TCM 02/08/94 ND ND ND 23.0 ND 18.0 9.6 16.0 ND 66.6 ND ND ND 605.0 LA Harbor/Cabrillo Pier SED 11/09/93 ND ND ND ND ND ND ND 2.6 ND 2.6 ND ND ND 605.0 LA Harbor/Cabrillo Pier TCM 02/08/94 ND ND ND 11.0 ND 9.4 4.2 8.2 ND 32.8 ND ND ND 605.0 LA Harbor/Cabrillo Pier TCM 01/31/95 ND NA 1.1 18.0 1.0 6.9 13.1 13.1 1.0 54.2 ND ND ND 616.0 LA Harbor/Consolidated Slip SED 11/09/93 1.4 ND 3.6 24.0 2.2 29.0 10.0 21.0 1.7 92.9 18.0 2.1 ND 616.0 LA Harbor/Consolidated Slip TCM 02/08/94 ND ND 2.9 33.0 1.7 30.0 16.0 31.0 ND 114.6 14.0 ND ND 616.0 LA Harbor/Consolidated Slip TCM 01/31/95 ND NA 2.2 26.2 1.8 14.6 18.9 18.9 1.4 84.1 6.2 ND ND _____________________________________________________________________________________________________________________________________________
o,p' p,p' o,p' p,p' o,p' p,p' p,p' p,p' Total Di- Dicofol Diel- Endo- Endo- Endo- Total Endrin Ethion alpha- Station DDD DDD DDE DDE DDT DDT DDMS DDMU DDT Chloro- drin sulfan sulfan sulfan Endo- HCH Number Benzophenone I II sulfate sulfan _____________________________________________________________________________________________________________________________________________
601.0 8.5 26.0 6.2 71.0 ND 63.0 NA ND 175.0 ND ND 1.0 ND ND ND ND ND ND ND 601.0 24.0 83.0 42.0 390.0 ND 20.0 NA 27.0 586.0 ND ND ND ND ND ND ND ND ND ND 601.0 16.8 69.9 28.6 283.0 5.3 31.0 NA 16.2 451.0 ND ND 10.4 ND ND ND ND ND ND ND 602.0 21.0 85.0 60.0 480.0 4.6 25.0 NA 25.0 700.6 ND ND 3.4 ND ND ND ND ND ND ND 605.0 7.6 17.0 34.0 210.0 ND 4.5 NA 23.0 296.1 ND ND ND ND ND ND ND ND ND ND 605.0 15.0 48.0 110.0 980.0 ND 12.0 NA 77.0 1242.0 ND ND 3.1 ND ND ND ND ND ND 1.1 605.0 12.8 44.8 69.6 557.0 7.7 29.4 NA 46.8 768.0 ND ND 12.7 ND ND ND ND ND ND ND 616.0 30.0 130.0 11.0 220.0 12.0 79.0 NA 12.0 494.0 ND ND 13.0 ND ND ND ND 9.4 ND ND 616.0 30.0 130.0 37.0 410.0 6.0 36.0 NA 29.0 678.0 ND ND 2.9 ND ND ND ND ND ND ND 616.0 20.7 71.4 18.1 229.0 17.5 62.4 NA 11.0 430.0 ND ND 13.1 ND ND ND ND ND ND ND _____________________________________________________________________________________________________________________________________________
beta- delta- gamma- Hepta- Hepta- Hexa- Meth- Ethyl- Methyl- Oxa- Phenol PCB PCB PCB Total PCT Tetra- Toxa- Tri- Station HCH HCH HCH chlor chlor- chloro- oxy- para- para- diazon 1248 1254 1260 PCB 5460 difon phene butyl- Number (Lindane) epoxide benzene chlor thion thion tin 601.0 ND ND ND ND 1.2 ND ND ND ND ND NA 73.0 96.0 180.0 349.0 ND ND 170.0 350.0 601.0 ND ND ND ND ND ND ND ND ND ND NA 72.0 520.0 ND 592.0 ND ND ND 8200.0 601.0 ND ND ND ND ND ND ND ND ND 3.0 NA 50.8 481.0 35.7 568.0 ND ND 124.0 NA 602.0 ND ND ND ND ND ND ND ND ND ND NA ND 840.0 ND 840.0 ND ND ND NA 605.0 ND ND ND ND ND ND ND ND ND ND NA ND 56.0 ND 56.0 ND ND ND NA 605.0 ND ND ND ND ND ND ND ND ND ND NA ND 250.0 ND 250.0 ND ND ND NA 605.0 ND ND ND ND 1.1 ND ND ND ND 5.1 NA 53.2 267.0 ND 320.0 ND ND 101.0 NA 616.0 ND ND ND ND 7.3 1.0 ND ND ND 12.0 NA 130.0 174.0 390.0 694.0 ND ND 580.0 290.0 616.0 ND ND ND ND ND ND ND ND ND 3.4 NA 97.0 500.0 ND 597.0 ND ND ND 3900.0 616.0 ND ND ND ND ND ND ND ND ND 7.9 NA 75.4 337.0 30.2 443.0 ND ND 320.0 2.6 _________________________________________________________________________________________________________________________________________________________ * RCM = Resident California Mussel SED = Sediment NA = Not Analyzed RBM = Resident Bay Mussel ND = Not Detected
TCM = Transplanted California Mussel

M-5
APPENDIX M (continued) State Mussel Watch Program
Summary of 1993-95 Data: Organic Chemicals in Mussels and Sediment (ppb, dry weight) ____________________________________________________________________________________________________________________________________________________________________________________________ Aldrin Chlor- alpha- cis- gamma- trans- cis- trans- Oxy- Total Chlor- Dacthal Diaz- Station Station Sample Sample ben- Chlor- Chlor- Chlor- Chlor- Nona- Nona- chlor- Chlor- pyrifos inon Number Name Type* Date side dene dane dene dane chlor chlor dane dane ____________________________________________________________________________________________________________________________________________________________________________________________ 618.0 LA Harbor/Angels Gate RCM 02/08/94 ND ND ND ND 1.0 ND ND 11.0 1.4 13.4 ND ND ND 618.0 LA Harbor/Angels Gate RCM 01/31/95 ND NA 1.6 30.3 2.4 10.5 31.2 31.2 1.7 109.0 4.2 ND ND 648.0 Malibu RBM 02/07/94 ND ND 1.3 25.0 2.8 22.0 9.1 27.0 ND 87.2 9.1 ND ND 648.0 Malibu RBM 01/31/95 ND NA ND 18.3 ND 6.1 18.6 18.6 1.0 62.6 ND 2.2 ND 650.0 Santa Monica RCM 02/07/94 ND ND ND 11.0 ND 9.7 4.5 10.0 1.2 36.4 ND ND ND 650.0 Santa Monica RCM 01/31/95 ND NA 1.2 30.6 ND 9.3 26.6 26.6 1.4 95.7 ND 3.5 ND 662.0 Royal Palms RCM 02/08/94 ND ND ND 2.8 ND 2.8 1.0 2.8 ND 9.4 ND ND ND 662.0 Royal Palms RCM 01/31/95 ND NA ND 9.1 ND 2.3 9.2 9.2 ND 29.9 ND ND ND 664.0 Cabrillo Beach RCM 11/11/94 ND NA ND 8.0 ND 3.2 10.7 10.7 1.2 33.8 ND ND ND 681.0 Catalina Island/West RCM 03/30/94 ND ND ND ND ND ND ND ND ND ND ND ND ND _____________________________________________________________________________________________________________________________________________
o,p' p,p' o,p' p,p' o,p' p,p' p,p' p,p' Total Di- Dicofol Diel- Endo- Endo- Endo- Total Endrin Ethion alpha- Station DDD DDD DDE DDE DDT DDT DDMS DDMU DDT Chloro- drin sulfan sulfan sulfan Endo- HCH Number Benzophenone I II sulfate sulfan _____________________________________________________________________________________________________________________________________________
618.0 ND ND 160.0 1300.0 ND 5.6 NA 100.0 1565.6 ND ND ND ND ND ND ND ND ND ND 618.0 21.7 67.6 83.6 641.0 18.7 81.4 NA 56.1 970.0 ND ND 10.2 ND ND ND ND ND ND ND 648.0 13.0 35.0 40.0 310.0 22.0 18.0 NA 42.0 480.0 ND ND ND ND ND ND ND ND ND 1.7 648.0 6.9 18.6 21.2 179.0 4.9 21.5 NA 20.8 273.0 ND ND 6.8 ND ND ND ND ND ND ND 650.0 8.0 24.0 31.0 270.0 ND 11.0 NA 35.0 379.0 ND ND ND ND ND ND ND ND ND 1.2 650.0 7.8 20.6 18.9 154.0 ND 20.4 NA 20.6 242.0 ND ND 14.3 ND ND ND ND ND ND 1.4 662.0 11.0 37.0 59.0 590.0 ND 13.0 NA 61.0 771.0 ND ND ND ND ND ND ND ND ND ND 662.0 11.8 41.3 61.5 581.0 ND 13.5 NA 58.9 768.0 ND ND 8.5 ND ND ND ND ND ND ND 664.0 10.0 35.4 57.4 516.0 ND 13.1 NA 51.2 683.0 ND ND 5.8 ND ND ND ND ND ND ND 681.0 ND ND ND 16.0 ND ND NA ND 16.0 ND ND ND ND ND ND ND ND ND ND _____________________________________________________________________________________________________________________________________________
beta- delta- gamma- Hepta- Hepta- Hexa- Meth- Ethyl- Methyl- Oxa- Phenol PCB PCB PCB Total PCT Tetra- Toxa- Tri- Station HCH HCH HCH chlor chlor- chloro- oxy- para- para- diazon 1248 1254 1260 PCB 5460 difon phene butyl- Number (Lindane) epoxide benzene chlor thion thion tin _____________________________________________________________________________________________________________________________________________
618.0 ND ND ND ND ND ND ND ND ND ND NA 75.0 370.0 ND 445.0 ND ND ND NA 618.0 ND ND ND ND 1.6 ND ND ND ND 8.6 NA 84.3 417.0 14.0 515.0 ND ND 274.0 NA 648.0 ND ND 0.9 ND ND ND ND ND ND ND NA ND 160.0 ND 160.0 ND ND ND NA 648.0 ND ND ND ND 1.3 ND ND ND ND 16.1 NA ND 71.4 ND 71.4 ND ND ND NA 650.0 ND ND ND ND ND ND ND ND ND 3.3 NA ND 66.0 ND 66.0 ND ND ND NA 650.0 ND ND ND ND 1.1 ND ND ND ND ND NA ND 97.4 ND 97.4 ND ND ND NA 662.0 ND ND ND ND ND ND ND ND ND ND NA ND 62.0 ND 62.0 ND ND ND NA 662.0 ND ND ND ND ND ND ND ND ND ND NA ND 96.0 ND 96.0 ND ND ND NA 664.0 ND ND ND ND ND ND ND ND ND ND NA ND 93.9 ND 93.9 ND ND ND NA 681.0 ND ND ND ND ND ND ND ND ND ND NA ND ND ND ND ND ND ND NA _________________________________________________________________________________________________________________________________________________________ * RCM = Resident California Mussel SED = Sediment NA = Not Analyzed RBM = Resident Bay Mussel ND = Not Detected TCM = Transplanted California Mussel

M-6
APPENDIX M (continued) State Mussel Watch Program
Summary of 1993-95 Data: Organic Chemicals in Mussels and Sediment (ppb, dry weight) ____________________________________________________________________________________________________________________________________________________________________________________________ Aldrin Chlor- alpha- cis- gamma- trans- cis- trans- Oxy- Total Chlor- Dacthal Diaz- Station Station Sample Sample ben- Chlor- Chlor- Chlor- Chlor- Nona- Nona- chlor- Chlor- pyrifos inon Number Name Type* Date side dene dane dene dane chlor chlor dane dane ____________________________________________________________________________________________________________________________________________________________________________________________ 713.0 Huntington Harbour/Edinger Street TCM 02/07/94 ND ND 1.8 22.0 ND 20.0 11.0 20.0 1.0 75.8 11.0 19.0 ND 713.0 Huntington Harbour/Edinger Street TCM 01/30/95 ND NA 1.6 27.0 1.0 12.8 28.6 28.6 2.6 102.0 6.8 ND ND 715.0 Huntington Harbour/Warner Ave Brdg TCM 02/07/94 ND ND 2.4 39.0 ND 35.0 23.0 36.0 1.8 137.2 11.0 3.0 ND 715.0 Huntington Harbour/Warner Ave Brdg TCM 01/30/95 ND NA 3.0 36.0 1.9 19.0 38.9 38.9 3.5 141.0 8.8 ND ND 723.4 Newport Bay/Turning Basin TCM 01/30/95 ND NA ND 19.6 ND 10.2 16.0 16.0 3.3 65.1 7.2 3.4 ND 724.0 Newport Bay/Highway 1 Bridge TCM 02/07/94 ND ND 1.6 31.0 ND 26.0 16.0 30.0 3.4 108.0 15.0 ND ND 724.0 Newport Bay/Highway 1 Bridge TCM 01/30/95 ND NA 1.6 36.7 1.1 18.7 34.4 34.4 2.9 130.0 22.0 9.3 ND 725.0 Newport Bay/Crows Nest TCM 02/07/94 ND ND ND 23.0 ND 18.0 17.0 20.0 5.2 83.2 5.8 ND ND 725.0 Newport Bay/Crows Nest TCM 01/30/95 ND NA 1.3 30.0 ND 19.5 20.9 20.9 1.4 94.0 4.4 4.0 ND 726.4 Newport Bay/Rhine Channel/End TCM 02/07/94 ND ND ND 25.0 ND 17.0 17.0 20.0 1.9 80.9 20.0 ND ND _____________________________________________________________________________________________________________________________________________
o,p' p,p' o,p' p,p' o,p' p,p' p,p' p,p' Total Di- Dicofol Diel- Endo- Endo- Endo- Total Endrin Ethion alpha- Station DDD DDD DDE DDE DDT DDT DDMS DDMU DDT Chloro- drin sulfan sulfan sulfan Endo- HCH Number Benzophenone I II sulfate sulfan _____________________________________________________________________________________________________________________________________________
713.0 11.0 34.0 12.0 220.0 ND 15.0 NA 15.0 307.0 ND ND 13.0 ND ND ND ND ND ND ND 713.0 13.1 34.9 12.6 321.0 23.1 79.9 NA 10.9 496.0 ND ND 20.7 ND ND ND ND ND ND ND 715.0 14.0 47.0 12.0 330.0 ND 14.0 NA 16.0 433.0 ND ND 14.0 ND ND ND ND ND ND ND 715.0 14.1 43.0 12.8 400.0 16.9 56.5 NA 12.5 556.0 ND ND 22.2 ND ND ND ND ND ND ND 723.4 5.2 21.2 4.1 180.0 9.9 42.8 NA ND 263.0 ND ND 18.1 ND ND ND ND ND ND ND 724.0 19.0 92.0 12.0 600.0 ND 17.0 NA 19.0 759.0 ND ND 17.0 ND ND ND ND ND ND ND 724.0 14.3 72.1 12.2 573.0 41.4 184.0 NA 12.9 910.0 ND ND 14.7 1.1 ND ND 1.1 ND ND ND 725.0 12.0 54.0 9.4 430.0 16.0 11.0 NA 16.0 548.4 ND ND 15.0 ND ND ND ND ND ND ND 725.0 14.1 51.0 8.6 409.0 10.0 43.3 NA 9.9 546.0 ND ND 30.7 ND ND ND ND ND ND ND 726.4 10.0 49.0 7.5 340.0 13.0 11.0 NA 12.0 442.5 ND ND 25.0 ND ND ND ND ND ND ND _____________________________________________________________________________________________________________________________________________
beta- delta- gamma- Hepta- Hepta- Hexa- Meth- Ethyl- Methyl- Oxa- Phenol PCB PCB PCB Total PCT Tetra- Toxa- Tri- Station HCH HCH HCH chlor chlor- chloro- oxy- para- para- diazon 1248 1254 1260 PCB 5460 difon phene butyl- Number (Lindane) epoxide benzene chlor thion thion tin _____________________________________________________________________________________________________________________________________________
713.0 ND ND ND ND ND ND ND ND ND ND NA ND 100.0 ND 100.0 ND ND ND 960.0 713.0 ND ND ND ND 1.3 ND ND ND ND 6.9 NA ND 121.0 ND 121.0 ND ND 118.0 NA 715.0 ND ND ND ND ND ND ND ND ND 12.0 NA ND 140.0 ND 140.0 ND ND ND 1100.0 715.0 ND ND ND ND 1.6 ND ND ND ND 5.6 NA 50.6 185.0 19.3 255.0 ND ND 163.0 NA 723.4 ND ND ND ND ND ND ND ND ND 16.7 NA ND 90.1 ND 90.1 ND ND 163.0 NA 724.0 ND ND ND ND ND ND ND ND ND ND NA ND 120.0 ND 120.0 ND ND ND 3400.0 724.0 ND ND ND ND 1.4 ND ND ND ND 30.8 NA ND 129.0 ND 129.0 ND ND 331.0 NA 725.0 ND ND ND ND ND ND ND ND ND ND NA 150.0 630.0 ND 780.0 ND ND ND 7100.0 725.0 ND ND ND ND ND ND ND ND ND 11.3 NA 101.0 534.0 23.0 658.0 ND ND 161.0 NA 726.4 ND ND ND ND ND ND ND ND ND 5.8 NA 130.0 630.0 ND 760.0 ND ND ND 7700.0 _____________________________________________________________________________________________________________________________________________ * RCM = Resident California Mussel SED = Sediment NA = Not Analyzed RBM = Resident Bay Mussel ND = Not Detected TCM = Transplanted California Mussel

M-7
APPENDIX M (continued) State Mussel Watch Program
Summary of 1993-95 Data: Organic Chemicals in Mussels and Sediment (ppb, dry weight) ____________________________________________________________________________________________________________________________________________________________________________________________ Aldrin Chlor- alpha- cis- gamma- trans- cis- trans- Oxy- Total Chlor- Dacthal Diaz- Station Station Sample Sample ben- Chlor- Chlor- Chlor- Chlor- Nona- Nona- chlor- Chlor- pyrifos inon Number Name Type* Date side dene dane dene dane chlor chlor dane dane ____________________________________________________________________________________________________________________________________________________________________________________________ 726.4 Newport Bay/Rhine Channel/End TCM 01/30/95 ND NA 1.1 26.5 1.5 16.5 22.2 22.2 2.5 92.5 6.8 6.1 ND 750.0 Oceanside RCM 01/30/95 ND NA ND 8.3 ND 4.8 8.7 8.7 1.1 31.6 ND 3.3 ND 868.5 Mission Bay/Landfill 1 TCM 01/30/95 ND NA ND 14.5 ND 5.9 14.0 14.0 ND 48.4 ND ND ND 868.6 Mission Bay/Landfill 2 TCM 01/30/95 ND NA ND 17.6 ND 6.9 16.3 16.3 ND 57.2 ND ND ND 882.0 24th St Maritime Terminal/South TCM 01/31/95 ND NA ND 12.8 ND 6.5 8.2 8.2 1.7 37.3 ND ND ND 883.4 San Diego Bay/Continental Maritime TCM 02/08/94 ND ND ND 10.0 ND 7.7 6.6 9.0 ND 33.3 ND ND ND 883.5 San Diego Bay/Tuna Docks TCM 02/08/94 NA NA NA NA NA NA NA NA NA NA NA NA NA 894.0 SD Bay/Harbor Is/E Basin/Storm Dr TCM 02/08/94 ND ND 1.6 19.0 ND 19.0 7.4 18.0 ND 65.0 ND ND ND 894.0 SD Bay/Harbor Is/E Basin/Storm Dr TCM 01/31/95 ND NA 2.1 24.7 2.2 8.4 14.4 14.4 5.3 71.5 ND ND ND 899.0 San Diego Bay/Shelter Is/Fshg Pier TCM 01/31/95 ND NA ND 7.0 ND 2.7 5.2 5.2 3.1 23.3 ND ND ND _____________________________________________________________________________________________________________________________________________
o,p' p,p' o,p' p,p' o,p' p,p' p,p' p,p' Total Di- Dicofol Diel- Endo- Endo- Endo- Total Endrin Ethion alpha- Station DDD DDD DDE DDE DDT DDT DDMS DDMU DDT Chloro- drin sulfan sulfan sulfan Endo- HCH Number Benzophenone I II sulfate sulfan _____________________________________________________________________________________________________________________________________________
726.4 10.0 35.8 6.4 271.0 11.2 53.0 NA 5.5 393.0 ND ND 18.3 ND ND ND ND ND ND ND 750.0 8.6 18.3 6.1 134.0 9.7 29.9 NA 5.4 212.0 ND ND 6.2 ND ND ND ND ND ND 1.7 868.5 ND 4.1 ND 34.0 ND ND NA ND 38.0 ND ND 14.0 ND ND ND ND ND ND ND 868.6 ND ND ND 40.4 ND 8.8 NA ND 49.0 ND ND 16.6 ND ND ND ND ND ND ND 882.0 ND 8.5 ND 49.2 ND 10.7 NA ND 68.0 ND ND 7.4 ND ND ND ND ND ND ND 883.4 ND 9.1 ND 43.0 ND 9.2 NA ND 61.3 ND ND 2.8 ND ND ND ND ND ND ND 883.5 NA NA NA NA NA NA NA NA NA NA NA NA NA NA NA NA NA NA NA 894.0 32.0 100.0 ND 35.0 5.2 27.0 NA 15.0 214.2 ND ND 2.8 ND ND ND ND ND ND ND 894.0 47.1 135.0 ND 29.8 8.6 32.0 NA 22.6 275.0 ND ND 6.0 ND ND ND ND ND ND ND 899.0 ND 7.2 ND 54.4 ND ND NA 5.6 67.0 ND ND 4.7 ND ND ND ND ND ND ND _____________________________________________________________________________________________________________________________________________
beta- delta- gamma- Hepta- Hepta- Hexa- Meth- Ethyl- Methyl- Oxa- Phenol PCB PCB PCB Total PCT Tetra- Toxa- Tri- Station HCH HCH HCH chlor chlor- chloro- oxy- para- para- diazon 1248 1254 1260 PCB 5460 difon phene butyl- Number (Lindane) epoxide benzene chlor thion thion tin _____________________________________________________________________________________________________________________________________________
726.4 ND ND ND ND ND ND ND ND ND 18.1 NA 62.8 360.0 12.1 435.0 ND ND 213.0 6.0 750.0 ND ND ND ND ND ND ND ND ND 3.5 NA ND 22.0 ND 22.0 ND ND 134.0 NA 868.5 ND ND ND ND 1.4 ND ND ND ND 6.9 NA ND 102.0 ND 102.0 ND ND ND NA 868.6 ND ND ND ND 1.7 ND ND ND ND 6.2 NA ND 112.0 ND 112.0 ND ND ND NA 882.0 ND ND ND ND ND ND ND ND ND 7.0 NA ND 278.0 33.1 311.0 ND ND ND NA 883.4 ND ND ND ND ND ND ND ND ND ND NA ND 290.0 ND 290.0 ND ND ND 3000.0 883.5 NA NA NA NA NA NA NA NA NA NA NA NA NA NA NA NA NA NA 5300.0 894.0 ND ND 1.3 1.4 ND ND ND ND ND ND NA 4600.0 2800.0 ND 7400.0 ND ND ND 1000.0 894.0 ND ND ND 1.9 1.3 ND ND ND ND 2.0 NA 11173.0 6904.0 207.0 18300.0 ND ND ND 1.4 899.0 ND ND ND ND ND ND ND ND ND ND NA ND 168.0 13.2 181.0 ND ND ND 0.8 _________________________________________________________________________________________________________________________________________________________ * RCM = Resident California Mussel SED = Sediment NA = Not Analyzed RBM = Resident Bay Mussel ND = Not Detected TCM = Transplanted California Mussel

�
N-1
APPENDIX N
Summary of 1993-95 Data
Organic Chemicals in Mussels
(ppb, lipid weight)

N-2
�
�
APPENDIX N State Mussel Watch Program
Summary of 1993-95 Data: Organic Chemicals in Mussels (ppb, lipid weight) ____________________________________________________________________________________________________________________________________________________________________________________________ Aldrin Chlor- alpha- cis- gamma- trans- cis- trans- Oxy- Total Chlor- Dacthal Diaz- Station Station Sample Sample ben- Chlor- Chlor- Chlor- Chlor- Nona- Nona- chlor- Chlor- pyrifos inon Number Name Type* Date** side dene dane dene dane chlor chlor dane dane ____________________________________________________________________________________________________________________________________________________________________________________________ 10.0 Trinidad Head RCM 10/14/93 ND ND ND 25.5 ND ND ND ND ND 25.5 ND ND ND 10.0 Trinidad Head RCM 11/28/94 ND NA ND 25.9 ND ND ND ND ND 25.9 ND ND ND 100.0 Mad River Slough TCM 02/24/94 ND ND ND 44.8 ND 22.4 ND ND 134.5 201.8 ND ND ND 103.0 Eureka Channel TCM 02/24/94 ND ND ND 34.6 ND 23.1 ND ND 80.7 138.4 ND ND ND 202.0 Bodega Head RCM 09/16/93 ND ND ND 38.0 ND 25.3 ND ND ND 63.3 ND ND ND 202.0 Bodega Head RCM 09/19/94 ND NA ND 53.6 ND ND ND ND ND 53.6 ND ND ND 302.0 Point Pinole TCM 02/02/82 ND NA ND 335.7 18.7 135.1 254.5 254.5 16.3 1014.9 ND ND ND 308.0 San Francisco Bay/Hunter's Point TCM 01/15/88 ND NA 15.8 409.9 21.3 99.3 242.3 242.3 17.7 1047.6 ND ND ND 309.0 San Mateo Bridge/8B TCM 02/12/85 ND NA ND 324.6 18.2 110.2 145.1 145.1 21.6 765.5 ND 35.9 ND 313.0 San Francisco Bay/near Redwood Cr TCM 02/12/85 ND NA 14.4 365.3 26.6 128.3 261.5 261.5 14.4 1071.5 ND 24.8 ND _____________________________________________________________________________________________________________________________________________
o,p' p,p' o,p' p,p' o,p' p,p' p,p' p,p' Total Di- Dicofol Diel- Endo- Endo- Endo- Total Endrin Ethion alpha- Station DDD DDD DDE DDE DDT DDT DDMS DDMU DDT Chloro- drin sulfan sulfan sulfan Endo- HCH Number Benzophenone I II sulfate sulfan _____________________________________________________________________________________________________________________________________________
10.0 ND ND ND 76.5 ND ND NA ND 76.5 ND ND 102.0 ND ND ND ND ND ND 102.0 10.0 ND ND ND 73.0 ND ND NA ND 73.0 ND ND 68.8 ND ND ND ND ND ND 89.9 100.0 ND ND ND 89.7 ND ND NA ND 89.7 ND ND 179.4 ND ND ND ND ND ND 44.8 103.0 ND ND ND 115.3 ND ND NA ND 115.3 ND ND 69.2 ND ND ND ND ND ND 34.6 202.0 ND ND ND 126.6 ND ND NA ND 126.6 ND ND 139.2 ND ND ND ND ND ND 63.3 202.0 ND ND ND 141.4 ND ND NA ND 141.4 ND ND 188.2 ND ND ND ND ND ND 39.5 302.0 190.1 835.7 ND 851.0 ND 153.3 NA 95.0 2131.2 ND ND 417.0 31.3 ND ND 31.3 ND ND 55.7 308.0 280.2 823.6 76.0 1505.9 67.4 510.7 NA 151.9 3417.6 ND ND 729.3 26.0 ND ND 26.0 ND ND 24.8 309.0 258.8 916.1 ND 636.8 ND 86.1 NA ND 1903.5 ND ND 1821.3 22.6 ND ND 22.6 ND ND 49.2 313.0 207.7 718.4 ND 797.9 ND 106.8 NA 66.3 1893.8 ND ND 1319.5 23.7 ND ND 23.7 ND ND 36.6 _____________________________________________________________________________________________________________________________________________
beta- delta- gamma- Hepta- Hepta- Hexa- Meth- Ethyl- Methyl- Oxa- Phenol PCB PCB PCB Total PCT Tetra- Toxa- Tri- Station HCH HCH HCH chlor chlor- chloro- oxy- para- para- diazon 1248 1254 1260 PCB 5460 difon phene butyl- Number (Lindane) epoxide benzene chlor thion thion tin _____________________________________________________________________________________________________________________________________________
10.0 ND ND ND ND ND ND ND ND ND ND NA ND ND ND ND ND ND ND ND 10.0 ND ND ND ND ND ND ND ND ND ND NA ND 254.8 ND 254.9 ND ND ND ND 100.0 ND ND 44.8 ND ND ND ND ND ND ND NA ND ND ND ND ND ND ND NA 103.0 ND ND 11.5 ND ND ND ND ND ND ND NA ND ND ND ND ND ND ND NA 202.0 ND ND ND ND ND ND ND ND ND ND NA ND ND ND ND ND ND ND ND 202.0 ND ND ND ND ND ND ND ND ND ND NA ND 812.2 ND 812.2 ND ND ND ND 302.0 ND ND 30.2 ND 22.2 ND ND ND ND ND NA 897.0 2990.3 433.9 4323.6 NA ND ND NA 308.0 ND ND 26.0 ND 17.5 ND ND ND ND 51.0 NA 686.4 29868.6 8380.4 38890.4 NA ND ND NA 309.0 ND ND 82.0 ND 36.3 ND ND ND ND 33.5 NA ND 2834.7 815.9 3656.3 NA ND ND NA 313.0 ND ND 73.0 ND 38.0 ND ND ND ND 49.2 NA 765.9 3506.3 733.1 5009.4 NA ND ND NA _____________________________________________________________________________________________________________________________________________
* RCM = Resident California Mussel SED = Sediment NA = Not Analyzed RBM = Resident Bay Mussel ND = Not Detected TCM = Transplanted California Mussel ** Samples with a collection date prior to 1993 are archive samples.

N-3
�
�
APPENDIX N (continued) State Mussel Watch Program
Summary of 1993-95 Data: Organic Chemicals in Mussels (ppb, lipid weight) ____________________________________________________________________________________________________________________________________________________________________________________________ Aldrin Chlor- alpha- cis- gamma- trans- cis- trans- Oxy- Total Chlor- Dacthal Diaz- Station Station Sample Sample ben- Chlor- Chlor- Chlor- Chlor- Nona- Nona- chlor- Chlor- pyrifos inon Number Name Type* Date** side dene dane dene dane chlor chlor dane dane ____________________________________________________________________________________________________________________________________________________________________________________________ 313.0 San Francisco Bay/near Redwood Cr TCM 01/15/88 ND NA 22.7 474.1 34.4 128.7 348.1 348.1 24.6 1380.2 ND 54.7 ND 321.0 Dumbarton Bridge/Channel Marker 14 TCM 01/18/82 ND NA 22.0 548.6 28.5 225.1 357.9 357.9 41.2 1586.7 ND 56.2 ND 321.0 Dumbarton Bridge/Channel Marker 14 TCM 02/12/85 ND NA 15.1 425.0 22.1 134.6 283.8 283.8 26.8 1191.4 ND 38.2 ND 321.0 Dumbarton Bridge/Channel Marker 14 TCM 01/15/88 ND NA ND 449.1 ND 130.0 233.2 233.2 27.4 1072.7 ND 48.8 ND 404.0 Sandholdt Bridge TCM 03/07/94 ND ND ND 586.3 ND 521.2 304.0 456.0 32.6 1889.3 542.9 4321.4 ND 404.0 Sandholdt Bridge TCM 02/22/95 ND NA 23.1 514.7 19.7 257.3 599.8 599.8 22.3 2038.4 290.7 2289.1 ND 414.0 Pacific Grove RCM 04/14/94 ND ND ND 76.2 ND 57.1 ND 38.1 ND 152.4 ND ND ND 414.0 Pacific Grove RCM 04/19/95 ND NA ND 74.7 ND ND 59.6 59.6 ND 193.7 ND ND ND 420.0 Monterey Harbor/Coast Guard Jetty TCM 05/26/94 ND ND ND 109.8 ND 66.6 ND ND ND 176.4 ND ND ND 507.3 Mugu Lagoon/Calleguas Creek TCM 02/08/94 ND ND 62.4 1466.5 31.2 1138.8 655.2 1029.6 62.4 4446.2 1622.5 9734.8 ND _____________________________________________________________________________________________________________________________________________
o,p' p,p' o,p' p,p' o,p' p,p' p,p' p,p' Total Di- Dicofol Diel- Endo- Endo- Endo- Total Endrin Ethion alpha- Station DDD DDD DDE DDE DDT DDT DDMS DDMU DDT Chloro- drin sulfan sulfan sulfan Endo- HCH Number Benzophenone I II sulfate sulfan _____________________________________________________________________________________________________________________________________________
313.0 121.6 358.5 23.4 894.2 ND 64.7 NA ND 1455.2 ND ND 643.6 47.2 ND ND 47.2 ND ND 20.1 321.0 158.7 560.9 ND 906.5 ND 110.0 NA 89.0 1820.4 ND ND 970.5 60.9 ND ND 60.9 ND ND 98.8 321.0 213.3 788.0 ND 883.1 ND 91.2 NA 99.9 2074.5 ND ND 1656.7 34.6 ND ND 34.6 ND ND 46.9 321.0 101.3 384.8 ND 902.1 ND 92.0 NA ND 1478.3 ND ND 1133.3 48.5 ND ND 48.5 ND ND 34.7 404.0 2443.0 9772.0 803.5 35689.5 3756.8 16721.0 NA 1161.8 70347.4 ND ND 3941.4 173.7 466.9 1856.7 2497.3 488.6 ND 21.7 404.0 1665.9 6650.0 705.1 27752.8 3391.8 11428.6 NA 914.0 52464.7 ND ND 4962.4 111.6 372.1 1372.2 1854.6 369.7 ND ND 414.0 ND ND ND 685.7 ND 152.4 NA ND 838.1 ND ND 171.4 ND ND ND ND ND ND 38.1 414.0 ND ND ND 757.2 ND 264.6 NA ND 1009.6 ND ND 324.2 ND ND ND ND ND ND 31.9 420.0 ND ND ND 732.1 ND ND NA ND 732.1 ND ND 169.7 ND ND ND ND ND ND 159.7 507.3 1934.5 8517.9 1014.0 50702.0 4867.4 18861.2 NA 998.4 86879.9 ND ND 733.2 ND ND ND ND 171.6 ND 31.2 _____________________________________________________________________________________________________________________________________________
beta- delta- gamma- Hepta- Hepta- Hexa- Meth- Ethyl- Methyl- Oxa- Phenol PCB PCB PCB Total PCT Tetra- Toxa- Tri- Station HCH HCH HCH chlor chlor- chloro- oxy- para- para- diazon 1248 1254 1260 PCB 5460 difon phene butyl- Number (Lindane) epoxide benzene chlor thion thion tin _____________________________________________________________________________________________________________________________________________
313.0 ND ND 269.7 ND 36.8 ND ND ND ND 202.5 NA ND 3630.9 417.0 4050.6 NA ND ND NA 321.0 ND ND 172.2 ND 62.5 ND ND ND ND 70.0 NA 714.4 5092.2 631.4 6432.9 NA ND ND NA 321.0 ND ND 100.9 ND 43.6 ND ND ND ND 35.5 NA ND 3442.7 852.6 4293.0 NA ND ND NA 321.0 ND ND 95.4 ND 37.8 ND ND ND ND 138.4 NA ND 4075.5 997.2 5079.4 NA ND ND NA 404.0 ND ND 32.6 ND 43.4 ND ND ND ND ND NA ND 3376.8 ND 3376.8 ND ND 15971.8 NA 404.0 ND ND 16.6 ND 63.0 ND ND ND ND 121.6 NA ND 4360.8 304.5 4661.7 ND ND 14503.2 NA 414.0 ND ND ND ND ND ND ND ND ND ND NA ND ND ND ND ND ND ND ND 414.0 ND ND ND ND ND ND ND ND ND ND NA ND 271.2 ND 271.0 ND ND ND NA 420.0 169.7 ND ND ND ND ND ND ND ND ND NA ND ND ND ND ND ND ND NA 507.3 ND ND 31.2 ND 140.4 ND ND ND ND ND NA ND 1809.7 811.2 2620.9 ND ND 73010.9 NA _____________________________________________________________________________________________________________________________________________
* RCM = Resident California Mussel SED = Sediment NA = Not Analyzed RBM = Resident Bay Mussel ND = Not Detected TCM = Transplanted California Mussel ** Samples with a collection date prior to 1993 are archive samples.

N-4
�
�
APPENDIX N (continued) State Mussel Watch Program
Summary of 1993-95 Data: Organic Chemicals in Mussels (ppb, lipid weight) ____________________________________________________________________________________________________________________________________________________________________________________________ Aldrin Chlor- alpha- cis- gamma- trans- cis- trans- Oxy- Total Chlor- Dacthal Diaz- Station Station Sample Sample ben- Chlor- Chlor- Chlor- Chlor- Nona- Nona- chlor- Chlor- pyrifos inon Number Name Type* Date side dene dane dene dane chlor chlor dane dane ____________________________________________________________________________________________________________________________________________________________________________________________ 601.0 LA Harbor/National Steel TCM 02/08/94 ND ND ND 458.2 ND 438.2 199.2 358.6 ND 1474.1 ND ND ND 601.0 LA Harbor/National Steel TCM 01/31/95 ND NA 65.1 914.5 ND 509.3 657.6 657.6 82.0 2886.1 ND ND ND 602.0 LA Harbor/West Basin TCM 02/08/94 ND ND ND 538.8 ND 409.5 215.5 366.4 ND 1551.7 ND ND ND 605.0 LA Harbor/Cabrillo Pier TCM 02/08/94 ND ND ND 192.3 ND 163.5 76.9 144.2 ND 576.9 ND ND ND 605.0 LA Harbor/Cabrillo Pier TCM 01/31/95 ND NA 28.1 463.3 26.0 177.4 337.3 337.3 25.7 1395.1 ND ND ND 616.0 LA Harbor/Consolidated Slip TCM 02/08/94 ND ND 71.8 789.5 47.8 717.7 382.8 741.6 ND 2703.3 334.9 ND ND 616.0 LA Harbor/Consolidated Slip TCM 01/31/95 ND NA 75.2 879.5 60.5 490.3 634.4 634.4 47.9 2823.5 208.1 ND ND 618.0 LA Harbor/Angels Gate RCM 02/08/94 ND ND ND ND 24.5 ND ND 208.1 24.5 244.8 ND ND ND 618.0 LA Harbor/Angels Gate RCM 01/31/95 ND NA 28.1 535.3 41.7 185.6 551.2 551.2 29.7 1925.7 74.1 ND ND 648.0 Malibu RBM 02/07/94 ND ND 11.4 238.6 28.4 210.2 85.2 255.7 ND 823.9 85.2 ND ND _____________________________________________________________________________________________________________________________________________
o,p' p,p' o,p' p,p' o,p' p,p' p,p' p,p' Total Di- Dicofol Diel- Endo- Endo- Endo- Total Endrin Ethion alpha- Station DDD DDD DDE DDE DDT DDT DDMS DDMU DDT Chloro- drin sulfan sulfan sulfan Endo- HCH Number Benzophenone I II sulfate sulfan _____________________________________________________________________________________________________________________________________________
601.0 478.1 1673.3 836.7 7848.6 ND 398.4 NA 537.8 11792.8 ND ND ND ND ND ND ND ND ND ND 601.0 830.2 3454.7 1413.4 13985.6 264.0 1532.0 NA 800.6 22288.0 ND ND 514.0 ND ND ND ND ND ND ND 602.0 495.7 1982.8 1400.9 11163.8 107.8 581.9 NA 581.9 16314.7 ND ND 86.2 ND ND ND ND ND ND ND 605.0 259.6 846.2 1932.7 17240.4 ND 211.5 NA 1355.8 21855.8 ND ND 57.7 ND ND ND ND ND ND 19.2 605.0 329.5 1153.2 1791.5 14337.2 198.7 756.8 NA 1204.6 19768.3 ND ND 327.0 ND ND ND ND ND ND ND 616.0 717.7 3086.1 885.2 9712.9 143.5 861.2 NA 693.8 16052.6 ND ND 71.8 ND ND ND ND ND ND ND 616.0 694.8 2396.8 607.8 7687.8 587.5 2094.7 NA 369.3 14435.6 ND ND 439.9 ND ND ND ND ND ND ND 618.0 ND ND 2974.3 24186.0 ND 110.2 NA 1860.5 29131.0 ND ND ND ND ND ND ND ND ND ND 618.0 383.4 1194.3 1477.0 11324.5 330.4 1438.1 NA 991.1 17137.0 ND ND 180.2 ND ND ND ND ND ND ND 648.0 125.0 329.5 375.0 2926.1 210.2 170.5 NA 397.7 4528.4 ND ND ND ND ND ND ND ND ND 17.0 _____________________________________________________________________________________________________________________________________________
beta- delta- gamma- Hepta- Hepta- Hexa- Meth- Ethyl- Methyl- Oxa- Phe- PCB PCB PCB Total PCT Tetra- Toxa- Tributyl- Station HCH HCH HCH chlor chlor- chloro- oxy- para- para- diazon nol 1248 1254 1260 PCB 5460 difon phene tin Number (Lindane) epoxide benzene chlor thion thion _____________________________________________________________________________________________________________________________________________
601.0 ND ND ND ND ND ND ND ND ND ND NA 1454.2 10458.2 ND 11912.4 ND ND ND 170000.0 601.0 ND ND ND ND ND ND ND ND ND 148.8 NA 2511.6 23773.4 1761.6 28070.0 ND ND 6128.0 NA 602.0 ND ND ND ND ND ND ND ND ND ND NA ND 19547.4 ND 19547.4 ND ND ND NA 605.0 ND ND ND ND ND ND ND ND ND ND NA ND 4403.8 ND 4403.8 ND ND ND NA 605.0 ND ND ND ND 29.0 ND ND ND ND 131.4 NA 1369.7 6873.4 ND 8236.8 ND ND 2600.5 NA 616.0 ND ND ND ND ND ND ND ND ND 71.8 NA 2296.7 11842.1 ND 14138.8 ND ND ND 93000.0 616.0 ND ND ND ND ND ND ND ND ND 265.1 NA 2531.8 11312.8 1014.1 14872.0 ND ND 10742.8 87.4 618.0 ND ND ND ND ND ND ND ND ND ND NA 1395.3 6878.8 ND 8274.2 ND ND ND NA 618.0 ND ND ND ND 27.7 ND ND ND ND 151.6 NA 1489.4 7367.5 246.9 9098.5 ND ND 4840.3 NA 648.0 ND ND 5.7 ND ND ND ND ND ND ND NA ND 1511.4 ND 1511.4 ND ND ND NA _____________________________________________________________________________________________________________________________________________
* RCM = Resident California Mussel SED = Sediment NA = Not Analyzed RBM = Resident Bay Mussel ND = Not Detected TCM = Transplanted California Mussel

N-5
�
�
APPENDIX N (continued) State Mussel Watch Program
Summary of 1993-95 Data: Organic Chemicals in Mussels (ppb, lipid weight) ____________________________________________________________________________________________________________________________________________________________________________________________ Aldrin Chlor- alpha- cis- gamma- trans- cis- trans- Oxy- Total Chlor- Dacthal Diaz- Station Station Sample Sample ben- Chlor- Chlor- Chlor- Chlor- Nona- Nona- chlor- Chlor- pyrifos inon Number Name Type* Date side dene dane dene dane chlor chlor dane dane ____________________________________________________________________________________________________________________________________________________________________________________________ 648.0 Malibu RBM 01/31/95 ND NA ND 208.4 ND 69.8 211.8 211.8 11.4 712.8 ND 24.8 ND 650.0 Santa Monica RCM 02/07/94 ND ND ND 150.0 ND 140.0 60.0 140.0 20.0 510.0 ND ND ND 650.0 Santa Monica RCM 01/31/95 ND NA 25.0 637.1 ND 194.1 553.8 553.8 29.5 1992.6 ND 73.9 ND 662.0 Royal Palms RCM 02/08/94 ND ND ND 85.8 ND 85.8 21.5 85.8 ND 279.0 ND ND ND 662.0 Royal Palms RCM 01/31/95 ND NA ND 300.4 ND 77.1 305.8 305.8 ND 990.3 ND ND ND 664.0 Cabrillo Beach RCM 11/11/94 ND NA ND 250.8 ND 100.2 335.0 335.0 36.3 1058.3 ND ND ND 681.0 Catalina Island/West RCM 03/30/94 ND ND ND ND ND ND ND ND ND ND ND ND ND 713.0 Huntington Harbour/Edinger Street TCM 02/07/94 ND ND 45.1 586.9 ND 541.8 293.5 541.8 22.6 2009.0 293.5 496.6 ND 713.0 Huntington Harbour/Edinger Street TCM 01/30/95 ND NA 48.7 798.0 30.3 378.2 845.3 845.3 75.7 3014.6 201.6 ND ND 715.0 Huntington Harbour/Warner Ave Brdg TCM 02/07/94 ND ND 54.2 866.4 ND 776.2 505.4 794.2 36.1 3014.4 234.7 72.2 ND _____________________________________________________________________________________________________________________________________________
o,p' p,p' o,p' p,p' o,p' p,p' p,p' p,p' Total Di- Dicofol Diel- Endo- Endo- Endo- Total Endrin Ethion alpha- Station DDD DDD DDE DDE DDT DDT DDMS DDMU DDT Chloro- drin sulfan sulfan sulfan Endo- HCH Number Benzophenone I II sulfate sulfan _____________________________________________________________________________________________________________________________________________
648.0 78.8 211.8 241.4 2038.2 55.5 244.8 NA 236.9 3108.5 ND ND 77.0 ND ND ND ND ND ND ND 650.0 110.0 340.0 430.0 3780.0 ND 150.0 NA 490.0 5310.0 ND ND ND ND ND ND ND ND ND 20.0 650.0 162.4 428.9 393.5 3206.4 ND 424.7 NA 428.9 5038.6 ND ND 297.7 ND ND ND ND ND ND 28.7 662.0 321.9 1094.4 1738.2 17467.8 ND 386.3 NA 1802.6 22832.6 ND ND ND ND ND ND ND ND ND ND 662.0 390.8 1367.9 2037.0 19242.5 ND 447.2 NA 1950.7 25435.9 ND ND 281.6 ND ND ND ND ND ND ND 664.0 312.2 1108.3 1797.2 16156.2 ND 410.2 NA 1603.1 21385.0 ND ND 181.3 ND ND ND ND ND ND ND 681.0 ND ND ND 501.3 ND ND NA ND 501.3 ND ND ND ND ND ND ND ND ND ND 713.0 293.5 902.9 316.0 5869.1 ND 406.3 NA 406.3 8171.6 ND ND 338.6 ND ND ND ND ND ND ND 713.0 387.2 1031.4 372.4 9487.2 682.8 2361.4 NA 322.1 14659.4 ND ND 611.9 ND ND ND ND ND ND ND 715.0 306.9 1028.9 270.8 7274.4 ND 306.9 NA 361.0 9530.7 ND ND 306.9 ND ND ND ND ND ND ND _____________________________________________________________________________________________________________________________________________
beta- delta- gamma- Hepta- Hepta- Hexa- Meth- Ethyl- Methyl- Oxa- Phe- PCB PCB PCB Total PCT Tetra- Toxa- Tributyl- Station HCH HCH HCH chlor chlor- chloro- oxy- para- para- diazon nol 1248 1254 1260 PCB 5460 difon phene tin Number (Lindane) epoxide benzene chlor thion thion _____________________________________________________________________________________________________________________________________________
648.0 ND ND ND ND 14.2 ND ND ND ND 183.3 NA ND 812.9 ND 813.0 ND ND ND NA 650.0 ND ND ND ND ND ND ND ND ND 50.0 NA ND 920.0 ND 920.0 ND ND ND NA 650.0 ND ND ND ND 23.1 ND ND ND ND ND NA ND 2028.0 ND 2027.9 ND ND ND NA 662.0 ND ND ND ND ND ND ND ND ND ND NA ND 1845.5 ND 1845.5 ND ND ND NA 662.0 ND ND ND ND ND ND ND ND ND ND NA ND 3178.7 ND 3179.5 ND ND ND NA 664.0 ND ND ND ND ND ND ND ND ND ND NA ND 2940.7 ND 2940.0 ND ND ND NA 681.0 ND ND ND ND ND ND ND ND ND ND NA ND ND ND ND ND ND ND NA 713.0 ND ND ND ND ND ND ND ND ND ND NA ND 2663.7 ND 2663.7 ND ND ND 25000.0 713.0 ND ND ND ND 38.3 ND ND ND ND 203.4 NA ND 3576.6 ND 3576.2 ND ND 3486.6 NA 715.0 ND ND ND ND ND ND ND ND ND 270.8 NA ND 3086.6 ND 3086.6 ND ND ND 23000.0 _____________________________________________________________________________________________________________________________________________
* RCM = Resident California Mussel SED = Sediment NA = Not Analyzed RBM = Resident Bay Mussel ND = Not Detected TCM = Transplanted California Mussel

N-6
�
�
APPENDIX N (continued) State Mussel Watch Program
Summary of 1993-95 Data: Organic Chemicals in Mussels (ppb, lipid weight) ____________________________________________________________________________________________________________________________________________________________________________________________ Aldrin Chlor- alpha- cis- gamma- trans- cis- trans- Oxy- Total Chlor- Dacthal Diaz- Station Station Sample Sample ben- Chlor- Chlor- Chlor- Chlor- Nona- Nona- chlor- Chlor- pyrifos inon Number Name Type* Date side dene dane dene dane chlor chlor dane dane ____________________________________________________________________________________________________________________________________________________________________________________________ 715.0 Huntington Harbour/Warner Ave Brdg TCM 01/30/95 ND NA 78.5 927.2 48.7 489.4 1001.8 1001.8 90.7 3631.5 225.7 ND ND 723.4 Newport Bay/Turning Basin TCM 01/30/95 ND NA ND 710.3 ND 369.5 579.7 579.7 118.5 2358.8 259.3 124.2 ND 724.0 Newport Bay/Highway 1 Bridge TCM 02/07/94 ND ND 54.1 810.8 ND 675.7 405.4 783.8 81.1 2810.8 378.4 ND ND 724.0 Newport Bay/Highway 1 Bridge TCM 01/30/95 ND NA 36.2 852.5 26.2 434.4 798.9 798.9 67.4 3019.4 511.0 215.2 ND 725.0 Newport Bay/Crows Nest TCM 02/07/94 ND ND ND 482.5 ND 372.8 350.9 416.7 109.6 1776.3 131.6 ND ND 725.0 Newport Bay/Crows Nest TCM 01/30/95 ND NA 54.0 1248.4 ND 811.8 869.5 869.5 56.5 3911.7 181.4 167.1 ND 726.4 Newport Bay/Rhine Channel/End TCM 02/07/94 ND ND ND 1147.5 ND 765.0 765.0 874.3 109.3 3606.6 874.3 ND ND 726.4 Newport Bay/Rhine Channel/End TCM 01/30/95 ND NA 42.1 984.2 53.9 612.8 824.5 824.5 94.6 3435.3 252.5 225.7 ND 750.0 Oceanside RCM 01/30/95 ND NA ND 195.3 ND 113.7 205.8 205.8 26.5 746.4 ND 77.2 ND 868.5 Mission Bay/Landfill 1 TCM 01/30/95 ND NA ND 285.9 ND 116.5 276.0 276.0 ND 954.3 ND ND ND _____________________________________________________________________________________________________________________________________________
o,p' p,p' o,p' p,p' o,p' p,p' p,p' p,p' Total Di- Dicofol Diel- Endo- Endo- Endo- Total Endrin Ethion alpha- Station DDD DDD DDE DDE DDT DDT DDMS DDMU DDT Chloro- drin sulfan sulfan sulfan Endo- HCH Number Benzophenone I II sulfate sulfan _____________________________________________________________________________________________________________________________________________
715.0 363.2 1107.5 329.8 10302.2 435.2 1455.3 NA 322.0 14320.1 ND ND 571.7 ND ND ND ND ND ND ND 723.4 188.3 768.0 148.3 6521.5 359.3 1550.7 NA ND 9528.6 ND ND 655.9 ND ND ND ND ND ND ND 724.0 486.5 2378.4 324.3 15567.6 ND 432.4 NA 486.5 19702.7 ND ND 432.4 ND ND ND ND ND ND ND 724.0 332.1 1674.6 283.3 13308.7 961.5 4273.6 NA 299.6 21135.9 ND ND 341.5 24.8 ND ND 24.8 ND ND ND 725.0 263.2 1140.4 197.4 9144.7 350.9 241.2 NA 350.9 11666.7 ND ND 328.9 ND ND ND ND ND ND ND 725.0 586.9 2122.3 359.6 17020.0 416.1 1801.8 NA 411.2 22721.1 ND ND 1277.6 ND ND ND ND ND ND ND 726.4 437.2 2185.8 327.9 15245.9 601.1 491.8 NA 546.4 19836.1 ND ND 1147.5 ND ND ND ND ND ND ND 726.4 371.4 1329.5 236.0 10064.5 416.0 1968.3 NA 203.6 14595.4 ND ND 679.6 ND ND ND ND ND ND ND 750.0 202.6 432.2 143.4 3165.1 228.4 706.2 NA 128.3 5007.5 ND ND 145.3 ND ND ND ND ND ND 39.5 868.5 ND 80.7 ND 670.4 ND ND NA ND 749.3 ND ND 276.0 ND ND ND ND ND ND ND _____________________________________________________________________________________________________________________________________________
beta- delta- gamma- Hepta- Hepta- Hexa- Meth- Ethyl- Methyl- Oxa- Phe- PCB PCB PCB Total PCT Tetra- Toxa- Tri- Station HCH HCH HCH chlor chlor- chloro- oxy- para- para- diazon nol 1248 1254 1260 PCB 5460 difon phene butyl- Number (Lindane) epoxide benzene chlor thion thion tin _____________________________________________________________________________________________________________________________________________
715.0 ND ND ND ND 41.0 ND ND ND ND 145.2 NA 1304.0 4765.8 496.9 6567.7 ND ND 4198.0 NA 723.4 ND ND ND ND ND ND ND ND ND 605.0 NA ND 3264.5 ND 3264.5 ND ND 5906.3 NA 724.0 ND ND ND ND ND ND ND ND ND ND NA ND 3108.1 ND 3108.1 ND ND ND 89000.0 724.0 ND ND ND ND 33.5 ND ND ND ND 715.4 NA ND 2996.4 ND 2996.2 ND ND 7687.7 NA 725.0 ND ND ND ND ND ND ND ND ND ND NA 3201.8 13399.1 ND 16600.9 ND ND ND 150000.0 725.0 ND ND ND ND ND ND ND ND ND 470.2 NA 4204.8 22223.0 956.5 27381.8 ND ND 6701.7 NA 726.4 ND ND ND ND ND ND ND ND ND 273.2 NA 5847.0 28251.4 ND 34043.7 ND ND ND 340000.0 726.4 ND ND ND ND ND ND ND ND ND 672.1 NA 2331.9 13369.8 449.9 16155.2 ND ND 7909.8 222.8 750.0 ND ND ND ND ND ND ND ND ND 83.3 NA ND 519.2 ND 519.7 ND ND 3165.4 NA 868.5 ND ND ND ND 26.7 ND ND ND ND 135.6 NA ND 2011.0 ND 2011.2 ND ND ND NA _____________________________________________________________________________________________________________________________________________
* RCM = Resident California Mussel SED = Sediment NA = Not Analyzed RBM = Resident Bay Mussel ND = Not Detected TCM = Transplanted California Mussel

N-7
�
�
APPENDIX N (continued) State Mussel Watch Program
Summary of 1993-95 Data: Organic Chemicals in Mussels (ppb, lipid weight) ____________________________________________________________________________________________________________________________________________________________________________________________ Aldrin Chlor- alpha- cis- gamma- trans- cis- trans- Oxy- Total Chlor- Dacthal Diaz- Station Station Sample Sample ben- Chlor- Chlor- Chlor- Chlor- Nona- Nona- chlor- Chlor- pyrifos inon Number Name Type* Date side dene dane dene dane chlor chlor dane dane ____________________________________________________________________________________________________________________________________________________________________________________________ 868.6 Mission Bay/Landfill 2 TCM 01/30/95 ND NA ND 293.0 ND 115.7 271.3 271.3 ND 952.2 ND ND ND 882.0 24th St Maritime Terminal/South TCM 01/31/95 ND NA ND 289.3 ND 147.0 184.7 184.7 37.7 843.1 ND ND ND 883.4 San Diego Bay/Continental Maritime TCM 02/08/94 ND ND ND 239.8 ND 191.8 167.9 215.8 ND 839.3 ND ND ND 894.0 SD Bay/Harbor Is/E Basin/Storm Dr TCM 02/08/94 ND ND 23.9 406.7 ND 406.7 167.5 382.8 ND 1363.6 ND ND ND 894.0 SD Bay/Harbor Is/E Basin/Storm Dr TCM 01/31/95 ND NA 61.2 705.8 63.7 238.8 411.4 411.4 150.1 2043.2 ND ND ND 899.0 San Diego Bay/Shelter Is/Fshg Pier TCM 01/31/95 ND NA ND 166.3 ND 64.2 122.9 122.9 73.3 550.6 ND ND ND _____________________________________________________________________________________________________________________________________________
o,p' p,p' o,p' p,p' o,p' p,p' p,p' p,p' Total Di- Dicofol Diel- Endo- Endo- Endo- Total Endrin Ethion alpha- Station DDD DDD DDE DDE DDT DDT DDMS DDMU DDT Chloro- drin sulfan sulfan sulfan Endo- HCH Number Benzophenone I II sulfate sulfan _____________________________________________________________________________________________________________________________________________
868.6 ND ND ND 672.5 ND 145.8 NA ND 815.7 ND ND 276.3 ND ND ND ND ND ND ND 882.0 ND 192.2 ND 1112.0 ND 241.8 NA ND 1536.9 ND ND 166.8 ND ND ND ND ND ND ND 883.4 ND 215.8 ND 1079.1 ND 239.8 NA ND 1534.8 ND ND 71.9 ND ND ND ND ND ND ND 894.0 669.9 2105.3 ND 741.6 119.6 574.2 NA 311.0 4497.6 ND ND 47.8 ND ND ND ND ND ND ND 894.0 1346.1 3857.9 ND 851.6 245.4 914.5 NA 645.9 7858.6 ND ND 172.4 ND ND ND ND ND ND ND 899.0 ND 170.6 ND 1285.4 ND ND NA 133.0 1583.0 ND ND 111.4 ND ND ND ND ND ND ND _____________________________________________________________________________________________________________________________________________
beta- delta- gamma- Hepta- Hepta- Hexa- Meth- Ethyl- Methyl- Oxa- Phe- PCB PCB PCB Total PCT Tetra- Toxa- Tri- Station HCH HCH HCH chlor chlor- chloro- oxy- para- para- diazon nol 1248 1254 1260 PCB 5460 difon phene butyl- Number (Lindane) epoxide benzene chlor thion thion tin _____________________________________________________________________________________________________________________________________________
868.6 ND ND ND ND 28.6 ND ND ND ND 103.9 NA ND 1864.7 ND 1864.3 ND ND ND NA 882.0 ND ND ND ND ND ND ND ND ND 157.2 NA ND 6282.9 748.0 7029.0 ND ND ND NA 883.4 ND ND ND ND ND ND ND ND ND ND NA ND 7242.2 ND 7242.2 ND ND ND 74000.0 894.0 ND ND 23.9 23.9 ND ND ND ND ND ND NA 96842.1 58947.4 ND 155789.5 ND ND ND 21000.0 894.0 ND ND ND 54.0 37.0 ND ND ND ND 58.3 NA 319289.0 197293.0 5914.9 522955.4 ND ND ND 39.9 899.0 ND ND ND ND ND ND ND ND ND ND NA ND 3969.1 312.1 4276.6 ND ND ND 19.6 _____________________________________________________________________________________________________________________________________________
* RCM = Resident California Mussel SED = Sediment NA = Not Analyzed RBM = Resident Bay Mussel ND = Not Detected TCM = Transplanted California Mussel�

�
O-1
APPENDIX O
Summary of 1993-95 Data
PAHs in Mussels and Sediment
(ppb, wet weight)

O-2
�
�
APPENDIX O State Mussel Watch Program
Summary of 1993-95 Data: PAHs in Mussels and Sediment (ppb, wet weight) __________________________________________________________________________________________________________________________________________________________________________________ Station Station Sample Sample Total Anthracene Anthracene, Anthracene, Biphenyl Chrysene Fluoranthene Number Name Type* Date PAH benz(a) dibenz(a,h) __________________________________________________________________________________________________________________________________________________________________________________ 10.0 Trinidad Head RCM 10/14/93 2.4 ND ND ND ND ND ND 10.0 Trinidad Head RCM 11/28/94 6.3 ND ND ND ND ND ND 100.0 Mad River Slough TCM 02/24/94 6.3 ND ND ND ND ND 1.2 103.0 Eureka Channel TCM 02/24/94 71.9 ND 2.1 ND ND 3.2 6.2 202.0 Bodega Head RCM 09/16/93 4.6 ND ND ND ND ND ND 202.0 Bodega Head RCM 09/19/94 ND ND ND ND ND ND ND 404.0 Sandholdt Bridge TCM 03/07/94 186.7 4.2 2.9 ND ND 4.2 20.0 414.0 Pacific Grove RCM 04/14/94 10.4 ND ND ND ND ND ND 601.0 LA Harbor/National Steel SED 11/09/93 2182.7 53.8 123.7 40.3 10.8 231.3 209.8 601.0 LA Harbor/National Steel TCM 02/08/94 785.7 3.2 12.0 ND ND 21.0 100.0 __________________________________________________________________________________________________________________________________________________________________________________ Station Fluoranthene, Fluoranthene, Fluorene Naphthalene Naphthalene, Naphthalene, Naphthalene, Naphthalene, Naphthene, Number benzo(b) benzo(k) 1-methyl 2-methyl 2,6-dimethyl 2,3,5-trimethyl ace __________________________________________________________________________________________________________________________________________________________________________________ 10.0 ND ND ND 2.4 ND ND ND ND ND 10.0 ND ND ND 1.9 ND 2.2 ND ND ND 100.0 ND ND ND 2.9 ND ND ND ND ND 103.0 ND ND 2.2 3.8 ND 3.7 ND ND 2.1 202.0 ND ND ND 2.7 ND ND ND ND ND 202.0 ND ND ND ND ND ND ND ND ND 404.0 ND ND 4.7 4.3 ND ND 2.2 ND 6.2 414.0 ND ND 2.1 2.7 ND ND ND ND 2.6 601.0 398.1 80.7 12.9 18.3 8.6 27.4 14.5 5.9 9.7 601.0 20.0 4.7 1.9 3.2 ND ND 1.0 ND 3.1 __________________________________________________________________________________________________________________________________________________________________________________ Station Naphthylene, Perylene Perylene, Phenanthrene Phenanthrene, Pyrene Pyrene, Pyrene, Pyrene, Number ace benzo(ghi) 1-methyl benzo(a) benzo(e) indeno(1,2,3-cd) __________________________________________________________________________________________________________________________________________________________________________________ 10.0 ND ND ND ND ND ND ND ND ND 10.0 ND ND ND 2.2 ND ND ND ND ND 100.0 ND ND ND 2.2 ND ND ND ND ND 103.0 ND ND ND 9.6 ND 39.0 ND ND ND 202.0 ND ND ND 1.9 ND ND ND ND ND 202.0 ND ND ND ND ND ND ND ND ND 404.0 ND ND ND 28.0 ND 110.0 ND ND ND 414.0 ND ND ND 3.0 ND ND ND ND ND 601.0 ND 64.6 59.2 96.8 11.3 204.4 236.7 188.3 75.3 601.0 ND 3.3 7.5 5.9 ND 570.0 6.7 19.0 3.2 __________________________________________________________________________________________________________________________________________________________________________________
* RCM = Resident California Mussel SED = Sediment ND = Not Detected TCM = Transplanted California Mussel

O-3
�
�
APPENDIX O (continued) State Mussel Watch Program
Summary of 1993-95 Data: PAHs in Mussels and Sediment (ppb, wet weight) __________________________________________________________________________________________________________________________________________________________________________________ Station Station Sample Sample Total Anthracene Anthracene, Anthracene, Biphenyl Chrysene Fluoranthene Number Name Type* Date PAH benz(a) dibenz(a,h) __________________________________________________________________________________________________________________________________________________________________________________ 605.0 LA Harbor/Cabrillo Pier SED 11/09/93 1017.9 22.5 43.6 16.3 5.7 71.8 100.6 605.0 LA Harbor/Cabrillo Pier TCM 02/08/94 185.3 2.9 3.5 ND ND 7.9 34.0 616.0 LA Harbor/Consolidated Slip SED 11/09/93 4809.0 206.1 320.6 45.8 26.1 503.8 595.4 616.0 LA Harbor/Consolidated Slip TCM 02/08/94 1443.5 3.2 22.0 ND ND 41.0 120.0 713.0 Huntington Harbour/Edinger Street TCM 02/07/94 26.6 ND ND ND ND 6.5 8.1 715.0 Huntington Harbour/Warner Ave Brdg TCM 02/07/94 92.8 ND 5.0 ND ND 4.9 7.1 724.0 Newport Bay/Highway 1 Bridge TCM 02/07/94 118.1 1.1 2.7 ND ND 5.1 8.2 725.0 Newport Bay/Crows Nest TCM 02/07/94 77.5 ND 1.6 ND ND 3.6 6.0 726.4 Newport Bay/Rhine Channel/End TCM 02/07/94 125.5 ND 1.6 ND ND 4.3 8.3 868.5 Mission Bay/Landfill 1 TCM 01/30/95 66.9 ND 2.0 ND ND 4.5 6.7 __________________________________________________________________________________________________________________________________________________________________________________ Station Fluoranthene, Fluoranthene, Fluorene Naphthalene Naphthalene, Naphthalene, Naphthalene, Naphthalene, Naphthene, Number benzo(b) benzo(k) 1-methyl 2-methyl 2,6-dimethyl 2,3,5-trimethyl ace __________________________________________________________________________________________________________________________________________________________________________________ 605.0 110.2 35.9 5.3 10.1 11.0 23.5 20.6 24.4 ND 605.0 3.3 ND 3.1 3.5 ND ND ND ND 4.2 616.0 503.8 123.7 50.4 64.1 33.9 109.9 50.4 36.2 28.9 616.0 32.0 7.4 4.9 3.9 ND 6.2 4.5 8.4 4.2 713.0 ND ND ND 3.9 ND 3.9 ND ND ND 715.0 ND ND ND 3.8 ND 2.3 ND ND ND 724.0 ND ND ND 3.0 ND 2.7 1.1 1.4 ND 725.0 ND ND ND 2.5 ND ND ND ND ND 726.4 3.4 0.9 0.8 2.7 ND 1.6 ND 1.0 ND 868.5 ND ND ND 6.7 5.9 25.5 3.1 ND ND __________________________________________________________________________________________________________________________________________________________________________________ Station Naphthylene, Perylene Perylene, Phenanthrene Phenanthrene, Pyrene Pyrene, Pyrene, Pyrene, Number ace benzo(ghi) 1-methyl benzo(a) benzo(e) indeno(1,2,3-cd) __________________________________________________________________________________________________________________________________________________________________________________ 605.0 ND 167.6 29.7 36.4 8.1 110.2 71.8 67.1 25.4 605.0 ND 2.4 2.4 8.1 ND 110.0 ND ND ND 616.0 ND 91.6 123.7 329.8 39.8 778.6 325.2 338.9 82.4 616.0 ND 5.8 9.3 13.0 6.5 1100.0 12.0 34.0 5.2 713.0 ND ND ND 4.2 ND ND ND ND ND 715.0 ND ND ND 2.7 ND 67.0 ND ND ND 724.0 ND ND ND 4.3 ND 81.0 2.6 2.5 2.4 725.0 ND ND ND 3.2 ND 59.0 ND ND 1.6 726.4 ND ND 2.3 3.5 ND 94.0 1.1 ND ND 868.5 1.1 ND ND 5.9 ND 5.7 ND ND ND __________________________________________________________________________________________________________________________________________________________________________________
* RCM = Resident California Mussel SED = Sediment ND = Not Detected TCM = Transplanted California Mussel

O-4
�
�
APPENDIX O (continued) State Mussel Watch Program
Summary of 1993-95 Data: PAHs in Mussels and Sediment (ppb, wet weight) __________________________________________________________________________________________________________________________________________________________________________________ Station Station Sample Sample Total Anthracene Anthracene, Anthracene, Biphenyl Chrysene Fluoranthene Number Name Type* Date PAH benz(a) dibenz(a,h) __________________________________________________________________________________________________________________________________________________________________________________ 868.6 Mission Bay/Landfill 2 TCM 01/30/95 54.2 ND ND ND ND 3.0 5.7 883.1 San Diego Bay/Chollas Creek TCM 02/08/94 4273.4 64.0 86.0 ND 2.7 81.0 560.0 883.8 San Diego Bay/Switzer Creek TCM 02/08/94 477.4 6.2 8.9 ND ND 15.0 83.0 __________________________________________________________________________________________________________________________________________________________________________________ Station Fluoranthene, Fluoranthene, Fluorene Naphthalene Naphthalene, Naphthalene, Naphthalene, Naphthalene, Naphthene, Number benzo(b) benzo(k) 1-methyl 2-methyl 2,6-dimethyl 2,3,5-trimethyl ace __________________________________________________________________________________________________________________________________________________________________________________ 868.6 ND ND ND 8.3 4.9 20.3 2.6 ND ND 883.1 56.0 13.0 35.0 3.9 ND 8.6 4.8 ND 25.0 883.8 8.2 2.3 3.1 3.0 ND 2.0 ND ND 3.5 __________________________________________________________________________________________________________________________________________________________________________________ Station Naphthylene, Perylene Perylene, Phenanthrene Phenanthrene, Pyrene Pyrene, Pyrene, Pyrene, Number ace benzo(ghi) 1-methyl benzo(a) benzo(e) indeno(1,2,3-cd) __________________________________________________________________________________________________________________________________________________________________________________ 868.6 1.1 ND ND 3.7 ND 4.7 ND ND ND 883.1 1.3 8.2 9.7 250.0 ND 3000.0 18.0 38.0 8.2 883.8 ND ND 3.1 19.0 ND 310.0 2.4 5.6 2.1 __________________________________________________________________________________________________________________________________________________________________________________
* RCM = Resident California Mussel SED = Sediment ND = Not Detected TCM = Transplanted California Mussel

P-1
APPENDIX P
Summary of 1993-95 Data
PAHs in Mussels and Sediment
(ppb, dry weight)

P-2
APPENDIX P State Mussel Watch Program
Summary of 1993-95 Data: PAHs in Mussels and Sediment (ppb, wet weight) __________________________________________________________________________________________________________________________________________________________________________________ Station Station Sample Sample Total Anthracene Anthracene, Anthracene, Biphenyl Chrysene Fluoranthene Number Name Type* Date PAH benz(a) dibenz(a,h) __________________________________________________________________________________________________________________________________________________________________________________
__________________________________________________________________________________________________________________________________________________________________________________ * RCM = Resident California Mussel SED = Sediment ND = Not Detected TCM = Transplanted California Mussel
10.0 Trinidad Head RCM 10/14/93 15.0 ND ND ND ND ND ND 10.0 Trinidad Head RCM 11/28/94 31.3 ND ND ND ND ND ND 100.0 Mad River Slough TCM 02/24/94 60.0 ND ND ND ND ND 11.0 103.0 Eureka Channel TCM 02/24/94 245.0 ND 13.0 ND ND 20.0 39.0 202.0 Bodega Head RCM 09/16/93 29.0 ND ND ND ND ND ND 202.0 Bodega Head RCM 09/19/94 ND ND ND ND ND ND ND 404.0 Sandholdt Bridge TCM 03/07/94 556.0 24.0 17.0 ND ND 24.0 110.0 414.0 Pacific Grove RCM 04/14/94 69.0 ND ND ND ND ND ND 601.0 LA Harbor/National Steel SED 11/09/93 4057.0 100.0 230.0 75.0 20.0 430.0 390.0 601.0 LA Harbor/National Steel TCM 02/08/94 2714.0 32.0 120.0 ND ND 210.0 990.0 __________________________________________________________________________________________________________________________________________________________________________________
Station Fluoranthene, Fluoranthene, Fluorene Naphthalene Naphthalene, Naphthalene, Naphthalene, Naphthalene, Naphthene, Number benzo(b) benzo(k) 1-methyl 2-methyl 2,6-dimethyl 2,3,5-trimethyl ace __________________________________________________________________________________________________________________________________________________________________________________
10.0 ND ND ND 15.0 ND ND ND ND ND 10.0 ND ND ND 9.3 ND 11.0 ND ND ND 100.0 ND ND ND 28.0 ND ND ND ND ND 103.0 ND ND 14.0 24.0 ND 23.0 ND ND 13.0 202.0 ND ND ND 17.0 ND ND ND ND ND 202.0 ND ND ND ND ND ND ND ND ND 404.0 ND ND 27.0 25.0 ND ND 13.0 ND 36.0 414.0 ND ND 14.0 18.0 ND ND ND ND 17.0 601.0 740.0 150.0 24.0 34.0 16.0 51.0 27.0 11.0 18.0 601.0 200.0 47.0 19.0 32.0 ND ND 10.0 ND 31.0 __________________________________________________________________________________________________________________________________________________________________________________
Station Naphthylene, Perylene Perylene, Phenanthrene Phenanthrene, Pyrene Pyrene, Pyrene, Pyrene, Number ace benzo(ghi) 1-methyl benzo(a) benzo(e) indeno(1,2,3-cd) __________________________________________________________________________________________________________________________________________________________________________________
10.0 ND ND ND ND ND ND ND ND ND 10.0 ND ND ND 11.0 ND ND ND ND ND 100.0 ND ND ND 21.0 ND ND ND ND ND 103.0 ND ND ND 60.0 ND 39.0 ND ND ND 202.0 ND ND ND 12.0 ND ND ND ND ND 202.0 ND ND ND ND ND ND ND ND ND 404.0 ND ND ND 170.0 ND 110.0 ND ND ND 414.0 ND ND ND 20.0 ND ND ND ND ND 601.0 ND 120.0 110.0 180.0 21.0 380.0 440.0 350.0 140.0 601.0 ND 33.0 74.0 58.0 ND 570.0 66.0 190.0 32.0

P-3
APPENDIX P (continued) State Mussel Watch Program
Summary of 1993-95 Data: PAHs in Mussels and Sediment (ppb, wet weight) __________________________________________________________________________________________________________________________________________________________________________________ Station Station Sample Sample Total Anthracene Anthracene, Anthracene, Biphenyl Chrysene Fluoranthene Number Name Type* Date PAH benz(a) dibenz(a,h) __________________________________________________________________________________________________________________________________________________________________________________
__________________________________________________________________________________________________________________________________________________________________________________ * RCM = Resident California Mussel SED = Sediment ND = Not Detected TCM = Transplanted California Mussel
605.0 LA Harbor/Cabrillo Pier SED 11/09/93 2125.0 47.0 91.0 34.0 12.0 150.0 210.0 605.0 LA Harbor/Cabrillo Pier TCM 02/08/94 525.0 16.0 19.0 ND ND 43.0 190.0 616.0 LA Harbor/Consolidated Slip SED 11/09/93 10500.0 450.0 700.0 100.0 57.0 1100.0 1300.0 616.0 LA Harbor/Consolidated Slip TCM 02/08/94 4552.0 32.0 220.0 ND ND 410.0 1200.0 713.0 Huntington Harbour/Edinger Street TCM 02/07/94 226.0 ND ND ND ND 55.0 69.0 715.0 Huntington Harbour/Warner Ave Brdg TCM 02/07/94 278.0 ND 41.0 ND ND 40.0 58.0 724.0 Newport Bay/Highway 1 Bridge TCM 02/07/94 466.0 11.0 28.0 ND ND 53.0 85.0 725.0 Newport Bay/Crows Nest TCM 02/07/94 249.0 ND 16.0 ND ND 37.0 62.0 726.4 Newport Bay/Rhine Channel/End TCM 02/07/94 478.0 ND 20.0 ND ND 53.0 100.0 868.5 Mission Bay/Landfill 1 TCM 01/30/95 341.5 ND 10.0 ND ND 23.0 34.0 __________________________________________________________________________________________________________________________________________________________________________________
Station Fluoranthene, Fluoranthene, Fluorene Naphthalene Naphthalene, Naphthalene, Naphthalene, Naphthalene, Naphthene, Number benzo(b) benzo(k) 1-methyl 2-methyl 2,6-dimethyl 2,3,5-trimethyl ace __________________________________________________________________________________________________________________________________________________________________________________
605.0 230.0 75.0 11.0 21.0 23.0 49.0 43.0 51.0 ND 605.0 18.0 ND 17.0 19.0 ND ND ND ND 23.0 616.0 1100.0 270.0 110.0 140.0 74.0 240.0 110.0 79.0 63.0 616.0 320.0 75.0 49.0 39.0 ND 63.0 45.0 85.0 42.0 713.0 ND ND ND 33.0 ND 33.0 ND ND ND 715.0 ND ND ND 31.0 ND 19.0 ND ND ND 724.0 ND ND ND 31.0 ND 28.0 11.0 15.0 ND 725.0 ND ND ND 26.0 ND ND ND ND ND 726.4 41.0 11.0 10.0 33.0 ND 19.0 ND 12.0 ND 868.5 ND ND ND 34.0 30.0 130.0 16.0 ND ND __________________________________________________________________________________________________________________________________________________________________________________
Station Naphthylene, Perylene Perylene, Phenanthrene Phenanthrene, Pyrene Pyrene, Pyrene, Pyrene, Number ace benzo(ghi) 1-methyl benzo(a) benzo(e) indeno(1,2,3-cd) __________________________________________________________________________________________________________________________________________________________________________________
605.0 ND 350.0 62.0 76.0 17.0 230.0 150.0 140.0 53.0 605.0 ND 13.0 13.0 44.0 ND 110.0 ND ND ND 616.0 ND 200.0 270.0 720.0 87.0 1700.0 710.0 740.0 180.0 616.0 ND 59.0 94.0 130.0 66.0 1100.0 120.0 350.0 53.0 713.0 ND ND ND 36.0 ND ND ND ND ND 715.0 ND ND ND 22.0 ND 67.0 ND ND ND 724.0 ND ND ND 45.0 ND 81.0 27.0 26.0 25.0 725.0 ND ND ND 33.0 ND 59.0 ND ND 16.0 726.4 ND ND 28.0 43.0 ND 94.0 14.0 ND ND 868.5 5.5 ND ND 30.0 ND 29.0 ND ND ND

P-4
APPENDIX P (continued) State Mussel Watch Program
Summary of 1993-95 Data: PAHs in Mussels and Sediment (ppb, wet weight) __________________________________________________________________________________________________________________________________________________________________________________ Station Station Sample Sample Total Anthracene Anthracene, Anthracene, Biphenyl Chrysene Fluoranthene Number Name Type* Date PAH benz(a) dibenz(a,h) __________________________________________________________________________________________________________________________________________________________________________________
__________________________________________________________________________________________________________________________________________________________________________________ * RCM = Resident California Mussel SED = Sediment ND = Not Detected TCM = Transplanted California Mussel
868.6 Mission Bay/Landfill 2 TCM 01/30/95 267.2 ND ND ND ND 15.0 28.0 883.1 San Diego Bay/Chollas Creek TCM 02/08/94 16115.0 650.0 870.0 ND 28.0 830.0 5800.0 883.8 San Diego Bay/Switzer Creek TCM 02/08/94 1767.0 54.0 77.0 ND ND 130.0 720.0 __________________________________________________________________________________________________________________________________________________________________________________
Station Fluoranthene, Fluoranthene, Fluorene Naphthalene Naphthalene, Naphthalene, Naphthalene, Naphthalene, Naphthene, Number benzo(b) benzo(k) 1-methyl 2-methyl 2,6-dimethyl 2,3,5-trimethyl ace __________________________________________________________________________________________________________________________________________________________________________________
868.6 ND ND ND 41.0 24.0 100.0 13.0 ND ND 883.1 570.0 130.0 350.0 40.0 ND 88.0 49.0 ND 260.0 883.8 71.0 20.0 27.0 26.0 ND 17.0 ND ND 30.0 __________________________________________________________________________________________________________________________________________________________________________________
Station Naphthylene, Perylene Perylene, Phenanthrene Phenanthrene, Pyrene Pyrene, Pyrene, Pyrene, Number ace benzo(ghi) 1-methyl benzo(a) benzo(e) indeno(1,2,3-cd) __________________________________________________________________________________________________________________________________________________________________________________
868.6 5.2 ND ND 18.0 ND 23.0 ND ND ND 883.1 13.0 84.0 99.0 2600.0 ND 3000.0 180.0 390.0 84.0 883.8 ND ND 27.0 170.0 ND 310.0 21.0 49.0 18.0

Q-1
APPENDIX Q
Summary of 1993-95 Data
PAHs in Mussels
(ppb, lipid weight)

Q-2
APPENDIX Q State Mussel Watch Program
Summary of 1993-95 Data: PAHs in Mussels and Sediment (ppb, wet weight) __________________________________________________________________________________________________________________________________________________________________________________ Station Station Sample Sample Total Anthracene Anthracene, Anthracene, Biphenyl Chrysene Fluoranthene Number Name Type* Date PAH benz(a) dibenz(a,h) __________________________________________________________________________________________________________________________________________________________________________________
__________________________________________________________________________________________________________________________________________________________________________________ * RCM = Resident California Mussel ND = Not Detected TCM = Transplanted California Mussel
10.0 Trinidad Head RCM 10/14/93 310.0 ND ND ND ND ND ND 10.0 Trinidad Head RCM 11/28/94 726.0 ND ND ND ND ND ND 100.0 Mad River Slough TCM 02/24/94 1410.0 ND ND ND ND ND 270.0 103.0 Eureka Channel TCM 02/24/94 8290.0 ND 240.0 ND ND 370.0 720.0 202.0 Bodega Head RCM 09/16/93 580.0 ND ND ND ND ND ND 202.0 Bodega Head RCM 09/19/94 ND ND ND ND ND ND ND 404.0 Sandholdt Bridge TCM 03/07/94 20320.0 460.0 310.0 ND ND 460.0 2100.0 414.0 Pacific Grove RCM 04/14/94 1980.0 ND ND ND ND ND ND 601.0 LA Harbor/National Steel TCM 02/08/94 149139.0 640.0 2400.0 ND ND 4100.0 20000.0 605.0 LA Harbor/Cabrillo Pier TCM 02/08/94 18280.0 280.0 340.0 ND ND 760.0 3300.0 __________________________________________________________________________________________________________________________________________________________________________________ Station Fluoranthene, Fluoranthene, Fluorene Naphthalene Naphthalene, Naphthalene, Naphthalene, Naphthalene, Naphthene, Number benzo(b) benzo(k) 1-methyl 2-methyl 2,6-dimethyl 2,3,5-trimethyl ace __________________________________________________________________________________________________________________________________________________________________________________ 10.0 ND ND ND 310.0 ND ND ND ND ND 10.0 ND ND ND 216.0 ND 255.0 ND ND ND 100.0 ND ND ND 650.0 ND ND ND ND ND 103.0 ND ND 250.0 440.0 ND 430.0 ND ND 240.0 202.0 ND ND ND 340.0 ND ND ND ND ND 202.0 ND ND ND ND ND ND ND ND ND 404.0 ND ND 510.0 470.0 ND ND 240.0 ND 670.0 414.0 ND ND 400.0 510.0 ND ND ND ND 500.0 601.0 3900.0 940.0 380.0 640.0 ND ND 200.0 ND 620.0 605.0 320.0 ND 300.0 340.0 ND ND ND ND 400.0 __________________________________________________________________________________________________________________________________________________________________________________ Station Fluoranthene, Fluoranthene, Fluorene Naphthalene Naphthalene, Naphthalene, Naphthalene, Naphthalene, Naphthene, Number benzo(b) benzo(k) 1-methyl 2-methyl 2,6-dimethyl 2,3,5-trimethyl ace __________________________________________________________________________________________________________________________________________________________________________________ 10.0 ND ND ND ND ND ND ND ND ND 10.0 ND ND ND 255.0 ND ND ND ND ND 100.0 ND ND ND 490.0 ND ND ND ND ND 103.0 ND ND ND 1100.0 ND 4500.0 ND ND ND 202.0 ND ND ND 240.0 ND ND ND ND ND 202.0 ND ND ND ND ND ND ND ND ND 404.0 ND ND ND 3100.0 ND 12000.0 ND ND ND 414.0 ND ND ND 570.0 ND ND ND ND ND 601.0 ND 660.0 1500.0 1200.0 ND 110000.0 1300.0 19.0 640.0 605.0 ND 230.0 230.0 780.0 ND 11000.0 ND ND ND

Q-3
APPENDIX Q (continued) State Mussel Watch Program
Summary of 1993-95 Data: PAHs in Mussels and Sediment (ppb, wet weight) __________________________________________________________________________________________________________________________________________________________________________________ Station Station Sample Sample Total Anthracene Anthracene, Anthracene, Biphenyl Chrysene Fluoranthene Number Name Type* Date PAH benz(a) dibenz(a,h) __________________________________________________________________________________________________________________________________________________________________________________
__________________________________________________________________________________________________________________________________________________________________________________ * RCM = Resident California Mussel ND = Not Detected TCM = Transplanted California Mussel
616.0 LA Harbor/Consolidated Slip TCM 02/08/94 324234.0 770.0 5200.0 ND ND 9700.0 29000.0 713.0 Huntington Harbour/Edinger Street TCM 02/07/94 6010.0 ND ND ND ND 1500.0 1800.0 715.0 Huntington Harbour/Warner Ave Brdg TCM 02/07/94 16680.0 ND 900.0 ND ND 880.0 1300.0 724.0 Newport Bay/Highway 1 Bridge TCM 02/07/94 31402.5 300.0 730.0 ND ND 1400.0 2200.0 725.0 Newport Bay/Crows Nest TCM 02/07/94 17040.0 ND 350.0 ND ND 790.0 1300.0 726.4 Newport Bay/Rhine Channel/End TCM 02/07/94 68220.0 ND 870.0 ND ND 2300.0 4500.0 868.5 Mission Bay/Landfill 1 TCM 01/30/95 6733.0 ND 197.0 ND ND 454.0 670.0 868.6 Mission Bay/Landfill 2 TCM 01/30/95 4445.0 ND ND ND ND 249.0 466.0 883.1 San Diego Bay/Chollas Creek TCM 02/08/94 324234.0 53000.0 71000.0 ND 2200.0 67000.0 470000.0 883.8 San Diego Bay/Switzer Creek TCM 02/08/94 560105.6 7300.0 10000.0 ND ND 18000.0 97000.0 __________________________________________________________________________________________________________________________________________________________________________________ Station Fluoranthene, Fluoranthene, Fluorene Naphthalene Naphthalene, Naphthalene, Naphthalene, Naphthalene, Naphthene, Number benzo(b) benzo(k) 1-methyl 2-methyl 2,6-dimethyl 2,3,5-trimethyl ace __________________________________________________________________________________________________________________________________________________________________________________ 616.0 7700.0 1800.0 1200.0 930.0 ND 1500.0 1100.0 2000.0 1000.0 713.0 ND ND ND 880.0 ND 880.0 ND ND ND 715.0 ND ND ND 690.0 ND 420.0 ND ND ND 724.0 ND ND ND 810.0 ND 730.0 300.0 380.0 ND 725.0 ND ND ND 550.0 ND ND ND ND ND 726.4 1900.0 490.0 440.0 1500.0 ND 870.0 ND 550.0 ND 868.5 ND ND ND 670.0 592.0 2563.0 316.0 ND ND 868.6 ND ND ND 682.0 399.0 1664.0 216.0 ND ND 883.1 46000.0 11000.0 29000.0 3200.0 ND 7100.0 4000.0 ND 21000.0 883.8 9600.0 2700.0 3600.0 3500.0 ND 2400.0 ND ND 4100.0 __________________________________________________________________________________________________________________________________________________________________________________ Station Fluoranthene, Fluoranthene, Fluorene Naphthalene Naphthalene, Naphthalene, Naphthalene, Naphthalene, Naphthene, Number benzo(b) benzo(k) 1-methyl 2-methyl 2,6-dimethyl 2,3,5-trimethyl ace __________________________________________________________________________________________________________________________________________________________________________________ 616.0 ND 1400.0 2200.0 3000.0 1600.0 250000.0 2900.0 34.0 1200.0 713.0 ND ND ND 950.0 ND ND ND ND ND 715.0 ND ND ND 490.0 ND 12000.0 ND ND ND 724.0 ND ND ND 1200.0 ND 22000.0 700.0 2.5 650.0 725.0 ND ND ND 700.0 ND 13000.0 ND ND 350.0 726.4 ND ND 1300.0 1900.0 ND 51000.0 600.0 ND ND 868.5 108.0 ND ND 592.0 ND 571.0 ND ND ND 868.6 87.0 ND ND 299.0 ND 383.0 ND ND ND 883.1 1100.0 6800.0 8000.0 210000.0 ND 2500000.0 15000.0 38.0 6800.0 883.8 ND ND 3600.0 23000.0 ND 370000.0 2800.0 5.6 2500.0

R-1
APPENDIX R
Field and Laboratory Operations

R-2
FIELD AND LABORATORY OPERATIONS
Sample Collection
The State Mussel Watch Program (SMWP) collects about 100 mussels at each station, which are randomly divided into two groups for trace element and synthetic organic chemical analysis. Based on recommendations by Goldberg (1980) and Risebrough et al. (1980), the SMWP samples 45 mussels, three replicates of 15 individuals each, for trace elements at each site. Trace element results in the SMWP represent a mean value for the three replicates. A single replicate of 45 composited individuals is analyzed for synthetic organic compounds. Mussels of 55 to 65 mm in length are collected wherever possible in order to reduce size related effects. Mussels are collected from the highest tidal height where they occur in adequate numbers to reduce variability induced by habitat height. Stainless steel pry bars are used to collect mussels off rocks. The pry bars are cleaned and rinsed in the laboratory and rinsed again with seawater prior to use. At locations where mussels are unavailable and sampling can be accomplished using scuba equipment, transplanted samples are used. The mussel transplant system used is one of the following three systems; 1) In an area of deep water and no structures, a bottom anchored submerged buoy system is used; 2) In areas with structures (ie. pilings, floating docks, etc.), a polypropylene line may be tied between two pilings or a line hung beneath a dock; 3) In areas of shallow water, samples may be placed on PVC or wooden stakes that are pounded into the substrate. Transplanted mussels are placed in polypropylene mesh bags and kept cool in ice chests for no more than 48 hours prior to deployment. To minimize the risk of contamination of the mussel from boat exhaust or surface film during deployment or retrieval, mussel samples are placed in polyethylene bags, where they remain until submerged and deployed. Upon retrieval from the subsurface buoy system, samples are again placed in polyethylene bags before being brought through the air-water interface. Once collected, the transplants are triple bagged. To minimize contamination caused by handling the mussel samples, polyethylene gloves are worn during collection, as well as processing, of mussel samples. A two month transplant period is adequate in most cases where pollutant uptake rates are expected to be high, but for trace elements in less contaminated environments, a six month interval may be necessary for an adequate sample (Stephenson et al. 1980). A four to six month transplant interval is used for organic chemicals to be consistent with transplant periods for trace elements. Mussels to be analyzed for trace elements are placed in a ZIPLOCK
R polyethylene bag
of 4 mm thickness. The samples are placed inside two additional polyethylene ZIPLOCK
R bags. Mussels to be analyzed for synthetic organic compounds are placed
in a bag constructed of two layers of "heavy duty" aluminum foil. Prior to use, the foil is cleaned by heating to 500
o C or by rinsing in hexane. Samples in the foil bags are
placed in two polyethylene ZIPLOCKR bags. After bagging, all samples are placed in
non-metallic ice chests and frozen using dry ice and stored at or below -20o C until
processed.
Laboratory Analysis
A detailed description of procedures and techniques discussed below can be found in the Department of Fish and Game's (DFG) Laboratory Quality Assurance Program Plan (DFG 1990). The following is a summary of the 1993-94 and 1994-95 Quality Assurance/Quality Control (QA\QC) results provided by the DFG's Water Pollution Control and Moss Landing Laboratories. Copies of the Laboratory Quality Assurance Program Plan and QA\QC results are available upon request.

R-3
Trace Elements Analytical Techniques in Tissue and Sediment The following procedures were employed for mussel dissection and homogenization for trace element analysis: Frozen mussels were removed individually from the bags, cleaned of epiphytic organisms and debris under running deionized water by personnel wearing polyethylene gloves, and allowed to thaw in clean polyethylene trays. Adductor muscles were severed and gonads removed with a MICRO
R-cleaned stainless steel
scalpel. Gonads were removed from mussels to reduce variability in trace element concentrations due to the sex of the organism (Stephenson et al. 1987). The remainder of the soft part was placed in a pre-weighted, acid-cleaned polypropylene 4 oz. jar and re-weighed. The shell lengths were also taken at this time. Samples were then homogenized to a paste-like consistency in the jars using a Brinkmann Polytron (Model PT10-35) equipped with a titanium generator (Model PTA 20). The homogenized samples were then refrozen at -20
o C until analyzed.
A Perkin-Elmer Model 2280 spectrophotometer with deuterium arc background corrector and digital display was used for techniques employing conventional (flame) atomic absorption spectrophotometry (Al, Cd, Cu, Mn, Zn) and cold vapor technique for mercury. A Perkin-Elmer Model 3030 Zeeman atomic absorption spectrophotometer equipped with an HGA-600 graphite furnace and an AS-60 autosampler was used for techniques requiring a graphite furnace (Ag, As, Cr, Ni, Pb, Se). All analytical values were corrected using procedural blanks. Trace element detection limits are presented in Table R-1 The technique used for digesting samples was known as "teflon vessel digestion". Separate techniques were performed on sediments and tissues in the "teflon vessel digestion" technique. The "teflon vessel digestion" technique for tissue and sediment were performed as follows: Samples were weighed into pre-cleaned 125 ml teflon digestion vessels. Three grams of tissue and one gram of sediment were used. Digestion of each tissue sample was accomplished by adding a 4:1 concentrated HNO3: 3 ml concentrated HClO4 mixture and heating the sample on a warm (≈75
o) hotplate 2-3 hours. After the
initial reaction, the teflon vessel was capped and heated in a 130o C oven for four
hours. Once the digestate had cooled it was transferred to a clean polyethylene bottle and diluted up to 20 ml with Type ll water. Sediment samples were digested using the same mixture as tissue samples except, instead of warming on a hotplate, sediment samples were heated in a 130
o C oven for four hours. After the initial reaction, 3 ml of
hydrofluoric acid was added to the sediment sample and the teflon vessel returned to a 130
o C oven for 12 hours. Twenty ml of boric acid (2.5%) was added to each sediment
sample before again returning to a 130o C oven for another 8 hours. Once the
digestate was cool it was transferred to a clean polyethylene bottle and brought up to 20 ml with Type ll water. To protect sample integrity, all materials contacting samples during laboratory operations were analyzed for trace element content. To ensure accuracy, reference materials from the National Bureau of Standards (NBS) were analyzed (Table R-2). Synthetic Organic Compounds Analytical Techniques in Tissues A 50 gram sample of tissue was spiked with a surrogate mixture of 4,4'-dibromo-octafluorobiphenyl, decachlorobiphenyl, and dibutylchlorendate (DBOB, DCB, DBCE) and extracted twice with acetonitrile by shaking for two hours. The sample extracts were combined, filtered, and partitioned with petroleum ether. An aliquot of the petroleum ether extract was eluted through a Florisil
R column. The Florisil
R columns were eluted

R-4
with petroleum ether (Fraction 1), six percent ethyl ether/petroleum ether (Fraction 2), and 15 percent ethyl ether/petroleum ether (Fraction 3). Fractions 2 and 3 were spiked with decachlorobiphenyl and all of the fractions were concentrated to an appropriate volume in a Zymark
R Turbovap concentrator prior to analysis by gas chromatography.
The DCB was used as a surrogate to determine analyte recovery of the F1 compounds and to determine relative retention times for all fractions. DBOB was used to check the analyte recovery of the F2 compounds but was found to elute with the F1 compounds. DBCE was used to check the analyte recovery of the F3 compounds. The percent recoveries for the surrogate compounds are listed in Table R-3 for 1994 and Table R-4 for 1995. A mixture of synthetic standards was eluted through the Florisil
R column to
determine the recovery and separation characteristics of the column. The distribution of synthetic organic compounds in the three fractions is listed in Table R-5. The detection limits for synthetic organics in mussels are presented in Table R-6. At stations where the SMWP had previously detected endosulfan, samples were analyzed for endosulfan I, endosulfan II, and endosulfan sulfate. This required an additional elution through Florisil
R with 50 percent ethyl ether/petroleum ether (Fraction
4, Table R-5). All other stations were analyzed for endosulfan I only. This fraction was also spiked with decachlorobiphenyl prior to the concentration step. Due to the high lipid content of the fraction all of the 50 percent extracts were diluted with iso-octane by a factor of ten prior to analysis by gas chromatography. Two mussel samples were spiked with a solution containing known concentrations of target analytes to asses accuracy and matrix effects. Percent recoveries of the target analytes from the matrix spike are listed in Table R-7. Ten percent of the samples were analyzed in duplicate. Table R- 8 lists duplicate sample results. A method blank representative of all materials and solutions contacting the sample was analyzed for contamination. To preclude errors due to contamination, a vertical solvent was blank analyzed for each set of glassware before introducing a new sample. Synthetic Organic Compounds Analytical Techniques in Sediment In 1994, approximately 30 grams of each sediment sample was spiked with a surrogate mixture of DBOB, DCB and DBCE. After adding approximately 200 ml of a 1:1 solution of acetone:dichloromethane, the sample was extracted with an orbital shaker for two hours at 300 rpm. These steps were repeated after the sample was filtered. After evaporating and exchanging solvents, the sample extract was eluted through a Florisil
R
column using the four solvent mixtures (F1, F2, F3 and F4). In 1995, the method for analyzing synthetic organics in sediments was modified. Twenty grams of sediment was dried by mixing with sodium sulfate. After adding 200 ml of 1:1 solution of hexane/acetone, each sample was spiked with 1 ml of the DBOB, DCB and DBCE solution. The samples were then placed on an orbital shaker for two hours at 300 rpm. The sample was filtered, re-extracted with fresh solvent, and the extracts were combined. After evaporating and exchanging solvents, the sample extract was eluted through a Florisil
R column with petroleum ether (Fraction 1) and a
solution of 50% ethyl ether/petroleum ether (Fraction 2). Sediment detection limits are listed in Table R-6. Duplicate sample analysis results are listed in Table R-9.

R-5
Instrument and Analytical Conditions for Chlorinated Hydrocarbons Chlorinated hydrocarbons were determined with a Varian Model 3500 gas chromatograph equipped with a Model 8035 autosampler, temperature programmable on-column injector, and dual Ni
63 electron capture detectors. A 5 meter J&W DB5
fused silica capillary pre-column is connected to the temperature programmable injector, the column effluent is split using a press-fit "Y" connector to a 60 meter J&W DB5 and a 60 meter J&W DB17 column. The DB5 and DB17 columns are connected to the electron capture detectors. All three columns have a 0.25 mm ID and a 25 µm liquid phase thickness. Helium was used as the carrier gas at a linear velocity of 35 cm/sec and nitrogen was used as the detector makeup gas at a flow of 25 ml/min. Chromatographic data was acquired and processed with a Hewlett-Packard Chem-Station, version A.03.02. All samples were analyzed using a single injection for each extract under the following conditions: _____________________________________________________________________ Injector temperature program: Initial temperature - 70
oC
Program rate - 300 oC/min
Final temperature - 280oC
Final temperature hold time - 70 min Column temperature program: Initial temperature - 70
oC
Program rate 1 - 15oC/min to 210
oC
Program 1 hold time - 10 min Program rate 2 - 2
oC/min to 280
oC
Final temperature hold time - 11 min Detector temperature: 330
oC
_____________________________________________________________________
Analytical Techniques for Polynuclear Aromatic Hydrocarbon Compounds (PAHs) in Flesh
A 20 gram tissue sample was dried with sodium sulfate, spiked with a surrogate mixture of deuterated PAH compounds and extracted with dichloromethane. Sample extracts were cleaned up using gel permeation chromatography followed by alumina and silica gel chromatography. Sample extracts were analyzed using a Varian Saturn II Ion Trap GC-MS. One microliter of sample extract was injected into a J&W Scientific DB-5MS, 30 meter x 0.25 mm I.D. fused silica capillary column with a 0.25 µm film thickness. The GC oven temperature was initially held at 70
oC for two minutes. The temperature ramp was
15oC per minute until the oven reached 150
oC. The second temperature ramp was 2
oC
per minute to a final temperature of 280oC and held for 5 minutes. Initial injector
temperature was 70o and was programmed to 280
o at 300
o/min immediately after
injection. The GC carrier gas was helium at a linear velocity of 37 cm/sec. Detection limits of the PAHs are reported in Table R-10. Results of duplicate analyses for PAHs in mussel and sediment are listed in Tables R-11, R-12, and R-13. Matrix spike recoveries for mussel tissue and sediment are listed in Table R-14.

R-6
Analytical Techniques for Tributyltin (TBT)
Tributyltin was extracted from tissues by mixing 10 g of tissue, 10 ml of 50% HCL, and 25 ml of methylene chloride for 15 hours. The mix was then centrifuged for five minutes. The methylene chloride was removed and evaporated under a stream of air and the residue was dissolved in hexane. The hexane was washed in a 3% NaOH solution to remove all monobutyl- and dibutyl-tins, mixed for 10 seconds, centrifuged for 5 minutes, and re-evaporated to dryness. The residue was digested with 1 ml of concentrated nitric acid and diluted to 5 ml with Type ll water. The solution was analyzed on a Perkin Elmer Model 3030 Zeeman Atomic Absorption Spectrophotometer equipped with a Model 500 Graphite Furnace and an AS60 Autosampler. Ten µl sample was co-injected with 10 µl of matrix modifier consisting of 100 µg phosphate and 10 µg magnesium nitrate per injection. Tributyltin detection limit is provided in Table R-6. A PACS sample, marine sediment reference material from the National Research Council of Canada, was used as a reference material for tributyltin. In 1993-94, the laboratory result was 1.09 µg/g dry weight with a certified value of 1.27±0.22. In 1994-95, the laboratory result was 1.57±0.02 µg/g dry weight with the same certified value. Duplicate tributyltin analysis was not performed in either 1993-94 or 1994-95.
Procedure for Lipid Determination
As synthetic organic concentrations in organisms may vary with lipid content, it is customary to provide lipid data when reporting tissue concentrations. A thoroughly homogenized sample weighing approximately 5 g (wet weight) is macerated and dried with anhydrous granular Na2SO4. The dried sample is transferred to a blender with 150 ml of petroleum ether and blended for two minutes at high speed. The liquid is vacuum-filtered into a 250 ml filter flask through a 10 cm Buchner funnel containing Whatman #1 filter paper. The sample is blended once more with an additional 150 ml of petroleum ether and filtered. The filtrate is concentrated to approximately 25 ml with heat (steam bath) and nitrogen steam. The remaining filtrate is then quantitatively transferred into a 50 ml pre-weighed planchet. The petroleum ether is evaporated, the planchet containing the residue is reweighed, and the percent lipid is calculated.

R-7
TABLE R-1
State Mussel Watch Program Trace Element Detection Limits
Tissue and Sediment ___________________________________________________________________________________
Element Detection Limit (µg/g, ppm dry weight) (µg/g, ppm wet weight) ___________________________________________________________________________________
Aluminum 1.0 0.2 Arsenic 0.25 0.04 Cadmium 0.002 0.0003 Chromium 0.02 0.003 Copper 0.003 0.0005 Mercury 0.03 0.005 Manganese 0.05 0.008 Nickel 0.1 0.02 Lead 0.03 0.005 Selenium 0.1 0.02 Silver 0.002 0.0003 Titanium 0.5 0.08 Zinc 0.02 0.003 ___________________________________________________________________________________

R-8
TABLE R-2
State Mussel Watch Program Trace Element Analysis of Reference Materials (µg/g, dry weight)*
Error!
Bookmark not defined.
1993-94** 1994-95**
NBS Oyster NBS Dolt2 NBS Oyster NBS Dolt2
Ag
1.72±0.16 (1.68±0.15)
NA
1.43±0.11 (1.68±0.15)
NA
Al
174±5 (202.5±14.1)
NA
194±14 (202.5±14.1)
NA
As
13.4±1.0 (14.0±1.2)
NA
11.8±0.6 (14.0±1.2)
NA
Cd
4.6±0.4 (4.15±0.38)
21.2±1.5 (20.8±0.5)
4.31±0.37 (4.15±0.38)
NA
Cr
0.94±0.08 (1.43±0.46)
NA 1.15±0.06 (1.43±0.46)
NA
Cu
64.2±2.5 (66.3±4.3)
27.0 (25.8±1.1)
61.9±1.3 (66.3±4.3)
NA
Hg
0.066±0.012 (0.064±0.007)
NA 0.073±0.005 (0.064±0.007)
2.09±0.11 (1.99±0.10)
Mn
12.6±0.5 (12.3±1.5)
6.68±0.36 (6.88±0.56)
11.9±0.4 (12.3±1.5)
NA
Ni
2.09±0.34 (2.25±0.44)
NA
2.70±0.10 (2.25±0.44)
NA
Pb
0.34±0.04 (0.371±0.014)
NA
0.33±0.01 (0.371±0.014)
NA
Se
NA NA
1.98±0.24 (2.21±0.24)
NA
Zn
821±9.2 (830±57)
96.5±3.5 (85.8±2.5)
897±10 (830±57)
NA
* Sample values are given first, followed by reference values in parentheses, both values include
95% confidence interval where appropriate. NBS refers to the National Bureau of Standards. DOLT2 refers to dogfish liver from the National Research Council of Canada.
** Sample Year = State Fiscal Year (July 1 - June 30). NA = Not Analyzed.

R-9
TABLE R-3
State Mussel Watch Program Percent Recovery of Surrogate Compounds for 1994
_______________________________________________________________________ Station Station Number Name DBOB DBC DBCE _______________________________________________________________________ 10.0 Trinidad Head 51 68 73 100.0 Mad River Slough 58 81 84 103.0 Eureka Channel 51 71 82 202.0 Bodega Head 55 81 66 404.0 Sandholdt Bridge 55 70 82 414.0 Pacific Grove 52 78 90 414.0 Dup Pacific Grove 57 79 105 420.0 Monterey Harbor/Coast Guard Jetty 53 60 77 507.3 Mugu Lagoon/Calleguas Creek 57 76 78 601.0 LA Harbor/National Steel 53 82 74 602.0 LA Harbor/West Basin 55 78 70 605.0 LA Harbor/Cabrillo Pier 56 72 81 616.0 LA Harbor/Consolidated Slip 55 80 33 618.0 LA Harbor/Angels Gate 57 51 78 648.0 Malibu 52 50 78 650.0 Santa Monica 54 53 70 662.0 Royal Palms 58 85 84 681.0 Catalina Island/West 51 82 96 713.0 Huntington Harbour/Edinger Street 60 84 77 713.0 Dup Huntington Harbour/Edinger Street 57 83 67 715.0 Huntington Harbour/Warner Ave Brdg 54 77 74 715.0 Dup Huntington Harbour/Warner Ave Brdg 58 83 81 724.0 Newport Bay/Highway 1 Bridge 54 81 72 725.0 Newport Bay/Crows Nest 55 83 81 726.4 Newport Bay/Rhine Channel/End 56 81 84 883.4 San Diego Bay/Continental Maritime 52 77 64 894.0 SD Bay/Harbor Is/E Basin/Storm Dr 53 80 69 _______________________________________________________________________ DBOB = 4,4'-dibromo-octafluorobiphenyl Dup = Duplicate analysis. DCB = decachlorobiphenyl DBCE = dibutylchlorendate

R-10
TABLE R-4
State Mussel Watch Program Percent Recovery of Surrogate Compounds for 1995
_______________________________________________________________________ Station Station Number Name DBOB DBC DBCE _______________________________________________________________________ 10.0 Trinidad Head 66 88 81 202.0 Bodega Head 54 93 42 404.0 Sandholdt Bridge 64 110 56 404.0 Dup Sandholdt Bridge 62 110 61 601.0 LA Harbor/National Steel 80 130 120 605.0 Cabrillo Pier 75 120 77 616.0 LA Harbor/Consolidated Slip 75 140 81 618.0 LA Harbor/Angels Gate 76 120 78 648.0 Malibu 80 95 73 650.0 Santa Monica 92 130 91 662.0 Royal Palms 87 130 86 664.0 Cabrillo Beach 78 110 77 713.0 Huntington Harbour/Edinger Street 73 110 69 715.0 Huntington Harbour/Warner Ave Brdg 70 110 55 723.4 Newport Bay/Turning Bas. 66 120 56 724.0 Newport Bay/Highway 1 Bridge 73 120 57 725.0 Newport Bay/Crows Nest 74 120 61 726.4 Newport Bay/Rhine Channel/End 68 120 66 750.0 Oceanside 77 110 68 882.0 24th St. Maritime Terminal/South 72 120 62 894.0 SD Bay/Harbor Is/E Basin/Storm Dr 46 78 46 894.0 Dup SD Bay/Harbor Is/E Basin/Storm Dr 69 110 50 899.0 San Diego Bay/Shelter Is/Fshg Pier 66 99 44 _______________________________________________________________________ DBOB = 4,4'-dibromo-octafluorobiphenyl Dup = Duplicate analysis. DCB = decachlorobiphenyl DBCE = dibutylchlorendate

R-11
TABLE R-5
State Mussel Watch Program Distribution of Synthetic Organic Compounds Among
Four Fractions of a Standard FlorisilR Column
___________________________________________________________________________________
(0%) Fraction 1 (6%) Fraction 2 (15%) Fraction 3 ___________________________________________________________________________________
HCH, alpha* HCH, alpha* dacthal aldrin HCH, beta diazinon chlordene, alpha HCH, gamma dichlorobenzophenone, p,p' chlordene, gamma HCH, delta dieldrin DDE, o,p' cis-chlordane endosulfan I DDE, p,p' trans-chlordane endrin DDMU, p,p'* chlorpyrifos malathion DDT, o,p' DDD, o,p' oxadiazon DDT, p,p'* DDD, p,p' parathion, ethyl heptachlor DDMU p,p'* parathion, methyl hexachlorobenzene DDT, p,p'* tetradifon (tedion) trans-nonachlor dicofol (kelthane) PCB 1248 ethion PCB 1254 heptachlor epoxide PCB 1260 methoxychlor cis-nonachlor (50%) Fraction 4 oxychlordane toxaphene endosulfan II endosulfan sulfate ___________________________________________________________________________________
* Found in both 0% and 6% fractions.

R-12
TABLE R-6
State Mussel Watch Program Synthetic Organic Compounds Analyzed
and Their Detection Limits in Mussel and Sediment ___________________________________________________________________________________
Compound Detection Limit (ng/g, ppb dry weight) ___________________________________________________________________________________
aldrin 1 cis-chlordane 1 trans-chlordane 1 chlordene, alpha 1 chlordene, gamma 1 chlorpyrifos 4 dacthal 2 DDD, o,'p 5 DDD, p,p' 3 DDE, o,p' 3 DDE, p,p' 3 DDMU,p,p' 5 DDT, o,p' 4 DDT, p,p' 4 diazinon 50 dichlorobenzophenone-p,p' 3 dicofol (Kelthane) 10 dieldrin 1 endosulfan I 1 endosulfan II 10 endosulfan sulfate 50 endrin 6 ethion 20 HCH, alpha 1 HCH, beta 3 HCH, gamma 0.8 HCH, delta 2 heptachlor 1 heptachlor epoxide 1 HCB 1 methoxychlor 15 cis-nonachlor 1 trans-nonachlor 1 oxadiazon 2 oxychlordane 1 parathion, ethyl 10 parathion, methyl 10 PCB 1248 50 PCB 1254 10 PCB 1260 10 tetradifon (Tedion) 10 toxaphene 100 tributyltin 20 ___________________________________________________________________________________

R-13
TABLE R-7
State Mussel Watch Program Results of Matrix Spike Analyses: 1993-95 Synthetic Organic Compounds
Mussel Tissue
_______________________________________________________________________ 1994 1995 Station Name Bodega Head Pacific Grove Station Number 202.0 414.0 Species RCM RCM Percent Recovery Percent Recovery Compound aldrin 59 58 cis-chlordane 92 94 trans-chlordane 95 84 oxychlordane 87 77 cis-nonachlor 100 88 trans-nonachlor 94 65 alpha chlordene 65 61 gamma chlordene 64 64 chlorpyrifos 86 59 dicofol not spiked 72 dichlorobenzophenone not spiked 39 dacthal 91 67 diazinon 97 70 dieldrin 110 75 endosulfan I 110 72 endosulfan II 110 83 endosulfan sulfate 89 77 endrin 110 69 ethion 100 71 alpha HCH 91 58 beta HCH 76 65 gamma HCH 77 60 delta HCH 81 47 o,p'-DDD 100 95 p,p'-DDD 120 97 o,p'-DDE 84 74 p,p'-DDE 80 50 p,p'-DDMU 66 70 o,p'-DDT 84 62 p,p'-DDT 110 94 heptachlor 58 46 heptachlor epoxide 96 88 hexachlorobenzene 61 62 methooxychlor 120 82 oxadiazon 71 50 ethyl parathion 95 58 methyl parathion 45 42 PCB 1248 not spiked not spiked PCB 1254 not spiked not spiked PCB 1260 not spiked not spiked tetradifon 110 68 toxaphene not spiked not spiked _______________________________________________________________________ RCM = Resident California Mussel.

R-1
4
TABLE R-8 State Mussel Watch Program
Results of Duplicate Sample Analysis: 1994 Synthetic Organic Compounds Quality Control - Mussel Tissue (ng/g dry weight)
_________________________________________________________________________________________________________________________________ Station Name Hunting Harbor/ Hunting Harbor/ Pacific Grove Edinger Street Warner Ave. Bridge Station No. 713.0 715.0 414.0 Species TCM TCM RCM REPLICATE 1 2 1 2 1 2 COMPOUNDS aldrin ND 1.1 cis-chlordane 22 24 39 40 2.4 2.0 cis-nonachlor 11 11 23 24 alpha-chlordene 1.8 1.6 2.4 2.7 gamma-chlordene ND 1.0 oxychlordane 1.0 1.0 1.8 1.6 trans-chlordane 20 20 35 35 1.9 1.5 trans-nonachlor 20 21 36 36 1.2 1.5 chlorpyrifos 11 8.8 11 14 dacthal 19 19 3.0 2.2 DDD, o,p' 11 11 14 14 DDD, p,p' 34 34 47 49 DDE, o,p' 12 13 12 12 DDE, p,p' 220 230 330 340 24 26 DDT, o,p' DDT, p,p' 15 14 14 15 5.0 4.3 DDMU,p,p' 15 14 16 18 diazinon dieldrin 13 13 14 10 5.9 7.5 endosulfan I endosulfan II endosulfan sulfate hexachlorobenzene alpha-HCH 1.3 1.3 gamma-HCH heptachlor epoxide oxadiazon 12 14 PCB 1248 PCB 1254 100 100 140 170 PCB 1260 toxaphene percent moisture 88.2 88.5 87.8 88.2 84.9 85.6 percent lipid 0.443 0.484 0.554 0.555 0.525 0.430 TCM = Transplanted California Mussel. RCM = Resident California Mussel. ND = Not Detected.

R-1
5
TABLE R-8 (continued) State Mussel Watch Program
Results of Duplicate Sample Analysis: 1994 Synthetic Organic Compounds Quality Control - Sediment (ng/g dry weight)
_______________________________________________________________________ Station Name L.A. Harbor/ Consolidated Slip Station No. 616.0 SED REPLICATE 1 2 COMPOUNDS aldrin 1.4 1.1 cis-chlordane 24 20 cis-nonachlor 10 11 alpha-chlordene 3.6 3.4 gamma-chlordene 2.2 2.0 oxychlordane 1.7 1.9 trans-chlordane 29 21 trans-nonachlor 21 18 chlorpyrifos 18 13 dacthal 2.1 2.2 DDD, o,p' 30 33 DDD, p,p' 130 130 DDE, o,p' 11 9.8 DDE, p,p' 220 210 DDT, o,p' 12 13 DDT, p,p' 79 320 DDMU,p,p' 12 12 diazinon dieldrin 13 7.9 endrin 9.4 12 endosulfan I endosulfan II endosulfan sulfate heptachlor ND 1.0 heptachlor epoxide 7.3 3.9 hexachlorobenzene 1.0 1.0 alpha-HCH beta-HCH ND 5.7 gamma-HCH heptachlor epoxide oxadiazon 12 11 PCB 1248 130 100 PCB 1254 170 190 PCB 1260 390 360 toxaphene 580 600 percent moisture 54.2 NA
_______________________________________________________________________ SED = Sediment. ND = Not Detected.

R-1
6
TABLE R-9 State Mussel Watch Program
Results of Duplicate Sample Analysis: 1995 Synthetic Organic Compounds Quality Control - Mussel Tissue (ng/g dry weight)
______________________________________________________________________________ Station Name SD Bay/Harbor Is/ Sandholt Bridge E Basin/Storm Dr Station No. 894.0 404.0 Species TCM TCM REPLICATE 1 2 1 2 COMPOUNDS aldrin cis-chlordane 25 27 31 33 cis-nonachlor 8.4 8.3 15 16 gamma-chlordene 2.2 3.2 1.2 1.0 alpha-chlordene 2.1 3.2 1.4 1.1 oxychlordane 5.2 5.7 1.3 4.2 trans-chlordane 25 26 25 27 trans-nonachlor 14 20 36 34 chlorpyrifos ND 4.1 17 18 dacthal 140 140 DDD, o,p' 47 51 100 100 DDD, p,p' 140 150 400 420 DDE, o,p' 42 41 DDE, p,p' 30 39 1700 1600 DDT, o,p' 8.6 8.9 200 200 DDT, p,p' 32 41 680 730 DDMU,p,p' 23 27 55 54 diazinon dieldrin 6.0 6.4 300 300 endrin 22 23 endosulfan I 6.7 6.5 endosulfan II 22 20 endosulfan sulfate 82 95 heptachlor 1.9 ND hexachlorobenzene alpha-HCH gamma-HCH 0.91 0.87 heptachlor epoxide 1.3 ND 3.8 2.9 oxadiazon 2.0 2.0 7.3 7.6 PCB 1248 11,800 15,000 PCB 1254 6,900 9,400 260 250 PCB 1260 210 250 18 16 toxaphene 870 930 percent moisture 87.4 87.2 85.9 86.3 percent lipid 0.441 0.412 0.844 0.838 ______________________________________________________________________________ TCM = Transplanted California Mussel. ND = Not Detected.

R-1
7
TABLE R-9 (continued) State Mussel Watch Program
Results of Duplicate Sample Analysis: 1995 Synthetic Organic Compounds Quality Control - Sediment (ng/g dry weight)
_____________________________________________________________________________ Station Name Mugu Drainage 1 Station No. 508.0 SED REPLICATE 1 2 COMPOUNDS aldrin cis-chlordane 6.7 6.7 cis-nonachlor ND 3.4 gamma-chlordene alpha-chlordene 0.75 0.74 oxychlordane trans-chlordane 4.7 5.1 trans-nonachlor 5.5 5.8 chlorpyrifos 10 10 dacthal 53 52 DDD, o,p' 10 13 DDD, p,p' 44 44 DDE, o,p' 5.4 5.8 DDE, p,p' 340 300 DDT, o,p' 16 21 DDT, p,p' 71 77 DDMU,p,p' diazinon dieldrin 4.1 4.1 ethion 26 20 endrin 8.2 7.6 endosulfan I endosulfan II 3.1 2.9 endosulfan sulfate hexachlorobenzene ND 0.43 alpha-HCH gamma-HCH heptachlor epoxide oxadiazon 13 13 PCB 1248 PCB 1254 PCB 1260 toxaphene 320 320 percent moisture 37.9 37.7 _____________________________________________________________________________ SED = Sediment. ND = Not Detected.

R-18
TABLE R-10
State Mussel Watch Program Polynuclear Aromatic Hydrocarbons (PAHs) Analyzed
and Their Detection Limits in Mussel and Sediment
___________________________________________________________________________________ Detection Limit Compound (ng/g, ppb dry weight) ___________________________________________________________________________________
naphthalene 10 1-methylnaphthalene 10 2-methylnaphthalene 10 biphenyl 10 2,6-dimethylnaphthalene 10 acenaphthylene 10 acenaphthene 10 2,3,5-trimethylnaphthalene 10 fluorene 10 phenanthrene 10 anthracene 10 1-methylphenanthrene 10 fluoranthene 10 pyrene 10 benz[a]anthracene 10 chrysene 10 benzo[b]fluoranthene 10 benzo[k]fluoranthene 10 benzo[e]pyrene 10 benzo[a]pyrene 10 perylene 10 indeno[1,2,3-cd]pyrene 10 dibenz[a,h]anthracene 10 benzo[ghi]perylene 10 ___________________________________________________________________________________

R-1
9
TABLE R-11
State Mussel Watch Program Results of Duplicate Sample Analysis: 1994 Polynuclear Aromatic Hydrocarbons Quality Control
Mussel Tissue (ng/g dry weight)
___________________________________________________________________________ Station Name Huntington Harbor/ Blind 4 Edinger Street Station No. 713.0 713.0 Species TCM TCM REPLICATE 1 2 1 2 COMPOUNDS naphthalene 33 34 31 37 1-methylnaphthalene 2-methylnaphthalene 33 35 24 19 biphenyl 2,6-dimethylnaphthalene acenaphthylene acenaphthene 2,3,5-trimethylnaphthalene fluorene phenanthrene 36 33 15 13 anthracene 1-methylphenanthrene fluoranthene 69 67 pyrene ND 78 ND 26 benz[a]anthracene chrysene 55 44 benzo[b]fluoranthene benzo[k]fluoranthene benzo[e]pyrene benzo[a]pyrene perylene indeno[1,2,3-cd]pyrene dibenz[a,h]anthracene benzo[ghi]perylene percent moisture 88.2 88.5 76.1 NA percent lipid 0.443 0.484 1.59 NA ___________________________________________________________________________ TCM = Transplanted California Mussel. ND = Not Detected. NA = Not Analyzed.

R-2
0
TABLE R-12
State Mussel Watch Program Results of Duplicate Sample Analysis: 1994 Polynuclear Aromatic Hydrocarbons Quality Control
Sediment (ng/g dry weight)
___________________________________________________________________________ Station Name LA Harbor/ National Steel Station No. 601.0 SED REPLICATE 1 2 COMPOUNDS naphthalene 34 36 1-methylnaphthalene 16 14 2-methylnaphthalene 51 54 biphenyl 20 14 2,6-dimethylnaphthalene 27 18 acenaphthylene ND ND acenaphthene 18 17 2,3,5-trimethylnaphthalene 11 11 fluorene 24 24 phenanthrene 180 200 anthracene 100 110 1-methylphenanthrene 21 26 fluoranthene 390 420 pyrene 380 490 benz[a]anthracene 230 260 chrysene 430 490 benzo[b]fluoranthene 740 830 benzo[k]fluoranthene 150 190 benzo[e]pyrene 350 400 benzo[a]pyrene 440 510 perylene 120 130 indeno[1,2,3-cd]pyrene 140 120 dibenz[a,h]anthracene 75 46 benzo[ghi]perylene 110 120 percent moisture 46.2 45.8 ___________________________________________________________________________ SED = Sediment. ND = Not Detected.

R-2
1
TABLE R-13
State Mussel Watch Program Results of Duplicate Sample Analysis: 1995 Polynuclear Aromatic Hydrocarbons Quality Control
Mussel Tissue* (ng/g dry weight)
___________________________________________________________________________ Station Name Mission Bay/ Landfill 2 Station No. 868.6 TCM REPLICATE 1 2 COMPOUNDS naphthalene 41 41 1-methylnaphthalene 24 25 2-methylnaphthalene 100 100 biphenyl 2,6-dimethylnaphthalene 13 12 acenaphthylene 5.2 6.0 acenaphthene 2,3,5-trimethylnaphthalene fluorene phenanthrene 18 23 anthracene 1-methylphenanthrene fluoranthene 28 33 pyrene 23 34 benz[a]anthracene chrysene 15 ND benzo[b]fluoranthene benzo[k]fluoranthene benzo[e]pyrene benzo[a]pyrene perylene indeno[1,2,3-cd]pyrene dibenz[a,h]anthracene benzo[ghi]perylene percent moisture NA NA ___________________________________________________________________________ TCM = Transplanted California Mussel. ND = Not Detected. NA = Not Analyzed. * Duplicate sample analysis was not performed on sediment in 1995.

R-2
2
TABLE R-14
State Mussel Watch Program Results of Matrix Spike Analyses: 1993-95 Polynuclear Aromatic Hydrocarbons (PAHs)
______________________________________________________________________ 1994 1995 Station Name LA Harbor/Cabrillo Pier Trinidad Head Station Number 605.0 10.0 Species SED RCM Percent Recovery* Percent Recovery COMPOUNDS naphthalene 100 100 1-methylnaphthalene 80 not spiked biphenyl 63 not spiked 2,6-dimethylnaphthalene 30 not spiked acenaphthylene 86 110 acenaphthene 121 120 2,3,5-trimethylnaphthalene 63 not spiked fluorene 100 130 phenanthrene 100 130 anthracene 96 110 1-methylphenanthrene 140 not spiked fluoranthene 120 120 pyrene 200 100 benz[a]anthracene 180 130 chrysene 230 130 benzo[b]fluoranthene 360 100 benzo[k]fluoranthene 160 100 benzo[e]pyrene 210 not spiked benzo[a]pyrene 250 100 perylene 410 not spiked indeno[1,2,3-cd]pyrene 160 110 dibenz[a,h]anthracene 110 120 benzo[ghi]perylene 200 120
______________________________________________________________________ SED = Sediment. RCM = Resident California Mussel. * The percent recovery of several spiked PAHs exceeded 150% in the 1994 sediment
sample. The unspiked sample contained concentrations of these PAH compounds at 2.5 to 10 times the amount spiked. For example, the concentration of perylene in the unspiked sample was 3.47 ppm while the amount of perylene spiked was only 0.332 ppm. The recovery of 2,6-dimethylnaphthalene was low, reported concentrations for this compound are qualified as estimates only.

S-1
APPENDIX S
Median International Standards

S-2
Median International Standards
In 1982, the Food and Agricultural Organization (FAO) of the United Nations conducted a survey of standards and legal limits for metals including mercury, pesticides, and other contaminants in fishery products. This was in response to frequent inquiries from institutions and companies active in international commerce that found it difficult finding such information. The FAO surveyed nations that were members of the FAO as well as those who were not. Most nations cooperated with the survey and, in certain other cases, the standards were drawn from other sources. The FAO took all of the responses and presented them in a report entitled "Compilation of Legal Limits for Hazardous Substances in Fish and Fishery Products" (Nauen 1983). Most of the limits were presented in a standard format and in standard units of fresh or live weight. Exceptions are clearly noted. Nearly all of the standards for pesticides were from the United States (FDA standards). However, with the exception of mercury, the United States has no standards for trace metals in fishery products. It is this very lack of standards that makes interpretation of some of the SMWP findings difficult. Table S-1 summarizes the standards and guidelines for metals from the FAO report. The table notes whether the standards are for freshwater fish, marine fish, shellfish, or a combination of these. When more than one standard was listed by the FAO report, those values closest to a standard for fresh weight, edible portion were chosen. Exceptions are clearly noted in the table. Standards for each element are arranged in ascending order. The country of origin and the approximate date of adoption are also noted. As can be seen in Table S-1, some of the standards are not truly for edible portion, fresh weight. For example, some standards refer to canned products or protein. In the case of India, the standards are on a dry weight basis. If the Indian standards were stated in fresh weight terms, they would be approximately one fifth or one sixth of the stated standard. Table S-1 has many striking features. One feature is that most of the standards are surprisingly similar. Another feature is the large number of countries that have standards for metals. Also, although many of these countries are less developed nations, the standards adopted by these nations do not differ from those of the more developed nations. The standards were not summarized for mercury because there is a USFDA standard of 1.0 ppm for methyl mercury in the edible portions of fish and shellfish. This was, incidentally, the highest limit set by any nation in the FAO study. The great majority of nations have set a mercury standard of 0.5 ppm. Median International Standards presented in Table 4 were calculated from the standards listed in Table S-1. The median standard was chosen for use for several reasons. The median is less influenced than the mean by outliers in the data. Also, direct comparisons of standards for fresh versus canned versus dry can be misleading. By using median standards, these misleading comparisons can be more easily avoided. In most cases, the Median International Standard is actually a standard set by one or more nations rather than an average value not actually set by any country. The median was calculated as follows. All standards or guidelines (with the exception of the Indian standards which are based on dry weight) were considered to be more-or-less equivalent. For the purposes of calculating the median, the Indian standards were divided by five. The median was calculated as the middle value of all of the standards (e.g., the fourth of seven values

S-3
arranged in ascending order). In a few cases, the number of standards was even. In this event, the two mid-values were averaged (most were not different). None of the adjusted dry-weight standards from India ended up as a median or as part of a mid-value pair. For obvious reasons, the Median International Standards can only be used to provide a general idea of what other nations have chosen to use as a standard. The range of all values is listed in Table 4 as a reminder of this. However, with the lack of American standards, Median International Standards can provide a guidepost for those responsible for interpreting trace metal findings in fish and shellfish tissue.

S-4
TABLE S-1
International Standards for Trace Elements in Fish and Molluscs __________________________________________________________________________________
Approximate Freshwater Marine Molluscs/ Date of Element Standard Fish Fish Shellfish Country Adoption __________________________________________________________________________________
Antimony 1.0 ppm x x x Hong Kong 1983 1.0 ppm x x x New Zealand 1971 1.5 ppm x x x Australia 1982 __________________________________________________________________________________
Arsenic 0.1 ppm x x x Venezuela - 1.0 ppm x x x Chile - 1.0 ppm d d x India - 1.0 ppm x x x New Zealand 1971 1.0 ppm e e e United Kingdom 1959 1.4 ppm x Hong Kong 1983 1.5 ppm x x x Australia 1982 1.5 ppm c c c Thailand 1982 3.5 ppm p p Canada 1976 5.0 ppm x x x Finland 1980 5.0 ppm x x x Zambia 1976 __________________________________________________________________________________
Cadmium 0.05 ppm x x Netherlands - 0.1 ppm c c c Switzerland 1982 0.1 ppm r x Venezuela - 0.2 ppm x x Australia 1982 0.3 ppm r r Finland - 0.5 ppm x W. Germany 1979 1.0 ppm x Netherlands - 1.0 ppm x x New Zealand 1971 2.0 ppm x Australia 1982 2.0 ppm x x x Hong Kong 1983 __________________________________________________________________________________
Chromium 1.0 ppm x x x Hong Kong 1983 __________________________________________________________________________________
Copper 10.0 ppm x x x Chile - 10.0 ppm d d India - 10.0 ppm x x Venezuela - 20.0 ppm c c c Thailand 1982 20.0 ppm g g g United Kingdom 1956 30.0 ppm x x x Australia 1982 30.0 ppm x x x New Zealand 1971 100.0 ppm x x Zambia 1976 __________________________________________________________________________________
Fluoride 150.0 ppm p p Canada 1979 __________________________________________________________________________________
Fluorine 10.0 ppm x x New Zealand 1971 25.0 ppm x x Zambia 1976 __________________________________________________________________________________
p - in protein g - recommended guideline e - except where natural levels are higher d - dry weight basis c - in metal containers r - revised limit (proposed)

S-5
TABLE S-1 (continued)
International Standards for Trace Elements in Fish and Molluscs
__________________________________________________________________________________ Approximate Freshwater Marine Molluscs/ Date of Element Standard Fish Fish Shellfish Country Adoption __________________________________________________________________________________
Lead 0.5 ppm p p Canada 1979 0.5 ppm x W. Germany 1979 0.5 ppm x x Netherlands - 1.0 ppm x x x Sweden 1979 1.0 ppm c c c Switzerland 1982 1.0 ppm c c c Thailand 1982 2.0 ppm x x Australia 1982 2.0 ppm x x x Chile 1982 2.0 ppm x Finland 1980 2.0 ppm x Italy 1978 2.0 ppm x Netherlands - 2.0 ppm x x New Zealand - 2.0 ppm l l Sweden 1979 2.0 ppm x x United Kingdom 1980 2.0 ppm x x Venezuela - 2.5 ppm x Australia 1982 5.0 ppm d d India - 6.0 ppm x x x Hong Kong 1983 10.0 ppm x x Zambia 1976 __________________________________________________________________________________
Mercury International Standards for Mercury range from 0.1 ppm to 1.0 ppm. Twenty-eight countries
have established standards for Mercury. The U. S. Food and Drug Administration has set an action level of 1.0 ppm in the edible portion of fish and molluscs. The median international standard is 0.5 ppm.
__________________________________________________________________________________ Selenium 0.3 ppm x x x Chile 1982 2.0 ppm x x Australia 1982 2.0 ppm x x New Zealand 1971 __________________________________________________________________________________
Tin 50.0 ppm x x Australia 1982 100.0 ppm x x Venezuela - 150.0 ppm c c c Finland 1979 150.0 ppm x x New Zealand 1977 230.0 ppm x x x Hong Kong 1983 250.0 ppm d d India - 250.0 ppm x x Thailand 1982 250.0 ppm g,c g,c g,c United Kingdom 1973 __________________________________________________________________________________
Zinc 40.0 ppm x x x Australia 1982 40.0 ppm x x New Zealand 1971 50.0 ppm d d India - 50.0 ppm g g United Kingdom 1953 100.0 ppm x x x Chile 1982 100.0 ppm x x Zambia 1976 __________________________________________________________________________________
p - in protein g - recommended guideline e - except where natural levels are higher d - dry weight basis c - in metal containers r - revised limit (proposed) l - in liver

T-1
APPENDIX T
Elevated Data Levels

T-2
Elevated Data Levels (EDL) An EDL is defined for the purposes of the SMWP as that concentration of a toxic substance in mussels or clams that equals or exceeds a specified percentile (such as 85 percent) of all SMWP measurements of the toxic substance in the same species and exposure condition (resident or transplant) between 1977 and 1995. EDLs were determined as follows: (1) All SMWP data from 1977 through 1995 were pooled by species and exposure, (2) The concentrations of each toxicant were ranked from highest to lowest concentration down to, and including, instances when a chemical was not detected, (3) The cumulative frequency of occurrence and percentile ranking for all concentrations were calculated, (4) The concentration of the toxic substance representing the 85th percentile was identified and designated the 85 percent EDL or EDL 85, and (5) The concentration of the toxic substance representing the 95th percentile was identified and designated the 95 percent EDL or EDL 95. The EDL 85 is that concentration of a toxic substance that equals or exceeds 85 percent of all SMWP measurements of the toxic substance in the same species and exposure between 1977 and 1995. The EDL 95 is that concentration of a toxic substance that equals or exceeds 95 percent of all SMWP measurements of the toxic substance in the same species and exposure between 1977 and 1995. EDLs for trace elements are summarized in Tables 5 and 6. EDLs for synthetic organic substances are summarized in Tables 7 through 9. Because EDLs are based on the relative ranking of each measurement, rather than a percentage of the highest concentration obtained, they are not influenced by unusually high (anomalous) toxicant values. This characteristic of EDLs is especially desirable in the evaluation of synthetic organic toxicants where the highest concentration may be as much as ten times the next highest concentration. EDLs do, however, reflect the biases of the data upon which they have been based. Because they are based on SMWP data rather than an absolute number external to the SMWP, EDLs, when exceeded, can provide a sensitive first indication of elevated toxicant levels in California waters. As such, EDLs fulfill the monitoring function of the SMWP effectively. In addition, EDLs may be expressed in dry weight to eliminate data variability due to moisture content and to conform to scientific literature relevant to mussel or clam monitoring programs worldwide. However, EDLs do not assess adverse impacts, nor do they necessarily represent concentrations that may be damaging to the mussels, clams, or to a human consuming these species. They do not directly relate to Maximum Tissue Residue levels (MTRLs), FDA action levels, NAS guidelines, or Median International Standards (MIS).