state fire commission annual report 20142015 - tfs online€¦ · 2014state fire commission annual...
TRANSCRIPT

20142015State Fire Commission Annual Report

Statement of Compliance
Honourable M.T. (Rene) Hidding MP
Minister for Police and Emergency Management
Dear Minister
In accordance with Section 107(g) of the Fire Service Act 1979, we hereby submit for your information and presentation to Parliament the Report of the State Fire Commission for the year ending 30 June 2015.
The report has been prepared in accordance with the provisions of the Fire Service Act 1979.
Gavin Freeman AFSM
ACTING CHIEF OFFICER
Rodney Sweetnam AFSM
COMMISSION CHAIR
23 September 2015
Photographer: Geoff Rollins
Front Cover:Kingston Brigade supporting Make-a-Wish Photograph courtesy of The Mercury

Contents
Our organisation...........................................................................................................2
Chief Officer’s report ...................................................................................................4
State Fire Commission .................................................................................................6
Executive Leadership Team .........................................................................................7
State Fire Management Council ...................................................................................8
Key performance indicators ....................................................................................... 10
Be a leader in emergency management and inter-agency relations............................ 12
Deliver safe, effective and efficient strategies for preventing and responding to fires and other emergencies ......................................................... 18
Build community capacity to prevent, respond and to recover from fires and other emergencies .............................................................. 25
Be an adaptive, relevant, resilient and sustainable organisation .................................33
Be a socially and environmentally responsible organisation .......................................39
Financial Statements 2014-15 ....................................................................................44
Glossary ..................................................................................................................... 72
Photo courtesy of The AdvocatePhotographer: Katrina Docking
1 2014-15 State Fire Commission Annual Report
Our organisation
Our RoleThe role of the State Fire Commission (the Commission) is to protect life, property and the environment from the impact of fire and other emergencies.
The Commission delivers all of its services through its operational arm, Tasmania Fire Service (TFS).
Our VisionOur vision is a Tasmanian community safe from the impact of fire and other emergencies.
Our EthosTFS’ ethos is one of service to the people of Tasmania. We work together to minimise the social, economic and environmental impact of fire on our community. We serve as part of a team, and implement strategies that build community resilience in preventing and preparing for fire. We deliver high-quality response to fires and emergencies. We are inspired by a long tradition of commitment and service; and we are respected for our integrated and innovative approach in contributing to a safer Tasmania.
Our ValuesThe services we provide are driven by the needs of the community. In order to meet these needs, and the needs of our people, we have adopted the following core values:
Service
We value:
• serving the Tasmanian community
• being responsive to community needs
• being progressive and delivering quality services.
Professionalism
We value:
• dedication and pride in our organisation
• being skilled, efficient, committed and innovative
• using our collective capabilities to deliver an excellent service
• being accountable for our actions.
Major Goals Expected Outcomes
Be a leader in emergency management and inter-agency relations.
More effective and efficient emergency management arrangements for the Tasmanian community.
Deliver safe, effective and efficient strategies for preventing, preparing for and responding to fires and other emergencies.
Fewer fire fatalities and injuries and less fire-related damage.
Build community capacity to prevent, respond to and recover from fires and other emergencies.
A safer and more resilient Tasmanian community.
Be an adaptive, relevant, resilient and sustainable organisation.
An effective organisation, capable of responding effectively to change.
Be a socially and environmentally responsible organisation. An organisation respected by the Tasmanian community.
Integrity
We value:
• being trustworthy and ethical
• treating each other fairly and honestly
• having the courage to do the right thing.
Consideration
We value:
• each other
• working together to achieve our goals
• treating each other with respect and understanding
• being supportive, compassionate and helping each other.
2 State Fire Commission Annual Report 2014-15
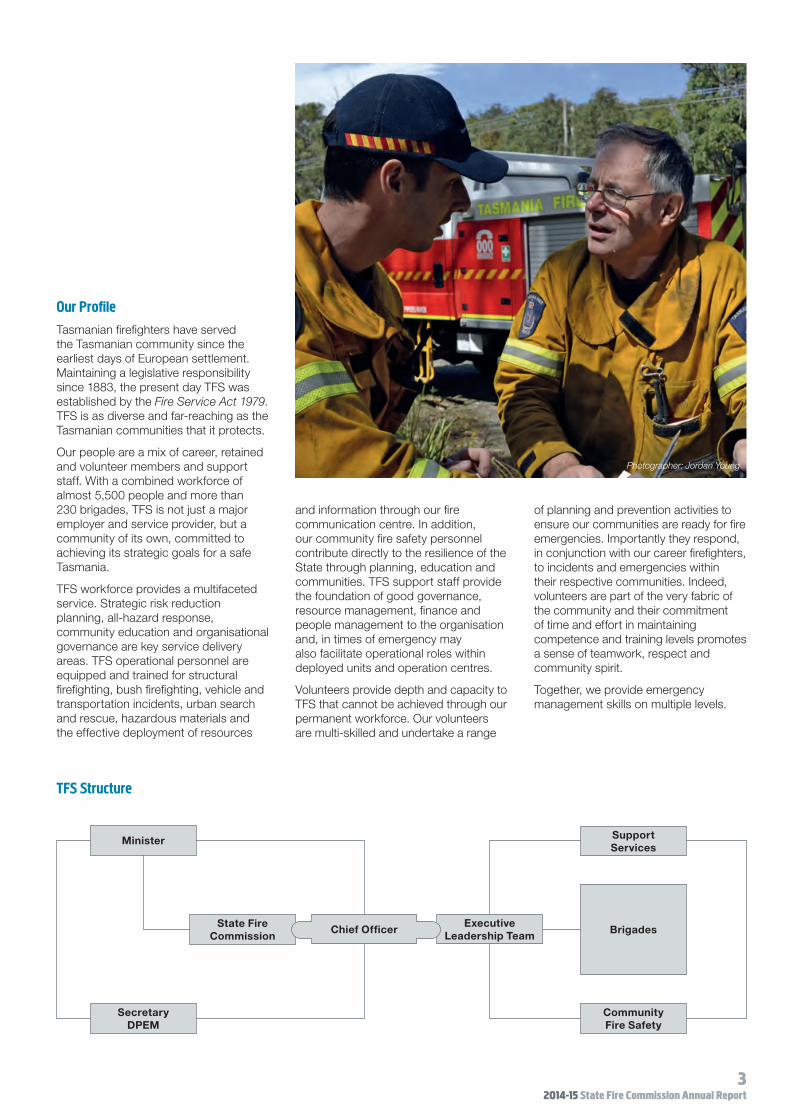
Our ProfileTasmanian firefighters have served the Tasmanian community since the earliest days of European settlement. Maintaining a legislative responsibility since 1883, the present day TFS was established by the Fire Service Act 1979. TFS is as diverse and far-reaching as the Tasmanian communities that it protects.
Our people are a mix of career, retained and volunteer members and support staff. With a combined workforce of almost 5,500 people and more than 230 brigades, TFS is not just a major employer and service provider, but a community of its own, committed to achieving its strategic goals for a safe Tasmania.
TFS workforce provides a multifaceted service. Strategic risk reduction planning, all-hazard response, community education and organisational governance are key service delivery areas. TFS operational personnel are equipped and trained for structural firefighting, bush firefighting, vehicle and transportation incidents, urban search and rescue, hazardous materials and the effective deployment of resources
and information through our fire communication centre. In addition, our community fire safety personnel contribute directly to the resilience of the State through planning, education and communities. TFS support staff provide the foundation of good governance, resource management, finance and people management to the organisation and, in times of emergency may also facilitate operational roles within deployed units and operation centres.
Volunteers provide depth and capacity to TFS that cannot be achieved through our permanent workforce. Our volunteers are multi-skilled and undertake a range
of planning and prevention activities to ensure our communities are ready for fire emergencies. Importantly they respond, in conjunction with our career firefighters, to incidents and emergencies within their respective communities. Indeed, volunteers are part of the very fabric of the community and their commitment of time and effort in maintaining competence and training levels promotes a sense of teamwork, respect and community spirit.
Together, we provide emergency management skills on multiple levels.
TFS Structure
Minister
Secretary DPEM
State Fire Commission
Executive Leadership Team
Support Services
Community Fire Safety
BrigadesChief Officer
Photographer: Jordan Young
3 2014-15 State Fire Commission Annual Report

Chief Officer’s report
It is with great pleasure that I present the 2014-15 Annual Report of the State Fire Commission.
It has been another busy year in general for our brigades. While our summer fire season was relatively quiet compared to the eventful and challenging seasons of recent summers, we were still able to exercise our readiness on a number of occasions, including the deployment of Large Air Tankers (LATs) for the first time in this State.
Of course, the cool and mild conditions of the 2014-15 summer greatly reduced exposure to the Severe-Extreme fire weather behaviour that we normally experience around the New Year. We declared only two Total Fire Bans (TFBs) over the season—significantly below the average. From this, we can draw two conclusions:
1. We have yet to fully test some of our refined procedures since the 2013 bushfires.
2. We can expect the 2015-16 season to offer significant challenges.
Nevertheless, TFS continued to train and test capabilities as much as possible. Our Compressed Air Foam System (CAFS) continued to provide an increased response capability throughout the State and was featured at the 2014 State Conference. Additionally, we worked hard to revise and confirm aircraft arrangements with the National Aerial Firefighting Centre (NAFC). Positive results from this were seen in the response to the Lefroy fire in the north of the State when LAT aircraft defended homes successfully and implemented suppression strategies.
Of course, there are many more examples of progressive initiatives within the operations sphere. The Fuel Reduction Unit was formed in 2014 as a new capability within TFS and, in conjunction with fire partners, has a considerable state-wide responsibility
4 State Fire Commission Annual Report 2014-15
Photographer: Warren Frey

to introduce and facilitate a tenure-blind fuel reduction program. This is the first of its kind in Australia and is a resounding success so far.
Automatic Vehicle Locating (AVL) devices have been rolled out to make our people safer, our fleet continues to be class-leading and our command and control systems are better than ever before.
Our Brigades across the State consistently achieve excellent results in terms of confining structure fires to the room of origin, reflecting good offensive fire attack strategy. During the past 15 years we have seen a steady decline and overall reduction in fire fatalities, injuries and residential property losses. This reflects well on our operational, leadership and firefighting skills and our ongoing educational programs and campaigns.
Community Protection Planning and Bushfire-Ready Neighbourhoods programs both received State and national recognition through awards and invitations to deliver presentations. As a result, Tasmanians are now benefiting from personal bushfire survival plans and community protection plans, and resilience is improving considerably.
Our people initiatives have also progressed well in the past year. Our Values continue to be embedded within the organisation and our collective conduct and approach to service demonstrate this. The Senior Station Officer Development Program is an excellent example of the professional development programs that make us a class-leading organisation in the context of people and leadership development. Following some challenges, TFS has also met the majority of Working with Children legislative requirements. No mean feat!
Last year, Chief Officer Mike Brown invested significant effort in exploring the release of the Hyde “2013 Tasmanian
Gavin Freeman AFSM ACTING CHIEF OFFICER
Bushfires Inquiry”. In doing so he noted the lasting emotional issues for some of our members. I also acknowledge the identified management strategies that we continue to work through.
To that end, much progress was made this past year in meeting the requirements of the Hyde Inquiry. The Government accepted the majority of the 103 recommendations made by Mr Hyde and it is immensely pleasing to note that many of these conditions have already been met by TFS. Although there is still a way to go to realise all facets of the inquiry, we are clearly demonstrating an innovative and progressive culture.
In much the same vein, this past year has seen the first major review into Tasmanian emergency management arrangements by the Department of Justice. This report has yet to be considered by Cabinet and released to the general public; however, outcomes may further streamline the alignment and actions of TFS and our emergency management partners.
This brings me to acknowledge the new arrangements with our emergency management partner, the State Emergency Service (SES). With the release of budget papers, the Director SES now reports to the Chief Officer of TFS, and the Commission now has increased funding responsibilities for SES operations. As our collective core business sees us both as emergency management practitioners, this makes perfect sense and I congratulate all members on the excellent initiatives to date to facilitate a closer, aligned relationship. Of course, there is still
much work to do, including identification of a tailored and sustainable funding model for the future. We must continue to strive for success in this area.
The past year also saw commencement of the DPEM Corporate Services Integration Project. I acknowledge the issue of singular support services, changing locations and merging functions to be a very emotional one. In this respect, I anticipate challenges will continue, however, I have been hugely impressed by the majority of attitudes in striving for a collegial (and efficient) relationship with our departmental colleagues.
I wish to acknowledge the magnificent contribution of our retiring Chief Officer, Mike Brown who has shown extraordinary leadership during unparalleled change over the course of 39 years of service. The achievements included in this report are in no small way attributable to Mike, and on behalf of the Service I thank him and wish him well in retirement.
In closing, I have no doubt the coming year will be a period of change and associated challenges. The Commission is confident TFS is up to the challenge and joins me in sincerely thanking and acknowledging the work of all our firefighters, career and volunteer, along with all those that strive to support the essential work we do.
Compressed Air Foam System appliancePhotographer: Tony Shultz
5 2014-15 State Fire Commission Annual Report

Michael Brown AFSM, BSocSc, MIFireE, EFO
Chairperson of the Commission and TFS Chief Officer (CEO). Former Deputy Chief Officer and Regional Chief of TFS with 39 years’ experience. Chairman (Director) for the Board of the NAFC, Director (Board Member) of AFAC, AFAC Council member and member of the State Fire Management Council (SFMC).
Rodney Sweetnam AFSM ESM
Local Government Association of Tasmania (LGAT) representative on the Commission since November 2009. Director Facilities Management and Municipal Emergency Management Coordinator with the Launceston City Council. LGAT representative on the SFMC from 2002 until his appointment on the Commission in 2009. Currently Group Officer of the Quamby Group and has held various officer positions as an active volunteer in brigades in Tasmania and Victoria.
Bruce Corbett AFSM
Tasmanian Retained Volunteer Firefighters Association (TRVFA) representative on the Commission since November 2006. Commenced with the Wynyard Brigade in 1977 and has held various positions in the brigade including Brigade Chief since 1991. Life Member of both TRVFA and the Wynyard Brigade. TRVFA representative and Company Secretary of the Council of Australian Volunteer Fire Associations Inc. Represents TRVFA on the Tasmanian Volunteer Awards Framework Management Committee, the State Volunteer Consultative Committee and the Volunteer Handbook Review Committee. President of the North West Branch of TRVFA.
Lyndsay Suhr AFSM
Tasmanian Volunteer Fire Brigades Association (TVFBA) representative on the Commission since July 2007. Commenced with the Glenorchy Central Brigade (now Wellington Brigade) in 1977 and has held various positions including that of Brigade Chief. Currently Group Officer of the Derwent Group. Life member of the TVFBA and Wellington Brigade. Member of the Wellington Trust Maintenance Coordinating Committee and Glenorchy Emergency Planning Committee. Represents TVFBA on the Operations and Resources Committee and Volunteer Handbook Committee. Southern delegate to the State Council of the TVFBA.
Paul Kingston BEc(Hons), GAICD
Department of Treasury and Finance representative on the Commission since December 2009. During his time as a Commission member, Mr Kingston held the position of Director, Procurement and Property within Treasury. Mr Kingston resigned his position with the Commission on 13 January 2015 to take up his new position as CEO of the Motor Accidents Insurance Board.
Dale Rayner
Southern Region Senior Station Officer with 26 years’ experience within TFS. Representative of the United Firefighters Union (Tasmania Branch) on the Commission.
Hannah Rubenach BA (Hons), Grad Dip Sc
LGAT representative on the Commission since January 2013, Councillor of Break O’Day Council, Volunteer Firefighter with St Marys Brigade since 1995 and Third Officer of St Marys Brigade.
Derek Inglis BEc (Hons) GAICD GDACG
Department of Treasury and Finance representative on the Commission since March 2015. Currently Assistant Director, Shareholder Policy and Markets Branch.
State Fire Commission
L to R: Lyndsay Suhr, Rod Sweetnam, Michael Brown, Bruce Corbett, Dale Rayner, Hannah Rubenach, Derek Inglis. Absent: Paul Kingston.
6 State Fire Commission Annual Report 2014-15

Executive Leadership Team
Michael Wayne Brown AFSM, BSocSc, MIFireE, EFOChief OfficerDirector (Chair), National Aerial Firefighting Centre (NAFC)Director (Board Member), Australasian Fire and Emergency
Services Authorities Council (AFAC) BoardChairperson , State Fire CommissionChair, TFS Executive Leadership TeamChair, TFS Learning and Development Policy GroupChair, TFS Leadership Strategy GroupCo-Chair, Emergency Services Review CommitteeMember, State Fire Management CouncilMember, State Emergency Management Committee
Gavin Stuart Freeman AFSM, MEmergMgt, Grad Dip Exec Lship, FIFireE Deputy Chief OfficerChair, AFAC Hazardous Materials Technical GroupChair, TFS Operational Leadership GroupChair, TFS Volunteer State Consultative CommitteeChair, TFS Central OH&S CommitteeChair, Tasmanian Emergency Services Capability and Capacity sub committeeChair, TFS Enterprise Bargaining CommitteeMember, AFAC Urban Operations GroupMember, Tasmanian Security Emergency Management Advisory GroupMember, State Fire Management CouncilMember, TFS State Consultative Committee
Damien John Killalea AFSM, BBus, GIFireEDirector, Community Fire SafetyChair, AFAC Community Safety GroupMember, Bushfire & Natural Hazards CRC Research & Utilisation CommitteeMember, National Fire Danger Ratings Project BoardMember, National Warnings and Communications Project Steering CommitteeMember, AFAC AIIMS Review Steering CommitteeMember, State Emergency Management Committee Recovery & Resilience Sub-committeeMember, Tas Natural Disaster Resilience Program Assessment PanelMember, TFS State Consultative Committee
Robyn Elizabeth Pearce Grad Cert App MgtDirector, Human ServicesChair, AFAC Work Health and Safety Technical Group Chair, TFS State Consultative CommitteeMember, AFAC Workforce Management NetworkMember, TFS Volunteer State Consultative CommitteeMember, TFS Central OH&S Committee
Jeremy Jeffery Smith Grad Cert App Mgt, Grad Cert PSMRegional Chief, SouthMember, AFAC Rural and Land Management CommitteeMember, AFAC Pacific Islands Fire Services Association
Member, TFS Operational Leadership GroupMember, TFS State Consultative CommitteeMember, TFS Volunteer State Consultative CommitteeMember, Southern Region Emergency Management CommitteeMember, TFS Representative Multi-Agency Coordination Group (MAC)
Scott Wilson-Haffenden B.ComDirector, Corporate ServicesChair, Divisional Employee Safety Representatives CommitteeMember – Inter-agency ICT CommitteeMember, Emergency Services Review CommitteeMember, DPEM Internal Audit CommitteeMember, AFAC Chief Information Officer’s CommitteeMember, Crimtrac Chief Information Officer’s Committee
Todd Crawford BA (Hons.) MEBusDPEM Director, Finance and Physical Resource Chair, TFS Passenger Vehicle CommitteeChair, TFS Building CommitteeMember, AFAC Business Management GroupMember, AFAC Collaborative Purchasing GroupMember, Agency Business Advisory CommitteeMember, Emergency Services Review CommitteeMember, DPEM Internal Audit Committee
Jeffrey Andrew Harper Grad Cert PSMRegional Chief, North WestMember, North West Emergency Management CommitteeMember, National Bushfire Arson ReductionMember, SEMAG Collaborative Leadership CommitteeMember, Northern Region Emergency Management Committee
Ian Stuart Bounds Grad Cert App Mgt, (Policing and Emergency Services AIPM)A/Regional Chief, North WestMember, AFAC Operational Equipment Technical GroupMember, North West Emergency Management CommitteeProject Manager, TFS AVL project
Andrew Lea ESM, Grad Cert EM, Grad Cert Mgt, Adv Dip Small Ship Operations, Dip Ap Sci (CD), Dip Maritime StudiesDirector, State Emergency ServiceChair, Australian Tsunami Advisory GroupChair, National Flood Risk Advisory GroupMember, Australasian Fire & Emergency Service Authorities Council (AFAC)Member, Australian Council of State/territory Emergency Services (ACSES)Member, ANZEMC Risk Assessment, Mitigation and Measurement Sub-Committee (RAMMS)Member, BoM Hazards Services ForumMember, Australian Emergency Management Volunteers Forum (AEMVF)
Robyn Pearce, Damien Killalea, Scott Wilson-Haffenden, Andrew Lea, Todd Crawford, Jeff Harper, Mike Brown, Gavin Freeman and Jeremy Smith. Absent: Ian Bounds
7 2014-15 State Fire Commission Annual Report

The State Fire Management Council (SFMC) is an independently chaired body established under Section 14 of the Fire Service Act, 1979. SFMC provides advice to the Minister and the Commission on all matters relating to management of vegetation fires in Tasmania. Its role is to enhance the efficient and effective management of bushfire-related risk in Tasmania to protect life, property and significant community values.
Current MembersIan Sauer (SFMC Chairperson)
Ian was appointed as Chair of the SFMC and the Fuel Reduction Burning Committee in October 2014. Ian is a dry-land sheep and cattle producer from Pipers Brook in northern Tasmania. He brings 35 years’ experience to the role, including experience in agriculture, natural resource management, policy formulation, project development, management, and community development as well as being a Volunteer Firefighter with the Pipers Brook Brigade and holding a range of positions including Brigade Chief. Ian has represented community groups at the local, State and national policy level, and been on national and State committees and boards.
Michael Brown AFSM, BSocSc, MIFireE Chief Officer
Michael is Chairperson of the Commission and TFS Chief Officer (CEO). He is the former Deputy Chief Officer and Regional Chief of TFS with 39 years’ experience. Chair (Director) for the Board of the NAFC, Director (Board Member) of AFAC, and an AFAC Council member.
Gavin Stuart Freeman AFSM, MEmergMgt, Grad Dip Exec Lship, FIFireE Deputy Chief Officer
Gavin has 30 years’ experience in the emergency management field as an operational fire officer, and spent the past 14 years as a manager, executive, leader and innovator. He was promoted to District Officer in 1998, Deputy Regional Chief–North in 2009 and Deputy Chief Officer in 2010. As Deputy Chief Officer, Gavin is primarily responsible for TFS’ operational arm and chairs or participates in a range of forums within TFS and across Government. At a national level, Gavin is Chair of the AFAC Hazardous Materials Technical Group and a member of the AFAC Urban Operations Group.
Peter Mooney
Peter has 36 years’ experience in parks management, and has been General Manager Tasmania Parks and Wildlife Service (PWS) since 2004. He has a strong commitment to building the capabilities of conservation agencies to manage reserves in partnership with local communities. The PWS places high priority on improved management of bushfire and fuel reduction burning.
State Fire Management Council
L-R Back: Katy Edwards, Mark Bryce, Sandra Whight. L-R Front: Peter Mooney, Ian Sauer, Gavin Freeman, John Atkinson, Nigel Foss. Absent: Mike Brown and Steve Whiteley
8 State Fire Commission Annual Report 2014-15
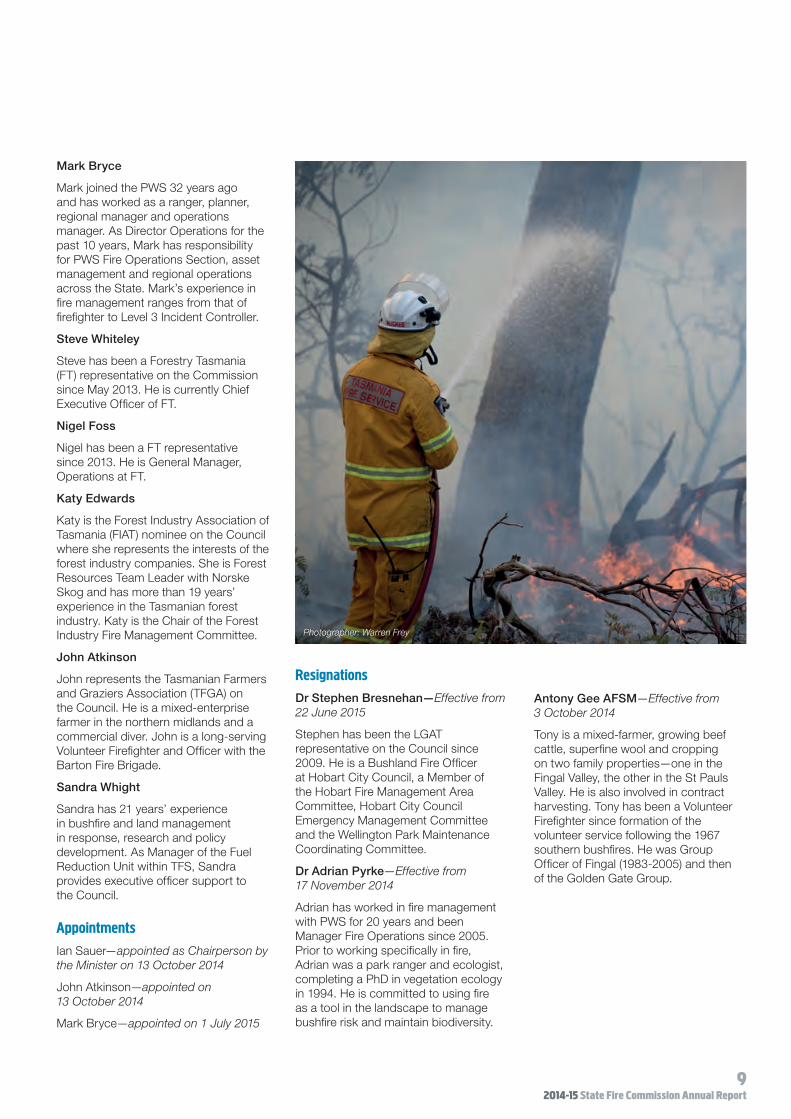
Mark Bryce
Mark joined the PWS 32 years ago and has worked as a ranger, planner, regional manager and operations manager. As Director Operations for the past 10 years, Mark has responsibility for PWS Fire Operations Section, asset management and regional operations across the State. Mark’s experience in fire management ranges from that of firefighter to Level 3 Incident Controller.
Steve Whiteley
Steve has been a Forestry Tasmania (FT) representative on the Commission since May 2013. He is currently Chief Executive Officer of FT.
Nigel Foss
Nigel has been a FT representative since 2013. He is General Manager, Operations at FT.
Katy Edwards
Katy is the Forest Industry Association of Tasmania (FIAT) nominee on the Council where she represents the interests of the forest industry companies. She is Forest Resources Team Leader with Norske Skog and has more than 19 years’ experience in the Tasmanian forest industry. Katy is the Chair of the Forest Industry Fire Management Committee.
John Atkinson
John represents the Tasmanian Farmers and Graziers Association (TFGA) on the Council. He is a mixed-enterprise farmer in the northern midlands and a commercial diver. John is a long-serving Volunteer Firefighter and Officer with the Barton Fire Brigade.
Sandra Whight
Sandra has 21 years’ experience in bushfire and land management in response, research and policy development. As Manager of the Fuel Reduction Unit within TFS, Sandra provides executive officer support to the Council.
AppointmentsIan Sauer—appointed as Chairperson by the Minister on 13 October 2014
John Atkinson—appointed on 13 October 2014
Mark Bryce—appointed on 1 July 2015
ResignationsDr Stephen Bresnehan—Effective from 22 June 2015
Stephen has been the LGAT representative on the Council since 2009. He is a Bushland Fire Officer at Hobart City Council, a Member of the Hobart Fire Management Area Committee, Hobart City Council Emergency Management Committee and the Wellington Park Maintenance Coordinating Committee.
Dr Adrian Pyrke—Effective from 17 November 2014
Adrian has worked in fire management with PWS for 20 years and been Manager Fire Operations since 2005. Prior to working specifically in fire, Adrian was a park ranger and ecologist, completing a PhD in vegetation ecology in 1994. He is committed to using fire as a tool in the landscape to manage bushfire risk and maintain biodiversity.
Antony Gee AFSM—Effective from 3 October 2014
Tony is a mixed-farmer, growing beef cattle, superfine wool and cropping on two family properties—one in the Fingal Valley, the other in the St Pauls Valley. He is also involved in contract harvesting. Tony has been a Volunteer Firefighter since formation of the volunteer service following the 1967 southern bushfires. He was Group Officer of Fingal (1983-2005) and then of the Golden Gate Group.
Photographer: Warren Frey
9 2014-15 State Fire Commission Annual Report
Key performance indicators
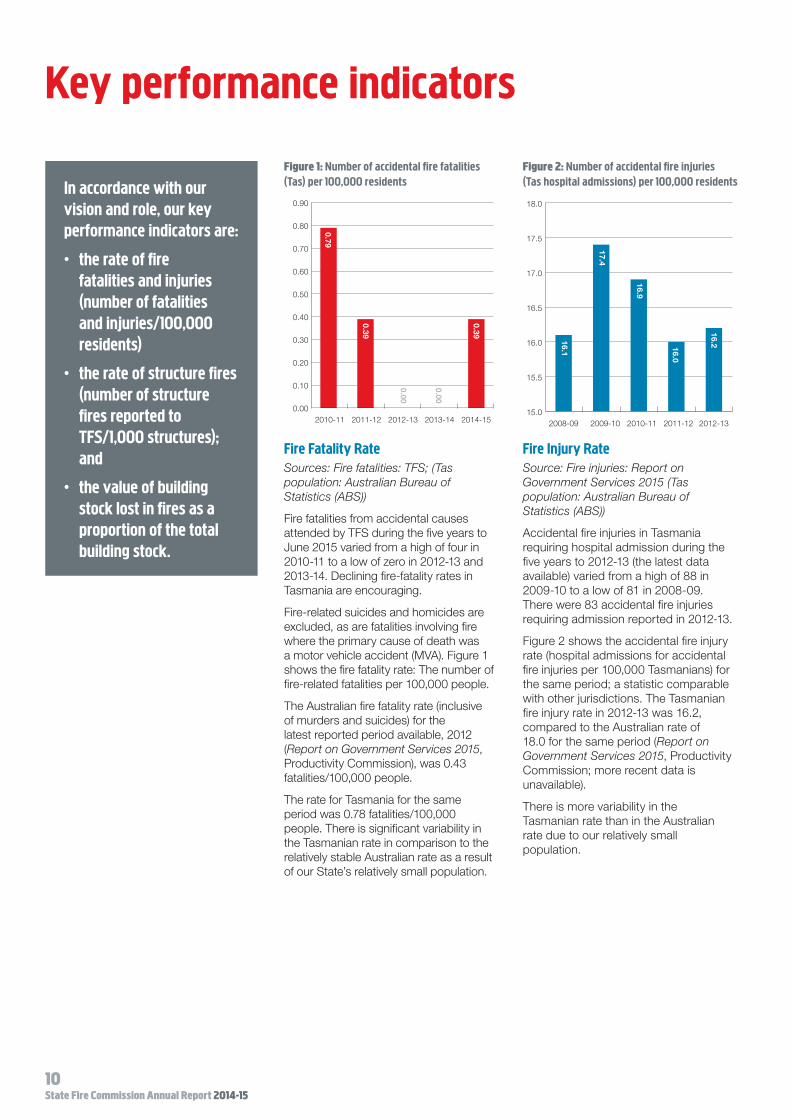
Fire Fatality RateSources: Fire fatalities: TFS; (Tas population: Australian Bureau of Statistics (ABS))
Fire fatalities from accidental causes attended by TFS during the five years to June 2015 varied from a high of four in 2010-11 to a low of zero in 2012-13 and 2013-14. Declining fire-fatality rates in Tasmania are encouraging.
Fire-related suicides and homicides are excluded, as are fatalities involving fire where the primary cause of death was a motor vehicle accident (MVA). Figure 1 shows the fire fatality rate: The number of fire-related fatalities per 100,000 people.
The Australian fire fatality rate (inclusive of murders and suicides) for the latest reported period available, 2012 (Report on Government Services 2015, Productivity Commission), was 0.43 fatalities/100,000 people.
The rate for Tasmania for the same period was 0.78 fatalities/100,000 people. There is significant variability in the Tasmanian rate in comparison to the relatively stable Australian rate as a result of our State’s relatively small population.
Fire Injury RateSource: Fire injuries: Report on Government Services 2015 (Tas population: Australian Bureau of Statistics (ABS))
Accidental fire injuries in Tasmania requiring hospital admission during the five years to 2012-13 (the latest data available) varied from a high of 88 in 2009-10 to a low of 81 in 2008-09. There were 83 accidental fire injuries requiring admission reported in 2012-13.
Figure 2 shows the accidental fire injury rate (hospital admissions for accidental fire injuries per 100,000 Tasmanians) for the same period; a statistic comparable with other jurisdictions. The Tasmanian fire injury rate in 2012-13 was 16.2, compared to the Australian rate of 18.0 for the same period (Report on Government Services 2015, Productivity Commission; more recent data is unavailable).
There is more variability in the Tasmanian rate than in the Australian rate due to our relatively small population.
0.00
0.10
0.20
0.30
0.40
0.50
0.60
0.70
0.90
0.80
2010-11 2011-12 2012-13 2013-14 2014-15
Number of accidental �re fatalities (Tas) per 100,000 residents
0.79
0.39
0.39
0.00
0.00
2008-09 2009-10 2010-11 2011-12 2012-13
Number of accidental �re injuries (Tas hospital admissions)
per 100,000 residents
15.0
15.5
16.0
16.5
17.0
17.5
18.0
16.1
17.4
16.9
16.0
16.2
Figure 1: Number of accidental fire fatalities (Tas) per 100,000 residents
Figure 2: Number of accidental fire injuries (Tas hospital admissions) per 100,000 residents
10 State Fire Commission Annual Report 2014-15
In accordance with our vision and role, our key performance indicators are:
• the rate of fire fatalities and injuries (number of fatalities and injuries/100,000 residents)
• the rate of structure fires (number of structure fires reported to TFS/1,000 structures); and
• the value of building stock lost in fires as a proportion of the total building stock.

Structure Fire RateSources: Structure fires: TFS; Structures: Department of Primary Industry, Parks, Water and Environment (DPIPWE)
Structure fires attended by TFS over the past five years varied from a high of 1,105 in 2012-13 to a low of 553 in 2014-15. Figures for 2012-13 include the 431 structures damaged or destroyed during the January 2013 bushfires, most of which were not attended at the time they burned.
Figure 3 shows the structure fire rate (structure fires per 1,000 structures) for the past five years. These rates are marginally lower than rates reported in 2013-14 as a result of increasingly accurate structure counts in Tasmania.
The value of building stock lost in fires as a proportion of total building stockSource: Insurance Statistics Australia Ltd
The value of fire insurance claims by Tasmanian householders as a proportion of housing stock insured is compared to provide an indicator of the value of building stock lost to fire as a proportion of all building stock in Tasmania, Data is available for the 12-month period to 31 March in each reporting year.
House fire insurance claims have varied from a high of $43.15 million in 2012-13 to a low of $7.94 million in 2011-12.
The significant increase in the loss rate depicted in Figure 4 is attributable to insurance claims resulting from insured dwellings damaged or destroyed during the 2012-13 bushfire season.
Performance Targets 2013-14 Actual
2014-15 Target
2014-15 Actual
2015-16 Target
2016-17 Target
Operational
Number of preventable structure fires per 1,000 structures 2.7 2.6 2.5 2.3 2.1
Number of false alarms (DBA) 3,367 2,900 3,219 3,100 3,000
Percentage of fires of undetermined cause 18.0% 17.5% 18.0% 17.5% 17.0%
Percentage of fires in structures confined to room of origin 71.6% 71.2% 72.2% 71.8% 71.2%
Financial
Operational surplus ($4.2m) ($3.8m) ($6.0m) ($3.9m) ($2.5m)
Return on assets (3.3%) (3.1%) (5.0%) (3.2%) (2.0%)
Return on equity (4.3%) (4.0%) (6.4%) (4.4%) (3.0%)
Debt to equity 3.5% 5.6% 5.1% 5.6% 5.8%
Current ratio 64.4% 47.4% 40.4% 34.1% 28.8%
Human Resources
Average sick days per employee 6.0 <6 5.3 <6 <6
Workers compensation claims 70 <50 69 <50 <50
0
0.0002
0.0004
0.0006
0.0008
0.0012
0.0010
2010-11 2011-12 2012-13 2013-14 2014-15
House �re insurance claims as a percentage of housing stock insured
Number of structure �res per 1,000 structures
2010-11 2011-12 2012-13 2013-14 2014-150.0
0.5
1.0
1.5
2.0
2.5
3.0
3.5
4.0
4.5
5.0
2.7 2.6
4.4
2.5
2.1
Figure 3: Number of structure fires per 1,000 structures
Figure 4: House fire insurance claims as a percentage of housing stock insured
11 2014-15 State Fire Commission Annual Report

Be a leader in emergency management and inter-agency relations
Commissioner of Police Darren Hine and Chief Officer Mike Brown.
12 State Fire Commission Annual Report 2014-15
TasFire Training (TFT)TFT continues to consult with major industries about effective emergency response in high-risk workplaces such as the mining and manufacturing sector. These major industries include Grange Resources, Unity Mining (North West), Cornwall Coal and Temco (North), and Nyrstar and Norske Skog in the South. The majority of these industries are also jointly serviced by TasFire Equipment (TFE).
In 2014-15, TFT worked closely with these industries to tailor Emergency Response Team training programs that target specific site risks at these typically isolated worksites. This training prepares site teams to respond effectively while
the nearest TFS brigade is alerted via 000. Well-trained Emergency Response Teams can mitigate on-site fire risks, often preventing small fires from developing into much larger incidents. Their key motivation is saving lives, with a secondary focus on asset protection and working effectively with the responding TFS brigade. An increasing number of workplace Emergency Response Team members are also active TFS volunteers.
• Improve public safety outcomes through effective inter-agency and stakeholder collaboration and interoperability.
• Maximise benefits and opportunities from involvement in national forums and initiatives.

13 2014-15 State Fire Commission Annual Report
State OperationsIntroduction of WebEOC™
To allow better information sharing across Tasmanian emergency services the WebEOC™ (Web Emergency Operations Centre) system was adapted for use during multi-agency incidents of all types. State Operations facilitated its introduction across TFS.
WebEOC™ was created with crisis management and public safety personnel in mind and has evolved to include information-sharing during all phases of a crisis or emergency. WebEOC™ promotes situational awareness through all levels of incident management and government agencies, and includes:
• an Internet based incident management system and information sharing tool
• support for multiple incidents and emergency operation centres (RFOCs and SFOC)
• information sharing between agencies (government, non-government and private sector), when required
• an ability to manage information, tasks and resource allocation effectively and efficiently
• a common operating picture across a diverse range of emergency service organisations; and
• real-time information sharing.
WebEOC™ was trialled during 2014-15 in the State Fire Operations Centre (SFOC) and Regional Fire Operations Centres (RFOC) only, with implementation into Incident Management Teams (IMTs) planned for the 2015-16 bushfire season.
Personnel working at an incident can be confident that the information they provide in situational reports (Sitreps) will
be used to develop the ‘big picture’ that is then posted on WebEOC™, ensuring other Emergency Service Organisations (ESOs) have excellent situational awareness.
State Operations works to ensure appropriate levels of training and support are provided to our WebEOC™ operators. Implementation of WebEOC™ presented a great opportunity to forge stronger partnerships with Tasmania’s other ESOs.
Common Operating Platform
TFS continues to work closely with DPIPWE—Emergency Services GIS, particularly in relation to the Common Operating Platform (COP). Several additional data layers were developed during 2014-15 to assist firefighting operations, including fire history, environmentally sensitive areas, vineyards, organic farms and inland waterways.
Public Information
TFS’ Publishing System continues to be used to distribute information to the community, TFS members, and media personnel during incidents. This information can be sent via SMS, email, and can be uploaded to the TFS web, Facebook and Twitter sites.
During 2014-15 TFS successfully distributed information using:
• media releases
• Fire Permit/TFB declarations
• social media messages; and
• community alerts such as Advice, Watch and Act, and Emergency Warning messages.
Since the last bushfire season, an upgrade to the publishing system now shows a community alert area using a shaded area, rather than a point on a map.
Web EOCAcross Agency
Situational Awareness
Situation Reports
Resource Requests
Incident Action Plans
Activitiesand Tasks
Operational Decisions
Alerts and Noti�cations

14 State Fire Commission Annual Report 2014-15
Aerial FirefightingTFS, PWS and FT progressed the use of water-enhancing products used by firefighting aircraft during bushfires, including “A” Class foam, gels and fire retardants. In consultation with the Environmental Protection Authority (DPIPWE) an analysis was undertaken to determine if the use of these fire chemicals on bushfires would have any adverse effects on the environment. Emergency Services GIS developed map layers identifying environmentally sensitive areas that were able to be included within the COP. The information provided enables Incident Controllers to assess an incident before using firefighting chemicals.
During the 2014-15 bushfire season, Tasmania had six contracted aircraft available to undertake firefighting operations. The aircraft included two medium and three light helicopters. In addition to rotary-winged aircraft a partially contracted, fixed-wing firebomber was also available. These firefighting aircraft were made available through NAFC arrangements.
This was the first time Tasmania had a partially contracted, fixed-wing firebombing aircraft available during the bushfire season. While the aircraft was not stationed in Tasmania, contractual arrangements allowed it to be deployed to the State from Victoria at a predetermined trigger point. The aircraft was deployed once during the 2014-15 bushfire season.
TFS introduced a web-based “Electronic Air Desk” designed to provide our Call When Needed (CWN) aircraft companies and firefighting air operations greater flexibility and detail when booking and using firefighting aircraft outside of NAFC contractual arrangements.
In 2014 Emergency Management Victoria contracted two Large Air Tankers (LATs) with capacity to drop large amounts of foam, retardant and/or water onto bushfires. Total capacity of each aircraft was approximately 11,350 and 13,250 litres respectively. Both aircraft were utilised in Western Australia, South Australia, and Victoria, as well as in Tasmania during the Lefroy fire of 2015. The LATs will be available from Victoria for the 2015-16 bushfire seasons.
OperationsMarine Response
Development of the TFS Marine Response capability slowed during the past 12 months to allow for progress on higher-level organisational priorities; however, operational staff continue to be trained in preparation for planned coordinated exercises at Hobart dockyards with TasPorts.
Purchase of four new transportable pumps during 2014-15 enhanced TFS ability to respond to incidents occurring within Tasmania’s small marinas. The pumps have undergone some minor modifications by TFS Engineering Services to allow greater flexibility when transporting and accessing these smaller marinas.
A full review of the marine training package is scheduled for early 2016 including plans to develop closer relationships with the Australian Maritime College and provide refresher training for marine response instructors to deliver training across TFS. These activities will enable marine capability to be extended to volunteer areas that have a marine response risk within their assignment areas.
Aviation Response
Competency maintenance and further development of operational staff in aviation response continued during 2014-15 through joint exercise activities undertaken with Aviation Rescue Fire Fighting Services (ARFFS). The established relationship between TFS and ARFFS continues to strengthen and has seen an increase in joint training exercises and sharing of training facilities across the State. For the first time in several years, a Memorandum of Understanding (MoU) was signed between TFS and ARFFS.
Tactical Command—Urban
TFS undertook a review of the Public Safety Training Package (PSTP) Units of Competence associated with Respond to and Supress Urban Fire with the intention of aligning these packages to meet changes in the urban environment.
CAFS were introduced onto major city urban pumpers and training has begun in Hobart and Launceston to upskill firefighters in this area. The planned rollout of new 3-1 class appliances to volunteer brigades means these brigades will also have CAFS capability. Training of volunteer firefighters in this new technology will occur in the near future.
Large Air Tanker (LAT) being used at the Lefroy fire. Photo courtesy of Ian Cawthorn.

15 2014-15 State Fire Commission Annual Report
TFS and Fire Rescue New South Wales (FRNSW) firefighters attended a four-day workshop held in Launceston as part of CAFS/Compartment Fire Behaviour Training (CFBT) programs. The workshop aimed to review and validate current packages and share skills and knowledge in the area of CAFS and CFBT. It proved beneficial in developing professional networks now and for the future.
Additionally, a review began of the Incident Operations Procedures (IOP) in the major response centres. As a result, the high-rise, multi-complex, structural fire and rescue response procedures in Hobart have been modified and the review will now move to Launceston, Devonport and Burnie.
Remote Area Team (RAT)
The RATs continued to be used on an as-needs basis during the summer period, depending on the circumstances of each incident. Deployments occurred to remote bushfires as a stand-alone agency response and as part of a multi-agency response team.
First Aid
TFS continues to deliver nationally accredited first aid training and all career staff, many volunteers and support staff hold this qualification. TFS also recognises qualifications gained from other Registered Training Organisations (RTOs).
In 2015, TFS joined Ambulance Tasmania’s (AT) Early Access to Defibrillation Program Emergency Services Partnership. This program is unique in Australia and has generated a good deal of interest nationally.
Nearly 50 volunteer brigades have purchased Automated External Defibrillators (AEDs) and registered to be part of the Early Access to Defibrillator program. More brigades are in the process of fundraising to purchase AEDs and all members of registered brigades will be offered first aid training in future.
Importantly, TFS provided a mapped brigade response area for registered brigades to alert AT dispatch operators in a timely fashion. To-date call numbers have been low but the potential lifesaving capability of this program is recognised. Although AT response will not be altered if a TFS brigade responds, this additional service to the community is clearly beneficial.
HAZMAT
Training and up-skilling of career firefighting staff continued this year with the successful delivery of a Statewide Hazmat Technicians Course based in Launceston. The 10-day intensive course provided 16 officers and firefighters with a range of enhanced skills and knowledge to build on existing capabilities.
Tasmania Police (TasPol) and TFS continue to collaborate on training initiatives designed to complement interoperability between the two agencies, in particular in the areas of bomb response, post-blast scene examination and clandestine laboratories.
TFS and TasPol completed a review and rewrite of the Tasmanian Government Chemical, Biological, Radiological & Nuclear (CBRN) Response Plan together with a MoU to facilitate joint operational response and CBRN resource sharing.
TFS continues to participate as a member of the AFAC Hazardous Materials Technical Group and the Operational Capability Group (CBRNOCG) to maintain links with national and international agencies. This provides a direct return in learning, knowledge and capability growth. Following the raising of the national threat level during 2014-15, a national review of doctrine, plans, equipment and training will occur in 2016.
In the 2014-15 financial year TFS attended 126 HAZMAT incidents with the majority of these being:
• LPG and natural gas leaks
• petrol or other flammable liquid spills; and
• minor chemical spills or leaks.
Fire Investigation
TFS continues to have a representative on the National Fire Investigation Group and has had direct involvement in development of the Advanced Diploma qualification in Fire Investigation. Throughout 2014-15, TFS fire investigation actively sought to establish a policy regarding self-extinguishing cigarettes and methylated spirit-type heating appliances. Additionally, TFS is working towards implementation of a reporting system attached to the Australian Incident Reporting System (AIRS) to capture improved data for use in operations and community information.
New doctrine inclusive of guidelines, instructions and safety alerts was developed for fire investigation. Additionally fire investigation courses for Leading Firefighters and a one-week inter-agency course were conducted in 2014-15.
DPEM, Techsafe and TFS continued to collaborate on joint training initiatives designed to complement interoperability between agencies in the areas of forensic and fire scene examination. The three entities participated jointly in national counter-terrorism exercises during 2014-15.
Left: First aid training exercise with Ambulance Tasmania, State Emergency Services and both volunteer and career TFS crews. Photo courtesy of New Norfolk Brigade.
Right: Brigades attending structure fire at Cygnet. Photo courtesy of The Mercury. Photographer: Luke Bowden

16 State Fire Commission Annual Report 2014-15
TFS and our partnership with the Nauru Fire Service through the Pacific Islands Fire Services Association (PIFSA) TFS has participated in a sustainable development program with the Nauruan Fire Service for more than a decade. This program aims to improve fire and emergency service provision in Nauru as part of AFAC’s commitment to support South Pacific island nations and Timor Leste.
The Nauruan Fire Service’s sustainable development program is provided in cooperation with the Pacific Islands Fire Service Association (PIFSA). PIFSA is a non-profit network comprised of fire and emergency services within the Pacific region.
PIFSA members work to actively support the building of safer and more resilient Pacific Island nations and communities. They do this by improving the technical and institutional capacity of fire and emergency services to enhance levels of fire protection, community safety and fire and emergency management through an integrated approach using national and regional partnerships.
Activities in 2014-15 included:
• a donation (at no direct cost to TFS) of an urban fire appliance to build on PIFSA’s current limited capability
• a personal protective clothing (PPC) upgrade through a coordinated assistance program managed by New South Wales Fire and Rescue
• administrative assistance with human resource management systems for contemporary staff statements of duties and reporting; and
• AFAC planning meetings and workshops to further develop consistent activities and opportunities across the emergency management sector.
Learning and Development (L&D)2014-15 saw a number of significant developments in operational training. In late 2014, TFS participated in a Registered Training Organisation (RTO) audit by the Australian Skills Quality Authority (ASQA), the national VET training regulator. As a result in 2015, TFS completed a significant body of work to ensure compliance with the Standards for Registered Training Organisations.
For the first time, TFS delivered a structured training program for Station Officers moving to Senior Station Officer positions. Candidates were selected based on operational needs and attended the first of three two-week development blocks. Considerable work was also completed on a transition group that moved between the recognition process to the new development program.
Development of Incident Management Team (IMT) training materials continued with funding from the Commonwealth Attorney-General’s department. Considerable progress was made towards its completion by the December 2015 deadline. Training materials were developed and pilot programs rolled out across four jurisdictions, including Tasmania, ACT, South Australia and the Northern Territory.
National funding was provided for development of a new Volunteer Brigade Basics DVD that will support brigades in conducting basics training. A focus group was established to develop the materials, which are now under review and due for completion at the end of 2015.
Operational training staff reviewed and validated a significant amount of both career and volunteer accredited and non-accredited courses. Significant effort was also invested to enhance the Volunteer Training Pathway and incorporate new units of competency and improved training outcomes. Effort was also made on development of new curriculum for the Trainee Firefighter Development Program scheduled to start in August 2015.
Staff are now able to access Organisational Learning and operational training policies and documents on TFS’ intranet site and training related doctrine was completed in line with the broader organisational doctrine project. Included in this body of work was a full review of training ground risk assessments and safe work method statements to enhance the safety of staff using TFS training facilities.
Left: Donated urban fire appliance to build on PIFSA’s current limited capability.
Right: Trainee Firefighters undertaking training activities at Cambridge Training Complex.

17 2014-15 State Fire Commission Annual Report

Deliver safe, effective and efficient strategies for preventing and responding to fires and other emergencies
Trainee Firefighters undertaking Road Crash Rescue training.
18 State Fire Commission Annual Report 2014-15
FireCommFireComm, as part of State Operations, is the centralised call receipt, dispatch and communications centre for TFS. The FireComm team comprises 16 Communications Officers and one Supervisor who initiate emergency responses on behalf of TFS. The recording and transmitting of important information supports operational needs through to incident completion and includes community warnings and emergency alert messages during times of crisis.
FireComm receives and records all incident information in relation to bushfires on land managed by FT and PWS and manages dispatch of SES units to motor vehicle accidents.
During 2014-15, FireComm staff completed formal training in a number of disciplines, including Certificate III
and IV in Public Safety (Emergency Communications Centre Operations).
FireComm staff actively developed and practiced using the Cambridge facility. This ensures FireComm’s resilience and system redundancy in the event it is required.
The review into FireComm instructions, guidelines and call-taking scripts improved service delivery and customer/client relations.
FireComm handled a total of 10,776 emergency incidents during 2014-15. These figures reflect incidents where TFS resources were deployed, 85 bushfire incidents where the sole respondent was either FT or PWS, and four incidents where SES was the sole respondent.
• Allocate and deploy resources based on assessed risk.

0
10
20
30
40
50
60
2010-11 2011-12 2012-13 2013-14 2014-15
Median call handling times 2010-11 to 2014-15
SE
CO
ND
S
52
49
53
49
51
Type of incidents attended 2014-15
False Alarm - non malicious 46.4%False Alarm - malicious 1.4%Fire/explosion 33.2%Rescue 12.5%Other 6.4%Hazmat 0.1%
0
5
10
15
20
2010-11 2011-12 2012-13 2013-14 2014-15
Response times (structural �res) 2009-10 to 2013-14
MIN
UTE
S
90th Percentile 50th Percentile
14.9
14.7
15.5
16.1
16.4
8.3 8.1
8.2
8.3
8.8
Type of �res attended 2014-15
Bush�re 42%Vehicle 20%Structure 6% Rubbish 16% Other 6%
Number of incidents 2010-11 to 2014-15
False alarms Emergencies Not reported
2
4
6
8
10
12
145,267
4,943
4,655
4,828
4,685
5,752
6,013
5,901
5,645
5,690
348
390
750
428
398
0
2010-11 2011-12 2012-13 2013-14 2014-15
11,367
11,346
11,306
10,901
10,773
2010-11 2011-12 2012-13 2013-14 2014-15
11,367
11,346
11,306
10,901 10,773
Total incidents attended by TFS brigades 2010-11 to 2014-15
10,400
10,500
10,600
10,700
10,800
10,900
11,000
11,100
11,200
11,300
11,400
11,500
The 2015 Lefroy fire. Photo Courtesy of The Mercury. Photographer: Ross Marsden
Vertical Rescue training exercise. Photographer: Warren Frey
19 2014-15 State Fire Commission Annual Report

Vertical Rescue training. Photographer: Warren Frey
2010-11 2011-12 2012-13 2013-14 2014-15
False alarms (Direct Brigade Alarms) 2010-11 to 2014-15
0
500
1,000
1,500
2,000
2,500
3,000
3,500
4,000
4,500
3,854
3,569 3,186
3,367
3,219
20 State Fire Commission Annual Report 2014-15
Reduction of Unwanted Alarms and Unnecessary False CallsTFS maintained its focus on reducing unwanted alarms and unnecessary false calls. The primary strategy consists of engaging with individual premises with high incidence of false alarm activations to discuss their individual alarm systems and provide them advice on measures to reduce avoidable false alarms.
This primary strategy has resulted in a steady decline in false alarm activations as a percentage of the total incidents attended by TFS (from 35% in 2010 to 31% in 2015). Further work is underway to identify how TFS can improve brigade fire reporting information (captured through the fire incident reporting system AIRS) to improve datasets for further false alarm cause interrogation and development of future reduction strategies.
During 2014-15, TFS introduced an information pamphlet developed in collaboration with the AFAC Unwanted False Alarm Sub Group. This national initiative is aimed at providing owners and occupiers of premises fitted with Direct Brigade Alarms (DBAs) information on false alarm reduction strategies they can employ.
RescueTFS is the primary support agency to TasPol for a variety of technical rescue roles within the State. These roles include:
• Road Crash Rescue (RCR), including heavy vehicles
• Confined Space Rescue
• Trench Rescue
• Vertical Rescue
• Industrial and Domestic Rescue; and
• Urban Search and Rescue (USAR).
Calls-to-rescue incidents accounted for approximately 12% of all incidents responded to by TFS in 2014-15, representing a 1% reduction on the previous reporting period. RCR accounts for the vast majority of all rescue incidents attended and TFS’ capability has steadily increased since formally assuming this role in urban areas in 2006.
TFS works closely with the SES in the provision of RCR where the SES has this responsibility in rural areas. In some locations, dual response zones exist where both TFS and SES respond simultaneously to RCR emergencies.
Capabilities in RCR are:
Southern Region
Heavy Rescue Hobart
Light Rescue Clarence, Bridgewater and Triabunna1
Northern Region
Heavy Rescue Launceston
Light Rescue Launceston and Rocherlea
North West Region
Heavy Rescue Burnie and Devonport
Light Rescue Burnie (trial)
1 Triabunna is the only TFS volunteer station with RCR capability

TFS MVA and RCR dispatches and actual rescues 2010-11 to 2014-15
2010-11 2011-12 2012-13 2013-14 2014-15
MVA Dispatch RAR Dispatch TFS Rescue(actual)
0
100
200
300
400
500
600
700
800
900
1,000
831 748
640
684
688 627
707
702
750
103
51
41
79
88
78
2010-11 2011-12 2012-13 2013-14 2014-15
Accidental residential structure �res 2010-11 to 2014-15
0
50
100
150
200
250
300
350
400
450
500
401
411
439
395
350
Cause of �res attended 2014-15
Accidental - design fault 7%Accidental - misuse 26%Accidental - natural 3%Deliberate 40%Other 6%Undetermined 18%
Cause of all �res 2010-11 to 2014-15
0%
10%
20%
30%
40%
50%
60%
70%
80%
90%
100%
2010-11 2011-12 2012-13 2013-14 2014-15
Undetermined Determined cause
19%
18%
19%
18%
18%
81%
82%
81%
82%
82%
2010-11 2011-12 2012-13 2013-14 2014-15
Total structure �res 2010-11 to 2014-15
0
100
200
300
400
500
600
700
800
900 663
645
676 631 553
2010-11 2011-12 2012-13 2013-14 2014-15
Structure �res con�ned to theroom of origin 2010-11 to 2014-15
10%
20%
30%
40%
50%
60%
70%
80%
90%
100%
0%
70.0%
72.7%
71.3%
71.6%
72.2%
Road Crash Rescue training. Photographer: Warren Frey
Photo courtesy of The Mercury. Photographer: Kim Eiszele
21 2014-15 State Fire Commission Annual Report

Photographer: Warren Frey
22 State Fire Commission Annual Report 2014-15
Work-at-HeightAs a result of recent Workplace Health and Safety (WHS) legislative changes a number of training packages have been developed to address identified skills gaps. These will be rolled out to brigades during 2015-16. Guidelines are being developed to capture operational procedures and legislative compliance requirements. In 2014-15:
• height safety system kits were procured for brigades identified with specific risk (key structural brigades within each district) and will be allocated on completion of relevant training;
• training props have been and continue to be developed to assist with initial and ongoing skills maintenance requirements; and
• work with the SES began to identify support requirements for both training and operations where the need is identified.
Additionally, Learning and Development (L&D) has reviewed the training package for Work at Heights and it is now nearing completion. This package includes a range of topics such as ladder use, use of height safety packs, roof anchor points, the ‘Take Five’ process and general safety issues when working at height.
DrivingDuring 2014-15 TFS driver training was enhanced considerably. A reference group was established to work through the national legislation requirements of National Heavy Vehicle Fatigue Management Law and continues to liaise with the Department of State Growth to provide compliance and recording policies across all sectors of TFS for vehicles over 12 tonnes. Additionally, Induction and Safe Driving sessions were refined and successfully delivered at the 2014 Trainee Firefighter Course. This session complies with the Workplace Health and Safety requirements and will form part of the TFS Administration Instruction.
The working group also reviewed and updated training packages for other TFS resources and Training Resource Kits (TRKs), resulting in improved and contemporary training delivery.
Automatic Vehicle Location (AVL) ProjectThe AVL Project aims to have our dispatch and regional operations centres use this technology primarily during emergency incidents to ensure operational vehicle locations are known during incident response and operations. Extended applications and further development of the technology will improve TFS capacity to enhance safety of personnel in the broader work environment. As part of this project during the past year more than 200 vehicles were fitted with the technology that works on both 3G phone networks and the TFS radio network, providing robust redundancy and increased coverage. The AVL device and radio have been combined into a compact unit that is generally housed under the seat and notification/information is placed in the vehicle once the unit has been fitted.
Breathing Apparatus (BA)Three new BA cylinder filling stations were purchased and installed at Cambridge, Youngtown and Burnie. A new compressor was also installed at the Burnie Fire Brigade. Devonport Fire Station’s ageing filling station has been removed.
Early in 2014, Draeger visited TFS to reprogram the new Draeger 1000 Distress Signal Units (DSU) bodyguards following a number of reported problems. During an investigation, Draeger discovered a software issue when removing the DSU tally tag and decided to replace all 700 units. Distribution of the recalibrated units was slow at first as Draeger also had to produce an additional 2,500 units for the New Zealand Fire Service, which had experienced the same software issue as TFS. The replacements are identical in appearance and operation to the original units.
A number of DSUs with the new settings were trialled at Hobart and Glenorchy and positive feedback from these trials determined that the new calibrations would reduce false activation significantly.
A review of breathing apparatus policies and procedures was undertaken in late 2014 to bring them into line with current TFS doctrine format. This enabled the information to be compressed into three relevant documents: BA Procedures, BA Responsibilities and BA Decontamination.

New Gemini structural firefighting ensemble.
23 2014-15 State Fire Commission Annual Report
Planning and CapabilityTowards the end of 2014, TFS conducted its annual Statewide ‘Exercise Connect’ using the Northern Region as the operational deployment hub. The aim of the exercise was to test deployment, command and control of multiple Task Forces responding across the Regions.
The main objectives were to practice use of:
• SFOC
• RFOCs (South and North)
• WebEOC
• Staging Area Management
• Operational Aircraft Management and working safely around aircraft; and
• CAFS.
A range of scenarios were established within close proximity to the Northern Region Headquarters and the four Task Forces rotated between each scenario, giving all participants the opportunity to observe activity at each site.
The main aim was to test TFS capability to command and control crews and vehicles as they responded to each different scenario just as if they were being deployed to an actual incident.
Personal Protective EquipmentTFS is committed to the highest standard of protection of our firefighters through use of appropriate Personal Protective Clothing (PPC).
Structural PPC
During 2014-15, TFS procured 670 sets of new Gemini structural firefighting ensembles—the start of an ongoing program that will see these rolled out across the organisation.
Vegetation PPC
A new, innovative material, Tecasafe Plus, is now being used in this ensemble instead of the traditional proban material.
Both of these new ensembles are lighter weight garments and provide increased flexibility while improving protection.
Bushfire Season 2014-15 OverviewConditions during autumn and winter led to expectations of normal fire potential for season 2014-15 everywhere except the central part of the East Coast, which was significantly drier than normal. This resulted in above normal fire potential for the East Coast and normal bushfire season potential for the rest of the State1.
Windy and dry conditions resulted in a Total Fire Ban (TFB) in the Southern Region on 28 September 2014; the second earliest TFB recorded in the State. The peak Fire Danger Index (FDI) recorded this day was 63 and remained the peak value for the entire season. As the dry conditions continued through spring, the area of concern expanded to cover the land between St Helens and Marion Bay, west to the Midlands and the Lower Derwent Valley2.
As summer progressed conditions remained relatively mild with relieving rains in early January and relatively fewer days with dangerous fire weather compared to other seasons. A second TFB was required for the Southern and Northern Regions on 3 January 2015.
Late summer saw more rain and this continued into autumn. This resulted in a bushfire season notable for very few fires of any size or requiring more than a day to affect their control.
The most significant fire of the bushfire season was at Lefroy which, although smaller than 1,000ha, threatened the township and considerable critical infrastructure in the area. Other large fires occurred near Runnymede and Conara in November and at Hayes, Lanes Tier and Lake Tooms in April. The Fire Permit Period was revoked on 1 April 2015 and the length of the period was close to the long-term average.
1 Southern Australia Seasonal Bushfire Outlook 2014–15. Hazard Note 2, September 2014, Bushfire and Natural Hazards Cooperative Research Centre.
2 Southern Australia Seasonal Bushfire Outlook 2014 – 15: November Update. Hazard Note 3, November 2014, Bushfire and Natural Hazards Cooperative Research Centre.

Lefroy fire. Photographer: Chrissie Anquetil
24 State Fire Commission Annual Report 2014-15
Bushfire StatisticsFire Permit PeriodCommenced for the whole State on 20 November 2014 and concluded on 1 April 2015. During this period 1,769 Fire Permits were issued across the State: 612 in the North West, 488 in the North and 669 in the South. This is a 51% increase from the 2013-14 Fire Permit Period.
Registered Burns–No Permit RequiredThe Tasmanian public informed TFS about 11,783 occurrences of fire use where a Fire Permit was not required. This is a 38% increase in notifications from the previous reporting period.
Total Fire BansTwo TFBs were declared: one for the South on 28 September 2014 and another for the South and the North on 3 January 2015.
BushfiresThe bushfire season total of 1,426 bushfires is 30% less than the average for the previous 16 bushfire seasons.
Total Area BurntThe total area burnt by bushfire in 2014-15 was 6,848ha: 291ha in the North West, 3,219ha in the North and 333ha in the South. This was the second smallest total area burnt in the preceding 11 bushfire seasons and represented just 18% of the average total area burnt across those seasons.
Major Bushfires, where fires have been mapped
Incident date
Street Location Region Area burnt (ha)
15-Nov-14 Tasman Highway Runnymede Southern 1760
03-Mar-15 Curries Dam Road George Town Northern 1061
17-Apr-15 Tooms Lake Road Ross Northern 557
17-Nov-14 Midland Highway Conara Northern 387
09-Apr-15 Lanes Tier Road Ouse Southern 340
07-Sep-14 Tasman Highway Dianas Basin Northern 327
17-Apr-15 Lyell Highway Hayes Southern 299
25-Feb-15 Musk Vale Road Bell Bay Northern 198
15-Nov-14 Wilmot Road Forth North West 177
28-Sep-14 Narrows Road Dover Southern 166
19-Oct-14 Tasman Highway St Helens Northern 155
Fire Permit Summary
Region Number of Fire Permits
2011-12
Number of Fire Permits
2012-13
Number of Fire Permits
2013-14
Number of Fire Permits
2014-15
North West 422 43·6 331 612
Northern 478 388 309 488
Southern 504 394 532 669
Total for State 1,404 1,218 1,172 1,769

25 2014-15 State Fire Commission Annual Report
TFS delivers a broad range of programs to improve the safety of people in the community with a focus on those most at risk from structure fire or bushfire. These programs aim to prevent fires and minimise the impact of any fires that do occur. The Community Fire Safety Division focuses on delivering programs that improve fire safety in homes, workplaces and other locations such as healthcare facilities and schools. Targeted risk mitigation initiatives were undertaken with a wide range of identified risk groups, including children, elderly people, people with disabilities living in the community, workplaces, and remote and isolated communities.
Build community capacity to prevent, respond to and recover from fires and other emergencies
• Build partnerships with communities and share responsibility for risk.
• Develop and implement customised community-based risk assessment and management strategies in collaboration with local communities.
The Community Fire Safety Division focuses on delivering programs that improve fire safety in homes, workplaces and other locations such as healthcare facilities and schools.

Georgina Bonfield, 8, with (from left) Station Officer David Homan, School Fire Educator Craig Machen and Firefighter Ben Phillips. Photo courtesy The Advocate. Photographer: Katrina Docking
www.theadvocate.com.au
The Advocate, Monday, August 11, 2014 — 3
DANNY HOLMES
c u r t a i n s & b l i n d s
5 Rettkes Rd, Somerset (off Back Cam Rd)
Phone: 6435 [email protected]
DANNY HOLMESc u r t a i n s & b l i n d s
UPTO40%OFFON ALL PRODUCTS
Verticals
Roller Blinds
Slimline Blinds
Curtains
Honey Comb
BlindsPanel BlindsFree measure &
quote to all areas.
DANNY HOLMES
c u r t a i n s & b l i n d s
5 Rettkes Rd, Somerset (off Back Cam Rd)
Phone: 6435 [email protected]
DANNY HOLMESc u r t a i n s & b l i n d s
UPTO40%OFFON ALL PRODUCTS
Verticals
Roller Blinds
Slimline Blinds
Curtains
Honey Comb Blinds
Panel Blinds
Free measure &
quote to all areas.
TA1435045
Covering the
North West
(includingSmithton)
Fire tragedy avoidedBrave 8-year-old puts education program into action
LITTLE FIREFIGHTER: Georgina Bonfield, 8, with (from left) station officer David Homan, school fire educator Craig Machen and
firefighter Ben Phillips. Picture: Katrina Docking.
By EMILY WOODS❛❛ I was standing
right next to her
and before I even
realised she was
on fire, she had put
the fire out. ❜❜
Samantha Bonfield
❛❛ I was standing
right next to her
and before I even
realised she was
on fire, she had put
the fire out. ❜❜
Samantha Bonfield
A QUICK-THINKING
young girl saved her own
life when her clothing
caught fire.
Extensive power outages
in the North-West, caused
by the strong winds and
stormy conditions
recently, led Georgina
Bonfield’s family to use
candles.
‘‘I was playing with my
sister,’’ Georgina, 8,
recalled.
‘‘And I put my arm over a
candle, to grab something,
and my pyjamas caught
alight.‘‘I dropped straight down
to the floor and put it out.’’
The Miandetta Primary
School pupil’s mother,
Samantha Bonfield, was
amazed at her daughter’s
ability to stop, drop and
roll, without hesitation.
‘‘I was standing right
next to her and before I
even realised she was on
fire, she had put the fire
out,’’ Mrs Bonfield said.
Georgina’s actions are a
testament to Tasmania
Fire Service’s (TFS) School
Education Program.
‘‘When we get evidence
like this from a family, it’s
very gratifying,’’ TFS
senior station officer in
community education,
Chris Tomes, said.
‘‘That situation could
have been very traumatic.
It’s what drives you to run
this program and keeps
the motivation of the
people who deliver the
program right up there.’’
North-West district
education officer, Craig
Machen, attends 60 schools
every couple of years. He
visited Miandetta Primary
in May.
‘‘My initial reaction was
silence; I had to digest it, I
get a bit emotional about
those things,’’ Mr Machen
said.‘‘It really meant a lot to
me, to know that the
information I’m passing
on is making a difference.’’
The fire safety program,
which has been running
for almost 20 years, uses
different methods to
engage primary school
pupils.
‘‘We use a hands-on
approach and a very
interactive program. It’s
about being active and
getting to stop, drop and
roll in the classroom,’’ Mr
Tomes said.
‘‘Students are also asked
to develop a fire escape
plan, and we get the
students to bring that plan
home and work on it with
the family, which gets
parents and siblings
involved.’’
Georgina’s mother was
grateful for the program
that saved her daughter’s
life.‘‘She ended up with a few
little minor burns on her
arm,’’ Mrs Bonfield said.
‘‘If she had panicked and
flapped her arms around,
it could have been a lot
worse.’’
■ To learn more about the
TFS education program, visit
http://www.tfseducation-
.com.au/.
POSITIVE NEWS: Tasmania Fire Service North-West station officer David
Meldrum says there has been a decline in house fires. Picture: Stuart
Wilson.
House fire numbers
in state start to fizzleBy EMILY WOODS
RATES of house fires in Tas-
mania are among the lowest in
the country, thanks to effective
advertising, community preven-
tion projects and education.
Tasmania Fire Service North-
West station officer David Meld-
rum said fire-related tragedies
were at a record low this winter.
‘‘We’ve definitely seen a drop
off in house fires, and our deaths
from fires are significantly lower
than the national average,’’ Mr
Meldrum said.
‘‘There’s been a big change in
the frequency of call outs to fires;
they are definitely a lot less this
year and the severity of the fires
has dropped dramatically.’’
Mr Meldrum said there were
several factors which helped
keep the numbers low.
‘‘Contributing factors include
successful school education on
fire safety, and community edu-
cation programs, reminding peo-
ple every winter to check the
danger zones, like power points
and heaters,’’ he said.
The firefighters themselves
were also using best-practice
methods to contain the fires.
‘‘Most fires are contained to the
room of origin, which prevents
complete destruction. This is
down to the community and the
strategies employed by the fire-
fighters,’’ Mr Meldrum said.
The station officer said volun-
teers were the lifeblood of the
service.
‘‘Volunteers are a huge re-
source for us. They are able to go
out and check houses, they
change smoke alarms for the
elderly,’’ he said.
The Tasmania Fire Service’s
advertising campaigns were an-
other tool for creating public
awareness.
‘‘The safety campaigns help to
alert people to the dangers. This
includes cleaning heater fluids
before the season starts, making
sure washing is two metres from
the heater and cleaning lint out
of dryers,’’ Mr Meldrum said.
Mr Meldrum’s parting words to
the community were ‘‘keep up
the good work and ensure you
have a fire safe plan for the
home’’.
NEWS
26 State Fire Commission Annual Report 2014-15
Mitigation of Fire Risk for ChildrenHistorically, children have been over-represented in home fire morbidity and mortality statistics in Tasmania. Schools are also a priority for bushfire protection and emergency planning.
School Fire Education Program
The TFS School Fire Education Program was designed to teach children from Prep to Grade six about basic home fire safety and empower them to make safer choices about fire risk. The program is offered to all Tasmanian primary schools and more than 95% of Tasmanian children participate in the program at least twice during their primary school education. There is substantial evidence that the program is effective in increasing fire safety knowledge and skills for both the children it reaches directly, and for adults in the community.
The school-based program also aims to prevent the onset of firelighting among children by increasing their awareness of the dangers of fires and encouraging them to make safe choices about fire. The success of this is reflected in reduced referrals to TFS’ secondary arson prevention program for children, the Juvenile Fire Lighter Intervention Program (JFLIP).
Specially-trained TFS career firefighters provide classroom lessons and take-home learning resources through the School Fire Edication Program. Age-appropriate learning activities and resources have been developed and reviewed in consultation with educators. An evaluation of the program is currently being undertaken by a TFS career firefighter as his research project for a post-graduate qualification in education.
In 2014-15 the program was delivered to 16,285 primary school children in 81 schools.
Bushfire-Ready Schools
The Community Protection Planning Unit coordinates Bushfire-Ready Schools and Bushfire-Ready Sites. These initiatives use bushfire science to categorise sites based on their survivability during a bushfire event and prescribe tailored risk treatments. Through these joint initiatives, stakeholder groups such as the Department of Education (DoE) and Department of Health and Human Services (DHHS) are being engaged with and developing strategies for bushfire protection and emergency management at high-risk sites.
During 2014-15, 68 sites were assessed and protection strategies developed. These strategies focus on asset-level fuel management and building retrofits for ember protection. Community Protection Planning through Bushfire-Ready Schools and Bushfire-Ready Sites works with key stakeholders to generate a greater understanding and mitigation of their bushfire risk.
“In 2014-15 the [School Fire Education] Program was delivered to 16,285 primary school children in 81 schools.”

Peer Education Program participants.
27 2014-15 State Fire Commission Annual Report
Mitigation of Fire Risk for Older People and People with DisabilitiesThe majority of fire fatality victims in Tasmania have been aged 60 years or older and elderly people and people with disabilities living in their own homes have been identified as a major risk group for home fires and fire morbidity. Tasmania’s ageing population and increased demand for the provision of care to people in their own homes makes this issue of particular relevance in our State.
Project Wake Up! (PWU!)
PWU! is a state-wide home fire safety program through which career and volunteer brigades provide home fire-safety checks and installation of smoke alarms in the homes of the elderly and people with disabilities.
It began as a state-wide program in 1999, following a project undertaken by the New Norfolk Volunteer Brigade. The Brigade developed a program for the large population of elderly people and people with disabilities living in their community, including those who had previously lived in the Royal Derwent Hospital.
The components of PWU! are:
• a home fire safety audit—observation and advice regarding specific risk factors and discussion of escape plan
• a general home fire safety information—provision of home fire-safety resources and general advice (for example, safe heating and cooking, smoke alarm maintenance, escape plan); and
• installation of smoke alarms (photoelectric, 10-year lithium battery, installed to AFAC standard).
A total of 175 aged care service providers around the State refer clients to the program. In 2014-15, PWU! provided services to 305 clients, including installation of 565 smoke alarms. All career brigades and all 143 volunteer brigades are involved in delivering the program.
Council on the Ageing (COTA) Home Fire Safety Peer Education Program
Following the success of this program in 2012-13 and 2013-14, TFS committed to it again in 2014-15. The rationale behind peer education is that peers are accepted as trusted and credible sources of information because they share similar experiences and social norms and are therefore well-placed to
provide relevant, meaningful, explicit and honest information. Peer education is proven to break down barriers and open channels of communication. This collaborative approach offers older people opportunities to participate in conversations about issues that affect them and to access the information and services they need to protect their wellbeing.
Outcomes of the Peer Education Program have included participants from identified fire risk groups:
• increasing their knowledge about home fires
• gaining greater understanding of what they can do to prevent home fires; and
• gaining greater understanding of what they can do to reduce or limit the severity of fire in their homes.
During 2014-15 this program reached approximately 500 community members around the State.
Smoke Alarms for the Deaf and Hard of Hearing
People who are deaf or hard of hearing are at increased risk of injury or death resulting from a house fire compared to hearing people in comparable living situations. ABS census data indicates there are at least 200 Auslan Signing people in Tasmania. It is estimated that hearing impairment in Australia (those aged 15 years and over) is around 22% or 3.25 million people.1
Since July 2010 the TasFire Equipment
1 Statistics from The Deafness Forum
(TFE) and Community Education units of TFS have worked with The Tasmanian Deaf Society (TasDeaf) and DHHS (Disability and Housing) to deliver home fire safety programs for deaf and hard of hearing Tasmanians. This includes home fire safety checks and installation of subsidised special smoke alarms by TFE officers. This program assists to provide the deaf and hard of hearing community in Tasmania with equitable access to essential and potentially life-saving equipment.
In 2014-15, 24 deaf and hard of hearing clients had specialist smoke alarms installed in their homes. Seventy-two clients have now received these special alarms since the program began in 2010.
TFS’ Community Education Unit also reached out to a number of people with hearing difficulties through a series of community education talks on home fire safety.

28 State Fire Commission Annual Report 2014-15
Mitigation of Bushfire and Flood Risk for TouristsVisitor Information Network National Disaster Resilience Project
The catalyst for this project was the realisation of our duty of care to visitors (including interstate or international tourists and Tasmanians travelling out of area) that was highlighted during the 2013 Dunalley/East Coast fires. Following those events, Tasmanian Visitor Information Centres (VICs) wanted to be prepared and appropriately equipped to provide information to visitors on bushfire and other weather related events and to have adequate systems in place to enable them to perform a useful role in times of emergencies.
This is a collaborative project between the Tasmanian Visitor Information Network (VIN), TFS Bushfire-Ready Neighbourhoods program and the SES. The project commenced in 2014-15 for implementation prior to the 2015-16 bushfire season and builds VICs’ capacity to deliver alerts and warnings about bushfires and other emergencies to visitors. The project incorporates training and education to increase preparedness for emergencies, including:
• developing a manual incorporating:
- an introduction to bushfire behaviour and incident management
- TFS regions and bushfire risk
- Fire Danger Ratings and Alert Levels
- Evacuation Centres; and
- flood, storm and tsunami prone areas
• educating representatives of all 20 accredited visitor centres through workshops held across the State to address content of the manual
• adding all VICs to the existing emergency electronic messaging system; and
• increasing emergency awareness of tourism operators, with VICs providing notifications to this group when an emergency alert is received.
Another outcome of the project is the ongoing education of visitors about bushfire and other natural hazards in Tasmania, through production and distribution of targeted bushfire and flood brochures with visitor-specific messages presented in both English and Mandarin.
Mitigation of Fire Risk for WorkplacesEmergency Preparedness and Response Training
TFT markets emergency preparedness and response training to Tasmanian workplaces. Firefighting training is delivered to emergency response teams and for employees generally on workplace fire safety, use of portable firefighting equipment and ways to manage building evacuations in emergencies (emergency control organisation training). In addition to typical workplaces, TFT also services remote and isolated sites, offering subsidised training to at-risk, not-for-profit organisations with a reduced capacity to pay.
In 2014-15 TFT delivered 451 courses to 3,770 participants. TFT instructors reached 361 different workplaces covering most sectors across Tasmania. A total of 40% of participants were from the public sector with the balance from the private sector (25% were from high-risk, not-for-profit organisations). Approximately one-quarter of training delivered was for emergency response teams in high-risk sectors such as mining and manufacturing. Emergency Control Organisation training comprised 40% of total courses.
Fire Safety Standards in Commercial Buildings
Building Safety continued to support career brigades to assess and approve evacuation plans required under the General Fire Regulations 2010. Evacuation plans are an integral component of safety for building occupiers. Building Safety staff assess and approve written plans, with brigades and district staff observing and critiquing practise evacuations as part of the approval process. Checklists and other resources are prepared and managed by Building Safety to ensure a consistent approach to all external clients.
Mitigation of Fire Risk for Culturally and Linguistically Diverse (CALD) CommunitiesCommunity Education undertook a number of bushfire and home fire safety initiatives with culturally and linguistically diverse individuals and communities in 2014-15. Home fire safety workshops in collaboration with regional Migrant Resource Centres and TasTAFE continue to be well-received among communities of recently arrived immigrants. Bushfire-Ready Neighbourhoods also engaged with a number of community members from culturally and linguistically diverse backgrounds through Statewide community events that promoted effective community-based bushfire prevention, preparedness and response.
Mitigation of Arson RiskJuvenile Fire Lighter Intervention Program (JFLIP)
The JFLIP is a family-based program for primary school-aged children who engage in unsafe fire-play. About 90% of participating children stop engaging in such play. As an arson-prevention program for children, JFLIP is an extension of the School Fire Education Program. The reach of the School Fire Education Program with the target demographic has been an effective primary prevention strategy, and has contributed to a decline in referrals to JFLIP. During 2014-15, just five JFLIP cases were registered.
JFLIP practitioners are also trained to participate in Youth Justice diversionary processes for young people who have committed fire-related offences. JFLIP practitioners represented TFS at two Community Conferences and Formal Cautions in 2014-15.
Collaboration with TasPol
TFS fire investigators continue to work with TasPol to identify effective strategies based on the identification of arson hot spots, so that policing activities and programs are able to supplement or support TFS programs.
TasFire Training markets emergency preparedness and response training.

Launch of ‘Farming communities and the TFS working together to reduce bushfire risk’ brochure.
29 2014-15 State Fire Commission Annual Report
Mitigation of Fire Risk for Remote and Isolated CommunitiesBoth TFE and TFT provide services across Tasmania, with a focus on more remote areas of the State. Geographical isolation means emergency service response times to these areas are slower than in urban areas so there is increased need for workplaces and individuals to be able to respond quickly and safely to fires. Delivery of services to these areas is not financially viable for many commercial providers, so TFE and TFT provide access to fire equipment maintenance and workplace fire safety training.
Mitigation of Bushfire RiskState Fire Management Council (SFMC)
There have been significant changes to the SFMC in the past 12 months. Mr Stephen Geard resigned as Chair in July 2014 after 11 years. In November 2014 Mr Ian Sauer commenced as the new Chair and is also spokesperson for the whole-of-government fuel reduction program announced in October 2014.
As part of the establishment of this program, the SMFC unit has transitioned to become the Fuel Reduction Unit—a part of TFS. This Unit continues to provide executive support to the SFMC and associated Fire Management Area Committees, as well as to coordinate planning and implementation of the Fuel Reduction Program. In order to undertake this task the number of staff within the Unit has grown substantially, with a team of 14 people currently working across the State.
“Bushfire in Tasmania”
In July 2014, the SFMC published the report Bushfire in Tasmania: A new approach to reducing our Statewide relative risk. Conducted on a state-wide scale, the report provided analysis of the state of bushfire risk in Tasmania and compared the effectiveness of different fuel reduction strategies. Significantly, the report moved away from post-event analysis of bushfire risk, using scenario-based modelling tools to better identify bushfire potential into the future. The risk analysis work undertaken in the report is essential background information for the development of fire protection plans.
Fire Management Area Committees (FMAC)
Ten Fire Management Areas cover the State, with boundaries based on bushfire risk and topography and largely aligning to local government boundaries. A committee was established for each area, with membership drawn from:
• local government
• a TFS Volunteer Brigade representative
• a TFS District Officer
• FT
• PWS
• Private Conservation Partnerships Program
• major private land owners (including Aboriginal land)
• Defence
• SES
• private forest companies
• the Tasmania Farmer’s and Graziers Association; and
• the utility companies.
FMACs report all their activities to the SFMC.
In October 2014, building on the risk assessment work already undertaken by the Unit, each FMAC tabled a Fire Protection Plan for its area and the SFMC has accepted all 10 fire protection plans. Building on the quantitative risk assessment work, each FMAC has undertaken qualitative analysis, identifying priorities for bushfire mitigation activities. The reports are all tenure-blind, and identified priorities are being used to prioritise and guide implementation of the Fuel Reduction Program.

Red Hot Tips participants conducting planned burning.
30 State Fire Commission Annual Report 2014-15
Red Hot Tips
Planned burning is a very important tool for managing bushfire fuel hazards and enhancing biodiversity and native vegetation condition (for example, enhancing regeneration and assisting in weed management). However, there has been a major reduction in the use of planned fire and the skills required to conduct burning during recent decades. To address this, SFMC oversees Red Hot Tips, a program designed to assist landholders in rural areas of Tasmania implement safe and strategic planned burning of native vegetation on private land and develop farm fire management plans.
Macquarie Franklin has been engaged to deliver much of the program, with considerable support provided by TFS, FT and PWS. The project has developed practical tools for bushfire management and planned burning on private land, including property-based fire management plans, training workshops, risk assessment, a monitoring template and a practical manual for burning on private land. In 2014-15, 21 farm fire management plans have been prepared, and seven burns completed. Based on feedback from participants, the format has been adjusted slightly with all participants participating in a field day prior to farm fire management plan preparation. As Red Hot Tips enters its final year, SFMC is reviewing the structure and effectiveness of the program.
Community Protection Planning
The Community Protection Planning Unit develops bushfire protection plans, response plans and mitigation plans for high-risk communities. Protection plans focus on local safety options for communities, such as nearby safer places, escape routes and emergency information sources. The plans are developed with community, brigade and other stakeholder consultation, promoting ownership and confidence. During 2014-15, Community Protection Planning developed 15 community protection plans covering 41 high-risk communities Statewide.
Response plans are a tactical tool for firefighters, identifying protection priorities when bushfires are burning out of control. Development of these plans involves engagement with both the local brigade and local community—a process that enhances the relationship between brigades and communities and ultimately enables local brigades to respond to bushfire emergencies safely and effectively. During 2014-15 Community Protection Planning developed 13 response plans covering 35 communities.
Mitigation plans focus on local-level fuel management strategies that improve the survivability of communities and their assets. FMACs identify communities where mitigation plans are a priority and Community Protection Planning then develop these plans with brigades and the community. This consultative approach to mitigation planning ensures
community, brigade and stakeholder values and expectations are managed. Brigades ultimately play a key role in implementation of mitigation strategies identified in these plans. Community Protection Planning facilitated implementation of bushfire mitigation plans for eight high-risk communities this year.
Community Protection Planning, through Bushfire-Ready Schools and Bushfire-Ready Sites, works with key stakeholders to generate greater awareness of bushfire risk and assist in planning and preparation for bushfire emergencies. Through these initiatives, stakeholder groups such as Department of Education (DoE) and Department of Health & Human Services (DHHS) are empowered to mitigate bushfire risk at their sites.
By 30 June 2015, plans to mitigate bushfire risk had been developed for 148 of the highest-risk DoE schools.

Left: Bushfire-Ready Neighbourhoods on Flinders Island.
31 2014-15 State Fire Commission Annual Report
Bushfire-Ready Neighbourhoods
Bushfire-Ready Neighbourhoods is a community-based prevention and preparedness program for bushfire-prone communities across Tasmania. The program is staffed by the Community Development Coordinator and three Community Development Officers. As of June 2015, Bushfire-Ready Neighbourhoods had been in full operation for one year.
A comprehensive and rigorous pilot program was undertaken for five years (2009-2013) prior to establishment of the program in 2014. This tested evidence-based community development in selected communities in bushfire prone areas with the aim of building community preparedness and resilience. The pilot was planned, implemented and evaluated based on best practice community development approaches taking a community-led approach. It incorporated and built on existing bushfire safety research, inquiry recommendations, policy and strategies. Fundamental to the success of the pilot and now the program has been collaboration with researchers and the Bushfire and Natural Hazards Cooperative Research Centre (BNHCRC), TFS staff, volunteer brigades and communities. The success of the pilot has led to roll-out and integration of the Bushfire-Ready Neighbourhoods program as an element of core business for TFS in 2014.
Research conducted by the BNHCRC has shown that simply giving or distributing information about what to do is not enough for everyone in the community to prepare for hazards, particularly low frequency hazards such as bushfires. Community development is a successful and cost-effective approach for changing behaviour as it accesses existing community networks, resources and supporting communities to develop specific local strategies. A feature of Bushfire-Ready Neighbourhoods is how they are able to increase the capacity of our career and volunteer brigade members to work with their communities to increase their resilience. Some of the bushfire preparedness activities include community forums, workshops, field days, bushfire rehearsals, women’s programs, Bushfire-Ready Neighbourhood groups, and property assessments. These continue to be identified through collaboration with local fire brigades.
In 2014, Bushfire-Ready Neighbourhoods was awarded the State and National Resilience Australia Award for best practice in emergency management and community resilience-building. Bushfire-Ready Neighbourhoods was also recognised internationally for its best practice work in bushfire preparedness, with the Community Development Coordinator presenting at the International
Association of Wildland Fire Human Dimensions of Wildland Fire Conference in the United States.
Also in 2014, Bushfire-Ready Neighbourhoods commenced stage one of the program roll-out by working with 16 core communities Statewide. By June 2015, the Bushfire-Ready Neighbourhoods program had engaged with more than 40 communities since the pilot program began in 2009.
Stage one implementation included:
• working directly with communities (including volunteer brigades); and
• developing the capacity of brigades in community engagement.
Communities were selected for first stage of implementation (2014 to 2016) using a multi-stage evidence-based approach. A list of communities was prepared with input from the SFMC based on the Bushfire Risk Assessment Model (BRAM) and Phoenix Rapidfire. This list was then compared to a list of existing and future community protection planning priorities. Consultation was undertaken with Regional Chiefs and District Staff and a series of other criteria were considered, including community connectedness, TFS capacity and ground-truthing. The community development team began working with the identified communities from June 2014 in the lead up to the 2014-15 bushfire season.
“In 2014 Bushfire-Ready Neighbourhoods was awarded the State and National Resilience Australia Award for best practice in emergency management and community resilience-building. “

Planned burning as part of the Fuel Reduction Program.
32 State Fire Commission Annual Report 2014-15
Development Control in Bushfire-Prone Areas
Tasmania uses a combination of planning and building controls to increase community safety for those living and working in bushfire-prone areas. These controls are applied when planning or building applications are made for new building work or activity. They are applied in areas deemed to be bushfire-prone and require the work or activity to adopt a suitable combination of bushfire protective measures. The measures are to provide suitable:
• combinations of built resistance to flame and embers and separation from the bushfire hazard
• access to and from the site
• minimum water supplies for firefighting; and
• emergency plans for vulnerable and hazardous uses. The system of development controls depends on three key activities:
• mapping
Mapping of bushfire-prone areas is preferred to making individual site assessments. Maps are being developed for each council area and will become part of the local planning scheme used for building control. This is a joint activity between councils and TFS staff. Mapping has commenced in 17 councils and will continue in 2015-2016 with the aim of achieving complete coverage of the State.
• training and mentoring
The activity area supports the people accredited by the Chief Officer to undertake bushfire hazard assessments for the purpose of development control. This includes providing training with ongoing mentoring and technical support. Two training courses were conducted in the past year and, at the end of the year 74 practitioners were listed on the dedicated TFS website page. About half of these were both fully accredited and
actively practising. It is anticipated that when the current trainees are accredited there will be about the same number of practitioners as there are building surveyors and that the number of practitioners will be sufficient to meet demand.
• policy and technical development
TFS has worked with councils and State agencies to resolve implementation issues with bushfire provisions in both the planning code and the Building Code of Australia. This work is ongoing and will result in a revised planning code being submitted to the Tasmanian Planning Commission together with preparation of complementary building regulations. At a national level, TFS participates in AFAC Bushfire Technical Reference Group activities and is part of the FPAA Technical Advisory Committee responsible for bushfire. Ongoing mentoring and technical support are provided to the community through a dedicated public webpage Building for Bushfire on the TFS website.

Be an adaptive, relevant, resilient and sustainable organisation
33 2014-15 State Fire Commission Annual Report
GeneralThe Commission performs its functions through its operational arm, TFS. The TFS workforce comprises two important groups: employees in the Department of Police and Emergency Management (DPEM) appointed under the State Service Act 2000, and volunteers appointed under the Fire Service Act 1979. In TFS, these groups are known collectively as ‘members’. Our members provide extraordinarily high levels of service to the community in frontline emergency response and community safety services as well as in support roles at emergency incidents and by ensuring effective performance of TFS’ administrative, governance and management functions.
As at 30 June 2015, TFS had a workforce of 5,024 volunteer members
• Further develop a safe, strategic and capable workforce.
• Shape and foster our leadership and culture to achieve our vision, values and strategic objectives.
• Be a well-informed, evidence-based decision-making organisation supported by effective systems and processes.
and 488 career members1 (476.12FTE). Overall workforce distribution has been relatively stable with operational and non-operational numbers for both career and volunteer members remaining similar to those in 2013-14.
Strategic WHS PlanThe Commission has approved a three-year strategic WHS plan to prioritise and focus improvement within TFS. Governance capability has improved in this area through senior management participation in WHS Officer training.
A WHS management system audit undertaken by the State Service Management Office (SSMO) in June - July 2014 provided valuable information to assist with development of the
1 Excludes Volunteer Training Instructors who are casual employees—as at 30 June 2015 90 VTIs or 5.52 FTE
Photographer: Warren Frey

34 State Fire Commission Annual Report 2014-15
strategic plan. The audit identified that a substantial WHS management system exists in TFS, with strengths identified in its culture, proactive action and management of key risks. Opportunities for improvement were identified with respect to improved planning, faster resolution of WHS issues and systems for review and improvement of systems and procedures.
An overarching Remote and Isolated Work system was developed in recognition of the risks inherent in the work of many TFS members. The system was developed in consultation with members and is flexible to ensure the varying needs of work groups are addressed.
TFS continues to work on improving our capability to work safely at height in both emergency and non-emergency situations. While risks in non-operational areas have been mitigated through improved work systems, training and personal protective equipment, progress continues on finalising safe systems in operational areas, particularly in the delineation of safe systems in emergency and non-emergency situations.
WHS Performance
TFS uses a number of measures to monitor WHS performance. The lost time accident rate and average time lost rate are preferred to the traditional lost time injury frequency rate as they measure performance for both career and volunteer members.
Lost Time Accident Rate
The lost time accident rate is a measure of the frequency of lost time accidents based on the number of members (rather than hours worked). This rate looks at the number of new lost time death, injuries and diseases reported for the financial year for every 100 members. There is a slight upward trend in this rate for TFS that may result from the significant bushfire season in 2012-13 as well as accidents being reported that traditionally were not (e.g. smoke inhalation).
Average Time Lost Rate
The average lost time rate is a measure of the severity of lost time accidents. It measures the total number of work days that were lost during the year as a result of deaths, injuries or disease, divided by the number of new lost time occurrences. There is a downward trend with this statistic at this time, reflecting a reduction in the number of work-related long term injuries and illnesses in the past financial year. This is a positive result.
Operational and Support members, Volunteer Training Instructorsheadcount from July 2011
May-1
5
Mar-15
Jan-
15
Nov-1
4
Sep-1
4Ju
l-14
May-1
4
Mar-14
Jan-
14
Nov-1
3
Sep-1
3Ju
l-13
May-1
3
Mar-13
Jan-
13
Nov-1
2
Sep-1
2Ju
l-12
May-1
2
Mar-12
Jan-
12
Nov-1
1
Sep-1
1Ju
l-11
0
50
100
150
200
250
300
350
VTI HeadcountSupport & Non Op HeadcountOperational Headcount
0
500
1000
1500
2000
2500
3000
3500
4000
4500
5000
May-1
5
Mar-15
Jan-
15
Nov-1
4
Sep-1
4Ju
l-14
May-1
4
Mar-14
Jan-
14
Nov-1
3
Sep-1
3Ju
l-13
May-1
3
Mar-13
Jan-
13
Nov-1
2
Sep-1
2Ju
l-12
May-1
2
Mar-12
Jan-
12
Nov-1
1
Sep-1
1Ju
l-11
Operational and Support Volunteers from July 2011
Total Support Volunteers (inc Juniors & Cadets)Total Operational Volunteers
Lost Time Accident RateMeasures the number of new lost time death, injuries and diseases
reported for every 100 members
0.0
0.1
0.2
0.3
0.4
0.5
2014/152013/142012/132011/122010/112009/102008/092007/082006/07
Average Lost Time RateMeasures the total number of workdays that were lost during the year as a result of deaths, injuries or disease
divided by the number of new lost time occurrences
0
10
20
30
40
50
2014/152013/142012/132011/122010/112009/102008/092007/08
Figure 5
Figure 6
Figure 7
Figure 8
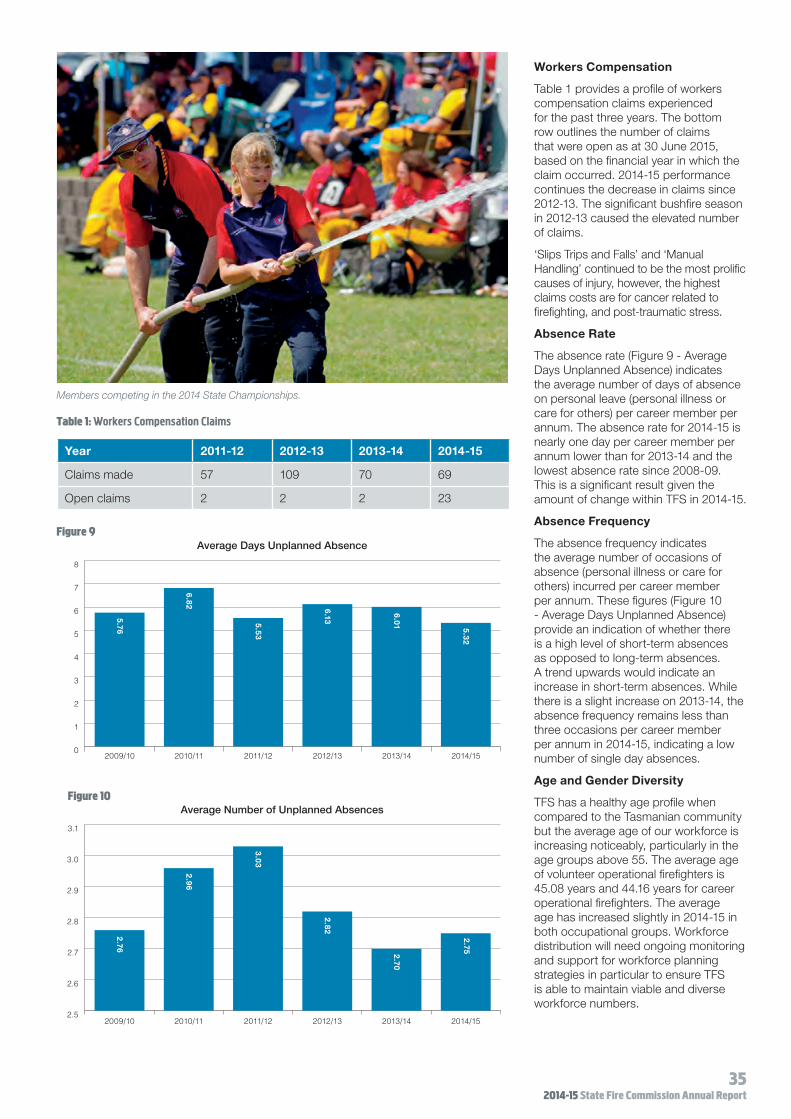
Members competing in the 2014 State Championships.
35 2014-15 State Fire Commission Annual Report
Workers Compensation
Table 1 provides a profile of workers compensation claims experienced for the past three years. The bottom row outlines the number of claims that were open as at 30 June 2015, based on the financial year in which the claim occurred. 2014-15 performance continues the decrease in claims since 2012-13. The significant bushfire season in 2012-13 caused the elevated number of claims.
‘Slips Trips and Falls’ and ‘Manual Handling’ continued to be the most prolific causes of injury, however, the highest claims costs are for cancer related to firefighting, and post-traumatic stress.
Absence Rate
The absence rate (Figure 9 - Average Days Unplanned Absence) indicates the average number of days of absence on personal leave (personal illness or care for others) per career member per annum. The absence rate for 2014-15 is nearly one day per career member per annum lower than for 2013-14 and the lowest absence rate since 2008-09. This is a significant result given the amount of change within TFS in 2014-15.
Absence Frequency
The absence frequency indicates the average number of occasions of absence (personal illness or care for others) incurred per career member per annum. These figures (Figure 10 - Average Days Unplanned Absence) provide an indication of whether there is a high level of short-term absences as opposed to long-term absences. A trend upwards would indicate an increase in short-term absences. While there is a slight increase on 2013-14, the absence frequency remains less than three occasions per career member per annum in 2014-15, indicating a low number of single day absences.
Age and Gender Diversity
TFS has a healthy age profile when compared to the Tasmanian community but the average age of our workforce is increasing noticeably, particularly in the age groups above 55. The average age of volunteer operational firefighters is 45.08 years and 44.16 years for career operational firefighters. The average age has increased slightly in 2014-15 in both occupational groups. Workforce distribution will need ongoing monitoring and support for workforce planning strategies in particular to ensure TFS is able to maintain viable and diverse workforce numbers.
Average Number of Unplanned Absences
2.5
2.6
2.7
2.8
2.9
3.0
3.1
2014/152013/142012/132011/122010/112009/10
2.76
2.9
6
3.03
2.82
2.70
2.75
Average Days Unplanned Absence
0
1
2
3
4
5
6
7
8
2014/152013/142012/132011/122010/112009/10
5.76
6.82
5.53
6.13
6.01 5.32
Table 1: Workers Compensation Claims
Year 2011-12 2012-13 2013-14 2014-15
Claims made 57 109 70 69
Open claims 2 2 2 23
Figure 9
Figure 10

36 State Fire Commission Annual Report 2014-15
TFS’ gender profile reflects a workforce that is predominantly male and in the 36-55 year age range. This profile reflects the challenge of changing community and organisational perceptions of firefighting in order to attract and retain a more diverse group of new members. Females currently constitute 19% of overall TFS membership. Females comprise 4% of career operational members and 14% of volunteer operational members. On average, females comprise less than 10% of the applicant pool for career operational vacancies.
Strategic Learning and Development (L&D) PlanThe TFS Strategic Learning and Development Plan has been operating for 12 months. Learning and development outcomes during this time have focussed on training delivery achievement and the plan’s high priority projects. Learning is also informed by the personal development plans arising from the TFS Workplace Feedback System—the TFS’ performance management system. Participation in the system continues to vary; however, a recent review and new reporting systems are expected to deliver improved outcomes in 2015-16.
In late 2014 a new set of standards was legislated for RTOs. These standards superseded previous ones and came into force on 1 January 2015 with full compliance required by 1 April 2015. Gap analysis against the new Standards identified priority action areas and an RTO working group was established to facilitate the gaps being addressed.
Work on scoping the TFS Capability Framework began with completion scheduled for 2015-16. The framework will outline the required capabilities for all work undertaken across all levels of TFS. Development of this framework is fundamental to the systematic recruitment, development, and retention of high performing members.
TFS invested significantly in curriculum development during 2014-15 with the focus on the Senior Station Officer (SSO) Development Program. This Program is a new initiative aimed at developing capable fire managers and leaders for the future. A mix of people management, resource management and fire safety curriculum were completed and the first SSO Development Program began in April 2015 as a pilot.
The national training regulator, ASQA, conducted an external audit of the TFS RTO in late 2014. The audit identified
TFS Age Pro�le 2010–2015All members
0
100
200
300
400
500
600
700
800
900
1000
1100
1200
76+66-7556-6546-5536-4526-3518-2510-17
June 2010 June 2011 June 2012 June 2013 June 2014 June 2015
Age and Gender Pro�leCareer Members
0
20
40
60
80
100
120
140
160
180
66+56-6546-5536-4526-3518-25
Male Female
4 2
60
135
154
50
28 19
224
13
0
Age and Gender Pro�leVolunteer Members
0
100
200
300
400
500
600
700
800
76+66-7556-6546-5536-4526-3518-2510-17
Male Female
36
5
163
48
5
114
54
8
138
701
167
794
161
724
122
361
54 49
8
Figure 11
Figure 12Age and Gender Pro�le
Career Members
0
20
40
60
80
100
120
140
160
180
66+56-6546-5536-4526-3518-25
Male Female
4 2
60
135
154
50
28 19
224
13
0
Figure 13

37 2014-15 State Fire Commission Annual Report
that TFS was largely compliant with RTO requirements, as well as a number of areas where changes were required to ensure that training is consistent with the required standard. Plans have been developed to implement the necessary changes with rectification work to be completed in 2015-16.
Significant career and volunteer member training activity continued in 2014-15. TFS training is conducted at the workplace, at TFS training centres in each region by volunteer and career training instructors and at external providers. Table 2 shows the number of TFS volunteers who hold required skills.
It should be noted that all volunteers are required to complete the Induction program and all operational volunteers must complete Brigade Basics. Remaining skills not covered in these programs only need to be undertaken by a proportion of volunteers depending on their individual roles and community risk levels. Given the average 10% turnover in volunteer numbers each year, it is not possible for volunteers to achieve a 100% skill achievement level in Induction and Brigade Basics.
Workforce ManagementThe Tasmanian Parliament passed the Registration to Work with Vulnerable People Act 2013 that makes it compulsory for people who work with children in regulated activities to attain registration through the Department of Justice. This legislation is being introduced in three stages with members who have ongoing contact with our Junior and Cadet program having had to be registered by 1 April 2015. Additional small groups of TFS members will be required to register progressively by 1 January 2017.
TFS has placed a high priority on ensuring members are registered and increasing awareness of child-safe practices. To date more than 550 members have applied for registration and more than 200 members across all regions have attended information sessions about the registration requirements and child-safe practices.
The Internal Vacancy Management procedure established under the State Service’s Managing Positions in the State Service direction resulted in collaborative arrangements being established for the movement of career members between TFS and DPEM as a whole.
TFS Behavioural DevelopmentTFS continued to promote its Values and to incorporate them into decision-making and development of positive workplace relationships. For these Values to be successful every member needs to understand what they mean and what they ‘look like’ in their workplace. Importantly, each team needs to agree on how they will act to ensure the ways they relate are always supportive of TFS values.
As part of developing this understanding TFS produced a 15-minute media clip that can be used by each workgroup to discuss TFS Values and prepare a poster that outlines how team members will apply them. This facilitation tool will be distributed to all TFS teams progressively before the end of 2015.
TFS commitment to implementation of the TFS Leadership Framework continued in 2014-15 with a further 62 members participating in the Fireline Leadership program. A total of 420 career and volunteer members have now participated in the foundational leadership program since 2011. A further 20 members have developed greater self-awareness and self-management strategies through participation in the LifeStyles Inventory (LSI) development program. In recognition that a toolbox approach for leadership development to be personalised and targeted, 23 members participated in internal coaching, external leadership or programs.
Internal CommunicationsThe clear benefits to date have included a focus on workplace engagement, information dispersion (e.g. workplace posters, WordBack, Chief Officer’s communiqués etc.) and use of other communications tools such as Fireground and social media.
Additionally, arrangements surrounding the TFS Style Guide were revisited to ensure consistency with State Government guidelines, resulting in a combined tender with DPAC to streamline a range of communications processes.
Table 2: Volunteer skills
Volunteer Skills 2011-2012 2012-2013 2013-2014 2014-2015
Induction 3529 (92.9%)
3702 (92.63%)
3832 (93.9%)
3816 (95.07%)
Brigade Basics 3268 (86.1%)
3390 (84.69%)
3523 (86.5%)
3536 (88.09%)
Firefighter Level 1 2011 2104 2220 2319
Urban Firefighter 1180 1204 1194 1228
Advanced Urban Firefighter 501 554 547 617
Advanced Bush Firefighter 1044 1080 1121 1253
Crew Leader 544 567 576 679

Participating in the 2014 State Championships.
38 State Fire Commission Annual Report 2014-15
Firefighter ChampionshipsThe Firefighter Championships are run by a voluntary committee of career, volunteer and support members that enable TFS members to practice skills relevant to firefighting and put their skills to test in a competitive environment.
The 2014 Tasmanian Fire Brigades Competitions Association State Firefighter Championships were held on 8 and 9 November at Launceston’s Invermay Park in near-perfect conditions.
A total of 39 teams battled it out in 17 individual events over two days of competition. Three new events with origins in NSW were included–First Aid Reel & Pumper, Hose, Hydrant and Extinguisher and Hose and Hydrant. Feedback following the Championships suggests these new events were well received.
Eleven new State Records were recorded at the Championships, demonstrating that teams are honing their skills in preparation for competition. Devonport 1 was the eventual aggregate winner in the senior section with Sassafras taking out the juniors. The combined section went to Claremont 1. Devonport 1 was selected automatically to represent Tasmania at the Australasian Firefighters Championships being held 23-25 October 2015 in Echuca, Victoria.
New State Records—Senior
GP Pumper Relay Devonport 1 30.684 (32.137)
Hose, Hydrant and Pumper Claremont 1 23.487 (26.558)
Siamese Valve Devonport 1 46.985 (51.063)
First Aid Reel and Pumper Devonport 1 34.853 (new event)
Hose, Hydrant and Extinguisher Claremont 1 38.693 (new event)
Hose and Hydrant Claremont 2 20.811 (new event)
New State Records—Junior
GP Pumper Relay Gretna 27.693 (31.110)
Tanker Rescue New Norfolk 38.173 (40.992)
Hose, Hydrant and Pumper Claremont 1 20.394 (26.051)
Hose, Hydrant and Extinguisher Sassafras 40.052 (new event)
Hose and Hydrant Sassafras 25.148 (new event)
The Tasmanian Firefighter Championships were extremely well supported by a number of corporate partners:
• Bendigo Bank
• Britax Automotive Equipment
• Bupa
• Caltex
• FRM
• Isuzu Trucks
• Ken ‘N’ Barbie
• PT Hydraulics Australia
• Draeger
• J Boag & Son
• Tassie Instant Marquees
• Andrew Walter Constructions
• SPT Security
• TVFBA North
• New Norfolk Fire Brigade
• John Banks
• Robert & Veronica Atkins.

39 2014-15 State Fire Commission Annual Report
Working with ChildrenWorkshops were held across the State to give our members an update on the introduction to legislative requirements regarding working with children.
Regional Administration, in conjunction with District Staff, identified the brigades that have Juniors and Cadets and those that have Junior and Cadet Coordinatiors.
The Officers and Junior and Cadet Coordinatiors from brigades with Junior and Cadet programs were contacted and advised of the process they needed to follow to ensure they were registered through Justice and able to continue working with our younger members. Our Administration teams also received confirmation from Brigade Chiefs of those members who did not need to register.
To date, around 75% of TFS members requiring registration have completed the process.
The next stage is to identify those members who may have contact with children through their normal roles but are not necessarily involved directly with brigades. For example this includes, includes School Education, TFE or career brigade members.
Be a socially and environmentally responsible organisation
• �Build mutual respect and understanding between the community and our organisation.
• Minimise our impact on the environment.

40 State Fire Commission Annual Report 2014-15
AwardsAustralian Fire Service Medal (AFSM)
AFSMs were presented to:
Volunteer Firefighter John Duggan
John started his firefighter service when he joined the Cradoc Rural Fire Brigade in 1976. He remained there until 1996 when he moved to the Cygnet Fire Brigade where he is still an active member. John has held a variety of positions at Cygnet including that of Brigade Chief and various functional roles overseeing the coordination of juniors and cadets and the brigade’s health and safety.
John’s interest and commitment to fire safety led him to a career with the PWS as a firefighter specialising in remote area firefighting and fuel reduction burning in all areas of the State. This work began as a seasonal capacity in 1998, developing into a full-time position in 2003. Currently, John holds the leadership position of Fire Crew Manager, overseeing the operations and development of all PWS specialist firefighters.
John has undertaken several taskforce deployments in recent years, including the USA in 2006 and the Victorian Black Saturday Fires in 2009. He is an experienced firefighter and holds qualifications in Operations Coordination and at the highest level in Incident Control.
John was awarded the National Medal for his dedicated service to TFS in 1992 and 1st and 2nd clasps were awarded in 2002 and 2012 along with the National Emergency Medal for his service in Victoria in 2009.
John has served TFS, his local community and the PWS with distinction over many years.
Retired Brigade Chief John White
John resigned from the volunteer ranks of TFS in August 2014 after freely giving service of 37 years. He joined as a Volunteer Firefighter with the Ridgley Fire Brigade in 1977. While at Ridgley, John developed a keen interest in operational training and competitions and led brigade activities in both of these areas.
After moving house in 1989, John joined the Sulphur Creek Fire Brigade and within one year was elected to the leadership position of Brigade Chief by his peers. In this position John proposed moving the brigade to a more suitable location at Heybridge and motivated brigade members to provide hundreds of hours of labour to assist with the station construction, landscaping and the development of several innovative training props.
John also led and supported development of brigade juniors and cadets and held the positions of Fire Management Area Committee (FMAC) representative, health and safety representative and the local Fire Permit Officer.
He held the position of Brigade Chief up until his retirement in 2014, a true acknowledgement of his commitment and leadership. At all times John had strong support from his wife, Avis.
He has been awarded the National Medal and clasp and is now due for his 2nd clasp.
Regional Chief Jeffrey Harper
Jeff began his TFS career in September 1985 as a recruit firefighter. A keen and committed firefighter, Jeff worked and studied at the Launceston Fire Brigade and was promoted to Station Officer in 1991. After five years in an operational supervision role, Jeff transferred to work in Building Safety, undertaking building fire safety inspections for proposed developments and general fire safety compliance. Following a return to brigade operations, Jeff then applied to work in the specialist role of fire investigation—a field in which he provides key leadership across the state.
Following some experience as a Field Officer supporting volunteer brigades, Jeff was promoted to District Officer in 2004, providing key support, advice and leadership to the brigades of the North Esk. He was promoted to Deputy Regional Chief North in 2009 and Regional Chief North in 2010. Jeff has also acted as Deputy Chief Officer and State Controller on occasion.
He has worked to assist interstate agencies on several occasions, including during the Victorian Black Saturday Fires and Cyclone Yasi. Jeff was awarded the National Medal plus clasp and the National Emergency Medal for his work supporting Queensland local government authorities in the wake of Cyclone Yasi. Jeff has served TFS with distinction over many years.

National Medal and Long Service Award recipients.
41 2014-15 State Fire Commission Annual Report
National Medals
The National Medal recognises diligent long service for members who protect life and property.
National Medals (awarded for 15 years service) 81 recipients
1st Clasp (awarded for an additional 10 years service) 44 recipients
2nd Clasp (awarded for a further 10 years service) 26 recipients
3rd Clasp (awarded for a further 10 years service) 14 recipients
4th Clasp (awarded for a further 10 years service) No recipients
Chief Officer’s Special Awards
The Chief Officer presented a number of special awards in recognition of outstanding efforts by various personnel.
Chief Officer’s Commendation
Career and Volunteer TFS Crews of Launceston and White Hills Brigades received this Award for demonstrating leadership and professionalism in conducting the rescue of a man buried and trapped while working in a deep trench at White Hills Road on 26 July 2013.
The Chief Officer’s Special Award
TFS CAFS Crews received this Award for their professionalism, innovation and service in their response to the Hazelwood (Victoria) Coal Mine Fire of February-March 2014.
Institute of Fire Engineers (IFE) Companion Fellow
Acting Chief Officer Gavin Freeman, AFSM was awarded the prestigious grade of IFE Companion Fellow. This grade is awarded to those who have demonstrated significant individual responsibility and exceptional contribution to the fire engineering profession over an extended period of time (normally not less than 15 years).

Compressed Air Foam System (CAFS) truck in action at the Hazelwood Coal Mine fire, Victoria, February 2014. Photographer: Tony Shultz
42 State Fire Commission Annual Report 2014-15
Financial Overview The net deficit for the Commission for 2014-15 was $6.0 million, compared with last year’s deficit of $4.2 million.
Total income of $76.4 million was $2.3 million higher than 2013-14 and this was mainly due to an increase of $1.9 million in the fire service contribution. The insurance fire levy was down $0.6 million as a result of market conditions in the insurance industry. This was offset by an increase in the motor vehicle levy of $0.8 million.
Total expenses of $82.5 million in 2014-15 were $4.1 million higher than last year and this partly resulted from the payment of a contribution of $2.5 million towards the operating costs of the State Emergency Service for the first time. This contribution is ongoing in accordance with Government policy. Salary-related expenses increased $1.2 million to $49.9 million principally due to negotiated award increases. There was an increase in expenditure on protective clothing and uniforms of $0.7 million and this was due to the replacement of structural firefighting clothing with new technology clothing.
The Commission had net cash of $0.3 million at 30 June: cash was $0.9 million and overnight borrowings were $0.6 million. Cash holdings at 30 June 2014 were $6.2 million.
More detail regarding income and expenditure is contained in the notes to the accounts in this report.
Physical Resource Management For the 2014-15 financial year the Commission spent $6.3 million on assets. This included $3.6 million on fire appliances, $1.4 million on plant and equipment, $0.9 million on motor vehicles and $0.5 million on buildings.
Fire Appliance ProgramA capital allocation of $160,000 was made to fund the 10-year upgrade of a second hydraulic platform (Launceston Fire Brigade).
In addition, $3.65 million was made available to fund design and fabrication of 14 Heavy Compressed Air Foam System (CAFS) Tankers. The new design is based on the 2013-14 version, which was enhanced with CAFS capability developed in-house by TFS. Funding of $160,000 was made available to fund development of a prototype medium tanker appliance, once again fitted with TFS engineered CAFS capability.
TFS’ capacity to design and fabricate internally combined with an ability to integrate new technology and enhance previous generation designs has impressed cab chassis manufacturers. Some of these manufacturers showcased both the medium and heavy tanker on their respective stands at the 2015 AFAC trade show. The medium CAFS enabled tanker will be used as an evaluation platform to determine the effectiveness and appropriateness of CAFS in this
application, providing direction for future medium tanker design. Innovation by way of the integration of a monitor for mobile suppression and wet line establishment has also been incorporated and will increase the capacity of the appliance in both a suppression and preparation role. The 14 four-wheel drive heavy tanker appliances have been allocated to brigades around the State based on a resource-to-risk methodology.
These appliances are considered state-of-the-art within the industry, significantly increasing both capability and crew safety, with up-to-date crew protection systems of a national standard.
TFS provided assistance by way of technical advice and guidance to other national fire agencies to develop their own CAFS integration with the CFA in Victoria, the CFS in South Australia and Queensland FRS seeking assistance from TFS to implement CAFS in their operational fleets.

FireComm Communications Officer in action.
43 2014-15 State Fire Commission Annual Report
ICT System upgrades TFS was the first Emergency Service Organisation Australiawide to use the new mobile phone location information as part of the Caller Line Identification (CLI) information from 000 calls. This geographical information is displayed on maps on both TFS and Whole of Government (WoG) web mapping platforms. This is not the GPS location of the phone but an estimate of area where the phone is located using phone tower information.
The automated bushfire simulation modelling system was modified this year to allow display of simulations on the WoG Common Operating Platform (COP) in addition to the existing TFS web mapping platform. This system runs the Phoenix model on vegetation fire starts as they are entered in the dispatch system.
New templates were added to the Publishing System for TFB, permits and media releases. The Publishing System is used to create and distribute community warnings to the TFS website, Facebook, Twitter, SMS, email and fax. The new templates consolidate the management of messages to the public into one system to streamline publishing. The system has also been modified to allow display of fire alert areas on TasALERT and WoG COP.
WoG Wireless Access Points (WAP) were deployed to complement TFS WAPs in major centres where incident management involving other agencies is conducted. This will provide other agencies with direct access to their respective networks.
There were a number of other system changes throughout the year, including:
• TRIM, RMS and AIRS upgrades to new versions
• the automatic fault notification system going live
• pre-incident plan system enhancements to simplify the validation process
• replacement of the fax gateway
• TFS’ Total Operating Picture (TOP) integration with FIRM; and
• installation of new FireMon servers that connect to the direct brigade alarms system in both Hobart and Cambridge.
The TFS website was moved to new servers, replacing the last Oracle servers as part of TFS’ move from proprietary servers to commodity servers.
DPEM Corporate Services’ Integration Project had a significant impact in 2014-15 with a significant increase in cooperation between Fire and TasPol IT areas. Planning commenced for aligning TFS and TasPol systems with a view to providing an integrated service to TFS, TasPol, SES and FSST. In addition to the integration project are a number of other cooperative projects were undertaken:
• implementation of the recommendations of the Tasmanian Audit Office audit of ICT security in DPEM
• provision of geocoded feeds of the Police Helicopter, vehicle crash, offence and infringement locations to the WoG COP
• assistance with emergency service computer aided dispatch tender
• changes to TasPol and TFS computer networks to enable easier sharing of computer systems and links into the Police Academy and Youngtown
• modification of the TFS publishing system to allow SES to publish flood warnings
• movement of TasPol Recruiting and Report a Crash websites to TFS hardware
• preliminary work to transfer TFS email to Connect (WoG) email with completion expected in early July 2015
• completion of site setup for ConnectV (WoG phones) at TFS SHQ and installation of new phones at Finance Branch; and
• changes to TFS’ Total Operating Picture (TOP) to allow all DPEM staff access through single sign-on security.
Communication Network Upgrades TFS continued to upgrade both its radio and paging infrastructure this year with 12 paging transmitters replaced. These replacements are for end-of-life equipment and the new systems provide enhanced monitoring of each transmitter. Seven remote access paging encoders were installed, replacing old store and forward units.
TFS continued to upgrade communications systems at local volunteer stations across the State. In 2014-15, 18 brigades received upgrades that included installation of new radios (VHF and UHF). These installations included six stations that were connected to the NBN, enabling TFS to provide the brigade with a new communications hub with access to enhanced data services including a wireless access point.
A new radio shelter was installed on Mt Mangana, Bruny Island and an additional radio transmitter was added at Flagstaff Lookout near St Helens. These will provide improved communications for local brigades. TFS continued to provide ongoing systems provisioning and services to AT and the SES for radio communications and dispatch paging services.

44 State Fire Commission Annual Report 2014-15
Financial Statements 2014-15
STATE FIRE COMMISSION FINANCIAL STATEMENTS 2014-15The accompanying financial statements, including notes to accounts, are provided to disclose activities funded both within and outside the Public Account. These statements have been prepared on an accrual basis in accordance with the Fire Service Act 1979.
CERTIFICATION OF FINANCIAL STATEMENTS 44
FINANCIAL STATEMENTS
STATEMENT OF COMPREHENSIVE INCOME 47
STATEMENT OF CHANGES IN EQUITY 47
STATEMENT OF FINANCIAL POSITION 48
STATEMENT OF CASH FLOWS 49
NOTES TO AND FORMING PART OF THE ACCOUNTS 50
STATE FIRE COMMISSION CERTIFICATION OF FINANCIAL STATEMENTSThe accompanying financial statements of the State Fire Commission have been prepared in compliance with the provisions of the Fire Service Act 1979 from proper accounts and records.
In the opinion of the Commissioners of the State Fire Commission:
a) the financial statements are drawn up so as to give a true and fair view of the results and cash flows for the period 1 July 2014 to 30 June 2015 and the financial position at 30 June 2015 of the State Fire Commission;
b) the accounts have been prepared in accordance with the provisions of the Fire Service Act 1979; and
c) at the date of this statement, there are reasonable grounds to believe that the Commission will be able to pay its debts as and when they fall due.
At the date of signing we are not aware of any circumstances which would render the particulars in the financial statements misleading or inaccurate.
Rodney Sweetnam AFSM Lyndsay Suhr AFSM
COMMISSION CHAIR COMMISSION MEMBER
23 September 2015

45 2014-15 State Fire Commission Annual Report

46 State Fire Commission Annual Report 2014-15

STATEMENT OF COMPREHENSIVE INCOME2015 2015 2014
Note Budget Actual Actual$’000 $’000 $’000
IncomeFire Service Contribution 36,837 36,845 34,924 Insurance Fire Levy 18,000 17,009 17,658 State Government Contribution 2 3,083 4,670 5,046 Motor Vehicle Fire Levy 7,388 7,680 6,902 Fire Prevention Charges 3 5,807 5,933 5,855 Sundry Income 4 1,330 2,681 2,351 Commonwealth Government Contribution 2 - 1,629 1,399 Total Income 72,445 76,447 74,135
Expenses Employee Related Expenses 5 46,078 49,923 48,717 Community Awareness, Subscriptions and Professional Fees 6 1,737 1,984 1,971 Learning and Development 920 899 946 Operations Expenses 7 7,454 9,992 10,557 Funding of State Emergency Service 2,494 2,494 - Protective Clothing and Uniforms 8 900 1,686 1,001 Depreciation 19 6,303 6,538 6,208 Financial and Other Expenses 9 4,666 4,419 3,704 Insurance 2,086 1,740 1,799 Borrowing Costs 10 240 190 242 Repairs and Maintenance 11 1,734 1,676 1,923 Minor Equipment Under $2,000 12 1,590 914 1,295 Total Expenses 76,202 82,455 78,363
Net Surplus/(Deficit) for the Year (3,757) (6,008) (4,228)
Other Comprehensive IncomeItems That Will Not be Reclassified Subsequently to Profit or Loss
Actuarial Gain/(Loss) on SFC Super Scheme Obligation 13 - 683 110 Increase/(Decrease) in Asset Revaluation Reserve 19 - 1,184 233
Total Other Comprehensive Income for the Year - 1,867 343 Total Comprehensive Income for the Year (3,757) (4,141) (3,885)
STATEMENT OF CHANGES IN EQUITY
ReservesRetained
Surpluses TOTAL$’000 $’000 $’000
Balance as at 30 June 2013 17,499 81,819 99,318
Net Surplus/(Deficit) - (4,228) (4,228)
Other Comprehensive Income
Actuarial Gain/(Loss) on SFC Super Scheme Obligation 13 683 110 793
Increase/(Decrease) in Asset Revaluation Reserve 19 233 - 233 Balance as at 30 June 2014 18,415 77,701 96,116
Net Surplus/(Deficit) - (6,008) (6,008)
Other Comprehensive Income
Actuarial Gain/(Loss) on SFC Super Scheme Obligation 13 - 683 683
Increase/(Decrease) in Asset Revaluation Reserve 19 1,184 - 1,184
Balance as at 30 June 2015 19,599 72,376 91,975
Budget information refers to original estimates and has not been subject to audit. Explanations of material variances between budget and actual outcomes are provided in Note 27a of the accompanying notes.
47 2014-15 State Fire Commission Annual Report
State Fire CommissionFinancial Report for the year ended 30 June 2015
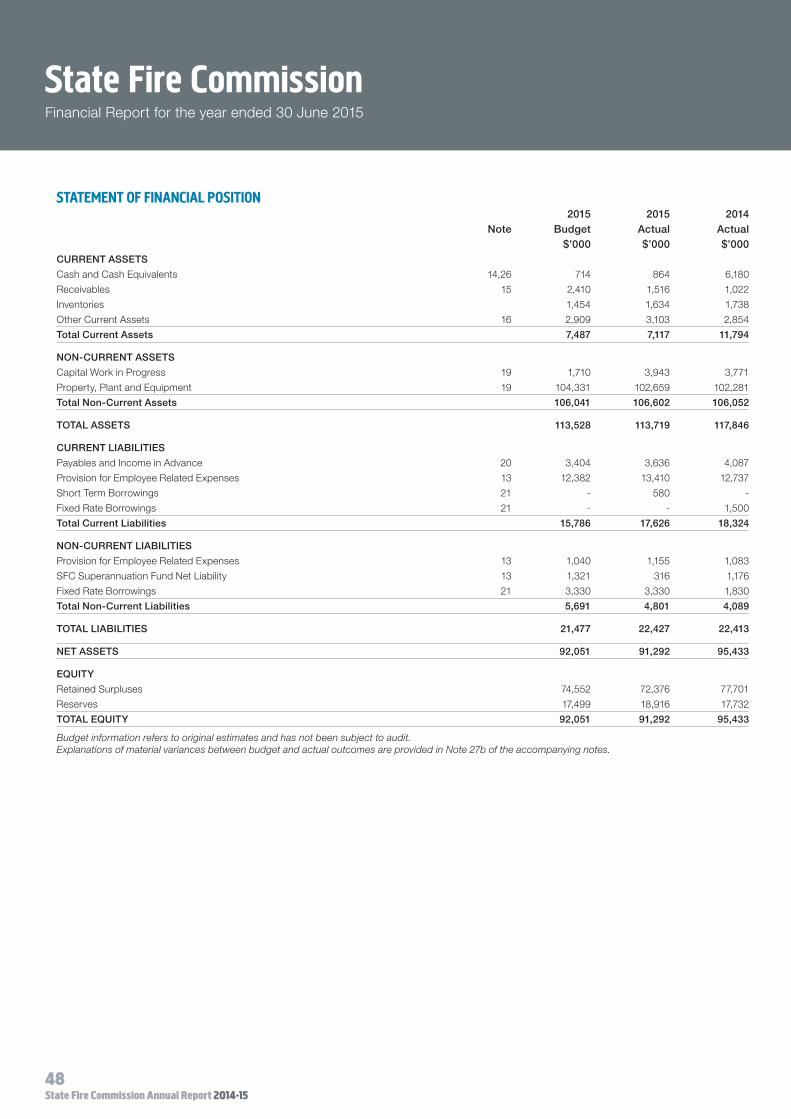
STATEMENT OF FINANCIAL POSITION2015 2015 2014
Note Budget Actual Actual$’000 $’000 $’000
CURRENT ASSETS
Cash and Cash Equivalents 14,26 714 864 6,180
Receivables 15 2,410 1,516 1,022
Inventories 1,454 1,634 1,738
Other Current Assets 16 2,909 3,103 2,854
Total Current Assets 7,487 7,117 11,794
NON-CURRENT ASSETS
Capital Work in Progress 19 1,710 3,943 3,771
Property, Plant and Equipment 19 104,331 102,659 102,281
Total Non-Current Assets 106,041 106,602 106,052
TOTAL ASSETS 113,528 113,719 117,846
CURRENT LIABILITIES
Payables and Income in Advance 20 3,404 3,636 4,087
Provision for Employee Related Expenses 13 12,382 13,410 12,737
Short Term Borrowings 21 - 580 -
Fixed Rate Borrowings 21 - - 1,500
Total Current Liabilities 15,786 17,626 18,324
NON-CURRENT LIABILITIES
Provision for Employee Related Expenses 13 1,040 1,155 1,083
SFC Superannuation Fund Net Liability 13 1,321 316 1,176
Fixed Rate Borrowings 21 3,330 3,330 1,830
Total Non-Current Liabilities 5,691 4,801 4,089
TOTAL LIABILITIES 21,477 22,427 22,413
NET ASSETS 92,051 91,292 95,433
EQUITY
Retained Surpluses 74,552 72,376 77,701
Reserves 17,499 18,916 17,732
TOTAL EQUITY 92,051 91,292 95,433
Budget information refers to original estimates and has not been subject to audit. Explanations of material variances between budget and actual outcomes are provided in Note 27b of the accompanying notes.
48 State Fire Commission Annual Report 2014-15
State Fire CommissionFinancial Report for the year ended 30 June 2015

STATEMENT OF CASH FLOWS2015 2015 2014
Note Budget Actual Actual$’000 $’000 $’000
Cash Flows from Operating Activities
Receipts from Operating Activities 72,295 77,391 77,466
Payments to Suppliers and Employees (69,659) (76,990) (72,539)
Interest Paid (240) (190) (242)
Interest Received 150 43 145
Net Cash provided by Operating Activities 26(b) 2,546 254 4,830
Cash Flows from Investing Activities
Proceeds from Sale of Equipment 300 342 759
Payments for Property, Plant and Equipment (5,930) (6,492) (9,173)
Net Cash used in Investing Activities (5,630) (6,150) (8,414)
Cash Flows from Financing Activities
Repayment of borrowings - - (1,368)
Proceeds from borrowings - 580 -
Net Cash used in Financing Activities - 580 (1,368)
Net Increase/(Decrease) in Cash and Cash Equivalents (3,084) (5,316) (4,952)
Cash and Cash Equivalents at the Beginning of the Financial Period 3,798 6,180 11,132
Cash and Cash Equivalents at the End of the Financial Period 26(a) 714 864 6,180
Budget information refers to original estimates and has not been subject to audit. Explanations of material variances between budget and actual outcomes are provided in Note 27c of the accompanying notes.
49 2014-15 State Fire Commission Annual Report
State Fire CommissionFinancial Report for the year ended 30 June 2015

50 State Fire Commission Annual Report 2014-15
State Fire CommissionNotes to the Financial Statements for the year ended 30 June 2015
1. Statement of Accounting Policies
(a) Business Details of the State Fire Commission
The State Fire Commission (the Commission) is a Statutory Corporation created under Section 7 of the Fire Service Act 1979 (the Act) of Tasmania, Australia. The Tasmania Fire Service (TFS) was created under Section 6 of the Act and is under the control of the Commission.
The role of the Commission is to protect life, property and the environment from the impact of fire and other emergencies. It delivers all of its services through its operational arm, the Tasmania Fire Service, which also operates under the business names of TasFire Equipment and TasFire Training. Its principal activities are emergency response (fire, vehicle accidents, biological and chemical hazards, etc.), preventative fire safety through community education and training, sales and servicing of fire protection equipment and administration of the General Fire Regulations including such activities as approving building plans in relation to fire safety and issuing various permits.
While the Commission reports to the Minister for Police and Emergency Management, the Chief Officer of TFS reports to the Secretary of the Department of Police and Emergency Management for administrative matters. From this financial year, the Director of the State Emergency Service (SES) reports to the Chief Officer (previously this position reported to the Commissioner of Police). From 1 July 2014, the Commission has been required to fund $2.494 million of the operating costs of the SES. This funding is expected to increase in the future to meet price rises associated with the expenses.
The Australian Business Number for the Commission and its operating entities is 68 039 681 690. The Head Office of the Commission is on the Corner of Melville and Argyle Streets, Hobart, Tasmania.
At 30 June the Commission had 479.1 employees (full time equivalents). Last year it had 472.0 employees.
(b) Basis of Financial Statements
The financial report is a general purpose financial report which has been prepared in accordance with Australian Accounting Standards and Interpretations. It has been prepared on the basis of historical costs except for the revaluation of land and buildings, and does not take into account changing money values. Accounting policies used are consistent with those of the prior year unless otherwise stated.
Compliance with Australian Accounting Standards may not result in compliance with International Financial Reporting Standards (IFRS), as Australian Accounting Standards include requirements and options available to not-for-profit organisations that are inconsistent with IFRS. The Commission is considered to be not-for-profit and has adopted the Australian Accounting Standards relating to not-for-profit entities which do not comply with IFRS.
(c) System of Accounting
The accompanying financial statements are prepared in accordance with the accrual basis of accounting that brings to account known assets and liabilities at balance date. Income is recognised when an increase in future economic benefits related to an increase in an asset or a decrease in a liability has arisen that can be measured reliably. Expenses are recognised when a decrease in future economic benefits related to a decrease in an asset or an increase in a liability has arisen that can be measured reliably. All amounts shown in the financial statements are in thousands of dollars unless otherwise stated. The system of accounting complies with the requirements of the Fire Service Act 1979.
(d) Inventories
Consumable stores are expensed at the time of purchase. Stock on hand is valued at the lower of average cost and net realisable value.
(e) Receivables
Trade and other receivables are measured at amortised cost less any impairment losses. The collectability of debts is assessed at year-end and a specific provision is made for any doubtful accounts. Due to the short settlement period, receivables are not discounted back to their present value. The Commission’s average trading terms are 30 days and no material interest is charged on overdue accounts.
(f) Capital Work in Progress
Capital Work in Progress is valued at the cost of material, labour and labour oncosts for work to date. Capital Work in Progress excludes certain commitments for outstanding purchase orders and unperformed work under existing contracts (Notes 18, 19).

51 2014-15 State Fire Commission Annual Report
State Fire CommissionNotes to the Financial Statements for the year ended 30 June 2015
(g) Plant, Property and Equipment
Asset Revaluation
On revaluation, the accumulated depreciation accounts are transferred to the related asset accounts. The assets are then depreciated over their estimated remaining useful lives using their revalued amount as the base.
When a class of assets is revalued upwards, that part of the revaluation increment that reverses previously expensed revaluation decrements for that class of assets is treated as revenue, and any excess is credited to the Asset Revaluation Reserve.
When a class of assets is revalued downwards, that part of the revaluation decrement that reverses a credit balance in the Asset Revaluation Reserve relating to that class of assets is debited to the Reserve, and any excess decrement is expensed.
Land and Buildings
Freehold land and buildings are recognised at fair value. Cost is considered to be the best measure of fair value for recently purchased or constructed property. Where available, in years subsequent to acquisition, the Valuer-General’s valuation is used. The Valuer-General progressively revalues land and buildings in a systematic manner, which is both independent and consistent.
During the year ended 30 June 2015, the asset class of Land was revalued upwards by $0.456m (2014 $0.302m increment) and Buildings were revalued upwards by $0.738m (2014 $0.069m decrement). These revaluations were both booked to the Asset Revaluation Reserve.
Fire Appliances, Passenger Vehicles and Plant and Equipment
Internal expenses incurred in the fabrication of Fire Appliances and the construction of Radio and Communications Equipment are capitalised.
Passenger vehicles are valued at cost.
Plant and Equipment is at cost and is comprised of Fire Fighting Equipment, Workshop and Other Equipment, Radio and Communications Equipment, Office Furniture and Equipment and Computer Equipment.
Items of Plant and Equipment with a purchase price of less than $2,000 are expensed at the time of purchase. Items of Plant and Equipment with a cost of $2,000 or more are shown at cost less depreciation and are written off over their expected useful life to the Commission on a straight line basis. Equipment is not depreciated until full operational status is attained.
Expenditure incurred in relation to plant and equipment subsequent to initial acquisitions is capitalised when it is probable that future economic benefits, in excess of the originally assessed performance of the assets will flow to the Commission in future years. Where these costs represent separate components they are accounted for as separate assets and are separately depreciated over their useful lives.
Depreciation
Items of Property, Plant and Equipment, including buildings, are depreciated over their estimated useful lives.
Assets are depreciated from the date of acquisition or, in respect of internally constructed assets, from the time an asset is completed and held ready for use. All items are depreciated using the straight line method of depreciation at the following range of rates:
Asset Class Range of Rates
Buildings 1% to 3.3%
Motor Vehicles 4% to 20%
Fire Appliances 4% to 5%
Plant and Equipment 6.6% to 33.3%
(h) Impaired Assets
Assets are reviewed at balance date for impairment using a range of impairment indicators. Where an asset is deemed to be impaired, its recoverable amount is estimated, and if materially lower than its carrying amount, the carrying amount is reduced to its recoverable amount. Any resulting impairment loss (or gain) is recognised in the Statement of Comprehensive Income in Financial and Other Expenses (or Sundry Income) unless the asset has previously been revalued upwards, in which case it is recognised as a reversal up to the amount of the previous revaluation and any excess is recognised through profit or loss.

52 State Fire Commission Annual Report 2014-15
State Fire CommissionNotes to the Financial Statements for the year ended 30 June 2015
(i) Assets Held for Sale
In accordance with AASB 5 Non-current Assets held for Sale and Discontinued Operations, Non-Current Assets are reclassified as held for sale if their carrying amount will be recovered principally through a sale transaction rather than through continuing use. They are stated at the lower of carrying value and fair (net recoverable) value less disposal costs. Provision for Depreciation accounts are transferred to the related asset accounts and the assets are then revalued to their estimated net recoverable value with any resulting impairment gains or losses disclosed in the Income Statement. Non-Current Assets held for sale are transferred to Current Assets and are not depreciated. Assets held for sale are sold in accordance with the Commission’s policy in relation to the useful life of assets. It is expected that assets held for sale will be sold within twelve months. Motor Vehicles and Fire Appliances are disposed of at auction or other public sale. (Note 17)
(j) Provision for Employee Related Expenses
No cash reserve has been set aside to meet commitments from the Provision for Employee Related Expenses and commitments will be met as they fall due. The Provision is comprised of Provisions for Long Service Leave, Annual Leave, Superannuation and Payroll Tax.
Provision for Long Service Leave is made for all employees. The liability is the sum of the existing entitlements and an estimate of future entitlements expected to arise from service completed at 30 June.
In determining the liability for expected future entitlements, consideration has been given to known future increases in wage and salary rates, and experiences with staff separations.
The provision relating to empolyees with ten or more years of service is measured at nominal value and disclosed as a current liability as experience shows that this is likely to be settled within 12 months after year end. The balance of the provision relating to employees with less than ten years of service has been measured at the present value of future cash outflows discounted using the rates applied to national government securities at balance date, which best match the terms of maturity of the related liabilities. This balance of the provision is disclosed as a non-current liability.
The Provision for Annual Leave represents employee entitlements due and accrued as at 30 June. The provision has been calculated using the remuneration rates the Commission expects to pay when the obligations are settled. The provision is measured at nominal value and disclosed as a current liability as experience shows that annual leave is settled within 12 months after year end.
Superannuation and Payroll Tax Provisions are calculated by applying the appropriate superannuation and payroll tax rates to the liabilities calculated for Long Service Leave and Annual Leave.
Sick Leave. The Commission does not provide for sick leave. All of the Commission’s sick leave is non-vesting, and it is thus inappropriate to make provision for future sick leave.
(k) Superannuation
The State Fire Commission Superannuation Scheme operates in accordance with the Retirement Benefits (State Fire Commission Superannuation Scheme Act) 2005. The Scheme is administered by the Retirement Benefits Fund (RBF) Board and the defined benefits component of the Scheme is a sub-fund of the RBF. The accumulation benefits component forms part of the Tasmanian Accumulation Scheme of the RBF. The Commission is responsible for ensuring adequate funding of the defined benefits component of the Scheme. The Commission’s net obligation in relation to the Scheme is recorded in the SFC Superannuation Fund Net Liability if it is a liability or in the SFC Superannuation Fund Net Asset if it is an asset, and net movement in the obligation is recorded in the Statement of Comprehensive Income. Actuarial gains and losses in relation to this fund are recognised in Other Comprehensive Income in the year they are incurred. (Note 13)
Prior to 30 April 2006, the Scheme operated the State Fire Commission Superannuation Scheme for employees of the State Fire Commission classified under the Tasmanian Fire Fighting Industry Employees Award. This scheme was closed to new members on 30 June 2005. Effective 1 May 2006 the State Fire Commission Superannuation Scheme Act 1994 was repealed by the Retirement Benefits (State Fire Commission Superannuation Scheme) Act 2005.
The Commission also makes employer superannuation contributions based as a minimum on the Commonwealth’s Superannuation Guarantee rate for State Award employees. These employees may elect to have their contributions forwarded to any complying superannuation scheme.
Prior to 1 July 1986 the State Fire Commission maintained its own fully funded superannuation scheme for Commission employees who contributed to the Retirement Benefits Fund. As at 30 June 1986 the provision had accumulated to $2,447,447 and this amount was recorded in the Commission’s accounts. As at 1 July 1986 accounting for Retirement Benefits Fund Superannuation entitlements was transferred to the State Treasury. A payment representing the provision as at 30 June 1986 of $2,447,447 was made to the State Treasury on the condition that the Government would fund the existing and future superannuation liability of Commission employees.

53 2014-15 State Fire Commission Annual Report
State Fire CommissionNotes to the Financial Statements for the year ended 30 June 2015
(l) Investments and Borrowings
The Commission conducts its investment and borrowing programmes with the Tasmanian Public Finance Corporation (Tascorp) and private investment managers.
Investments are carried at fair (face) value. Interest revenue is accrued at the market or contractual rate.
(m) Financial Liabilities
Financial liabilities, including borrowings, are initially measured at fair value, net of transaction costs. They are subsequently measured at amortised cost using the effective interest method, with interest recognised on an effective yield basis.
The effective interest method is a method of calculating the amortised cost of a financial liability and allocating interest expense over the relevant period. The effective interest rate is the rate that exactly discounts estimated future cash payments through the expected life of the financial liability, or where appropriate, a shorter period.
The Commission manages trade creditor accounts to ensure timely payments and no material interest is paid on these liabilities.
(n) Cash and Cash Equivalents
Cash comprises cash on hand, deposits held at call and short term deposits with a bank or financial institution. All cash transactions are recorded through the Commission’s bank account.
Cash and cash equivalents are carried at fair (face) value. Interest revenue is accrued at the market or contractual rate.
(o) Insurance Fire Levy
Contributions are received from insurance companies in respect of premium income on certain prescribed classes of insurance where the risks insured are situated in Tasmania. Contributions are received monthly with an approved lodgement return. The current insurance fire levy is 2% on marine cargo insurance, 14% on aviation hull insurance, and 28% on other classes of insurance. The first two rates were established in November 1986 and the last was increased from 14% in October 1990.
(p) Fire Service Contribution
Contributions are received from Local Councils through a fire service contribution raised on properties. A minimum contribution was initially implemented in 1991 to provide additional funds to re-equip volunteer brigades. The minimum contribution is $37 for the current year and this was increased from $36 on 1 July 2014.
(q) Motor Vehicle Fire Levy
The Commission receives income raised through a fire levy applied to all registered vehicles. This is collected by the Registrar of Motor Vehicles via the vehicle registration fee and forwarded to the Commission. The fire levy is $17 per vehicle for the current year and this was increased from $16 on 1 July 2014.
(r) Goods and Services Tax
Revenue, expenses and assets are recognised net of Goods and Services Tax (GST), except where the GST incurred is not recoverable from the Australian Taxation Office (ATO). Receivables and payables are stated inclusive of GST. The net amount recoverable from, or payable to, the ATO is recognised as an asset or liability in the Statement of Financial Position. In the Statement of Cash Flows, the GST component of cash flows arising from operating, investing or financing activities which is recoverable from, or payable to, the ATO is classified within operating cash flows.
(s) Borrowing Costs
Borrowing costs directly attributable to the acquisition, construction or production of assets that necessarily take substantial time to get ready for their intended use or sale, are added to the cost of those assets, until such time as the assets are substantially ready for their intended use or sale. All other borrowing costs are expensed in the period in which they are incurred.
(t) Changes in Accounting Policies
The State Fire Commission has adopted all of the new and revised accounting standards and interpretations issued by the Accounting Standards Board that are relevant to its operations and are effective for the current annual reporting period.
New and revised accounting standards adopted this year.

54 State Fire Commission Annual Report 2014-15
State Fire CommissionNotes to the Financial Statements for the year ended 30 June 2015
The following standards have been adopted this year:
• AASB 1055 Budgetary Reporting - The objective of this standard is to specify budgetary disclosure requirements for the whole of Government, General Government Sector (GGS) and not-for-profit entities within the GGS of each Government. Disclosures made in accordance with this standard provide users with information relevant to assessing performance of an entity, including accountability for resources entrusted to it. There is no financial impact.
• 2013-9 Amendments to Australian Accounting Standards – Conceptual Framework, Materiality and Financial Instruments (Operative dates: Part A Conceptual Framework – 20 December 2013; Part B Materiality – 1 January 2014; Part C Financial Instruments – 1 January 2015) - The objective of this Standard is to make amendments to the standards and interpretations listed in the Appendix of this Standard.
• as a consequence of the issue of Accounting Framework AASB CF 2013-1 Amendments to the Australian Conceptual Framework, and editorial corrections, as set out in Part A of this Standard;
• to delete references to AASB 1031 Materiality in other Australian accounting standards.
There is no financial impact.
The following applicable Standards have been issued by the AASB and are yet to be applied.
• AASB 9 Financial Instruments – This Standard supersedes AASB 139 Financial Instruments: Recognition and Measurement, introducing a number of changes to accounting treatments. The Standard was issued in December 2010. The Standard was reissued in August 2011 and is available from 1 January 2017 for application by not-for-profit entities. It is not expected to have a financial impact.
• AASB 15 Revenue from Contracts with Customers – The objective of this Standard is to establish the principles that an entity shall apply to report useful information to users of financial statements about the nature, amount, timing, an uncertainty of revenue and cash flows arising from a contract with a customer. This Standard applies to annual reporting periods beginning on or after 1 January 2017. Where an entity applies the Standard to an earlier annual reporting period, it shall disclose that fact. There is no financial impact.
• 2015-3 Amendments to Australian Accounting Standards arising from the withdrawal of AASB 1031 Materiality. The objective of this standard is to effect the withdrawal of AASB 1031 Materiality and to delete references to AASB 1031 in the Australian accounting standards, as set out in paragraph 13 of this Standard.
• AASB 2015-6 - Amendments to Australian Accounting Standards – Extending Related Party Disclosures to not-for-profit Public Sector Entities was issued in March 2015. This standard makes amendments to AASB 124 Related Party Disclosures to extend the scope of that standard to include not-for-profit public sector entities and applies to annual reporting periods beginning on or after 1 July 2016. There is no financial impact. The Commission will be required to disclose executive and directors remuneration, including comparative information for the first time in 2016/17.
(u) Judgements and Assumptions
In the application of Australian Accounting Standards, the Commission is required to make judgements, estimates and assumptions about carrying values of assets and liabilities that are not readily apparent from other sources. The estimates and associated assumptions are based on historical experience and various other factors that are believed to be reasonable under the circumstances, the results of which form the basis of making the judgements. Actual results may differ from these estimates.
The estimates and underlying assumptions are reviewed on an ongoing basis. Revisions to accounting estimates are recognised in the period in which the estimate is revised if the revision affects only that period or in the period of the revision and future periods if the revision affects both current and future periods.
Assumptions are utilised in the determination of the Commission’s employee provisions. These assumptions are discussed in notes 1(j) and 13. Actuarial assumptions which determine the State Fire Comission Superannuation Scheme asset or liability are discussed in notes 1(k) and 13.
Assumptions and judgements are utilised in the determination of the fair values of the Commission’s land and buildings and these are discussed in notes 1(g) and 19.
The Commission has made no assumptions concerning the future that may cause a material adjustment to the carrying amounts of assets and liabilities within the next reporting period.
Judgements made by the Commission that have significant effects on the financial statements are disclosed in the relevant notes to the financial statements.

2. Contributions from State and Commonwealth GovernmentsUnder section 101 of the Fire Service Act 1979 the Treasurer must pay out of monies appropriated by Parliament, such amounts as the Treasurer determines appropriate towards the operating costs of the Commission. The Commonwealth Government pays the Commission an annual contribution towards the operating cost of brigades.
Funds provided to the Commission are detailed below:-2015 2014
$’000 $’000State Government ContributionsGeneral Contribution 2,411 1,806 Bushfire Readiness Programme - Capital 790 790 Wildfire Fighting Reimbursements 1,469 2,450 Total 4,670 5,046
Commonwealth Government ContributionsGeneral Contribution 255 247 Helicopter Hire 906 972 Volunteer Grants 120 50 Natural Disaster Resilience Program 348 130 Total 1,629 1,399
3. Fire Prevention ChargesIncome is earned through the sale, inspection and maintenance of fire safetyequipment, training and provision of other fire prevention services throughout the State. Income is recorded when the goods or services are provided.Fire Prevention Charges comprise:-
Sale of Fire Safety Services and Equipment 1,339 1,465 Sale of Alarm Equipment 64 72 Alarm Rental 1,043 1,014 Alarm Network Fee 1,059 1,030 Avoidable False Alarms 145 93 Commercial Training 856 888 Inspection Fees - TasFire Equipment 1,248 1,138 Inspection Fees - Building Safety 158 143 Community Protection Plan Charges 21 12 Total 5,933 5,855
4. Sundry IncomeReimbursement by Ambulance Tasmania 1 321 209 Road Crash Rescue 237 290 Interest Received 43 145 Bushfire Fighting Reimbursements 2 665 842 Reimbursement for Fuel Reduction Unit Expenditure 3 592 - Worker’s Compensation Refunds 247 176 Reimbursement of Interstate and Overseas Deployments 5 113 Communications 7 24 Insurance Recoveries 16 12 Reimbursements for Construction of Shared Facilities 4 10 10 Other 538 530 Total 2,681 2,351
1. Contribution for shared facilities and reimbursement for costs incurred in upgrading and maintaining Ambulance Tasmania radio network and communication centre. (Note 12)
2. Reimbursement from Forestry Tasmania and the Parks and Wildlife Service for bushfire fighting.3. The Tasmanian Government is funding a fuel reduction program with funding via the Department of Primary Industry, Parks, Water and Environment4. Contribution by other State Agencies towards shared facilities
55 2014-15 State Fire Commission Annual Report
State Fire CommissionNotes to the Financial Statements for the year ended 30 June 2015

2015 2014$’000 $’000
5. Employee Related ExpensesSalaries,Wages and Allowances 36,011 35,769 Payroll Tax 2,700 2,756 Annual Leave 4,871 4,054 Long Service Leave 1,353 1,142 Superannuation 1 4,988 4,996 Total 49,923 48,717
1. Superannuation Contributions: SFC Superannuation Scheme 1,203 1,229 Retirement Benefits Fund 2,520 2,382 Other Funds 1,382 1,336 Superannuation related to provisions for Long Service Leave and Annual Leave 60 84 Other SFC Superannuation Scheme CostsService Costs (excluding current year contributions) (186) (48)Net Interest on Defined Benefit Liabilities and Assets 9 13 Total Superannuation Expense 4,988 4,996
6. Community Awareness, Subscriptions and Professional FeesAdvertising 990 659 Functions 46 71 Grants and Donations 52 85 Professional Fees 626 736 Subscriptions 243 357 Other 27 63 Total 1,984 1,971
7. Operations ExpensesCommunication Expenses 1,644 1,596 Computer Expenses 1,291 1,212 Consumables 427 356 Electricity 658 711 Bushfire Fighting Catering 93 76 Bushfire Fighting Support from Other Agencies - 12 Fire Suppression & Control 64 46 Hire of Equipment 84 77 Motor Vehicle Expenses 1,062 1,220 Municipal Rates 523 512 Office Cleaning 175 171 Printing and Stationery 150 217 Travel Expenses 822 687 Bushfire Fighting Helicopter Expenses 1,829 2,548 Bushfire Fighting Equipment Hire 800 718 Other 370 398 Total 9,992 10,557
8. Protective Clothing and UniformsProtective Clothing 1,392 620 Uniforms 294 381 Total 1,686 1,001
9. Financial and Other ExpensesAudit Fees 41 44 Cost of Goods Sold Sale of Fire Safety Services and Equipment 621 655 Sale of Alarm Equipment 56 53 Fringe Benefits Tax 117 134 Local Government Collection Fees 1,474 1,397 (Gain)/Loss on Sale of Assets 247 (180)Pensioner Rebates (Municipal) 1,141 1,087 Pensioner Rebates (Transport) 641 426 Other 81 88 Total 4,419 3,704
56 State Fire Commission Annual Report 2014-15
State Fire CommissionNotes to the Financial Statements for the year ended 30 June 2015

2015 2014
$’000 $’000
10. Borrowing Costs
Interest on Bank Overdraft 33 6
Interest on Interest Bearing Liabilities 157 236
Total 190 242
11. Repairs and Maintenance
Communication Expenses 213 263
Computer Equipment 10 11
Fire Fighting Equipment 73 90
Land and Buildings 570 642
Motor Vehicles 764 876
Office Furniture 17 14
Workshop Equipment 29 27
Total 1,676 1,923
12. Minor Equipment Under $2,000
Communication Equipment 27 65
Computer Equipment 101 148
Fire Fighting Equipment 363 418
Office Furniture and Related Equipment 245 287
Tasmanian Ambulance Service Communications Equipment (Note 4) 80 274
Workshop Equipment 82 95
Bushfire Fighting Equipment 15 6
Other 1 2
Total 914 1,295
13. Provision for Employee Related Expenses
Current Provisions
Provision for Long Service Leave 7,306 7,063
Provision for Annual Leave 3,878 3,547
Provision for Superannuation 1 1,455 1,397
Provision for Payroll Tax 1 771 730
Total 13,410 12,737
Non-Current Provisions
Provision for Long Service Leave 972 906
Provision for Superannuation 1 117 115
Provision for Payroll Tax 1 66 62
Total 1,155 1,083
1. Provisions for Superannuation and Payroll Tax relate to the Provisions for Long Service Leave and Annual Leave.
The following information relates to the State Fire Commission Superannuation Scheme net liability. It only relates to the defined benefits parts of the scheme and excludes any other liabilities or assets in relation to the scheme. The scheme is managed by the Retirement Benefits Fund.
2015 2014
Number of defined benefit members at 30 June 97 99
$’000 $’000
Total Annual Salaries 7,747 7,737
Total Liability Offset Accounts (516) (482)
The Liability Offset Accounts are used to record surcharge contributions tax and family law split benefits. They form part of the defined benefit members’ entitlements and are included at face value in the defined benefit obligation.
57 2014-15 State Fire Commission Annual Report
State Fire CommissionNotes to the Financial Statements for the year ended 30 June 2015

13. Provision for Employee Related Expenses (continued)
Assumptions
The following actuarial assumptions have been used in calculating the assets and liabilities associated with the SFC Superannuation Fund:
2015 2014
Discount rate p.a.
Gross of Tax 3.20% 3.80%
Net of Tax N/A1 3.20%
Salary increases p.a.
(includes allowance for promotional increases of 0.5% p.a.) 2.5% 2.5%
Crediting interest rate Equal to discount rate
Equal to discount rate
Tax on investment income (adjustment to discount rate) 15% 15%
Tax on employer contributions 15% 15%
Member movementsAs per the actuarial
investigation by the Trustee of the RBF at 1 May 2012
As per the actuarial investigation by the Trustee of
the RBF at 1 May 2012
1. Following revisions to AASB 119 Employee Benefits, the discount rate is no longer reduced to allow for investment tax
2015 2014
Disclosure in Statement of Financial Position $’000 $’000
Present value of defined benefit obligation at end of year 26,548 25,263
Fair value of plan assets at end of year (26,232) (24,087)
Net Liability/(Asset) Recognised in Statement of Financial Position 316 1,176
Disclosure in Statement of Comprehensive Income
Service Costs
Current service cost 772 946
Past service cost - -
Curtailment or settlement (gains)/losses - -
Net Interest
Interest cost 783 797
Interest Income (Expected return on plan assets1) (774) 9 (784) 13
Net (Income)/Expense Recognised 781 959
1. The expected return on plan assets is determined by weighting the expected long term allocation of assets to each asset class. Returns are net of investment fees.
Disclosure in Other Comprehensive Income/Changes in Equity
Remeasurement of the defined benefit Liability/Asset
Actuarial (Gains)/Losses
Actuarial (gains)/losses on the defined benefit obligation
Actuarial (gains)/losses due to changes in financial assumptions - 810
Actuarial (gains)/losses due to changes in experience 496 257
Actuarial (gains)/losses due to changes in demographic assumptions - -
Less Actuarial (gains)/losses on fair value of plan assets 1,179 1,177
Total Actuarial (Gains)/Losses (683) (110)
Total Disclosues in Other Comprehensive Income/Changes in Equity (683) (110)
58 State Fire Commission Annual Report 2014-15
State Fire CommissionNotes to the Financial Statements for the year ended 30 June 2015

13. Provision for Employee Related Expenses (continued) 2015 2014
Reconciliation of Income/Expense Recognised
Movement in SFC Super Scheme obligation (860) (145)
(Disclosed in Statement of Changes in Equity)
Service Costs 772 946
Net Interest 9 13
Actuarial (Gains)/Losses (683) (110)
98 849
Add Back Employer Contributions implicitly included in Service Costs (958) (994)
(already included in expenses)
Disclosed in Statement of Comprehensive Income (860) (145)
Movement in Recognised Liability/(Asset)
Superannuation Liability/(Asset) at Beginning of Year 1,176 1,321
Movement (860) (145)
Superannuation Liability/(Asset) at Year-end 316 1,176
59 2014-15 State Fire Commission Annual Report
State Fire CommissionNotes to the Financial Statements for the year ended 30 June 2015

13. Provision for Employee Related Expenses (continued)
Asset allocation
The table below shows the asset allocation of the Scheme assets.
Strategic Asset AllocationActual
Allocation 30 June 2015
Actual Allocation
30 June 2014
Scheme Benchmark
30 June 2015Australian shares 17% 18% 18%
International shares 19% 19% 19%
Low Beta Strategies 11% 8% 8%
Unlisted Property 14% 16% 16%
Diversified Fixed Interest 12% 12% 12%
Infrastructure/”Absolute Return” 21% 21% 21%
Term Deposits/Cash 6% 6% 6%
Total 100% 100% 100%
2015 2014
$’000 $’000
Reconciliation of the Present Value of the Defined Benefit Obligation
Present value of defined benefit obligation at start of year 25,263 22,817
Current service cost 777 869
Interest cost 783 796
Member contributions and transfers from other funds 395 391
Actuarial (gains)/losses due to changes in financial assumptions - 811
Actuarial (gains)/losses due to changes in experience 496 334
Benefits and tax paid (1,166) (755)
Present value of defined benefit obligation at end of year 26,548 25,263
Reconciliation of the Fair Value of Plan Assets
Fair value of plan assets at start of year 24,087 21,497
Interest income 773 784
Actuarial gains/(losses) 1,179 1,177
Employer contributions 964 994
Member contributions and transfers from other funds 395 391
Benefits and tax paid (1,166) (755)
Fair value of plan assets at end of year 26,232 24,087
General plan information
The Scheme was closed to new members on 30 June 2005.
Members of the Scheme are entitled to receive lump sum benefits on leaving service due to retirement, death, total and permanent disablement and resignation. An actuarial investigation into the Scheme was most recently performed as at 30 April 2012 by Dr David Knox FIAA of Mercer Consulting (Australia) Pty Ltd. The investigation showed the following figures determined in accordance with AAS 25 Financial Reporting by Superannuation Plans:
$’000
Value of Accrued Benefits at 30 June 2012 19,314
The actuary recommended that the Commission contribute to the scheme at the following rates
• 11% of salaries, plus
• 10% of any benefit paid to exiting members
• any deemed member contributions
The funding method used to make the contribution recommendation was the attained age normal method. Under this method, contributions are set with the aim of providing benefits in respect of future service for existing members, adjusted for any excess or shortfall of assets over liabilities in respect of service prior to the investigation date. The recommended contributions may be adjusted in the short-term to ensure that the Scheme’s financing objectives are met.
The economic assumptions used in the investigation were:
Rate of investment return 7.0% p.a. net of investment expenses and taxes on investment returns
Rate of inflationary salary increases 4.5% p.a.
60 State Fire Commission Annual Report 2014-15
State Fire CommissionNotes to the Financial Statements for the year ended 30 June 2015

13. Provision for Employee Related Expenses (continued)
2015 2014
Historical information $’000 $’000
Present value of defined benefit obligation at end of year 26,548 25,263
Fair value of plan assets at end of year (26,232) (24,087)
(Surplus)/Deficit in plan 316 1,176
Experience adjustments - plan liabilities (496) (257)
Experience adjustments - plan assets 1,179 1,177
Actual return on Scheme Assets 1,953 2,038
Expected ContributionsBased on the data provided, the assumptions used in this report and the recommendations from the 2012 actuarial investigation, the expected contributions to the Scheme for the year ending 30 June 2016 are detailed below. Due to improvements in the scheme’s financial position, the expected employer contributions of an additional 10% of benefits paid to exiting members is assumed to cease in the 2015-16 financial year.
2016
$’000
Expected employer contributions to Defined Benefits 833
Expected employer contributions to employee Productivity accounts 227
Expected employer contributions on benefit payments -
Total Expected Employer contributions 1,060
Expected member contributions 1 378
1. includes deemed member contributions (i.e. members’ contributions paid by salary sacrifice), net of 15% contribution tax.
Maturity Profile
The weighted average duration of the defined benefit obligation at 30 June 2015 was 11.4 years (2014: 12.3 years)
Sensitivity Analyis
The table below shows how the defined benefit obligation would have been impacted by changes in the key actuarial assumptions at balance date:
Resultant Movement in Defined Benefit Obligation
2015 2014
Assumption Change in Assumption ($’000) ($’000)
Discount rate Increase by 1.0% p.a. Decrease by: (1,642) Decrease by: (1,772)
Discount rate Decrease by 1.0% p.a. Increase by: 2,442 Increase by: 2,677
Inflation rate Increase by 1.0% p.a. Increase by: 2,435 Increase by: 2,670
Inflation rate Decrease by 1.0% p.a. Decrease by: (1,662) Decrease by: (1,793)
The resultant net liability (asset) balances in the Statement of Financial Position would have been:
Resultant Movement in Net Asset
2015 2014
Assumption Change in Assumption ($’000) ($’000)
Discount rate Increase by 1.0% p.a. (1,326) (594)
Discount rate Decrease by 1.0% p.a. 2,758 3,854
Inflation rate Increase by 1.0% p.a. 2,751 3,847
Inflation rate Decrease by 1.0% p.a. (1,346) (616)
In-house Assets
The fair value of Scheme assets does not include any of the Employer’s financial instruments, property occupied by the Employer or other assets used by the Employer.
Effect of Curtailments and Settlements
No material curtailments or settlements occurred during the year.
A curtailment is an event that significantly reduces the expected years of future service of present employees or reduces the accrual of defined benefits for a significant number of employees for some or all of their future services. A curtailment will occur when there is a significant reduction in the number of employees covered by the plan or where the plan is amended resulting in a reduction of benefits associated with the future service of current employees. Events causing a curtailment may include the termination or suspension of a plan.
A settlement occurs when an entity sponsoring a superannuation plan enters into an irrevocable transaction that eliminates all further legal or constructive obligation for all or a significant part of the benefits provided under the plan. Examples include the purchase of non-participating annuities for members or the payment of a lump sum payment to, or on behalf of, members in exchange for their right to receive benefits specified under the plan.
61 2014-15 State Fire Commission Annual Report
State Fire CommissionNotes to the Financial Statements for the year ended 30 June 2015

2015 2014
14. Cash and Cash Equivalents $’000 $’000
Cash on Hand 8 8
Cash at Bank 856 6,172
Total 864 6,180
15. Receivables
Trade Debtors 1,231 815
GST Receivable 305 227
Less Provision for Doubtful Debts (20) (20)
Total 1,516 1,022
Ageing of Trade Debtors
Current 1,023 619
30 - 60 days 72 113
60 - 90 days 28 18
90+ days 108 65
Total 1,231 815
16. Other Current Assets
Accrued Revenue 1,657 1,643
Prepayments 1,446 1,211
Total 3,103 2,854
17. Assets Held for Sale
Assets held for sale at year end were not material.
18. Capital Commitments
Capital expenditure contracted but not provided in the accounts, and payable within one year 1,044 496
62 State Fire Commission Annual Report 2014-15
State Fire CommissionNotes to the Financial Statements for the year ended 30 June 2015

2015 2014
19. Property, Plant and Equipment $’000 $’000
Land
At Fair Value at 30 June 17,517 17,070
17,517 17,070
Buildings
At Fair Value at 30 June 45,415 46,400
Accumulated Depreciation (4,439) (5,329)
Written Down Value 40,976 41,071
Motor Vehicles
At Cost 8,014 7,534
Accumulated Depreciation (4,856) (4,421)
Written Down Value 3,158 3,113
Fire Appliances
At Cost 65,511 63,779
Accumulated Depreciation (32,980) (31,709)
Written Down Value 32,531 32,070
Plant and Equipment
At Cost 29,990 29,449
Accumulated Depreciation (21,513) (20,492)
Written Down Value 8,477 8,957
Total Property, Plant and Equipment
Total Gross Value 166,447 164,232
Accumulated Depreciation (63,788) (61,951)
Written Down Value 102,659 102,281
Capital Work in Progress
Balance at the beginning of the year 3,771 5,493
Additions 4,921 6,907
Transfers to Assets (4,749) (8,629)
Balance at year end 3,943 3,771
Reconciliation of Property, Plant and Equipment as at 30 June 2015
Land Buildings Motor
Vehicles Fire
Appliances Plant and
Equipment Total $’000 $’000 $’000 $’000 $’000 $’000
Carrying Amount 30 June 2014 17,070 41,071 3,113 32,070 8,957 102,281
Additions 1 452 860 3,584 1,424 6,321
Revaluations 446 738 - - - 1,184
Depreciation Expense - (1,260) (660) (2,774) (1,844) (6,538)
Disposals - (25) (155) (349) (60) (589)
Carrying Amount 30 June 2015 17,517 40,976 3,158 32,531 8,477 102,659
Reconciliation of Property, Plant and Equipment as at 30 June 2014
Land Buildings Motor
Vehicles Fire
Appliances Plant and
Equipment Total $’000 $’000 $’000 $’000 $’000 $’000
Carrying Amount 30 June 2013 16,763 40,114 2,710 29,764 8,757 98,108
Additions 4 2,062 1,333 5,321 2,006 10,726
Revaluations 303 (69) - - - 234
Depreciation Expense - (1,036) (655) (2,769) (1,748) (6,208)
Disposals - - (275) (246) (58) (579)
Carrying Amount 30 June 2014 17,070 41,071 3,113 32,070 8,957 102,281
63 2014-15 State Fire Commission Annual Report
State Fire CommissionNotes to the Financial Statements for the year ended 30 June 2015

Measurement of Fair Value
Asset
Fair Value 30 June
2015 $’000
Fair Value 30 June
2014 $’000
Fair Value
Hierarchy
Valuation Technique
& Key Inputs
Significant Unobservable
Inputs
Relationship of Unobservable
Inputs to Fair Value
Land 17,517 17,070 Level 2 Comparable sales - market n/a n/a
Buildings - Fire Stations and Other
15,291 15,106 Level 3 Depreciated replacement cost Construction Cost
Useful Life 33 to 100 years
Increase in construction cost or useful life leads to higher fair value
Buildings - Major Urban Offices and Workshops
25,685 25,965 Level 2 Income approach - market
rent n/a n/a
(b) Valuation techniques and significant inputs used to derive fair values
The valuations of land and major urban offices and workshops were performed on the basis of market value, taking into consideration sale prices for similar properties and/or potential market rent these properties could generate. Specialised and often remote buildings such as fire stations and radio sites were valued on the basis of replacement with a new asset having similar service potential because there is no active market for these assets. The average cost of construction was used to calculate the gross replacement value. The level of accumulated depreciation was determined based on the age of the asset and the useful life adopted by the Commission
Recurring fair value measurements
Level 1 Level 2 Level 3 Total
$’000 $’000 $’000 $’000
Land - 17,517 - 17,517
Buildings - 25,685 15,291 40,976
Total - 43,202 15,291 58,493
There were no transfers between levels 1 and 2 during the year, nor between levels 2 and 3.
19. Property, Plant and Equipment (continued)
Assets at Fair Value
The Commission measures and recognises the following assets at fair value on a recurring basis:
Land
Buildings - Fire Stations and Other
Buildings - Major Urban Offices and Workshops
(a) Fair Value Hierarchy
AASB 13 Fair Value Measurement requires all assets and liabilities measured at fair value to be assigned to a level in the fair value hierarchy.
Fair value measurements are categorised into Level 1, 2 or 3 based on the degree to which the inputs to the fair value measurements are observable
and the significance of the inputs to the fair value measurement in its entirety, which are described as follows:
Level 1 - Unadjusted quoted prices in active markets for identical assets or liabilities that the entity can access at the measurement date;
Level 2 - Inputs, other than quoted prices included within Level 1, that are observable for the asset or liability, either directly or indirectly;
Level 3 - Unobservable inputs for the asset or liability.
The table below shows the assigned level for each asset held at fair value by the Commission. The table presents the Commission’s assets measured and recognised at fair value at 30 June 2014. Comparative information has not been provided as allowed by the transitional provisions of AASB 13.
The fair values of the assets are determined using valuation techniques which maximise the use of observable data, where it is available, and minimise the use of entity specific estimates. If one or more of the significant inputs is not based on observable market data, the asset is included in level 3. This is the case for fire stations, which are of a specialist nature for which there is no active market for similar or identical assets. These assets are valued using a combination of observable and unobservable inputs.
64 State Fire Commission Annual Report 2014-15
State Fire CommissionNotes to the Financial Statements for the year ended 30 June 2015

2015 2014
$’000 $’000
20. Payables and Income in Advance
Accrued Expenses 350 1,678
Trade Creditors 3,072 2,086
Income Received in Advance 214 323
Total 3,636 4,087
21. Financial Instruments Disclosures
The following tables detail the Commission’s remaining contractual maturity for its financial liabilities and expected maturity for financial assets.
2014-2015Weighted Average Interest
RateLess than 1
month1 - 3
months3 months to 1 year
1 - 5 years
5+ years Total
Market Value
$’000 $’000 $’000 $’000 $’000 $’000 $’000
Financial Assets
Non-interest bearing 8 1,516 - - - 1,524 1,524
Variable interest rate instruments 1.95% 856 - - - - 856 856
864 1,516 - - - 2,380 2,380
Financial Liabilities
Bank overdrafts - - - - - - -
Non-interest bearing 3,422 - - - - 3,422 3,422
Variable Rate Short Term Borrowings 4.17% 580 - - - - 580 580
Fixed Rate Interest Bearing Liabilities 4.17% - - - 3,330 - 3,330 3,389
4,002 - - 3,330 - 7,332 7,391
Comparative figures for 2013 - 2014Weighted Average Interest
RateLess than 1
month1 - 3
months3 months to 1 year
1 - 5 years
5+ years Total
Market Value
$’000 $’000 $’000 $’000 $’000 $’000 $’000
Financial Assets
Non-interest bearing 8 1,022 - - - 1,030 1,030
Variable interest rate instruments 2.48% 6,172 - - - - 6,172 6,172
6,180 1,022 - - - 7,202 7,202
Financial Liabilities
Bank overdrafts - - - - - - -
Non-interest bearing 3,764 - - - - 3,764 3,764
Variable Rate Short Term Borrowings - - - - - - -
Fixed Rate Interest Bearing Liabilities 4.72% - - 1,500 1,830 - 3,330 3,397
3,764 - 1,500 1,830 - 7,094 7,161
65 2014-15 State Fire Commission Annual Report
State Fire CommissionNotes to the Financial Statements for the year ended 30 June 2015

21. Financial Instruments Disclosures (Continued)
Financial Risk Management
The activities of the State Fire Commission are exposed to the following financial risks:
Credit Risk
The largest exposure to credit risk to the financial assets of the Commission relates to Trade Debtors. This exposure relates to the risk of financial loss due to debtors failing to discharge their financial obligations. This risk is significantly mitigated by the nature of the Commission’s revenue, most revenue is collected by the Commission or other Government agencies as a legislative requirement and has virtually no credit risk. Sales to the public which carry credit risk are a small part of the Commission’s revenue and bad debts have been immaterial in the past. The maximum credit risk exposure in relation to Trade Debtors is the carrying amount less the provision for doubtful debts (Notes 1(e), 15). The Commission is not materially exposed to any individual or group. Trading terms for the Commission’s Trade Debtors is 30 days.
Interest Rate Risk
The Commission’s exposure to interest rate risk, and the effective weighted average interest rate by class of asset or liability is set out in the table below. Exposure arises predominantly from assets and liabilities bearing variable interest rates as the Commission intends to hold fixed rate assets and liabilites to maturity.
Liquidity Risk
Liquidity risk is the risk that the Commission will not be able to meet its financial obligations as they become due. The cash inflow stream of the Commission is very consistent with some seasonality relating to quarterly collections. The major cash outflow is salaries which is also consistent. The Commission’s approach to managing liquidity is to ensure it will always have sufficient liquidity. It monitors its cash flows and utilises an overdraft when needed.
Other Price Risk
The only sensitivity analysis performed on financial assets and liabilities is interest rate risk. Other price risks are not considered material.
Interest Rate Risk Sensitivity Analysis for 2014 - 2015
Interest Rate Risk
-1% +1%
Carrying Amount
Impact on Operating Result
Impact on Equity
Impact on Operating Result
Impact on Equity
$’000 $’000 $’000 $’000 $’000
Financial Assets
Cash 856 (9) (9) 9 9
Total Financial Assets 856 (9) (9) 9 9
Financial Liabilities
Interest Bearing Liabilities 3,330 33 33 (33) (33)
Total Financial Liabilities 3,330 33 33 (33) (33)
Comparative figures for 2013 - 2014
Interest Rate Risk
-1% +1%
Carrying Amount
Impact on Operating Result
Impact on Equity
Impact on Operating Result
Impact on Equity
$’000 $’000 $’000 $’000 $’000
Financial Assets
Cash 6,172 (62) (62) 62 62
Total Financial Assets 6,172 (62) (62) 62 62
Financial Liabilities
Interest Bearing Liabilities 3,330 33 33 (33) (33)
Total Financial Liabilities 3,330 33 33 (33) (33)
66 State Fire Commission Annual Report 2014-15
State Fire CommissionNotes to the Financial Statements for the year ended 30 June 2015

21. Financial Instruments Disclosures (Continued) 2015 2014
$’000 $’000
Borrowing Facility
Total Facility (unsecured and subject to an annual review) (Note 25) 10,000 10,000
(Includes a sub-limit of $5M for working capital)
Short term borrowing 580 -
Fixed rate borrowing 3,330 3,330
Unused Facility 6,090 6,670
Bank Overdraft Facility
Total Facility (unsecured and subject to an annual review) 3,000 3,000
Less Overdraft - -
Unused Facility 3,000 3,000
Credit Card Facility
Total Facility 700 700
Less Allocated Facility (391) (416)
Facility Available 309 284
LoansSince 1986, all fixed rate loan raising has been arranged through the Tasmanian Public Finance Corporation. All loans are recorded in Australian dollars and are unsecured. The loan amount in current liabilities comprises the portions of the loans payable within one year. The non-current loan balance represents the portion of the loans due later than one year.
Security on Borrowings
All borrowings are unsecured. (Note 25)
Capital ManagementThe Commission is a Statutory Authority created under the Fire Service Act 1979, and does not have any externally imposed capital requirements. The Commission’s three year Corporate Plan including its finances and capital plan is required, however, to be approved by the Minister in consultation with the Treasurer each year. The Commission does not have any issued capital and its capital structure consists of equity (retained surpluses and reserves) and net debt or net cash (borrowings offset by cash and bank deposits). The Commission is a not-for-profit organisation and aims to break even or have a small net surplus each year. The government and the community fund it principally through contributions, grants and taxes. Its funds are expended on operating expenses, community awareness and safety and the construction or purchase and maintenance of assets such as fire trucks and fire stations. Management monitors cash flows to ensure adequate liquidity and the Commission’s ability to operate as a going concern. Senior management considers the capital structure when the corporate plan is prepared each year.
2015 2014
$’000 $’000
22. Lease Commitments
Not later than 1 year 66 69
Later than 1 year and not later than 5 years 61 95
Later than 5 years 38 37
Total 165 201
Operating lease commitments include land and building leases.
23. Remuneration of Auditors
The Tasmanian Audit Office audits the accounts for the State Fire Commission. The total remuneration
to the Tasmanian Audit Office exclusive of GST was $44,460 and $43,960 in 2014.
24. Contingent Liabilities
There are no material contingent liabilities known to the Commission.
25. Events After Reporting DateThe Tasmanian Public Finance Corporation has reviewed the Commission’s loan facility and while there is no change to the total facility which remains at $10M, the following conditions are to be imposed, subject to the Treasurer’s approval, due to a reduction in the Commission’s cash balances in line with Government policy:
- a total facility of $5m for fixed rate borrowing;
- a total facility of $5m for short term borrowing; and
- security for total Tascorp borrowings over the revenue of the Commission
67 2014-15 State Fire Commission Annual Report
State Fire CommissionNotes to the Financial Statements for the year ended 30 June 2015

26. Notes to the Statement of Cash Flows
(a) Reconciliation of Cash and Cash Equivalents
For the purpose of the Statement of Cash Flows , cash includes cash on hand and at bank.
Cash at the end of the financial year shown in the Statement of Cash Flows is reconciled
to the related items in the Statement of Financial Position as follows.
2015 2014
$’000 $’000
Bank Account 856 2,168
Overnight and Short-Term Deposits - 4,004
On hand 8 8
Cash and Cash Equivalents disclosed in the financial statements 864 6,180
(b) Reconciliation of Net Surplus to Net Cash Provided by Operating Activities
Net Surplus (6,008) (4,228)
Add (Less) Non-Cash Items:
Depreciation 6,538 6,208
SFCSS defined benefits fund movements in employee related expenses (177) (35)
(Profit)/Loss on disposal of assets 248 (179)
Net cash used in operating activities before change in assets and liabilities 601 1,766
Changes in Assets and Liabilities during the financial period
(Increase)/Decrease in receivables (495) 1,927
(Increase)/Decrease in accrued revenue (14) 143
(Increase)/Decrease in inventory 106 (268)
(Increase)/Decrease in prepayments (235) (65)
Increase/(Decrease) in payables and accred expenses (450) 537
Increase/(Decrease) in provisions 741 790
Net Cash from Operating activities 254 4,830
68 State Fire Commission Annual Report 2014-15
State Fire CommissionNotes to the Financial Statements for the year ended 30 June 2015

27. Explanations for Material Variances Between Budget and Actual Outcomes
The following are brief explanations of material variances between Budget estimates and actual outcomes. Variances are considered material where the variance exceeds the greater of 10 per cent of Budget estimate and $300,000.
(a) Statement of Comprehensive Income for the Year Ended 30 June 2015
Note Budget Actual Variance Variance
$’000 $’000 $’000 %
Income
Fire Service Contribution 36,837 36,845 (8) -0%
Insurance Fire Levy 18,000 17,009 991 6%
State Government Contribution (a) 3,083 4,670 (1,587) -51%
Motor Vehicle Fire Levy 7,388 7,680 (292) -4%
Fire Prevention Charges 5,807 5,933 (126) -2%
Sundry Income (b) 1,330 2,681 (1,351) -102%
Commonwealth Government Contribution (c) - 1,629 (1,629)
Total Income 72,445 76,447 (4,002) -6%
Expenses
Employee Related Expenses 46,078 49,923 (3,845) -8%
Community Awareness, Subscriptions and Professional Fees 1,737 1,984 (247) -14%
Learning and Development 920 899 21 2%
Operations Expenses (d) 7,454 9,992 (2,538) -34%
Funding of State Emergency Service (e) 2,494 2,494 -
Protective Clothing and Uniforms (f) 900 1,686 (786) -87%
Depreciation 6,303 6,538 (235) -4%
Financial and Other Expenses 4,666 4,419 247 5%
Insurance (g) 2,086 1,740 346 17%
Borrowing Costs 240 190 50 21%
Repairs and Maintenance 1,734 1,676 58 3%
Minor Equipment Under $2,000 (h) 1,590 914 676 43%
Total Expenses 76,202 82,455 (6,253) -8%
Net Surplus/(Deficit) for the Year (3,757) (6,008) 2,251 -60%
Other Comprehensive Income
Items That Will Not be Reclassified Subsequently to Profit or Loss
Actuarial Gain/(Loss) on SFC Super Scheme Obligation (i) - 683 (683)
Increase/(Decrease) in Asset Revaluation Reserve (j) - 1,184 (1,184)Total Other Comprehensive Income for the Year - 1,867 (1,867)Total Comprehensive Income for the Year (3,757) (4,141) 384 -10%
Variance Explanations
(a) Due principally to $1.5M reimursement of bushfire fighting expenses which are not budgeted due to their unpredictable quantum
(b) This variance mainly resulted from:
- reimbursement of unbudgeted bushfire expenses by other Tasmanian Government agencies $554K
- unbudgeted reimbursement of Fuel Reduction Unit expenditure by the Department of Primary Industries,
Parks, Water and Environment $273K
- unbudgeted payment by Ambulance Tasmania for maintenance and capital work on its radio network $321K
- workers compensation claim refunds $172K
(c) No budget was entered into the State budget for Commonwealth Government contributions
(d) Unbudgeted bushfire expenses
(e) The $2.5M contribution to the State Emergency Service wasn’t included in the budget (Note 1(a))
(f) $790K spent to upgrade to new technology protective clothing for firefighters operating in structural fires.
(g) Lower than expected insurance premiums due to claims experience
(h) Reduced expenditure due to re-evaluation of budget
(i) Due to the unpredictability of actuarial movements this item is not budgeted
(j) Due to the unpredictability of the timing and quantum of asset revaluations this item is not budgeted
69 2014-15 State Fire Commission Annual Report
State Fire CommissionNotes to the Financial Statements for the year ended 30 June 2015

27. Explanations for Material Variances Between Budget and Actual Outcomes (continued)
(b) Statement of Financial Position as at 30 June 2015
Note Budget Actual Variance Variance
$’000 $’000 $’000 %
CURRENT ASSETS
Cash and Cash Equivalents 714 864 (150) -21%
Receivables (a) 2,410 1,516 894 37%
Inventories 1,454 1,634 (180) -12%
Other Current Assets 2,909 3,103 (194) -7%
Total Current Assets 7,487 7,117 370 5%
NON-CURRENT ASSETS
Capital Work in Progress (b) 1,710 3,943 (2,233) -131%
Property, Plant and Equipment 104,331 102,659 1,672 2%
Total Non-Current Assets 106,041 106,602 (561) -1%
TOTAL ASSETS 113,528 113,719 (191) -0%
CURRENT LIABILITIES
Payables and Income in Advance 3,404 3,636 (232) -7%
Provision for Employee Related Expenses 12,382 13,410 (1,028) -8%
Short Term Borrowings - 580 (580)
Total Current Liabilities 15,786 17,626 (1,840) -12%
NON-CURRENT LIABILITIES
Provision for Employee Related Expenses 1,040 1,155 (115) -11%
SFC Superannuation Fund Net Liability 1,321 316 1,005 76%
Fixed Rate Borrowings 3,330 3,330 - 0%
Total Non-Current Liabilities 5,691 4,801 890 16%
TOTAL LIABILITIES 21,477 22,427 (950) -4%
NET ASSETS 92,051 91,292 759 1%
EQUITY
Retained Surpluses 74,552 72,376 2,176 3%
Reserves 17,499 18,916 (1,417) -8%
TOTAL EQUITY 92,051 91,292 759 1%
Variance Explanations
(a) Trade debtors higher than expected
(b) Fire appliance build project slightly behind schedule
70 State Fire Commission Annual Report 2014-15
State Fire CommissionNotes to the Financial Statements for the year ended 30 June 2015

27. Explanations for Material Variances Between Budget and Actual Outcomes (continued)
(c) Statement of Cash Flows for the Year Ended 30 June 2015
Note Budget Actual Variance Variance
$’000 $’000 $’000 %
Cash Flows from Operating Activities
Receipts from Operating Activities 72,295 77,391 (5,096) -7%
Payments to Suppliers and Employees (a) (69,659) (76,990) 7,331 -11%
Interest Paid (240) (190) (50) 21%
Interest Received 150 43 107 71%
Net Cash provided by Operating Activities 2,546 254 2,292 90%
Cash Flows from Investing Activities
Proceeds from Sale of Equipment 300 342 (42) -14%
Payments for Property, Plant and Equipment (5,930) (6,492) 562 -9%
Net Cash used in Investing Activities (5,630) (6,150) 520 -9%
Cash Flows from Financing Activities
Proceeds from borrowings (b) - 580 (580)
Net Cash used in Financing Activities - 580 (580)
Net Increase/(Decrease) in Cash and Cash Equivalents (3,084) (5,316) 2,232 -72%
Cash and Cash Equivalents at the Beginning of the Financial Period 3,798 6,180 (2,382) -63%
Cash and Cash Equivalents at the End of the Financial Period 714 864 (150) -21%
Variance Explanations
(a) This variance is mainly due to:
- Unbudgeted bushfire expenses $3.0M
- Unbudgeted contribution to the State Emergency Service $2.5M (Note 1(a))
- Upgrade to new technology protective clothing for firefighters operating in structural fires $790K
- Lower than expected insurance premiums due to claims experience $346K
- Reduced expenditure due to re-evaluation of minor equipment budget
(b) Unbudgeted overnight borrowings $580K (offset by cash $864K)
71 2014-15 State Fire Commission Annual Report
State Fire CommissionNotes to the Financial Statements for the year ended 30 June 2015

72 State Fire Commission Annual Report 2014-15
ABS Australian Bureau of Statistics
AFAC Australasian Fire and Emergency Service Authorities Council
AIIMS Australasian Inter-service Incident Management System
AIRS Australian Incident Reporting System
ANZCTC Australia-New Zealand Counter-Terrorism Committee
ARRO Australasian Road Rescue Organisation
AT Ambulance Tasmania
BA Breathing Apparatus
BNHCRC Bushfire and Natural Hazards Cooperative Research Centre
BCRC Bushfire Cooperative Research Centre
BRN Bushfire-Ready Neighbourhoods
BRS Bushfire-Ready Schools
CAFS Compressed Air Foam System
CALD Culturally and Linguistically Diverse
CBRN Chemical Biological Radiological Nuclear
DBA Direct Brigade Alarm
DHHS Department of Health and Human Services
DoE Department of Education
DPAC Department of Premier and Cabinet
DPEM Department of Police and Emergency Management
DPIPWE Department of Primary Industry, Parks, Water and Environment
ELT Executive Leadership Team
FIAT Forest Industries Association of Tasmania
FireComm State Operations Call Receipt, Dispatch and Communications Centre
FMAC Fire Management Area Committee
FRNSW Fire and Rescue New South Wales
FT Forestry Tasmania
Hazmat Hazardous Materials
ICS Incident Control System
IMT Incident Management Team
JFLIP Juvenile Fire Lighter Intervention Program
L&D Learning and Development
LGAT Local Government Association of Tasmania
MAC Multi Agency Coordination Group
MOU Memorandum of Understanding
MVA Motor Vehicle Accident
NAFC National Aerial Firefighting Centre
PIFSA Pacific Islands Fire Services Association
PIP Pre-incident plan
PSTP Public Safety Training Package
PWS Parks and Wildlife Service
RAP Road Accident Prevention
RAT Remote Area Team
RCR Road Crash Rescue
RFOC Regional Fire Operations Centre
RTO Registered Training Organisation
SES State Emergency Service
SFEP School Fire Education Program
SFMC State Fire Management Council
SFOC State Fire Operations Centre
TasPol Tasmania Police
TFB Total Fire Ban
TFE TasFire Equipment
TFS Tasmania Fire Service
TFT TasFire Training
The Commission
State Fire Commission
TRVFA Tasmanian Retained Volunteer Firefighters Association
TVFBA Tasmanian Volunteer Fire Brigades Association
USAR Urban Search and Rescue
WebEOC Web Emergency Operations Centre
WHS Work Health and Safety
Glossary

State Fire CommissionABN 68 039 681 690
HEAD OFFICE: Corner Argyle & Melville Streets Hobart
POSTAL ADDRESS: GPO Box 1526 HOBART TAS 7001
P: 1800 000 699 F: 03 6234 6647 E: [email protected] W: www.fire.tas.gov.au