state auto financial corporation
TRANSCRIPT
State Auto Financial Corporation
Profitable Growth
Driving Shareholder Value
FINANCIAL STRENGTH | REPUTATION | RELATIONSHIPS | RELIABILITY | RESPONSIVENESS
2010 FBR Capital Markets Fall Investor Conference
November 30, 2010

2
Participants
• Bob RestrepoChairman & Chief Executive Officer
• Steve EnglishVP, Chief Financial Officer
• Larry AdeleyeAVP, Director – Treasury and Finance

3
Safe Harbor
Forward-Looking Statements
This presentation may contain forward-looking statements within the
meaning of the Private Securities Litigation Reform Act of 1995. The
words “believe,” “expect,” “anticipate,” “estimate,” “target,” and similar
expressions, among others, identify forward-looking statements. All
forward-looking statements are based on assumptions, expectations
and other information currently available to management. Such
forward-looking statements are subject to certain risks and
uncertainties that could cause events and the Company’s actual results
to differ materially from those expressed or implied. Please see the
disclosure regarding forward-looking statements immediately preceding
Part I of the Company’s Annual Report on Form 10-K for the fiscal year
ended December 31, 2009. The Company assumes no obligation to
update any forward-looking statements.

4
NASDAQ: STFC
• Super regional property and casualty insurer
– Over $1.2 billion in annual premiums; 64% personal,
36% business
• 64% owned by State Automobile Mutual (SAM)
– Group premiums over $1.8 billion
– STFC and SAM companies pooled approximately
$1.5 billion in insurance premiums in 2009, 80%
ceded to STFC
• Rated A+ (Superior) by A.M. Best since 1954

5
Driving Profitable Growth
– Scalable technology and efficient business processes
– Deep and trusting relationships with agents
– Sophisticated analytical tools, processes and models
– State of the art products
– Reliable and responsive policyholder experience
– Engaged associates
Widely recognized by independent agents as the
best regional property and casualty company
marketing personal and small business insurance
products having -
State Auto Strategy
6
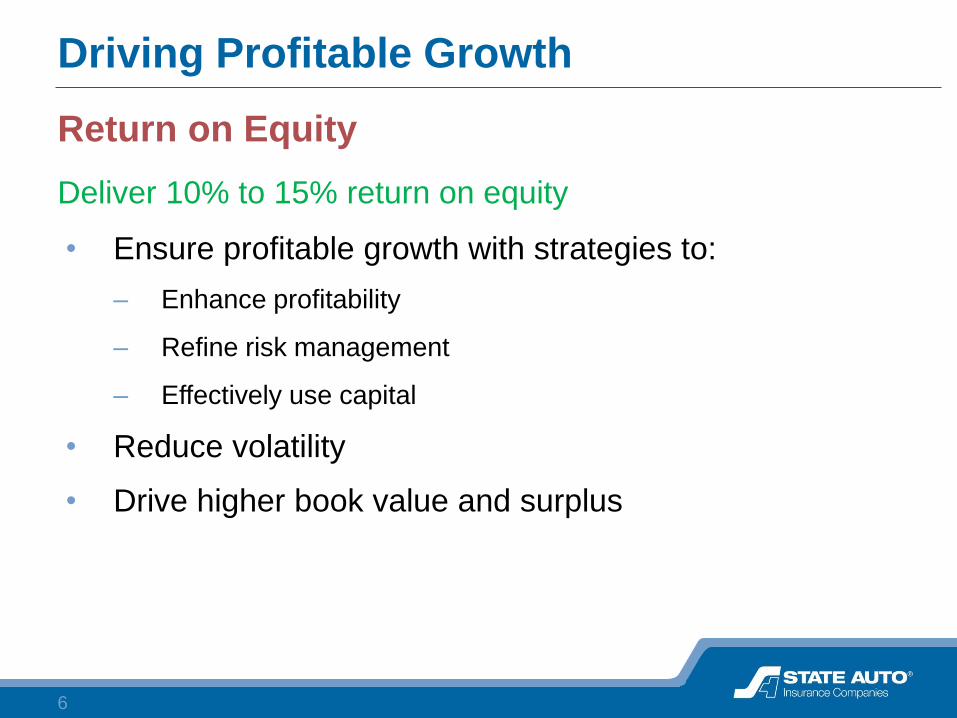
• Ensure profitable growth with strategies to:
– Enhance profitability
– Refine risk management
– Effectively use capital
• Reduce volatility
• Drive higher book value and surplus
Driving Profitable Growth
Return on Equity
Deliver 10% to 15% return on equity

7
Driving Profitable Growth
Deliver 10% to 15% ROE2009 Target Range
CAT Loss Ratio 7.7% 5.0% 5.0%
Ex-CAT Loss Ratio 64.0% 59.5% 57.0%
Expense Ratio 34.1% 32.5% 32.0%
Combined Ratio 105.8% 97.0% 94.0%
Underwriting Profit (5.8)% 3.0% 6.0%
Operating Leverage 1.5 1.5 1.7
ROAE from Underwriting, after tax (5.5)% 2.9% 6.6%
Investment Yield 3.9% 3.8% 4.1%
Investment Leverage 2.6 2.5 2.7
ROAE Investments, after tax 8.8% 8.1% 9.4%
ROAE, Other including debt (2.0)% (1.0)% (1.0)%
1.3% 10.0% 15.0%
8
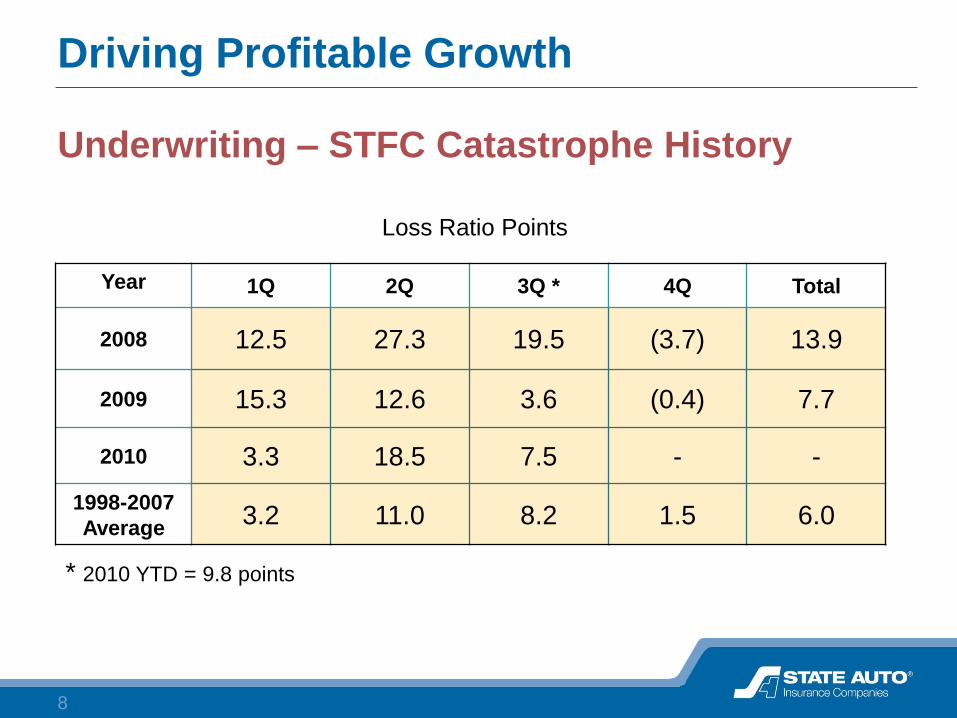
Driving Profitable Growth
Underwriting – STFC Catastrophe History
Year 1Q 2Q 3Q * 4Q Total
2008 12.5 27.3 19.5 (3.7) 13.9
2009 15.3 12.6 3.6 (0.4) 7.7
2010 3.3 18.5 7.5 - -
1998-2007
Average3.2 11.0 8.2 1.5 6.0
Loss Ratio Points
* 2010 YTD = 9.8 points

9
Driving Profitable Growth
Opportunities and Strategies
• Homeowners Profit Improvement
• Claims Initiatives
• Business Insurance Focus
• Specialty Insurance Integration
• Enterprise Risk Management
• Capital Management

10
Driving Profitable Growth
Homeowners Profit Improvement
• Price increases
• Insurance to Value (ITV)
• By peril product
• Wind/hail deductibles
• Aggregate reinsurance treaty
• Commission changes

11
Driving Profitable Growth
Fixing Homeowners: The Solution
Expected Benefit to Homeowners Loss Ratio:
– Insurance to Value 8.0%
– By-Peril 5.0
– Wind/Hail Deductibles 2.0
15.0%

12
Driving Profitable Growth
Claims Initiatives
• CAT teams
• Large property adjusters
• APD unit
• Staff counsel
• Inside vs. outside adjusters
• Workers compensation
• A 1% Game!
13
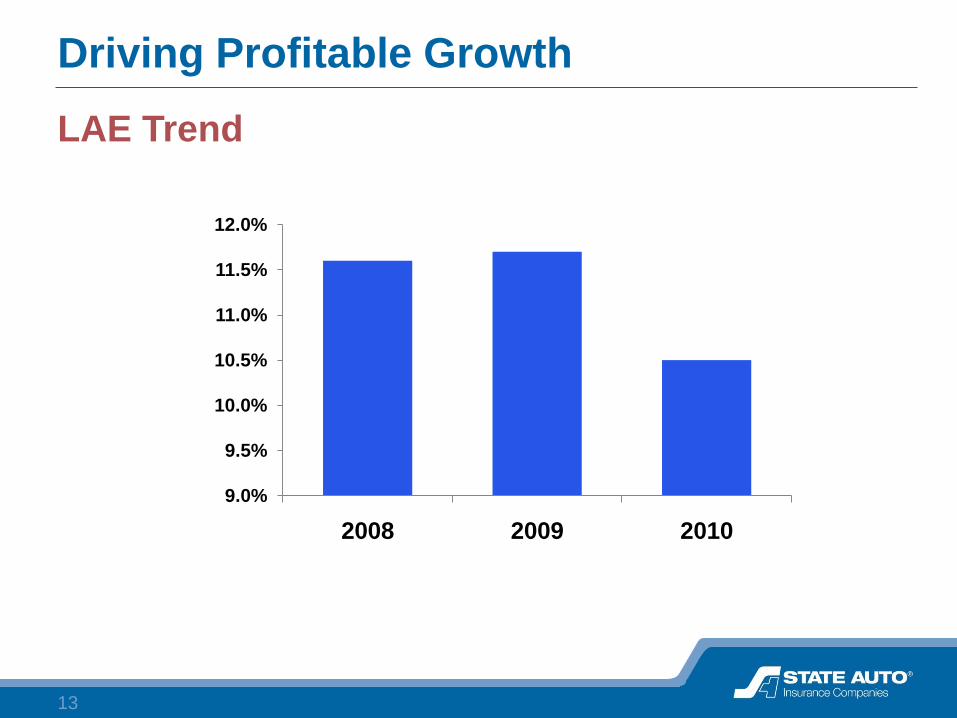
Driving Profitable Growth
LAE Trend
9.0%
9.5%
10.0%
10.5%
11.0%
11.5%
12.0%
2008 2009 2010

14
Driving Profitable Growth
Business Insurance Focus
• Pricing Models … evolving models … expanding price points
… speed of responsiveness to challenges and opportunities
• Ease of Doing Business Technology … supporting
architecture … straight-through processing (upload/download) …
portal functionality … rules …
• Enhanced Business Processes … leverage models
through rules (pricing, underwriting, workflow, services) … STP …
• Underwriting Quality … attaining goals through models,
technology and processes … e.g., combined ratio, growth, expense
ratio, service standards, underwriting consistency, account view,
market segmentation, agency EDB … business intelligence
15
Driving Profitable Growth
Business Insurance Outcomes
• Pricing: Optimized models
• Portals: Easy to use
• Productivity: Lower expense ratios
• People: Accessible and relationship oriented
16
Driving Profitable Growth
Specialty Insurance Integration
• Risk Evaluation and Design (RED)
• Rockhill
• Return to Work (RTW)
17
Driving Profitable Growth
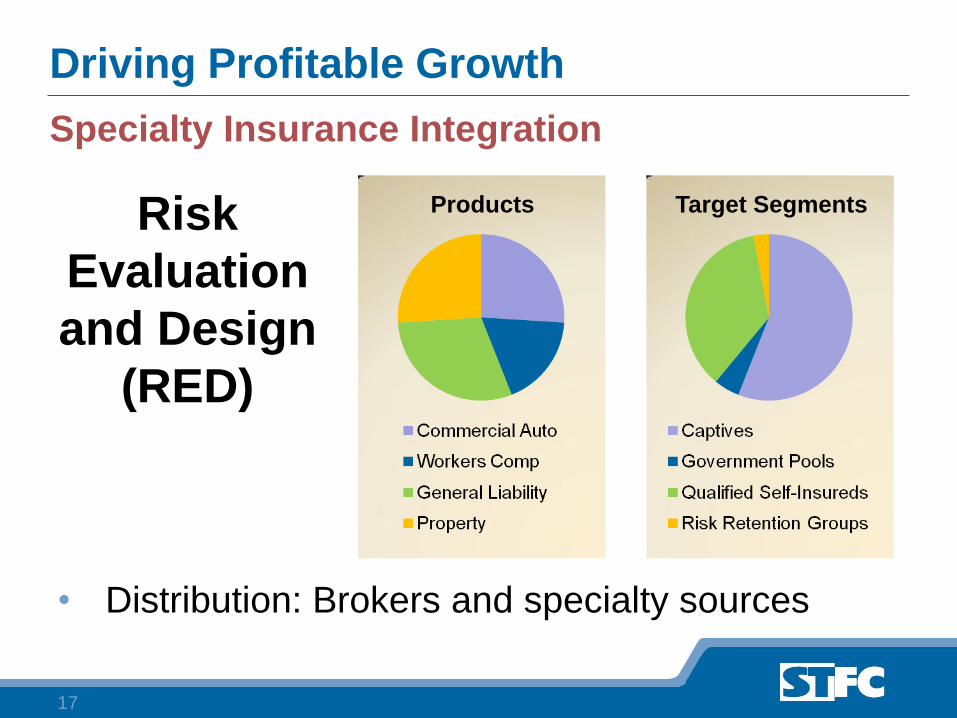
Specialty Insurance Integration
• Distribution: Brokers and specialty sources
Products Target SegmentsRisk
Evaluation
and Design
(RED)

18
Target Segments
Driving Profitable Growth
Specialty Insurance Integration
• Distribution:
Wholesale brokers and
program managers
Property
Construction
Environmental
Health Care
Programs
Rockhill

19
Driving Profitable Growth
Specialty Insurance Integration
RTW
• Workers Compensation
– Debit mod
– Small account
• Distribution
– Retail brokers
– Wholesalers
20
Driving Profitable Growth
Enterprise Risk Management
• Wind/hail
• Coastal
• CAT modeling
• DFA modeling

21
Approved for business
Active states
CO
AZ
UT
ND
SD
KS
OK
MN
IA
MO
AR
WI
ILOH
IN
MS ALGA
FL
MI
PA
SC
NC
VA
KY
TN
WV
MD
TX
Premiums
OH 15.1%
KY 8.9%
TX 6.8%
IN 6.2%
TN 6.1%
PA 4.5%
As of 09/30/10
VT
CT
MA
RI
Driving Profitable Growth
Geographic Dispersion

22
(% of total insured value) as of December 31, 2009 and December 31, 2005
Percent of Total
2009
2005
1.6
1.4
1.5
1.1
5.7
6.8
0.3
0.0
1.2
1.5
1.5
0.0
0.7
0.6
0.3
0.4
4.4
0.0
1.6
1.1
2.4
2.5
2.7
2.8
1.3
1.5
1.5
1.8
1.9
2.4
0.1
1.4
4.7
5.85.6
6.0
2.5
2.2
6.9
7.6
2.2
2.6 1.3
1.44.5
5.518.7
22.32.7
2.2 0.6
0.7
2.8
3.6
3.7
4.2
2.8
0.0
0.2
0.0
3.4
0.0
0.0
0.0
0.2
0.0
8.5
10.7
Homeowners, Commercial Property and Farm
Driving Profitable Growth
Geographic Dispersion
Expansion States
Growth States
Core States
23
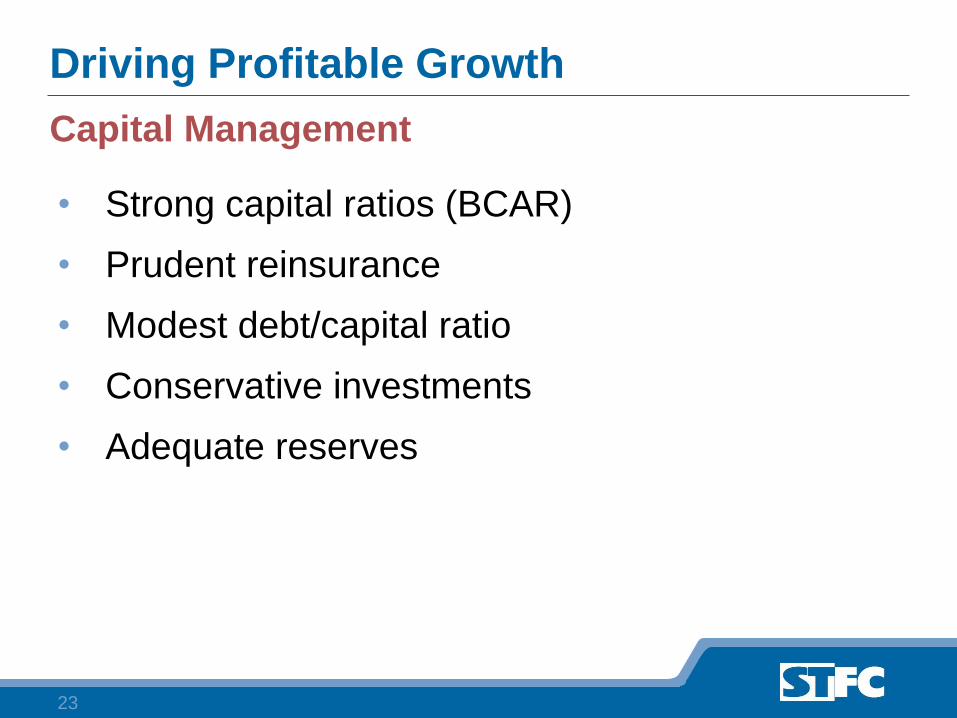
Driving Profitable Growth
Capital Management
• Strong capital ratios (BCAR)
• Prudent reinsurance
• Modest debt/capital ratio
• Conservative investments
• Adequate reserves

24
Tax Exempt Municipal Bonds
43.6%
U.S. Government
Agencies – MBS
26.9%
Corporate Bonds
5.9%
Equities
14.2%
U.S.
Treasury Bonds
9.4%
Driving Profitable Growth
STFC Investment Portfolio – September 30, 2010
Total: $2.22 billionAllocation
Fixed Income 85.8%
Equities 14.2%
Total 100.0%
Bond Ratings
Aaa 56.3%
Aa 34.8%
A 5.1%
Other 3.8%
Total 100.0%
Average Maturity: 7.1 years Duration: 4.2 Pre-Tax Yield: 4.0%
25
Driving Profitable Growth
Profitable growth leading to
long-term BV expansion.
State Auto is prepared
to deliver strong results.

26
-5%
0%
5%
10%
15%
20%
$0
$5
$10
$15
$20
$25
1998 1999 2000 2001 2002 2003 2004 2005 2006 2007 2008 2009 3Q10
Book Value ROE
Driving Profitable Growth
Book Value Per Share vs. ROE

27
Driving Profitable Growth
Deliver 10% to 15% ROE2009 Target Range
CAT Loss Ratio 7.7% 5.0% 5.0%
Ex-CAT Loss Ratio 64.0% 59.5% 57.0%
Expense Ratio 34.1% 32.5% 32.0%
Combined Ratio 105.8% 97.0% 94.0%
Underwriting Profit (5.8)% 3.0% 6.0%
Operating Leverage 1.5 1.5 1.7
ROAE from Underwriting, after tax (5.5)% 2.9% 6.6%
Investment Yield 3.9% 3.8% 4.1%
Investment Leverage 2.6 2.5 2.7
ROAE Investments, after tax 8.8% 8.1% 9.4%
ROAE, Other including debt (2.0)% (1.0)% (1.0)%
1.3% 10.0% 15.0%

28
Summary
Proven ability to deliver returns to investors
– Disciplined underwriter
– Improving claims capability
– Conservative risk and capital management
– Consistent book value growth
– Successful integration of acquisitions
– Ease of Doing Business: People, products, processes
– Diversified business profile: geographic and products

29
Questions
and Answers

State Auto Financial Corporation
Profitable Growth
Driving Shareholder Value
FINANCIAL STRENGTH | REPUTATION | RELATIONSHIPS | RELIABILITY | RESPONSIVENESS