state action plan on climate change - forest.bih.nic.inforest.bih.nic.in/docs/sapcc final draft...
TRANSCRIPT

[SAPCC- Bihar]
State Action Plan on Climate Change
Government of Bihar 2015

Supported by United Nations Development Programme

Table of Contents
List of Tables .................................................................................................................... v
List of Figures .................................................................................................................. vi
Abbreviations/Acronyms ................................................................................................ vii
Acknowledgements ........................................................................................................ xii
EXECUTIVE SUMMARY ................................................................................................... xiii
1. Background ................................................................................................................... xiii
2. Framework ........................................................................................................................ xiv
3. Focus Sector Strategies and Interventions ........................................................................... xv
4. Financial Projections for implementation of SAPCC ........................................................... xviii
5. Endorsement by National Steering Committee on Climate change, MoEF&CC ......................xix
Introduction ................................................................................................................. - 1 -
Background and Context ...................................................................................................... - 1 -
The National Context ............................................................................................................ - 1 -
The Bihar Context ................................................................................................................. - 2 -
Bihar - ‘Building Resilience’ ................................................................................................... - 3 -
BAPCC Preparation Process .................................................................................................. - 4 -
1. State Profile ........................................................................................................... - 6 -
1.1 Location and Physiography ........................................................................................ - 6 -
1.2 Demographic and Human Development Profile .......................................................... - 8 -
1.3 Economy ................................................................................................................. - 10 -
1.4 Focus Sectors .......................................................................................................... - 14 -
1.4.1 Agriculture and Allied Sectors .............................................................................. - 14 -
1.4.2 Forests and Biodiversity ....................................................................................... - 14 -
1.4.3 Water Resources ................................................................................................. - 15 -
1.4.4 Disaster Management .......................................................................................... - 15 -
1.4.5 Urban Development ............................................................................................ - 15 -
1.4.6 Transport ............................................................................................................ - 15 -
1.4.7 Energy ................................................................................................................. - 16 -
1.4.8 Industries and Mining .......................................................................................... - 16 -
1.4.9 Human Health ..................................................................................................... - 16 -
2. Climate Profile of the State .................................................................................. - 17 -

State Action Plan on Climate Change (SAPCC)-Jan 2015
ii
2.1 Introduction ............................................................................................................ - 17 -
2.2 Climate Change Scenarios ........................................................................................ - 17 -
2.3 Key Conclusions ...................................................................................................... - 19 -
3. Overarching State Framework ............................................................................. - 21 -
3.1 State Vision and Commitment ................................................................................. - 21 -
3.2 Overall Approach, Principles, and Strategies ............................................................ - 21 -
4. Sectoral Implementation Approaches .................................................................. - 31 -
4.1 Overall Common Implementation Framework ......................................................... - 31 -
5. Agriculture and Allied Sectors .............................................................................. - 33 -
5.1 Overview, Characteristics and Status ....................................................................... - 33 -
5.2 Key Issues ............................................................................................................... - 37 -
5.3 Priorities ................................................................................................................. - 37 -
5.4 Perceived Climate Impacts ....................................................................................... - 39 -
5.5 Strategies ................................................................................................................ - 46 -
5.6 Institutional Linkages and Stakeholders ................................................................... - 48 -
5.7 Linkages with the NAPCC ......................................................................................... - 48 -
5.8 Sectoral Action Plan and Budgets under the BAPCC .................................................. - 48 -
6. Forests and Biodiversity ....................................................................................... - 49 -
6.1 Overview, Characteristics and Status ....................................................................... - 49 -
6.2 Key Issues ............................................................................................................... - 57 -
6.3 Priorities ................................................................................................................. - 57 -
6.4 Perceived Climate Impacts ....................................................................................... - 59 -
6.5 Strategies ................................................................................................................ - 59 -
6.6 Institutional Linkages and Stakeholders ................................................................... - 64 -
6.7 Linkages with the NAPCC ......................................................................................... - 64 -
6.8 Sectoral Action Plan and Budgets under the BAPCC .................................................. - 64 -
7. Water Resources .................................................................................................. - 65 -
7.1 Overview, Characteristics and Status ....................................................................... - 65 -
7.1.1 River Basins and Rivers ................................................................................. - 65 -
7.2 Key Issues ............................................................................................................... - 68 -
7.3 Priorities ................................................................................................................. - 69 -
7.4 Perceived Climate Impacts ....................................................................................... - 70 -
7.5 Strategies ................................................................................................................ - 72 -
State Action Plan on Climate Change (SAPCC)-Jan 2015
iii
7.6 Institutional Linkages and Stakeholders ................................................................... - 74 -
7.7 Linkages with the NAPCC ......................................................................................... - 74 -
7.8 Sectoral Action Plan and Budgets under the BAPCC .................................................. - 74 -
8. Disaster Management ......................................................................................... - 75 -
8.1 Overview, Characteristics and Status ................................................................ - 75 -
8.2 Key Issues ..................................................................................................................... - 78 -
8.3 Priorities....................................................................................................................... - 79 -
8.4 Perceived Climate Impacts ............................................................................................ - 80 -
8.5 Strategies ..................................................................................................................... - 80 -
8.6 Institutional Linkages and Stakeholders ................................................................... - 84 -
8.7 Linkages with the NAPCC ......................................................................................... - 84 -
8.8 Sectoral Action Plan and Budgets under the BAPCC .................................................. - 84 -
9. Urban Development............................................................................................. - 85 -
9.1 Overview, Characteristics and Status ....................................................................... - 85 -
9.2 Keys Issues .............................................................................................................. - 89 -
9.3 Priorities ................................................................................................................. - 89 -
9.4 Perceived Climate Impacts ....................................................................................... - 90 -
9.5 Strategies ................................................................................................................ - 91 -
9.6 Institutional Linkages and Stakeholders ................................................................... - 93 -
9.7 Linkages with the NAPCC ......................................................................................... - 93 -
9.8 Sectorial Action Plan and Budget under the BPACC .................................................. - 93 -
10. Transport ......................................................................................................... - 94 -
10.1 Overview, Characteristics and Status ....................................................................... - 94 -
10.2 Key Issues ............................................................................................................... - 96 -
10.3 Priorities ................................................................................................................. - 96 -
10.4 Perceived Climate Impacts ....................................................................................... - 96 -
10.5 Strategies ................................................................................................................ - 97 -
10.6 Institutional Linkages and Stakeholders ................................................................... - 98 -
10.7 Linkages with the NAPCC ......................................................................................... - 98 -
10.8 Sectoral Action Plan and Budgets under the BAPCC .................................................. - 98 -
11. Energy.............................................................................................................. - 99 -
11.1 Overview, Characteristics and Status ....................................................................... - 99 -
11.2 Key Issues ............................................................................................................. - 101 -

State Action Plan on Climate Change (SAPCC)-Jan 2015
iv
11.3 Existing/On-going Initiatives .................................................................................. - 101 -
11.4 Priorities ............................................................................................................... - 101 -
11.5 Perceived Climate Impacts ..................................................................................... - 105 -
11.6 Strategies .............................................................................................................. - 108 -
11.7 Institutional Linkages and Stakeholders ................................................................. - 112 -
11.8 Linkages with the NAPCC ....................................................................................... - 112 -
11.9 Sectorial Action Plan and Budgets under the BAPCC ............................................... - 112 -
12. Industries and Mining ..................................................................................... - 113 -
12.1 Overview, Characteristics and Status ..................................................................... - 113 -
12.2 Key Issues ............................................................................................................. - 115 -
12.3 Priorities ............................................................................................................... - 116 -
12.4 Perceived Climate Impacts ..................................................................................... - 116 -
12.5 Strategies .............................................................................................................. - 117 -
12.6 Institutional Linkages and Stakeholders ................................................................. - 119 -
12.7 Linkages with the NAPCC ....................................................................................... - 119 -
12.8 Sectoral Action Plan and Budgets under the BAPCC ................................................ - 119 -
13. Human Health ................................................................................................ - 120 -
13.1 Overview, Characteristics and Status ..................................................................... - 120 -
13.2 Key Issues ............................................................................................................. - 120 -
13.3 Priorities ............................................................................................................... - 121 -
13.4 Perceived Climate Impacts ..................................................................................... - 122 -
13.5 Future Projection .................................................................................................. - 123 -
13.6 Strategies .............................................................................................................. - 124 -
13.7 Institutional Linkages and Stakeholders ................................................................. - 126 -
Annexures from page – ___________________________________________ 127 to 178
State Action Plan on Climate Change (SAPCC)-Jan 2015
v
List of Tables TABLE 1 BIHAR ADMINISTRATIVE DIVISIONS ________________________________________________ - 6 -
TABLE 2 AGRO-CLIMATIC ZONES IN BIHAR _________________________________________________ - 7 -
TABLE 3 ECONOMIC AND HUMAN DEVELOPMENT INDICATORS ___________________________________ - 9 -
TABLE 4 : COMPOUND ANNUAL GROWTH RATE (CAGR) OF GSDP _______________________________ - 12 -
TABLE 5 : RELATIVELY PROSPEROUS AND BACKWARD DISTRICTS OF BIHAR ___________________________ - 13 -
TABLE 6 LAND UTILIZATION PATTERN IN BIHAR (2006-07 TO 2008-09; AREA IN '000 HECTARES) __________ - 34 -
TABLE 7 CROPPING PATTERN IN BIHAR 2001-02 TO 2009-10) _________________________________ - 34 -
TABLE 8 PRODUCTIVITY (KG/HA) OF MAJOR CROPS IN BIHAR ___________________________________ - 35 -
TABLE 9 SIMULATED IMPACT OF CLIMATE CHANGE ON GROWTH PARAMETERS OF WHEAT ________________ - 41 -
TABLE 10 SIMULATED IMPACT OF CLIMATE CHANGE ON GROWTH PARAMETERS OF MAIZE ________________ - 42 -
TABLE 11 RAINFALL, CLIMATE, SOIL GROUP, ALTITUDE, AND ZONES IN NORTH BIHAR ___________________ - 49 -
TABLE 12 RAINFALL, CLIMATE, SOIL GROUP, ALTITUDE, AND ZONES IN SOUTH BIHAR ___________________ - 50 -
TABLE 13 DOMINANT TREE/PLANT SPECIES _______________________________________________ - 51 -
TABLE 14 DISTRICT-WISE FOREST COVER IN THE STATE (KM2) ___________________________________ - 52 -
TABLE 15 FOREST COVER CHANGE MATRIX (AREA IN KM2) _____________________________________ - 53 -
TABLE 16 FOREST AND TREE COVER ____________________________________________________ - 54 -
TABLE 17 GROWING STOCK (MILLION CUM) ______________________________________________ - 54 -
TABLE 18 BAMBOO BEARING AREA BY DENSITY IN RECORDED FOREST AREA (AREA IN KM2) _______________ - 55 -
TABLE 19 PROTECTED AREAS IN BIHAR __________________________________________________ - 55 -
TABLE 20 AREA ESTIMATES OF WETLANDS IN BIHAR _________________________________________ - 56 -
TABLE 21 TENTATIVE TARGET FOR GREEN COVER AUGMENTATION IN FOREST/NON-FOREST AREAS __________ - 63 -
TABLE 22 GROUNDWATER RESOURCES IN BIHAR ___________________________________________ - 66 -
TABLE 23 WATER UTILIZATION EFFICIENCY OF MAJOR AND MEDIUM IRRIGATION SCHEMES (FIGURES IN '000 HA) - 67 -
TABLE 24 : IRRIGATED AREA THROUGH MINOR IRRIGATION SOURCES (AREA IN '000 HECTARES) ____________ - 67 -
TABLE 25 DISTRICT-WISE DATA ON AHAR-PYNES/IRRIGATION PONDS ______________________________ - 68 -
TABLE 26 URBAN AGGLOMERATION WITH OVER 100,000 POPULATION ____________________________ - 85 -
TABLE 27 LEVEL OF URBAN SERVICE - BIHAR IN COMPARISON WITH NATIONAL STANDARD, NATIONAL AVERAGE AND 24
TOWN AVERAGE _____________________________________________________________ - 86 -
TABLE 28 NUMBER OF REGISTERED VEHICLES (2005-06 TO 2011-12; UP TO DEC. 2011) _______________ - 94 -
TABLE 29 TRANSPORT AND ALLIED SECTORS AS SECTORAL COMPOSITION OF GSDP AT CONSTANT PRICE (2004-05 TO
2011-12) _________________________________________________________________ - 95 -
TABLE 30 POWER SUPPLY POSITION IN BIHAR ______________________________________________ - 99 -
TABLE 31 : FORECAST OF PEAK LOAD AND ENERGY REQUIREMENT (2011-12 TO 2016-17) ______________ - 99 -
TABLE 32 RENEWABLE ENERGY POTENTIAL OF BIHAR ________________________________________ - 100 -
TABLE 33 POTENTIAL ENERGY SECTOR VULNERABILITY TO CLIMATE CHANGE ________________________ - 106 -
TABLE 34 LARGE SCALE INDUSTRIES IN BIHAR (2010-11) ____________________________________ - 113 -
TABLE 35 AVERAGE MONTHLY VALUE OF RAINFALL AND MALARIA CASES IN PURNIA DISTRICT DURING THE PERIOD OF
SEPT 2010 TO AUG 2010 (SOURCE:RANJANA KUMARI AND B. N. PANDEY, EGYPT. ACAD. J. BIOLOG. SCI., 5(1):
193-195 (2012)) ___________________________________________________________ - 122 -

State Action Plan on Climate Change (SAPCC)-Jan 2015
vi
List of Figures FIGURE 1: BIHAR – LOCATION AND DISTRICTS _______________________________________________ - 6 -
FIGURE 2 MAP DEPICTING AGRO CLIMATIC ZONE ____________________________________________ - 8 -
FIGURE 3 BIHAR’S NSDP AND PER CAPITA NSDP ___________________________________________ - 13 -
FIGURE 4 STATE LEVEL ARCHITECTURE FOR BAPCC IMPLEMENTATION _____________________________ - 24 -
FIGURE 5 : TENTATIVE AND INDICATIVE MONITORING FRAMEWORK FOR THE BAPCC ___________________ - 29 -
FIGURE 6 COMMON FRAMEWORK ELEMENTS FOR SECTORAL IMPLEMENTATION UNDER THE BAPCC _________ - 31 -
FIGURE 7 INDO-GANGETIC PLANE VULNERABILITY MAP _______________________________________ - 41 -
FIGURE 8 INDICES OF SPAWN QUALITY IN MIDDLE STRETCH OF THE RIVER GANGA FROM 1965-2009 ________ - 44 -
FIGURE 9 ANNUAL THI LOAD ON LIVESTOCK_______________________________________________ - 44 -
FIGURE 10 THI LOAD IN BASELINE (LEFT) AND IN 2030S SCENARIO (RIGHT) DURING MARCH ______________ - 45 -
FIGURE 11 BIHAR’S FOREST COVER _____________________________________________________ - 52 -
FIGURE 12 FOREST TYPE GROUPS ______________________________________________________ - 54 -
FIGURE 13 WETLANDS AREAS OF BIHAR _________________________________________________ - 57 -
FIGURE 14 RIVER BASINS AND SUB-BASINS IN BIHAR _________________________________________ - 65 -
FIGURE 15 SOIL MOISTURE, EVAPORATION AND RUNOFF FOR THE PERIOD OF 2006-2050 WITH RESPECT TO 1961-
2005 UNDER EXPERIMENT OF REPRESENTATIVE CONCENTRATION PATHWAY (RCP) 4.5 IN CMIP5 SIMULATION
(SOURCE: CUB, PATNA) ________________________________________________________ - 71 -
FIGURE 16 FLOOD VULNERABILITY ZONE-WISE _____________________________________________ - 76 -
FIGURE 17 FLOOD PRONE DISTRICTS OF BIHAR _____________________________________________ - 76 -
FIGURE 18 FREQUENCY OF SURFACE WATER DEFICIT IN BIHAR (SOURCE: CUB, PATNA) _________________ - 77 -
FIGURE 19 SUMMER MONSOON RAINFALL BIHAR __________________________________________ - 77 -
FIGURE 20 CYCLONIC STORMS VULNERABILITY ZONE-WISE _____________________________________ - 78 -
FIGURE 21 AVERAGE MONTHLY VALUE OF RAINFALL AND MALARIA CASES IN PURNIA DISTRICT DURING THE PERIOD OF
SEPTEMBER 2010 TO AUGUST 2010 (SOURCE: RANJANA KUMARI AND B. N. PANDEY, EGYPT. ACAD. J. BIOLOG.
SCI., 5(1): 193-195 (2012)) ___________________________________________________ - 123 -
FIGURE 22 PROJECTED RISK OF MALARIA TRANSMISSION IN THE YEAR 2020, COMPARED WITH THE AVERAGE RISK IN THE
YEARS 1961 TO 1990 (SOURCE: IPCC 2007) ________________________________________ - 123 -

State Action Plan on Climate Change (SAPCC)-Jan 2015
vii
Abbreviations/Acronyms Acronym Expanded Form
ADB Asian Development Bank
AHS Annual Health Survey
ANC Ante-Natal Care
ATC Aggregate Technical and Commercial
BAPCC Bihar State Action Plan for Climate Change
BEE Bureau of Energy Efficiency
BEE Bureau of Energy Efficiency
BERC Bihar Electricity Regulatory Commission
BIADA Bihar Industrial Area Development Authority
BIFR Board for Industrial and Financial Reconstruction
BIGWIS Bihar Groundwater Irrigation Scheme
BLY Bachat Lamp Yojana
BRBN Bihar Rajya Beej Nigam
BREDA Bihar Renewable Energy Development Agency
BRLP Bihar Rural Livelihoods Project
BRLPS Bihar Rural Livelihoods Project Society
BSEB Bihar State Electricity Board
BSFC Bihar State Financial Corporation
BSHPC Bihar State Hydroelectric Power Corporation Limited
BSRTC Bihar State Road Transport Corporation
BSSC Bihar State Sugar Corporation
BSUP Basic Services for Urban Poor
BUIDCO Bihar Urban Infrastructure Development Corporation
CBR Crude Birth rate
CDM Clean Development Mechanism
CDR Crude Death Rate
CEA Central Electricity Authority
CEPT Centre for Environment Planning and Technology
CETP Common Effluent Treatment Plant
CFL Compact Fluorescent Lamp
COMPFED Bihar State Co-operative Milk Producers’ Federation Ltd
CSS Centrally Sponsored Scheme
DDG Decentralized Distribution Generation
DFID Department for International Development, UK
DIC District Industries Centre
DMWR Department of Minor Water Resources
DPR Detailed Project Report
EOC Emergency Operations Centre
FDA French Development Agency
FMIS Flood Management Information System
FYP Five Year Plan
GDDP Gross District Development Product
GFCF Gross State Capital Formation
GIS Geographical Information System
GoB Government of Bihar
GSDP Gross State Domestic Product
HUDCO Housing and Urban Development Corporation
IAY Indira AwasYojana

State Action Plan on Climate Change (SAPCC)-Jan 2015
viii
Acronym Expanded Form
ICDS Integrated Child Development Scheme
IEC Information, Education, and Communication
IHSDP Integrated Housing and Slum Development Programme
IMR Infant Mortality Rate
IPP Independent Power Producer
IPT Intermediate Public Transport
ISDP Integrated Disease Surveillance Programme
ITI Indian Technical Institute
JBSY Janani Evam Bal SurakshaYojana
JFM Joint Forest Management
JNNURM Jawaharlal Nehru National Urban Renewal Mission
KCC Kisan Credit Card
KVIC Khadi and Village Industries Commission
MDR Major District Road
MFC Multi-Functional Complex
MMR Maternal Mortality Rate
MNREGS Mahatma Gandhi National Rural Employment Guarantee Scheme
MNSY MukhyaMantriNari Shakti Yojana
MoEF Ministry of Environment and Forests
MRTS Mass Rapid Transit System
MSME Medium, Small, and Micro Enterprises
NABARD National Bank for Rural and Agricultural Development
NAPCC National Action Plan for Climate Change
NDMA National Disaster Management Agency
NDRF National Disaster Response Force
NGRBA National Ganga River Basin Authority
NGRBA National Ganga River Basin Authority
NH National Highway
NHPC National Hydroelectric Power Corporation Limited
NPCIL Nuclear Power Corporation of India Limited
NPSGY Nayi Peedhi Swasthya Guarantee Yojna
NRHM National Rural Health Mission
NRLP National Rural Livelihoods Programme
NSDP Net State Domestic Product
NTFP Non-Timber Forest Produce
NTPC National Thermal Power Corporation Limited
NWDA National Water Development Agency
O&M Operation and Maintenance
PACS Primary Agricultural Cooperative Society
PCDE Per Capita Development Expenditure
PDS Public Distribution System
PESU Patna Electric Supply Undertaking
PFC Power Finance Corporation Limited
PGCIL Power Grid Corporation of India Limited
PHED Public Health Engineering Department
PIM Participatory Irrigation Management
PPA Power Purchase Agreement
PPP Public-Private Partnership
PRI Panchayati Raj Institution
PURA Provision of Urban Services for Rural Areas

State Action Plan on Climate Change (SAPCC)-Jan 2015
ix
Acronym Expanded Form
R-APDRP Restructured Accelerated Power Development and Reform Programme
R&M Restoration and Modernisation
RGGVY Rajiv Gandhi Grameen Vidyutikaran Yojana
RGSEAG Rajiv Gandhi Scheme for Empowerment of Adolescent Girls
RIDF Rural Infrastructure Development Fund
RSVY Rashtriya Sam VikasYojana
SAPCC State Action Plan on Climate Change
SC Scheduled Caste
SDMA State Disaster Management Agency
SDRF State Disaster Response Force
SGSY Swarnajayanti Gram SwarozgarYojana
SH State Highway
SHG Self-Help Group
SHP Small Hydro Power
SIPB State Investment Planning Board
SOP Standard Operating Procedure
SPCB State Pollution Control Board
SRI System of Rice Intensification
SRR Seed Replacement Ratio
SSC State Steering Committee
ST Scheduled Tribe
STF Special Task Force
STP Sewerage Treatment Plant
T&D Transmission and Distribution
TFR Total Fertility Rate
UIDSSMT Urban Infrastructure Development Scheme for Small and Medium Towns
UIG Urban Infrastructure Governance
ULB Urban Local Body
UNDP United Nations Development Programme
UNFCCC United Nations Framework Convention on Climate Change
UNICEF United nations Children’s Fund
VFMPC Village Forest Management and Protection Committee
WALMI Water and Land Management Institute
WDC Women Development Corporation
WLL Wireless in Locked Loop
WRD Water Resources Department
WUA Water Users Association

F O R E W O R D
The phenomenon of climate change caused by human activities has emerged as the
prime area of concern amongst the global challenges related to environment and
sustainable development. It has become a rallying subject for the governments and the
peoples in most parts of the world and led to international and national responses. Being
global phenomenon its impacts have spectrum of manifestations over regional and local
scales with mostly adverse implications related to human comfort, safety and economic
productivity.
To face the imminent adversities of the climate change phenomenon and to make
a salvation in the long run we have to leverage the human caliber for resilience, cooperation,
adaptive capacity and innovation with the due sense of urgency overcoming any alarmist
despondency. The National Action Plan for Climate Change and the State Action Plans
for Climate Change are the means to this goal. These intend to catapult and anchor the
urgent measures in cooperative and coordinated manner for facing and negotiating the
adverse impacts of the climate change as well as contribute to the global endeavours for
mitigation of the same in the relevant time frames utilizing the human potentials indicated
here above.
It is expected that sincere efforts of government machinery and other stakeholders
in the relevant sectors will ensure that the activities and interventions identified under the
adaptive and mitigation measures related to climate change in the Bihar SAPCC document
are appropriately enacted and also mainstreamed in the development processes of the State.
In the ventures to be undertaken, the wisdom and insights of the community in responding
to the changes in climate and associated manifestations should be gainfully internalized as
well as the primacy of equity and inclusiveness for the really vulnerable sections of society
should also be ensured.
I express my earnest appreciation for the contributions of all the experts and
professionals associated in finalizing this document
Patna, 17 August, 2015 Anjani Kumar Singh
Chief Secretary, Government of Bihar

State Action Plan on Climate Change (SAPCC)-Jan 2015
xi
P R E F A C E
The phenomena of climate change induced and recently aggravated by anthropogenic
causes have spurred concerted responses the world over. Although these responses have wide
spectrum of perceptions and comprehension of the impacts and vulnerabilities as well as the varied
range of mitigation and adaption measures, the universal resonance in this field is based upon the
imminent severity of the phenomena.
Guided by the structure and initiatives enunciated in the National Action Plan for Climate
Change, the Bihar State Action Plan for Climate Change has been drafted essaying to focus on
broad state-specific traits as far as practicable with the available knowledge and understanding.
This framework document will help the state machinery in orienting their endeavors in the
relevant fields and sectors to cope up and adapt with the ensuing and potential impacts of climate
change. This document will also be useful in prioritizing and implementing various kinds of
mitigation measures.
Climate change phenomena and their ramifications as well as the science, technology and
the human knowledge and the systems responding to these are dynamic over the relevant decadal
time frames. Therefore the activities and interventions in adaptation and mitigation responses to
the climate change impacts have themselves to have dynamic, evolutionary and adaptive
approaches. We have to consider the SAPCC document and the implementation thereof with such
a perspective of flexibility in the long run. The endeavours in this field calls for deliberative
and orchestrated trans-disciplinary and often multi-sector coordinated activities. The participation
of the community with thrust on equity and inclusiveness for the more vulnerable sections has to
be the key guiding factor in taking up the initiatives and interventions in implementation of the
measures identified or prescribed in the SAPCC.
The efforts put in by UNDP officials and experts and professionals - both external and
from the Government Departments and organizations and all those associated in finalizing this
document are acknowledged with thankful appreciation.
Vivek Kumar Singh
Patna, 17 August 2015 Principal Secretary
Department of Environment & Forests,
Government of Bihar

State Action Plan on Climate Change (SAPCC)-Jan 2015
xii
Acknowledgements To be written

EXECUTIVE SUMMARY
1. Background
The Bihar State Action Plan for Climate Change (Bihar SAPCC) has been formulated as a framework
document with reference to the contours of the National Action Plan for Climate Change (NAPCC)
formulated in 2008. It incorporates the tenets therein viz. Sustainable development, Co-benefits to
society at large, Focus on adaptation, and mitigation and scientific research. It is also aligned with the
focus areas / missions of NAPCC: Sustainable Agriculture, Water Resources, Forests & Biodiversity,
Energy, Sustainable Habitat and Strategic Knowledge for Climate Change.
Attempts have been made to incorporate the state specific traits, aspects and factors in profiling of
the climate change scenarios, the vulnerability assessments and identifying the strategic and
programmatic interventions and activities for adaptation and mitigation.
The state specific climate change scenario and vulnerability assessments comprise of only broad
observations based upon the available climatic data and quick studies or formulations based on
prevalent models undertaken by consultant of Central University of Bihar, Department of
Environmental Science. These indicate salient projected patterns having ramifications for temperature
and rainfall and in turn water balance entailing potential hazards for agriculture, livestock production,
and weather extremes including increased frequency of draught and flooding events across different
regions of the state. However, more in depth studies are required in climate change scenarios, impacts
and exposures and vulnerability assessment to enable identification of more effective adaptive and
mitigation strategies and measures, mid-term review and course correction. The Climate Change
Centre envisaged in SAPCC would address this aspect correlating the same with the adaptive and
mitigation strategies and measures.
In formulation of SAPCC, the UNDP consultants engaged by MoEF&CC, Govt. of India were associated
after the first workshop held in 2011 and they initially steered and assisted in the preparation of the
document from the first framework paper in 2012 till the final version was drafted after a consultative
workshop in December 2014 and adopted by State Steering Committee in January 2015. The task has
been accomplished over several rounds of interactions with and inputs from the designated nodal
officers of the focus sector departments and reference to the SAPCC documents of some of the States
endorsed by MoEF&CC, Govt. of India.
Based upon the recommendations of the inception workshop held in 2011, the focus sectors identified
for initiatives and interventions under the SAPCC are 1) Agriculture along with Animal and Fishery

State Action Plan on Climate Change (SAPCC)-Jan 2015
xiv
resources, 2) Water Resources, 3) Forests and Biodiversity, 4) Health, 5) Disaster Management, 6)
Urban Development, 7) Energy, 8) Transport and 9) Industry & Mining.
It is to be appreciated that formulation of this action plan has been constrained by the capacity of the
state level apparatus in the emergent field of climate change science and management with complex
and inter-sector and trans-disciplinary ramifications, diverse perceptions and limited readily available
functional information-knowledge base. These constraints manifest in some of the limitations of this
document to be made up in due course with augmentation of knowledge and capacity enhancement.
2. Framework
The approach and strategies of the SAPCC are oriented for reducing exposure, hazards and
vulnerability, and building preparedness and capability for timely and effective response systems,
augmenting capacity to cope with unforeseen events and for pooling and sharing of risks.
The SAPCC also emphasizes setting up knowledge base comprising of local level climate vulnerability
and risk analyses, improved scientific evidence base in this field together with documentation of
people’s perceptions on climate change and its impacts, and ascertaining the perceptions for scientific
bases/validity enabling well informed and participatory review of sector strategies based on the
vulnerability and risk assessments.
Integrating poverty, livelihood and equity issues with thrust to reduce gender inequity as well as
intra-state inequity in the impacts and vulnerability have also been stated as guiding signpost in
programming the interventions.
The SAPCC also recognizes the need for gainful engagements with civil society, private sector,
financial institutions, and international / external support agencies. This would help in pooling
resources and expertise for up-scaling climate change adaptation and mitigation initiatives and
facilitate external support for bringing in resources, international best practices, knowledge
management and networking on climate change etc.
The governance and institutional set-up envisages State Steering Committee, Nodal
Department/Agency - Department of Environment & Forests, and Climate Change Cells/Units in the
Focus Sector Departments and District level formations of the line departments and ultimate reach
through village level institutions. This operational apparatus is to be supported by a State Centre for
Climate Change for pooling of knowledge resources in the scientific and management aspects on
climate change related potential impacts, vulnerability, adaptation and mitigation, together with an
Advisory Panel at the apex level with association of civil society and other stakeholders at operational
levels.

State Action Plan on Climate Change (SAPCC)-Jan 2015
xv
3. Focus Sector Strategies and Interventions
The prominent strategic measures and interventions for the nine focus sectors enlisted here
below are in consonance with the National Missions for climate change and convergent with
the thrust areas for sustainable development.
At this stage the interventions and activities have been identified for a short term preparatory
phase of about one and half years to be followed by a medium term of about five years. It is
understood that over this medium term the Climate Change aspects would be mainstreamed
with robust comprehension of the vulnerabilities, the identification, prioritization and
selection of appropriate and optimal measures of adaptation and mitigation across the focus
sectors. Over this period the capacity building along with adequate knowledge pool will also
be enriched to carry forward and upscale the measures over longer periods with the
manifestation of the climate change impacts.
Further, the strategies and interventions are numerous and may appear broad in some
instances, and despite the attempts to make the narrative more comprehensible for the non-
specialists, and to make the prescriptions more specific and precise and with assessed
implementation amenability of the same over a time frame, many of the generic inputs from
the focus sector departments have been retained to keep the plan document comprehensive
and exhaustive for the contextual understanding of the focus sector departments and
enlistment of broad spectrum of the identified measures to choose from. Considering the
diverse bio-physical setting and the changing socio-economic profile of the state, it has been
observed in the final workshop on 19th December 2014 and also in the State Steering
Committee meeting on 9th January 2015 that implementation of the SAPCC has to be itself
dynamic, evolutionary and adaptive over long term context. The objective and process of
assessing the impact potential of the interventions among competing options, precision,
prioritization and evaluation of implementation efficiency under resource availability or
constraint thereof shall be undertaken at the time of formulation of the work plans related
to many of the shortlisted strategies and interventions.
In case of the sectors of Forests & Biodiversity and Agriculture, most of the interventions are
convergent with many of the extant strategies and ongoing core activities in these sectors; in
other sectors some of these are of the same nature.

State Action Plan on Climate Change (SAPCC)-Jan 2015
xvi
3.1. Agriculture
Minimizing soil & water losses - resource conservation technologies & Improving irrigation
efficiency and Introduction / promotion of low water demanding crops in low rain fall areas;
Promotion of conservation agriculture &Conservation of gene pool of traditional crop
varieties;
Discouraging exploitation of fertile top soil use for brick manufacture etc. and promote eco-
friendly alternatives; Strengthening weather services and early warning systems;
Synergizing traditional knowledge, agricultural heritage and modern technology and
research;
Access to information institutional support to Panchayats;
Disseminating and follow best management practices;
Strategic planning at agro-climatic zone level
3.2 Water Resources
Improving understanding of climate impacts to water resource sector;
Development of water resources information system and reassessment of basin wise water
situation;
Preservation of wetlands and maintenance of optimal wetland hydrology;
Revival of traditional systems of water storage, conservation and micro-irrigation;
Intensive programmes for ground water recharge in over-exploited areas;
Extending subsidies and incentives for recycling / recovery;
Management of shallow and deep aquifers particularly in arsenic prone area;
State Water Policy framework and a comprehensive water sector roadmap
3.3 Forests and Biodiversity
Integrated approach - leveraging opportunities for mitigation and adaptation measures
considering forests and non-forest public lands as well as private lands
Emphasis on restoration of ecosystems and habitat diversity for enhancing ecosystem goods
and services
Maximising niches for diverse life forms by preserving mosaic of diverse vegetation types
with restoration of native bio-diverse species mix
Strengthening institutions of decentralized forest governance (JFMCs), and capacity building
for adaptive forest management
Appraisal and promotion of traditional wisdom and practices having climate change
ramifications
Forest degradation to be addressed by inter-sector convergence
Exploring possibility of leveraging opportunities such as REDD+
Climate change effects on wild life (wild fauna) to be examined and preventive measures to
be undertaken
3.4 Disaster Management
Build adaptive resilience and reduce vulnerability across communities and sectors
Integration of disaster risk management and climate change adaptation, along with
incorporation of both into state, district, and local planning and practices
State Action Plan on Climate Change (SAPCC)-Jan 2015
xvii
Multi-hazards approach in planning and action for disasters
Promoting green and disaster resilient construction technologies
Raising quick response teams at grassroot level
Disaster management plan for major reservoirs
Assessment of urban vulnerability in case of extreme precipitation events
Simulation of extreme precipitation scenario in major river basins and planning for the same
Averting disasters related to hazardous and biomedical waste
Mainstreaming of risk assessment and disaster management planning in govt. projects
3.5 Urban Development
Exploiting potential for mitigating climate change through reduction in demand for energy
Reorienting urban planning to address climate change issues w.r.t. mitigation and
adaptation and improve responsiveness to disasters
Promoting satellite towns for major cities to de-congest and distribute load
Mitigating climate change with respect to urban transport
Decentralize sewage treatment plants at local (colony/settlement/household) level
Application of Energy efficiency codes in commercial & residential consumptions
Comprehensive approach in the management of water, municipal solid waste and waste
water; clean energy technologies utilizing municipal solid waste.
Encourage competitiveness and technological innovation in mitigating and adapting to
climate change
3.6 Energy
Increasing the mix of renewable energy in power generation up to 30%
To design Bihar specific policy for implementation of Decentralized Distributed Generation in
rural areas
Improving energy efficiency in households cooking in rural areas
Feasibility studies for solar concentrator applications
Undertake feasibility study and develop implementation plan for an integrated grid
connected energy supply system from all type of energy resources
Scoping, planning and implementation of Decentralized Distributed Generation
3.7 Transport
Evaluation of infrastructure vulnerability to climate change taking into account natural
hazards and disasters
Improve vehicle maintenance as a priority to reduce pollution and GHG emission
Promote and ensure availability of cleaner fuels
Intelligent traffic management system encouraging modal shift
Public transport and infrastructure promoting cycling and walking
3.8 Health
Integrated Disease Surveillance program and Develop disease forecasting system
Identify potential sources impacting health due to climate change
Study of vulnerability to disease due to change in temperature and rainfall
Capacity building to address health issues related to climate change

State Action Plan on Climate Change (SAPCC)-Jan 2015
xviii
Associate private health care services in these endeavors
Strengthening of disaster management teams in district hospitals to respond to the effect of
extreme climatic episodes
3.9 Industry & Mining
Developing policy - regulatory instruments to encourages existing and new CC mitigation
technologies
Build awareness on options, opportunities and benefits of fuel switching, including the use
of waste materials and energy
Partnerships with industry associations to stimulate technological innovation/change to
improve resources use efficiency.
Waste management and reduction, and enhancing use of renewable energy.
Exploring market based mechanisms for emission reduction
4. Financial Projections for implementation of SAPCC have been assigned for the
nine sectors - interventions and activity wise. These projections are indicative and broad for most of
the focus sectors. The projections aggregate to the tune of 2000 crores over a period of 5+ years. Of
these, sizable chunks have been projected in the sectors of agriculture and animal and fishery
resources, forests and biodiversity sector and water resources. The Central Sector schemes and the
National Missions on National Initiative for Climate Resilient Agriculture, Water and River and
Wetlands conservation, Solar and Renewable Energy, Energy Efficiency and CDM, Green India Mission,
Sustainable Habitat, would cover substantial requirements as the interventions identified are aligned
or convergent. The additionally (a fraction of the aggregate projection) for overarching activities like
setting up of State Centre for Climate Change, Capacity building, Research etc. in some of the focus
sectors, the funding support of DST, MoEF& CC would be required. The abstract of the Financial
Projections for implementation of SAPCC have been assigned for the nine sectors are given below.
FINANCIAL PROJECTIONS FOR SAPCC, BIHAR
FOCUS SECTORS
SHORT TERM (01-2 yr) MEDIUM TERM (5 yr+) Total Rs in lakh
No. of Interventions/Activities
Financial Rs in Lakh
No. of Interventions/ Activities
Financial Rs in Lakh
Agriculture AH & Fisheries
6 -
231 -
9 10
14750 +78914
93895*
Water Resources 9 220 19 34900 35120
Forests & Biodiversity 12 6350 25 58050 64400*
Disaster Management
5 30 19 370 400
Urban Development 6 650 19 1450 2050
Energy 10 550 37 4200 4750
Transport 6 300 25 3400 3700
Industry & Mining 9 300 18 340 640
Health 11 - 16 1335 1335

State Action Plan on Climate Change (SAPCC)-Jan 2015
xix
Total 8631 2,06,640
5. Endorsement by National Steering Committee on Climate change,
MoEF&CC Government of India.
National Steering Committee has endorsed the SAPCC in its meeting held on 31st March 2015.
Therein, it was advised that for the financial projections, a broad apportionment or mapping
should be attempted such that the sector wise financial requirements that could be met with
under ongoing central or state schemes / programmes / missions are worked out and
indicated in the document with a view to roughly segregate the financial requirements which
should have to funded specifically/separately/ from national and international sources /
avenues especially created for funding climate change related adaptive and mitigation
measures.
Towards this end, the focus sectors departments have been consulted and as per inputs
received from Departments of Animal & Fisheries Resource Department, Agriculture, Health,
Industry, Water Resources and information available from the websites of concerned
ministries of Government of India, the break-up statement has been appended at the end of
Section C. It is to be appreciated that with the ongoing changes of contents and funding
pattern/arrangement in the central schemes together with some amount of inherent
variability of interpretation in correlating the identified activities or interventions and the
available programmes, schemes and missions, the exercise for working out the break-ups has
its limitations and the figures may vary to large extents.
17 August, 2015
Bharat Jyoti Director, Ecology & Environment
Environment and Forest Department Government of Bihar

State Action Plan on Climate Change (SAPCC)-Jan 2015
- 1 -
Introduction
Background and Context
Climate change will have wide-ranging effects on the environment, and on socio-
economic and related sectors, including water resources, agriculture and food security,
human health, terrestrial ecosystems and biodiversity and coastal zones. Changes in
rainfall pattern are likely to lead to severe water shortages and/or flooding. Melting of
glaciers can cause flooding and soil erosion. Rising temperatures will cause shifts in crop
growing seasons, which affects food security, and changes in the distribution of disease
vectors putting more people at risk from diseases such as malaria and dengue fever.
Temperature increases will potentially severely increase rates of extinction for many
habitats and species (up to 30 percent with a 2° C rise in temperature).
A rise in extreme events will have effects on health and lives as well as associated
environmental and economic impacts. Because of the speed at which change is happening
due to global temperature rise, it is urgent that the vulnerability of developing countries to
climate change is reduced and their capacity to adapt is increased and national adaptation
plans are implemented. Future vulnerability depends not only on climate change but also
on the type of development path that is pursued. Thus adaptation should be implemented
in the context of national and global sustainable development efforts.
The international community is identifying resources, tools and approaches to support this
effort. Adapting to climate change entails taking the right measures to reduce the negative
effects of climate change (or exploit the positive ones) by making the appropriate
adjustments and changes. There are many options and opportunities to adapt. These range
from technological options such as increased sea defences or flood-proof houses on stilts,
to behaviour change at the individual level, such as reducing water use in times of drought
and using insecticide-sprayed mosquito nets. Other strategies include early warning
systems for extreme events, better water management, improved risk management, various
insurance options and biodiversity conservation.
The National Context
India’s economy and a majority of its population are highly dependent on climate sensitive
sectors such as agriculture, animal husbandry, fisheries, tourism, etc. Since climate change
is expected to impact natural and human systems adversely by inducing changes these
systems, India can be considered highly vulnerable.
Climate change is only likely to exacerbate India’s already high physical exposure to
climate-related disasters (65 percent of India is drought prone, 12 percent flood prone, and
8 percent susceptible to cyclones). As a consequence, climate change is highly likely to
impact livelihoods by disrupting social, cultural, economic, ecological systems, physical
infrastructure, and human assets, accentuating health risks, and as such, posing severe risks
to the development of the country. Since climate change impacts are felt at multiple levels
from the global to the local, responses to climate change too need to be at multiple levels,
calling for strategic interventions at local, sub-national, national, and global levels.
At the global level, India’s contribution to multilateral negotiations in the United Nations
Framework Convention on Climate Change (UNFCCC) has been significant and it
continues to advocate for effective, cooperative and equitable global approaches based on

State Action Plan on Climate Change (SAPCC)-Jan 2015
- 2 -
the principle of ‘common but differentiated responsibilities and respective capabilities’.
At the national level, India has developed the National Action Plan on Climate Change
(NAPCC), 2008, and comprising eight national missions (see Box 1 below) at its core,
addressing various sectoral aspects of climate change.
The NAPCC seeks to promote understanding of climate change, adaptation, mitigation,
energy efficiency and natural resource conservation while pursuing overall economic
growth – i.e., measures that promote development objectives which also result in co-
benefits for addressing climate change.
Box 1: National Missions under the NAPCC
At the same time, recognising that the impacts of climate change will vary across states,
sectors, locations, and populations, and that different approaches will need to be adopted
to fit specific sub-national contexts and conditions, all States to prepare State Action Plans
for Climate Change (SAPCCs) in line the NAPCC. It is in this context that the Bihar State
Action plan (BAPCC) for Climate Change has been prepared.
The Bihar Context
Available evidence shows that there is high probability of increase in the frequency and
intensity of climate related natural hazards due to climate change and hence increase in
National Solar Mission aims to promote the development and use of solar energy for power generation and other uses with the ultimate objective of making solar energy competitive with fossil based energy options.
National Mission for Enhanced Energy Efficiency recommends mandating specific energy consumption decreases in large energy consuming industries. It also recommends financing for public-private participants to reduce energy consumption through demand side management programs
National Mission on Sustainable Habitat aims to promote energy efficiency as a core competent for urban planning. The plan calls for a greater emphasis on urban waste management and recycling including production of power from waste.
National Water Mission sets a goal of 20 percent improvement in water use efficiency through pricing and other measures
National Mission for Sustaining the Himalayan Ecosystem aims to conserve biodiversity, forest cover and other ecological values in the Himalayan region
National Mission for a Green India aims at Increased forest/tree cover on 5 m ha of forest/non-forest lands and improved quality of forest cover on another 5 m ha (a total of 10 m ha), improved ecosystem services including biodiversity, hydrological services, and carbon sequestration as a result of treatment of 10 m ha.
National Mission for Sustainable Agriculture aims to support climate adaptation in agriculture through the development of climate resilient crops and appropriate agricultural practices
National Mission on Strategic Knowledge for Climate Change is for gaining a better understanding of climate science, impacts and challenges. It envisions improved climate modelling and increased international collaboration to develop adaptation and mitigation technologies.

State Action Plan on Climate Change (SAPCC)-Jan 2015
- 3 -
potential threat due to climate change related natural disasters in India, and Bihar is no
exception to this. It is highly vulnerable to hydro-meteorological natural disasters, with
North Bihar in general being highly flood-prone, and South Bihar being highly drought
prone. In the (relative) absence of state level climate models and/or vulnerability studies,
as well low community awareness, Bihar is potentially more sensitive and vulnerable to
the climate change and its impacts.
Bihar - ‘Building Resilience’
Bihar is on an accelerated growth and development pathway, and in recent years, it has
acquired considerable attention throughout the country and even abroad for its remarkable
performance in the development front. For a state which had suffered stagnation for long
and which had almost resigned to its perpetual backwardness, this was a turning point,
leading to new hopes and aspirations. These changes were possible because of the state
government's firm commitment to an agenda of development, which is both speedy and
inclusive.
To fulfil this agenda, the state government had not only utilised its limited resources most
prudently, but had also strengthened its administrative machinery and introduced a number
of institutional reforms. The results clearly show that the past growth process of the state's
economy is not a short-term phenomenon, but the beginning of a long-term stable growth
process. For the 12th Five Year Plan (FYP) period, the State has adopted the motto –
“Growth with Justice.” The State’s Approach Paper for the 12th FYP targets a 13 percent
constant growth rate.
The state has constantly been emphasising on social, financial, and economic inclusion,
and the Approach Paper indicates that this would continue. Additionally, all sectors have
been asked to identify areas for inclusion and explore the possibilities of broad-streaming
(broad-streaming as envisaged by the State Planning and Development Department,
visualises the development of sub-streams by its broadening at par with mainstreams so
they may be considered as one entity; broad-streaming tries to take into account the
strength and weaknesses of the community and builds upon the existing avenues keeping
in view the language, tradition, culture, practices of under-privileged communities into
consideration). This may be one of the effective and feasible solutions for inclusive
development.
As such, in line with the motto “Growth with Justice” adopted for the Approach to the 12th
FYP, this BAPCC adopts the motto “Building Resilience” as the core theme that will guide
implementation.
The State’s developmental and growth priorities are in sync with India’s national priorities.
Likewise, the BAPCC and the priorities outlined herein are aligned to the imperatives of
the NAPCC and the eight national sectoral Missions under it. A range of measures is
already underway in the State that is complementary to the State’s climate resilience
agenda elaborated under this BAPCC, and spans multiple sectors. Some examples of these
on-going complementary initiatives are briefly outlined below:
Bihar is taking appropriate measures to conserve the limited extent of natural
forest areas (7 percent of geographical area) and ensure that the tree-cover

State Action Plan on Climate Change (SAPCC)-Jan 2015
- 4 -
outside the natural forests is enhanced to the maximum feasible extent within
the next decade.
Bihar has opted to implement the Bachat Lamp Yojana (BLY) of the Bureau
of Energy Efficiency (BEE), in a move to save an estimated 170MW by
replacing around 64 lakh conventional bulbs in the state with compact
fluorescent lamps (CFLs).
The State has also advocated an ‘entitlement based planning approach’ to
streamline the development planning process and to have a wider impact on
eradicating poverty and improve socio-economic conditions in the State;
The Integrated Food Processing Development Scheme of the State
Government has made progress with attracting investments into the State,
especially in the biscuits and edible oil manufacturing sectors, opening up the
scope for sowing crops such as mustard and sunflower. Recent investments
under the scheme are to the tune of several hundred crores, by major private
sector firms;
JEEVIKA - Bihar Rural Livelihoods Project (BRLP) has been designed to
address rural poverty in Bihar through the collaboration of the poor, the
Government of Bihar (GoB) and the World Bank. The BRLP objective is to
enhance social and economic empowerment of the rural poor in Bihar.
ULBs in the State, including the Patna Municipal Corporation (PMC) are
currently underequipped to deal with weather events such as flooding etc.;
steps are being taken to rectify this. Additionally, a City Strategic Plan has been
prepared for Patna and 19 other cities/towns of the State under the National
Ganga River Basin Authority (NGRBA) to deal with the sewage situation and
preventing the flow of sewage from flowing into the Ganges, at an estimated
total budget of nearly ₹800 crores.
BAPCC Preparation Process
Preparatory processes for formulating the BAPCC were taken up in early
2011, facilitated by the United Nations Development Programme (UNDP),
India, with the formulation of a State Steering Committee (SSC). A meeting
of the SSC was held on 22 June 2011, wherein it was decided that the BAPCC
would focus on the following key sectors: 1. Agriculture and Animal Husbandry;
2. Forests and Biodiversity;
3. Water Resources and Disaster Management;
4. Urban Development and Transport;
5. Industries and Mining;
6. Energy; and
7. Human Health

State Action Plan on Climate Change (SAPCC)-Jan 2015
- 5 -
Working Groups were constituted for each of the focus sectors, and these
were then tasked with developing initial strategy papers for the BAPCC for
their respective sectors. The State Environment and Forest Department was
nominated the nodal Department for coordinating the inputs for draft SAPCC
from the focus sector departments. A two-day workshop on preparation of
BAPCC was organized by the Environment & Forest Department, GoB and
facilitated by UNDP India, on 11-12 November 2011 at Hotel Maurya, Patna.
The Workshop was organised to discuss the issues associated with impact of
climate change and to formulate an understanding of the Framework for
preparation of the BAPCC. Attended by over 150 representatives various
departments/organizations and about 20 resource persons, the workshop
centred around the following themes relevant to preparation of the BAPCC:
o Frame work for preparation of SAPCC,
o Climate Change: Projections and Scenario for Bihar,
o Vulnerability and adaptation to climate change in:
Transport Sector;
Urban Sector;
Agriculture Sector;
Water resources Sector;
Energy Sector;
Forestry Sector;
Industries and Mining Sector;
Health Sector; and
Disaster Management Sector.
Timeline of BAPCC formulation Process/Activities
Month/Dates Process/Activity
Early 2011 Formation of State Steering Committee
June 2011 Meeting of key State & Departmental personnel; discussion on formulation of Working Groups
11-12 Nov 2011
Consultative Workshop in Patna
July 2012 Consultations with various line departments and First Draft of BAPCC developed and shared with line departments of focus sectors
Dec 2013 SSC reviews the progress of SAPCC formulation
Nov 2014 Contents for focus sector departments finalised with inputs of the respective departments
Dec 2014 Consultative workshop (19 Dec 2014) over the draft SAPCC and revision incorporating the suggestions of the workshop
9 Jan 2015 SAPCC placed before SSC for approval

State Action Plan on Climate Change (SAPCC)-Jan 2015
- 6 -
1. State Profile
1.1 Location and Physiography
Bihar is located between 24°20'10" and 27°31'15"N latitude and 82°19'50” and
88°17'40"E longitude in the eastern part of the country and situated at about 52.73 m height
above sea level. It is an entirely land locked state and is surrounded by West Bengal in the
east, Uttar Pradesh in the West and the State of Jharkhand in the South. In the North, Bihar
shares its boundary with Nepal. Humid West Bengal in the east and the sub humid Uttar
Pradesh in the West provides it with a transitional position in respect of climate, economy,
and culture.
Figure 1: Bihar – location and districts
Table 1 Bihar Administrative Divisions
Details 2001 2011
No.ofDivisions 9 9
No.ofDistricts 37 38
No.ofSub-Districts 101 101
No.ofTowns 130 199
No.ofVillages 45,098 44,875
Percentageofurbanpopulation 10.46 11.30
The Bihar plain is divided into two unequal halves by the River Ganga, which flows
through the middle from West to East. Close to 88 percent of the population lives in
villages. Bihar state is 12th largest in terms of geographical size (94,163 sq. km) and 3rd
largest by population, 10.38 crores as per Census 2011, in the country. It is also known for
its abundant natural resources, perennial rivers, fertile lands, and a long glorious history.
After the division the state in 2000, Bihar retained almost 75 percent of the population,
while it is left with only 54 percent of the land, thus inducing a lot of strain on the available
resources. Bihar lies in the tropical to sub-tropical region. Rainfall here is the most
significant factor in determining the nature of vegetation.

State Action Plan on Climate Change (SAPCC)-Jan 2015
- 7 -
Bihar has a monsoon climate with an average annual rainfall of 1200 mm. The sub-
Himalayan foothills of Someshwar and Dun ranges in Champaran constitute another belt
of moist deciduous forests. These also consist of scrub, grass, and reeds. Here the rainfall
is above 1,600 mm and thus promotes luxuriant Sal forests in the favoured areas. The hot
and dry summer gives the deciduous forests. The most important trees are Shorea Robusta
(Sal), Shisham, CedrelaToona, Khair, and Semal. This type of forests also occurs in
Saharasa and Purnia districts.
The topography of Bihar can be easily described as a fertile alluvial plain occupying the
Gangetic Valley. The plain extends from the foothills of the Himalayas in the north to a
few miles south of the river Ganges as it flows through the State from the west to the east.
Rich farmland and lush orchards extend throughout the state. The major crops are paddy,
wheat, lentils, sugarcane, and jute (hemp, related to the marijuana plant, but a source of
tough fibres for gunny bags). Also, cane grows wild in the marshes of West Champaran.
The principal fruits are mangoes, banana, jackfruit, and litchis. The State is broadly
divided into three agro-climatic zones as given below:
Table 2 Agro-climatic zones in Bihar
Agro climatic Zone
Districts Area (,000
ha) Average rainfall
Soil and Topography
Crops
Zone -I
North
West
Alluvial
Plains
Bettiah, Motihari,
Gopalganj, Siwan,
Vaishali, Seohar,
Muzaffarpur,
Samastipur,
Sitamarhi,
Madhubani,
Darbhanga, West
& East Champaran
Net
Cultivated
– 2281;
Gross
Cultivated
-- 3260
1234.7 Medium acidic,
heavy textured,
sandy loam to
clayed, flood
prone. (Large
area remains
under water
called Chaur,
Maun & Tal
lands)
Rice, Wheat,
Maize, Arhar;
Horticultural
crops including
Litchi, Mango,
Makhana, Water
Chestnut.
Zone -
II North
East
Alluvial
Plains
Purnea, Katihar,
Saharsa,
Madhepura,
Araria, Kishanganj,
Supaul, Khagaria,
Begusarai
Net
Cultivated
– 1147;
Gross
cultivated
-- 1677
1382.2 Light to medium
textured, slightly
acidic, sandy to
silty loam (large
area comprise of
Tal and Diara
lands)
Maize, Mustard,
Jute, Sugarcane;
Horticultural
crops include
Mango, Bel,
Banana, Papaya,
Cucurbit, Chilly,
Turmeric, Potato

State Action Plan on Climate Change (SAPCC)-Jan 2015
- 8 -
Agro climatic Zone
Districts Area (,000
ha) Average rainfall
Soil and Topography
Crops
Zone -
III
South
Bihar
Alluvial
Plains
3(a) Bhagalpur,
Sheikhpura,
Lakhisarai, Jamui,
Munger, Banka
3(b) Bhabua,
Rohtas,
Aurangabad,
Buxar, Jahanabad,
Gaya, Nalanda,
Nawada, Patna
Net
Cultivated
– 241;
Gross
cultivated
-- 3408
1102.1 Old alluvium to
sandy loam.
Rice, Gram,
Wheat;
Horticultural
crops include
Mango, Guava,
Banana, Bel,
Jackfruit, Onion,
Potato, Chillies,
Marigold
1.2 Demographic and Human Development Profile
Figure 2 Map depicting Agro climatic zone
According to the 2011 census, the population of the state of Bihar is 103,804,637 persons,
consisting of 52.2 percent males and 47.8 percent females. The average population of a
district of the state is 2,731,701. The population of the state is predominantly rural, with
89 percent of the population residing in rural areas. Patna (5772804) and Sheikhpura
(634927) are most populated and least populated districts of the state. Some of the
important economic and development indicators of Bihar are given below:
Figure 1 Map depicting Bihar’s agro-climatic zones

State Action Plan on Climate Change (SAPCC)-Jan 2015
- 9 -
Table 3 Economic and human development indicators
Indicators Bihar India
Demographic Indicators 2011 2011
1 Total Population (In Millions) 104 1210
2 % Contribution to national population 8.58 100
3 Sex Ratio (females per 1000 males) 916 940
4 Under 6 sex ratio (females per 1000 males) 933 914
Economic Indicators 2009-10 2009-10
5 Net domestic Product (at factor cost) (Rs crores) (For state) 110778 4493743
Gross Domestic Product (at factor cost) (Rs crores) (For
India)
6 Contribution of Agriculture to NSDP/GDP (%) 21.30 14.62
7 Contribution of Industry to NSDP/GDP (%) 4.63 20.16
8 Contribution of Services to NSDP/GDP (%) 74.07 65.22
9 Per Capita Net State Domestic Product (factor cost) (Rs)
(for State)
11558 33731
Per Capita Net National Product (factor cost) (Rs) (For
India)
10 NDP Growth rate (%) (for State) 9.56 8
GDP Growth Rate (%) (For India)
Human Development Indicators 2007-08 2007-08
11 Human Development Index Value (HDI) 0.367 0.467
12 HDI Rank (out of 23) 21
2006 2006
13 Gender Related Development Index (GDI) 0.479 0.590
14 GDI Rank (out of 35) 35 122
15 Gender Empowerment Measure (GEM) 0.379 0.497
16 GEM Rank (out of 35) 31
Human Development Indicators 2011 2011*
17 Inequality Adjusted Human Development Index Value
(IHDI)
0.303 0.343
18 Inequality Adjusted Human Development Index Rank (out
of 19)
16
19 Loss in HDI due to Inequalities (%) 32.06 32
20 Literacy Rate (%) 63.82 74.04
21 Male Literacy Rate (%) 73.39 82.14
22 Female Literacy Rate (%) 53.33 65.46
Poverty and Hunger Indicators 2009-10 2009-10
23 Poverty Headcount Ratio (%) 53.5 29.8
24 Total number of poor (in millions) 54.35 354.68
2005 2005
25 Multidimensional Poverty Index (MPI) 0.479 0.283

State Action Plan on Climate Change (SAPCC)-Jan 2015
- 10 -
Indicators Bihar India
26 Multidimensional Poverty Headcount (%) 79.3 53.7
27 Number of Multidimensional Poor (in millions) 72.3 612
2007 2007
28 Global Hunger Index (GHI) 27.3 23.3
29 GHI Rank (out of 17) 15
2005-06 2005-06
30 Prevalence of calorie undernourishment (%) 17.3 20
31 Prevalence of Underweight Children under 5 years of age
(%)
56.1 42.5
* Values differ from India IHDI in Global HDR 2011 due to different data sources.
Source for indicators 1-4, 20-22 -- Census of India 2011, Provisional Tables, Registrar General of India (http://www.censusindia.gov.in/2011-prov-results/prov_results_paper1_india.html); for 5-10 -- RBI Handbook of Statistics on Indian Economy and Economic Survey of India 2010-11 (http://www.rbi.org.in/scripts/AnnualPublications.aspx?head=Handbook%20of%20Statistics%20 on%20Indian%20Economy); for 11-12 -- India Human Development Report 2011, IAMR and Planning Commission; for 13-16 -- Gendering Human Development Indices: Gendering Human Development Indices: Recasting the Gender Development Index and Gender Empowerment Measure for India, Ministry of Women and Child Development, GOI (http://undp.org.in/sites/default/files/GDI_and_GEM_Report.pdf); for 17-19 -- Inequality Adjusted Human Development Index for India’s States 2011, UNDP (www.undp.org.in/sites/default/files/reports_publication/IHDI_India.pdf0 ; for 23-24 -- Tendulkar Committee Report 2009, Planning Commission (http://planningcommission.gov.in/reports/genrep/rep_pov.pdf); for 25-27 -- MPI data and updates for 2011, OPHI (http://www.ophi.org.uk/policy/multidimensional-poverty-index/mpi-data-methodology); for 28-31 -- India State Hunger Index 2009, IFPRI (http://www.ifpri.org/publication/comparisons-hunger-across-states-india-state-hunger-index)
According to Census 2011 Bihar has recorded 25.07 percent decadal population growth.
The district with highest decadal growth is Madhepura (30.65) and the district with lowest
decadal growth is Gopalganj (18.83). The urban decadal growth rate (35.11) is higher
when compared to rural growth rate (23.9). From the data, it could be seen that decadal
growth rate of urban females (37.07) is more than urban males (33.4), whereas the decadal
growth rate of rural females (23.43) is lower than rural males (24.33). This could be a
pointer towards increased acceptance of girl child (reduced female foeticide/infanticide)
and women empowerment in urban areas.The household size in the state of Bihar roughly
stands at six members per household. The number of members per household in rural areas
is about six, whereas in urban areas it is about 6.5. As per 2011 Census, the number of
literates in Bihar is 54,390,254 taking the state’s literacy rate to 63.82 percent. Out of these
male literates are 73.4 percent and female literates are 53.3 percent. The urban literacy rate
stands at 78.75 percent (male 84.42 percent and female 72.36 percent) compared to rural
literacy rate of 61.83 percent (male 71.9 percent and female 50.82 percent).
1.3 Economy
The recent data on state income shows that the economy of Bihar has been showing a
steady growth trend for the last 6 years. During the first 5 years after separation of
Jharkhand in 2000, the economy had grown at an annual rate of 4.42 percent at constant
prices. The already stagnating economy of Bihar had become even more crippled after the
bifurcation, thanks to the asymmetric distribution of resources between Jharkhand and
present Bihar. However, the economy witnessed a turnaround due to policies pursued by
the present state government and, as a result, the economy grew at an annual rate of 11.36

State Action Plan on Climate Change (SAPCC)-Jan 2015
- 11 -
percent during the period 2004-05 to 2010-11. This has been made possible by the fact
that the investment pattern showed a massive upsurge. From a small average annual plan
size of around ₹1200 crores during the 10th Plan (2002-2007), the annual plan size
climbed to more than ₹15,000 crores during the 11th Plan period (2007-2012). The
investment portfolio also changed and there was a massive stress on infrastructural
development and social delivery system.
Bihar faces complex economic development challenges. With an estimated population of
103.8 million in 2011, Bihar is a densely populated region, with no less than 1102 persons
living per sq. km. of its area. As per the Planning Commission figures, in 2004-05, 41.4
percent of the population lived below poverty line in Bihar. As nine out of ten people on
the average live in the villages, poverty is more visible in rural areas. With the bifurcation
of the state in November 2000, the newly created Jharkhand state inherited the mineral
rich and forest rich parts of the state and present Bihar was left with its largely agro-based
economy. However, Bihar is a part of the Gangetic plains and hence has rich soil and
possesses abundant water resources, and with optimal use of its abundant agricultural
resources, it is possible to enhance growth of the economy and the pace of growth of
Bihar's economy in last 6 years is a vindication of such a possibility.
The share of the primary sector in the gross state domestic product (GSDP) has been
declining on a continuous basis. The government is trying to stress investment in the
manufacturing and infrastructure sector so that the decline in the primary sector's
contribution is accompanied by productivity gains in the secondary and tertiary sector.
Nevertheless, the state cannot progress without a satisfactory growth of its agricultural
sector.
Agriculture would continue to play an integral part of the development process, as around
90 percent of the population still live in villages and they would continue to depend on
agriculture as a prime source of their livelihood. The growth rate of Bihar's economy has
not been uniform over the last decade. During the first five years since 1999-00, the
economy had grown at an annual rate of only 4.42 (see Table 5 below).
The economy then witnessed a turnaround and it grew at an annual rate of 11.36 percent
during the period 2004-05 to 2010-11. It can be noted that the growth rate achieved during
2004-05 to 2010-11 has been one of the highest among all the Indian states. The table also
shows that during the period 2004-05 to 2010-11, the sectors reporting a growth rate of
more than 15 percent are — registered manufacturing (23.30 percent), construction (19.61
percent), communications (27.23 percent) and trade, hotels and restaurant (20.22 percent).
During the period 1999-00 to 2004-05, the major contributors to the growth process were
— construction (12.17 percent), communication (11.02 percent) and trade, hotel and
restaurant (12.25 percent). In other words, the registered manufacturing has emerged as a
new leading sector of growth during 2004-05 to 2010-11. It can also be noted from the
table that, except for forestry and fishing both of which are rather small in size, all the
sectors of Bihar economy had registered a higher growth rate during the later five years.

State Action Plan on Climate Change (SAPCC)-Jan 2015
- 12 -
Table 4 : Compound Annual Growth Rate (CAGR) of GSDP1
No. Sector
Annual Growth Rate
1999-00 to 2004-05 2004-05 to 2010-11
Current Prices
Constant
1999-00
Prices
Current
Prices
Constant
2004-05
Prices
1 Agriculture/Animal Husbandry 4.00 2.40 13.95 3.73
2 Forestry / Logging 7.91 3.96 4.36 -2.00
3 Fishing 10.92 10.18 16.46 1.79
4 Mining/Quarrying -20.53 -19.13 16.12 13.80
Sub-Total (Primary) 4.42 2.71 13.17 3.08
5 Manufacturing 3.31 -0.41 16.19 9.74
5.1 Registered -0.91 -6.53 31.30 23.30
5.2 Un-registered 4.89 1.80 11.76 5.71
6 Construction 14.75 12.17 27.95 19.61
7 Electricity/Water Supply/Gas 5.12 -3.01 5.60 7.57
Sub-Total (Secondary) 7.42 3.82 22.09 15.04
8 Transport/Storage/Communication 2.56 2.63 15.39 14.68
8.1 Railways -1.50 -2.69 12.79 7.86
8.2 Other Transport 5.90 3.10
17.88 9.30
8.3 Storage 14.50 7.11
8.4 Communication 4.11 11.02 13.90 27.23
9 Trade/Hotel/Restaurant 15.93 12.25 29.68 20.22
Sub-Total (8 and 9) 12.16 9.41 27.02 19.03
10 Banking/Insurance 10.08 5.23 16.42 16.00
11 Real Estate/Ownership of
Dwelling/Business Services 12.44 4.59 18.15 9.68
Sub-Total (10 and 11) 11.35 4.88 17.52 12.38
12 Public Administration 6.36 2.80 17.27 9.14
13 Other Services 4.22 1.47 13.89 5.38
Sub-Total (Tertiary) 9.11 5.70 21.81 14.17
Total GSDP 7.32 4.42 19.45 11.36
Per Capita GSDP 5.08 2.24 17.63 9.67
In 2009-10, the Net State Domestic Product (NSDP) of Bihar was US$ 32.5 billion. The
average NSDP growth rate between 2004-05 and 2009-10 was about 16.2 percent. Bihar’s
per capita NSDP increased from US$ 172.6 in 2004-05 to US$ 340 in 2009-10. A robust
secondary and tertiary sector has helped Bihar to increase its average per capita NSDP by
around 14.5 percent between 2004-05 and 2009-10.
1Source: Bihar Economic Survey 2011-12, Finance Department, GoB, February 2012

State Action Plan on Climate Change (SAPCC)-Jan 2015
- 13 -
While Bihar’s per capita income at current prices remains relatively low, the impact of the
strong growth process in the state is reflected when one compares it with the all-India
average. In 2006-07, the Per Capita Income in Bihar (₹10,055) was 32.2 percent of the all-
India average (₹31,198); but in 2009-10, this ratio had increased to 34.7 percent (₹16,119
for Bihar and ₹46,492 for India) compared to the all India average of ₹46492 in 2009-102.
However, as is the case with most states in India, these figures mask regional disparities
within the State.
The latest available estimates for Per Capita GDDP (Gross District Domestic Product)
relate to 2007-08 and those estimates show that Patna (₹47,293), Munger (₹13,689), and
Begusarai (₹11,959) are the most prosperous districts of Bihar. On the other end of the
ranking, the most economically backward districts are Seohar (₹5021), Sitamarhi (₹5479),
and East Champaran (₹5575). Even if Patna is excluded since it has the State capital, the
per capita income of Munger is about 3 times that of Seohar. Analyses of consumption
levels of petroleum products (petrol, diesel, coal and cooking gas) show that Patna happens
to be most prosperous one according to all the four indicators. Other districts, which fall
among the top 3 districts with respect to at least one indicator, are — Munger, Rohtas and
Bhojpur in south Bihar, and Begusarai, Muzaffarpur, Vaishali in north Bihar. The most
backward districts in terms of at least one of the above four indicators are — East
Champaran, Sitamarhi, Seohar, Madhubani, Nawada, Supaul, Vaishali, Darbhanga,
Samastipur and Araria. It may be noted here that, except Nawada, all of these 10 districts
are in north Bihar.
Table 5 : Relatively prosperous and backward districts of Bihar3
Criteria Top 3 Districts Bottom 3 Districts
Per Capita NDDP Patna, Munger, Begusarai E. Champaran, Sitamarhi, Seohar
Consumption of Petrol Patna, Muzaffarpur, Vaishali Madhubani, Sitamarhi, Nawada
Consumption of Diesel Patna, Begusarai, Rohtas Madhubani, Sitamarhi, Supaul
2 Source: Central Statistical organization, New Delhi
3 Source: Bihar Economic Survey 2011-12, Finance Department, GoB, February 2012
Figure 3 Bihar’s NSDP and per capita NSDP
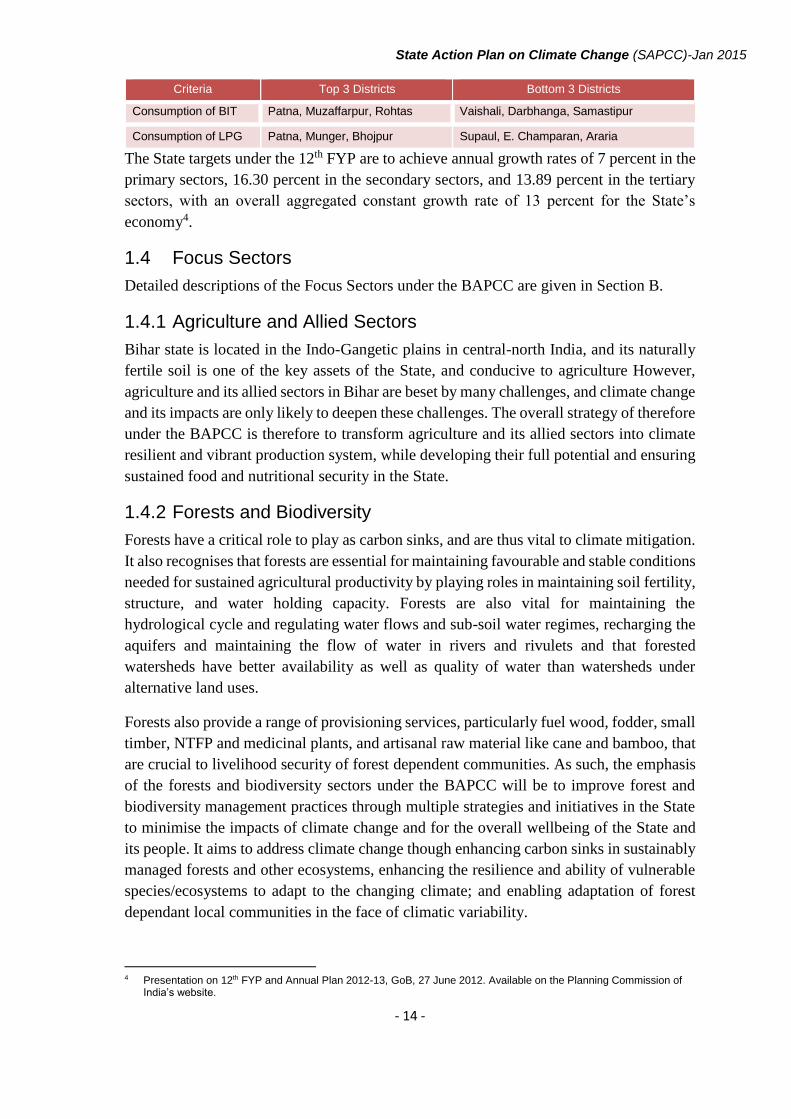
State Action Plan on Climate Change (SAPCC)-Jan 2015
- 14 -
Criteria Top 3 Districts Bottom 3 Districts
Consumption of BIT Patna, Muzaffarpur, Rohtas Vaishali, Darbhanga, Samastipur
Consumption of LPG Patna, Munger, Bhojpur Supaul, E. Champaran, Araria
The State targets under the 12th FYP are to achieve annual growth rates of 7 percent in the
primary sectors, 16.30 percent in the secondary sectors, and 13.89 percent in the tertiary
sectors, with an overall aggregated constant growth rate of 13 percent for the State’s
economy4.
1.4 Focus Sectors
Detailed descriptions of the Focus Sectors under the BAPCC are given in Section B.
1.4.1 Agriculture and Allied Sectors
Bihar state is located in the Indo-Gangetic plains in central-north India, and its naturally
fertile soil is one of the key assets of the State, and conducive to agriculture However,
agriculture and its allied sectors in Bihar are beset by many challenges, and climate change
and its impacts are only likely to deepen these challenges. The overall strategy of therefore
under the BAPCC is therefore to transform agriculture and its allied sectors into climate
resilient and vibrant production system, while developing their full potential and ensuring
sustained food and nutritional security in the State.
1.4.2 Forests and Biodiversity
Forests have a critical role to play as carbon sinks, and are thus vital to climate mitigation.
It also recognises that forests are essential for maintaining favourable and stable conditions
needed for sustained agricultural productivity by playing roles in maintaining soil fertility,
structure, and water holding capacity. Forests are also vital for maintaining the
hydrological cycle and regulating water flows and sub-soil water regimes, recharging the
aquifers and maintaining the flow of water in rivers and rivulets and that forested
watersheds have better availability as well as quality of water than watersheds under
alternative land uses.
Forests also provide a range of provisioning services, particularly fuel wood, fodder, small
timber, NTFP and medicinal plants, and artisanal raw material like cane and bamboo, that
are crucial to livelihood security of forest dependent communities. As such, the emphasis
of the forests and biodiversity sectors under the BAPCC will be to improve forest and
biodiversity management practices through multiple strategies and initiatives in the State
to minimise the impacts of climate change and for the overall wellbeing of the State and
its people. It aims to address climate change though enhancing carbon sinks in sustainably
managed forests and other ecosystems, enhancing the resilience and ability of vulnerable
species/ecosystems to adapt to the changing climate; and enabling adaptation of forest
dependant local communities in the face of climatic variability.
4 Presentation on 12th FYP and Annual Plan 2012-13, GoB, 27 June 2012. Available on the Planning Commission of
India’s website.
State Action Plan on Climate Change (SAPCC)-Jan 2015
- 15 -
1.4.3 Water Resources
Water is critical for all aspects of life on earth, and all human activity is dependent on this
critical resource. While Bihar has abundant water resources, the spatially and temporal
distribution of this valuable resource is uneven across the state; the water resources sector
poses challenges and complexities at multiple levels for the State.
Increased water use by all categories of water users and increased demand due to economic
and population growth are compounded by further stress by the increased pollution of
existing water resources, which not only restricts potential uses of available water but also
threatens future use. There is also a high degree of dependence on groundwater in the
State, and this can have serious consequences in the future. The BAPCC recognises the
critical importance of water resources to the State and need to safeguard these through a
comprehensive multi-pronged response process.
1.4.4 Disaster Management
Bihar is prone to multiple and frequent disasters of various categories, predominantly
floods and droughts. The Department of Disaster management is committed for the cause
of disaster resilient state. Climate change is making extreme climate events more frequent
and the incidences of landslide, flash flood, and drought are on the rise.
In the long run this is sure to adversely affect virtually all sectors of the State’s economy.
As a response, the State has already prepared a comprehensive Draft State Disaster
Management Plan, and the strategies outlined in the BAPCC will be complementary to
those in the Plan.
1.4.5 Urban Development
Although Bihar is relatively less urbanised than most other states in India, its percentage
decadal growth of urban population at 35.11 is higher than the 31.80 for the country as a
whole (and higher than as many as eighteen states/UTs). Bihar’s urban infrastructure faces
a serious deficit, and the rapid urban growth is putting immense pressure on the urban
infrastructure and services resulting in degradation of the urban environment and of natural
resources.
The State recognises that climate change and related extreme weather vents can critically
impact Bihar’s urban agglomerations, and as such, is committed to taking all necessary
measures to mitigate this, through actions outlined herein under the BAPCC.
1.4.6 Transport
The rapid growth of vehicles numbers in the State has been accompanied by concomitant
problems including congestion and traffic snarls, lack of adequate parking spaces, high
accident rates, environmental vehicular pollution rise, and inadequacy of road space for
efficient public transportation. The Transport Department has to not only cater to the
public transportation needs of the State’s population in general and also especially but also
the growing demands of urban agglomerations.

State Action Plan on Climate Change (SAPCC)-Jan 2015
- 16 -
1.4.7 Energy
Bihar has adopted a blend of thermal and hydel sources. Bihar currently has only 493 MW
of installed capacity for power, with thermal plants accounting for nearly 89 percent of the
total installed power generation capacity, with the remaining 11 percent being contributed
by the hydel plants. Of late, emphasis is also being laid on the development of non-
conventional energy sources, i.e., solar, wind and biomass energy. Even though Bihar has
a very lowest annual per capita consumption of electricity, considering the limited
generation in the State, there is an acute shortage of power not only for peak demand, but
even the base demand in the state.
The CEA has anticipated nearly 65 percent deficit in peak demand in 2012. This scenario,
while dismal from the standpoint of energy availability, also represents significant
opportunities for holistic and planned approaches to the energy sector, including
integration of various climate concerns.
1.4.8 Industries and Mining
Bihar today (after the separation of Jharkhand) has virtually no large industries, and most
industrial activity is in the medium, small, and cottage sectors. Nevertheless, Bihar is
proactively promoting the state as an attractive investment destination, and with initiatives
such as the Industrial Incentive Policy 2011, industrial growth is likely mushroom across
a range of sectors in the coming years. This represents an opportunity for the State to take
cognisance of climate change and its impacts on industry, as well plan a range of
adaptation and mitigation interventions.
1.4.9 Human Health
While the status of health services in Bihar is still inadequate, substantial improvements
have been recorded in this sector in recent years owing to increase in expenditure for health
services on one hand and better monitoring of the health services on the other. Health
indicators for the state have also shown significant improvement more recently. The State
has developed a Health Sector roadmap, and has planned substantial investments in the
sector under the 12th FYP.
However, climate change and its impacts pose a set of additional risks, and could
potentially impact the State’s well-laid plans.

State Action Plan on Climate Change (SAPCC)-Jan 2015
- 17 -
2. Climate Profile of the State
2.1 Introduction
Bihar is situated at the eastern part of the country which lies midway between the humid
West Bengal, in the east and the sub humid Uttar Pradesh, in the west. It is bounded by
country Nepal in the north and by the state of Jharkhand in the South. The Bihar plain is
divided into two unequal halves by the river Ganga which flows through almost in the
middle from west to east. Bihar occupies geographical area of 94,163 sq. km and is
extended for 483 km from east to west and 345 km from north to south.
Geologically, Bihar represents the northern front of Indian sub- continent. The
geographical and geological feature of Bihar includes the belt of Himalayan foothills in
the northern fringe of Paschim Champaran, the vast Ganga Plains, theVindhyan (Kaimur)
Plateau extending into Rohtas region and the small Gondwana basin outliers in Banka
district. Nearly two third of Bihar is under cover of the Ganga basin composed of alluvium
and masks the nature of basement rocks.
The state has a tropical monsoon climate with three distinct seasons-winters, summer and
rainy. The state can be divided into two climate zones; the Sub-Himalayan and the Ganga
plain. The winter season exists from December to February, January being the coldest
month when temperature falls below 10°C. The winter season is characterized by fog, cold
wave and western disturbances. Winter rainfall is received by western disturbances in the
state.
The summer season covers the period from April to June, May is the hottest month in the
greater part of the area and the maximum temperature some time reaches above 45°C and
causes the heat waves of the state. The monsoon season normally starts in the third week
of June and lasts up to end of September and downpour accumulated seasonal rainfall of
120-150 cm throughout the state. The rainfall is also triggered by monsoon depression
which formed in Bay of Bengal, entered in Bihar and produced wide spread rainfall.
During monsoon season, the state experienced flood and drought in almost every year and
affect the water resources and agriculture of Bihar.
Rainfall and temperature are two main climatic variables which affect agriculture, water,
forest, health and other sectors; therefore it is necessary to understand its observed and
future projected scenarios in Bihar.
2.2 Climate Change Scenarios
The observed rainfall and surface temperature (resolution of 10x10) for the period of 1961-
2000 of India Meteorological Department (IMD) is used. For future climate projection,
Climate Model Inter-comparison Project Phase 5 (CMIP5) data is used. The
Representative Concentration Pathways (RCPs) 2.6 4.5, 6.0 and 8.5experiments is
considered for future time periods while the Historical experiment is for past time periods.
In the Historical experiment in CMIP5, models are integrated from 1850 to 2012 with
external forcing changing with time..The simulated ISMR in RCPs experiment is

State Action Plan on Climate Change (SAPCC)-Jan 2015
- 18 -
considered for the period of 2006-2050.Here, Future change in annual surface temperature
(0C) and percentage change in JJA rainfall (mm/day) in Representative Concentration
Pathways (RCP) 4.5 experiment are analysed for the period of 2006-2050 with respect to
Historical experiment for the period of 1961-2005 in CESM1(CAM5) model.
2.2.1 Observed temperature Based on temperature time-series for 1951-2010
Annual mean temperature=0.010C increase,
Mean temperature in monsoon=0.010C increase
Mean temperature in post monsoon=0.020C increase
Mean temperature in winter and summer=No trend
Annual Tmax= No trend
Mean Tmax in winter= -0.010C, decrease
Mean Tmax in Summer= -0.020C, decrease
Mean Tmax in Monsoon= 0.010C, increase
Mean Tmax in Post Monsoon= 0.010C increase
2.2.2 Observed Rainfall (Based on rainfall time-series for 1951-2010)
Monsoon season rainfall (0.59 mm/year) shows significant trend, although negative
trend is found in winter (-0.06 mm/year) but not significant.
Based on rainfall date for the period of 1984-2012, Heavy rainfall frequency is more
in the month of July in Patna while Purnea shows more heavy rainfall frequency in
compare to Patna for June-July-August-September
Meteorological Drought and flood years during 1872-2010 over Bihar are 26 and 24
respectively.

State Action Plan on Climate Change (SAPCC)-Jan 2015
- 19 -
2.2.3 Projected temperature
Future projected change in maximum surface temperature (0C) during 2011-2040 with
respect to 1961-1990 in simulation of GISS-E2-H-rcp4.5, GISS-E2-H-CC-RCP8.5
climate models shows that
Western Bihar=0.60C to 10C, increase
Eastern Bihar=0.20C to 0.40C, increase
Future projected change in minimum surface temperature (0C) during 2011-2040 with respect to
1961-1990 in simulation of GFDL-CM3-RCP4.5,GFDL-CM3-8.5, MRI-CGCM3-RCP8.5, and
MRI-esm1-RCP8.5climate model shows that
Southern Bihar=1.20C to 2.00C
North Bihar=1.00Cto1.60C
2.2.4 Projected rainfall
Future projected change in JJA rainfall (cm) during 2011-2040 with respect to 1961-1990
in simulation of CCSM-RCP4.5, CCSM-recp8.5, CESM1-CAM5-rcp4.5 and CESM1-
CAM5-rcp8.5climate model shows:
EASTERN & CENTRAL BIHAR: 5-10 % surplus
SOUTH & WESTERN BIHAR: 5 % deficit
(Data & analysis source: Central University of Bihar, Patna)
2.3 Key Conclusions
Tmin increase of 0.6 to 1.50C in Dec-Jan during 1971-2000 in different pockets of
Bihar
Tmax decrease of -3.0 (Southwest) to -1.40C (Northeast) in April-May during 1971-
2000
Tmin increase of 0.10C is observed in the month of December during 1971-2000
No significant change in June-July-August (JJA) rainfall (cm) during 1871-2002
although decrease (southwest) or increase of rainfall is observed in different pockets
Future projected change in annual temperature (0C) during 2011-2040 with respect to
1961-1990 in RCPs of 8.5 shows changes of 0.8-1.90C
Future projected change in Tmin(0C) in December-January during 2011-2040 with
respect to 1961-1990 shows changes of 0.2-1.00C

State Action Plan on Climate Change (SAPCC)-Jan 2015
- 20 -
The 5-10% change (positive or negative) in mean JJA rainfall (cm) is noticed over
Bihar in RCPs of 4.5 and 8.5 scenarios
Based on temperature and rainfall time-series for 1951-2010
Annual Tmax does not show any trend while mean Tmax in winter (-0.010C/year),
Summer (-0.020C/year), Monsoon (0.010C/year), and Post Monsoon (0.010C/year)
shows significant tend.
Tmin in annual (0.020C), winter (0.020C/year), Summer (0.010C/year), and Post
Monsoon (0.020C/year) shows significant tend, while Monsoon season does not show
any trend
Annual mean temperature (0.010C), mean temperature in monsoon (0.010C) and post
monsoon (0.020C) show significant trend while no trend is found in winter and
summer season.
Mean Diurnal temperature range shows significant negative trend in annual (-0.020C),
winter (-0.040C) and summer (-0.030C), other seasons do not show significant trend.
Monsoon season rainfall (0.59 mm/year) shows significant trend, although negative
trend is found in winter (-0.06 mm/year) but not significant.
Based on rainfall date for the period of 1984-2012, Heavy rainfall frequency is more
in the month of July in Patna while Purnea shows more heavy rainfall frequency in
compare to Patna for June-July-August-September

Part B: Climate Change Strategy

State Action Plan on Climate Change (SAPCC)-Jan 2015
- 21 -
3. Overarching State Framework
3.1 State Vision and Commitment
The State has articulated climate concerns in its Approach Paper for the 12th FYP, and as
such, is committed to fostering an integrated approach to inclusive, sustainable, and
climate resilient growth and development. The GoB’s vision will be achieved through
pursuing (a) broadstreaming of climate concerns into all aspects of development policy
and implementation, (b) integrating low carbon and climate resilient development models
into its growth strategy, and (c) ensuring complementarity with and contributing to the
national agenda on climate change.
Keeping in mind the overall motto of Bihar Action Plan of Climate Change (BAPCC) –
‘Building Resilience through Development’, these approaches will be supported by the
strategies and actions outlined in this report, and by all other necessary actions by the State
Government for the achievement of the Vision.
3.2 Overall Approach, Principles, and Strategies
The approach of the BAPCC is to create and define an overarching climate response
framework at the State Government level to reduce vulnerability; reduce hazards and
exposure; pool, transfer, and share risks; prepare and respond effectively; and increase
capacity to cope with unforeseen events, while articulating flexible sector specific
response strategies and actions keeping in mind the overall Vision.
The State recognises that it has several existing vulnerabilities (ecological, economic,
social and cultural), and that climate change is likely exacerbate these further if not
addressed adequately and holistically. Therefore the climate response strategy of Bihar has
key elements such as accelerating inclusive economic growth, promoting sustainable
development, securing and diversifying livelihoods, and safeguarding ecosystems.
Further, the strategy is not to be viewed as a standalone action; instead it will be integrated
into the regular developmental planning process, keeping with the convergence principles
articulated in the State’s 12th FYP Approach Paper.
Adaptation will be the predominant philosophy and component of the climate response
strategy of Bihar, while at the same time leveraging opportunities for mitigation co-
benefits. The state lays equal emphasis on both ‘hard’ and ‘soft’ adaptation approaches –
where ‘hard adaptation options’ include options that have physical attributes (e.g.
infrastructure and engineering structures) and ‘soft adaptation options’ include the
development of skills, processes, institutions, social systems, policies and programmes.
Flexibility (within livelihoods, economic, social, cultural, ecological and institutional
systems), diversification (involving multiple independent flows to livelihood and natural
systems), learning and education (from events at both individual and institutional levels
and knowledge base required to develop new systems when existing ones are disrupted),

State Action Plan on Climate Change (SAPCC)-Jan 2015
- 22 -
mobility (an attribute of flexibility), operational techniques (for risk reduction before and
following disruptions), convertible asset and innovation (designing new systems and
options) will be the key elements of the climate response strategy for Bihar.
Specific elements of the overarching climate response framework at the State Government
level are articulated below (additional elements will be added as and when necessary). The
state will develop action oriented operational plans and budgetary frameworks for these
by end 2012. It has also been ensured that all actions to be undertaken as part of the
BAPCC have broad conformity to the NAPCC and the eight National Missions under it.
3.2.1 Scientific Knowledge, Evidence Base, and Understanding of Climate Change
The previous section has already outlined the fact that the currently available knowledge
base vis-à-vis climate change vulnerability and its impacts on the State, its economy, and
its various sectors and communities is limited or virtually non-existent. As such, the
BAPCC seeks to fulfil the following outcomes (which are linked to the overall knowledge
management Strategy under the BAPCC)
Development of detailed climate vulnerability and risk analyses covering all
districts, as well as specific analyses pertaining each of the sectors addressed in the
BAPCC;
Improved scientific evidence base and coordination mechanisms between
scientific research and academic institutions (including both national and state
level agencies) for build scientific data and evidence base for the State; and
collation of available scientific information and data on climate change pertaining
to the State
Review of the sectoral strategies under the BAPCC based on the vulnerability and
risk assessments; and
Documentation (on an on-going basis) of people’s perceptions on community
change and its impacts, and where appropriate, establish if these have scientific
bases and validity.
To fulfil the above outcomes, the State will take all necessary steps including initiating (as
one of the highest priority agendas) processes for carrying out detailed climate
vulnerability analyses and developing a climate vulnerability atlas, which will be updated
on an on-going basis. Centre for Environmental Science, Central University of Bihar,
Patna may be proposed for climate modelling activities.
Centre for Environmental Sciences arrange dialogue among academic institutions and
coordinate climate change research. These will then be used to foster processes for specific
basic and applied research initiatives that may be required to support the implementation
of BAPCC. Central University of Bihar will also foster dialogue and collaboration between
scientific and academic research organisations elsewhere as part of the above processes.

State Action Plan on Climate Change (SAPCC)-Jan 2015
- 23 -
Climate modelling activities have been started at Centre for Environmental Sciences
(CES), Central University of Bihar (Founded by GoI under Central Universities Act, 2009)
at Patna. The Regional Climate Model, PRECIS (UK Met Office) is being used to conduct
the experiment for base line (1961-1990) and A1B scenario (2011-2040) at surface
horizontal resolution of 50x50km2 over India, apart from various other studies using IPCC
climate model data and in the next phase, CES is expanded climate modelling activities
on a high speed computing facility by government funded research projects on Monsoon
Rainfall, Droughts, Floods, Western Disturbances and Climate Change Impacts on
Agriculture and Water Resources. Considering that Centre for Environmental Sciences,
Central University of Bihar is the only academic institution who is working on modelling
of climate change, the State proposes to mandate CES with the role of Centre for Climate
Change, and to task it with the role of anchoring all climate change and impact related
research activity specific to the State and also build State capacities for understanding and
tackling climate change through appropriate adaptation and mitigation actions.
3.2.2 Governance Mechanisms, Institutional Decision Making, and Convergence
As indicated in an earlier section, Bihar is already implementing a range of
steps/programmes that are climate-friendly/neutral (there are described in Section 4 below
under each sectoral subsection). While continuing to foster such initiatives, the State will
seek to fulfil a range of outcomes including:
Developing and putting into place overarching institutional and governance
mechanisms at the State level to oversee and implement the BAPCC;
Review of all state policies and revise these as necessary to articulate and integrate
climate concerns;
Articulation and integration of climate change considerations into development
strategies, plans and programmes;
Strengthening of institutional decision-making mechanisms and processes
(including monitoring & evaluation) to ensure cross-sectoral coordination related
to climate change;
Development and adoption of appropriate management approaches including
regulatory, incentive, and innovation based approaches to encourage appropriate
adaptation and mitigation measures; and
Development and strengthening of institutional capacity for climate related
disaster risk reduction and management.
The overarching State level institutional architecture is given in Figure 5 below.

State Action Plan on Climate Change (SAPCC)-Jan 2015
- 24 -
In order to provide an overarching governance framework and guidance to the State’s
climate agenda, the State has already constituted the State Steering Committee under the
Chair of the Chief Secretary and consisting of key senior bureaucrats from various sectors,
and other eminent persons.
The SSC, which was mandated the apex role of overseeing all aspects of the State’s
preparations and initiatives to address climate change and its impacts, will be activated,
and a specific terms of reference will be developed for it, including periodic mandatory
meetings, and outlining other key responsibilities including review of all State policies and
programmes and identify gaps, risks, opportunities, and possible corrective actions
towards achieving the above outcomes.
The Department of Environment and Forest will act as the Nodal Agency for coordinating
and overseeing all operational aspects of the BAPCC implementation and coordination at
the State level, with oversight support from the Chief Secretary, the Development
Commissioner, and the Principal Secretary, Planning and Development. All sectoral line
departments and other key agencies in the state will set up Climate Change Cells in their
respective departments/agencies. These Cells will coordinate and oversee all aspects of
BAPCC implementation in their respective sectors, as well as liaise/coordinate with the
State Planning Board and other line departments as required.
The State will also put together and co-opt an Advisory Panel comprising of academic and
practitioner experts to advise and work with the State SSC and the State Planning Board
in carrying out their respective mandates. It is anticipated that the Advisory panel would
co-opt new members as and when required or a case-by-case basis. While this BAPCC
State Steering Committee (SSC)
Nodal/Coordinating Agency
Climate Change Cells of Line Departments/Agencies
District Administration, Line Departments/Agencies
Village Level Institutions -- Panchayats, JFMCs, etc.
Advisory Panel
Climate Change Leaders, Civil Society, and other Stakeholder
Groups
Bihar State Centre for
Climate Change
Figure 4 state level architecture for BAPCC implementation

State Action Plan on Climate Change (SAPCC)-Jan 2015
- 25 -
focuses on sectoral interventions across a selected set of government line
departments/agencies, this will by no means exclude the role of other line
departments/agencies, and these will be co-opted to support BAPCC implementation
processes from time to time.
3.2.3 Capacity Development, Education, and Awareness
The State recognises that overall awareness of climate change and its impacts in Bihar is
limited. Therefore, the BAPCC seeks the fulfilment of the following outcomes:
Capacities of government line departments and agencies at all levels to analyse, plan,
converge, implement and monitor programmes addressing climate change and its
impacts; and
Significantly improved awareness of climate change and its impacts in government at
all levels as well as in communities, civil society, and the private sector in the State.
The State will initiate and foster a range of on-going awareness and capacity building
measures aimed at targeting government departments and agencies at various levels, to
improve overall awareness levels. It is proposed that Centre for Environmental Sciences,
Central University of Bihar will develop climate modelling centre and deploy capacity
building modules to train personnel from the Climate Change Cells of various line
departments, who in turn can train and build capacities of their respective departmental
personnel to actively engage the climate agenda.
The State will also put into motion a process of building awareness on climate change and
its impacts among the population and communities in general and also develop and widely
disseminate sets of actions that the citizens of the State can take to support the BAPCC. In
addition, the State will examine the possibility of incorporating climate change related
modules into the educational curriculum across various levels, including the development
of specific academic programmes on climate change at University levels.
Appropriate external agencies in coordination with Centre for Environmental Sciences,
Central University of Bihar will be co-opted as necessary to support the awareness and
capacity building processes. The State will additionally seek to build and support a
network of Climate Leaders – who can come from either government or elsewhere – to
help foster and champion the climate agenda in the State.
3.2.4 Connecting Science, Policy, and Practice
As an extension of the overarching principles actions on improving scientific knowledge
and evidence base articulated above, the State is committed to supporting processes that
connect science to policy and practice. The following outcomes are envisaged towards this
end:
Data/research needs to support BAPCC implementation and related policymaking
identified (on an on-going basis, as needs evolve);
Mechanisms to foster dialogue with and between scientific research and academic
agencies; and

State Action Plan on Climate Change (SAPCC)-Jan 2015
- 26 -
Specific mechanisms to adopt and implement practical approaches and solutions based
on basic and applied research to support BAPCC implementation.
As such, under the BAPCC, the State seeks to actively consult and dialogue with relevant
scientific organisations and academia in the formulation of state policies, to develop a
culture of evidence-based policymaking. It also similarly will support similar consultation
and dialogue in the formulation of developmental and sectoral programmes by the various
line departments and agencies, through their Climate Change Cells as has been proposed
in the BAPCC. On an immediate basis, specific emphasis will be given to practical
approaches and solutions (technological and otherwise) that have already been developed
by universities/research organizations in the state.
3.2.5 Integrating Poverty, Livelihoods, and Equity Issues
The State already places emphasis on inclusive development, as has been articulated in its
Approach Paper to the 12th FYP. By extension, the State also recognises that since climate
change can disproportionately impact the poor, women, children and the aged, and can
also impact livelihoods, sectoral planning under the BAPCC needs to explicitly integrate
poverty, livelihoods and equity concerns.
The State also recognizes the different roles that men and women play in society and
because of the unequal power relations between them. While a large number of poor, rural
women depend on climate-sensitive resources for survival and their livelihoods, they are
also less likely to have the education, opportunities, authority, decision-making power and
access to resources they need to adapt to climate change. Women’s vulnerability to climate
change differs from men and climate change interventions that are not gender-responsive
often result in deepening the existing gender divide5.
As such, the state will take the necessary steps towards fulfilling the following (but not be
limited to) outcomes:
(a) Reduced intra-state inequity between the various regions of Bihar as also reduced
inter-district inequality, especially in infrastructure and service provision as these
have a bearing on livelihoods and thus adaptive capacity as well;
(b) Mainstreamed use of explicit gender-responsive language, data, and analysis in the
detailed implementation plans to be developed under the BAPCC and integration of
gender and equity elements components in programming such as setting gender-
specific indicators in programmes and schemes, carrying out gender-focused
monitoring and evaluation, including gender-sensitive audits of adaptation
programme and schemes, building capacities of women and men to implement
participatory schemes at the village-level; building capacities on gender and
5 Fourth Assessment Report (2007) of the Inter-governmental Panel on Climate Change (IPCC), Chapter 17,
especially pages 729-730

State Action Plan on Climate Change (SAPCC)-Jan 2015
- 27 -
adaptation within all governance institutions at all levels from Panchayati Raj
Institutions (PRIs) to the State6;
(c) Partnerships and collaborative arrangements with relevant agencies (to be identified)
to help build capacities within the Departments to work with gender and climate
change adaptation; and
(d) Partnerships and collaborative arrangements with the Panchayati Raj Department to
help Gram Panchayats develop participatory and gender-just local action plans on
adaptation (LAPAs) at the Panchayat level, in addition to their mandate of developing
and implementing the Village-level Development Plans
It is expected that these actions will significantly enhance and contribute to equitous
adaptive climate resilience in the State.
3.2.6 Private Sector and Financial Institutions
The private sector already plays a role in contributing to the State’s economy in the
secondary and tertiary sectors. A range of PPP initiatives and projects are already
underway in the State in various sectors. Such PPP models can be useful for pooling
resources and expertise and for up-scaling climate change adaptation (especially in terms
of climate resilient infrastructure and low carbon goods and services) and mitigation
initiatives by way of explicit incorporation of climate concerns into project frameworks.
Private Sector has great potential and competency for bringing innovative solutions and
scale to the various models for climate change adaptation shaped by the civil society
and/or government institutions however their primary thrust thus far has been limited to
clean development mechanism (CDM) and related projects.
Increasingly, there is a huge potential and need private sector to play critical roles sectoral
initiatives in the primary sectors as well – brining in new management practices,
technologies and technology transfer, innovation, capital and investments, capacity
building, etc. In this direction, the BAPCC will seek to fulfil the following outcomes:
A roadmap for exploring the potential role of private sector across the various focus
sectors of the BAPCC especially in the primary sectors such as agriculture (with
special emphasis on rain-fed mountain agriculture and extension), forestry, etc.;
Review of existing initiatives by the private sector including CSR to examine
possibility of incorporating climate agendas;
Review of existing policy frameworks governing the private sector including the draft
State PPP Policy with the objective of exploring the incorporation of climate change
concerns into PPP projects in the state;
6 Aditi Kapoor, EngenderingThe Climate For Change: Policies and practices for gender-just adaptation. Alternative
Futures and Heinrich Boll Foundation (HBF), 2011
State Action Plan on Climate Change (SAPCC)-Jan 2015
- 28 -
Outlining of necessary enabling frameworks and regulatory mechanisms for
involvement of the private sector.
As in the case of the private sector, increasingly, the financial sector and financial
institutions will have critical roles to play in sectoral initiatives – brining in new financial
practices, products, and innovation, capital, investments, climate risk transfer mechanism,
etc. As such, the BAPCC envisages the following outcomes:
Developing a roadmap for exploring the potential role of the financial sector and
financial institutions across the various focus sectors identified in the BAPCC (and in
other sectors as appropriate/necessary); and
Outlining the necessary enabling frameworks and regulatory mechanisms for
involvement of the financial sector.
3.2.7 Role of Civil Society
Civil society and voluntary organizations have played critical roles in shaping the
development landscape of not only Bihar, but also across the nation. These will continue
to have vital roles in the context of climate change, and have the potential to deliver
programmes and services to communities and to bridge the roles of not only the
government and community but also bridge the roles of scientific research institutions and
the private sector with government and the community.
As such, the BAPCC envisages the following outcomes relating to the role of civil
society:
Developing a roadmap for exploring and articulating the potential role of civil society
organisations (including non-governmental organisations [NGOs] and NGO
Networks, community based organisations [CBOs] and CBO networks, etc.) in
BAPCC implementation including capacity building at various levels especially at
district and sub-district levels, inputs to the BAPCC on poverty, equity and livelihood
concerns, outreach and extension and bridging roles, documentation of community
perceptions and best practices, participatory research, knowledge networking, and
contributing to expanding the available evidence base on climate change, etc. and
Identifying appropriate civil society organisations and their networks at various levels
who can who can partner BAPCC implementation at various levels including state,
district, block and at the grassroots.
3.2.8 Role of International/External Support Agencies
Likewise, international/external agencies play significant roles in supporting
developmental initiatives and bringing in technical assistance to the State. A range of
international organisations, including multilateral, bilateral and other agencies have
supported and continue to support significant development projects across government
departments as well as civil society.
As such, the it is envisaged that international organisations will also play a significant role
in supporting various aspects of BAPCC implementation; the State will therefore

State Action Plan on Climate Change (SAPCC)-Jan 2015
- 29 -
proactively seek opportunities for collaborative partnerships with such organisations
especially in the context of external support for financial support, technical assistance and
advisory services, bringing in international best practices, knowledge management and
networking, inter-state and regional dialogues on climate change, etc.
3.2.9 Monitoring Framework
A tentative and indicative outline of a monitoring and reporting framework is given in
Figure 6 below.
The state is committed to ensuring that BAPCC implementation is complemented by a
robust framework and mechanisms for monitoring and evaluation not only as a means of
ensuring that the detailed operational plans that will be developed under the BAPCC are
implemented as planned, but more importantly, as a tool for systematic review and
programme improvement as the needs of the State evolve with implementation.
The reporting will take place on a quarterly basis at all levels, internal reviews of
implementation progress and performance on a half-yearly basis. Likewise, considering
that this BAPCC broadly covers implementation plans over a five year period,
implementation of the, an external third-party evaluation during mid-2014 to critically
examine implementation and recommend course corrections, and another similar external
evaluation will be carried out during end 2017.
State Steering Committee (SSC)
Nodal/Coordinating Agency
Climate Change Cells of Line Departments/Agencies
District Administration, Line Departments/Agencies
Village Level Institutions
Panchayats, JFMCs, etc.
External monitoring and evaluation agencies/teams
Bihar State Centre for
Climate Change
Figure 5 : Tentative and indicative monitoring framework for the BAPCC

State Action Plan on Climate Change (SAPCC)-Jan 2015
- 30 -
A detailed and robust monitoring framework will be developed including specific
methodologies, protocols, and templates for monitoring and reporting as part of the
process of developing detailed work plans under the BAPCC.
3.2.10 Knowledge Management, Sharing, Learning, and Dialogue
The BAPCC recognises that knowledge creation, management, and dissemination/
exchange will be critical and central to the successful implementation of the SAPCC. The
BAPCC also recognises that Bihar does not exist in an independent developmental
vacuum; it exists in the developmental context of the central-north Indian region and also
in the larger context of India. Therefore the BAPCC will seek to fulfil the following
outcomes in this regard:
Develop protocols for new knowledge creation and documenting emerging best
practice across sectors and at all levels, as well as documenting and sharing people’s
perceptions on climate change and its impacts on an on-going basis;
Develop mechanisms and partnerships for sharing knowledge base and emerging
experiences including best practice not only within the State at all levels but also with
other states in the region and across India and elsewhere.
As such, it is envisaged that the BAPCC outcomes knowledge management will be
crosscutting and also closely connected to the envisaged outcomes on capacity building.
Additional elements of Knowledge Management may be taken up from time to time during
BAPCC implementation as required.
Linkages with the NAPCC and the National Mission on Strategic Knowledge for Climate
Change
The above sub-sections, and in particular, those on -- Scientific Knowledge, Evidence Base,
and Understanding of Climate Change; Capacity Development, Education, and Awareness;
Connecting Science, Policy, and Practice; and Knowledge Management, Sharing, Learning, and
Dialogue – are consistent with and complement imperatives outlined in the NAPCC in general
and in particular, those under the National Mission on Strategic Knowledge for Climate
Change.

State Action Plan on Climate Change (SAPCC)-Jan 2015
- 31 -
4. Sectoral Implementation Approaches
4.1 Overall Common Implementation Framework
It is envisaged the BAPCC implementation under the various sectors of the State will be
governed by a common implementation framework7 as in Figure 6 below:
The common elements will include:
Sector policy reviews: Each sector will undergo a policy review, and where
appropriate, explicit articulation of climate change concerns and sectoral responses
will be articulated;
7 Since these will be common across sectors, in order to avoid repetitiveness, will not appear in the descriptions of
each sectoralprogramme
Sector policy reviews
Sector climate vulnerability
assessments
Sector climate change impacts
evidence base strengthening
Sector public/ community perceptions
documentation
Periodic consultations
with civil society and communities
Incorporation of poverty, equity, and livelihood concerns
Monitoring and evaluation
protocols
Knowledge management
activities
Sector programmes under BAPCC
Figure 6 Common framework elements for sectoral implementation under the BAPCC

State Action Plan on Climate Change (SAPCC)-Jan 2015
- 32 -
Sector climate vulnerability assessments: Sectoral climate vulnerability and risk
assessments will be carried out as part of a larger vulnerability and risk assessment for
the State, and where appropriate, sectoral programme elements will be re-framed based
on the findings;
Sector climate change impacts evidence base strengthening: Each sector will put into
motion a process of building the evidence base on climate change and impacts to the
sector;
Forecasting and early warning systems: Each sector will put into motion systems for
adoption forecasting and early warning systems for adverse climate impact installation
for improved resilience and adaptation;
Participatory qualitative methods and quantitative models: Each sector will seek to
adopt and foster quantification of cost and benefit analysis of adaptation options for
sector performance improvements and outcome optimisation;
Locally specific adaptation plans: To increase resilience, locally specific adaptation
plans will be made; enabling the exchange of case studies and good practices will
facilitate the development of robust solutions;
Leveraging Co-benefits: Each sector will proactively seek to identify and leverage
opportunities for co-benefits arising out of BAPCC implementation;
Sector public/community perceptions documentation: Periodic documentation of
public/community perceptions on climate change and its impacts relevant to the sector;
Periodic consultations with civil society and communities: Periodic consultations with
civil society and communities to gauge adaptive resilience needs;
Incorporation of poverty, equity and livelihood concerns: Each sector will, where
appropriate, incorporate and explicitly articulate poverty, equity and livelihood
concerns in their policies, plans and budgetary processes;
Monitoring and evaluation protocols: Each sector will, in line with the overarching
State level framework, develop and deploy monitoring and evaluation processes and
protocols to guide effective programme implementation; and
Knowledge management activities: Each sector will, in line with the overarching State
level framework, carry out KM activities, and contribute to the State level processes
on an on-going basis. Under the BAPCC, an appropriate organisation will be identified
to carry out the role of a knowledge aggregator, and become a clearinghouse of all
data/information on existing and planned research projects and initiatives relating to
climate change in the Bihar context. Towards this, the identified organisation will
provide the following inputs:
o Hosting of geo-portal on climate change;
o Host-hub for knowledge/information sharing related to climate change;
o Knowledge repository;
o Identification of potential research and development domains concerned with
climate change issues in the state; and
o Technical demonstration, research and development, extension and transfer of
technology protocols, relating to climate change.
Additionally, efforts will be made to explore the options for participation of and leveraging
the private sector and financial institutions in each sectoral programme. Likewise, where
appropriate, suitable external support agencies will be leveraged/sought to bring in
additional implementation support or technical assistance.
State Action Plan on Climate Change (SAPCC)-Jan 2015
- 33 -
5. Agriculture and Allied Sectors
5.1 Overview, Characteristics and Status
Bihar's Economy is dominated by the agricultural sector. Around 90 percent of the
population still live in rural areas where agriculture, along with animal husbandry, has
been the mainstay of their livelihood. Agriculture is sure to play the most important role
for the development of the state. Bihar is rich with fertile land resources. The area under
cultivation as a proportion of the total reporting area is as high as 60 percent, as compared
to only 47 percent for the country as a whole. Nearly 81 percent of the State’s population
is employed in agriculture production system, which is much higher than the national
average.
In Bihar, based on soil characteristics, rainfall, temperature, and terrain, there are three
main agro-climatic zones, which have been briefly described in earlier section. Each zone
has its own unique characteristics in terms of the crop production. Agro climatic zone I
and II is located south of the river Ganges whereas the Zone III (A and B) is located south
of the river Ganges. Zone I is situated in the north-western part of the state whereas zone
II is located in the north-eastern part. Zones I and II are flood prone whereas zone III is
drought prone.
The soil texture in the state varies from sandy loam to heavy clay and majority type belongs
to loam category, which is good for crop cultivation. Soil PH varies from 6.5 to 8.4. The
annual precipitation varies from 990 to 1200 mm although major precipitation is received
during the month of July to September. The changing temporal and spatial pattern of
rainfall and temperature will adversely affect these agro climate zones. There are three
crop seasons- Kharif, Rabi and Zaid. Kharif crops are sown in May-June and harvested in
September– October.
The important Kharif crops are cotton, rice, sugarcane, maize, jowar, and bajra. Rabi crops
are sown in October–November and harvested in February–March. The important Rabi
crops are wheat, grams, barley, rapeseed, and mustard. Zaid crops are produced in the short
duration between Rabi and Kharif crop season, mainly from March to June, are called Zaid
crops e.g. Muskmelon, Watermelon, gourd and etc. Rice, wheat, and pulses are grown in
all the districts however the choice of the crop and crop rotation varies across the agro
climatic zone.
The principal crops are rice, wheat, pulses, maize, potato, sugarcane, oil seeds, tobacco,
and jute. Rice, wheat, and maize are the major crops. Although the state has attained self-
sufficiency in food grains production, barring maize and pulses, productivity of other farm
produce in Bihar is much below the national average. Bihar is rich in water resources,
which can be utilized for inland fishery.

State Action Plan on Climate Change (SAPCC)-Jan 2015
- 34 -
5.1.1 Land Use Pattern
Table 6 presents the land use pattern of the state from 2006-07 to 2008-09.
Table 6 Land utilization pattern in Bihar (2006-07 to 2008-09; area in '000 hectares)8
Land use 2006-07 2007-08 2008-09
Geographical area 9359.57 (100.0) 9359.57 (100.0) 9359.57 (100.0)
(1)Forests 621.64 (6.6) 621.24 (6.6) 621.64 (6.6)
(2)Barren and Uncultivable Land 436.06 (4.7) 432.09 (4.6) 431.77 (4.6)
(3)Land put to Non-agricultural use 1646.89 (17.6) 1652.66 (17.7) 1670.45 (17.8)
Land Area 1285.98 (13.7) 1292.11 (13.8) 1312.94 (14.0)
Water Area 360.91 (3.9) 360.55 (3.9) 357.51 (3.8)
(4)Cultivable Waste 45.65 (0.5) 45.59 (0.5) 45.43 (0.5)
(5)Permanent Pastures 17.33 (0.2) 16.47 (0.2) 15.87 (0.2)
(6)Land Under Tree Crops 240.52 (2.6) 240.96 (2.6) 242.86 (2.6)
(7)Fallow Land (excluding current fallow) 119.97 (1.3) 119.35 (1.3) 122.30 (1.3)
(8)Current Fallow 566.39 (6.1) 568.61 (6.1) 655.17 (7.0)
Total Uncultivable Land (1 to 8) 3694.45 (39.5) 3697.36 (39.5) 3805.48 (40.6)
Net Sown Area 5665.12 (60.5) 5662.20 (60.5) 5554.08 (59.4)
Gross Sown Area 7718.95 7764.65 7670.95
Cropping Intensity 1.36 1.37 1.38
Seven districts where more than 70 percent of the area are under cultivation, are Nalanda
(77.0 percent) Bhojpur (79.3 percent), Buxar (77.4 percent), Siwan (74.4 percent),
Sheikhpura (72.6 percent), Gopalganj (72.6 percent), and East Champaran (70.6 percent).
On the other hand, there are five districts that have less than 50 percent of net sown area,
viz., Banka (42.3 percent), Jamui (16.9 percent), Munger (37.1 percent), Gaya (34.5
percent) and Nawada (42.1 percent). The cropping intensity is the lowest at 1.16 in Jamui
and Patna.
5.1.2 Cropping Pattern
Table 7shows the cropping pattern of various crops.
Table 7 Cropping Pattern in Bihar 2001-02 to 2009-10)9
Crops
Percentage of Area
2001-02
2002-03
2003-04
2004-05
2005-06
2006-07
2007-08
2008-09
2009-10
Food grains
94.3 94.4 94.4 94.2 94.4 94.3 94.4 94.7 94.3
Cereals -- -- 85.2 84.8 85.8 85.9 86.5 86.7 86.3
Pulses -- -- 9.2 9.4 8.6 8.4 7.9 8.0 8.0
8 Source: Directorate of Economics and Statistics, GOB
9 Source: Department of Agriculture, GoB

State Action Plan on Climate Change (SAPCC)-Jan 2015
- 35 -
Crops
Percentage of Area
2001-02
2002-03
2003-04
2004-05
2005-06
2006-07
2007-08
2008-09
2009-10
Oilseeds 1.9 1.8 1.9 1.9 1.9 1.9 1.9 1.8 1.9
Fibre Crops
2.1 2.3 2.4 2.2 2.1 2.1 2.1 2.0 1.9
Sugarcane 1.5 1.4 1.4 1.4 1.5 1.6 1.4 1.5 1.6
Total Area 100.0 100.0 100.0 100.0 100.0 100.0 100.0 100.0 100.0
5.1.3 Production and Productivity
Table 8 below shows the productivity of major crops in the State.
Table 8 Productivity (Kg/ha) of major crops in Bihar10
Crops
Triennium Average
(2000- 03) 2007-08 2008-09 2009-10
Triennium Average
(2007-10)
% Change between
trienniums
Total Cereals 1732 1799 1941 1595 1778 3
Total Rice 1457 1288 1651 1120 1353 -7
Autumn Rice 1247 1396 1324 947 1222 -2
Aghani Rice 1488 613 1712 1132 1152 -23
Summer Rice 1758 1729 1643 1736 1703 -3
Wheat 2036 2334 2205 2084 2208 8
Total Maize 2384 2823 2724 2341 2629 10
Kharif maize 1765 1221 1478 1772 1490 -16
Rabi Maize 2934 4001 3845 2660
- -
Summer Maize 2765 3762 3096 - -
Total Coarse Cereals
979 924 2642 2277 1948 99
Barley 1186 1202 1245 1118 1189 0
Jowar 923 1096 1044 1040 1060 15
Bajra 861 1103 1208 1108 1140 32
Ragi 879 605 687 812 702 -20
Small Millets 681 739 786 760 761 12
Total Kharif Pulses 901 1024 1034 1125 1061 18
Arhar 1215 1383 1357 1513 1417 17
Urad 682 782 845 892 840 23
Bhadai Moong 529 607 598 656 620 17
Kulthi 788 929 940 962 944 20
Other Kharif Pulses 544 657 671 810 713 31
Ghaghra (Cow Pea) 564 899 737 938 858 52
Total Rabi Pulses 806 781 902 796 826 3
Gram 1001 990 1157 1014 1054 5
Lentil 886 796 931 880 869 -2
10ibid

State Action Plan on Climate Change (SAPCC)-Jan 2015
- 36 -
Crops
Triennium Average
(2000- 03) 2007-08 2008-09 2009-10
Triennium Average
(2007-10)
% Change between
trienniums
Pea 947 1077 1027 1009 1038 10
Khesari 847 839 1062 944 949 12
Summer Moong 596 600 656 510 588 -1
Other Rabi Pulses 662 742 743 744 743 12
Total Oilseeds 818 1015 938 1034 996 22
Castor seed 944 950 957 963 957 1
Safflower (Kusum) 802 750 802 769 774 -4
Sesamum 629 795 806 766 789 26
Sunflower 1401 1390 1506 1405 1434 2
Mustard & Rapeseed
799 992 861 996 950 19
Linseed 712 825 848 846 840 18
Ground Nut 716 719 557 1650 975 36
Total Fibre Crops 7131 9416 8162 9148 8909 25
Jute 7317 9442 1361 1637 4147 -43
Mesta 6858 9260 1669 1701 4210 -39
Sunhemp 727 - - - - -
Sugarcane 43586 37624 37624 43430 39559 -9
5.1.4 Production and Productivity of Vegetables and Fruit
Bihar produces a variety of vegetables and fruits. In terms of vegetable production, the
state is proud to be holding the topmost position in the country in recent times. Although,
Horticulture (Fruits, vegetables, spices, honey, medicinal and aromatic plants) occupies
15 % of land area but income generated from horticulture is much higher. The state has a
monopoly in production of litchi and makhana and continues to grow various fruits,
vegetables, spices and floriculture is catching the imagination of people, reflected in their
growing interest, across the state, ion diversification of horticulture. The productivity of
potato increased from 2008-09 to 2009-10. The productivity of onion and cauliflower is
increased from 2008-09 to 2009-10.
5.1.5 Area and Production of Flowers
Patna, Muzaffarpur, Vaishali, Samastipur, and Gaya are major flower producing districts
in the state.In 2010-11, the production levels of important flower crops were – rose (86.52
tonnes), marigold (5120 tonnes), Jasmine (307.46 tonnes), and tuberose (522 tonnes).
5.1.6 Animal Husbandry
Livestock and dairy is one of the key sectors for creation of livelihood and employment
opportunities in the rural sector. Since 90% of state's population is rural, animal husbandry
is extremely important for providing gainful employment to population living in rural
areas. The production of milk has increased from 26.32 lakh tonnes in 2001-02 to 65.00
lakh tonnes in 2010-11. During the same period, the production of eggs has increased to
110.10 crores in 2009-10 from a production level of 74.00 crore in 2001-02. But, in 2010-

State Action Plan on Climate Change (SAPCC)-Jan 2015
- 37 -
11, the production level fell to 74.40 crores leading to an annual growth rate of 3.25
percent. The production of wool now stands stagnated at a level of 2.50 – 2.60 lakh kg.
5.1.7 Fisheries
Fisheries sector of the state is an important, most promising and fast growing food farming
sub-sector accounting 7.97% annual growth rate. The availability of immense aquatic
resources of the state not only satisfies the demand offish but also plays an important role
in gainful employment generation, food and nutritional security, poverty alleviation, state
income growth and finally socio-economic up-gradation of the rural community. To meet
the challenge of the global climatic change and its impact on fisheries of Bihar, the
Department of Fisheries, State govt. will strategically ensure end-to-end holistic approach
covering production, input and resource enhancement, renovation of existing resources,
postharvest management to assure sustainable returns to the producers. To meet draught
challenge, Renovation of Infrastructure such as ponds and tanks developments is required.
5.2 Key Issues
Though endowed with good soil, adequate rainfall, and good ground water availability
Bihar has not yet realized its full agricultural potential. Its agricultural productivity is one
of the lowest in the country, leading to rural poverty, low nutrition, and migration of
labour. Vagaries of rainfall influence agriculture productions; recurrent floods and
droughts severely affect the outputs. Weak agriculture extension systems have led to poor
transfer and adoption of modern efficient technologies.
Problems of flood and drought severely affect the agricultural income on an annual basis,
and intra-state disparities are significant in many sub-sectors. Beginning with 2005-06, the
achievement level of total credit targets has been around 80% till 2009-10. The
achievement level came down to around 70 % 2010-11. The estimated green fodder
production from forests, permanent pastures, grazing lands and cultivated areas has
declined from 13.77 lakh tonnes in 2000-2001 to 13.46 lakh tonnes in 2002-03.
Dry fodder production (crop residue of cereals, pulses and oil seeds) over the same period
declined from 195.23 lakh tonnes to 156.12 lakh tones. The area under pastures and
grazing lands is extremely scarce (0.18 percent of the total geographic area). Gaya has the
maximum area under pastures and grazing lands at 2192 ha. Of all rural households
owning cattle and/or buffalo in Bihar, more than three-quarters are either landless or have
less than 1 hectare of land. Sheep and goats tend to be even more concentrated among
landless and marginal rural households.
5.3 Priorities
Bihar’s priorities have been identified in the State Agriculture Roadmap, which aims to
trigger processes of development in agriculture and allied sector. Given the substantial
yield gaps of most agricultural commodities on the one hand and low farmers’ income and
widespread rural poverty on the other, and also taking into account the richness of natural
resources and high level of peoples’ aspirations, a gradual approach for liberating the
people of Bihar from twin traps of hunger and poverty will neither be economically sound
not socially expedient. The proposed road map of agriculture, with defined goals and time

State Action Plan on Climate Change (SAPCC)-Jan 2015
- 38 -
frame gives a humanitarian dimension to agriculture apart from addressing the important
question of food security.
The State’s agriculture development in the 12th Five Year Plan will emphasize on:
(i) Broad based agriculture growth – benefits of raising productions and productivity
will be ensured to diverse crops, i.e., food grains (rice, wheat, durum wheat, maize,
Madua), pulses, oilseeds, horticulture crops, cash crops like sugarcane, Jute, Paan
and others through specific strategies;
(ii) Making agriculture gainful and raising incomes of farmers; stress will be on:
a. Removing constraints in procurement and market linkages;
b. Promoting cost effectiveness, reducing insecurities and expansion of
processing capacities;
c. Encouraging sustainable agriculture development in the state by reducing
fluctuations and uncertainty in productions due to floods, droughts and water
logging, and by promotion of environment friendly techniques like organic
farming, improvement of soil health, reuse of wastes and by- products;
(iii) Rapid expansion in supply of inputs (seeds, mechanization, fertilizers, credit and
others) and quality assurance will play a major role. Impetus to agriculture credit
will be a major thrust area to meet essential requirements of farmers;
(iv) Substantial augmentation of warehousing and storage facility will be carried out
for agriculture growth and food security. Marketing of agriculture produces will
be promoted through involvement of multiple agencies and innovations in
institutional structures. Rapid expansion in infrastructure will be ensured through
increased investments;
(v) Triggering rapid growth in traditional agriculture systems will require institutional
changes and realignments. Vastly expanded, strengthened, and modernized
extension network would ensure benefits of broad based development to farmers
of the entire state. To realize the goals the agriculture development plan must
accompany establishment of strong information/data base systems and growth of
education and research;
For Animal Husbandry and Dairy, the major thrust points will be the following:
(i) Production and productivity will be raised through improved breed management.
Impetus will be given to augmentation of processing facilities (milk and milk
products);
(ii) Rapid expansion of extension network up to the Panchayat level will be carried
out. Government aims to act as facilitator for livestock entrepreneurship
development in rural areas. Development plan will involve strengthening of
veterinary and dairy services network; and

State Action Plan on Climate Change (SAPCC)-Jan 2015
- 39 -
(iii) Establishment and strengthening of institutions for human resource development
and promotion of education, training, and research will play a major role in the
growth of the sector.
Development and management of fisheries will aim for a major jump in fish production
and productivity by the end of the 12th FYP. The major thrust will be as follows:
(iv) Infrastructure facilities will be expanded for availability of quality inputs.
Institutional strengthening will be carried out for improved extension services,
training and skill development and infusing professional management practices.
5.4 Perceived Climate Impacts11
The spatial and temporal distribution of Indian Summer Monsoon Rainfall (ISMR) during
June-September is largely affect agricultural yields. The departure in minimum and
maximum temperatures from average values influences plant physiological conditions
viz., respiration, water requirement, and growth, thereby affecting yields. Extreme weather
conditions such as floods, droughts, heat and cold waves, flash floods, cyclones, hail
storms, etc. are constant hazards for agricultural production. Potential risks to the
agricultural system from changing climatic conditions can be identified at multiple levels.
Climatic variability directly impacts yields at crop level and also affects soil quality; water
resources; brings in pests, diseases and weeds, etc. further aggravating the impact on the
cropping system, thereby reducing the yield per hectare of land or per unit of livestock at
the farm level. The adverse impact of climatic variability on agriculture production at farm
level gets aggregated to the level of the food system in terms of food shortages and rising
prices, which can also endanger food and livelihood security.
At the crop level, in the short term, increase in carbon dioxide (CO2) concentration is likely
to compensate the negative effect on yields due to increase in temperature, but as
temperature increases further, it would result in yield losses. Most crop simulation studies
have predicted a decrease in the yield of crops with an increase in temperature. Further,
adverse temperature and moisture conditions affect the quality of food grains.
Climate change may have significant effect on the quality of plantation and cash crops
such as fruits, vegetables, tea, coffee, aromatic & medicinal plants, etc. Change in climate
is likely to bring about a change in the population dynamics, growth and distribution of
insects and pests thereby, upsetting crop-pest balance. Drought conditions would increase
pathogen and insect survival rate due to change in plant nutrient level and decrease in plant
defence system. These changes could lead to enormous crop losses in altered environment.
An increase in temperature also leads to increased evapotranspiration, thereby lowering
groundwater table and adversely affecting irrigation potential. At some places, increased
surface temperature coupled with reduced rainfall may lead to accumulation of salts in
upper soil layers.
Impacts of climate change on livestock will be felt in the form of elevated body
temperatures, increased respiration rates, decrease in feed intake, etc. Indirect impacts will
11 Adapted from the National Mission for Sustainable Agriculture: Strategies for Meeting the Challenges of Climate
Change. Department of Agriculture and Cooperation, Ministry Of Agriculture, New Delhi, August 2010.

State Action Plan on Climate Change (SAPCC)-Jan 2015
- 40 -
be observed in the form of reduction in grazing land and water availability, decline in
available cattle feed, emergence of new diseases, etc.
Thermal or heat stress would impact animal production and profitability in dairying due
to lower feed intake, milk production, and reproduction. Severe drought conditions are
likely to affect livestock due to decline in feed and fodder availability and serious water
shortages. The impact of climate change induced decline in pastoral land would further
aggravate the severe constraints on livestock farming.
It has already been observed that the breeding of Indian major carps as well as the
distribution of important fish species and plankton has been affected due to changes in
temperature and rainfall patterns over the catchments of the Ganga.
5.4.1 Wheat, Rice, Maize
Production of crop is greatly influenced by weather phenomena and therefore any change
in climate will have major effect on crop yield and productivity. The temperature, air
movement, solar radiation, humidity and soil moisture are major climatic factors
influencing the crop phenology. The projected increase in temperature is less in Kharif
season that that of in the Rabi.
In Bihar, under scenarios of increase in atmospheric CO2 concentration, the climate change
impact on wheat and winter maize shows that simulated yield of wheat is possible to
decrease in 2050s and 2080s by 3.6% and 14.1% respectively, for Pusa. At Madhepura,
decline in yield is possible by 5%, 13% and 21% for during 2020s, 2050s and 2080s
respectively. Patna and Sabour shows decrease in simulated yield around 40% for 2080s.
Crop duration shows maximum decline at Madhepura by 26 days. Number of grains
increased marginally for Pusa and Patna during 2020s; otherwise a decrease is noticed for
other time periods from the baseline. The agroclimatic zones I and II showed lesser decline
in the number of grains and more or less constant weight of grains than zone III. However,
zone III shows decrease in both number and weight of grains during different time-periods,
thus indicating suitability of North Bihar (zones I and II) for wheat cultivation. Simulated
yield of winter maize showed an increase in the range of 8.4–18.2%, 14.1–25.4% and
23.6–76.7% during 2020s, 2050s and 2080s respectively.
Maximum increase is observed in Sabour for all the three time-periods Maize with
increased CO2 and consequent rise in temperature shows a decrease in duration and days
from the baseline. TDM, grain weight and grain number shows an increase from the
baseline to 2080s. The decrease in duration is probably well compensated by increased
growth rate with better temperature regimes resulting in increased number of grains and
grain weight leading to overall increase in biomass. Increase in grain number and TDM is
an indicator of increased net photosynthesis, as the net rate of photosynthesis is more in
full sunlight and also photo-respiratory losses are almost negligible in case of C4 plants
compared to C3 plants (Abdul Haris et. al. 2012).

State Action Plan on Climate Change (SAPCC)-Jan 2015
- 41 -
Table 9 Simulated impact of climate change on growth parameters of wheat
Duration
(days)
Maximum
CGR
(kg/ha/day)
Maximum
LAI
(kg/ha/day)
TDM
(kg/ha)
No. of
grains/ha
Weight
of grains
(g/1000
grains)
Pusa
Baseline 123 257 3.66 13,796 114,699,833 37.306
2020s 117 249 3.54 13,197 116,578,283 37.471
2050s 108 246 3.34 12,106 107,897,132 37.7
2080s 100 273 3.05 11,238 96,575,358 37.7
Madhepura
Baseline 111 284 3.58 13,510 136,776,467 35
2020s 100 293 3.49 12,394 120,584,333 38
2050s 91 290 3.39 11,178 107,761,030 38
2080s 85 272 3.16 10,455 98,064,733 38
Patna
Baseline 97 134 2.88 5,399 37,508,229 36
2020s 92 130 2.93 5,186 42,182,533 38
2050s 87 128 2.71 4,526 37,961,153 34
2080s 79 122 2.26 3,893 29,137,213 30
Sabour
Baseline 107 229 3.41 10,883 108,409,826 33
2020s 100 209 3.30 9,742 92,359,979 34.6
2050s 92 197 3.08 8,570 84,163,695 31.2
2080s 86 188 2.83 7,642 71,424,974 29.8
Based on the Tmax, Tmin, drought and flood severity, available water capacity, population
density, average yield, net shown area, cropping intensity, percentage area irrigated,
livestock density and many others, a vulnerability index map is prepared which shows
Kishanganj of Bihar is most vulnerable with vulnerability index of 4.687.
Based on the modelling study, it is found that wheat yield may decrease by 5-6 % in Bihar
state due to change in maximum temperature alone by 2080s (Arvind Kumar et al. 2011).
Figure 7 Indo-Gangetic Plane vulnerability Map
Indo-Gangetic Plain Vulnerability Map (-7.35) – (-2.00) (-1.99) – (0.00½ 0.01 – 2.00 2-01 – 4.69

State Action Plan on Climate Change (SAPCC)-Jan 2015
- 42 -
It is found Sarjoo-52 Rajshree, MTU-7029, Satyam, Rajendra Mahsuri-I and others are
most suitable rice for direct dry seeding of rice with subsequent aerobic soil conditions
avoiding water requirement during land preparation and reduces overall water demand
Table 10 Simulated impact of climate change on growth parameters of maize
Duration
(days)
Post-
anthesis
duration
Maximum
CGR
(kg/ha/day
Maximum
LAI
(kg/ha/day)
TDM
(kg/ha)
Grain
weight
(g/100
grains)
No. of
grains
(grains/ha)
Pusa
Baseline 157 26 216 2.58 13,544 114.3 34,108,353
2020s 152 26 223 2.62 13,582 115.6 36,404,873
2050s 143 25 244 2.58 13,475 114.3 38,772,077
2080s 135 26 284 2.52 14,262 122.8 39,685,550
Madhepura
Baseline 159 28 238 2.77 15,555 120.1 39,556,007
2020s 154 27 249 2.80 15,639 121.7 41,386,080
2050s 145 27 291 2.81 15,608 121.2 43,266,460
2080s 135 27 340 2.53 16,392 124.3 44,248,780
Patna
Baseline 150 22 351 4.79 16,556 90.8 43,590,337
2020s 146 22 347 4.75 16,785 94.7 45,289,700
2050s 138 22 411 4.65 16,383 93.9 46,697,863
2080s 128 23 524 4.54 17,365 100.2 49,212,777
Sabour
Baseline 150 21 195 2.56 11,468 82.34 29,869,011
2020s 145 21 201 2.66 11,720 84.63 31,253,789
2050s 137 22 237 265 11,604 86.25 35,699,926
2080s 130 23 246 2.56 12,597 101.5 37,796,805
5.4.2 Livestock and animal husbandry
Bihar is rich in livestock resources. The total livestock in the state has decreased from
53.742 million to 42.990 million between 1997 and 2003 showing a decrease of
20%.Impacts of climate change on livestock will be felt in the form of elevated body
temperatures, increased respiration rates, decrease in feed intake, etc. Indirect impacts will
be observed in the form of reduction in grazing land and water availability, decline in
available cattle feed, emergence of new diseases, etc.
Thermal or heat stress would impact animal production and profitability in dairying due
to lower feed intake, milk production, and reproduction. Besides being susceptible to
State Action Plan on Climate Change (SAPCC)-Jan 2015
- 43 -
increased heat stress from climate change, livestock is also exposed to the risks associated
with extreme events. Severe drought conditions are likely to affect livestock due to decline
in feed and fodder availability and serious water shortages.
The impact of climate change induced decline in pastoral land would further aggravate the
severe constraints on livestock farming. A rise of 2-6 °C due to global warming (time
slices 2040-2069 and 2070-2099) projected to negatively impact growth, puberty and
maturity of crossbreds and buffaloes and time to attain puberty of crossbreds and buffaloes
will increase by one to two weeks due to their higher sensitivity to temperature than
indigenous cattle.
5.4.3 Fisheries and aquaculture
Bihar is blessed with vast and varied fisheries and aquaculture resources. However, despite
such natural resources and fish as highly preferred food item, aquaculture and open water
fisheries resource remain highly underutilized. The major schemes taken up include
production and supply of fish seed, development of Maun/Chaur besides centrally
sponsored schemes for development of aquaculture and welfare of fishers.
The total fish production in the state is about 2.66 lakh tones with average productivity of
about 2.2 tonnes per ha per annum. It contributes about 1.6 % of Bihar GDP.
Changes in the climate would also affect the fisheries sector in many ways. Climate change
would also indirectly affect aquatic habitats (quantity and quality), ecosystem
productivity, distribution and abundance of aquatic competitors and predators/disease
thereby affecting the livelihood and food security of fishing communities. It has already
been observed that the distribution of important fish species and plankton has been affected
due to changes in temperature and rainfall patterns over the catchments of the Ganga.
The fishes cannot maintain a constant body temperature like mammals and their body
maintain the same temperature where they are living in. Fishes can live in very cold or
very hot water and prefer to stay in the preferred range of temperature. In very cold water,
their metabolism slows down and they become lethargic. In other side, if the surrounding
water is relatively warm, their metabolism speeds up and they digest food more rapidly,
grow more quickly, and eventually have more energy for reproduction. At the same time,
fishes need more food and more oxygen to support this higher metabolism.
The changing pattern of rainfall and temperature will have direct implications on natural
stock of fish populations as well as will have direct implication to livelihood option of
fisher folk. The Gangetic River system (Uttar Pradesh, Bihar and West Bengal) contains
about 265 species of freshwater fish. The water problems due to climate change in the
Ganga River basin will increase and may be critical in terms of the ecosystem goods and
services derived from the inland water bodies via fisheries. The breeding period of
majority of fishes of the Ganga River system is June-August due to their dependency on
seasonal floods.
The monthly data of rainfall from the middle stretch of the river at Allahabad from 1979–
2009 revealed that the percentage of total rainfall in the peak breeding period (May–
August) declined by 7% whereas it increased by 4% in the post- breeding period when
resorption of eggs of IMC sets in (M. K. Das et al., 2014)

State Action Plan on Climate Change (SAPCC)-Jan 2015
- 44 -
Figure 8 Indices of spawn quality in middle stretch of the River Ganga from 1965-2009
5.4.4 Dairy
The Present milk production of the state is 6516 thousand MT per year. It has been targeted
to take this production level up to 10035 Thousand MT per year by 2017 and to 14867
Thousand MT per year by 2022. However, milk productivity level in the State is still very
low. Global warming is likely to lead to a loss of 1.6 million tones in milk production by
2020 and 15 million tons by 2050 in business as usual scenario.
Based on temperature-humidity index (THI), the estimated annual loss in milk production
at the all-India level by 2020 is valued at about Rs. 2661 crores at current prices. The
economic losses may be highest in UP followed by Tamil Nadu, Rajasthan and West
Bengal. Stressful THI with 20th or more daily THI-hrs (THI >84) for several weeks affects
animal responses.
Figure 9 Annual THI load on livestock

State Action Plan on Climate Change (SAPCC)-Jan 2015
- 45 -
The economic losses may be significant in Bihar producing crossbred cows and buffaloes
will be affected more by climate change. Under climate change scenario, increased number
of stressful days with a change in temperatures and probable decline in availability of
water may further impact animal productivity and health.
5.4.5 Horticulture
Fruits, vegetables, spices, honey, medicinal and aromatic plants occupy 15% of land area
but income generated from horticulture is much higher in Bihar. The state has a monopoly
in production of litchi and makhana and continues to grow various fruits, vegetables,
spices. Floriculture is getting more importance in the state. The agro-climatic conditions
are eminently suitable for whole range of vegetables; a variety of roots and tubers crops;
perennial fruit crops like mango, litchi, guava, and limes; annual fruit crops like banana,
pineapple and papaya and spices like ginger, turmeric and chilly, of late, floriculture is
also showing excellent prospects. The state thus has possibilities for growing a diversified
basket of vegetables, fruits, spices, tubers and flowers and medicinal and aromatic plants.
Fruits
Major fruits grown in the state are Mango, Litchi, Guava, Pineapple, Citrus, Banana,
Papaya and Ber. Mango is grown all over the state, main growing areas are Muzaffarpur,
Vaishali, Bhagalpur, Darbhanga, Madhubani, Sitamarhi, Patna and West Champaran.
Litchi is mainly grown in Muzaffarpur, Vaishali, Sitamarhi, East and West Champaran
and Darbhanga of North Bihar region. Pineapple is grown in north- eastern part of the state
particularly in Kishanganj, Purnea, Araria, Katihar and Saharsa districts.
Vegetables
Bihar ranks 3rd in vegetable production in the country and produces a variety of traditional
and non-traditional vegetables. Climatic and soil conditions of the state are congenial for
production of different types of vegetables in the state. However, it lacks the basic
infrastructure for storage, packaging, transportation, organized marketing system and post
harvest handling facilities. Seed is the most important input which influences the output
of vegetables crops. Vegetable production programme could be strengthened only if its
seed production programme is strengthened. Thus, seed production programme should be
strengthened to give a boost to vegetable production.
In future climate scenarios warming may ease the chilling conditions in these regions to
favour potato productivity, while in other regions with cooler winter season the warming
from current levels may prove detrimental. Based on INFOCROP-POTATO model (Singh
Figure 10 THI load in baseline (left) and in 2030s scenario (right) during March

State Action Plan on Climate Change (SAPCC)-Jan 2015
- 46 -
et.al. 2005), It is found that potato production in 2020s and 2050s, will be decrease by 3%
and 11% over Bihar.
Spices
A variety of spices are produced in Bihar. At present Bihar produces about 20 thousand
tonnes of spices annually from an area of nearly 15,081 ha. The important spices are
Ginger, Turmeric, Chilly, Coriander, and Garlic. Chilli accounts for 47.6 percent of the
area under spices and 39.5 per cent of the production followed by turmeric, which occupies
26.3 per cent of the area under spices and accounts for 36.4 per cent of the production in
the state.
5.5 Strategies
The State has already developed a comprehensive Road Map covering agriculture and its
allied sectors. State will undertake the several measures that will be complementary to
Agriculture Road Map and are specifically designed to enhance resilience. These will
indicatively include (but not be restricted to):
1. Building institutional linkages with Indian Council on Agricultural Research (ICAR)
and its participating organisations including Central Research Institute for Dry land
Agriculture (CRIDA), Indian Agricultural Research Institute (IARI), Indian Institute
of Horticultural Research (IIHR), Central Institute of Agricultural Engineering
(CIAE), National Dairy Research Institute (NDRI), Central Marine Fisheries Research
Institute (CMFRI), Central University of Bihar (CUB) and other collaborating centres
for technical advice, capacity building, and research support including State and sector
specific vulnerability analyses
2. Developing strategic plans at the agro-climatic zone level so that action plans are
contextualized to regional scales in the areas of research and development, technology
and practices, infrastructure and capacity building;
3. Collating, disseminating and follow best management practices including those for
conserving resources and increase input use efficiency, bridging the yield gaps, and
through customized interventions such as use of bio-technology to develop improved
and diversified varieties of crops (including flood and drought tolerant varieties) and
livestock, promoting efficient irrigation systems, demonstration of appropriate
technology, capacity building and skill development;
4. Conservation of agro-biodiversity (gene pool of traditional crop varieties) as a
safeguard against potential long term effects of climatic change and
introduction/promotion of low water demanding crops and foods in low rain fall
areas(e.g. millets and similar crops or xerophytic plants of nutritional values);
5. Strengthening weather services and early warning systems through enhanced agro-met
systems; Facilitating access to information and institutional support by expanding
Automatic Weather Stations (AWS) networks to the Panchayat level and linking them
to existing insurance mechanisms including Weather Based Crop Insurance Scheme
(WBCIS) and National Agriculture Insurance Scheme (NAIS), scaling the returns at
that level;

State Action Plan on Climate Change (SAPCC)-Jan 2015
- 47 -
6. Implementing measures to minimize soil and water losses through resource
conservation technologies such as agro-forestry, integrated watershed management
and water harvesting through check dams, renovation of existing ponds, etc. and
building new ones; protection of top soil of agriculture land - discouraging exploitation
of fertile top soil use for brick manufacture etc. and promote eco-friendly alternatives;
7. Improving irrigation efficiency including developing processes for adopting/
promoting improved energy pricing and water pump efficiency and promoting
adoption of solar and wind power systems for irrigation and other uses;
8. Use of chemical fertilizer and pesticide to be discouraged and ecologically benevolent
practices like integrated nutrient and pest management of agriculture to be promoted.
9. Enhance productivity through — adequate input supply (i.e. seed), resource renovation
& enhancement, intensification, diversification of aquatic crops.
10. Promote R&D technologies for conservation, production, processing and marketing.
11. IT enabled database management regarding resource availability, existing production,
potential production and demands in agriculture, animal husbandry and fishery.
12. Capacity building of stakeholders by synergizing traditional knowledge, agricultural
heritage and modern technology and research; Promote capacity building and Human
Resource Development at production and marketing level in agriculture, animal
husbandry and fisheries.
13. Adopt coordinated approach and promotion of public private partnership (PPP)
Specific and additional emphasis will also be placed on the role of women in agriculture
and its allied sectors – which is high in the State and likely to be most adversely affected
by the impacts of climate change. In these contexts, responsibility for adaptation is likely
to fall on their shoulders – including finding alternative ways to feed their family.
However, statutory and/or customary laws often restrict women’s property and land rights
and make it difficult for them to access credit and agricultural extension services, while
also reducing their incentive to engage in environmentally sustainable farming practices
and make long-term investments in land rehabilitation and soil quality. Despite these
obstacles, recent evidence demonstrates that women who are already experiencing the
effects of weather-related hazards –such as erratic monsoon patterns, flooding and
extended periods of drought – are developing effective coping strategies, which include
adapting their farming practices. Therefore, efforts will be made to further recognize and
support women’s role in adaptation, including promoting women’s involvement in
decision-making processes and implementation. Also, given women's key role in
agriculture, efforts will be especially made so that gender disaggregated data becomes
available to enable gender specific planning and interventions.

State Action Plan on Climate Change (SAPCC)-Jan 2015
- 48 -
5.6 Institutional Linkages and Stakeholders
A range of institutional linkages, convergence potential, and partnerships is envisaged
under the BAPCC12. While these have largely been identified in the State Agriculture
Roadmap, these will indicatively include State institutions such as the National Food
Security Mission, Bihar; Bihar Rajya Beej Nigam Limited; Bihar Agricultural
Management & Extension Training Institute (BAMETI); Bihar State Seed Certification
Agency (BSSCA); the Bihar State Horticultural Mission; Animal & Fisheries Resources
Department (and related institutions); State Water resources Department; State Directorate
of Rice Development; State Energy Department; BREDA; State Forest Department; State
Food and Consumer Protection Department, etc. Additional linkages with be built with
National and State agricultural research institutes/centres and universities such as Central
University of Bihar (CUB); Bihar Watershed Development Society; various international
development agencies, private sector and financial institutions, civil society, community
based organisations, and agriculture and allied sector dependent communities in general,
are the primary stakeholders.
5.7 Linkages with the NAPCC
While the strategies outlined in the State Agricultural Roadmap and herein are consistent
with the sectoral imperatives of the NAPCC and the National Mission for Sustainable
Agriculture under it, the State will also take specific care to ensure that specific action
plans developed under the BAPCC are also consistent with the same. The strategies under
the agriculture and allied sectors under the BAPCC also additionally have linkages with
the National Mission on Water, National Mission for a Green India, National Mission for
Enhanced Energy Efficiency, National Solar Mission, and the National Mission on
Strategic Knowledge on Climate.
5.8 Sectoral Action Plan and Budgets under the BAPCC
See Part C, Action Plans and Budgets
12 This is not meant to be an exhaustive list; rather, it gives some examples of possible linkages under the BAPCC.

State Action Plan on Climate Change (SAPCC)-Jan 2015
- 49 -
6. Forests and Biodiversity
6.1 Overview, Characteristics and Status13
6.1.1 Ecology of Bihar
Bihar has diverse landforms ranging from plains of Ganga and other rivers to high
elevation forests in the Shivalik range covering West Champaran, while Vindhyan range
in the southern districts adjoining Jharkhand. The state can be divided into three zones
based on the geological and climatic variation, namely Eastern Himalayan region, Middle
Gangetic plain and South Eastern plateau and hill region. The north western and southern
parts of the state are the mountainous regions.
The region is biologically very rich harbouring large number of economically important
and medicinal plants, which are unique to the region. Further the seasonal variations in the
form of dry and moist months influence the phonological types representing high degree
of biological diversity. Bihar is divided into two major ecoregions, namely North Bihar
and South Bihar; the brief salient features of these regions are as follows.
North Bihar: - North Bihar region is the northern most section of the state and is mostly
covered by the Shivalik ranges. This region lies in the foothills of central Himalayas and
on the north of Gangetic plain. River Gandak and Masan are the perennial rivers cutting
the topography. These rivers along with their tributaries bring in the water and soil in lower
part of the region.
Due to constant erosion and depositional rhythm along the course, the river Gandak
changes its path and some of the abandoned portion in the region has given a way for
unique system of water logged areas consist of ecologically important swamp forest,
swamp grassland and ox-bow lakes. These areas have given refuge to few of the important
species such as Indian One horn Rhino, Royal Bengal Tiger, Great Pied Hornbill, Sarus
Crane, etc. The forests in the region are restricted to the hilly tracts of the Shivaliks and
lower Himalayas.
Table 11 Rainfall, climate, soil group, altitude, and zones in North Bihar
Rainfall
(mm) Climate Soil group Zone Altitude
1461-2035
mm
Damp, humid and
moist 8oC-36oC
Piedmont Swamp Soil, Terai
Soil and alluvial plains
Shivalik ranges
and Terai belt
125-880
m
South Bihar: - South Bihar region is the southernmost section of the state, which lies
south to the Gangetic plain in the eastern part of Vindhyan range. This region is
13 All statistical data in this section are sourced from the Forest Survey of India Report 2011.

State Action Plan on Climate Change (SAPCC)-Jan 2015
- 50 -
represented by unique ecological systems. River ‘Sone’ is most important to this region.
The forests in the region are restricted to the hilly tracts of the Kaimur hills, Rajgir hills,
and Kharagpur hills.
The region also consists of some of the important conservation zones and Wild Life
Sanctuaries like Bhimbandh Wildlife Sanctuary, Gautam Buddha Wildlife Sanctuary,
Kaimur Wildlife Sanctuary, Nagi Dam Wildlife Sanctuary, Nakti Dam Wildlife Sanctuary
and Pant Wildlife Sanctuary, Rajgir. The rainfall, climate, soil group, zone, altitude are
given in the following table.
Table 12 Rainfall, climate, soil group, altitude, and zones in South Bihar
Rainfall
(mm) Climate Soil group Zone Altitude
1000-1100
mm
Hot and dry with Average
Temperature 40oC
Gangetic Alluvium,
sandy loam
Gangetic plain and
Eastern Vindhyan range
300-500
m
6.1.2 General Description of Vegetation of Bihar
Vegetation of the state is classified under climatic, serial and edaphic types. The climatic
forest types are broadly classified into dry deciduous and moist deciduous types. Besides
the deciduous forest, the vegetation types also include Sal, gregarious forests, bamboo
forests, canebrakes, and grasslands, covering relatively less area.
Sal mixed dry deciduous forests (northern dry mixed deciduous forests) occupy major
proportion under natural vegetation cover and predominantly found in Kaimur, Rohtas,
Aurangabad, Gaya, Nalanda, Nawada, Jamui, Banka and Munger districts.
Dry deciduous forests are found in both, the plains and the peninsular region in the
southern districts. Sal mixed moist deciduous forests (northern moist Sal bearing forest)
are distributed mainly in West Champaran and partly in the valleys of Kaimur, Rohtas,
Aurangabad, Gaya, Nalanda, Nawada, Jamui, Banka and Munger.
Dry Siwalik Sal forests are mainly distributed in the Shivaliks range in the West
Champaran district. Moist mixed deciduous forests (West Gangetic moist mixed
deciduous forest) occur mostly in West Champaran district, also in the valleys in the
valleys of south Bihar hills. Canebrakes (tropical seasonal swamp forests) are
predominantly found in the West Champaran district.

State Action Plan on Climate Change (SAPCC)-Jan 2015
- 51 -
Table 13 Dominant tree/plant species
Forest Type Dominant Species
Moist deciduous ShorearobustaGaertn.f; Mallotusphilippensis (Lam.) Muell. -Arg.; Terminalia
ellipticaWilld; Syzygiumcumini (L.) Skeels; Haldinacordifolia (Roxb.) Ridsd;
BuchananialanzanSprengs; Lanneacoromandelica (Houtt.) Merrill; Acacia
catechu (L.f.) Wild; Terminalia bellirica (Gaertn.) Roxb; and Litseamonopetala
(Roxb.) Pers.
Dry Siwalik Sal ShorearobustaGaertn. f.; Terminalia crenulata Roth; Litseamonopetala
(Roxb.) Pers.; Lanneacoromandelica (Houtt.) Merrill;
Holarrhenaantidysenterica (Heyne ex Roth) Wall .ex DC; Lagerstroemia
parvifloraRoxb; Grewiatillifolia Wahl; GarugapinnataRoxb; Acacia catechu
(L.f.) Willd; and Terminalia bellirica (Gaertn.) Roxb
Sal mixed dry
deciduous
ShorearobustaGaertn.f; MadhucaindicaGmelin; BuchananialatifoliaRoxb;
Lanneacoromandelica (Houtt.) Merrill; Terminalia crenulata Roth;
DiospyrosmelanoxylonRoxb; Aeglemarmelos (L.) Corr.; Anogeissuslatifolia
(Roxb. Ex DC.) Guillemin &Perottet; Acacia catechu (L.f.) Wild; and
Lagerstroemia parvifloraRoxb.
Sal mixed moist
deciduous
ShorearobustaGaertn. f.; Terminalia crenulata Roth; Lanneacoromandelica
(Houtt.) Merrill; Syzygiumcumini (L.) Skeels; Mallotusphilippensis (Lam.) Mull.
-Arg.; Litseamonopetala (Roxb.) Pers.; Bambusaarundinacea (Retz.) Wild;
Lagerstroemia parvifloraRoxb; Un identified-60; and
Holarrhenaantidysenterica (Heyne ex Roth) Wall .ex DC.
Dry Deciduous MadhucaindicaGmelin; Lenneacoromandelica (Houtt.) Merrill;
DiospyrosmelanoxylonRoxb; ShorearobustaGaertn. f.; Anogeissuslatifolia
(Roxb. Ex DC.) Guillemin & Wall. Ex DC; Lagerstroemia parvifloraRoxb;
BuchananialatifoliaRoxb; Holarrhenaantidysenterica (Heyne ex Roth) Wall
.ex DC; Aeglemarmelos (L.) Corr.; and Cassia fistula L.
Tropical seasonal
swamp
Syzygiumcumini (L.) Skeels; Mallotusphilippensis (Lam.) Mull. -Arg.;
Trewianudiflora L.; FicushispidaL.f.; Drypetesroxburghii (Wall. Hurusawa);
DalbergiasissooRoxb. Ex DC; Grewiatillifolia Wahl; Lenneacoromandelica
(Houtt.) Merrill; Streblusasper Lour; and Ficusracemosa L.
The highest number of species in Bihar State has been recorded for dry deciduous forests
with 305 species including two parasites, followed by moist deciduous type having 184
species. Whereas the Sal mixed dry deciduous, Sal mixed moist deciduous, Dry Siwalik
Sal forest and tropical seasonal swamp forest types have 138, 68, 180 and 80 species,
respectively.
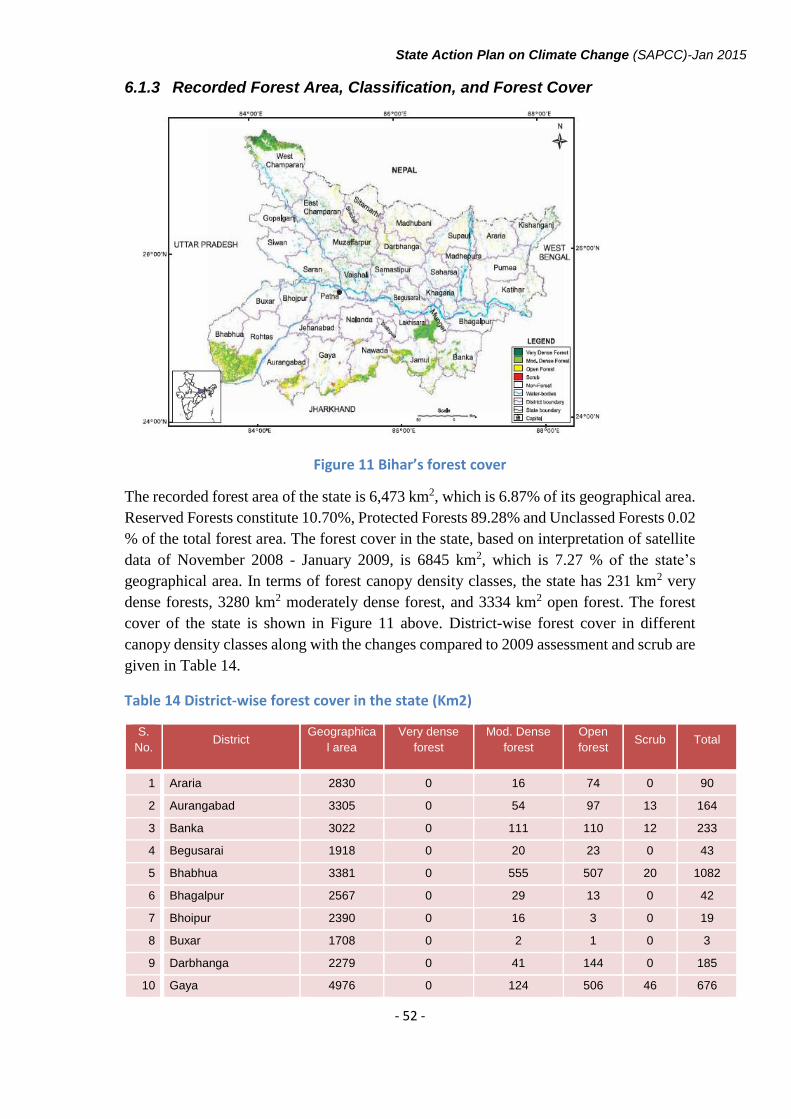
State Action Plan on Climate Change (SAPCC)-Jan 2015
- 52 -
6.1.3 Recorded Forest Area, Classification, and Forest Cover
Figure 11 Bihar’s forest cover
The recorded forest area of the state is 6,473 km2, which is 6.87% of its geographical area.
Reserved Forests constitute 10.70%, Protected Forests 89.28% and Unclassed Forests 0.02
% of the total forest area. The forest cover in the state, based on interpretation of satellite
data of November 2008 - January 2009, is 6845 km2, which is 7.27 % of the state’s
geographical area. In terms of forest canopy density classes, the state has 231 km2 very
dense forests, 3280 km2 moderately dense forest, and 3334 km2 open forest. The forest
cover of the state is shown in Figure 11 above. District-wise forest cover in different
canopy density classes along with the changes compared to 2009 assessment and scrub are
given in Table 14.
Table 14 District-wise forest cover in the state (Km2)
S.
No. District
Geographica
l area
Very dense
forest
Mod. Dense
forest
Open
forest Scrub Total
1 Araria 2830 0 16 74 0 90
2 Aurangabad 3305 0 54 97 13 164
3 Banka 3022 0 111 110 12 233
4 Begusarai 1918 0 20 23 0 43
5 Bhabhua 3381 0 555 507 20 1082
6 Bhagalpur 2567 0 29 13 0 42
7 Bhoipur 2390 0 16 3 0 19
8 Buxar 1708 0 2 1 0 3
9 Darbhanga 2279 0 41 144 0 185
10 Gaya 4976 0 124 506 46 676

State Action Plan on Climate Change (SAPCC)-Jan 2015
- 53 -
S.
No. District
Geographica
l area
Very dense
forest
Mod. Dense
forest
Open
forest Scrub Total
11 Gopalganj 2033 0 2 2 0 4
12 Jamui 3107 0 383 249 2 634
13 Jahanabad (including
Arwal district)
1569 0 2 1 5 8
14 Katihar 3057 0 18 44 0 62
15 Khagaria 1486 0 2 6 0 8
16 Kishanganj 1884 0 26 49 0 75
17 Lakhisarai 1356 0 180 14 2 196
18 Madhepura 1788 0 6 20 0 26
19 Madhubani 3501 0 18 118 0 136
20 Munger 1347 0 251 14 7 272
21 Muzaffarpur 3172 0 82 74 0 156
22 Nalanda 2367 0 5 23 6 34
23 Nawada 2494 0 187 323 10 520
24 Pashchimi Champaran 5228 231 520 162 0 913
25 Patna 3202 0 13 3 0 16
26 PurbiChamparan 3968 0 76 88 0 164
27 Purnea 3229 0 6 41 0 47
28 Rohtas 3832 0 321 385 11 717
29 Saharsa 1680 0 2 9 0 11
30 Samastipur 2904 0 39 18 0 57
31 Saran 2641 0 38 17 0 55
32 Sheikhpura 612 0 0 0 0 0
33 Seohar 572 0 2 17 0 19
34 Sitamarhi 2071 0 18 64 0 82
35 Siwan 2219 0 1 1 0 2
36 Supaul 2432 0 8 93 0 101
37 Vaishali 2036 0 74 12 0 86
Total 94163 231 3248 3325 134 6938
Table 15 Forest cover change matrix (area in Km2)
2009 Assessment 2011 Assessment
Total 2009 VDF MDF OF Scrub NF
Very Dense Forest 231 0 0 0 0 231
Moderately Dense Forest 0 3,239 5 0 4 3,248
Open Forest 0 6 3,312 4 3 3,325
Scrub 0 2 2 130 0 134
Non-Forest 0 33 15 0 87,177 87,225

State Action Plan on Climate Change (SAPCC)-Jan 2015
- 54 -
2009 Assessment 2011 Assessment
Total 2009 VDF MDF OF Scrub NF
Total2011 231 3,280 3,334 134 87,184 94,163
Net Change 0 32 9 0 -41
The change matrix given in Table 15 reveals that there has been no change in very dense
forest whereas there is an increase of 32 km2 in the moderately dense forest and nine km2
in open forest. Forest cover of the state in different altitude zones is given in Table16
Altitude zone-wise forest cover (area in Km2)
The forest and tree cover of the state is presented in Table 16.
Table 16 Forest and tree cover
Category Area % of Geographical Area
Tree Cover 2,369 2.52
Forest Cover 6,845 7.27
Forest & Tree Cover 9,214 9.79
The growing stock in the recorded forest area has been estimated on the basis of the current
forest cover map, forest type map and forest inventory data. For TOF, the same has been
estimated using TOF inventory data. It is presented in the Table 17 below.
Table 17 Growing Stock (million cum)
Forest TOF Total
35.186 47.195 82.381
The extent of bamboo bearing area in the forests of the state is 739 km2. Density-wise
details, number of culms by soundness and equivalent green weight are given in following
table 18.
Figure 12 Forest type groups

State Action Plan on Climate Change (SAPCC)-Jan 2015
- 55 -
Table 18 Bamboo bearing area by density in recorded forest area (Area in km2)
Recorded
Forest Area
Pure
Bamboo
Dense
bamboo
Scattered
bamboo
Clumps
hacked
Bamboo
regeneration
No
bamboo
6,473 1 239 393 75 31 5,734
6.1.4 Protected Areas
Table 19 Protected areas in Bihar
Sr.
No. Name District
Legal
Status
Date of
Notification Area (in Km2)
1 Valmiki National Park W. Champaran N.P. 2.8.89 335.6
2 Valmiki Vanya Prani Sanctuary W. Champaran S 4.5.76 880.78
3 Bhimbandh Sanctuary Monger S 27.5.76 681.99
4 Pant VanyPrani Sanctuary Nalanda S 20.5.78 36.84
5 Kaimur Sanctuary Rohtas S 25.7.79 1342
6 GautamBudha Bird Sanctuary Gaya S 14.9.71 259.5
7 UdaypurVanyPrani Sanctuary W. Champaran S 29.4.78 8.87
8 Nagi Dam Bird Sanctuary Jamui S 14.7.87 7.91
9 Nakti Dam Bird Sanctuary Jamui S 15.7.87 3.32
10 Vikaramshila Gangetic Dolphin
Sanctuary
Bhagalpur S 28.8.90 0.5 Km in length
11 KanwarJheel Bird Sanctuary Begusarai S 20.6.89 63.11
12 BarailaJheel Salim
aliJhbbaSahni Bird Sanctuary
Vaishali
13 KusheshwarSthan Bird
Sanctuary
Darbhanga
6.1.5 Salient Features of Bihar’s Forests
The hill ranges at Rohtas, Kaimur, and Bhabhua have good quality Sal gregarious forest, whereas
the deep valleys provide habitat for dense moist deciduous forests. The forest along the periphery
of the hill range are mostly open to degradation due to constant and anthropogenic pressure,
however, the hill tops are relatively in better condition in the places with steep slope and rocky
terrain. The forests in Gaya, Aurangabad, and Nawada owing to their small areas are most into
poor state of tree density. The Sal mixed dry deciduous forest range at Munger-Lakhisarai-Jamui
is one such forest which is in better condition for both diversity and density, comprising of well
grown trees mainly of Shorearobusta and Terminalia elliptica. The ground vegetation is also quite
diverse.
In North Champaran the high Shivaliks range provides a good habitat for the wide range of flora
and fauna. The old bamboo plantation in the Govardhana range is very well established and
provides ideal habitat for the Tiger in the region. The loss of forest every year due to change in the
path of river Gandak is considered as one of the most crucial threats to the forest in the region.

State Action Plan on Climate Change (SAPCC)-Jan 2015
- 56 -
This change in the path has been attributed to the manoeuvring to the banks of river Gandak along
the Indo-Nepal border.
6.1.6 Wetlands
Area estimates of various wetland categories for Bihar have been published in the National
Wetlands Atlas of India, Bihar Section, by the Space Applications Centre, Indian Space Research
Organisation. Total wetland area estimated is 403209 ha that is around 4.4% of the geographic
area. The major wetland types are river/stream accounting for about 74% of the wetlands (298408
ha), natural waterlogged (34878 ha) lakes/ponds (20281 ha), and ox-bow lakes/cut-off meanders
(16172 ha). However, the small wetlands (< 2.5 ha) accounts for about 4.5% assuming that each
is of one ha.There is a significant reduction in the extent of open water (about 34%) from post-
monsoon (224655 ha) to pre-monsoon (148382 ha). It is reflected in all the wetland types except
reservoir/barrage (Table 20).
Table 20 Area estimates of wetlands in Bihar
Sr.
No. Wetland Category
Number of
Wetlands
Total
Wetland
area
% of
wetland
area
Open Water
Post-
monsoon
area
Pre-
monsoon
area
Inland Wetlands - Natural
1 Lakes/Ponds 514 20281 5.03 11506 6345
2 Ox-bow lakes/ Cut-off
meanders 989 16172 4.01 10130 5264
3 High altitude wetlands - - - - -
4 Riverine wetlands 200 2118 0.53 1664 777
5 Waterlogged 1300 34878 8.65 21185 9507
6 River/Stream 238 298408 74.01 168984 118481
Inland Wetlands -Man-made
7 Reservoirs/Barrages 90 8612 2.14 7587 6005
8 Tanks/Ponds 1067 4822 1.20 3363 1870
9 Waterlogged 18 336 0.08 236 133
10 Salt pans - - - - -
Sub-Total 4416 385627 95.64 224655 148382
Wetlands (<2.25 ha) 17582 17582 4.36 - -
Total 21998 403209 100.00 224655 148382

State Action Plan on Climate Change (SAPCC)-Jan 2015
- 57 -
Figure 13 Wetlands areas of Bihar
6.2 Key Issues
The key threats to forests in Bihar include extreme poverty and overdependence of local population
on depleted forest resources, uncontrolled livestock grazing, and recurrent droughts in South Bihar,
and floods (and water logging) in North Bihar districts. Many of Bihar’s wetland areas too are in
urgent need of conservation and protection, as these are important habit areas for a range of species,
especially avifauna. All aquatic plants are good sources of organic fertilizer hence they will be
well utilized as such in and around wetland.
6.3 Priorities
Considering the limited forest resources in the State and the threats to these, there are several key
priority areas. Proposed initiatives during the 12th FYP period are briefly outlined below:
It is proposed to increase tree cover in the state by plantation in non-forestlands. A robust
social forestry program is being proposed to encourage farmers to plant trees on their
lands. A pilot project for introducing Poplar in Vaishali district has yielded encouraging
results and it will be replicated in 24 other districts of the state at an estimated cost of 260
crores during the 12th FYP period. To achieve 15 percent forest/tree cover Social Forestry
and Agro Forestry as well as schemes under MNREGA need to be intensively and
extensively implemented. Farm nurseries in the private sector need to be promoted and
encouraged as the Environment and Forest Department cannot by itself fulfil the needs of
the State.
The State has taken a very important decision to free 10 species of trees from transit rules,
which will act as an incentive for the farmers to grow trees, as they will be freed from
procedural hassles for disposing off their produce.
The rehabilitation and enrichment of these forests will be done with the cooperation of the
local people through Joint Forest Management (JFM). JFM will be strengthened by
doubling the number of Village Forest Management and Protection Committee (VFMPC)
in the state.
Intensification of Forest Management Schemes during the 11th Plan has given a fillip to
strengthening of infrastructure like communication, roads, free surveillance etc. in the
forests. However, there is a need to change the mode of funding under the scheme.
Currently the scheme is constrained by the guidelines of Ministry of Environment and
Forests (MoEF) and each of the items of work needs the sanction of MoEF.

State Action Plan on Climate Change (SAPCC)-Jan 2015
- 58 -
50 % of forest area of the State is notified as Protected Areas (Sanctuaries and National
Parks); management of these areas needs special emphasis and specialized approach. The
State has taken up preparation of the management plans for these areas. These
management plans will provide the necessary baseline date for finalizing the management
practices to be adopted for wildlife and biodiversity conservation.
Protection mechanism of protected areas is being upgraded by providing more vehicles
and communication systems. The firepower of staff engaged in protection, needs
enhancement through provision of arms and requisite training to use them effectively.
Protection of wildlife and its habitat will be done with the active participation of people
through eco-development committees.
Man-animal conflict issues need redressal. The State has enhanced the compensation
packages for damage by wild animals and for the first time has introduced a compensation
package for crop damage. Relocation of habitations of Valmiki Tiger Project on lines of
the recommendations of the Tiger task Force is desirable. Where this is not possible, an
effective co-existence plan will be put in place.
6.3.1 Intensification of Forest Conservation
Enhance soil moisture/water conservation efforts;
Integrate watershed management/catchment area treatment schemes;
Total ban on mining in and around natural forest areas/protected areas including
ecologically fragile areas;
Livestock management in villages near the natural forests - phasing out unproductive cattle
folk by providing productive (better quality) cattle - incentivizing stall feeding to
reduce/minimize grazing pressure on forests;
Undertaking studies on dependence of local communities on forests, especially for fuel
wood and non-timber forest produce (NTFPs);
Provide alternative fuel resources to villagers near forests (LPG/fuel wood production
incentives etc.) to reduce fuel wood dependence on forests, promoting the use of non-
conventional energy resources;
Water harvesting and ground water recharging tanks and other rural development schemes
in and around the villages near forests with focus on forest conservation objectives -
involving the forest officials and Panchayat Raj institutions. (PRIs);
The sustainable development of wetlands depends on proper utilization, management and
conservation of diverse natural resources to ensure the fulfilment of human needs, that
continue to do so far for the future generation without hampering the natural resources;
and
Providing occupational rehabilitation to people around the protected areas by promoting
eco-tourism and also utilizing their services in wildlife and biodiversity conservation
efforts.
6.3.2 Greening in Other Areas (Outside Forests)
Institutionalized plantation efforts - Road side, canal side, flood protection,
embankments and community lands to be strengthened;
More nurseries for production of quality planting materials for agroforestry and
farm forestry;
Incentivize agro-forestry propagation and promotion through aggressive
campaigning and extension services;
Linking isolated wetlands for effective drainage through rivers/ rivulets after
proper research/ study of their habitat potentials (of aquatic and avian flora/ fauna);
State Action Plan on Climate Change (SAPCC)-Jan 2015
- 59 -
creation of green shelterbelts around wetlands with focus on avian habitat
management; and scientific water & fisheries management through PRIs;
Survey and appraisal of flora and fauna in areas out of forests and wildlife
management outside forest areas in active collaboration with PR institutions;
Evolving a "green code" with Urban/Rural Development/Industries Department
providing for and regulating:
Development and Management of Parks, greening of roads in urban and semi urban
areas;
Industries, commercial establishments and housing schemes to have mandatory
greening tasks/ components; and
Shelterbelt/green cover around drainage/sewer and treatment facilities (oxidation
ponds etc.)
6.3.3 Strengthen Infrastructure for Implementation, Research Training, monitoring and Enforcement
Forest Department and the State Pollution Control Board (SPCB) to be strengthened
sufficiently to carry out the required tasks; and
Create a separate multi-disciplinary facility/wing in the Environment and Forest
Department for research and monitoring of climate change action plan and inter
departmental co-ordination
6.4 Perceived Climate Impacts
There is no in depth study of impact of climate change on forest per say in the state. In
general, climate change is likely to make the State’s meagre forest resources more
vulnerable on account of possible shift of the species of forest ecosystems and also on
account of increased occurrences of fire, pest /diseases, invasive species, change in species
assemblage/forest type, forest die-back and loss of biodiversity. It is also almost certain
that forest dependant livelihoods may get severely affected, increasing the vulnerability of
local communities in and around forests in the State.
6.5 Strategies
The overarching approach to the forests and biodiversity sector will be to foster an
integrated approach that treats forests and non-forest public lands as well as private lands
simultaneously, while identifying and leveraging opportunities for mitigation and
adaptation measures that enhance ecosystem goods and services, particularly carbon
stocks, water, and meet biodiversity conservation and livelihood security needs at the
unit/landscape or sub-landscape/watershed or sub-watershed levels.
The BAPCC will focus on restoration of native bio-diverse species mix while at the same
time enhancing carbon sink in forests and other ecosystems, while being informed by
sensitivity to the ecological nature and value of resources, for instance avoiding dense
plantations in grasslands which have other values like fodder, watershed etc.
Research studies will be undertaken to categorise vulnerability and potential as criteria for
intervention, and intervention priorities and selection of project areas/sub-landscapes/sub-
watersheds will be formed formulated based on the analyses from these studies.
State Action Plan on Climate Change (SAPCC)-Jan 2015
- 60 -
Drivers of degradation, such as firewood needs and livestock grazing will be addressed
using inter sectoral convergence (e.g. livestock, forest, agriculture, rural development,
energy etc.).The BAPCC will ensure a key role for local communities in project
governance and implementation. Gram Sabha and its various committees/groups including
JFMCs, etc. will be strengthened as institutions of decentralized forest governance, and
capacity building for adaptive forest management and livelihood support activities e.g.
community based NTFP enterprises will be accorded high priority. Key Interventions in
different forest classes will include the following.
Interventions in very dense forests: The entire 231 km2 of very dense forests are situated
in the West Champaran district, and is part of the Valmiki Tiger Project. Forests of all ages
and types of this class have remarkable capacity to sequester and store carbon. As such,
interventions will focus on enhancing storage and reducing emissions by ensuring full
stocking, maintaining health, reducing losses due to tree mortality, natural calamities,
wildfires, insects and diseases, and stand density management by prudent tree removal. It
is envisaged that this will provide a renewable source of products including timber,
engineered composites, paper, and energy even as the stand continues to sequester carbon.
These forests will continue to be protected rigorously against all threats.
Moderately dense forests: It is proposed to improve the condition of these forest areas
through:
Improved/enhanced fire management through prevention, detection and
control measures as well as improvement of infrastructure;
Regulated grazing;
Eradication of invasive species;
Soil and moisture conservation through watershed management; and
Gap plantation adopting indigenous species.
It is envisaged that sustainable management of these forests would lead to increase in
stocking density, enhanced biomass and carbon sinks.
Open forests: The Forest Department proposes to improve these forests through:
Large-scale gap plantation of indigenous species;
Regeneration of rootstock;
Soil, and moisture conservation, run off reduction, and integrated watershed
management;
Consultation with communities and plantation of multi-purpose and fast
growing small timber yielding and other tree species to fulfil the requirement
of local people such as fuel wood, fodder, NTFPs, agricultural implements,
etc.;
Constitution/re-vitalisation of forest protection committees/JFMCs and
capacity building of these to develop community conserved areas and similar
local protection regimes;
Provision/promotion of efficient cook-stoves among local village households;
Development and deployment of other innovative incentive based conservation
measures involving local communities.

State Action Plan on Climate Change (SAPCC)-Jan 2015
- 61 -
Scrub Forests: The Forest Department aims to improve the condition and productivity
of these forests through:
Planting small timber producing plants/trees;
Fodder, fuel wood producing plants;
Developing grass land and pasture land for local people within the carrying
capacity of the scrub forest areas;
Constitution/re-vitalisation of forest protection committees/JFMCs and capacity
building of these to develop community conserved areas and similar local
protection regimes to encourage re-generation of trees;
Provision/promotion of efficient cook-stoves among local village households; and
Development and deployment of other innovative incentive based conservation
measures involving local communities.
Key interventions in the Protected Areas will include:
Appropriate zonation into multiple use categories including core, buffer, tourism zones,
etc.;
Control of invasive species including weeds and protection of catchment areas;
Fencing of strategic areas to protect wildlife and control encroachments;
Key interventions wetland areas to be taken up for interventions in the immediate short
term would include the notified wetland areas including Kabar Lake Bird Sanctuary,
Barailla Lake Bird Sanctuary, Kusheshwara Asthan Bird Sanctuary, Udaipur Sanctuary,
Nagi/Nakti, and Vikramshila Gangetic Dolphin Sanctuary. Interventions in these would
include (but not be limited to):
Protection measures on a priority basis including fencing, training/capacity
building of relevant personnel, increased strength of frontline staff and
improved/enhanced infrastructure;
Treatment of catchment areas, support to compatible land use practices, water
quality monitoring, and other measures infrastructure and equipment needed to
ensure sustained water balance, optimal wetland hydrology, and all-season water
availability;
Extensive community education/awareness building on the importance of these
wetland areas and the need to protect/conserve them and formation of community
conserved zones around these wetlands for enhanced protection; and
Capacity building for, promotion of, and supporting infrastructure provision/
enhancements for enterprise linked community conservation efforts such as eco-
tourism, birding, and bird photography, especially during migratory bird seasons.
Over the medium to long-term, the Forest Department will identify and take up other non-
notified areas for similar protection and conservation using community based approaches.

State Action Plan on Climate Change (SAPCC)-Jan 2015
- 62 -
Just over two million ha of lands -- 22.25 percent of the total geographical area in the State
are not available for cultivation. A part from this, 129000 ha are fallow lands that can be
treated and brought under plantation.
Presently the percentage of forest and tree cover is 9.21 percent, implying that for
increasing the forest and tree cover to 15 percent, 542000 ha of additional land has to be
brought under tree cover or alternatively about 338 million trees/plants have to be raised
outside forest area. The Forest Department aims to achieve this by undertaking a range of
interventions including the following.
Urban and peri-Urban areas (including institutional lands): Urban forests are an exciting
opportunity to (a) mitigate climate change; (b) ameliorate air and dust pollution; (c) help
in improving overall water regime; and (d) nurture bio-diversity in urban environments.
As such, the Forest Department will leverage all opportunities for urban greening by
various interventions categorizing urban forest in following broad categories:
Recorded or notified forest patches: In urban areas where large or medium forest
patches are available, it will be notified as protected forest and fenced;
Open spaces/green spaces like parks/wood lots: Open Spaces/Green spaces such
as parks/wood lots should be raised on municipal lands to enhance the vegetative
cover;
Avenue plantations: In urban areas road side avenue plantations will be raised at
least in two rows on both sides of the road where land is available; and
Plantation on institutional lands: In urban areas, many government institutions
have large open campuses. Sufficient land is available in these -- where suitable
species of trees/plants can be raised.
Agro-forestry and Social Forestry: Social forestry and agroforestry have immense
potential in Bihar, which is pre-eminently an agricultural State. Farmers are eager to raise
plants on the bunds of the farmland. Poplar and Eucalyptus trees are suitable for farmers
for agroforestry plantations. Farmers are eager to raise fruit-bearing trees on their raiyati
lands.
As such, the Forest Department, in coordination with the Agriculture Department and
other appropriate agencies will plan and undertake agroforestry initiatives including
development of large-scale nurseries of high quality tree/plant material; distribution of
plants free of cost to farmers, making available extension and support services through
research and other initiatives such as training for post plantation care, visits by forest
department staff, agroforestry specialists/scientists from institutions such as the National
Research Centre for Agroforestry (NRCAF) and other centres/universities; support for
planting trees on non-agricultural rural lands such as homesteads, school yards,
compounds of various offices, public spaces, roadsides, canal sides, private/public bunds
etc. Plantations along canals and river embankments: The State has about 3430 Kms of
river embankments. The Forest Department will examine the possibility of raising
plantations on these embankments by using suitable species especially bamboo, which is
a strong soil binder. In addition to these river embankments there are 10000 kms of canal

State Action Plan on Climate Change (SAPCC)-Jan 2015
- 63 -
embankments that can be brought under plantation. A tentative physical projection of
various interventions for increasing green cover is given below:
Table 21 Tentative target for green cover augmentation in forest/non-forest areas
Type of area and the
density class
Extent of
area (in Ha)
Area likely to be treated under
existing program/ schemes of
Green Bihar till 2016-17 (ha)
Areas to be treated under
the Climate Change
Action Plan (ha)
Moderately dense
forest (40.70%) 324800 173860 150940
Open Forests
(10.40%) 332500 178200 154300
Scrub/Grasslands 13400 10720 2680
Non Forests land 2212000 560000
Waste land 46000 46000
Agro – forestry 6222000 1476700
Total 9150700 362780 2390620
A range of other interventions will also be undertaken. These will include:
1. Extensive measures to be taken by using both traditional as well as modern inputs
to contain forest fires -- with increase in temperatures, forests are likely to be more
prone to fires. Hence, wildfire management will to be taken up at a priority basis
to combat increased frequency and intensity of wildfires in future;
2. Examination of the possibility of leveraging opportunities such clean development
mechanisms (CDM), reducing emissions from deforestation and forest degradation
(REDD+), etc.;
3. Promotion of such plant species that are more friendly/adaptable to climate change
(e.g. species with relatively high carbon sequestration capabilities);
4. In social forestry, agro-forestry and their variants, traditional wisdom and practices
should be appraised for conformity with climate change ramifications and
accordingly promoted; also choice of species should be reviewed from this angle;
5. Effect of climate change on wild life (wild fauna) should be properly examined
and preventive measures should be undertaken to check loss of diversity (to be
incorporated in the management plans/working plans for wildlife protected areas
and other natural wilderness habitats).
6. Activating the State Biodiversity Board and transforming it into a fully functional
institution undertaking the full range of activities to survey, identify, catalogue,
document, protect, and improve/enhance the status of biodiversity in the State
including producing, in a time-bound manner, flagship publications on Bihar’s
biodiversity;
7. Developing and implementing a proactive and on-going programme of research
and documenting studies relating to forestry and wildlife in the state including for
example (but not limited to):
Studies on indigenous trees species to assess their vulnerability to climate
change;
Assessing and documenting additional threats to biodiversity and wildlife.

State Action Plan on Climate Change (SAPCC)-Jan 2015
- 64 -
Population dynamics and movement of wildlife;
Obtaining access to updated knowledge on climate change science and policy
developments;
Monitoring carbon stock and biodiversity at regular intervals etc.
Additionally, the Forest Department recognises that the private sector can play a role in
many forestry related activity in incentivizing collection and value addition of NTFPs,
growing of medicinal plants by people, promoting agro-forestry, and thus enhancing
livelihood opportunities. As such, the Forest Department will actively examine the
creation of enabling mechanisms for increased roles for the private sector in selected
operations/activities.
6.6 Institutional Linkages and Stakeholders
A range of institutional linkages, convergence potential, and partnerships is envisaged
with, indicatively, the State Agriculture Department, State Energy Department; BREDA;
Bihar Watershed Development Society; State Water Resources Department, Central
University of Bihar (CUB) and other agencies as necessary for enhancing green cover or
achieving the imperatives under the BAPCC. Additional linkages with be built with
National forestry research institutes/centres and universities; various international
development agencies, private sector and financial institutions, civil society, community
based organisations, and forestry and allied sector dependant communities in general.
6.7 Linkages with the NAPCC
The initiatives outlined above are consistent with the NAPCC and National Mission for
Green India. Additionally, the strategies and imperatives under the forestry and
biodiversity section of the BAPCC also have linkages with the National Mission on
Sustainable Agriculture, National Water Mission, National Mission for Enhanced Energy
Efficiency, National Solar Mission, and the National Mission on Strategic Knowledge on
Climate, and the National Mission on Sustainable Habitat.
6.8 Sectoral Action Plan and Budgets under the BAPCC
See Part C, Action Plans and Budgets

State Action Plan on Climate Change (SAPCC)-Jan 2015
- 65 -
7. Water Resources
7.1 Overview, Characteristics and Status
7.1.1 River Basins and Rivers
Bihar is a landlocked state, yet it is rich with ample natural water resources. The most
important river Ganga, flowing from west to east, divides the state into north and south
Bihar. The state is almost fully covered under the lower Ganga basin, with a small part in
the west of the State under the upper Ganga basin. The Lower Ganga basin is further
divided into several sub-basins. Broadly divided into the eight major rivers – the Ghagra,
Gandak, BudhiGandak, Bagmati, the Adhwara group of rivers, Kamla, Kosi, and
Mahananda spread are across North Bihar. The major rivers of South Bihar are
Karamnasha, Sone, Punpun, Kiul-Harohar, Badua, Falgu, Morhar, Chandan, and Bilasi,
having their origins in Jharkhand, Madhya Pradesh, and Uttar Pradesh. Most of the rivers
in north Bihar originate in Nepal flowing through the plains of Bihar before draining into
the river Ganga.
Figure 14 River basins and sub-basins in Bihar
Bihar is one of the worst flood-affected states in India. About 68.8 lakh hectares of its total
geographical area of 94.16 lakh hectares are flood prone. In addition, nearly 9.41 lakh
hectares (8.32 lakh ha in north Bihar and 1.09 lakh ha in south Bihar), i.e., 10% of the total
geographical area of the state is water logged. There are multiple reasons behind
waterlogging which include: spilling of silted small rivers, encroachment of drainage
channels, embankment induced waterlogging and the prevalence of saucer type
depressions in the topography of the land.

State Action Plan on Climate Change (SAPCC)-Jan 2015
- 66 -
7.1.2 Hydrogeology and Groundwater
Hydro geologically, the State can be grouped as unconsolidated/ alluvial formation, semi-
consolidated formations, and consolidated/fissured formations. The main alluvial tract
covers entire north Bihar and a sizeable area south of the Ganga River. These alluvial
formations constitute prolific aquifers where the tube well can yield between 120-247
m3/hr. The potentiality of these aquifer decreases due south in the marginal tracts. Auto
flow conditions occur in the sub-Tarai region of Madhubani, Sitamarhi, and West
Champaran districts. In the hard rock areas of South Bihar, bore wells located near
lineaments/fractures can yield between 10-50 m3/hr.
Table 22 Groundwater resources in Bihar
Dynamic Ground Water Resources
Annual Replenishable
Ground water Resource
29.19 BCM
Net Annual Ground Water
Availability
27.42 BCM
Annual Ground Water Draft 10.77 BCM
Stage of Ground Water
Development
39 %
Ground Water Development & Management
Over Exploited NIL
Critical NIL
Semi- critical NIL
Ground Water User Maps 38 districts
Artificial Recharge to
Ground Water (AR)
• Area identified for AR: 1650 sq. km.
• Quantity of Surface Water to be Recharged: 574 MCM
• Feasible AR structures: 891 Percolation Tanks, 2260 Check Dams,
1630 Recharge Shaft, 1303 Contour Bunding, RWH in Urban Areas
Despite the fact that Bihar has ample ground water resources, these are also beset with
several quality problems, including arsenic, fluoride, iron, and nitrate concentrations in
many districts.
7.1.3 Irrigation
There are six major sources of irrigation—surface canals (major), surface canals (minor),
tanks (including ahars and pynes), tube wells, other wells, and other sources. Tanks and
other sources are becoming less important over time, leaving the other four sources for
providing irrigation facilities.
In 2009-10, canals (major, medium and minor) provided 27.5% wells provided
61.4%percent of total irrigation. Tube wells continue to be an extremely important source
of irrigation, providing more than 50% of the total irrigation in 30 districts. However,
irrigation from surface canals (major, medium and minor) continues to play an important

State Action Plan on Climate Change (SAPCC)-Jan 2015
- 67 -
role in districts – Rohtas, Kaimur, Bhojpur, Buxar, Aurangabad, Banka, and Lakhisarai,
all of which are notable rice producing districts of Bihar.
The ultimate irrigation potential is to be created by the major and medium irrigation. At
present, schemes like Western Kosi Canal Project, Durgawati Reservoir Scheme,
KundGhat, Barnar Reservoir Scheme, Bateshwarsthan Ganga Pump Canal, North Koel
Reservoir Scheme, Tilaiya Diversion Scheme, Punpun Barrage Scheme, Batane Reservoir
Scheme, Mandai Weir Scheme, Uderasthan Barrage Scheme, Lower Morhar and Lower
Kiul irrigation schemes are under execution. The year-wise irrigation potential created
until 2010-11 under major and medium schemes, actual areas irrigated, along with the
utilization efficiency are presented in Table 23.
Table 23 Water utilization efficiency of major and medium irrigation schemes (Figures in '000 ha)14
Year Irrigation Potential created Total Irrigation Efficiency (%)
2001-02 2482.43 1656.21 66.72
2002-03 2509.43 1598.36 63.69
2003-04 2574.00 1721.24 66.87
2004-05 2619.00 1528.23 58.35
2005-06 2637.00 1660.91 62.98
2006-07 2833.00 1684.73 59.47
2007-08 2863.00 1679.82 58.67
2008-09 2873.00 1666.04 57.99
2009-10 2880.00 1202.45 41.75
2010-11 2886.00 1226.45 42.50
The source-wise area irrigated through minor irrigation during 2008-09, 2009-10, 2010-
11, and 2011-12 (up to September 2011) is shown in Table 24.
Table 24 : Irrigated area through minor irrigation sources (Area in '000 hectares)15
Source 2008-09 2009-10 2010-11 2011-12, upto
Sept.2011
Surface Canal (Minor) 29.21 17.59 23.00 48.84
Tanks (including Ahars and Pynes) 332.56 332.56 NA 22.20
Tube wells (Private and State) 2722.39 2726.6 2803.45 1715.00
Other Wells (Irrigation Wells) 145.79 145.79 145.79 NA
Other Sources (Lift Irrigation) and
Barge Lift Irrigation
24.36 16.74 15.50 4.98
Total 3254.31 3239.28 2987.74 1791.02
Around 20,938 traditional irrigation systems of Ahar-Pynes/irrigation ponds exist in the
state (Table 24). Out of these, around 3,255 are now defunct. These schemes are situated
14 Source: Water Resources Department, GoB 15 Source: Department of Minor Water Resources, GoB

State Action Plan on Climate Change (SAPCC)-Jan 2015
- 68 -
across 17 districts in south Bihar and they have existed for centuries. In a way, this is a
self-developed traditional system, based on water harvesting, with the purpose of storage
and distribution of the rainwater with wide potential of irrigation flood management and
ground water recharge.
Table 25 District-wise data on Ahar-Pynes/irrigation ponds16
Sl.
No. District
Number of Systems
Total Sl.
No. District
Number of Systems Total
Functional Defunct Functional Defunct
1 Patna 212 86 298 10 Jahanabad 501
2 Nalanda 238 82 320 11 Arwal 91 11 102
3 Bhojpur 93 31 124 12 Bhagalpur 472 50 522
4 Buxar 69 00 69 13 Banka 2146 117 2263
5 Kaimur 1330 71 1401 14 Munger 162 04 166
6 Rohtas 398 19 417 15 Jamui 2449 73 2522
7 Aurangabad 1251 442 1693 16 Lakhisarai 251 15 266
8 Gaya 6502 762 7264 17 Sheikhpura 125 26 151
9 Nawada 1488 1371 2859 Total 17683 3255 20938
7.2 Key Issues
The total flood affected area of the state is 68.80 lakh ha which is nearly 74 % of the total
geographical area of Bihar (94.16 lakh ha) and this is about one-sixth (17.2 %) of the total
flood prone area of India. Within the state, North Bihar is by far the worst affected by
floods. This is largely due to the fact that, upstream of the Indo-Nepal border, the bed slope
of all the rivers in north Bihar is very steep, but when they enter into Bihar, the land is
very flat.
On account of the sudden decrease in bed slope, the silt carried by these rivers along with
water flow is deposited into the beds of the respective rivers within the territory of North
Bihar. Besides the creation of new irrigation potential, the optimum utilization of
previously created irrigation potential is also necessary.
On account of sedimentation and damaged canal systems, full utilization of the created
irrigation potential is not possible in many areas. Restoration of lost irrigation potential
created before is not only economically more beneficial than creation of new irrigation
potential, but it is less time intensive as well. The reduction in irrigation efficiency in
Bihar’s medium and large irrigation systems is a cause for concern.
16ibid

State Action Plan on Climate Change (SAPCC)-Jan 2015
- 69 -
7.3 Priorities
Under the 12th FYP, the State proposes the several priority measures. Some of these are
outlined below:
Study of carrying capacity of the rivers, changes in drainage pattern and study of
carrying capacity of the rivers, changes in drainage pattern and wetlands of North
Bihar; management of deep aquifer particularly in arsenic prone area
Significant research on surface hydrologic and geochemical responses to climate
variability on intra-annual and multi-decadal time scales for ground water
resources management
Creation and restoration of irrigation potential of 30.362 Lakh hectares through
surface and ground water schemes;
Extensive renovation of surface irrigation schemes including Ahar/Pynes and
irrigation tanks;
Execution of surface irrigation schemes on priority basis in drought prone districts
of the state. Execution of community based/owned electric power operated
medium duty deep Tube wells in South Bihar and Sugar Cane areas;
Incentivize execution of private shallow tube-wells under BIGWIS especially in
north Bihar and non- hilly areas of south Bihar;
Restoration of old State Tube-well and lift irrigation schemes, which have lost their
useful lives;
Strengthening the mechanism of ground water monitoring;
Execution of artificial recharges schemes/water conservation schemes such as
check dams in ground water stressed areas;
Capacity building of engineers, officials, operational staff, beneficiaries,
contractors and WUAs by Organizing training programs, refresher courses and
workshops and hiring of technical personnel and services of experts for preparation
of DPR; and
Infrastructure development: construction of new field office premises,
establishment of quality control labs at headquarter as well as field levels,
strengthening of monitoring and evaluation wing, provision of third party
inspection facility, man power empowerment by upgrading them with latest
technology; and
During extensive renovation of traditional irrigation system such Ahar-Pyne and
irrigation tanks, the main conductor channels will be taken up first and the minor
conductors with command and less than 40 hectares will be renovated with
MGNREGA.

State Action Plan on Climate Change (SAPCC)-Jan 2015
- 70 -
As far drinking water supply is concerned, following goals will be set for achieving
the objective of providing safe, adequate, and sustainable drinking water supply to
all habitations
Ensure social equity in distribution of assets for drinking water so that SC/ST
population and other poor and weaker sections including minority communities are
covered fully;
Generation of base line data for various water resources related parameters for
validation and for future planning and development of infrastructure
Traditional adaptation strategies for recharge ground water by rainfall.
7.4 Perceived Climate Impacts
No in-depth climate vulnerability and risk analyses currently exist for the State. Climate
change can affect the hydrological regime changing water flows, precipitation levels,
evaporation, and snow cover/melt. These changes would in turn impact the communities
adversely as the pressure on natural resources and environment would compound; water
availability in the rivers will be affected; crop yields could decrease, therefore jeopardizing
food security; and leading to health concerns due to occurrence of extreme events such as
floods and droughts. While some regions would receive excess precipitation, there might
be reduction in other regions (adversely affecting arid and semi-arid areas); increased
evaporation; changes in runoff and available surface flow also causing changes in the
groundwater recharge.
The increase in rainfall due to climate change does not necessarily means an increase in
surface runoff as may be generally predicted. It may be observed that even though an
increase in precipitation is projected for the Ganga basins for the climate change scenario,
the corresponding total runoff for has not necessarily increased. Integrated water policies
will help to cope with variability in rainfall· and river flows at the basin level such as in
river basins in Bihar, few of which lies south of the Ganga are Karmnasa, Sone, Punpun,
Halohar, Kiul, Badua and Chandan and few basin lies to the north of the Ganga are
Gandak, Bagmati, Kamla, Balan, Kosi, Mahanand. Hydrological Treatment should be
done for basins to the north and south of Ganga separately.
Observed global warming has been linked to changes in the large-scale hydrological cycle
such as: increasing atmospheric water vapour content; changing precipitation patterns,
intensity and extremes; reduced snow cover and widespread melting of ice; and changes
in soil moisture and runoff. Precipitation changes show substantial spatial and inter-
decadal variability.
By the 2050s, the land area will be increasing to water stress due to climate change.
Increased precipitation intensity and variability are projected to increase the risks of
flooding and drought in many areas and will affect water quality and exacerbate many
forms of water pollution and finally will affect food availability, stability, access and
utilisation. Areas in which runoff is projected to decline face a clear reduction in the value

State Action Plan on Climate Change (SAPCC)-Jan 2015
- 71 -
of the services provided by water resources. Increased annual runoff in some areas is
projected to lead to increased total water supply.
No in-depth climate vulnerability and risk analyses currently exist for the State. Although,
Centre for Environmental Sciences, Central University of Bihar is conducting climate
modelling studies and its impact on water resources. The Climate Model Intercomparision
Phase 5 (CMIP5) simulated % change in soil moisture, evaporation and runoff for the
period of 2006-2050 with respect to 1961-2005 udder experiment of Representative
Concentration Pathway (RCP) 4.5 is shown in Figs.7.7a-c. Parts of Bihar is showing
significant decrease in soil moisture, increased evaporation and decreased runoff in future
time period of 2006-2050 with respect to 1961-2005.
Water availability: The gross per capita water availability in Bihar will decline from
about 1,950 m3/yr in 2001 to as low as about 1,170 m3/yr in 2050. Bihar will reach a state
of water stress before 2020 when the availability of clean water falls below 1000 m3 per
Probable impact of cumulative change on water resources include:
Increased drought like situation;
Increased flood events;
Effect on ground water quality;
Influence on ground water recharge;
Figure 15 Soil moisture, Evaporation and Runoff for the period of 2006-2050 with respect to 1961-
2005 under experiment of Representative Concentration Pathway (RCP) 4.5 in CMIP5 simulation
(Source: CUB, Patna)

State Action Plan on Climate Change (SAPCC)-Jan 2015
- 72 -
The atmospheric hydrological cycle is very likely [>90%] to be altered in
significant ways due to climate change as early a by 2020s also due to warmer
climate;
There is a general reduction in the quantity of available runoff under some
scenarios;
River basins such as Ganga are likely to experience seasonal or regular water
stressed conditions;
By 2050s fresh water availability in South Asia is projected to decrease; and
The rise of population will increase the demand for water leading to faster
withdrawal of water in turn would reduce the recharging time of the water table.
7.5 Strategies
The BAPCC recognises that scientific knowledge and evidence base on impacts of climate
change to the water sector is limited. As such, a comprehensive climate vulnerability
analysis will be taken up. As a complementary activity, a comprehensive water data base
in public domain and assessment of the impact of climate change on water resource
through the various agencies responsible for different aspects of water resources
management in the State will be developed, and updated and analysed on an on-going
basis. Strategies towards this will include:
Incentivize government officers undertaking research and development activities to
enhance in-house competence.
Review of network of hydrological observation stations and automatic weather
stations and automated rain gauge stations (using sensors)
Collection of necessary additional hydro-meteorological and hydrological data for
proper assessment of impact of climate change in the state including other
improvements required in hydrometric networks to appropriately address the issues
related to the climate change. Such data will include Hydrological and hydro-
meteorological data in low rainfall areas
Establishment/strengthening of ground water monitoring and geohydrology networks
Collection of data about river morphology for monitoring erosion and carrying
capacity,
Research on surface hydrologic and geochemical responses to climate variability on
intra-annual and multi-decadal time scales for ground water resources management;
Avenues to facilitate ground water recharge should be revived or introduced and
encouraged in future planning with special reference to urban expansion; Encourage
traditional rainwater harvesting practices for ground water recharge;
Strategies required to combat low wastewater discharge in view of water stress
conditions due to climate change in dense urban areas in future;
Review of the proposed interlinking of rivers in Bihar in context of climatic change
before implementation;
Other initiatives will include adoption/development of modern technology for
measurement of flow in rivers areas, developing inventory of wetlands, development of
water resources information system, and reassessment of basin wise water situation, apart
from projection of water resources availability as a result of impact of climate change
which would inter-alia include the likely changes in the characteristics of water availability
in time and space.

State Action Plan on Climate Change (SAPCC)-Jan 2015
- 73 -
Capacity development, education, and awareness are high priority agendas for the sector,
and as such, initiatives for this will be taken up including (but not limited to):
Interactive sessions with policy makers for sensitization.
Development and deployment of capacity building for professionals from various
departments/organizations associated with water resources development and
management including Panchayati Raj functionaries.
Promotion of do-it-yourself action by citizens through intensive social
communication,
Mass awareness programme including through school/college/university curriculum
development and deployment.
In view of above, appropriate measures for mitigation of the impact of climate change on
water resources, as also the adaptive measures are to be undertaken by various state
departments and agencies.
Certain issues are essentially required to be addressed adequately to make conducive
environment for state of the art R&D work for accurately predicting the climate change
scenarios and its implications in order to fix up the indicators for designing the effective
strategies to mitigate the climate change effectively on regional scales. For this, policy and
institutional framework and institutional strengthening of government
stakeholder/organizations concerning water resources need to be necessarily developed at
State and Central Level. Issues which have to be addressed mentioned here in under as:
Development of the infrastructure for smooth data sharing amongst water resources
stakeholders;
Long periodical database on drought and flood need to be procured and for that
capacity building need to be done;
Customization of climate change models / Regional Climate Models (RC!'1s) for
regional water basins for future predictions with especial emphasis on water stress
zones;
Procurement and development of digital elevation models especially for flood prone
areas;
Extensive application and promotion of remote sensing and satellite data based
technology for hydrological study purposes;
Comprehensive water data base accessibility in public domain;
Development of suitable techniques for efficient utilization of water including state
wise implementation of rain water harvesting, roof top harvesting, desalination,
checking over exploitation of ground water storage, canal networking, recycling,
basin-wise intra-linking of rivers on regional scale;
Inventory of wetlands especially those with unique features;
Study of change behaviour regarding the usage of water and addressing land use
pattern and improvement of catchment characteristics;
Promotion of the restoration and integration management of small scale hydraulic
infrastructure such as multiple use small scale dams, artificial lakes and improved
wells;

State Action Plan on Climate Change (SAPCC)-Jan 2015
- 74 -
Mapping of catchments, surveying, and assessing land use pattern with emphasis on
drainage, vegetation cover, silting, encroachment, human settlement, and human
activities and their impact on catchment and water bodies.
7.6 Institutional Linkages and Stakeholders
A range of institutional linkages, convergence potential, and partnerships is envisaged
with, indicatively, the State Agriculture Department, State Energy Department; BREDA;
Bihar Watershed Development Society; Central University of Bihar (CUB) and other
agencies as necessary for enhancing green cover or achieving the imperatives under the
BAPCC. Additional linkages with be built with National water research institutes/centres
and universities; various international development agencies, private sector and financial
institutions, civil society, community based organisations, and forestry and allied sector
dependent communities in general.
7.7 Linkages with the NAPCC
The initiatives outlined above are consistent with the NAPCC and National Water Mission.
Additionally, the strategies and imperatives under the forestry and biodiversity section of
the BAPCC also have linkages with the National Mission on Sustainable Agriculture,
National Mission for A Green India, National Mission for Enhanced Energy Efficiency,
and the National Mission on Strategic Knowledge on Climate; and the National Mission
on Sustainable Habitat.
7.8 Sectoral Action Plan and Budgets under the BAPCC
See Part C, Action Plans and Budgets

State Action Plan on Climate Change (SAPCC)-Jan 2015
- 75 -
8. Disaster Management
8.1 Overview, Characteristics and Status Due to its topographic and climatic conditions, Bihar is vulnerable to numerous hazards
on an almost on-going basis. The state faces flood, earthquake, drought, cyclones, heat
waves, and cold wave as well as recurrent fires in the villages during summer. 33% of the
State receives less than 750 mm rainfall, making Bihar chronically drought-prone. Bihar
accounts 16.5% of the flood-prone area. Further aggravating is the fact that more than half
the population of Bihar lives under potential risk of flooding during the annual monsoon.
Bihar is prone to floods and droughts.
Floods
North Bihar is a courtyard of Himalayan Rivers and the whole of South Bihar the backyard
of rivers flowing from south. Most of rivers namely Ghaghra, Gandak, Burhi Gandak,
Bagmati, Kamla, Adhwara group of rivers, Kosi and Mahanada have Himalayan origin
and have considerable portion of their catchment in the glacial region falling in Nepal and
Tibet. They receive very copious rainfall during monsoon when discharge of these rivers
is 50 to 90 times larger than fair weather flow. This causes frequent and large scale
flooding of North Bihar.
As such, 73.63% of the geographical area of North Bihar is considered to be prone to
floods. The southern part of Bihar, on the other hand, is drained by rivers that are largely
rain fed, having their origins either in the Vindhyachal Hills or in the Hills of Chotanagpur
and Rajmahal. These rivers are either dry or have scanty discharges in non-monsoon
months.
Karmanasa, Sone, Punpun, Kiul, Badua, Chandan are the important rivers of this region.
Falling between the Ganga and Indo-Nepal border, North Bihar has a general slope from
northwest to southeast. The geographical area of South Bihar has a general slope of south
to north. If the rivers of North Bihar, due to their large catchment area in the Himalayas,
cause floods in around 74% of its geographical area, then the rivers of South Bihar drain
their water of the tract and accumulate them behind the high southern Bank of the Ganges
which has resulted in the formation of a number of tals viz, Fatuha Tal, Bhaktiyarpur Tal,
Barh Tal, More Tal, Mokamah Tal, Barahiya Tal and Singhual Tal. These tals also receive
backwater of the Ganges when it is in high spate. These tals, therefore, get submerged
during monsoon and affect the kharif cultivation in most of the area. The area, thus,
affected by tals is around 36 % of the total South Bihar area. Thus, the total geographical
area affected by flood, water logging in tals etc. amount to 56 % of the total geographical
area of Bihar. Floods in large parts of the plains of Bihar, especially North Bihar, are
recurring features and cause havoc destroying crops and the quality of land and threatening
the conditions of life and livestock due to large-scale displacement.
Every year, almost 28 districts get flooded causing huge loss of property, lives, farmlands,
and infrastructure. Out of these the area of Sitamarhi, Supaul and Kishanganj are 90%
affected by flood, five districts- Bhagalpur, Darbhanga, Khagaria, Madhepura, Saharsa get
around 70% affected and in the rest of the districts, the flood-affected areas vary from 55%
to 25%. In all 56% of the total area of Bihar is affected by flood.

State Action Plan on Climate Change (SAPCC)-Jan 2015
- 76 -
Figure 16 Flood vulnerability zone-wise
Figure 17 Flood prone districts of Bihar
A study of the flood stages in various river systems revealed that early flood takes place
during the month of May-June in River Bagmati, Kosi, and Kamla. Thereafter, flood
generally comes in River Burhi Gandak in the month of mid July. During these months
River Ganga generally remains low but by September, the master drain, the Ganges, also
rises making the flood -problem very acute. Thus, from the month of May to September,
for five months, Bihar has to suffer through the ravages of floods of one kind or another,
the impact of which was perhaps not felt to the same extent in the past as is felt now. It is
so because of the ever-increasing encroachments on the flood plains by the growing
population to meet its requirements of food and fibre.

State Action Plan on Climate Change (SAPCC)-Jan 2015
- 77 -
Drought
Apart from deficiency in rainfall prime reasons of recurring drought in Bihar is the nature
of soil with low mineral and humus-contents besides extremely poor water holding
capacity. Recurrent rainfall variability and sustained departure from the normal rainfall
vis-a-vis low reliability, fluctuating both surface and underground water resources and
extremely poor water holding capacity of the major soil group appear to have clubbed
together to cause frequent droughts in Bihar. Besides, there is a relationship between
reducing forestland and the increasing rainfall variability and the phenomenon is well
manifested in Bihar scenario of recurrent droughts.
Figure 19 Summer Monsoon Rainfall (June-Sept) in Bihar (1872-2010) (Source: CUB, Patna)
Recent years show more meteorological drought years in Bihar. It seems that frequency
in increasing.
Figure 19 Summer Monsoon Rainfall Bihar
% D
epar
ture
fro
m N
orm
al
Figure 18 Frequency of surface water deficit in Bihar (Source: CUB, Patna)

State Action Plan on Climate Change (SAPCC)-Jan 2015
- 78 -
Cyclonic Storms (High Speed Winds)
Among the natural hazards of the surface cyclones (High Speed Winds) are by far the most
devastating both by causing loss of life as well as loss in terms of socio-economic
development. The only saving grace is that its formation can be watched right from the
depression development to landfall stage. 27 districts in Bihar are fully affected by high-
speed winds of 47 m/s intensity. The area of districts—Banka, Jahanabad, Arwal, and
Nalanda is nearly 90% affected. Other districts of South Bihar except Nawada are partly
affected by high-speed winds of 44 m/s. Nawada is, however, 100 % affected by high-
speed winds of this intensity. In all 86 % of the total area of Bihar is prone to high-speed
winds of 47 m/s intensity and only 14% of the area prone to high-speed winds of lesser
intensity.
Figure 20 Cyclonic Storms vulnerability zone-wise
8.2 Key Issues
Key issues relating to disasters in the State include the recurring nature of the main event
categories – floods and droughts. The Kosi River is the main cause of recurrent floods in
north Bihar. The river runs through a steep gradient in Nepal. Rainfall in the Kosi
catchment in Nepal overloads the barrage compelling release from the Barrage, which
causes floods and waterlogging in north Bihar. The heavy discharge from the Barrage
causes downstream Bagmati, Burhi Gandak, and Ganga rivers to inundate. In addition, the
discharge carries enormous amounts of sandy silt that gets deposited over arable land and
renders it fallow. Additionally, disasters, as and when they occur, are exacerbated by a
number of factors; some of these include:
High population decadal growth rate;
Illiteracy in general and Female illiteracy in particular, and therefore, low
awareness levels;

State Action Plan on Climate Change (SAPCC)-Jan 2015
- 79 -
Low per capita income;
Rural roads in poor condition;
Scarce health infrastructure;
Sand casting and changes in land use due to sand casting;
Lack of adequate tree/green cover and resultant soil erosion;
Debris disposal;
Damage to water management resources;
Damage to plantations;
Increasing salinity due to poor drainage;
Pressure on environmental resources in areas receiving the out-migration; and
Environmental degradation due to pollution caused by reconstruction
8.3 Priorities
Key priorities for the State will include:
Continuous on-going efforts at tracking and disaster risk indicators and developing
improved early warning systems;
Developing and putting in place strategies and action programmes for disaster
vulnerability reduction;
Extensive information, education and communication campaigns for the public in
general, and specific communications in high risk zones;
Improving inter-departmental coordination and communications for improved risk
management and disaster response;
Seamless integration of state disaster management machinery with other key
stakeholders such as other developmental agencies and civil society for extended
capability in all aspects of risk management and disaster response;
Provision of all necessary equipment and infrastructure for speedy and efficient
responses to disasters including search and rescue, relief measures, and
rehabilitation/reconstruction;
Upgradation and retrofitting of key infrastructure assets in risk-prone zones/areas;
and
Systematic implementation of the State Disaster Management Plan in all its
aspects.
Proper waste management practices, particularly biomedical waste management to
improve health and laying scenario.
State Action Plan on Climate Change (SAPCC)-Jan 2015
- 80 -
8.4 Perceived Climate Impacts
No in-depth climate related vulnerability and risk analyses currently exist for the State,
apart from the detailing already done in the Draft State Disaster Management. It is
anticipated that such an in-depth vulnerability and risk analyses will be carried out as part
of the larger overarching State strategies under the BAPCC.
However, it is expected that even without taking climate change into account, disaster risk
will continue to increase, as more vulnerable people and assets are exposed to weather
extremes. Available evidence seems to suggest that that climate change has changed the
magnitude and frequency of some extreme weather and climate events. In the next two or
three decades, the expected increase in climate extremes will probably be relatively small
compared to the normal year-to-year variations in such extremes.
As climate change impacts become more dramatic, its effect on a range of climate
extremes will become increasingly important and will play a more significant role in
disaster impacts. However, it is also expected that even minor variations in existing climate
extremes can exacerbate the challenges that the State, its different sectors, and its people
face.
Past and Future scenarios of cyclonic storms
Past data show that cyclonic storms track is not covering Bihar and future projected
cyclonic storms in Bay of Bengal (BoB) during 2071-2100 under A2 scenario would also
not cover Bihar. Since the size of projected storms in BoB would be relatively larger, and
more intense, therefore Bihar may experience more cloudy, windy conditions and intense
rainfall.
8.5 Strategies
The overall approach to disaster management in the face of climate change under the
BAPCC will be to seek closer integration of disaster risk management and climate change
adaptation, along with the incorporation of both into state, district, and local planning and
practices. It is anticipated that a multi-hazards approach will be used to planning and action
for disasters and will address social welfare, quality of life, infrastructure, and livelihoods,
and other aspects for managing disaster risk in the short term, and facilitating adaptation
to climate extremes in the longer term.
Towards improving governance mechanisms, institutional decision making and
convergence, specific mechanisms seamless coordination on an on-going basis will be
established between the State Disaster Management Department, State Disaster
Management Authority, and various sectoral line departments.
The following initiatives will be undertaken for improving scientific knowledge and
evidence base and understanding of climate change and its impacts:
State Action Plan on Climate Change (SAPCC)-Jan 2015
- 81 -
Studies of recent changes in climate parameters and associated disaster related
impacts: These studies will be undertaken in collaboration with one or more centres/
of excellence/universities/institutes for climate research in India; on-going
programmes of collaboration will be established with such centres for continued
scientific analyses and evidence base inputs to the State’s disaster management
planning and practice;
Documentation of adaptation strategies of the masses: Various adaptation strategies
and traditional being used by the masses to ward off or minimise the climate change
related impacts will be documented. This would ensure intellectual property rights
protection to the same where applicable;
Land use/land cover change in the previous decade: Temporal satellite data will be
utilized to assess the changes in the land use/land cover pattern; and
Monitoring of various climate parameters: A series of automatic weather stations will
be installed at critical location in the high reaches of the state so as to monitor the
changes in various climate parameters.
Assessment of the socio-economic vulnerability masses in various remote locations of
the state with particular emphasis upon gender, class, caste, ethnicity, physical ability,
community structure, existing decision-making processes and the other local factors;
In the absence of any authentic study, as on date both the magnitude of the problem
related to migration and its impact is ill quantified. Data collection and compilation
work on population movements (migration) across the region; primary and secondary
data is proposed to be compiled at the regional level; and the impact of migration on
poverty alleviation;
Documentation of best practices for livelihood and adaptation strategies and promotion
of the same through various modes including policy interventions;
A study on migration and its possible impacts (considering that there is significant
migration within the State);
Gender based studies to identify the role of women as first and most responsible
responder in disasters and train the women leaders. Study would also understand the
impact of the increase in predominantly women-headed households in the mountains;
Gender mainstreaming and gender-sensitive approaches in regions affected by food
shortages and decreased agricultural production based on approaches and methods
developed by traditional knowledge; and
Trainings on livelihood options including small scale business, animal husbandry and
agriculture with focus on adaptation and coping mechanism.
The following activities are planned for education and awareness on this important issue.
i. School curriculum: Disaster management has already been included in the school
curriculum. Appropriate material would subsequently be developed for on various

State Action Plan on Climate Change (SAPCC)-Jan 2015
- 82 -
climate change related issues and the same will be introduced in the school
curriculum.
ii. School awareness program: Awareness programs will be organized by the
Department for school children. Climate change will be included in these programs
and these will be made a regular feature in all the schools of the state.
iii. Awareness program for officials: It is urgently necessary to sensitize the
government officials on this important issue. The Department will regularly
organize sensitization programs for government officials at state, district and tehsil
/ block level. Various key issues related to climate change will be included in these
training programs.
iv. Training program for vulnerability assessment and risk reduction: For better
appreciation of vulnerability and risk assessment reports as also for undertaking
these exercises on their own special training programs will be organized for the
representatives of various sectors.
The following initiatives will be taken up to build adaptive resilience and reduce
vulnerability across communities and sectors:
i. Capacity building for effective planning: Planning is the key to mitigating effects
of various climate induced contingencies. Various stakeholders from amongst the
community as also from various sectors will be trained in assessing their
vulnerabilities and to prepare plans in the light of the various contingencies that
they might face;
ii. Planning for government infrastructure: The entire public infrastructure will be
mapped under GIS environment and the climate vulnerability of the same will be
assessed. This would help in developing adaptive climate disaster resilience plans,
including retrofitting where required;
iii. Preparation of disaster management plan for all major reservoirs in the state: In
the case of extreme precipitation events in the catchment of major reservoirs the
possibility of flash floods in the downstream areas cannot be ruled out. Various
possibilities have therefore to be simulated and based upon these appropriate plans
have to be developed for tackling these situations.
iv. Raising quick response teams at grassroots level: In case of any disaster situations
the people at the grassroots level are the first responders and in most events
response activities are over before the arrival of formal responders on the scene. It
is therefore critically important to raise quick response teams at the grassroots
level. These will be raised in every village so as to effectively manage any
contingency. Certified training in search and rescue and first aid will be imparted
to selected volunteers.
v. Vulnerability assessment of all lifeline structures in the state: Vulnerability of all
the lifeline structures will be assessed out and this would help the respective sectors
to undertake appropriate measures for vulnerability reduction.

State Action Plan on Climate Change (SAPCC)-Jan 2015
- 83 -
vi. Retrofitting of lifeline infrastructure: After assessing vulnerability of the
infrastructure the beneficiaries will be asked to undertake retrofitting of their
infrastructure.
vii. Relocation of critical infrastructure: The infrastructure and critical facilities
falling in identified high-risk zone will be advised to relocate their infrastructure.
This would at the same time act as a disincentive for infrastructure development in
the high-risk zone.
viii. Promoting green and disaster resilient construction technologies: Certified
training programs will be organized for the engineers of the various engineering
departments for promoting green and disaster resilient construction technologies.
ix. Assessment of urban vulnerability particularly in case of extreme precipitation
events: Major urban agglomerations of the state having population of more than
one lakh will be undertaken under this program.
x. Vulnerability assessment of all industrial units in the state: Vulnerability of all
the industrial units will be carried out and this would help the individual agencies
in undertaking appropriate measures for vulnerability reduction.
xi. Simulation of extreme precipitation scenario in major river basins of the state
and planning for the same: Extreme precipitation in the downstream areas. It is
therefore important to simulate various scenarios and accordingly plan for
effectively managing these contingencies.
xii. Review of various techno-legal regimes: The techno-legal regime has an
important bearing in reducing risk of disasters. Various techno-legal provisions
would therefore be reviewed and appropriate amendments in the same will be
suggested.
xiii. Promotion of risk transfer mechanisms: Risk transfer is increasingly being seen
as an important tool for reducing the burden of disasters upon public exchequer.
Various risk transfer instruments would therefore be developed and the same will
be promoted through various modes.
A robust monitoring framework will be put into place, and both financial and physical
monitoring of the various activities will be resorted to. Besides in house monitoring
independent third party monitoring will be undertaken.
Possibilities will be explored for collaboration with private and cooperate sectors. Special
emphasis will be laid for collaboration in the following sectors:
a) Housing and infrastructure, health, and education -- safe housing is the most
important aspect as far as disaster management and housing is concerned.
Promotion of earthquake safe construction technology will be targeted through
training of engineers, architects and masons working in private housing projects;
b) Advocate and convince the private sector in disaster prevention in reconstruction
and rehabilitation;
c) Mobilizing private sector resources for investment in various disaster prevention
measures;
d) Explore the opportunities for risk reduction in the design and construction of new

State Action Plan on Climate Change (SAPCC)-Jan 2015
- 84 -
systems and those available for risk reduction in the retrofitting of existing life line
structures like hospitals, schools and other important buildings;
e) Study on the social and economic consequences of critical infrastructure failure
from various disasters and approaches to estimation of direct and indirect losses
from infrastructure service failure with emphasis on the comparison of expected
scale and distribution of losses related to infrastructure failure with the costs of
strengthening and other strategies for risk reduction; and
f) Many infrastructure systems are owned and managed by private sector therefore
opportunities will be explored for promoting standards of design, construction,
maintenance and operation as routine practice.
Civil society has an important role to play in bringing forth awareness amongst the masses
and in propagating green technologies. The Department will work in close collaboration
of various civil society organisations. Initiatives under the BAPCC will include:
a) Civil society organisations will be approached as bridge between the centre and
the people;
b) Information and data of the civil society will be used and further research will be
done through or with the help of these organizations;
c) Advocacy programmes will be conducted through local NGOs; and
d) For knowledge sharing
8.6 Institutional Linkages and Stakeholders
Considering the nature of climate change and disasters, a wide range of institutional
linkages, convergence potential, and partnerships is envisaged between the State Disaster
Management Department, State Disaster Management Authority, all sectoral line
departments, and sub-state administrative/sectoral units, apart from linkages with
academia, civil society, international development agencies, private sector and financial
institutions, and communities in general.
8.7 Linkages with the NAPCC
As is the case with institutional linkages and stakeholders, considering that climate change
and disasters as well as their impacts cut across virtually all sectors, the initiatives outlined
above are consistent with the NAPCC and all the National Missions under it.
8.8 Sectoral Action Plan and Budgets under the BAPCC
Details are given in Part C
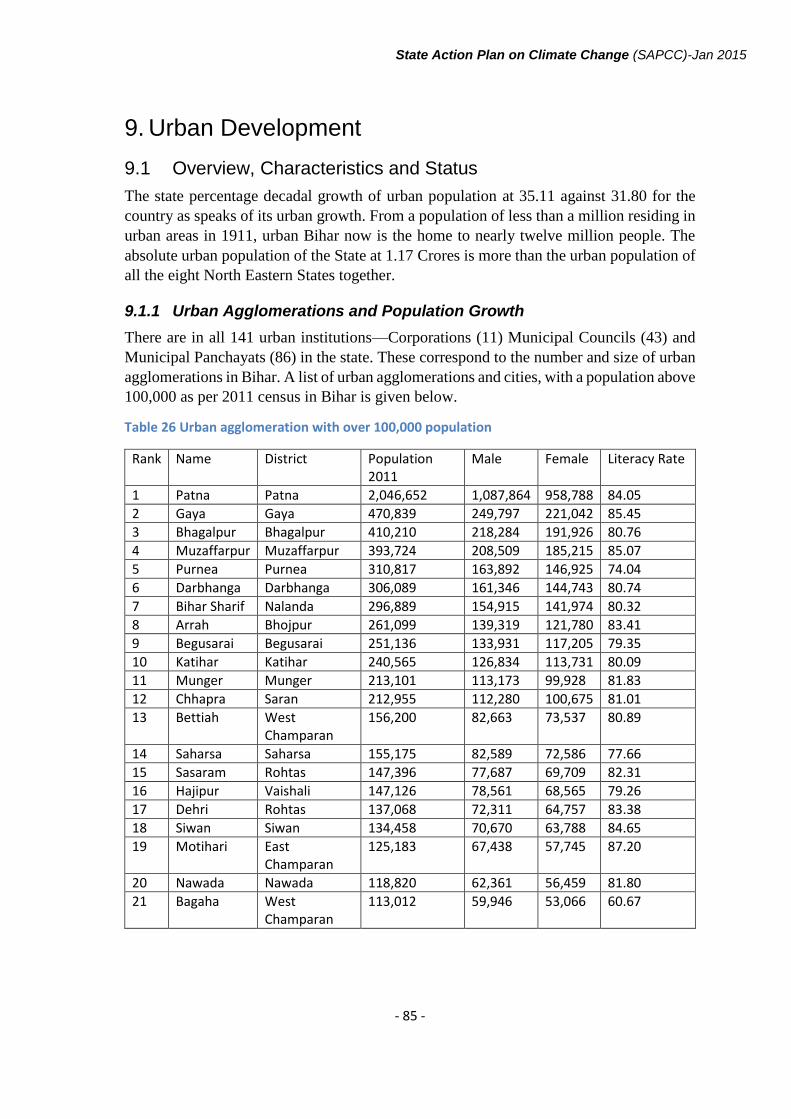
State Action Plan on Climate Change (SAPCC)-Jan 2015
- 85 -
9. Urban Development
9.1 Overview, Characteristics and Status
The state percentage decadal growth of urban population at 35.11 against 31.80 for the
country as speaks of its urban growth. From a population of less than a million residing in
urban areas in 1911, urban Bihar now is the home to nearly twelve million people. The
absolute urban population of the State at 1.17 Crores is more than the urban population of
all the eight North Eastern States together.
9.1.1 Urban Agglomerations and Population Growth
There are in all 141 urban institutions—Corporations (11) Municipal Councils (43) and
Municipal Panchayats (86) in the state. These correspond to the number and size of urban
agglomerations in Bihar. A list of urban agglomerations and cities, with a population above
100,000 as per 2011 census in Bihar is given below.
Table 26 Urban agglomeration with over 100,000 population
Rank Name District Population 2011
Male Female Literacy Rate
1 Patna Patna 2,046,652 1,087,864 958,788 84.05
2 Gaya Gaya 470,839 249,797 221,042 85.45
3 Bhagalpur Bhagalpur 410,210 218,284 191,926 80.76
4 Muzaffarpur Muzaffarpur 393,724 208,509 185,215 85.07
5 Purnea Purnea 310,817 163,892 146,925 74.04
6 Darbhanga Darbhanga 306,089 161,346 144,743 80.74
7 Bihar Sharif Nalanda 296,889 154,915 141,974 80.32
8 Arrah Bhojpur 261,099 139,319 121,780 83.41
9 Begusarai Begusarai 251,136 133,931 117,205 79.35
10 Katihar Katihar 240,565 126,834 113,731 80.09
11 Munger Munger 213,101 113,173 99,928 81.83
12 Chhapra Saran 212,955 112,280 100,675 81.01
13 Bettiah West Champaran
156,200 82,663 73,537 80.89
14 Saharsa Saharsa 155,175 82,589 72,586 77.66
15 Sasaram Rohtas 147,396 77,687 69,709 82.31
16 Hajipur Vaishali 147,126 78,561 68,565 79.26
17 Dehri Rohtas 137,068 72,311 64,757 83.38
18 Siwan Siwan 134,458 70,670 63,788 84.65
19 Motihari East Champaran
125,183 67,438 57,745 87.20
20 Nawada Nawada 118,820 62,361 56,459 81.80
21 Bagaha West Champaran
113,012 59,946 53,066 60.67

State Action Plan on Climate Change (SAPCC)-Jan 2015
- 86 -
9.1.2 Urban Infrastructure and Services
Levels of urban service in 24 selected towns of Bihar in comparison to national
standards/average are given below.
Table 27 Level of urban service - Bihar in comparison with national standard, national average and 24 town average
24 Towns Water Supply Sewerage Solid
Waste
Drainage
Wat
er S
upply
Cover
age
Per
Cap
ita
Supply
of
Wat
er (
MO
UD
SL
B)
Tota
l W
ater
Suppli
ed i
nto
Dis
trib
uti
on/
Popula
tion i
n C
over
age
Are
a
Hours
per
day
supply
in c
over
age
area
s
Num
ber
met
ered
conn
ecti
ons
Sew
erag
e C
over
age
Popula
tion
wit
h T
oil
ets
Popula
tion C
over
ed
Dis
posa
l to
lan
dfi
lls
Cover
age
of
sto
rm w
ater
dra
inag
e
net
work
Aggre
gat
e num
ber
of
wat
er l
oggin
g
inci
den
ts r
eport
ed i
n a
yea
r
Units % Lpcd lpcd hrs % % % % % % unit
National
Standard
100 135 24 100 100 100 100 100 100 0
National
Average
81 123 4 25 28 82 51 2 53
24 Town
Average
49 28 56 7 0 0 72 46 0 32 9
1 Arrah 70 56 80 8 0 0 90 28 0 70 12
2 Bagaha 50 15 0 12
3 Begusarai 60 20 33 4 0 0 90 67 0 65 15
4 Bettiah 30 10 33 5 0 0 90 43 0 20 8
5 Bhagalpur 81 57 70 5 0 0 58 60 0 70 0
6 Bihar Sharif 80 46 57 8 0 0 90 28 0 60 12
7 Chapra 70 34 48 5 0 0 50 28 0 60 10

State Action Plan on Climate Change (SAPCC)-Jan 2015
- 87 -
24 Towns Water Supply Sewerage Solid
Waste
Drainage
Wat
er S
upply
Cover
age
Per
Cap
ita
Supply
of
Wat
er (
MO
UD
SL
B)
Tota
l W
ater
Suppli
ed i
nto
Dis
trib
uti
on/
Popula
tion i
n C
over
age
Are
a
Hours
per
day
supply
in c
over
age
area
s
Num
ber
met
ered
conn
ecti
ons
Sew
erag
e C
over
age
Popula
tion w
ith T
oil
ets
Popula
tion C
over
ed
Dis
posa
l to
lan
dfi
lls
Cover
age
of
sto
rm w
ater
dra
inag
e
net
work
Aggre
gat
e num
ber
of
wat
er l
oggin
g
inci
den
ts r
eport
ed i
n a
yea
r
8 Danapur
Nizamat
80 69 86 12 0 0 80 46 0 0 9
9 Darbhanga 36 28 78 12 0 0 70 70 0 37 0
10 Dehri 60 12 19 4 0 0 80 53 0 50 11
11 Gaya 82 29 35 5 0 0 53 70 0 47 0
12 Hazipur
13 Jamalpur 0 90 78 0 0 8
14 Katihar 45 3 7 6 0 0 90 41 0 40 10
15 Kishanganj 20 9 45 8 0 0 90 60 0 40 7
16 Motihari 40 48 120 6 0 0 80 73 0 15 8
17 Munger 75 0 0 8 0 0 90 41 0 0 12
18 Muzaffarpur 30 76 253 11 0 0 0 60 0 86 0
19 Nawada 40 27 68 8 0 0 97 60 0 20 12
20 Patna 95 102 107 16 0 46 82 75 0 60 8
21 Purnea 40 4 10 8 0 0 84 42 0 15 15
22 Saharsa 24 6 25 6 0 0 93 28 0 15 8
23 Sasaram 40 6 0 0 67 10 0 0 12
24 Siwan 80 29 36 6 0 0 74 31 0 0 15

State Action Plan on Climate Change (SAPCC)-Jan 2015
- 88 -
(A) Water Supply: The water supply situation in Bihar is highly critical for per capita
supply of water and hours of supply of water for most towns with the exception of Patna,
Muzaffarpur, and Danapur Nizamat. For water supply coverage-the situation is highly
critical for about half the towns-mainly the towns with smaller populations further from
the capital Patna.
Town suffering particularly badly from a lack of water supply are lack of water supply are
Bettiah, Darbhanga, Katihar, Kishanganj, Motihari, Muzaffarpur, Nawada, Purnea,
Saharsa and Sasaram. In particular, Bettiah ,Darbhanga, Kishanganj,and Saharsa show
very poor water supply service for all three parameters. In many town of Bihar the
groundwater resources, which have been the most common water supply source in the
past, are generally insufficient to meet the Ministry of Urban Development standard of per
capita requirement of 135 lpcd.
There has been a lack of investment for new Water Treatment Plants and water supply
pipelines-but the fact that many surface water sources are further away from the town adds
to the cost of improving the water supply network. There is a lack of water meters so it is
difficult to charge commercial and high users of water, and also no incentive to stop people
wasting water. An improvement in accounting practices in urban local bodies (ULBs) is
required so that water consumers can be identified, and the introduction of billing to ensure
that revenue is obtained for the water service delivered.
(B) Sewerage: The Bihar sewerage subsector is lagging substantially behind the national
standard and national average. In Bihar there are very few towns with modern sewerage
systems with the exception of town along the Ganga River like Patna and Bhagalpur. These
towns have benefited from specific investments in sewerage infrastructure provided under
the National Ganga Action Plan 1985-2000.The initiation of improved sewage disposal
and sanitation facilities throughout Bihar has a very high priority. Whilst most town are
low to moderate critical for toilet coverage, the disposal of toilet wastes to septic tanks are
directly to drains and ditches needs to be addressed.
The issues affecting sewerage are similar to those affecting water supply but the sewerage
system issues are more serious that water supply issues. Implementation of sewerage
systems in Bihar lags far behind the National Standard and even the National average 28
percent-which itself is low for India by comparison with international standards. The
issues are lack of Town Sewerage Master Plan, inadequate water supply, intermittent and
unreliable power supply for sewage pump stations and powering sewage treatment plants
(STPs), lack of investment in sewerage infrastructure.
(C) Solid Waste Management: About half of the towns in Bihar are highly critical for
solid waste collection. Nevertheless the widespread practice of disposing of garbage along
the roadside or just beyond town limits represents a serious health risk to communities
from vermin and flies as well as being unsightly and offensive.
The issues affecting solid waste management are lack of Solid Waste Master Plans, no
landfill site identified, lack of investment in solid waste management, inadequate capital
and O&M budget for garbage disposal, garbage which is collected is disposed of
indiscriminately at the side of the road or at town boundaries (e.g. Gaya), effect on the
State Action Plan on Climate Change (SAPCC)-Jan 2015
- 89 -
environment and public health effects of indiscriminate garbage disposal and lack of
trained staff. Non availability of land for processing & disposal of waste is the major issue.
(D) Drainage: For drainage the situation in Bihar is highly critical for storm water
drainage coverage for 75 % of towns with the exception of Patna, Muzaffarpur, Bhagalpur,
Arrah and Begusarai. The issues affecting drainage are lack of Drainage Master Plans,
limited capacity of city storm water drainage channels ,periodic and serious town flooding
due to monsoon, use of open drains for disposal of sewerage and toilet wastes, lack of
storm water pump stations to clear flooding from monsoon rains, lack of investment in
drainage infrastructure,inadequate capital & O&M budget for drainage management,
effect on the environment and public health effects of flooding and use of drains and
ditches for sanitation and lack of trained staff.
9.2 Keys Issues
The State’s urban development sector faces a number of key challenges. With growing
urban populations across all the cities and towns, the existing infrastructure and services
deficit is only likely to widen further increasing the risk to these agglomerations unless
urgent steps are taken. The institutions responsible for providing the civic amenities are
themselves starved of resources; while reform measures are underway, the financial health
of urban local bodies in the state is a cause of concern. Further, urban roads congestion
and traffic management are major problems in most cities and towns. Urban Local Bodies
(ULBs) lack skilled manpower for O&M of infrastructure.
9.3 Priorities
Building up of a comprehensive and consistent municipal database- a well –
structured uniform needs to be prepared to compile urban datum and update it
periodical across all the ULBs.
Mapping of municipal areas by geographical information system (GIS).
Promoting energy efficiency and appropriate use of solar energy is going to be
promoted in street lighting.
Emphasis will be given to ‘greening’ the towns.
For improving storm and wastewater management, the UDD will, in co-ordination
with other relevant departments, examine the existing drainage and wastewater
handling situation in all the cities and towns and develop appropriate plans.
Provision of rainwater harvesting tanks in all ULB buildings and new constructions
in municipal limits will be taken up. The concept of ‘Green Buildings’ will be
promoted in both the public and private sectors to save energy, water, and
reduce/recycle waste.
For disaster preparedness and mitigation, an extensive screening of buildings will
be done across the urban settlements; retrofitting or reconstruction will be carried
out by modifying the Building Byelaws.

State Action Plan on Climate Change (SAPCC)-Jan 2015
- 90 -
ULBs would plan for the convergence of all government programs being / to be
implemented within their jurisdiction in consultation with the District Collector by
synergizing the efforts of all stake holder till the activation of DPC.
Disposal of rejects from processing Municipal Solid Waste from cluster of towns
on Regional Landfill will be encouraged. 14 Regional Landfill sites have already
been identified to cover 104 towns.
Piped water supply to households through metering will be planned. The soft path
water demand management in residential cluster may include three water demand
management in techniques- economic, structural, and operational, and socio
political. Although a minimum/ subsidized domestic tariff for lifeline consumption
up to a modest quantity will be levied, telescopic tariff will be followed for
consumption beyond lifeline supply and up to a limit. Linking of tariff with
variations in cost of energy and raw water quality should guide the fixation of tariff.
PPP approach will be adopted wherever feasible from water treatment down to
water billing and collection.
Natural water bodies/ wetlands and natural waterways (other than rivers) will be
protected through a detailed rehabilitation plan for discharging treated sewage
water into them.
Planned Dhobi Ghats & Community Toilets/ Public Toilets in 20 towns settled
along the river Ganga will be constructed. Detailed Project Reports are under
preparation. DPRs for River Front Development in 8 towns are under preparation.
The UDD will develop and deploy a range of awareness and capacity-building
programmes for municipal officials for promoting appropriate measures towards
climate resilience in their respective ULBs, as also similar programmes for
building awareness about climate change and its impacts for urban populations.
9.4 Perceived Climate Impacts
The concentration of urban population in a few large cities has led to tremendous pressure
on civic infrastructure systems like water supply, sewerage and drainage, solid waste
management, parks and open spaces, transport, etc. In several cities, the problems of traffic
congestion, pollution, poverty, slums, crime and social unrest are assuming alarming
proportions. Climate change is likely to exacerbate the existing stresses that these
settlements already face.
Climate change is likely to affect infrastructure related to water, sanitation, energy,
transportation, health- care, fire services, and other forms of emergency measures. Climate
change could affect water supply systems in any number of ways. It can affect the water
demand for drinking and cooling systems. Where climate change leads to failure of small
local water sources such as wells, it could lead to greater demand for regional water
supplies. Changes in precipitation patterns could lead to greater demand for regional water
supplies and reduction in water availability and fall in water tables. A change in water
availability and supply also affects sewer sanitation and drainage systems. Further, sewage
treatment plants are vulnerable to floods, as these are often located near rivers or water

State Action Plan on Climate Change (SAPCC)-Jan 2015
- 91 -
bodies. Storm water drainage systems could become frequently overloaded and cause
flooding if heavy storms become more frequent due to climate change. The urban-heat
island effects could get exacerbated due to increase in baseline temperatures, affecting
climate comfort of the urban populations and may consequently lead to additional costs in
climate control.
The vulnerability of human populations varies with economic, social, and institutional
conditions. The poor and the marginalized have little capacity to adapt to changes in
climate by adopting such mechanisms as air-conditioning or heating. The traditional
coping mechanisms of these vulnerable communities may be over stretched due to
additional stresses related to climate change. Climate change threatens the homes,
livelihoods, and health of the urban poor. When disasters strike, their homes may be
damaged or destroyed and they may be unable to travel to work causing them to lose
money for food and other basic needs. Poor people often live in informal settlements on
land, which is susceptible to climate change- flood plains, lowlands, or unstable hillsides.
Drains and culverts are frequently blocked with rubbish. Slum dwellers often lack secure
tenure, proper shelter, water, sanitation, electricity and other services. Most have no
insurance.
9.5 Strategies
To exploit the potential for mitigating climate change through reduction in demand
for energy in the residential and commercial sectors by adopting various energy
efficiency and conservation measures. Energy efficient street lights with LED
lamps will be installed in 11 corporation towns. Rs.24 Crore for energy efficient
LED street lights has already been allotted to BUIDCo for implementation. With
respect to adaptation, the aim would be to promote greater use of renewable
sources and to reduce dependence on a single source. In formulating climate
change strategies, mitigation efforts need to be balanced with those aimed at
adaptation;
To promote energy efficiency and appropriate use of solar energy is going to be
promoted in street lighting. Solar water heating will be encouraged through Bihar
Renewable Energy Development Agency (BREDA).
Taking appropriate action with respect to the transport sector such as evolving land
use and transportation plans, achieving a modal shift from private to public mode
of transportation, encouraging the use of non- motorized transport, improving fuel
efficiency, and encouraging use of alternate fuels, etc. To evolve strategies for
adaptation in terms of realignment and relocation, design standards and planning
for roads, rail and other infrastructure to cope with warming and climate change;
To facilitate adoption of technologies and research and development which lead
to energy efficiency and reduction in emissions;
Emphasis will be given to ‘greening ‘ the towns, and plans will be developed and
implemented for increasing the available green cover in the cities and towns in the
State. Provision of rainwater harvesting tanks in all ULB buildings and new
constructions in municipal limits will be taken up.

State Action Plan on Climate Change (SAPCC)-Jan 2015
- 92 -
Establishment of official or informal energy building codes that reflect the “ state
of the art” in energy efficiency
Energy efficient housing;
Water supply augmentation and efficiency improvements;
Door –to- door collection of municipal and household solid waste, secondary
storage, development of transfer station & transportation, treatment and
processing; and disposal, including development of sanitary landfill; integrated
municipal solid waste management systems ( with combination of above)
Waste water collection, handling, treatment, and disposal including storm water
drainage, sewerage systems including treatment plants, decentralized waste water
treatment units, sewerage gas based power generation etc.;
Establish Partnerships for green transportation.
To promote patterns of urban growth and sustainable urban development that help
secure the fullest possible use of sustainable transport for moving freight, public
transport, and encourage cycling and walking; thereby reducing the need to travel,
especially by car;
To conserve the natural resources that are the key to sustainability of human
habitats like water vulnerability consistent with social cohesion and inclusion;
To conserve the natural resources that are the key to sustainability of human habits
like water , clean air, flora and fauna, recognizing the integrated nature of human
and other systems;
To reflect the development needs and interests of communities that are especially
vulnerable to climate change;
To encourage competitiveness and technological innovation in mitigating and
adapting to climate change;
To develop a transparent, flexible, predictable, efficient, and effective planning
system that will produce the quality development needed to deliver sustainable
development and secure sustainable communities. National policies and regional
and local development plans provide the framework for planning for sustainable
development and for that development to be managed effectively;
To encourage community involvement in ensuring more sustainable patterns of
development;
To bring together key stakeholders at the central, state, district and local levels for
a coordinated and comprehensive response to vulnerabilities arising out of climate
change; and
To promote and strengthen efforts aimedat generating awareness related to climate
change.

State Action Plan on Climate Change (SAPCC)-Jan 2015
- 93 -
9.6 Institutional Linkages and Stakeholders
A range of institutional linkages and partnership is envisaged, including with the Water
Resource Department, the Energy Department, BREDA, Disaster Management
Department, BUIDCO, the Transport Department, ULBs as well as apart from linkages
with academia, civil society, international development agencies, private sector and
financial institutions and urban communities in general.
9.7 Linkages with the NAPCC
The strategies and actions proposed in the BAPCC under the Urban Development section
are consistent with the NAPCC and the National Mission for sustainable habitat. In
addition, it has also linkages with the National Mission for a Green India, National Water
Mission, National Mission for Energy Efficiency and the National Solar Mission.
9.8 Sectorial Action Plan and Budget under the BPACC
See Part C, Action Plans and Budgets

State Action Plan on Climate Change (SAPCC)-Jan 2015
- 94 -
10. Transport
10.1 Overview, Characteristics and Status
10.1.1 Vehicular Growth
The Transport Department of the state government is responsible for improvements in the
road transport system, along with collection of fees, road taxes, etc. under the Central
Motor Vehicles Act, 1988. Thus the Transport Department plays a major role in raising
the internal resources for the state government. The number of registered vehicles is on
continuous increase and the registration of new vehicles recorded a phenomenal increase
of around five fold, from around 80 thousand in 2005-06 to 3.87 lakh in 2010-11.
Table 28 Number of registered vehicles (2005-06 to 2011-12; up to Dec. 2011)17
Year Truc
k
Bus Car Taxi Jeep Auto Two-
Wheele
r
Tracto
r
Traile
r
Other
s
Total
2005
-06
579 113 5062 427 2321 3273 61333 3509 2440 1306 80363
2006
-07
1989 921 7409 1326 4430 5027 112985 6160 5281 1781 147309
2007
-08
2409 134
1
8223 3042 4229 6030 120296 8164 5358 2665 161757
2008
-09
3598 112
1
1054
9
3791 5748 8423 166882 11203 7510 1588 220413
2009
-10
8474 155
5
1485
4
7347 9862 1239
2
233656 19496 10529 969 319134
2010
-11
6990 149
4
1881
4
5419 9746 1742
2
293204 21208 11137 1947 387381
2011
-12
6982 208
0
1485
8
5551 6143 1511
0
244032 16950 7994 933 320633
Total 3102
1
862
5
7976
9
2690
3
4247
9
6767
7
123238
8
86690 50249 1118
9
163699
0
With substantial increase in the number of vehicles, the actual revenue collection also
doubled in 2010-11 over 2006-07. It is also noted that the actual collection of revenue
remained very close (98.69 percent) to the target in 2010-11, which is a welcome
achievement compared to 2006-07 when the achievement was 57.75 percent. During
April-December, 2011, the trend in revenue collection has also been quite encouraging
(101.48 percent) of the cumulative target.
17 Source: Department of Transport, GoB

State Action Plan on Climate Change (SAPCC)-Jan 2015
- 95 -
10.1.2 Sector Growth
The transport sector has shown modest growth over the years as can be seen from the
tables below.
Table 29 Transport and allied sectors as sectoral composition of GSDP at constant price (2004-05 to 2011-12)18
Sector Triennium Average
(2004-05to2006-07)
Triennium Average
(2007-08to2009-10)
2011-12
(Adv.)
Transportation,
Storage &
Communication
6.23 6.53 7.51
Railways 1.97 1.84 1.48
Other Transportation
and Storage
2.62 2.46 2.33
10.1.3 Bihar State Road Transport Corporation (BSRTC)
Bihar State Road Transport Corporation was established in May 1959 with primary
objective of making safe, adequate, economical and systematic bus services available to
the passengers. The Corporation has undertaken various steps to improve its performance
during the last two years.
10.1.4 State Waterways and Inland Navigation
There is virtually no organised inland navigation in the waterways of the state, and there
are ample scope for development in this sector in Bihar. With promotion of waterways and
navigation in the state, the rural economy can be substantially transformed.
10.1.5 Railways
The state has an extensive railway network providing vital connectivity within the state,
as also with other areas in the country. The total rail length exceeds 5400 Kms. in the state.
The East Central Region, one of the biggest railway zones in the country with five
divisions of Danapur, Mughal Sarai, Dhanbad, Sonepur, and Samastipur, has its
headquarters at Hajipur.
10.1.6 Airways
Patna's airport emerged as number one among 46 airports in the country in terms of growth
of domestic passengers as well as domestic aircraft movement for the second consecutive
year in 2010-11. There is virtually no international aircraft movement in the state, since
the state does not have an international airport. Although Gaya airport is declared as an
18 Economic Survey of Bihar 2011-12, Finance Department, GoB

State Action Plan on Climate Change (SAPCC)-Jan 2015
- 96 -
International airport, it is only nominal, because the big aircrafts do not operate on regular
basis from here.
10.2 Key Issues
Some of the key issues in the sector include:
Increasing congestion, especially in urban agglomerations; increasing air pollution
from vehicular emissions
Very little public transport facilities especially in urban areas; what exists is largely
out-dated vehicle fleets;
Virtually no organised inland waterways transport networks/systems.
10.3 Priorities
Well integrated multimodal public transport system will be planned for seamless
travel across modes by designing a sound interchange infrastructure and
introducing a single ticket over all such systems;
Urban transportation will be incorporated as an important parameter at the urban
planning stage;
Rather than being a consequential requirement, different types of public transport
for different segments of commuters will be planned for. Smaller buses along
arterial roads may be a good substitute for private vehicles;
Intermediate public transport (IPT) will be promoted to cater intra urban mobility
mostly along;
Arterial/low density principal roads. Fare structure of IPT modes will be properly
framed and strictly enforced;
Working hours of offices, educational institutions, and commercial establishments
will be staggered to avoid the conflict of traffic movement dedicated to these
activities; and
Development of waterways navigation system on river Ganga to reduce the cost of
transportation.
10.4 Perceived Climate Impacts
Transport-related pollution, noise, and vibration can pose serious threats to human health
and wellbeing. Local air pollution is caused by exhaust emissions produced by traffic,
mostly in the form of Sulphur Oxides (SOx), Nitrogen Oxides (NOx), Carbon Monoxide
(CO), Hydro Carbon (HC), Volatile Organic Compounds (VOC), toxic metals, Lead
Particles and Particulate Matter (PM) – including Black Carbon.

State Action Plan on Climate Change (SAPCC)-Jan 2015
- 97 -
Climate change can exacerbate these impacts, leading to traffic-filled roads that can
become physical and psychological barriers that can sever communities and divide entire
cities. Roads, railways, and other transport infrastructure can also have a severe impact on
the natural environment, from the removal of vegetation during construction or the
subsequent fragmentation of habitats and disturbance of animals; such fragmentation,
without proper ecological infrastructure planning can severely disturb wildlife and reduce
biodiversity.
10.5 Strategies
In the short to medium term, the transport department will seek to:
Promote the use of ensure availability of cleaner fuels such as CNG and bio-fuels
Improve access to bus services and service quality;
Promote initiatives such as vehicle pooling, etc., especially in cities and towns;
Partnerships for green transportation.
Shift to more environmentally efficient modes such as public and non-motorised
transport
Invest in public transport and infrastructure that promotes walking and cycling
generates jobs, improves wellbeing and add considerable
Improve vehicles, vehicle maintenance, and fuels as a priority to reduce urban air
pollution and greenhouse gas emissions as also ensuring that vehicles that have
passed their useful life do not come out on roads
Develop green-belts and avenue plantation for in-situ urban pollution dispersal
Undertake capacity building of personnel in the Transport Department and other
agencies as required;
Rigorously implement measures for vehicular pollution control;
Systematise and ensure uniformity in institutional arrangements for providing
public transport services.
In the long term, the Department will undertake following steps:
Promote access instead of mobility; shift to less harmful modes of transportation;
and improve vehicles towards lower carbon intensity and pollution. A fundamental
shift in investment patterns will be sought, based on the principles of avoiding or
reducing trips through integrating land-use and transport planning and enabling
more localised production and consumption.
Shift to more environmentally efficient modes such as public and non-motorised
transport (for passenger transport) and to rail and water transport (for freight)

State Action Plan on Climate Change (SAPCC)-Jan 2015
- 98 -
Invest in public transport and infrastructure that promotes walking and cycling
generates jobs, improves wellbeing and add considerable value to the state
economy, as well as reduce greenhouse gas emissions;
Improve vehicles, vehicle maintenance, and fuels as a priority to reduce urban air
pollution and greenhouse gas emissions;
Adopt green transport policies will also reduce road accidents and alleviate poverty
by improving access to markets and other essential facilities.
10.6 Institutional Linkages and Stakeholders
Institutional linkages are envisaged with the State Transport Corporation, the Urban
Development Department, BUIDCO, Tourism Department, and the State Tourism
development Corporation, Indian Railways, other State Road Construction Department, as
well as linkages with academia, civil society, international development agencies, private
sector and financial institutions, and communities in general.
10.7 Linkages with the NAPCC
The outlined strategies herein are consistent with the NAPCC in general; they also have
linkages with the National Mission on Sustainable Habitat and the National Mission on
Energy Efficiency.
10.8 Sectoral Action Plan and Budgets under the BAPCC
See Part C, Action Plans and Budgets

State Action Plan on Climate Change (SAPCC)-Jan 2015
- 99 -
11. Energy
11.1 Overview, Characteristics and Status
11.1.1 Power Situation in Bihar
In its quest for increasing the availability of electricity, Bihar has adopted a blend of
thermal and hydel sources. Bihar has the lowest annual per capita consumption of
electricity at 144KWH in the country, against the national average of 917 KWH. There is
an acute shortage of power not only for peak demand, but even the base demand in the
state.
Table 30 Power supply position in Bihar19
Year Peak Demand (MW)
Peak Availability (MW)
Deficit (MW) Deficit (%)
2010-11 3046 1406 1340 53.84
2011-12 3607 1675 1932 53.56
2012-13 2642 1638 1004 38.00
2013-14 3150 2200 1377 43.72
2014-15 3774 2700 1842 48.80
The forecasts are presented in Table 31.
Table 31 : Forecast of peak load and energy requirement (2011-12 to 2016-17)20
Year Peak Load (MW) Energy Requirement (MU)
2011-12 2226 15015
2012-13 2642 17354
2013-14 3150 20147
2014-15 3774 23471
2015-16 4352 26299
2016-17 5620 29447
There are three key agencies in the energy sector in Bihar – BSEB, Bihar State
Hydroelectric Power Corporation Limited (BSHPC) and BREDA.
19 Source: BiharState ElectricityBoard,GoB
20ibid

State Action Plan on Climate Change (SAPCC)-Jan 2015
- 100 -
11.1.2 Bihar State Electricity Board
BSEB is a vertically integrated agency and is responsible for generation, transmission, and
distribution of electricity in Bihar. At present, there are only two thermal power stations
in the state sector – Barauni Thermal Power Station (2x50 MW and 2x110 MW) and the
Kanti Thermal Power Station (2x110 MW). At present, more than 10 lakh consumers in
the state under various categories are unmetered and are, therefore, billed at a flat tariff
rate, leading to huge revenue losses. However, the transmission and distribution (T&D)
losses declined during 2008 to 2010. The T&D loss during 2011 remained at 35.26 percent
on the basis of previous norms of consumption in case of un-metered categories of
consumers adopted for calculation of T&D loss during the years prior to 2011.
11.1.3 Bihar State Hydroelectric Power Corporation Limited (BSHPC)
The BSHPC conducts survey for this purpose and prepares the schemes on hydroelectric
power generation. There are 13 minor hydel projects that are currently operational in the
state with installed capacity of 54.3 MW.
11.1.4 Bihar Renewable Energy Development Agency (BREDA)
The Bihar Renewable Energy Development Agency (BREDA) is responsible for
development of projects using non-conventional energy sources in the state. The overall
picture of the renewable energy potential of the state is given in the Table 32.
Table 32 Renewable energy potential of Bihar21
Renewable Energy Sector Potential (MW)
Large Wind Marginal, to be explored further
Small Wind Marginal, to be explored further
Small Hydro 195.25
Bio Energy 1950 to 2150
Solar Grid Connected 2850 to 8549
Solar Off-Grid 7300
Total Range 12295 to 18194
11.1.5 Rajiv Gandhi Grameen Vidyutikaran Yojana (RGGVY)
The rural electrification work is being carried out in all 38 districts of the state under
RGGVY. This work is carried out by the Power Grid Corporation of India Limited (24
districts), National Hydroelectric Power Corporation (NHPC) (six districts) and by
BSEB (eight districts).
21 Source: Renewable Energy Potential Assessment and Renewable Energy Action Plan for Bihar

State Action Plan on Climate Change (SAPCC)-Jan 2015
- 101 -
11.1.6 Restructured Accelerated Power Development and Reforms Programme (R-APDRP)
Part A of the scheme is dedicated to establishment of IT enabled system for achieving
reliable and verifiable baseline data in all towns with a population greater than 30,000 as
per 2001 census. Part B of the scheme deals with strengthening and upgradation of regular
sub-transmission and distribution system. The focus for Part B is on ATC (Aggregate
Technical and Commercial) loss reduction on a sustainable basis. Part A of R-APDRP
covers 71 towns of the state.
11.2 Key Issues
The generating capacity of Bihar is the lowest in the country. The peak availability is about
2700 MW against the peak demand of 4000 MW, causing a peak shortfall of about 1300
MW, which results in widespread Power Shortage in Bihar. Bihar has targeted to achieve
per capita consumption of electricity at least 731.66 units by the end of the 12th plan. This
per capita consumption translates to a staggering 11,650 MW of power generating capacity
for Bihar.
11.3 Existing/On-going Initiatives
11.4 Priorities
During the 12th FYP, peak demand for electricity is expected to surge in Bihar owing to
electrification of villages and setting up of many industries. Industrial demand for power
is also expected to pick up substantially in the wake of new incentives for investment
provided by the Bihar Single Window Clearance Act, 2006; the Bihar Infrastructure
Development Enabling Act, 2006 and the State Government’s Industrial Policy, 2011. A
target of per capita consumption of about 731.66 units by 2016-17 has been set. The State
plans to achieve this target in the phased manner. The State Government considers the
involvement of the private sector in the development of thermal power projects in the state,
as an important aspect of the Power Policy.
The State Government encourages captive power generation by industries using any of
their waste, by- product or similar substances like bagasse-based co- generation in the
Sugarcane industry, provided that for continuity of generation in the off-season, any other
substance could be used for generation. The State Government shall provide all such co-
generation plants similar incentives as available to Captive Power Plants outlined in the
Policy.
The State has planned to procure 1500 MW Power through Case - I bidding. The Power
purchase agreement (PPA) for 450 MW has already been made and the power will be
available from July 2014. For the remaining 1050 MW +20 percent Power, bids have been
invited and procurement process is likely to be finalized by September 2011. The
availability of power is expected from September 2015. In addition, Restoration of Unit
No. 6 of BTPS, the only generating plant owned by BSEB, was done in the year 2007 and

State Action Plan on Climate Change (SAPCC)-Jan 2015
- 102 -
Renovation and Modernization of 2x110 MW units each at BTPS and MTPS was approved
by Planning Commission with limited scope of work.
To derive full benefit and ensure sustenance of desired PLF, certain essential
infrastructural requirements are needed, which have not been included in the scope of
repair and maintenance work awarded to BHEL under RSVY. So, under BRGF scheme
for the 12th Plan remaining works have been proposed. Bihar State Electricity Board is
availing 300 MW Power under Short Term from September 2011 to November 2011.
BSEB has initiated bidding process for procurement of 450 MW+20 percent under
Medium Term for 3 years 10 months with effect from March 2012. Phase-1 of investment
projects to strengthen the transmission system under the Rashtriya Sam Vikas Yojna has
been completed. The augmentation of transmission system in the remaining part of the
State is under progress in phase - II of the same scheme. Major works will be completed
by March 2012. Out of sanctioned amount of Rs2246.58Crores, Rs1886 Crores has been
spent so far for strengthening of transmission works of Phase I and II.
During the 12th plan period, the State Government will provide active support to ensure
the financial viability of developing new transmission capacity in the State, and the SIPB
will give priority to the clearance of new transmission systems. Wherever required, the
State Government will also provide counterpart funding and guarantees for obtaining loans
from central financial institutions and international funding agencies like ADB, World
Bank, JBIC, etc. Existing transformation capacity with expected upcoming addition by
March 2012 is 220/132 KV- 4650 MVA and 132/33 KV-5423 MVA. The transmission
capacity would therefore require massive strengthening to support the projected growth.
ADB have prepared a Master Plan for transmission through its consultant SNC LAVLIN.
They have recommended year-wise enhancement of capacity of existing G.S.S. and
installation of reactors, etc. at voltage level 400 KV to 132 KV level. The total capacity
after aforesaid addition shall be 3320 MVA at the level of 400/220 KV and at level of
220/132 and 132/33 KV will be 9800 MVA and 13023 MVA, respectively. The above
works have been proposed under BRGF.
In order to create the new infrastructure in the State transmission system and to augment
the existing capacity of the transmission system, Bihar will follow the model of Public
Private Partnership developed by the Planning Commission, GoI. This would help in
improving efficiency, and reducing tariff. The above mechanism will also attract private
investments in the development of State transmission system. The real challenge of
reforms in Bihar’s power sector lies in improving the efficiency of distribution.
The current power distribution system is characterized by huge ATC losses of
approximately 45 percent, which calls for a radical change in the way electricity
distribution is managed. Fundamental restructuring and institutional development of
distribution operations is crucial to the reforms planned for the power sector as a whole.
Distribution Reforms will contain the following elements:
New distribution licensees for med as successor entities of BSEB will begin operations
afresh, and without the burden of past losses, unserviceable liabilities and
unrecoverable arrears.

State Action Plan on Climate Change (SAPCC)-Jan 2015
- 103 -
Feasibility of adoption of PPP Model for distribution management of Patna is being
studied in collaboration with the Planning Commission. After feasibility study, PPP
Model will be tried for four major cities viz., Patna, Gaya, Muzaffarpur, and
Bhagalpur.
Under Distribution reforms, NIT has been floated for awarding input based franchisee
for rural and urban feeders. Hundred and seventeen bidders have participated for Rural
Feeders and 11 for Urban
Feeders. The tender is in the stage of finalization for the award.
Strengthening of distribution network of 49 towns (not covered under R-APDRP) whose
population is more than 5000, has been proposed under BRGF for the 12th Plan. A total of
Rs 245.47 Crores has been proposed for strengthening of 49 non-R-APDRP towns.
The lack of any medium or large hydropower plants in Bihar restricts its ability to meet
peaking requirements or to have the flexibility to meet intra-day changes in system
demand. Bihar has a current installed capacity of about 53.30 MW from small hydro power
(SHP) and 27.00 MW is under construction with the potential for 250 MW more. SHP for
3.70 MW is likely to be added by March 2012. The State also has large hydro power
generation potential in Dagmara 125 MW (Kosi) and Indrapuri 450 MW besides five
pumped storage projects, pre-feasibility for which have been established by the BHPC.
Bihar has high potential of generation of renewable energy especially in the field of solar
as well as biomass. The renewable energy production in the field of wind energy however
is limited to some riverine and hilly regions only. The energy production through solar
photovoltaic as well as solar thermal has immense potential in the state for power
generation.
It is expected that the plateau and hilly areas as well as the riverine belts in Bihar have
sufficient wind speeds suitable for wind power generation. Wind energy potential in Bihar
is being assessed by C-WET, a GoI undertaking which has so far established 3 high mast
stations at Adhaura (District Kaimur), Lalganj (District Vaishali) and Simultala (District
Jamui). Three more places have been identified and are being assessed for their potential
at Bodhgaya (District Gaya), Pirpahari (District Munger), and Ruxaul (District Motihari).
Rural electrification plays a vital role in all economic activities; it provides for a better
quality of life and may be considered as an instrument the socio-economic development
of remote areas. The State has good opportunity to cover these villages under RGGVY for
DDG in the 12th FYP in a big way. For these, a large-scale survey of concerned villages is
required and other preparatory works are also to be undertaken. This will facilitate the
action plan and estimate of the costs. Primary work for preparing action plan has
started.The New and Renewable Energy policy, 2011 has come into being which has
several incentives, some of which are as follows:
Single window clearance of the renewable projects through the State Investment
Planning Board (SIPB).

State Action Plan on Climate Change (SAPCC)-Jan 2015
- 104 -
State Government would facilitate land availability through State Land Bank whenever
necessary.
The Bihar Electricity Regulatory Commission has fixed the purchase rate of the energy
produced through renewable as well as the procurement quota year wise.
The State government will facilitate loan from banks and other financial institutions to
the project developers. Moreover wheeling facilities have been adequately defined and
explained for all grid-connected sources of Renewable Energy electricity generation
projects up to 25 MW.
Provision for waiver of entry tax on equipment and electricity duty apart from other
incentives available under the industrial incentive policies of the State.
BREDA as a nodal Agency for the implementation of the Renewable Energy projects
will co-ordinate with the provide project developers.
The renewable energy production through biomass is another potential area for the
state and to encourage investment in these projects special concessions are envisaged.
The State government shall encourage project developers to install mechanisms such
as Clean Development Mechanism (CDM) for leveraging funds for renewable energy-
based power projects. BREDA is a nodal agency for helping private developers to
apply for CDM benefits. Bundling of projects shall be encouraged for CDM
application to make the initiative viable.
Bihar State Energy Conservation Fund has been constituted for the promotion of efficient
use of energy and conservation. The state has three types of projects for consideration:
Grid connected renewable energy projects based on biomass.
Co-generation of renewable energy through bagasse in sugar mills and rice husk in
rice mills.
Off-Grid renewable energy distributing projects based on biomass. The investment of
the private sector and cooperative sector is very important in the field.
There is an urgent need to have a system that encourages energy conservation and provides
disincentives for inefficient use of energy. The State government shall promote measures
for economy and efficiency in energy consumption. The State government also proposes
to implement the provisions of the Energy Conservation Act, 2001 and to set up the State
Resource Fund to promote activities for energy conservation.
In co-ordination with the Bureau of Energy Efficiency (BEE), PESU has planned to
facilitate 'Bachat Lamp Yojna' in Patna on experimental measure. Demand side
management will also be given emphasis. There is a compelling need for second green
revolution for Bihar, which has a three-crop land and whose crop intensity is only 1.52.
Ninety percent of the total energy required for irrigation purposes is to be met through
conventional sources.

State Action Plan on Climate Change (SAPCC)-Jan 2015
- 105 -
11.5 Perceived Climate Impacts
Today 70 percent of greenhouse gas emissions come from fossil fuel combustion for
electricity generation, in industry, buildings, and transport – and these emissions are
projected to rise. By 2050, the global population will grow to 9 billion, with growth mostly
concentrated in developing countries with improved living standards. If we continue as we
are today, delivering energy services and sustaining economic growth will result in a
tripling of annual GHG emissions.
Climate impacts cross the entire energy supply chain. Impacts on energy supply and
demand are the most intuitive but there are also direct effects on energy resource
endowment, infrastructure, and transportation, and indirect effects through other economic
sectors (e.g., water, agriculture). This exposure is driven in part by the current state of the
sector (e.g., inefficiencies in energy and water use mean energy services are vulnerable
and have less capacity to deal with change).
Increasing temperatures are almost certain to reduce heating demands but increase cooling
demands overall, but inter-annual variability will remain and cold periods will not
disappear. Seasonal demand profiles will alter responding to user needs for energy for
heating and cooling in buildings, for industrial processes, and for agriculture (e.g.,
irrigation).
Energy transportation infrastructure (for power, oil, and gas) are also variously exposed to
wind gusts, storms, storm-related landslides and rock falls, land movements, siltation and
erosion processes, as well as changes in water basins. The table below summarizes
potential impacts on the energy sector.
Flooding and droughts will continue, with likely impacts on infrastructure (including
silting of reservoirs), and on demand. Climate change may impact the generation cycle
efficiency and cooling water operations of fossil fuel fired, nuclear, and biomass fired
power plants. The generation potential of renewables may change but is impossible to
assess without additional locally specific study:
Hydro‐generation may benefit or suffer, or both at different times, from changes in
rainfall;
Solar generation may not be affected in a substantial manner, although some regions
may see future decreased generation;
Wind generation may be impacted either positively or negatively by local adjustments
to the wind regime; and
Biomass/biofuel generation could be affected by changes in cultivation regimes.

State Action Plan on Climate Change (SAPCC)-Jan 2015
- 106 -
Table 33 Potential energy sector vulnerability to climate change
Item
Relevant Climate Impacts Impacts on
the Energy
Sector General Specific Additional
Climate Change Impacts on Resource Endowment
Hydropower Runoff Quantity (+/‐) Seasonal flows
high & low flows,
Extreme events
Erosion
Siltation
Reduced
firm energy
Increased
variability
Increased
uncertainty
Wind power Wind field
characteristic
s, changes in
wind
resource
Changes intensity,
wind speed
increased wind
variability
Changes in
vegetation (might
change roughness
and available
wind)
Increased
uncertainty
Biofuels Crop
response to
climate
change
Crop yield Agro‐ecological zones
shift
Pests
Water demand
Drought, frost,
fires, storms
Increased
uncertainty
Increased
frequency
of extreme
events
Solar power Atmospheric
transmissivit
y
Water content
Cloudiness Cloud
characteristics
Positive or
negative
impacts
Wave and
tidal energy
Ocean
climate
Wind field
characteristics No
effect on tides
Strong non-
linearity between
wind speed and
wave power
Increased
uncertainty
Increased
frequency
of extreme
events
Climate Change Impacts on Energy Supply
Hydropower Water
availability
and
seasonality
Water resource
variability
Increased
uncertainty of
expected energy
output
Impact on the grid
Wasting excessive
generation
Extreme events
Increased
uncertainty
Revision of
system
reliability
Revision of
transmissio
n needs
Wind power Alteration
inwind speed
frequency
distribution
Increaseduncertain
ty ofEnergy output.
Short life span
reducesrisk
associated with
Climate change
Extreme events
Increased
uncertainty
on energy
output

State Action Plan on Climate Change (SAPCC)-Jan 2015
- 107 -
Item
Relevant Climate Impacts Impacts on
the Energy
Sector General Specific Additional
Biofuels Reduced
transformatio
n efficiency
High temperatures
reduce thermal
generation
efficiency
Extreme events Reduced
energy
generated
Increased
uncertainty
Solar power Reduced
solar cell
efficiency
Solar cell
efficiency reduced
by higher
temperatures
Extreme events Reduced
energy
generated
Increased
uncertainty
Thermal
power plants
Generation
cycle
efficiency
Cooling
water
availability
Reduced efficiency
Increased water
needs, e.g., during
heat waves
Extreme events Reduced
energy
generated
Increased
uncertainty
Oil and gas Vulnerable to
extreme
events
Floods, erosion
and siltation
(coastal areas, on
land)
Extreme events Reduced
energy
generated
Increased
uncertainty
Impacts on Transmission, Distribution, and Transfers
Transmissio
n,
distribution,
and transfers
Increased
frequency of
extreme
events Sea
level rise
Wind and ice
Landslides and
flooding
Coastal erosion,
sea level rise
Erosion and
siltation
Weather
conditions that
prevent transport
Increased
vulnerabilit
y of
existing
assets
Impacts on Design and Operations
Siting
infrastructur
e
Sea level rise
Increased
extreme
events
Flooding from sea
level rising, coastal
erosion Increased
frequency of
extreme events
Water availability
Geomorphodynam
ic equilibrium
Increased
vulnerabilit
y of
existing
assets
Increased
demand for
new good
siting
locations
Downtime
and system
bottlenecks
Extreme
weather
events
Impacts on isolated
infrastructure
Compound impacts
on multiple assets
in the energy
system
Energy system not
fully operational
when community
requires it the most
Increased
vulnerabilit
y
Reduced
reliability
Increased
social
pressure for

State Action Plan on Climate Change (SAPCC)-Jan 2015
- 108 -
Item
Relevant Climate Impacts Impacts on
the Energy
Sector General Specific Additional
better
performanc
e
Energy trade Increased
vulnerability
to extreme
events
Cold spells and
heat waves
Increased stress on
transmission,
distribution, and
transfer
infrastructure
Increased
uncertainty
Increased
peak
demand on
energy
system
Impacts on Energy Demand
Energy use Increased
demand for
indoor
cooling
Reduced growth in
demand for heating
Increased energy
use for indoor
cooling
Associated
efficiency
reduction with
increased
temperature
Increased
demand
and peak
demand,
taxing
transmissio
n and
distribution
systems
Other impacts
Cross-sector
impacts
Competition
for water
resources
Competition
for adequate
siting
locations
Conflicts in water
allocation during
stressed weather
conditions
Competition for
good siting
locations
Potential
competition
between energy
and non-energy
crops for land and
water resources
Increased
vulnerabilit
y and
uncertainty
Increased
costs
11.6 Strategies
The energy sector vision is to strive for improved energy security in Bihar through multiple
strategies including improving generation, transmission, distribution, scaling up use of
renewables, promoting energy efficiency across all sectors, as well as fostering
mechanisms for demand side management.
A range of initiatives is already underway in the State as described in Section. New
initiatives are planned under the 12th FYP Approach Paper; additionally, the State has now
developed a Hydropower Policy as well as a Bihar Policy for promotion of New and
Renewable Energy Sources 2011.
The State recognises that while energy systems already take account of some climate risks
in their operation and planning, adaptation measures can further reduce their vulnerability
to environmental change, by building capacity and improving information for decision
making, and integrating climate risks into management and operational decisions, and as
such, is committed to taking all necessary measures to build in climate concerns into

State Action Plan on Climate Change (SAPCC)-Jan 2015
- 109 -
energy sector policy, planning, and implementation. The Energy Department has already
planned a set of measures in the context of climate change, and these are given below:
11.6.1 Generation
Since coal based thermal power plants are the highest contributors in CO2 emissions, the
following actions are being taken to improve the overall efficiency of such thermal power
stations:
Renovation and modernisation of existing units to restore original efficiency along
with reduced auxiliary power consumption and reduced chimney emissions.
Modernisation work on the BTPS units 6 and 7 are expected to be completed by
February 2013, and for the MTPS units 1 and 2, by December 2012;
Adoption of super critical technology for all upcoming coal based power stations
to have better efficiency and reduced emissions;
Fly ash utilisation is part of each plant’s environment plan. While some quantity
of fly ash is used in land development, expressions of interest has been sought from
cement manufacturers for use of fly ash for their current needs and future
expansion projects;
Sufficient green lands have been identified around future projects; and
Feasibility of gas based and nuclear (including thorium-based) power plants are
being explored.
11.6.2 Transmission
The following measures have been planned to reduce transmission losses:
Expansion of high voltage transmission network with latest and state of the art
technologies and adequate coverage network to prevent loading beyond limits;
Use of sufficient reactors and capacitors in the network;
Replacement of old and jointed conductors;
Better load management, efficient scheduling and use of information systems to
achieve optimum network utilisation; and
Proper upkeep of GSS transformers.
11.6.3 Distribution
The following measures are being taken and planned to reduce AT&C losses:
Replacement of old and jointed conductors;
Procurement of start rated distribution transformers and load balancing of existing
ones;
Tariff structure to be such as to levy lower tariff for lesser energy consumption and
ToD tariff, etc. to promote lower energy withdrawal and promote conservation;

State Action Plan on Climate Change (SAPCC)-Jan 2015
- 110 -
Underground cabling in green areas;
Addition of adequate capacitors and upkeep of PSS transformers and distribution
transformers;
Expansion of network with high HT/LT ratio;
Adoption of HVDS systems where feasible and putting into place effective anti-
power theft measures; and
To facilitate power supply for monorail and metro-rail schemes envisaged for
Patna as part of improving public transportation systems, which will also be
expected to considerably reduce emissions.
11.6.4 Demand Side Management
The following demand side management measures have been planned:
Promoting the use of energy efficient pumps and motors in the State;
Implementing promotion of CFLs under the Bachat Lamp Yojana (BLY) in
identified areas of the PESU and expanding the scheme to other parts of the state
in a phased manner; and
Investing in building consumer awareness about energy efficient equipment and
energy conservation measures.
11.6.5 Small Hydropower Projects
The State intends to develop large hydropower projects and pumped storage schemes
either through loan from bilateral/multilateral funding agencies or as joint ventures with
government companies such as the National Hydro Power Corporation (NHPC) or even
through private sector participation.
Bihar has a current installed capacity of about 53.30 MW from small hydropower (SHP)
and united to generate an additional 27 MW are under construction, with the potential for
an additional 250 MW. SHP capacity for 3.70 MW is likely to be added in the immediate
near future. The State also has large hydropower generation potential in Dagmara by way
of 125 MW in the Kosi, and 450 MW at Indrapuri, besides five pumped storage projects,
pre-feasibility for which has been established by the BSHPC.
The DPR of the Dagmara HEP has been prepared, and is currently being modified before
submission to the CEA. The State intends to complete both the large projects by the end
of the 12th Plan period, and as such, the installed capacity in Bihar is likely to be around
209 MW by the end of the 12th Plan period.
11.6.6 Renewable Energy Projects
Renewable energy based generation has a significant role to play in Bihar especially in the
biomass and small hydro subsectors. Given the predominantly agrarian nature of the
economy, such sources are likely to be self-sustaining and economically viable. In
addition, it is expected that the plateau and hilly areas as well as the riverine belts in Bihar
have sufficient wind speeds suitable for wind power generation. As such wind energy

State Action Plan on Climate Change (SAPCC)-Jan 2015
- 111 -
potential development is to be shortly taken up in the State for assessment under the
sanction of the Ministry of New and Renewable Energy.
BREDA has been nominated as the nodal agency to take up rural electrification work in
those villages which are inaccessible or where conventional grid connectivity is not
commercially viable. The State has decided to sign MoUs with the GoI to take up rural
electrification work in such villages. The preparatory work for the survey of these villages
is being taken up and accordingly, plans will be prepared and submitted in due course.
To encourage local private sector participation in renewable energy power generation
projects including solid waste and sewerage gas based projects or decentralised distributed
generation (DDG), the policy will include renewable energy projects, and adequate
budgetary allocations in plan funds to augment Central support.
The State will also work closely with the Electricity Regulatory Commission to fix the
renewable energy procurement quotas and tariffs for renewable energy based power over
the next six months or so. The State will also provide banking and wheeling facilities for
all grid connected renewable energy electricity generation projects up to 25 MW. Entry
tax will be waived on capital costs for equipment for DDG based renewable energy plants
of less than five MW.
The State will also encourage project developers to install or adopt mechanisms such as
Clean Development Mechanisms (CDM) for leveraging funds for renewable energy based
projects, and BREDA is the nodal agency for coordinating this. Bundling of projects or
initiatives will also be considered. As part of the State’s commitment to renewables, the
BERC has made provision of renewable power purchase obligation by distribution
licensees from 2.5 percent in 2011-12 to 5 percent in 2014-15. Such obligation also
includes a minimum 0.5 percent of solar power in 2011-12.
11.6.7 Other Initiatives
Research, Climate Impacts Needs Assessment
Awareness and knowledge exchange
Development of project screening tools
Development of adaptation standards for the energy sector
Promotion of energy efficiency
Capacity building
Addressing poverty and equity concerns

State Action Plan on Climate Change (SAPCC)-Jan 2015
- 112 -
11.7 Institutional Linkages and Stakeholders
Institutional linkages are envisaged with virtually all state government departments and
other institutions, since efforts will be required across sectors, especially in the promotion
of energy efficiency measures. Linkages are also envisaged with academia, civil society,
international development agencies, private sector and financial institutions, and
communities in general.
11.8 Linkages with the NAPCC
The outlined strategies herein are consistent with the NAPCC in general and with the
national Mission on Energy Efficiency as well as the national Solar Mission. Additionally,
they also have linkages with the all the other National Missions under the NAPCC.
11.9 Sectorial Action Plan and Budgets under the BAPCC
See Part C, Action Plans and Budgets

State Action Plan on Climate Change (SAPCC)-Jan 2015
- 113 -
12. Industries and Mining
12.1 Overview, Characteristics and Status
12.1.1 Industrial Situation
The small industries in the state are dominated by tiny enterprises and artisan based
industries and its share is as high as 99.9 percent among all the Medium, Small, and Micro
Enterprises (MSME) units. Though Bihar's enterprises sector is the smallest in India, it too
felt the pinch of global downturn and registered a marginal decline of (–) 3.7 percent in
the growth rate of manufacturing sector in 2009-10. In 2010-11, however, it grew by 8.9
percent and is projected to increase further to 9.2 percent in the current year 2011-12.
Table 34 Large scale industries in Bihar (2010-11)22
Sl.
No. Type of Unit Number Location
1 Rural Agriculture Business
Centre – Fruit Processing
7 East Champaran, Vaishali, Ara,
Purnea, Muzaffarpur, Samastipur
2 Food & Vegetable Processing 2 Muzaffarpur, Nalanda
3 Rice Mill 9 Rohtas, Gaya, Banka, Kaimur
4 Roller Flour Mill 6 Patna City, Patna, Darbhanga, Ara
5 Biscuit Production 3 Hajipur, Muzaffarpur
6 Edible Oil/ Refined Vegetable
Oil
3 Ara, Rohtas
7 Others 6 Araria, Muzaffarpur, Munger,
Banka, Bhojpur
Total 36 -
12.1.2 Processing Industries
There are only 45 licensed fruits and vegetables processing units in the state and most of
these are engaged in manufacturing fruit juices, pulps, squashes, pickles, tomato
ketchup/juice/puree, and jam/jelly, etc. The fruits and vegetables processing segment is
marked by a complete absence of cold chain, resulting into quality deterioration of raw
materials. Further, even after processing, the products are kept under either minimum
refrigeration or no refrigeration. A large number of processing units operate on work-order
22 Source: Department of Industry, GoB

State Action Plan on Climate Change (SAPCC)-Jan 2015
- 114 -
basis for longer chain and, therefore, the operative margins are very thin, leaving no scope
for technology upgradation or expansion.
Presently, there are around 5000 rice mills in the state of which over 95 percent are hullers.
Only 5 percent of these mills may be considered as modern. There is a tremendous
potential in maize processing, which needs to be exploited on commercial basis. The
potential of maize-based products are corn oil, poultry, and animal feed, and high value
products like ethanol and extra neutral alcohols, given the high protein content of Bihar
maize. There are only a limited number of medium sized registered maize-processing units
in the state, with no estimate available for unregistered units. Some large private players
have recently shown interest in maize processing in the state.
The sugar industry is another important agro-based industry in Bihar. It generates
considerable employment in the farm sector, both directly and through ancilliarisation and
related activities. Among the agro-based industries in the state, tea industry is growing
very fast and has started assuming a place of importance involving 1000 small and medium
planters employing about 30,000 people.
Bihar produces around 3 million tonnes of milk, which accounts for 3.28 percent of the
total milk production in the country. Only about 10 percent of the milk production is
processed by COMFED (Sudha Dairy). Compared to the annual growth rate of 4 percent
in India, milk processing in Bihar has recorded a much lower rate.
Bihar is one of the leading honey producing states in India, accounting for almost half of
the country's total production of 8400 tonnes. The litchi honey is produced on commercial
scale, sold at prices at par with some of the premium honey in the world market, because
of its uniqueness. The yield of honey with the Italian honeybee species is the highest in
Bihar compared to other states, with a production rate of 40 and 60 kgs honey/hive/year,
for stationary and migratory beekeeping respectively.
12.1.3 Non Agro-Based Industries
There are a large number of handloom units in Bihar, of which 10,850 are under
cooperative sector and 25,503 units are outside. Besides, there are 11,361 power looms in
the state. The state has a great potential of leather-based industries. There are around
50,000 footwear artisans in the state. The state also has tanneries in both the public and
private sectors. The major problem faced by the tanneries is the disposal of industrial
waste. This necessitates establishment of the Common Effluent Treatment Plan (CETP),
and unless this is established, the existing tanneries may also face environmental problems
and ultimately will be forced to close down production. The major minerals in the state
include pyrite, limestone, and mica, whereas minor minerals primarily consist of sand and
stones. The decorating stones like granite, magnate, and quartz are also available in large
quantity. A fair proportion of major mines fall under forest areas rendering it almost
difficult to approve mining lease for the mining work.
State Action Plan on Climate Change (SAPCC)-Jan 2015
- 115 -
12.2 Key Issues
The industries in Bihar remained plagued by a plethora of problems. According to
Economic Census 2005, out of a total of 12.25 lakh enterprises, only 7 percent were
financed by banks, 80 percent enterprises did not have power linkage, 11 percent
functioned without premises and 4 percent were seasonal. Only 63 percent enterprises
were registered and 82 percent had only five or less employees. At all-India level, a total
of 1.55 lakh factories were covered in 2008-09 as against 1777 in Bihar, of which 96.76
percent and 87.17 percent respectively were in operation.
A comparison with the corresponding figures for 2007-08 reveals that while the percentage
of operational units for all- India showed a moderate increase, the same for Bihar recorded
a decline. A detailed analysis of the data further reveals that while at all-India, the
proportion of agro-based factories in operation remained almost the same in both the years,
the same for the non-agro based industries showed a modest increase. However, in Bihar,
the proportion of units in both the categories registered a drop in 2008-09, more so for the
non-agro based industries.
The industrial group-wise analysis of net value added shows that, except for food
products/beverages/tobacco, all other groups under agro-based industries performed
poorly in terms of the state's share to all-India in 2008-09, compared to 2007-08.
The major agricultural products of Bihar are cereals, pulses, and oilseeds, along with
varieties of fruits and vegetables like mango, litchi, makhana, potato, tomato, cauliflowers,
etc. However, the farmers have been unable to harness the full benefits of these important
agricultural products in the absence of processing industries, which have also high
potential for employment generation. It is all because of poor pre-and post-harvest
management, as well as inadequate infrastructure for food processing.
Bihar is pioneer in production of rabi maize of quality variety with high protein content.
The farmers are shifting from wheat to rabi maize in the state for quite some time.
However, there are no processing facilities worth the name to complete the supply chain
of maize and, as such, bulk of maize goes out of the state for milling and maize-based
products. Similarly, all the groups under non-agro based category registered a major
setback, primarily on account of poor post- recession recovery, accentuated by poor
infrastructure in the state.
Bihar has witnessed complete turnaround during the last 6 years, and the state has moved
ahead on the trajectory of development with justice. However, the revival of sick industries
is yet to take place. With the creation of SIPB in the state, a total of 42,941 investment
proposals have been received since 2007-08. But, there remains a vast gap between the
investment proposals received, proposals approved and actual investments made. Though
all efforts are made by the state government, yet the slowing of the Indian economy in
recent years has affected the growth of the state's enterprises sector.

State Action Plan on Climate Change (SAPCC)-Jan 2015
- 116 -
12.3 Priorities
In the 12th FYP, focus will be on intensive efforts to promote industrial growth in areas
where the state has comparative advantage such as agro and food processing, tourism,
healthcare industry, higher and technical industrial education, FMCG and other consumer
goods, secondary steel sector, textiles, power and renewable energy generation. Growth
of the manufacturing sector in the 11th Plan is likely to remain at 8.2 percent.
There is need to raise this growth to 11-12 percent per year in the 12th Plan period to create
more jobs for the growing labour force. This has become an urgent need, since it is now
clear that agriculture will no longer absorb more workers. The manufacturing sector
(industry) performance is weak at the present scenario. Hence it has to perform better in
investment, production, and creation of jobs.
The overall strategy under the 12th FYP will include:
Promoting MSMEs 'cluster';
Thrust on skill up-gradation/Skill development Institutions. To adopt and
encourage PPP mode of investment;
Revival of PSUs of the state;
Rehabilitation of Sick Units; and
To promote value added production (food Processing) diversified products- milk,
fish, meat, and poultry, agro based wealth- consumer products.
The State government and private sector will collaborate for development of tourism
infrastructure. The state government will prepare an area-based Master Plan for
developing infrastructure as necessary for the respective areas and regions. Efforts will be
made to dovetail external assistance, central assistance, and the State plan resources with
private investments to attain the set goals as under the Master Plan.
12.4 Perceived Climate Impacts
While there have been no Bihar specific detailed studies on climate change available
evidence shows several pointers, as in the case of the energy sector. Industry is likely to
be vulnerable to a variety of climate risks, including extreme weather events that can
adversely impact industrial infrastructure. Agro-based and food processing industries that
rely on agricultural resources can be particularly vulnerable. Likewise, industries that are
either water or energy intensive could also be similarly vulnerable to climate change and
its impacts. Because of their financial and technical resources, large industrial
organizations typically have a significant adaptive capacity for addressing vulnerability to
weather extremes. SMEs typically have fewer financial and technical resources and
therefore less adaptive capacity.

State Action Plan on Climate Change (SAPCC)-Jan 2015
- 117 -
As such, climate change is likely to disproportionately impacts smaller industrial
establishments, in particular those in high risk or highly dependent on climate vulnerable
resources such as agriculture. On the other hand, industries could also contribute to climate
change. The industrial sector emissions of greenhouse gases (GHGs) include carbon
dioxide (CO2) from energy use, from non- energy uses of fossil fuels and from non-fossil
fuel sources (e.g., cement manufacture); as well as non-CO2 gases. Many industrial
segments also emit a range of non-CO2 GHGs including N2O from the chemical and food
industries. Industries can also contribute to climate change by a variety of other means,
including energy inefficiency.
12.5 Strategies
Towards improving scientific knowledge and evidence base and understanding of climate
change and its impacts, the Department will commission cluster-wise or district-wise
studies to estimate the carbon footprint of industrial clusters in the State. This would
include a baseline study, as well as periodic studies.In line with the overarching State
objectives of improving governance mechanisms, institutional decision-making and
convergence, the Industries Department, together with various industries associations will
initiate the following:
Carry out a review of the current industrial policy and strengthening it with reference
to climate change including explicit incorporation of climate concerns and the
institutional and governance framework for climate change initiatives vis-à-vis
industry will be enshrined in a proposed new Industrial policy;
Constitute a state-level Task Force, comprising representatives of the state
government, industry, and technical experts to drive the climate initiatives of the
BAPCC. The possibility/viability of establishing cluster-wise or district wise Sub-Task
Forces will also be examined.
The Industries Department recognises that many options exist for mitigating GHG
emissions from the industrial sector, in three broad categories:
Sector-wide options
Process-specific options,
Operating procedures,
As such, the Department will identify and put into motion processes for leveraging
these options in existing industrial units, as well examine ways to build these into plans
for the development of new industrial units. While it is clear that industries will not
invest in GHG mitigation if other factors provide a return on their investment, the
Department will examine ways of incentivising such investments and linking it to
initiatives such as energy efficiency projects, through which economic gains can
accrue.
Where industries lack of the financial and technical resources needed to implement
mitigation options, and have limitations in the ability to access and absorb
technological information about available options, the Department will seek to build
adequate linkages with financial institutions as also to build capacities of industrial

State Action Plan on Climate Change (SAPCC)-Jan 2015
- 118 -
establishments (potentially in partnership with other relevant
agencies/institutions/industries associations).
The Department will also seek to develop appropriate policy and regulatory
instruments that encourages the implementation of existing and new mitigation
technologies that could lead to lower GHG emissions, and seek to develop policy
portfolios that reduce the barriers to the adoption of cost-effective, low-GHG-emission
technologies, including CDM. The Department will also examine the possibility of
promoting voluntary agreements between industry and government to reduce energy
use and GHG emissions as part of its policy package.
The Department will promote and build awareness, and develop and deploy measures
to incentivise industries to adopt a range of management practices including energy
audits, adoption of energy efficiency measures and technologies, benchmarking, etc.
Likewise, the Department will also build awareness on options, opportunities and
benefits of fuel switching, including the use of waste materials, energy (especially heat
and power recovery), cogeneration (which could, for example, be readily adopted in
Bihar’s sugar industry), use of renewable energy including biomass and by-product
wastes based generation, and materials efficiency and recycling. Efforts will also be
initiated to undertake infrastructural improvements in industrial areas in the State.
The Department will also examine the options for developing and deploying a range
of financial instruments such as taxes, subsidies and measures to improve access to
capital as these could potentially lead to energy savings and corresponding emission
reductions and can create a larger market for energy efficient technologies. At the same
time, the Department will also examine options for budget allocations for research and
development on innovative technologies, subsidy, or legislation to stimulate specific
environmental technologies, or regulation/disincentives to reduce/eliminate use of
unsustainable technologies.
The Department will also take proactive steps to build partnerships with industry
associations, and through them, initiate sustained process to stimulate technological
innovation and change to reduce dependency on imported fuels, to improve resources
use efficiency, waste management, water and air pollution reduction, and enhance use
of renewables, while providing health benefits and improved services to communities.
Sector specific studies will also be undertaken, to examine options for improvement –
these will include, for example, the brick making sector, which generates significant
emissions from a large number of brick kilns in the state.
Mining activities are negligible in the State after the separation of Jharkhand, and as such,
will not need focus on in the BAPCC. However, the Department will undertake a study of
the mining sector, its status, and prospects from the standpoint of climate change and its
impacts in association with the Department of Mines and Geology. Appropriate strategies
and actions for the mining sector, if required, will be developed on the basis of the findings
of the study.

State Action Plan on Climate Change (SAPCC)-Jan 2015
- 119 -
12.6 Institutional Linkages and Stakeholders
Institutional linkages are envisaged various agencies/departments including BIADA, the
Energy Department, Water Resources Department, Environment and Forest Department
in addition to linkages with various industries associations, industrial groups and
entrepreneurs, as well as with academia, civil society, international development agencies,
private sector and financial institutions, and communities in general.
12.7 Linkages with the NAPCC
The outlined strategies herein are consistent with the NAPCC in general, as well as with
the National Mission on Energy Efficiency, the National Solar Mission, the National
Mission for Sustainable Agriculture, and the National Water Mission.
12.8 Sectoral Action Plan and Budgets under the BAPCC
See Part C, Action Plans and Budgets

State Action Plan on Climate Change (SAPCC)-Jan 2015
- 120 -
13. Human Health
13.1 Overview, Characteristics and Status
13.1.1 Key Health Indicators and Performance
Climate Change may be described 1st as “global” and 2nd as “nature”. Global- Change
includes environment disturbance arising from localized source, but having widely
dispersed effects. Global climate changes occur because of perturbation in systems
operating on a global level, and this makes stand out from other wide-ranging, human
induced environmental problems. Nature – Nature of Phenomenon and not by the
distribution of its impacts.
The average Temperature is a convenient metric for describing climate, but there are
other aspect of climate change that are more closely related to the incidence of disease
and injury.
Besides education, the status of health is also an important component of the human
development of a state. The status of health services in Bihar is still inadequate, but
substantial improvements have been recorded in this sector in recent years. This is because
of increase in expenditure for health services on one hand and better monitoring of the
health services on the other.
This section will present the relevant information on the various initiatives taken by the
state government to improve the health services in the state. These improved services have
indeed resulted in improved overall health situation in the state, as indicated by some
crucial health indicators. One of the key indicators of status of health in the state is the
Infant Mortality Rate (IMR). In spite of being the poorest state in the terms of per capita
income and having the least literacy rate, the IMR in Bihar is 48 per thousand live births
in 2010, nearly equal to national average of 47 per thousand live births. Between 2005 and
2010, the IMR in India has been reduced from 58 to 47. This pace of decline was even
higher for Bihar, as the IMR for Bihar has decreased from 61 in 2005 to 48 in 2010.
For the period 2005 to 2010, the rate of decline in birth rate in Bihar is higher than the
national average; but there is a still a long way to go to attain the replacement level fertility
rate. The District Level Household Survey (2002-04 and 2007-08) and Coverage
Evaluation Survey (2009) conducted by Ministry of Health and Family Welfare of the
central government show that there has been considerable improvement in Bihar as regards
Ante-Natal Care (ANC) for mothers, institutional delivery, and immunisation of children.
13.2 Key Issues
Key issues in the health sector primarily centre on the availability of health infrastructure,
which is lower than national standards/averages. Drinking water supply and sanitation
coverage and infrastructure is also relatively low, leading to frequent outbreaks water-
borne diseases. This is further compounded by frequent floods, heat and cold waves that
the State experiences. Shortage of skilled frontline health personnel (ANM, LHV) to
provide timely and quality ANC and PNC services is another problem confronting the
state. Besides, public health facilities providing obstetric and gynaecological care at
district and sub-district levels are inadequate.

State Action Plan on Climate Change (SAPCC)-Jan 2015
- 121 -
Bihar also has a high burden of diseases, which arises from natural calamities (such as
floods), poor environmental conditions (such as water and vector borne diseases), poor
nutrition status, and acute poverty in which a day’s wage is a significant incentive to skip
treatment.
13.3 Priorities
Under the 12th FYP, expansion of the State’s health infrastructure will be accorded high
priority. Two bills namely – (1) Bihar Clinical Establishment (Registration and
Regulation) Act and (2) Bihar Medical Service Institution and Individual Protection Act
have been passed by the State government. With the enactment of Bihar Clinical
Establishment Act, qualitative health services will be made available at government and
private health hospitals.
At the same time registration will also be essential. Bihar Medical Service Institution and
Individual Protection Act ensure security to doctors and health personnel at one end and
on the other hand also ensure that the poor and the common people are experiencing
excellent services at the health facility. By making Bihar Medical Services and
Infrastructure Corporation limited functional steps are being taken for purchasing of
equipment and construction of buildings. Setting up of Advance Trauma Centre is being
taken care of by State Health Society, Bihar.
ANM and GNM Training Schools will be strengthened after increasing the number of
seats as well as setting up new nursing colleges. Private players will be especially
encouraged to establish such schools and colleges. The state plans to move ahead with five
primary objectives that are going to define its guiding principles in the sector in the coming
years:
Reduce Maternal Deaths
Reduce infant deaths
Reduce Total Fertility Rate
Increase availability of medical professionals
Reduce barriers to access health services
Keeping in view the dearth of Super Specialist Hospitals in the state, at least one Super
Specialist Hospital will be established for each main disease in next five years. In order
to reduce the number of patients going outside for treatment, quality changes are being
made in health facilities located within the State. Efforts are being made to enhance
facilities provided by Mahavir Cancer Sansathan so that number of patients moving out
of state for treatment can be reduced.
The proposals to build three medical colleges in the state and its proper functioning will
be ensured. Besides, investors will be encouraged to invest for private medical colleges.
With the vision to strengthen the present medical colleges of the state, facilities like
building, specialized equipment, trained doctors and para-medical doctors will be
provided. In order to bring better health facilities to the present medical colleges, efforts
for improvement are being made by contacting Public Service Engineering Department
for building and electricity. Steps to improve all the medical colleges will be planned.
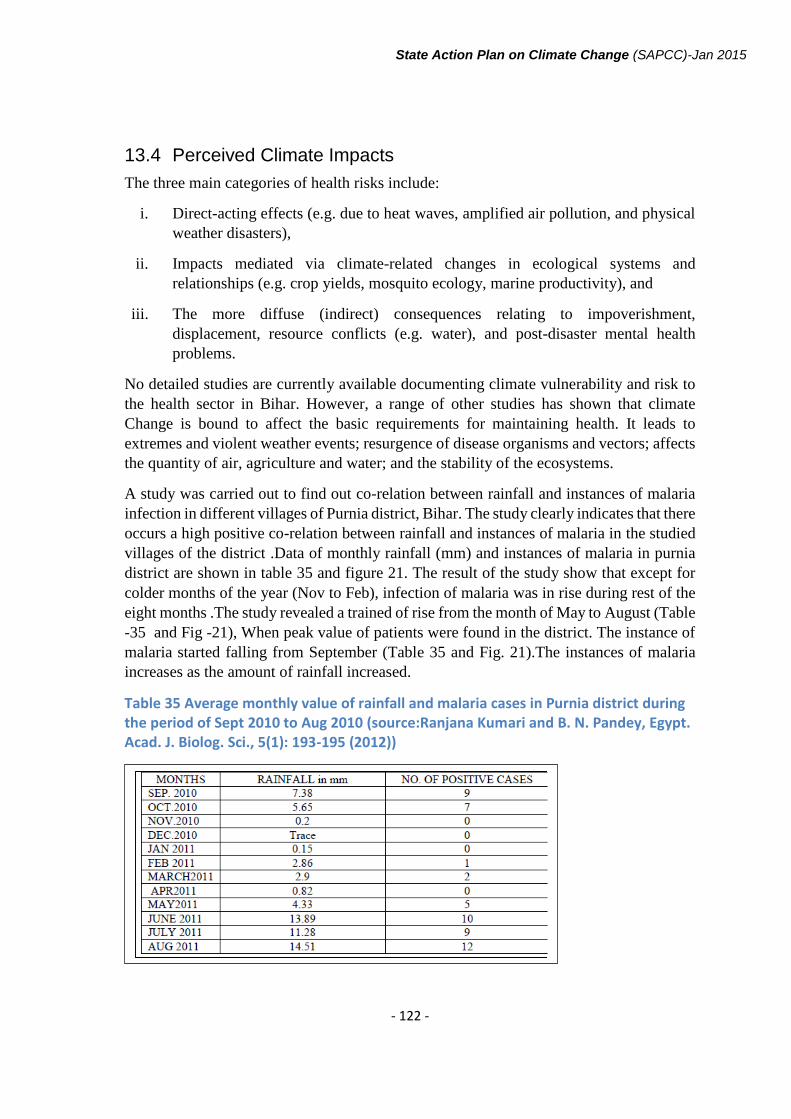
State Action Plan on Climate Change (SAPCC)-Jan 2015
- 122 -
13.4 Perceived Climate Impacts
The three main categories of health risks include:
i. Direct-acting effects (e.g. due to heat waves, amplified air pollution, and physical
weather disasters),
ii. Impacts mediated via climate-related changes in ecological systems and
relationships (e.g. crop yields, mosquito ecology, marine productivity), and
iii. The more diffuse (indirect) consequences relating to impoverishment,
displacement, resource conflicts (e.g. water), and post-disaster mental health
problems.
No detailed studies are currently available documenting climate vulnerability and risk to
the health sector in Bihar. However, a range of other studies has shown that climate
Change is bound to affect the basic requirements for maintaining health. It leads to
extremes and violent weather events; resurgence of disease organisms and vectors; affects
the quantity of air, agriculture and water; and the stability of the ecosystems.
A study was carried out to find out co-relation between rainfall and instances of malaria
infection in different villages of Purnia district, Bihar. The study clearly indicates that there
occurs a high positive co-relation between rainfall and instances of malaria in the studied
villages of the district .Data of monthly rainfall (mm) and instances of malaria in purnia
district are shown in table 35 and figure 21. The result of the study show that except for
colder months of the year (Nov to Feb), infection of malaria was in rise during rest of the
eight months .The study revealed a trained of rise from the month of May to August (Table
-35 and Fig -21), When peak value of patients were found in the district. The instance of
malaria started falling from September (Table 35 and Fig. 21).The instances of malaria
increases as the amount of rainfall increased.
Table 35 Average monthly value of rainfall and malaria cases in Purnia district during the period of Sept 2010 to Aug 2010 (source:Ranjana Kumari and B. N. Pandey, Egypt. Acad. J. Biolog. Sci., 5(1): 193-195 (2012))

State Action Plan on Climate Change (SAPCC)-Jan 2015
- 123 -
Figure 21 Average monthly value of rainfall and malaria cases in Purnia district during the period of September 2010 to August 2010 (source: Ranjana Kumari and B. N. Pandey, Egypt. Acad. J. Biolog. Sci., 5(1): 193-195 (2012))
The maximum cases of malaria where observed in rainy season, when rainfall by
maximum (Table -35) followed by summer and winter. The incidence of malaria was
maximum in the month of August followed by June and July. This clearly indicates that
there is positive co-relation between incidence of malaria and pattern of rainfall. The
malaria shows its appearance in the month of February, when ambinent temperature is
quite congenial for the parasite, vector as well as host.
13.5 Future Projection
No significant changes in Malaria transmission is seen over Bihar for future time periods
as in Fig.22
Figure 22 Projected risk of malaria transmission in the year 2020, compared with the average risk in the years 1961 to 1990 (Source: IPCC 2007)

State Action Plan on Climate Change (SAPCC)-Jan 2015
- 124 -
13.6 Strategies
The State Health Department is committed to the health and well being of all citizens and
visitors to the State, and as such, the Department will stake the necessary steps to gear up
for the potential health impacts from climate change, while continuing to contribute to the
achievement of the State’s health targets as well as the national health targets plan for 2012
– 2017.As the highest priority agenda, a Climate Change Cell will be constituted in the
Health Department, as well as district level sub-cells, and these will be mandated the task
of coordinating all climate related activities of the Department under the BAPCC as well
as liaising with the State institutional and coordination mechanisms outlined in an earlier
section of this report.
The Department will undertake collation and review of all available material and evidence
related to climate change impacts on human health, and also undertake a review of health
policies, plans, and institutional frameworks in the State with a view to incorporating
climate concerns. In line with the overarching principle of improving scientific knowledge,
evidence base and understanding of climate change and its impacts on human health, the
Health Department will begin building a strong evidence base including collecting,
compiling, and analysing relevant data and information in terms of perceptions of affected
people and communities.
Based on the results of the comprehensive vulnerability analyses to be undertaken by the
State, will review the adequateness of its current plans and institutional frameworks to
respond to climate concerns in the health sector at all levels. Plans at all levels including
the District health Plans will be suitably amended.
Based on current evidence, it is anticipated that the Department will initiate action
relating to:
Coordination with other departments will be a key strategy towards seeking a
comprehensive health plan within the state. Towards establishing this a state level
coordination committee comprising of members from ICDS, Panchayati Raj,
Education, Water and PHED under the chairmanship of Development
Commissioner would jointly work to seek support from other development
departments in improving the quality of service delivery is proposed.
Conducting regular survey and surveillance for heat related illness and Filling up
the existing shortfalls in the health infrastructure of the State and increasing the
percentage of population covered under the health drugs.
Awareness building for the decision makers: Awareness generation and training
programs to sensitize them on the climate change and its impact on human health
Integration Early Warning System with health departments – Short term weather
forecast and seasonal forecasts should be used to plan for the coming weeks and
season ahead. This will allow for early action in terms of procurement and pre-
positioning of stocks and giving health prevention message to communities

State Action Plan on Climate Change (SAPCC)-Jan 2015
- 125 -
Setting up of an Institute of Environmental Health Sciences: A full- fledged
institute in the state to undertake operational research on epidemic-prone diseases
and also to impart training for different functionaries of the health services
department and other line departments. Research studies on the eco-epidemiology,
virology, parasitology, entomology, and environmental factors with respect to the
epidemic- prone diseases can be undertaken under the institute.
A hub at the Panchayat level is proposed that could provide various entitlement
based facilities to people. For achieving efficiency, accountability and providing
transparent services focus will be on developing the capacity of the departments;
improve the direction, utilization and effectiveness of budget spending, enhance
the availability of skilled medical, nursing and support professionals, strengthen
information, monitoring and evaluation systems, enhance the capacity for strategic
planning and evidence based decision making, improve governance, social
accountability and transparency.
Identify most vulnerable communities – Identify specific population with limited
capacity to adapt to various health related stresses.
Undertaking measures to manage increased vector borne and water borne disease
burden;
Design and deploy improved approaches to deal with heat and wave conditions;
Dealing with the physical and psychological impacts post-extreme weather events.
Addressing drought, malnutrition, and food security issues; and
Addressing food safety arising due to increased ambient temperature and extreme
events.
Undertaking reviews of the State’s health infrastructure and potential climate change
related vulnerabilities and risks (and where such infrastructure is found to be at high risk,
retrofit to make these more climate resilient);
The Department will initiate a range of capacity building measures including:
Awareness of people about health hazard from climatic change, covering all areas like
rain water harvesting, energy efficiency, health hazards, water conservation, protection
from extreme climate etc.;
Information, education and communication efforts;
Behavioural change communications interventions in relation to the impacts of climate
change;
Trainings and Sensitizations for Department personnel;
Capacity Building of the all medical personnel of in districts including frontline
functionaries and personnel associated with various programmes such as the Integrated
Disease Surveillance Programme, Auxiliary Nurse Midwife, Aanganwadi Worker,

State Action Plan on Climate Change (SAPCC)-Jan 2015
- 126 -
ASHA & all the medical NGO’s in the district to identify the early signs of extreme
climatic effects on the population; and
Developing and strengthening of disaster management teams in every district hospital
specifically to respond to the effect of extreme climate changes.
13.7 Institutional Linkages and Stakeholders
Institutional linkages are envisaged various agencies/departments including the
Agriculture Department and the Water Resources Department, in addition to linkages with
various industries associations, industrial groups and entrepreneurs, as well as with
academia, civil society, international development agencies, private sector and financial
institutions, and communities in general.
13.8 Linkages with the NAPCC
The outlined strategies herein are consistent with the NAPCC in general.
13.9 Sectoral Action Plan and Budgets under the BAPCC
See Part C, Action Plans and Budgets

Part C-Action Plans and Budgets
Annexures from page – 127 to 178

Annexures – (Action Plan and Budget) SAPCC- Jan 2015
- 127 -
Annexure 1: Overarching State Level Actions Interventions Intervention Type Activities Duration
Total Cost (in
lakh)
Possibility of convergence Expected Outcome
Short-term actions
Coordination and networking Coordination/management
Setting up of State Climate Change Action Plan Coordination Cell
1 year Multi-sector coordination across all departments
Streamlined mechanisms for coordination of all activities under the BAPCC
Climate risk assessments
Risk management Detailed vulnerability assessments across all focus sectors
1 year Multi-sector approach
Improved understanding of climate change vulnerabilities and risks across sectors and districts
State Centre for Climate Change
Scientific research, cooperation and capacity building
Setting up of State Centre for Climate Change
1 year
Coordination across scientific community in state and elsewhere; coordination with Bihar Space Applications Centre and other remote sensing centres/agencies
Coordination mechanisms for scientific research and capacity building on Climate change
Roadmap for Sector climate change impacts evidence base strengthening and documentation
1 year
Coordination across scientific community in state and elsewhere; convergence with focus sectors
Detailed strategy for collation and strengthening of evidence base towards improving scientific understanding of climate change and impacts
Capacity Building Human resource development Capacity needs assessment and roadmap for capacity building at State level
1 year Convergence with focus sectors
Clear understanding of capacity needs at State level vis-à-vis climate change and its impacts
Monitoring and Evaluation
Monitoring Development of detailed reporting and M&E plan
1 year Convergence with all line departments
Comprehensive framework for M&E for the BAPCC
Knowledge management
Knowledge management Development of detailed KM strategy
1 year Convergence with all focus sectors
Detailed multi-year strategy for KM under BAPCC
Medium-term actions

Annexures – (Action Plan and Budget) SAPCC- Jan 2015
- 128 -
Interventions Intervention Type Activities Duration Total
Cost (in lakh)
Possibility of convergence Expected Outcome
Climate Change Coordination Cell
Coordination/management To be detailed by GoB 5 years (12th FYP period)
Convergence with all focus sectors
Fully functional Climate Change coordination cell
State Centre for Climate Change
Scientific research, cooperation and capacity building
To be detailed by GoB 5 years (12th FYP period)
Convergence with all focus sectors
Fully functional State Centre for Climate Change
Capacity building Human resource development To be detailed by GoB 5 years (12th FYP period)
Convergence with all focus sectors
Improved state capacities to understand and address climate change issues
Monitoring and evaluation
M&E
Quarterly BAPCC monitoring reports
5 years (12th FYP period)
Convergence with all focus sectors Results for programme
implementation improvements and mid-course corrections; lessons learnt on what worked and what didn’t; input for improved annual plans for 13th FYP.
Internal Annual Review of BAPCC implementation
5 years (12th FYP period)
Convergence with all focus sectors
External mid-term review of BAPCC Implementation
5 years (12th FYP period)
Convergence with all focus sectors
Evaluation of BAPCC implementation
5 years (12th FYP period)
Convergence with all focus sectors
Knowledge Management
Knowledge Management
Hosting of geo-portal on climate change
5 years (12th FYP period)
Convergence with all focus sectors
Significantly improved awareness of and understanding of climate change in the State, and among its citizens/communities
Host-hub for knowledge/information sharing related to climate change; detailed dissemination planning and dissemination
5 years (12th FYP period)
Identification of potential research and development domains concerned with climate change issues in the state
5 years (12th FYP period)
Knowledge repository 5 years (12th FYP period)
Technical demonstration, research and development, extension and transfer of technology protocols, relating to climate change
5 years (12th FYP period)

Annexures – (Action Plan and Budget) SAPCC- Jan 2015
- 129 -
Annexure 2: Agriculture
Interventions Intervention Type Activities Duration Total
Cost (in lakh)
Possibility of convergence Expected Outcome
Short-term actions
Policy reviews Policy
Review of state agriculture and allied sector policies; incorporation of climate concerns (based on sector vulnerability assessment)
1-1.5 years 15 Convergence with linked sectors such as water resources, energy, etc.
Sector policies explicitly reflect climate concerns
Coordination and networking Coordination/management Setting up of Climate Change Cell 1 year 25
Convergence with districts and linked sectors such as water resources, energy, etc.
Streamlined mechanisms for coordination of all sector activities under the BAPCC
Capacity Building Human resource development Sector capacity needs assessment 1 year 25 Convergence with districts
Clear understanding of sector capacity needs at State and sub-state levels vis-à-vis climate change and its impacts
Planning Planning
Development of agro-climatic zone-wise adaptation plans, incorporation into Agriculture Roadmap
1-1.5 years
76 Convergence with districts Zone-specific climate response plans in place
Poverty, equity and livelihoods study and strategy formulation 15 Convergence with districts
Enhanced understanding of poverty and equity issues in the sector; integrated into policy and planning
Monitoring and Evaluation
Monitoring Contribution to BAPCC Monitoring Plan
1 year 50 Convergence with districts Sector M&E framework in place
Knowledge management
Knowledge management Contribution to BAPCC KM Strategy and roadmap
1 year 25 Convergence with districts and linked sectors such as water resources, energy, etc.
Sector KM strategy in place
Medium-term actions
Capacity building Human resource development Capacity building of department personnel and stakeholders (to be detailed by Department)
Within/over 5 years (12th FYP period)
150 Convergence with all focus sectors
Improved sector capacities to understand and address climate change issues
Forecasting and early warning systems
Risk management
Weather services and early warning systems through enhanced agro-met technology deployment and information dissemination
Within/over 5 years (12th FYP period)
200 Convergence with districts and linked sectors such as water resources, energy, etc.
Improved risk management and early warning systems

Annexures – (Action Plan and Budget) SAPCC- Jan 2015
- 130 -
Interventions Intervention Type Activities Duration Total
Cost (in lakh)
Possibility of convergence Expected Outcome
Improved varieties and practices
Science and technology Development and deployment of improved crop varieties (drought and flood tolerant)
Within/over 5 years (12th FYP period)
750 Convergence with scientific research institutions/academia
Improved crop resilience
Irrigation Research, technology adoption/transfer
Study on irrigation efficiency improvements
Within/over 5 years (12th FYP period)
25
Convergence with districts and linked sectors such as water resources, energy, etc.
Improved irrigation efficiency; diversified and climate resilient irrigation infrastructure
Study on irrigation infrastructure improvements/adaptation 25
Revival/rehabilitation of traditional irrigation systems 400
Micro-irrigation systems augmentation 500
Solar and wind power systems for irrigation 200
Soil and water conservation
Watershed development Agroforestry, integrated watershed management
Within/over 5 years (12th FYP period)
500 Convergence with districts and linked sectors such as water resources, energy, etc.
Improved soil and water management practices; improved climate resilience in intervention areas
Integrated nutrient and pest management
Risk management; research/technology transfer
Study on integrated nutrient and pest management based on sector climate vulnerability assessment; development of management options
Within/over 5 years (12th FYP period)
1000 Convergence with scientific research institutions/academia
Improved nutrient and pest management practices and climate resilience
Monitoring and evaluation
M&E
Quarterly sector monitoring reports
Within/over 5 years (12th FYP period)
100 Convergence with districts and linked sectors such as water resources, energy, etc.
Results for programme implementation improvements and mid-course corrections; lessons learnt on what worked and what didn’t; input for improved annual plans for 13th FYP.
Internal Annual Review of sector implementation under BAPCC 100
Knowledge Management
Knowledge Management
Identification of potential research and development domains concerned with climate change issues in the sector; initiating studies
5 years (12th FYP period)
500 Convergence with districts and linked sectors such as water resources, energy, etc.
Significantly improved awareness of and understanding of climate change in the sector and its stakeholders Knowledge repository, strengthening
evidence base 100

Annexures – (Action Plan and Budget) SAPCC- Jan 2015
- 131 -
Interventions Intervention Type Activities Duration Total
Cost (in lakh)
Possibility of convergence Expected Outcome
Technical demonstration, research and development, extension and transfer of technology protocols, relating to climate change
10000
Sector co-benefits identification study 25
Documentation on community perceptions of climate change and impacts
25
Networking and linkages
Networking and coordination
Institutional linkages with research/academic institutions Within/over 5
years (12th FYP period)
50 Linkages with academia, civil society and communities
Improved networking and communications with academia, participatory sector processes
Consultations with civil society 50
Consultations with communities 50
Total Budget for 5 years (12th FYP period) 14981*
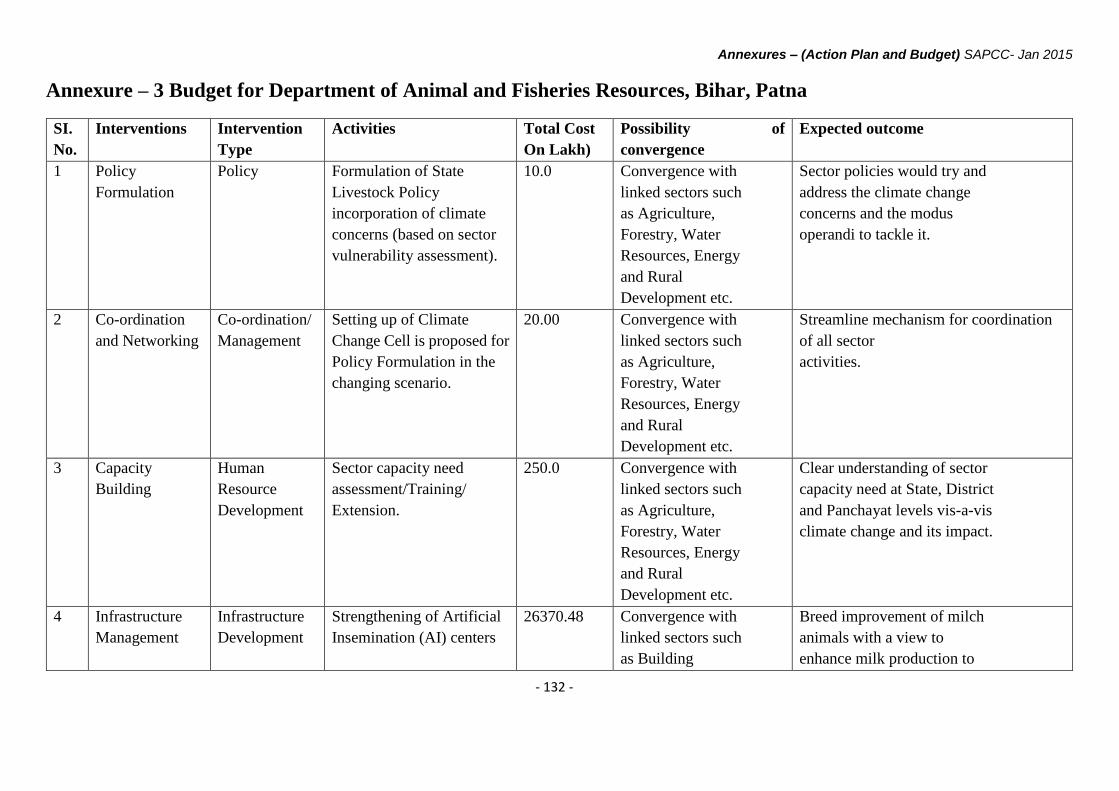
Annexures – (Action Plan and Budget) SAPCC- Jan 2015
- 132 -
Annexure – 3 Budget for Department of Animal and Fisheries Resources, Bihar, Patna
SI.
No.
Interventions Intervention
Type
Activities Total Cost
On Lakh)
Possibility of
convergence
Expected outcome
1 Policy
Formulation
Policy Formulation of State
Livestock Policy
incorporation of climate
concerns (based on sector
vulnerability assessment).
10.0 Convergence with
linked sectors such
as Agriculture,
Forestry, Water
Resources, Energy
and Rural
Development etc.
Sector policies would try and
address the climate change
concerns and the modus
operandi to tackle it.
2 Co-ordination
and Networking
Co-ordination/
Management
Setting up of Climate
Change Cell is proposed for
Policy Formulation in the
changing scenario.
20.00 Convergence with
linked sectors such
as Agriculture,
Forestry, Water
Resources, Energy
and Rural
Development etc.
Streamline mechanism for coordination
of all sector
activities.
3 Capacity
Building
Human
Resource
Development
Sector capacity need
assessment/Training/
Extension.
250.0 Convergence with
linked sectors such
as Agriculture,
Forestry, Water
Resources, Energy
and Rural
Development etc.
Clear understanding of sector
capacity need at State, District
and Panchayat levels vis-a-vis
climate change and its impact.
4 Infrastructure
Management
Infrastructure
Development
Strengthening of Artificial
Insemination (AI) centers
26370.48 Convergence with
linked sectors such
as Building
Breed improvement of milch
animals with a view to
enhance milk production to

Annexures – (Action Plan and Budget) SAPCC- Jan 2015
- 133 -
SI.
No.
Interventions Intervention
Type
Activities Total Cost
On Lakh)
Possibility of
convergence
Expected outcome
Construction
Department etc.
counter production loss due to
adverse climatic condition.
5 Resource
Management.
Conservation
of
native breeds of
cattle and
buffalo
In-Situ conservation of
Cattle and Buffalo Native to
Bihar through
Establishment of Nucleus
Herds
759.03 Convergence with
linked sectors such
as Agriculture
University etc.
Conservation of disease
resistant and stress resistant
native breeds of cattle and
buffalo to adjust with climatic
changes and production.
6. Infrastructure/
Resource
Management.
Livestock
Health
Management
Strengthening of
Veterinary Hospitals/
Dispensaries/ Mobile
Veterinary Clinics.
14326.00 Convergence with
linked sectors such
as Building
Construction
Department etc.
Treatment of livestock
through well equipped
hospitals and dispensaries as
well as through Mobile
Veterinary Clinics in remote
areas in case of emerging
diseases.
7. Infrastructure/
Resource
Management.
Coservation of
local disease
resistant native
breeds of cattle
and Bio-gas
utilization.
Strengthening of Goshalas 860.00 Convergence with
linked sectors such
as Building
Construction
Department,
Agriculture, BREDA
etc.
Coservation of local disease
resistant native breeds of
animals as well as setting up of
Bio-gas plants so as to capture
and utilize methane gas.
8. Health Care
Management.
Livestock
Health
Management
Mass deworming
programme.
33810.00 Mass deworming of livestock
to combat endo and ectoparasitic
infestation in adverse climatic condition
to sustain stress.

Annexures – (Action Plan and Budget) SAPCC- Jan 2015
- 134 -
SI.
No.
Interventions Intervention
Type
Activities Total Cost
On Lakh)
Possibility of
convergence
Expected outcome
9. Nutritional
Management.
Nutritional
Management of
Livestock.
Distribution of Seeds of
Green fodder.
2450.00 Convergence with
linked sectors such
as Agriculture,
Forestry, Water
Resources etc.
Seeds of green fodder suitable
for changing climate will be
distributed to combat fodder
crisis.
10. Health Care
Management.
Livestock
Health
Management.
Livestock Disease Early
Warning System
58.40 Development of disease
forecasting system in changing
climatic scenario through
NADRS.
Total budget for 5 years 78913.91
This is a tentative budget. The amount may be finalized as per discussion/decision taken by competent authority.

Annexures – (Action Plan and Budget) SAPCC- Jan 2015
- 135 -
Annexure 4: Forests and Biodiversity Interventions Intervention type Activities Duration Total
Cost (in
lakh)
Possibility of convergence Expected Outcome
Short-term actions
Policy reviews Policy Review of state forest
sector policies;
incorporation of climate
concerns (based on
sector vulnerability
assessment)
1.15 years 25 Convergence with linked
sectors such as water
resources, energy, etc.
Sector policies explicitly
reflect climate concerns
Coordination
and networking
Coordination/management Setting up of Climate
Change Cell
1 year 100 Convergence with districts
and linked sectors such as
water resources, energy, etc.
Streamlined mechanisms for
coordination of all sector
activities under the BAPCC
Capacity
Building
Human resource
Development
Sector capacity needs
assessment
1 year 50 Convergence with districts
and linked sectors such as
water resources, energy, etc.
Clear understanding of sector
capacity needs at State and
sub-state levels vis-à-vis
climate change and its
impacts
Planning Planning
Review of forest
working
plans and incorporation
of climate concerns
1 year 25 Convergence with districts
and linked sectors such as
water resources, energy,etc.
Revised working plans
explicitly incorporate climate
concerns
Institutional arrangements
Activation of State
Biodiversity Board;
development of
multiannual
action plans covering
12th FYP
1 year 50 Convergence with districts
and linked sectors such as
water resources, energy,etc.
Functional State Biodiversity
Board in place, with action
plans
Sub-total – Policy-Planning, HRD, Climate Change Cell
Institutional Arrangement
250
Interventions in Forest/biodiversity
protection,
Interventions in very
dense forests initiated
1-1.5 year 100 Convergence with districts
and linked sectors such as
Initial Interventions on-
stream

Annexures – (Action Plan and Budget) SAPCC- Jan 2015
- 136 -
Interventions Intervention type Activities Duration Total
Cost (in
lakh)
Possibility of convergence Expected Outcome
forest and non-
forest areas
conservation, and green
cover augmentation
Interventions in
moderately dense forests
initiated
1-1.5 year 400 water resources, energy,etc.
Interventions in open
forests initiated
1.15 years 1000
Interventions in scrub
forests initiated
1.15 years 500
Specific interventions in
the Valmiki Tiger
Reserve and National
Park initiated
1.15 years 500
Specific interventions in
wetlands and river
ecosystems initiated
1.15 years 1000
Specific interventions in
non-forest areas initiated
1.15 years 2500
Sub-total 6000
Research Research Study on forest and
NTFP dependence of
communities
1.15 years 50 Convergence with district
administrations and social sector
departments
Comprehensive
understanding of community-
forest interface and
dependence, especially on
NTFP’s
Monitoring and
Evaluation
Monitoring Contribution to BAPCC
Monitoring Plan
1 year 25 Convergence with districts Sector M&E framework in
place
Knowledge
management
Knowledge management Contribution to BAPCC
KM Strategy and
roadmap
1 year 25 Convergence with districts and
linked sectors such as water
resources, energy, etc.
Sector KM strategy in place
Sub-total 100
Total short-term actions 6350
Medium-term action
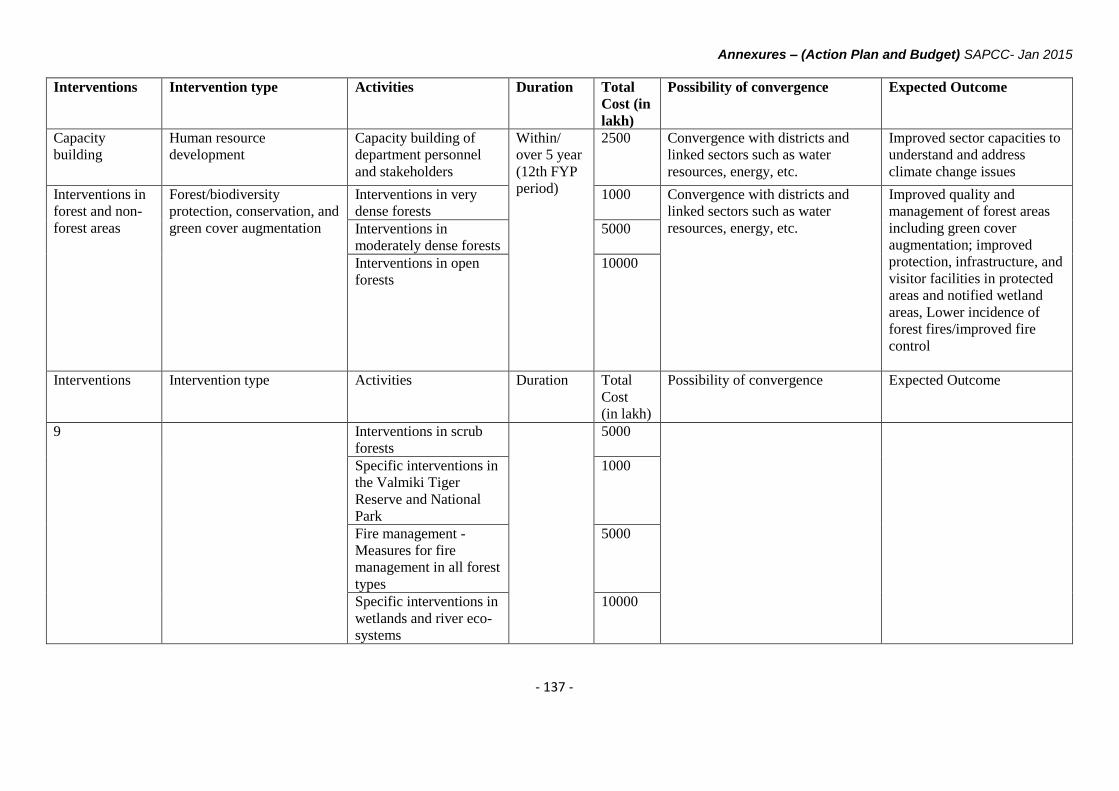
Annexures – (Action Plan and Budget) SAPCC- Jan 2015
- 137 -
Interventions Intervention type Activities Duration Total
Cost (in
lakh)
Possibility of convergence Expected Outcome
Capacity
building
Human resource
development
Capacity building of
department personnel
and stakeholders
Within/
over 5 year
(12th FYP
period)
2500 Convergence with districts and
linked sectors such as water
resources, energy, etc.
Improved sector capacities to
understand and address
climate change issues
Interventions in
forest and non-
forest areas
Forest/biodiversity
protection, conservation, and
green cover augmentation
Interventions in very
dense forests
1000 Convergence with districts and
linked sectors such as water
resources, energy, etc.
Improved quality and
management of forest areas
including green cover
augmentation; improved
protection, infrastructure, and
visitor facilities in protected
areas and notified wetland
areas, Lower incidence of
forest fires/improved fire
control
Interventions in
moderately dense forests
5000
Interventions in open
forests
10000
Interventions Intervention type Activities Duration Total
Cost
(in lakh)
Possibility of convergence Expected Outcome
9 Interventions in scrub
forests
5000
Specific interventions in
the Valmiki Tiger
Reserve and National
Park
1000
Fire management -
Measures for fire
management in all forest
types
5000
Specific interventions in
wetlands and river eco-
systems
10000

Annexures – (Action Plan and Budget) SAPCC- Jan 2015
- 138 -
Interventions Intervention type Activities Duration Total
Cost (in
lakh)
Possibility of convergence Expected Outcome
Specific interventions in
non-forest areas
15000
Survey, identify,
catalogue, document ,
protect; and
improve/enhance the
status of biodiversity
rich areas in the State
1000 Biodiversity registers in
place/progress; publication/s
on state’s biodiversity
resources; enhanced
biodiversity
conservation/management
practices in places
Sub-total – Interventions in forests and non-forest areas 53000
Planning Research; Planning Study on and
development of plans for
interventions in
wetlands areas
100 Convergence with districts and
linked sectors such as water
resources, energy, etc.
Detailed strategy and
management plans for
interventions in wetland areas
in place
Research Research; Planning Study on potential for
REDD +
Within/over
5 year (12th
FYP
period)
100 Linkages with academia,
consulting
organisations/individuals
Enhanced strategies and
action for forest and
biodiversity conservation Studies on indigenous
trees species to assess
their vulnerability to
climate change
200
Assessing and
documenting additional
threats to biodiversity
and wildlife
100
Population dynamics
and movement of key
indicator wildlife
species,
100
Population dynamics
and movement of key
indicator wildlife
species
100

Annexures – (Action Plan and Budget) SAPCC- Jan 2015
- 139 -
Interventions Intervention type Activities Duration Total
Cost (in
lakh)
Possibility of convergence Expected Outcome
Monitoring and
evaluation
M&E Quarterly sector
monitoring reports
Within/over
5 year (12th
FYP
period)
500 Convergence with districts and
linked sectors such as water
resources, energy, etc.
Results for programme
implementation
improvements and mid-
course corrections; lessons
learnt on what worked and
what didn’t, input for
improved annual plans for
13th FYP
Internal Annual Review
of sector implementation
under BAPCC
100
Knowledge
management
Knowledge management Identification of
potential research and
development domains
concerned with climate
change issues in the
sector, initiating studies
5 year (12th
FYP
period)
50 Convergence with districts and
linked sectors such as water
resources, energy, etc.
Significantly improved
awareness of and
understanding of climate
change in the sector and its
stakeholders
Knowledge repository,
strengthening evidence
base
50
Technical demonstration
research and
development, extension
and transfer of
technology protocols,
relating to climate
change
1000
Documentation on
community perceptions
of climate change and
impacts
50
Networking and
linkages
Networking and
coordination
Institutional linkages
with research/academic
institutions
Within/over
5 year (12th
FYP
period)
50 Linkages with academia civil
society and communities
Improved networking and
communications with
academia participatory sector
processes Consultations with civil
society
50

Annexures – (Action Plan and Budget) SAPCC- Jan 2015
- 140 -
Interventions Intervention type Activities Duration Total
Cost (in
lakh)
Possibility of convergence Expected Outcome
Consultations with
communities
Sub-total – Planning, Research, M & E , Knowledge
management, Networking
2550
Total – Medium-term
Actions/Interventions
58050
Total Budget for 5 years
(12th FYP period)
64400

Annexures – (Action Plan and Budget) SAPCC- Jan 2015
- 141 -
Annexure 5: Water Resources
Interventions Intervention Type Activities Duration
Total
Cost
(in
lakh)
Possibility of
convergence Expected Outcome
Short-term actions
Policy Formulation Policy
Formulation of State Water
Policy; incorporation of climate
concerns (based on sector
vulnerability assessment)
1-1.5 years 10
Convergence
with linked
sectors such as
agriculture,
forestry,
energy, etc.
Sector policies
explicitly reflect
climate concerns
Coordination and
networking Coordination/management
Setting up of Climate Change
Cell 1 year 20
Convergence
with linked
sectors such as
agriculture,
forestry,
energy, etc.
Streamlined
mechanisms for
coordination of all
sector activities under
the BAPCC
Capacity Building Human resource development Sector capacity needs
assessment 1 year 10
Convergence
with linked
sectors such as
agriculture,
forestry,
energy, etc.
Clear understanding of
sector capacity needs
at State and sub-state
levels vis-à-vis climate
change and its impacts
Planning Planning Formulation of State Water
Sector Roadmap 1 – 1.5 years 10
Convergence
with linked
sectors such as
agriculture,
forestry,
energy, etc.
Comprehensive water
sector plan in place
Research Research
Study on projection of water
resources availability in time
and space
1 – 1.5 years 50
Convergence
with linked
sectors such as
Enhanced
understanding of key
sector issues;

Annexures – (Action Plan and Budget) SAPCC- Jan 2015
- 142 -
Interventions Intervention Type Activities Duration
Total
Cost
(in
lakh)
Possibility of
convergence Expected Outcome
Study on poverty and equity
issues in the water sector;
incorporation of findings into
Water Sector Roadmap
1 – 1.5 years
agriculture,
forestry,
energy, etc.
improved management
practices
Monitoring and
Evaluation Monitoring
Contribution to BAPCC
Monitoring Plan 1 year 50
Convergence
with districts
Sector M&E
framework in place
Knowledge
management Knowledge management
Contribution to BAPCC KM
Strategy and roadmap 1 year 20
Convergence
with districts
and linked
sectors such as
water
resources,
energy, etc.
Sector KM strategy in
place Comprehensive water data base
in public domain and water
resources information system
initiated
1 year 50
Total Budget for Short Term Actions 220
Medium-term actions
Capacity building Human resource development
Capacity building of
department personnel and
stakeholders (to be detailed by
Department) including
Panchayati Raj Institutions,
urban local bodies and primary
stakeholders such as WUAs in
participatory management of
water facilities
Within/over
5 years (12th
FYP period)
50
Convergence
with districts
and linked
sectors such as
water
resources,
energy, etc.
Improved sector
capacities to
understand and
address climate change
issues
Planning Research; Planning
Study on and development of
plans for interventions in non-
notified wetland areas
Within/over
5 years (12th
FYP period)
400
Convergence
with districts
and linked
sectors such as
water
resources,
energy, etc.
Detailed strategy and
management plans for
interventions in non-
notified wetland areas
in place

Annexures – (Action Plan and Budget) SAPCC- Jan 2015
- 143 -
Interventions Intervention Type Activities Duration
Total
Cost
(in
lakh)
Possibility of
convergence Expected Outcome
Infrastructure/resource
management
Water infrastructure/resource
augmentation/conservation/management
Inventory of and revival/ repair
of Ahar-Pynes and traditional
systems of water initiated
Within/over
5 years (12th
FYP period)
1000
Convergence
with districts
and linked
sectors such as
water
resources,
energy, etc.
Enhanced water sector
infrastructure assets
and management
practices; improved
sector resilience
Conservation and preservation
of wetlands and maintenance of
optimal wetland hydrology
Within/over
5 years (12th
FYP period)
10000
Groundwater resources
regulation and
recharge/replenishment
Within/over
5 years (12th
FYP period)
5000
Actions for water use efficiency
across sub-sectors
Within/over
5 years (12th
FYP period)
5000
Actions for improving water
quality
Within/over
5 years (12th
FYP period)
1000
Actions for adaptive retrofitting
of infrastructure assets and
O&M improvements
Within/over
5 years (12th
FYP period)
10000
Monitoring and
evaluation M&E
Quarterly sector monitoring
reports
Within/over
5 years (12th
FYP period)
1000 Convergence
with districts
and linked
sectors such as
water
resources,
energy, etc.
Results for programme
implementation
improvements and
mid-course
corrections; lessons
learnt on what worked
and what didn’t; input
for improved annual
plans for 13th FYP.
Internal Annual Review of
sector implementation under
BAPCC
1000
Knowledge
Management Knowledge Management
Identification of potential
research and development
domains concerned with climate
change issues in the sector;
5 years (12th
FYP period) 200
Convergence
with districts
and linked
sectors such as
Significantly improved
awareness of and
understanding of
climate change in the

Annexures – (Action Plan and Budget) SAPCC- Jan 2015
- 144 -
Interventions Intervention Type Activities Duration
Total
Cost
(in
lakh)
Possibility of
convergence Expected Outcome
initiating studies (may be with
Central University of Bihar,
Patna)
water
resources,
energy, etc.
sector and its
stakeholders
Knowledge repository,
strengthening evidence base 50
Technical demonstration,
research and development,
extension and transfer of
technology protocols, relating
to climate change
10
Sector co-benefits identification
study 20
Documentation on community
perceptions of climate change
and impacts
20
Networking and
linkages Networking and coordination
Institutional linkages with
research/academic institutions Within/over
5 years (12th
FYP period)
50 Linkages with
academia, civil
society and
communities
Improved networking
and communications
with academia,
participatory sector
processes
Consultations with civil society 50
Consultations with communities 50
Total Budget for 5 years (12th FYP period) 43900*

Annexures – (Action Plan and Budget) SAPCC- Jan 2015
- 145 -
Annexure 6: Disaster Management
Interventions Intervention Type Activities Duration
Total Cost (in lakh)
Possibility of convergence
Expected Outcome
Short-term actions
Coordination and networking
Coordination/management Setting up of Climate Change Cell
1 year 5
Convergence with linked sectors such as agriculture, forestry, energy, etc.
Streamlined mechanisms for coordination of all sector activities under the BAPCC
Capacity Building Human resource development Sector capacity needs assessment
1 year 10
Convergence with linked sectors such as agriculture, forestry, energy, etc.
Clear understanding of sector capacity needs at State and sub-state levels vis-à-vis climate change and its impacts
Planning Planning
Incorporation of climate change concerns into State Disaster Management Plan (based on climate vulnerability and risk assessment)
1 – 1.5 years 5
Convergence with linked sectors such as agriculture, forestry, energy, etc.
Comprehensive water sector plan in place
Monitoring and Evaluation
Monitoring Contribution to BAPCC Monitoring Plan
1 year 5 Convergence with districts
Sector M&E framework in place
Knowledge management
Knowledge management Contribution to BAPCC KM Strategy and roadmap
1 year 5
Convergence with districts and linked sectors such as water resources, energy, etc.
Sector KM strategy in place
Medium-term actions
Capacity building Human resource development Capacity building of personnel at Department,
Within/over 5 years (12th FYP period)
50 Convergence with districts and linked
Improved sector capacities to understand and address climate change issues

Annexures – (Action Plan and Budget) SAPCC- Jan 2015
- 146 -
Interventions Intervention Type Activities Duration
Total Cost (in lakh)
Possibility of convergence
Expected Outcome
SDMA, and other stakeholders
sectors such as water resources, energy, etc.
Monitoring and evaluation
M&E
Quarterly sector monitoring reports
Within/over 5 years (12thFYP period)
25
Convergence with districts and linked sectors such as water resources, energy, etc.
Results for programme implementation improvements and mid-course corrections; lessons learnt on what worked and what didn’t; input for improved annual plans for 13th FYP.
Internal Annual Review of sector implementation under BAPCC
Improving scientific knowledge and evidence base and understanding of climate change and its impacts; capacity building
Research Training & Capacity Building
Study of recent changes in climate parameters Monitoring of various climate parameters
Within/over 5 years (12th FYP period)
10 In collaboration with IISc Bangalore and PRL Ahmedabad Forest & agriculture For community level training: PRIs, District Administration
Data on changes in various climate related parameters Monitoring the changes in various climate parameters. Land use /land change scenario Promotion of Safe construction technology More trained persons
Land use / land cover change studies for various towns of the state using high resolution satellite imageries (IKONOS and WV 2)
10
Community based risk assessment Preparation of disaster management plan Training of community members on search and rescue.
10

Annexures – (Action Plan and Budget) SAPCC- Jan 2015
- 147 -
Interventions Intervention Type Activities Duration
Total Cost (in lakh)
Possibility of convergence
Expected Outcome
Training of: Departmental officials in vulnerability assessment. Departmental officials in the use of GIS and RS tools for effective resource management. Engineers in retrofitting of existing structures and safer construction practices. Mason in safer construction practices. Formal first responders in search & rescue&first aid. State government officers in post-disaster needs assessment (PDNA). Media personnel in reporting disaster related issues. Government officials in preparation of disaster management plans Government officials in post disaster response and utilisation of ICS (IRS) principles.
25
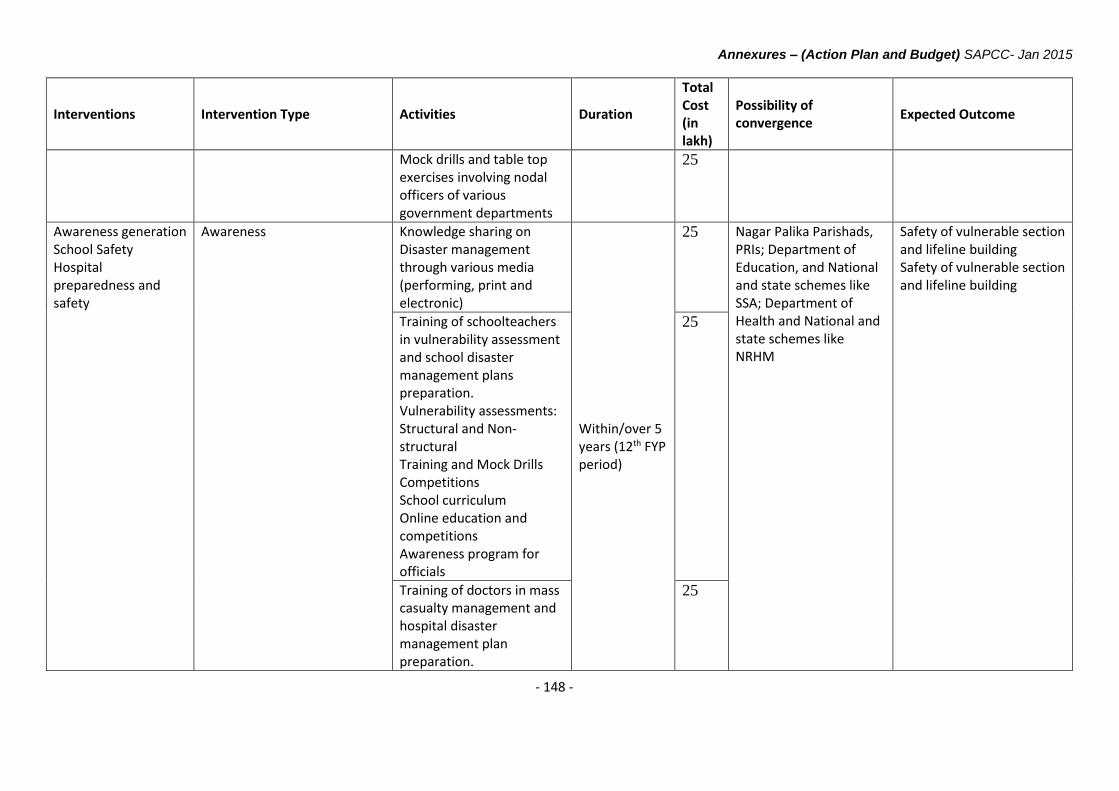
Annexures – (Action Plan and Budget) SAPCC- Jan 2015
- 148 -
Interventions Intervention Type Activities Duration
Total Cost (in lakh)
Possibility of convergence
Expected Outcome
Mock drills and table top exercises involving nodal officers of various government departments
25
Awareness generation School Safety Hospital preparedness and safety
Awareness Knowledge sharing on Disaster management through various media (performing, print and electronic)
Within/over 5 years (12th FYP period)
25 Nagar Palika Parishads, PRIs; Department of Education, and National and state schemes like SSA; Department of Health and National and state schemes like NRHM
Safety of vulnerable section and lifeline building Safety of vulnerable section and lifeline building
Training of schoolteachers in vulnerability assessment and school disaster management plans preparation. Vulnerability assessments: Structural and Non-structural Training and Mock Drills Competitions School curriculum Online education and competitions Awareness program for officials
25
Training of doctors in mass casualty management and hospital disaster management plan preparation.
25

Annexures – (Action Plan and Budget) SAPCC- Jan 2015
- 149 -
Interventions Intervention Type Activities Duration
Total Cost (in lakh)
Possibility of convergence
Expected Outcome
Vulnerability assessments: Structural and Non-structural
Vulnerability and risk management
Risk management; infrastructure adaptation
Vulnerability assessment of lifeline structure and demonstrative retrofitting Relocation of critical infrastructure Relocation of a few threatened habitations Assessment of urban vulnerability particularly in case of extreme precipitation events Vulnerability assessment of all industrial units in the state
50
Knowledge Management
Knowledge Management
Identification of potential research and development domains concerned with climate change issues in the sector; initiating studies 5 years (12th
FYP period)
10
Convergence with districts and linked sectors such as water resources, energy, etc.
Significantly improved awareness of and understanding of climate change in the sector and its stakeholders
Knowledge repository, strengthening evidence base
10
Technical demonstration, research and development, extension and transfer of
10

Annexures – (Action Plan and Budget) SAPCC- Jan 2015
- 150 -
Interventions Intervention Type Activities Duration
Total Cost (in lakh)
Possibility of convergence
Expected Outcome
technology protocols, relating to climate change
Sector co-benefits identification study
10
Documentation on community perceptions of climate change and impacts
20
Networking and linkages
Networking and coordination
Institutional linkages with research/academic institutions Within/over 5
years (12th FYP period)
10 Linkages with academia, civil society and communities
Improved networking and communications with academia, participatory sector processes
Consultations with civil society
10
Consultations with communities
10
Total Budget for 5 years (12th FYP period) 425

Annexures – (Action Plan and Budget) SAPCC- Jan 2015
- 151 -
Annexure 7: Urban Development
Interventions Intervention Type Activities Duration
Total Cost (in lakh)
Possibility of convergence
Expected Outcome
Short-term actions
Policy review Policy
Review of urban development policy; incorporation of climate concerns (based on sector vulnerability assessment)
1-1.5 years 100
Convergence with linked sectors such as agriculture, forestry, water, etc.
Sector policies explicitly reflect climate concerns
Coordination and networking
Coordination/management Setting up of Climate Change Cell 1 year 200
Convergence with linked sectors such as agriculture, forestry, water, etc.
Streamlined mechanisms for coordination of all sector activities under the BAPCC
Capacity Building Human resource development
Sector capacity needs assessment 1 year 50
Convergence with linked sectors such as agriculture, forestry, water, etc.
Clear understanding of sector capacity needs at State and sub-state levels vis-à-vis climate change and its impacts
Planning Planning Formulation of Urban Sector Roadmap incorporating climate concerns
1 – 1.5 years 100
Convergence with linked sectors such as agriculture, forestry, water, etc.
Comprehensive water sector plan in place
Monitoring and Evaluation
Monitoring Contribution to BAPCC Monitoring Plan
1 year 100
Convergence with linked sectors such as agriculture, forestry, water, etc.
Sector M&E framework in place
Knowledge management
Knowledge management Contribution to BAPCC KM Strategy and roadmap
1 year 100
Convergence with linked sectors such as agriculture, forestry, water, etc.
Sector KM strategy in place
Medium-term actions

Annexures – (Action Plan and Budget) SAPCC- Jan 2015
- 152 -
Interventions Intervention Type Activities Duration
Total Cost (in lakh)
Possibility of convergence
Expected Outcome
Capacity building Human resource development
Capacity building of department personnel and stakeholders (to be detailed by Department) including ULBs
Within/over 5 years (12th FYP period)
100
Convergence with linked sectors such as agriculture, forestry, water, etc.
Improved sector capacities to understand and address climate change issues
Energy demand reduction and efficiency
Energy efficiency
Energy efficiency and conservation measures
Within/over 5 years (12th FYP period)
100
Enhanced energy efficiency and reduced demand
Promotion of and codes for green/energy efficient buildings, including in urban housing projects under various programmes
100
Adoption of renewables
Alternative energy sources Promotion of renewable energy sources and technologies
Within/over 5 years (12th FYP period)
100
Convergence with linked sectors such as agriculture, forestry, water, etc.
Enhanced energy source mix
Management of water, municipal solid waste and waste water
Urban utility management
Comprehensive approach in the management of water, municipal solid waste and waste water with a view to realize their full potential for energy generation, recycling and reuse, and composting, rainwater harvesting, etc.
Within/over 5 years (12th FYP period)
100 Convergence with linked sectors such Water Resources Department, etc.
Improved utility performance, services delivery, and infrastructure resilience
Retrofitting of urban infrastructure for climate resilience based on vulnerability and risk assessment
100
Urban transportation
Transportation
Evolving integrated land use and transportation plans, achieving a modal shift from private to public mode of transportation, encouraging the use of non-motorised transport,
Within/over 5 years (12th FYP period)
100
Convergence with Transportation Department
Improved urban transportation systems

Annexures – (Action Plan and Budget) SAPCC- Jan 2015
- 153 -
Interventions Intervention Type Activities Duration
Total Cost (in lakh)
Possibility of convergence
Expected Outcome
improving fuel efficiency, and encouraging use of alternate fuels
Adaptation in terms of realignment and relocation, design standards and planning for roads, rail and other infrastructure to cope with risks from climate change
100
Promote and foster alternative fuels such as CNG, bio-fuels
100
Monitoring and evaluation
M&E
Quarterly sector monitoring reports
Within/over 5 years (12th FYP period)
50
Convergence with linked sectors such as agriculture, forestry, water, etc.
Results for programme implementation improvements and mid-course corrections; lessons learnt on what worked and what didn’t; input for improved annual plans for 13th FYP.
Internal Annual Review of sector implementation under BAPCC
50
Knowledge Management
Knowledge Management
Identification of potential research and development domains concerned with climate change issues in the sector; initiating studies
5 years (12th FYP period)
50
Convergence with linked sectors such as agriculture, forestry, water, etc.
Significantly improved awareness of and understanding of climate change in the sector and its stakeholders
Knowledge repository, strengthening evidence base
50
Technical demonstration, research and development, extension and transfer of technology protocols, relating to climate change
100
Sector co-benefits identification study 50

Annexures – (Action Plan and Budget) SAPCC- Jan 2015
- 154 -
Interventions Intervention Type Activities Duration
Total Cost (in lakh)
Possibility of convergence
Expected Outcome
Documentation on community perceptions of climate change and impacts
Networking and linkages
Networking and coordination
Institutional linkages with research/academic institutions
Within/over 5 years (12th FYP period)
100 Linkages with academia, civil society and communities
Improved networking and communications with academia, participatory sector processes
Consultations with civil society 50
Consultations with communities 50
Total Budget for 5 years (12th FYP period) 2190

Annexures – (Action Plan and Budget) SAPCC- Jan 2015
- 155 -
Annexure 8: Transport
Interventions Intervention Type Activities Duration
Total Cost (in lakh)
Possibility of convergence
Expected Outcome
Short-term actions
Policy review Policy
Review of transport policy; incorporation of climate concerns (based on sector vulnerability assessment)
1-1.5 years 50
Convergence with linked sectors such as agriculture, forestry, water, etc.
Sector policies explicitly reflect climate concerns
Coordination and networking
Coordination/management Setting up of Climate Change Cell 1 year 50
Convergence with linked sectors such as agriculture, forestry, water, etc.
Streamlined mechanisms for coordination of all sector activities under the BAPCC
Capacity Building Human resource development
Sector capacity needs assessment
1 year 50
Convergence with linked sectors such as agriculture, forestry, water, etc.
Clear understanding of sector capacity needs at State and sub-state levels vis-à-vis climate change and its impacts
Planning Planning Formulation of Transport Sector Roadmap incorporating climate concerns
1 – 1.5 years 50
Convergence with linked sectors such as agriculture, forestry, water, etc.
Comprehensive water sector plan in place
Monitoring and Evaluation
Monitoring Contribution to BAPCC Monitoring Plan
1 year 50
Convergence with linked sectors such as agriculture, forestry, water, etc.
Sector M&E framework in place
Knowledge management
Knowledge management Contribution to BAPCC KM Strategy and roadmap
1 year 50
Convergence with linked sectors such as agriculture, forestry, water, etc.
Sector KM strategy in place
Medium-term actions

Annexures – (Action Plan and Budget) SAPCC- Jan 2015
- 156 -
Interventions Intervention Type Activities Duration
Total Cost (in lakh)
Possibility of convergence
Expected Outcome
Capacity building Human resource development
Capacity building of department personnel and stakeholders (to be detailed by Department)
Within/over 5 years (12thFYP period)
100
Convergence with linked sectors such as agriculture, forestry, water, etc.
Improved sector capacities to understand and address climate change issues
Transport Infrastructure, planning, and management
Infrastructure, planning, management
Improve access to bus services and service quality
Within/over 5 years (12th FYP period)
500
Linkages with Urban Development Department, Roads Department, Energy Department, etc.
Enhanced and resilient transportation infrastructure and systems in place
Improve the poor image of bus and public transport
Within/over 5 years (12th FYP period)
500
Mechanisms for proper planning and provisioning of infrastructure facilities
Within/over 5 years (12th FYP period)
100
Improve route and traffic planning, and regulate issue of permits through surveys and scientific data
Within/over 5 years (12th FYP period)
50
Provide/improve passenger information systems, and remove institutional and regulatory hurdles
Within/over 5 years (12th FYP period)
100
Promote initiatives such as vehicle pooling, etc., especially in cities and towns
Within/over 5 years (12th FYP period)
50
Rigorously implement measures for vehicular pollution control
Within/over 5 years (12th FYP period)
50
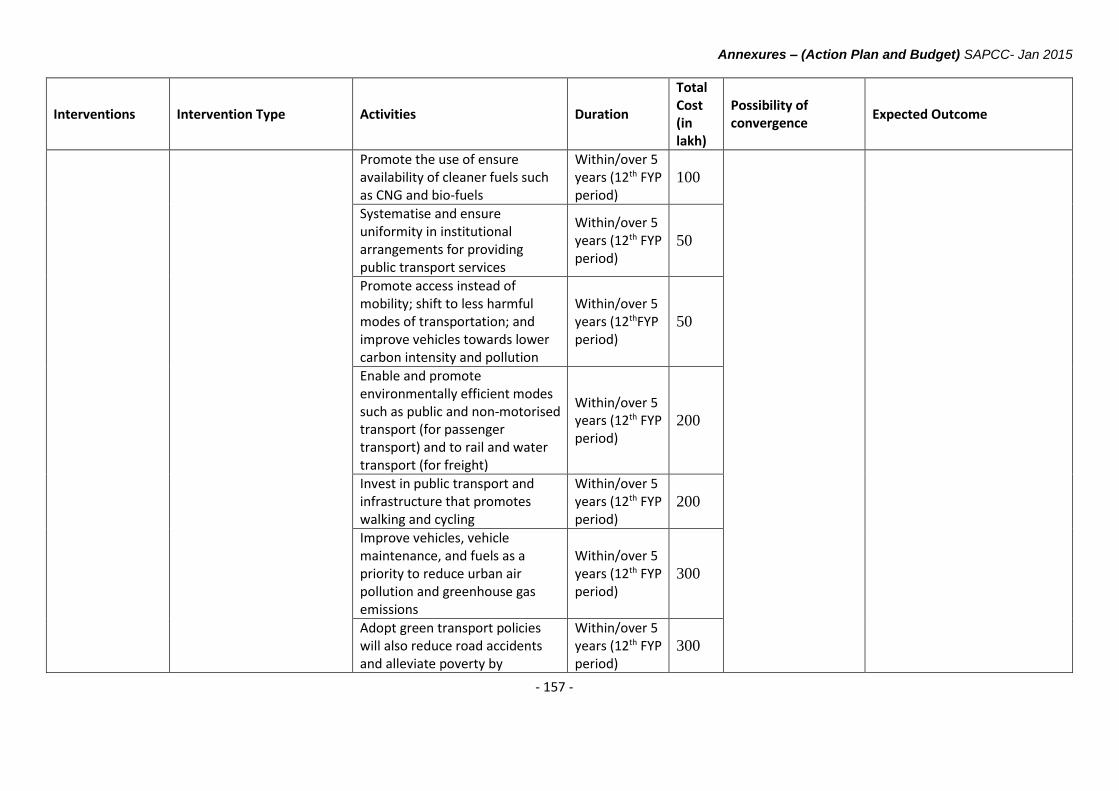
Annexures – (Action Plan and Budget) SAPCC- Jan 2015
- 157 -
Interventions Intervention Type Activities Duration
Total Cost (in lakh)
Possibility of convergence
Expected Outcome
Promote the use of ensure availability of cleaner fuels such as CNG and bio-fuels
Within/over 5 years (12th FYP period)
100
Systematise and ensure uniformity in institutional arrangements for providing public transport services
Within/over 5 years (12th FYP period)
50
Promote access instead of mobility; shift to less harmful modes of transportation; and improve vehicles towards lower carbon intensity and pollution
Within/over 5 years (12thFYP period)
50
Enable and promote environmentally efficient modes such as public and non-motorised transport (for passenger transport) and to rail and water transport (for freight)
Within/over 5 years (12th FYP period)
200
Invest in public transport and infrastructure that promotes walking and cycling
Within/over 5 years (12th FYP period)
200
Improve vehicles, vehicle maintenance, and fuels as a priority to reduce urban air pollution and greenhouse gas emissions
Within/over 5 years (12th FYP period)
300
Adopt green transport policies will also reduce road accidents and alleviate poverty by
Within/over 5 years (12th FYP period)
300

Annexures – (Action Plan and Budget) SAPCC- Jan 2015
- 158 -
Interventions Intervention Type Activities Duration
Total Cost (in lakh)
Possibility of convergence
Expected Outcome
improving access to markets and other essential facilities
Monitoring and evaluation
M&E
Quarterly sector monitoring reports
Within/over 5 years (12th FYP period)
100 Convergence with linked sectors such as agriculture, forestry, water, etc.
Results for programme implementation improvements and mid-course corrections; lessons learnt on what worked and what didn’t; input for improved annual plans for 13th FYP.
Internal Annual Review of sector implementation under BAPCC
50
Knowledge Management
Knowledge Management
Identification of potential research and development domains concerned with climate change issues in the sector; initiating studies
5 years (12th FYP period)
100
Convergence with linked sectors such as agriculture, forestry, water, etc.
Significantly improved awareness of and understanding of climate change in the sector and its stakeholders
Knowledge repository, strengthening evidence base
50
Technical demonstration, research and development, extension and transfer of technology protocols, relating to climate change
100
Sector co-benefits identification study
50
Documentation on community perceptions of climate change and impacts
50
Networking and linkages
Networking and coordination
Institutional linkages with research/academic institutions
Within/over 5 years (12th FYP period)
100 Linkages with academia, civil
Improved networking and communications with academia, participatory sector processes Consultations with civil society 100

Annexures – (Action Plan and Budget) SAPCC- Jan 2015
- 159 -
Interventions Intervention Type Activities Duration
Total Cost (in lakh)
Possibility of convergence
Expected Outcome
Consultations with communities 50 society and communities
Total Budget for 5 years (12th FYP period) 3400

Annexures – (Action Plan and Budget) SAPCC- Jan 2015
- 160 -
Annexure 9: Energy
Interventions Intervention Type Activities Duration
Total Cost (in lakh)
Possibility of convergence
Expected Outcome
Short-term actions
Policy review Policy
Review of energy sector policies; incorporation of climate concerns (based on sector vulnerability assessment)
1-1.5 years 50
Convergence with linked sectors such as agriculture, forestry, water, etc.
Sector policies explicitly reflect climate concerns
Coordination and networking
Coordination/management Setting up of Climate Change Cell 1 year 100
Convergence with linked sectors such as agriculture, forestry, water, etc.
Streamlined mechanisms for coordination of all sector activities under the BAPCC
Research, Climate Impacts Needs Assessment
Research
Develop comprehensive Bihar specific energy sector vulnerability analyses, and options for developing in-house skills for data analyses, modelling, and forecasting will be considered
1-1.5 years 50
Risk Management
Risk Management
Templates to screen individual energy projects for climate vulnerability and risks, either retrospectively or during project planning and implementation will be developed
1-1.5 years 50
Standards Development
Management Develop adaptation standards for the energy sector -- defined, codified and adopted into standard operating
1-1.5 years 50

Annexures – (Action Plan and Budget) SAPCC- Jan 2015
- 161 -
Interventions Intervention Type Activities Duration
Total Cost (in lakh)
Possibility of convergence
Expected Outcome
procedures in all aspects of energy sector planning and implementation
Capacity Building
Human resource development Sector capacity needs assessment 1 year 50
Convergence with linked sectors such as agriculture, forestry, water, etc.
Clear understanding of sector capacity needs at State and sub-state levels vis-à-vis climate change and its impacts
Research Research Study on poverty and equity issues in energy sector; incorporation of findings into energy sector planning
1-1.5 years 50
Planning Planning
Formulation of Energy Sector Roadmap incorporating climate concerns/Revision of existing Roadmap to incorporate climate concerns
1 – 1.5 years 50
Convergence with linked sectors such as agriculture, forestry, water, etc.
Comprehensive water sector plan in place
Monitoring and Evaluation
Monitoring Contribution to BAPCC Monitoring Plan 1 year 50
Convergence with linked sectors such as agriculture, forestry, water, etc.
Sector M&E framework in place
Knowledge management
Knowledge management Contribution to BAPCC KM Strategy and roadmap
1 year 50
Convergence with linked sectors such as agriculture, forestry, water, etc.
Sector KM strategy in place

Annexures – (Action Plan and Budget) SAPCC- Jan 2015
- 162 -
Interventions Intervention Type Activities Duration
Total Cost (in lakh)
Possibility of convergence
Expected Outcome
Medium-term actions
Capacity building
Human resource development Capacity building of department personnel and stakeholders (to be detailed by Department)
Within/over 5 years (12th FYP period)
100
Convergence with linked sectors such as agriculture, forestry, water, etc.
Improved sector capacities to understand and address climate change issues
Generation Improvements
Power generation infrastructure enhancement/adaptation and management
Renovation and modernisation of existing units to restore original efficiency along with reduced auxiliary power consumption and reduced chimney emissions. Modernisation work on the BTPS units 6 and 7 are expected to be completed by February 2013, and for the MTPS units 1 and 2
Within/over 5 years (12th FYP period)
100
Enhanced generation systems
Adoption of super critical technology for all upcoming coal based power stations to have better efficiency and reduced emissions
100
Fly ash utilisation management 50
SHP capacity addition for 3.70 MW 50
Transmission Improvements
Power transmission infrastructure enhancement/adaptation and management
Expansion of high voltage transmission network with latest and state of the art technologies and adequate coverage network to prevent loading beyond limits
Within/over 5 years (12th FYP period)
200
Enhanced transmission systems
Use of sufficient reactors and capacitors in the network
50
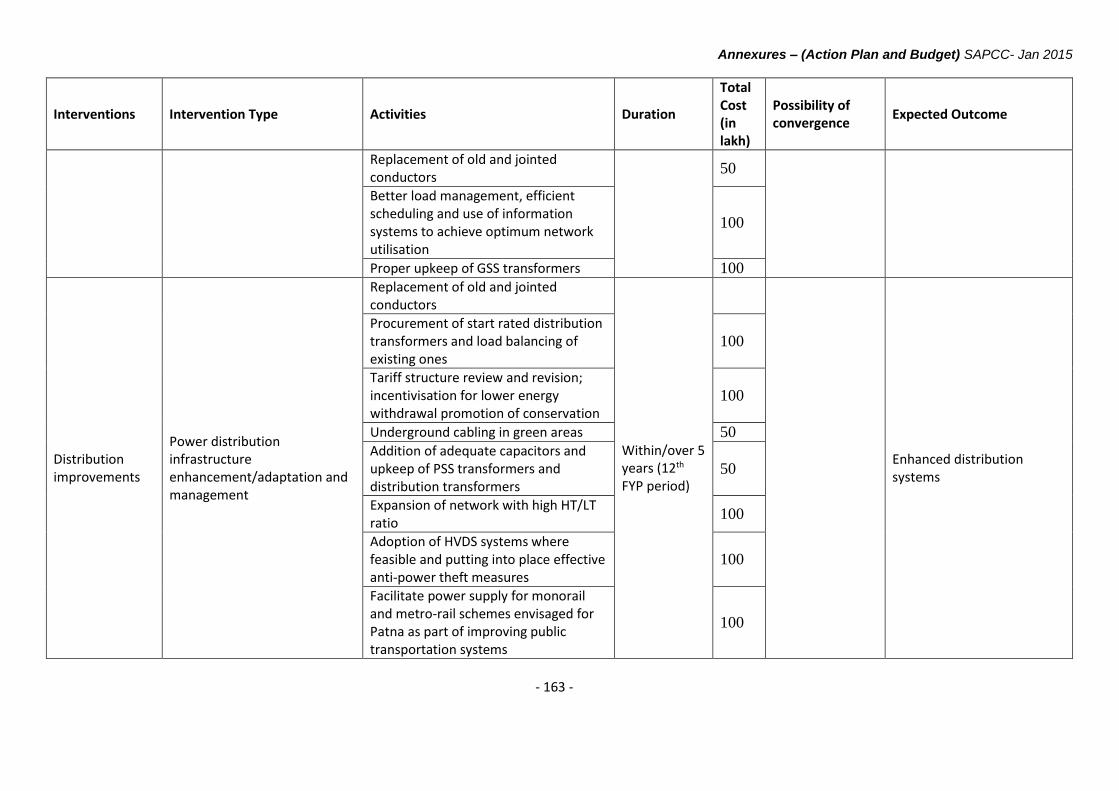
Annexures – (Action Plan and Budget) SAPCC- Jan 2015
- 163 -
Interventions Intervention Type Activities Duration
Total Cost (in lakh)
Possibility of convergence
Expected Outcome
Replacement of old and jointed conductors
50
Better load management, efficient scheduling and use of information systems to achieve optimum network utilisation
100
Proper upkeep of GSS transformers 100
Distribution improvements
Power distribution infrastructure enhancement/adaptation and management
Replacement of old and jointed conductors
Within/over 5 years (12th FYP period)
Enhanced distribution systems
Procurement of start rated distribution transformers and load balancing of existing ones
100
Tariff structure review and revision; incentivisation for lower energy withdrawal promotion of conservation
100
Underground cabling in green areas 50
Addition of adequate capacitors and upkeep of PSS transformers and distribution transformers
50
Expansion of network with high HT/LT ratio
100
Adoption of HVDS systems where feasible and putting into place effective anti-power theft measures
100
Facilitate power supply for monorail and metro-rail schemes envisaged for Patna as part of improving public transportation systems
100

Annexures – (Action Plan and Budget) SAPCC- Jan 2015
- 164 -
Interventions Intervention Type Activities Duration
Total Cost (in lakh)
Possibility of convergence
Expected Outcome
Demand Side Management
Energy conservation and efficiency improvements
Promoting the use of energy efficient pumps and motors in the State
Within/over 5 years (12th FYP period)
500
Enhanced demand side management in place
Promotion of CFLs under the Bachat Lamp Yojana (BLY) in identified areas of the PESU and expanding the scheme to other parts of the state in a phased manner
500
Building consumer awareness about energy efficient equipment and energy conservation measures
100
Renewable energy
Renewable energy promotion and adoption
Electrification of rural villages through renewables based DDGs
Within/over 5 years (12th FYP period)
Increase in the share of renewables in stake energy mix; cleaner sector
Encourage local private sector participation in renewable energy power generation projects including solid waste and sewerage gas based projects or decentralised distributed generation (DDG)
100
Fix the renewable energy procurement quotas and tariffs for renewable energy based power
100
Provide banking and wheeling facilities for all grid connected renewable energy electricity generation projects up to 25 MW
100
Waive entry tax capital costs for equipment for DDG based renewable energy plants of less than five MW
100

Annexures – (Action Plan and Budget) SAPCC- Jan 2015
- 165 -
Interventions Intervention Type Activities Duration
Total Cost (in lakh)
Possibility of convergence
Expected Outcome
Encourage project developers to install or adopt mechanisms such as Clean Development Mechanisms (CDM) for leveraging funds for renewable energy based projects
200
Infrastructure adaptation
Infrastructure adaptation Based on climate vulnerability analyses, retrofitting of existing energy infrastructure
Within/over 5 years (12th FYP period)
100 Improved infrastructure resilience
Monitoring and evaluation
M&E
Quarterly sector monitoring reports
Within/over 5 years (12th FYP period)
50 Convergence with linked sectors such as agriculture, forestry, water, etc.
Results for programme implementation improvements and mid-course corrections; lessons learnt on what worked and what didn’t; input for improved annual plans for 13th FYP.
Internal Annual Review of sector implementation under BAPCC
50
Knowledge Management
Knowledge Management
Identification of potential research and development domains concerned with climate change issues in the sector; initiating studies
5 years (12th FYP period)
100
Convergence with linked sectors such as agriculture, forestry, water, etc.
Significantly improved awareness of and understanding of climate change in the sector and its stakeholders
Knowledge repository, strengthening evidence base
50
Technical demonstration, research and development, extension and transfer of technology protocols, relating to climate change
50
Sector co-benefits identification study 50

Annexures – (Action Plan and Budget) SAPCC- Jan 2015
- 166 -
Interventions Intervention Type Activities Duration
Total Cost (in lakh)
Possibility of convergence
Expected Outcome
Documentation on community perceptions of climate change and impacts
50
Networking and linkages
Networking and coordination
Institutional linkages with research/academic institutions
Within/over 5 years (12th FYP period)
100 Linkages with academia, civil society and communities
Improved networking and communications with academia, participatory sector processes
Consultations with civil society 50
Consultations with communities 50
Total Budget for 5 years (12th FYP period) 4450

Annexures – (Action Plan and Budget) SAPCC- Jan 2015
- 167 -
Annexure 10: Industries and Mining
Interventions Intervention Type Activities Duration
Total Cost (in lakh)
Possibility of convergence
Expected Outcome
Short-term actions
Policy review Policy
Review of industries and mining policies; incorporation of climate concerns (based on sector vulnerability assessment)
1-1.5 years 15
Convergence with linked sectors such as agriculture, forestry, water, etc.
Sector policies explicitly reflect climate concerns
Coordination and networking
Coordination/management
Setting up of Climate Change Cells; setting up of Task force at State and Cluster levels
1-1.5 years
50
Convergence with linked sectors such as agriculture, forestry, water, private sector, industries associations, etc.
Streamlined mechanisms for coordination of all sector activities under the BAPCC
Build partnerships with industry associations, and through them, initiate sustained process to stimulate technological innovation and change to reduce dependency on imported fuels, to improve resources use efficiency, waste management, water and air pollution reduction, and enhance use of renewables
50
Capacity Building
Human resource development
Sector capacity needs assessment 1 year 30
Convergence with linked sectors such as agriculture, forestry, water, etc.
Clear understanding of sector capacity needs at State and sub-state levels vis-à-vis climate change and its impacts
Planning Planning Formulation of Sector Roadmap incorporating climate concerns
1 – 1.5 years 25
Convergence with linked sectors such as agriculture, forestry, water, etc.
Comprehensive water sector plan in place

Annexures – (Action Plan and Budget) SAPCC- Jan 2015
- 168 -
Interventions Intervention Type Activities Duration
Total Cost (in lakh)
Possibility of convergence
Expected Outcome
Research Research
Cluster-wise or district-wise studies to estimate the carbon footprint of industrial clusters in the State; This would include a baseline study, as well as periodic studies
1 – 1.5 years
30
Improved understanding of key emissions and carbon footprint issues in clusters, and industry sectors Studies on brick making industry (and
associated mining issues) and on mining industry
25
Monitoring and Evaluation
Monitoring Contribution to BAPCC Monitoring Plan 1 year 50
Convergence with linked sectors such as agriculture, forestry, water, etc.
Sector M&E framework in place
Knowledge management
Knowledge management Contribution to BAPCC KM Strategy and roadmap
1 year 25
Convergence with linked sectors such as agriculture, forestry, water, etc.
Sector KM strategy in place
Medium-term actions
Capacity building
Human resource development
Capacity building of department personnel and stakeholders (to be detailed by Department)
Within/over 5 years (12th FYP period)
20
Convergence with linked sectors such as agriculture, forestry, water, etc.
Improved sector capacities to understand and address climate change issues
Promoting GHG Mitigation
Mitigation
Build awareness of and promote sector-wide, process-specific, and operating procedure based mitigation options for industries
Within/over 5 years (12th FYP period)
10 Linkages with academia, financial institutions, industry associations, media, private sector, etc.
Increased adoption of GHG mitigation options Actions for incentivising adoption of
GHG mitigation options 15
Build capacities of financial institutions to finance GHG mitigation options
10

Annexures – (Action Plan and Budget) SAPCC- Jan 2015
- 169 -
Interventions Intervention Type Activities Duration
Total Cost (in lakh)
Possibility of convergence
Expected Outcome
Develop regulatory instruments and promote CDM
20
Promoting Energy efficiency
Energy efficiency
Promote and build awareness, and develop and deploy measures to incentivise industries to adopt a range of management practices including energy audits, adoption of energy efficiency measures and technologies, benchmarking, etc.
Within/over 5 years (12th FYP period)
20
Linkages with academia, financial institutions, industry associations, media, private sector, etc.
Enhanced energy efficiency in industries/industrial clusters
Build awareness on options, opportunities and benefits of fuel switching, including the use of waste materials, energy (especially heat and power recovery), cogeneration, use of renewable energy including biomass and by-product wastes based generation, and materials efficiency and recycling
50
Developing and deploying a range of financial instruments such as taxes, subsidies and measures to improve access to capital to adopt energy efficiency technologies and processes
25
Monitoring and evaluation
M&E
Quarterly sector monitoring reports Within/over 5 years (12th FYP period)
10 Convergence with linked sectors such as agriculture, forestry, water, etc.
Results for programme implementation improvements and mid-course corrections; lessons learnt on what worked and what didn’t; input for
Internal Annual Review of sector implementation under BAPCC
25

Annexures – (Action Plan and Budget) SAPCC- Jan 2015
- 170 -
Interventions Intervention Type Activities Duration
Total Cost (in lakh)
Possibility of convergence
Expected Outcome
improved annual plans for 13th FYP.
Knowledge Management
Knowledge Management
Identification of potential research and development domains concerned with climate change issues in the sector; initiating studies
5 years (12th FYP period)
15
Convergence with linked sectors such as agriculture, forestry, water, etc.
Significantly improved awareness of and understanding of climate change in the sector and its stakeholders
Knowledge repository, strengthening evidence base
10
Technical demonstration, research and development, extension and transfer of technology protocols, relating to climate change
25
Sector co-benefits identification study 20
Documentation on community perceptions of climate change and impacts
20
Networking and linkages
Networking and coordination
Institutional linkages with research/academic institutions
Within/over 5 years (12th FYP period)
20 Linkages with academia, civil society and communities
Improved networking and communications with academia, participatory sector processes
Consultations with civil society 10
Consultations with communities 15
Total Budget for 5 years (12th FYP period) 340

Annexures – (Action Plan and Budget) SAPCC- Jan 2015
- 171 -
Annexure 11: Human Health
Interventions Intervention Type Activities Duration
Total Cost (in lakh)
Possibility of convergence
Expected Outcome
Short-term actions
Policy review Policy
Review of health policies; incorporation of climate concerns (based on sector vulnerability assessment)
1-1.5 years
Convergence with linked sectors such as agriculture, forestry, water, etc.
Sector policies explicitly reflect climate concerns
Coordination and networking
Coordination/management Setting up of Climate Change Cell at State level, and sub-cells at district levels
1-1.5 years
Convergence with linked sectors such as agriculture, forestry, water, private sector, industries associations, etc.
Streamlined mechanisms for coordination of all sector activities under the BAPCC
Capacity Building
Human resource development
Sector capacity needs assessment 1 year
Convergence with linked sectors such as agriculture, forestry, water, etc.
Clear understanding of sector capacity needs at State and sub-state levels vis-à-vis climate change and its impacts
Planning Planning Formulation of Sector Roadmap incorporating climate concerns
1 – 1.5 years
Convergence with linked sectors such as agriculture, forestry, water, etc.
Comprehensive water sector plan in place
Building programme based resilience
Programme enhancements
Design and deploy to manage increased vector borne and water borne disease burden Within 2
years
Convergence with State Health Society, programme such as VBDCP, IDSP, NRHM, etc.; also with linked sectors such as
Improved health sector programmes, geared to address increased climate change induced morbidity/health burden
Design and deploy improved approaches to deal with heat and wave conditions
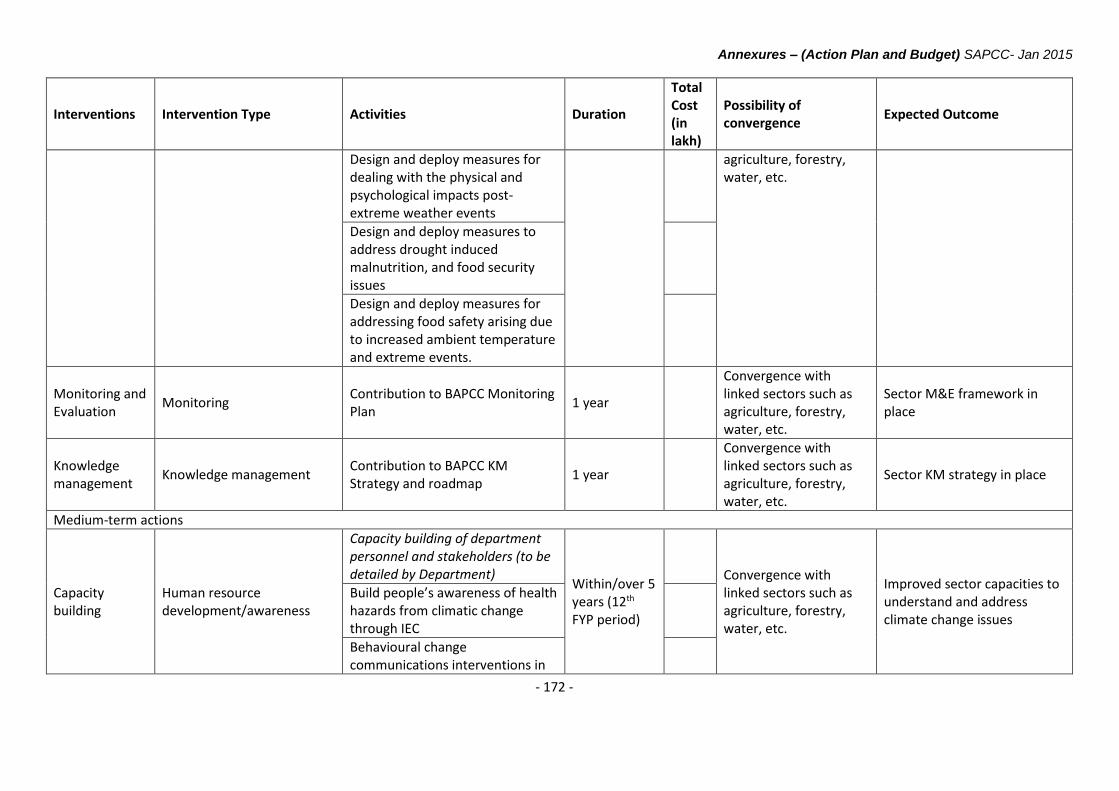
Annexures – (Action Plan and Budget) SAPCC- Jan 2015
- 172 -
Interventions Intervention Type Activities Duration
Total Cost (in lakh)
Possibility of convergence
Expected Outcome
Design and deploy measures for dealing with the physical and psychological impacts post-extreme weather events
agriculture, forestry, water, etc.
Design and deploy measures to address drought induced malnutrition, and food security issues
Design and deploy measures for addressing food safety arising due to increased ambient temperature and extreme events.
Monitoring and Evaluation
Monitoring Contribution to BAPCC Monitoring Plan
1 year
Convergence with linked sectors such as agriculture, forestry, water, etc.
Sector M&E framework in place
Knowledge management
Knowledge management Contribution to BAPCC KM Strategy and roadmap
1 year
Convergence with linked sectors such as agriculture, forestry, water, etc.
Sector KM strategy in place
Medium-term actions
Capacity building
Human resource development/awareness
Capacity building of department personnel and stakeholders (to be detailed by Department)
Within/over 5 years (12th FYP period)
Convergence with linked sectors such as agriculture, forestry, water, etc.
Improved sector capacities to understand and address climate change issues
Build people’s awareness of health hazards from climatic change through IEC
Behavioural change communications interventions in

Annexures – (Action Plan and Budget) SAPCC- Jan 2015
- 173 -
Interventions Intervention Type Activities Duration
Total Cost (in lakh)
Possibility of convergence
Expected Outcome
relation to the impacts of climate change
Developing and strengthening of disaster management teams in every district hospital specifically to respond to the effect of extreme climate change
Research Research
Study on poverty and equity dimensions of health, disease burden and morbidity as a result of climate change; design of appropriate measures to incorporate findings into health policy and programming
Within/over 5 years (12th FYP period)
Convergence with linked sectors such as agriculture, forestry, water, etc.
Enhanced understanding of poverty and equity issues in health sector in relation to climate change and its impacts
Health Infrastructure resilience
Infrastructure improvements; asset management
Reviews of the State’s health infrastructure and potential climate change related vulnerabilities and risks (and where such infrastructure is found to be at high risk, retrofit to make these more climate resilient)
Within/over 5 years (12th FYP period)
Increased resilience of health infrastructure assets
Monitoring and evaluation
M&E
Quarterly sector monitoring reports
Within/over 5 years (12th FYP period)
Convergence with linked sectors such as agriculture, forestry, water, etc.
Results for programme implementation improvements and mid-course corrections; lessons learnt on what worked and what didn’t; input for improved annual plans for 13th FYP.
Internal Annual Review of sector implementation under BAPCC

Annexures – (Action Plan and Budget) SAPCC- Jan 2015
- 174 -
Interventions Intervention Type Activities Duration
Total Cost (in lakh)
Possibility of convergence
Expected Outcome
Knowledge Management
Knowledge Management
Identification of potential research and development domains concerned with climate change issues in the sector; initiating studies
5 years (12th FYP period)
Convergence with linked sectors such as agriculture, forestry, water, etc.
Significantly improved awareness of and understanding of climate change in the sector and its stakeholders
Knowledge repository, strengthening evidence base
Technical demonstration, research and development, extension and transfer of technology protocols, relating to climate change
Sector co-benefits identification study
Documentation on community perceptions of climate change and impacts
Networking and linkages
Networking and coordination
Institutional linkages with research/academic institutions
Within/over 5 years (12th FYP period)
Linkages with academia, civil society and communities
Improved networking and communications with academia, participatory sector processes
Consultations with civil society
Consultations with communities
Total Budget for 5 years (12th FYP period)
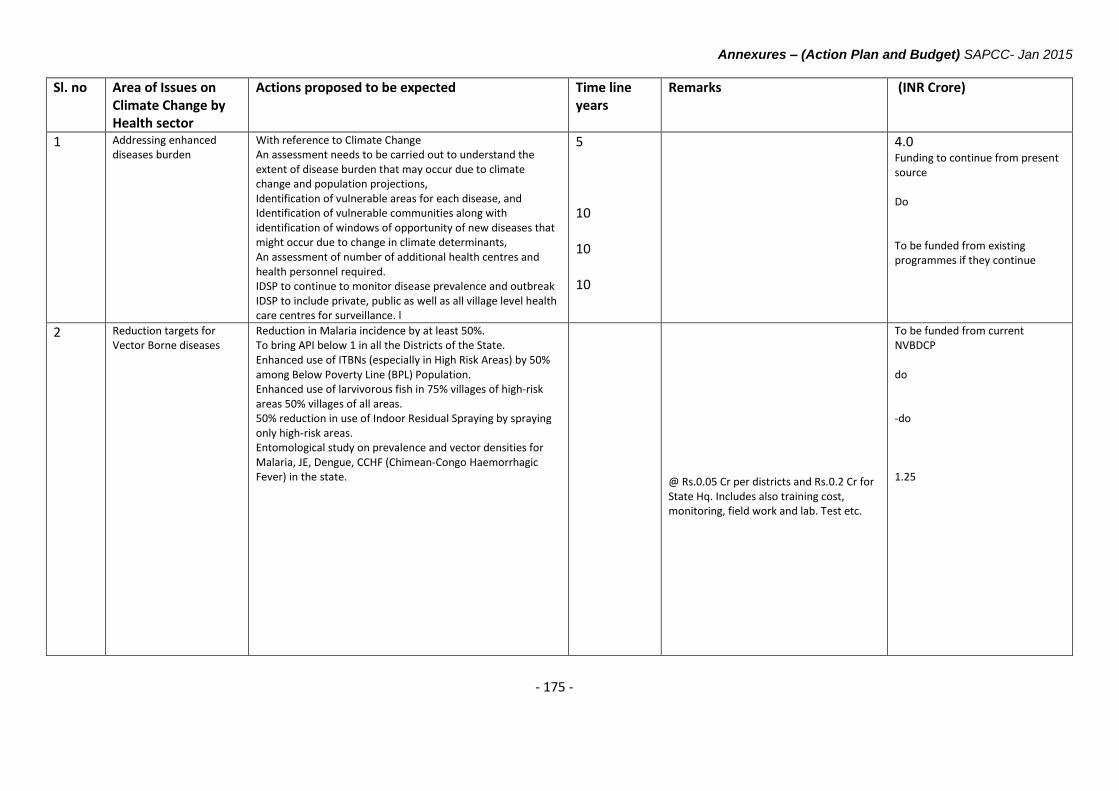
Annexures – (Action Plan and Budget) SAPCC- Jan 2015
- 175 -
Sl. no Area of Issues on Climate Change by Health sector
Actions proposed to be expected Time line years
Remarks (INR Crore)
1 Addressing enhanced diseases burden
With reference to Climate Change An assessment needs to be carried out to understand the extent of disease burden that may occur due to climate change and population projections, Identification of vulnerable areas for each disease, and Identification of vulnerable communities along with identification of windows of opportunity of new diseases that might occur due to change in climate determinants, An assessment of number of additional health centres and health personnel required. IDSP to continue to monitor disease prevalence and outbreak IDSP to include private, public as well as all village level health care centres for surveillance. l
5 10 10 10
4.0 Funding to continue from present source Do To be funded from existing programmes if they continue
2 Reduction targets for Vector Borne diseases
Reduction in Malaria incidence by at least 50%. To bring API below 1 in all the Districts of the State. Enhanced use of ITBNs (especially in High Risk Areas) by 50% among Below Poverty Line (BPL) Population. Enhanced use of larvivorous fish in 75% villages of high‐risk areas 50% villages of all areas. 50% reduction in use of Indoor Residual Spraying by spraying only high‐risk areas. Entomological study on prevalence and vector densities for Malaria, JE, Dengue, CCHF (Chimean‐Congo Haemorrhagic Fever) in the state.
@ Rs.0.05 Cr per districts and Rs.0.2 Cr for State Hq. Includes also training cost, monitoring, field work and lab. Test etc.
To be funded from current NVBDCP do ‐do 1.25

Annexures – (Action Plan and Budget) SAPCC- Jan 2015
- 176 -
Sl. no Area of Issues on Climate Change by Health sector
Actions proposed to be expected Time line years
Remarks (INR Crore)
3 Control of TB Under RNTCP the aim is in terms of Universal Access is 100%
case detection. Requires Expansion of DOTS Plus services.
Extend services in private hospitals with OPD patient intake of
100‐150 per hospital
5
5
To be funded from the RNTCP
‐do‐
4. To control NCD To control NCDs main emphasis will be given on IEC
activities to reach out target communities, continuous
monitoring and independent evaluation of the program and
10
To be funded from NPCDCS and NRHM

Annexures – (Action Plan and Budget) SAPCC- Jan 2015
- 177 -
research, Promotion of public private partnerships,
Mainstreaming AYUSH – revitalizing local health traditions
5. Ecological study on air
pollutants‐ from industry,
transport and domestic
cooking, pollen and molds
(as triggers of Asthma and
Resp. diseases) and how
they are affected by CC
Pilot study is proposed for all districts Hospitals, *To screen
and study patients suffering from Bronchial Asthma and other
Resp. Diseases
5
@ 0.1 Cr rupees per district *Required
Med. Specialist and Chest Specialist are
available.
2.1
6. Enhanced provision of
Primary, Secondary and
Tertiary health care
facilities and
implementation of public
health measures, including
vector control, sanitation
and clean drinking water
supply
i) Primary level:‐ Awareness and sensitization to all sectors on
Climate change.
ii) Secondary level:‐ Early diagnosis and treatment i.e. Testing
kits and drugs.
iii) Tertiary level:‐ Testing kits and treatment with drugs
Primary level: Rs.0.05 Cr per districts and
Rs.1.8 Cr for State Hq Secondary and
tertiary level each: Rs.1 Cr @ of Rs.0.05 Cr
per districts and Rs.2 Cr for State Hq.
2.5
7. Providing high resolution
weather and climate data to
study the regional pattern
of diseases. Development
of a high resolution health
impact model at the state
level
i Through IDSP (Integrated Disease Surveillance Project)
which is a project by GOI on Disease Surveillance and is
engaged in Outbreak/ Epidemic forecasting and
investigation/management. Assistance of department. Of
Science and Technology, Remote Sensing section will be
taken for real time high resolution weather and climate data.
Fund will be needed for engaging Remote
Sensing department for high resolution data
transfer.
1.0
8. GIS mapping of access
routes to health facilities
Both State Remote Sensing Health departments under
NVBDCP will be utilized for GIS mapping. /Centre for
Environmental Sciences Central University of Bihar, Patna
1.0
9. Development of a disaster
Risk reduction Plan In association with the National Disaster Management
Authority / Bihar State Disaster Management Authority/Centre
for Environmental Sciences, Central University of Bihar, Patna.
1.0
Annexures – (Action Plan and Budget) SAPCC- Jan 2015
- 178 -
Develop plans for risk reduction of diseases escalation and
outbreaks due to climate change
10. Climate change
coordination committee
A committee needs to be formulated with members from all
disease control programmes who will ensure integration of
climate change concerns in planning and implementing diseases
control measures for existing and new and emerging diseases
0.5
Total budget proposed