stat 13, intro. to statistical methods for the life and
TRANSCRIPT

Stat 13, Intro. to Statistical Methods for the Life and Health Sciences.
1. Echinacea and rejecting the null example. 2. Sampling, bias, and students example. 3. Estimating the mean, and guessing elapsed time example. 4. Sig. level, Type 1 and type 2 errors.
Read chapter 3. http://www.stat.ucla.edu/~frederic/13/F17 .HW2 is due Thu Oct 19 and is problems 2.3.15, 3.3.18, and 4.1.23.2.3.15 starts "Consider a manufacturing process that is producing hypodermic needles that will be used for blood donations."3.3.18 starts "Reconsider the investigation of the manufacturing process that is producing hypodermic needles. Using the data from the most recent sample of needles, a 90% confidence interval for the average diameter of needles is...."4.1.23 starts "In November 2010, an article titled 'Frequency of Cold Dramatically Cut with Regular Exercise' appeared in Medical News Today."
1

1.Failingtorejectthenullvs.acceptingthenull.
– 28inechinacea groupand30inplacebogroup.– "[V]olunteers recruitedfromhospitalpersonnelwererandomlyassignedtoreceive3capsulestwicedailyofeitherplacebo(parsley)orE.purpurea [echinacea]for8weeksduringthewintermonths.Upperrespiratorytractsymptomswerereportedweeklyduringthisperiod.
– "Individualsintheechinacea groupreported9sickdaysperpersonduringthe8-weekperiod,whereastheplacebogroupreported14sickdays(z=-0.42;P=.67)."

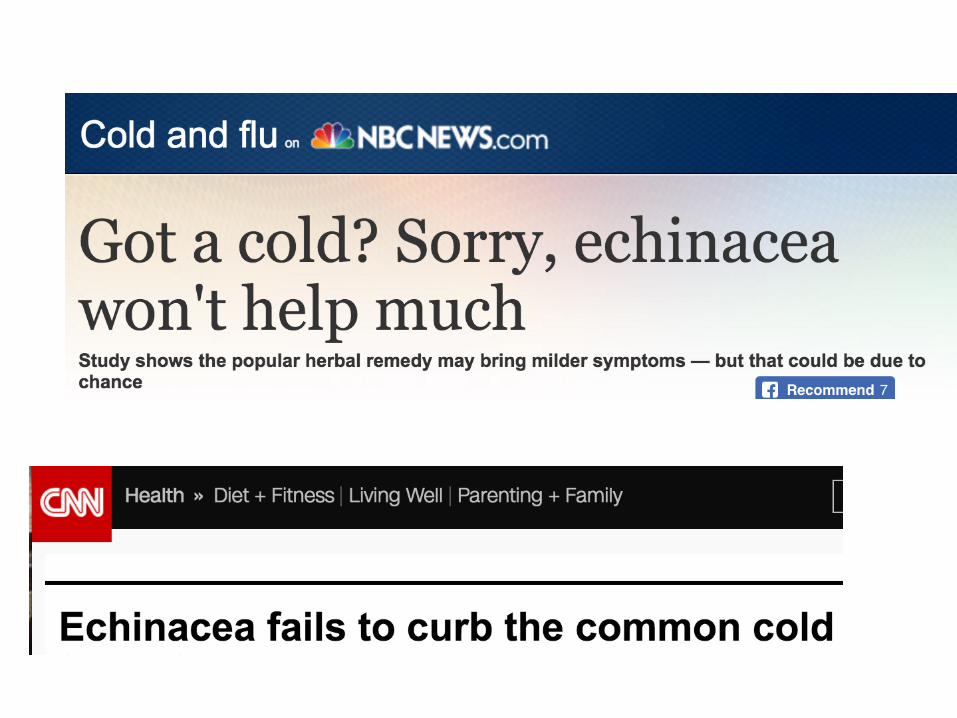
1.Failingtorejectvs.accepting– conclusioninOneil etal.(2008),"commerciallyavailableE.purpurea capsulesdidnotsignificantlyalterthefrequencyofupperrespiratorytractsymptomscomparedwithplacebouse."
– Fromsciencebasedmedicine.org,"[Thestudy]addedtotheevidencethat Echinacea isnotusefulforpreventionofcoldsorflus.Theyfoundnodifferenceinincidenceofcoldsymptoms."
– ABCNewsheadline"Study:Echinaceanohelpforcolds".

1.Failingtorejectvs.accepting.
Today, most of the evidence seems to indicate that echinaceadoes boost the immune system a little bit and help to fight colds. From WebMD: "Extracts of echinacea do seem to have an effect on the immune system, your body's defense against germs. Research shows it increases the number of white blood cells, which fight infections. A review of more than a dozen studies, published in 2014, found the herbal remedy had a very slight benefit in preventing colds."

2.Samplingstudents
Example2.1A

• Wewilllookatdatacollectedfromtheregistrar’sofficefromtheCollegeoftheMidwestforALLstudentsforSpring2011bylookingatthetwovariablesinthespreadsheetbelowthatshowsthefirst8students.
SamplingStudents
StudentID CumulativeGPA Oncampus?1 3.92 Yes2 2.80 Yes3 3.08 Yes4 2.71 No5 3.31 Yes6 3.83 Yes7 3.80 No8 3.58 Yes… … …

• Whattypeofvariableis“Oncampus”?• WhattypeisCumulativeGPA?
SamplingStudents
StudentID CumulativeGPA Oncampus?1 3.92 Yes2 2.80 Yes3 3.08 Yes4 2.71 No5 3.31 Yes6 3.83 Yes7 3.80 No8 3.58 Yes… … …

• Herearegraphs(ahistogramandabargraph)representingallofthe2919students attheCollegeoftheMidwestforourtwovariablesofinterest.
SamplingStudents

• Weusuallydon’thaveinformationonanentirepopulationlikewedohere.
• Weusuallyneedtomakeinferencesaboutapopulationbasedonasample.
• Supposearesearcherasksthefirst30studentsshefindsoncampusonemorningwhethertheyliveoncampus.Thiswouldbeaquickandconvenientwaytogetasample.
SamplingStudents

Forthisscenario:• Whatisthepopulation?• Whatisthesample?• Whatistheparameter• Whatisthestatistic?• Doyouthinkthisquickandconvenientsamplingmethodwillresultinasimilarsampleproportiontothepopulationproportion?
SamplingStudents

• Theresearcher’ssamplingmethodmightoverestimatetheproportionofstudentsthatliveoncampusbecauseifitistakenearlyinthemorningmostofthosethatliveoffcampusmightnothavearrivedyet.
• Wecallthissamplingmethodbiased.• Asamplingmethodisbiased ifstatisticsfromsamplesoverorunder-estimatethepopulationparameteronaverage.
SamplingStudents

• Biasisapropertyofasamplingmethod,notthesample– Amethodmustconsistently (onaverage)producenon-representativeresultstobeconsideredbiased
• Samplingbiasalsodependsonwhatismeasured– WouldthemorningsamplingmethodbebiasedinestimatingtheaverageGPAofstudentsatthecollege?
– Whataboutestimatingtheproportionofstudentswearingorangeshirts?
SamplingStudents

• What’sabetterwayofselectingarepresentativesample?
• Usearandommechanismtoselecttheobservationalunits
• Don’trelyonconveniencesamples• A SimpleRandomSample(SRS) iswhereeverycollectionofsizen isequallylikelytobethesampleselectedfromthepopulation.
SamplingStudents

• HowcouldwetakeaSimpleRandomSampleof30studentsfromtheCollegeoftheMidwest?
• RepresenteachstudentbyIDnumbers1to2919• Havethecomputerrandomlyselect30numbersbetween1and2919
SamplingStudents

IDCumGPA
Oncampus? ID
CumGPA
Oncampus? ID
CumGPA
Oncampus?
827 3.44 Y 844 3.59 N 825 3.94 Y1355 2.15 Y 90 3.30 Y 2339 3.07 N1455 3.08 Y 1611 3.08 Y 2064 3.48 Y2391 2.91 Y 2550 3.41 Y 2604 3.10 Y575 3.94 Y 2632 2.61 Y 2147 2.84 Y2049 3.64 N 2325 3.36 Y 2590 3.39 Y895 2.29 N 2563 3.02 Y 1718 3.01 Y1732 3.17 Y 1819 3.55 N 168 3.04 Y2790 2.88 Y 968 3.86 Y 1777 3.83 Y2237 3.25 Y 566 3.60 N 2077 3.46 Y
SamplingStudentsIDsofthe30peopleselected,alongwiththeircumulativeGPAandresidentialstatus
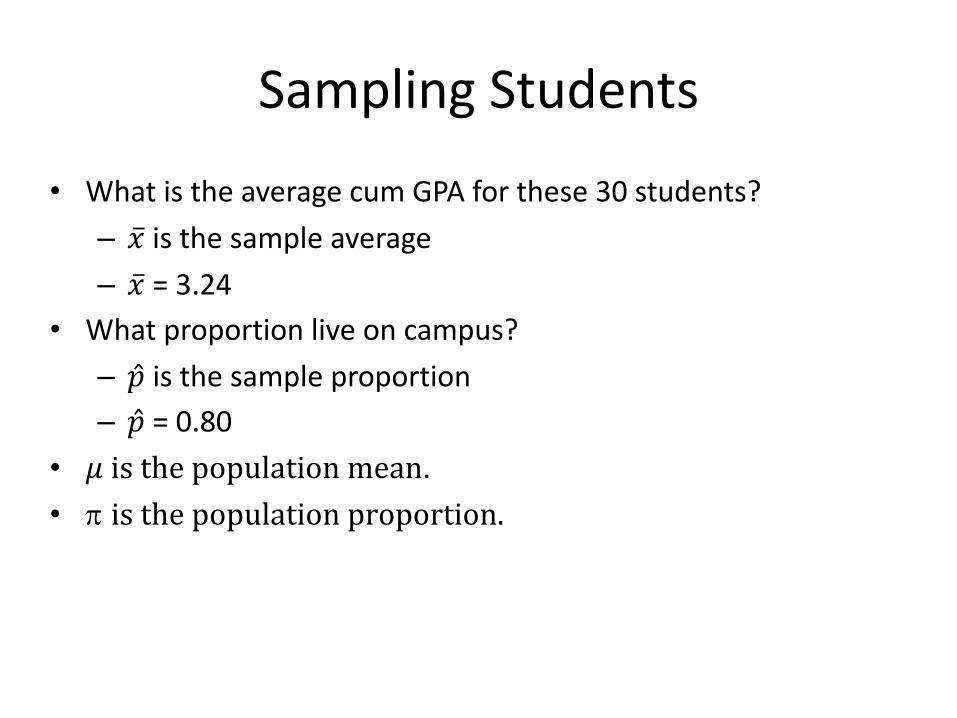
• WhatistheaveragecumGPAforthese30students?– �̅� isthesampleaverage– �̅� =3.24
• Whatproportionliveoncampus?– �̂� isthesampleproportion– �̂� =0.80
• 𝜇isthepopulationmean.• p isthepopulationproportion.
SamplingStudents

• Howdoweknowif�̅� and�̂� areclosetothepopulationvalues,𝜇 andp?
• Adifferentsampleof30studentswouldprobablyhavehaddifferentvalues.
• Howarethesestatisticsusefulinestimatingthepopulationparametervalues?
• Let’stakemoresimplerandomsamplesof30studentstoexaminethenulldistributionofthestatisticsfromothersamples.
SamplingStudents

• Herearegraphs(ahistogramandabargraph)representingallofthe2919students attheCollegeoftheMidwestforourtwovariablesofinterest.
SamplingStudents

IDCumGPA
Oncampus? ID
CumGPA
Oncampus? ID
CumGPA
Oncampus?
827 3.44 Y 844 3.59 N 825 3.94 Y1355 2.15 Y 90 3.30 Y 2339 3.07 N1455 3.08 Y 1611 3.08 Y 2064 3.48 Y2391 2.91 Y 2550 3.41 Y 2604 3.10 Y575 3.94 Y 2632 2.61 Y 2147 2.84 Y2049 3.64 N 2325 3.36 Y 2590 3.39 Y895 2.29 N 2563 3.02 Y 1718 3.01 Y1732 3.17 Y 1819 3.55 N 168 3.04 Y2790 2.88 Y 968 3.86 Y 1777 3.83 Y2237 3.25 Y 566 3.60 N 2077 3.46 Y
SamplingStudentsIDsofthe30peopleselected,alongwiththeircumulativeGPAandresidentialstatus

• WhatistheaveragecumGPAforthese30students?– �̅� isthesampleaverage– �̅� =3.24
• Whatproportionliveoncampus?– �̂� isthesampleproportion– �̂� =0.80
• 𝜇isthepopulationmean.• p isthepopulationproportion.
SamplingStudents

• Howdoweknowif�̅� and�̂� areclosetothepopulationvalues,𝜇 andp?
• Adifferentsampleof30studentswouldprobablyhavehaddifferentvalues.
• Howarethesestatisticsusefulinestimatingthepopulationparametervalues?
• Let’stakemoresimplerandomsamplesof30studentstoexaminethenulldistributionofthestatisticsfromothersamples.
SamplingStudents

• Wetook5differentSRSsof30students• Eachsamplegivesdifferentstatistics• Thisissamplingvariability.• Thevaluesdon’tchangemuch:– AverageGPAsrangefrom3.22to3.40– Sampleproportionsrangefrom0.63to0.83
SamplingStudents
Randomsample 1 2 3 4 5
AverageGPA() 3.22 3.29 3.40 3.26 3.25
proportiononcampus( ) 0.80 0.83 0.77 0.63 0.83

• Populationparameters:– 𝜇 =3.288– 𝜋 ≈0.776(2265/2919).
• Whatdotheparametersdescribe?– ThetrueaveragecumulativeGPAandthetrueproportiononcampusofthe2919students
• Thestatisticstendtobeclosetotheparameters.
SamplingStudents
Randomsample 1 2 3 4 5
AverageGPA() 3.22 3.29 3.40 3.26 3.25
proportiononcampus( ) 0.80 0.83 0.77 0.63 0.83

• Wetook1000SRSsandhavegraphsofthe1000samplemeans(fortheGPAs)and1000sampleproportions(forlivingoncampus).
• Themeanofeachdistributionfallsnearthepopulationparameter.
SamplingStudents

• Whatwouldhappenifwetookallpossiblerandomsamplesof30studentsfromthispopulation?– Theaveragesofthestatisticswouldmatchtheparameters
exactly• StatisticscomputedfromSRSsclusteraroundtheparameter.• Whyisthisanunbiasedsamplingmethod?
– Thereisnotendencytooverorunderestimatetheparameter.• Thesamplingmethodandstatisticyouchoosedetermineifa
samplingmethodisbiased.• Asamplemeanofasimplerandomsampleisanunbiasedestimate
ofthepopulationmean.Sameforproportionsinsteadofmeans.
SamplingStudents

• Wecangeneralizewhenweusesimplerandomsamplingbecauseitcreates:– Asamplethatisrepresentativeofthepopulation.– Asamplestatisticthatisunbiasedandthusclosetotheparameterforlargen.
SamplingStudents
• IftheresearcherattheCollegeoftheMidwestuses75studentsinsteadof30withthesameearlymorningsamplingmethodwillitbelessbiased?
• Selectingmorestudentsinthesamemanner doesn’tfixthetendencytooversamplestudentswholiveoncampus.
• Asmallersamplethatisrandomisactuallymoreaccurate.
SamplingStudents
• Whatisanadvantageofalargersamplesize?– Lesssampletosamplevariability.– Statisticsfromdifferentsamplesclustermorecloselyaroundthecenterofthedistribution.
SamplingStudents

3.InferenceforaSingleQuantitativeVariable
Section2.2

Example2.2:EstimatingElapsedTime
• Studentsinastatsclass(fortheirfinalproject)collecteddataonstudents’perceptionoftime
• Subjectsweretoldthatthey’dlistentomusicandbeaskedquestionswhenitwasover.
• 10secondsoftheJackson5’s“ABC”andsubjectswereaskedhowlongtheythoughtitlasted
• Canstudentsaccuratelyestimatethelength?

Hypotheses
NullHypothesis:Peoplewillaccuratelyestimatethelengthofa10second-songsnippet,onaverage.(μ=10seconds)AlternativeHypothesis:Peoplewillnotaccuratelyestimatethelengthofa10second-songsnippet,onaverage.(μ≠10seconds)

EstimatingTime
• Asampleof48studentsoncampusweresubjectsandsonglengthestimateswererecorded.
• Whatdoesasingledotrepresent?• Whataretheobservationalunits?Variable?

Skewed,mean,median
• Thedistributionobtainedisnotsymmetric,butisrightskewed.
• Whendataareskewedright,themean getspulledouttotherightwhilethemedian ismoreresistanttothis.

MeanvsMedian• Themeanis13.71andthemedianis12.• Howwouldthesenumberschangeifoneofthe
peoplethatgaveananswerof30secondsactuallysaid300seconds?
• Thestandarddeviationis6.5sec.Alsonotresistanttooutliers.
Inference• H0:μ=10seconds• Ha:μ≠10seconds• Ourproblemnowis,howdowedevelopanull
distribution?• Flippingcoinswillnotworktomodelwhatwould
happenunderatruenullhypothesis.– Herewedon’thavepopulationdatathatreflectsournullhypothesiswhereμ =10seconds.
– Allwehaveisoursampleof48.
Population?
• Weneedtocomeupwithalargedatasetthatwethinkourpopulationoftimeestimatesmightlooklikeunderatruenull.
• Wemightassumethepopulationisskewed(likeoursample)andhasastandarddeviationsimilartowhatwefoundinoursample,buthasameanof10seconds.
• Thebookrecommendsusinganappletforthis.WecoulduseR,ordoa(theory-based)t-test.

Theory-BasedTest
• Usingsimulationstocreateapopulationeachtimewewanttorunatestofsignificanceisextremelytimeconsumingandcumbersome.(Sothiswillbetheonlytimewewilldoit.)
• Thenulldistributionthatwedevelopedcanbepredictedwiththeory-basedmethods.
• Weknowitwillbecenteredonthemeangiveninthenullhypothesis.
• Wecanalsopredictitsshapeanditsstandarddeviation.

t-distribution• Theshapeisverymuchlikeanormaldistribution,butslightlywider
inthetailsandiscalledat-distribution.• Thet-statisticisthestandardizedstatisticweusewithasingle
quantitativevariableandcanbefoundusingtheformula:
𝑡 =�̅� − 𝜇𝑠
𝑛�<The= >�< (standarddeviationofoursampledividedbythesquarerootofthesamplesize)iscalledthestandarderrorandisanestimateforthestandarddeviationofthenulldistribution.
Here𝑡 = [email protected]?B?C.CD.E
FG�<= 3.95.
p-value=2*(1-pt(3.95,df=47))=0.000261.
ValidityConditions
• Theobservationsmustbeindependent.• Thepopulationmustbenormallydistributed.• Thebooksaysyouneedthesamplesizetobeatleast20forthet-test,butthisisnotright.However,itisoftenhardtohaveanyideaifthepopulationisnormalwithouthavingatleast20observations.

EstimatingTime
FormulateConclusions.• Basedonoursmallp-value,wecanconcludethatpeopledon’taccuratelyestimatethelengthofa10-secondsongsnippetandinfacttheysignificantlyoverestimateit.
• Towhatlargerpopulationcanwemakeourinference?
Summary
• Whenwetestasinglequantitativevariable,ourhypothesishasthefollowingform:– H0:μ=somenumber– Ha:μ≠somenumber,µ<somethingorµ>something.
• Wewillgetourdata(ormean,samplesize,andSDforourdata)andusetheTheory-BasedInferencetodeterminethep-value.
• Thep-valuewegetwiththistesthasthesamegeneralmeaningasthosefromatestforasingleproportion.
4.Significancelevel,Type1andType2errors
Section2.3

SignificanceLevel
• Wethinkofap-valueastellingussomethingaboutthestrengthofevidencefromatestofsignificance.
• Thelowerthep-valuethestrongertheevidence.• Somepeoplethinkofthisinmoreblackandwhiteterms.Eitherwerejectthenullornot.

SignificanceLevel
• Thevaluethatweusetodeterminehowsmallap-valueneedstobetoprovideconvincingevidencewhetherornottorejectthenullhypothesisiscalledthesignificancelevel.
• Werejectthenullwhenthep-valueislessthanorequalto(≤)thesignificancelevel.
• ThesignificancelevelisoftenrepresentedbytheGreekletteralpha,α.
SignificanceLevel
• Typicallyweuse0.05foroursignificancelevel.Thereisnothingmagicalabout0.05.Wecouldsetupourtesttomakeit– hardertorejectthenull(smallersignificancelevelsay0.01)or
– easier(largersignificancelevelsay0.10).

TypeIandTypeIIerrors
• Inmedicaltests:– AtypeIerrorisafalsepositive.(Theyconcludesomeonehasadiseasewhentheydon’t.)
– AtypeIIerrorisafalsenegative.(Theyconcludesomeonedoesnothaveadiseasethentheyactuallydo.)
• Thesetypesoferrorscanhaveverydifferentconsequences.

TypeIandTypeIIErrors
•

TypeIandTypeIIerrors

TheprobabilityofaTypeIerror
• TheprobabilityofatypeIerroristhesignificancelevel.
• Supposethesignificancelevelis0.05.Ifthenullistruewewouldrejectit5%ofthetimeandthusmakeatypeIerror5%ofthetime.
• Ifyoumakethesignificancelevellower,youhavereducedtheprobabilityofmakingatypeIerror,buthaveincreasedtheprobabilityofmakingatypeIIerror.

TheprobabilityofaTypeIIerror• TheprobabilityofatypeIIerrorismoredifficulttocalculate.
• Infact,theprobabilityofatypeIIerrorisnotevenafixednumber.Itdependsonthevalueofthetrueparameter.
• TheprobabilityofatypeIIerrorcanbeveryhighif:– Thetruevalueoftheparameterandthevalueyouaretestingareclose.
– Thesamplesizeissmall.

Power• Theprobabilityofrejectingthenullhypothesiswhenitisfalseiscalledthepower ofatest.
• Powercanalsobethoughtofas1minustheprobabilityofatypeIIerror.
• Wewantatestwithhighpowerandthisisaidedby– Alargeeffectsize,i.e.asamplemeanfarfromtheparameterinthenullhypothesis.
– Alargesamplesize.– Asmallstandarddeviation.