stas$cs:( - · pdf filecorrelaon(coefficient • descrip$ve(stas$c(•...
TRANSCRIPT

Sta$s$cs: Correla'on
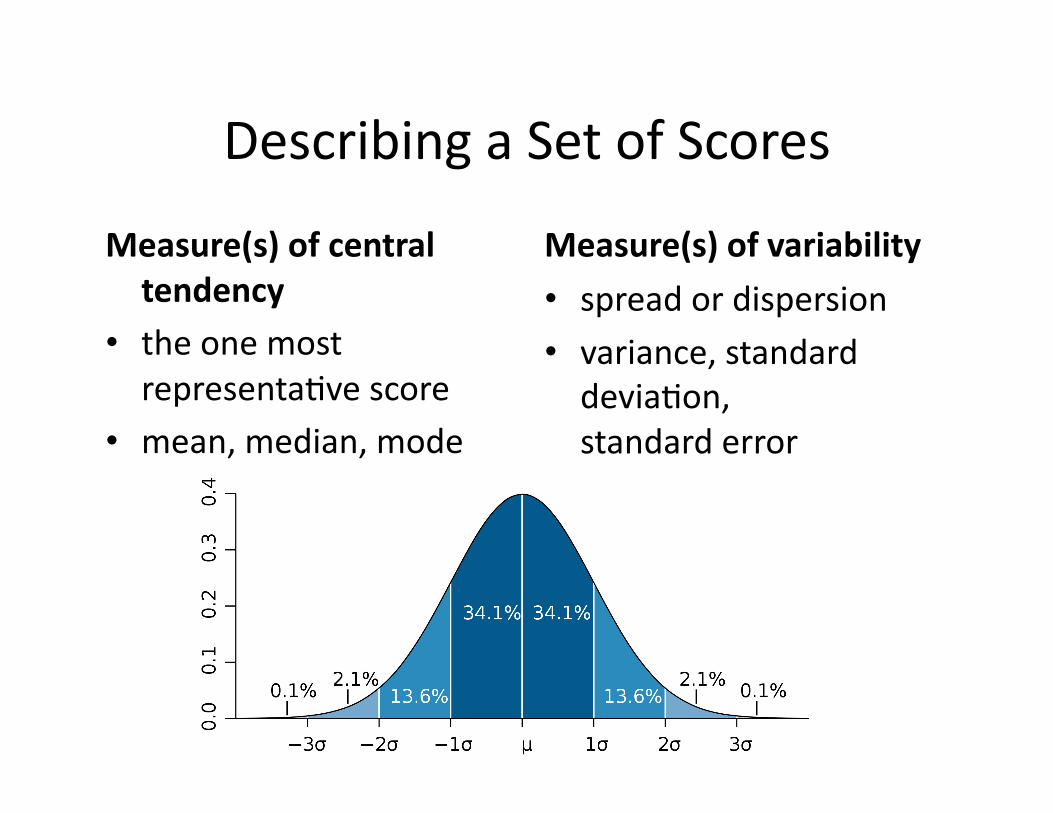
Describing a Set of Scores
Measure(s) of central tendency
• the one most representa$ve score
• mean, median, mode
Measure(s) of variability
• spread or dispersion • variance, standard devia$on, standard error
Describing Rela$onships Between Variables
• How the value (scores) of one variable changes when the value (scores) of another variable changes.
• Correla$on

Correla$on Coefficient
• Descrip$ve Sta$s$c • Numerical index
• Reflects the rela$onship between two variables
• Ranges from -‐1 to +1
• (Karl) Pearson’s r (product-‐moment correla$on)

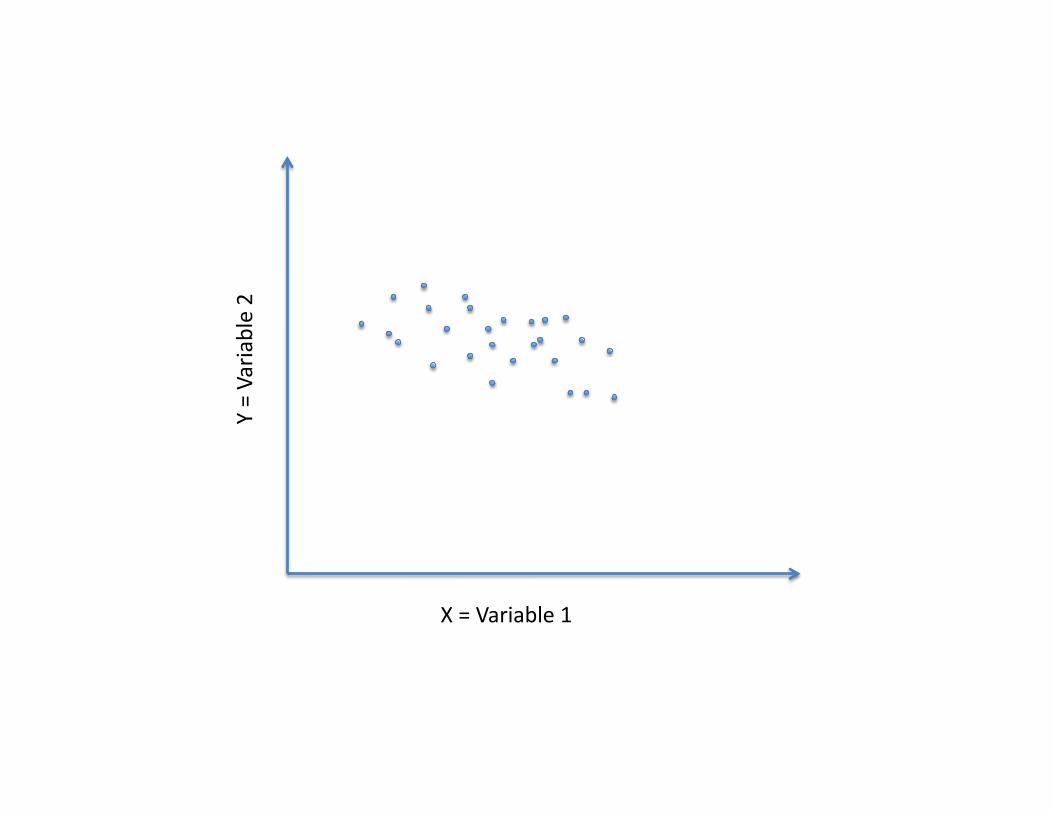
X = Variable 1
Y = Variable 2

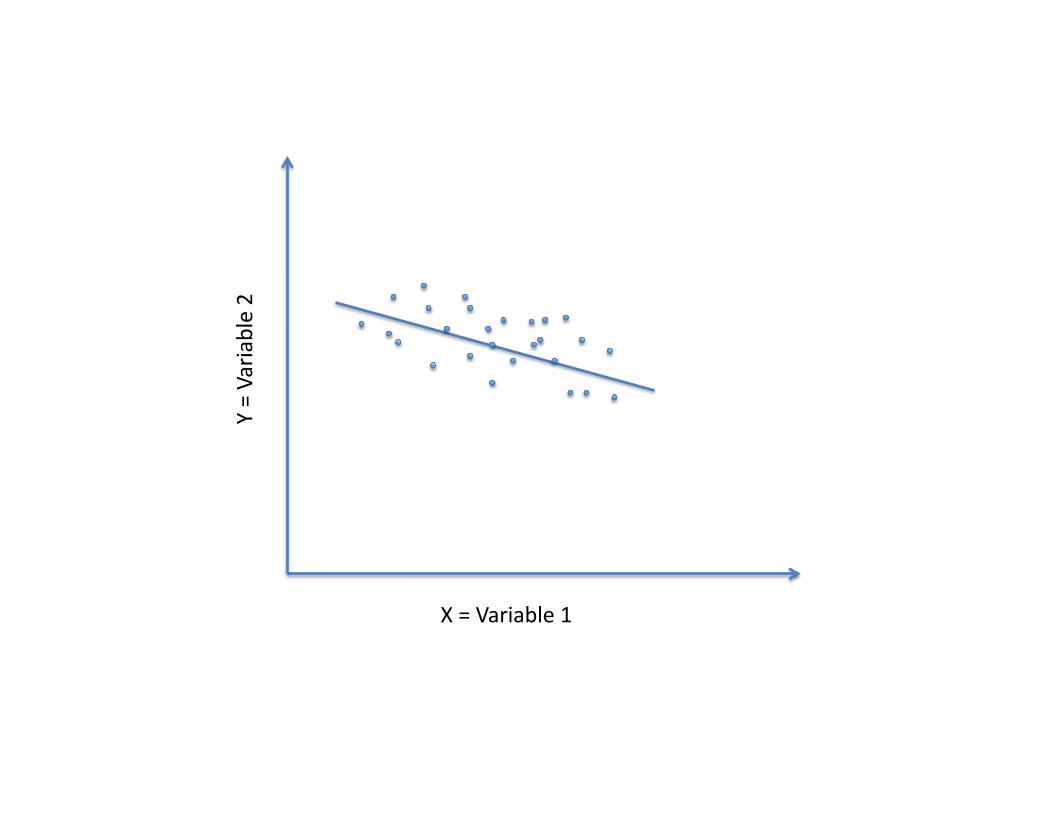
X = Variable 1
Y = Variable 2

X = Variable 1
Y = Variable 2

X = Variable 1
Y = Variable 2
X = Variable 1
Y = Variable 2
X = Variable 1
Y = Variable 2

X = Variable 1
Y = Variable 2
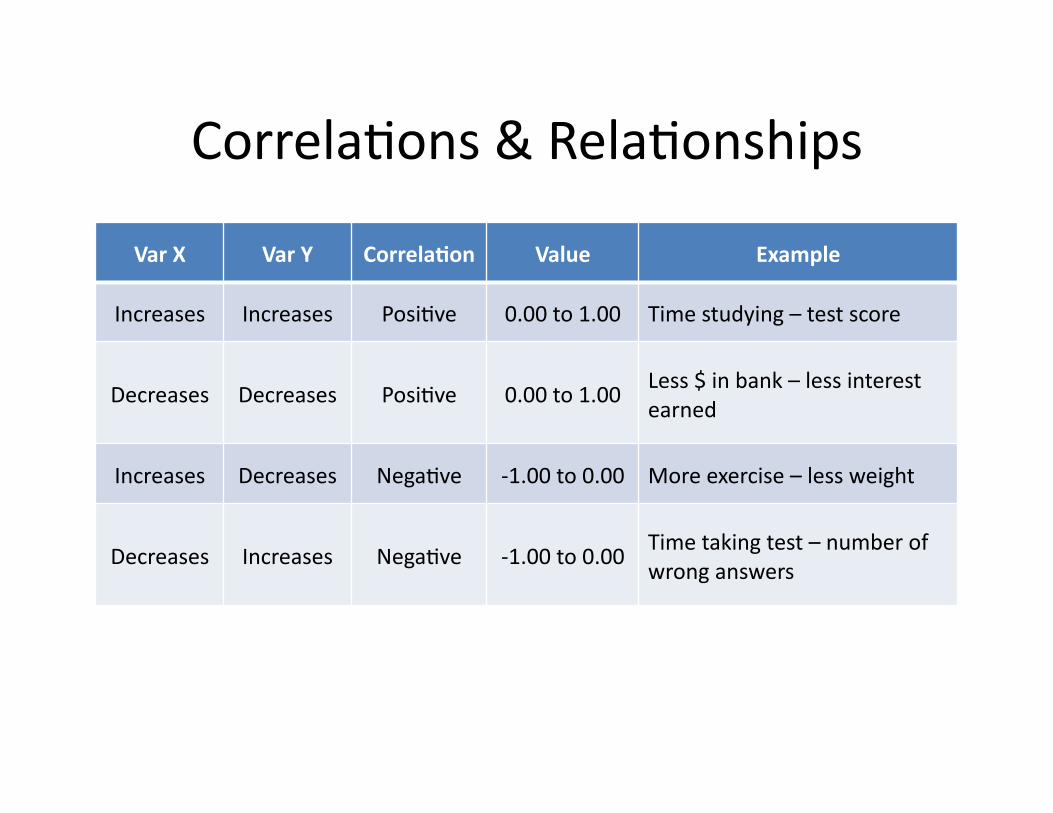
Correla$ons & Rela$onships
Var X Var Y Correla'on Value Example
Increases Increases Posi$ve 0.00 to 1.00 Time studying – test score
Decreases Decreases Posi$ve 0.00 to 1.00 Less $ in bank – less interest earned
Increases Decreases Nega$ve -‐1.00 to 0.00 More exercise – less weight
Decreases Increases Nega$ve -‐1.00 to 0.00 Time taking test – number of wrong answers
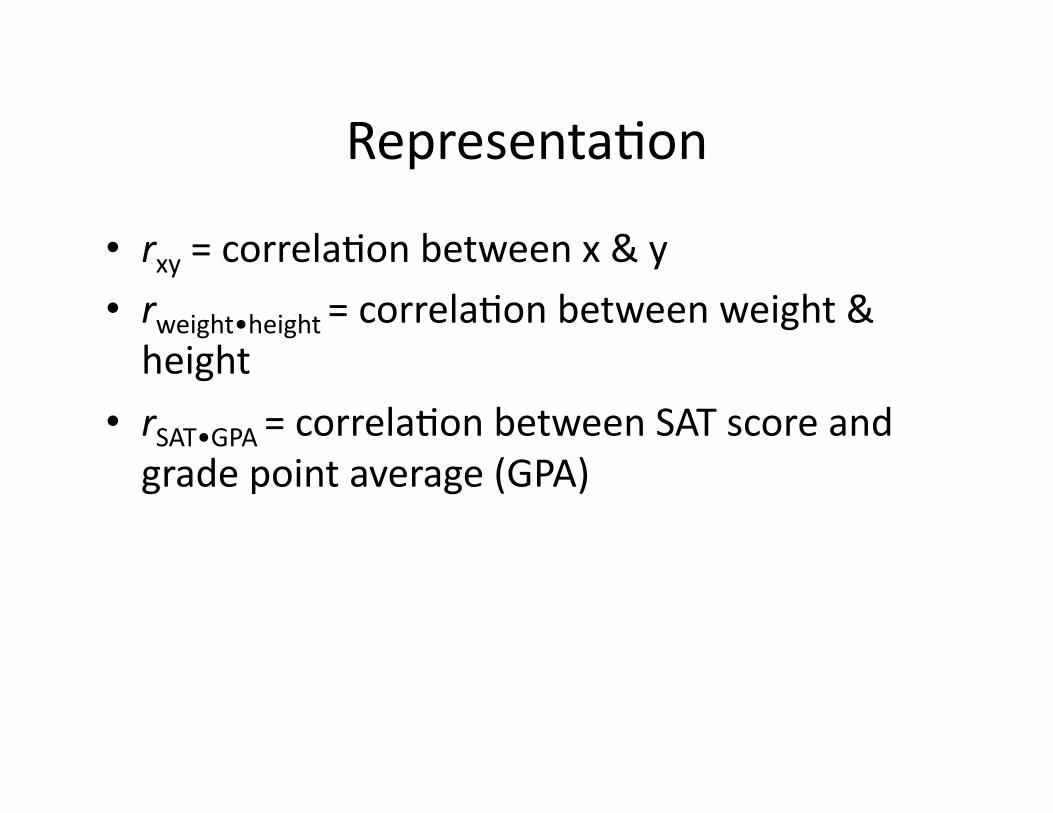
Representa$on
• rxy = correla$on between x & y • rweight•height = correla$on between weight & height
• rSAT•GPA = correla$on between SAT score and grade point average (GPA)

Formula for rxy
€
€
n XY − X Y∑∑∑
€
n X 2∑ − X∑( )2⎡
⎣ ⎢ ⎤ ⎦ ⎥ − n Y 2∑ − Y∑( )
2⎡ ⎣ ⎢
⎤ ⎦ ⎥

Formula for rxy (spreadsheet)
=CORREL(array1,array2)
Example: =CORREL(A2:A31,B2:B31)

Correla$on Matrix (>2 variables)
V1 V2 V3 V4
V1 rV1•V1 rV1•V2 rV1•V3 rV1•V4
V2 rV2•V1 rV2•V2 rV2•V3 rV2•V4
V3 rV3•V1 rV3•V2 rV3•V3 rV3•V4
V4 rV4•V1 rV4•V2 rV4•V3 rV4•V4

Correla$on Matrix (>2 variables)
V1 V2 V3 V4
V1 rV1•V1 rV1•V2 rV1•V3 rV1•V4
V2 rV2•V1 rV2•V2 rV2•V3 rV2•V4
V3 rV3•V1 rV3•V2 rV3•V3 rV3•V4
V4 rV4•V1 rV4•V2 rV4•V3 rV4•V4

Correla$on Matrix (>2 variables)
V1 V2 V3 V4
V1 1.00 -0.05 0.48 -0.95
V2 -0.05 1.00 0.86 0.36
V3 0.48 0.86 1.00 -0.17
V4 -0.95 0.36 -0.17 1.00

What Does It Mean? (1)
Correla'on Coefficient General
Interpreta'on
0.8 to 1.0 Very strong rela$onship
0.6 to 0.8 Strong rela$onship
0.4 to 0.6 Moderate rela$onship
0.2 to 0.4 Weak rela$onship
0.0 to 0.2 Weak or no rela$onship

What Does It Mean? (2)
• r2 = coefficient of determina$on • Percentage of variance in one variable that is accounted for by the variance in the other variable.
• r = 0.30 r2 = 0.09
• r = 0.60 r2 = 0.36
• r = 0.80 r2 = 0.64

What It DOES NOT Mean!
Causality

Imagine this: rice cream•crime = 0.65