startup myths and models
TRANSCRIPT

STARTUP MYTHS
AND MODELS
WHAT YOU WON’T LEARN
IN BUSINESS SCHOOL
BY RIZWAN VIRK

Contents
Figure 0.1 3
Figure 1.1 4
Startup Tool #1: Prioritizing Founder Motivations 5
Startup Tool #2: Uncovering Founder Expectations 6
Figure 3.1 7
Figure 5.1 8
Figure 7.1 9
Figure 8.1 10
Figure 8.2 11
Figure 11.1 12
Startup Tool #3: Calculating LTV and CAC 13
Figure 14.1 15
Figure 15.1 16
Startup Tool #4: Stated (Logical) Reasons for
Acquisitions
17
Startup Tool #5: Real (Underlying, Emotional) Reasons
for Acquisitions
18
Figure 17.1 19
Figure ApA.1 20
Figure ApA.2 21

What people thinkit looks like
What it reallylooks like
Startup success Startup success
Figure 0.1What Success Looks Like. This popular internet meme applies to startups perfectly! Recreated by the author
3

Figure 1.1 Evolution of Startup Markets and Valuations (The Startup Market Lifecycle). Created by the author
30
Actual valuations Total market sizeValuation multiples
25
20
15
10
5
0Nascent Growing Super-hot Maturing Mature
100B
10B
5B
1B
100M
50M
10M
4
26 T H E C A L L T O A D V E N T U R E
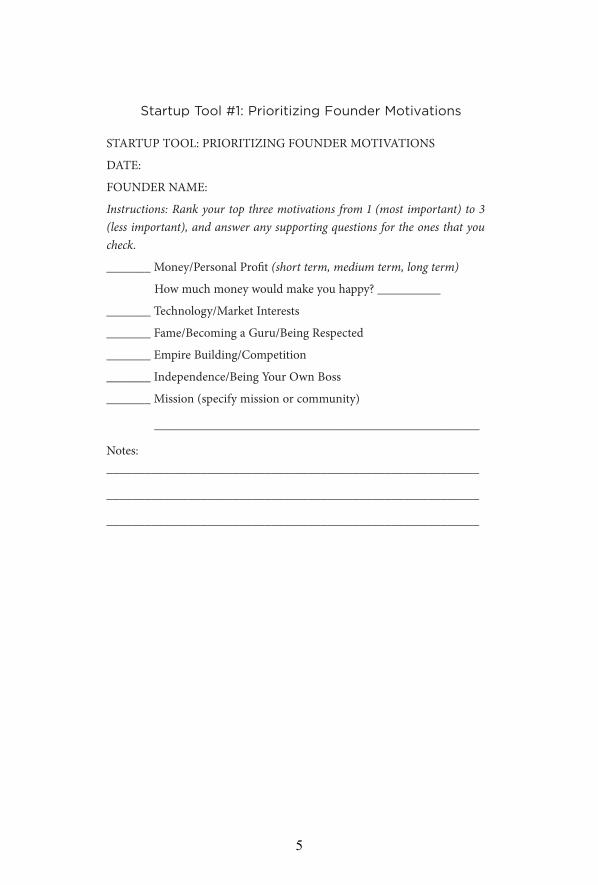
startup Tool #1: prioritizing Founder Motivations
STARTUP TOOL: PRIORITIZING FOUNDER MOTIVATIONS
DATE:
FOUNDER NAME:
Instructions: Rank your top three motivations from 1 (most important) to 3 (less important), and answer any supporting questions for the ones that you check.
_______ Money/Personal Profit (short term, medium term, long term)
How much money would make you happy? __________
_______ Technology/Market Interests
_______ Fame/Becoming a Guru/Being Respected
_______ Empire Building/Competition
_______ Independence/Being Your Own Boss
_______ Mission (specify mission or community)
____________________________________________________
Notes:___________________________________________________________
___________________________________________________________
___________________________________________________________
5

startup Tool #2: Uncovering Founder Expectations
• What happens if the company doesn’t raise money in six months?What if it doesn’t raise money in five years?(1 = not happy, 2 = indifferent, 3 = happy)
unhappy ← 1 2 3 → happy
• What if someone offers to buy the company for $5 million beforethe product is even released? Would you sell?
no way ← 1 2 3 → yes
• What if you were offered $5 million in another company’s stock vs.$5 million in cash?
no way ← 1 2 3 → yes
• What if your startup became the most popular company in SiliconValley, raised $25 million or more, but eventually flamed out.How would you feel?
unhappy ← 1 2 3 → happy
• What if your company started out as direct to consumer, and youended up pivoting to a b2b company dealing with an enterprisesales cycle (or vice versa)—would you be happy in this scenario?
unhappy ← 1 2 3 → happy
What if you are still running this company ten years from now, it’s profitable and surviving but not really an acquisition target?
unhappy ← 1 2 3 → happy
Extra Credit Expectations Exercise: Come up with one scenario that would make you happy and one that would make you unhappy. Then see how your cofounders would score each of those scenarios.
6

Figure 3.1 The Startup Market Opportunity Curve (aka the Goldilocks Curve). Created by the author
30
Actual valuations
Capital required
Valuation curve
Startupopportunitycurve
25
20
15
10
5
0Nascent Growing Super-hot Maturing Mature
100BTotal market size
10B
5B
1B
100M
50M
10M
7

30
Capital required
Startupopportunitycurve
First half: Two guys and a businessplan are better
Second half: Two guys and abusiness are better
25
20
15
10
5
0Nascent Growing Super-hot Maturing Mature
100B
10B
5B
1B
100M
50M
10M
Figure 5.1Two Halves of the Market and Two Guys and a Business Plan. Created by the author
8

Figure 7.1 Two Ways to Think About Valuation—Pie vs. High-Jump Bar. Pie created by the author, high-jump bar used under license from iDraw/Shutterstock.com
20%
9

Low fit
Low High
High/high
(hire/keep)(???)
(???)(reject/fire)
High
Low
Cultural fit
Figure 8.1 The Four Quadrants of Hiring. Created by the author
Expe
rienc
e/co
mpe
tenc
e
High experience
Low experienceHigh fit
?
?Low/Low
10

Low fit
Low High
High/high
(hire/keep)(don’t hire/fire)
(hire/keep)(reject/fire)
High
Low
Cultural fit
Figure 8.2 Conclusions for employees in the Four Quadrants of Hiring. Created by the author
Expe
rienc
e/co
mpe
tenc
e
High experience
Low experienceHigh fit
Low/Low
11

Figure 11.1 Focusing vs. Exploring. Created by the author
Large oilpocket
ExploreExplore/focus
D
Explore
B
Focus
A
C
12

Startup Tool #3: Calculating LTV and CAC
Some Basic Date Information
Campaign Start Date: __________ (a) The date your marketing spend started.
Example: April 1
Campaign End Date: __________ (b)The date your marketing spend ended (for this measurement).
Example: April 5
# of Days in Campaign: __________ (c)If you want to measure per day, you can calculate this as (b)–(a)
Example: 4 days
Total Lifetime Period: __________ (c)The time period you are measuring revenue for.
Example: 60 days, 90 days, or 1 year.
Customer Calculation Worksheet
Total Amount Spent: __________ (1)Total amount spent during that period.
Example: $10,000
Total Paid Users: __________ (2)Users that were acquired directly by marketing spend.
Example: 2,000
Total New Users: __________ (3)The total number of new users you got during the campaign period.
Example: 5,000
Total Organic Users: __________ (4) Calculate by (3) – (2)
Example: 5,000–2,000 = 3,000
CAC (paid): __________ (5)This is the cost of customer acquisition for a paid user. Divide (1) by (2).
Example: $10,000/2,000 = $5 per user
13

Customer Calculation Worksheet
CAC (effective): __________ (6)This is your real CAC, or effective CAC. Divide (1) by (3).
Example: $10,000/5000 = $2 per user
Total Revenue for Cohort: __________ (7)This is the total revenue generated over your target period by the users in (3).
Example: 3,000 users generated $15,000 in revenue
LTV: Lifetime Value for a Customer:
__________ (8)This is how much money per customer. Divide (7) by (3).
Example: $15,000 / 5,000 users = $3 LTV per customer
Finally, your LTV (8) should be greater than your CAC (6) for you to prof-itably acquire users. How much more it needs to be depends on factors beyond marketing spend.
Profitability Calculator: __________ (9) Take (8) – (6)
Example: $3 – $2 = $1 profit per user
14

Same Different
Same DifferentAxis: Market
Figure 14.1 The Four Quadrants of Pivoting. Created by the author
Different productdifferent market
Different
Same
Different
Same
Axi
s: p
rodu
ct/
tech
nolo
gy
Different product techsame market
Same productdifferent market
Current productcurrent market
2 3
1 4
15

Figure 15.1 Multiples of Revenues on Exit for Startups. Created by the author
30
Multiples Valuations
25
20
15
10
5
0Nascent Growing Super-hot Maturing Mature
16

startup Tool #4: stated (Logical) reasons for acquisitions
Why is acquirer _______________ (X) interested in buying your startup?
Please rank from 1 (most important reason) to 5 (least important or n/a).Repeat for each potential acquirer.___ Strategic market buy (expand into market)___ Geography buy (expand to a specific location)___ Product buy (product into their product line)___ Technology buy (component of your product into theirs)___ Numbers buy (put an X next to the number most important) ___ Revenue ___ Customers ___ Profits___ Acqui-hire / Talent
° What will you work on after the acquisition?
° What will happen to your product?
Other comments:________________________________________________________________________________________________________
17

startup Tool #5: real (underlying, emotional) reasons for acquisitions
Why is acquirer _______________ (X) interested in buying your startup?
Please rank from 1 (most important reason) to 5 (least important or n/a).Repeat for each potential acquirer.___ FOMO (fear of missing out)___ Frustration___ Checkbox___ Master of the universe___ Shiny new toy!___ Security___ Embarrassment
Usually, a combination of these emotional reasons underlie an acquisition; it’s just that most CEOs or management teams aren’t totally honest or forth-coming about these emotional reasons.
18

100
90
80
70
60
50
Perc
ent
40
30
20
10
0Seed A B
Series
Figure 17.1 Value of Common Stock vs. Preferred Stock. Created by the author
D IPOC
PreferredCommon
19

30
Actual valuations
25
20
15
10
5
0Nascent Growing Super-hot Maturing Mature
100B
Valuation multiples Total market size
10B
5B
1B
100M
50M
10M
figure apa.1Market Size Evolution with Stages. Created by the author
20

figure apa.2The Startup Market Opportunity and Related Curves. Created by the author
30
Actual valuations
Capital required
Valuation curve
Startupopportunitycurve
25
20
15
10
5
0Nascent Growing Super-hot Maturing Mature
100BTotal market size
10B
5B
1B
100M
50M
10M
21