starch resin moisture level effect on injection molding
TRANSCRIPT
Brigham Young University Brigham Young University
BYU ScholarsArchive BYU ScholarsArchive
Theses and Dissertations
2013-03-16
Starch Resin Moisture Level Effect on Injection Molding Starch Resin Moisture Level Effect on Injection Molding
Processability and Molded Part Mechanical Properties with Pure Processability and Molded Part Mechanical Properties with Pure
Starch Resin and Polymer Blends Starch Resin and Polymer Blends
Jordan M. Ellingson Brigham Young University - Provo
Follow this and additional works at: https://scholarsarchive.byu.edu/etd
Part of the Construction Engineering and Management Commons, Engineering Science and Materials
Commons, and the Manufacturing Commons
BYU ScholarsArchive Citation BYU ScholarsArchive Citation Ellingson, Jordan M., "Starch Resin Moisture Level Effect on Injection Molding Processability and Molded Part Mechanical Properties with Pure Starch Resin and Polymer Blends" (2013). Theses and Dissertations. 3782. https://scholarsarchive.byu.edu/etd/3782
This Thesis is brought to you for free and open access by BYU ScholarsArchive. It has been accepted for inclusion in Theses and Dissertations by an authorized administrator of BYU ScholarsArchive. For more information, please contact [email protected], [email protected].
Starch Resin Moisture Level Effect on Injection Molding Processability and
Molded Part Mechanical Properties with Pure
Starch Resin and Polymer Blends
Jordan Mark Ellingson
A thesis submitted to the faculty of Brigham Young University
in partial fulfillment of the requirements for the degree of
Master of Science
Alan J. Boardman, Chair Michael P. Miles
Andrew R. George
School of Technology
Brigham Young University
March 2013
Copyright © 2013 Jordan Mark Ellingson
All Rights Reserved
ABSTRACT
Starch Resin Moisture Level Effect on Injection Molding Processability and Molded Part Mechanical Properties with Pure
Starch Resin and Polymer Blends
Jordan Ellingson School of Technology, BYU
Master of Science
The current and forecasted global consumption of plastic packaging and products through the 21st century combined with the already reported and growing negative impact of plastics on the environment due to plastics being synthesized from nonrenewable resources that do not biodegrade is of serious concern. However, recent advances in starch technology including the development of thermoplastic starch (TPS) materials —polymers that are both renewable and biodegradable—have brought hope to reducing this impact. The mechanical properties of thermoplastic starch have often been improved by blending with synthetic polymers. One issue that arises with blending is volatilization of the melt from moisture in the TPS materials. Ecostarch™, a proprietary, pelletized thermoplastic starch resin formulated from potato starch, was processed and tested to observe injection molding processability at various moisture levels, in pure TPS as well as various blend ratios with high-density polyethylene (HDPE) and polypropylene (PP). This study evaluated and analyzed the effects of the TPS pellet moisture content on void formation in the plastic pre-injection melt and subsequent molded part mechanical properties. Statistical analysis of the test results showed that moisture had a significant effect on void formation in the plastic melt. In TPS/HDPE blends, voids percent (as measured by cross section area) increased by 300-350% from 0.6% to 1.4% moisture levels. In unblended TPS, void percent increased by 150% from 0.4% to 1.4% moisture levels. In the unblended TPS parts, impact strength (energy in ft-lb) was decreased by 1% from 0.6% to 1.4% moisture level. In the TPS/HDPE and TPS/PP blends, there was no significant effect on impact strength due to the moisture percent levels of the TPS. Modulus decreased by 25% from 0.4% to 1.4% moisture level in unblended TPS parts. From 0.6% to 1.4% change in TPS moisture content, the modulus of the TPS/HDPE blend decreased by 9% at a 30% TPS/70% HDPE blend and decreased by 14% at a 70% TPS/30% HDPE blend. Though the moisture of TPS did not have a significant impact on the tensile strength of TPS/HDPE blends, the tensile strength of TPS/PP blend samples were significantly affected: a change from 0.6% to 1.4% moisture increased tensile strength 34% at a 70% TPS/30% PP blend and increased tensile strength by 22% at a 30% TPS/70% PP blend. Thus the results of this study highlight the relationships between moisture, voids, and mechanical performance of TPS and TPS/Polymer blends.
Keywords: Jordan Mark Ellingson, thermoplastic starch, TPS, Ecostarch, injection mold, voids, BiologiQ, tensile test, impact test, glycerol, moisture content, polyolefin

ACKNOWLEDGEMENTS
I would like to express my gratitude to all those who have supported my efforts in writing
this thesis. There were several individuals who were essential to my success in completing this
thesis. First and foremost my wife, Kaitlin, has been a constant support and encouragement to
me in completing this research, and in the pursuit of higher education. Thanks Kaitlin, for your
incredible support!
This research would have been impossible without the enthusiastic support and trust I
received from my graduate committee chair, Dr. Alan Boardman. I drew from his expertise in
polymer science and processing on a daily basis. I was honored to receive his mentorship as a
graduate student at BYU. I was also grateful for the participation and mentorship of my
graduate committee members, Dr. Mike Miles and Dr. Andy George.
I would like to thank all of the faculty and staff of the School of Technology at BYU. I
am grateful for their diligent efforts in providing a quality education environment. I will forever
be indebted to them for the education and experience they have provided to me as I prepare to
launch my career in Manufacturing Engineering.
iv
TABLE OF CONTENTS
LIST OF TABLES ........................................................................................................ VII
LIST OF FIGURES ..................................................................................................... VIII
1 Introduction ..........................................................................................................................10
1.1 Background.......................................................................................................... 10
1.2 Objective ............................................................................................................. 11
1.3 Problem Statement ............................................................................................... 11
1.4 Justification ......................................................................................................... 12
1.5 Hypotheses .......................................................................................................... 12
1.6 Methodology ........................................................................................................ 13
1.7 Definition of Terms .............................................................................................. 13
2 Literature Review ................................................................................................................16
2.1 Introduction ......................................................................................................... 16
2.2 Thermoplastic Starch ........................................................................................... 16
2.3 Injection Molding Thermoplastic Starch............................................................... 17
2.4 Pelletized Starch .................................................................................................. 18
2.5 Starch/ SynthetiC Polymer Blends ........................................................................ 19
2.6 Effects of Moisture............................................................................................... 20
2.6.1 Void Formation and Performance ............................................................................. 20
3 Methodology .........................................................................................................................22
3.1 Materials .............................................................................................................. 22
3.1.1 Synthetic Polymers ................................................................................................... 22
3.1.2 TPS ............................................................................................................................ 23
3.2 Equipment ........................................................................................................... 23
v
3.2.1 Preparation Equipment .............................................................................................. 23
3.2.2 Processing Equipment ............................................................................................... 24
3.2.3 Testing Equipment .................................................................................................... 25
3.3 Experimental Procedure ....................................................................................... 26
3.3.1 Design of Experiment ............................................................................................... 27
3.3.2 Sample Preparation ................................................................................................... 28
3.3.3 Sample Testing .......................................................................................................... 30
3.4 Data Analysis ....................................................................................................... 32
4 Results ...................................................................................................................................33
4.1 Void Formation .................................................................................................... 34
4.1.1 HDPE Blends and Void Formation ........................................................................... 34
4.1.2 PP Blends and Void Formation ................................................................................. 36
4.1.3 Void Formation in Unblended TPS .......................................................................... 38
4.2 Tensile Properties ................................................................................................ 39
4.2.1 HDPE Blends and Tensile Properties ....................................................................... 40
4.2.2 PP Blends and Tensile Properties ............................................................................. 42
4.2.3 Unblended TPS and Tensile Properties .................................................................... 44
4.3 Impact Properties ................................................................................................. 45
4.4 Relationship between Voids and Mechanical Performance of Injection-molded Part....................................................................................... 47
5 Conclusions and Recommendations ...................................................................................50
5.1 Summary ............................................................................................................. 50
5.2 Conclusions ......................................................................................................... 51
5.3 Discussion ........................................................................................................... 51
5.3.1 Relationship between MC, Voids, and Performance ................................................ 51
5.3.2 Problems in Blending PP and TPS ............................................................................ 52
vi
5.3.3 Differences in Findings ............................................................................................. 53
5.4 Recommendations ................................................................................................ 53
References .....................................................................................................................................55
Appendices ....................................................................................................................................57
Appendix A: Experimental Designs and Data...........................................................................58
Appendix B: Regression Results .................................................................................................60
Appendix C: Tensile Test Data ...................................................................................................75
Appendix D: Microscope Images ................................................................................................80
Appendix E: Microscope Data ....................................................................................................92
Appendix F: MSDS and Technical Data sheets for ESR Resin (25% Glycerol) ................................................................................................................................94
vii
LIST OF TABLES
Table 1: Variables Measured and Corresponding Tests ................................................................27
Table 2: Injection Molding Conditions ..........................................................................................30
Table 3: Results Showing Significance of Moisture % and Polyolefin Blend % for Two DOEs .....................................................................................................33
Table 4: Results Showing Significance of Moisture % for Unblended TPS .................................34
Table 5: Percent Change in Void % in Melt Cross Sections from Minimum Moisture to Maximum Moisture ........................................................................................35
Table 6: Percentage Decrease in Voids as Moisture Changes from Minimum to Maximum ......................................................................................................39
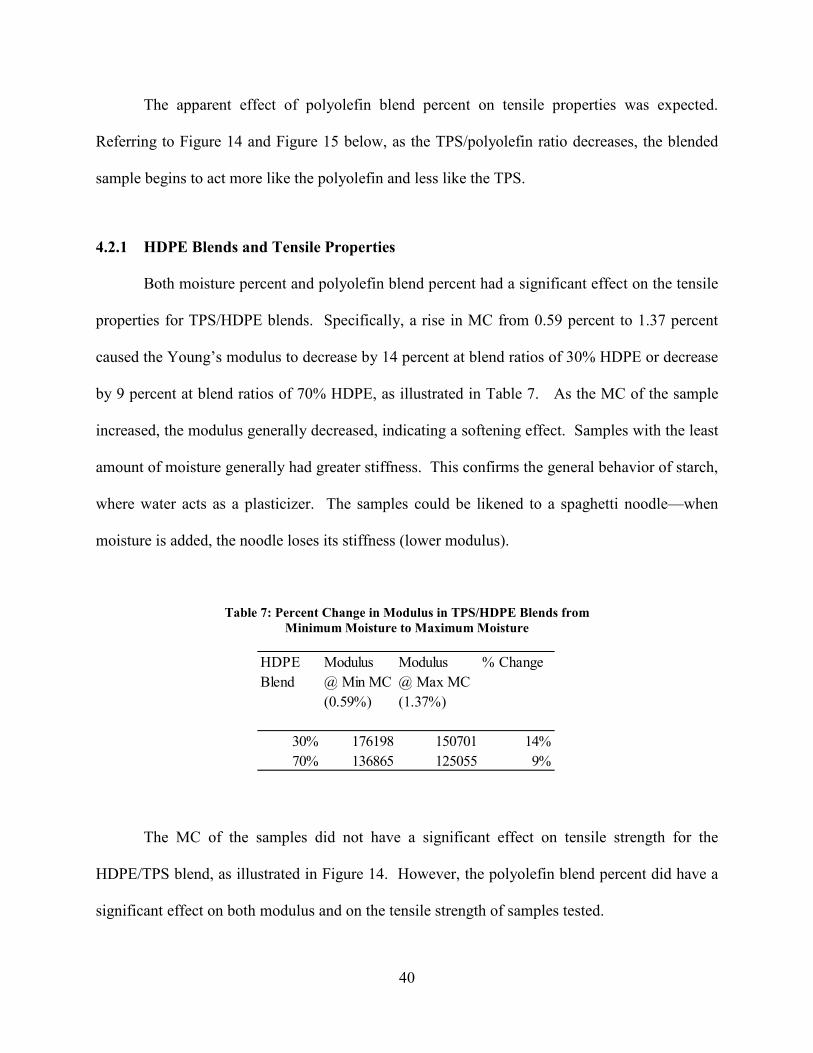
Table 7: Percent Change in Modulus in TPS/HDPE Blends from Minimum Moisture to Maximum Moisture ........................................................................................40
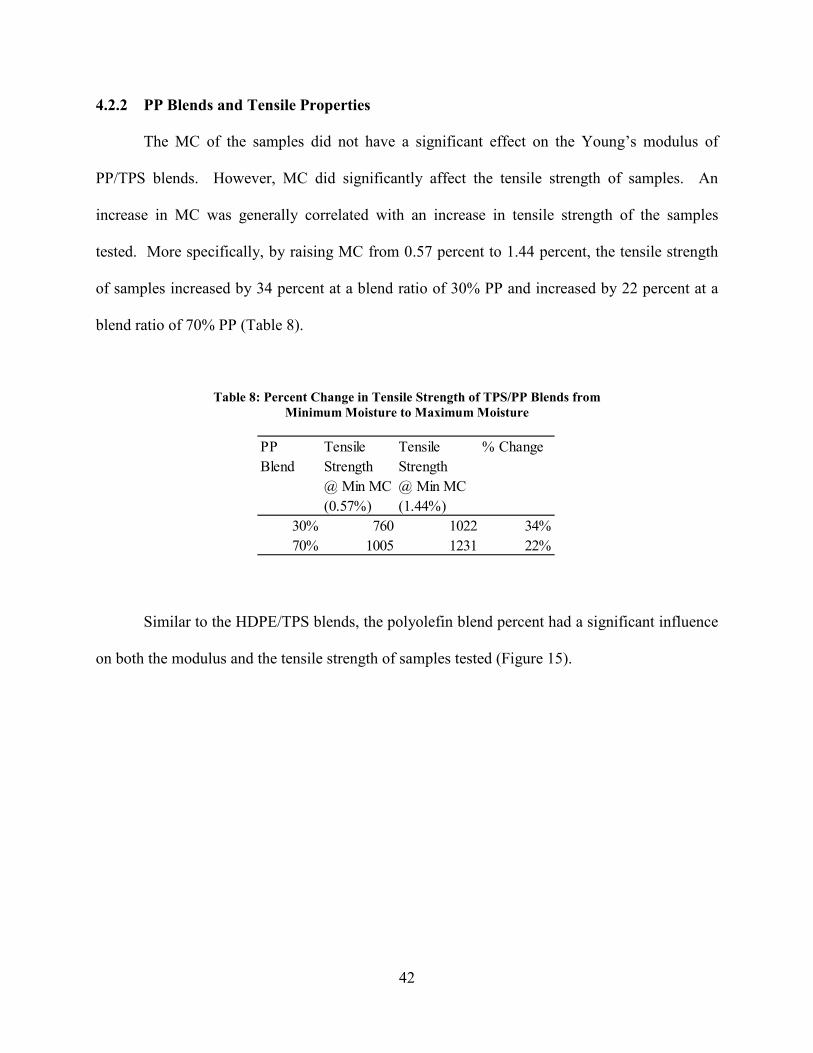
Table 8: Percent Change in Tensile Strength of TPS/PP Blends from Minimum Moisture to Maximum Moisture .......................................................................42
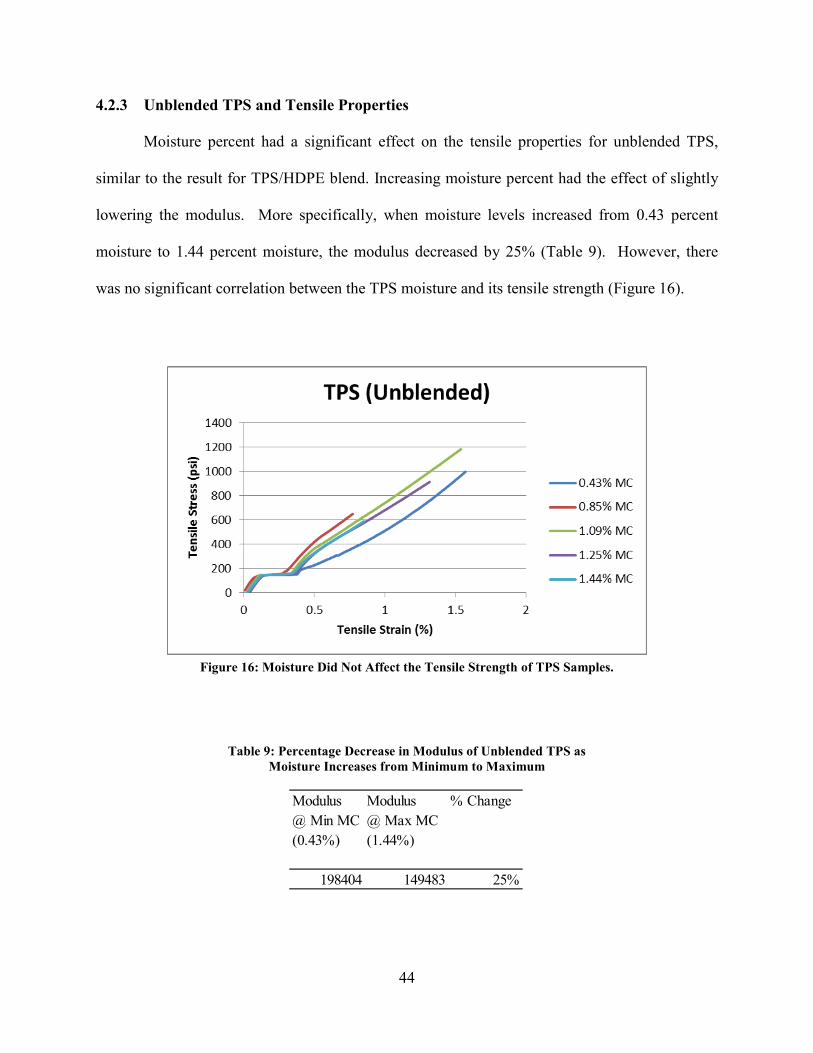
Table 9: Percentage Decrease in Modulus of Unblended TPS as Moisture Increases from Minimum to Maximum .............................................................................44
Table 10: The Effects of Voids (in Melt and in Finished Parts) on Mechanical Performance in TPS/Polyolefin Blends. This Table Also Shows that ESR Granules in TPS/PP Blends Had an Effect on Tensile Strength ............................................................................................................47
Table 11: The Effects of Voids (in Melt and in Finished Parts) on Mechanical Performance in Unblended TPS .....................................................................49
viii
LIST OF FIGURES
Figure 1: Pelletized Potato TPS Called Ecostarch™ .....................................................................19
Figure 2: ARID-X™ 35FM Air Drier (left) & Torbal™ ATS 120 Moisture Analyzer (right) ..................................................................................................................24
Figure 3: BOY 50M Injection Mold Machine (left) & Mold for Type 1 Tensile and Falling Dart Impact Samples (right) ...............................................................25
Figure 4: Keyence VHX 500 Microscope (Courtesy of Keyence, Inc. 2013) ...............................26
Figure 5: Instron 4204 Tensile Testing Machine (left) & Instron Falling Dart Impact Tester (right) ..................................................................................................26
Figure 6: Customized 52 Factorial Design of Experiment .............................................................28
Figure 7: Example of Extrudate Cross Section with Voids (Dyed Red for Visibility) ...........................................................................................................................31
Figure 8: Void % of HDPE Blends Were Affected by MC; 0.59% MC (left); 1.37% MC (right) ...............................................................................................................35
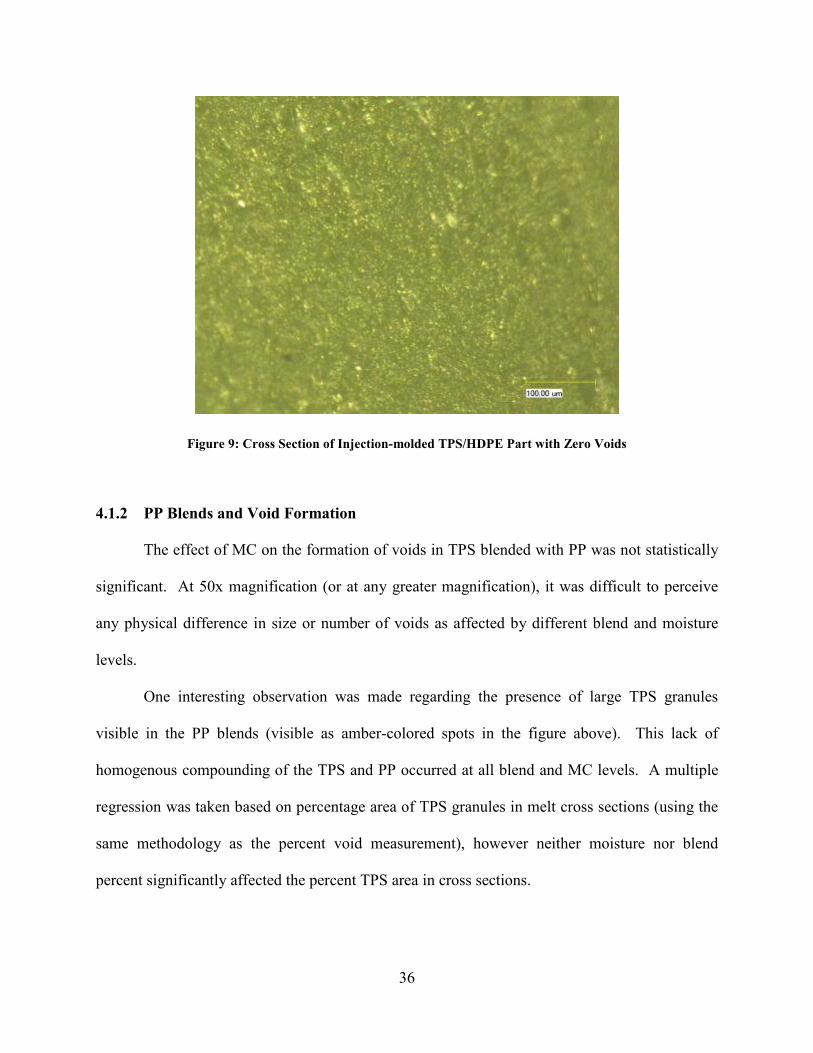
Figure 9: Cross Section of Injection-molded TPS/HDPE Part with Zero Voids ..................................................................................................................................36
Figure 10: No Significant Effect of MC on Void % of PP Blends; 0.57% MC (left) with 17% Voids; 1.44% MC (right) with 15% Voids .......................................37
Figure 11: Cross Section of Injection-molded TPS/PP Part. Note the Voids Prevalent in the Amber-colored ESR .................................................................................38
Figure 12: Void % of TPS Was Affected by MC. 0.59% MC (left) and 1.37% MC (right) ...............................................................................................................38
Figure 13: Cross Section of Injection-molded TPS Part (Unblended). .........................................39
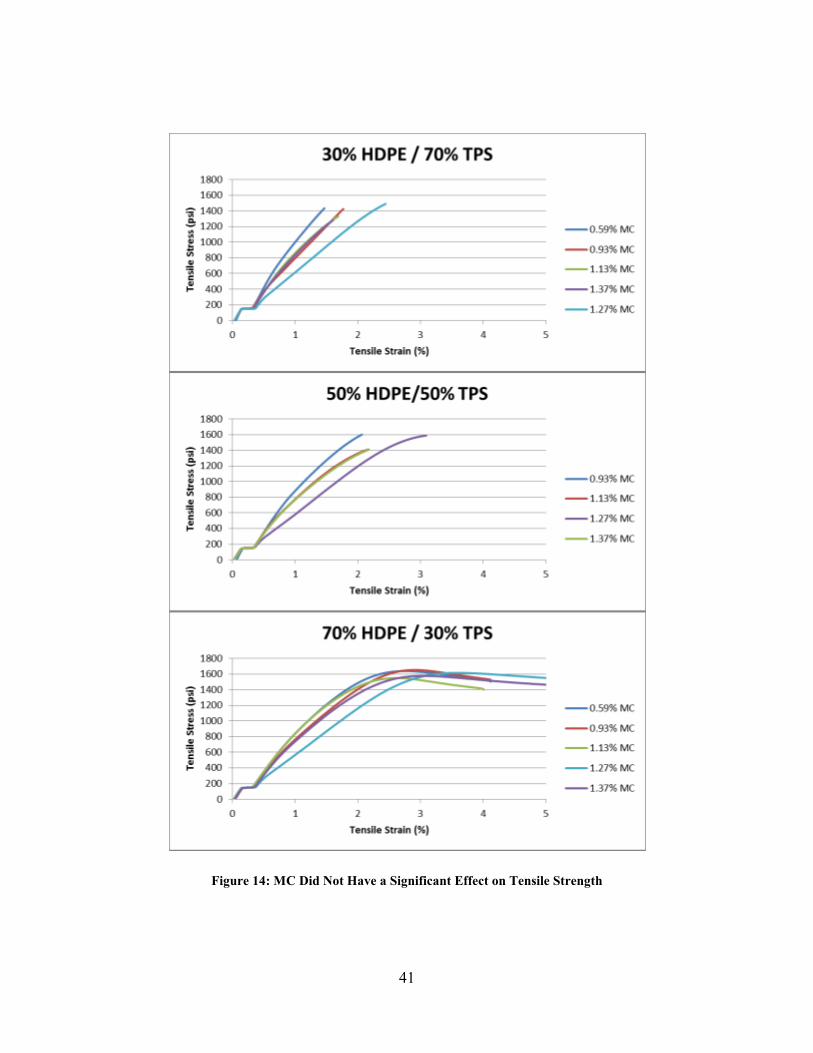
Figure 14: MC Did Not Have a Significant Effect on Tensile Strength ........................................41
Figure 15: Increasing the Moisture Generally Increases the Tensile Strength in TPS/PP Blends. Note that Increasing PP levels Also Had an Effect on Increasing Tensile Strength...........................................................................................43
Figure 16: Moisture Did Not Affect the Tensile Strength of TPS Samples. .................................44
Figure 17: The Only Effect on Impact Energy for TPS/polyolefin Blends Was the Polyolefin Blend % ..............................................................................................46

ix
Figure 18: Moisture Content Did Not Have Significant Effect on Impact Energy of Unblended TPS .................................................................................................47
10
1 INTRODUCTION
1.1 Background
Plastic is an integral part of our every-day lives. In 2010, the US produced over 31
million tons of plastic waste—or 12% of overall waste (EPA 2012). Experts estimate a 2- or 3-
fold global increase in plastics consumption during the beginning of the 21st century due to
growth in developing countries (Rudnik 2008). The alarming accumulation of plastic waste is
compounded by the fact that it is synthesized from non-renewable resources, and it is considered
“indestructible” when exposed to natural forces of decomposition (Carvalho 2008). To avoid
these issues, researchers have turned their attention to the feasibility of producing plastic goods
that are more friendly to the environment—both in their synthesis (through the use of renewable
resources) and in their disposal (through their ability to completely or partially decompose
through natural means). Known as green plastics (Gerngross 2000), biodegradable polymers
(Moore and Saunders 1997), or compostable polymers (Rudnik 2008), these products can be
made both from petroleum-based resources such as poly(caprolactone) (PCL) or poly(vinyl
alcohol) (PVA). Fortunately, scientists have discovered ways to produce compostable polymers
from renewable resources such as poly(lactic acid) (PLA) and thermoplastic starch (TPS)
(Rudnik 2008).
This research focuses on a specific type of TPS derived from potato starch. More
specifically, the material examined in this study is a proprietary form of pelletized TPS, designed
11
for injection molding and extrusion processing applications. Despite the environmental benefits
of using thermoplastic derived from potato starch, this material presents unique challenges due to
its naturally high moisture content, which can cause bubble formation during processing due to
water volatilization.
1.2 Objective
The purpose of this research is to determine to what extent the moisture content of
thermoplastic potato starch affects the resin’s mechanical properties in injection-molded parts
when operated at constant standard operating parameters (temperature, shot size, feed rate, etc).
This research aims to determine the above-mentioned relationship by observing the presence and
character of undesirable voids in the melt of extrudate leaving the nozzle of the injection mold
machine in addition to completed parts. To ensure an industrially-relevant understanding of the
effects of moisture of the thermoplastic potato starch, the research includes observations for both
stand-alone TPS resin and TPS/polymer blends.
1.3 Problem Statement
Although researchers have identified the importance of water as a plasticizer in the
formation of TPS, it has been observed that too much moisture can cause processing difficulties
due to bubble formation from steam (Liu, et al. 2009). This is a problem faced by Idaho start-up,
BiologiQ, Inc., when processing its trademarked and patented Ecostarch™ resin (a potato-based,
pelletized TPS resin) in injection molding applications.
A clear understanding of the relationship between the level of moisture and the resulting
bubble formation and mechanical performance of finished parts in the injection molding process
will help lead to greater process optimization for large-scale operations using TPS—both for
12
BiologiQ and for other industry players. By manipulating moisture content of the thermoplastic
potato starch resin, this research will possibly help define ideal processing practices that reach
beyond the technique of minimizing the resin’s exposure to atmospheric moisture.
This study additionally considers the effects of moisture on different TPS/polymer
blends, since a potential application of thermoplastic potato starch resin is its use as a blended
ingredient with common polymers. After all, TPS is rarely used alone, due to its poor
mechanical properties. Instead it is often blended with synthetic polymers to improve its
mechanical performance (Liu, et al. 2009).
1.4 Justification
This research is justified by the fact that TPS presents a high-potential alternative to
petroleum-based polymers due to the fact that it is derived from a renewable source and that it is
biodegradable. The aim of this research is to address the problem of water volatilization which
can hinder the industrial adoption of this product.
1.5 Hypotheses
The first hypothesis of this research involves the observable volatilization of moisture
found in TPS. The stated hypothesis is: The level of moisture content of the TPS resin has an
effect on the size and number of voids in the melt of an injection-molded part.
A second hypothesis closely relates to the first regarding the way voids in the melt
translate to voids in the injection-molded part. The second stated hypothesis is: Voids within the
injection-molded part are directly related to the amount of voids in the melt.
13
An additional hypothesis of the research involves the effects of moisture content on the
final injection-molded part, as pertaining to its performance: The level of moisture content of the
TPS resin has an effect on the tensile and impact performance of injection-molded samples.
1.6 Methodology
Unblended TPS resin was processed in an injection molding machine at various moisture
content levels. Additionally, two different polymers (HDPE and PP) were blended with the TPS
at various moisture content levels and blend ratios. The above-stated hypotheses were tested by
means of microscope for void detection and by mechanical testing of injection-molded parts.
The mechanical tests consisted of tensile testing and falling dart impact testing. The independent
variables of moisture content and polymer blend were tested for effect using statistical regression
analysis.
1.7 Definition of Terms
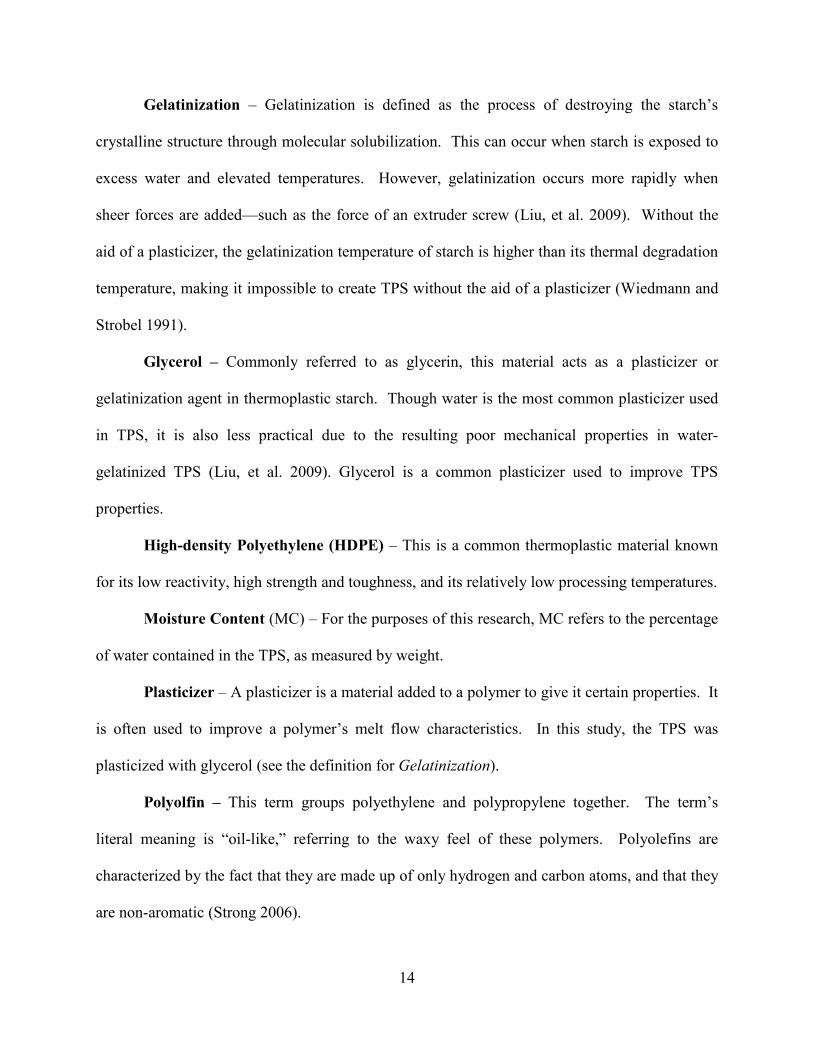
Ecostarch™ Resin (ESR) – This is a patented TPS compound produced by BiologiQ™,
Inc., based in Idaho, USA. Ecostarch ™ is made from potato starch, mixed with 27 percent
weight content of glycerol, which acts as a plasticizer. The MSDS and technical data sheets for
this material are not yet available. However, Appendix F does include these sheets for a similar
TPS product from BiologiQ, Inc., which is produced with 2 percent less glycerol.
Extrudate -- This term is used interchangeably with the word, “melt.” Though this study
does not use any extruder equipment, some melted plastic material was tested after allowing it to
be extruded from the injection molding machine nozzle while backed away from the sprue
bushing.
14
Gelatinization – Gelatinization is defined as the process of destroying the starch’s
crystalline structure through molecular solubilization. This can occur when starch is exposed to
excess water and elevated temperatures. However, gelatinization occurs more rapidly when
sheer forces are added—such as the force of an extruder screw (Liu, et al. 2009). Without the
aid of a plasticizer, the gelatinization temperature of starch is higher than its thermal degradation
temperature, making it impossible to create TPS without the aid of a plasticizer (Wiedmann and
Strobel 1991).
Glycerol – Commonly referred to as glycerin, this material acts as a plasticizer or
gelatinization agent in thermoplastic starch. Though water is the most common plasticizer used
in TPS, it is also less practical due to the resulting poor mechanical properties in water-
gelatinized TPS (Liu, et al. 2009). Glycerol is a common plasticizer used to improve TPS
properties.
High-density Polyethylene (HDPE) – This is a common thermoplastic material known
for its low reactivity, high strength and toughness, and its relatively low processing temperatures.
Moisture Content (MC) – For the purposes of this research, MC refers to the percentage
of water contained in the TPS, as measured by weight.
Plasticizer – A plasticizer is a material added to a polymer to give it certain properties. It
is often used to improve a polymer’s melt flow characteristics. In this study, the TPS was
plasticized with glycerol (see the definition for Gelatinization).
Polyolfin – This term groups polyethylene and polypropylene together. The term’s
literal meaning is “oil-like,” referring to the waxy feel of these polymers. Polyolefins are
characterized by the fact that they are made up of only hydrogen and carbon atoms, and that they
are non-aromatic (Strong 2006).
15
Polypropylene (PP) – This is a common thermoplastic material, also known for low
reactivity and toughness. It is favored in plastic parts that require moving hinges, thanks to its
toughness and lower crystallinity.
Thermoplastic Starch (TPS) -- This material is created from starches derived from
plants such as corn, wheat, rice, potato, tapioca, sorghum, arrowroot, and sago (Rudnik 2008)
(Whistler, BeMiller and Paschall 1984). Usually in powder form, the starch turns to
thermoplastic when combined with a swelling agent such as water, or another plasticizer such as
glycerol (Rudnik 2008). According to A. J. F. Carvalho, TPS can be generally defined as a
mixture of starch and plasticizer processed by a batch mixer or extruder at temperatures from
140°C to 160°C (Carvalho 2008).
Void – Refers to a small space or opening found in plastic. This study examines the
relationship between void formation and moisture content under the hypothesis that voids are
created when moisture within the polymer turns to steam and expands to form bubbles or voids.
However, this study ignores other possible factors that could lead to void creation (such as
glycerol content) by keeping other possible factors constant.
Volatilization – This refers to the creation of steam when water reaches 100ºC.
16
2 LITERATURE REVIEW
2.1 Introduction
This section will explore published literature regarding the relationships between TPS
and moisture content. The literature review begins with a basic explanation of researchers’
findings regarding TPS. The review will then narrow its focus to specific background and
foundational research pertinent to topics related to this study like potato starch resin, moisture
content and testing, extrusion processing of starch, starch/polymer blends, etc.
2.2 Thermoplastic Starch
Starch is a naturally-occurring polymer (or biopolymer) found in a variety of plants such
as corn, wheat, rice, potato, tapioca, sorghum, arrowroot, and sago (Rudnik 2008) (Whistler,
BeMiller and Paschall 1984). Researchers have discovered ways to transform starch into a
thermoplastic--known by researchers as thermoplastic starch, or simply TPS. The advantages of
using starch as a polymer include the fact that starch is a cheap and renewable alternative to
synthetic polymers (Carvalho 2008).
At first glance, the concept of using starch as a thermoplastic might be counterintuitive.
As Mano et al. reports, starch has poor mechanical properties, and it readily degrades at the
temperatures typical of thermal processing (Mano, Koniarova and Reis 2003). Additionally,

17
starch has a decomposition temperature that is lower than its melting temperature (Liu, et al.
2008). Fortunately, however, each of these poor characteristics of starch can be countered.
Starch can be “gelatinized” through the aid of a plasticizer at temperatures lower than its
decomposition temperature. Gelatinization can be defined as the process of destroying the
starch’s crystalline structure through molecular solubilization. This can occur when starch is
exposed to excess water and elevated temperatures. However, gelatinization occurs more rapidly
when sheer forces are added—such as the force of an extruder screw (Liu, et al. 2009). While
water is known to be the most effective plasticizer, there are other plasticizers used, depending
on the processing technique and desired properties.
Researchers have extensively explored other processing techniques for TPS to achieve
desirable material properties and performance for different plastic applications. The poor
mechanical properties of native starch have been countered by blending it with synthetic
polymers (Griffin 1994). Other processing techniques include adding plasticizers or lubricants,
or blending TPS with fibers (Liu, et al. 2009).
2.3 Injection Molding Thermoplastic Starch
The application of thermal processing of starch was first developed on the basis of the
long-known practice of extrusion cooking for pasta—where the components of mechanical shear
force, high temperatures, and water act together to “plasticize” the starchy ingredients
(Wiedmann and Strobel 1991). However, these early processes were mostly extrusion
applications. In fact, extrusion processing of starch is the most common application of
thermoplastic starch (Liu, et al. 2009). Fortunately, extrusion processing is very similar to
injection molding, in the sense that both employ the use of a screw to plasticize the polymer
through sheer, heat, and pressure.
18
An example of early innovation in the injection molding of starch products occurred in
the mid 1980’s when Wittwer and Tomka developed a patent for injection-molded medicine
capsules. This product was based on starch in which a moisture content of 5%-30% was
specified (Wittwer and Tomka 1987). The process was similar to the traditional extrusion
cooking, in the sense that it depended on water as a primary plasticizer.
Researchers have studied ways to counter the negative effects of starch’s high viscosity
and poor flow properties for injection molding applications. One proven solution is to blend
starch with synthetic polymers, which generally lowers the viscosity (Liu, et al. 2009). Another
solution is the introduction of an alternative plasticizer such as the glycerol used in the ESR
material in this experiment. Rodriguez-Gonzalez, et al. demonstrated that an increase in glycerol
content in starch reduces the overall viscosity of the TPS (Rodriguez-Gonzalez, Ramsay and
Favis 2004).
Processing conditions have proven to affect physical properties of starch and
starch/synthetic polymer blends (Ramkumar, et al. 1996). Therefore, this study sought to
minimize the effect of processing conditions by holding them constant across the entire
experiment.
2.4 Pelletized Starch
In reading researchers’ methodologies for injection molding and extrusion of TPS, it
seemed that starch is commonly fed into processing equipment in its native form, or in a
starch/water (or other plasticizer) mixture, similar to the methodology used by Rodriguez-
Gonzalez et al. or Ramkumar et al. (Rodriguez-Gonzalez, Ramsay and Favis 2004) (Ramkumar,
et al. 1996). One thing that sets this research apart is the use of pelletized TPS (known as
19
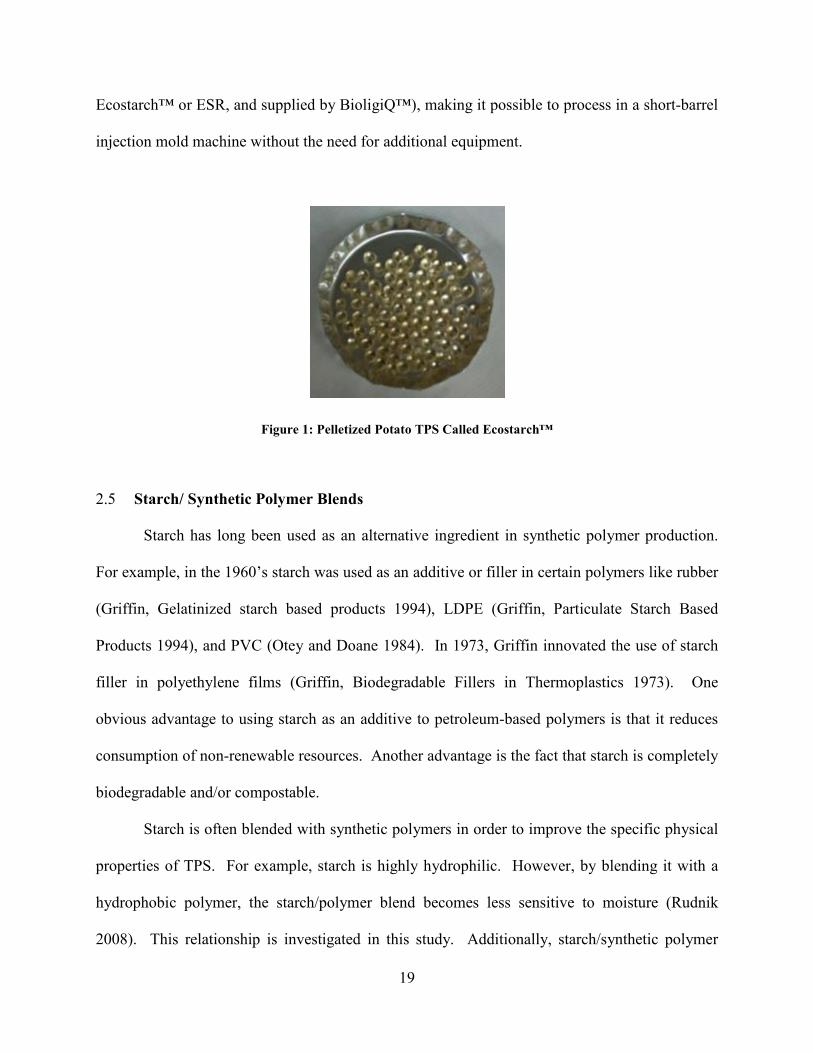
Ecostarch™ or ESR, and supplied by BioligiQ™), making it possible to process in a short-barrel
injection mold machine without the need for additional equipment.
Figure 1: Pelletized Potato TPS Called Ecostarch™
2.5 Starch/ Synthetic Polymer Blends
Starch has long been used as an alternative ingredient in synthetic polymer production.
For example, in the 1960’s starch was used as an additive or filler in certain polymers like rubber
(Griffin, Gelatinized starch based products 1994), LDPE (Griffin, Particulate Starch Based
Products 1994), and PVC (Otey and Doane 1984). In 1973, Griffin innovated the use of starch
filler in polyethylene films (Griffin, Biodegradable Fillers in Thermoplastics 1973). One
obvious advantage to using starch as an additive to petroleum-based polymers is that it reduces
consumption of non-renewable resources. Another advantage is the fact that starch is completely
biodegradable and/or compostable.
Starch is often blended with synthetic polymers in order to improve the specific physical
properties of TPS. For example, starch is highly hydrophilic. However, by blending it with a
hydrophobic polymer, the starch/polymer blend becomes less sensitive to moisture (Rudnik
2008). This relationship is investigated in this study. Additionally, starch/synthetic polymer
20
blends have been shown to improve overall the mechanical performance over pure TPS.
Rodriguez-Gonzalez et al. illustrated this in finding that PE/TPS blends approach polyethylene-
like properties as blend ratio is increased (Rodriguez-Gonzalez, Ramsay and Favis 2004).
2.6 Effects of Moisture
Researchers have observed that water acts as the best plasticizer for starch due to its
ability to penetrate the starch’s crystalline structure (Perry and Donald 2000). The moisture
content (MC) of TPS directly affects its viscosity (Liu, et al. 2009). For this reason, Senouci
and Smith observed the difficulty of extruding potato starch at low moisture contents in extrusion
cooking applications (Senouci and Smith 1986).
Of course there are less volatile options for plasticizers available, such as the glycerol
used in ESR (which boils at 554ºF). However, substituting water for other plasticizers like
glycerol has the effect of increasing the material’s gelatinization temperature (Liu, et al. 2009).
2.6.1 Void Formation and Performance
Mercier and Feillet, in their experimentation with extrusion cooking, described the
positive correlation between moisture content of starch and the expansion (or foaming) of the
melted starch (due to evaporating water) as it exits the nozzle of the extrusion head. They also
determined that the degree of expansion affects the properties of the resulting product (Mercier
and Feillet 1975). More recently, manufacturers have taken advantage of the effects of moisture
on expansion of starch-based products. For example, Lacourse et al. filed a patent describing an
innovative method for preparing biodegradable shaped foam meant to replace polystyrene foam
in packaging applications. The patent recommends a moisture content of 21% at processing
temperatures above the boiling point of water, 150 to 200 ºC (Lacourse and Altieri 1991).
21
As illustrated above, the moisture content of starch can easily affect the formation of
voids in injection-molding applications. In fact, researchers have repeatedly acknowledged the
problem of defects caused by excessive moisture in starch due to the volatile nature of water
when raised to the temperatures needed for processing (Griffin 1994). The moisture content in
the starch can cause undesirable air bubbles due to expanding steam (Liu, et al. 2009).
Willett and Doane have shown that the tensile properties of starch/poly(hydroxyester
ether) composites can be dependent on MC (Willett and Doane 2002). Aside from this study,
however, there does not seem to be any research investigating the relationship between moisture,
void formation, and mechanical properties.
22
3 METHODOLOGY
As stated above, the purpose of this research was to identify the effects of moisture on
TPS by performing two studies. The first study involved the effects of moisture on void
formation within the non-pressurized melt leaving the nozzle of the injection mold machine. The
second study involved the effects of moisture on the mechanical performance of injection-
molded parts.
3.1 Materials
To determine the effects of moisture on TPS in an injection molding application it was
necessary to not only test the TPS as a stand-alone product, but also as a blend with other
polymers.
3.1.1 Synthetic Polymers
Two polymers were selected for blending with the TPS: High-density Polyethylene
(HDPE) and Polypropylene (PP). These two polyolefin materials were selected due to their
favorable properties such as low reactivity, high strength, high toughness, and relatively low
processing temperatures. HDPE could also be considered a wise choice for a TPS blend due to
its potential application in creating compostable bags or containers. These materials were in the
form of standard pellets made for injection molding or extrusion applications. No preparation
23
was needed for the HDPE. However, according to a popular industry reference book, the PP
needed to be dried to less than 0.2% moisture content (weight percent) before processing (IDES,
Inc. 2004).
3.1.2 TPS
The TPS resin used for this study is called Ecostarch™ resin or ESR. This product is
coded as GS270 by the supplier, BiologiQ, Inc., and is supplied in pelletized form. The ESR
resin is derived from a blend of potato starch and 27% glycerol, which acts as a plasticizer. Its
untreated moisture content at room temperature was about 1.40% ± 0.04 (weight percent).
3.2 Equipment
Equipment for this research consisted of machines used for preparing materials, for
producing samples, and for testing samples as outlined below.
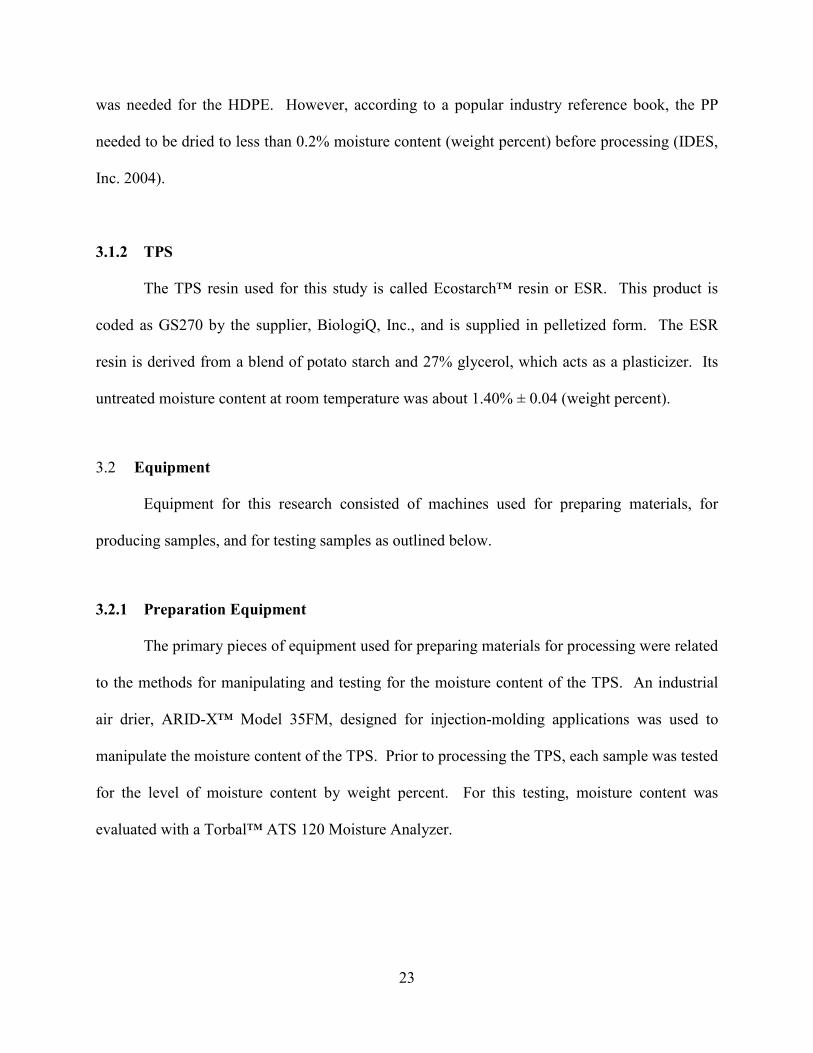
3.2.1 Preparation Equipment
The primary pieces of equipment used for preparing materials for processing were related
to the methods for manipulating and testing for the moisture content of the TPS. An industrial
air drier, ARID-X™ Model 35FM, designed for injection-molding applications was used to
manipulate the moisture content of the TPS. Prior to processing the TPS, each sample was tested
for the level of moisture content by weight percent. For this testing, moisture content was
evaluated with a Torbal™ ATS 120 Moisture Analyzer.
24
Figure 2: ARID-X™ 35FM Air Drier (left) & Torbal™ ATS 120 Moisture Analyzer (right)
3.2.2 Processing Equipment
All injection molding was completed using a 55-ton BOY 50 injection molding machine
with a general-purpose screw. The machine was fitted with a mold designed to make Type I
tensile testing specimens, conforming to the ASTM D 638-0 standard and falling dart impact
testing samples as guided by ASTM Standard D 5628 (ASTM International 2004).

25
Figure 3: BOY 50M Injection Mold Machine (left) & Mold for Type 1 Tensile and Falling Dart Impact Samples (right)
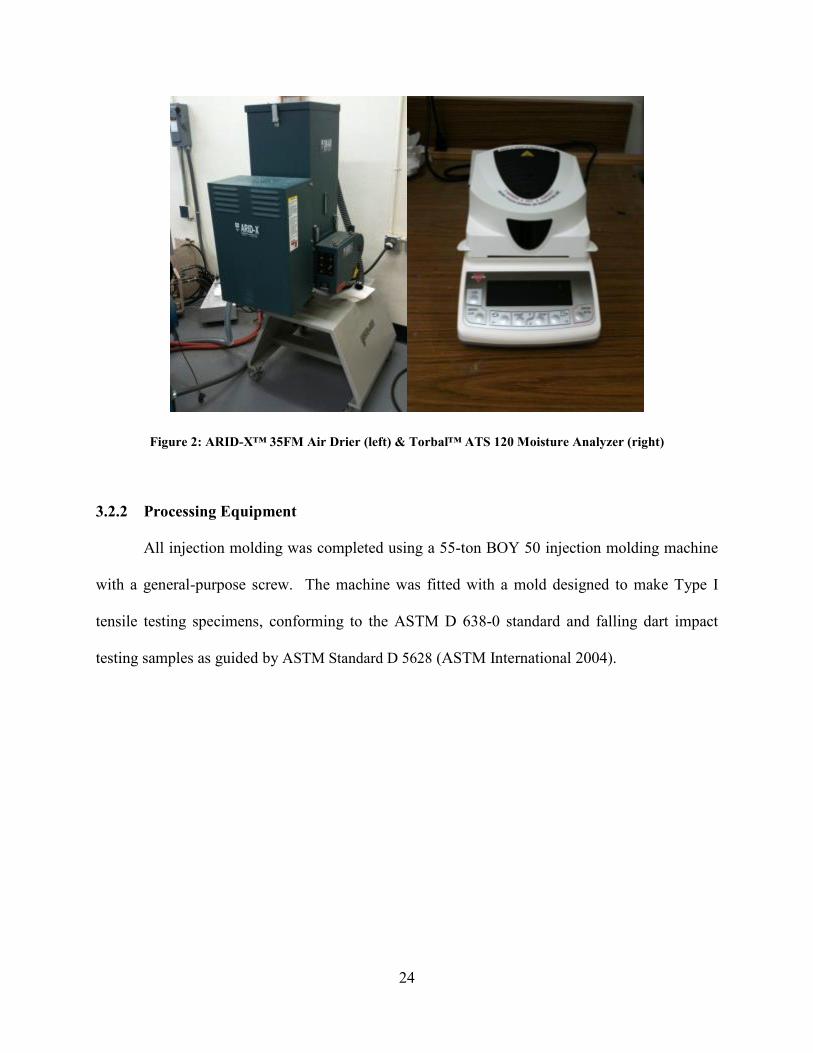
3.2.3 Testing Equipment
There were three pieces of equipment used for evaluating samples. The first piece of
equipment was a Keyence VHX 500 digital microscope, used for evaluating cross-sectional
samples of cooled extrudate ejected from the nozzle of the injection mold machine.
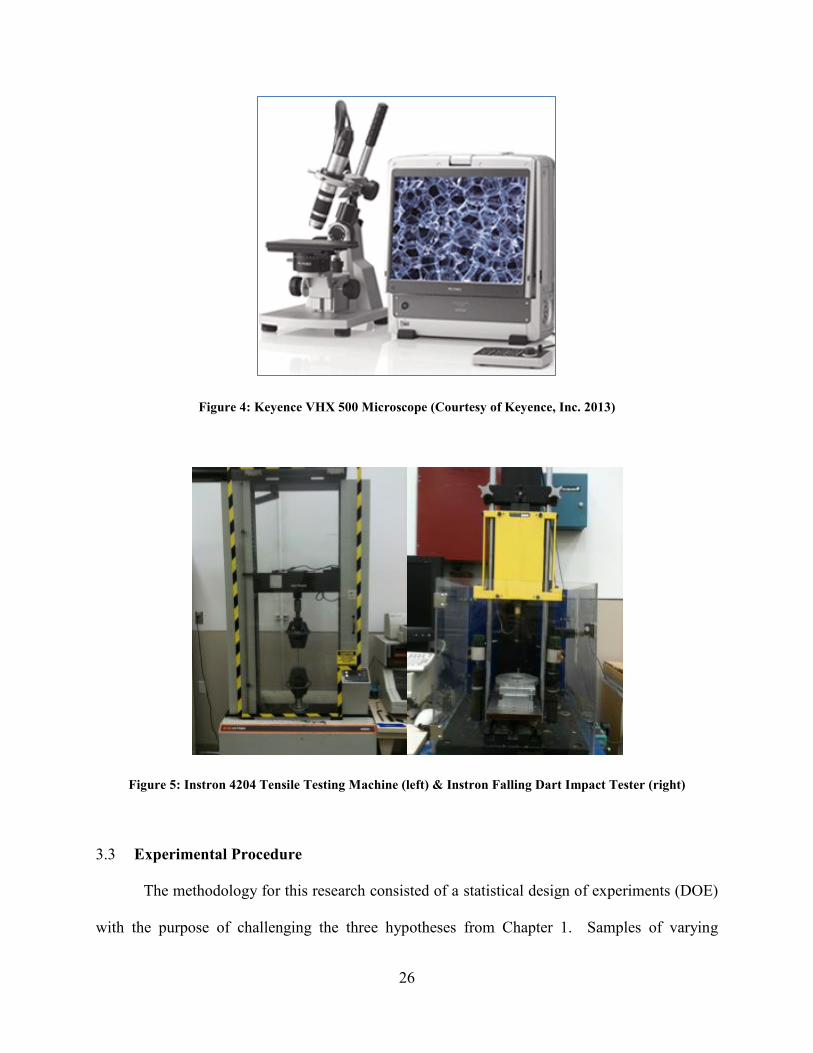
Secondly, the Type-I tensile testing specimens were analyzed using a computer-
controlled Instron 4204 machine, conforming to ASTM D 638-0 (ASTM International 2004).
The third piece of testing equipment used was an Instron falling dart impact tester, used
for gathering data for impact performance of samples, as guided by ASTM Standard D 5628
(ASTM International 2004).
26
Figure 4: Keyence VHX 500 Microscope (Courtesy of Keyence, Inc. 2013)
Figure 5: Instron 4204 Tensile Testing Machine (left) & Instron Falling Dart Impact Tester (right)
3.3 Experimental Procedure
The methodology for this research consisted of a statistical design of experiments (DOE)
with the purpose of challenging the three hypotheses from Chapter 1. Samples of varying
27
moisture and polyolefin blends were analyzed to identify the relationships between moisture
content of the TPS and the nature of void formation and mechanical performance.
3.3.1 Design of Experiment
The DOE for this research involved two customized 52 Factorial experiments—one for
each polyolefin blend—based on a Taguchi L25 Orthogonal array. The decision was made to
perform separate experiments for each polyolefin (HDPE and PP) due to the increase in
variability of time and processing temperatures when changing over the machine from HDPE to
PP or vice versa. In each experiment, the two independent variables were:
• moisture content of TPS (weight percent)
• percentage blend of polyolefin (weight percent)
Samples were created by varying the levels of each independent variable. These samples
were measured for four different dependent variables to test for effect. The dependent variables
and corresponding tests are outlined in the figure below:
Table 1: Variables Measured and Corresponding Tests
In each case, all other process constraints (i.e. shot size, barrel temperature, feed rate,
etc.) were held constant across all samples, based on the processing conditions recommended for
the blended polyolefin, as referenced from “IDES Pocket Specs for Injection Molding.” A third
Dependent Variable Test ASTM StandardYoung's Modulus Tensile Test ASTM D 638Tensile Strength Tensile Test ASTM D 638Impact Energy Falling Dart Impact ASTM Standard D 5628Cross-sectional Void Area Microscope N/A
28
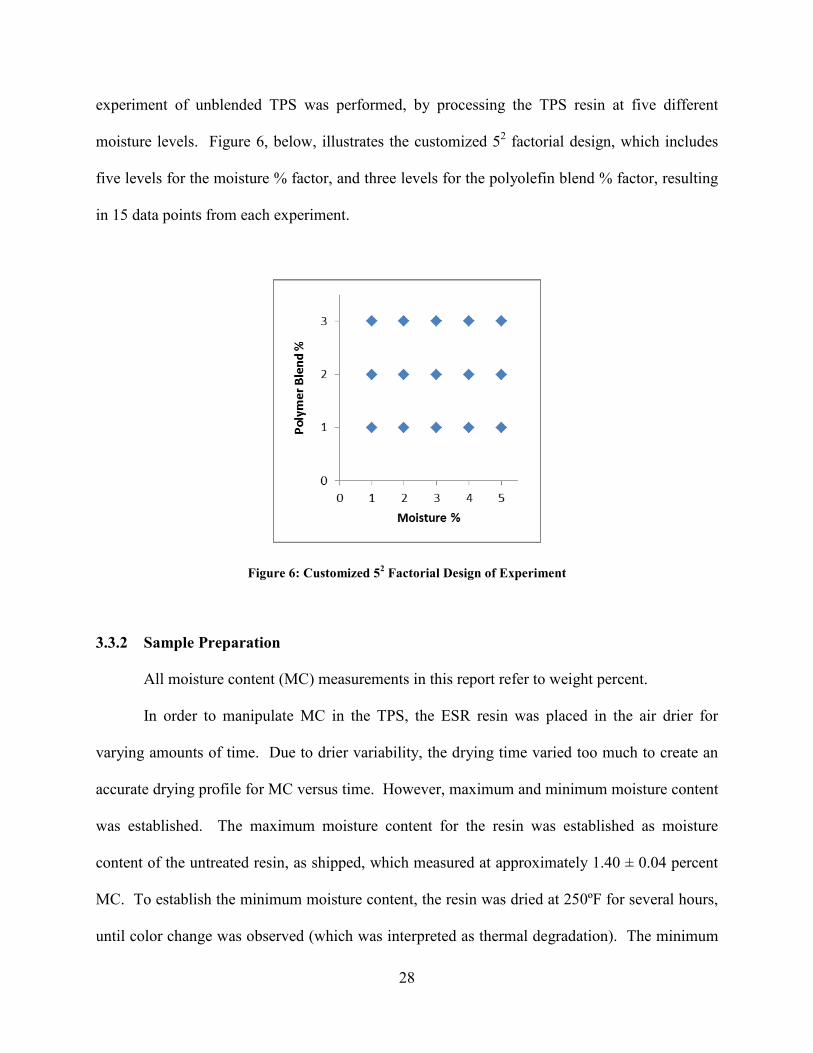
experiment of unblended TPS was performed, by processing the TPS resin at five different
moisture levels. Figure 6, below, illustrates the customized 52 factorial design, which includes
five levels for the moisture % factor, and three levels for the polyolefin blend % factor, resulting
in 15 data points from each experiment.
Figure 6: Customized 52 Factorial Design of Experiment
3.3.2 Sample Preparation
All moisture content (MC) measurements in this report refer to weight percent.
In order to manipulate MC in the TPS, the ESR resin was placed in the air drier for
varying amounts of time. Due to drier variability, the drying time varied too much to create an
accurate drying profile for MC versus time. However, maximum and minimum moisture content
was established. The maximum moisture content for the resin was established as moisture
content of the untreated resin, as shipped, which measured at approximately 1.40 ± 0.04 percent
MC. To establish the minimum moisture content, the resin was dried at 250ºF for several hours,
until color change was observed (which was interpreted as thermal degradation). The minimum
29
moisture content was around 0.59 ± 0.16 percent MC. The maximum MC and minimum MC
were used as two levels in the experiment. The other three MC levels were simply obtained by
targeting varying levels of moisture between the maximum and the minimum.
The MC for each sample was analyzed with a Torbal™ ATS 120 Moisture Analyzer.
This machine was set to measure the moisture of a 3-gram sample by heating it to 121ºF for 15
minutes. Since drying is a function of batch size, the 15-minute setting was determined to be an
optimal drying time for the moisture analyzer when using a 3-gram sample. By using an
integrated scale, this machine was capable of interpreting the change in mass attributed to
evaporation as the percentage of moisture originally in the sample through the following
equation:
(𝑚0 −𝑚)/𝑚0 (3.1)
After obtaining a targeted moisture level of a given batch of TPS, a scale was used to
create three different 1-pound batches of TPS/polyolefin blends. The three levels of polymer
blend (by weight percent) were 70%, 50%, and 30%.
The BOY 50M Injection Molding machine was used to create the samples for tensile
testing, falling dart impact testing, and void analysis testing. Processing conditions were held
constant at the parameters displayed in Table 2 below, based on the properties recommended for
processing the polyolefin used in the blend. The rear temperature was always held at or below
275ºF to prevent thermal degradation of the TPS while in the hopper.
Each 1-pound batch was sufficient material to clean the injection molding machine’s
barrel of old material and then create 2 warm-up samples before processing the 10 samples used
30
for testing. After processing the 10 samples, one additional shot of resin was produced with the
nozzle backed away from the sprue bushing. The resulting extrudate was then allowed to cool
before being cross-sectioned to analyze for void formation. All samples were hermetically
sealed after processing in order to prevent moisture absorption before testing.
Table 2: Injection Molding Conditions
3.3.3 Sample Testing
Three different tests were performed to examine the effects of the MC on the unblended
TPS and on the TPS/polyolefin blends. The only non-mechanical test involved the use of a
microscope to examine voids created by steam in the extrudate of each sample. Samples were
obtained by cooling and then cross-sectioning extrudate for each batch. Cross section samples
were then examined for voids as a percentage of the total cross sectional area through use of a
Keyence VHX 500 digital microscope. To remain consistent, only voids visible at 50X
magnification were measured. Each batch was sampled twice in different locations. The
resulting value is the average of the two samples. Due to the near transparent nature of ESR, a
red dye was used to enhance visibility of voids in cross section samples due to the fact that the
surface would stain while voids remained unchanged.
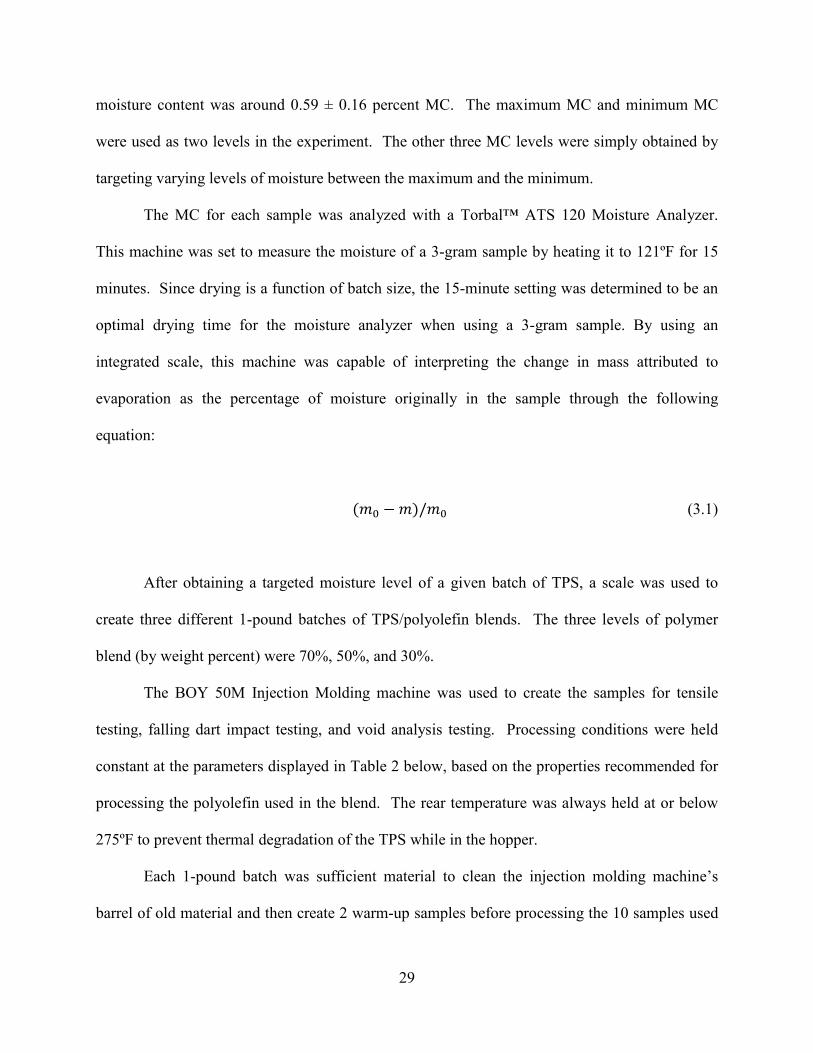
In addition to examining the cross sections of extrudate, the second hypothesis was tested
using a similar methodology with cross sections of injection-molded parts. Parts taken from
PolymerNozzle Front Mid Rear Front Rear
HDPE 400 380 360 275 60 100PP 420 410 392 275 30 30ESR (non-blend) 360 340 300 250 60 100
Temperatures (ºF) Injection Pressure (psi)
31
each batch were randomly sampled from the tensile testing specimen population. To remain
consistent, when examining finished parts, only voids visible at 50X magnification were
measured.
Figure 7: Example of Extrudate Cross Section with Voids (Dyed Red for Visibility)
Tensile testing was performed using a computer-controlled Instron 4204 machine.
Samples were tested in accordance with the ASTM D 638-03 standards, using Type-I specimens.
The machine was set to a nominal strain rate of 0.1 mm/mm · min, and to a 5 mm/min extension
speed. Key measurements were Young’s modulus and Tensile strength. Due to material
constraints, only five specimens were tested for each blend/MC combination.
The second and final mechanical test was an impact test, using an Instron falling dart
impact tester, as described by ASTM D5628 (ASTM International 2004). The test procedure
involved dropping a weighted dart from a specified height onto the center of a thin plastic plate
as it rested on a metal fixture. The machine is designed to drop the dart onto the plastic
32
specimen with a hole positioned directly under the strike zone, in order to gather data regarding
impact resistance. Parameters for this test include the use of a rounded tup, 0.52 inches in
diameter, starting from a drop height consistent with a 2000 ft-lb drop energy potential. The data
from this study was gathered as a comparison from one sample to another only—data is not
intended to be referenced as an absolute measurement. Each tested batch consisted of a sample
size of five.
3.4 Data Analysis
The effects of moisture content were studied by means of statistical analysis, with results
reported from the two separate DOEs in addition to the results for the unblended TPS. A
standard statistical software add-on for Microsoft Office Excel was used to perform multiple
regression analysis for each of the dependent variables. All calculations were based on a 95%
confidence level.
33
4 RESULTS
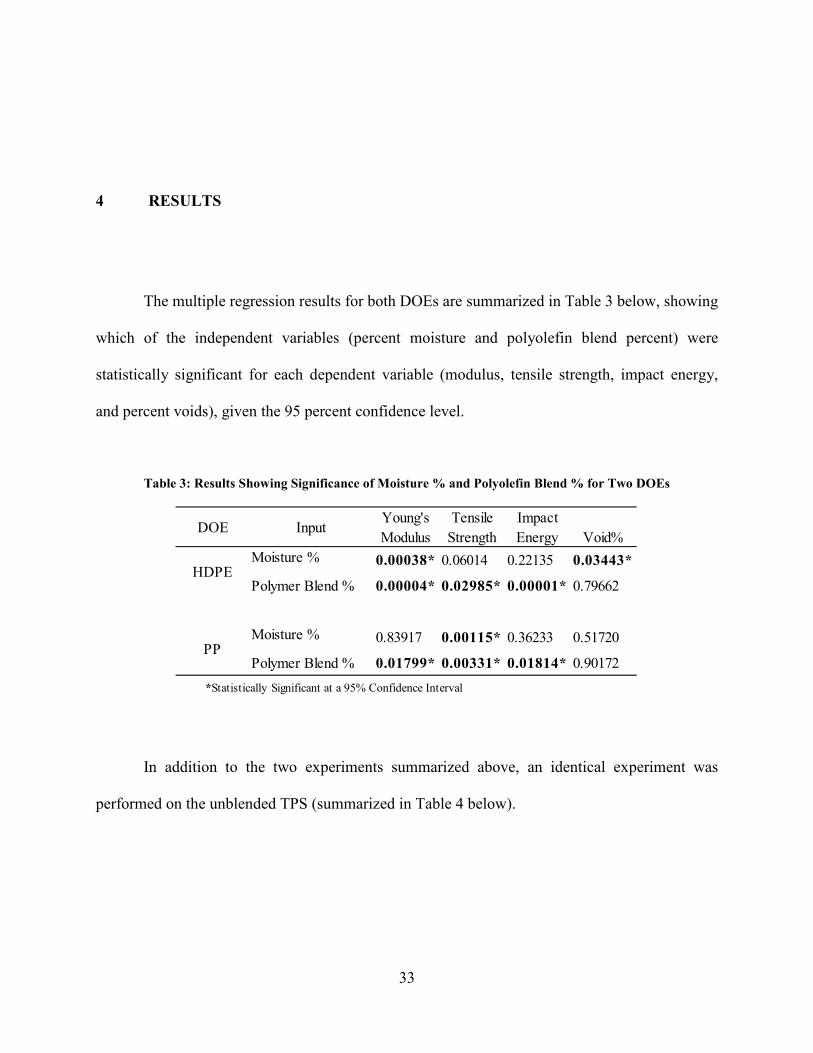
The multiple regression results for both DOEs are summarized in Table 3 below, showing
which of the independent variables (percent moisture and polyolefin blend percent) were
statistically significant for each dependent variable (modulus, tensile strength, impact energy,
and percent voids), given the 95 percent confidence level.
Table 3: Results Showing Significance of Moisture % and Polyolefin Blend % for Two DOEs
In addition to the two experiments summarized above, an identical experiment was
performed on the unblended TPS (summarized in Table 4 below).
DOE InputYoung's Modulus
Tensile Strength
Impact Energy Void%
Moisture % 0.00038* 0.06014 0.22135 0.03443*
Polymer Blend % 0.00004* 0.02985* 0.00001* 0.79662
Moisture % 0.83917 0.00115* 0.36233 0.51720
Polymer Blend % 0.01799* 0.00331* 0.01814* 0.90172
HDPE
PP
*Statistically Significant at a 95% Confidence Interval
34
Table 4: Results Showing Significance of Moisture % for Unblended TPS
4.1 Void Formation
As discussed above, the process for analyzing the effect of TPS moisture on void
formation involved the use of multiple regression analysis, where the two independent variables
were percent moisture and polyolefin blend percent and the dependent variable was percent
voids.
4.1.1 HDPE Blends and Void Formation
As stated in the first and second hypotheses, one of the major purposes of this study was
to examine the effect of moisture on void formation in both melt from the nozzle as well as in
finished injection-molded parts.
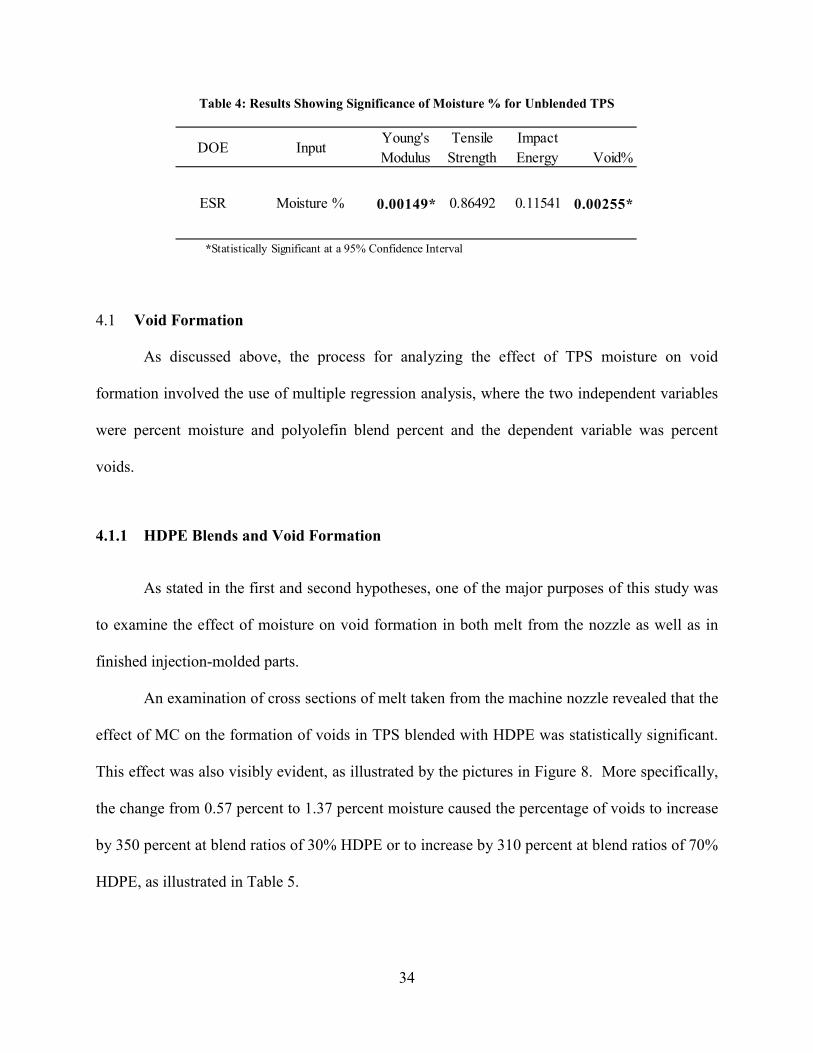
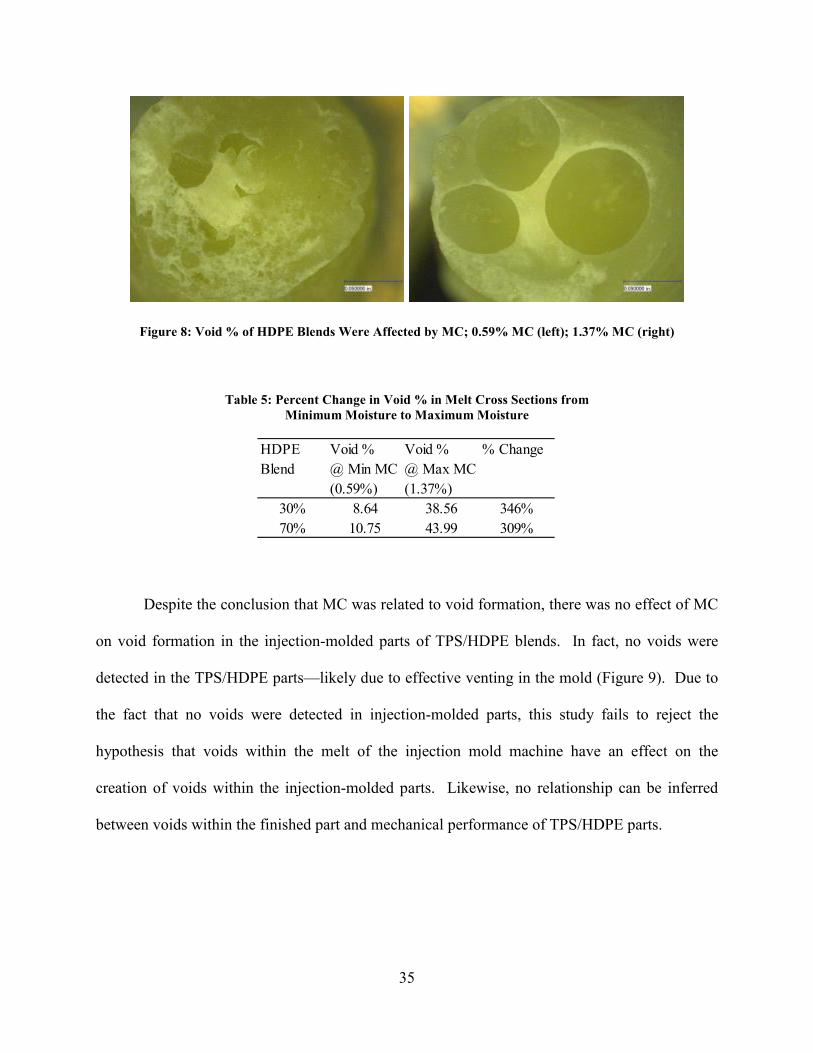
An examination of cross sections of melt taken from the machine nozzle revealed that the
effect of MC on the formation of voids in TPS blended with HDPE was statistically significant.
This effect was also visibly evident, as illustrated by the pictures in Figure 8. More specifically,
the change from 0.57 percent to 1.37 percent moisture caused the percentage of voids to increase
by 350 percent at blend ratios of 30% HDPE or to increase by 310 percent at blend ratios of 70%
HDPE, as illustrated in Table 5.
DOE InputYoung's Modulus
Tensile Strength
Impact Energy Void%
ESR Moisture % 0.00149* 0.86492 0.11541 0.00255*
*Statistically Significant at a 95% Confidence Interval
35
Figure 8: Void % of HDPE Blends Were Affected by MC; 0.59% MC (left); 1.37% MC (right)
Table 5: Percent Change in Void % in Melt Cross Sections from Minimum Moisture to Maximum Moisture
Despite the conclusion that MC was related to void formation, there was no effect of MC
on void formation in the injection-molded parts of TPS/HDPE blends. In fact, no voids were
detected in the TPS/HDPE parts—likely due to effective venting in the mold (Figure 9). Due to
the fact that no voids were detected in injection-molded parts, this study fails to reject the
hypothesis that voids within the melt of the injection mold machine have an effect on the
creation of voids within the injection-molded parts. Likewise, no relationship can be inferred
between voids within the finished part and mechanical performance of TPS/HDPE parts.
HDPE Blend
Void % @ Min MC (0.59%)
Void % @ Max MC (1.37%)
% Change
30% 8.64 38.56 346%70% 10.75 43.99 309%
36
Figure 9: Cross Section of Injection-molded TPS/HDPE Part with Zero Voids
4.1.2 PP Blends and Void Formation
The effect of MC on the formation of voids in TPS blended with PP was not statistically
significant. At 50x magnification (or at any greater magnification), it was difficult to perceive
any physical difference in size or number of voids as affected by different blend and moisture
levels.
One interesting observation was made regarding the presence of large TPS granules
visible in the PP blends (visible as amber-colored spots in the figure above). This lack of
homogenous compounding of the TPS and PP occurred at all blend and MC levels. A multiple
regression was taken based on percentage area of TPS granules in melt cross sections (using the
same methodology as the percent void measurement), however neither moisture nor blend
percent significantly affected the percent TPS area in cross sections.
37
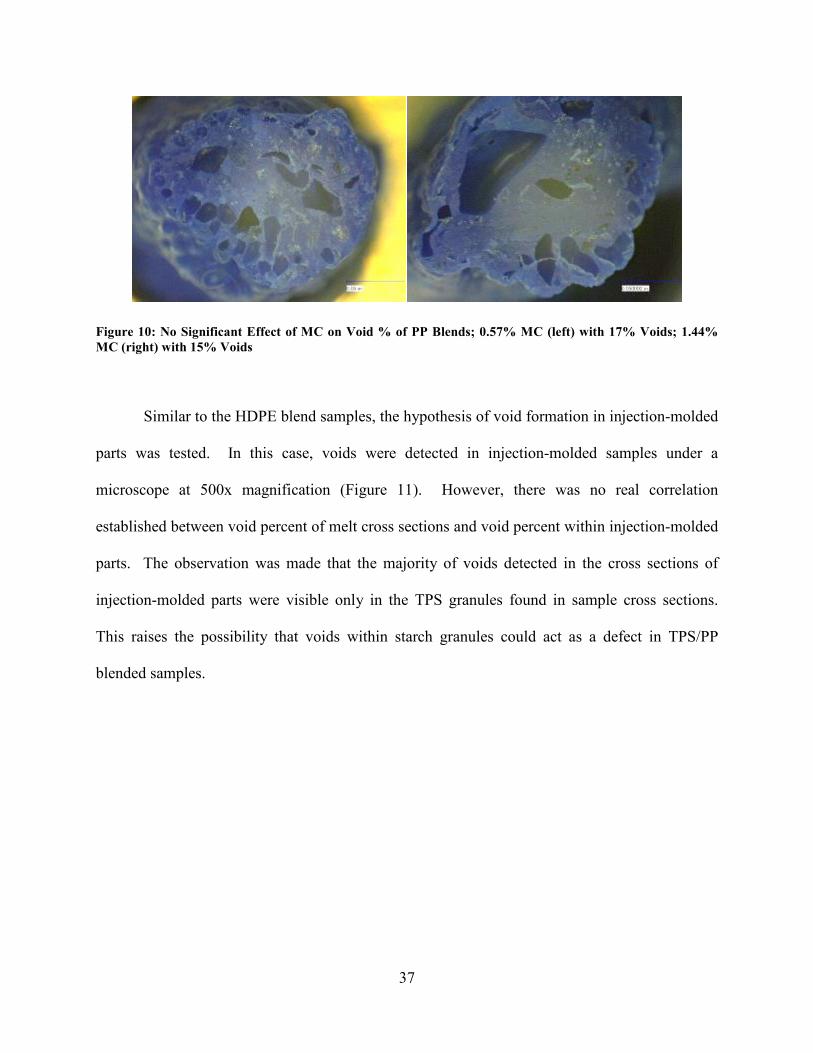
Figure 10: No Significant Effect of MC on Void % of PP Blends; 0.57% MC (left) with 17% Voids; 1.44% MC (right) with 15% Voids
Similar to the HDPE blend samples, the hypothesis of void formation in injection-molded
parts was tested. In this case, voids were detected in injection-molded samples under a
microscope at 500x magnification (Figure 11). However, there was no real correlation
established between void percent of melt cross sections and void percent within injection-molded
parts. The observation was made that the majority of voids detected in the cross sections of
injection-molded parts were visible only in the TPS granules found in sample cross sections.
This raises the possibility that voids within starch granules could act as a defect in TPS/PP
blended samples.
38
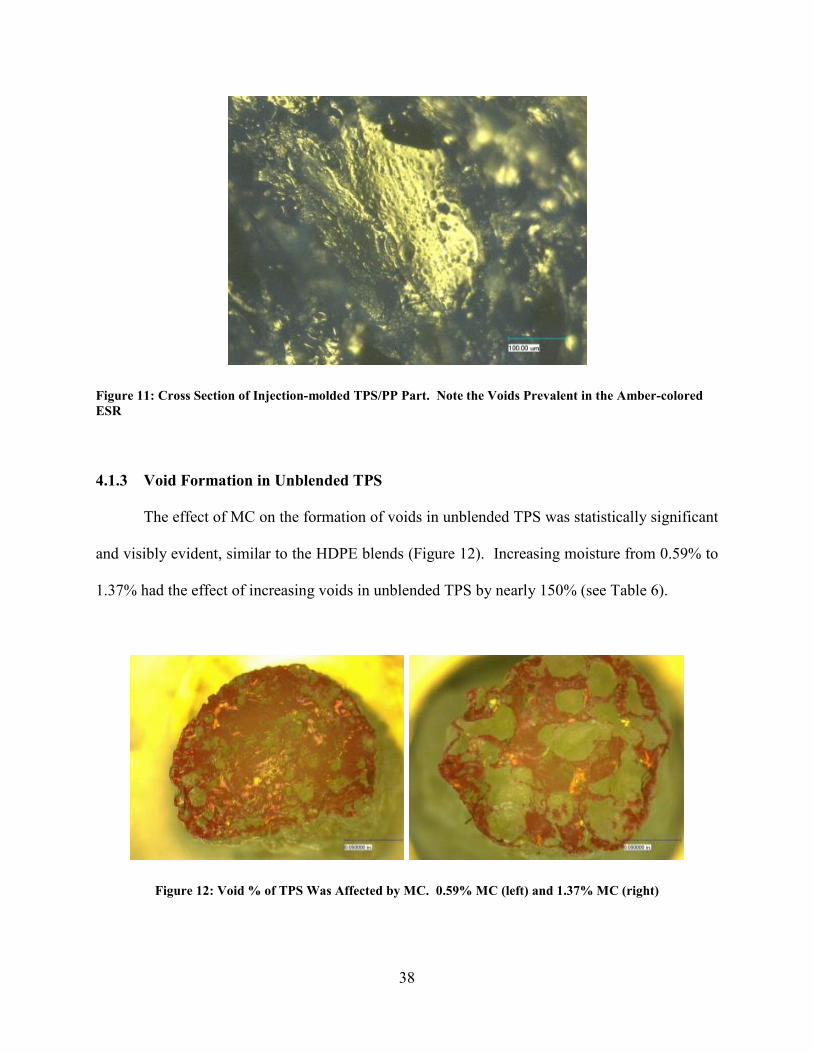
Figure 11: Cross Section of Injection-molded TPS/PP Part. Note the Voids Prevalent in the Amber-colored ESR
4.1.3 Void Formation in Unblended TPS
The effect of MC on the formation of voids in unblended TPS was statistically significant
and visibly evident, similar to the HDPE blends (Figure 12). Increasing moisture from 0.59% to
1.37% had the effect of increasing voids in unblended TPS by nearly 150% (see Table 6).
Figure 12: Void % of TPS Was Affected by MC. 0.59% MC (left) and 1.37% MC (right)
39
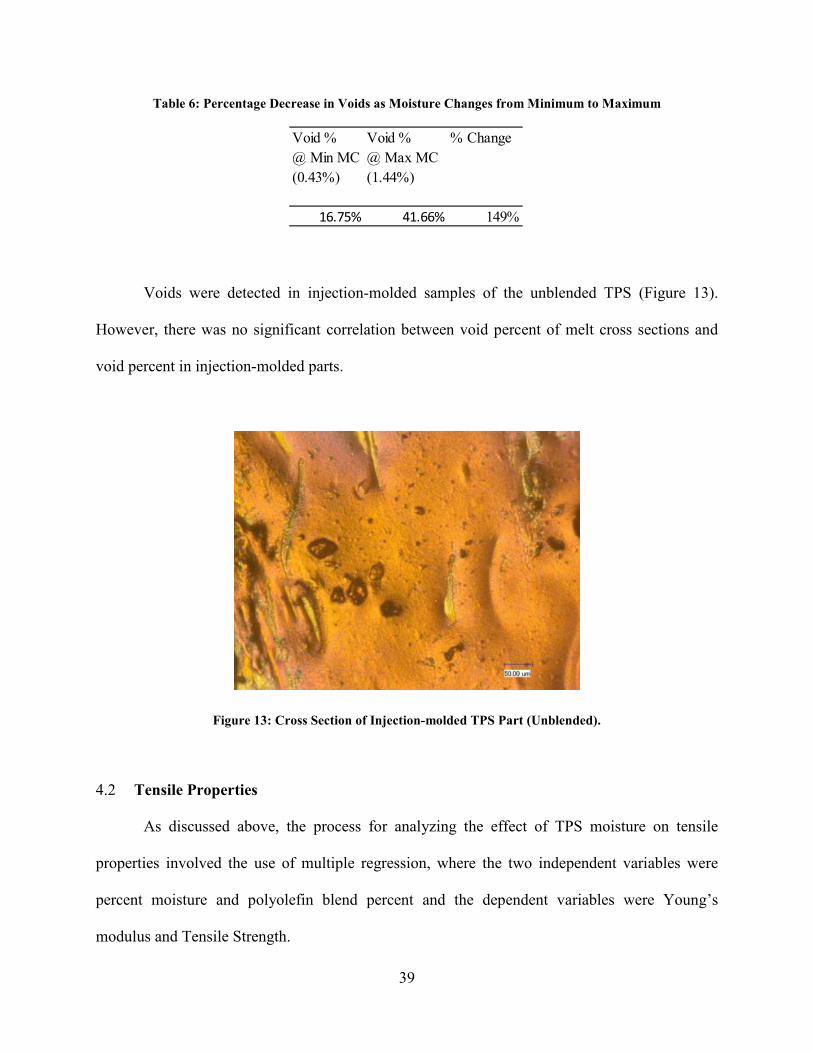
Table 6: Percentage Decrease in Voids as Moisture Changes from Minimum to Maximum
Voids were detected in injection-molded samples of the unblended TPS (Figure 13).
However, there was no significant correlation between void percent of melt cross sections and
void percent in injection-molded parts.
Figure 13: Cross Section of Injection-molded TPS Part (Unblended).
4.2 Tensile Properties
As discussed above, the process for analyzing the effect of TPS moisture on tensile
properties involved the use of multiple regression, where the two independent variables were
percent moisture and polyolefin blend percent and the dependent variables were Young’s
modulus and Tensile Strength.
Void % @ Min MC (0.43%)
Void % @ Max MC (1.44%)
% Change
16.75% 41.66% 149%
40
The apparent effect of polyolefin blend percent on tensile properties was expected.
Referring to Figure 14 and Figure 15 below, as the TPS/polyolefin ratio decreases, the blended
sample begins to act more like the polyolefin and less like the TPS.
4.2.1 HDPE Blends and Tensile Properties
Both moisture percent and polyolefin blend percent had a significant effect on the tensile
properties for TPS/HDPE blends. Specifically, a rise in MC from 0.59 percent to 1.37 percent
caused the Young’s modulus to decrease by 14 percent at blend ratios of 30% HDPE or decrease
by 9 percent at blend ratios of 70% HDPE, as illustrated in Table 7. As the MC of the sample
increased, the modulus generally decreased, indicating a softening effect. Samples with the least
amount of moisture generally had greater stiffness. This confirms the general behavior of starch,
where water acts as a plasticizer. The samples could be likened to a spaghetti noodle—when
moisture is added, the noodle loses its stiffness (lower modulus).
Table 7: Percent Change in Modulus in TPS/HDPE Blends from Minimum Moisture to Maximum Moisture
The MC of the samples did not have a significant effect on tensile strength for the
HDPE/TPS blend, as illustrated in Figure 14. However, the polyolefin blend percent did have a
significant effect on both modulus and on the tensile strength of samples tested.
HDPE Blend
Modulus @ Min MC (0.59%)
Modulus @ Max MC (1.37%)
% Change
30% 176198 150701 14%70% 136865 125055 9%
41
Figure 14: MC Did Not Have a Significant Effect on Tensile Strength
42
4.2.2 PP Blends and Tensile Properties
The MC of the samples did not have a significant effect on the Young’s modulus of
PP/TPS blends. However, MC did significantly affect the tensile strength of samples. An
increase in MC was generally correlated with an increase in tensile strength of the samples
tested. More specifically, by raising MC from 0.57 percent to 1.44 percent, the tensile strength
of samples increased by 34 percent at a blend ratio of 30% PP and increased by 22 percent at a
blend ratio of 70% PP (Table 8).
Table 8: Percent Change in Tensile Strength of TPS/PP Blends from Minimum Moisture to Maximum Moisture
Similar to the HDPE/TPS blends, the polyolefin blend percent had a significant influence
on both the modulus and the tensile strength of samples tested (Figure 15).
PP Blend
Tensile Strength @ Min MC (0.57%)
Tensile Strength @ Min MC (1.44%)
% Change
30% 760 1022 34%70% 1005 1231 22%

43
Figure 15: Increasing the Moisture Generally Increases the Tensile Strength in TPS/PP Blends. Note that Increasing PP Levels Also Had an Effect on Increasing Tensile Strength
44
4.2.3 Unblended TPS and Tensile Properties
Moisture percent had a significant effect on the tensile properties for unblended TPS,
similar to the result for TPS/HDPE blend. Increasing moisture percent had the effect of slightly
lowering the modulus. More specifically, when moisture levels increased from 0.43 percent
moisture to 1.44 percent moisture, the modulus decreased by 25% (Table 9). However, there
was no significant correlation between the TPS moisture and its tensile strength (Figure 16).
Figure 16: Moisture Did Not Affect the Tensile Strength of TPS Samples.
Table 9: Percentage Decrease in Modulus of Unblended TPS as Moisture Increases from Minimum to Maximum
Modulus @ Min MC (0.43%)
Modulus @ Max MC (1.44%)
% Change
198404 149483 25%
45
4.3 Impact Properties
Similar to void formation and tensile testing, the process for analyzing the effect of TPS
moisture on impact properties involved the use of a multiple regression analysis, where the two
independent variables were percent moisture and polyolefin blend percent and the dependent
variable was impact energy.
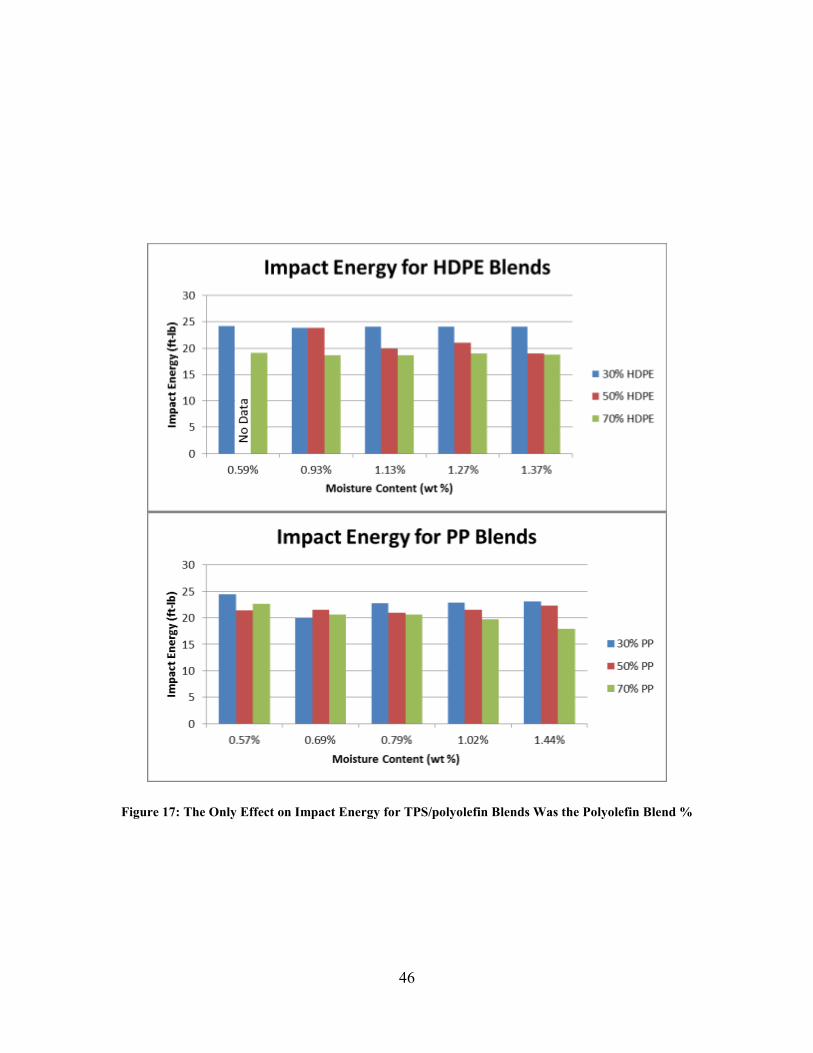
There was no positive correlation detected between MC and impact energy. However,
for both polyolefin blends (HDPE and PP) the blend percent had a significant effect on impact
energy. This relationship is expected, since the test specimens should absorb different amounts
of energy based on their polyolefin composition (Figure 17).
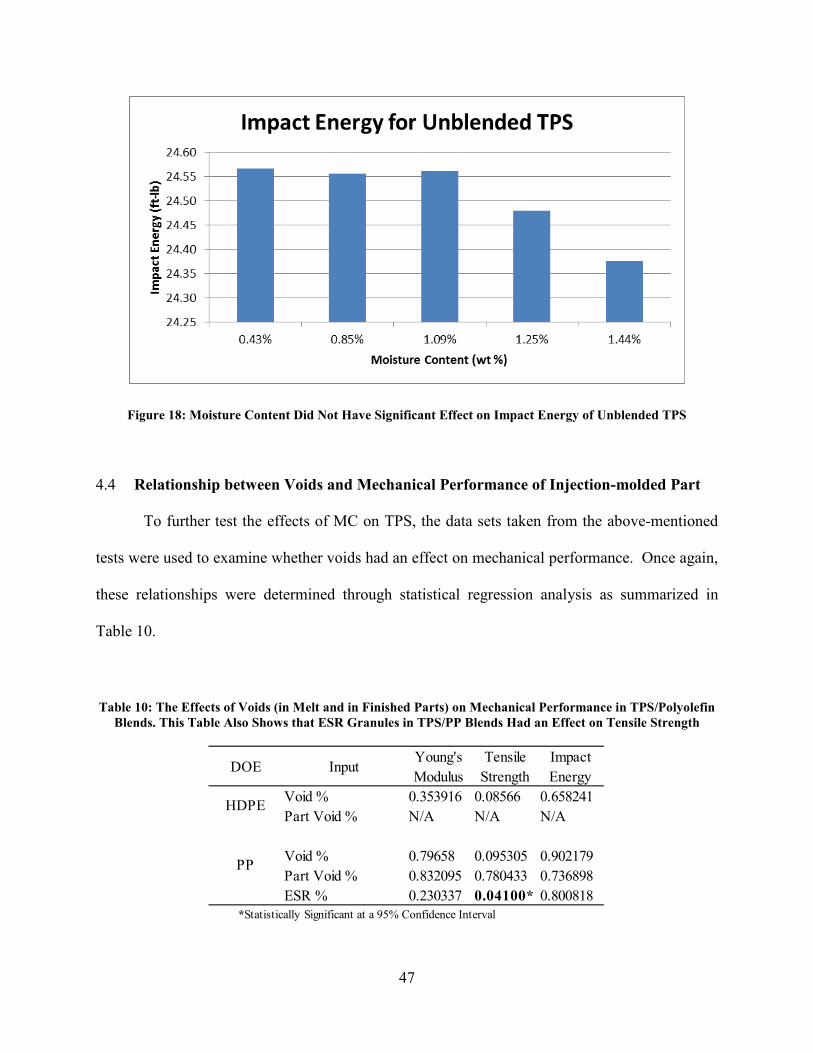
Similar to the blended TPS, the unblended TPS samples showed that MC had no effect on
impact energy, with only a one percent decrease in impact energy as moisture was increased
from 0.43% MC to 1.44% MC (Figure 18).
46
Figure 17: The Only Effect on Impact Energy for TPS/polyolefin Blends Was the Polyolefin Blend %
47
Figure 18: Moisture Content Did Not Have Significant Effect on Impact Energy of Unblended TPS
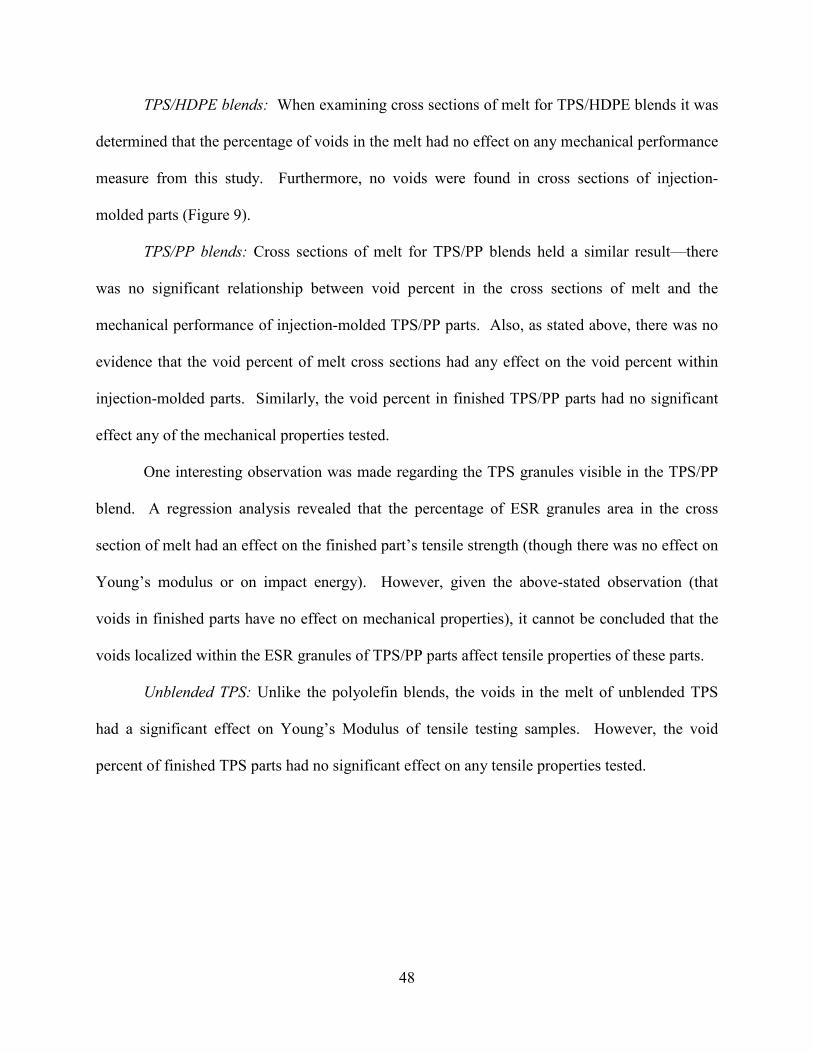
4.4 Relationship between Voids and Mechanical Performance of Injection-molded Part
To further test the effects of MC on TPS, the data sets taken from the above-mentioned
tests were used to examine whether voids had an effect on mechanical performance. Once again,
these relationships were determined through statistical regression analysis as summarized in
Table 10.
Table 10: The Effects of Voids (in Melt and in Finished Parts) on Mechanical Performance in TPS/Polyolefin Blends. This Table Also Shows that ESR Granules in TPS/PP Blends Had an Effect on Tensile Strength
DOE InputYoung's Modulus
Tensile Strength
Impact Energy
Void % 0.353916 0.08566 0.658241Part Void % N/A N/A N/A
Void % 0.79658 0.095305 0.902179Part Void % 0.832095 0.780433 0.736898ESR % 0.230337 0.04100* 0.800818
HDPE
PP
*Statistically Significant at a 95% Confidence Interval
48
TPS/HDPE blends: When examining cross sections of melt for TPS/HDPE blends it was
determined that the percentage of voids in the melt had no effect on any mechanical performance
measure from this study. Furthermore, no voids were found in cross sections of injection-
molded parts (Figure 9).
TPS/PP blends: Cross sections of melt for TPS/PP blends held a similar result—there
was no significant relationship between void percent in the cross sections of melt and the
mechanical performance of injection-molded TPS/PP parts. Also, as stated above, there was no
evidence that the void percent of melt cross sections had any effect on the void percent within
injection-molded parts. Similarly, the void percent in finished TPS/PP parts had no significant
effect any of the mechanical properties tested.
One interesting observation was made regarding the TPS granules visible in the TPS/PP
blend. A regression analysis revealed that the percentage of ESR granules area in the cross
section of melt had an effect on the finished part’s tensile strength (though there was no effect on
Young’s modulus or on impact energy). However, given the above-stated observation (that
voids in finished parts have no effect on mechanical properties), it cannot be concluded that the
voids localized within the ESR granules of TPS/PP parts affect tensile properties of these parts.
Unblended TPS: Unlike the polyolefin blends, the voids in the melt of unblended TPS
had a significant effect on Young’s Modulus of tensile testing samples. However, the void
percent of finished TPS parts had no significant effect on any tensile properties tested.

49
Table 11: The Effects of Voids (in Melt and in Finished Parts) on Mechanical Performance in Unblended TPS
DOE InputYoung's Modulus
Tensile Strength
Impact Energy
Void % 0.00682* 0.75759 0.208947Part Void % 0.525446 0.86969 0.938023
*Statistically Significant at a 95% Confidence Interval
ESR
50
5 CONCLUSIONS AND RECOMMENDATIONS
5.1 Summary
Through a series of experiments, this study identified the relationship between TPS
moisture content and void creation in the melt of injection molded parts—both as a stand-alone
resin as well as a blend with HDPE and with PP. TPS moisture appeared to have a significant
effect on void percent in the cross section of melt for TPS/HDPE blends and for TPS alone (with
no significant effect on void percent in PP). Additionally, the possible relationship between
percent voids in the melt and percent voids in the injection-molded part was explored. Though
voids were detected in the final parts of TPS/PP blends and unblended TPS, there was no
statistical correlation found between the measurements for voids in the final part and the
measured mechanical performance.
The designed experiments also explored the relationship between TPS moisture content
and mechanical performance as measured by tensile and impact testing. A negative correlation
was found between MC and Young’s modulus values for both the TPS/HDPE blend and the
unblended TPS. Also, the TPS/PP blend showed a positive correlation between MC and tensile
strength. The polyolefin blend percent significantly affected all mechanical test results.
51
5.2 Conclusions
In order to determine the effect of moisture on void formation in in TPS, the following
hypotheses were tested:
Hypothesis 1: The level of moisture content of the TPS resin has an effect on the size and
number of voids in the melt of an injection-molded part. This hypothesis was not rejected for
TPS/HDPE blends or for unblended TPS. The hypothesis was rejected for TPS/PP blends.
Hypothesis 2: Voids within the injection-molded part are directly related to the amount
of voids in the melt. This hypothesis was rejected for TPS/PP blends as well as for unblended
TPS. It was not rejected for TPS/HDPE blends due to fact that zero voids were detected in
finished parts of this blend.
Hypothesis 3: The level of moisture content of the TPS resin has an effect on the tensile
and impact performance of injection-molded samples. This hypothesis was not rejected for
tensile testing, since the TPS/HDPE blend and the unblended TPS both had modulus values that
were significantly affected by the TPS moisture. Also, PP/HDPE blends showed a positive
correlation between MC and tensile strength. This hypothesis was rejected for impact testing,
however, since moisture had no significant effect on impact performance of TPS (both blended
and unblended).
5.3 Discussion
5.3.1 Relationship between MC, Voids, and Performance
As stated in the previous chapter, there was no statistical correlation established between
void percent in injection-molded parts and the mechanical performance values measured in this
study. Similarly, there was no significant correlation between percent voids in the extrudate
52
cross sections and mechanical performance of injection-molded parts when blended with HDPE
or with PP. It is concluded, therefore, that the relationships identified between MC and voids
and between MC and mechanical performance cannot be directly connected. In other words, had
this study hypothesized that voids within the melt of the injection mold machine that were
caused by MC, would affect mechanical performance, then this study would fail to reject the
hypothesis for TPS/polyolefin blends.
In the case of unblended TPS, this study first established a positive correlation between
MC and percent voids found in the cross section of extrudate. It was later established that the
percent voids in extrudate had an effect on the modulus of TPS samples. It is concluded,
therefore, that had this study hypothesized that voids within the melt of the injection mold
machine that were caused by MC, would affect mechanical performance, then this study would
fail to reject the hypothesis for TPS/polyolefin blends.
5.3.2 Problems in Blending PP and TPS
As previously observed, the PP and TPS did not fully compound during injection
molding processing. The cause of this phenomenon is unknown. However, there was
speculation that this incomplete blending may have been a result of thermal degradation of the
starch due to the relatively high processing temperatures necessary for processing PP compared
to the processing temperatures used for the ESR resin. Another possible explanation might relate
to the small size and screw configuration of the BOY 55 injection molding machine involved—
especially given its relatively short screw and only three heating zones. Potential questions for
further study could address the possibility of there being incompatibility between PP and ESR
pellets.

53
5.3.3 Differences in Findings
As discussed above, one unexpected result was the fact that for TPS/HDPE blends, MC
had a significant effect on modulus but not tensile strength, while TPS/PP blends did not have a
significant effect on modulus, but did have a significant effect on modulus. One possible
explanation for this could relate to the earlier observation regarding incomplete compounding of
TPS/PP blends. The lack of significant effect of MC in TPS/PP blends could be attributed to the
fact that moisture from the TPS did not leave the TPS, as evidenced by the voids found in ESR
granules within the TPS/PP blends. Similarly, the fact that MC did have an effect on the tensile
strength of TPS/PP blends (contrary to the TPS/HDPE blends) could relate to the incomplete
compounding of TPS/PP blends. The large, hard, granules of ESR within TPS/PP samples may
have acted as defects while tensile testing.
5.4 Recommendations
These experiments showed that there is a relationship between TPS moisture and its
physical properties in injection-molded applications. In hindsight, however, there were certain
limitations to the research which, if addressed, could be beneficial to future research in this area.
The first problem related to the mold used to create samples. The alignment of the
mold’s sprue and the sprue bushing was slightly off-center due to years of wear. This defect
created significant delays in cycle times due to the frequent necessity of manual removal of
injection-molded parts. The cycle time variation could have introduced deviations in moisture
content, thermal degradation, and cooling that could affect results. Therefore, the first
recommendation is to use a different (or repaired) mold that would enable speedy processing
with little variation.
54
The second problem related to the incomplete compounding of the TPS with the PP. The
samples used in this study should be replaced by samples that are homogeneously compounded.
Therefore, the second recommendation is to use a twin-screw injection mold machine with
longer or more heating zones to ensure complete compounding. A homogenous mixture of
TPS/PP will enable a more-accurate study of the effects of voids within injection-molded parts
on their mechanical performance.
A third problem relates to the narrow scope of this study. This research was limited to
two polyolefin blends due in part to material availability at the time of the study. However,
HDPE is a wise choice for a TPS blend due to its potential application in creating compostable
bags or containers. PP can be used in similar applications. However, the third recommendation
is to expand this study to other common thermoplastics such as polycarbonate, polystyrene, or
polyvinylchloride.
55
REFERENCES
ASTM International. Annual Book of ASTM Standards. 2004. Vol. 08.03. West Conshohocken, PA: ASTM International, 2004.
ASTM International. Annual Book of ASTM Standards. 2004. Vol. 08.01. West Conshohocken,
PA: ASTM International, 2004. Carvalho, A. J. F. "Starch: Major Sources, Properties and Applications as Thermoplastic
Materials." Chap. 15 in Monomers, Polymers and Composites from Renewable Resources, edited by M. N. Belgacem, & A. Gandini, 321-342. Oxford: Elsevier, 2008.
EPA. Plastics. November 19, 2012. http://epa.gov/osw/conserve/materials/plastics.htm#facts
(accessed December 20, 2012). Gerngross, T. "How Green Are Green Plastics." Scientific American, 2000: 36-41. Griffin, G. J. L. "Biodegradable Fillers in Thermoplastics." ACS Organic Coatings and Plastics
Chemistry Division Preprints, 1973: 88-96. Griffin, G. J. L. "Gelatinized starch based products." Chap. 7 in Chemistry and Technology of
Biodegradable Polymers, by G. J. L. Griffin, 135-150. London: Blackie Academic & Professional, 1994.
Griffin, G. J. L. "Particulate Starch Based Products." Chap. 3 in Chamistry and Technology of
Biodegradable Polymers, by G. J. L. Griffin, 18-47. London: Blackie Academic & Professional, 1994.
IDES, Inc. Pocket Specs for Injection Molding. 6th. Laramie, 2004. Lacourse, N. L., and P. A. Altieri. United States of America Patent 5,035,930. 1991. Liu, H., F. Xie, L. Yu, L. Chen, and L. Li. "Thermal Processing of Starch-based Polymers."
Progress in Polymer Science 34 (2009): 1348-1368. Liu, X., L. Yu, H. Liu, L. Chen, and L. Li. "In Situ Thermal Decomposition of Starch with
Constant Moisture in a Sealed System." Polymer Degradation and Stability 93, no. 1 (2008): 260-262.
56
Mano, J. F., D. Koniarova, and R. L. Reis. "Thermal Properties of Thermoplastic Starch/ Synthetic Polymer Blends with Potential Biomedical Applicability." Journal of Materials Science: Materials in Medicine, 2003: 127-135.
Mercier, C., and P. Feillet. "Modification of Carbohydrate Components by Extrusion-cooking of
Cereal Products." Cereal Chemistry 52 (1975): 283-297. Moore, G. F., and S. M. Saunders. "Advances in Biodegradable Polymers." Rapra Review
Reports 9, no. 2 (1997). Otey, F.H., and W.M. Doane. "Chemicals from Starch." Chap. 11 in Starch: Chemistry and
Technology, edited by R. L. Whistler, J. N. Bemiller, & E. F. Paschall, 389-416. San Diego: Academic Press, 1984.
Perry, P. A., and A. M. Donald. "The role of plasticization in starch granule assembly."
Biomacromolecules, 2000: 424-432. Ramkumar, D., U. R. Vaidya, M. Bhattacharya, M. Hakkarainen, A. C. Albertsson, and S.
Karlsson. "Properties of injection moulded starch/synthetic polymer blends—I. Effect of processing parameters on physical properties." European Polymer Journal 32, no. 8 (1996): 999-1010.
Rodriguez-Gonzalez, F. J., B. A. Ramsay, and B. D. Favis. "Rheological and thermal properties
of thermoplastic starch with high glycerol content." Carbohydrate Polymers 58, no. 2 (2004): 139-147.
Rudnik, E. Compostable Polymer Materials. Boston: Elsevier, 2008. Senouci, A., and A. C. Smith. "The Extrusion Cooking of Potato Starch Material." Starch -
Stärke 38, no. 3 (1986): 78-82. Strong, A. B. Plastics Materials and Processing. 3rd. Columbus: Prentice Hall, 2006. Whistler, R. W., H. N. BeMiller, and E. F. Paschall. Starch: Chemistry and Technology. 2nd.
San Diego: Academic Press, 1984. Wiedmann, W., and E. Strobel. "Compounding of Thermoplastic Starch with Twin-screw
Extruders." Starch/Stärke 43, no. 4 (1991): 138-145. Willett, J. L., and W. M. Doane. "Effect of moisture content on tensile properties of
starch/poly(hydroxyester ether) composite materials." Polymer 43, no. 16 (2002): 4413-4420.
Wittwer, F., and I. Tomka. United States Patent 4673438. 1987.

57
APPENDICES
58
APPENDIX A: EXPERIMENTAL DESIGNS AND DATA
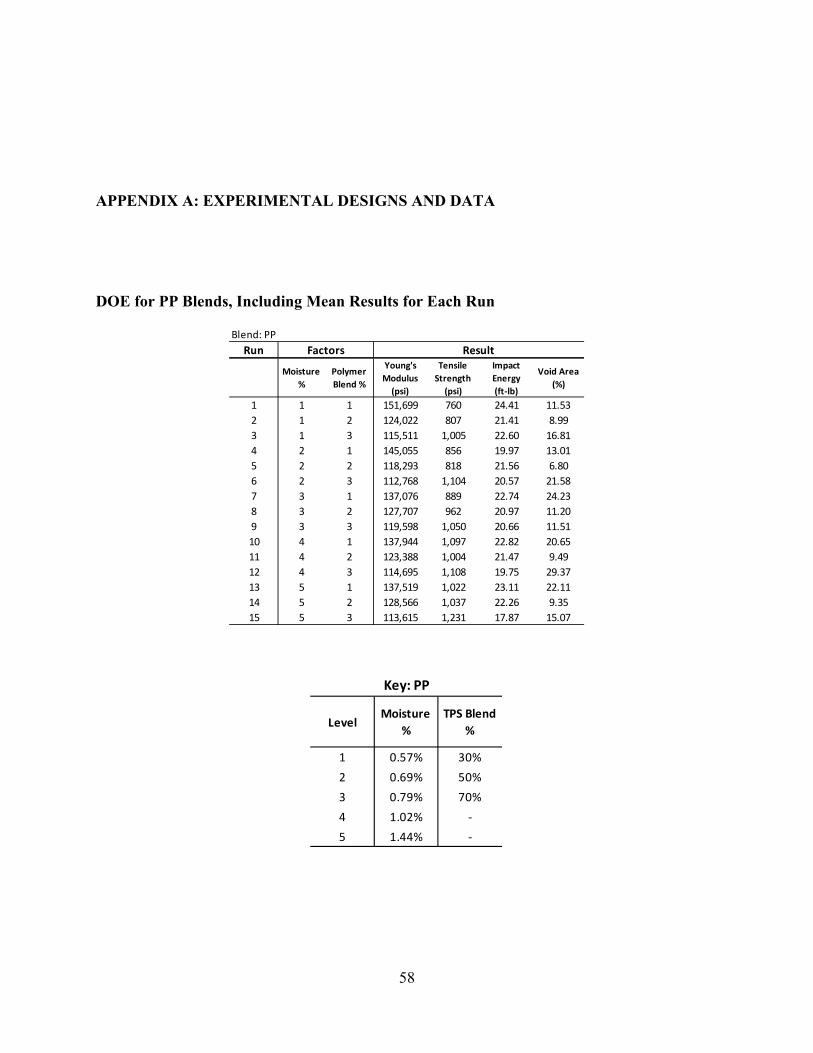
DOE for PP Blends, Including Mean Results for Each Run
Blend: PPRun
Moisture %
Polymer Blend %
Young's Modulus
(psi)
Tensile Strength
(psi)
Impact Energy (ft-lb)
Void Area (%)
1 1 1 151,699 760 24.41 11.532 1 2 124,022 807 21.41 8.993 1 3 115,511 1,005 22.60 16.814 2 1 145,055 856 19.97 13.015 2 2 118,293 818 21.56 6.806 2 3 112,768 1,104 20.57 21.587 3 1 137,076 889 22.74 24.238 3 2 127,707 962 20.97 11.209 3 3 119,598 1,050 20.66 11.5110 4 1 137,944 1,097 22.82 20.6511 4 2 123,388 1,004 21.47 9.4912 4 3 114,695 1,108 19.75 29.3713 5 1 137,519 1,022 23.11 22.1114 5 2 128,566 1,037 22.26 9.3515 5 3 113,615 1,231 17.87 15.07
Factors Result
LevelMoisture
%TPS Blend
%
1 0.57% 30%2 0.69% 50%3 0.79% 70%4 1.02% -5 1.44% -
Key: PP
59
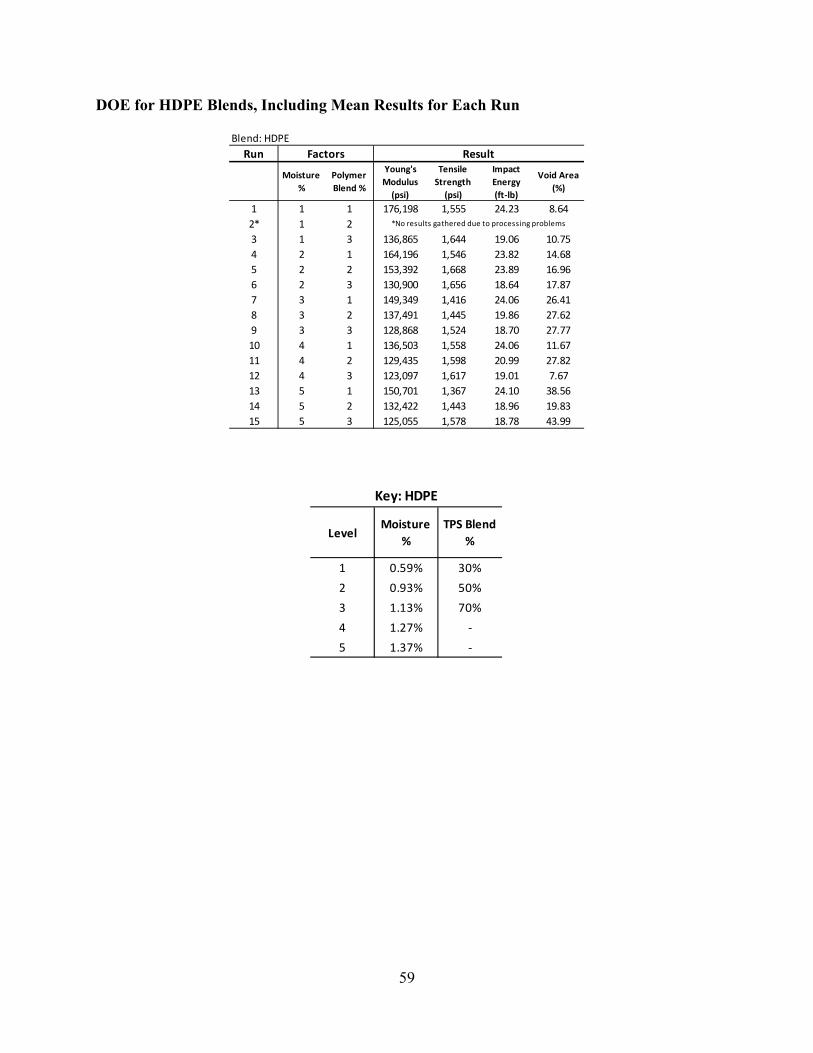
DOE for HDPE Blends, Including Mean Results for Each Run
Blend: HDPERun
Moisture %
Polymer Blend %
Young's Modulus
(psi)
Tensile Strength
(psi)
Impact Energy (ft-lb)
Void Area (%)
1 1 1 176,198 1,555 24.23 8.642* 1 23 1 3 136,865 1,644 19.06 10.754 2 1 164,196 1,546 23.82 14.685 2 2 153,392 1,668 23.89 16.966 2 3 130,900 1,656 18.64 17.877 3 1 149,349 1,416 24.06 26.418 3 2 137,491 1,445 19.86 27.629 3 3 128,868 1,524 18.70 27.7710 4 1 136,503 1,558 24.06 11.6711 4 2 129,435 1,598 20.99 27.8212 4 3 123,097 1,617 19.01 7.6713 5 1 150,701 1,367 24.10 38.5614 5 2 132,422 1,443 18.96 19.8315 5 3 125,055 1,578 18.78 43.99
*No results gathered due to processing problems
Factors Result
LevelMoisture
%TPS Blend
%
1 0.59% 30%2 0.93% 50%3 1.13% 70%4 1.27% -5 1.37% -
Key: HDPE
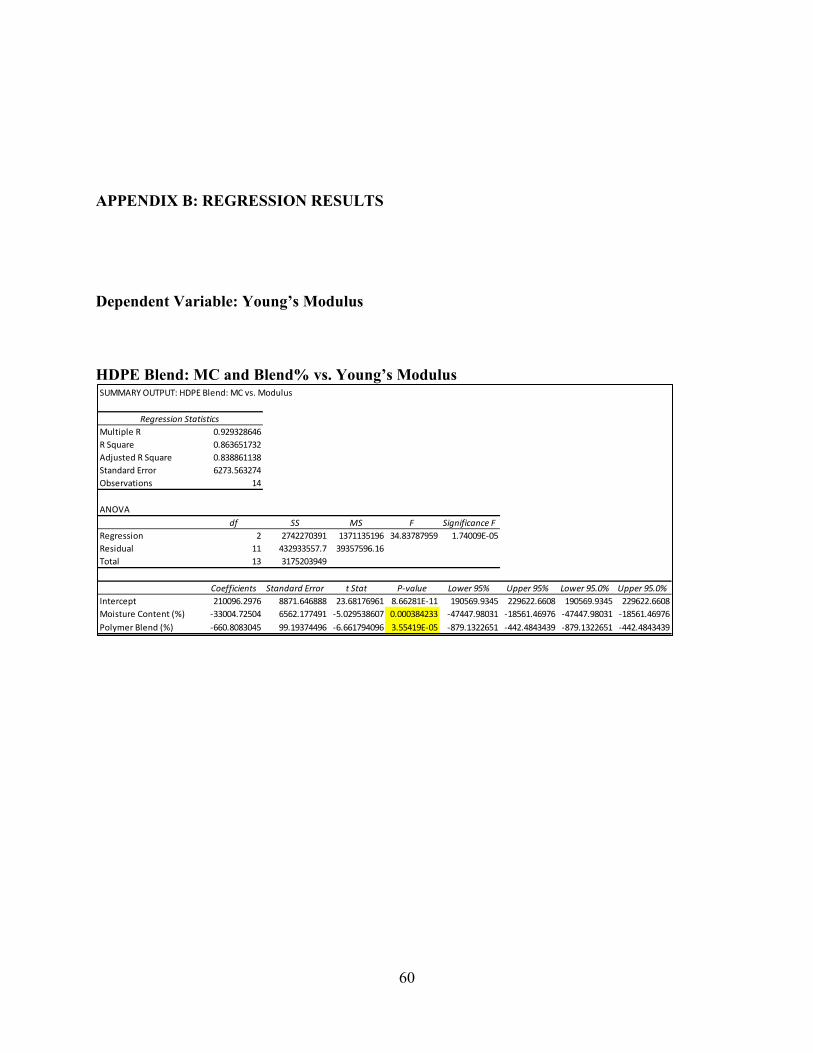
60
APPENDIX B: REGRESSION RESULTS
Dependent Variable: Young’s Modulus
HDPE Blend: MC and Blend% vs. Young’s Modulus
SUMMARY OUTPUT: HDPE Blend: MC vs. Modulus
Regression StatisticsMultiple R 0.929328646R Square 0.863651732Adjusted R Square 0.838861138Standard Error 6273.563274Observations 14
ANOVAdf SS MS F Significance F
Regression 2 2742270391 1371135196 34.83787959 1.74009E-05Residual 11 432933557.7 39357596.16Total 13 3175203949
Coefficients Standard Error t Stat P-value Lower 95% Upper 95% Lower 95.0% Upper 95.0%Intercept 210096.2976 8871.646888 23.68176961 8.66281E-11 190569.9345 229622.6608 190569.9345 229622.6608Moisture Content (%) -33004.72504 6562.177491 -5.029538607 0.000384233 -47447.98031 -18561.46976 -47447.98031 -18561.46976Polymer Blend (%) -660.8083045 99.19374496 -6.661794096 3.55419E-05 -879.1322651 -442.4843439 -879.1322651 -442.4843439
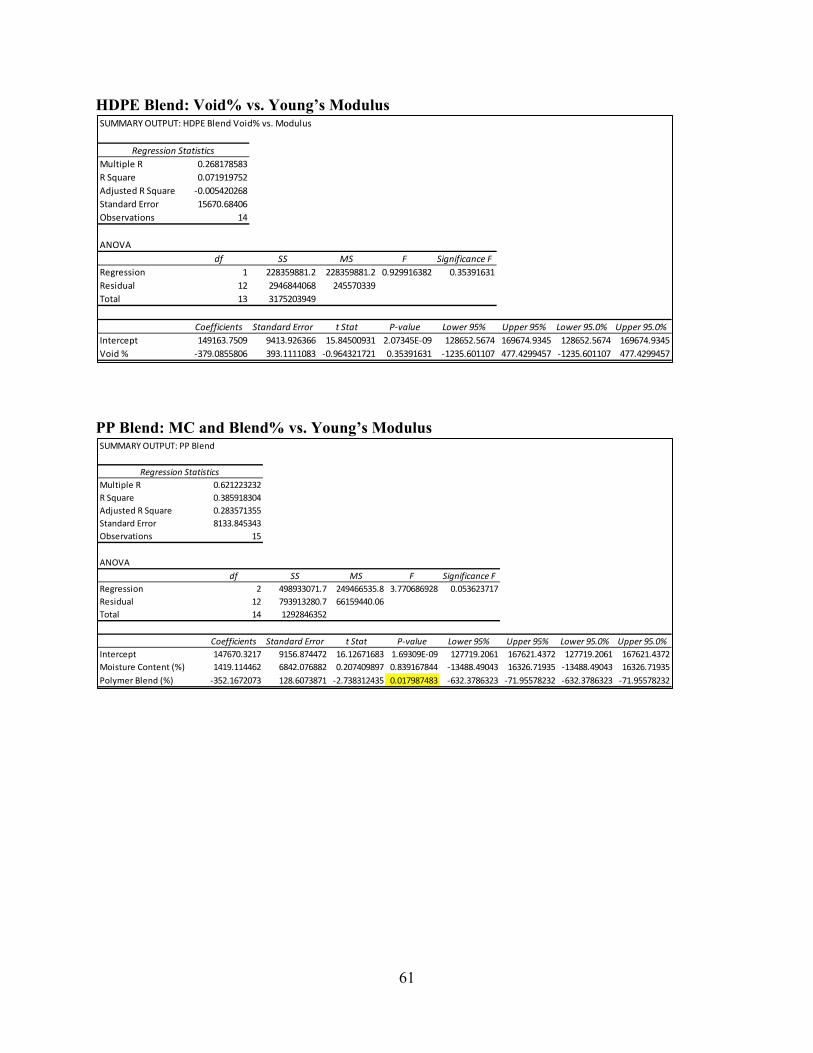
61
HDPE Blend: Void% vs. Young’s Modulus
PP Blend: MC and Blend% vs. Young’s Modulus
SUMMARY OUTPUT: HDPE Blend Void% vs. Modulus
Regression StatisticsMultiple R 0.268178583R Square 0.071919752Adjusted R Square -0.005420268Standard Error 15670.68406Observations 14
ANOVAdf SS MS F Significance F
Regression 1 228359881.2 228359881.2 0.929916382 0.35391631Residual 12 2946844068 245570339Total 13 3175203949
Coefficients Standard Error t Stat P-value Lower 95% Upper 95% Lower 95.0% Upper 95.0%Intercept 149163.7509 9413.926366 15.84500931 2.07345E-09 128652.5674 169674.9345 128652.5674 169674.9345Void % -379.0855806 393.1111083 -0.964321721 0.35391631 -1235.601107 477.4299457 -1235.601107 477.4299457
SUMMARY OUTPUT: PP Blend
Regression StatisticsMultiple R 0.621223232R Square 0.385918304Adjusted R Square 0.283571355Standard Error 8133.845343Observations 15
ANOVAdf SS MS F Significance F
Regression 2 498933071.7 249466535.8 3.770686928 0.053623717Residual 12 793913280.7 66159440.06Total 14 1292846352
Coefficients Standard Error t Stat P-value Lower 95% Upper 95% Lower 95.0% Upper 95.0%Intercept 147670.3217 9156.874472 16.12671683 1.69309E-09 127719.2061 167621.4372 127719.2061 167621.4372Moisture Content (%) 1419.114462 6842.076882 0.207409897 0.839167844 -13488.49043 16326.71935 -13488.49043 16326.71935Polymer Blend (%) -352.1672073 128.6073871 -2.738312435 0.017987483 -632.3786323 -71.95578232 -632.3786323 -71.95578232
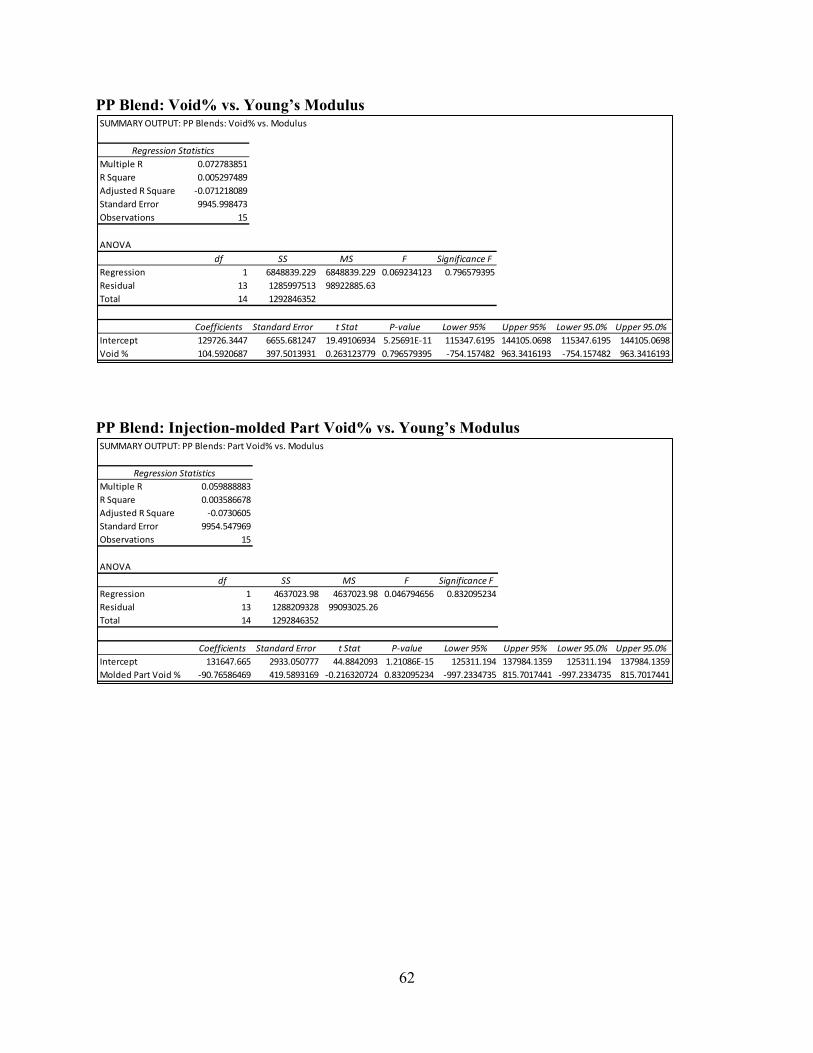
62
PP Blend: Void% vs. Young’s Modulus
PP Blend: Injection-molded Part Void% vs. Young’s Modulus
SUMMARY OUTPUT: PP Blends: Void% vs. Modulus
Regression StatisticsMultiple R 0.072783851R Square 0.005297489Adjusted R Square -0.071218089Standard Error 9945.998473Observations 15
ANOVAdf SS MS F Significance F
Regression 1 6848839.229 6848839.229 0.069234123 0.796579395Residual 13 1285997513 98922885.63Total 14 1292846352
Coefficients Standard Error t Stat P-value Lower 95% Upper 95% Lower 95.0% Upper 95.0%Intercept 129726.3447 6655.681247 19.49106934 5.25691E-11 115347.6195 144105.0698 115347.6195 144105.0698Void % 104.5920687 397.5013931 0.263123779 0.796579395 -754.157482 963.3416193 -754.157482 963.3416193
SUMMARY OUTPUT: PP Blends: Part Void% vs. Modulus
Regression StatisticsMultiple R 0.059888883R Square 0.003586678Adjusted R Square -0.0730605Standard Error 9954.547969Observations 15
ANOVAdf SS MS F Significance F
Regression 1 4637023.98 4637023.98 0.046794656 0.832095234Residual 13 1288209328 99093025.26Total 14 1292846352
Coefficients Standard Error t Stat P-value Lower 95% Upper 95% Lower 95.0% Upper 95.0%Intercept 131647.665 2933.050777 44.8842093 1.21086E-15 125311.194 137984.1359 125311.194 137984.1359Molded Part Void % -90.76586469 419.5893169 -0.216320724 0.832095234 -997.2334735 815.7017441 -997.2334735 815.7017441

63
PP Blend: ESR% in Melt Cross Section vs. Young’s Modulus
Unblended ESR: MC vs. Young’s Modulus
SUMMARY OUTPUT: PP Blend: ESR% vs. Modulus
Regression StatisticsMultiple R 0.329551677R Square 0.108604308Adjusted R Square 0.040035409Standard Error 9415.362523Observations 15
ANOVAdf SS MS F Significance F
Regression 1 140408683.5 140408683.5 1.583871246 0.230336852Residual 13 1152437669 88649051.45Total 14 1292846352
Coefficients Standard Error t Stat P-value Lower 95% Upper 95% Lower 95.0% Upper 95.0%Intercept 135622.5411 4180.721717 32.43998292 7.95901E-14 126590.6409 144654.4413 126590.6409 144654.4413ESR% -373.8984967 297.0939321 -1.258519466 0.230336852 -1015.730916 267.9339222 -1015.730916 267.9339222
SUMMARY OUTPUT: ESR
Regression StatisticsMultiple R 0.988411654R Square 0.976957597Adjusted R Square 0.969276796Standard Error 3330.529479Observations 5
ANOVAdf SS MS F Significance F
Regression 1 1410898478 1410898478 127.1947544 0.001494892Residual 3 33277279.83 11092426.61Total 4 1444175758
Coefficients Standard Error t Stat P-value Lower 95% Upper 95% Lower 95.0% Upper 95.0%Intercept 221617.1701 4562.346475 48.57526085 1.92116E-05 207097.7474 236136.5928 207097.7474 236136.5928Moisture Content (%) -48058.46875 4261.233461 -11.27806519 0.001494892 -61619.61544 -34497.32207 -61619.61544 -34497.32207
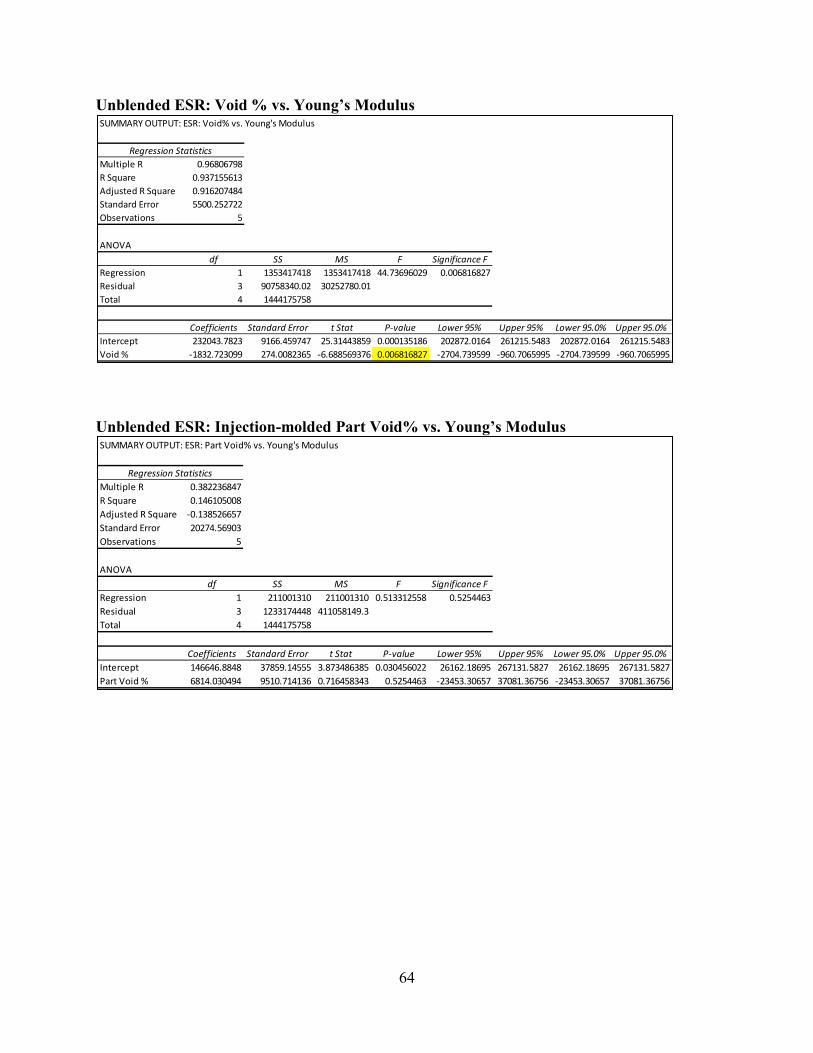
64
Unblended ESR: Void % vs. Young’s Modulus
Unblended ESR: Injection-molded Part Void% vs. Young’s Modulus
SUMMARY OUTPUT: ESR: Void% vs. Young's Modulus
Regression StatisticsMultiple R 0.96806798R Square 0.937155613Adjusted R Square 0.916207484Standard Error 5500.252722Observations 5
ANOVAdf SS MS F Significance F
Regression 1 1353417418 1353417418 44.73696029 0.006816827Residual 3 90758340.02 30252780.01Total 4 1444175758
Coefficients Standard Error t Stat P-value Lower 95% Upper 95% Lower 95.0% Upper 95.0%Intercept 232043.7823 9166.459747 25.31443859 0.000135186 202872.0164 261215.5483 202872.0164 261215.5483Void % -1832.723099 274.0082365 -6.688569376 0.006816827 -2704.739599 -960.7065995 -2704.739599 -960.7065995
SUMMARY OUTPUT: ESR: Part Void% vs. Young's Modulus
Regression StatisticsMultiple R 0.382236847R Square 0.146105008Adjusted R Square -0.138526657Standard Error 20274.56903Observations 5
ANOVAdf SS MS F Significance F
Regression 1 211001310 211001310 0.513312558 0.5254463Residual 3 1233174448 411058149.3Total 4 1444175758
Coefficients Standard Error t Stat P-value Lower 95% Upper 95% Lower 95.0% Upper 95.0%Intercept 146646.8848 37859.14555 3.873486385 0.030456022 26162.18695 267131.5827 26162.18695 267131.5827Part Void % 6814.030494 9510.714136 0.716458343 0.5254463 -23453.30657 37081.36756 -23453.30657 37081.36756
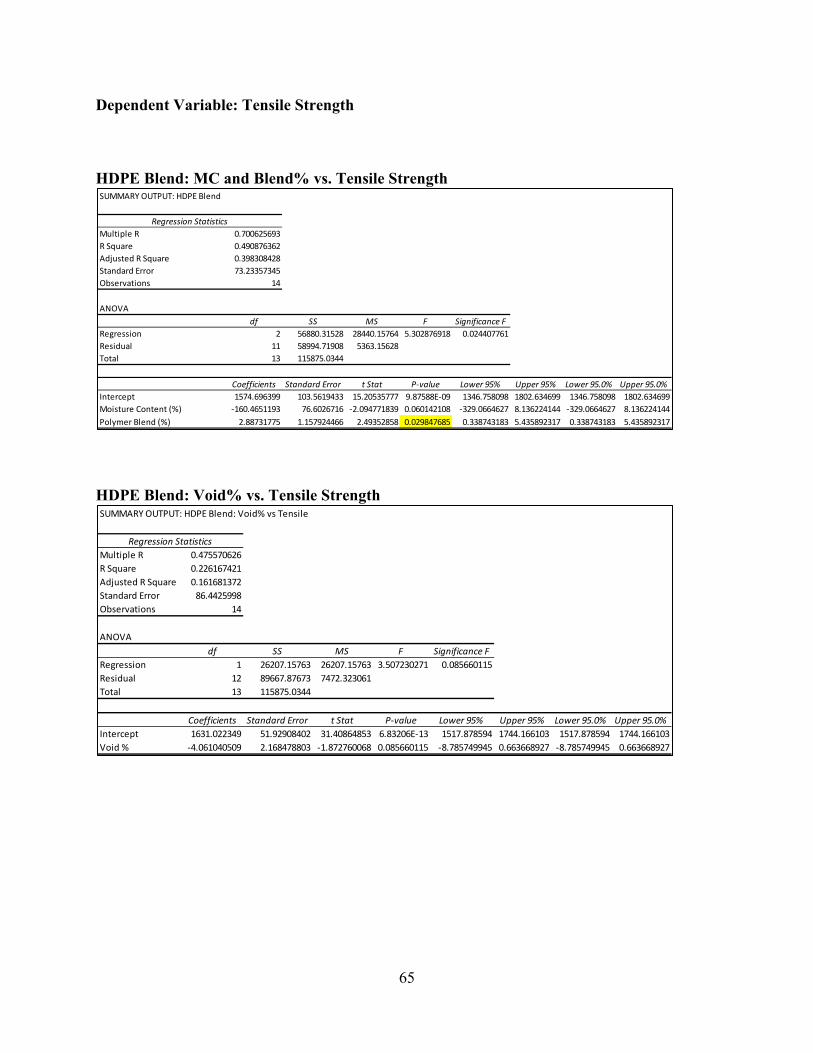
65
Dependent Variable: Tensile Strength HDPE Blend: MC and Blend% vs. Tensile Strength
HDPE Blend: Void% vs. Tensile Strength
SUMMARY OUTPUT: HDPE Blend
Regression StatisticsMultiple R 0.700625693R Square 0.490876362Adjusted R Square 0.398308428Standard Error 73.23357345Observations 14
ANOVAdf SS MS F Significance F
Regression 2 56880.31528 28440.15764 5.302876918 0.024407761Residual 11 58994.71908 5363.15628Total 13 115875.0344
Coefficients Standard Error t Stat P-value Lower 95% Upper 95% Lower 95.0% Upper 95.0%Intercept 1574.696399 103.5619433 15.20535777 9.87588E-09 1346.758098 1802.634699 1346.758098 1802.634699Moisture Content (%) -160.4651193 76.6026716 -2.094771839 0.060142108 -329.0664627 8.136224144 -329.0664627 8.136224144Polymer Blend (%) 2.88731775 1.157924466 2.49352858 0.029847685 0.338743183 5.435892317 0.338743183 5.435892317
SUMMARY OUTPUT: HDPE Blend: Void% vs Tensile
Regression StatisticsMultiple R 0.475570626R Square 0.226167421Adjusted R Square 0.161681372Standard Error 86.4425998Observations 14
ANOVAdf SS MS F Significance F
Regression 1 26207.15763 26207.15763 3.507230271 0.085660115Residual 12 89667.87673 7472.323061Total 13 115875.0344
Coefficients Standard Error t Stat P-value Lower 95% Upper 95% Lower 95.0% Upper 95.0%Intercept 1631.022349 51.92908402 31.40864853 6.83206E-13 1517.878594 1744.166103 1517.878594 1744.166103Void % -4.061040509 2.168478803 -1.872760068 0.085660115 -8.785749945 0.663668927 -8.785749945 0.663668927
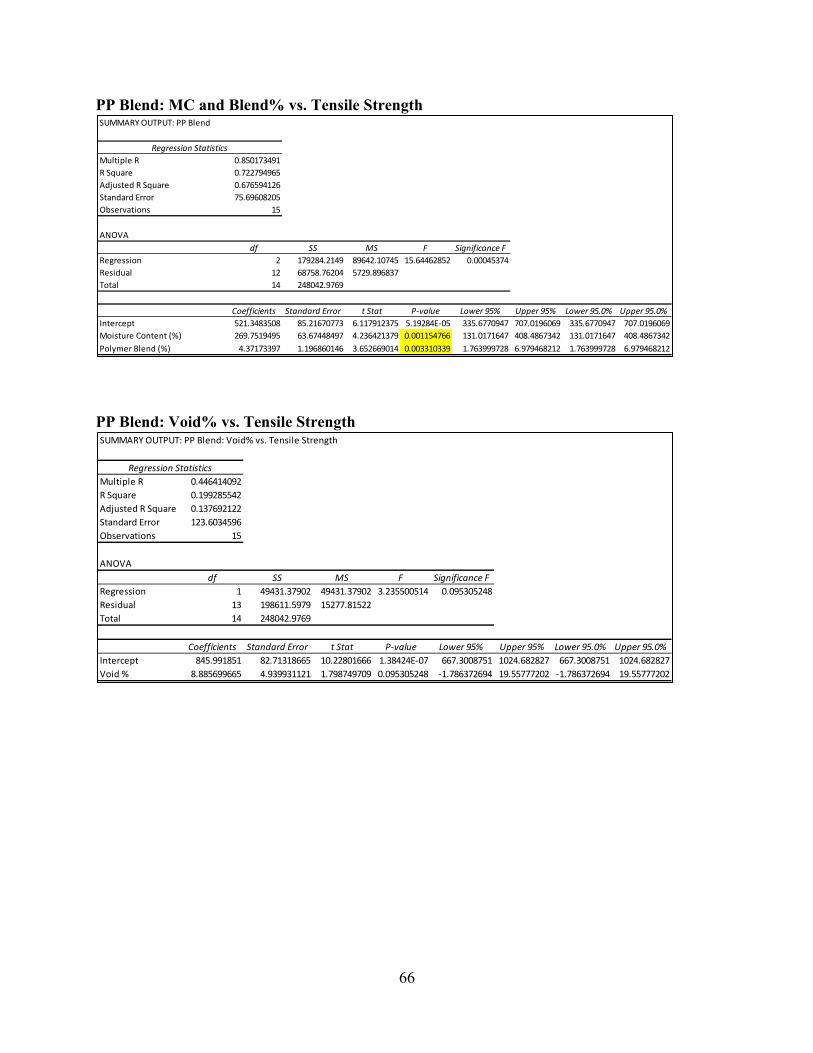
66
PP Blend: MC and Blend% vs. Tensile Strength
PP Blend: Void% vs. Tensile Strength
SUMMARY OUTPUT: PP Blend
Regression StatisticsMultiple R 0.850173491R Square 0.722794965Adjusted R Square 0.676594126Standard Error 75.69608205Observations 15
ANOVAdf SS MS F Significance F
Regression 2 179284.2149 89642.10745 15.64462852 0.00045374Residual 12 68758.76204 5729.896837Total 14 248042.9769
Coefficients Standard Error t Stat P-value Lower 95% Upper 95% Lower 95.0% Upper 95.0%Intercept 521.3483508 85.21670773 6.117912375 5.19284E-05 335.6770947 707.0196069 335.6770947 707.0196069Moisture Content (%) 269.7519495 63.67448497 4.236421379 0.001154766 131.0171647 408.4867342 131.0171647 408.4867342Polymer Blend (%) 4.37173397 1.196860146 3.652669014 0.003310339 1.763999728 6.979468212 1.763999728 6.979468212
SUMMARY OUTPUT: PP Blend: Void% vs. Tensile Strength
Regression StatisticsMultiple R 0.446414092R Square 0.199285542Adjusted R Square 0.137692122Standard Error 123.6034596Observations 15
ANOVAdf SS MS F Significance F
Regression 1 49431.37902 49431.37902 3.235500514 0.095305248Residual 13 198611.5979 15277.81522Total 14 248042.9769
Coefficients Standard Error t Stat P-value Lower 95% Upper 95% Lower 95.0% Upper 95.0%Intercept 845.991851 82.71318665 10.22801666 1.38424E-07 667.3008751 1024.682827 667.3008751 1024.682827Void % 8.885699665 4.939931121 1.798749709 0.095305248 -1.786372694 19.55777202 -1.786372694 19.55777202
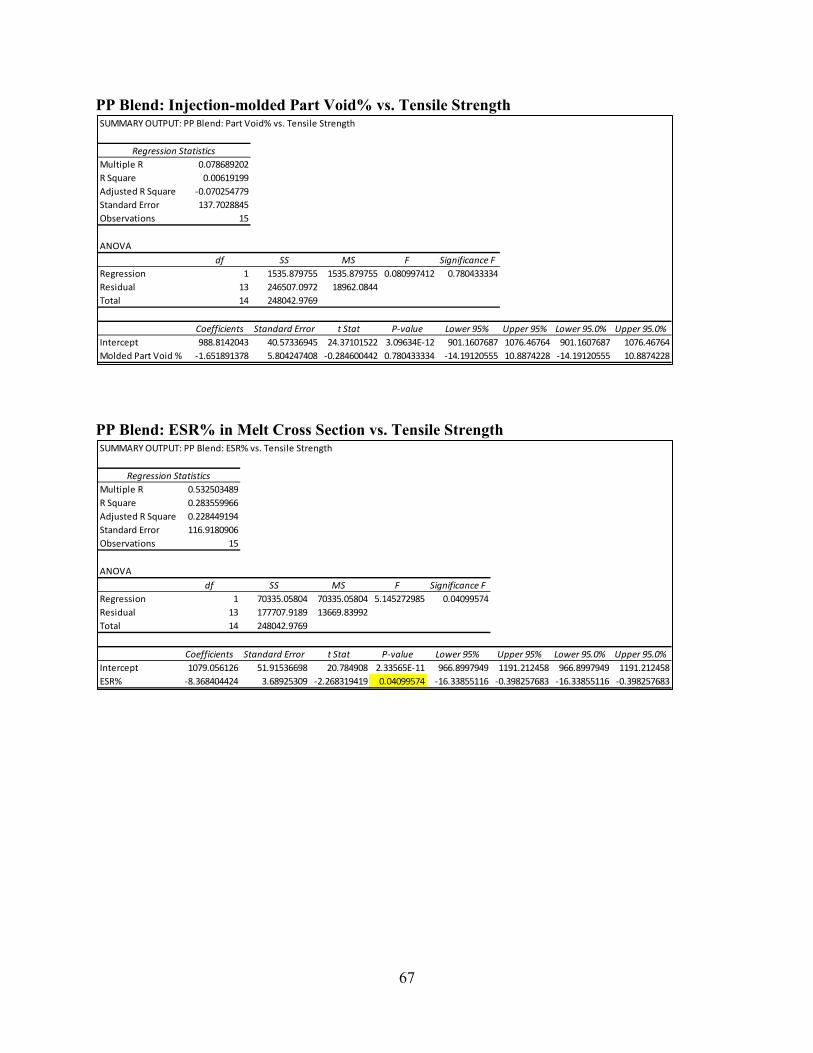
67
PP Blend: Injection-molded Part Void% vs. Tensile Strength
PP Blend: ESR% in Melt Cross Section vs. Tensile Strength
SUMMARY OUTPUT: PP Blend: Part Void% vs. Tensile Strength
Regression StatisticsMultiple R 0.078689202R Square 0.00619199Adjusted R Square -0.070254779Standard Error 137.7028845Observations 15
ANOVAdf SS MS F Significance F
Regression 1 1535.879755 1535.879755 0.080997412 0.780433334Residual 13 246507.0972 18962.0844Total 14 248042.9769
Coefficients Standard Error t Stat P-value Lower 95% Upper 95% Lower 95.0% Upper 95.0%Intercept 988.8142043 40.57336945 24.37101522 3.09634E-12 901.1607687 1076.46764 901.1607687 1076.46764Molded Part Void % -1.651891378 5.804247408 -0.284600442 0.780433334 -14.19120555 10.8874228 -14.19120555 10.8874228
SUMMARY OUTPUT: PP Blend: ESR% vs. Tensile Strength
Regression StatisticsMultiple R 0.532503489R Square 0.283559966Adjusted R Square 0.228449194Standard Error 116.9180906Observations 15
ANOVAdf SS MS F Significance F
Regression 1 70335.05804 70335.05804 5.145272985 0.04099574Residual 13 177707.9189 13669.83992Total 14 248042.9769
Coefficients Standard Error t Stat P-value Lower 95% Upper 95% Lower 95.0% Upper 95.0%Intercept 1079.056126 51.91536698 20.784908 2.33565E-11 966.8997949 1191.212458 966.8997949 1191.212458ESR% -8.368404424 3.68925309 -2.268319419 0.04099574 -16.33855116 -0.398257683 -16.33855116 -0.398257683

68
Unblended ESR: MC and Blend% vs. Tensile Strength
Unblended ESR: Void% vs. Tensile Strength
SUMMARY OUTPUT: ESR: MC vs. Tensile Strength
Regression StatisticsMultiple R 0.106295538R Square 0.011298741Adjusted R Square -0.318268345Standard Error 268.5687797Observations 5
ANOVAdf SS MS F Significance F
Regression 1 2472.847215 2472.847215 0.034283585 0.864915613Residual 3 216387.5682 72129.18941Total 4 218860.4154
Coefficients Standard Error t Stat P-value Lower 95% Upper 95% Lower 95.0% Upper 95.0%Intercept 904.6416536 367.9006094 2.458929478 0.090954038 -266.1822816 2075.465589 -266.1822816 2075.465589Moisture Content (%) 63.62395888 343.6193187 0.185158271 0.864915613 -1029.926072 1157.17399 -1029.926072 1157.17399
SUMMARY OUTPUT: ESR: Void% vs. Tensile Strength
Regression StatisticsMultiple R 0.191566961R Square 0.036697901Adjusted R Square -0.284402799Standard Error 265.0966476Observations 5
ANOVAdf SS MS F Significance F
Regression 1 8031.717796 8031.717796 0.114287825 0.757589526Residual 3 210828.6976 70276.23255Total 4 218860.4154
Coefficients Standard Error t Stat P-value Lower 95% Upper 95% Lower 95.0% Upper 95.0%Intercept 825.150935 441.7974722 1.86771312 0.158612414 -580.845798 2231.147668 -580.845798 2231.147668Void % 4.464627123 13.20642315 0.338064824 0.757589526 -37.56410545 46.4933597 -37.56410545 46.4933597
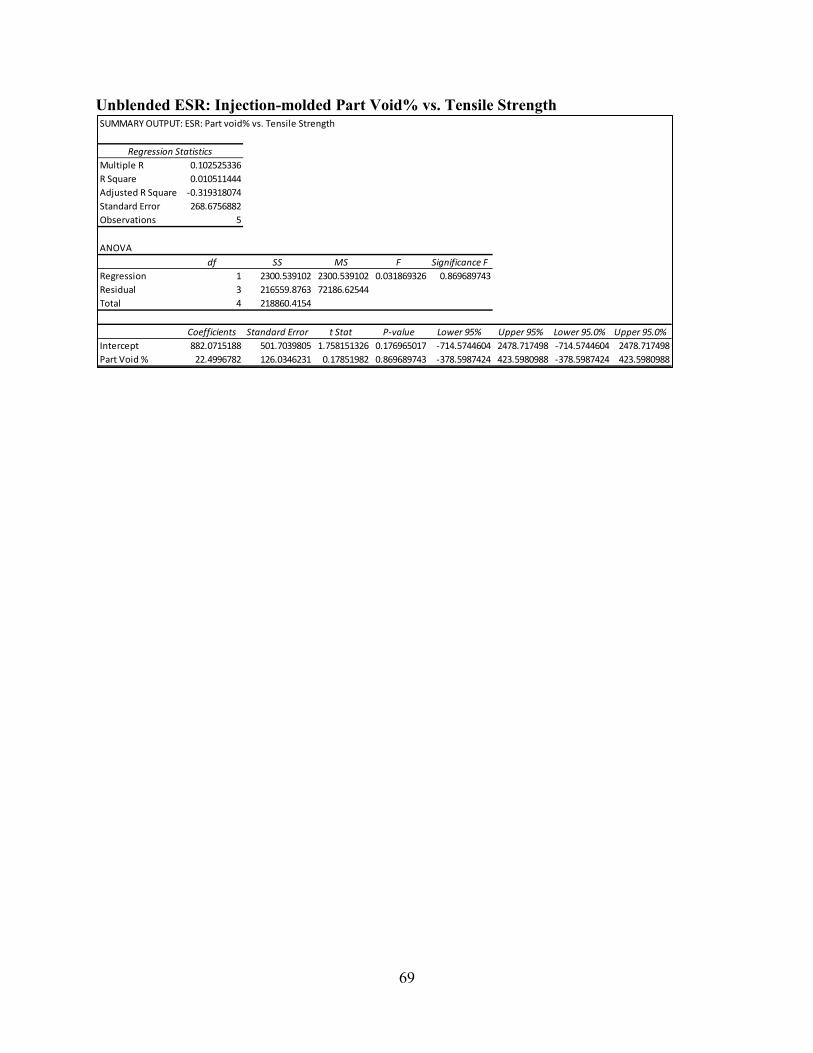
69
Unblended ESR: Injection-molded Part Void% vs. Tensile Strength
SUMMARY OUTPUT: ESR: Part void% vs. Tensile Strength
Regression Statistics Multiple R 0.102525336R Square 0.010511444Adjusted R Square -0.319318074Standard Error 268.6756882Observations 5
ANOVAdf SS MS F Significance F
Regression 1 2300.539102 2300.539102 0.031869326 0.869689743Residual 3 216559.8763 72186.62544Total 4 218860.4154
Coefficients Standard Error t Stat P-value Lower 95% Upper 95% Lower 95.0% Upper 95.0%Intercept 882.0715188 501.7039805 1.758151326 0.176965017 -714.5744604 2478.717498 -714.5744604 2478.717498Part Void % 22.4996782 126.0346231 0.17851982 0.869689743 -378.5987424 423.5980988 -378.5987424 423.5980988
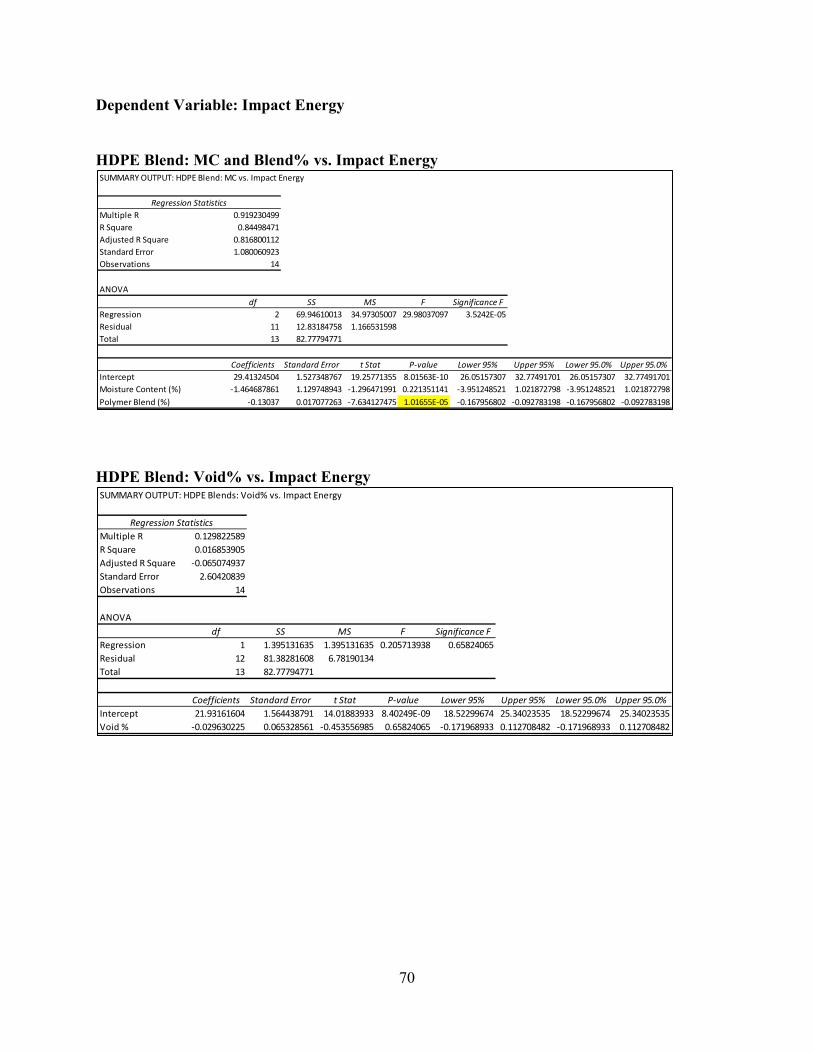
70
Dependent Variable: Impact Energy HDPE Blend: MC and Blend% vs. Impact Energy
HDPE Blend: Void% vs. Impact Energy
SUMMARY OUTPUT: HDPE Blend: MC vs. Impact Energy
Regression StatisticsMultiple R 0.919230499R Square 0.84498471Adjusted R Square 0.816800112Standard Error 1.080060923Observations 14
ANOVAdf SS MS F Significance F
Regression 2 69.94610013 34.97305007 29.98037097 3.5242E-05Residual 11 12.83184758 1.166531598Total 13 82.77794771
Coefficients Standard Error t Stat P-value Lower 95% Upper 95% Lower 95.0% Upper 95.0%Intercept 29.41324504 1.527348767 19.25771355 8.01563E-10 26.05157307 32.77491701 26.05157307 32.77491701Moisture Content (%) -1.464687861 1.129748943 -1.296471991 0.221351141 -3.951248521 1.021872798 -3.951248521 1.021872798Polymer Blend (%) -0.13037 0.017077263 -7.634127475 1.01655E-05 -0.167956802 -0.092783198 -0.167956802 -0.092783198
SUMMARY OUTPUT: HDPE Blends: Void% vs. Impact Energy
Regression StatisticsMultiple R 0.129822589R Square 0.016853905Adjusted R Square -0.065074937Standard Error 2.60420839Observations 14
ANOVAdf SS MS F Significance F
Regression 1 1.395131635 1.395131635 0.205713938 0.65824065Residual 12 81.38281608 6.78190134Total 13 82.77794771
Coefficients Standard Error t Stat P-value Lower 95% Upper 95% Lower 95.0% Upper 95.0%Intercept 21.93161604 1.564438791 14.01883933 8.40249E-09 18.52299674 25.34023535 18.52299674 25.34023535Void % -0.029630225 0.065328561 -0.453556985 0.65824065 -0.171968933 0.112708482 -0.171968933 0.112708482

71
PP Blend: MC and Blend% vs. Impact Energy
PP Blend: Void% vs. Impact Energy
SUMMARY OUTPUT: PP Blend: MC vs. Impact Energy
Regression StatisticsMultiple R 0.641026258R Square 0.410914663Adjusted R Square 0.312733774Standard Error 1.338096516Observations 15
ANOVAdf SS MS F Significance F
Regression 2 14.98751229 7.493756146 4.185281528 0.041789702Residual 12 21.48602744 1.790502287Total 14 36.47353973
Coefficients Standard Error t Stat P-value Lower 95% Upper 95% Lower 95.0% Upper 95.0%Intercept 25.33131069 1.506394739 16.81585181 1.04518E-09 22.04915851 28.61346287 22.04915851 28.61346287Moisture Content (%) -1.065902465 1.125588065 -0.946973852 0.362332069 -3.518348182 1.386543252 -3.518348182 1.386543252Polymer Blend (%) -0.05784 0.021157164 -2.733825814 0.018137553 -0.103937499 -0.011742501 -0.103937499 -0.011742501
SUMMARY OUTPUT: PP Blend: Void% vs. Impact Energy
Regression StatisticsMultiple R 0.034739685R Square 0.001206846Adjusted R Square -0.075623397Standard Error 1.673998479Observations 15
ANOVAdf SS MS F Significance F
Regression 1 0.044017934 0.044017934 0.015707951 0.902178667Residual 13 36.4295218 2.802270908Total 14 36.47353973
Coefficients Standard Error t Stat P-value Lower 95% Upper 95% Lower 95.0% Upper 95.0%Intercept 21.60739231 1.12020933 19.28870947 5.99535E-11 19.18732718 24.02745743 19.18732718 24.02745743Void % -0.008385039 0.066902959 -0.125331365 0.902178667 -0.152920095 0.136150016 -0.152920095 0.136150016
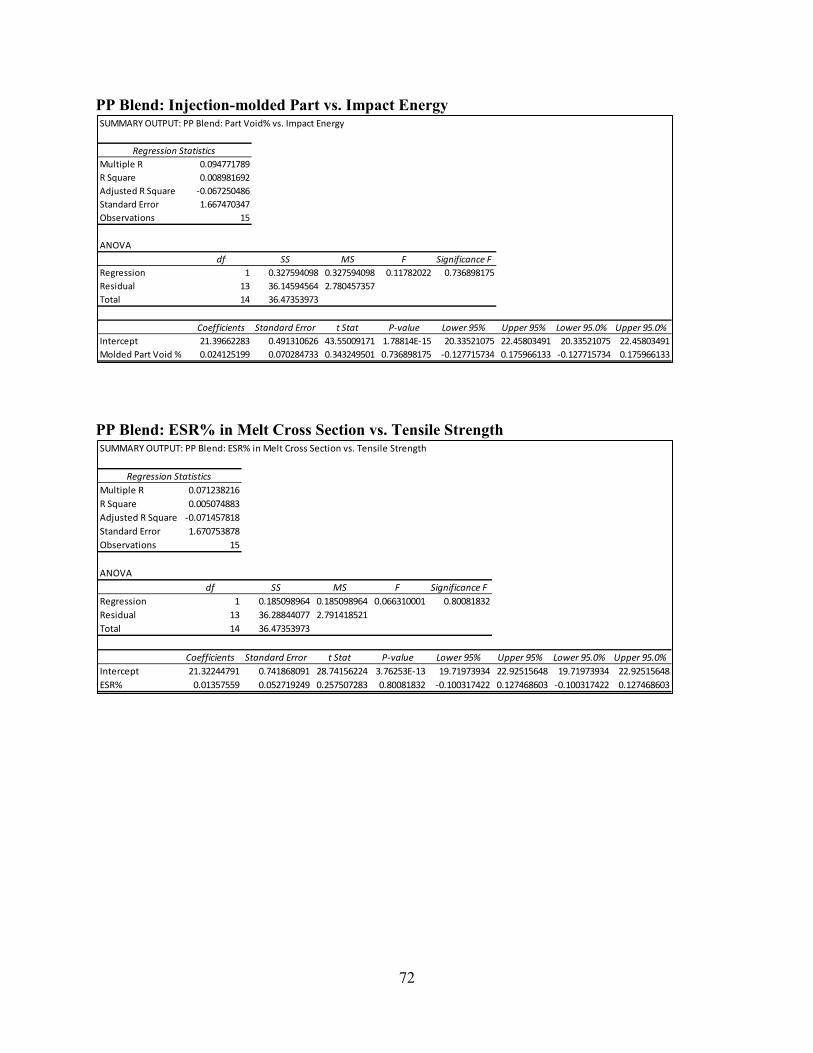
72
PP Blend: Injection-molded Part vs. Impact Energy
PP Blend: ESR% in Melt Cross Section vs. Tensile Strength
SUMMARY OUTPUT: PP Blend: Part Void% vs. Impact Energy
Regression StatisticsMultiple R 0.094771789R Square 0.008981692Adjusted R Square -0.067250486Standard Error 1.667470347Observations 15
ANOVAdf SS MS F Significance F
Regression 1 0.327594098 0.327594098 0.11782022 0.736898175Residual 13 36.14594564 2.780457357Total 14 36.47353973
Coefficients Standard Error t Stat P-value Lower 95% Upper 95% Lower 95.0% Upper 95.0%Intercept 21.39662283 0.491310626 43.55009171 1.78814E-15 20.33521075 22.45803491 20.33521075 22.45803491Molded Part Void % 0.024125199 0.070284733 0.343249501 0.736898175 -0.127715734 0.175966133 -0.127715734 0.175966133
SUMMARY OUTPUT: PP Blend: ESR% in Melt Cross Section vs. Tensile Strength
Regression StatisticsMultiple R 0.071238216R Square 0.005074883Adjusted R Square -0.071457818Standard Error 1.670753878Observations 15
ANOVAdf SS MS F Significance F
Regression 1 0.185098964 0.185098964 0.066310001 0.80081832Residual 13 36.28844077 2.791418521Total 14 36.47353973
Coefficients Standard Error t Stat P-value Lower 95% Upper 95% Lower 95.0% Upper 95.0%Intercept 21.32244791 0.741868091 28.74156224 3.76253E-13 19.71973934 22.92515648 19.71973934 22.92515648ESR% 0.01357559 0.052719249 0.257507283 0.80081832 -0.100317422 0.127468603 -0.100317422 0.127468603
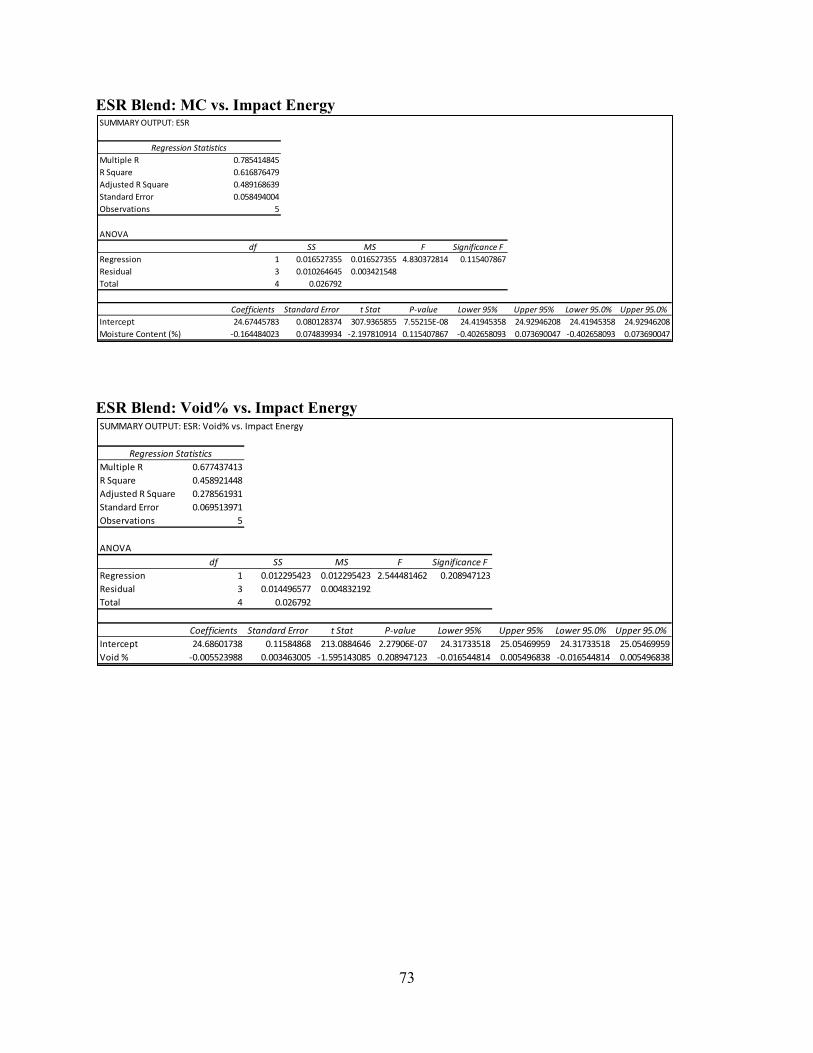
73
ESR Blend: MC vs. Impact Energy
ESR Blend: Void% vs. Impact Energy
SUMMARY OUTPUT: ESR
Regression StatisticsMultiple R 0.785414845R Square 0.616876479Adjusted R Square 0.489168639Standard Error 0.058494004Observations 5
ANOVAdf SS MS F Significance F
Regression 1 0.016527355 0.016527355 4.830372814 0.115407867Residual 3 0.010264645 0.003421548Total 4 0.026792
Coefficients Standard Error t Stat P-value Lower 95% Upper 95% Lower 95.0% Upper 95.0%Intercept 24.67445783 0.080128374 307.9365855 7.55215E-08 24.41945358 24.92946208 24.41945358 24.92946208Moisture Content (%) -0.164484023 0.074839934 -2.197810914 0.115407867 -0.402658093 0.073690047 -0.402658093 0.073690047
SUMMARY OUTPUT: ESR: Void% vs. Impact Energy
Regression StatisticsMultiple R 0.677437413R Square 0.458921448Adjusted R Square 0.278561931Standard Error 0.069513971Observations 5
ANOVAdf SS MS F Significance F
Regression 1 0.012295423 0.012295423 2.544481462 0.208947123Residual 3 0.014496577 0.004832192Total 4 0.026792
Coefficients Standard Error t Stat P-value Lower 95% Upper 95% Lower 95.0% Upper 95.0%Intercept 24.68601738 0.11584868 213.0884646 2.27906E-07 24.31733518 25.05469959 24.31733518 25.05469959Void % -0.005523988 0.003463005 -1.595143085 0.208947123 -0.016544814 0.005496838 -0.016544814 0.005496838

74
ESR Blend: Injection-molded Part Void% vs. Impact Energy
SUMMARY OUTPUT: Part Void % and Impact Energy
Regression Statistics Multiple R 0.048696252R Square 0.002371325Adjusted R Square -0.330171567Standard Error 0.09439009Observations 5
ANOVAdf SS MS F Significance F
Regression 1 6.35325E-05 6.35325E-05 0.007130884 0.93802252Residual 3 0.026728467 0.008909489Total 4 0.026792
Coefficients Standard Error t Stat P-value Lower 95% Upper 95% Lower 95.0% Upper 95.0%Intercept 24.49354924 0.176256677 138.9652275 8.21621E-07 23.93262183 25.05447665 23.93262183 25.05447665Part Void % 0.003739036 0.04427799 0.084444564 0.93802252 -0.13717329 0.144651362 -0.13717329 0.144651362
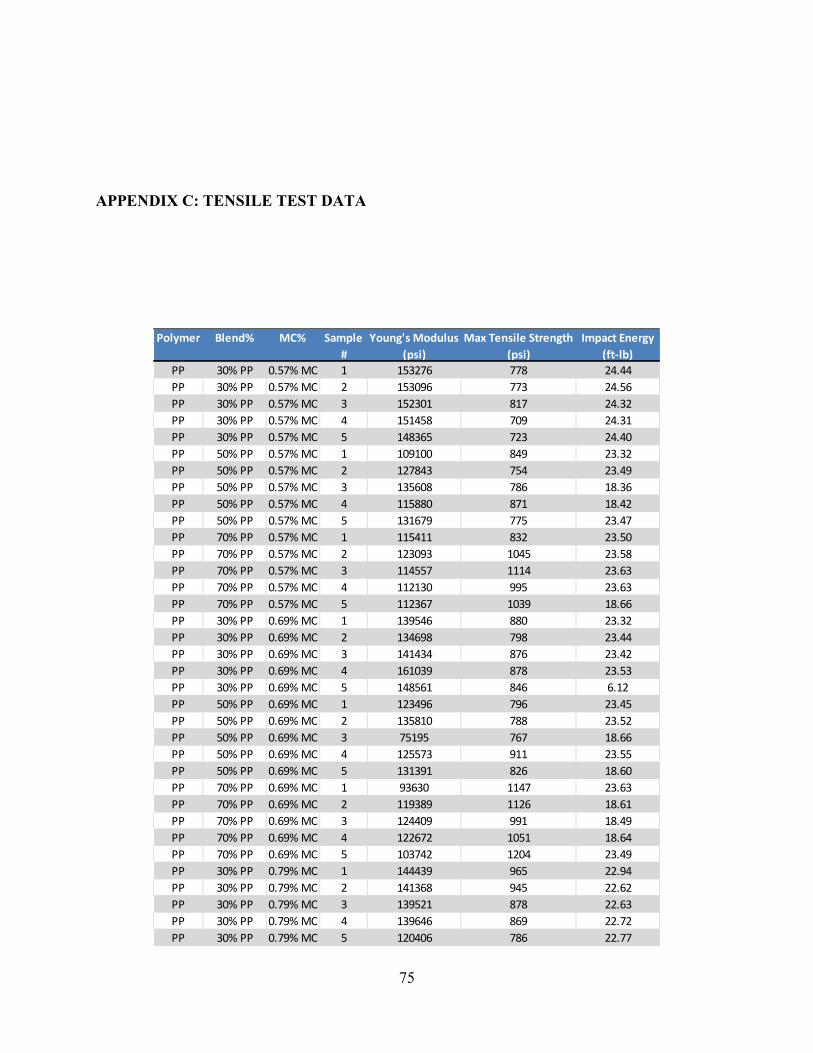
75
APPENDIX C: TENSILE TEST DATA
Polymer Blend% MC% Sample #
Young's Modulus (psi)
Max Tensile Strength (psi)
Impact Energy (ft-lb)
PP 30% PP 0.57% MC 1 153276 778 24.44PP 30% PP 0.57% MC 2 153096 773 24.56PP 30% PP 0.57% MC 3 152301 817 24.32PP 30% PP 0.57% MC 4 151458 709 24.31PP 30% PP 0.57% MC 5 148365 723 24.40PP 50% PP 0.57% MC 1 109100 849 23.32PP 50% PP 0.57% MC 2 127843 754 23.49PP 50% PP 0.57% MC 3 135608 786 18.36PP 50% PP 0.57% MC 4 115880 871 18.42PP 50% PP 0.57% MC 5 131679 775 23.47PP 70% PP 0.57% MC 1 115411 832 23.50PP 70% PP 0.57% MC 2 123093 1045 23.58PP 70% PP 0.57% MC 3 114557 1114 23.63PP 70% PP 0.57% MC 4 112130 995 23.63PP 70% PP 0.57% MC 5 112367 1039 18.66PP 30% PP 0.69% MC 1 139546 880 23.32PP 30% PP 0.69% MC 2 134698 798 23.44PP 30% PP 0.69% MC 3 141434 876 23.42PP 30% PP 0.69% MC 4 161039 878 23.53PP 30% PP 0.69% MC 5 148561 846 6.12PP 50% PP 0.69% MC 1 123496 796 23.45PP 50% PP 0.69% MC 2 135810 788 23.52PP 50% PP 0.69% MC 3 75195 767 18.66PP 50% PP 0.69% MC 4 125573 911 23.55PP 50% PP 0.69% MC 5 131391 826 18.60PP 70% PP 0.69% MC 1 93630 1147 23.63PP 70% PP 0.69% MC 2 119389 1126 18.61PP 70% PP 0.69% MC 3 124409 991 18.49PP 70% PP 0.69% MC 4 122672 1051 18.64PP 70% PP 0.69% MC 5 103742 1204 23.49PP 30% PP 0.79% MC 1 144439 965 22.94PP 30% PP 0.79% MC 2 141368 945 22.62PP 30% PP 0.79% MC 3 139521 878 22.63PP 30% PP 0.79% MC 4 139646 869 22.72PP 30% PP 0.79% MC 5 120406 786 22.77
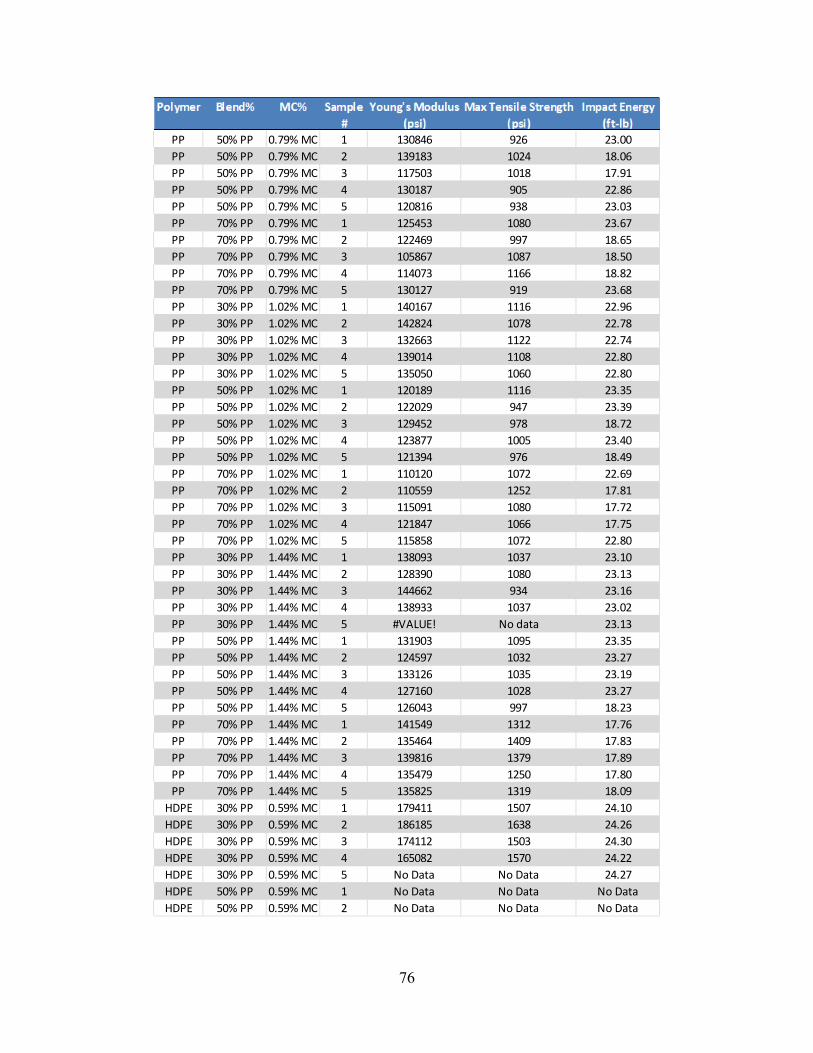
76
PP 50% PP 0.79% MC 1 130846 926 23.00PP 50% PP 0.79% MC 2 139183 1024 18.06PP 50% PP 0.79% MC 3 117503 1018 17.91PP 50% PP 0.79% MC 4 130187 905 22.86PP 50% PP 0.79% MC 5 120816 938 23.03PP 70% PP 0.79% MC 1 125453 1080 23.67PP 70% PP 0.79% MC 2 122469 997 18.65PP 70% PP 0.79% MC 3 105867 1087 18.50PP 70% PP 0.79% MC 4 114073 1166 18.82PP 70% PP 0.79% MC 5 130127 919 23.68PP 30% PP 1.02% MC 1 140167 1116 22.96PP 30% PP 1.02% MC 2 142824 1078 22.78PP 30% PP 1.02% MC 3 132663 1122 22.74PP 30% PP 1.02% MC 4 139014 1108 22.80PP 30% PP 1.02% MC 5 135050 1060 22.80PP 50% PP 1.02% MC 1 120189 1116 23.35PP 50% PP 1.02% MC 2 122029 947 23.39PP 50% PP 1.02% MC 3 129452 978 18.72PP 50% PP 1.02% MC 4 123877 1005 23.40PP 50% PP 1.02% MC 5 121394 976 18.49PP 70% PP 1.02% MC 1 110120 1072 22.69PP 70% PP 1.02% MC 2 110559 1252 17.81PP 70% PP 1.02% MC 3 115091 1080 17.72PP 70% PP 1.02% MC 4 121847 1066 17.75PP 70% PP 1.02% MC 5 115858 1072 22.80PP 30% PP 1.44% MC 1 138093 1037 23.10PP 30% PP 1.44% MC 2 128390 1080 23.13PP 30% PP 1.44% MC 3 144662 934 23.16PP 30% PP 1.44% MC 4 138933 1037 23.02PP 30% PP 1.44% MC 5 #VALUE! No data 23.13PP 50% PP 1.44% MC 1 131903 1095 23.35PP 50% PP 1.44% MC 2 124597 1032 23.27PP 50% PP 1.44% MC 3 133126 1035 23.19PP 50% PP 1.44% MC 4 127160 1028 23.27PP 50% PP 1.44% MC 5 126043 997 18.23PP 70% PP 1.44% MC 1 141549 1312 17.76PP 70% PP 1.44% MC 2 135464 1409 17.83PP 70% PP 1.44% MC 3 139816 1379 17.89PP 70% PP 1.44% MC 4 135479 1250 17.80PP 70% PP 1.44% MC 5 135825 1319 18.09
HDPE 30% PP 0.59% MC 1 179411 1507 24.10HDPE 30% PP 0.59% MC 2 186185 1638 24.26HDPE 30% PP 0.59% MC 3 174112 1503 24.30HDPE 30% PP 0.59% MC 4 165082 1570 24.22HDPE 30% PP 0.59% MC 5 No Data No Data 24.27HDPE 50% PP 0.59% MC 1 No Data No Data No DataHDPE 50% PP 0.59% MC 2 No Data No Data No Data
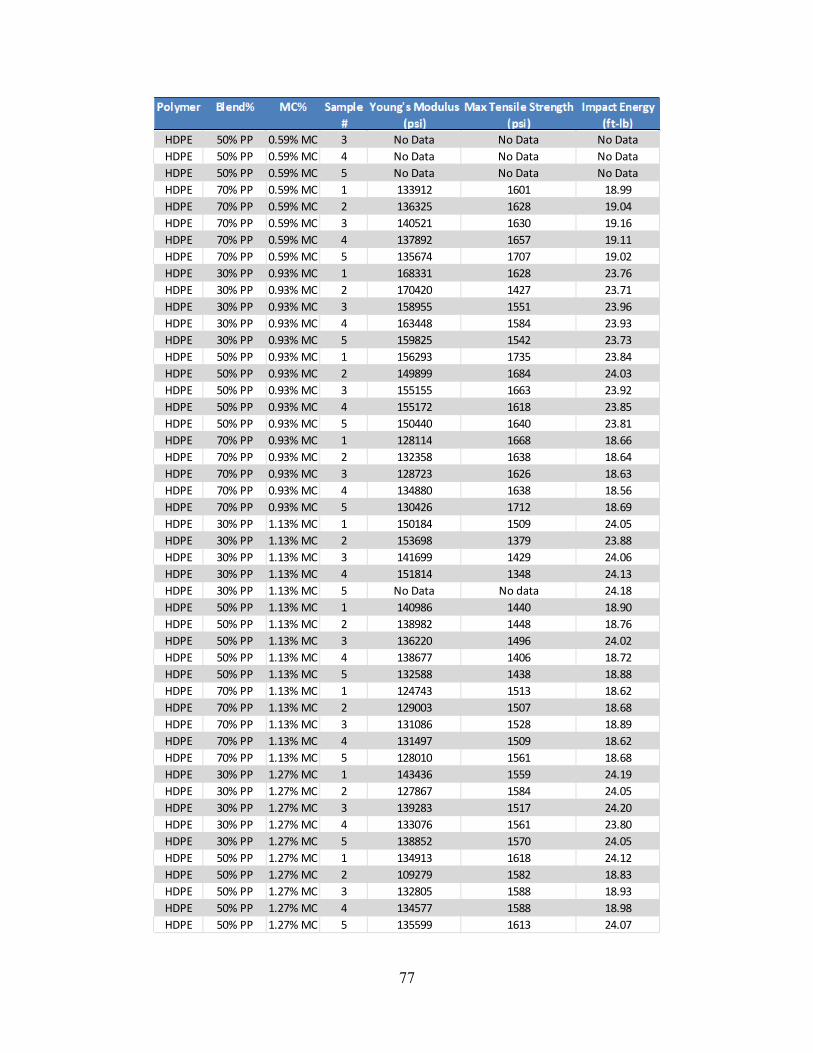
77
HDPE 50% PP 0.59% MC 3 No Data No Data No DataHDPE 50% PP 0.59% MC 4 No Data No Data No DataHDPE 50% PP 0.59% MC 5 No Data No Data No DataHDPE 70% PP 0.59% MC 1 133912 1601 18.99HDPE 70% PP 0.59% MC 2 136325 1628 19.04HDPE 70% PP 0.59% MC 3 140521 1630 19.16HDPE 70% PP 0.59% MC 4 137892 1657 19.11HDPE 70% PP 0.59% MC 5 135674 1707 19.02HDPE 30% PP 0.93% MC 1 168331 1628 23.76HDPE 30% PP 0.93% MC 2 170420 1427 23.71HDPE 30% PP 0.93% MC 3 158955 1551 23.96HDPE 30% PP 0.93% MC 4 163448 1584 23.93HDPE 30% PP 0.93% MC 5 159825 1542 23.73HDPE 50% PP 0.93% MC 1 156293 1735 23.84HDPE 50% PP 0.93% MC 2 149899 1684 24.03HDPE 50% PP 0.93% MC 3 155155 1663 23.92HDPE 50% PP 0.93% MC 4 155172 1618 23.85HDPE 50% PP 0.93% MC 5 150440 1640 23.81HDPE 70% PP 0.93% MC 1 128114 1668 18.66HDPE 70% PP 0.93% MC 2 132358 1638 18.64HDPE 70% PP 0.93% MC 3 128723 1626 18.63HDPE 70% PP 0.93% MC 4 134880 1638 18.56HDPE 70% PP 0.93% MC 5 130426 1712 18.69HDPE 30% PP 1.13% MC 1 150184 1509 24.05HDPE 30% PP 1.13% MC 2 153698 1379 23.88HDPE 30% PP 1.13% MC 3 141699 1429 24.06HDPE 30% PP 1.13% MC 4 151814 1348 24.13HDPE 30% PP 1.13% MC 5 No Data No data 24.18HDPE 50% PP 1.13% MC 1 140986 1440 18.90HDPE 50% PP 1.13% MC 2 138982 1448 18.76HDPE 50% PP 1.13% MC 3 136220 1496 24.02HDPE 50% PP 1.13% MC 4 138677 1406 18.72HDPE 50% PP 1.13% MC 5 132588 1438 18.88HDPE 70% PP 1.13% MC 1 124743 1513 18.62HDPE 70% PP 1.13% MC 2 129003 1507 18.68HDPE 70% PP 1.13% MC 3 131086 1528 18.89HDPE 70% PP 1.13% MC 4 131497 1509 18.62HDPE 70% PP 1.13% MC 5 128010 1561 18.68HDPE 30% PP 1.27% MC 1 143436 1559 24.19HDPE 30% PP 1.27% MC 2 127867 1584 24.05HDPE 30% PP 1.27% MC 3 139283 1517 24.20HDPE 30% PP 1.27% MC 4 133076 1561 23.80HDPE 30% PP 1.27% MC 5 138852 1570 24.05HDPE 50% PP 1.27% MC 1 134913 1618 24.12HDPE 50% PP 1.27% MC 2 109279 1582 18.83HDPE 50% PP 1.27% MC 3 132805 1588 18.93HDPE 50% PP 1.27% MC 4 134577 1588 18.98HDPE 50% PP 1.27% MC 5 135599 1613 24.07
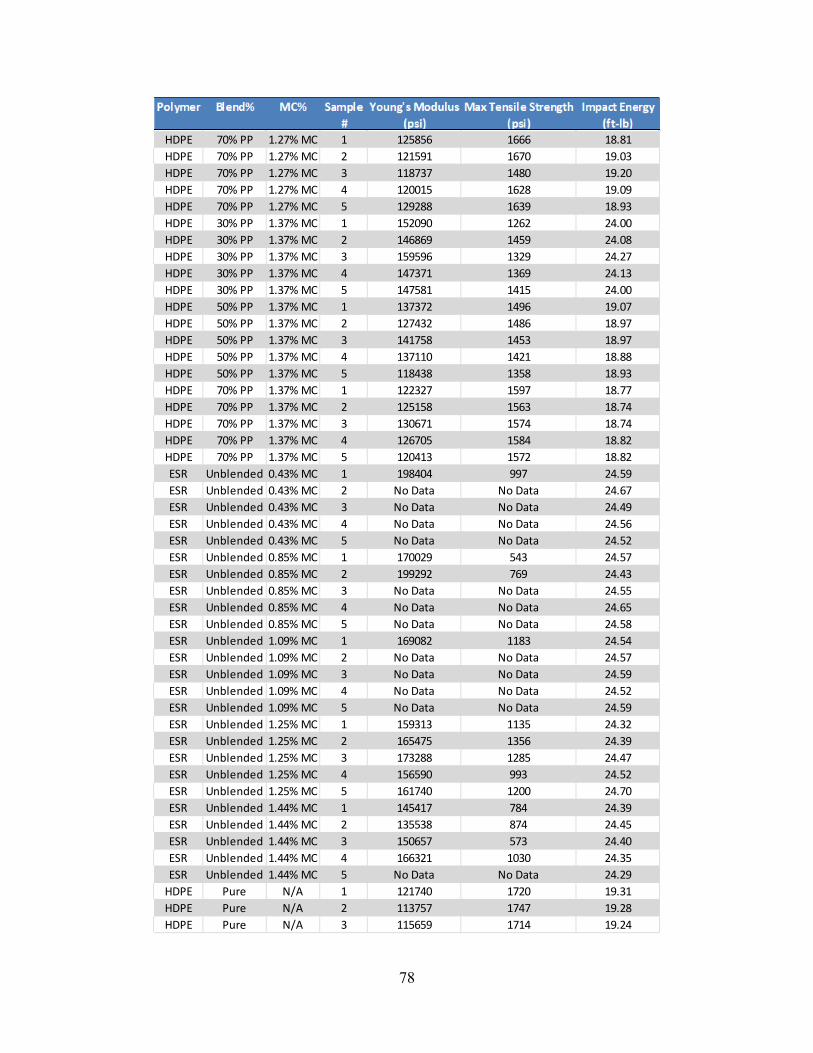
78
HDPE 70% PP 1.27% MC 1 125856 1666 18.81HDPE 70% PP 1.27% MC 2 121591 1670 19.03HDPE 70% PP 1.27% MC 3 118737 1480 19.20HDPE 70% PP 1.27% MC 4 120015 1628 19.09HDPE 70% PP 1.27% MC 5 129288 1639 18.93HDPE 30% PP 1.37% MC 1 152090 1262 24.00HDPE 30% PP 1.37% MC 2 146869 1459 24.08HDPE 30% PP 1.37% MC 3 159596 1329 24.27HDPE 30% PP 1.37% MC 4 147371 1369 24.13HDPE 30% PP 1.37% MC 5 147581 1415 24.00HDPE 50% PP 1.37% MC 1 137372 1496 19.07HDPE 50% PP 1.37% MC 2 127432 1486 18.97HDPE 50% PP 1.37% MC 3 141758 1453 18.97HDPE 50% PP 1.37% MC 4 137110 1421 18.88HDPE 50% PP 1.37% MC 5 118438 1358 18.93HDPE 70% PP 1.37% MC 1 122327 1597 18.77HDPE 70% PP 1.37% MC 2 125158 1563 18.74HDPE 70% PP 1.37% MC 3 130671 1574 18.74HDPE 70% PP 1.37% MC 4 126705 1584 18.82HDPE 70% PP 1.37% MC 5 120413 1572 18.82ESR Unblended 0.43% MC 1 198404 997 24.59ESR Unblended 0.43% MC 2 No Data No Data 24.67ESR Unblended 0.43% MC 3 No Data No Data 24.49ESR Unblended 0.43% MC 4 No Data No Data 24.56ESR Unblended 0.43% MC 5 No Data No Data 24.52ESR Unblended 0.85% MC 1 170029 543 24.57ESR Unblended 0.85% MC 2 199292 769 24.43ESR Unblended 0.85% MC 3 No Data No Data 24.55ESR Unblended 0.85% MC 4 No Data No Data 24.65ESR Unblended 0.85% MC 5 No Data No Data 24.58ESR Unblended 1.09% MC 1 169082 1183 24.54ESR Unblended 1.09% MC 2 No Data No Data 24.57ESR Unblended 1.09% MC 3 No Data No Data 24.59ESR Unblended 1.09% MC 4 No Data No Data 24.52ESR Unblended 1.09% MC 5 No Data No Data 24.59ESR Unblended 1.25% MC 1 159313 1135 24.32ESR Unblended 1.25% MC 2 165475 1356 24.39ESR Unblended 1.25% MC 3 173288 1285 24.47ESR Unblended 1.25% MC 4 156590 993 24.52ESR Unblended 1.25% MC 5 161740 1200 24.70ESR Unblended 1.44% MC 1 145417 784 24.39ESR Unblended 1.44% MC 2 135538 874 24.45ESR Unblended 1.44% MC 3 150657 573 24.40ESR Unblended 1.44% MC 4 166321 1030 24.35ESR Unblended 1.44% MC 5 No Data No Data 24.29
HDPE Pure N/A 1 121740 1720 19.31HDPE Pure N/A 2 113757 1747 19.28HDPE Pure N/A 3 115659 1714 19.24
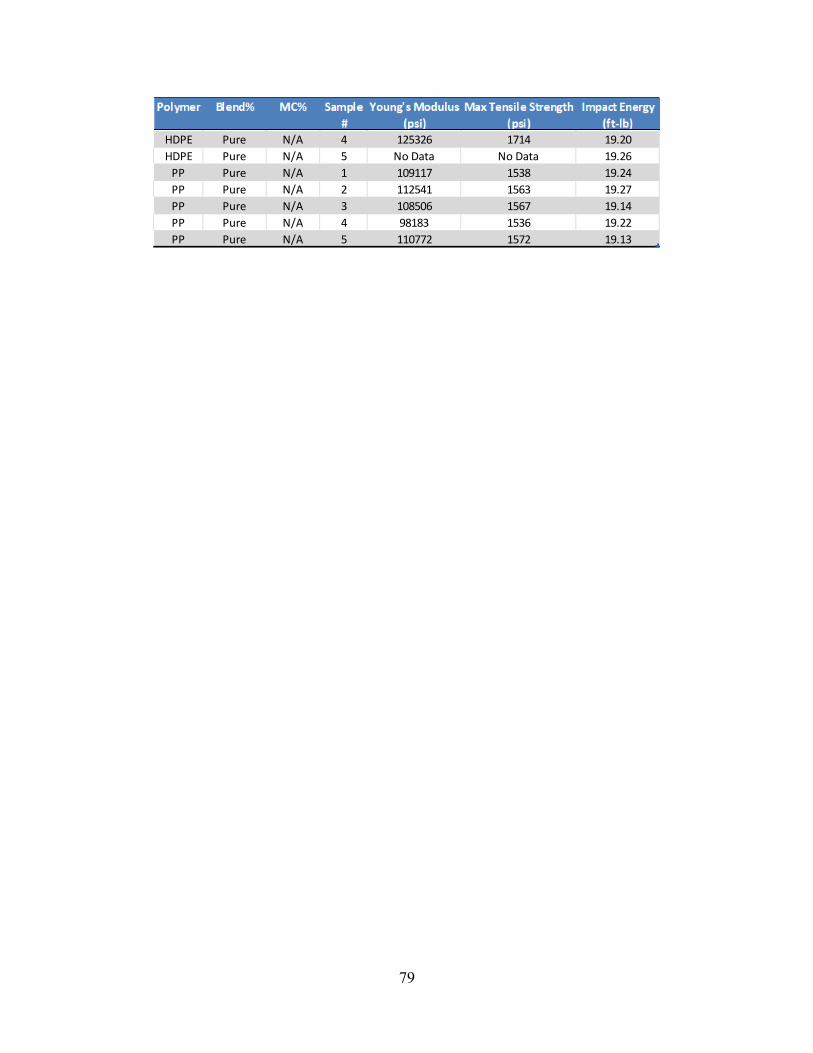
79
HDPE Pure N/A 4 125326 1714 19.20HDPE Pure N/A 5 No Data No Data 19.26
PP Pure N/A 1 109117 1538 19.24PP Pure N/A 2 112541 1563 19.27PP Pure N/A 3 108506 1567 19.14PP Pure N/A 4 98183 1536 19.22PP Pure N/A 5 110772 1572 19.13
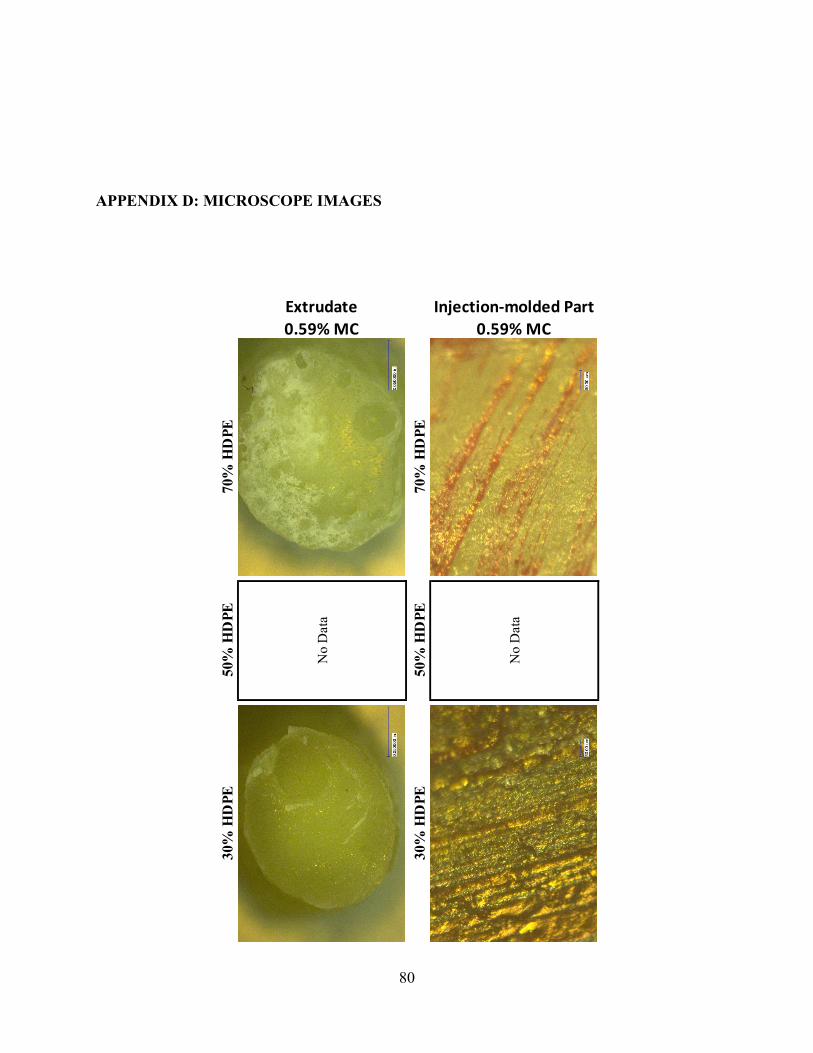
80
APPENDIX D: MICROSCOPE IMAGES
No
Dat
a
0.59% MCInjection-molded Part
30%
HD
PE50
% H
DPE
70%
HD
PE
No
Dat
a0.59% MCExtrudate
30%
HD
PE50
% H
DPE
70%
HD
PE
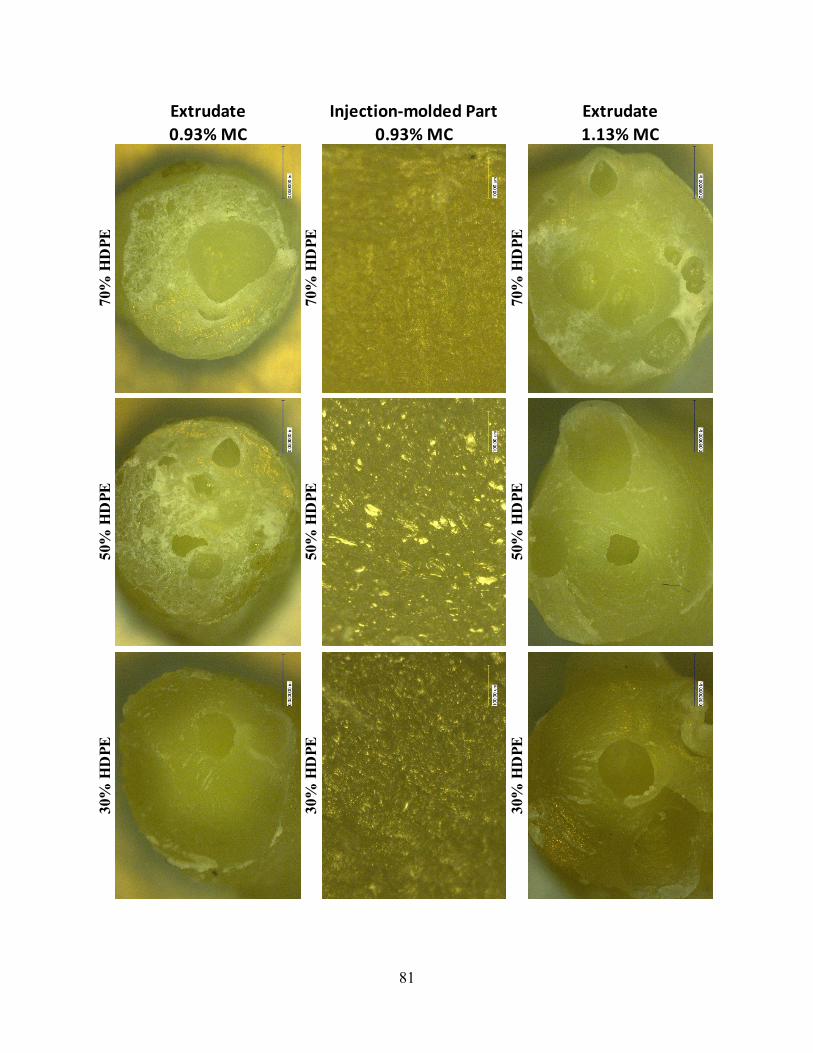
81
Extrudate Injection-molded Part Extrudate0.93% MC 0.93% MC 1.13% MC
30%
HD
PE50
% H
DPE
70%
HD
PE
30%
HD
PE50
% H
DPE
70%
HD
PE
30%
HD
PE50
% H
DPE
70%
HD
PE
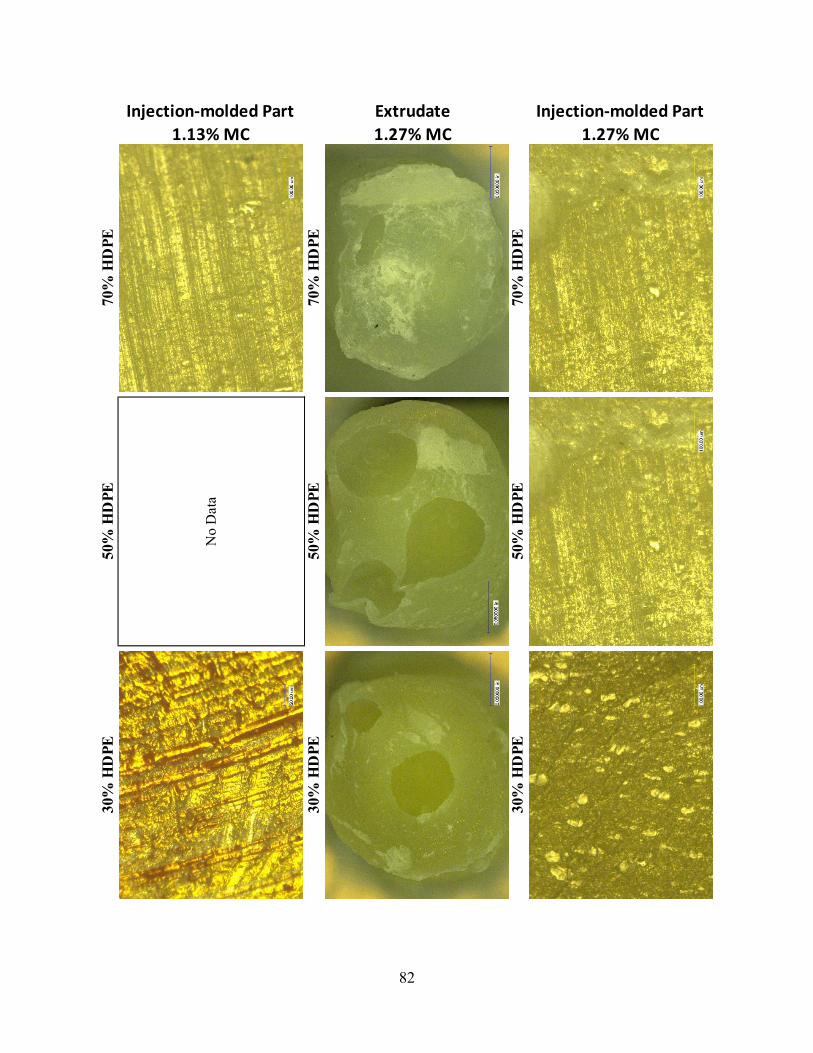
82
Injection-molded Part Extrudate Injection-molded Part1.13% MC 1.27% MC 1.27% MC
No
Dat
a
30%
HD
PE50
% H
DPE
70%
HD
PE
30%
HD
PE50
% H
DPE
70%
HD
PE
30%
HD
PE50
% H
DPE
70%
HD
PE
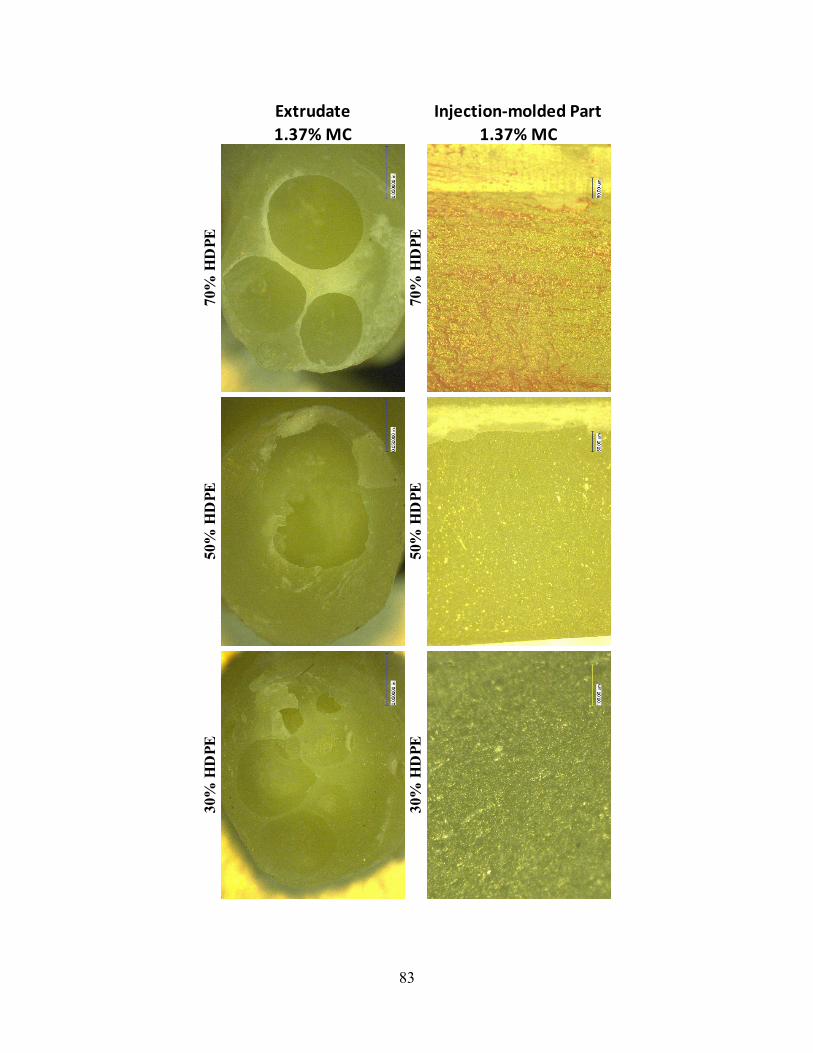
83
Extrudate Injection-molded Part1.37% MC 1.37% MC
30%
HD
PE50
% H
DPE
70%
HD
PE
30%
HD
PE50
% H
DPE
70%
HD
PE
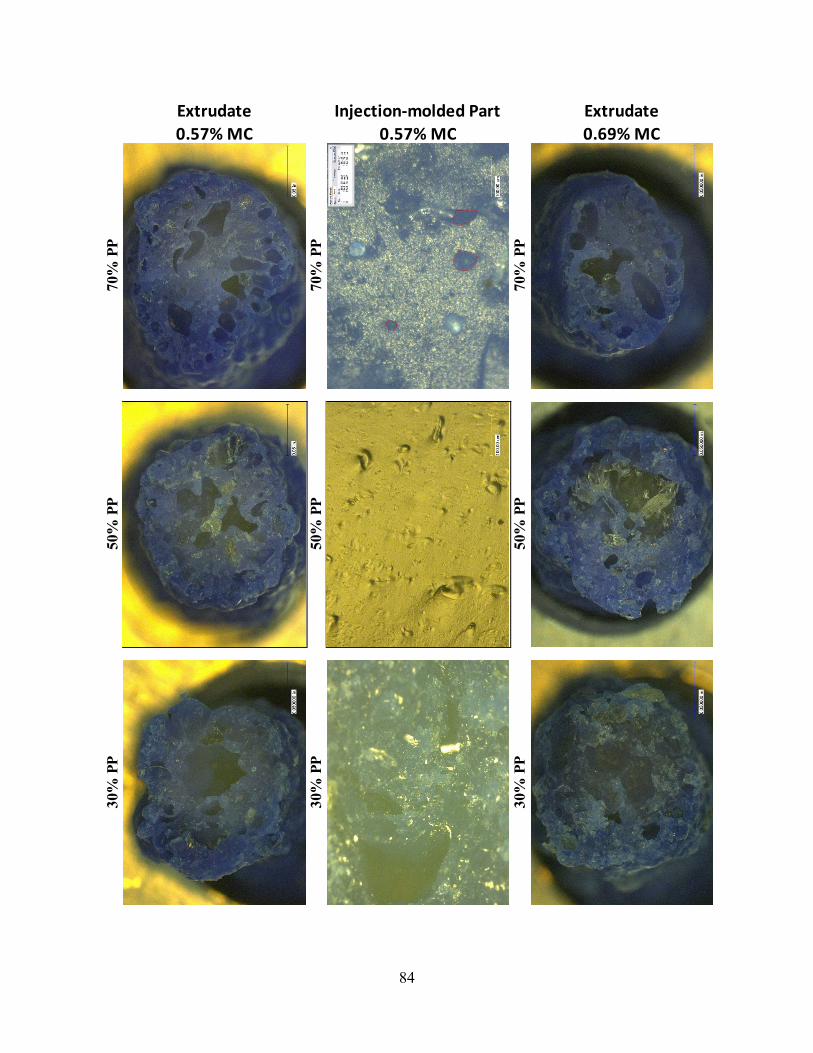
84
Extrudate30
% P
P50
% P
P70
% P
P0.57% MC 0.57% MC 0.69% MCExtrudate Injection-molded Part
30%
PP
50%
PP
70%
PP
30%
PP
50%
PP
70%
PP
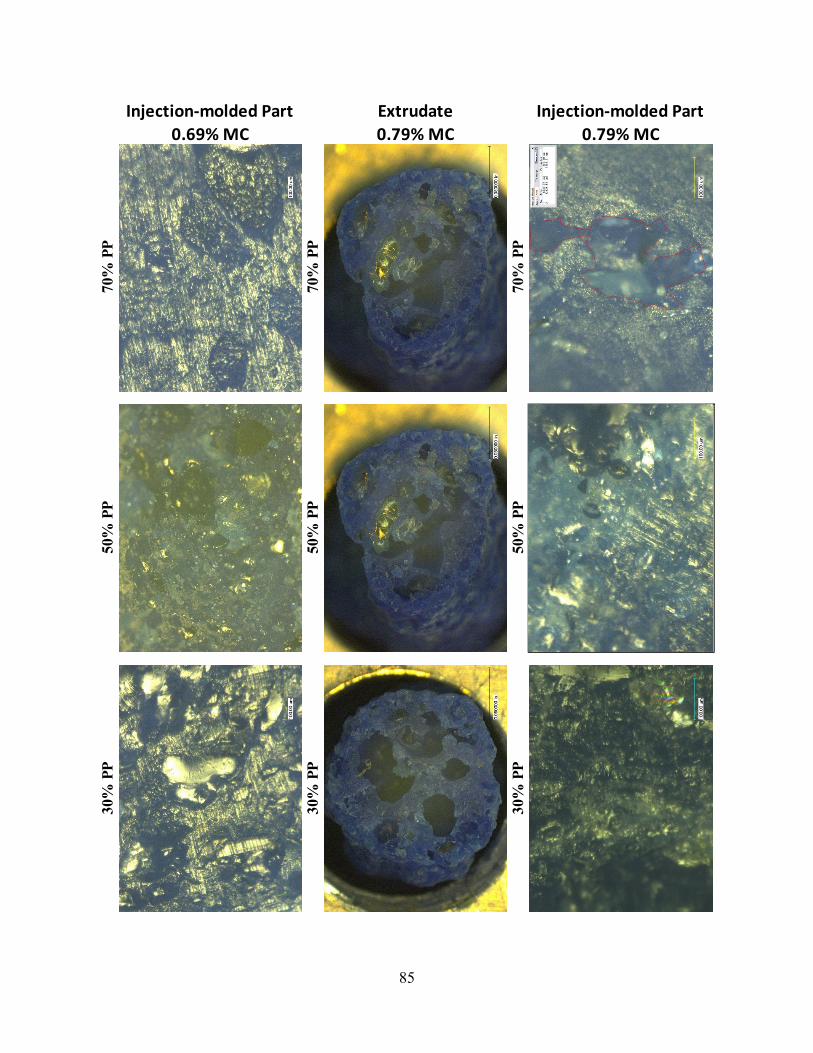
85
Injection-molded Part Extrudate Injection-molded Part30
% P
P50
% P
P
0.69% MC 0.79% MC 0.79% MC70
% P
P
30%
PP
50%
PP
70%
PP
30%
PP
50%
PP
70%
PP
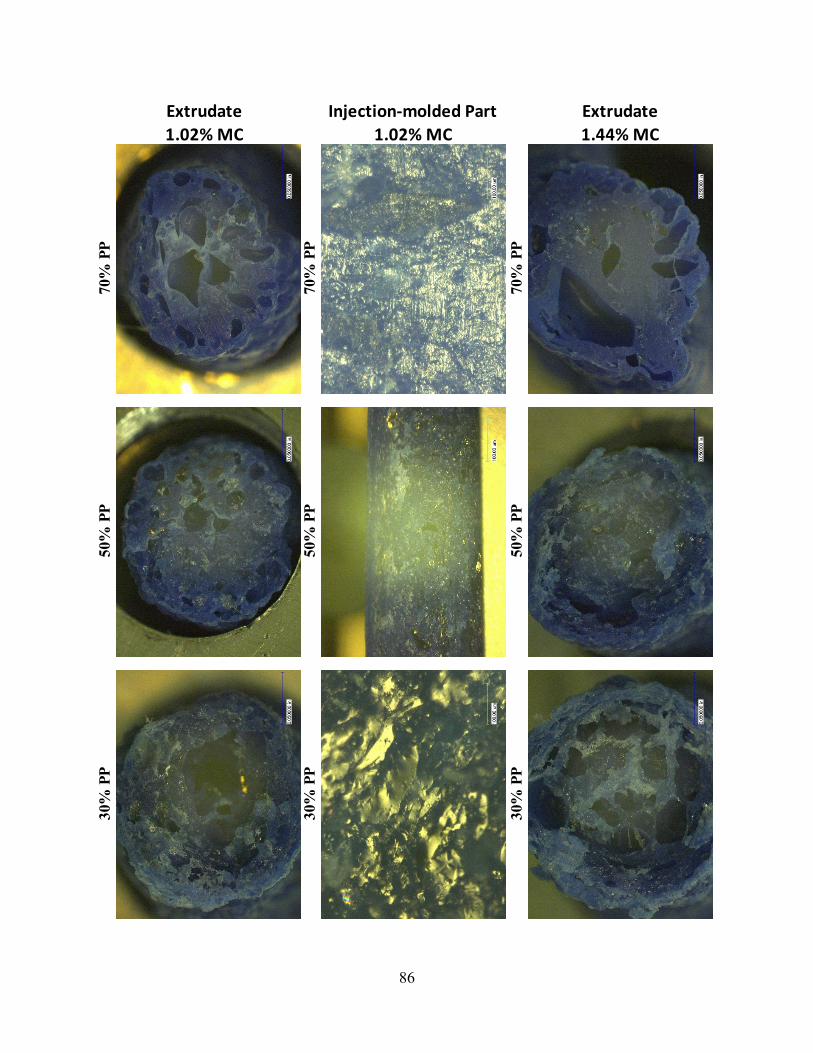
86
Extrudate Injection-molded Part Extrudate30
% P
P50
% P
P
1.02% MC 1.02% MC 1.44% MC
70%
PP
30%
PP
50%
PP
70%
PP
30%
PP
50%
PP
70%
PP
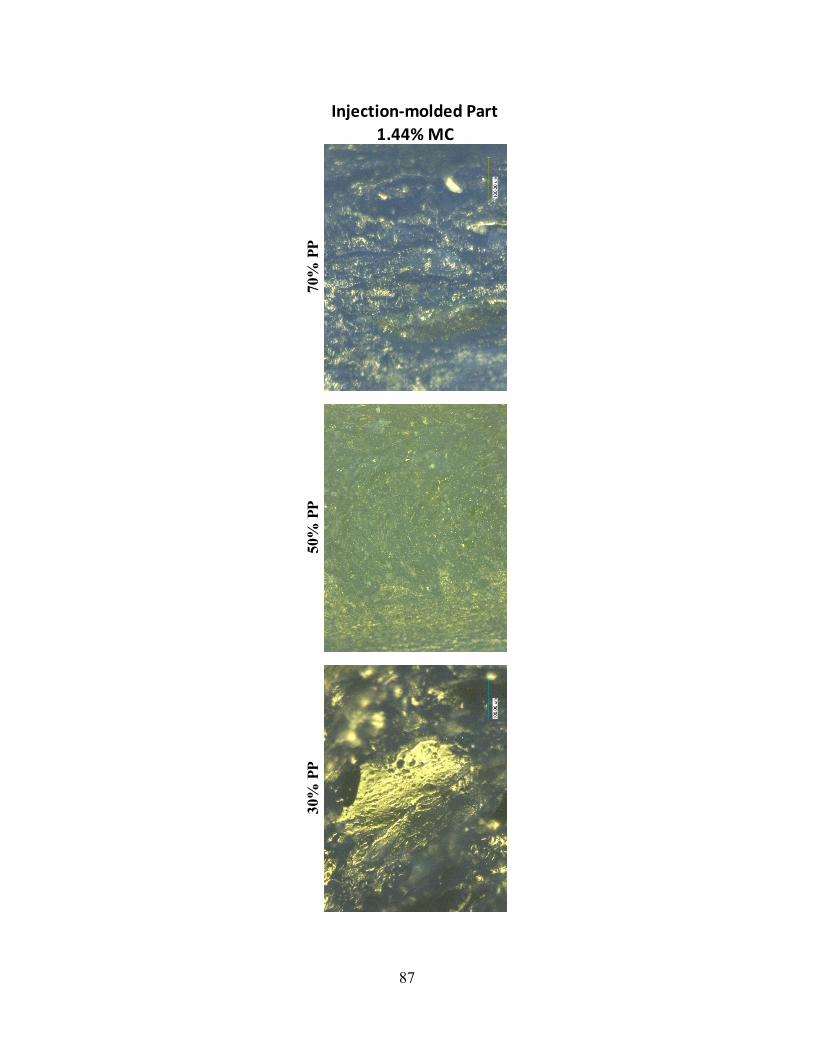
87
Injection-molded Part1.44% MC
30%
PP
50%
PP
70%
PP
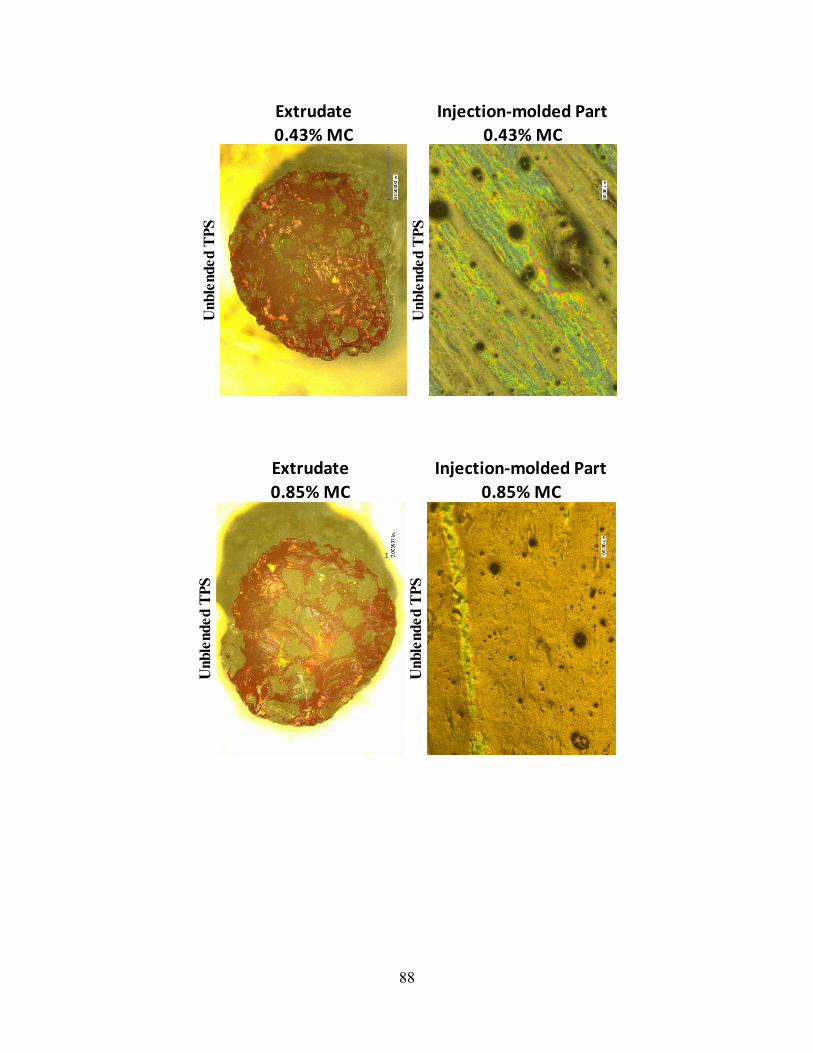
88
Extrudate Injection-molded Part0.43% MC 0.43% MC
Unb
lend
ed T
PS
Unb
lend
ed T
PS
Extrudate Injection-molded Part0.85% MC 0.85% MC
Unb
lend
ed T
PS
Unb
lend
ed T
PS
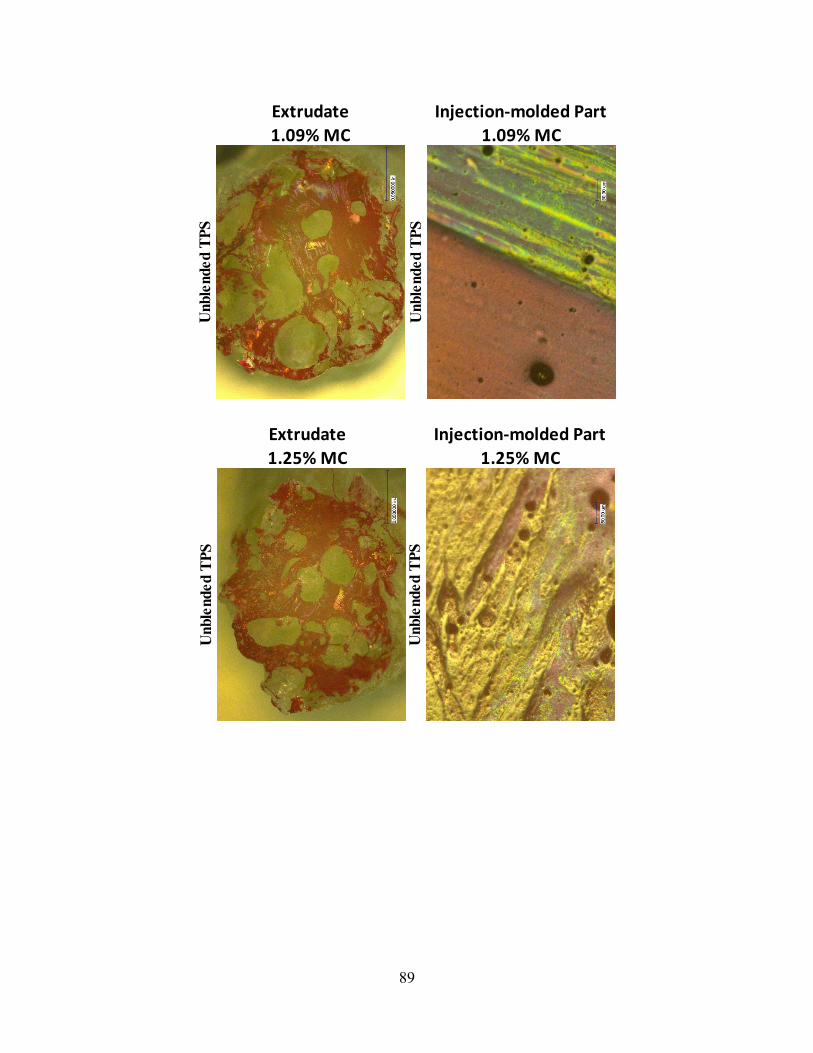
89
Extrudate Injection-molded Part1.09% MC 1.09% MC
Unb
lend
ed T
PS
Unb
lend
ed T
PSExtrudate Injection-molded Part1.25% MC 1.25% MC
Unb
lend
ed T
PS
Unb
lend
ed T
PS
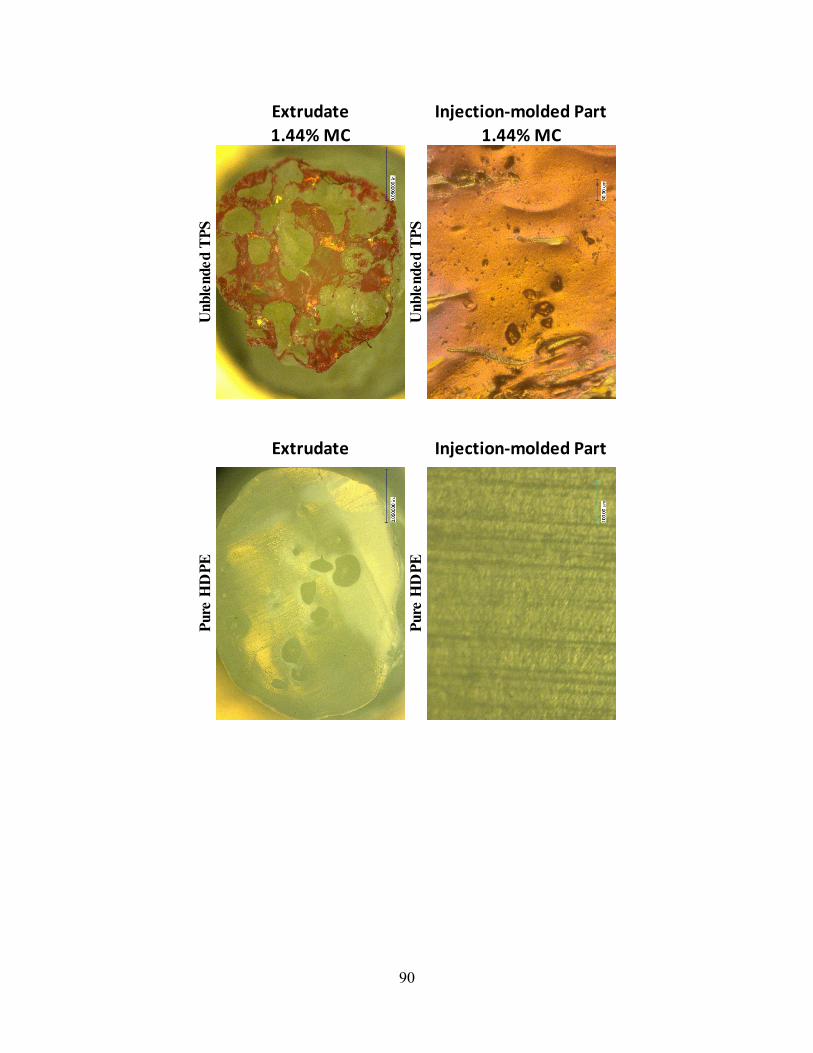
90
Injection-molded PartExtrudate1.44% MC 1.44% MC
Unb
lend
ed T
PS
Unb
lend
ed T
PS
Pure
HD
PE
Pure
HD
PE
Extrudate Injection-molded Part

91
Extrudate Injection-molded Part
Pure
PP
Pure
PP
0.85
% M
C0.
85%
MC
Unblended TPS
Unblended TPS
Extr
udat
eIn
ject
ion-
mol
ded
Part
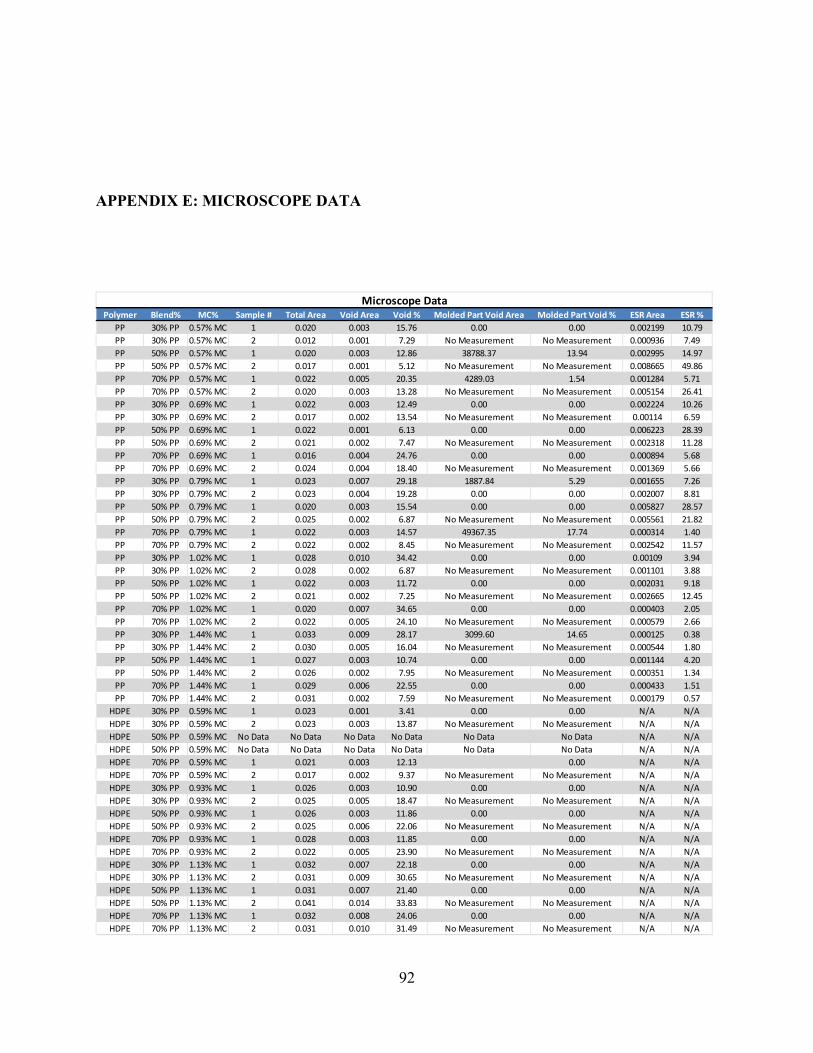
92
APPENDIX E: MICROSCOPE DATA
Polymer Blend% MC% Sample # Total Area Void Area Void % Molded Part Void Area Molded Part Void % ESR Area ESR %PP 30% PP 0.57% MC 1 0.020 0.003 15.76 0.00 0.00 0.002199 10.79PP 30% PP 0.57% MC 2 0.012 0.001 7.29 No Measurement No Measurement 0.000936 7.49PP 50% PP 0.57% MC 1 0.020 0.003 12.86 38788.37 13.94 0.002995 14.97PP 50% PP 0.57% MC 2 0.017 0.001 5.12 No Measurement No Measurement 0.008665 49.86PP 70% PP 0.57% MC 1 0.022 0.005 20.35 4289.03 1.54 0.001284 5.71PP 70% PP 0.57% MC 2 0.020 0.003 13.28 No Measurement No Measurement 0.005154 26.41PP 30% PP 0.69% MC 1 0.022 0.003 12.49 0.00 0.00 0.002224 10.26PP 30% PP 0.69% MC 2 0.017 0.002 13.54 No Measurement No Measurement 0.00114 6.59PP 50% PP 0.69% MC 1 0.022 0.001 6.13 0.00 0.00 0.006223 28.39PP 50% PP 0.69% MC 2 0.021 0.002 7.47 No Measurement No Measurement 0.002318 11.28PP 70% PP 0.69% MC 1 0.016 0.004 24.76 0.00 0.00 0.000894 5.68PP 70% PP 0.69% MC 2 0.024 0.004 18.40 No Measurement No Measurement 0.001369 5.66PP 30% PP 0.79% MC 1 0.023 0.007 29.18 1887.84 5.29 0.001655 7.26PP 30% PP 0.79% MC 2 0.023 0.004 19.28 0.00 0.00 0.002007 8.81PP 50% PP 0.79% MC 1 0.020 0.003 15.54 0.00 0.00 0.005827 28.57PP 50% PP 0.79% MC 2 0.025 0.002 6.87 No Measurement No Measurement 0.005561 21.82PP 70% PP 0.79% MC 1 0.022 0.003 14.57 49367.35 17.74 0.000314 1.40PP 70% PP 0.79% MC 2 0.022 0.002 8.45 No Measurement No Measurement 0.002542 11.57PP 30% PP 1.02% MC 1 0.028 0.010 34.42 0.00 0.00 0.00109 3.94PP 30% PP 1.02% MC 2 0.028 0.002 6.87 No Measurement No Measurement 0.001101 3.88PP 50% PP 1.02% MC 1 0.022 0.003 11.72 0.00 0.00 0.002031 9.18PP 50% PP 1.02% MC 2 0.021 0.002 7.25 No Measurement No Measurement 0.002665 12.45PP 70% PP 1.02% MC 1 0.020 0.007 34.65 0.00 0.00 0.000403 2.05PP 70% PP 1.02% MC 2 0.022 0.005 24.10 No Measurement No Measurement 0.000579 2.66PP 30% PP 1.44% MC 1 0.033 0.009 28.17 3099.60 14.65 0.000125 0.38PP 30% PP 1.44% MC 2 0.030 0.005 16.04 No Measurement No Measurement 0.000544 1.80PP 50% PP 1.44% MC 1 0.027 0.003 10.74 0.00 0.00 0.001144 4.20PP 50% PP 1.44% MC 2 0.026 0.002 7.95 No Measurement No Measurement 0.000351 1.34PP 70% PP 1.44% MC 1 0.029 0.006 22.55 0.00 0.00 0.000433 1.51PP 70% PP 1.44% MC 2 0.031 0.002 7.59 No Measurement No Measurement 0.000179 0.57
HDPE 30% PP 0.59% MC 1 0.023 0.001 3.41 0.00 0.00 N/A N/AHDPE 30% PP 0.59% MC 2 0.023 0.003 13.87 No Measurement No Measurement N/A N/AHDPE 50% PP 0.59% MC No Data No Data No Data No Data No Data No Data N/A N/AHDPE 50% PP 0.59% MC No Data No Data No Data No Data No Data No Data N/A N/AHDPE 70% PP 0.59% MC 1 0.021 0.003 12.13 0.00 N/A N/AHDPE 70% PP 0.59% MC 2 0.017 0.002 9.37 No Measurement No Measurement N/A N/AHDPE 30% PP 0.93% MC 1 0.026 0.003 10.90 0.00 0.00 N/A N/AHDPE 30% PP 0.93% MC 2 0.025 0.005 18.47 No Measurement No Measurement N/A N/AHDPE 50% PP 0.93% MC 1 0.026 0.003 11.86 0.00 0.00 N/A N/AHDPE 50% PP 0.93% MC 2 0.025 0.006 22.06 No Measurement No Measurement N/A N/AHDPE 70% PP 0.93% MC 1 0.028 0.003 11.85 0.00 0.00 N/A N/AHDPE 70% PP 0.93% MC 2 0.022 0.005 23.90 No Measurement No Measurement N/A N/AHDPE 30% PP 1.13% MC 1 0.032 0.007 22.18 0.00 0.00 N/A N/AHDPE 30% PP 1.13% MC 2 0.031 0.009 30.65 No Measurement No Measurement N/A N/AHDPE 50% PP 1.13% MC 1 0.031 0.007 21.40 0.00 0.00 N/A N/AHDPE 50% PP 1.13% MC 2 0.041 0.014 33.83 No Measurement No Measurement N/A N/AHDPE 70% PP 1.13% MC 1 0.032 0.008 24.06 0.00 0.00 N/A N/AHDPE 70% PP 1.13% MC 2 0.031 0.010 31.49 No Measurement No Measurement N/A N/A
Microscope Data
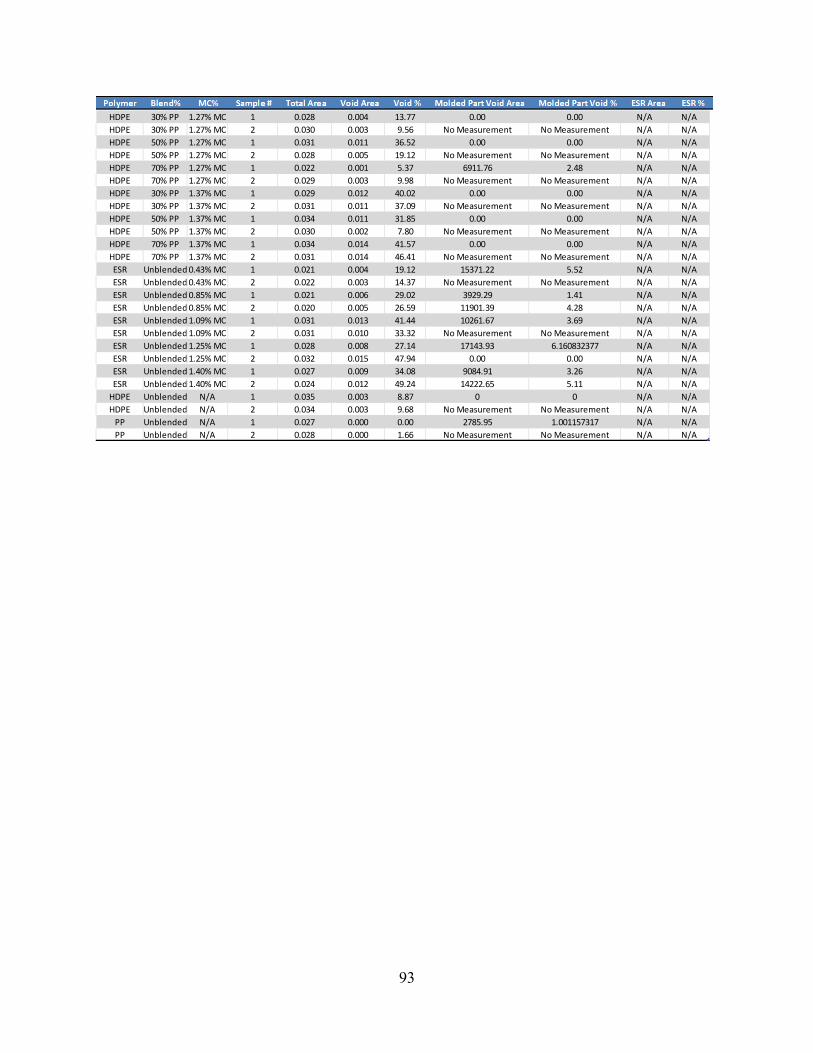
93
HDPE 30% PP 1.27% MC 1 0.028 0.004 13.77 0.00 0.00 N/A N/AHDPE 30% PP 1.27% MC 2 0.030 0.003 9.56 No Measurement No Measurement N/A N/AHDPE 50% PP 1.27% MC 1 0.031 0.011 36.52 0.00 0.00 N/A N/AHDPE 50% PP 1.27% MC 2 0.028 0.005 19.12 No Measurement No Measurement N/A N/AHDPE 70% PP 1.27% MC 1 0.022 0.001 5.37 6911.76 2.48 N/A N/AHDPE 70% PP 1.27% MC 2 0.029 0.003 9.98 No Measurement No Measurement N/A N/AHDPE 30% PP 1.37% MC 1 0.029 0.012 40.02 0.00 0.00 N/A N/AHDPE 30% PP 1.37% MC 2 0.031 0.011 37.09 No Measurement No Measurement N/A N/AHDPE 50% PP 1.37% MC 1 0.034 0.011 31.85 0.00 0.00 N/A N/AHDPE 50% PP 1.37% MC 2 0.030 0.002 7.80 No Measurement No Measurement N/A N/AHDPE 70% PP 1.37% MC 1 0.034 0.014 41.57 0.00 0.00 N/A N/AHDPE 70% PP 1.37% MC 2 0.031 0.014 46.41 No Measurement No Measurement N/A N/AESR Unblended 0.43% MC 1 0.021 0.004 19.12 15371.22 5.52 N/A N/AESR Unblended 0.43% MC 2 0.022 0.003 14.37 No Measurement No Measurement N/A N/AESR Unblended 0.85% MC 1 0.021 0.006 29.02 3929.29 1.41 N/A N/AESR Unblended 0.85% MC 2 0.020 0.005 26.59 11901.39 4.28 N/A N/AESR Unblended 1.09% MC 1 0.031 0.013 41.44 10261.67 3.69 N/A N/AESR Unblended 1.09% MC 2 0.031 0.010 33.32 No Measurement No Measurement N/A N/AESR Unblended 1.25% MC 1 0.028 0.008 27.14 17143.93 6.160832377 N/A N/AESR Unblended 1.25% MC 2 0.032 0.015 47.94 0.00 0.00 N/A N/AESR Unblended 1.40% MC 1 0.027 0.009 34.08 9084.91 3.26 N/A N/AESR Unblended 1.40% MC 2 0.024 0.012 49.24 14222.65 5.11 N/A N/A
HDPE Unblended N/A 1 0.035 0.003 8.87 0 0 N/A N/AHDPE Unblended N/A 2 0.034 0.003 9.68 No Measurement No Measurement N/A N/A
PP Unblended N/A 1 0.027 0.000 0.00 2785.95 1.001157317 N/A N/APP Unblended N/A 2 0.028 0.000 1.66 No Measurement No Measurement N/A N/A
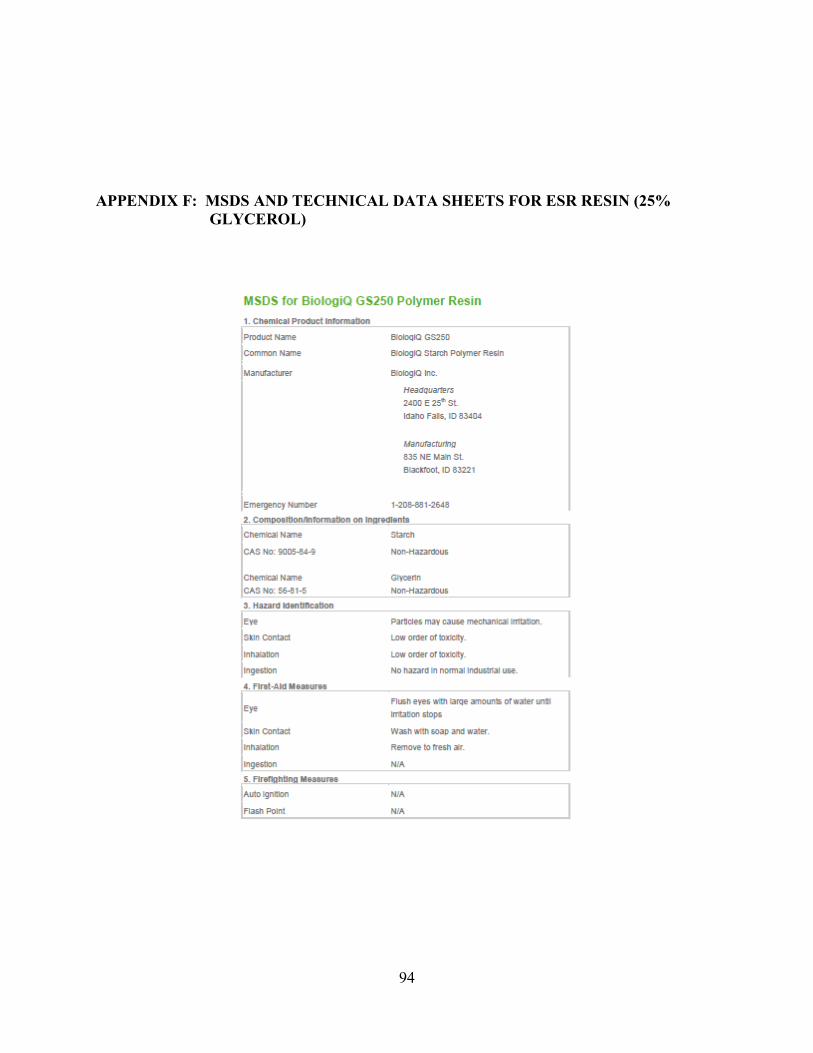
94
APPENDIX F: MSDS AND TECHNICAL DATA SHEETS FOR ESR RESIN (25% GLYCEROL)
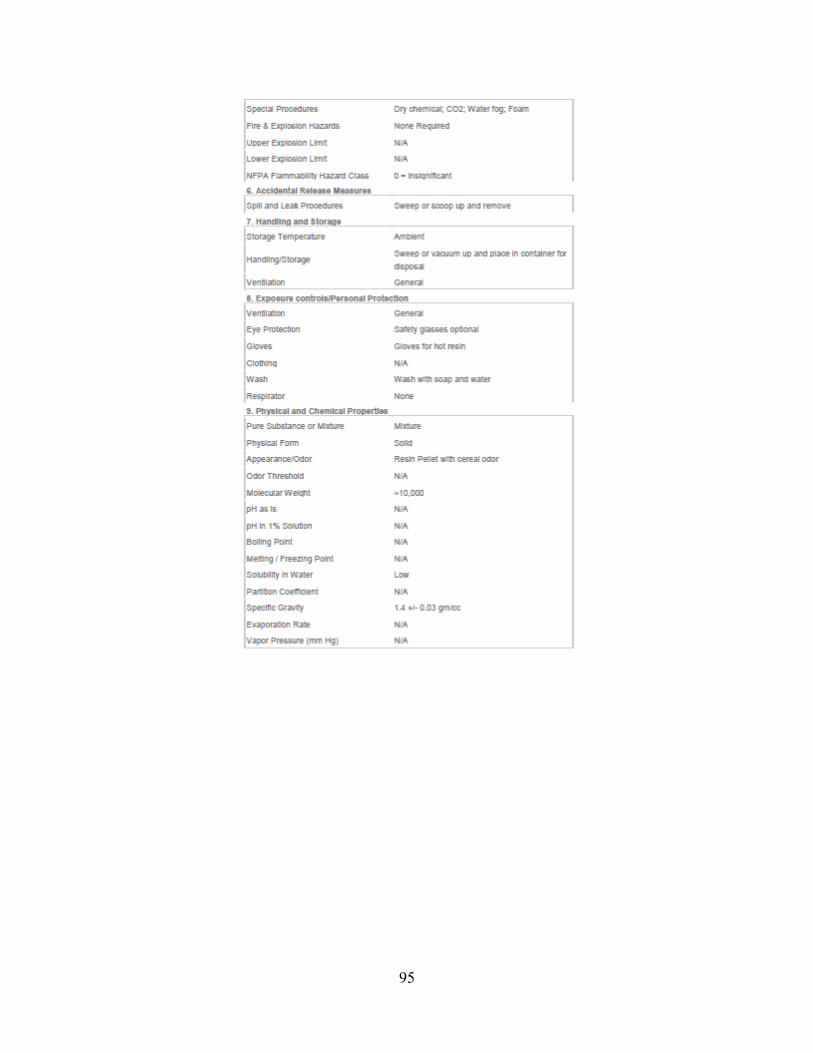
95
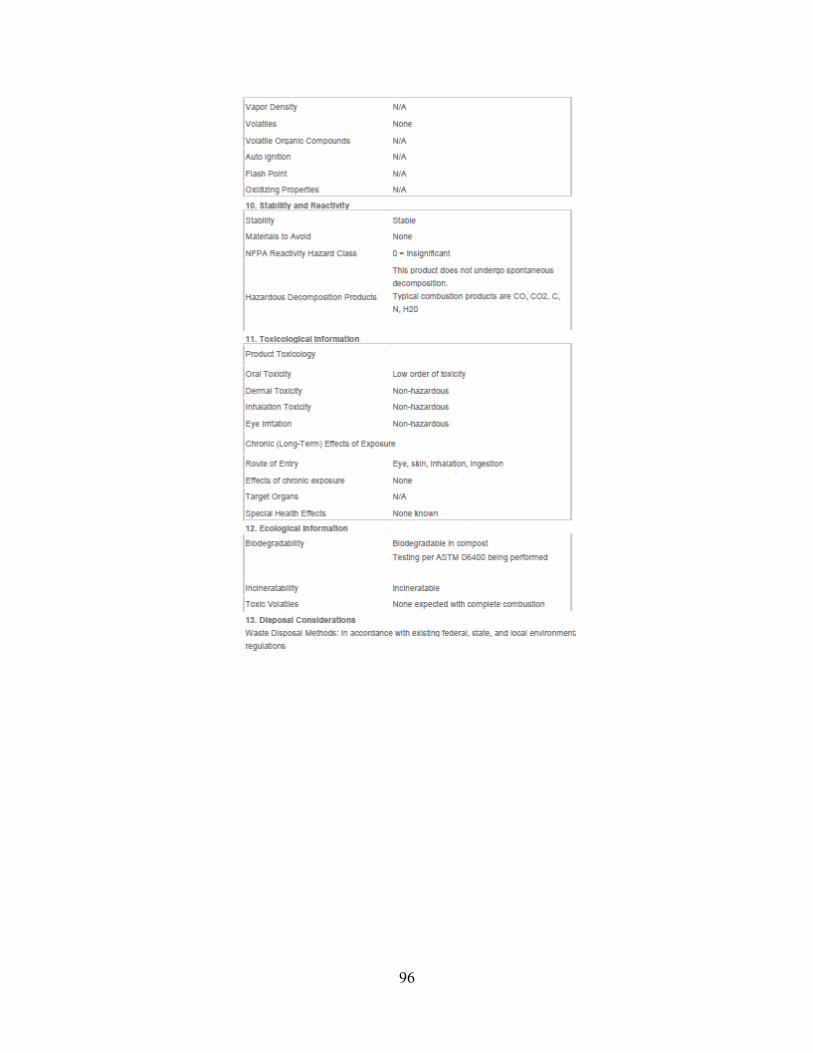
96
97

98