star ceramic survey
TRANSCRIPT
8/10/2019 Star Ceramic Survey
http://slidepdf.com/reader/full/star-ceramic-survey 1/38
1
1.
Scope of the Study:
This report is about the Measurement of Customer loyalty of Star Ceramic LTD. The focus of
this report is mainly on the Customer loyalty of Star Ceramic LTD.
2.
Literature Review:
Customer’s loyalty has been defined in very much similar ways by most of the researchers. They
have said that it is comprised of customers’ attitudes and behaviors. Components of attitude are
represented through repurchase intention, purchasing additional products or services from the
same company, willingness to recommend the company to others, demonstration of commitment
to the company by resisting to switch to another competitor (Cronin & Taylor, 1992; Prus&
Brandt, 1995; Narayandas, 1996; Pearson 1996; Gremler& Brown, 1996 cited in Dhandabani,
2010 and Thakur, 2011), and willingness to pay a price premium (Zeithaml, Berry,
&Parasuraman, 1996 cited in Thakur, 2011). Alternatively the behavioral aspect represents
actual performing according to the loyal attitude (Feick, Lee, & Lee, 2001 cited in Thakur,
2011). It is actually a feeling of commitment of the consumer to a product, brand, marketer, or
services above and beyond that for the competitors in the market place, which results in repeat
purchase (Szymigin and Carrigan, 2001 cited in Thakur, 2011). On the other hand, according to
Bloemer& Kasper (1995) cited in Mosahab, et al. (2010) loyalty is interpreted as true loyalty
rather than repeat purchasing behavior, which is the actual re-buying of a brand, regardless of
commitment because customers, who are not loyal, can also demonstrate repurchasing behavior.
This may be due to switching costs, lack of perceived differentiation of alternatives, location
constraints on choice, time or money constraints, habit or inertia which are not related to loyalty(Bitner, 1990; Ennew&Binks, 1996 cited in Kheng, 2010).
High service quality often leads to favorable behavioral intention (Burton et al., 2003 cited in
Dhandabani, 2010). But loyalty is driven by satisfaction predominantly (Rust et al., 1995 cited in
Dhandabani, 2010) and therefore customer’s satisfaction measurements give a better indication
8/10/2019 Star Ceramic Survey
http://slidepdf.com/reader/full/star-ceramic-survey 2/38
2
of future performance of service firms (Anderson and Fornell, 1999 cited in Dhandabani, 2010).
In case of service arena, loyalty is often termed as “observed behaviors” (Bloemer et al., 1999
cited in Mosahab, et al., 2010). Caruana (2002) cited in Mosahab, et al. (2010) opined behavior
as a full expression of loyalty to the brand and not just judgment. An operational definition often
refers to the first product or service which comes to the mind of a person, while making decision
for purchase. Meanwhile, Ostrowski et al. (1993) and Bloemer (1999) cited in Mosahab, et al.
(2010) refer it to the first product or service that a person chooses among products and services.
3. Objectives of the Study:
Broad Objective: The broad objective of this report is “Evaluation of Customer Loyalty of
Star ceramic ltd
Specific Objectives: The specific objectives of my internship report are given below:
To determine the level of loyalty of customer at Star ceramic ltd
COMPANYLtd.
To bring out the problems that customer faces.
To know how Star ceramic ltd. ensures the required service to the
customers.
4. Methodology:
Information was collected from both primary and secondary sources. The secondary sources are
Internet, Statistical report & Company annual report.
For collecting primary information from the customer a questionnaire was used.
Both primary and secondary data sources are used for completing this report.
8/10/2019 Star Ceramic Survey
http://slidepdf.com/reader/full/star-ceramic-survey 3/38
3
Primary Sources:
Questionnaire
Secondary Sources:
Relevant books, newspapers, journals etc.
Star ceramic ltd published documents
Office circular and COMPANYexecutives
Web sites:-
www.starceramic.com/
www.customer loyalty.com
www.aiblannualreport.com
8/10/2019 Star Ceramic Survey
http://slidepdf.com/reader/full/star-ceramic-survey 4/38
4
Chapter -3
Analysis and Discussion
CHAPTER-3: ANALYSIS AND DISCUSSION

8/10/2019 Star Ceramic Survey
http://slidepdf.com/reader/full/star-ceramic-survey 5/38
5
Respondents Age:
20-30 years 16 53.33%
31-40 years 8 26.66%
41-50 years 5 16.66%
Above 50 years 1 3.33%
Total Respondents 30 100%
Figure: Respondents Age
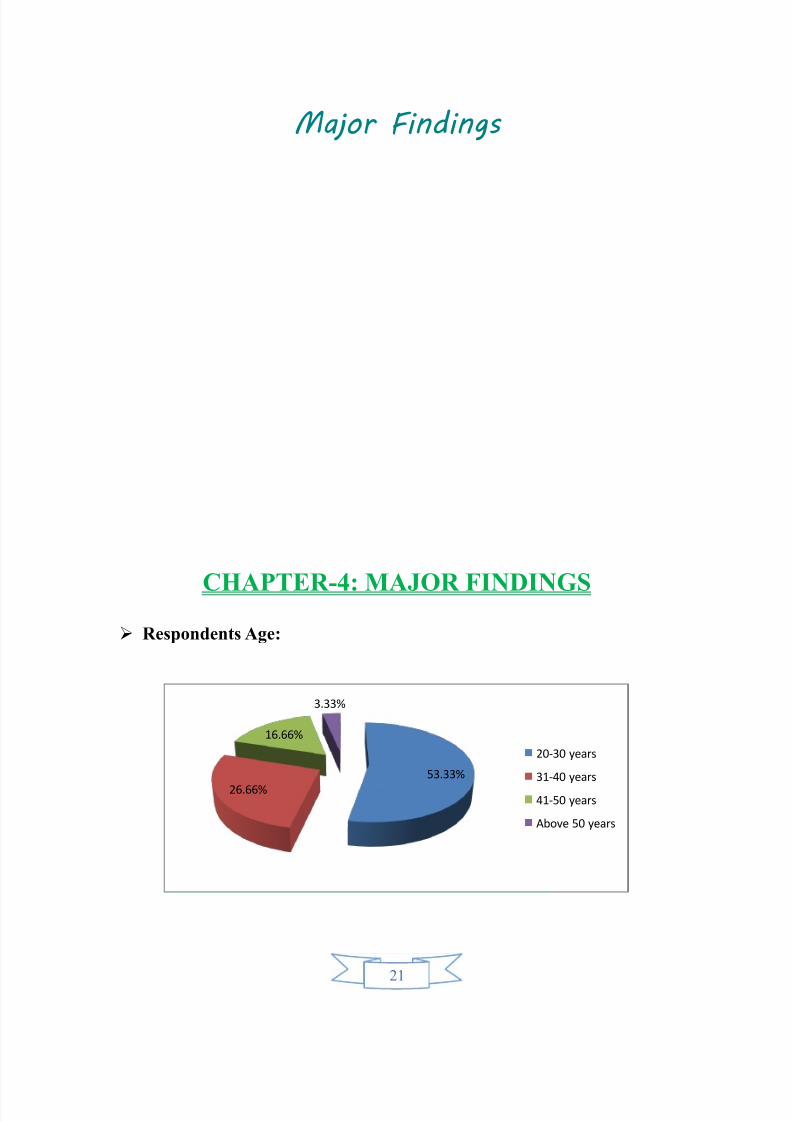
In the above figure, 53.33% respondents are 20-30 years old, 26.66% respondents are 31-40
years old, 16.66% respondents are 41-50 years old and 3.33% respondents are above 50 years
old. So, maximum customer’s ages are 20-30 years.
53.33%
26.66%
16.66%
3.33%
20-30 years
31-40 years
41-50 years
Above 50 years
8/10/2019 Star Ceramic Survey
http://slidepdf.com/reader/full/star-ceramic-survey 6/38
6
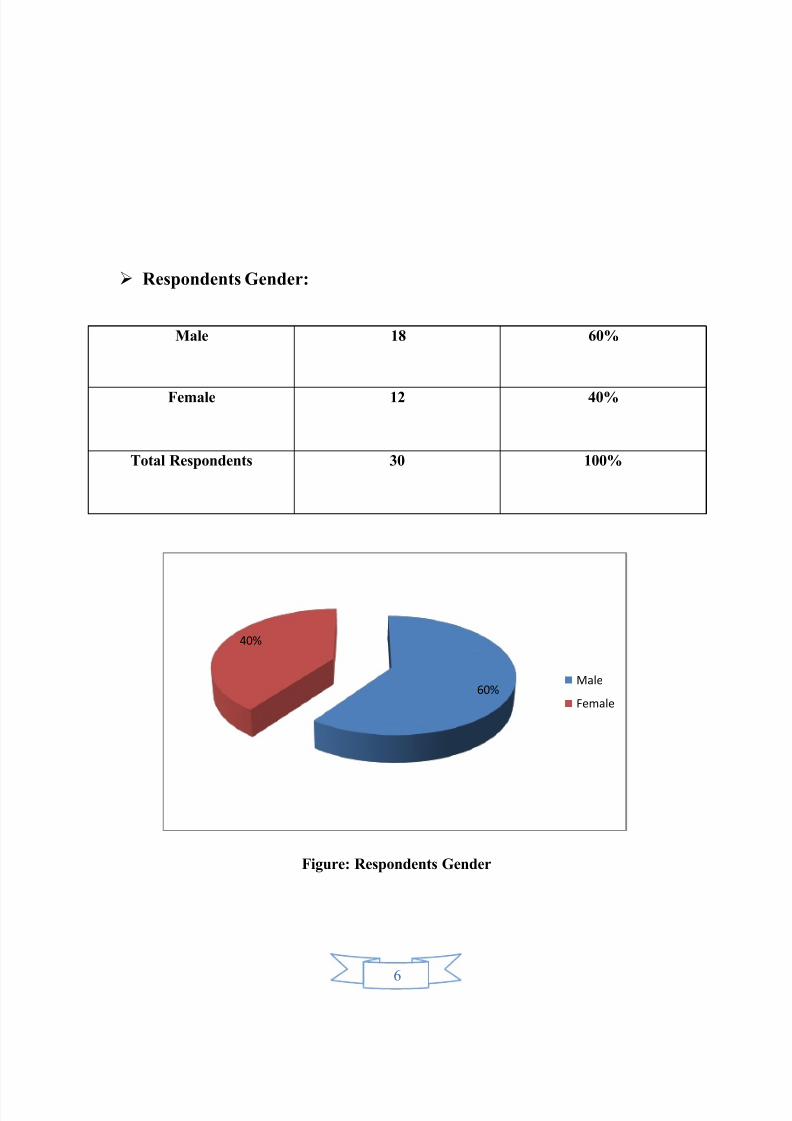
Respondents Gender:
Male 18 60%
Female 12 40%
Total Respondents 30 100%
Figure: Respondents Gender
60%
40%
Male
Female
8/10/2019 Star Ceramic Survey
http://slidepdf.com/reader/full/star-ceramic-survey 7/38
7
In this above figure, 60% respondents are male and 40% respondents are female. So, maximum
customers are male persons.
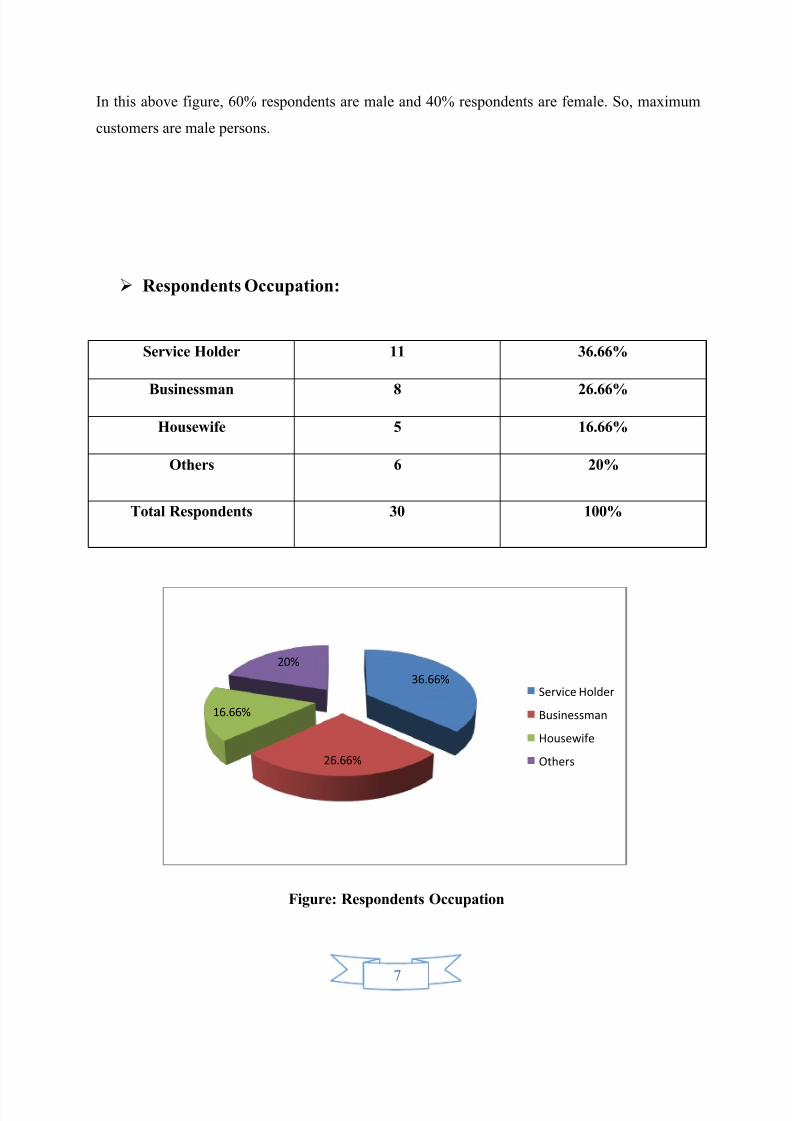
Respondents Occupation:
Service Holder 11 36.66%
Businessman 8 26.66%
Housewife 5 16.66%
Others 6 20%
Total Respondents 30 100%
Figure: Respondents Occupation
36.66%
26.66%
16.66%
20%
Service Holder
Businessman
Housewife
Others

8/10/2019 Star Ceramic Survey
http://slidepdf.com/reader/full/star-ceramic-survey 8/38
8
In this above figure, 36.66% respondents are service holder, 26.66% respondents are
businessman, 16.66% respondents are housewife and 20% respondent’s occupations are
different.
Q: 1 How professional is our company?
Extremely professional 6 20%
Very professional 10 33.33%
Moderately professional 7 23.33%Slightly professional 4 13.33%
Not at all professional 3 10%
Total Respondents 30 100%
Figure: Professional
In this above figure, 33.33% respondents say that our COMPANYis very professional, 23.33%
respondents say that our COMPANYis moderately professional, 20% respondents say that our
20%
33.33%23.33%
13.33%
10%Extremely professional
Very professional
Moderately professional
Slightly professional
Not at all professional
8/10/2019 Star Ceramic Survey
http://slidepdf.com/reader/full/star-ceramic-survey 9/38
9
COMPANYis extremely professional, 13.33% respondents say that our COMPANYis slightly
professional and 10% respondents say that our COMPANYis not at all professional.
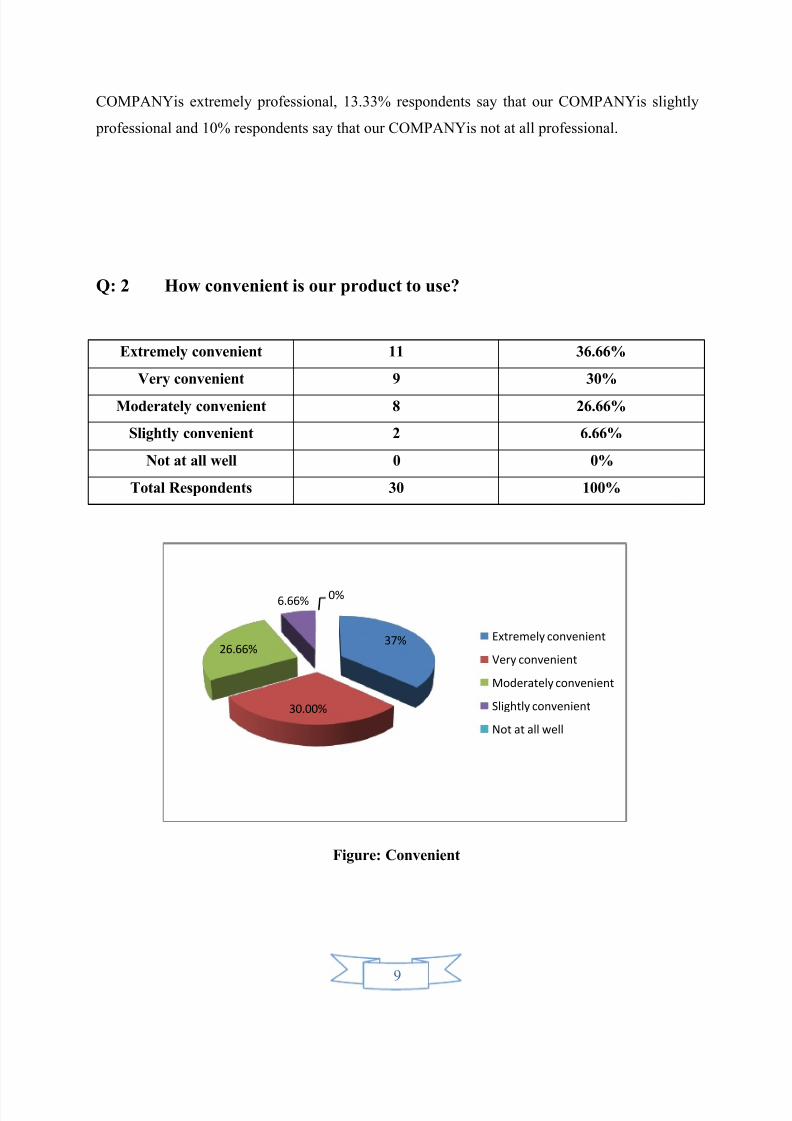
Q: 2 How convenient is our product to use?
Extremely convenient 11 36.66%
Very convenient 9 30%
Moderately convenient 8 26.66%
Slightly convenient 2 6.66%
Not at all well 0 0%
Total Respondents 30 100%
Figure: Convenient
37%
30.00%
26.66%
6.66%0%
Extremely convenient
Very convenient
Moderately convenient
Slightly convenient
Not at all well

8/10/2019 Star Ceramic Survey
http://slidepdf.com/reader/full/star-ceramic-survey 10/38
10
In this above figure, 36.66% respondents say that our COMPANYis extremely convenient, 30%
respondents say that our COMPANYis very convenient, 26.66% respondents say that our
COMPANYis moderately convenient and 6.66% respondents say that our COMPANYis slightly
convenient. Most of the respondents say our COMPANYis extremely convenient because if we
compare with other Companys then we find that our COMPANYgive many facility to the
customer which are very good for attracting the customer.
Q: 3 How well do you feel that our company your need?
Extremely well 7 23.33%
Quite well 12 40%
Moderately well 6 20%
Slightly well 3 10%
Not at all well 2 6.66%
Total Respondents 30 100%
Figure: Identify Need
23%
40.00%
20.00%
10.00%7%
Extremely well
Quite well
Moderately well
Slightly well
Not at all well

8/10/2019 Star Ceramic Survey
http://slidepdf.com/reader/full/star-ceramic-survey 11/38
11
In this above figure, 40% respondents say that our COMPANYidentifies their need quite well,
23.33% respondents say that our COMPANYidentifies their need extremely well, 20%
respondents say that our COMPANYidentifies their need moderately well, 10% respondents say
that our COMPANYidentifies their need slightly well and 6.66% respondents say that our
COMPANYidentifies their need not at all well. So, I can say, our COMPANYis able to identify
the customer needs.
Q: 4 Compared to our competitors, is our service quality better, worse or
about the same?
A great deal better 5 16.66%
Somewhat better 4 13.33%
About the same 8 26.66%
Somewhat worse 13 43.33%
A great deal worse 0 0%
Total Respondents 30 100%
17%
13.33%
26.66%
43.33%
0%
A great deal better
Somewhat better
About the same
Somewhat worse
A great deal worse
8/10/2019 Star Ceramic Survey
http://slidepdf.com/reader/full/star-ceramic-survey 12/38
12
Figure: Service Quality
In this above figure, 43.33% respondents say that our Company’s service quality is somewhat
worse than other competitors, 26.66% respondents say that our Company’s service quality is
about the same to others, 16.66% respondents say that our Company’s service quality is a great
deal better and 13.33% respondents say that our Company’s service quality is somewhat better.
Here, maximum customers are not satisfied with our service quality compared with other
competitors. So, we have to improve our service quality.
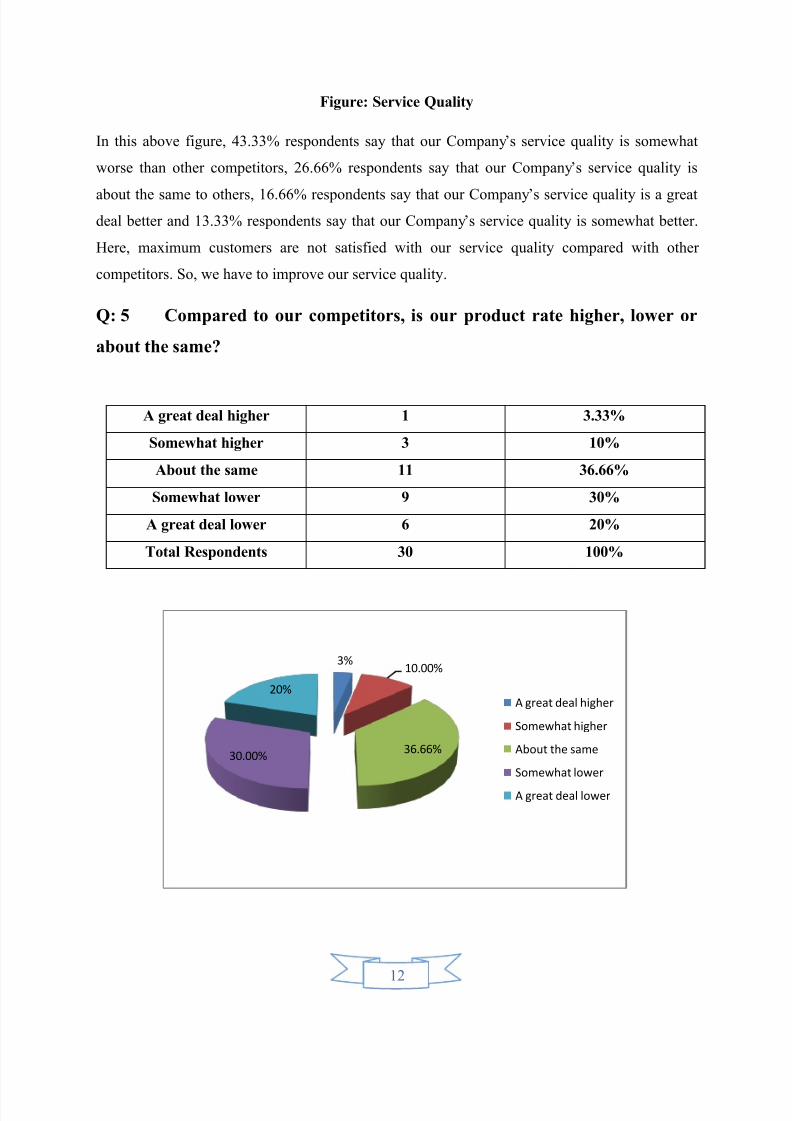
Q: 5 Compared to our competitors, is our product rate higher, lower or
about the same?
A great deal higher 1 3.33%
Somewhat higher 3 10%
About the same 11 36.66%
Somewhat lower 9 30%
A great deal lower 6 20%
Total Respondents 30 100%
3%10.00%
36.66%30.00%
20%A great deal higher
Somewhat higher
About the same
Somewhat lower
A great deal lower

8/10/2019 Star Ceramic Survey
http://slidepdf.com/reader/full/star-ceramic-survey 13/38
13
Figure: Interest Rate
Q: 6 Overall, how responsive have we been to your questions or concerns
about our service?
Extremely responsive 3 10%
Quite responsive 9 30%
Moderately responsive 10 33.33%
Slightly responsive 6 20%
Not at all responsive 2 6.66%
Total Respondents 30 100%
10%
30.00%
33.33%
20.00%
7%Extremely responsive
Quite responsive
Moderately responsive
Slightly responsive
Not at all responsive

8/10/2019 Star Ceramic Survey
http://slidepdf.com/reader/full/star-ceramic-survey 14/38
14
Figure: Responsiveness
In this above figure, 33.33% respondents say that we are moderately responsive, 30%
respondents say that we are quite responsive, 20% respondents say that we are slightly
responsive, 10% respondents say that we are extremely responsive and 6.66% respondents say
that we are not at all responsive. Here, maximum customers say that we are moderate responsive.
So, we have to give more concern about our service.
Q: 7 Do you like our company neither like it, or dislike it?
Like a great deal 12 40%
Like a little 8 26.66%
Neither like nor dislike 5 16.66%
Dislike a little 4 13.33%
Dislike a great deal 1 3.33%
Total Respondents 30 100%
Figure: Likeliness
40%
26.66%
16.66%
13.33%
3%
Like a great deal
Like a little
Neither like nor dislike
Dislike a little
Dislike a great deal
8/10/2019 Star Ceramic Survey
http://slidepdf.com/reader/full/star-ceramic-survey 15/38
15
In this above figure, 40% respondents choose our COMPANYlike a great deal, 26.66%
respondents like a little, 16.66% respondents neither like nor dislike, 13.33% respondents dislike
a little and 3.33% respondents dislike a great deal. Here, maximum customers like our
COMPANYwhich is good for doing this business.
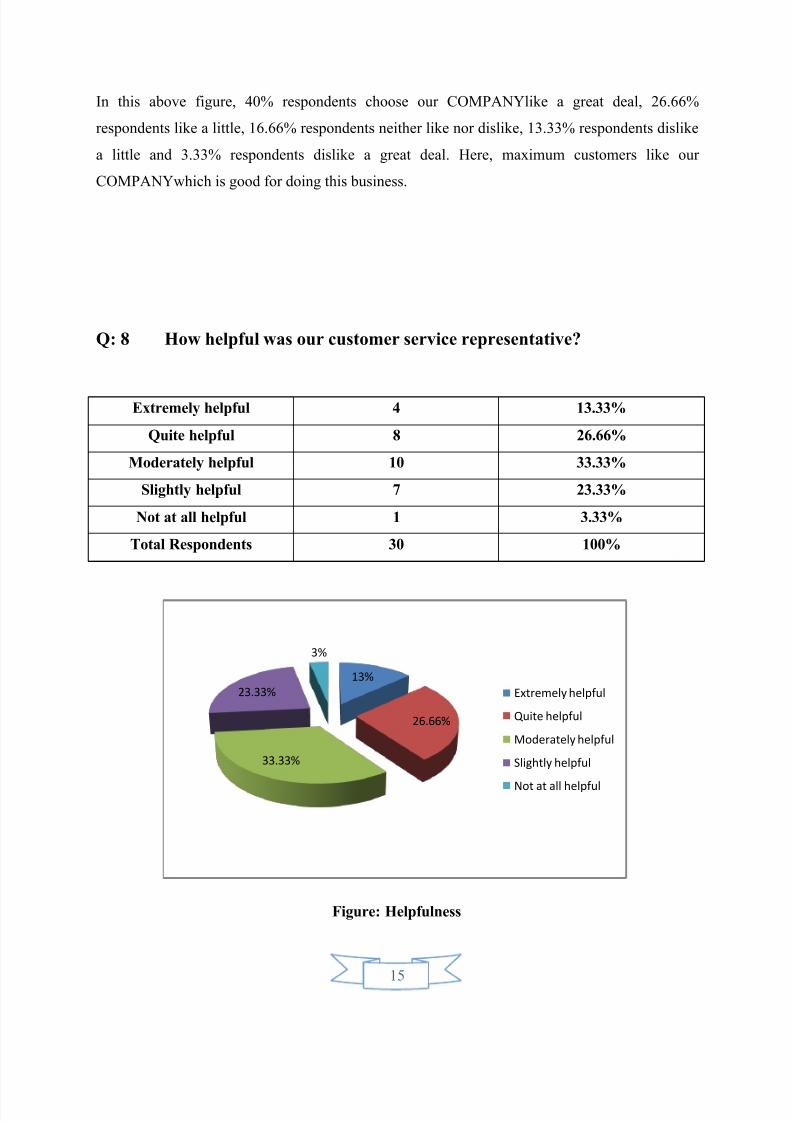
Q: 8 How helpful was our customer service representative?
Extremely helpful 4 13.33%
Quite helpful 8 26.66%
Moderately helpful 10 33.33%
Slightly helpful 7 23.33%
Not at all helpful 1 3.33%
Total Respondents 30 100%
Figure: Helpfulness
13%
26.66%
33.33%
23.33%
3%
Extremely helpful
Quite helpful
Moderately helpful
Slightly helpful
Not at all helpful

8/10/2019 Star Ceramic Survey
http://slidepdf.com/reader/full/star-ceramic-survey 16/38
8/10/2019 Star Ceramic Survey
http://slidepdf.com/reader/full/star-ceramic-survey 17/38
17
Figure: Answering ability
In this above figure, 40% respondents say that our customer representatives answering question
ability is extremely well, 26.66% respondents say that our customer representatives answering
question ability is quite well, 16.66% respondents say that our customer representatives
answering question ability is moderately well, 10% respondents say that our customer
representatives answering question ability is slightly well and 6.66% respondents say that our
customer representatives answering question ability is not at all well. So that, I can say, our
customer representatives are efficient.
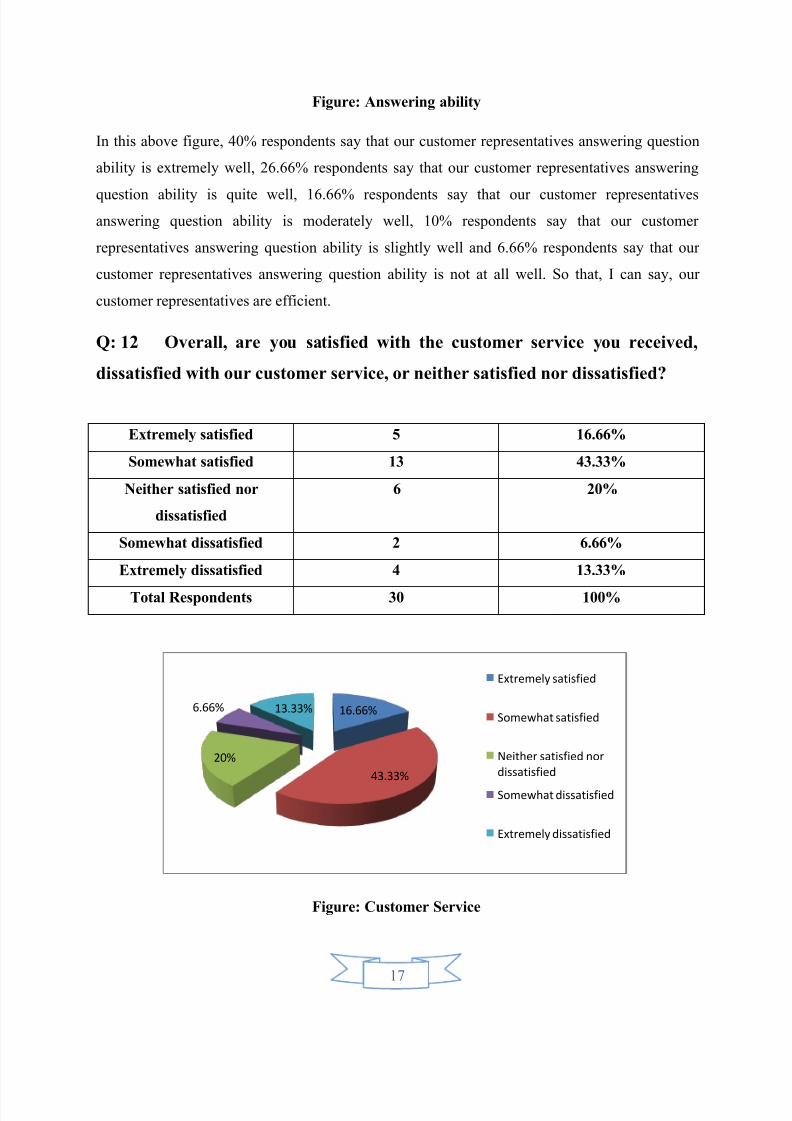
Q: 12 Overall, are you satisfied with the customer service you received,
dissatisfied with our customer service, or neither satisfied nor dissatisfied?
Extremely satisfied 5 16.66%
Somewhat satisfied 13 43.33%
Neither satisfied nor
dissatisfied
6 20%
Somewhat dissatisfied 2 6.66%
Extremely dissatisfied 4 13.33%
Total Respondents 30 100%
Figure: Customer Service
16.66%
43.33%
20%
6.66% 13.33%
Extremely satisfied
Somewhat satisfied
Neither satisfied nor
dissatisfied
Somewhat dissatisfied
Extremely dissatisfied
8/10/2019 Star Ceramic Survey
http://slidepdf.com/reader/full/star-ceramic-survey 18/38
18
In this above figure, 43.33% respondents are somewhat satisfied for our Company’s customer
service, 20% respondents are neither satisfied nor dissatisfied for our Company’s customer
service, 16.66% respondents are extremely satisfied for our Company’s customer service,
13.33% respondents are extremely dissatisfied for our Company’s customer service and 6.66%
respondents are somewhat dissatisfied for our Company’s customer service. Here, maximum
customers are satisfied for our customer service. This is also strength for our Company.
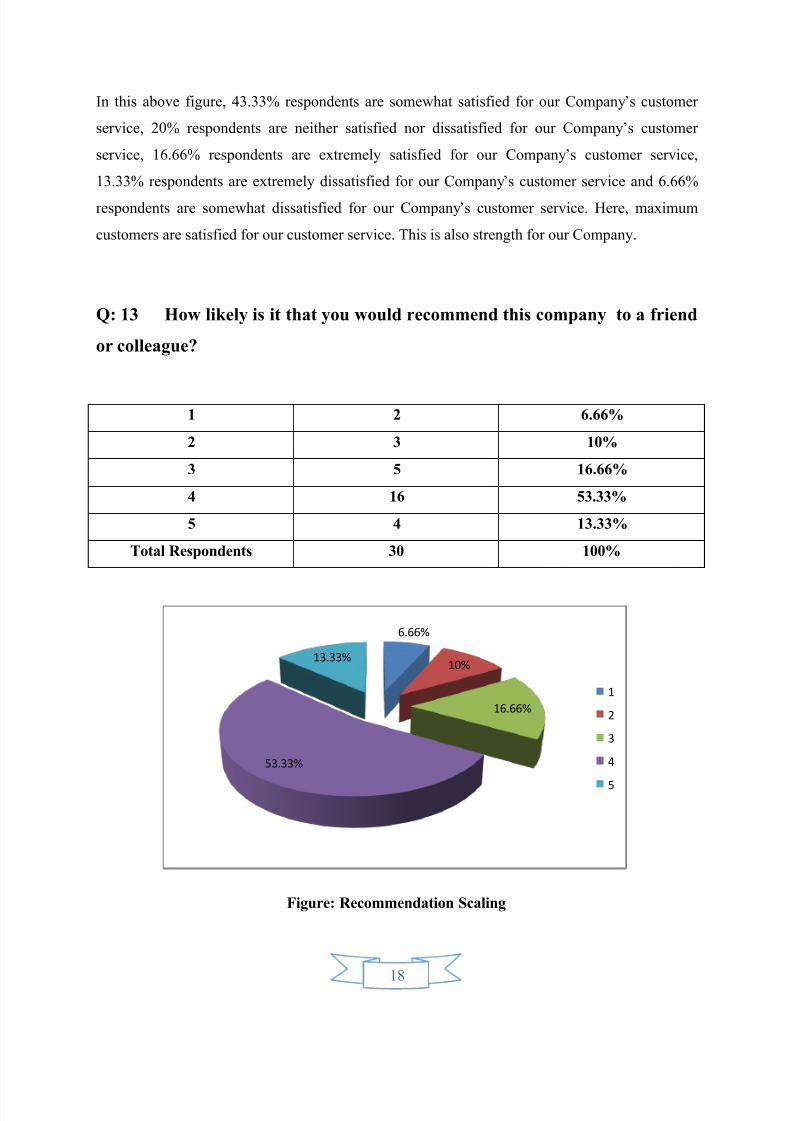
Q: 13 How likely is it that you would recommend this company to a friend
or colleague?
1 2 6.66%
2 3 10%
3 5 16.66%
4 16 53.33%
5 4 13.33%
Total Respondents 30 100%
Figure: Recommendation Scaling
6.66%
10%
16.66%
53.33%
13.33%
1
2
3
4
5
8/10/2019 Star Ceramic Survey
http://slidepdf.com/reader/full/star-ceramic-survey 19/38
19
In this above figure, 53.33% respondents give 4 out of 5, 16.66% respondents give 3 out of 5,
13.33% respondents give 5 out of 5, 10% respondents give 2 out of 5 and 6.66% respondents
give 1 out of 5. In recommendation scale our rating is well because our customers trust our
COMPANYvery much and recommend to others.
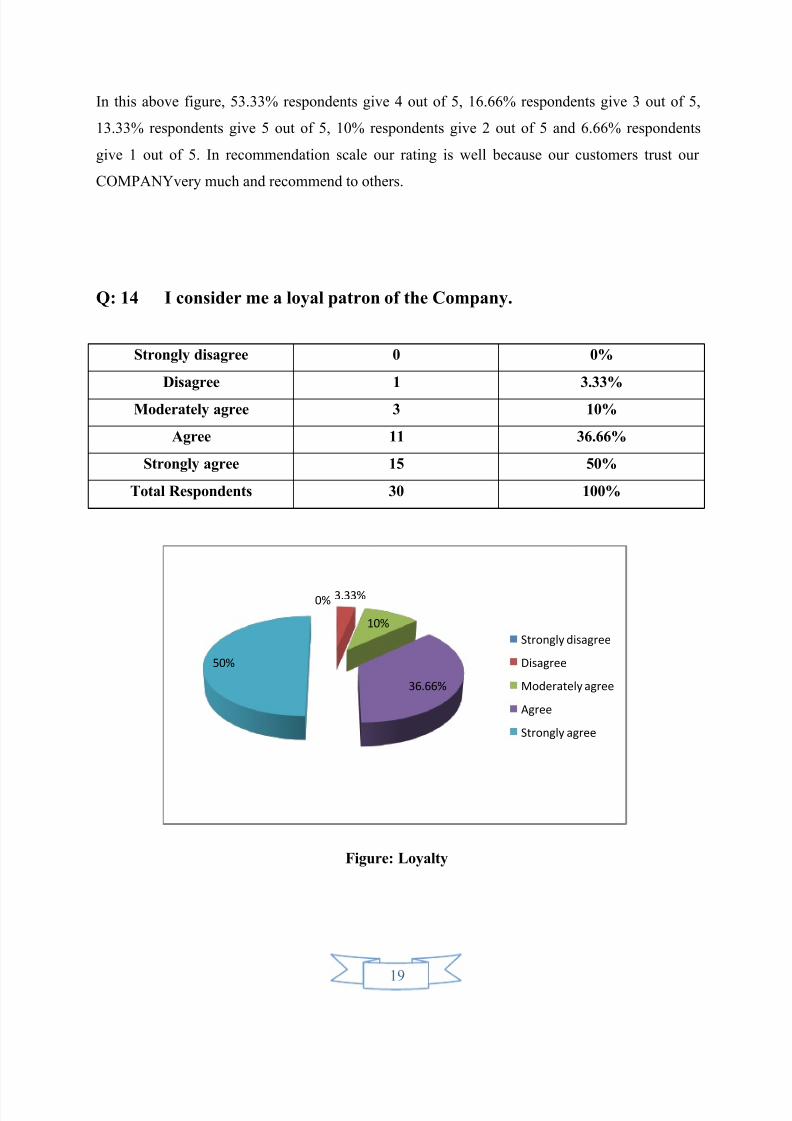
Q: 14 I consider me a loyal patron of the Company.
Strongly disagree 0 0%
Disagree 1 3.33%
Moderately agree 3 10%
Agree 11 36.66%
Strongly agree 15 50%
Total Respondents 30 100%
Figure: Loyalty
0% 3.33%
10%
36.66%
50%
Strongly disagree
Disagree
Moderately agree
Agree
Strongly agree

8/10/2019 Star Ceramic Survey
http://slidepdf.com/reader/full/star-ceramic-survey 20/38
20
In this above figure, 50% respondents strongly agree with this statement, 36.66% respondents are
agree with this statement, 10% respondents are moderately agree with this statement and 3.33%
respondents are disagree with this statement. Here, the maximum respondents are strongly
agreed because they believe that they are loyal about our Company.
Chapter -4
8/10/2019 Star Ceramic Survey
http://slidepdf.com/reader/full/star-ceramic-survey 21/38
21
Major Findings
CHAPTER-4: MAJOR FINDINGS
Respondents Age:
53.33%
26.66%
16.66%
3.33%
20-30 years
31-40 years
41-50 years
Above 50 years

8/10/2019 Star Ceramic Survey
http://slidepdf.com/reader/full/star-ceramic-survey 22/38
22
Figure: Respondent Age
Major Finding: The Maximum customers are young.
Respondents Gender:
Figure: Respondents Gender
Major Finding: The maximum customers are male persons.
Respondents Occupation:
60%
40%
Male
Female
36.66%
26.66%
16.66%
20%
Service Holder
Businessman
Housewife
Others
8/10/2019 Star Ceramic Survey
http://slidepdf.com/reader/full/star-ceramic-survey 23/38
23
Figure: Respondents Occupation
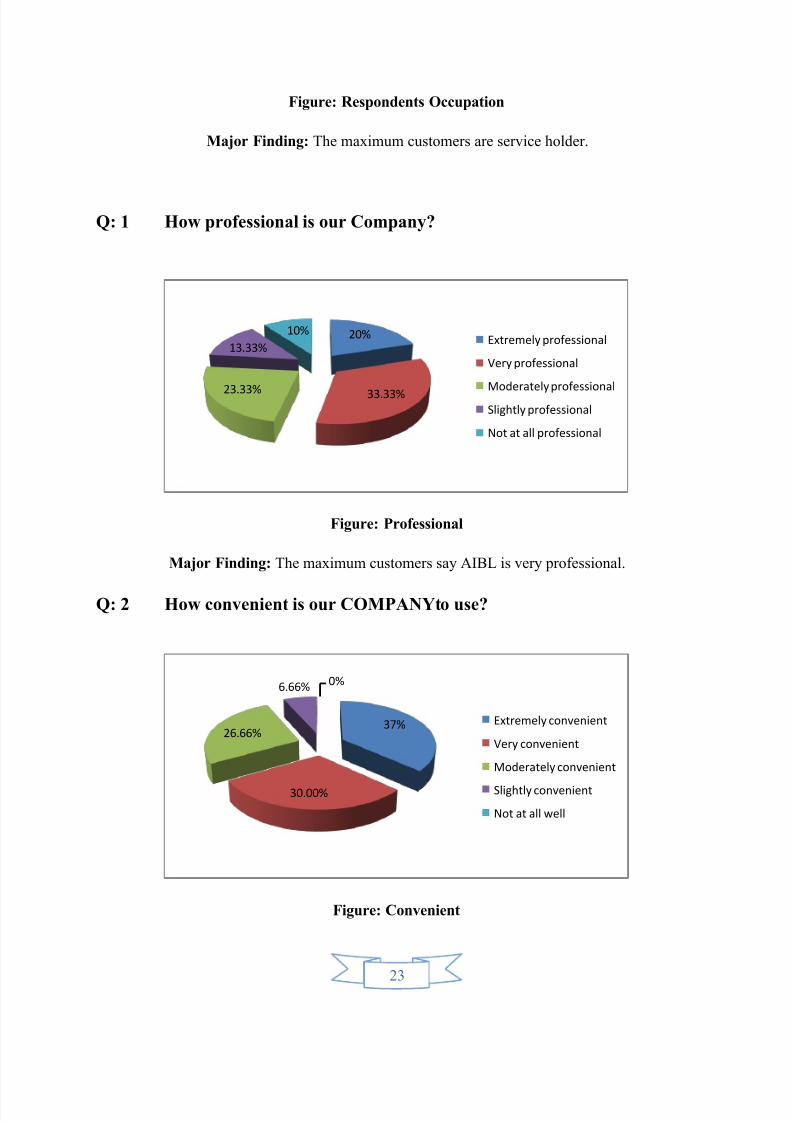
Major Finding: The maximum customers are service holder.
Q: 1 How professional is our Company?
Figure: Professional
Major Finding: The maximum customers say AIBL is very professional.
Q: 2 How convenient is our COMPANYto use?
Figure: Convenient
20%
33.33%23.33%
13.33%
10%Extremely professional
Very professional
Moderately professional
Slightly professional
Not at all professional
37%
30.00%
26.66%
6.66%0%
Extremely convenient
Very convenient
Moderately convenient
Slightly convenient
Not at all well

8/10/2019 Star Ceramic Survey
http://slidepdf.com/reader/full/star-ceramic-survey 24/38
24
Major Finding: The maximum customers say AIBL is extremely convenient.
Q: 3 How well do you feel that our COMPANYunderstands your need?
Figure: Identify Need
Major Finding: The maximum customers say AIBL quite well for identifying customer need.
Q: 4 Compared to our competitors, is our service quality better, worse or
about the same?
Figure: Service Quality
23%
40.00%
20.00%
10.00%7%
Extremely well
Quite well
Moderately well
Slightly well
Not at all well
17%
13.33%
26.66%
43.33%
0%
A great deal better
Somewhat better
About the same
Somewhat worse
A great deal worse
8/10/2019 Star Ceramic Survey
http://slidepdf.com/reader/full/star-ceramic-survey 25/38
25
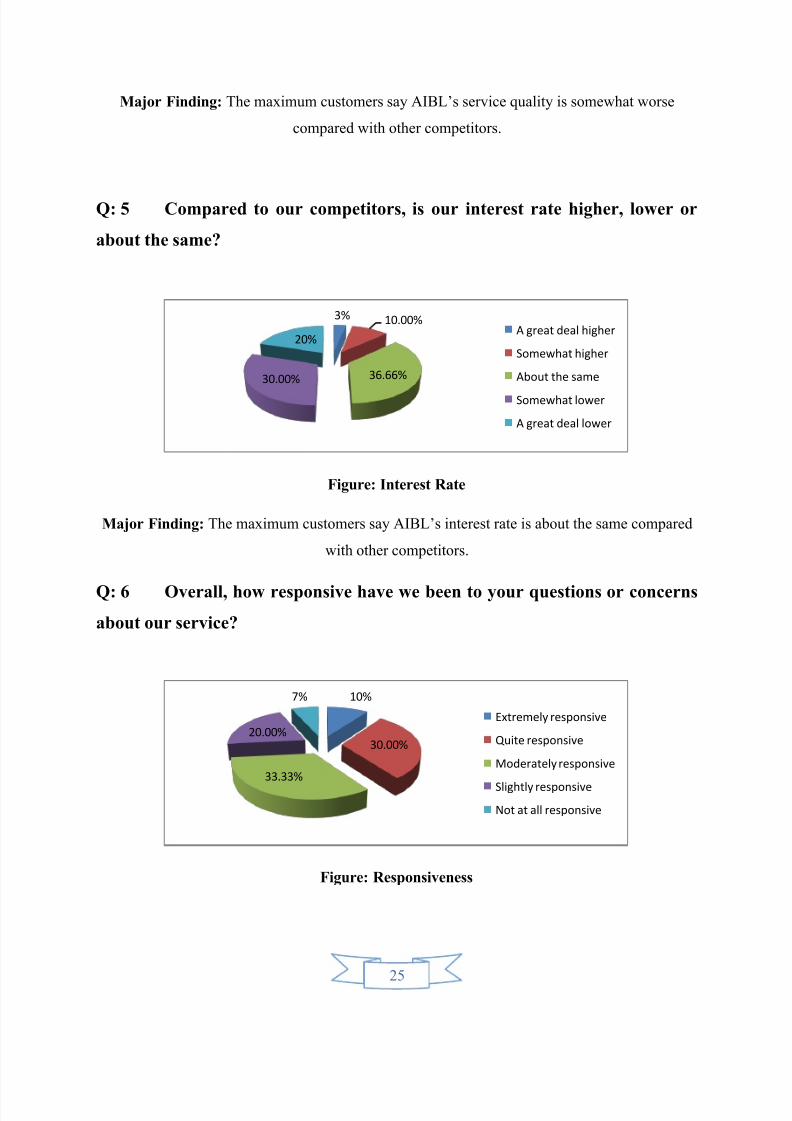
Major Finding: The maximum customers say AIBL’s service quality is somewhat worse
compared with other competitors.
Q: 5 Compared to our competitors, is our interest rate higher, lower or
about the same?
Figure: Interest Rate
Major Finding: The maximum customers say AIBL’s interest rate is about the same compared
with other competitors.
Q: 6 Overall, how responsive have we been to your questions or concerns
about our service?
Figure: Responsiveness
3% 10.00%
36.66%30.00%
20%A great deal higher
Somewhat higher
About the same
Somewhat lower
A great deal lower
10%
30.00%
33.33%
20.00%
7%
Extremely responsive
Quite responsive
Moderately responsive
Slightly responsive
Not at all responsive
8/10/2019 Star Ceramic Survey
http://slidepdf.com/reader/full/star-ceramic-survey 26/38
26
Major Finding: The maximum customers say AIBL is moderately responsive for customer’s
questions.
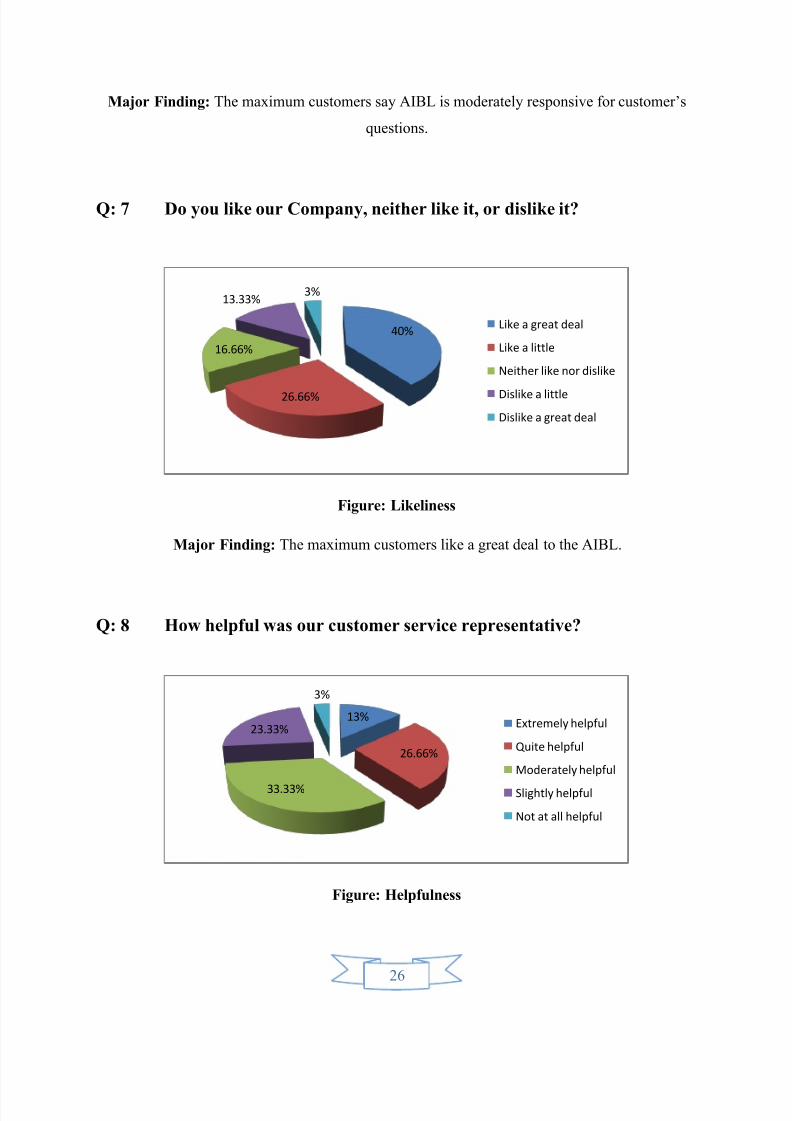
Q: 7 Do you like our Company, neither like it, or dislike it?
Figure: Likeliness
Major Finding: The maximum customers like a great deal to the AIBL.
Q: 8 How helpful was our customer service representative?
Figure: Helpfulness
40%
26.66%
16.66%
13.33%3%
Like a great deal
Like a little
Neither like nor dislike
Dislike a little
Dislike a great deal
13%
26.66%
33.33%
23.33%
3%
Extremely helpful
Quite helpful
Moderately helpful
Slightly helpful
Not at all helpful

8/10/2019 Star Ceramic Survey
http://slidepdf.com/reader/full/star-ceramic-survey 27/38
27
Major Finding: The maximum customers say AIBL’s service representatives are moderately
helpful.
Q: 9 How well did our customer service representative answer your
question or solve your problem?
Figure: Answering ability
Major Finding: The maximum customers say AIBL’s service representatives are answering
extremely well.
Q: 10 Overall, are you satisfied with the employees at our Company,
neither satisfied nor dissatisfied with them, or dissatisfied with them?
40%
26.66%
16.66%
10.00%7%
Extremely well
Quite well
Moderately well
Slightly well
Not at all well
37%
30.00%
20.00%
10.00% 3% Extremely satisfied
Slightly satisfied
Neither satisfied nor
dissatisfied
Slightly dissatisfied
Extremely dissatisfied
8/10/2019 Star Ceramic Survey
http://slidepdf.com/reader/full/star-ceramic-survey 28/38
28
Figure: Satisfied with the Employee
Major Finding: The maximum customers are extremely satisfied with AIBL employees.
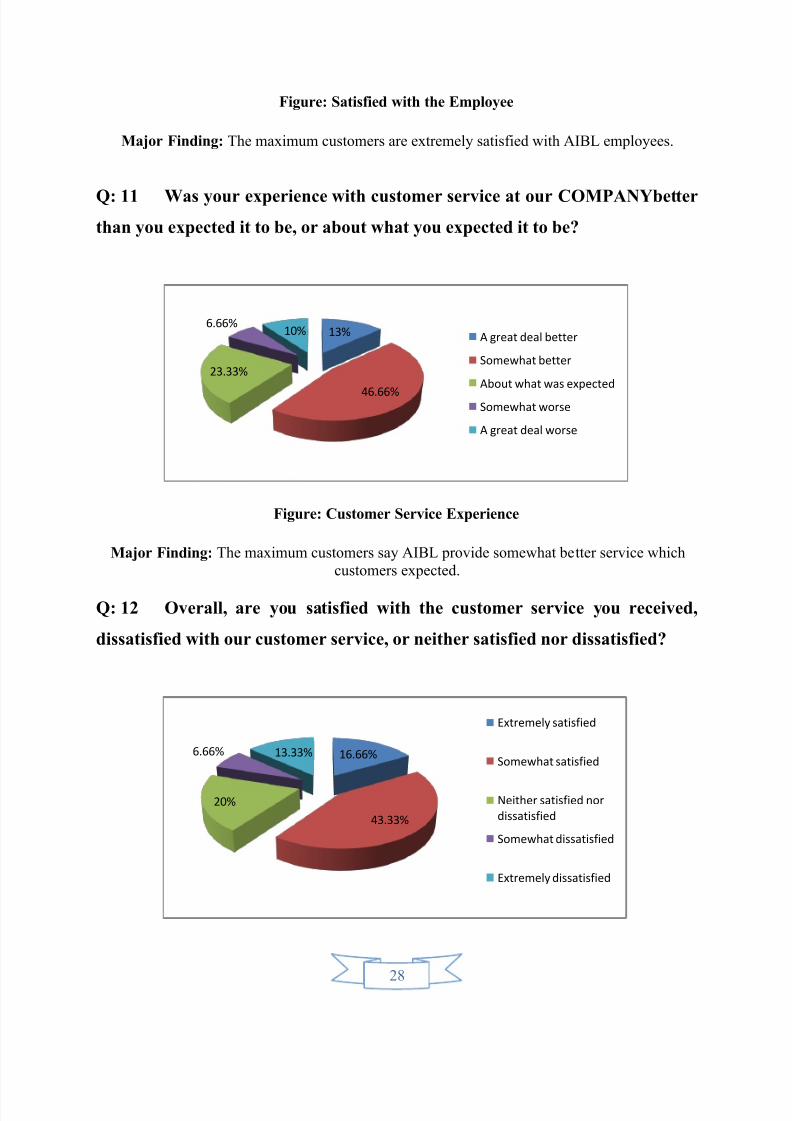
Q: 11 Was your experience with customer service at our COMPANYbetter
than you expected it to be, or about what you expected it to be?
Figure: Customer Service Experience
Major Finding: The maximum customers say AIBL provide somewhat better service which
customers expected.
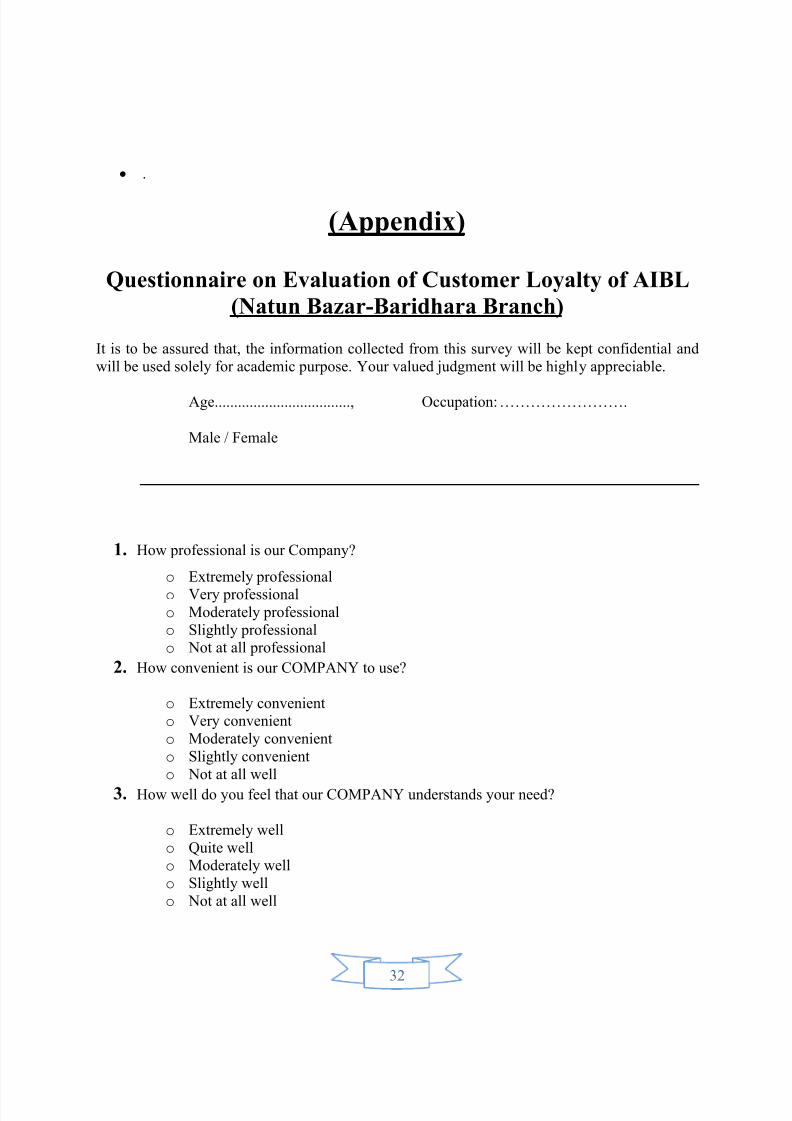
Q: 12 Overall, are you satisfied with the customer service you received,
dissatisfied with our customer service, or neither satisfied nor dissatisfied?
13%
46.66%
23.33%
6.66%10%
A great deal better
Somewhat better
About what was expected
Somewhat worse
A great deal worse
16.66%
43.33%
20%
6.66% 13.33%
Extremely satisfied
Somewhat satisfied
Neither satisfied nor
dissatisfied
Somewhat dissatisfied
Extremely dissatisfied

8/10/2019 Star Ceramic Survey
http://slidepdf.com/reader/full/star-ceramic-survey 29/38
29
Figure: Customer Service
Major Finding: The maximum customers somewhat satisfied with AIBL customer service.
Q: 13 How likely is it that you would recommend this COMPANYto a
friend or colleague?
Figure: Recommendation Scaling
Major Finding: The maximum customer’s recommendation AIBL to others.
Q: 14 I consider me a loyal patron of the Company.
Figure: Loyalty
6.66%10%
16.66%
53.33%
13.33%
1
2
3
4
5
0% 3.33%
10%
36.66%
50%
Strongly disagree
Disagree
Moderately agree
Agree
Strongly agree

8/10/2019 Star Ceramic Survey
http://slidepdf.com/reader/full/star-ceramic-survey 30/38
30
Major Finding: The maximum customers strongly agree that they are loyal customer of AIBL
Finding of The Report
The customers of the Al-Arafah Islami COMPANYLtd at Natun
Bazar- Baridhara Branch are very Loyal.

8/10/2019 Star Ceramic Survey
http://slidepdf.com/reader/full/star-ceramic-survey 31/38
31
Chapter -5
Recommendations And conclusion
8/10/2019 Star Ceramic Survey
http://slidepdf.com/reader/full/star-ceramic-survey 32/38
32
.
(Appendix)
Questionnaire on Evaluation of Customer Loyalty of AIBL
(Natun Bazar-Baridhara Branch)
It is to be assured that, the information collected from this survey will be kept confidential and
will be used solely for academic purpose. Your valued judgment will be highly appreciable.
Age..................................., Occupation: …………………….
Male / Female
1. How professional is our Company?
o Extremely professional
o
Very professionalo Moderately professional
o Slightly professional
o Not at all professional
2. How convenient is our COMPANY to use?
o Extremely convenient
o Very convenient
o Moderately convenient
o Slightly convenient
o Not at all well
3.
How well do you feel that our COMPANY understands your need?
o Extremely well
o Quite well
o Moderately well
o Slightly well
o Not at all well
8/10/2019 Star Ceramic Survey
http://slidepdf.com/reader/full/star-ceramic-survey 33/38
33
4. Compared to our competitors, is our service quality better, worse or about the same?
o A great deal better
o Somewhat better
o About the same
o
Somewhat worseo A great deal worse
5. Compared to our competitors, is our interest rate higher, lower or about the same?
o A great deal higher
o Somewhat higher
o About the same
o Somewhat lower
o A great deal lower
6. Overall, how responsive have we been to your questions or concerns about our service?
o
Extremely responsiveo Quite responsive
o Moderately responsiveo Slightly responsive
o Not at all responsive
7. Do you like our Company, neither like it, or dislike it?
o Like a great deal
o Like a little
o Neither like nor dislike
o Dislike a little
o
Dislike a great deal8. How helpful was our customer service representative?
o Extremely helpfulo Quite helpful
o Moderately helpful
o Slightly helpful
o Not at all helpful
9. How well did our customer service representative answer your question or solve your
problem?
o
Extremely wello Quite well
o Moderately well
o Slightly well
o Not at all well
10. Overall, are you satisfied with the employees at our Company, neither satisfied nordissatisfied with them, or dissatisfied with them?
8/10/2019 Star Ceramic Survey
http://slidepdf.com/reader/full/star-ceramic-survey 34/38
34
o Extremely satisfied
o Slightly satisfied
o Neither satisfied nor dissatisfied
o Slightly dissatisfied
o Extremely dissatisfied
11. Was your experience with customer service at our COMPANYbetter than you expected itto be, or about what you expected it to be?
o A great deal better
o Somewhat better
o About what was expected
o Somewhat worse
o A great deal worse
12. Overall, are you satisfied with the customer service you received, dissatisfied with ourcustomer service, or neither satisfied nor dissatisfied?
o Extremely satisfied
o Somewhat satisfied
o Neither satisfied nor dissatisfied
o Somewhat dissatisfied
o Extremely dissatisfied
13. How likely is it that you would recommend this COMPANYto a friend or colleague?
Not at all likely- 1 2 3 4 Extremely likely-5
o
o
o
o
o
14. I consider me a loyal patron of the Company.
o Strongly disagree
o Disagree
o Moderately agree
o
Agree
o Strongly agree
At DESIGNA Tiles we welcome frank and honest feed-back from all of our customers. Our aim
is to be considered New Zealand's BEST tile supplier and we'd really appreciate it if you could
tell us what we're doing well - and highlight any areas where we can improve. Individual survey

8/10/2019 Star Ceramic Survey
http://slidepdf.com/reader/full/star-ceramic-survey 35/38
35
responses are completely anonymous and only the summarised results are provided to
DESIGNA.
Thank you for participating. The survey should only take 5 minutes or so.
1. How did you first hear about DESIGNA Tiles?
How did you first hear about DESIGNA Tiles? I am a previous customer
Referred by friend
Referred by tradesman / professional
Designa web site
Yellow Pages or other business directory
Other advertising media
Can't recall
Other comments?2. If you have visited DESIGNA's web site, what did you think of it?
Poor Average Good Excellent Not applicable
Ease to find and
navigate
Ease to findand navigate
Poor
Ease to
find andnavigate
Average
Ease to
find and
navigate Good
Ease to
find andnavigate
Excellent
Ease to
find andnavigate Not
applicable
Usefulness and
information
Usefulnessand
information
Poor
Usefulnessand
information
Average
Usefulnessand
information
Good
Usefulnessand
information
Excellent
Usefulnessand
information
Not applicable
Images and
design ideas
Imagesand designideas Poor
Imagesand design
ideas Average
Imagesand designideas Good
Imagesand design
ideas Excellent
Imagesand design
ideas Not
applicable
Product
information
Productinformation
Poor
Productinformation
Average
Productinformation
Good
ProductinformationExcellent
Productinformation
Not applicable
Links to
additional
information
Links to
additional
informationPoor
Links to
additional
informationAverage
Links to
additional
informationGood
Links to
additional
informationExcellent
Links to
additional
information Not applicable
Other comments?
3. If you have visited DESIGNA's showroom at 15 Kalmia Street Ellerslie, what did you think of
it?
Poor Average Good Excellent Not applicable

8/10/2019 Star Ceramic Survey
http://slidepdf.com/reader/full/star-ceramic-survey 36/38
36
Poor Average Good Excellent Not applicable
Ease of finding
location
Ease of findinglocation Poor
Ease of
finding
location
Average
Ease of
findinglocation Good
Ease of
finding
location
Excellent
Ease of
finding
location Not
applicable
Ease of parking Ease of
parking Poor
Ease of parking
Average
Ease of
parking Good
Ease of parking
Excellent
Ease of parking Not
applicable
General standard
of showroom
(layout, design
etc)
Generalstandard of
showroom
(layout, design
etc) Poor
Generalstandard of
showroom
(layout, design
etc) Average
Generalstandard of
showroom
(layout, design
etc) Good
Generalstandard of
showroom
(layout, design
etc) Excellent
General
standard of
showroom
(layout, designetc) Not
applicable
Availability ofsamples &/or
brochures
Availability ofsamples &/or
brochures Poor
Availability of
samples &/or
brochuresAverage
Availability of
samples &/or
brochuresGood
Availability of
samples &/or
brochuresExcellent
Availability of
samples &/or
brochures Notapplicable
Displays, tiled
areas and mock-
up examples
Displays,
tiled areas andmock-up
examples Poor
Displays,tiled areas and
mock-up
examples
Average
Displays,tiled areas and
mock-up
examples
Good
Displays,tiled areas and
mock-up
examples
Excellent
Displays,tiled areas and
mock-up
examples Not
applicable
Other (please specify)
4. Thinking about your interactions with DESIGNA's staff, please rank the following qualities;Poor Average Good Excellent Not applicable
Friendliness
and welcome
*Thinking
about your
interactionswith
DESIGNA's
staff, pleaserank the
following
qualities;Friendlinessand welcome
Poor
Friendliness
and welcome
Average
Friendliness
and welcome
Good
Friendliness
and welcome
Excellent
Friendliness
and welcome
Not applicable
Communicatio
n - both
listening &
explaining
Communicatio
n - both
listening &
Communicatio
n - both
listening &
Communicatio
n - both
listening &
Communicatio
n - both
listening &
Communicatio
n - both
listening &

8/10/2019 Star Ceramic Survey
http://slidepdf.com/reader/full/star-ceramic-survey 37/38
37
Poor Average Good Excellent Not applicableexplaining Poor explaining
Average
explaining
Good
explaining
Excellent
explaining Not
applicable
Product
knowledge
Product
knowledge
Poor
Product
knowledge
Average
Product
knowledge
Good
Product
knowledge
Excellent
Product
knowledge Not
applicable
Helpfulness and
design
suggestions
Helpfulnessand design
suggestions
Poor
Helpfulnessand design
suggestions
Average
Helpfulnessand design
suggestions
Good
Helpfulnessand design
suggestions
Excellent
Helpfulnessand design
suggestions Not
applicable
Reliability:
following-up etc
Reliability:
following-up
etc Poor
Reliability:
following-up
etc Average
Reliability:
following-up
etc Good
Reliability:
following-up
etc Excellent
Reliability:following-up
etc Notapplicable
Willingness to
go the 'extra
mile'
Willingness to
go the 'extramile' Poor
Willingness to
go the 'extramile' Average
Willingness to
go the 'extramile' Good
Willingness to
go the 'extramile' Excellent
Willingness togo the 'extra
mile' Not
applicable
Other (please specify)5. Thinking about DESIGNA's product range and value, please rate the following qualities;
Poor Average Good Excellent Not applicable
Range of tile
choices - sizes,
colours, designs,
finishes
*Thinkingabout
DESIGNA's product range
and value,
please rate the
followingqualities;
Range of tile
choices - sizes,colours,
designs,
finishes Poor
Range of
tile choices -sizes, colours,
designs,
finishesAverage
Range oftile choices -
sizes, colours,designs,
finishes Good
Range of
tile choices -sizes, colours,
designs,
finishesExcellent
Range of
tile choices -sizes, colours,
designs,
finishes Notapplicable
Value for money,
pricing and
illingness to
negotiate
Value formoney, pricing
and
willingness tonegotiate Poor
Value for
money, pricing
andwillingness to
negotiate
Average
Value formoney, pricing
and
willingness tonegotiate Good
Value for
money, pricing
andwillingness to
negotiate
Excellent
Value for
money, pricing
andwillingness to
negotiate Not
applicable
Choice of quality Choice of Choice of Choice of Choice of Choice of
8/10/2019 Star Ceramic Survey
http://slidepdf.com/reader/full/star-ceramic-survey 38/38
Poor Average Good Excellent Not applicable
suppliers /
manufacturers
quality
suppliers /manufacturers
Poor
quality
suppliers /manufacturers
Average
quality
suppliers /manufacturers
Good
quality
suppliers /manufacturers
Excellent
quality
suppliers /manufacturers
Not applicable
Immediate
availability of
stock
Immediateavailability of
stock Poor
Immediateavailability of
stock Average
Immediateavailability of
stock Good
Immediateavailability of
stock Excellent
Immediateavailability of
stock Notapplicable
Other (please specify)
“THANKS A LOT FOR YOUR TIME SPARED AND PATIENCE”