star 2010 september 10, 2010. agenda new in 2010 interpreting reports comparing results appendixes...
TRANSCRIPT

STAR 2010STAR 2010
September 10, 2010
AgendaAgenda
• New in 2010
• Interpreting reports
• Comparing results
• Appendixes A-G
2

3
What’s New in 2010What’s New in 2010• California Modified Assessment (CMA)
reports– Scale score, performance levels for
• Grades 6–8 English−Language Arts (ELA)• Grades 6–7 mathematics• Grade 8 science
– Percent correct for • ELA grade 9• Life Science, grade 10• Algebra I
Manual (M) 2

4
Results: Reporting ClusterResults: Reporting ClusterCautionsCautions
• Based on small numbers of items; therefore, may not be reliable or generalizable
• NOT equated from year to year
• Should not compare reporting cluster percent correct from year to year
M 8−12;Appendix A
5
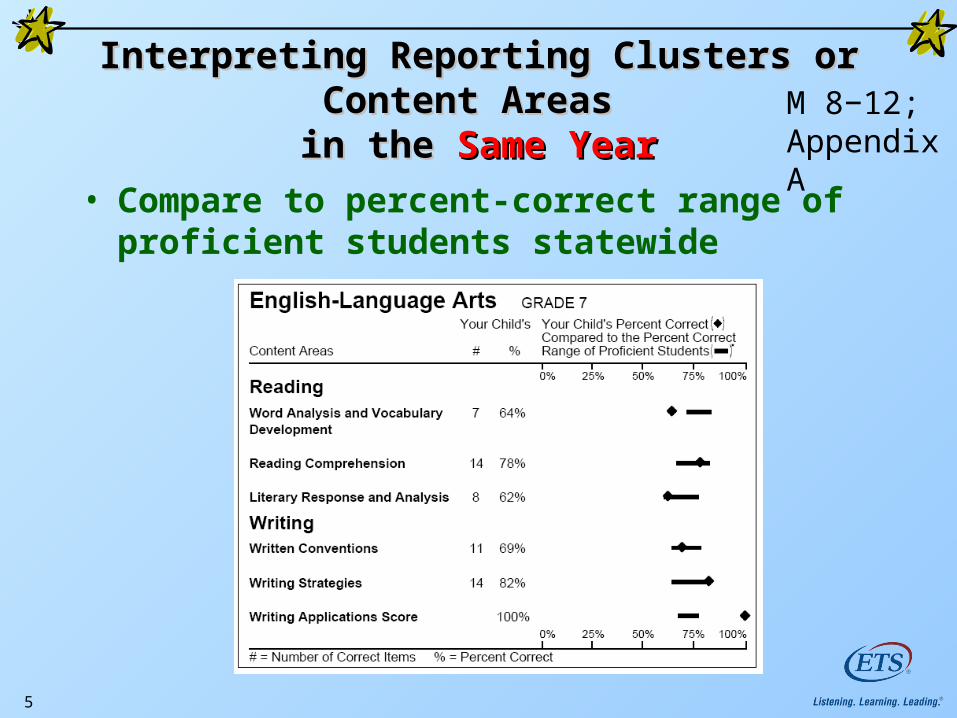
Interpreting Reporting Clusters or Interpreting Reporting Clusters or Content Areas Content Areas
in the in the Same YearSame Year• Compare to percent-correct range of
proficient students statewide
M 8−12;Appendix A

6
2010 CST Reporting Clusters: 2010 CST Reporting Clusters: Number of Questions and Number of Questions and Average Percent CorrectAverage Percent Correct
To be finalized with complete data in 2010 Post-Test Guide, after August 16.
M Appendix A

7
ExamplesExamples—Interpreting Reporting —Interpreting Reporting Clusters for the CST for Geometry Clusters for the CST for Geometry M 11

8
Using ResultsUsing Results
• For instructional decisions with other data
• Used in Academic Performance Index (API) calculations: CSTs, CAPA, CMA (only grades 3–8, excluding Algebra I)
• Used in adequate yearly progress (AYP) calculations, ELA and mathematics: – Grades 2–8, CSTs– Grades 3–8, CMA (excluding Algebra I)– Grades 2–8 and 10, CAPA
M 4

9
Year-to-Year ComparisonsYear-to-Year ComparisonsDoDo Compare CSTs: Compare CSTs:
Same Grade and Same Content AreaSame Grade and Same Content Area
• Mean scale score – Same content and grade, varying
years• Percent in each performance level
– Same content by grade across years• e.g., 2009 ELA grade 10 with 2010
ELA grade 10
M 13−16
10
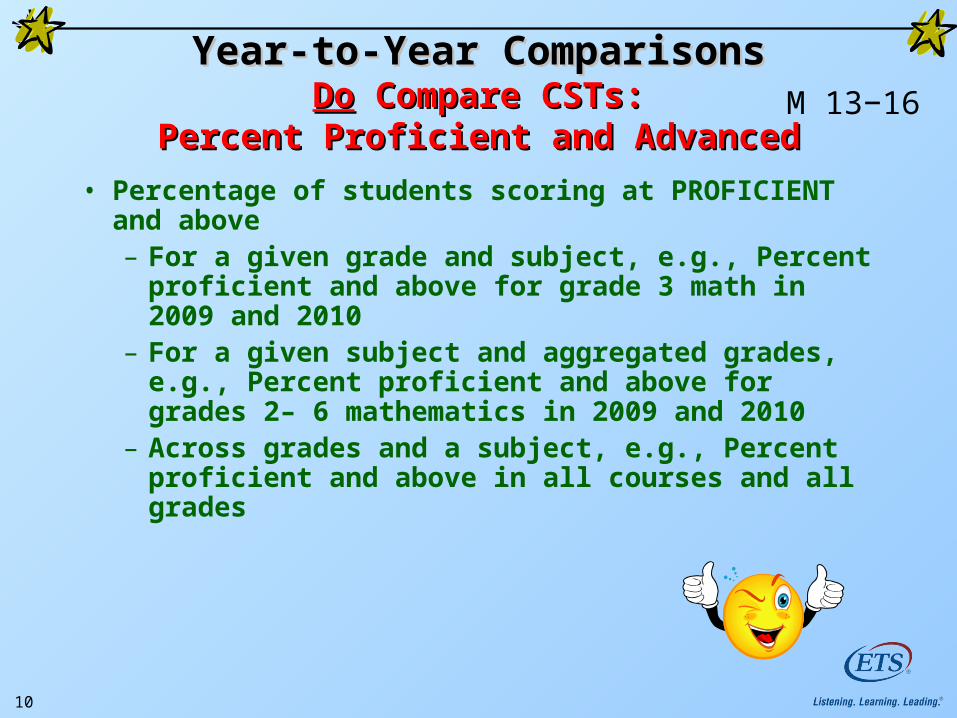
Year-to-Year ComparisonsYear-to-Year ComparisonsDoDo Compare CSTs: Compare CSTs:
Percent Proficient and AdvancedPercent Proficient and Advanced
• Percentage of students scoring at PROFICIENT and above– For a given grade and subject, e.g., Percent
proficient and above for grade 3 math in 2009 and 2010
– For a given subject and aggregated grades, e.g., Percent proficient and above for grades 2– 6 mathematics in 2009 and 2010
– Across grades and a subject, e.g., Percent proficient and above in all courses and all grades
M 13−16

11
Year-to-Year ComparisonsYear-to-Year ComparisonsDON’TDON’T Compare Compare
• Individual scale scores or statistics based on scale scores for different grades or content areas– Subjects by grade are independently scaled – Different content standards are measured in
different grades• Cohorts across grades• Across tests• CMA grades 6−11, STS grades 5−11 to
previous years• CAPA, CMA grades 3−5, STS grades 2−4 to
years before 2009
M 13−16
12
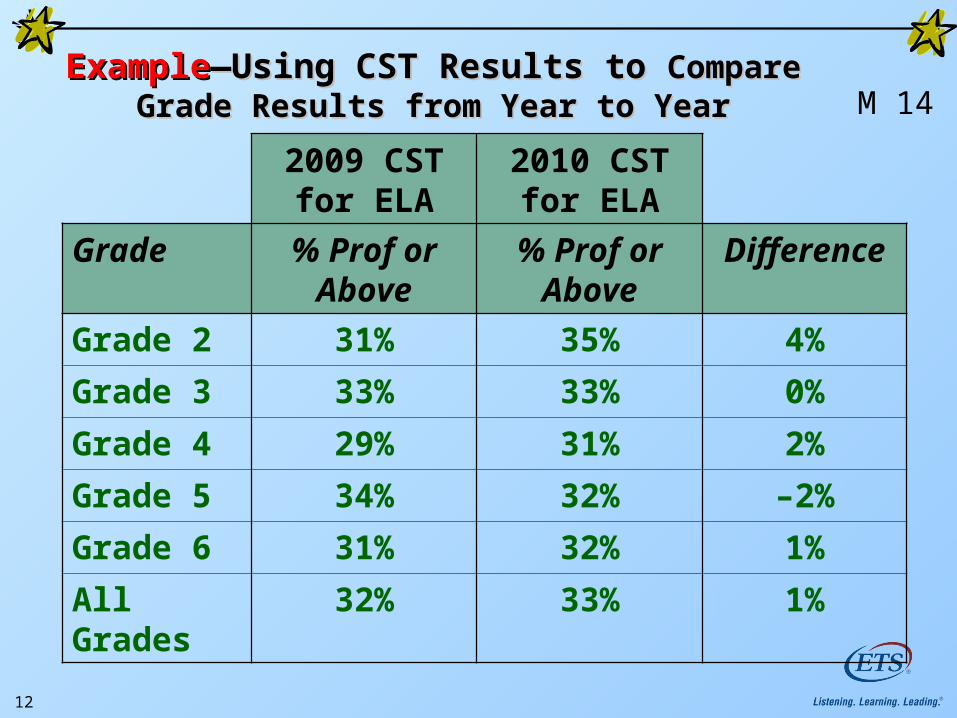
ExampleExample—Using CST Results to —Using CST Results to Compare Grade Results from Year to Compare Grade Results from Year to
YearYear2009 CST for ELA
2010 CST for ELA
Grade % Prof or Above
% Prof or Above
Difference
Grade 2 31% 35% 4%
Grade 3 33% 33% 0%
Grade 4 29% 31% 2%
Grade 5 34% 32% –2%
Grade 6 31% 32% 1%
All Grades
32% 33% 1%
M 14
13
SummarySummary
• Do’s and Don’ts – Do compare mean scale score, percent
at performance levels within same grade, same content area
– Don’t compare mean scale scores across grades, content area
• Summary and Internet reports• Data CDs• Individual reports

AppendixesAppendixes
• Appendix A: STAR Reporting Clusters• Appendix B: STAR Scale Score Ranges• Appendix C: STAR Conditional Standard Errors
of Measurement (CSEM)• Appendix D: Parent/Guardian or School District
Request for Verification of 2010 Test Score• Appendix E: Request to Correct 2010 STAR
CST/CMA and CAPA Demographic Data• Appendix F: California Reading List Number• Appendix G: Glossary of Statistical Terms
September 201014

15
For more information see:For more information see:• http://www.cde.ca.gov/ta/tg/sr/• http://www.star.cde.ca.gov/• http://www.startest.org/ • STAR Technical Assistance Center
– 800-955-2954• CDE Accountability
– [email protected] – 916-319-0863

To Contact CDETo Contact CDE
• CDE STAR office: 916-445-8765– English–Language Arts tests, including writing: Jamie
Contreras, [email protected], 916-319-0353– Mathematics tests: Jane Liang, [email protected],
916-322-1854– Science tests: Blessing Mupanduki,
[email protected], 916-319-0969– History–Social Science tests: Nicole Jespersen,
[email protected], 916-319-0364– CAPA, CMA: Don Killmer, [email protected], 916-
319-0350
16