standards-based assessment in math
TRANSCRIPT


Advance Organizer
• What is SBA?
• How do we make assessment based on Standards?
• Why assess the standards?

What is SBA? On Practice:
• The practice involves comparing each student’s performance to academic standards that are developed in the national or international setting.
• More importantly, the process involves communicating goals that the school systems, schools, teachers and students need to achieve, providing targets for teaching and learning, and shaping the performance of teachers and students.
On Assessment: [Magno, C. (2015). On SBA. SBA Journal, 3, 2-3.]
•The SBA model requires that assessment practices to be closely aligned with the required competencies that students need to learn. •The general intention is to focus more on the learning of competencies of every student.

Examples of Curricular Standards
DepEd Curriculum Guide – Standards indicated in the form of learning competencies
www.deped..gov.ph
McREL International Standards and benchmarks
http://www2.mcrel.org/compendium/browse.asp
Academic Benchmarks http://academicbenchmarks.com/
Program for International Student Assessment
www.oecd.org
Education World http://www.educationworld.com/standards/

How do we make assessment based on SBA?
Standards (Competencies)
What do you want to measure? Serves as Content Domains of the measure
How do you Prepare the assessment? - Indicated it the table of specifications
How do you construct the assessment? -Constructive alignment -Determines the kind of task whether written or performance-based
Can the student perform the task? -scoring and interpretation based on the competency
How do you use assessment to help students learn? - Feedback (Formative Assessment

What do you want to measure?
• Define content domains
• Break down the content domains into specific competencies
• Use curricular standards as the basis for the content domains and specific competencies

Mathematics Standards Grade 6 (4th Quarter)
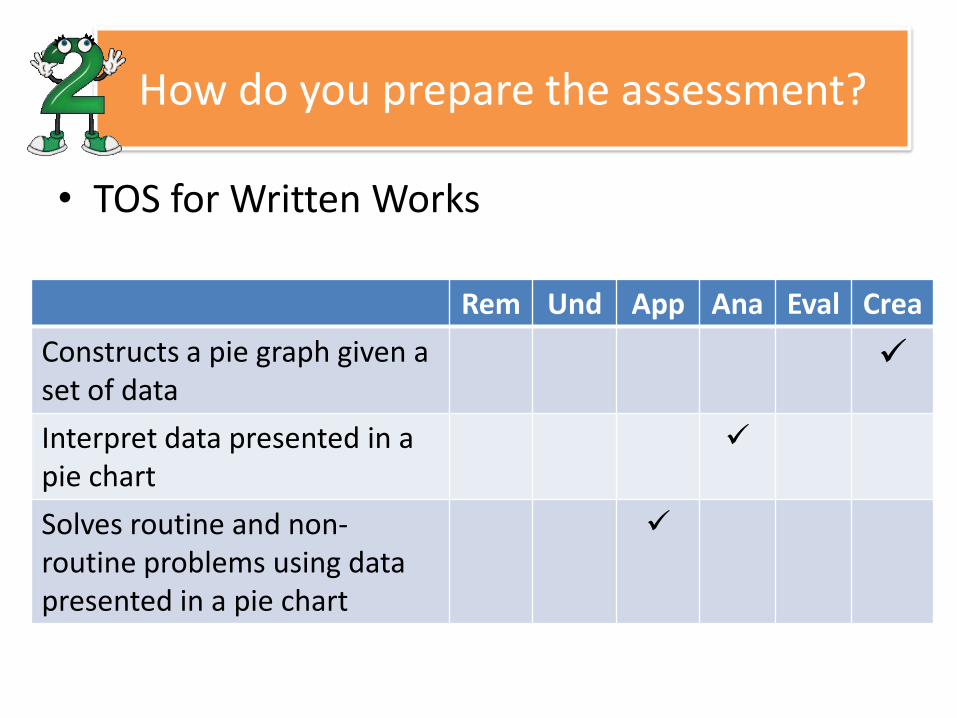
How do you prepare the assessment?
• TOS for Written Works
Rem Und App Ana Eval Crea
Constructs a pie graph given a set of data
Interpret data presented in a pie chart
Solves routine and non-routine problems using data presented in a pie chart

How you construct the assessment protocol?
• Decide on the task!
Paper and Pen
Performance-based Task
Collects data on one or two variables using any source
Constructs a pie graph based on a given set of data
Interprets data given on a pie graph
Solves routine and routine problems using data presented in the pie graph
Creates problems that can be answered using information presented in a pie graph

Constructive Alignment
• Competency: Solves routine and routine problems using data presented in the pie graph.
• Item: (A pie chart showing students budget of allowance for one week)
Look at the percent of expenses shown in the pie chart. How much more did you spend on food than school supplies in percent? How much is the difference in peso amount?

Constructive alignment
• Competency: Recognize area as additive: Find areas of rectilinear figures by decomposing them into non-overlapping rectangles and adding the areas of the non-overlapping parts, applying this technique to solve real world problems.
• Task: What is the total floor area of the apartment (including the terrace and the walls)? Show the measurement size of each room, calculate the area of each one and add all the areas together.
1 cm = 1 meter

Constructive alignment
• Grade 1 Competency: Reads and writes money in symbols and in words through PhP100.
• Task: Which of the following is equivalent to PhP 100?
a.
b.
Aligned or not aligned?

Constructive alignment • Competency:
– Collects data on one or two variables using any source – Constructs a pie graph based on a given set of data
• Output: A pie graph in a powerpoint presentation showing the percentage of students preferred restaurants with a four sentence paragraph interpretation.
• Task: In a piece of paper ask your classmates to check their favorite restaurant. If their favorite is not in the option, they can write it in the options (others). Count the preferences per restaurant and convert it into percentage. Plot the percentage into a pie chart. Interpret the pie chart using the following guide questions… Put the Pie chart and interpretations in a powerpoint presentation to be shown in class.
• Criteria: accuracy of converting frequencies to percentage, accuracy of the size of the parts of the pie graph, accuracy of interpretation.

Can the student perform the task?
• Global score or item/competency score?
• Class average score of individual score?
• Are my items valid and reliable?

Can the student perform the task? Al: Algebra G: Geometry C: Calculus T: Trigonometry S: statistics
Pro
fici
ent
leve
l B
egi
nn
er
Leve
l
Easy
item
s D
iffi
cult
item
s

Numeracy Assessment in L2 Numeracy Assessment in L1
1 Plc_Vl
2 Oper
3 Decim
4 Fract
5 Strat
6 Geom
Ave. Item Difficulty
Ave. student ability
Ave. Item Difficulty
Ave. student ability

Sample ICC Numeracy Gr 5-L2
Item 1.1 MNSQ = .77 (bad fit) Item 3.3 MNSQ = .96 (good fit)

Using Math Assessment Results Formative Assessment: Feedback and Corrective
instruction Who can do this?
Who needs help on this?
Collects data on one or two variables using any source
Constructs a pie graph based on a given set of data
Interprets data given on a pie graph
Solves routine and routine problems using data presented in the pie graph
Creates problems that can be answered using information presented in a pie graph

Delivering Formative Assessment
Make learners aware of the learning goal
Determine current status
of students
Move students closer to the
goals

Why do we need to assess mathematics standards?
• Basis on what to assess
• To make sure that everyone delivers quality work (21st century skills)
• To produce quality students
• To deliver quality programs
20