standardizing assessment across ql courses
TRANSCRIPT
Standardizing Assessment Across QL Courses
Jill Dunham and Betty Mayfield
Hood College

A new core curriculum
• Old: Computation requirement (3-4 credits)
• Students will be able to solve basic mathematical problems and demonstrate some ability to interpret and present numerical data.
• Statistics (in any department)
• “Mathematics Everywhere” (math for liberal arts course)
• Calculus

New core curriculum will take effect next fall • Quantitative Literacy requirement (3-4 credits)
• Quantitative literacy (QL) is a habit of mind. It involves using elementary mathematical tools to interpret and manipulate quantitative data arising in a variety of contexts. It is marked by computational fluency, and by competence and comfort in working with numerical data. Those who are quantitatively literate can create arguments supported by data and can communicate those arguments in many ways – using tables, graphs, mathematical expressions, and words.
• A course that satisfies the QL section of the Core Curriculum should have as its main focus the use of mathematics to solve real-world problems. In those courses, using data and appropriate technology, students will collaborate to solve multi-step problems and effectively communicate their reasoning to others.

How to recognize a QL course?
We believe that a course that satisfies the QL requirement should include many of the following:
• Problem-solving: applying mathematics to real-world problems.
• Working with data.
• Using (and knowing when to use) appropriate technology.
• Looking carefully at quantitative arguments in the media, or in journal articles in another discipline.
• Reasoning: using quantitative skills to defend one’s opinion.

How to recognize a QL course?
• Solving multi-step quantitative problems (as in a class project).
• Active learning and engagement.
• Collaborative learning.
• Communicating (mostly in writing) about quantitative issues in everyday life. May include homework, exams, lab reports, essays.
• Presenting data in useful ways: graphs, charts, tables, equations.
• Multiple forms of assessment.

Student learning outcomes in a QL course
Students who successfully complete a QL course should be able to
• Demonstrate computational fluency.
• Understand and interpret data presented in a variety of formats, and convert from one format to another.
• Draw conclusions based on numerical data and assess their limitations.
• Evaluate quantitative arguments in a variety of settings.
• Communicate their understanding of the usefulness of mathematics.

Courses
• Statistics (Mathematics, Economics, Psychology, Sociology)
• Mathematics Everywhere
Mathematics of Daily Life (For All Practical Purposes)
Mathematics of Democracy
Mathematics of Games and Sports
• Workshop Calculus I
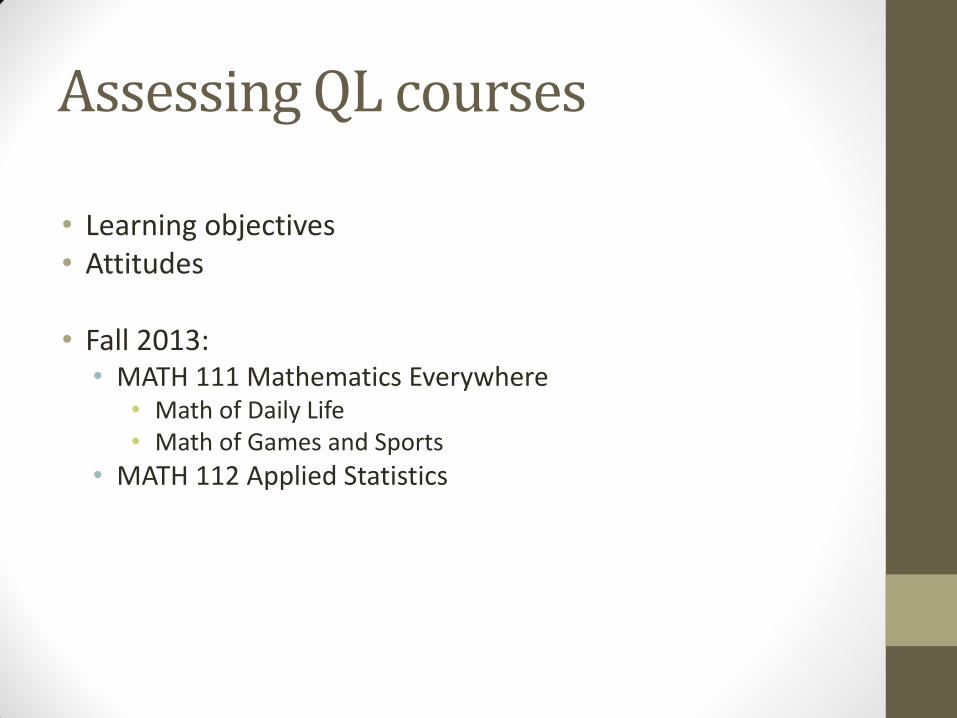
Assessing QL courses
• Learning objectives • Attitudes
• Fall 2013: • MATH 111 Mathematics Everywhere
• Math of Daily Life • Math of Games and Sports
• MATH 112 Applied Statistics

How do our current QL courses address the desirable attributes of a QL course?
Quantitative Literacy in Math 111A-The Mathematics of Daily Life
• Problem Solving-The first two topics in Math 111A are Euler Circuits and Hamiltonian circuits, where students determine most efficient routes for mailmen, airlines, etc. In the personal finance unit students determine how much mortgage they can afford and how much they need to save a month to accrue a down payment. These are just two examples, since problem solving is occurring in every unit.
• Working with Data-We do a complete unit on one variable and two variable statistics. We develop the skills necessary to analyze the statistic by hand and with Excel. Interpreting graphs, 5 number summaries, stem plots, etc. are emphasized.
• Using (and Knowing When to Use) Appropriate Technology-About a third of the course involves using Excel. We do three labs and a project using Excel to manage and analyze personal finances. We use Excel to present and analyze one variable and two variable statistics, as well.

• Looking Carefully at Quantitative Arguments in the Media, or Journal Articles in Other Disciplines-This is addressed in homework assignments in our statistics unit.
• Reasoning: Using quantitative skills to defend one’s opinion-using the web and Excel, students make and defend an argument for their choice of the greatest homerun hitter of all time. As with problem solving, reasoning is a part of every unit.
• Active Learning and Engagement-The class format includes very little lecture. Much more time is spent on well-designed worksheets and labs that introduce and develop the subject matter. Students are encouraged to talk to each other as they work through the worksheets and material. At the same time they can question and seek reinforcement from the instructor. Often the class summary is an exit slip demonstrating mastery of the day’s topic. The student must answer the problem on the exit slip correctly to exit the room.

• Collaborative Learning-See active learning above. Students also do a home buying project with a partner in which, using the web and Excel, they determine how much mortgage they can afford and develop a plan to save for the down payment.
• Communicating about Quantitative Issues in Everyday Life-Besides the assignment defending the greatest homerun hitter, students use data to analyze current events such as health care costs.
• Presenting Data in Useful Ways: We do a complete unit on one variable and two variable statistics. We develop the skills necessary to analyze the statistic by hand and with Excel. Histograms, scatter plots, stem plots, box and whisker plots, and five number summaries are emphasized.
• Multiple forms of assessment: Labs (primarily Excel based, in-class and take home ; projects; two midterms with take home components; and a final exam. The students also do an Excel practical at the end of the course.

How did students meet the learning objectives?
Examples from three courses:
• Mathematics of Daily Life
• Applied Statistics
• Mathematics of Games and Sports

Math of Daily Life Class project: buying a home

Example student submission


Applied Statistics: Final project
• Form hypothesis
• Collect data
• Analyze
• Report findings – orally and in writing

Examples
• Compare the yearly temperature means with the crime rate in New York City (using published data)
• Relationship between the day of the week and the number of EMS and fire calls (student was a volunteer at a VFD)
• Cost analysis of several local grocery stores and “supercenters”
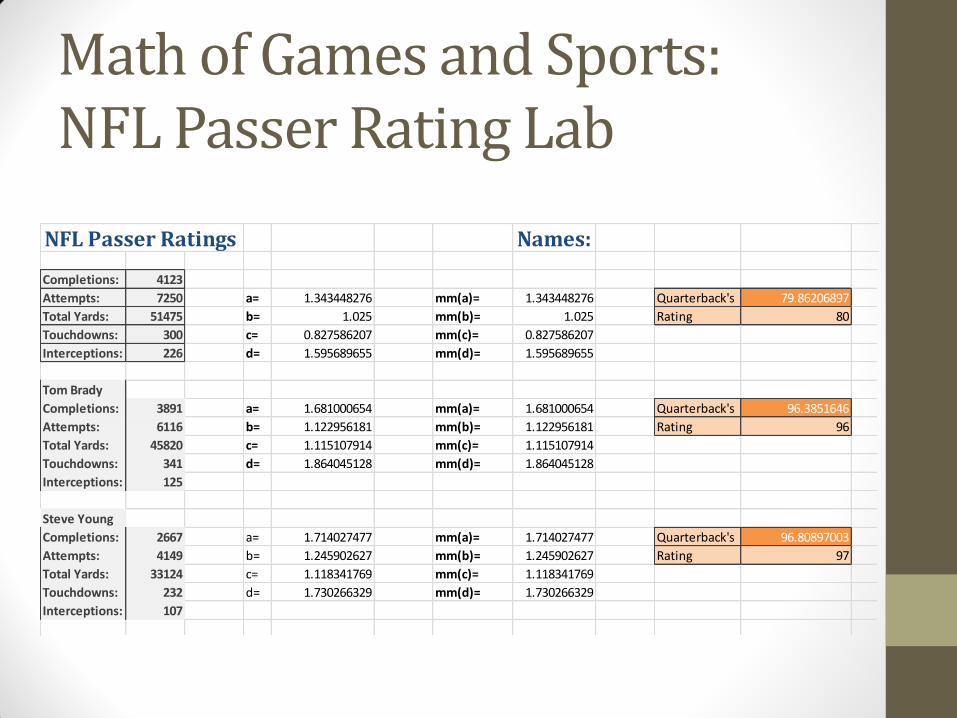
Math of Games and Sports: NFL Passer Rating Lab
NFL Passer Ratings Names:
Completions: 4123
Attempts: 7250 a= 1.343448276 mm(a)= 1.343448276 Quarterback's 79.86206897
Total Yards: 51475 b= 1.025 mm(b)= 1.025 Rating 80
Touchdowns: 300 c= 0.827586207 mm(c)= 0.827586207
Interceptions: 226 d= 1.595689655 mm(d)= 1.595689655
Tom Brady
Completions: 3891 a= 1.681000654 mm(a)= 1.681000654 Quarterback's 96.3851646
Attempts: 6116 b= 1.122956181 mm(b)= 1.122956181 Rating 96
Total Yards: 45820 c= 1.115107914 mm(c)= 1.115107914
Touchdowns: 341 d= 1.864045128 mm(d)= 1.864045128
Interceptions: 125
Steve Young
Completions: 2667 a= 1.714027477 mm(a)= 1.714027477 Quarterback's 96.80897003
Attempts: 4149 b= 1.245902627 mm(b)= 1.245902627 Rating 97
Total Yards: 33124 c= 1.118341769 mm(c)= 1.118341769
Touchdowns: 232 d= 1.730266329 mm(d)= 1.730266329
Interceptions: 107

NFL Passer Rating: recognizing a problem
NFL Passer Ratings Names:Elway
Completions: 4123
Attempts: 7250 a= 1.343448276 mm(a)= 1.343448276 Quarterback's
Total Yards: 51475 b= 1.025 mm(b)= 1.025 Rating 79.86206897
Touchdowns: 300 c= 0.827586207 mm(c)= 0.827586207
Interceptions: 226 d= 1.595689655 mm(d)= 1.595689655
Max(Min(2,5),4)=4
Manning
Completions: 117 a= 2.25 mm(a)= 2.25
Attempts: 156 b= 1.605769231 mm(b)= 1.605769231
Total Yards: 1470 c= 2.051282051 mm(c)= 2.051282051
Touchdowns: 16 d= 2.375 mm(d)= 2.375
Interceptions: 0
Quarterback's
Rating 138.034188
Rivers
Completions: 105 a= 2.197183099 mm(a)= 2.197183099
Attempts: 142 b= 1.360915493 mm(b)= 1.360915493
Total Yards: 1199 c= 1.549295775 mm(c)= 1.549295775 Quarterback's
Touchdowns: 11 d= 2.022887324 mm(d)= 2.022887324 Rating 24316.66667 Something is wrong here- this is way out of bounds!
Interceptions: 2 The formula you want is the one in the cell right below:
118.838
I chose Manning and Rivers becuase they have the highest ratings in the data
I found for the 2013 season. I think that their data will be s imilar to eachother but di fferent then Elway's because his is
based on his career, not just a season.
source:
http://espn.go.com/nfl/statistics/player/_/stat/passing/sort/quarterbackRating
Accoring to my data, Rivers would "win" because he has a higher quarterback's
rating. This does not seem like a fair assesment because Rivers has a lower amont of completes, arrempts, total yards and touchdowns then Manning does. i noticed that in the data for a ll the parameters Rivers scores are lower, so i t does not make
sence that he has a higher rating. It doesn't- it's far enough off that you should be suspicious.
completion: a forward pass that is sucessfully caught attempts: # of times the pass is tried tota l yards: # of yards completed by the playertouchdows: # of touchdowns made
interceptions: # of time the passes were intercepted

Data in different formats
2001, 14
y = -0.3377x + 692.81 0
10
20
30
40
1980 1985 1990 1995 2000 2005
HR
To
tals
Years
Cal Ripken's Home Runs per Season
1
8
11
1
0 to 9 10 to 19 20 to 29 30 to 39
Cal Ripken's Home Runs per Season

What is slope, anyway?

What is slope, anyway?

“Cracking the Scratch Lottery Code” from Wired magazine

Alas, no big money for us this year!
We did carefully analyze a much simpler scratch ticket using Excel

Analyzing our own scratch tickets
prizes total prizes prob. of ind. payout payout summands
2000 25 5.89424E-06 1999 0.011782583
1000 36 8.4877E-06 999 0.008479216
500 57 1.34389E-05 499 0.006705993
100 584 0.000137689 99 0.013631252
50 1591 0.000375109 49 0.018380358
30 2877 0.000678309 29 0.01967096
15 5648 0.001331626 14 0.018642769
10 14354 0.003384236 9 0.030458124
5 98797 0.023293323 4 0.093173293
2 289287 0.068205063 1 0.068205063
1 390045 0.09196073 0 0
803301 0.28912961 -0.81061
expected value -0.52148

Conditional Probability in Blackjack

Another blackjack response

Who is faster?

Students’ attitudes towards mathematics
• Attitudinal survey administered to all students in MATH 111 and MATH 112 in Fall 2013.
• Once in September, once in December.
• Items from existing attitudinal instruments, including
• Fennema & Sherman
• Dartmouth Mathematics Attitude Survey
• Students responded to 16 statements:
e.g., “Mathematics is very interesting to me, and I enjoy math courses.”
Strongly agree/Somewhat agree/Somewhat disagree/Strongly disagree
• Some examples…

I like exploring problems using real data and computers.
0
0.1
0.2
0.3
0.4
0.5
0.6
0.7
StronglyAgree
SomewhatAgree
SomewhatDisagree
StronglyDisagree
Math 112 Statistics
Pre
Post
0
0.1
0.2
0.3
0.4
0.5
0.6
0.7
StronglyAgree
SomewhatAgree
SomewhatDisagree
StronglyDisagree
MATH 111 Math of Daily Life
Pre
Post

I am comfortable applying math to real world situations.
0
0.1
0.2
0.3
0.4
0.5
0.6
0.7
Strongly Agree SomewhatAgree
SomewhatDisagree
StronglyDisagree
Daily Life
0
0.1
0.2
0.3
0.4
0.5
0.6
0.7
Strongly Agree SomewhatAgree
SomewhatDisagree
StronglyDisagree
Statistics

I believe that mathematics is useful in the real world.
0
0.1
0.2
0.3
0.4
0.5
0.6
0.7
Strongly Agree SomewhatAgree
SomewhatDisagree
StronglyDisagree
Daily Life
0
0.1
0.2
0.3
0.4
0.5
0.6
0.7
Strongly Agree SomewhatAgree
SomewhatDisagree
StronglyDisagree
Statistics
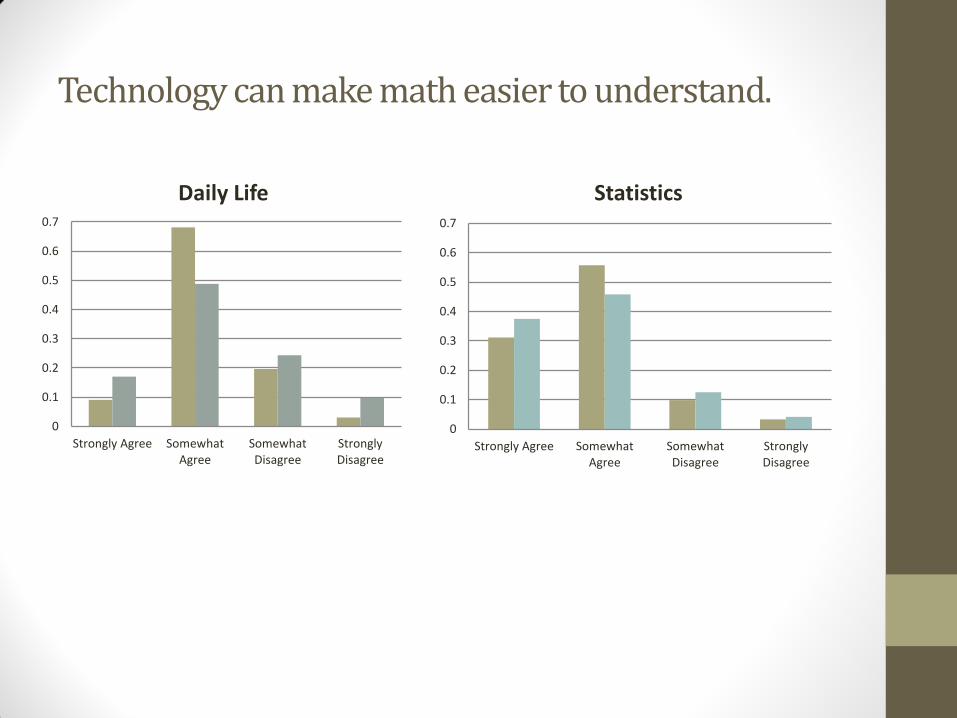
Technology can make math easier to understand.
0
0.1
0.2
0.3
0.4
0.5
0.6
0.7
Strongly Agree SomewhatAgree
SomewhatDisagree
StronglyDisagree
Daily Life
0
0.1
0.2
0.3
0.4
0.5
0.6
0.7
Strongly Agree SomewhatAgree
SomewhatDisagree
StronglyDisagree
Statistics
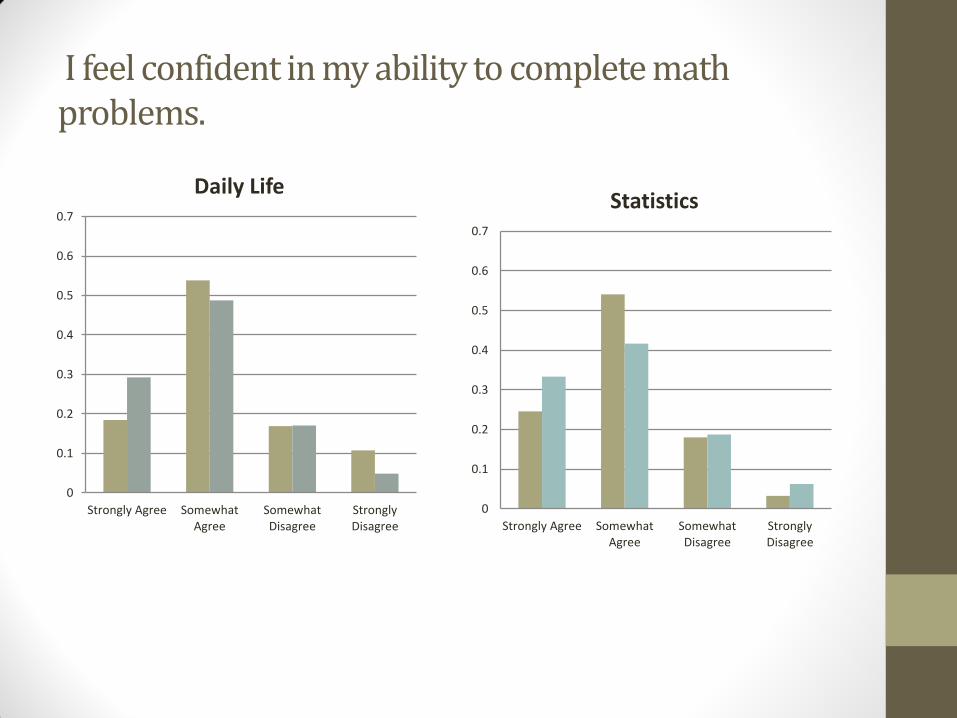
I feel confident in my ability to complete math problems.
0
0.1
0.2
0.3
0.4
0.5
0.6
0.7
Strongly Agree SomewhatAgree
SomewhatDisagree
StronglyDisagree
Daily Life
0
0.1
0.2
0.3
0.4
0.5
0.6
0.7
Strongly Agree SomewhatAgree
SomewhatDisagree
StronglyDisagree
Statistics

Conclusions
• We are doing a good job of creating assignments that address the learning objectives.
• For the most part, students are meeting those objectives.
• Especially for the attitudes survey, perhaps we should use a different sort of assessment.
• Instructors did not address attitudes explicitly in their classes.
• We need to do a better job of articulating to instructors what evidence to collect.
• Adjunct instructors cannot be expected to put in a lot of time on assessment; we need a clear, streamlined process.
• We will re-examine our learning objectives; perhaps we need to address the use of technology explicitly.

References, thanks
• National Numeracy Network
• MAA SIGMAA QL
• Fennema-Sherman attitudes survey
• Dartmouth math attitudes survey
• Numerous papers, books, reports about QL