standard operating procedures thermo environmental ... · standard operating procedures thermo...
TRANSCRIPT

TEI Model 43C-TLE SO2 Analyzer SOP Version No. 2.0 May 6, 2009 Page 1 of 30
1.0 Title Page
Standard Operating Procedures
Thermo Environmental Instruments Model 43C Trace Level Pulsed Fluorescence Sulfur Dioxide Analyzer
Approvals: _______________________ _________________ Author Date _______________________ _________________ OAQPS QA Manager Date _______________________ _________________ OAQPS Project Manager Date _______________________ _________________ OAQPS QA Coordinator Date Annual Review by:
Date of Review:
NOTICE: This Standard Operating Procedure is written for use with the above named analyzer or system at the EPA/OAQPS/AAMG Burdens Creek ambient air monitoring site located in Research Triangle Park, North Carolina.

TEI Model 43C-TLE SO2 Analyzer SOP Version No. 2.0 May 6, 2009 Page 2 of 30
2.0 Table of Contents
1.0 Title Page ......................................................................................................................... 1
2.0 Table of Contents............................................................................................................. 2
3.0 Introduction...................................................................................................................... 5
3.1 Scope................................................................................................................................ 5
3.2 Method Description ......................................................................................................... 5
3.3 Interferences..................................................................................................................... 5
3.4 Data Quality Objectives................................................................................................... 6
3.5 Personnel Qualifications and Training............................................................................. 7
4.0 Health and Safety Procedures .......................................................................................... 7
4.1 Preventing Personal Injury............................................................................................... 7
4.2 Cautions ........................................................................................................................... 7
5.0 Siting and Sampling......................................................................................................... 9
5.1 Site Characteristics........................................................................................................... 9
5.2 Air Sample Routing ......................................................................................................... 9
5.3 Equipment and Supplies .................................................................................................. 9
6.0 43C-TLE Analyzer Installation, Operation, Calibration, and Maintenance .................. 11
6.1 Overview........................................................................................................................ 11
6.2 Startup............................................................................................................................ 13
6.2.1 Analyzer setup ............................................................................................................... 13
6.2.2 Tubing and gas delivery................................................................................................. 13
6.2.3 Electrical connections .................................................................................................... 13
6.3 Operation and Range Setting ......................................................................................... 14
6.3.1 Display ........................................................................................................................... 14
6.3.2 Run Screen ..................................................................................................................... 14
6.3.3 Range Displays .............................................................................................................. 14
6.4 Diagnostic Checks ......................................................................................................... 14
6.5 Initial and Periodic Multipoint Calibration.................................................................... 15
6.5.1 Pre-calibration checks.................................................................................................... 17
6.5.2 Adjustment to Zero Air.................................................................................................. 17

TEI Model 43C-TLE SO2 Analyzer SOP Version No. 2.0 May 6, 2009 Page 3 of 30
6.5.3 Adjustment to Calibration Gas (Span point).................................................................. 18
6.5.4 Multipoint Calibrations.................................................................................................. 18
6.5.4.1 Frequency of calibrations............................................................................................... 19
6.5.4.2 Periodic Quality Control Checks ................................................................................... 19
7.0 Routine Site Visits ......................................................................................................... 19
7.1. Inspect Shelter Condition and Status ............................................................................. 19
7.2 Operational Requirements for Entering the Station....................................................... 19
7.3 Data Acquisition Systems.............................................................................................. 20
7.4 Calibration System......................................................................................................... 22
7.5 Return Systems to Monitoring Mode............................................................................. 23
7.6 Other Maintenance Checks ............................................................................................ 24
7.7 Operational Requirements—Exiting the Station ........................................................... 24
8.0 Quality Indicators........................................................................................................... 24
8.1 Precision Evaluation ...................................................................................................... 24
8.2 Bias Evaluation .............................................................................................................. 25
8.3 Representativeness......................................................................................................... 25
8.4 Completeness ................................................................................................................. 25
8.5 Comparability ................................................................................................................ 25
8.6 Method Detection Limits ............................................................................................... 25
8.7 Measurement Quality Objectives................................................................................... 25
9.0 Quality Assessments ...................................................................................................... 28
9.1 Performance Evaluation Audits ..................................................................................... 28
9.2 Technical Systems Audits.............................................................................................. 28
9.3 Procedures in the Event of an Audit Failure.................................................................. 28
10.0 Preventive Maintenance................................................................................................. 29
10.1 Instrument Troubleshooting........................................................................................... 29
11.0 References...................................................................................................................... 30

TEI Model 43C-TLE SO2 Analyzer SOP Version No. 2.0 May 6, 2009 Page 4 of 30
List of Figures Figure 1. Front Panel of the TEI 43C-TLE SO2 Analyzer. .......................................................... 12 Figure 2. General Schematic for TEI Model 43C-TLE SO2 Analyzer. ....................................... 12 Figure 3. Data Form for Diagnostic and Quality Control Checks for the TEI 43C-TLE SO2
Analyzer...................................................................................................................... 16 Figure 4. ENVIDAS FW Dynamic Tabular Channel Display..................................................... 21 Figure 5. ESC 8832 Main Menu Display..................................................................................... 22
List of Tables Table 1. Operating Parameters for the TEI 43C-TLE SO2 Analyzer .......................................... 17 Table 2. Measurement Quality Objectives for Sulfur Dioxide: Burdens Creek Site................... 26 Table 3. Preventive Maintenance Schedule for the TEI 43C-TLE.............................................. 29
TEI Model 43C-TLE SO2 Analyzer SOP Version No. 2.0 May 6, 2009 Page 5 of 30 3.0 Introduction
This standard operating procedure (SOP) document describes the procedures used by members of the Ambient Air Monitoring Group (AAMG) to operate a continuous sulfur dioxide (SO2) analyzer at the Environmental Protection Agency, Office of Air Quality Planning and Standards (EPA OAQPS) Burdens Creek monitoring site located in Research Triangle Park, North Carolina. The procedures given in this SOP are to be used in conjunction with the monitoring site’s Quality Assurance Project Plan (QAPP), the latest information published in the Code of Federal Regulations, and the Operator’s manual for the Thermo Environmental Instruments Model 43C-Trace Level (TEI 43C-TLE) SO2 analyzer . 3.1 Scope
For trace level measurement of SO2 the analyzer must have a sensitive detector. The Thermo Electron Corporation model 43C-TLE combines proven detection technology and advanced diagnostics for the determination of trace levels of SO2. This SOP will describe the monitor and its operation. 3.2 Method Description
The Model 43C-TLE Trace Level operating principle is based on measuring the emitted fluorescence of SO2 produced by the absorption of ultraviolet (UV) light. Pulsating UV light is focused through a narrow band-pass filter mirror allowing only light wavelengths of 190 to 230 nm to pass into the fluorescent chamber. SO2 absorbs light in this region without any quenching by air or most other molecules found in polluted air. The SO2 molecules are excited by UV light and emit a characteristic decay radiation. A second filter allows only this decay radiation to contact a photomultiplier tube (PMT). Electronic signal processing transfers the light energy impinging on the PMT into a voltage which is directly analyzed. Specifically, SO2 + hν1 → SO2 * → SO2 + hν2 (equation 1) where: hν1 = incidence light, hν2 = fluoresced light, and SO2* = SO2 in its excited state 3.3 Interferences
Interferences are physical or chemical entities that cause measurements to be higher (positive) or lower (negative) than they would be without the entity. The most common source of interference is from other gases that fluoresce in a similar fashion to
TEI Model 43C-TLE SO2 Analyzer SOP Version No. 2.0 May 6, 2009 Page 6 of 30 SO2 when exposed to UV light. The most significant of these is a class of hydrocarbons called polynuclear aromatic hydrocarbons (PAH). These hydrocarbons are removed via the hydrocarbon “kicker”.
Nitric oxide (NO) fluoresces in a spectral range close to SO2. Interference from NO is addressed by the presence of the band pass filter, which allows only the wavelengths emitted by the excited SO molecules to reach the PMT. 3.4 Data Quality Objectives
The Burdens Creek site provides the EPA/OAQPS/AAMG with the ability to test new monitoring and data acquisition/data transfer technologies and to train monitoring organizations in these technologies. Data are gathered at the Burdens Creek site in a manner similar to state, local, and tribal monitoring organizations in order to assist or guide others and to test the ability of two data acquisition systems to transfer data to information management programs like AIRNow and the AQS system. Sulfur dioxide will be measured year-round on a range setting of 0 to 100 ppb and reported at a minimum frequency of one-hour averages.
The decision rule for determining the quality of the Burdens Creek SO2 data is not based on comparison to the National Ambient Air Quality Standard (NAAQS), but rather on whether or not the data meet the measurement quality objectives of precision and bias. Precision and bias will be estimated from the quality control (QC) precision checks that are made automatically by the calibration system or manually by the site operator at least every two weeks.
The Burdens Creek site will use the data quality objectives (DQOs) developed by EPA for determining whether or not a particular monitoring system is performing properly and what corrective actions might be needed. The goal for acceptable measurement uncertainty for trace-level SO2 measurements is defined for precision as an upper 90 percent confidence limit for the coefficient variation (CV) of 10 percent, for bias as an upper 95 percent confidence limit for the absolute bias of 10 percent, and a data completeness of 90 percent (with a required completeness of at least 75 percent). Thus, the Burdens Creek site data set will be assumed to have met the DQO if the measurement quality objectives (MQO) of 10% or better for precision and 10% or better for bias are consistently met over the months and years of site operation. A tabular presentation of the MQOs for SO2 is given in Table 2 of Section 8.

TEI Model 43C-TLE SO2 Analyzer SOP Version No. 2.0 May 6, 2009 Page 7 of 30 3.5 Personnel Qualifications and Training
The person(s) assigned to operate the 43C-TLE SO2 analyzer should receive classroom instructions, hands-on sampler training, and safety briefings from an experienced site operator. The desired qualifications for an operator include: a good understanding of basic chemistry and electronics; understanding of digital circuitry; coursework and/or experience in ambient air data processing and validation. 4.0 Health and Safety Procedures
Sulfur dioxide (SO2) is a colorless, nonflammable gas that has a strong suffocating odor. Sulfur dioxide can be detected by taste and odor in ambient air at concentrations as low as 0.3 ppm. Higher levels of SO2 can result in temporary breathing impairment for asthmatic children and adults who are active outdoors. The SO2, or any other calibration span gas, should be vented to the atmosphere rather than into the shelter or other sampling areas. If this is impossible, limit operator exposure to SO2 by getting fresh air every 5 to 10 minutes. The operator must leave the area immediately if he experiences light headedness, headache or dizziness. 4.1 Preventing Personal Injury
To prevent personal injury, the following warnings and cautions must be observed when operating the 43C-TLE.
1. Always unplug the analyzer when servicing or replacing parts.
2. Always use a third ground wire on all instruments.
3. If it is mandatory to work inside an analyzer while it is in operation, use extreme caution to avoid contact with high voltages. The analyzer has a 110- Volt Alternating Current (VAC) power supply. Refer to the manufacturer's instruction manual and know the precise locations of the VAC components before working on the instrument.
4. Avoid electrical contact with jewelry. Remove rings, watches, bracelets, and
necklaces to prevent electrical burns. 4.2 Cautions
To prevent damage to the analyzer, the following precautions should be taken:
1. Wear an anti-static wrist strap that is properly connected to earth ground (note that when the analyzer is unplugged, the chassis is not at earth ground).

TEI Model 43C-TLE SO2 Analyzer SOP Version No. 2.0 May 6, 2009 Page 8 of 30
2. If an anti-static wrist strap is not available, be sure to touch a grounded metal object before touching any internal components.
3. Handle all printed circuit boards by the edge.
4. Carefully observe the instructions in each procedure specified in Chapter 7
(Servicing) of the owner’s manual.
5. Normally, if Teflon™ filters are used in the sample train, cleaning the optical bench will not be required. However, in the event that the bench is cleaned, be careful to avoid damaging the interior of the sample chamber. Use extreme caution when cleaning or servicing the sample chamber(s). In addition the mirrors are very fragile; avoid dropping the instrument. This may damage, misalign or crack the mirrors and cause expensive repairs.
6. Keep the interior of the analyzer clean.
7. Inspect the system regularly for structural integrity.
8. To prevent major problems with leaks, make sure that all sampling lines are
reconnected after required checks and before leaving the site;
9. Inspect tubing for cracks and leaks.
10. It is recommended that the analyzer be leak checked after replacement of any pneumatic parts.
11. If cylinders are used in tandem with mass flow control (MFC) calibrators, use
and transport is a major concern. Gas cylinders can sometimes contain pressures as high as 2000 pounds per square inch (psi). Handling of cylinders must be done in a safe manner. If a cylinder is accidentally dropped and valve breaks off, the cylinder can become explosive or a projectile.
12. Transportation of cylinders is regulated by the Department of Transportation
(DOT). It is strongly recommended that all agencies contact the DOT or Highway Patrol to learn the most recent regulations concerning transport of cylinders;
13. It is possible (and practical) to blend other compounds with SO2. If this is the
case, it is recommended that MSDS for all compounds be made available to all staff that use and handle the cylinders or permeation tubes.

TEI Model 43C-TLE SO2 Analyzer SOP Version No. 2.0 May 6, 2009 Page 9 of 30
14. Shipping of cylinders is governed by the DOT. Contact the DOT or your local courier about the proper procedures and materials needed to ship high-pressure cylinders.
5.0 Siting and Sampling 5.1 Site Characteristics
The Burdens Creek site is located within 0.5 mile of the EPA/OAQPS facility in
Research Triangle Park, NC. The site is adjacent to Alexander Drive and N.C. Route 147 and is intended to represent a neighborhood scale location. The site conforms to many of the network and siting requirements for air monitoring as stated in Title 40 of the Code of Federal Regulations (CFR), Part 58, Appendix D (40 CFR Part 58, Appendix D). While the site is like an NCore site in many respects, it is not intended to be an officially approved NCore site. 5.2 Air Sample Routing
The SO2 sample inlet probe is an inverted glass funnel, located on the roof of the shelter, approximately 5 meters above ground level. The funnel inlet is greater than 1 meter vertically and horizontally away from any supporting structures; the drip-line of the nearest tree is greater than 20 meters from the probe inlet. Sampling for trace level SO2 is performed by using a vacuum pump to continuously draw ambient air from the station’s glass sampling manifold directly into the analyzer. The air inlet probe and sampling manifold for SO2 monitoring are designed so that residence time in the assembly is less than 20 seconds; a squirrel-cage blower maintains airflow through the manifold to meet this residence time requirement as specified in 40 CFR Part 58, Appendix E. 5.3 Equipment and Supplies TEI 43C-TLE SO2 Analyzer: The Burdens Creek site uses the TEI 43C-TLE SO2 analyzer. For this site, its range is typically set to 0 to 100 ppb (0 to 0.1 ppm). All fittings and tubing associated with the delivery of ambient air SO2 samples, or calibration and QC gases, are composed of Teflon or glass. The features of the analyzer are fully described in the operator’s manual. The three main components of the 43C-TLE are the:
Pneumatic System: consists of sample inlet line, particulate filter, hydrocarbon scrubber/kicker, dryer (if needed), sample cell, reaction chamber, flowmeter, and pump, all used to bring ambient air samples to the analyzer inlet.
Analytical System: consists of the UV source with the associated source filters, lenses, and optics, as well as the light baffles, the detector (photomultiplier tube), and bandpass filters.

TEI Model 43C-TLE SO2 Analyzer SOP Version No. 2.0 May 6, 2009 Page 10 of 30
Electronic Hardware: consists of the electronic components that control the analyzer and process the signals. This part of the analyzer generally requires little or no maintenance. If the 43C-TLE is operated above the manufacturer's recommended temperature limit individual integrated chips can fail and cause problems with data storage or retrieval.
Instrument Shelter: A shelter is required to protect the analyzer from
precipitation and adverse weather conditions, maintain operating temperature within a ± 2 °C range within the analyzer's temperature range requirements, and provide security and electrical power. The acceptable shelter temperature range is 20-30 °C. An ideal range of temperature control would be 25 ± 1 °C.
Calibration System: The Burdens Creek site uses a model 9100 Environics® calibration system to create concentrations of SO2 by diluting the contents of a NIST traceable compressed gas cylinder. For details on the operation of the calibration system, refer to the Environics Operator’s Manual and to the SOP “Standard Operating Procedures, Environics Series 9100, Computerized Ambient Monitoring Calibrations System. The compress gas cylinders at the site are multi-blend mixture of the target analytes with a nitrogen base. The zero air at the site is produced by pumping room air through an Advanced Pollution Instruments (API) model 701 zero air module. The zero air required for the calibration of the 43C-TLE must contain no detectable SO2 (i.e., SO2
content must be less than the lowest detectable limit [LDL] of the SO2 analyzer) and be free of particulate matter. The API 701 uses a charcoal scrubber and a Purafil scrubber to assure SO2-free air. All gas must be delivered to the instrument at atmospheric pressure.
DAS: The ENVIDAS for Windows (EFW) data system is the primary digital data acquisition system for the Burdens Creek site. The ENVIDAS system uses non-proprietary desktop or industrial personal computer hardware to run flexible, Windows-based data acquisition software. Data can be averaged, archived, displayed, and reported in various formats, including display of data as an “electronic strip chart.” ENVIDAS is designed to communicate with and control a variety of precursor gas analyzers and dynamic dilution calibrators. The ESC 8832 data logger is used as the backup system for recording analog data at the Burdens Creek station. For more details, refer to the individual ENVIDAS or ESC 8832 operator’s manual and to the Burdens Creek SOP for DAS operations.
Wiring, Tubing and Fittings: Teflon™ and borosilicate glass are inert materials that should be used exclusively throughout the ambient air intake system. Because it is expensive, hard to clean and can develop micro-cracks that are difficult to detect, stainless steel tubing should be avoided. It is recommended that Polytetrafluoroethylene (PTFE) or Fluoroethylpropylene (FEP) Teflon™ tubing be used. PTFE or FEP Teflon is the best choice for the connection between the intake manifold and the 43C-TLE inlet. Examine the tubing and discard if particulate matter has collected on the tube’s interior.

TEI Model 43C-TLE SO2 Analyzer SOP Version No. 2.0 May 6, 2009 Page 11 of 30 All fittings and ferrules should be made of Teflon™ or stainless steel. Connection wiring to the DAS should be shielded two-strand wire or RS-232 cables for digital connections.
Reagents and Standard: The TEI 43C-TLE does not require any reagents since the instrument uses photometry to analyze for SO2. All gas calibration and quality control concentrations are obtained by dynamic dilution of the compressed gas from cylinders whose contents are traceable to a NIST Standard Reference Material (SRM).
Spare Parts and Incidental Supplies: See Chapter 5 (Preventive Maintenance) and Chapter 7 (Servicing) in the TEI 43C-TLE operating manual for lists of recommended spare parts and replacement subassemblies. 6.0 43C-TLE Analyzer Installation, Operation, Calibration, and Maintenance 6.1 Overview
The TEI 43C-TLE instrument has a front panel screen with digital display. The screen and a set of push button operating switches located below it allow the user to check functions, switch operating parameters, adjust zero and span, and read warnings messages.
Caution: It is extremely important that the users familiarize themselves with the menus available. Inadvertently changing parameters within the analyzer can damage the instrument and possibly invalidate data as well. Please reference the TEI 43C-TLE owner’s manual and read it carefully before adjusting any parameters that are set by the factory.
Chapter 2.0 of the operator’s manual must be consulted to understand or carry out
the following initial setup procedures, including:
Χ How to unpack and inspect the exterior and interior of the analyzer, Χ Setup procedures for making pneumatic connections for sample and calibration
gases, and Χ How to make electrical connections for: output, status outputs, control inputs,
serial ports, and other features.
Refer to Figure 1 for an illustration of the analyzer’s front panel. Figure 2 shows a general schematic of the 43C-TLE.

TEI Model 43C-TLE SO2 Analyzer SOP Version No. 2.0 May 6, 2009 Page 12 of 30
Figure 1. Front Panel of the TEI 43C-TLE SO2 Analyzer.
Figure 2. General Schematic for TEI Model 43C-TLE SO2 Analyzer. The 43C-TLE instrument operates in the following fashion:
1. In sample mode, the sample is drawn into the analyzer through the “SAMPLE” bulkhead. The sample flows through a hydrocarbon “kicker,” which operates on a selective permeation principle, allowing only hydrocarbon molecules to pass through the tube wall. The driving force for the hydrocarbon removal is the differential partial pressure across the wall. This differential pressure is produced within the instrument by passing the sample gas through a capillary tube to reduce its pressure and feeding it into the shell side of the hydrocarbon kicker. The SO2 molecules pass through the hydrocarbon “kicker” unaffected.

TEI Model 43C-TLE SO2 Analyzer SOP Version No. 2.0 May 6, 2009 Page 13 of 30
2. The sample flows into the fluorescence chamber, where pulsating UV light excites the SO2 molecules. The condensing lens focuses the pulsating UV light into the mirror assembly. The mirror assembly contains eight selective mirrors that reflect only the wavelengths which excite SO2 molecules.
3. As the excited SO2 molecules decay to lower energy states they emit UV light
that is proportional to the SO2 concentration. The band pass filter allows only the wavelengths emitted by the excited SO2 molecules to reach the PMT. The PMT detects the UV light emission from the decaying SO2 molecules. The photo detector, located at the back of the fluorescence chamber, continuously monitors the pulsating UV light source and is connected to a circuit that compensates for fluctuations in the UV light.
4. The sample then flows through a flow sensor, a capillary, and the shell side of
the hydrocarbon “kicker.” The 43C-TLE outputs the SO2 concentration to the front panel display and the analog or digital outputs.
6.2 Startup
6.2.1 Analyzer setup After the analyzer is removed from the shipping container and placed on a sturdy
bench top or in an instrument rack, remove the outer cover and any packing material from the internal compartment. Next, the internal components should be inspected for damage. Check that all connectors and printed circuit boards are firmly attached. After reinstallation of the instrument cover, sample lines are connected to the “SAMPLE” bulkhead on the rear panel.
6.2.2 Tubing and gas delivery
All tubing should be constructed of Teflon™ with an outside diameter (OD) of ¼ inch and a minimum inside diameter (ID) of ⅛ inch. The length of the tubing should be less than 10 feet. For delivery of gases at atmospheric pressure it might be necessary to use an atmospheric bypass plumbing arrangement or to attach the analyzer inlet line to a ambient air intake manifold that is vented to the atmosphere. An exhaust line of the same dimensions as previously noted is connected to a suitable vent. For proper analyzer operation, it is essential that no tubing be restricted or kinked.
6.2.3 Electrical connections
The 43C-TLE is supplied with a three-wire grounding cord. Under no circumstances should this grounding system be defeated. The instrument must be plugged into an outlet of the appropriate voltage and frequency. For these specifications, see page 1-3 in Chapter 1 of the operator’s manual. A grounded power strip that has

TEI Model 43C-TLE SO2 Analyzer SOP Version No. 2.0 May 6, 2009 Page 14 of 30 surge protection could also be used. It is also advisable to use an Uninterrupted Power Supply (UPS) which in addition to protecting the analyzer from power surges will keep it running until an operator can shut it down. Connect the analyzer to the DAS using the rear panel terminals. Use the power rocker switch to turn the instrument on. 6.3 Operation and Range Setting
Refer to Chapter 3 of the operator’s manual for detailed descriptions and views of the pushbuttons, menus and displays. When the power to the instrument is turned on, the exhaust fan and the front panel display will come on. Next, the central processing unit (CPU) will boot the system and load the firmware. While an overnight warm-up is recommended, a minimum 30-minute warm-up time should occur before proceeding.
6.3.1 Display
The front panel of the instrument has a 4 line by 20 character alphanumeric display that shows the sample concentration, instrument parameters, instrument controls and help/warning messages. The pushbuttons on the front panel are used to access the menu driven software. Some menus contain more items that can be displayed at one time. If this is the case, the ↑ and ↓ pushbuttons are used to move the cursor through the available choices.
6.3.2 Run Screen
Once the instrument loads the firmware, the display will show the SO2 concentration in the “RUN” mode. The instrument should always be left in the RUN mode when it is collecting ambient data. Press the “Menu” button to access the main menu.
6.3.3 Range Displays Use the down arrow to move to the “Range” sub-menu. Press “Enter.” The “Range” sub-menu contains the concentration units (ppb), SO2 ranges, or the custom ranges. In the upper right corner of the display, the word “SINGLE”, “DUAL”, or AUTO” is displayed to indicate the active mode. The default is the “SINGLE” mode. Refer to page 3-6 of the operator’s manual for more information concerning the details of each of these range modes. 6.4 Diagnostic Checks
Diagnostic checks to determine whether the 43C-TLE is working properly should
be performed every time the site is visited—even though the purpose of the visit may be to work with another instrument. The diagnostic checks for the 43C-TLE can be conducted manually or by using the computer software.
TEI Model 43C-TLE SO2 Analyzer SOP Version No. 2.0 May 6, 2009 Page 15 of 30
By pressing the “MENU” button and following the menu tree, the desired location can be easily reached. Note that because the TEI 43C-TLE has set upper and lower ranges for some of these diagnostic checks, the operator’s manual should be referenced for working with these ranges. Use the following instructions to manually perform the diagnostic checks.
1. While in the “RUN” mode, press the “MENU” button. This will put you into the main menu.
2. From the main menu use the ↑ and ↓ pushbuttons to move the cursor down so
that the arrow is next to “Diagnostics” selection. Press “Enter.”
3. In the “Diagnostics Menu’, toggle the arrow using the ↑ and ↓ pushbuttons to align the arrow to the diagnostic to be evaluated. To view the results, press “Enter.” Record the information on a diagnostic data form. Figure 3 is the diagnostics data form used at the Burdens Creek site to record the results of the quality control and maintenance checks. The top portion of the form is used to record the diagnostic checks. The latter section is used to record the results of the QC checks discussed in Section 7 of this SOP.
4. Press “MENU” and then “RUN” to return the analyzer to the main menu.
Once the diagnostic checks have been established and recorded for the 43C-TLE, it is time to check the calibration of the analyzer and, if required or scheduled, to calibrate the instrument.
6.5 Initial and Periodic Multipoint Calibration
The next step is to conduct an initial or periodic adjusted multipoint (MP) calibration of the 43C-TLE analyzer. Adjusted MP calibrations are conducted every 90 days. Before beginning the calibration process, ensure that both the ENVIDAS FW DAS and the ESC 8832 DAS are set “off line.” This section of the SOP will describe how to compare and adjust the digital response of the 43C-TLE to various calculated concentrations of SO2. The calibration points are generated by diluting a higher concentration of SO2 from a NIST-traceable calibration gas to a target concentration. The recommended ranges for the MP calibration points are detailed in Table 1. As each calibration point is generated, the responses shown by the DAS should be compared to the calculated value. If the difference exceeds +/-5%, the instrument’s response should be adjusted as detailed in the following sections.

TEI Model 43C-TLE SO2 Analyzer SOP Version No. 2.0 May 6, 2009 Page 16 of 30
Environmental Protection Agency
Quality Control and Maintenance Records TEI 43C-TLE SO2 Analyzer
Site Name/Location Date Time Technician Instrument ID# Date of Last Calibration TEI Diagnostics Actual Reading Acceptance Criteria Acceptable? Range 0-100 ppb
Averaging Time 10-300 seconds
SO2 background 0-10 ppb
SO2 Span Coefficient 0.800-1.200
PMT Voltage ~-600 V
Lamp voltage 500-1200V
Power (+5/+15/-15/Battery) ±0.1V, >3.0V
Internal Temperature 8-47 °C
Chamber Temperature 43-47 °C
Chamber Pressure 650-760 mm Hg
Sample Flow 0.5-1.0 L/min
UV Lamp Intensity 10,000-50,000 Hz
Change Particle Filter Y□ N□ Respan
Quality Control Results
Calibrator Type/SN Certification Date Expiration Date
STD#, PPM, PSIG ________ Certification Date _____ Expiration Date
Unadjusted 3-point Calibration Unadjusted M-P Calibration Adjusted M-P Calibration Zero point + 0.2 ppb □Y □N Precision Point + 10% of expected value □Y □N All calibration points ± 5% □Y □N EFW Regression Criteria: XY (0.9800 < M <1.0200) ______ (-1.0000 <B< 1.0000) ______ R2 (> .9950) _______ Comments: __________________________________
Figure 3. Data Form for Diagnostic and Quality Control Checks for the TEI 43C-TLE SO2 Analyzer
Point #
Expected SO2, ppb
Actual
Calibrator, ppb (Y)
Observed 1-min. average,
ppb EFW (X)
Observed 1-minute average,
ppb, ESC
% Deviation EFW
% Deviation ESC
1 2 3 4 5 6

TEI Model 43C-TLE SO2 Analyzer SOP Version No. 2.0 May 6, 2009 Page 17 of 30 Table 1. Operating Parameters for the TEI 43C-TLE SO2 Analyzer
6.5.1 Pre-calibration checks
Prior to conducting any calibrations, it is important to ensure that the analyzer is
properly warmed up and leak-free. To ensure proper operation, the maintenance procedures described in Section 10 of this SOP should be reviewed and conducted as necessary. Chapters 5 and 7 in the owner’s manual should be reviewed too.
6.5.2 Adjustment to Zero Air The instrument response to zero air is adjusted by performing the following steps:
1. For a minimum of 15 minutes, allow the instrument to sample zero air from a
manifold that is at atmospheric pressure. 2. Before any adjustments to the instrument can be made, the instrument must be
put into “LOCAL” mode. This is done by pressing “ENTER” while the instrument is displaying the “RUN” screen. Pressing “ENTER” while in the “RUN” mode enables the operator to toggle between “REMOTE” and “LOCAL” modes.
3. Bring up the main menu by pressing the “MENU” button on the front panel of
the instrument. From the main menu, use the ↑ or ↓ button to move the cursor to align with “Calibration” on the screen; press “ENTER”.
4. Continue to press the arrow button(s) until the cursor is aligned with the
“Calibrate Zero” position on the screen; press “ENTER.” The bottom of the display will flash the message “SAVING PARAMETER(S)” and the SO2
Item Range Comments
Units Parts per billion (ppb) Recommended
Full scale range 0 to 100 ppb Suggested range.
Compressed gas cylinder 10-15 ppm NIST traceable EPA Protocol #1 cylinder.
Calibration point:
a. zero 0-0.1 ppb There are a number of commercially available vendors of zero air sources.
b. Level 1 span 80 – 90 ppb NIST traceable EPA Protocol #1 cylinder.
c. Midpoint span 40 - 50 ppb NIST traceable EPA Protocol #1 cylinder.
d. Precision point 5 – 10 ppb NIST traceable EPA Protocol #1 cylinder.

TEI Model 43C-TLE SO2 Analyzer SOP Version No. 2.0 May 6, 2009 Page 18 of 30
reading will be added to the background correction (see page 3-17 of the owner’s manual).
5. Press “MENU” to return to the “Calibration” sub-menu. The baseline is now
adjusted to reflect the instrument’s response to zero air.
6.5.3 Adjustment to Calibration Gas (Span point)
The instrument response to the NIST traceable calibration gas is adjusted by performing the following steps:
1. Adjust the Environics® 9100 calibration unit to generate a known concentration of SO2. Allow the instrument to sample calibration gas from a manifold that is at near atmospheric pressure for a minimum of 15 minutes.
2. As instructed earlier, before any adjustments to the instrument can be made,
the instrument must be put into “LOCAL” mode. Pressing “ENTER” while in the “RUN” mode enables the operator to toggle between “REMOTE” and “LOCAL” modes.
3. At the calibration screen press the ↓ ↑ buttons until the cursor aligns with the
“Calibrate Span” selection; press “ENTER” to display the ”Calibrate span” screen.
4. The first line of the display shows the current SO2 concentration reading. The
second line shows the instrument range and the third line is where the SO2 concentration is entered. Use the “↓↑→←” buttons on the front panel to enter the concentration that is being generated by the calibration system. Press “ENTER” to calibrate the instrument to the SO2 span gas. The bottom of the display will flash the message “SAVING PARAMETER(S),” and the corrected SO2 reading will be displayed.
5. Press “MENU” to return to the calibration sub-menu, and then press “RUN.”
The zero and span of the instrument are now set.
6.5.4 Multipoint Calibrations
Use the calibration system instructions given in Section 7.4 to continue generating the desired concentrations that fall within the calibration ranges shown in Table 1. Record the data in the lower section of the data form shown in Figure 3. Generate a linear regression by plotting the analyzer response against the calculated concentration. Observe that the calculated values for the regression parameters do not exceed the regressions limits: slope (M), 0.9800 < M < 1.0200; intercept (B), -1.0000<B < 1.0000, and R2 > 0.9950.

TEI Model 43C-TLE SO2 Analyzer SOP Version No. 2.0 May 6, 2009 Page 19 of 30
6.5.4.1 Frequency of calibrations
At the Burdens Creek site, the multipoint calibrations are performed: every three months; any time any major disassembly or servicing of components is performed; and any time that zero or span checks give results outside of the performance criteria.
6.5.4.2 Periodic Quality Control Checks
Periodic quality control checks (i.e., zero, span, and precision checks) may be conducted at the Burdens Creek site during a routine site visit by the operator responsible for the SO2 monitoring operations. The details for conducting these checks are provided in Section 7.
7.0 Routine Site Visits
Visits to the Burdens Creek site to check the SO2 analyzer and other equipment are made biweekly. Pollutant monitors for oxides of nitrogen, ozone, and carbon monoxide, as well as other site systems are usually checked on a routine schedule. Listed below are site visit procedures that pertain to the TEI 43C-TLE SO2 analyzer and the supporting monitoring equipment. To be able to carry out these checks it is necessary that the site visitor be fully trained and familiar with operator’s manuals for all equipment and with their specific SOPs. Any findings indicating the need for analyzer maintenance or recalibration must be recorded in the site logbook and reported to the site supervisor. 7.1. Inspect Shelter Condition and Status
When visiting the site by vehicle, park the vehicle well away from the ambient air sampling inlet to avoid contamination from exhaust emissions. Before entering the Burdens Creek shelter, conduct a visual survey of the site; checking the external sampling lines for cleanliness and integrity; check the meteorological tower components, and search for any evidence of damage or vandalism to the shelter and sample inlets. 7.2 Operational Requirements for Entering the Station
When entering the station, observe the operational requirements posted on the far
wall of the monitoring station.
1. Sign in the site logbook with your name, the time and date, the purpose of the visit, etc.
2. Check the room temperature displayed on the digital temperature sensor
located on the far side of the station. Record the reading in the logbook. If

TEI Model 43C-TLE SO2 Analyzer SOP Version No. 2.0 May 6, 2009 Page 20 of 30
the temperature is markedly different from the usually 24 to 26 °C range or is outside the 20 to 30°C limits, record these observations and report the findings to the station supervisor.
Note: Cold conditions inside the shelter can cause condensation of water vapor
inside the glass sampling manifold and inside Teflon sampling tubing. If visual observation shows water condensation, notify the site supervisor promptly and take action to reset the shelter temperature, remove the condensed water, and conduct analyzer calibration checks.
3. Before running the diagnostic check on the SO2 analyzer, observe the
ENVIDAS FW display to verify that all systems in the station are operating properly. Conduct a visual check of each analyzer’s front panel display for reasonableness of the pollutant concentrations and for indications of FAULT or other messages. Make a notation in the station logbook that the checks were made and write down any FAULT or message indicating out-of-tolerance conditions for any analyzer.
4. Determine and make a notation of the type of calibration to be executed. The
unadjusted 3-point calibration is conducted every two weeks. The adjusted multipoint calibration is conducted every 90 days.
7.3 Data Acquisition Systems
Parallel data acquisition systems are used for data collection at the Burdens Creek site. Use the keypad for each system to link to the data logger. On the ENVIDAS FW (EFW) use the keypad to activate the channel selection screen (Figure 4). The screen will promptly display all the parameters being monitored by the EFW system. The screen updates every 5 seconds. To view the past day’s data, click on the icon for the “Reporter” program to bring up the data. Compare the instantaneous values displayed by the EFW to those displayed on the front panel of the 43C-TLE. The values should be identical.

TEI Model 43C-TLE SO2 Analyzer SOP Version No. 2.0 May 6, 2009 Page 21 of 30
Figure 4. ENVIDAS FW Dynamic Tabular Channel Display
When conducting calibration checks, the data acquisition systems must be set “off line.” Go to the EFW configuration menu, enter the username “a” (no password required), locate the channel associated with the instrument, change the online status to “Off” or “Off-Scan”, and then SAVE the changes to the channel.
Next, activate the ESC 8832 DAS by pressing any key on its laptop keypad. The main display screen for the ESC is shown in Figure 5. Verify that the “Digi-Trend Scheduler” program is running by looking for the red clock icon on the program tray. Click on “Stop Scheduler” to prevent the program from attempting to communicate through the serial port while it is being used for manual communications in Link to Logger.
At the main menu, type the operator’s initials in the “User Name” field. No password is required. Click on the “ESC” logo. Select “OK”, select version 540S, go to the Utilities screen, and select “Link to Logger.” Log in by entering the letter “L” and then enter the password, “EPA”. Within the configuration menu (“C”), select Disable/Mark Channel Offline (“M”), and toggle the appropriate data channel with the space bar, thus turning the instrument to “disabled” to prevent non-valid data from being recorded as valid.

TEI Model 43C-TLE SO2 Analyzer SOP Version No. 2.0 May 6, 2009 Page 22 of 30
Figure 5. ESC 8832 Main Menu Display
Finally, turn the ambient air solenoid to the SO2 analyzer to the “normally closed” position to provide calibration air to the analyzer. To do this go to the “setup” of the EFW, select:
Χ view, Χ dynamic data, Χ input/output, and then Χ click the circle corresponding to the SO2 analyzer and listen for the sound of the
solenoid switching on (circle changes from clear to red). 7.4 Calibration System
The dynamic calibration system used at the Burdens Creek site is an Environics® Series 9100. The instrument can be programmed to automatically perform a zero, span, and precision check, and multipoint calibrations of ambient analyzers. Programming is executed using the pushbuttons located on the front panel. The front panel also has a backlit 25 line by 80 character liquid crystal display. To conduct an unadjusted, 3-point calibration, set the calibrator so that it produces only zero air:
Χ access the concentration mode on the calibrator by pushing the “F1” button, Χ adjust the SO2 concentration to read 0.000 ppm, Χ push “F1” again.
The SO2 analyzer is now sampling zero air. Observe the display on the calibrator
and the responses of the data acquisition systems until stable readings are shown for each instrument. For this zero air response, record all of the information requested in the

TEI Model 43C-TLE SO2 Analyzer SOP Version No. 2.0 May 6, 2009 Page 23 of 30 quality control results section of the data form used to record the diagnostic information (Figure 3). If the responses are out of limits, refer to Chapter 6 of the operator’s manual for instructions on troubleshooting the SO2 analyzer.
On the Environics® calibrator, adjust the SO2 concentration to 90% of full-scale, wait for stable readings from the calibrator and each DAS. Record the values observed for the stable readings from each device on the data form.
Set a new concentration on the calibrator for a precision check (5-10 ppb).
Record the values once stable readings are displayed on the instruments. Set the concentration back to zero and observe the responses shown on the DAS’s. The instrument zero response (baseline) can optionally be adjusted at this time using the procedure specified in section 6.5.2.
If an unadjusted three point calibration (zero, span, precision) is being conducted, no further actions are necessary except for scheduled maintenance actions such as changing a particulate filter. If an unadjusted multipoint calibration is being performed, complete all the points specified on the data form and calculate a linear regression. Observe that each variable of the regression is within the specified limits; where for the slope (M), 0.9800 < M < 1.0200, for the intercept (B), -1.0000< B < 1.0000 and R2 > 0.9950. If the regression criteria are not met, determine a plan for troubleshooting the calibration system, the analyzer, and/or the data acquisition systems. Repeat the multipoint calibration (now an adjusted calibration) and use the instrument controls to adjust the 43C-TLE response to zero and span concentrations (sections 6.5.2 and 6.5.3) before completing the remainder of the specified points. 7.5 Return Systems to Monitoring Mode
Turn the ambient air solenoid to the SO2 analyzer to the “normally open” position to re-connect the analyzer to the ambient air stream. To do this go to the “setup” of the EFW, select:
Χ view, Χ dynamic data, Χ input/output, and then Χ click the circle corresponding to the SO2 analyzer and listen for the sound of the
solenoid switching off (circle changes from red to clear).
For the EFW DAS, put the “STATE” to “On” from “Off” or “Off-scan” for the appropriate channel. Finally, stop the Environics calibrator and set it to “READY” mode.
For the ESC 8832 DAS, within the configuration menu (“C”), select Enable/Mark Channel Online (“E”), and toggle the appropriate data channel with the space bar, thus turning the instrument to “enabled” to commence the collection of ambient. Use the

TEI Model 43C-TLE SO2 Analyzer SOP Version No. 2.0 May 6, 2009 Page 24 of 30 <Esc> key to back out of the 8832 menu and logoff from the unit with the “O” menu choice. Exit from the E-DAS menu program and restart the Scheduler program. 7.6 Other Maintenance Checks
In accordance with the biweekly schedule, change the particle filter on the SO2 analyzer(s). When finished, allow the instrument(s) to sample zero air and return to stable readings. Finally, set all instrument back to on-line conditions (i.e., sampling ambient air). See Section 10 of this SOP for a discussion of preventive maintenance activities. 7.7 Operational Requirements—Exiting the Station
As a final check before leaving the station, review the operational requirements posted on the door. Make sure that the following conditions are in place:
Χ Environics calibrator is in “Ready Mode” Χ Manifold solenoid is turned off Χ EFW DAS channel STATE is on Χ ESC DAS channel is enabled Χ Normalcy of EFW readings are verified
8.0 Quality Indicators Quality control for continuous electronic instruments, such as the TEI 43C-TLE SO2 analyzer consists of performing the diagnostic checks, maintenance and calibrations as discussed earlier in this document. In Section 6, Figure 3 presented an example of a data form for recording QC and maintenance information that was developed by the EPA for the 43C-TLE. In addition, information in Table 1, which shows the recommended operation parameters for the 43C-TLE, should be reviewed. The operating parameters include the suggested operating range, calibration ranges, and recommended cylinder concentrations. The following sections note the criteria for the quality indicators, precision, bias, representativeness, completeness, and comparability for monitoring SO2 at the Burdens Creek. 8.1 Precision Evaluation Precision is defined as the measure of agreement among individual measurements of the same property taken under the same conditions. For SO2, this refers to testing the 43C-TLE at concentrations between 5 and 10 ppb. The test must be performed, at a minimum, once every two weeks. The measured precision point must agree with the expected value within ±10%. The Burdens Creek site data set will be assumed to have met the DQO if the measurement quality objective (MQO) of 10% or better for precision is consistently met over the months and years of site operation.

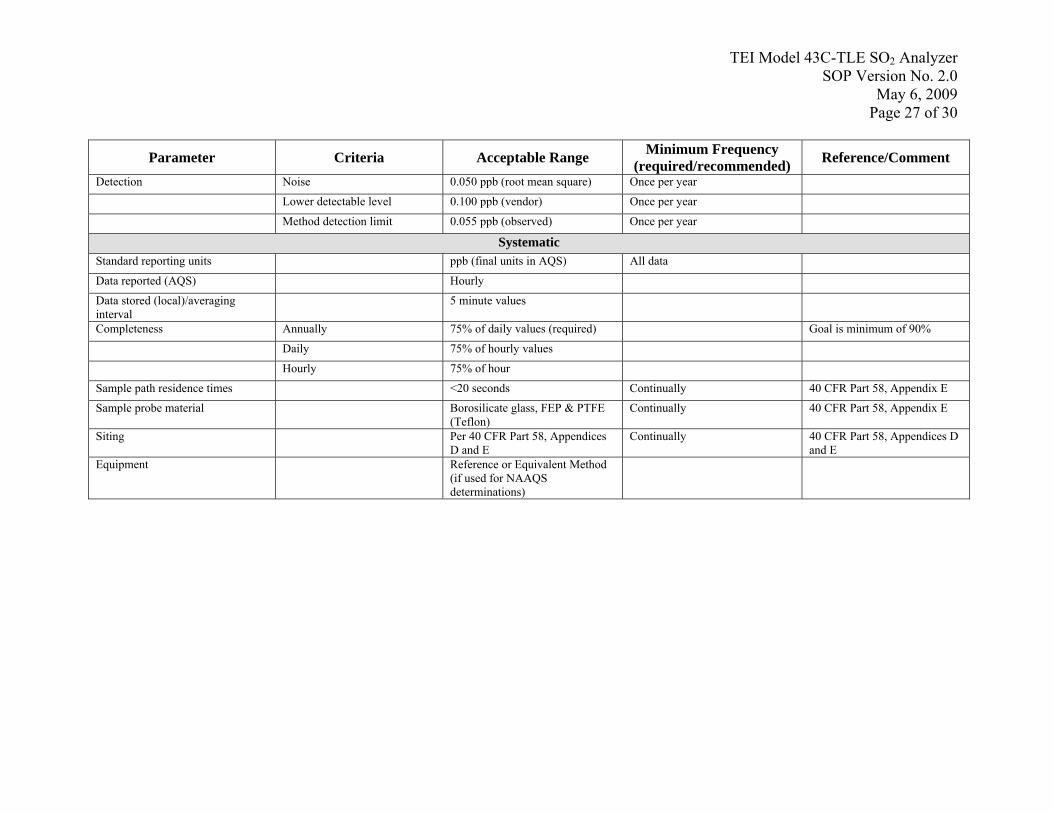
TEI Model 43C-TLE SO2 Analyzer SOP Version No. 2.0 May 6, 2009 Page 25 of 30 8.2 Bias Evaluation Bias is defined as the degree of agreement between a measured value and the true, expected, or accepted value. For SO2, this refers to testing the 43C-TLE at various concentrations between the level of the precision point and more upscale calibration concentrations. The test must be performed, at a minimum, once every two weeks. The Burdens Creek site data set will be assumed to have met the DQO if the measurement quality objective (MQO) of 10% or better for bias is consistently met over the months and years of site operation. 8.3 Representativeness Representativeness refers to whether the data collected accurately reflect the conditions being measured. It is the data quality indicator most difficult to quantify. Unless the samples are truly representative, the other indicators are meaningless. Since the NCore siting criteria are generally intended to represent neighborhood, urban, or regional scales, the SO2 trace level criteria are the same. The National Monitoring Strategy, available on the AMTIC web site, discusses representativeness aspects of NCore monitoring sites. 8.4 Completeness Completeness is defined as the amount of data collected compared to a pre-specified target amount. For SO2, EPA requires a minimum completeness of 75% with a goal of at least 90% data capture. Typical completeness of data capture by the TEI 43C-TLE SO2 analyzer should exceed 90% under normal conditions. 8.5 Comparability Comparability is defined as the process of collecting data under conditions that are consistent with those used for other data sets of the same pollutant. The TEI 43C-TLE meets the MQOs for a trace level SO2 instrument. 8.6 Method Detection Limits The method detection limit (MDL) or detectability refers to the lowest concentration of a substance that can be reliably determined by a given procedure. At the Burdens Creek site, the TEI 43C-TLE analyzer has exhibited an observed MDL of 0.055 ppb of SO2. (5) 8.7 Measurement Quality Objectives Table 2 is a tabular presentation of the MQOs for SO2 set for the Burdens Creek site.

TEI Model 43C-TLE SO2 Analyzer SOP Version No. 2.0 May 6, 2009 Page 26 of 30
Table 2. Measurement Quality Objectives for Sulfur Dioxide: Burdens Creek Site
Parameter Criteria Acceptable Range Minimum Frequency (required/recommended) Reference/Comment
Critical Precision (single analyzer)
5-10 ppb Percent difference: ±10% Bi-weekly
Zero/span check-level 1 Zero drift: 0.20 ppb Span drift: 10%
Daily
Operational Shelter temperature 20 to 30 °C or operate instrument
according to manufacturer’s specifications
Daily (hourly values) 40 CFR Part 53.20
Temperature control Ideal range of temperature control would be 25 ± 1 °C
≤ ±3°C over 24 hours Daily (hourly average) digital temperature recording recommended
Precision and bias (Site Level)
Precision : 90%, CV < 10% Absolute bias estimate: ±10%
Independent performance audit (NC-DAQ)
Mean concentration level Mean absolute difference ≤ 10%
Once per year if no NPAP
Federal performance audit (NPAP) Mean concentration level Mean absolute difference ≤ 10%
Once per year
Technical systems audit (EPA Regional Office and OAQPS/AAMG)
At least once every 3 years
Calibration (GPT capable) Multipoint calibration (at least 4 points including zero)
Slope: 1.00 ± 0.020, Intercept: ± 1.0 ppb, R2: 0.9950
Upon receipt, after repair or adjustment, or once every 90 days
Zero air < 0.1 ppb Annual zero air purity check Check zero air generator against an independent standard
Gaseous standards NIST Traceable 10-15 ppm ± 1%
Gaseous dilution systems (mass flow controller)
0-20 L/min for zero air 0-100cc/min gas flow
Accuracy ± 1% (NIST traceable) Linearity: ± 1% Precision: ± 1%
Once per 6 months Verify air and gas flows with a NIST traceable primary or secondary standard. If a secondary standard is used, it must be certified against a NIST primary standard annually.
TEI Model 43C-TLE SO2 Analyzer SOP Version No. 2.0 May 6, 2009 Page 27 of 30
Parameter Criteria Acceptable Range Minimum Frequency (required/recommended) Reference/Comment
Detection Noise 0.050 ppb (root mean square) Once per year
Lower detectable level 0.100 ppb (vendor) Once per year
Method detection limit 0.055 ppb (observed) Once per year
Systematic Standard reporting units ppb (final units in AQS) All data
Data reported (AQS) Hourly
Data stored (local)/averaging interval
5 minute values
Completeness Annually 75% of daily values (required) Goal is minimum of 90%
Daily 75% of hourly values
Hourly 75% of hour
Sample path residence times <20 seconds Continually 40 CFR Part 58, Appendix E
Sample probe material Borosilicate glass, FEP & PTFE (Teflon)
Continually 40 CFR Part 58, Appendix E
Siting Per 40 CFR Part 58, Appendices D and E
Continually 40 CFR Part 58, Appendices D and E
Equipment Reference or Equivalent Method (if used for NAAQS determinations)

TEI Model 43C-TLE SO2 Analyzer SOP Version No. 2.0 May 6, 2009 Page 28 of 30 9.0 Quality Assessments 9.1 Performance Evaluation Audits
A performance evaluation (PE) is a quantitative comparison of results between the Burdens Creek equipment and an independent audit system brought to the site. The audit system produces gas concentrations that are assayed by the 43C-TLE SO2 analyzer. The responses of the on-site analyzer are then compared against the calculated concentration from the independent audit system and a linear regression is generated.
The PE is conducted through the EPA Regional Office by means of participation in the National Performance Audit Program (NPAP). The Burdens Creek/Ambient Air Monitoring Group will participate in the NPAP on an annual basis. When NPAP audits are not available, performance evaluations will be performed through a cooperative agreement with the North Carolina Division of Air Quality, Raleigh, NC. An acceptable audit result requires that the average difference between the designated audit values and the site’s SO2 analyzer be no greater than 10 percent. A through-the-probe audit may be a component of the PE. If so, known concentrations of SO2 will be introduced at the outside ambient air inlet of the station and will traverse the all tubing and the sampling manifold from which the 43C-TLE analyzer samples. 9.2 Technical Systems Audits
A technical systems audit (TSA) is a thorough, systematic, on-site qualitative examination of facilities, equipment, training, technical procedures, record-keeping activities, data validation, data management, and reporting aspects of a monitoring station or system. Evaluation of the Burdens Creek site’s SO2 measurement system is a component of monitoring site operations. Ideally, technical systems audits are conducted by the EPA Regional Office at least once every 3 years.
The OAQPS/AAMG also performs an annual internal technical systems audit of
the site operations. For this type of assessment, the AAMG will use the technical systems audit forms found in Appendix 15 of the Quality Assurance Handbook for Air Pollution Measurement Systems, Volume II, Part 1. 9.3 Procedures in the Event of an Audit Failure
An unacceptable audit result (average difference between the designated audit values and the site’s SO2 analyzer greater than 10 percent) must be followed up with appropriate corrective action. These actions may include:
Χ Repeating the audit with another independent calibrator and/or gas standard

TEI Model 43C-TLE SO2 Analyzer SOP Version No. 2.0 May 6, 2009 Page 29 of 30
Χ Verification of the station calibrator flow calibration and/or gas standard certification
Χ Investigating potential leaks between audit device(s) and instrument and/or calibration manifold
Χ Insuring that sufficient audit airflow is being provided for a through-the-probe audit, or that the station manifold blower has been disconnected as necessary
Χ Reviewing analyzer diagnostics and/or review of maintenance procedures to investigate instrument malfunction
Once the source of the audit discrepancy has been identified and corrected, the
audit should be repeated to obtain an acceptable result with the average difference between the designated audit values and the site’s SO2 analyzer of no greater than 10 percent. 10.0 Preventive Maintenance Preventive maintenance should be a deterrent to down-time and data loss. Table 3 lists the preventive maintenance events that are should be performed. A list of spare parts the operator should keep in stock is shown on page 5-1 of the owner’s manual. Table 3. Preventive Maintenance Schedule for the TEI 43C-TLE
Event Frequency Check diagnostics (if not available remotely) Bi-weekly Visual inspection and cleaning Bi-annually Inspect particulate filter Weekly Replace sample particulate filter Bi-weekly to monthly based on ambient
particulate levels Perform QC gas challenge Bi-weekly (daily recommended) Capillary inspection and replacement Bi-annually Perform flow check Bi-annually Inspect and clean fan Bi-annually Lamp voltage check Bi-annually
10.1 Instrument Troubleshooting The TEI 43C-TLE manual has an excellent troubleshooting guide in Chapter 6 of the manual. For details on using the Test Functions for predicting failures, please refer to this section.

TEI Model 43C-TLE SO2 Analyzer SOP Version No. 2.0 May 6, 2009 Page 30 of 30 11.0 References
1. Standard Operating Procedures. Thermo Electron Corporation Model 43C-TLE Trace Level SO2 Instrument. Version 1.10, Final. March 17, 2005
2. Ambient Air Surveillance, Code of Federal Regulations. Title 40, Part 58. 3. Model 43C Pulsed Fluorescence SO2 Analyzer. Instruction Manual P/N 13399.
THERMO Electron Corporation Environmental Instruments. 27 Forge Parkway. Franklin, Massachusetts 02038.
4. Technical Assistance Document (TAD) for Precursor Gas Measurements in the
NCore Multi-pollutant Monitoring Network. Version 4. U.S. Environmental Protection Agency. Office of Air Quality Planning and Standards. Emissions, Monitoring, and Analysis Division. Research Triangle Park, North Carolina. 27711. EPA-454/R05-003. September 2005.
5. SO2 Precursor Gas Monitoring Training Overview (as posted on
www.epa.gov/ttn/amtic). Lewis Weinstock and Solomon Ricks. U.S. EPA. Office of Air quality Planning and Standards. June 5-6, 2007.