standard operating procedures for residential pesticide ...€¦ · standard operating procedures...
TRANSCRIPT
Standard Operating Procedures for Residential Pesticide Exposure Assessment
October 2012
Health Effects Division Office of Pesticide Programs
Office of Chemical Safety and Pollution Prevention U.S. Environmental Protection Agency
Washington, DC

U.S. EPA Office of Pesticide Programs – Standard Operating Procedures for Assessing Residential Pesticide Exposure i
Preamble The 1996 Food Quality Protection Act (FQPA) expanded EPA risk assessment requirements under the Federal Insecticide Fungicide and Rodenticide Act (FIFRA) and the Federal Food, Drugs, and Cosmetics Act (FFDCA) by emphasizing protection of infants and children including combining exposures from all potential pathways. Its directive for pesticide assessments to provide “reasonable certainty that no harm will result from aggregate exposure to the pesticide chemical residue, including all anticipated dietary exposures and all other exposures for which there is reliable information” resulted in the Agency routinely conducting both aggregate and cumulative risk assessments. Aggregate risk assessments include all exposure pathways (i.e., food, drinking water, and residential non-dietary) and routes (i.e., oral, dermal, inhalation) to a single chemical. Cumulative risk assessments include all exposure pathways (i.e., food, drinking water, and residential) and routes (i.e., oral, dermal, inhalation) to multiple chemicals with a common mechanism of toxicity. In response, the Agency developed a series of science policies1 which included the initial version of its Standard Operating Procedures (SOPs) for Residential Exposure Assessments (i.e., “SOPs” or “Residential SOPs”) which addressed non-dietary exposure pathways. The SOPs were generally based on the Agency’s Exposure Assessment Guidelines.2 The document outlined a wide array of exposure scenarios that were intended to address all major possible means by which individuals in the general public could be exposed to pesticides in a residential environment (e.g., home, schools, parks, athletic fields or other publicly accessible locations). Some notable scenarios include children playing on treated lawns or homeowners spraying their gardens. Specifically tailored for each scenario, methods for estimating dermal, inhalation, and non-dietary oral exposure were presented including descriptions and sources for factors included in exposure algorithms. Due to some novel aspects and the overall groundbreaking nature of the SOPs, they were first presented to the FIFRA Scientific Advisory Panel (SAP) in 1997 with a follow-up review of some modifications in 1999.3 Since 1997, the SOPs have been used to assess exposure in residential settings for pesticide regulatory decisions within the Office of Pesticide Programs (OPP) as required under FQPA. This document represents the Agency’s revised set of Residential SOPs and was presented to the FIFRA SAP in 20094. In most cases, the exposure scenarios and basic algorithms remain the same with changes made only to the algorithm inputs using more recent data sources. However, some new scenarios have been added to this set of SOPs reflecting new products and uses and some existing scenarios have modified exposure algorithms. In addition, appendices for each SOP section provide extensive details on the underlying data that are recommended for the algorithm inputs. This information can provide the basis for future probabilistic exposure assessments.
1 http://www.epa.gov/oppfead1/trac/science/ 2 http://cfpub.epa.gov/ncea/cfm/recordisplay.cfm?deid=15263 3 http://www.epa.gov/scipoly/sap/meetings/1997/090997_mtg.htm#materials and http://www.epa.gov/scipoly/sap/meetings/1999/092199_mtg.htm 4 http://www.epa.gov/scipoly/sap/meetings/2009/100609meeting.html
U.S. EPA Office of Pesticide Programs – Standard Operating Procedures for Assessing Residential Pesticide Exposure ii
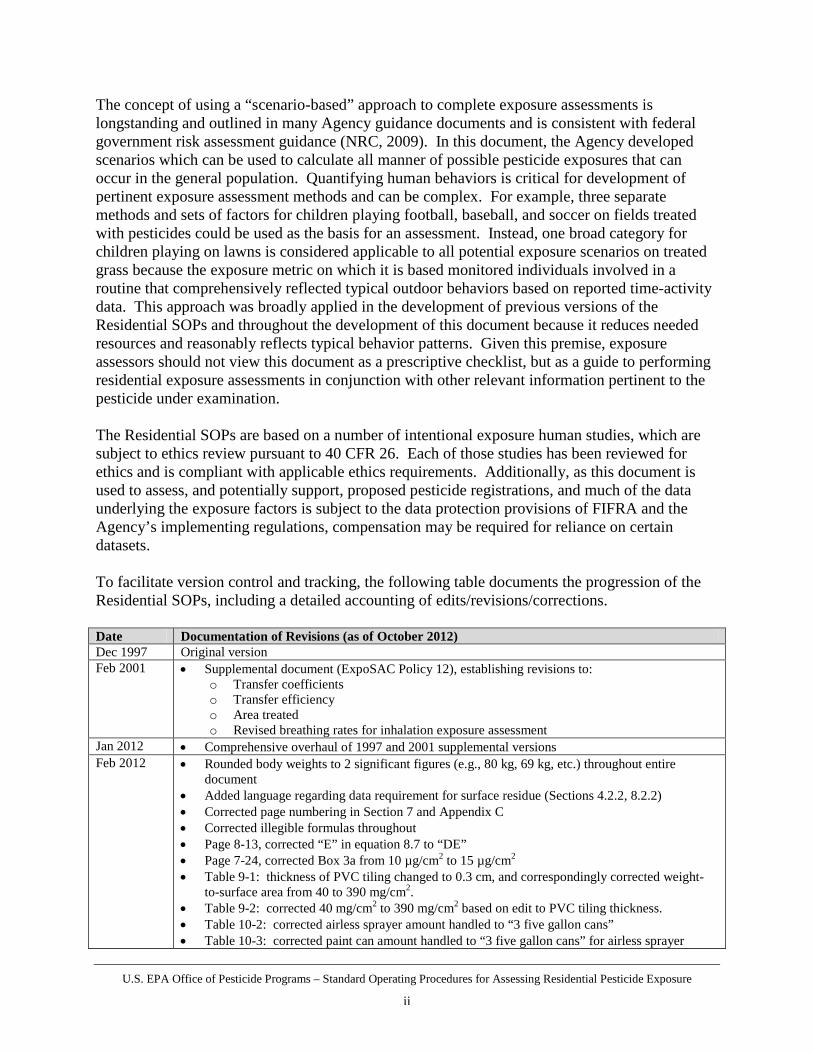
The concept of using a “scenario-based” approach to complete exposure assessments is longstanding and outlined in many Agency guidance documents and is consistent with federal government risk assessment guidance (NRC, 2009). In this document, the Agency developed scenarios which can be used to calculate all manner of possible pesticide exposures that can occur in the general population. Quantifying human behaviors is critical for development of pertinent exposure assessment methods and can be complex. For example, three separate methods and sets of factors for children playing football, baseball, and soccer on fields treated with pesticides could be used as the basis for an assessment. Instead, one broad category for children playing on lawns is considered applicable to all potential exposure scenarios on treated grass because the exposure metric on which it is based monitored individuals involved in a routine that comprehensively reflected typical outdoor behaviors based on reported time-activity data. This approach was broadly applied in the development of previous versions of the Residential SOPs and throughout the development of this document because it reduces needed resources and reasonably reflects typical behavior patterns. Given this premise, exposure assessors should not view this document as a prescriptive checklist, but as a guide to performing residential exposure assessments in conjunction with other relevant information pertinent to the pesticide under examination. The Residential SOPs are based on a number of intentional exposure human studies, which are subject to ethics review pursuant to 40 CFR 26. Each of those studies has been reviewed for ethics and is compliant with applicable ethics requirements. Additionally, as this document is used to assess, and potentially support, proposed pesticide registrations, and much of the data underlying the exposure factors is subject to the data protection provisions of FIFRA and the Agency’s implementing regulations, compensation may be required for reliance on certain datasets. To facilitate version control and tracking, the following table documents the progression of the Residential SOPs, including a detailed accounting of edits/revisions/corrections. Date Documentation of Revisions (as of October 2012) Dec 1997 Original version Feb 2001 • Supplemental document (ExpoSAC Policy 12), establishing revisions to:
o Transfer coefficients o Transfer efficiency o Area treated o Revised breathing rates for inhalation exposure assessment
Jan 2012 • Comprehensive overhaul of 1997 and 2001 supplemental versions Feb 2012 • Rounded body weights to 2 significant figures (e.g., 80 kg, 69 kg, etc.) throughout entire
document • Added language regarding data requirement for surface residue (Sections 4.2.2, 8.2.2) • Corrected page numbering in Section 7 and Appendix C • Corrected illegible formulas throughout • Page 8-13, corrected “E” in equation 8.7 to “DE” • Page 7-24, corrected Box 3a from 10 µg/cm2 to 15 µg/cm2 • Table 9-1: thickness of PVC tiling changed to 0.3 cm, and correspondingly corrected weight-
to-surface area from 40 to 390 mg/cm2. • Table 9-2: corrected 40 mg/cm2 to 390 mg/cm2 based on edit to PVC tiling thickness. • Table 10-2: corrected airless sprayer amount handled to “3 five gallon cans” • Table 10-3: corrected paint can amount handled to “3 five gallon cans” for airless sprayer
U.S. EPA Office of Pesticide Programs – Standard Operating Procedures for Assessing Residential Pesticide Exposure iii
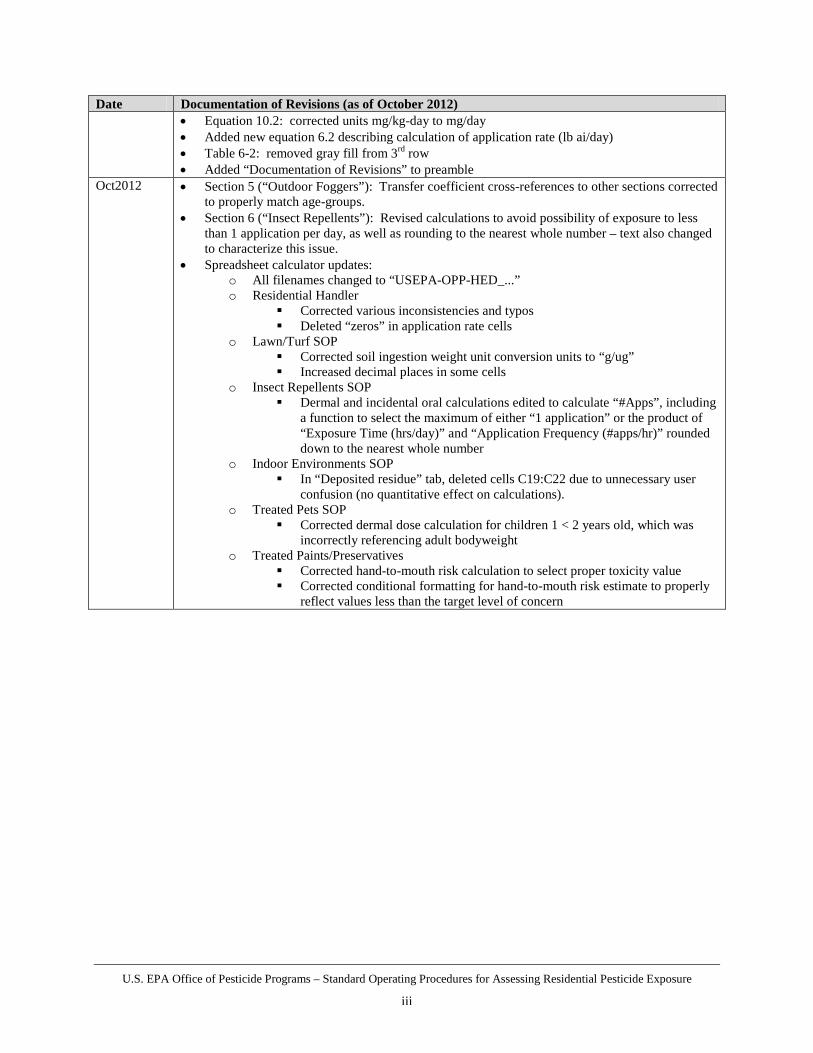
Date Documentation of Revisions (as of October 2012) • Equation 10.2: corrected units mg/kg-day to mg/day • Added new equation 6.2 describing calculation of application rate (lb ai/day) • Table 6-2: removed gray fill from 3rd row • Added “Documentation of Revisions” to preamble
Oct2012 • Section 5 (“Outdoor Foggers”): Transfer coefficient cross-references to other sections corrected to properly match age-groups.
• Section 6 (“Insect Repellents”): Revised calculations to avoid possibility of exposure to less than 1 application per day, as well as rounding to the nearest whole number – text also changed to characterize this issue.
• Spreadsheet calculator updates: o All filenames changed to “USEPA-OPP-HED_...” o Residential Handler
Corrected various inconsistencies and typos Deleted “zeros” in application rate cells
o Lawn/Turf SOP Corrected soil ingestion weight unit conversion units to “g/ug” Increased decimal places in some cells
o Insect Repellents SOP Dermal and incidental oral calculations edited to calculate “#Apps”, including
a function to select the maximum of either “1 application” or the product of “Exposure Time (hrs/day)” and “Application Frequency (#apps/hr)” rounded down to the nearest whole number
o Indoor Environments SOP In “Deposited residue” tab, deleted cells C19:C22 due to unnecessary user
confusion (no quantitative effect on calculations). o Treated Pets SOP
Corrected dermal dose calculation for children 1 < 2 years old, which was incorrectly referencing adult bodyweight
o Treated Paints/Preservatives Corrected hand-to-mouth risk calculation to select proper toxicity value Corrected conditional formatting for hand-to-mouth risk estimate to properly
reflect values less than the target level of concern

U.S. EPA Office of Pesticide Programs – Standard Operating Procedures for Assessing Residential Pesticide Exposure iv
Table of Contents
Section 1 Introduction ........................................................................................... 1-1
1.1 General Principles of Exposure Assessment .............................................................................. 1-2 1.2 Guidance on Residential Pesticide Usage .................................................................................. 1-3 1.3 Residential Exposure Assessment Guidance .............................................................................. 1-5
1.3.1 Potentially Exposed and Index Lifestages .................................................................... 1-6 1.3.2 Durations of Exposure .................................................................................................. 1-7 1.3.3 Handler Exposure ......................................................................................................... 1-9 1.3.4 Post-application Exposure .......................................................................................... 1-11 1.3.5 Combining Exposure Scenarios .................................................................................. 1-12 1.3.6 Exposure Uncertainty and Characterization ............................................................... 1-13 1.3.7 Ethical Considerations of Human Exposure Data ...................................................... 1-14 1.3.8 Deterministic Exposure Assessment Methodology .................................................... 1-14
Section 2 Universal Exposure Factors .................................................................. 2-1
2.1 Body Weight .............................................................................................................................. 2-1 2.2 Inhalation Rates .......................................................................................................................... 2-2 2.3 Body Surface Area ..................................................................................................................... 2-2 2.4 Fraction Hand Surface Area Mouthed (FM) ............................................................................... 2-4 2.5 Surface Area of Object Mouthed (SAMO) ................................................................................. 2-5 2.6 Fraction of Pesticide Extracted by Saliva (SE) .......................................................................... 2-5 2.7 Life Expectancy Averaging Time .............................................................................................. 2-5
Section 3 Lawns/Turf ............................................................................................. 3-1
3.1 Handler Exposure Assessment ................................................................................................... 3-2 3.2 Post-application Exposure Assessment ...................................................................................... 3-7
3.2.1 Post-application Inhalation Exposure Assessment ....................................................... 3-7 3.2.2 Post-application Dermal Exposure Assessment: Physical Activities on Turf .............. 3-7 3.2.3 Post-application Non-Dietary Ingestion Exposure Assessment: Hand-to-Mouth ...... 3-14 3.2.4 Post-application Non-Dietary Ingestion Exposure Assessment: Object-to-Mouth .... 3-18 3.2.5 Post-application Non-Dietary Ingestion Exposure Assessment: Incidental Soil
Ingestion ............................................................................................................... 3-22 3.2.6 Post-application Non-Dietary Ingestion Exposure Assessment: Episodic Granular
Ingestion ............................................................................................................... 3-24 3.2.7 Post-application Dermal Exposure Assessment: Mowing .......................................... 3-26 3.2.8 Post-application Dermal Exposure Assessment: Golfing ........................................... 3-30 3.2.9 Combining Post-application Scenarios ....................................................................... 3-35
Section 4 Gardens and Trees................................................................................. 4-1
4.1 Handler Exposure Assessment ................................................................................................... 4-2 4.2 Post-application Exposure Assessment ...................................................................................... 4-7
4.2.1 Post-application Inhalation Exposure Assessment ....................................................... 4-8 4.2.2 Post-application Dermal Exposure Assessment ........................................................... 4-8 4.2.3 Post-application Non-Dietary Ingestion Exposure Assessment ................................. 4-18

U.S. EPA Office of Pesticide Programs – Standard Operating Procedures for Assessing Residential Pesticide Exposure v
4.2.4 Combining Post-application Scenarios ....................................................................... 4-18
Section 5 Outdoor Fogging/Misting Systems ....................................................... 5-1
5.1 Outdoor Aerosol Space Sprays (OASS) ..................................................................................... 5-1 5.1.1 Handler Exposure Assessment ..................................................................................... 5-1 5.1.2 Post-application Exposure Assessment ........................................................................ 5-5 5.1.2.1 Post-application Inhalation Exposure Assessment ....................................................... 5-5 5.1.2.2 Post-application Dermal and Non-dietary Ingestion Exposure Assessment............... 5-11 5.1.2.3 Combining Post-application Scenarios ....................................................................... 5-13
5.2 Candles, Coils, Torches & Mats (CCTM) ................................................................................ 5-14 5.2.1 Handler Exposure Assessment ................................................................................... 5-14 5.2.2 Post-Application Exposure Assessment ..................................................................... 5-14 5.2.2.1 Post-application Inhalation Exposure Assessment ..................................................... 5-15 5.2.2.2 Post-application Dermal and Non-Dietary Ingestion Exposure Assessment .............. 5-20 5.2.2.3 Combining Post-application Scenarios ....................................................................... 5-21
5.3 Outdoor Residential Misting Systems (ORMS) ....................................................................... 5-21 5.3.1 Handler Exposure Assessment ................................................................................... 5-21 5.3.2 Post-Application Exposure Assessment ..................................................................... 5-25 5.3.2.1 Post-application Inhalation Exposure Assessment ..................................................... 5-25 5.3.2.2 Post-application Dermal and Non-dietary Ingestion Exposure Assessment............... 5-33 5.3.2.3 Combining Post-application Scenarios ....................................................................... 5-36
5.4 Animal Barn Misting Systems ................................................................................................. 5-36 5.4.1 Handler Exposure Assessment ................................................................................... 5-37 5.4.2 Post-application Exposure Assessment ...................................................................... 5-40 5.4.2.1 Post-application Inhalation Exposure Assessment ..................................................... 5-41 5.4.2.2 Post-application Dermal and Non-Dietary Ingestion Exposure Assessment .............. 5-46 5.4.2.3 Combining Post-application Scenarios ....................................................................... 5-50
Section 6 Insect Repellents .................................................................................... 6-1
6.1 Handler Exposure Assessment ................................................................................................... 6-1 6.2 Post-application Exposure Assessment ...................................................................................... 6-4
6.2.1 Post-application Inhalation Exposure Assessment ....................................................... 6-5 6.2.2 Post-application Dermal Exposure Assessment ........................................................... 6-5 6.2.3 Post-application Non-Dietary Ingestion Exposure Assessment: Hand-to-Mouth ..... 6-10 6.2.4 Combining Post-application Scenarios ....................................................................... 6-15
Section 7 Indoor Environments ............................................................................ 7-1
7.1 Handler Exposure Assessment ................................................................................................... 7-3 7.2 Post-application Exposure Assessment ...................................................................................... 7-7
7.2.1 Post-application Inhalation Exposure Assessment ....................................................... 7-8 7.2.1.1 Indoor Foggers .............................................................................................................. 7-9 7.2.1.2 Indoor Spray Applications .......................................................................................... 7-10 7.2.1.3 Termiticide Applications (Foundation and Soil Injection) ......................................... 7-15 7.2.2 Post-application Dermal Exposure Assessment ......................................................... 7-22 7.2.2.1 Post-Application Dermal Exposure Algorithm (hard surfaces and carpets) ............... 7-22 7.2.2.2 Post-Application Dermal Exposure Algorithm (mattresses) ...................................... 7-35
U.S. EPA Office of Pesticide Programs – Standard Operating Procedures for Assessing Residential Pesticide Exposure vi
7.2.3 Post-application Non-Dietary Ingestion Exposure Assessment: Hand-to-Mouth ..... 7-39 7.2.4 Post-application Non-Dietary Ingestion Exposure Assessment: Object-to-Mouth ... 7-43 7.2.5 Post-application Non-Dietary Ingestion Exposure Assessment: Dust Ingestion ....... 7-48 7.2.6 Combining Post-application Scenarios ....................................................................... 7-49
Section 8 Treated Pets ............................................................................................ 8-1
8.1 Handler Exposure Assessment ................................................................................................... 8-2 8.2 Post-application Exposure Assessment ...................................................................................... 8-5
8.2.1 Post-application Inhalation Exposure Assessment ....................................................... 8-5 8.2.2 Post-application Dermal Exposure Assessment ........................................................... 8-5 8.2.3 Post-application Non-Dietary Ingestion Exposure Assessment: Hand-to-Mouth ..... 8-12 8.2.4 Combining Post-application Scenarios ....................................................................... 8-16
Section 9 Impregnated Materials.......................................................................... 9-1
9.1 Handler Exposure Assessment ................................................................................................... 9-2 9.2 Post-Application Exposure Assessment ..................................................................................... 9-2
9.2.1 Post-Application Inhalation Exposure Assessment ...................................................... 9-2 9.2.2 Post-Application Surface Residue Concentration......................................................... 9-2 9.2.3 Post-Application Dermal Exposure Assessment .......................................................... 9-4 9.2.4 Post-Application Non-Dietary Ingestion Exposure Assessment: Object-to-Mouth
(Textiles Only) ....................................................................................................... 9-9 9.2.5 Post-Application Non-Dietary Ingestion Exposure: Hand-to-Mouth (Carpets,
Flooring, and Hard Surfaces Only) ...................................................................... 9-12 9.2.6 Combining Post-application Scenarios ....................................................................... 9-16
Section 10 Treated Paints & Preservatives .......................................................... 10-1
10.1 Residential Handler Exposure Assessment .............................................................................. 10-1 10.2 Post-Application Exposure Assessment ................................................................................... 10-5
10.2.1 Post-Application Dermal Exposure Assessment ........................................................ 10-6 10.2.2 Post-Application Non-Dietary Ingestion Exposure Assessment: Hand-to-Mouth .... 10-8 10.2.3 Post-Application Inhalation Exposure Assessment .................................................. 10-12
Section 11 References ............................................................................................. 11-1
Appendix A Health Effects Division Residential Standard Operating Procedures “Index Lifestage” White Paper ........................................................... A-1
Appendix B Supporting Data Analysis and Documentation for Universal Exposure Factors for Residential Exposure Assessment .................. B-1
B.1 Generic Estimates of Fraction Hand Surface Area Mouthed .................................................... B-1 B.2 Generic Estimates of Object Surface Area Mouthed ................................................................ B-8 B.3 Generic Estimates of Fraction of Pesticide Extracted by Saliva ............................................... B-9
Appendix C Supporting Data Analysis and Documentation for Residential Handler Exposure Assessment ............................................................ C-1
U.S. EPA Office of Pesticide Programs – Standard Operating Procedures for Assessing Residential Pesticide Exposure vii
C.1 Summary of Exposure Data Used to Generate Residential Unit Exposures ............................. C-1 C.2 Exposure Factors Used to Calculate Amount of Active Ingredient Handled ........................ C-151
C.2.1 Gardens and Trees ................................................................................................... C-151 C.2.1.1 Garden Size ............................................................................................................. C-151 C.2.1.2 Hose-end Sprayer Application Volumes ................................................................. C-152
Appendix D Supporting Data Analysis and Documentation for Residential Post-Application Exposure Assessment ...................................................... D-1
D.1 Indoor Fogger Settling Time ..................................................................................................... D-1 D.2 Background on Multi-Chamber Concentration and Exposure Model (MCCEM) .................... D-2 D.3 Background on Well-Mixed Box Model ................................................................................... D-6
D.3.1 Outdoor Fogging/Misting Systems - Aerosol Spray Area Foggers ............................. D-6 D.3.2 Outdoor Fogging/Misting Systems - Candles, Coils, Torches, and Mats (CCTM) ..... D-9 D.3.3 Outdoor Fogging/Misting Systems - Outdoor Residential Misting Systems (ORMS)D-12 D.3.4 Outdoor Fogging/Misting Systems - Animal Barn Misting Systems ........................ D-17 D.3.5 Indoor Environments - Instantaneous Release/Aerosol Applications ....................... D-23 D.3.6 Indoor Environments - Vapor Emission for Surface Sprays ..................................... D-24 D.3.7 Vapor Emission for Surface-directed Sprays – Using the Saturation Concentration D-27
D.4 Selection of Air Velocity ......................................................................................................... D-30 D.5 Estimates of Deposited Residue (DepR) ................................................................................. D-31
D.5.1 Deposited Residue Based on Chemical-specific Data ............................................... D-31 D.5.2 Deposited Residue Based on Application Rate ......................................................... D-32 D.5.3 Default residue values based on type of application.................................................. D-41
D.6 Generic Estimates of Transferable Residue ............................................................................ D-46 D.6.1 Turf ............................................................................................................................ D-47 D.6.2 Gardens, Trees, and “Pick-your-own” Farms ............................................................ D-52 D.6.3 Indoor Surfaces .......................................................................................................... D-58 D.6.4 Treated Pets ............................................................................................................... D-75
D.7 Generic Estimates of Residential Transfer Coefficients ......................................................... D-88 D.7.1 Turf ............................................................................................................................ D-88 D.7.2 Gardens, Trees, and “Pick-your-own” Farms ............................................................ D-96 D.7.3 Indoor Areas ............................................................................................................ D-104 D.7.4 Treated Pets ............................................................................................................. D-109
D.8 Estimates for Residential Activity Duration ......................................................................... D-115 D.8.1 Gardens, Trees, and “Pick-your-own” Farms .......................................................... D-115 D.8.2 Treated Pets ............................................................................................................. D-121
D.9 Estimates of Hand-to-Mouth Events per Hour ...................................................................... D-122 D.9.1 Outdoors - Turf ........................................................................................................ D-122 D.9.2 Indoor ...................................................................................................................... D-124 D.9.3 Pets .......................................................................................................................... D-129
D.10 Estimates of Object-to-Mouth Events per Hour .................................................................... D-130 D.10.1 Outdoors - Turf ........................................................................................................ D-130 D.10.2 Indoors ..................................................................................................................... D-131
D.11 Insect Repellent Application Rates ....................................................................................... D-136
Introduction
U.S. EPA Office of Pesticide Programs – Standard Operating Procedures for Assessing Residential Pesticide Exposure 1-1
Section 1 Introduction
The Standard Operating Procedures for Residential Pesticide Exposure Assessment (hereafter referred to as “the SOPs” or “Residential SOPs”) provide methods for assessment of pesticide exposures unrelated to employment or dietary intake of food or water. These types of exposures include two major scenarios: residential handler and post-application exposures. The term “handler” refers to an individual who mixes, loads, and/or applies a pesticide. The term “post-application” refers to exposure as a result of contact with pesticide residues in previously treated areas. The exposure assessment methods in this document are scenario-based and reflect homeowners who purchase pesticides and complete their own applications as well as post-application exposures resulting from both homeowner and professional or commercial applications in areas that can be frequented by the general population. Prior to outlining exposure assessment methodologies for specific scenarios (Sections 3.0 – 10.0), this document provides general information, including:
• Section 1.1: General Principles of Exposure Assessment; • Section 1.2: Guidance on Residential Pesticide Usage; • Section 1.3: Residential Exposure Assessment Guidance; and • Section 2.0: Universal Exposure Factors.
Exposure assessment methodologies are then outlined for the following major residential scenarios:
• Section 3.0: Lawns and Turf; • Section 4.0: Gardens and Trees; • Section 5.0: Outdoor Fogging/Misting Systems; • Section 6.0: Insect Repellents; • Section 7.0: Indoor Environments; • Section 8.0: Treated Pets; • Section 9.0: Impregnated Materials; and • Section 10.0: Treated Paints and Preservatives.

Introduction
U.S. EPA Office of Pesticide Programs – Standard Operating Procedures for Assessing Residential Pesticide Exposure 1-2
1.1 General Principles of Exposure Assessment Exposure assessment is the process by which: (1) potentially exposed populations are identified; (2) potential pathways of exposure are identified; and (3) potential doses are quantified. As indicated above, the populations considered in these SOPs are those individuals who are potentially exposed to pesticides in non-occupational or residential settings (e.g., homes, parks, schools, athletic fields or any other area frequented by the general public). Exposures to pesticides may occur from applying pesticides or from being in areas previously treated with pesticides and contacting residues through oral, inhalation, or dermal routes. Planning, Scoping, and Problem Formulation It is important to adequately prepare prior to the initiation of a risk assessment and to clearly define the limitations of an assessment as recently described by the National Academy of Science (NRC, 2009). In Science and Decisions, much more detailed information is available that describes these processes in detail. For assessments completed using these SOPs planning and scoping are important because it ensures that assessors clearly identify the information that will be used as the basis for an assessment, what specific types of exposure patterns will be considered, what durations of exposure will be considered, and what potentially impacted populations will be evaluated. A problem formulation exercise is important for assessors using these SOPs because it will clearly assist them in defining which methods will be used to evaluate particular exposure patterns and how data, if available, should be incorporated into the process. It will also help in the ultimate characterization of the resulting risk estimates because the process will aid in developing a more thorough understanding of the issues that should be considered with the interpretation of the data, methods, and results of a particular assessment. Calculation of Exposure Exposure is commonly defined as contact of visible external physical boundaries (i.e., mouth, nostrils, and skin) with a chemical agent (U.S. EPA, 1992). As described in the Guidelines for Exposure Assessment (U.S. EPA, 1992), exposure is dependent upon the intensity, frequency, and duration of contact. The intensity of contact is typically expressed in terms of the concentration of contaminant per unit mass or volume (i.e., µg/g, µg/L, mg/m3, ppm, etc.) in the medium to which humans are exposed (U.S. EPA, 1992). Exposure can be calculated as follows: CR* C E = (1.1) where:
E = exposure (mg/day); C = contaminant concentration in the media (mg/cm2; mg/m3, mg/g); and CR = contact rate with that media (cm2/day; m3/day; gm/day).
Calculation of Absorbed Dose Dose refers to the amount of chemical to which individuals are exposed that crosses the external boundary. Dose is dependent upon contaminant concentration and the rate of intake (i.e., inhalation or ingestion) or uptake (i.e., dermal absorption) and may be normalized to body

Introduction
U.S. EPA Office of Pesticide Programs – Standard Operating Procedures for Assessing Residential Pesticide Exposure 1-3
weight as a function of time (i.e., mg/kg-day). Daily dose is the amount of chemical that could be ingested, inhaled, or deposited upon the skin per day (U.S. EPA, 1992) and can be calculated as follows:
BWAFED *
= (1.2)
where: D = dose (mg/kg-day); E = exposure (mg/day); AF = absorption factor (dermal and/or inhalation); and BW = body weight (kg).
Exposure/Dose Amortization An accurate estimate of exposure over the course of weeks, years or a lifetime is difficult to predict as exposure likely differs from one day to the next due to product-specific application regimens, residue dissipation, human behavior and activity patterns, and the extent to which an individual’s exposure varies due to behavior changes. Approaches for amortizing dose over various exposure durations are explained in more detail in Section 1.3; however an example would be amortization of an individual’s daily dose over their lifetime necessary for calculating exposures for cancer risk assessments. This amortized dose is known as the lifetime average daily dose (LADD) and it can be calculated as follows:
CF * ATET * EF * D LADD=
(1.3)
where:
LADD = lifetime average daily dose (mg/kg-day); D = dose (mg/kg-day); EF = exposure frequency (i.e., frequency of product use) (days/year); ET = exposure time (years); AT = averaging time (i.e., life expectancy) (years); and CF = conversion factor (365 days/year).
1.2 Guidance on Residential Pesticide Usage
Prior to conducting a residential exposure assessment, all end-use product labels for the active ingredient under consideration should be researched to capture the information discussed below in order to define the overall scope of the assessment as well as specific exposure scenarios to consider. Additional information such as sales information or pest control extension agents can be considered as well.

Introduction
U.S. EPA Office of Pesticide Programs – Standard Operating Procedures for Assessing Residential Pesticide Exposure 1-4
Potential Use in Residential Settings Assessors should assume that a product may be used at residential sites or used by homeowners unless specific labeling statements indicate otherwise. Each SOP section provides examples of such labeling language. Additionally, restricted-use product (RUP) classification indicates that the product cannot be bought or applied by homeowners (i.e., no residential handler exposure/risk assessment required), but it may be applied by commercial applicators to residential sites; therefore, a post-application risk assessment may be required. Formulation Type The label will list the type of formulation as part of, or associated with, the brand name. Formulation type is important in an exposure assessment because different formulations can lead to higher or lower exposures for handlers as well as having different levels of surface residue transfer in post-application exposure scenarios. Examples of common residential formulations are as follows: • Liquid formulations (liquid formulations typically have a statement listing the number of
pounds active ingredient contained in a gallon of the liquid formulated product) o Emulsifiable concentrates (EC) o Soluble concentrates (SC) o Liquids (L) o Microencapsulated (ME)
• Solid Formulations o Dusts o Granules (G) o Water dispersible granules/dry flowable (WDG/DF) o Wettable Powder (WP)
• Other o Bait stations o Water soluble bags (WSB) o Aerosol cans o Trigger-pump sprayers
Use directions such as mixing/loading instructions, application equipment and application rate terminology may also indicate the formulation if it is not explicitly stated on the label. For example, solid products are typically measured in dry volume (e.g., ounces) and liquid products are typically measured in wet volume (e.g., pints, quarts, gallons, etc.). Possible Methods of Application Use directions often specify the methods of application for a product either by prohibiting specific application techniques (e.g., "do not apply in any type of irrigation equipment" or "spot treatment only") or by listing the application equipment to be used. Handler assessments should be performed for all equipment types applicable to the product and its application sites unless a specific piece of equipment is prohibited on the labeling or is obviously incompatible with the formulation, use directions, or the intended setting where the pesticide is to be used.

Introduction
U.S. EPA Office of Pesticide Programs – Standard Operating Procedures for Assessing Residential Pesticide Exposure 1-5
Maximum Application Rates Determine the maximum label-permitted application rate for each use site by comparing the directions for each use listed on the label. This is important because exposure assessments must consider the legal maximum application rates in order to account for those individuals who use pesticides at the highest rates allowable under the law. Label-specified lower rates or pest-specific rates should be noted as well if used in the assessment, and can provide valuable information for risk managers to consider during the regulatory decision-making process. Often there are multiple instructions with widely varying use rates because there are many uses associated with one label (e.g., indoor/outdoor use, types of pests, application timing, etc.) – these broad ranges of use should be addressed. Maximum rates also may vary by formulation, so the maximum rate for each formulation must be determined. Use Frequency Determine the number of applications per year or season and the re-treatment interval, typically estimated based on label directions for frequency of product application. Typical statements include "apply at 7-day intervals while pests are present," "apply in early spring before first mowing," or "apply a second spray in 3 to 5 days." Depending on the specific product, this can inform the expected duration of exposure as well as yearly exposure frequency for estimating lifetime exposure for cancer risk assessments. Often times, extension guidance or other information related to pest lifecycles can inform this process.
1.3 Residential Exposure Assessment Guidance Prior to conducting a residential pesticide exposure assessment, the following should be considered:
(1) various products containing the pesticide, (2) products’ use patterns, (3) application methods and equipment, (4) expected exposed populations (e.g., adults for handler activities and adults and children for post-application activities), (5) expected routes of exposure (e.g., dermal, inhalation, oral), and (6) expected durations of exposure for the pesticide being assessed.
This section builds on the general exposure assessment concepts and basic use information presented in Section 1.1 and 1.2 above. The intent is to provide more specific guidance on the issues that should be addressed in the development of a residential pesticide exposure assessment. Section 1.3.1: Potentially Exposed and Index Lifestages describes the various populations potentially exposed to pesticides in residential settings and how to select index lifestages used in exposure assessment to encompass exposure and risks for all potentially exposed populations. Section 1.3.2: Durations of Exposure addresses issues related to how exposure patterns associated with the use of a pesticide, which can range from a single exposure event through a lifetime, should be reconciled with its toxicological characteristics. Section 1.3.3: Handler Exposure and Section 1.3.4: Post-application Exposure describe special considerations for homeowners that apply pesticides and for those exposed while engaging in

Introduction
U.S. EPA Office of Pesticide Programs – Standard Operating Procedures for Assessing Residential Pesticide Exposure 1-6
activities in areas previously treated with pesticides. Section 1.3.5: Combining Exposure Scenarios discusses the issues associated with the development of exposure patterns which account for combinations of behaviors which contribute to overall exposure to a pesticide. Section 1.3.6: Exposure Uncertainty and Characterization introduces the concept of uncertainty and how to interpret its effect on residential exposure estimates. Section 1.3.7: Considerations for Use of Exposure Data describes issues surrounding Agency regulations with respect to research with human subjects. Section 1.3.8: Deterministic Exposure Assessment Methodology describes the Agency’s approach of using point estimate inputs in exposure algorithms as well as inclusion of distributional data analysis for use in more complex probabilistic methods should they be warranted.
1.3.1 Potentially Exposed and Index Lifestages In the beginning phase of an exposure and risk assessment, exposure assessors must first identify the relevant lifestages for each exposure scenario (i.e., adults, children 1 < 2 years old, children 3 < 6 years old, etc.). A lifestage can be thought of as a distinct period during development of a child, for example, where they have certain physical characteristics and also display discrete behaviors and cognitive abilities. In most cases, individuals in multiple lifestages could be potentially exposed within a particular exposure scenario. To simplify the exposure and risk assessment process, an exposure assessor generally focuses the exposure assessment towards the lifestage (or lifestages) of highest concern due to unique behavioral characteristics that may lead to higher levels of exposure. This “index lifestage” approach utilizes quantitative assessments of the index lifestage to protect for the exposures and risks for all potentially exposed lifestages. This approach simplifies and streamlines the assessment process and allows risk managers to focus on the area(s) of highest concern. The Agency has analyzed the index lifestage issue using both quantitative (e.g., exposure assessments) and qualitative (e.g., exposure and activity data) considerations. The analysis focuses on four specific child lifestages as defined in the Agency’s Guidance on Selecting Age Groups for Monitoring and Assessing Childhood Exposures for Environmental Contaminants5: children 6 < 12 months old, children 1 < 2 years old, children 2 < 3 years old, and children 3 < 6 years old. While children younger than 6 months may potentially have exposure in the residential setting, it is believed that exposure for children older than 6 months will be equivalent, if not greater, due to behavioral and anatomical/physiological development; therefore, the focus of the quantitative assessment was on children older than 6 months. This analysis is presented in full in Appendix A. Based on the combined quantitative and qualitative analysis of the index lifestage issue, the Agency has determined that the children 1 < 2 years old lifestage represents the most appropriate index lifestage for children for most of the individual SOPs. There are some exceptions to this selection within this document. For example, in some of the individual SOPs, selecting some of the younger lifestages (e.g., the 1 < 2 year old lifestage in animal barns) is inappropriate because children in that age range are not expected to engage in the activities represented in the scenario.
5 http://www.epa.gov/raf/publications/guidance-on-selecting-age-groups.htm

Introduction
U.S. EPA Office of Pesticide Programs – Standard Operating Procedures for Assessing Residential Pesticide Exposure 1-7
Any exceptions with regards to the index lifestage will be clearly presented and explained in the individual SOP. In addition to the children 1 < 2 years old lifestage, the adult lifestage should also be consistently assessed for all SOPs and exposure routes with the exception of non-dietary ingestion exposure. Adults typically do not have the highest calculated body burden, but the adult lifestage does represent a major proportion of the exposed population and some exposure patterns, like pesticide applications, are uniquely associated with adult behaviors.
1.3.2 Durations of Exposure Depending on the type of pesticide (i.e., insecticide, fungicide, etc.) and its use profile (i.e., application regimen) as well as behavioral/activity patterns and exposure pathways, the potential exists for individuals to experience exposure over a variety of exposure durations. Exposure can be on the order of one day, intermittently over multiple days, months, years or a lifetime, or continually over multiple days, months, years or a lifetime. The following should be considered in conjunction with the duration of exposure for a particular pesticide:
• Use Pattern: The application frequency, pests of concern, and regional differences impact use patterns. For example, more routine (i.e., repeated) treatments might occur in consistently warmer, southern areas of the country where there is more constant pest pressure over the course of a year.
• Environmental Persistence: The extent to which pesticide residues persist in the environment can determine the frequency and extent of exposure. For example, if a lawn is treated and the pesticide dissipates rapidly there is less chance of a sustained exposure for children playing on that lawn compared to a pesticide where residues slowly dissipate.
• Biological Persistence: The route of exposure, distribution, metabolism, and excretion of a pesticide should also be considered in conjunction with the available toxicological database. For example, if exposure is frequent but the pesticide is rapidly excreted and exposed individuals recover quickly from the toxicological effect continual exposure durations may not be germaine to risk assessment. Conversely, if applications are infrequent but the pesticide is slowly eliminated from the body then continual exposure would likely need further or more detailed consideration.
• Toxicity Endpoint Reconciliation: Toxicology studies are conducted using protocols which are designed to mimic various exposure patterns that can range from a one-time exposure event to a lifetime of expected exposures. It is important that the selection of a toxic endpoint be closely matched with an expected pesticide exposure pattern to yield more accurate estimates of risk. In cases where this is not possible, assessors should acknowledge the issue and describe how this can impact the interpretation of calculated risk estimates.
Due to standard pesticide use patterns and toxicity information typically available, exposure durations are summarized as short-term (i.e., up to 30 days), intermediate-term (i.e., 1-6 months), long-term (i.e., greater than 6 months), and lifetime (for assessing cancer risk). For the purposes of residential pesticide exposure assessment, the following is a general description of each category.

Introduction
U.S. EPA Office of Pesticide Programs – Standard Operating Procedures for Assessing Residential Pesticide Exposure 1-8
Short-term Exposure (up to 30 days) Exposure up to one month can range from continual pesticide exposure or a series of intermittent exposures over the course of one month. Though most residential handlers are not expected to re-treat the same sites repeatedly day after day, a short-term average exposure should be estimated in a residential handler assessment. Post-application exposure can be reasonably characterized as short-term as well. For example, it is not unreasonable to assume a child would play on a treated home lawn for a number of consecutive days and thus could be continually exposed to residues resulting from a previous pesticide treatment. Short-term post-application exposures can be refined by accounting for residue dissipation and re-treatment intervals. For instance, if a product can be applied to residential lawns twice a year at 14 day intervals, this could be accounted for in the calculation of transferable residues for short-term post-application assessments. If residential handler or post-application exposure fits this pattern, exposure over this time period should be compared with toxicity studies of comparable duration to assess risk. Intermediate-term Exposure (1-6 months) Exposure over the course of 1-6 months can range from continual pesticide exposure or a series of intermittent exposures over the course of 1-6 months. Intermediate-term residential handler assessments are generally not required because individuals are not expected to re-treat the same sites repeatedly day after day for this duration, nor are a large number of pesticide applications resulting in intermittent exposures expected over this duration. Residential post-application exposure could, however, be characterized as intermediate-term. Additionally, as in short-term assessments, residue dissipation and re-treatment intervals should be considered in a refined assessment. If residential handler or post-application exposure fits this pattern, exposure over this time period should be compared with toxicity studies of comparable duration to assess risk. Long-term Exposure (greater than 6 months) Exposure for more than 6 months can range from continual pesticide exposure or a series of intermittent exposures for more than 6 months. Long-term residential handler assessments are not required because individuals are not expected to re-treat the same sites repeatedly day after day for this duration, nor are a large number of pesticide applications resulting in intermittent exposures expected over this duration. For a limited number of situations, however, post-application exposure could be characterized as long-term (e.g., post-application indoor inhalation following structural termiticide applications). Additionally, as in short- and intermediate-term assessments, residue dissipation and re-treatment intervals should be considered in a refined assessment. If residential handler or post-application exposure fits this pattern, an average exposure estimate over this time period should be compared with toxicity studies of comparable duration to assess risk. Lifetime Exposure Calculation of pesticide exposure over an individual’s lifetime is applicable only when the active ingredient under consideration is a carcinogen and is calculated by considering multiple days of exposure over many years. Cancer risk depends on the extent to which a person might be exposed (i.e., over a certain duration and to a certain quantity of the pesticide) over the course of their lifetime. Lifetime exposure is calculated using the lifetime average daily dose equation

Introduction
U.S. EPA Office of Pesticide Programs – Standard Operating Procedures for Assessing Residential Pesticide Exposure 1-9
shown in Equation 1.3 of Section 1.1 and includes two factors that are generic (i.e., non-chemical specific) to cancer assessments: (1) the averaging time or lifetime and (2) the exposure time. Residential handler cancer assessments should include typical application rates, if available (if not, available maximum rates should be used) and amounts handled. Additionally, absent reliable information, an assumption must be made as to the yearly exposure frequency (i.e., the number of times that an individual applies the pesticide per year. The exposure frequency will typically differ depending on the type of pesticide (e.g., fungicide, herbicide, insecticide) and could potentially differ across formulations. In the past, cancer risk assessments have assumed that children are no more sensitive than adults to carcinogens (i.e., no adjustment was made to children's exposure estimates in calculating a cumulative lifetime exposure). More recently, the Agency's "Guidelines for Carcinogen Risk Assessment" (U.S. EPA, 2005) and “Supplemental Guidance for Assessing Susceptibility from Early-Life Exposure to Carcinogens” (U.S. EPA, 2005) proposed age-dependent adjustment factors to be applied to children's exposure. A 10x factor (exposure multiplier) is applied to exposure incurred from birth to 2 years and a 3x factor is applied to exposure incurred from 2 years to 16 years. No factor is applied to children age 16 years and beyond. These age-dependent factors are applied only to carcinogens shown to have a mutagenic mode of action. In general, most carcinogenic pesticides have not been shown to act through a mutagenic mode of action and thus this SOP document does not include further discussion of these adjustment factors. Any pesticide found to be a carcinogen acting through a mutagenic mode of action will be evaluated on a case by case basis and such an assessment should follow the Agency’s 2005 guidance.
1.3.3 Handler Exposure Handler exposure refers to an exposure scenario in which an adult is exposed during mixing, loading, and applying a pesticide. Residential handler exposure assessments estimate dermal and inhalation exposures for individuals using pesticides in and around their homes. Some key assumptions for residential handler assessments include:
• Residential handlers are assumed to be wearing shorts and short-sleeve shirts, shoes, and socks. This assumption differs from occupational handler assessments which assume handlers are wearing at least long pants, long-sleeved shirts, shoes, and socks.
• Personal protective equipment (PPE) is not considered a mitigation option for residential handlers because users are not trained and compliance would not be expected.
• Pesticides are assumed to be applied only by adults. The assessment methods account for children 16 years and older who may also perform applications, thus for the purposes of this document 16 year olds may be grouped with adults.
• All applicable application methods should be assessed unless prohibited by the product label.
Handler exposure can be estimated in the absence of chemical-specific exposure monitoring data with the following information:

Introduction
U.S. EPA Office of Pesticide Programs – Standard Operating Procedures for Assessing Residential Pesticide Exposure 1-10
• Application site (e.g., lawns, gardens, kitchen baseboards, etc.); • Formulation type (e.g., liquid, granule, etc.); • Application equipment (e.g., aerosol can, sprinkler can, hose-end sprayer, etc.); and • Application rate (e.g., lb ai/ft2, lb ai/gal).
Given the information described above – application equipment, formulation, etc. – dermal and inhalation handler exposure can be predicted using a factor known as the unit exposure. Unit exposure is the ratio, for a given formulation and application equipment, of an individual’s exposure to the amount of active ingredient handled (AaiH), expressed as mass active ingredient exposure per mass active ingredient handled (e.g., mg/lb ai). More specifically, this means that an individual’s exposure will increase by a given (and constant) amount for every “unit” increase in the amount of active ingredient handled. It follows that the use of unit exposures assumes proportionality between exposure and the amount of active ingredient handled, such that if one doubles the amount handled, the resulting exposure would be doubled as well. Exposure monitoring data for individuals mixing, loading, and applying pesticides enables derivation of unit exposure distributions for various pesticide formulations used in various application scenarios (e.g., granule formulations applied using a rotary spreader or liquid formulations applied via a handheld pump sprayer). These unit exposures can then be applied generically for use in estimating dermal or inhalation exposure for any active ingredient by estimating how much active ingredient an individual will handle using a particular piece of application equipment.6 Appendix C references and summarizes all available handler exposure studies from which unit exposures are derived for use in residential exposure assessment. Each SOP section provides information for two inputs that are necessary for calculating residential handler exposure: (1) unit exposures for each possible formulation/application equipment combination and (2) factors for deriving the amount of active ingredient handled such as area treated or volume used for each formulation/application equipment combination. Dermal and/or inhalation handler exposure calculations follow the general form shown below. A * AR * UE E = (1.4) where:
E = exposure (mg/day); UE = unit exposure (mg/lb ai); AR = application rate (e.g., lb ai/ft2, lb ai/gal); and A = area treated or amount handled (e.g., ft2/day, gal/day).
Dermal and/or inhalation absorbed doses are calculated as:
BWAF * E D =
(1.5) 6 This topic was discussed during a 2007 FIFRA SAP. See: http://www.epa.gov/scipoly/sap/meetings/2007/010907_mtg.htm

Introduction
U.S. EPA Office of Pesticide Programs – Standard Operating Procedures for Assessing Residential Pesticide Exposure 1-11
where: D = dose (mg/kg-day); E = exposure (mg/day); AF = absorption factor (dermal and/or inhalation); and BW = body weight (kg).
As described in Section 1.3.2 residential handlers are expected to generally experience only short-term exposures. Intermediate- and long-term exposures are not typically expected but should be considered with respect to regional differences and product label use directions. Additionally, selection of exposure factor inputs is dependent on various considerations related to the exposure duration. For residential handler exposure assessment, these considerations include product application regimens and the extent to which an individual’s exposure varies from day-to-day.
1.3.4 Post-application Exposure Post-application exposure refers to an exposure scenario in which an individual is exposed through dermal, inhalation, and/or incidental oral (non-dietary ingestion) routes as a result of being in an environment that has been previously treated with a pesticide. Post-application dermal exposure pathways can be evaluated using estimates for surface residue (e.g., carpets, foliage, turf, etc.), surface-to-skin residue transfer for individuals contacting treated surfaces during certain activities, and exposure time. The measure of surface-to-skin residue transfer for a given treated area and activity is known as the transfer coefficient (TC). Transfer coefficients are derived from concurrent measurements of exposure and surface residue, and is the ratio of exposure rate, measured in mass of chemical per time (e.g., µg/hr), to residue, measured in mass of chemical per foliar surface area (e.g., µg/cm2). In other words, transfer coefficients are exposure rates (e.g., mg/hr) normalized to residue (e.g., mg/cm2), with resulting units of cm2/hr. It follows that exposure rate for a given treated area and activity can then be predicted from a given residue using the transfer coefficient. Additionally, transfer coefficients are typically applied generically – that is, for any given chemical, treated area-activity transfer coefficients (e.g., apple harvesting, playing on lawns or carpets) can be used. Post-application inhalation exposure depends on concentrations in the air after treatment and inhalation rates. Post-application oral exposures are based on the ingestion of residues that can result from transfer of residues from hand-to-mouth or object-to-mouth or via direct ingestion of residues through soil ingestion, dust ingestion, or ingestion of pesticide granules or baits. Post-application dermal and inhalation assessments are typically conducted for a number of lifestages (ranging from children 1 < 2 years old through adulthood) while non-dietary oral post-application exposure assessments are typically only conducted for younger lifestages. Non-dietary oral exposure generally consists of two “incidental” exposure pathways – exposure resulting from children contacting treated surfaces and putting their hands in their mouth (i.e., “hand-to-mouth” exposure) and exposure resulting from children putting objects or other toys in their mouth that had been in contact with treated surfaces (i.e., “object-to-mouth” exposure). Exposure via these pathways are dependent upon the surface loading of the pesticide, transfer of the pesticide to children’s hands or objects from the treated surface, and the number of times a

Introduction
U.S. EPA Office of Pesticide Programs – Standard Operating Procedures for Assessing Residential Pesticide Exposure 1-12
child places their hands or an object in their mouth. While the basic input variables remain unchanged, the overall methodology/algorithm to assess this exposure has been revised since previous versions of the Residential SOPs. Working collaboratively with the Agency’s Office of Research and Development (ORD), the Residential SOPs incorporate a modified version of the algorithm utilized in the Stochastic Human Exposure Dose Simulation (SHEDS) – Multimedia model. Previous SOP versions assumed complete removal of hand/object residue per mouthing contact and complete residue replenishment of the hand/object per contact with the treated surface. The revised algorithm follows a more realistic removal/replenishment mechanism between hand/object mouthing events, establishing a maximum amount of residue which can be on the hand, or a maximum dermal hand loading, based on the post-application dermal exposure estimate.7 Like residential handler assessments, residential post-application assessments differ from occupational post-application assessments in that they assume individuals are wearing typical clothing such as shorts and short-sleeved shirts, shoes, and socks. Additionally, when managing occupational post-application risks the Agency typically uses an administrative control known as a Restricted Entry Interval (REI) which precludes worker activities in a treated area until residues dissipate to certain levels. This is not feasible in residential settings because excluding individuals from contact with their treated lawns or pets is not practical. Therefore, residential post-application exposure assessments need to address the potential for exposure on the day of application (i.e., “day 0”) because there is not a viable means of mitigating that type of scenario. If applicable, each SOP section provides separate algorithms for assessing dermal, inhalation, and oral non-dietary post-application exposures. Because both residues and their transfer to the body are likely dependent on both the chemical and scenario (e.g., indoors vs. outdoors; smooth surfaces vs. textured surfaces; etc.), chemical- and scenario-specific data are most reliable when performing post-application exposure assessments. However, in the absence of such data, generic exposure factors outlined in the scenario-specific SOPs are provided and should be used to estimate exposure. As described in Section 1.3.2, individuals can experience post-application exposures for all possible exposure durations and selection of exposure factor inputs is dependent on various considerations related to the exposure duration. For post-application exposure assessment, these considerations include product application regimens, residue dissipation, longitudinal activity patterns, and the extent to which exposure is expected to vary from day-to-day.
1.3.5 Combining Exposure Scenarios Each SOP provides methods for estimating daily exposures for a number of potential scenarios with the focus on assessment of single routes of exposure (i.e., dermal, inhalation, and non-dietary oral exposure). However, in reality, exposures to pesticides do not impact individuals through only dermal or oral contact and do not occur as single, isolated events, but rather as a series of sequential or concurrent events that may overlap or be linked in time and space. Based
7 The revised incidental oral exposure algorithm was first utilized in the Agency’s N-Methyl Carbamate cumulative risk assessment.
Introduction
U.S. EPA Office of Pesticide Programs – Standard Operating Procedures for Assessing Residential Pesticide Exposure 1-13
on this, risk estimates resulting from different exposure routes are combined when it is likely that they can occur simultaneously based on the use pattern and when the toxicological effects across different routes of exposure are the same. There are several methods of measuring and aggregating risk. Two aggregation methods used include the Total MOE and the Aggregate Risk Index (ARI). Arithmetically, the two approaches are the same when the uncertainty factors (UF) are the same for all routes of exposure. When the UF’s differ by route, however, the ARI is required. Further discussion of these two approaches and the corresponding algorithms can be found in the Agency's General Principles for Performing Aggregate Exposure and Risk Assessments8. To the extent that information is available, it is important for the assessor to characterize the potential for co-occurrence as well as to characterize the assessment inputs when combining risks from multiple scenarios. For example, it is likely that a child could experience dermal and hand-to-mouth exposures intermittently over a particular period of time while playing on previously treated turf. If each of those exposure scenarios is assessed using health-protective inputs, one must consider the likelihood when combining them that those individual health-protective exposures could reasonably co-occur at those same levels. Each scenario-specific SOP contains a more specific discussion and explanation of what routes of exposure should be combined.
1.3.6 Exposure Uncertainty and Characterization A number of different types of uncertainty are present in these SOPs. Uncertainty may occur as a result of the techniques used to estimate environmental concentrations (i.e., analytical uncertainty), the underlying models and relationships assumed for certain types of data (e.g., exponential decay for surface residues), and the application of surrogate information or data for exposure scenarios and exposure factors lacking specific information. Expected but unquantifiable variation in daily and longitudinal exposure also introduces uncertainty. Each scenario-specific SOP includes an exposure characterization and data quality section which describes the uncertainties associated with that particular scenario. While these uncertainties exist they should be addressed in the exposure assessment process to ensure that resulting risk assessments are developed in a manner that can be considered health protective for the particular situations being evaluated (U.S. EPA, 2002). The following discussion outlines general or universal uncertainties that should be considered in the interpretation of all the SOPs presented in this document. Surrogate Exposure Data For many scenarios, specific information is lacking and available information for another exposure scenario is considered appropriate to use. Examples include using exposure data for individuals applying powder formulations to assess exposure for individuals applying liquid products or using post-application occupational field worker exposure data for home gardening activities. Though reasonable when exposure information is unavailable, the assessment should characterize the uncertainty and identify the data gap. 8 http://www.epa.gov/opp00001/trac/science/aggregate.pdf
Introduction
U.S. EPA Office of Pesticide Programs – Standard Operating Procedures for Assessing Residential Pesticide Exposure 1-14
Exposure Data Analysis The exposure data utilized across residential exposure assessments (e.g., handler exposure data, post-application exposure data, etc.) are considered reasonable for the purposes of establishing distributions and estimating exposure. The data are from actual applications using standardized exposure sampling methodologies and laboratory analyses. Additionally, the use of exposure data in certain ways requires assumptions with regard to correlations or relationships between variables. For example, the underlying assumption of the use of exposure data as unit exposures – proportionality between the amount of active ingredient handled and exposure – is uncertain, though potentially conservative. However, as a prediction mechanism, it is considered practical and useful for the purposes of handler exposure assessment in a regulatory context. It provides a straightforward handler exposure calculation method and enables risk mitigation via formulation comparisons or decreased application rates. Where assumptions such as this are implicit, the assessment should characterize the associated uncertainty. Longitudinal Exposure Variation Information detailing the extent to which various residential pesticide exposure factors vary from day-to-day or application-to-application is largely unavailable. Therefore, if day-to-day or application-to-application variation is not assumed to occur for short-, intermediate-, long-term or lifetime assessments, the likelihood of this pattern should be characterized.
1.3.7 Ethical Considerations of Human Exposure Data As described in the preamble of this document, the Residential SOPs are based on a number of monitoring studies that involved the intentional exposure of humans to pesticides (e.g., scripted activities by human volunteers). These studies can only be used for regulatory purposes by the Agency if they are compliant with the requirements of 40 CFR 26. Each of the studies used in the development of this document has been found to be compliant with these requirements. In some cases, however, research considered throughout the process of revising the SOPs, though germane to a particular scenario under consideration, had to be excluded from consideration because they are not compliant with 40 CFR 26. For example, for the Lawns/Turf SOP, there is a section (Section 3.2.8) that describes how the exposure of golfers is estimated based on monitoring data for workers at a golf course. In this case, one of the available golfer exposure studies (Putnam et al., 2008) did not meet 40 CFR 26 requirements and, therefore, the data from that study were not included in the final analysis. As the Agency considers the Residential SOPs a “living” document, if additional applicable research is identified that should be considered, it would also be subject to review under the criteria stipulated in 40 CFR 26.
1.3.8 Deterministic Exposure Assessment Methodology

Introduction
U.S. EPA Office of Pesticide Programs – Standard Operating Procedures for Assessing Residential Pesticide Exposure 1-15
Deterministic methods are most commonly used for residential exposure assessments. In a deterministic exposure assessment, each algorithm input is represented by a single numeric value called a point estimate. The output of a deterministic exposure assessment, therefore, is also a single point estimate. Exposure estimates are easily calculated using deterministic methods and can be relatively straightforward to communicate to risk managers. As described in Section 1.3.2, due to both expected exposure patterns and available toxicity information, routine residential exposure assessments include short-term exposures, and sometimes intermediate- and long-term exposures. For these assessments, the Agency typically utilizes arithmetic mean inputs coupled with chemical-specific inputs such as maximum application rates or minimum retreatment intervals in order to yield reasonably health-protective estimates of exposure. Even though deterministic methods are straightforward and provide a health protective estimate of exposure, they do not provide information on the variability and uncertainty inherent in the algorithm inputs. As a result, deterministic assessment may not provide sufficient detail on the range of possible exposures or the level of confidence in the estimate of exposure used in risk assessment. Probabilistic assessment is a more complex methodology that accounts for the variability of each algorithm input. Additionally, probabilistic methods can be incorporated into more robust sensitivity analyses, based on each algorithm input’s probability distribution. These sensitivity analyses can be useful at identifying the inputs that are the main contributors of exposure and can be used to prioritize additional research efforts (U.S. EPA, 2001). As the main focus for the Residential SOPs is to provide a simple, yet health protective, approach for assessing residential exposures in the form of a deterministic method using appropriate default point estimates, each section presents summary tables and algorithms which correspond to this goal. The appendices for each section, however, analyze and characterize the data for each algorithm input in the form of probability distributions, so that users can conduct a probabilistic exposure assessment, if necessary. Other than presenting datasets in a format useful for probabilistic methods, this document does not provide any other guidance, nor should it be viewed as recommending probabilistic assessment as a routine approach. As described above, for routine use by the Agency, deterministic assessments yield understandable and health-protective exposure estimates.
Universal Exposure Factors
U.S. EPA Office of Pesticide Programs – Standard Operating Procedures for Assessing Residential Pesticide Exposure 2-1
Section 2 Universal Exposure Factors
Many of the algorithm inputs discussed in this document are specific to a particular scenario. However, some factors are common across the SOPs. These factors include: body weight, inhalation rate, body surface area, hand surface area mouthed, object surface area mouthed, and saliva extraction factor. Where applicable, each SOP refers to this section for discussion of these universal exposure factors. Where appropriate and when data are available, the recommended distributions are presented for lifestages that are potentially exposed during residential pesticide use. These are represented by the following lifestages: adults 16 < 80 years (male and female combined), children 11 < 16 years old (male and female combined), children 6 < 11 years old (male and female combined), children 3 < 6 years old (male and female combined), children 2 < 3 years old (male and female combined), and children 1 < 2 years old (male and female combined) respectively. The selection of these lifestages is based, in part, on discussions presented in Guidance on Selecting Age Groups for Monitoring and Assessing Childhood Exposures to Environmental Contaminants (U.S. EPA, 2005). Distributions for different lifestages can be used if there is a need to assess a more specific lifestage. The following sections provide summary descriptions and recommended exposure assessment inputs for each factor.
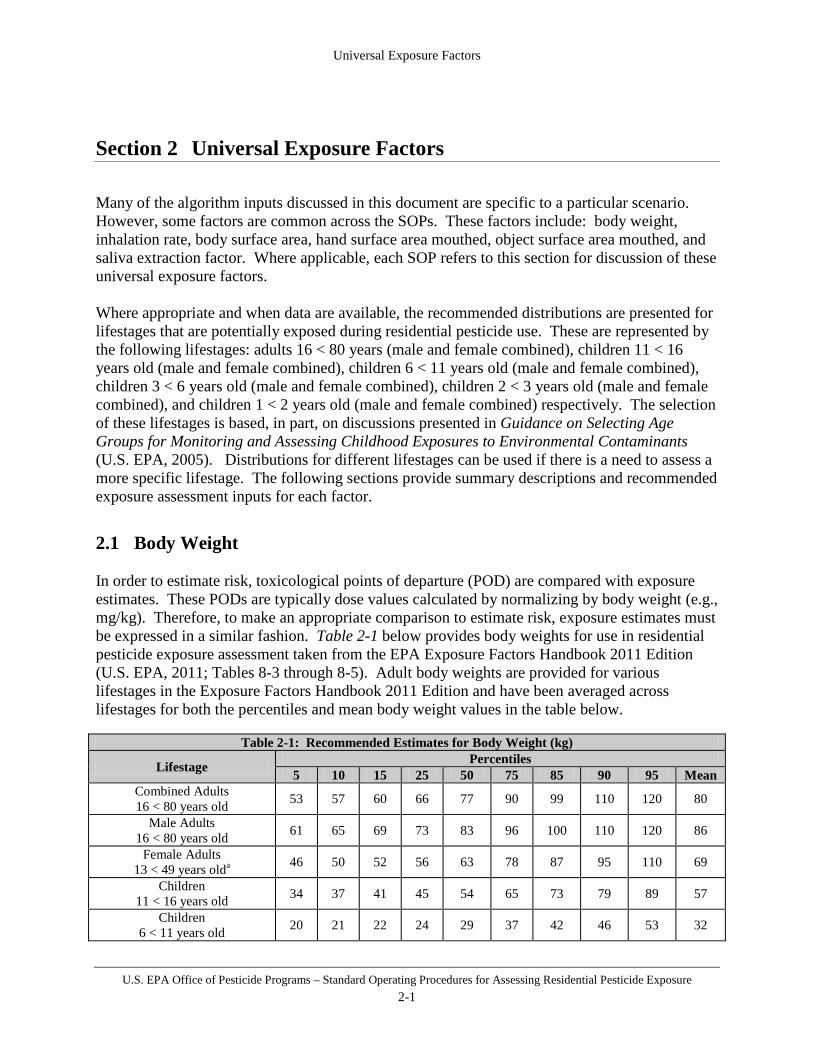
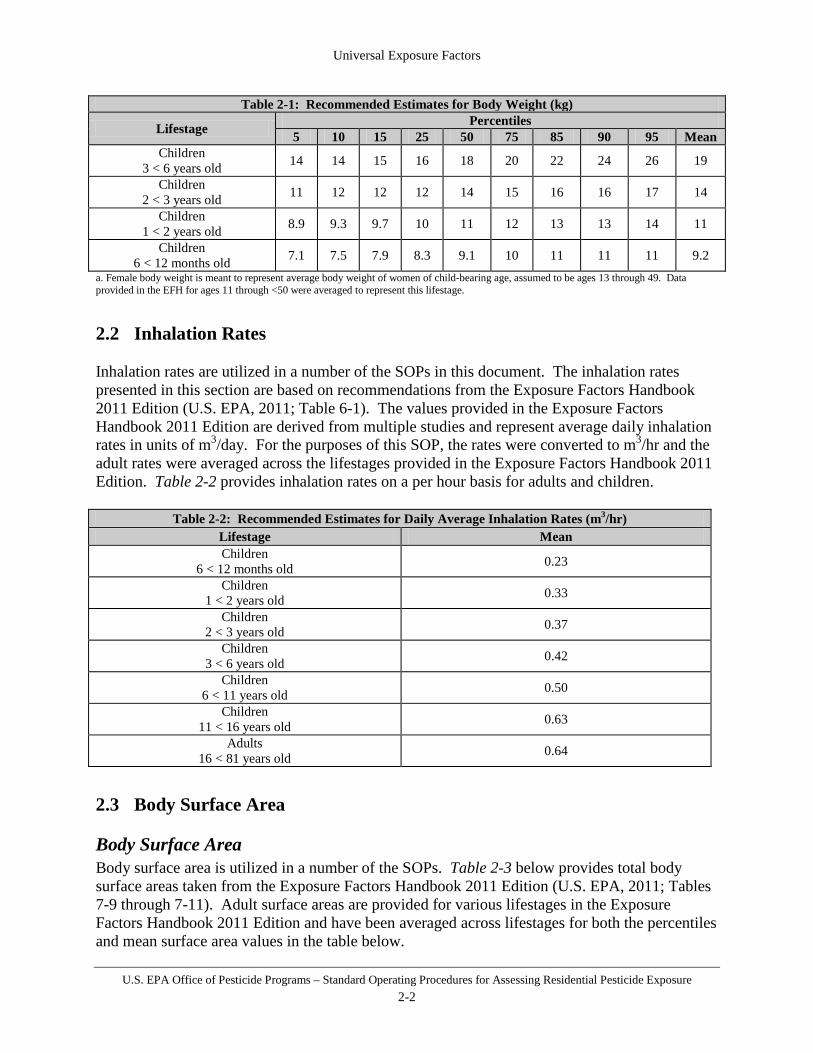
2.1 Body Weight In order to estimate risk, toxicological points of departure (POD) are compared with exposure estimates. These PODs are typically dose values calculated by normalizing by body weight (e.g., mg/kg). Therefore, to make an appropriate comparison to estimate risk, exposure estimates must be expressed in a similar fashion. Table 2-1 below provides body weights for use in residential pesticide exposure assessment taken from the EPA Exposure Factors Handbook 2011 Edition (U.S. EPA, 2011; Tables 8-3 through 8-5). Adult body weights are provided for various lifestages in the Exposure Factors Handbook 2011 Edition and have been averaged across lifestages for both the percentiles and mean body weight values in the table below.
Table 2-1: Recommended Estimates for Body Weight (kg)
Lifestage Percentiles 5 10 15 25 50 75 85 90 95 Mean
Combined Adults 16 < 80 years old 53 57 60 66 77 90 99 110 120 80
Male Adults 16 < 80 years old 61 65 69 73 83 96 100 110 120 86
Female Adults 13 < 49 years olda 46 50 52 56 63 78 87 95 110 69
Children 11 < 16 years old 34 37 41 45 54 65 73 79 89 57
Children 6 < 11 years old 20 21 22 24 29 37 42 46 53 32
Universal Exposure Factors
U.S. EPA Office of Pesticide Programs – Standard Operating Procedures for Assessing Residential Pesticide Exposure 2-2
Table 2-1: Recommended Estimates for Body Weight (kg)
Lifestage Percentiles 5 10 15 25 50 75 85 90 95 Mean
Children 3 < 6 years old 14 14 15 16 18 20 22 24 26 19
Children 2 < 3 years old 11 12 12 12 14 15 16 16 17 14
Children 1 < 2 years old 8.9 9.3 9.7 10 11 12 13 13 14 11
Children 6 < 12 months old 7.1 7.5 7.9 8.3 9.1 10 11 11 11 9.2
a. Female body weight is meant to represent average body weight of women of child-bearing age, assumed to be ages 13 through 49. Data provided in the EFH for ages 11 through <50 were averaged to represent this lifestage.
2.2 Inhalation Rates
Inhalation rates are utilized in a number of the SOPs in this document. The inhalation rates presented in this section are based on recommendations from the Exposure Factors Handbook 2011 Edition (U.S. EPA, 2011; Table 6-1). The values provided in the Exposure Factors Handbook 2011 Edition are derived from multiple studies and represent average daily inhalation rates in units of m3/day. For the purposes of this SOP, the rates were converted to m3/hr and the adult rates were averaged across the lifestages provided in the Exposure Factors Handbook 2011 Edition. Table 2-2 provides inhalation rates on a per hour basis for adults and children.
Table 2-2: Recommended Estimates for Daily Average Inhalation Rates (m3/hr) Lifestage Mean Children
6 < 12 months old 0.23
Children 1 < 2 years old 0.33
Children 2 < 3 years old 0.37
Children 3 < 6 years old 0.42
Children 6 < 11 years old 0.50
Children 11 < 16 years old 0.63
Adults 16 < 81 years old 0.64
2.3 Body Surface Area
Body Surface Area Body surface area is utilized in a number of the SOPs. Table 2-3 below provides total body surface areas taken from the Exposure Factors Handbook 2011 Edition (U.S. EPA, 2011; Tables 7-9 through 7-11). Adult surface areas are provided for various lifestages in the Exposure Factors Handbook 2011 Edition and have been averaged across lifestages for both the percentiles and mean surface area values in the table below.
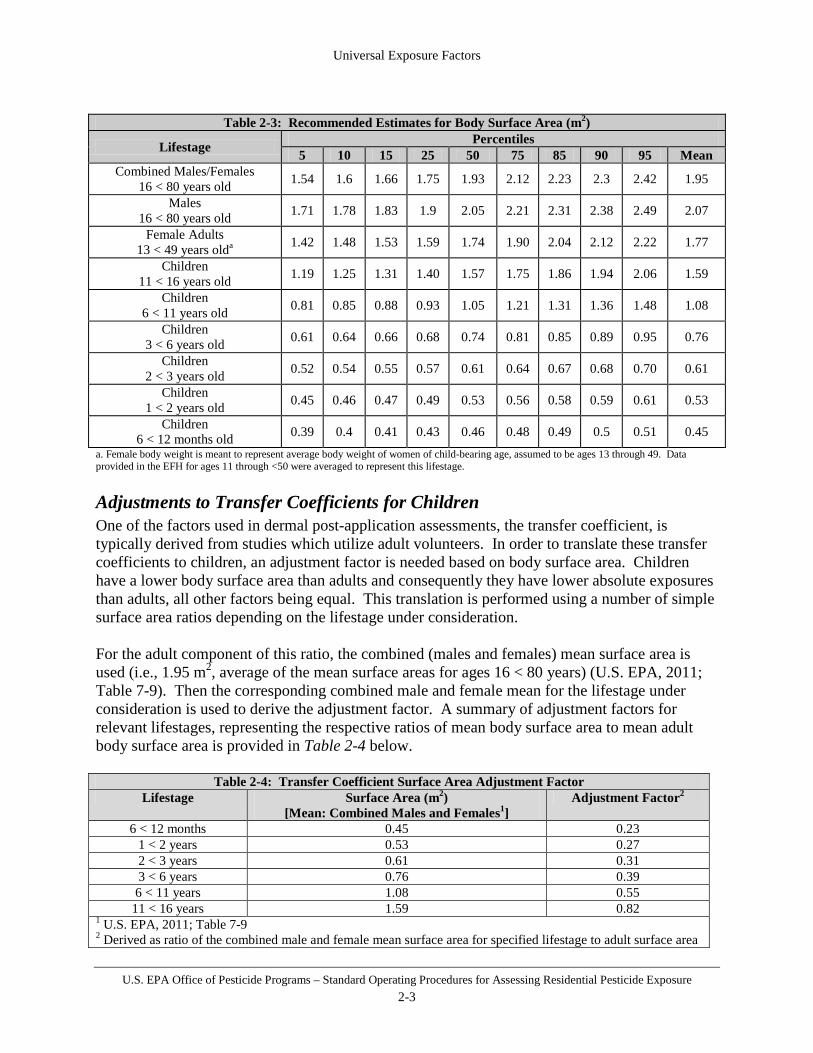
Universal Exposure Factors
U.S. EPA Office of Pesticide Programs – Standard Operating Procedures for Assessing Residential Pesticide Exposure 2-3
Table 2-3: Recommended Estimates for Body Surface Area (m2)
Lifestage Percentiles 5 10 15 25 50 75 85 90 95 Mean
Combined Males/Females 16 < 80 years old 1.54 1.6 1.66 1.75 1.93 2.12 2.23 2.3 2.42 1.95
Males 16 < 80 years old 1.71 1.78 1.83 1.9 2.05 2.21 2.31 2.38 2.49 2.07
Female Adults 13 < 49 years olda 1.42 1.48 1.53 1.59 1.74 1.90 2.04 2.12 2.22 1.77
Children 11 < 16 years old 1.19 1.25 1.31 1.40 1.57 1.75 1.86 1.94 2.06 1.59
Children 6 < 11 years old 0.81 0.85 0.88 0.93 1.05 1.21 1.31 1.36 1.48 1.08
Children 3 < 6 years old 0.61 0.64 0.66 0.68 0.74 0.81 0.85 0.89 0.95 0.76
Children 2 < 3 years old 0.52 0.54 0.55 0.57 0.61 0.64 0.67 0.68 0.70 0.61
Children 1 < 2 years old 0.45 0.46 0.47 0.49 0.53 0.56 0.58 0.59 0.61 0.53
Children 6 < 12 months old 0.39 0.4 0.41 0.43 0.46 0.48 0.49 0.5 0.51 0.45
a. Female body weight is meant to represent average body weight of women of child-bearing age, assumed to be ages 13 through 49. Data provided in the EFH for ages 11 through <50 were averaged to represent this lifestage. Adjustments to Transfer Coefficients for Children One of the factors used in dermal post-application assessments, the transfer coefficient, is typically derived from studies which utilize adult volunteers. In order to translate these transfer coefficients to children, an adjustment factor is needed based on body surface area. Children have a lower body surface area than adults and consequently they have lower absolute exposures than adults, all other factors being equal. This translation is performed using a number of simple surface area ratios depending on the lifestage under consideration. For the adult component of this ratio, the combined (males and females) mean surface area is used (i.e., 1.95 m2, average of the mean surface areas for ages 16 < 80 years) (U.S. EPA, 2011; Table 7-9). Then the corresponding combined male and female mean for the lifestage under consideration is used to derive the adjustment factor. A summary of adjustment factors for relevant lifestages, representing the respective ratios of mean body surface area to mean adult body surface area is provided in Table 2-4 below.
Table 2-4: Transfer Coefficient Surface Area Adjustment Factor Lifestage Surface Area (m2)
[Mean: Combined Males and Females1] Adjustment Factor2
6 < 12 months 0.45 0.23 1 < 2 years 0.53 0.27 2 < 3 years 0.61 0.31 3 < 6 years 0.76 0.39 6 < 11 years 1.08 0.55
11 < 16 years 1.59 0.82 1 U.S. EPA, 2011; Table 7-9 2 Derived as ratio of the combined male and female mean surface area for specified lifestage to adult surface area
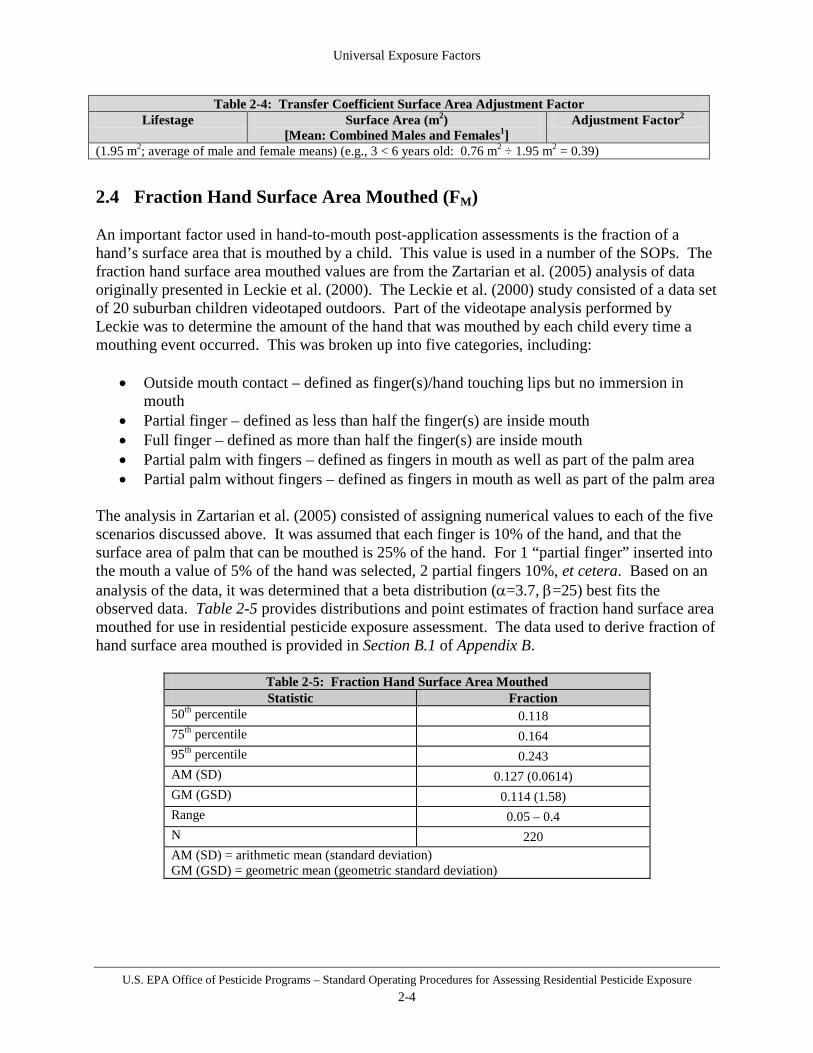
Universal Exposure Factors
U.S. EPA Office of Pesticide Programs – Standard Operating Procedures for Assessing Residential Pesticide Exposure 2-4
Table 2-4: Transfer Coefficient Surface Area Adjustment Factor Lifestage Surface Area (m2)
[Mean: Combined Males and Females1] Adjustment Factor2
(1.95 m2; average of male and female means) (e.g., 3 < 6 years old: 0.76 m2 ÷ 1.95 m2 = 0.39)
2.4 Fraction Hand Surface Area Mouthed (FM) An important factor used in hand-to-mouth post-application assessments is the fraction of a hand’s surface area that is mouthed by a child. This value is used in a number of the SOPs. The fraction hand surface area mouthed values are from the Zartarian et al. (2005) analysis of data originally presented in Leckie et al. (2000). The Leckie et al. (2000) study consisted of a data set of 20 suburban children videotaped outdoors. Part of the videotape analysis performed by Leckie was to determine the amount of the hand that was mouthed by each child every time a mouthing event occurred. This was broken up into five categories, including:
• Outside mouth contact – defined as finger(s)/hand touching lips but no immersion in mouth
• Partial finger – defined as less than half the finger(s) are inside mouth • Full finger – defined as more than half the finger(s) are inside mouth • Partial palm with fingers – defined as fingers in mouth as well as part of the palm area • Partial palm without fingers – defined as fingers in mouth as well as part of the palm area
The analysis in Zartarian et al. (2005) consisted of assigning numerical values to each of the five scenarios discussed above. It was assumed that each finger is 10% of the hand, and that the surface area of palm that can be mouthed is 25% of the hand. For 1 “partial finger” inserted into the mouth a value of 5% of the hand was selected, 2 partial fingers 10%, et cetera. Based on an analysis of the data, it was determined that a beta distribution (α=3.7, β=25) best fits the observed data. Table 2-5 provides distributions and point estimates of fraction hand surface area mouthed for use in residential pesticide exposure assessment. The data used to derive fraction of hand surface area mouthed is provided in Section B.1 of Appendix B.
Table 2-5: Fraction Hand Surface Area Mouthed Statistic Fraction
50th percentile 0.118 75th percentile 0.164 95th percentile 0.243 AM (SD) 0.127 (0.0614) GM (GSD) 0.114 (1.58) Range 0.05 – 0.4 N 220 AM (SD) = arithmetic mean (standard deviation) GM (GSD) = geometric mean (geometric standard deviation)

Universal Exposure Factors
U.S. EPA Office of Pesticide Programs – Standard Operating Procedures for Assessing Residential Pesticide Exposure 2-5
2.5 Surface Area of Object Mouthed (SAMO) One of the factors used in object-to-mouth post-application assessments is the surface area (expressed in cm2) of the object that is mouthed by a child, and is used in a number of the SOPs. Based on the area of hand mouthed by 2-5 years old as reported by Leckie et al. , (2000), and the assumption that children mouth a smaller area of an object than their hand, an exponential distribution with a minimum of 1 cm2, a mean of 10 cm2, and a maximum of 50 cm2 was chosen. The maximum is comparable to the surface area of a ping-pong ball. Additional details and analyses are provided in Section B.2 of Appendix B.
2.6 Fraction of Pesticide Extracted by Saliva (SE) One of the factors used in hand-to-mouth and object-to-mouth post-application assessments is the fraction of pesticide extracted from the hand/object via saliva. The values for fraction of pesticide extracted by saliva are based on analysis of data collected in a study by Camann et al. (1996). This study focused specifically on fraction of pesticide extracted by saliva from hands, not objects. However, there are currently no data available to address the removal of residues from objects by saliva during mouthing events so this study is being used for both hands and objects. The estimates of saliva extraction were derived using a beta distribution (α = 7.0, β = 7.6). Table 2-6 provides estimates of pesticide extracted by saliva for use in residential pesticide exposure assessment. Additional details and analyses are provided in Section B.3 of Appendix B.
Table 2-6: Fraction of Pesticide Extracted by Saliva Statistic Fraction of Pesticide Extracted by Saliva
50th percentile 0.50 75th percentile 0.57 90th percentile 0.64 95th percentile 0.68 99th percentile 0.80 AM (SD) 0.48 (0.13) GM (GSD) 0.46 (1.35) Range 0.22 – 0.71 N 27 AM (SD) = arithmetic mean (standard deviation) GM (GSD) = geometric mean (geometric standard deviation)
2.7 Life Expectancy Averaging Time An important factor to consider when evaluating cancer risk is life expectancy because it is used to derive the lifetime average daily dose estimate. Life expectancy values are presented in the Exposure Factors Handbook 2011 Edition Table 18-1 (U.S. EPA, 2011). The table shows that the overall life expectancy is 78 years based on life expectancy data from 2007. In 2007, the average life expectancy for males was 75 years and 80 years for females. Based on the available data, the recommended value for use in cancer risk assessments is 78 years.

Lawns/Turf
U.S. EPA Office of Pesticide Programs – Standard Operating Procedures for Assessing Residential Pesticide Exposure 3-1
Section 3 Lawns/Turf
The residential lawns/turf SOP provides algorithms and inputs to assess a number of handler and post-application turf exposure scenarios. The populations considered in this SOP are those individuals who are potentially exposed to pesticides from either treating turf with a product available for sale to the general public or after contact with treated turf in many settings, including residential lawns, playgrounds, parks, recreation areas, schools, and golf courses. Another potential source of exposure addressed by this section, where professional applications could potentially lead to exposure by the general population, if applicable to the pesticide and its label under consideration, is treated sod purchased at retail locations. Before the development of an exposure assessment for a turf scenario, the assessor should review the pesticide label to determine whether the scenario is appropriate based on the usage of the product. Specific labeling statements that indicate an assessment for residential lawns is needed are as follows:
• Registered for Use on Turfgrass: Determine whether the labeling contains directions for use on "turfgrass," "lawns," or "ornamental turf," or on specific species of turfgrasses, such as "bluegrass," "zoysia," "bentgrass," etc.
• Limitation and Descriptive Statements: Assume that a product registered for use on
turfgrass is used on home lawns or by homeowners, unless a specific statement on the label indicates the product is only used in non-residential settings. Examples include:
o For golf course use only; o For commercial sod farm use only; o For professional athletic field use only; and o For industrial/commercial turf use only.
Additionally, “Restricted Use Pesticide” classification indicates that the product cannot be bought or applied by homeowners (i.e., no residential handler exposure/risk assessment required), but it may be applied by commercial applicators to residential sites; therefore, a post-application risk assessment may be required.
• Post-application assessments do not need to be performed if label directions indicate the
turf use is an edging use (e.g., along fence rows), a foundation perimeter treatment (e.g., 3 foot band around the perimeter of a house), or a specific spot treatment (e.g., ant mounds). These types of uses can result in residues on turf but residential exposure is expected to be low. Post-application assessments should be conducted for all other turf application scenarios.

Lawns/Turf
U.S. EPA Office of Pesticide Programs – Standard Operating Procedures for Assessing Residential Pesticide Exposure 3-2
If a turf use is possible, the assessment should then characterize and estimate the potential for exposure by route (e.g., dermal, non-dietary ingestion, inhalation) following the methodology outlined in this SOP. The assessor should also consider the durations of exposure for each route.
Much of the data contained within this SOP is the result of the Outdoor Residential Data-Call-In (OREDCI) that was issued to pesticide registrants in 1995 (U.S. EPA, 1995) under the authority of the Federal Insecticide, Fungicide, and Rodenticide Act (FIFRA). This DCI required additional data, which would allow for more refined turf handler and post-application exposure assessments. It impacted all pesticide registrants who produced products that could lead to handler and post-application exposure on turf. In anticipation of the need to provide these data to the Agency, the industry-based Occupational and Residential Exposure Task Force (ORETF) was formed prior to the time that the DCI was issued.
3.1 Handler Exposure Assessment This residential turf handler SOP provides a standard method for estimating potential dermal and inhalation doses resulting from applying pesticides to residential turf. Such exposure is assumed to occur only to adults (i.e., individuals 16 years old or older). Dermal and Inhalation Handler Exposure Algorithm As described in Section 1.3.3, daily dermal and inhalation exposure (mg/day) for residential pesticide handlers, for a given formulation-application method combination, is estimated by multiplying the formulation-application method-specific unit exposure by an estimate of the amount of active ingredient handled in a day, using the equation below: E = UE * AR * A (3.1) where:
E = exposure (mg/day); UE = unit exposure (mg/lb ai); AR = application rate (e.g., lb ai/ft2, lb ai/gal); and A = area treated or amount handled (e.g., ft2/day, gal/day).
Dermal and/or inhalation absorbed doses normalized to body weight are calculated as:
BW
AF * E D = (3.2)
where:
D = dose (mg/kg-day); E = exposure (mg/day); AF = absorption factor (dermal and/or inhalation); and BW = body weight (kg).
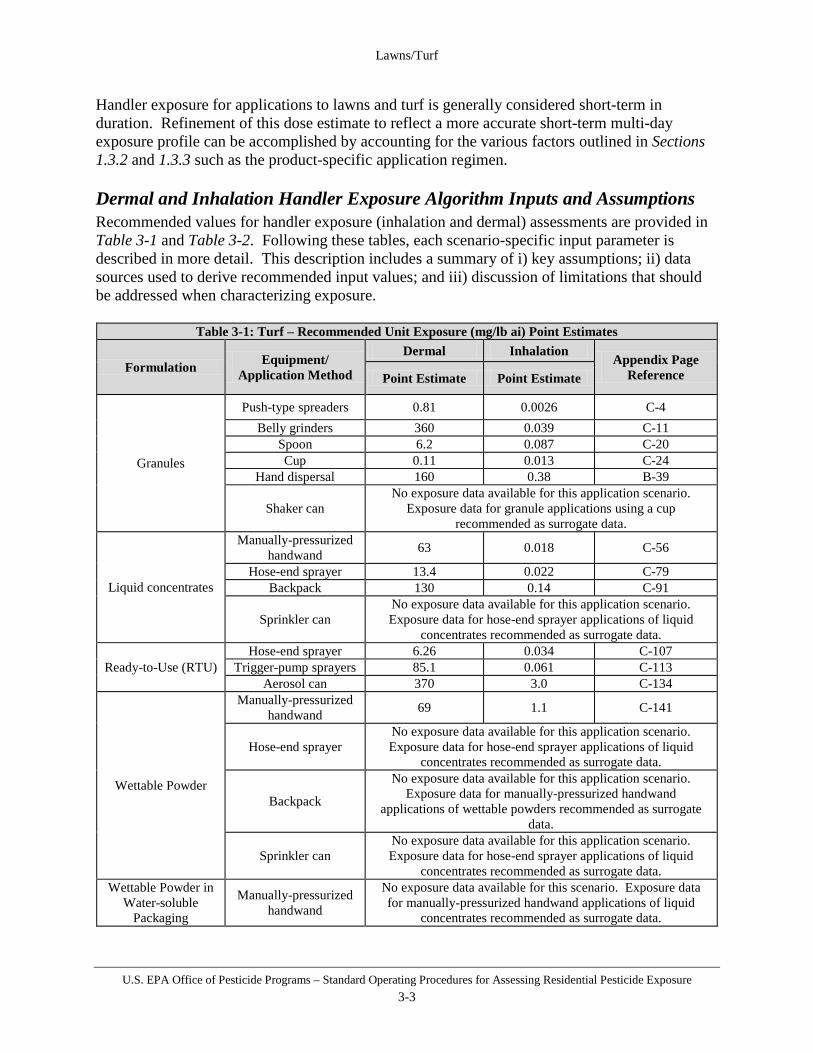
Lawns/Turf
U.S. EPA Office of Pesticide Programs – Standard Operating Procedures for Assessing Residential Pesticide Exposure 3-3
Handler exposure for applications to lawns and turf is generally considered short-term in duration. Refinement of this dose estimate to reflect a more accurate short-term multi-day exposure profile can be accomplished by accounting for the various factors outlined in Sections 1.3.2 and 1.3.3 such as the product-specific application regimen.
Dermal and Inhalation Handler Exposure Algorithm Inputs and Assumptions Recommended values for handler exposure (inhalation and dermal) assessments are provided in Table 3-1 and Table 3-2. Following these tables, each scenario-specific input parameter is described in more detail. This description includes a summary of i) key assumptions; ii) data sources used to derive recommended input values; and iii) discussion of limitations that should be addressed when characterizing exposure.
Table 3-1: Turf – Recommended Unit Exposure (mg/lb ai) Point Estimates
Formulation Equipment/ Application Method
Dermal Inhalation Appendix Page Reference Point Estimate Point Estimate
Granules
Push-type spreaders 0.81 0.0026 C-4 Belly grinders 360 0.039 C-11
Spoon 6.2 0.087 C-20 Cup 0.11 0.013 C-24
Hand dispersal 160 0.38 B-39
Shaker can No exposure data available for this application scenario.
Exposure data for granule applications using a cup recommended as surrogate data.
Liquid concentrates
Manually-pressurized handwand 63 0.018 C-56
Hose-end sprayer 13.4 0.022 C-79 Backpack 130 0.14 C-91
Sprinkler can No exposure data available for this application scenario. Exposure data for hose-end sprayer applications of liquid
concentrates recommended as surrogate data.
Ready-to-Use (RTU) Hose-end sprayer 6.26 0.034 C-107
Trigger-pump sprayers 85.1 0.061 C-113 Aerosol can 370 3.0 C-134
Wettable Powder
Manually-pressurized handwand 69 1.1 C-141
Hose-end sprayer No exposure data available for this application scenario. Exposure data for hose-end sprayer applications of liquid
concentrates recommended as surrogate data.
Backpack
No exposure data available for this application scenario. Exposure data for manually-pressurized handwand
applications of wettable powders recommended as surrogate data.
Sprinkler can No exposure data available for this application scenario. Exposure data for hose-end sprayer applications of liquid
concentrates recommended as surrogate data. Wettable Powder in
Water-soluble Packaging
Manually-pressurized handwand
No exposure data available for this scenario. Exposure data for manually-pressurized handwand applications of liquid
concentrates recommended as surrogate data.
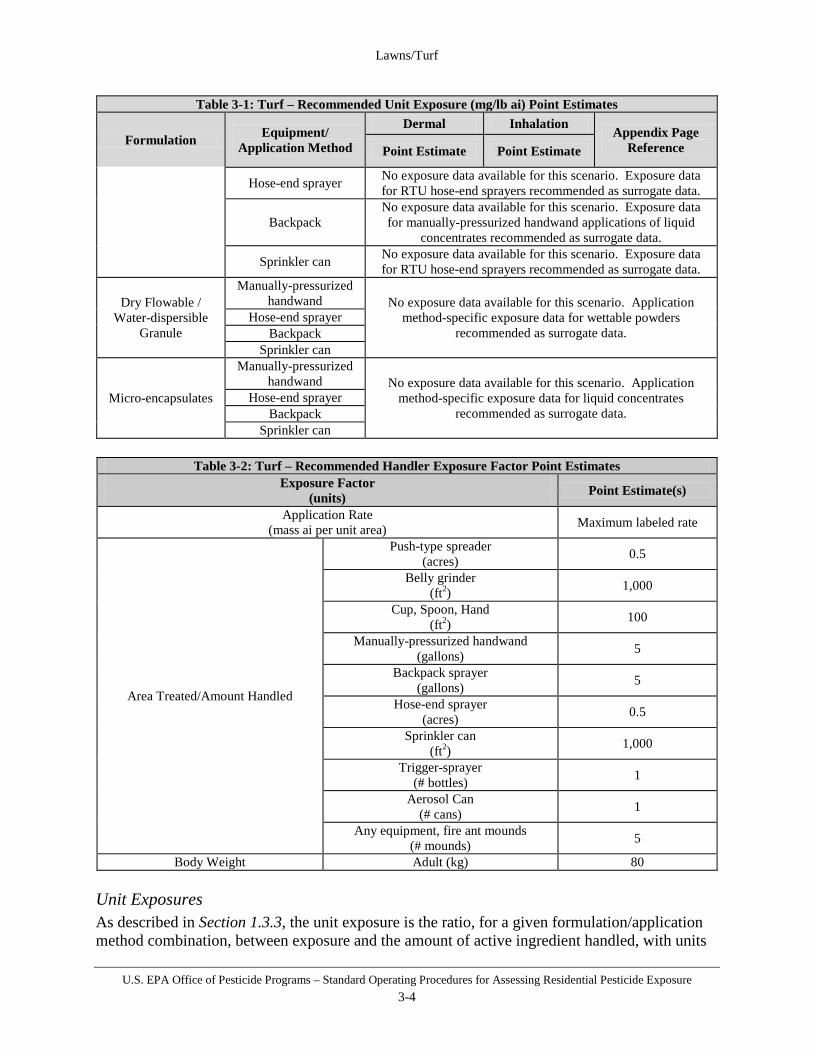
Lawns/Turf
U.S. EPA Office of Pesticide Programs – Standard Operating Procedures for Assessing Residential Pesticide Exposure 3-4
Table 3-1: Turf – Recommended Unit Exposure (mg/lb ai) Point Estimates
Formulation Equipment/ Application Method
Dermal Inhalation Appendix Page Reference Point Estimate Point Estimate
Hose-end sprayer No exposure data available for this scenario. Exposure data for RTU hose-end sprayers recommended as surrogate data.
Backpack No exposure data available for this scenario. Exposure data for manually-pressurized handwand applications of liquid
concentrates recommended as surrogate data.
Sprinkler can No exposure data available for this scenario. Exposure data for RTU hose-end sprayers recommended as surrogate data.
Dry Flowable / Water-dispersible
Granule
Manually-pressurized handwand No exposure data available for this scenario. Application
method-specific exposure data for wettable powders recommended as surrogate data.
Hose-end sprayer Backpack
Sprinkler can
Micro-encapsulates
Manually-pressurized handwand No exposure data available for this scenario. Application
method-specific exposure data for liquid concentrates recommended as surrogate data.
Hose-end sprayer Backpack
Sprinkler can
Table 3-2: Turf – Recommended Handler Exposure Factor Point Estimates Exposure Factor
(units) Point Estimate(s)
Application Rate (mass ai per unit area) Maximum labeled rate
Area Treated/Amount Handled
Push-type spreader (acres) 0.5
Belly grinder (ft2) 1,000
Cup, Spoon, Hand (ft2) 100
Manually-pressurized handwand (gallons) 5
Backpack sprayer (gallons) 5
Hose-end sprayer (acres) 0.5
Sprinkler can (ft2) 1,000
Trigger-sprayer (# bottles) 1
Aerosol Can (# cans) 1
Any equipment, fire ant mounds (# mounds) 5
Body Weight Adult (kg) 80 Unit Exposures As described in Section 1.3.3, the unit exposure is the ratio, for a given formulation/application method combination, between exposure and the amount of active ingredient handled, with units

Lawns/Turf
U.S. EPA Office of Pesticide Programs – Standard Operating Procedures for Assessing Residential Pesticide Exposure 3-5
mass exposure per mass active ingredient handled (e.g., mg ai exposure/lb ai handled). The recommended point estimates for individual handler scenarios are shown in Table 3-1. Data summaries can be found in Appendix C. Amount of Active Ingredient Handled The algorithm for estimating handler exposure requires some estimate of the amount of active ingredient handled per day. This factor varies based on the type of equipment or application method used and is estimated based on the application rate specified on the product label. First, the assessor should assemble application rate information in terms of active ingredient per area treated (e.g., lb ai/acre, lb ai/1000 ft2) and active ingredient per volume of spray (e.g., lb ai/gallon solution). For example, instructions for a granule formulation might direct application of 2 lbs of product per 100 square feet or a spray application might say to apply 2 gallons of solution per 100 square feet. Data on the amount of active ingredient handled are limited and difficult to collect. The amounts of active ingredient handled presented in this SOP are reasonable high-end assumptions for typical residential turf application equipment. These values and the supporting data (where applicable) are discussed below.
• Push-type spreader: ½ an acre for broadcast applications. This value is supported by data from the Outdoor Residential Pesticide Use and Usage Survey and National Gardening Association Survey (Johnson, et al., 1999), which showed that 73% of the people surveyed had lawns smaller than ½ acre.
• Belly grinder: 1,000 ft2 for spot treatments. Belly grinders are not practical for broadcast lawn treatments.
• Cup, Spoon, or Hand: 100 ft2 for spot treatments. Applications of granule pesticides with a cup, spoon, or by hand are not practical for broadcast lawn treatments, but are more appropriate for treating ant mounds, yellow jacket nests or dandelions (check label for pest directions).
• Manually-pressurized handwand sprayer: 5 gallons for spot treatments, which assumes mixing/loading/applying two 2.5-gallon sprayers. Manually-pressurized hand sprayers are not practical for broadcast lawn treatments due to the numbers of gallons generally required for broadcast sprays (e.g., 15 gallons/1000 sq ft).
• Backpack sprayer: 5 gallons for spot treatments, which assumes mixing/loading/applying two 2.5-gallon sprayers. Backpack sprayers are not practical for broadcast lawn treatments due to the numbers of gallons generally required for broadcast sprays (e.g., 15 gallons/1000 sq ft).
• Hose-end sprayer: ½ an acre for broadcast applications. This value is further supported by data from the Outdoor Residential Pesticide Use and Usage Survey and National Gardening Association Survey (Johnson, et al., 1999), which showed that 73% of the people surveyed had lawns smaller than ½ acre.
• Sprinkler can: 1,000 ft2 for spot treatments. Sprinkler cans are not practical for broadcast lawn treatments due to the numbers of gallons generally required for broadcast sprays (e.g., 15 gallons/1000 sq ft).

Lawns/Turf
U.S. EPA Office of Pesticide Programs – Standard Operating Procedures for Assessing Residential Pesticide Exposure 3-6
• Trigger sprayer: 1 bottle. Trigger sprayers are not practical for broadcast lawn treatments but are more appropriate for treating ant mounts, yellow jacket nests or dandelions (check label for pest directions).
• Aerosol can: 1 can. Aerosol cans are not practical for broadcast lawn treatments but are more appropriate for treating ant mounts, yellow jacket nests or dandelions (check label for pest directions).
• Fire ant mound treatments (any equipment): 5 individual mounds. Note: some labels have directions for broadcast applications to prevent invasion of fire ants of areas widely infested.
Future Research/Data Needs Unavailable information that would refine handler exposure assessments for pesticide applications to turf include:
• Application intervals (i.e., how often chemicals are applied to turf) – either chemical-specific or generic intervals by pesticide-type (e.g., fungicides, insecticides, etc.).
• Survey information (preferably longitudinal) detailing: o General pesticide use to obtain, on a per capita basis, the probability of treating
turf with pesticides; o Amount of product or formulation used or area treated per application; and, o Product-specific application rates to obtain the likelihood that the maximum rate
is used. • Handler exposure data:
o Specific for turf applications as well as for those formulations and/or application methods currently unavailable as shown in Table 3-1;
o Describing the extent to which an individual’s exposure for a given formulation and application method varies from application-to-application.
Exposure Characterization and Data Quality Unit Exposures
• The exposure data underlying unit exposures are considered reasonable for the purposes of estimating exposure. The data are from actual applications using standardized exposure sampling methodologies and laboratory analyses.
• The underlying assumption of the use of exposure data as unit exposures – proportionality between the amount of active ingredient handled and exposure – is uncertain, though potentially conservative. However, as a prediction mechanism, it is considered practical and useful for the purposes of handler exposure assessment in a regulatory context. It provides a straightforward handler exposure calculation method and enables risk mitigation in the form of formulation comparison and decreased application rates.
• The extent to which an individual’s exposure (expressed via unit exposures) varies day-to-day or application-to-application is unknown; therefore, the assumption that there is no variation when assessing longer-term exposure durations is considered conservative.

Lawns/Turf
U.S. EPA Office of Pesticide Programs – Standard Operating Procedures for Assessing Residential Pesticide Exposure 3-7
Amount of active ingredient handled
• Information on the amounts of active ingredient handled for typical residential turf application equipment is largely unavailable. The estimates used however, are believed to result in health protective exposure estimates.
• The extent to which the amount an individual will handle per application varies from day-to-day or application-to-application is unknown; therefore, the assumption that there is no variation when assessing longer-term exposure durations is considered conservative.
3.2 Post-application Exposure Assessment Post-application exposure can result from a number of activities following pesticide applications on turf. While exposure may occur for people of all ages, adults, children 11 < 16 years old, children 6 < 11 years old, and children 1 < 2 years old are considered the index lifestages for lawns and turf depending on the exposure scenario. The Agency has derived standard methods for estimating exposure and dose for eight scenarios resulting from contact with turf that has previously been treated with pesticides:
• Section 3.2.1 - adult/children 1 < 2 years old inhalation exposure resulting from activities on turf;
• Section 3.2.2 - adult/children 1 < 2 years old dermal exposure resulting from activities on turf;
• Section 3.2.3 - children 1 < 2 years old non-dietary ingestion via hand-to-mouth activity; • Section 3.2.4 - children 1 < 2 years old non-dietary ingestion via object-to-mouth
activity; • Section 3.2.5 - children 1 < 2 years old non-dietary ingestion via soil ingestion; • Section 3.2.6 - children 1 < 2 years old non-dietary ingestion via episodic granular
ingestion; • Section 3.2.7 - adult/children 11 < 16 years old dermal exposure resulting from mowing;
and • Section 3.2.8 – adult/children 11 < 16 years old/children 6 < 11 years old dermal
exposure resulting from golfing.
3.2.1 Post-application Inhalation Exposure Assessment Post-application inhalation exposure while engaged in activities on or around previously treated turf is generally not assessed and should be handled on a case-by-case basis. The combination of low vapor pressure for chemicals typically used as active ingredients in outdoor residential pesticide products and dilution in outdoor air is likely to result in minimal inhalation exposure.
3.2.2 Post-application Dermal Exposure Assessment: Physical Activities on Turf

Lawns/Turf
U.S. EPA Office of Pesticide Programs – Standard Operating Procedures for Assessing Residential Pesticide Exposure 3-8
The residential turf post-application SOP provides a standard method for estimating potential dermal doses among adults and/or children 1 < 2 years old from dermal contact with turf that has previously been treated with pesticides. This scenario assumes that pesticide residues are transferred to the skin of adults/children who enter treated lawns for play, recreation, yardwork, or other homeowner activities. Considering the strengths and limitations of available data and behavioral characteristics of potentially exposed lifestages (see Appendix A for more details); post-application dermal exposure is only calculated for adults and children 1 < 2 years old. It is assumed that individuals contact previously treated turf on the same day a pesticide is applied. However, the assessment can be refined to more accurately reflect exposure over a longer period of time (e.g., a week or month) if toxicological or activity information indicate the need for such estimates. Post-application Dermal Exposure Algorithm – Physical Activities on Turf Exposure resulting from contacting previously treated turf while performing physical activities is calculated as shown below. As discussed in Section 1.3.4 residential post-application exposure assessment must include calculation of exposure on the day of application. Therefore, though an assessment can present exposures for any day “t” following the application, it must include “day 0” exposure. E = TTRt * CF1 * TC * ET (3.3) where:
E = exposure (mg/day); TTRt = turf transferable residue on day t (µg/cm2); CF1 = weight unit conversion factor (0.001 mg/µg); TC = transfer coefficient (cm2/hr); and ET = exposure time (hr/day).
If chemical-specific TTR data are available, then surface residues from the day of application should be used (assume that individuals could be exposed to residues immediately after application). However, if data are not available, then TTRt can be calculated using the following formula: TTRt = AR * F * (1-FD)t
* CF2 * CF3 (3.4)
where: TTRt = turf transferable residue on day t (µg/cm2); AR = application rate (lbs ai/ft2
or lb ai/acre); F = fraction of ai as transferable residue following application (unitless); FD = fraction of residue that dissipates daily (unitless); t = post-application day on which exposure is being assessed; CF2 = weight unit conversion factor (4.54 x 10⁸ µg/lb); and CF3 = area unit conversion factor (1.08 x 10⁻³ ft2/ cm2
or 2.47 x 10⁻⁸ acre/cm2). Dermal absorbed doses are calculated as:

Lawns/Turf
U.S. EPA Office of Pesticide Programs – Standard Operating Procedures for Assessing Residential Pesticide Exposure 3-9
BW
AFED *= (3.5)
where:
D = dose (mg/kg-day); E = exposure (mg/day); AF = absorption factor (dermal); and BW = body weight (kg).
Post-application dermal exposure following applications to lawns and turf is generally considered short-term in duration. Refinement of this dose estimate to reflect a more accurate short-term multi-day exposure profile can be accomplished by accounting for the various factors outlined in Sections 1.3.2 and 1.3.4 such as residue dissipation, product-specific re-treatment intervals, and activity patterns. If longer-term assessments (i.e., intermediate-, long-term, or lifetime exposures) are deemed necessary, similar refinements to more accurately reflect the exposure profile are recommended. Post-application Dermal Exposure Algorithm Inputs and Assumptions – Physical Activities on Turf Recommended values for post-application dermal (physical activities on turf) exposure assessments are provided in Table 3-3. Following this table, each scenario-specific input parameter is described in more detail. This description includes a summary of i) key assumptions; ii) data sources used to derive recommended input values; and iii) discussion of limitations that should be addressed when characterizing exposure.
Table 3-3: Turf (Physical Activities) – Recommended Point Estimates for Post-Application Dermal Exposure Factors
Algorithm Notation Exposure Factor (units) Point Estimate(s)
AR Application rate (mass active ingredient per unit area)
Maximum labeled application rate
F
Fraction of AR as TTR following application (if chemical-specific data is
unavailable)
L/WP/WDG 0.01
Granules 0.002
FD
Daily residue dissipation (if chemical-specific data
is unavailable) (fraction)
L/WP/WDG 0.1
Granules 0.1
TC Transfer
Coefficient (cm2/hr)
L/WP/WDG Adults 180,000
Children 1 < 2 years old 49,000
Granules Adults 200,000
Children 1 < 2 years old 54,000
ET Exposure Time (hours per day)
Adults 1.5 Children 1 < 2 years old 1.5
BW Body Weight (kg)
Adults 80 Children 1 < 2 years old 11

Lawns/Turf
U.S. EPA Office of Pesticide Programs – Standard Operating Procedures for Assessing Residential Pesticide Exposure 3-10
Table 3-3: Turf (Physical Activities) – Recommended Point Estimates for Post-Application Dermal Exposure Factors
Algorithm Notation Exposure Factor (units) Point Estimate(s)
L/WP/WDG = Liquids/Wettable Powders/Water-dispersible Granules Turf Transferable Residue (TTR) Following an application, some pesticide residue remains on turf for an individual to contact and remove. This is referred to as turf transferable residue (TTR) and is assumed to be the most significant source for dermal exposure in this scenario. The industry-based ORETF tested five TTR collection techniques in 1996: the California roller method, the shoe method, the polyurethane foam (PUF) roller method, the drag sled method, and the foliar wash method. A follow-up study was conducted on a turf farm in 1997 using three modified techniques: the modified California roller method, the modified shoe method, and the ORETF roller method. The data from both of these studies are summarized and analyzed in a 1999 ORETF report (Cowell, J. and Johnson, D., 1999; EPA MRID 44972203). Ultimately – based on the information provided by ORETF and working in conjunction with the California Department of Pesticide Regulation (DPR) and Canada’s Pest Management Regulatory Agency (PMRA) – a TTR collection method (the Modified California Roller Method) was agreed upon for all future TTR studies. The Modified California Roller was selected because it produced the most consistent results across individuals, active ingredients, formulation types, and time than the other techniques. It also was sensitive enough to detect low levels of residues and was one of the easier techniques to use. TTR studies using the Modified California Roller Method were required for all pesticide active ingredients that had turf uses as part of the 1995 OREDCI (U.S. EPA, 1995), which was amended in 1998. Subsequently, in October of 2007, the Agency revised the data requirements that pertain to conventional pesticides. As part of these revisions, TTR studies were classified as required for all occupational (e.g., sod farms, golf courses, parks, and recreational areas) or residential turf uses under 40 CFR 158, subpart K (158.1070; post-application exposure data requirements table). If no chemical-specific TTR data are available, an initial screening level assessment can be performed using the maximum labeled turf application rate.
Chemical-specific data When chemical-specific data are available, the TTR is the surface residue on Day 0, which assumes an individual could be exposed to residues immediately after application.
Calculating from Application Rate When the application rate is in terms of mass active ingredient per area (e.g., lbs ai/ft2
or lb ai/acre), the total deposited residue is assumed to be equivalent to the application rate.
Fraction of Application Rate Available For Transfer (F) If chemical-specific TTR measurements are not available, a screening value for the fraction of application rate available for transfer should be used to perform the assessment. For the purpose

Lawns/Turf
U.S. EPA Office of Pesticide Programs – Standard Operating Procedures for Assessing Residential Pesticide Exposure 3-11
of this SOP, 59 studies that collected turf transferable residues using the Modified California Roller Method (36 studies using liquids, 11 studies using wettable powders/water dispersible granules, and 12 studies using granules) were analyzed. Only TTR data collected with the Modified California Roller Method were used in this analysis because this was the turf residue collection method agreed upon by the Agency in the 1995 OREDCI (U.S. EPA, 1995). During the analysis of these studies, it was determined that there was no statistical difference between residues resulting from liquid, wettable powder (applied as a spray), or water dispersible granular (applied as a spray) applications; as a result, these data were combined for analysis. Granular data were analyzed separately. These analyses are presented in Section D.6 of Appendix D. For liquid applications (including wettable powders/water dispersible granules applied as sprays), the recommended screening level point estimate for use in post-application dermal exposure assessment is 0.01 (equivalent to 1%). For granular applications, the recommended screening level point estimate for use in post-application dermal exposure assessment is 0.002 (equivalent to 0.2%). Daily Residue Dissipation (FD) Post-application exposures must be assessed on the same day the pesticide is applied because it is assumed that individuals could be exposed to turfgrass immediately after application. Therefore, post-application exposures are based on residues found on the day of application (i.e., referred to as day 0). For subsequent days after application it is also important to estimate exposure based on pesticide dissipation rates because of possible concerns over longer term exposures (i.e., using an amortized dose) and possible re-treatment intervals. If no chemical-specific TTR data are available, then a 10 percent dissipation rate per day should be assumed. Transfer Coefficient (TC) The transfer coefficients used for turf dermal scenarios were derived from data gathered while adult human volunteers performed an approximate 2-hour composite routine consisting of 12 sequential activities which children and adults routinely engage on residential turf (D. Klonne and D. Johnson, MRID 47292001). These activities represent behaviors that are reported in the National Human Activity Pattern Survey (NHAPS) for children aged 1 to 12 years (Klepeis, et. al., 2001). The two-hour duration of the routine was chosen because NHAPS indicated that a high-bound estimate of time children spend playing on turf is two hours per day. Two turf sites were treated during the study; one with a liquid formulation and the other with a granular formulation. A total of 40 participants performed the composite routine during the study; 10 participants each during two separate sessions at the two treated turf sites. The potential dermal exposure to each study participant was measured by using whole-body dosimetry (inner and outer dosimeters), foot washes, hand washes, and face/neck wipes. TTR was collected at both sites using the Modified California Roller Method. All of these measurements were then used in the transfer coefficient calculations. An analysis was performed to assess the statistical differences between the TCs calculated using the liquid data vs. the granular data. It was determined that these two distributions should not be combined because the upper percentile values are higher for the granular TCs vs. the liquid TCs even though the central tendency values of the two distributions are similar (See Section D.7.1 of Appendix D). For children 1 < 2 years old, the transfer coefficient is adjusted for body surface
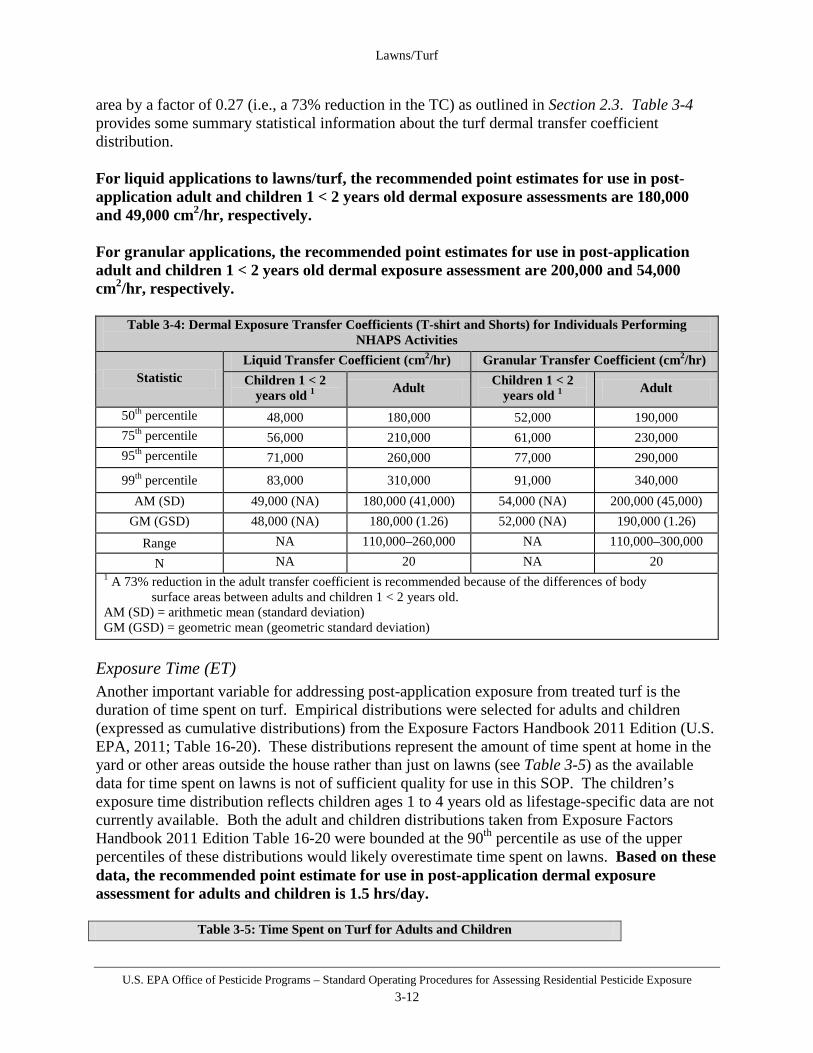
Lawns/Turf
U.S. EPA Office of Pesticide Programs – Standard Operating Procedures for Assessing Residential Pesticide Exposure 3-12
area by a factor of 0.27 (i.e., a 73% reduction in the TC) as outlined in Section 2.3. Table 3-4 provides some summary statistical information about the turf dermal transfer coefficient distribution. For liquid applications to lawns/turf, the recommended point estimates for use in post-application adult and children 1 < 2 years old dermal exposure assessments are 180,000 and 49,000 cm2/hr, respectively. For granular applications, the recommended point estimates for use in post-application adult and children 1 < 2 years old dermal exposure assessment are 200,000 and 54,000 cm2/hr, respectively.
Table 3-4: Dermal Exposure Transfer Coefficients (T-shirt and Shorts) for Individuals Performing NHAPS Activities
Statistic Liquid Transfer Coefficient (cm2/hr) Granular Transfer Coefficient (cm2/hr) Children 1 < 2
years old 1 Adult Children 1 < 2 years old 1 Adult
50th percentile 48,000 180,000 52,000 190,000 75th percentile 56,000 210,000 61,000 230,000 95th percentile 71,000 260,000 77,000 290,000
99th percentile 83,000 310,000 91,000 340,000 AM (SD) 49,000 (NA) 180,000 (41,000) 54,000 (NA) 200,000 (45,000)
GM (GSD) 48,000 (NA) 180,000 (1.26) 52,000 (NA) 190,000 (1.26)
Range NA 110,000–260,000 NA 110,000–300,000
N NA 20 NA 20 1 A 73% reduction in the adult transfer coefficient is recommended because of the differences of body surface areas between adults and children 1 < 2 years old. AM (SD) = arithmetic mean (standard deviation) GM (GSD) = geometric mean (geometric standard deviation)
Exposure Time (ET) Another important variable for addressing post-application exposure from treated turf is the duration of time spent on turf. Empirical distributions were selected for adults and children (expressed as cumulative distributions) from the Exposure Factors Handbook 2011 Edition (U.S. EPA, 2011; Table 16-20). These distributions represent the amount of time spent at home in the yard or other areas outside the house rather than just on lawns (see Table 3-5) as the available data for time spent on lawns is not of sufficient quality for use in this SOP. The children’s exposure time distribution reflects children ages 1 to 4 years old as lifestage-specific data are not currently available. Both the adult and children distributions taken from Exposure Factors Handbook 2011 Edition Table 16-20 were bounded at the 90th percentile as use of the upper percentiles of these distributions would likely overestimate time spent on lawns. Based on these data, the recommended point estimate for use in post-application dermal exposure assessment for adults and children is 1.5 hrs/day.
Table 3-5: Time Spent on Turf for Adults and Children

Lawns/Turf
U.S. EPA Office of Pesticide Programs – Standard Operating Procedures for Assessing Residential Pesticide Exposure 3-13
Statistic Hours per Day Adults Children 1 < 2 years old 1
5th percentile 0.08 0.42 25th percentile 0.5 1.0 50th percentile 1.5 1.5 75th percentile 3.0 3.0 90th percentile 5.5 5.1 100th percentile 5.5 5.1
1 Data represents 1 to 4 years old. Future Research/Data Needs Unavailable information that would refine post-application dermal exposure assessments for pesticide applications to turf include:
• Application intervals (i.e., how often chemicals are applied to turf) – either chemical-specific or generic intervals by pesticide-type (e.g., fungicides, insecticides, etc.).
• Survey information (preferably longitudinal) detailing: o General pesticide use to obtain, on a per capita basis, the probability of treating
turf with pesticides; o Product-specific application rates to obtain the likelihood that the maximum rate
is used; and, o Lifestage-specific daily activity patterns for turf.
• Post-application exposure data: o Describing the extent to which an individual’s exposure for a given activity
varies. Exposure Characterization and Data Quality
Turf Transferable Residue • The Modified California Roller Method was used in the selected turf dermal transfer
coefficient study to collect TTR. This TTR collection method was agreed upon by the ORETF, CDPR, PMRA, and the Agency. For all assessments, transfer coefficients from this study should only be used with TTR studies that utilize the Modified California Roller Method. If chemical-specific TTR data collected via the Modified California Roller Method are not available, then the screening level TTR value (i.e., based on application rate) should be used.
• Absent chemical-specific data, estimates of turf transferable residue factors such as the amount available following application and dissipation are used generically based on existing data for a wide variety of chemicals. Use of the data generically, including using high-end estimates, may overestimate exposure for some chemicals.
• Assessors should recognize that factors such as rainfall/irrigation, grass growth, and grass mowing can greatly impact the dissipation rate of pesticides on turf when conducting turf post-application exposure assessments.
Exposure Time

Lawns/Turf
U.S. EPA Office of Pesticide Programs – Standard Operating Procedures for Assessing Residential Pesticide Exposure 3-14
• The extent to which the amount of time spent conducting certain activities varies over an extended period of time is unknown; therefore, the assumption that there is no variation when assessing longer-term exposure times is considered conservative.
3.2.3 Post-application Non-Dietary Ingestion Exposure Assessment: Hand-to-Mouth
This SOP provides a standard method for estimating the dose from incidental ingestion of pesticide residues from previously treated turf. Considering the strengths and limitations of available data and behavioral characteristics of potentially exposed lifestages (see Appendix A for more details), exposure for children 1 < 2 years old is calculated in this scenario. It assumed that pesticide residues are transferred to the skin of children playing on treated turf and are subsequently ingested as a result of hand-to-mouth transfer. It does not include residues ingested as a result of mouthing an object or via soil ingestion (See Sections 3.2.4 and 3.2.5). Post-application Hand-to-Mouth Exposure Algorithm Exposure from hand-to-mouth activity is calculated as follows (based on the algorithm utilized in the SHEDS-Multimedia model): (3.6) where:
E = exposure (mg/day); HR = hand residue loading (mg/cm2); FM = fraction hand surface area mouthed / event (fraction/event); SAH = typical surface area of one hand (cm2); ET = exposure time (hr/day); N_Replen = number of replenishment intervals per hour (intervals/hour); SE = saliva extraction factor (i.e., mouthing removal efficiency); and Freq_HtM = number of hand-to-mouth contacts events per hour (events/hour).
and
2* SADE* Fai
HRH
hands= (3.7)
where: HR = hand residue loading (mg/cm2);
Faihands = fraction ai on hands compared to total surface residue from dermal transfer coefficient study (unitless);
DE = dermal exposure (mg); and SAH = typical surface area of one hand (cm2). Dose, normalized to body weight, is calculated as:
( ) ( ) ( )
−−∗∗∗∗∗= ReplenN
HtMFreq
HM SEReplenNETSAFHRE __
11_

Lawns/Turf
U.S. EPA Office of Pesticide Programs – Standard Operating Procedures for Assessing Residential Pesticide Exposure 3-15
BWED = (3.8)
where:
D = dose (mg/kg-day); E = exposure (mg/day); and BW = body weight (kg).
Post-application hand-to-mouth exposure following applications to lawns and turf is generally considered short-term in duration. Refinement of this dose estimate to reflect a more accurate short-term multi-day exposure profile can be accomplished by accounting for the various factors outlined in Sections 1.3.2and 1.3.4 such as residue dissipation, product-specific re-treatment intervals, and activity patterns. If longer-term assessments (i.e., intermediate-, long-term, or lifetime exposures) are deemed necessary, similar refinements to more accurately reflect the exposure profile are recommended. Post-application Hand-to-Mouth Algorithm Inputs and Assumptions Recommended values for post-application hand-to-mouth exposure assessments are provided in Table 3-6. Following this table, each scenario-specific input parameter is described in more detail. This description includes a summary of i) key assumptions; ii) data sources used to derive recommended input values; and iii) discussion of limitations that should be addressed when characterizing exposure.
Table 3-6: Turf - Recommended Point Estimates for Post-Application Hand-to-Mouth Exposure Factors Algorithm Notation
Exposure Factor (units) Point Estimate(s)
Faihands
Fraction of ai on hands from dermal transfer
coefficient study (unitless)
Liquid formulations 0.06
Granular formulations 0.027
DE Dermal exposure (mg) As calculated from Section 3.2.2
SAH Typical surface area of one hand (cm2), children 1 < 2 years old 150
AR Application rate (mass active ingredient per unit area) Maximum labeled application rate
HR Residue available on the hands (mg/cm2) Calculated via (DE * Faihands)/SAH
FM Fraction hand surface area mouthed (fraction/event) 0.127
N_Replen Replenishment intervals per hour (intervals/hr) 4
ET Exposure time (hrs/day) 1.5
SE Saliva extraction factor (unitless) 0.48
Freq_HtM Hand-to-mouth events per hour (events/hr) 13.9
BW Body Weight Children 1 < 2 years old 11.4

Lawns/Turf
U.S. EPA Office of Pesticide Programs – Standard Operating Procedures for Assessing Residential Pesticide Exposure 3-16
Table 3-6: Turf - Recommended Point Estimates for Post-Application Hand-to-Mouth Exposure Factors Algorithm Notation
Exposure Factor (units) Point Estimate(s)
(kg) Hand Residue Loading (HR) Hand residue is linked to dermal exposure and it is assumed that the fraction of residue on the hands is equal to the fraction of the residue on the hands from the turf dermal transfer coefficient study. Fraction Active Ingredient on the Hands (Faihands) The fraction of active ingredient available on the hands was based on the turf dermal transfer coefficient study (D. Klonne and D. Johnson, MRID 47292001). These values were determined for liquids and granules by taking the average fraction of active ingredient on the hands from all monitoring units and comparing that value to the average fraction of active ingredient on the entire body from all monitoring units assuming an individual is wearing a t-shirt and shorts. This analysis resulted in values of 0.06 for liquids and 0.027 for granules. Fraction Hand Surface Area Mouthed (FM) See Section 2.4 of this SOP for discussion of the fraction of hand surface area mouthed distribution. The recommended point estimate for use in post-application hand-to-mouth exposure assessment is 0.127 per event. Hand Surface Area (SAH) The hand surface area for children 1 < 2 years old of 150 cm2, for one hand, was based on values from the Exposure Factors Handbook 2011 Edition (U.S. EPA, 2011). Exposure Time (ET) See discussion of exposure time in Section 3.2.2 above. The recommended point estimate for use in post-application hand-to-mouth exposure assessment is 1.5 hrs/day. Replenishment Intervals per Hour (N_Replen) This SOP assumes an estimate of 4 replenishment intervals per hour (i.e., residues on the hand will be replenished every 15 minutes). This value was selected as a conservative assumption based on the use of 30 minutes in the SHEDS model to coincide with the Consolidated Human Activity Database (CHAD) diaries.
Fraction of Pesticide Extracted by Saliva (SE) See Section 2.6 of this SOP for discussion of fraction of pesticide extracted by saliva distribution. The recommended point estimate for use in post-application hand-to-mouth exposure assessment is 0.48. Hand-to-Mouth Events per Hour (Freq_HtM)

Lawns/Turf
U.S. EPA Office of Pesticide Programs – Standard Operating Procedures for Assessing Residential Pesticide Exposure 3-17
Frequency of hand-to-mouth events is an important variable for hand-to-mouth post-application exposure assessments. The estimates for frequency of hand-to-mouth events in outdoor environments are based on the Xue et al. (2007) meta-analysis. The turf SOP utilizes hand-to-mouth frequency data for the 1 < 2 year old lifestage. The estimates of hand mouthing frequency (events/hour) for 1 < 2 years old were derived from 4 studies representing 32 participants. Based on an analysis of the data by Xue et al., it was determined that a Weibull distribution (scale= 13.8, shape= 0.98) best fits the observed data. Table 3-7 provides distributions and point estimates of hand-to-mouth events for use in residential pesticide exposure assessment and Appendix D.9.1 provides additional analysis. The recommended point estimate for use in post-application hand-to-mouth exposure assessment is 13.9 events/hr.
Table 3-7: Frequency of Hand-to-Mouth Events (events/hour) Statistic Children 1 < 2 years old 50th percentile 8.0 75th percentile 19.2 95th percentile 42.2 AM (SD) 13.9 (13.6) Range 1 - 46.7 N 32 AM (SD) = arithmetic mean (standard deviation)
Future Research/Data Needs Unavailable information that would refine post-application hand-to-mouth exposure assessments for pesticide applications to turf include:
• Application intervals (i.e., how often chemicals are applied to turf) – either chemical-specific or generic intervals by pesticide-type (e.g., fungicides, insecticides, etc.).
• Survey information (preferably longitudinal) detailing: o General pesticide use to obtain, on a per capita basis, the probability of treating
turf with pesticides; o Product-specific application rates to obtain the likelihood that the maximum rate
is used; and, o Daily activity patterns specific to hand-to-mouth activities on turf (e.g.,
replenishment interval, hand-to-surface contacts). Exposure Characterization and Data Quality
Turf Transferable Residue • Absent chemical-specific data, estimates of turf transferable residue factors such as the
amount available following application and dissipation are used generically based on existing data for a wide variety of chemicals. Use of the data generically, including using high-end estimates, may overestimate exposure for some chemicals.
• Assessors should recognize that factors such as rainfall/irrigation, grass growth, and grass mowing can greatly impact the dissipation rate of pesticides on turf.
Exposure Time
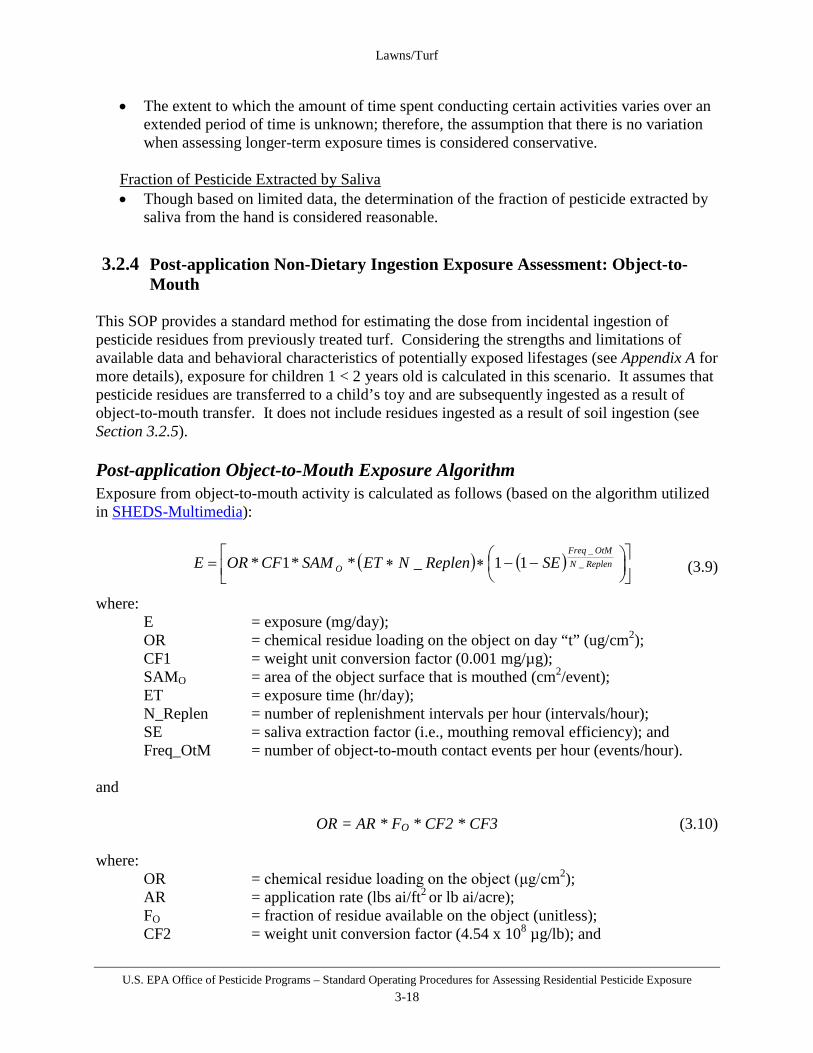
Lawns/Turf
U.S. EPA Office of Pesticide Programs – Standard Operating Procedures for Assessing Residential Pesticide Exposure 3-18
• The extent to which the amount of time spent conducting certain activities varies over an extended period of time is unknown; therefore, the assumption that there is no variation when assessing longer-term exposure times is considered conservative.
Fraction of Pesticide Extracted by Saliva • Though based on limited data, the determination of the fraction of pesticide extracted by
saliva from the hand is considered reasonable.
3.2.4 Post-application Non-Dietary Ingestion Exposure Assessment: Object-to-Mouth
This SOP provides a standard method for estimating the dose from incidental ingestion of pesticide residues from previously treated turf. Considering the strengths and limitations of available data and behavioral characteristics of potentially exposed lifestages (see Appendix A for more details), exposure for children 1 < 2 years old is calculated in this scenario. It assumes that pesticide residues are transferred to a child’s toy and are subsequently ingested as a result of object-to-mouth transfer. It does not include residues ingested as a result of soil ingestion (see Section 3.2.5). Post-application Object-to-Mouth Exposure Algorithm Exposure from object-to-mouth activity is calculated as follows (based on the algorithm utilized in SHEDS-Multimedia):
(3.9) where:
E = exposure (mg/day); OR = chemical residue loading on the object on day “t” (ug/cm2); CF1 = weight unit conversion factor (0.001 mg/µg); SAMO = area of the object surface that is mouthed (cm2/event); ET = exposure time (hr/day); N_Replen = number of replenishment intervals per hour (intervals/hour); SE = saliva extraction factor (i.e., mouthing removal efficiency); and Freq_OtM = number of object-to-mouth contact events per hour (events/hour).
and OR = AR * FO * CF2 * CF3 (3.10) where:
OR = chemical residue loading on the object (μg/cm2); AR = application rate (lbs ai/ft2
or lb ai/acre); FO = fraction of residue available on the object (unitless); CF2 = weight unit conversion factor (4.54 x 10⁸ µg/lb); and
( ) ( )
−−∗∗= ReplenN
OtMFreq
O SEReplenNETSAMCFORE __
11_**1*
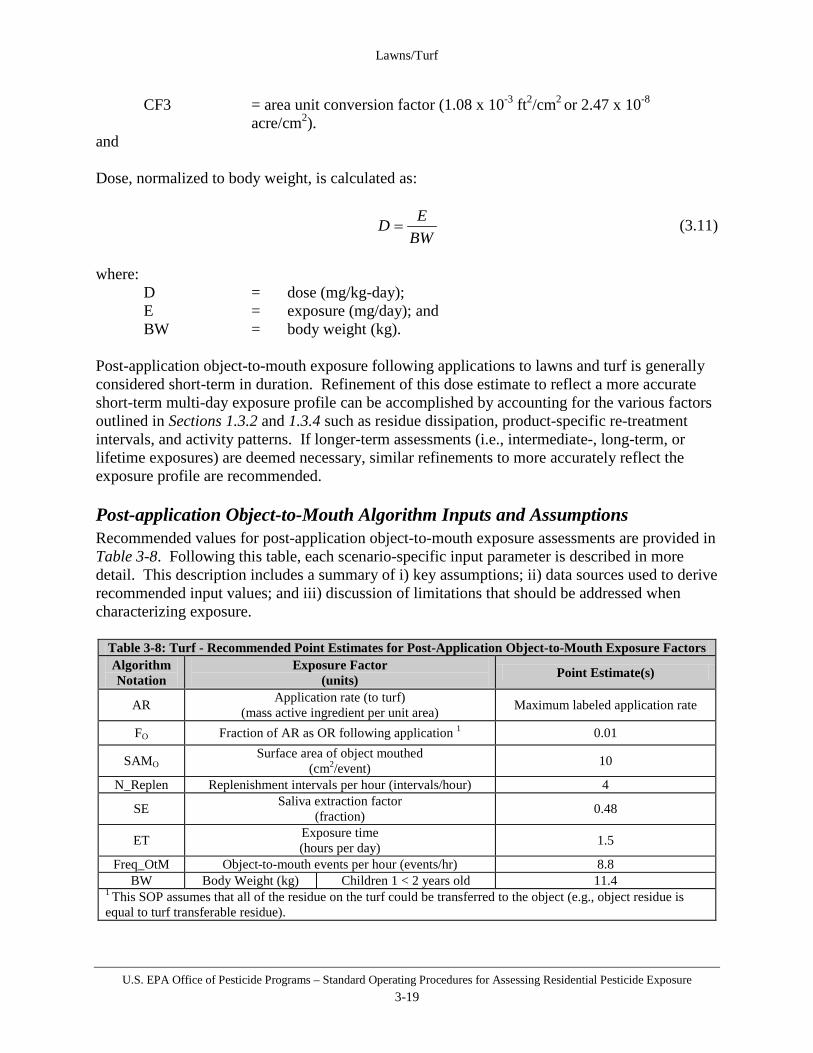
Lawns/Turf
U.S. EPA Office of Pesticide Programs – Standard Operating Procedures for Assessing Residential Pesticide Exposure 3-19
CF3 = area unit conversion factor (1.08 x 10⁻³ ft2/cm2 or 2.47 x 10⁻⁸
acre/cm2). and Dose, normalized to body weight, is calculated as:
BWED = (3.11)
where:
D = dose (mg/kg-day); E = exposure (mg/day); and BW = body weight (kg).
Post-application object-to-mouth exposure following applications to lawns and turf is generally considered short-term in duration. Refinement of this dose estimate to reflect a more accurate short-term multi-day exposure profile can be accomplished by accounting for the various factors outlined in Sections 1.3.2 and 1.3.4 such as residue dissipation, product-specific re-treatment intervals, and activity patterns. If longer-term assessments (i.e., intermediate-, long-term, or lifetime exposures) are deemed necessary, similar refinements to more accurately reflect the exposure profile are recommended. Post-application Object-to-Mouth Algorithm Inputs and Assumptions Recommended values for post-application object-to-mouth exposure assessments are provided in Table 3-8. Following this table, each scenario-specific input parameter is described in more detail. This description includes a summary of i) key assumptions; ii) data sources used to derive recommended input values; and iii) discussion of limitations that should be addressed when characterizing exposure.
Table 3-8: Turf - Recommended Point Estimates for Post-Application Object-to-Mouth Exposure Factors Algorithm Notation
Exposure Factor (units) Point Estimate(s)
AR Application rate (to turf) (mass active ingredient per unit area) Maximum labeled application rate
FO Fraction of AR as OR following application 1 0.01
SAMO Surface area of object mouthed (cm2/event) 10
N_Replen Replenishment intervals per hour (intervals/hour) 4
SE Saliva extraction factor (fraction) 0.48
ET Exposure time (hours per day) 1.5
Freq_OtM Object-to-mouth events per hour (events/hr) 8.8 BW Body Weight (kg) Children 1 < 2 years old 11.4
1 This SOP assumes that all of the residue on the turf could be transferred to the object (e.g., object residue is equal to turf transferable residue).

Lawns/Turf
U.S. EPA Office of Pesticide Programs – Standard Operating Procedures for Assessing Residential Pesticide Exposure 3-20
Fraction of Residue Available on the Object (FO) Following an application, some pesticide residue remains on turf. Some of this residue may be transferred to a child’s toy and subsequently ingested via object-to-mouth activities. For this SOP, it is assumed that the residue that could be transferred to the object is the same as what is available for dermal transfer. As a result, the fraction of total deposited residue available for transfer using the turf transferable residue data (see discussion above in Section 3.2.2 for more detail) should be used as a conservative estimate for the fraction of residue available on the object. Based on the available liquid TTR data, the recommended point estimate for use in post-application object-to-mouth exposure assessment is 0.01. Surface Area of Object Mouthed (SAMO) See Section 2.5 of this SOP for discussion of surface area of object mouthed. The recommended point estimate for use in post-application object-to-mouth exposure assessment is 10 cm2. Exposure Time (ET) See discussion of exposure time in Section 3.2.2 above. The recommended point estimate for use in post-application object-to-mouth exposure assessment is 1.5 hrs/day. Replenishment Intervals per Hour (N_Replen) This SOP assumes an estimate of 4 replenishment intervals per hour (i.e., residues on the hand will be replenished every 15 minutes). This value was selected as a conservative assumption based on the use of 30 minutes in the SHEDS model to coincide with the CHAD diaries. Fraction of Pesticide Extracted by Saliva (SE) See Section 2.6 of this SOP for discussion of fraction of pesticide extracted by saliva distribution. The recommended point estimate for use in post-application object-to-mouth exposure assessment is 0.48. Object-to-Mouth Events per Hour (Freq_OtM) Frequency of object-to-mouth events is an important variable for object-to-mouth post-application exposure assessments. The estimates for frequency of object-to-mouth events in outdoor environments are based on the Xue et al. (2010) meta-analysis. The turf SOP utilizes object-to-mouth frequency data for the 1 < 2 year old lifestage. The estimates of object mouthing frequency (events/hour) for 1 < 2 years old were derived from 2 studies representing 21 participants. Based on an analysis of the data by Xue et al. (2010), it was determined that a Weibull distribution (scale=8.58, shape= 0.93) best fits the observed data. Table 3-9 provides distributions and point estimates of hand to mouth events for use in residential pesticide exposure assessment and Appendix D.10.1 provides further detailed analysis. Based on this analysis, the recommended point estimate for use in post-application object-to-mouth exposure assessment is 8.8 events/hr.
Table 3-9: Frequency of Object-to-Mouth Events (events/hour) Statistic Children 1 < 2 years old

Lawns/Turf
U.S. EPA Office of Pesticide Programs – Standard Operating Procedures for Assessing Residential Pesticide Exposure 3-21
Table 3-9: Frequency of Object-to-Mouth Events (events/hour) Statistic Children 1 < 2 years old
50th percentile 6.0 75th percentile 10.8 95th percentile 21.3 AM (SD) 8.8 (8.8) N 21 AM (SD) = arithmetic mean (standard deviation)
Future Research/Data Needs Unavailable information that would refine post-application object-to-mouth exposure assessments for pesticide applications to turf include:
• Application intervals (i.e., how often chemicals are applied to turf) – either chemical-specific or generic intervals by pesticide-type (e.g., fungicides, insecticides, etc.).
• Survey information (preferably longitudinal) detailing: o General pesticide use to obtain, on a per capita basis, the probability of treating
turf with pesticides; o Product-specific application rates to obtain the likelihood that the maximum rate
is used; and, o Daily activity patterns specific to object-to-mouth activities on turf (e.g., typical
surface area of object that is mouthed). • Data on the amount of residue transferred from treated turf to both hard and soft
children’s toys.
Exposure Characterization and Data Quality Turf Transferable Residue • The assumption that the entire available turf transferable residue is transferred to the
object is considered conservative. • Absent chemical-specific data, estimates of turf transferable residue factors such as the
amount available following application and dissipation are used generically based on existing data for a wide variety of chemicals. Use of the data generically, including using high-end estimates, may overestimate exposure for some chemicals.
• Assessors should recognize that factors such as rainfall/irrigation, grass growth, and grass mowing can greatly impact the dissipation rate of pesticides.
Exposure Time • The extent to which the amount of time spent conducting certain activities varies over an
extended period of time is unknown; therefore, the assumption that there is no variation when assessing longer-term exposure times is considered conservative.
Fraction of Pesticide Extracted by Saliva • There are no data with which to determine the fraction of pesticide extracted by saliva
from an object. Use of the saliva extraction data for hands is considered a reasonable surrogate.

Lawns/Turf
U.S. EPA Office of Pesticide Programs – Standard Operating Procedures for Assessing Residential Pesticide Exposure 3-22
3.2.5 Post-application Non-Dietary Ingestion Exposure Assessment: Incidental Soil Ingestion
This SOP provides a standard method for estimating dose from incidental ingestion of soil containing pesticide residues. Considering the strengths and limitations of available data and behavioral characteristics of potentially exposed lifestages (see Appendix A for more details), exposure for children 1 < 2 years old is calculated in this scenario. It assumes that pesticide residues in soil are ingested by children who play on treated areas (e.g., lawns, gardens, playgrounds) as a result of normal mouthing activities (i.e., these estimates do not represent exposure among children who exhibit pica, an abnormal ingestion behavior). Post-application Incidental Soil Ingestion Exposure Algorithm Exposure from incidental soil ingestion is calculated as follows: E = SRt * SIgR * CF1 (3.12) where:
E = exposure (mg/day); SRt = soil residue on day "t" (µg/g); SIgR = ingestion rate of soil (mg/day); and CF1 = weight unit conversion factor (1 x 10⁻⁶ g/µg).
and SRt = AR * FS * (1-FD)t
* CF2 * CF3 * CF4 (3.13) where:
SRt = soil residue on day "t" (µg/g); AR = application rate (lbs ai/ft2 or lb ai/acre); FS = fraction of ai available in uppermost cm of soil (fraction/cm); FD = fraction of residue that dissipates daily (unitless); t = post-application day on which exposure is being assessed; CF2 = weight unit conversion factor (4.54 x 10⁸ µg/lb); CF3 = area unit conversion factor (1.08 x 10⁻³ ft2/cm2 or 2.47 x 10⁻⁸ acre/cm2); and CF4 = soil volume to weight unit conversion factor (0.67 cm3/g soil).
Dose, normalized to body weight, are calculated as:
BWED = (3.14)
where: D = dose (mg/kg-day); E = exposure (mg/day); and
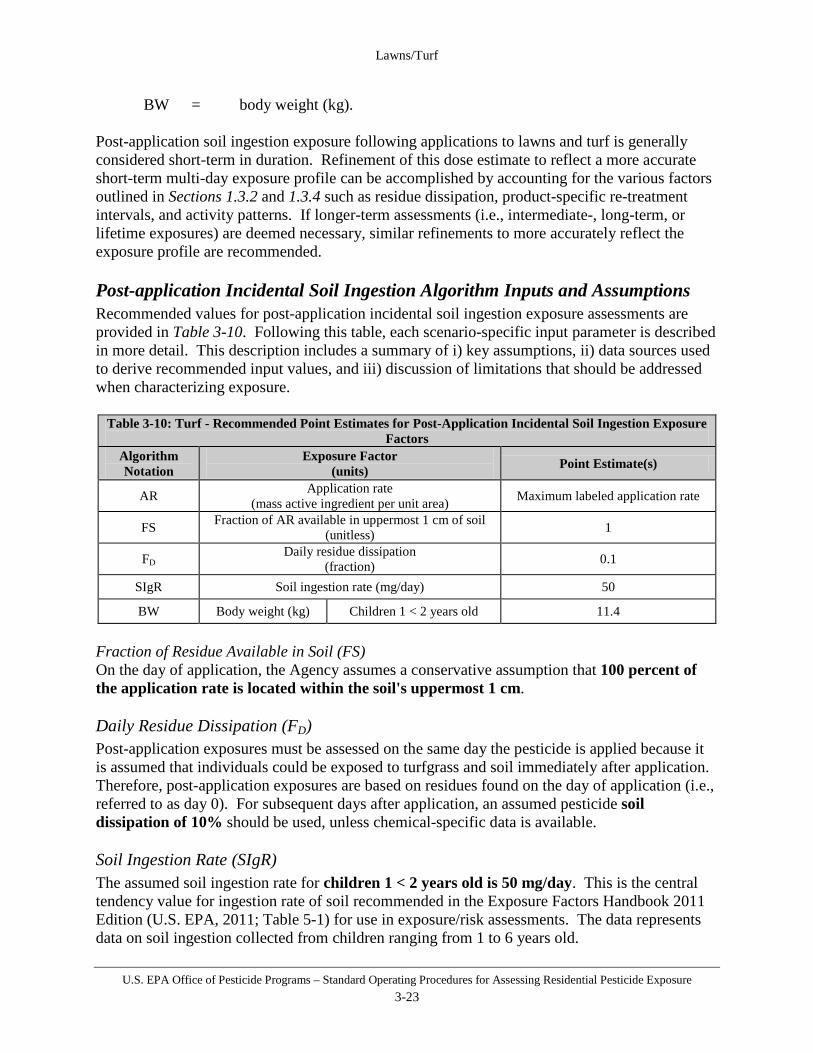
Lawns/Turf
U.S. EPA Office of Pesticide Programs – Standard Operating Procedures for Assessing Residential Pesticide Exposure 3-23
BW = body weight (kg). Post-application soil ingestion exposure following applications to lawns and turf is generally considered short-term in duration. Refinement of this dose estimate to reflect a more accurate short-term multi-day exposure profile can be accomplished by accounting for the various factors outlined in Sections 1.3.2 and 1.3.4 such as residue dissipation, product-specific re-treatment intervals, and activity patterns. If longer-term assessments (i.e., intermediate-, long-term, or lifetime exposures) are deemed necessary, similar refinements to more accurately reflect the exposure profile are recommended. Post-application Incidental Soil Ingestion Algorithm Inputs and Assumptions Recommended values for post-application incidental soil ingestion exposure assessments are provided in Table 3-10. Following this table, each scenario-specific input parameter is described in more detail. This description includes a summary of i) key assumptions, ii) data sources used to derive recommended input values, and iii) discussion of limitations that should be addressed when characterizing exposure.
Table 3-10: Turf - Recommended Point Estimates for Post-Application Incidental Soil Ingestion Exposure Factors
Algorithm Notation
Exposure Factor (units) Point Estimate(s)
AR Application rate (mass active ingredient per unit area) Maximum labeled application rate
FS Fraction of AR available in uppermost 1 cm of soil (unitless) 1
FD Daily residue dissipation (fraction) 0.1
SIgR Soil ingestion rate (mg/day) 50
BW Body weight (kg) Children 1 < 2 years old 11.4
Fraction of Residue Available in Soil (FS) On the day of application, the Agency assumes a conservative assumption that 100 percent of the application rate is located within the soil's uppermost 1 cm. Daily Residue Dissipation (FD) Post-application exposures must be assessed on the same day the pesticide is applied because it is assumed that individuals could be exposed to turfgrass and soil immediately after application. Therefore, post-application exposures are based on residues found on the day of application (i.e., referred to as day 0). For subsequent days after application, an assumed pesticide soil dissipation of 10% should be used, unless chemical-specific data is available. Soil Ingestion Rate (SIgR) The assumed soil ingestion rate for children 1 < 2 years old is 50 mg/day. This is the central tendency value for ingestion rate of soil recommended in the Exposure Factors Handbook 2011 Edition (U.S. EPA, 2011; Table 5-1) for use in exposure/risk assessments. The data represents data on soil ingestion collected from children ranging from 1 to 6 years old.

Lawns/Turf
U.S. EPA Office of Pesticide Programs – Standard Operating Procedures for Assessing Residential Pesticide Exposure 3-24
Future Research/Data Needs Unavailable information that would refine post-application exposure assessments for pesticide applications to turf include:
• Application intervals (i.e., how often chemicals are applied to turf) – either chemical-specific or generic intervals by pesticide-type (e.g., fungicides, insecticides, etc.).
• Data could be produced to examine the potential for a range of pesticides to stay in the uppermost 1 cm of soil over a period of time.
Exposure Characterization and Data Quality Soil Residue • The uncertainties associated with this assessment stem from the use of an assumed
amount of pesticide available in the uppermost 1 cm of soil, and assumptions regarding dissipation of chemical residues in the soil and soil ingestion. However, the defaults used produce health protective exposure estimates.
3.2.6 Post-application Non-Dietary Ingestion Exposure Assessment: Episodic Granular Ingestion
This SOP provides a standard method for estimating post-application doses from incidental ingestion of pesticide pellets and granules that have been applied to lawns and gardens when adequate site-or chemical-specific field data are unavailable. Considering the strengths and limitations of available data and behavioral characteristics of potentially exposed lifestages (see Appendix A for more details), exposure for children 1 < 2 years old is calculated in this scenario. This scenario assumes that dry pesticide materials are ingested by children who play in treated areas (e.g., lawns, playgrounds). Post-application Episodic Granular Ingestion Exposure Algorithm Exposure from incidental ingestion of pesticide pellets or granules is calculated as follows: E = GIgR* FD * CF1 (3.15)
where: E = exposure (mg/day); GIgR = ingestion rate of dry pesticide formulation (g/day); FD = fraction of ai in dry formulation (unitless); and CF1 = weight unit conversion factor (1,000 mg/g). Dose, normalized to body weight, are calculated as:
BWED = (3.16)

Lawns/Turf
U.S. EPA Office of Pesticide Programs – Standard Operating Procedures for Assessing Residential Pesticide Exposure 3-25
where: D = dose (mg/kg-day); E = exposure (mg/day); and
BW = body weight (kg). Post-application granular pesticide exposure following applications to lawns and turf would not occur as a result of routine behavior and is considered an episodic event related to poisoning. Thus, longer-term assessments are not conducted. Post-application Episodic Granular Ingestion Algorithm Inputs and Assumptions Recommended values for post-application episodic granular ingestion exposure assessments are provided in Table 3-11. Following this table, each scenario-specific input parameter is described in more detail. This description includes a summary of i) key assumptions; ii) data sources used to derive recommended input values; and iii) discussion of limitations that should be addressed when characterizing exposure.
Table 3-11: Turf - Recommended Point Estimates for Post-Application Episodic Granular Ingestion Exposure Factors
Algorithm Notation
Exposure Factor (units) Point Estimate(s)
FD Fraction of active ingredient in dry formulation Product specific
AR Application rate (lbs/A or lbs/1,000 ft2) Product specific
GIgR Granule ingestion rate per day (g/day) 1 0.3
BW Body Weight (kg) Children 1 < 2 years old 11.4 1 See discussion below on how this value may be adjusted if product specific information is available.
Fraction of Active Ingredient in the Dry Formulation (FD) The fraction of active ingredient in the dry formulation should be determined by consulting the product label(s). In all cases, the formulation with the highest amount of active ingredient should be used to assess episodic granular ingestion. Granular Product Application Rate (AR) The amount of granule product applied per area of lawn should be indicated by the product label. The combination of this factor with the fraction of active ingredient in the product yields the application rate in terms of active ingredient per area. Granular Ingestion Rate (GIgR) The assumed ingestion rate for dry pesticide formulations (e.g., pellets and granules) is 0.3 gram/day for children 1 < 2 years old. It is assumed that if 150 pounds of product were to be applied to a ½ acre lawn, the amount of product per square foot would be approximately 3 g/ft2 and a child would consume one-tenth of the product available in a square foot.

Lawns/Turf
U.S. EPA Office of Pesticide Programs – Standard Operating Procedures for Assessing Residential Pesticide Exposure 3-26
If product-specific information is available, the granular ingestion rate may be adjusted to reflect the amount of product applied on a per area basis if it is less or more than 150 pounds to a ½ acre lawn. For instance, if 50 pounds of product is meant to treat a ½ acre lawn, then the ingestion rate should be reduced by a third to 0.1 grams/day.
Future Research/Data Needs There are currently no data needs for the episodic granular ingestion scenario.
Exposure Characterization and Data Quality Exposure assessments addressing non-dietary ingestion of granules should indicate this is considered to be an episodic event, and should be addressed as a single scenario (i.e., the exposure should not be combined with any other sources of exposure to the pesticide). Granule size, granular color, particle density, and instructions such as “soil incorporate” should also be considered. An alternative assessment methodology for episodic granular ingestion can be done which examines the amount of granular product that a child could eat before any adverse effects occur. This alternative methodology can be used as characterization in support of the episodic granular ingestion assessment methodology discussed above.
3.2.7 Post-application Dermal Exposure Assessment: Mowing This SOP provides a method for estimating potential dermal doses from contact with turf that has previously been treated with pesticides. Considering the strengths and limitations of available data and behavioral characteristics of potentially exposed lifestages (see Appendix A for more details), exposure for adults and children 11 < 16 years old is calculated in this scenario. This scenario assumes that pesticide residues are transferred to the skin of adults and children 11 < 16 years old that enter treated lawns for mowing. It is assumed that individuals can be mowing previously treated turf on the same day a pesticide is applied even though this may be an unlikely scenario. However, the assessment can be refined to more accurately reflect exposure over a longer period of time (e.g., a week or month) if usage and activity information is available to allow for such calculations. Post-application Dermal Exposure Algorithm – Mowing Exposure resulting from contacting previously treated turf while mowing is calculated as follows: E = TTRt * CF1 * TC * ET (3.17) where:
E = exposure (mg/day); TTRt = turf transferable residue on day "t" (µg/cm2); CF1 = weight unit conversion factor (0.001 mg/µg); TC = transfer coefficient (cm2/hr); and
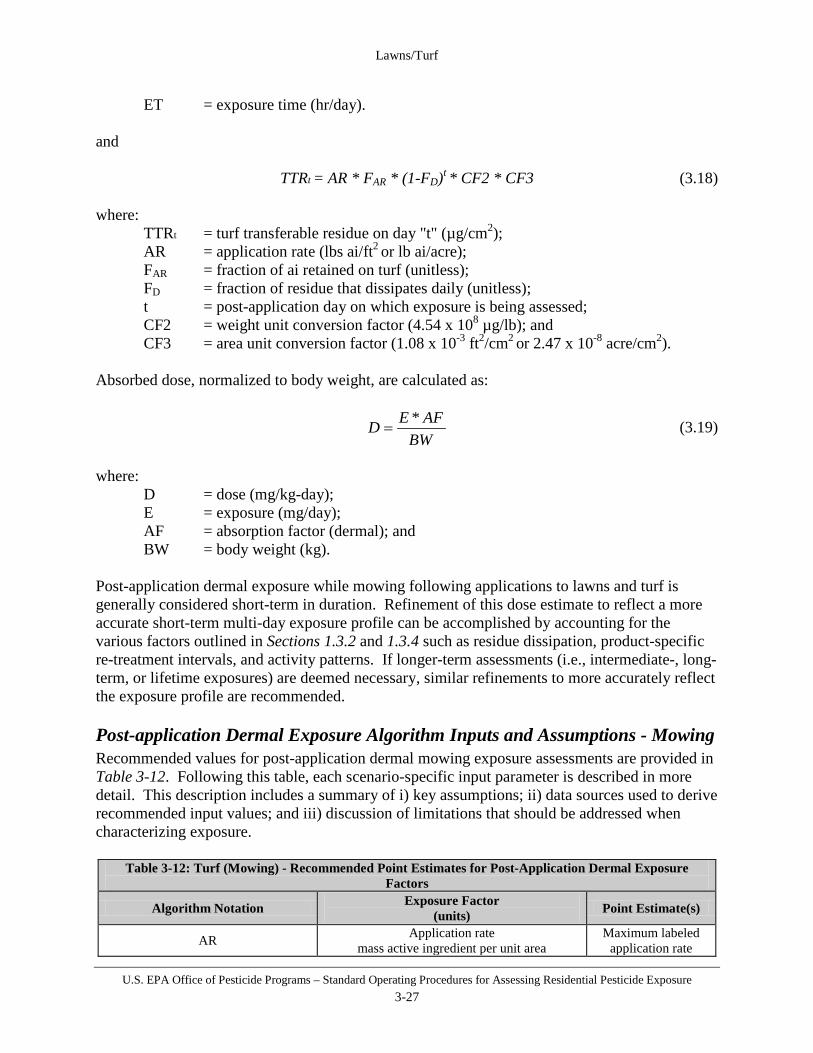
Lawns/Turf
U.S. EPA Office of Pesticide Programs – Standard Operating Procedures for Assessing Residential Pesticide Exposure 3-27
ET = exposure time (hr/day). and TTRt = AR * FAR * (1-FD)t
* CF2 * CF3 (3.18) where:
TTRt = turf transferable residue on day "t" (µg/cm2); AR = application rate (lbs ai/ft2
or lb ai/acre); FAR = fraction of ai retained on turf (unitless); FD = fraction of residue that dissipates daily (unitless); t = post-application day on which exposure is being assessed; CF2 = weight unit conversion factor (4.54 x 10⁸ µg/lb); and CF3 = area unit conversion factor (1.08 x 10⁻³ ft2/cm2
or 2.47 x 10⁻⁸ acre/cm2). Absorbed dose, normalized to body weight, are calculated as:
BW
AFED *= (3.19)
where:
D = dose (mg/kg-day); E = exposure (mg/day); AF = absorption factor (dermal); and BW = body weight (kg).
Post-application dermal exposure while mowing following applications to lawns and turf is generally considered short-term in duration. Refinement of this dose estimate to reflect a more accurate short-term multi-day exposure profile can be accomplished by accounting for the various factors outlined in Sections 1.3.2 and 1.3.4 such as residue dissipation, product-specific re-treatment intervals, and activity patterns. If longer-term assessments (i.e., intermediate-, long-term, or lifetime exposures) are deemed necessary, similar refinements to more accurately reflect the exposure profile are recommended. Post-application Dermal Exposure Algorithm Inputs and Assumptions - Mowing Recommended values for post-application dermal mowing exposure assessments are provided in Table 3-12. Following this table, each scenario-specific input parameter is described in more detail. This description includes a summary of i) key assumptions; ii) data sources used to derive recommended input values; and iii) discussion of limitations that should be addressed when characterizing exposure.
Table 3-12: Turf (Mowing) - Recommended Point Estimates for Post-Application Dermal Exposure Factors
Algorithm Notation Exposure Factor (units) Point Estimate(s)
AR Application rate mass active ingredient per unit area
Maximum labeled application rate
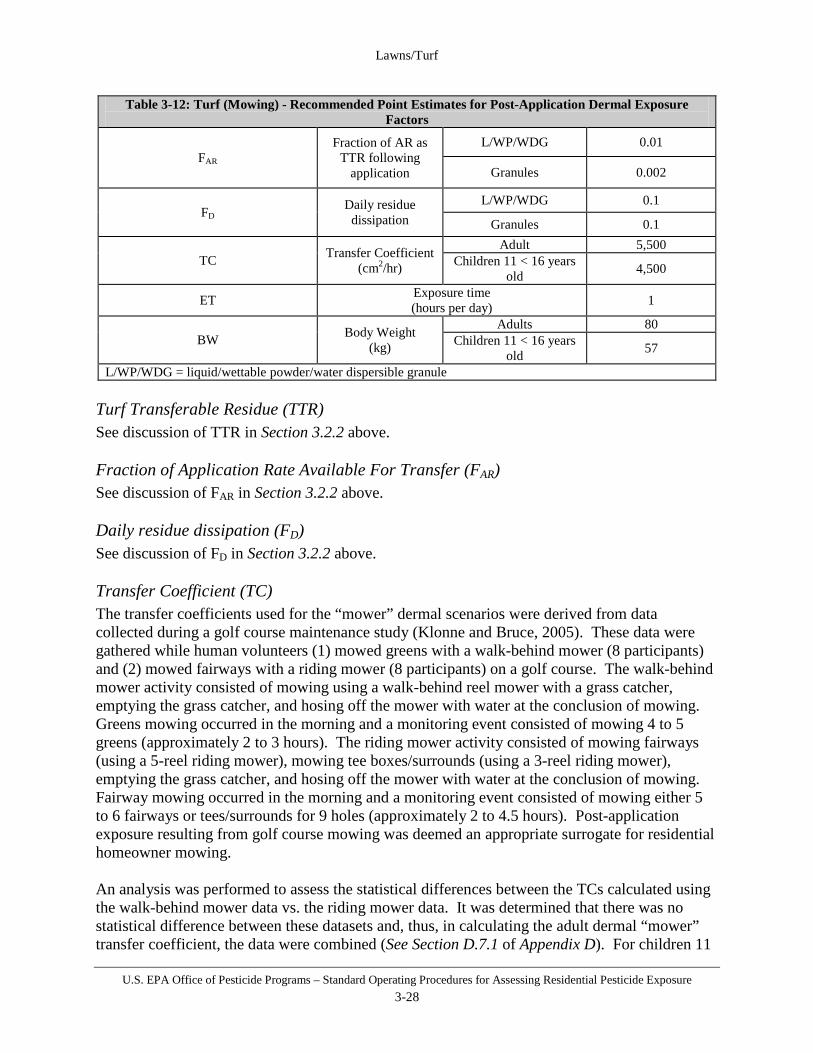
Lawns/Turf
U.S. EPA Office of Pesticide Programs – Standard Operating Procedures for Assessing Residential Pesticide Exposure 3-28
Table 3-12: Turf (Mowing) - Recommended Point Estimates for Post-Application Dermal Exposure Factors
FAR Fraction of AR as
TTR following application
L/WP/WDG 0.01
Granules 0.002
FD Daily residue dissipation
L/WP/WDG 0.1
Granules 0.1
TC Transfer Coefficient (cm2/hr)
Adult 5,500 Children 11 < 16 years
old 4,500
ET Exposure time (hours per day) 1
BW Body Weight (kg)
Adults 80 Children 11 < 16 years
old 57
L/WP/WDG = liquid/wettable powder/water dispersible granule Turf Transferable Residue (TTR) See discussion of TTR in Section 3.2.2 above. Fraction of Application Rate Available For Transfer (FAR) See discussion of FAR in Section 3.2.2 above. Daily residue dissipation (FD) See discussion of FD in Section 3.2.2 above. Transfer Coefficient (TC) The transfer coefficients used for the “mower” dermal scenarios were derived from data collected during a golf course maintenance study (Klonne and Bruce, 2005). These data were gathered while human volunteers (1) mowed greens with a walk-behind mower (8 participants) and (2) mowed fairways with a riding mower (8 participants) on a golf course. The walk-behind mower activity consisted of mowing using a walk-behind reel mower with a grass catcher, emptying the grass catcher, and hosing off the mower with water at the conclusion of mowing. Greens mowing occurred in the morning and a monitoring event consisted of mowing 4 to 5 greens (approximately 2 to 3 hours). The riding mower activity consisted of mowing fairways (using a 5-reel riding mower), mowing tee boxes/surrounds (using a 3-reel riding mower), emptying the grass catcher, and hosing off the mower with water at the conclusion of mowing. Fairway mowing occurred in the morning and a monitoring event consisted of mowing either 5 to 6 fairways or tees/surrounds for 9 holes (approximately 2 to 4.5 hours). Post-application exposure resulting from golf course mowing was deemed an appropriate surrogate for residential homeowner mowing. An analysis was performed to assess the statistical differences between the TCs calculated using the walk-behind mower data vs. the riding mower data. It was determined that there was no statistical difference between these datasets and, thus, in calculating the adult dermal “mower” transfer coefficient, the data were combined (See Section D.7.1 of Appendix D). For children 11
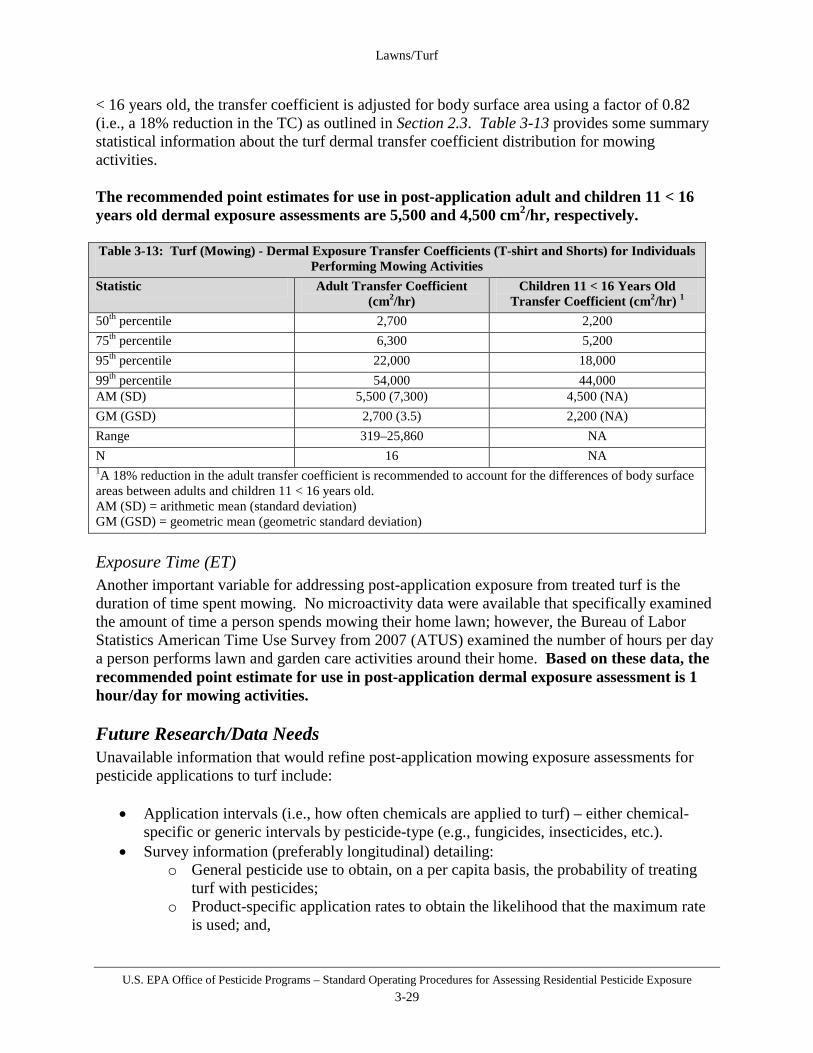
Lawns/Turf
U.S. EPA Office of Pesticide Programs – Standard Operating Procedures for Assessing Residential Pesticide Exposure 3-29
< 16 years old, the transfer coefficient is adjusted for body surface area using a factor of 0.82 (i.e., a 18% reduction in the TC) as outlined in Section 2.3. Table 3-13 provides some summary statistical information about the turf dermal transfer coefficient distribution for mowing activities. The recommended point estimates for use in post-application adult and children 11 < 16 years old dermal exposure assessments are 5,500 and 4,500 cm2/hr, respectively. Table 3-13: Turf (Mowing) - Dermal Exposure Transfer Coefficients (T-shirt and Shorts) for Individuals
Performing Mowing Activities Statistic Adult Transfer Coefficient
(cm2/hr) Children 11 < 16 Years Old
Transfer Coefficient (cm2/hr) 1 50th percentile 2,700 2,200 75th percentile 6,300 5,200 95th percentile 22,000 18,000 99th percentile 54,000 44,000 AM (SD) 5,500 (7,300) 4,500 (NA) GM (GSD) 2,700 (3.5) 2,200 (NA) Range 319–25,860 NA N 16 NA 1A 18% reduction in the adult transfer coefficient is recommended to account for the differences of body surface areas between adults and children 11 < 16 years old. AM (SD) = arithmetic mean (standard deviation) GM (GSD) = geometric mean (geometric standard deviation)
Exposure Time (ET) Another important variable for addressing post-application exposure from treated turf is the duration of time spent mowing. No microactivity data were available that specifically examined the amount of time a person spends mowing their home lawn; however, the Bureau of Labor Statistics American Time Use Survey from 2007 (ATUS) examined the number of hours per day a person performs lawn and garden care activities around their home. Based on these data, the recommended point estimate for use in post-application dermal exposure assessment is 1 hour/day for mowing activities. Future Research/Data Needs Unavailable information that would refine post-application mowing exposure assessments for pesticide applications to turf include:
• Application intervals (i.e., how often chemicals are applied to turf) – either chemical-specific or generic intervals by pesticide-type (e.g., fungicides, insecticides, etc.).
• Survey information (preferably longitudinal) detailing: o General pesticide use to obtain, on a per capita basis, the probability of treating
turf with pesticides; o Product-specific application rates to obtain the likelihood that the maximum rate
is used; and,

Lawns/Turf
U.S. EPA Office of Pesticide Programs – Standard Operating Procedures for Assessing Residential Pesticide Exposure 3-30
o Daily activity patterns specific to the typical amount of time a person spends mowing their home lawn.
Exposure Characterization and Data Quality
Transfer Coefficient • The use of the mowing component from a golf course maintenance study as a surrogate
for residential homeowner mowing is reasonably representative of the exposures related to residential mowing activities. HED believes that residential mower’s highest exposures are most likely to occur when clippings are removed by hand from collection bags for disposal and this activity was represented in the mowing activity of the golf course maintenance study.
Turf Transferable Residue • The Modified California Roller Method was used in the selected turf dermal transfer
coefficient study to collect TTR. This TTR collection method was agreed upon by the ORETF, CDPR, PMRA, and the Agency. For all assessments, transfer coefficients from this study should only be used with TTR studies that utilize the Modified California Roller Method. If chemical-specific TTR data collected via the Modified California Roller Method are not available, then default TTR data (i.e., based on the application rate) should be used.
• Absent chemical-specific data, estimates of turf transferable residue factors such as the amount available following application and dissipation are used generically based on existing data for a wide variety of chemicals. Use of this data generically, including using high-end estimates, may overestimate exposure for other chemicals.
• Assessors should recognize that mowing grass after an application may be limited by label directions indicating not to mow until a certain period of time has passed after application or else the product may not work.
• Assessors should recognize that real world factors such as rainfall/irrigation and grass growth can greatly impact the dissipation rate of pesticides on turf.
Exposure Time • The extent to which the amount of time spent conducting certain activities varies over an
extended period of time is unknown; therefore, the assumption that there is no variation when assessing longer-term exposure times is considered conservative.
3.2.8 Post-application Dermal Exposure Assessment: Golfing This SOP provides a standard method for estimating potential dermal doses to golfers from dermal contact with turf that has previously been treated with pesticides. Considering the strengths and limitations of available data and behavioral characteristics of potentially exposed lifestages (See Appendix A for more details); exposure for adults, children 11 < 16 years old, and children 6 < 11 years old is calculated in this scenario. This scenario assumes that pesticide residues are transferred to the skin of adults and teens that play golf on treated turf.

Lawns/Turf
U.S. EPA Office of Pesticide Programs – Standard Operating Procedures for Assessing Residential Pesticide Exposure 3-31
It is assumed that individuals can be golfing on previously treated turf on the same day a pesticide is applied. However, the assessment can be refined to more accurately reflect exposure over a longer period of time (e.g., a week or month) if toxicological or activity information is available to allow for such calculations. Post-application Dermal Exposure Algorithm – Golfing Exposure resulting from contacting previously treated turf while golfing is calculated as follows: E = TTRt * CF1 * TC * ET (3.20) where:
E = exposure (mg/day); TTRt = turf transferable residue on day "t" (µg/cm2); CF1 = weight unit conversion factor (0.001 mg/µg); TC = transfer coefficient (cm2/hr); and ET = exposure time (hr/day).
and TTRt = AR * F * (1-FD)t * CF2 * CF3 (3.21) where:
TTRt = turf transferable residue on day "t" (µg/cm2); AR = application rate (lbs ai/ft2
or lb ai/acre); F = fraction of ai retained on turf (unitless);’ FD = fraction of residue that dissipates daily (unitless); t = post-application day on which exposure is being assessed; CF2 = weight unit conversion factor (4.54 x 10⁸ µg/lb); and CF3 = area unit conversion factor (1.08 x 10⁻³ ft2/cm2
or 2.47 x 10⁻⁸ acre/cm2). Absorbed dose, normalized to body weight, is calculated as:
BW
AFED *= (3.22)
where:
D = dose (mg/kg-day); E = exposure (mg/day); AF = absorption factor (dermal); and BW = body weight (kg).
Post-application dermal exposure while golfing following applications to golf course turf is generally considered short-term in duration. Refinement of this dose estimate to reflect a more accurate short-term multi-day exposure profile can be accomplished by accounting for the various factors outlined in Sections 1.3.2 and 1.3.4 such as residue dissipation, product-specific re-treatment intervals, and activity patterns. If longer-term assessments (i.e., intermediate-, long-

Lawns/Turf
U.S. EPA Office of Pesticide Programs – Standard Operating Procedures for Assessing Residential Pesticide Exposure 3-32
term, or lifetime exposures) are deemed necessary, similar refinements to more accurately reflect the exposure profile are recommended. Post-application Dermal Exposure Algorithm Inputs and Assumptions - Golfing Recommended values for post-application dermal golfing exposure assessments are provided in Table 3-14. Following this table, each scenario-specific input parameter is described in more detail. This description includes a summary of i) key assumptions; ii) data sources used to derive recommended input values; and iii) discussion of limitations that should be addressed when characterizing exposure.
Table 3-14: Turf (Golfing) - Recommended Point Estimates for Post-Application Dermal Exposure Factors
Algorithm Notation
Exposure Factor (units)
Point Estimate(s)
AR Application rate (mass active ingredient per unit area)
Maximum labeled rate
F Fraction of AR as TTR following application
L/WP/WDG 0.01 Granules 0.002
FD Daily residue dissipation L/WP/WDG 0.1 Granules 0.1
TC Transfer Coefficient (cm2/hr)
Adult 5,300 Children 11 < 16 years old 4,400 Children 6 < 11 years old 2,900
ET Exposure time (hours per day)
Pesticides used on greens, tees, and fairways
4
Pesticides used only on greens and tees
1
BW Body Weight (kg)
Adults 80 Children 11 < 16 years old 57 Children 6 < 11 years old 32
NA = not applicable L/WP/WDG = liquid/wettable powder/water dispersible granule Turf Transferable Residue (TTR) See discussion of TTR in Section 3.2.2 above. Fraction of Application Rate Available For Transfer (F) See discussion of F in Section 3.2.2 above. Daily residue dissipation (FD) See discussion of FD in Section 3.2.2 above.
Transfer Coefficient (TC) The transfer coefficients used for the “golfer” dermal scenarios were derived using the best available data. In this case, data collected during a golf course maintenance study (Klonne and Bruce, 2005) was considered to provide the best representation of the exposures that might be experienced by golfers. Data were gathered while human volunteers moved cups on golf greens (6 participants). The cup changing activity consisted of making a new hole with a hand operated

Lawns/Turf
U.S. EPA Office of Pesticide Programs – Standard Operating Procedures for Assessing Residential Pesticide Exposure 3-33
cup cutter, putting the plastic cup liner from the old hole into the new hole, filling the old hole with sand and the plug from the new hole. Some cup changers also repaired ball marks on the greens with a hand tool similar to those used by golfers. Cup changing occurred first thing in the morning and a monitoring event consisted of changing 18 cups. Most workers performed the cup changing while bending over and not contacting the turf with anything, but their shoes and hands; however, one worker routinely kneeled on one knee and two other workers kneeled for a few holes. HED has fit a distribution from the 6 cup changing exposures to calculate a surrogate transfer coefficient for golfers (See Section D.7.1 of Appendix D). For children 11 < 16 years old, the transfer coefficient is adjusted for body surface area using a factor of 0.82 (i.e., a 18% reduction in the TC) as outlined in Section 2.3. For children 6 < 11 years old, the transfer coefficient is adjusted for body surface area using a factor of 0.55 (i.e., a 45% reduction in the TC) as outlined in Section 2.3. Table 3-15 provides some summary statistical information about the turf dermal transfer coefficient distribution for golfing activities. The recommended point estimates for use in post-application adult, children 11<16 years old, and children 6<11 years old dermal exposure assessment are 5,300; 4,400; and 2,900 cm2/hr, respectively.
Table 3-15: Turf (Golfing) - Dermal Exposure Transfer Coefficients (T-shirt and Shorts) for Individuals Golfing
Statistic Adult Transfer Coefficient (cm2/hr)
Children 11 < 16 Years Old Transfer Coefficient
(cm2/hr) 1
Children 6 < 11 Years Old Transfer Coefficient
(cm2/hr) 2 50th percentile 2,800 2,300 1,500 75th percentile 6,400 5,300 3,500 95th percentile 21,000 17,000 12,000 99th percentile 49,000 40,000 27,000
AM (SD) 5,300 (7,000) 4,400 (NA) 2,900 (NA) GM (GSD) 2,800 (3.3) 2,300 (NA) 1,500 (NA)
Range 988–18,863 NA NA
N 6 NA NA 1 A 18% reduction in the adult transfer coefficient is recommended to account for the differences of body surface areas between adults and children 11 < 16 years old. 2 A 45% reduction in the adult transfer coefficient is recommended to account for the differences of body surface areas between adults and children 6 < 11 years old. AM (SD) = arithmetic mean (standard deviation) GM (GSD) = geometric mean (geometric standard deviation)
Exposure Time (ET) Another important variable for addressing post-application exposure from treated turf while golfing is the duration of time spent golfing. The duration is assumed to be 4 hours for a chemical that can be used on all parts of a golf course (greens, tees, and fairways). This estimate is the average time it takes to play a round of golf and is based on a report completed by the Center for Golf Course Management (1992).

Lawns/Turf
U.S. EPA Office of Pesticide Programs – Standard Operating Procedures for Assessing Residential Pesticide Exposure 3-34
It should also be noted that some chemicals are limited to use on greens and tees or are primarily used on just greens and tees for cultural reasons. When chemicals meet these criteria, the exposure time is 1 hour because contact time is proportionately lower with the treated area. If a chemical has a label restriction for greens and tees, then a single exposure calculation should be completed for the 1 hour duration. Future Research/Data Needs Unavailable information that would refine post-application golfing exposure assessments for pesticide applications to turf include:
• Application intervals (i.e., how often chemicals are applied to turf) – either chemical-specific or generic intervals by pesticide-type (e.g., fungicides, insecticides, etc.).
• Survey information (preferably longitudinal) detailing: o General pesticide use to obtain, on a per capita basis, the probability of treating
golf course turf with pesticides; o Product-specific application rates to obtain the likelihood that the maximum rate
is used; and, o Daily activity patterns specific to the typical amount of time a person spends
golfing. Exposure Characterization and Data Quality Risk assessments for children (< 5 years old) golfing are complex due to the extrapolation of adult dermal exposure data and because of the increased likelihood of other behaviors that might contribute to exposure, such as mouthing contaminated hands or golf balls. Therefore, the risk associated with children in a golfing scenario is addressed qualitatively below:
• Five-year-old children are assumed to be the representative lifestage for children in a golfing scenario. The surface area to body weight ratio (SA/BW) for male children 5 years of age (the difference is larger for males compared to females making the value more protective) was calculated by using the 95th percentile for body surface area and the 50th percentile for body weight. The ratio was intentionally skewed to account for the uncertainties that would be expected with calculating dose levels for children if more definitive data were available, and for potential additional exposure that may occur from mouthing behaviors. This skewed SA/BW ratio for children was compared to that of the average adult, and found to be approximately 70 percent greater. Based on this parameter alone, a child’s exposure could be almost twice that of the adult golfer; however, it should be noted that a child is not expected to use the golf course for the same length of time as an adult. While an adult is likely to play a full round of golf (i.e., 18 holes), which takes approximately 4 hours, a child would probably only spend about 2 hours (i.e., the 75th percentile for time spent playing on grass by children aged 1-4 years and 5-11 years) on the course. Thus, the child’s shorter duration on the golf course offsets the higher SA/BW ratio, and therefore, the child golfer’s exposure is likely to be similar to that of the adult golfer.

Lawns/Turf
U.S. EPA Office of Pesticide Programs – Standard Operating Procedures for Assessing Residential Pesticide Exposure 3-35
Transfer Coefficient • The use of the cup changing component from a golf course maintenance study is an
acceptable surrogate for golfer exposure because it is assumed that a golfer’s highest exposures are most likely to occur when contacting residues from turf on and around the greens and residues remaining on the golf ball. The actions associated with cup changing in the golf course maintenance study are similar to typical golfer actions and, as a result, the actions should result in similar exposures.
Turf Transferable Residue • The Modified California Roller Method was used in the selected turf dermal transfer
coefficient study to collect TTR. This TTR collection method was agreed upon by the ORETF, CDPR, PMRA, and the Agency. For all assessments, transfer coefficients from this study should only be used with TTR studies that utilize the Modified California Roller Method. If chemical-specific TTR data collected via the Modified California Roller Method are not available, then default TTR data (i.e., based on the application rate) should be used.
• Absent chemical-specific data, estimates of turf transferable residue factors such as the amount available following application and dissipation are used generically based on existing data for a wide variety of chemicals. Use of the data generically, including using high-end estimates, may result in overestimates for some chemicals.
• Assessors should recognize that real world factors such as rainfall/irrigation, grass growth, and grass mowing can greatly impact the dissipation rate of pesticides on turf. Irrigation and mowing are of particular importance to the golfer scenario in that both of these activities occur on almost a daily basis at most golf courses. Based on these factors, the golfer exposure scenario should be considered conservative in nature when compared to possible real world exposures.
Exposure Time • The extent to which the amount of time spent conducting certain activities varies over an
extended period of time is unknown; therefore, the assumption that there is no variation when assessing longer-term exposure times is considered conservative.
3.2.9 Combining Post-application Scenarios Risk estimates resulting from different exposure scenarios are combined when it is likely that they can occur simultaneously based on the use pattern and when the toxicological effects across different routes of exposure are the same (see Section 1.3.5). When combining scenarios, it is important to fully characterize the potential for co-occurrence as well as characterizing the risk inputs and estimates. Risk estimates should be combined even if any one scenario or route of exposure exceeds the level of concern because this allows for better risk characterization for risk managers. The following issues should be considered when combining scenarios for the residential turf SOP: There are a number of non-dietary ingestion exposure scenarios that could potentially be
combined with the dermal exposure scenario. These non-dietary ingestion scenarios should be considered inter-related and it is likely that they occur interspersed amongst

Lawns/Turf
U.S. EPA Office of Pesticide Programs – Standard Operating Procedures for Assessing Residential Pesticide Exposure 3-36
each other across time. For example, a child may place his hand in his mouth X number of times as well as place an object in his mouth Y number of times during a certain period of time. Each of these events could result in a potential transfer of residue, but could also result in a soil ingestion event as soil may be present on the hand or object during mouthing. The potential combinations of co-occurrence of the hand-to-mouth/object-to-mouth/soil ingestion scenarios across a particular period of time are limitless. Combining all three of these scenarios with the dermal exposure scenario would be overly-conservative because of the conservative nature of each individual assessment. Based on this discussion, the post-application exposure scenarios that should be combined for short-term exposure durations are the dermal and hand-to-mouth scenarios. This combination should be considered a protective estimate of children’s exposure to pesticides used on turf.

Gardens and Trees
U.S. EPA Office of Pesticide Programs – Standard Operating Procedures for Assessing Residential Pesticide Exposure 4-1
Section 4 Gardens and Trees
The procedures outlined in this section should be used to assess dermal and inhalation exposure during (i.e., handler) and following pesticide applications (i.e., post-application) to gardens and trees at home by professional pesticide applicators or homeowners themselves. Other potential sources of exposure addressed by this section where professional applications could potentially lead to exposure by the general population, if applicable to the pesticide and its label under consideration, include “pick-your-own” farms and treated plants purchased at retail locations. For the purposes of this section, a “pick-your-own” farm is a commercial farming operation that allows public access for harvesting fruits, vegetables, or ornamental plants in large-scale fields that can be treated with commercially labeled pesticides. Additionally, as dietary exposure is a separate component of the overall human health exposure/risk assessment, this section does not include dietary exposure resulting from fruits or vegetables treated with pesticides at home. The following are example use sites from pesticide product labeling that would necessitate an assessment for this scenario:
• Gardens:
o Flowers (e.g., chrysanthemums); o Fruits (e.g., strawberries); and o Vegetables (e.g., tomatoes, squash, etc.).
• Trees:
o Fruits (e.g., apples, citrus); o Nuts (e.g., pecans); o Shrubs (e.g., boxwood); and o Ornamentals (e.g., maples).
The exposure assessor should assume use is permitted for use in home gardens and trees or by homeowners unless a specific statement on the label indicates the product is only used in non-residential settings. Examples of such statements include:
o Commercial or research greenhouse use only; o For nursery-grown ornamentals only; and o For use in commercial plantings only.
Additionally, “Restricted Use Pesticide” classification indicates that the product cannot be bought or applied by homeowners (i.e., no residential handler exposure/risk assessment required), but it may be applied by commercial applicators to residential sites; therefore, a post-application risk assessment may be required. Once scenarios are identified, the assessment should then characterize and estimate the potential for exposure by route (i.e., dermal, inhalation) using the methodologies outlined in this section.
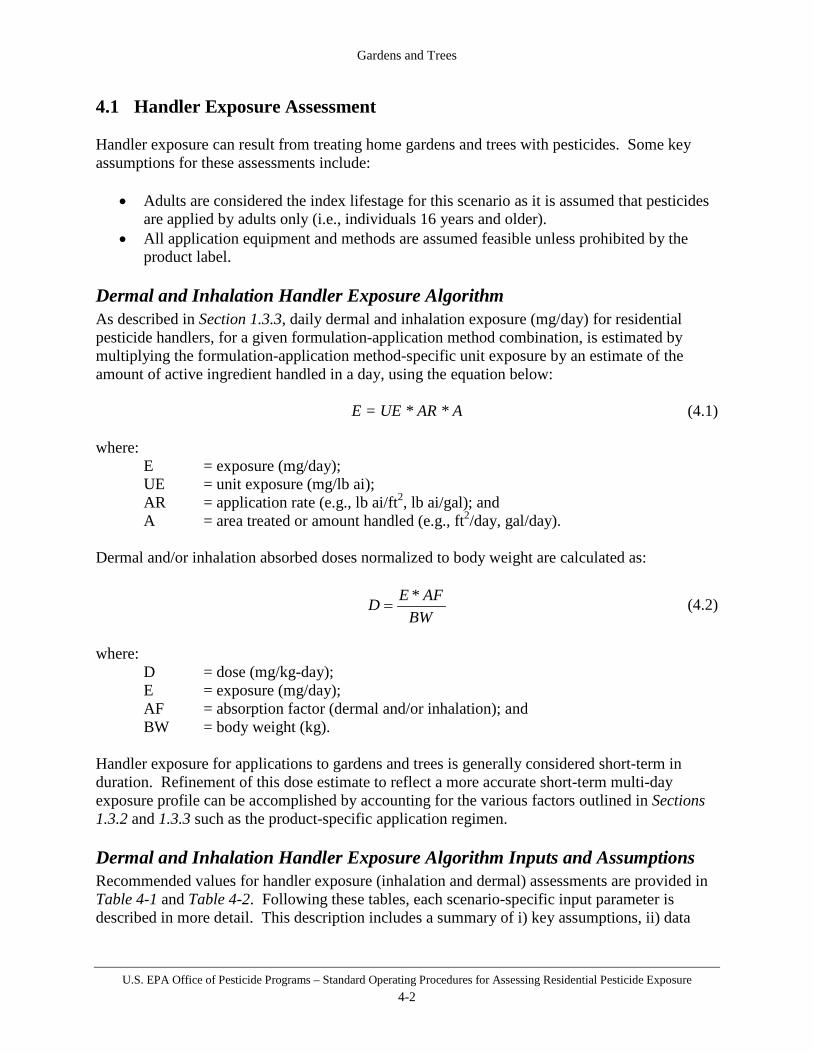
Gardens and Trees
U.S. EPA Office of Pesticide Programs – Standard Operating Procedures for Assessing Residential Pesticide Exposure 4-2
4.1 Handler Exposure Assessment Handler exposure can result from treating home gardens and trees with pesticides. Some key assumptions for these assessments include:
• Adults are considered the index lifestage for this scenario as it is assumed that pesticides are applied by adults only (i.e., individuals 16 years and older).
• All application equipment and methods are assumed feasible unless prohibited by the product label.
Dermal and Inhalation Handler Exposure Algorithm As described in Section 1.3.3, daily dermal and inhalation exposure (mg/day) for residential pesticide handlers, for a given formulation-application method combination, is estimated by multiplying the formulation-application method-specific unit exposure by an estimate of the amount of active ingredient handled in a day, using the equation below: E = UE * AR * A (4.1) where:
E = exposure (mg/day); UE = unit exposure (mg/lb ai); AR = application rate (e.g., lb ai/ft2, lb ai/gal); and A = area treated or amount handled (e.g., ft2/day, gal/day).
Dermal and/or inhalation absorbed doses normalized to body weight are calculated as:
BW
AFED *= (4.2)
where:
D = dose (mg/kg-day); E = exposure (mg/day); AF = absorption factor (dermal and/or inhalation); and BW = body weight (kg).
Handler exposure for applications to gardens and trees is generally considered short-term in duration. Refinement of this dose estimate to reflect a more accurate short-term multi-day exposure profile can be accomplished by accounting for the various factors outlined in Sections 1.3.2 and 1.3.3 such as the product-specific application regimen. Dermal and Inhalation Handler Exposure Algorithm Inputs and Assumptions Recommended values for handler exposure (inhalation and dermal) assessments are provided in Table 4-1 and Table 4-2. Following these tables, each scenario-specific input parameter is described in more detail. This description includes a summary of i) key assumptions, ii) data

Gardens and Trees
U.S. EPA Office of Pesticide Programs – Standard Operating Procedures for Assessing Residential Pesticide Exposure 4-3
sources used to derive recommended input values, and iii) discussion of limitations that should be addressed when characterizing exposure.
Table 4-1: Gardens and Trees – Recommended Unit Exposure (mg/lb ai) Point Estimates
Formulation Equipment/Application Method
Dermal Inhalation Appendix Page
Reference Point Estimate Point Estimate
Granules
Push-type spreaders 0.81 0.0026 C-4 Belly grinders 360 0.039 C-11
Spoon 6.2 0.087 C-20 Cup 0.11 0.013 C-24
Hand dispersal 160 0.38 C-28
Shaker can No exposure data available for this application scenario.
Exposure data for granule applications using a cup recommended as surrogate data.
Dusts/Powders
Plunger duster 250 1.7 C-32
Bulb duster No exposure data available for this application scenario.
Exposure data for plunger duster applications recommended as surrogate data.
Electric/power duster No exposure data available for this application scenario.
Exposure data for shaker can applications of dusts/powders recommended as surrogate data.
Hand crank duster No exposure data available for this application scenario.
Exposure data for shaker can applications of dusts/powders recommended as surrogate data.
Shaker can 4300 18 C-36
Liquid concentrates
Manually-pressurized handwand 63 0.018 C-56
Hose-end sprayer 58 0.0014 C-79 Backpack 130 0.14 C-91
Sprinkler can No exposure data available for this application scenario. Exposure data for hose-end sprayer applications of liquid
concentrates recommended as surrogate data.
Ready-to-Use (RTU) Hose-end sprayer 6.26 0.034 C-107 Trigger-sprayers 85.1 0.061 C-113
Aerosol can 370 3.0 C-134
Wettable Powder
Manually-pressurized handwand 69 1.1 C-141
Hose-end sprayer No exposure data available for this application scenario. Exposure data for hose-end sprayer applications of liquid
concentrates recommended as surrogate data.
Backpack
No exposure data available for this application scenario. Exposure data for manually-pressurized handwand
applications of wettable powders recommended as surrogate data.
Sprinkler can No exposure data available for this application scenario. Exposure data for hose-end sprayer applications of liquid
concentrates recommended as surrogate data.
Wettable Powder in Water-soluble
Packaging
Manually-pressurized handwand
No exposure data available for this scenario. Exposure data for manually-pressurized handwand applications of liquid
concentrates recommended as surrogate data.
Hose-end sprayer No exposure data available for this scenario. Exposure data for RTU hose-end sprayers recommended as surrogate data.
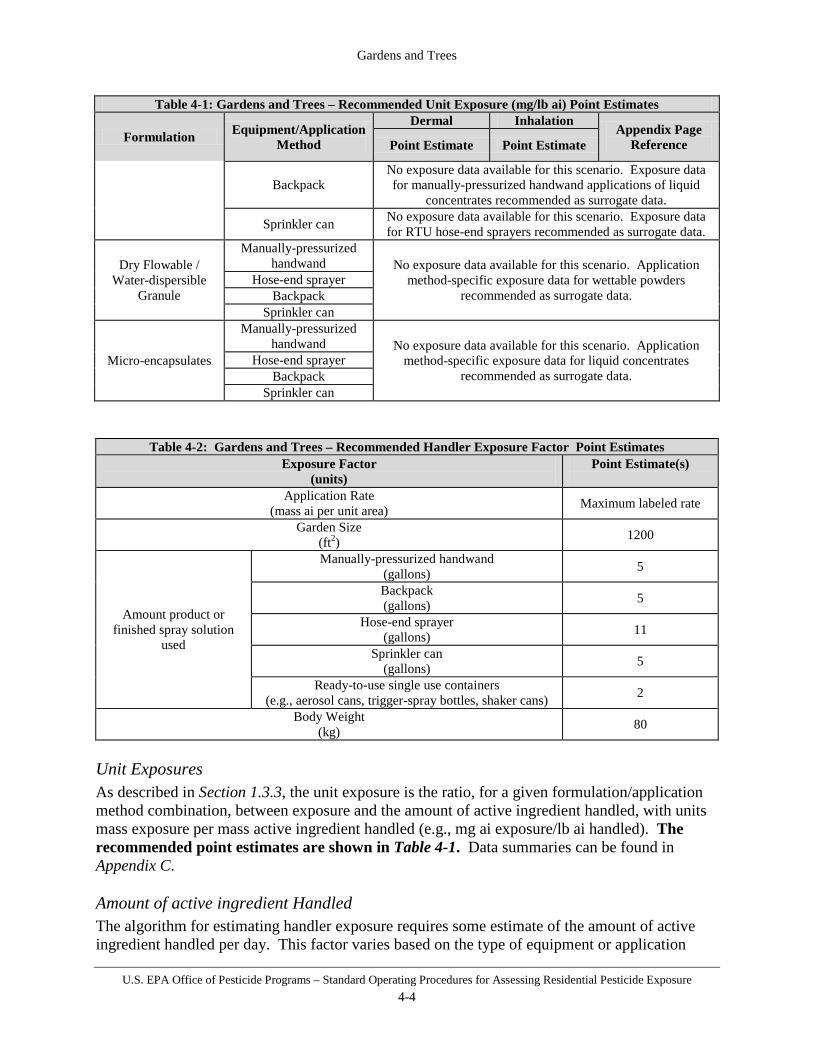
Gardens and Trees
U.S. EPA Office of Pesticide Programs – Standard Operating Procedures for Assessing Residential Pesticide Exposure 4-4
Table 4-1: Gardens and Trees – Recommended Unit Exposure (mg/lb ai) Point Estimates
Formulation Equipment/Application Method
Dermal Inhalation Appendix Page
Reference Point Estimate Point Estimate
Backpack No exposure data available for this scenario. Exposure data for manually-pressurized handwand applications of liquid
concentrates recommended as surrogate data.
Sprinkler can No exposure data available for this scenario. Exposure data for RTU hose-end sprayers recommended as surrogate data.
Dry Flowable / Water-dispersible
Granule
Manually-pressurized handwand No exposure data available for this scenario. Application
method-specific exposure data for wettable powders recommended as surrogate data.
Hose-end sprayer Backpack
Sprinkler can
Micro-encapsulates
Manually-pressurized handwand No exposure data available for this scenario. Application
method-specific exposure data for liquid concentrates recommended as surrogate data.
Hose-end sprayer Backpack
Sprinkler can
Table 4-2: Gardens and Trees – Recommended Handler Exposure Factor Point Estimates Exposure Factor
(units) Point Estimate(s)
Application Rate
(mass ai per unit area) Maximum labeled rate
Garden Size (ft2) 1200
Amount product or finished spray solution
used
Manually-pressurized handwand (gallons) 5
Backpack (gallons) 5
Hose-end sprayer (gallons) 11
Sprinkler can (gallons) 5
Ready-to-use single use containers (e.g., aerosol cans, trigger-spray bottles, shaker cans) 2
Body Weight (kg) 80
Unit Exposures As described in Section 1.3.3, the unit exposure is the ratio, for a given formulation/application method combination, between exposure and the amount of active ingredient handled, with units mass exposure per mass active ingredient handled (e.g., mg ai exposure/lb ai handled). The recommended point estimates are shown in Table 4-1. Data summaries can be found in Appendix C. Amount of active ingredient Handled The algorithm for estimating handler exposure requires some estimate of the amount of active ingredient handled per day. This factor varies based on the type of equipment or application

Gardens and Trees
U.S. EPA Office of Pesticide Programs – Standard Operating Procedures for Assessing Residential Pesticide Exposure 4-5
method used and is estimated based on the application rate specified on the product label. First, the assessor should assemble application rate information in terms of active ingredient per area treated (e.g., lb ai/1000 ft2) and/or active ingredient concentration established per volume of spray (e.g., lb ai/gallon solution). For example, instructions for a granule formulation might direct application of 2 lbs of product per 100 square feet or a spray application might say to apply 2 gallons of solution per 100 square feet. Additionally, the assessment must reflect exposure resulting from use of the product and chemical at the maximum allowable application rate found on the product label. The probability of using a product at its maximum allowable rate at home is unknown, so additional information (e.g., use surveys or pest-specific application rates), can be used, if available, to characterize the exposure resulting from use at the maximum allowable rate. Once the application rate is determined, an amount of area treated or amount of volume sprayed is used to convert the application rate into the amount of active ingredient handled (which is then used with the unit exposure to estimate handler exposure). For this scenario, the amount of area treated is estimated using information about garden size from a survey (Johnson et al., 1999). Note that these results represent garden sizes, not garden areas treated. Table 4-3 below presents a statistical summary assuming a lognormal distribution for garden size to be used when application rates are in terms of area. The recommended point estimate for garden size is 1200 ft2. Additional information and analysis is presented in Section A.1 of Appendix C.
Table 4-3: Statistical Summary – Garden Size (ft2) 50th percentile 80 75th percentile 390 95th percentile 3700 99th percentile 18000 AM (SD) 1200 (18000) GM (GSD) 80 (10) Range unknown N 364 AM (SD) = arithmetic mean (standard deviation) GM (GSD) = geometric mean (geometric standard deviation)
If a case is being considered in which the application rate is based on spray concentration, an estimate for the amount of finished spray solution volume is necessary. Such a rate would be used for spraying trees, for example, where an “area-based” approach would not be appropriate or useful because label instructions provide target spray concentrations. However, this factor is likely application method-specific (i.e., one might apply more solution using a hose-end sprayer than a sprinkler can) and explicit information on volumes sprayed in home applications is unavailable. For hose-end sprayers, application volume was derived from a study measuring exposure during applications of liquid formulations to fruit trees and ornamental shrubs using a hose-end sprayer (Merricks, 1998). A statistical summary assuming a normal distribution for application volume is provided in Table 4-4 below. The recommended point estimate for amount sprayed for hose-end sprayers is 11 gallons. Statistical analyses and data summary are provided in Section A.1 of Appendix C.

Gardens and Trees
U.S. EPA Office of Pesticide Programs – Standard Operating Procedures for Assessing Residential Pesticide Exposure 4-6
Table 4-4: Statistical Summary – Application Volume (gallons) for Hose-end Sprayers
50th percentile 11 75th percentile 14 95th percentile 19 99th percentile 22 AM (SD) 11 (5.1) GM (GSD) 10 (1.6) Range 6 – 21 N 20 AM (SD) = arithmetic mean (standard deviation) GM (GSD) = geometric mean (geometric standard deviation) For all other applications, information on the amount of product used is largely unavailable. For manually-pressurized handwands, backpacks, and sprinkler cans, a volume of 5 gallons is recommended; for aerosol cans and trigger-sprayers, 2 cans or containers per application is recommended. Should ready-to-use containers of granules or dusts/powders not specify an area-based application rate, 2 containers per application is recommended. These are conservative estimates based on professional judgment informed by existing applicator studies which discussed the extent of use (e.g., duration, volume, etc.). Future Research/Data Needs Unavailable information that would refine handler exposure assessments for pesticide applications to gardens and trees include:
• Application intervals (i.e., how often chemicals are applied to gardens and trees) – either chemical-specific or generic intervals by pesticide-type (e.g., fungicides, insecticides, etc.).
• Survey information (preferably longitudinal) detailing: o Daily/weekly/monthly probability of treating gardens and trees with pesticides; o Amount of product or formulation used or area treated per application; o Product-specific application rates to obtain the likelihood that the maximum rate
is used. • Handler exposure data:
o Specific for garden and tree applications, beyond what had been included in previous residential data call-ins (DCIs), including those formulations and/or application methods currently unavailable in Table 4-2;
o Describing the extent to which an individual’s exposure for a given formulation and application method varies from application-to-application.
Exposure Characterization and Data Quality

Gardens and Trees
U.S. EPA Office of Pesticide Programs – Standard Operating Procedures for Assessing Residential Pesticide Exposure 4-7
Unit Exposures • The exposure data underlying unit exposures are considered reasonable for the purposes
of estimating exposure. The data are from actual applications using standardized exposure sampling methodologies and laboratory analyses.
• The underlying assumption of the use of exposure data as unit exposures – proportionality between the amount of active ingredient handled and exposure – is uncertain, though potentially conservative. However, as a prediction mechanism, it is considered practical and useful for the purposes of handler exposure assessment in a regulatory context. It provides a straightforward handler exposure calculation method and enables risk mitigation in the form of formulation comparison and decreased application rates.
• The extent to which an individual’s exposure (expressed via unit exposures) varies day-to-day or application-to-application is unknown; therefore, the assumption that there is no variation when assessing longer-term exposure durations is considered conservative.
Amount of active ingredient handled • Information on the amounts of active ingredient handled for typical residential gardens
and trees application equipment is largely unavailable. The estimates used however, are believed to result in health protective exposure estimates.
• The extent to which the amount an individual will handle per application varies from day-to-day or application-to-application is unknown; therefore, the assumption that there is no variation when assessing longer-term exposure durations is considered conservative.
4.2 Post-application Exposure Assessment Post-application exposure can result from conducting activities in previously treated areas such as gardening or picking fruits following pesticide applications by professional pesticide applicators or by homeowners themselves. Adults and children 6 < 11 years old are considered the index lifestages for this exposure scenario as it is assumed that younger children (i.e., < 6 years old) won’t utilize these areas for playing nor engage in the types of activities associated with these areas (e.g., gardening or picking fruits) to the extent that older children will. Additionally, by law, “pick-your-own” farms cannot spray pesticides within the pre-harvest interval (PHI), e.g., 7 or 14 days prior to harvest. Therefore, assessments applicable for activities at “pick-your-own” farms should account for residue dissipation during the PHI (i.e., residue @ “day of application + PHI”). This section addresses standard methods for estimating exposure and dose for three scenarios resulting from contact with gardens and/or trees that have previously been treated with pesticides:
• Section 4.2.1 - adult/children 6 < 11 years old inhalation exposure resulting from activities in gardens and/or trees;
• Section 4.2.2 - adult/children 6 < 11 years old dermal exposure resulting from activities in gardens and/or trees; and

Gardens and Trees
U.S. EPA Office of Pesticide Programs – Standard Operating Procedures for Assessing Residential Pesticide Exposure 4-8
• Section 4.2.3 - children 1 < 2 years old non-dietary ingestion.
4.2.1 Post-application Inhalation Exposure Assessment Post-application inhalation exposure while performing activities in previously treated gardens or trees is rarely assessed due to the combination of low vapor pressure for typical pesticide active ingredients and the expected dilution in outdoor air. These should be handled on a case-by-case basis.
4.2.2 Post-application Dermal Exposure Assessment Post-application dermal exposure resulting from contact with previously treated gardens and trees is dependent on three exposure factors: foliar residue, leaf-to-skin residue transfer, and exposure time. Considering the strengths and limitations of available data and behavioral characteristics of potentially exposed lifestages, post-application dermal exposure is assessed for adults and children 6 < 11 years old. Post-application Dermal Exposure Algorithm The algorithm to calculate daily exposure and dose is shown below. As discussed in Section 1.3.4, residential post-application exposure assessment must include calculation of exposure on the day of application. Therefore, though an assessment can present exposures for any day “t” following the application, it must include “day 0” exposure. E = DFRt * CF1 * TC * ET (4.3) where:
E = exposure (mg/day); DFRt = dislodgeable foliar residue on day "t" (µg/cm2); CF1 = weight unit conversion factor (0.001 mg/µg); TC = transfer coefficient (cm2/hr); and ET = exposure time (hrs/day).
In the absence of chemical-specific data, DFRt can be calculated as follows: DFRt = AR * FAR * (1-FD)t * CF2 * CF3 (4.4) where:
DFRt = dislodgeable foliar residue on day "t" (µg/cm2); AR = application rate (lbs ai/ft2 or lb ai/acre); FAR = fraction of ai as dislodgeable residue following application (unitless); FD = fraction of residue that dissipates daily (unitless); t = post-application day on which exposure is being assessed; CF2 = weight unit conversion factor (4.54 x 10⁸ µg/lb); and CF3 = area unit conversion factor (1.08 x 10⁻³ ft2/cm2 or 2.47 x 10⁻⁸ acre/cm2).
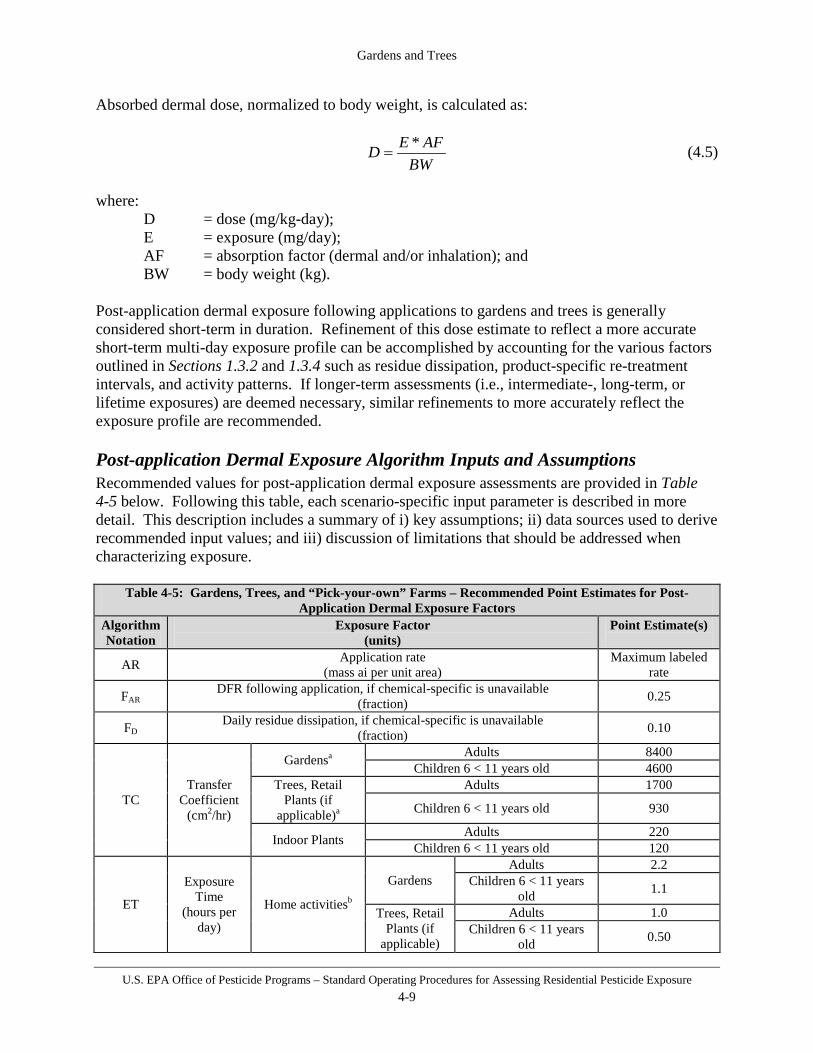
Gardens and Trees
U.S. EPA Office of Pesticide Programs – Standard Operating Procedures for Assessing Residential Pesticide Exposure 4-9
Absorbed dermal dose, normalized to body weight, is calculated as:
BW
AFED *= (4.5)
where:
D = dose (mg/kg-day); E = exposure (mg/day); AF = absorption factor (dermal and/or inhalation); and BW = body weight (kg).
Post-application dermal exposure following applications to gardens and trees is generally considered short-term in duration. Refinement of this dose estimate to reflect a more accurate short-term multi-day exposure profile can be accomplished by accounting for the various factors outlined in Sections 1.3.2 and 1.3.4 such as residue dissipation, product-specific re-treatment intervals, and activity patterns. If longer-term assessments (i.e., intermediate-, long-term, or lifetime exposures) are deemed necessary, similar refinements to more accurately reflect the exposure profile are recommended. Post-application Dermal Exposure Algorithm Inputs and Assumptions Recommended values for post-application dermal exposure assessments are provided in Table 4-5 below. Following this table, each scenario-specific input parameter is described in more detail. This description includes a summary of i) key assumptions; ii) data sources used to derive recommended input values; and iii) discussion of limitations that should be addressed when characterizing exposure.
Table 4-5: Gardens, Trees, and “Pick-your-own” Farms – Recommended Point Estimates for Post-Application Dermal Exposure Factors
Algorithm Notation
Exposure Factor (units)
Point Estimate(s)
AR Application rate (mass ai per unit area)
Maximum labeled rate
FAR DFR following application, if chemical-specific is unavailable (fraction) 0.25
FD Daily residue dissipation, if chemical-specific is unavailable (fraction) 0.10
TC Transfer
Coefficient (cm2/hr)
Gardensa Adults 8400 Children 6 < 11 years old 4600
Trees, Retail Plants (if
applicable)a
Adults 1700
Children 6 < 11 years old 930
Indoor Plants Adults 220 Children 6 < 11 years old 120
ET
Exposure Time
(hours per day)
Home activitiesb
Gardens Adults 2.2
Children 6 < 11 years old 1.1
Trees, Retail Plants (if
applicable)
Adults 1.0 Children 6 < 11 years
old 0.50

Gardens and Trees
U.S. EPA Office of Pesticide Programs – Standard Operating Procedures for Assessing Residential Pesticide Exposure 4-10
Table 4-5: Gardens, Trees, and “Pick-your-own” Farms – Recommended Point Estimates for Post-Application Dermal Exposure Factors
Algorithm Notation
Exposure Factor (units)
Point Estimate(s)
Indoor Plants Adults 1.0
Children 6 < 11 years old 0.50
“Pick-your-own” Farms (if
applicable)
Adults 5.0
Children 6 < 11 years old 1.9
BW Body weight (kg)
Adults 80
Children 6 < 11 years old 32 a Transfer coefficient point estimates from a composite distribution assuming equal proportion of time spent conducting various activities. See “Transfer Coefficient” section below. Children 6 < 11 years old TC derived using surface area adjustment (see Section 2.3). b Activity time point estimates from a composite distribution assuming equal proportion of each respective activity. Time for children 6 < 11 years old derived using hrs/day ratio adjustment. See “Exposure Time” section below and Section D.8.1 of Appendix D,
Application Rate The assessment must reflect exposure resulting from use of the product and chemical at the maximum allowable application rate found on the product label. The probability of using a product at its maximum allowable rate at home or at “pick-your-own” farms is unknown, so additional information (e.g., use surveys), can be used, if available, to characterize the exposure resulting from use at the maximum allowable rate. When chemical-specific residue information is unavailable, the assessment methodologies outlined in this section require the application rate to be in terms of mass active ingredient per area (e.g., lb ai/ft2). Typically, this is listed on the label however, it sometimes must be estimated based on the solution concentration (e.g., lb ai/gallon dilute solution) and the volume of solution applied (e.g., 0.5 gallons solution/ft2). This “area-based” approach is intuitive for garden applications where a user can approximate their garden’s size and spray accordingly. This is more difficult, however, for applications to trees since a user would not typically spray trees on a square footage basis. More likely, the product label directs the user to “spray to run off” or “as needed”. In these cases, a label indicating the chemical’s application rate for orchards or other trees used by professional applicators should be used – typically listed as an “area-based” rate in pounds of active ingredient per acre (lb ai/acre). In the event there is no professional label, the “area-based” application rate from sprays to gardens should be used. The assumption of similar foliar concentration for gardens and trees is reasonable absent chemical- and site-specific residue data.

Gardens and Trees
U.S. EPA Office of Pesticide Programs – Standard Operating Procedures for Assessing Residential Pesticide Exposure 4-11
Dislodgeable Foliar Residue
Estimates of Chemical Residue following Pesticide Applications Following an application, some pesticide residue remains on the leaves of the target plant for an individual to contact and remove from the leaf surface. This is represented by a measurement from a standardized analytical method (Iwata, et al., 1977) and is referred to as dislodgeable foliar residue (DFR). If DFR measurements are unavailable, it can be estimated from the application rate using default fractions. Either way, the goal is to establish an average concentration of pesticide residue per unit area of foliage (e.g., µg/cm2) that an individual can potentially contact over the course of the exposure period. Exposure can then be predicted using a surface-to-skin residue “transfer coefficient” (discussed below) – a metric which accounts for contact with treated surfaces based on the type of crop and activity being performed (e.g., harvesting apples). As stated previously, it is assumed that contact with previously treated residential gardens or trees occur on the same day of application. Therefore, whether measured or estimated, the exposure assessment needs to include an estimated exposure based on the DFR on the day of application (i.e., DFRt=0). For “pick-your-own” farms, however, individuals cannot conduct activities until the PHI has expired; therefore, residue should be representative of residue that has dissipated for a number of days (e.g., at 7 days or DFRt=7). When chemical- and crop-specific data are available, DFR on the day of application and subsequent days can be estimated using a standard exponential decay model. Notably, the Agency recently revised the data requirements that pertain to conventional pesticides. As part of these revisions, DFR studies were classified as required for all occupational and residential uses under 40 CFR 158, subpart K (158.1070; post-application exposure data requirements table). In the absence of data, however, DFR can be estimated using generic assumptions for both the initial residue available (i.e., DFRt=0) and residue dissipation. Analysis of DFR data from field studies for various types of crops and various active ingredients indicate that the amount of dislodgeable residue, on the day of application, expressed as a fraction of the application rate, ranges from 0.02 to 0.89 (i.e., 2% to 89%). The data were fit to a lognormal distribution with a geometric mean of 0.18 and a geometric standard deviation of 2.21. Because dislodgeable residue cannot physically be greater than that deposited, the distribution must be truncated at 1.0 (i.e., 100% of the application rate). Note that this distribution is only meant as a basis for selecting a generic value for the DFR on the day of application as a fraction of the application rate and is inappropriate to use probabilistically. Because the data are comprised of a variety of chemicals on a variety of crops under a variety of conditions, this distribution represents the variability of many different situations. Within each particular DFR study, because the nature of the sampling results in an average DFR estimate, the distribution of the DFR on the day of application as a fraction of the application rate is much less variable – indicating that, for a given chemical the range may be only 2 – 5% or 30 – 35%, not 2 – 89%. Furthermore, because the chemical-specific variability of this fraction is small, a distribution for use probabilistically is unnecessary (i.e., it will not have much effect on the outcome) and a point estimate is appropriate for use in both deterministic and probabilistic assessments. When chemical-specific data are unavailable the recommended default value for the fraction of application rate as
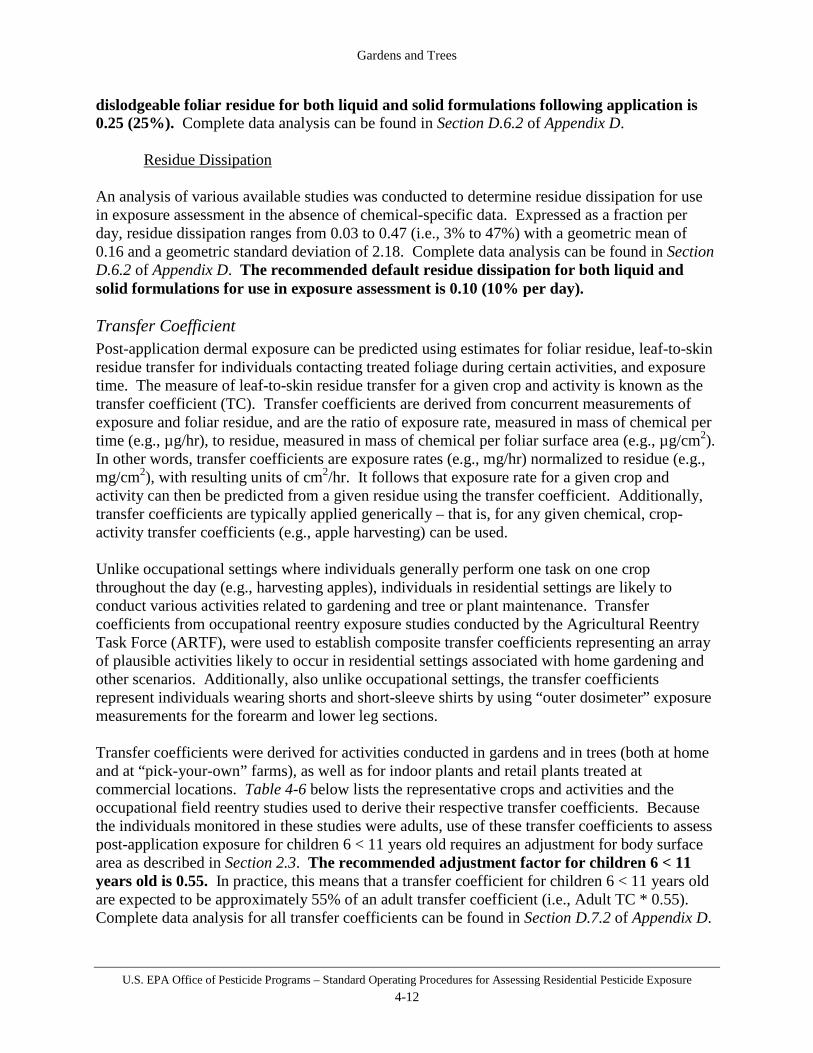
Gardens and Trees
U.S. EPA Office of Pesticide Programs – Standard Operating Procedures for Assessing Residential Pesticide Exposure 4-12
dislodgeable foliar residue for both liquid and solid formulations following application is 0.25 (25%). Complete data analysis can be found in Section D.6.2 of Appendix D.
Residue Dissipation An analysis of various available studies was conducted to determine residue dissipation for use in exposure assessment in the absence of chemical-specific data. Expressed as a fraction per day, residue dissipation ranges from 0.03 to 0.47 (i.e., 3% to 47%) with a geometric mean of 0.16 and a geometric standard deviation of 2.18. Complete data analysis can be found in Section D.6.2 of Appendix D. The recommended default residue dissipation for both liquid and solid formulations for use in exposure assessment is 0.10 (10% per day). Transfer Coefficient Post-application dermal exposure can be predicted using estimates for foliar residue, leaf-to-skin residue transfer for individuals contacting treated foliage during certain activities, and exposure time. The measure of leaf-to-skin residue transfer for a given crop and activity is known as the transfer coefficient (TC). Transfer coefficients are derived from concurrent measurements of exposure and foliar residue, and are the ratio of exposure rate, measured in mass of chemical per time (e.g., µg/hr), to residue, measured in mass of chemical per foliar surface area (e.g., µg/cm2). In other words, transfer coefficients are exposure rates (e.g., mg/hr) normalized to residue (e.g., mg/cm2), with resulting units of cm2/hr. It follows that exposure rate for a given crop and activity can then be predicted from a given residue using the transfer coefficient. Additionally, transfer coefficients are typically applied generically – that is, for any given chemical, crop-activity transfer coefficients (e.g., apple harvesting) can be used. Unlike occupational settings where individuals generally perform one task on one crop throughout the day (e.g., harvesting apples), individuals in residential settings are likely to conduct various activities related to gardening and tree or plant maintenance. Transfer coefficients from occupational reentry exposure studies conducted by the Agricultural Reentry Task Force (ARTF), were used to establish composite transfer coefficients representing an array of plausible activities likely to occur in residential settings associated with home gardening and other scenarios. Additionally, also unlike occupational settings, the transfer coefficients represent individuals wearing shorts and short-sleeve shirts by using “outer dosimeter” exposure measurements for the forearm and lower leg sections. Transfer coefficients were derived for activities conducted in gardens and in trees (both at home and at “pick-your-own” farms), as well as for indoor plants and retail plants treated at commercial locations. Table 4-6 below lists the representative crops and activities and the occupational field reentry studies used to derive their respective transfer coefficients. Because the individuals monitored in these studies were adults, use of these transfer coefficients to assess post-application exposure for children 6 < 11 years old requires an adjustment for body surface area as described in Section 2.3. The recommended adjustment factor for children 6 < 11 years old is 0.55. In practice, this means that a transfer coefficient for children 6 < 11 years old are expected to be approximately 55% of an adult transfer coefficient (i.e., Adult TC * 0.55). Complete data analysis for all transfer coefficients can be found in Section D.7.2 of Appendix D.
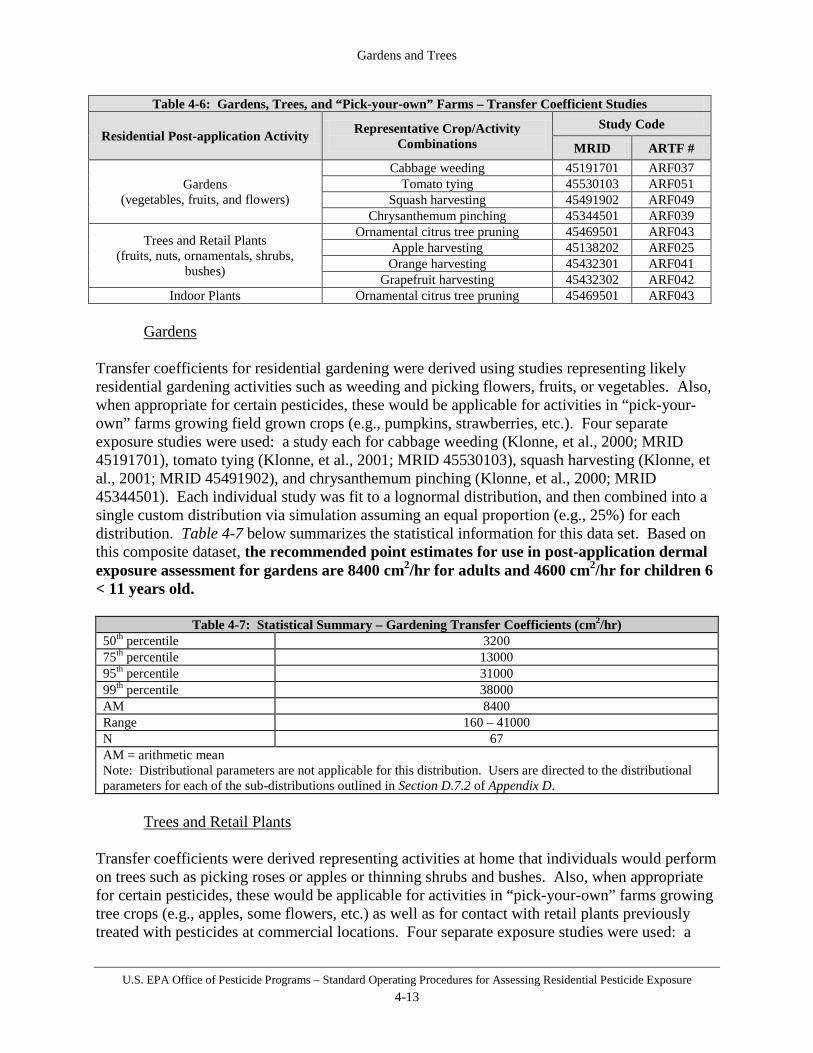
Gardens and Trees
U.S. EPA Office of Pesticide Programs – Standard Operating Procedures for Assessing Residential Pesticide Exposure 4-13
Table 4-6: Gardens, Trees, and “Pick-your-own” Farms – Transfer Coefficient Studies
Residential Post-application Activity Representative Crop/Activity Combinations
Study Code
MRID ARTF #
Gardens (vegetables, fruits, and flowers)
Cabbage weeding 45191701 ARF037 Tomato tying 45530103 ARF051
Squash harvesting 45491902 ARF049 Chrysanthemum pinching 45344501 ARF039
Trees and Retail Plants (fruits, nuts, ornamentals, shrubs,
bushes)
Ornamental citrus tree pruning 45469501 ARF043 Apple harvesting 45138202 ARF025 Orange harvesting 45432301 ARF041
Grapefruit harvesting 45432302 ARF042 Indoor Plants Ornamental citrus tree pruning 45469501 ARF043
Gardens
Transfer coefficients for residential gardening were derived using studies representing likely residential gardening activities such as weeding and picking flowers, fruits, or vegetables. Also, when appropriate for certain pesticides, these would be applicable for activities in “pick-your-own” farms growing field grown crops (e.g., pumpkins, strawberries, etc.). Four separate exposure studies were used: a study each for cabbage weeding (Klonne, et al., 2000; MRID 45191701), tomato tying (Klonne, et al., 2001; MRID 45530103), squash harvesting (Klonne, et al., 2001; MRID 45491902), and chrysanthemum pinching (Klonne, et al., 2000; MRID 45344501). Each individual study was fit to a lognormal distribution, and then combined into a single custom distribution via simulation assuming an equal proportion (e.g., 25%) for each distribution. Table 4-7 below summarizes the statistical information for this data set. Based on this composite dataset, the recommended point estimates for use in post-application dermal exposure assessment for gardens are 8400 cm2/hr for adults and 4600 cm2/hr for children 6 < 11 years old.
Table 4-7: Statistical Summary – Gardening Transfer Coefficients (cm2/hr) 50th percentile 3200 75th percentile 13000 95th percentile 31000 99th percentile 38000 AM 8400 Range 160 – 41000 N 67 AM = arithmetic mean Note: Distributional parameters are not applicable for this distribution. Users are directed to the distributional parameters for each of the sub-distributions outlined in Section D.7.2 of Appendix D.
Trees and Retail Plants
Transfer coefficients were derived representing activities at home that individuals would perform on trees such as picking roses or apples or thinning shrubs and bushes. Also, when appropriate for certain pesticides, these would be applicable for activities in “pick-your-own” farms growing tree crops (e.g., apples, some flowers, etc.) as well as for contact with retail plants previously treated with pesticides at commercial locations. Four separate exposure studies were used: a

Gardens and Trees
U.S. EPA Office of Pesticide Programs – Standard Operating Procedures for Assessing Residential Pesticide Exposure 4-14
study each for apple harvesting (Klonne, et al., 2000; MRID 45138202), orange harvesting (Klonne, et al., 2000; MRID 45432301), grapefruit harvesting (Klonne, et al., 2000; MRID 45432302), and ornamental citrus tree pruning (Klonne, et al., 2000; MRID 45469501). Each individual study was fit to a lognormal distribution, and then combined into a single custom distribution via simulation assuming an equal proportion (e.g., 25% each) for each distribution. Table 4-8 below summarizes the statistical information for this data set. Based on this composite dataset, the recommended point estimates for use in post-application dermal exposure assessment are 1700 cm2/hr for adults and 930 cm2/hr for children 6 < 11 years old.
Table 4-8: Statistical Summary – Tree Activity Transfer Coefficients (cm2/hr) 50th percentile 1900 75th percentile 2600 95th percentile 3300 99th percentile 3900 AM 1700 Range 90 – 3400 N 60 AM = arithmetic mean Note: Distributional parameters are not applicable for this distribution. Users are directed to the distributional parameters for each of the sub-distributions outlined in Section D.7.2 of Appendix.
Indoor Plants
Transfer coefficients were derived representing activities for indoor plants using the study measuring exposure while pruning ornamental citrus trees (Klonne, et al., 2000; MRID 45469501). Table 4-9below summarizes the statistical information for this data set. The recommended point estimates for use in post-application dermal exposure assessment are 220 cm2/hr for adults and 120 cm2/hr for children 6 < 11 years old.
Table 4-9: Statistical Summary – Indoor Plant Activities Transfer Coefficients (cm2/hr) 50th percentile 200 75th percentile 270 95th percentile 440 99th percentile 620 AM (SD) 220 (120) GM (GSD) 200 (1.6) Range 90 – 500 N 15 Statistics based on a lognormal distribution. AM (SD) = arithmetic mean (standard deviation) GM (GSD) = geometric mean (geometric standard deviation)
Exposure Time As shown in the post-application dermal exposure algorithm and stated previously, daily exposure while contacting previously treated gardens and trees in residential settings can be predicted using foliar residue, a generic crop/activity transfer coefficient, and exposure time.

Gardens and Trees
U.S. EPA Office of Pesticide Programs – Standard Operating Procedures for Assessing Residential Pesticide Exposure 4-15
Home Activities Exposure times for activities associated with gardens and trees at home were derived using a residential survey (Johnson et al., 1999) and Tsang and Klepeis, 1996 (as presented in 1997 EPA Exposure Factors Handbook; Vol. III, Table 15-62). While Tsang and Klepeis, 1996 includes information on “time spent working with soil in a garden or other circumstances working” for all lifestages including children 6 < 11 years old, the data are presented as hours/month, thus making it difficult to interpret daily exposure times necessary for exposure assessments of short duration. The residential survey (Johnson et al., 1999), on the other hand, asked about specific types of residential landscaping and maintenance activities and the amount of time an individual spends conducting such activities quantified in “hours per week” and “days per week”. However, because this survey only included individuals 18 years or older, Tsang and Klepeis, 1996 (as presented in 1997 EPA Exposure Factors Handbook; Vol. III, Table 15-62) was used to adjust these results for those under 18 years. Analysis of this survey information can be found in Section D.8.1 of Appendix D.
Gardens As for transfer coefficients for gardening, a custom distribution for home gardening was simulated using cumulative distributions derived from the Johnson, et al. (1999) survey results for vegetable gardening and flower gardening in equal proportion (i.e., 50% each). Each cumulative distribution was truncated at 16 hours per day (i.e., 16 hrs = 100th percentile) to subtract for 8 hours of sleep. Additionally, as described in Appendix D, based on Tsang and Klepeis, 1996 (as presented in 1997 EPA Exposure Factors Handbook; Vol. III, Table 15-62), activity time for children 6 < 11 years old is considered to be approximately half that for adults and are adjusted accordingly. Table 4-10 below provides a statistical summary of the composite distribution for time spent in home gardening activities. The recommended point estimates for use in post-application dermal exposure assessment are 2.2 hours per day for adults and 1.1 hours per day for children 6 < 11 years old.
Table 4-10: Home Gardening – Activity Time (hrs/day) Statistical Summary
Statistic Gardening Adults Youths
50th percentile 1.4 0.7 75th percentile 2.9 1.5 95th percentile 6.9 3.5 99th percentile 13 6.5
AM 2.2 1.1 N 883 883
Notes: AM = arithmetic mean - Distributions are truncated at 16 hours per day - Distributional parameters are not applicable (NA) for this distribution. Users are directed to the distributional parameters for each of the sub-distributions outlined in Section D.8.1of Appendix D

Gardens and Trees
U.S. EPA Office of Pesticide Programs – Standard Operating Procedures for Assessing Residential Pesticide Exposure 4-16
Trees, Retail Plants and Indoor Plants A custom distribution for activity time associated with trees at home was simulated using cumulative distributions derived from the Johnson, et al., 1999 survey results for roses, shrubs/bushes, and fruit/nut trees (i.e., 33% each). This distribution is also considered a reasonable representation for time spent during activities associated with indoor plants. Each cumulative distribution was truncated at 16 hours per day (i.e., 16 hrs = 100th percentile) to subtract for 8 hours of sleep. Table 4-11 below provides a statistical summary of the composite distribution. The recommended point estimates for use in post-application dermal exposure assessment are 1.0 hour per day for adults and 0.5 hour per day for children 6 < 11 years old. Table 4-11: Home Trees, Retail Plants, and Indoor Plants – Activity Time (hrs/day) Statistical Summary
Statistic Fruit, Nut, and Ornamental Trees and Bushes and Shrubs Adults Youths
50th percentile 0.5 0.25 75th percentile 1.4 0.7 95th percentile 3.4 1.7 99th percentile 6.3 3.2
AM 1.0 0.5 N 831 831
Notes: AM = arithmetic mean - Distributions are truncated at 16 hours per day. - Distributional parameters are not applicable (NA) for this distribution. Users are directed to the distributional parameters for each of the sub-distributions outlined in Section D.8.1 of Appendix D.
“Pick-your-own” Farm Activities Survey information specifically for the amount of time spent at “pick-your-own” farms is unavailable. Therefore, information from Tsang and Klepeis, 1996 (presented in the 1997 EPA Exposure Factors Handbook; Vol. III Table 15-112) for amount of time “spent outdoors at a farm” was used. The time for adults, aged 18-64 years, ranged from 5 minutes to 16 hours per day, while the time for children, aged 5-11, ranged from 25 minutes to 4.4 hours per day. Note that, while the upper-end of the distribution indicates the time spent for adults is near 16 hours per day, it is assumed that anything greater than 8 hours at a “pick-your-own” farm is unlikely and values higher than this are likely a characteristic of the genericness of the data set used to estimate this exposure factor (i.e., “time spent outdoors at a farm” is not necessarily representative of “time spent at a “pick-your-own” farm”). Table 4-12 below provides a statistical summary of this data. When a “pick your own” farm post-application exposure assessment is appropriate, the recommended values for exposure time are 5.0 hours per day for adults and 1.9 hours per day for children 6 < 11 years old. Additional information can be found in Section D.8 of Appendix D.
Table 4-12: Time Spent at “Pick-your-own” Farms (hrs/day) Statistical Summary Lifestage Age
(from data) Statistics
N Mean Summary Percentiles 5 25 50 75 90 95 98 99
Adults 18-64 91 5.0 0.3 1.3 3.8 8.3 10.6 13.0 15.6 15.9

Gardens and Trees
U.S. EPA Office of Pesticide Programs – Standard Operating Procedures for Assessing Residential Pesticide Exposure 4-17
Children 6<11
5-11 7 1.9 0.4 0.8 1.7 2.2 4.4 4.4 4.4 4.4
Source: Tsang and Klepeis, 1996 (presented in 1997 EPA Exposure Factors Handbook Vol. III; Table 15-112). Future Research/Data Needs Unavailable information that would refine post-application dermal exposure assessments for pesticide applications to gardens and trees include:
• Application intervals (i.e., how often chemicals are applied to gardens and trees) – either chemical-specific or generic intervals by pesticide-type (e.g., fungicides, insecticides, etc.).
• Survey information (preferably longitudinal) detailing: o Daily/weekly/monthly probability of treating gardens and trees with pesticides; o Product-specific application rates to obtain the likelihood that the maximum rate
is used; and, o Daily activity patterns specific to gardens and trees.
• Post-application exposure data: o Specific for residential garden and tree activities; o Describing the extent to which an individual’s exposure for a given activity
varies. Exposure Characterization and Data Quality Transfer Coefficient: Because exposure data for deriving “residential” transfer coefficients were unavailable, they were derived using occupational exposure studies. This is likely health-protective due to the level of activity by workers compared to an individual conducting a similar activity at home (e.g., picking apples). Additionally, the relationships underlying the use of post-application exposure data as transfer coefficients – proportionality between exposure and time and between exposure rate (i.e., mg/hr) and residue – are uncertain, though potentially conservative. Dislodgeable Foliar Residue: Absent chemical-specific data, estimates of dislodgeable foliar residue factors such as the amount available following application and dissipation are used generically based on existing data for a wide variety of chemicals. Use of these data generically, including using high-end estimates, may overestimate exposure for some chemicals. Exposure Time: Information on the amount of time spent conducting certain activities, while from a robust survey, was not available in a “per day” format. Thus, to normalize weekly data on a “per day” basis, the assumption was made (based on the responses for “days per week” for these activities) that individuals conducted activities 2 days per week. Additionally, the survey did not provide information on individuals younger than 18 years of age; therefore, an adjustment was made to the survey information based on the distributional ratio of adults to children 6 < 11 years old for “time spent working with soil in a garden or other circumstances working” from Tsang and Klepeis, 1996 (as presented in the 1997 EPA Exposure Factors Handbook; Vol. III Table 15-62).

Gardens and Trees
U.S. EPA Office of Pesticide Programs – Standard Operating Procedures for Assessing Residential Pesticide Exposure 4-18
Information on time spent at a “pick-your-own” farm is unavailable; therefore “time spent outdoors on a farm” was used as a reasonable surrogate dataset.
4.2.3 Post-application Non-Dietary Ingestion Exposure Assessment As a standard practice, post-application non-dietary ingestion exposure (i.e., hand-to-mouth, object-to-mouth, soil ingestion, etc.) for adults is not assessed – it is assumed that an adult would not place pesticide-contaminated hands, objects, or soil in their mouth. Additionally, for this scenario, post-application non-dietary ingestion exposure is also not assessed for young children. Unlike treated grass at home or in recreational areas or indoor floor surfaces, for this scenario the potential for exposure via non-dietary ingestion for young children is greatly diminished. Since the extent to which young children engage in the types of activities associated with these areas (e.g., gardening or picking fruits) or utilize these areas for prolonged periods of play is low, significant non-dietary ingestion exposure is not expected.
4.2.4 Combining Post-application Scenarios Aggregation of post-application exposure is generally not applicable to activities associated with gardens and trees, given the lack of non-dietary ingestion exposure expected for the activities and index lifestages. In the event post-application inhalation exposure is assessed, it should be combined with post-application dermal exposure for adults and children 6 < 11 years old according to Section 1.3.5.
Outdoor Fogging/Misting Systems
U.S. EPA Office of Pesticide Programs – Standard Operating Procedures for Assessing Residential Pesticide Exposure 5-1
Section 5 Outdoor Fogging/Misting Systems
This section covers the following exposure scenarios:
• Outdoor aerosol space sprays (handler/post-application); • Candles, coils, torches, mats (post-application); • Outdoor residential misting systems (handler/post-application); and • Animal barn misting systems (handler/post-application).
Each of these exposure scenarios is designated for outdoor use fogging products only. Each section offers additional description of the exposure scenario and the handler and/or post-application exposure. Indoor fogging products (i.e., “bug bombs”) are covered in Section 7. While barns and stables are “indoors” (i.e., enclosed or semi-enclosed structures), they are included in this section because of methodological similarities to the other scenarios in this section and because barns often have significantly more air exchange than standard indoor commercial or residential spaces.
5.1 Outdoor Aerosol Space Sprays (OASS) Outdoor aerosol space sprays are insecticide products available in aerosol cans formulated to kill or repel outdoor flying pests by an aerosol “fog”. This section provides a standard method for estimating handler (i.e., applicator) exposure and post-application exposure to outdoor aerosol space sprays (OASS) used to kill or repel flying insects in outdoor spaces like yards or patios. This exposure scenario can also be used to assess wasp/hornet spray products that typically have a more directed spray pattern than other types of outdoor foggers, for lack of scenario-specific data for these types of products. For handlers, inhalation and dermal exposure may occur during the application of the aerosol spray product (i.e., the spray event); thus dermal and inhalation exposure should be assessed. Post-application exposure may occur from inhalation exposure following a spray application, as well as dermal and non-dietary ingestion exposure resulting from residues deposited on the turf or lawn.
5.1.1 Handler Exposure Assessment This section provides a standard method for completing handler exposure assessments for adults treating an outdoor space with outdoor aerosol space sprays. It is assumed that only individuals 16 years of age or older handle (i.e., mix/load/apply) pesticides. The basis for this scenario is that handler exposure occurs as the aerosol spray is being applied by the applicator holding the product can and activating the spray. The method should be used for estimating potential doses that residential users may receive during aerosol applications from inhalation and dermal contact when chemical-specific data are unavailable.

Outdoor Fogging/Misting Systems
U.S. EPA Office of Pesticide Programs – Standard Operating Procedures for Assessing Residential Pesticide Exposure 5-2
This scenario assumes that pesticides may be inhaled or may come into contact with the skin during the application of aerosol spray products. The method to determine handler inhalation and dermal exposure to pesticides from aerosol applications relies on data from a study in which dermal and inhalation exposures were measured during use of an aerosol spray for indoor insecticide crack and crevice treatment, and is used in this scenario to represent an outdoor aerosol spray (See Appendix C). Thus, this method should be used in the absence of chemical-specific data, or as a supplement to estimates based on chemical-specific data. Dermal and Inhalation Handler Exposure Algorithm As described in Section 1.3.3, daily dermal and inhalation exposure (mg/day) for residential pesticide handlers is estimated by multiplying a unit exposure appropriate for the formulation and application method by an estimate of the amount of active ingredient handled in a day using the equation below: E = UE * AR (5.1) where:
E = exposure (mg/day); UE = unit exposure (mg/lb ai); and AR = application rate (lb ai/day).
The application rate can be calculated as follows: AR = A product * A.I. * CF1 * N (5.2) where:
AR = application rate (lb ai/ day); A product = amount of product in 1 can (oz or g/can); A.I. = percent active ingredient in product (% ai); CF1 = weight conversion factor (1 lb/16 oz or 1 lb/454 g); and N = number of cans used in one application (cans/day).
Alternatively, if the aerosol can contents are expressed as a volume in milliliters, the application rate for use in the exposure assessment can be calculated as follows: AR = A product * A.I. * CF1 * D product * N (5.3) where:
AR = application rate (lb ai/ day); A product = amount of product in 1 can (mL/can); A.I. = percent active ingredient in product (% ai); CF1 = weight conversion factor (1 lb/454 g); D product = density of product (g/mL); and N = number of cans used in one day (cans/day).
Absorbed dermal and/or inhalation doses normalized to body weight are calculated as:

Outdoor Fogging/Misting Systems
U.S. EPA Office of Pesticide Programs – Standard Operating Procedures for Assessing Residential Pesticide Exposure 5-3
BW
AFED *= (5.4)
where:
D = dose (mg/kg-day); E = exposure (mg/day); AF = absorption factor (dermal and/or inhalation); and BW = body weight (kg).
Handler exposure for outdoor aerosol space spray applications is generally considered short-term in duration. Refinement of this dose estimate to reflect a more accurate short-term multi-day exposure profile can be accomplished by accounting for the various factors outlined in Sections 1.3.2 and 1.3.3 such as the product-specific application regimen.
Dermal and Inhalation Handler Exposure Algorithm Inputs and Assumptions Recommended values for handler exposure (inhalation and dermal) assessments are provided in Table 5-1 and Table 5-2. Following these tables, each scenario-specific input parameter is described in more detail. This description includes a summary of: i) key assumptions; ii) data sources used to derive recommended input values; and iii) discussion of limitations that should be addressed when characterizing exposure.
Table 5-1: Outdoor Aerosol Space Sprays – Recommended Unit Exposure (mg/lb ai) Point Estimates
Formulation Equipment/ Application
Method
Dermal Inhalation Appendix Page Reference Point Estimate Point Estimate
Ready-to-Use (RTU) Aerosol can 370 3.0 C-134
Table 5-2: Outdoor Aerosol Space Sprays – Recommended Handler Exposure Factor Point Estimates
Algorithm Notation
Exposure Factor (units)
Point Estimate(s)
AR Application rate (lb ai/ day)
Product-specific
D product Density of
product (g/mL)
Water-based products 1.0 (or product-specific)
Solvent-based products 0.8 (or product-specific)
N Number of cans used per day 1 A.I. Percent ai in product Product-specific
A product Amount of product per can
(ounces, grams or milliliters) Product-specific
BW Body weight (kg) 80
Outdoor Fogging/Misting Systems
U.S. EPA Office of Pesticide Programs – Standard Operating Procedures for Assessing Residential Pesticide Exposure 5-4
Unit Exposures (UE) As described in Section 1.3.3, the unit exposure is the ratio, for a given formulation/application method combination, of exposure to amount of active ingredient handled, with units of mass exposure per mass active ingredient handled (e.g., mg ai exposure/lb ai handled). Application Rate (AR) For the purposes of OASS handler exposure assessment, the application rate is the amount of active ingredient applied per day. The application rate can be determined from product-specific factors that are listed on the label or from generic factors listed above. Number of Cans (N) Absent product- or chemical-specific data, it is assumed that 1 full can of product is applied by a residential handler at one time, and that one can of product represents a residential handler’s complete insecticidal aerosol product use per day. According to the Residential Exposure Joint Venture (REJV) survey (REJV, 2002), no household surveyed used more than one outdoor aerosol space spray product in one day. If extensive pest pressure exists, residential users would likely seek alternative application equipment. Density (D product) The density should represent the product being assessed. If product-specific densities are available, they should be used in the assessment. Otherwise, if the product is water-based, the assessor should use the density of water (1.0 g/mL). If the product is solvent-based, the assessor should use 0.8 g/mL, an average based on an informal survey of various organic solvents described in CRC (Lide, 1981). Amount of Product (A product) The amount of product (ounces, grams or milliliters per can) is a product-specific value and can be found on the product label. Future Research/Data Needs There are several main research/data needs with respect to the outdoor aerosol space spray handler scenario.
• A monitoring study is needed in which the spray application is conducted in a manner consistent with outdoor aerosol space sprays to more appropriately characterize dermal and inhalation handler exposure potential. The unit exposures for the outdoor aerosol space spray handler scenario were sourced from a study in which the spray application was completed indoors to baseboards.
• Use pattern information (i.e., amount handled, etc.) is needed to better characterize the residential handler exposure potential during application events.
• Scenario-specific unit exposure data are needed to more appropriately characterize dermal and inhalation handler exposure from wasp/hornet directed aerosol spray

Outdoor Fogging/Misting Systems
U.S. EPA Office of Pesticide Programs – Standard Operating Procedures for Assessing Residential Pesticide Exposure 5-5
applications; the wasp/hornet directed aerosol spray products typically have a modified delivery system (i.e., directed spray) than other outdoor products.
Exposure Characterization and Data Quality
Unit Exposures • Only one study is available to represent unit exposures for residential handlers of aerosol
spray products. The study is used to represent all residential handler (indoor and outdoor) aerosol exposure scenarios. The monitoring study was completed indoors where applicators directed the aerosol spray towards the baseboards of a residence. As the only data available, this study was considered a reasonable surrogate for outdoor aerosol space sprays.
Amount of active ingredient handled • Information on the amounts of active ingredient handled for typical outdoor aerosol
sprace sprays is largely unavailable. The estimates used however, are believed to result in health protective exposure estimates.
• The extent to which the amount an individual will handle per application varies from day-to-day or application-to-application is unknown; therefore, the assumption that there is no variation when assessing longer-term exposure durations is considered conservative.
5.1.2 Post-application Exposure Assessment Post-application exposure can result from activities performed in a treated patio or yard following outdoor aerosol space spray pesticide applications. While exposure may occur for people of all ages, adults and children 1 < 2 years old are considered the index lifestages based on behavioral characteristics and the strengths and limitations of available data (see Appendix A). This section addresses standard methods for estimating exposure and dose for three post-application exposure pathways resulting from use of area foggers:
• Section 5.1.2.1 - adult/children 1 < 2 years old inhalation exposure; and, • Section 5.1.2.2 - adult/children 1 < 2 years old dermal and children 1 < 2 years old non-
dietary exposure. Post-application exposure is not anticipated to occur following pesticide application of wasp/ hornet products. These products are applied directly to insect nests/hives and it is not likely that residential bystanders would be present in these areas.
5.1.2.1 Post-application Inhalation Exposure Assessment The well-mixed box (WMB) model was used to develop the exposure equation for the outdoor aerosol space spray post-application inhalation scenario (See Section D.3 of Appendix D for additional detail on the WMB). The WMB was used to model pesticide air concentrations within an enclosed, fixed volume (i.e., a box) over time after an initial outdoor aerosol space spray application. The WMB model incorporates a number of simplifying assumptions: fresh air
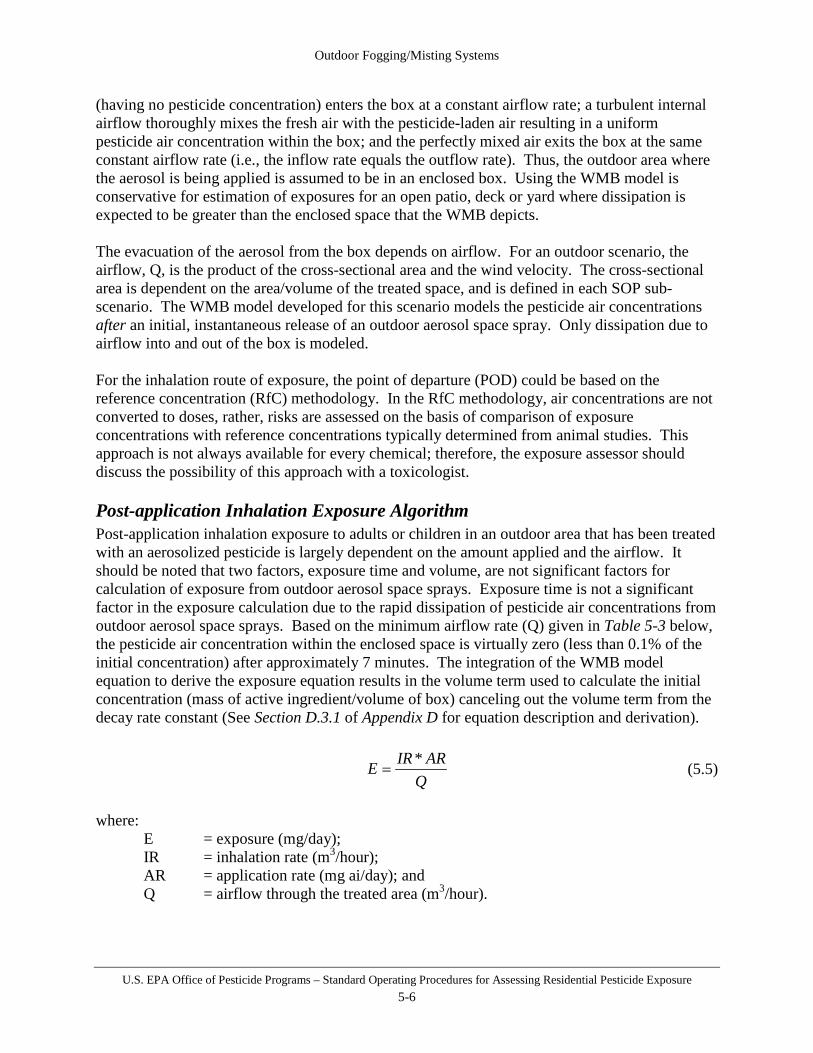
Outdoor Fogging/Misting Systems
U.S. EPA Office of Pesticide Programs – Standard Operating Procedures for Assessing Residential Pesticide Exposure 5-6
(having no pesticide concentration) enters the box at a constant airflow rate; a turbulent internal airflow thoroughly mixes the fresh air with the pesticide-laden air resulting in a uniform pesticide air concentration within the box; and the perfectly mixed air exits the box at the same constant airflow rate (i.e., the inflow rate equals the outflow rate). Thus, the outdoor area where the aerosol is being applied is assumed to be in an enclosed box. Using the WMB model is conservative for estimation of exposures for an open patio, deck or yard where dissipation is expected to be greater than the enclosed space that the WMB depicts. The evacuation of the aerosol from the box depends on airflow. For an outdoor scenario, the airflow, Q, is the product of the cross-sectional area and the wind velocity. The cross-sectional area is dependent on the area/volume of the treated space, and is defined in each SOP sub-scenario. The WMB model developed for this scenario models the pesticide air concentrations after an initial, instantaneous release of an outdoor aerosol space spray. Only dissipation due to airflow into and out of the box is modeled. For the inhalation route of exposure, the point of departure (POD) could be based on the reference concentration (RfC) methodology. In the RfC methodology, air concentrations are not converted to doses, rather, risks are assessed on the basis of comparison of exposure concentrations with reference concentrations typically determined from animal studies. This approach is not always available for every chemical; therefore, the exposure assessor should discuss the possibility of this approach with a toxicologist. Post-application Inhalation Exposure Algorithm Post-application inhalation exposure to adults or children in an outdoor area that has been treated with an aerosolized pesticide is largely dependent on the amount applied and the airflow. It should be noted that two factors, exposure time and volume, are not significant factors for calculation of exposure from outdoor aerosol space sprays. Exposure time is not a significant factor in the exposure calculation due to the rapid dissipation of pesticide air concentrations from outdoor aerosol space sprays. Based on the minimum airflow rate (Q) given in Table 5-3 below, the pesticide air concentration within the enclosed space is virtually zero (less than 0.1% of the initial concentration) after approximately 7 minutes. The integration of the WMB model equation to derive the exposure equation results in the volume term used to calculate the initial concentration (mass of active ingredient/volume of box) canceling out the volume term from the decay rate constant (See Section D.3.1 of Appendix D for equation description and derivation).
QARIRE *
= (5.5)
where:
E = exposure (mg/day); IR = inhalation rate (m3/hour); AR = application rate (mg ai/day); and Q = airflow through the treated area (m3/hour).
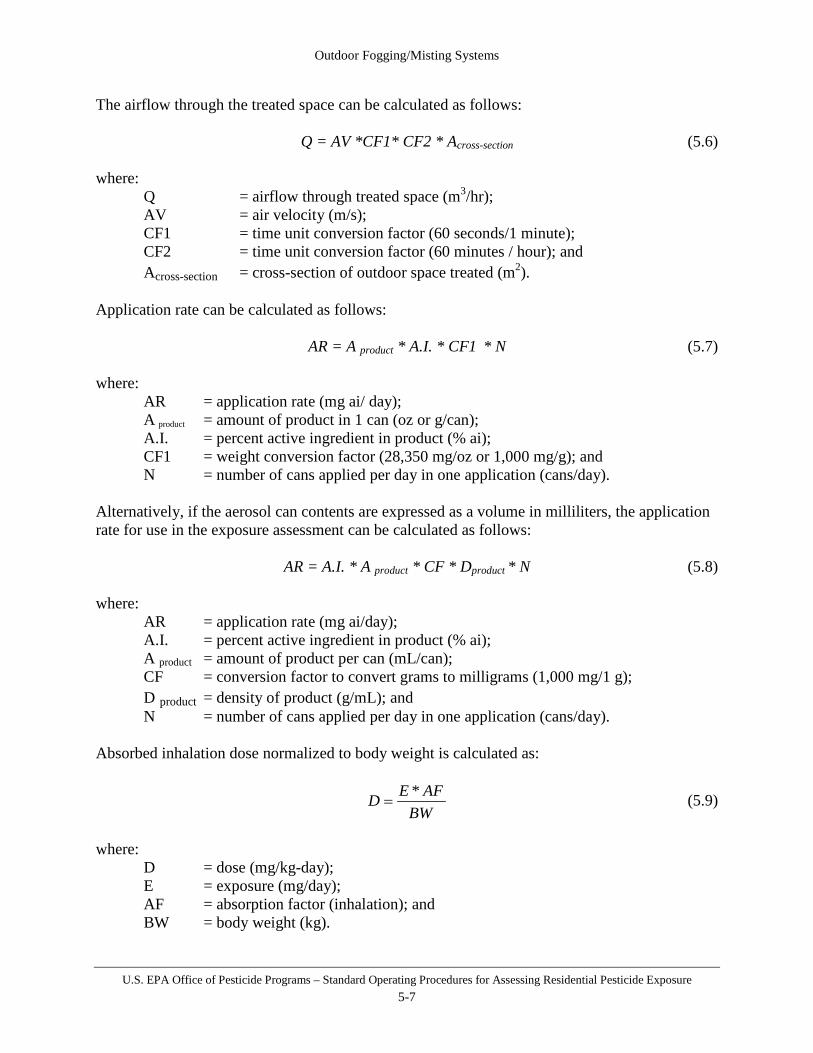
Outdoor Fogging/Misting Systems
U.S. EPA Office of Pesticide Programs – Standard Operating Procedures for Assessing Residential Pesticide Exposure 5-7
The airflow through the treated space can be calculated as follows: Q = AV *CF1* CF2 * Across-section (5.6) where:
Q = airflow through treated space (m3/hr); AV = air velocity (m/s); CF1 = time unit conversion factor (60 seconds/1 minute); CF2 = time unit conversion factor (60 minutes / hour); and Across-section = cross-section of outdoor space treated (m2).
Application rate can be calculated as follows: AR = A product * A.I. * CF1 * N (5.7) where:
AR = application rate (mg ai/ day); A product = amount of product in 1 can (oz or g/can); A.I. = percent active ingredient in product (% ai); CF1 = weight conversion factor (28,350 mg/oz or 1,000 mg/g); and N = number of cans applied per day in one application (cans/day).
Alternatively, if the aerosol can contents are expressed as a volume in milliliters, the application rate for use in the exposure assessment can be calculated as follows: AR = A.I. * A product * CF * Dproduct * N (5.8) where:
AR = application rate (mg ai/day); A.I. = percent active ingredient in product (% ai); A product = amount of product per can (mL/can); CF = conversion factor to convert grams to milligrams (1,000 mg/1 g); D product = density of product (g/mL); and N = number of cans applied per day in one application (cans/day).
Absorbed inhalation dose normalized to body weight is calculated as:
BW
AFED *= (5.9)
where:
D = dose (mg/kg-day); E = exposure (mg/day); AF = absorption factor (inhalation); and BW = body weight (kg).

Outdoor Fogging/Misting Systems
U.S. EPA Office of Pesticide Programs – Standard Operating Procedures for Assessing Residential Pesticide Exposure 5-8
Post-application inhalation exposure following applications of outdoor aerosol space sprays is generally considered short-term in duration, but is dependent on the use pattern of the specific product being assessed and the dissipation/degradation properties of the active ingredient. Refinement of this dose estimate to reflect a more accurate short-term multi-day exposure profile can be accomplished by accounting for the various factors outlined in Sections 1.3.2 and 1.3.4 such as residue dissipation, product-specific re-treatment intervals, and activity patterns. If longer-term assessments (i.e., intermediate-, long-term, or lifetime exposures) are deemed necessary, similar refinements to more accurately reflect the exposure profile are recommended. Post-application Inhalation Exposure Algorithm Inputs and Assumptions Recommended parameters for post-application inhalation exposure assessments are provided in Table 5-3 below. Following this table, each scenario-specific input parameter is described in more detail. This description includes a summary of: i) key assumptions; ii) data sources used to derive recommended input values; and iii) discussion of limitations that should be addressed when characterizing exposure. Table 5-3: Outdoor Aerosol Space Sprays – Recommended Post-application Inhalation Exposure Factor
Point Estimates Algorithm Notation
Exposure Factor (units)
Point Estimate(s)
AR Application rate (mg ai/ day) Product-specific
Across-section Cross sectional area of area treated
(m2) 15
AV Air velocity (m/s) 0.1
Q Airflow through treated area (m3/hr) 5,400
N Number of cans applied per day in one application (cans/day) 1
D product Density of product
(g/mL) Water-based products 1.0
Solvent-based products 0.8
A.I. Percent ai in product (%) Product-specific
A product Amount of product
(mL/can) Product-specific
IR Inhalation rate (m3/hour)
Adult 0.64 Children (1 < 2 years
old) 0.33
BW Body Weight (kg)
Adult 80 Children (1 < 2 years
old) 11
Application Rate (AR) The application rate is the amount of active ingredient applied per day. The application rate can be determined from product-specific factors that are listed on the product label. This application rate is determined by amount of product in a can, how many cans are used in an application, and the percentage of active ingredient.
Outdoor Fogging/Misting Systems
U.S. EPA Office of Pesticide Programs – Standard Operating Procedures for Assessing Residential Pesticide Exposure 5-9
Air Velocity (AV) The air velocity is the speed of the air moving through the treated area defined for the well-mixed box model. The fraction of the chemical available for inhalation in outdoor air is a function of the movement of air into and out of the backyard “box”. The air velocity determines the rate at which the contents of the outdoor area treated are evacuated. Wind velocity is an influencing factor affecting flying pest nuisance. Bidlingmayer et al. (1995) examined the effect of wind velocity on suction trap catches. Their research noted that trap catches declined as wind velocities increased over the entire range of observed velocities. Wind velocities within the range of normal mosquito flights, about 1 m/s, resulted in trap catch reductions on significant nights of approximately 50% by wind at 0.5 m/s and 75% at 1.0 m/s. The wind speed range considered here corresponds with the lower two tiers of the Beaufort wind force scale, an empirical measure for describing wind speed. The Beaufort wind force scale is a range on a numerical basis of 0-10, from still air conditions up to hurricane force winds. This SOP covers Beaufort numbers 0-1. The Beaufort number 0 corresponds to calm wind conditions of <0.3 m/s [18 meters/minute; 0.7 mph]. The Beaufort number 1 corresponds to light air conditions of 0.3-1.5 m/s [18-90 meters/minute; 0.7–3.4 mph]. This SOP provides a distribution of wind velocities from 0.1-1.5 m/s [0.2-3.4 mph], the upper limit for “light air” condition on the Beaufort scale and a reasonable upper bound for wind velocities where these products would be used to control flying pests. This windspeed represents a range of values foreseeable where OASS products may be used (i.e., in a yard or on an outdoor patio where flying pests may pose a nuisance). When wind velocities are higher than 1.5 m/s, these products are less likely to be used because of reduced flying pest pressure. The recommended point estimate for use in a deterministic exposure assessment is 0.1 m/s (0.22 mph). The range of air velocities applicable to this assessment are 0.1 m/s to 1.5 m/s. Across section
Across-section represents the cross-sectional area of the volume of treated space for this exposure scenario, with units m2. Unless otherwise specified by the product label, the exposure scenario for outdoor aerosol space sprays considers a 20 ft. x 20 ft. x 8 ft. (height) space treated. Therefore, the cross-sectional area for the treated space is 160 ft2 (20 ft width x 8 ft height) or 15 m2. Airflow (Q) Airflow (Q) is defined as the volume of natural air that uniformly passes through a given area in a specified period of time. In the well-mixed box model, the airflow through the treated space is the product of the air velocity (AV) and the cross-sectional area (Across section), with units m3/hour. As mentioned above, the cross-sectional area of the space treated is assumed to be 20 ft x 8 ft (160 ft2 or 15 m2). The range of air velocities to represent calm air conditions is 0.1 m/s to a maximum of 1.5 m/s. Therefore, the airflow for a typical space treated is assumed to range from 5,400 m3/hour (as the conservative default value) to 81,000 m3/hour (representing a high-end air velocity for calm air conditions).
Outdoor Fogging/Misting Systems
U.S. EPA Office of Pesticide Programs – Standard Operating Procedures for Assessing Residential Pesticide Exposure 5-10
Number of Cans per Day (N) Absent product- or chemical-specific data, it is assumed that 1 full can of product is applied by a residential handler at one time, and that one can of product represents a residential handler’s complete insecticidal aerosol product use per day. According to the Residential Exposure Joint Venture (REJV) survey (REJV, 2002), no household surveyed used more than one outdoor aerosol space spray product in one day. If extensive pest pressure exists, residential users would likely seek alternative application equipment. Density (D product) The density should represent the product being assessed. If product-specific densities are available, they should be used in the assessment. Otherwise, if the product is water-based, the assessor should use the density of water (1.0 g/mL). If the product is solvent-based, the assessor should use 0.8 g/mL, an average based on an informal survey of various organic solvents described in CRC (Lide, 1981). Amount of Product (A product) The amount of product (ounces, grams, or milliliters per can) is a product-specific value and should be stated on the label. Future Research/Data Needs There are several research/data needs with respect to the post-application outdoor aerosol space spray scenario.
• Survey data could be developed to examine the actual size of the space treated by typical outdoor aerosol space sprays. The OASS exposure scenario assumes that residential users treat a 20 ft x 20 ft space, unless otherwise specified on the label.
• Limited data are available to characterize the spatio-temporal distribution pattern that results from the release of an aerosol spray can.
• Use pattern information (i.e., amount handled, etc.) is needed to better characterize the residential post-application exposure potential after application events.
Exposure Characterization and Data Quality The OASS exposure scenario also makes the following health protective assumptions:
• all the amount of the applied pesticide is in the air available for inhalation exposure, and • all the amount of the applied pesticide settles onto the treated area (e.g.,turf) and is
available for dermal exposure • the simplifying assumptions implicit in the well-mixed box model identified in the first
two paragraphs of Section 5.1.2.1 would be health protective, since the modeled air concentrations would dissipate less rapidly (resulting in higher pesticide concentrations) in the artificially defined fixed volume compared to a true open outdoor space.
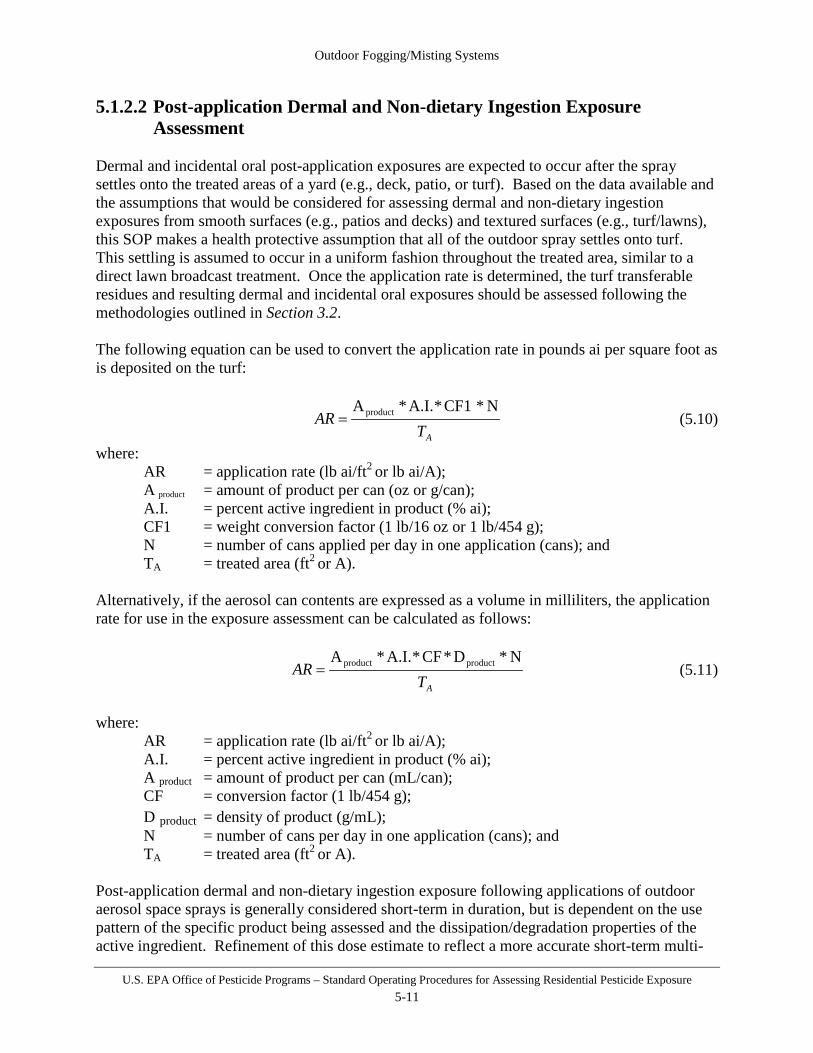
Outdoor Fogging/Misting Systems
U.S. EPA Office of Pesticide Programs – Standard Operating Procedures for Assessing Residential Pesticide Exposure 5-11
5.1.2.2 Post-application Dermal and Non-dietary Ingestion Exposure Assessment
Dermal and incidental oral post-application exposures are expected to occur after the spray settles onto the treated areas of a yard (e.g., deck, patio, or turf). Based on the data available and the assumptions that would be considered for assessing dermal and non-dietary ingestion exposures from smooth surfaces (e.g., patios and decks) and textured surfaces (e.g., turf/lawns), this SOP makes a health protective assumption that all of the outdoor spray settles onto turf. This settling is assumed to occur in a uniform fashion throughout the treated area, similar to a direct lawn broadcast treatment. Once the application rate is determined, the turf transferable residues and resulting dermal and incidental oral exposures should be assessed following the methodologies outlined in Section 3.2. The following equation can be used to convert the application rate in pounds ai per square foot as is deposited on the turf:
AT
ARN * CF1 * A.I.* Aproduct= (5.10)
where: AR = application rate (lb ai/ft2 or lb ai/A); A product = amount of product per can (oz or g/can); A.I. = percent active ingredient in product (% ai); CF1 = weight conversion factor (1 lb/16 oz or 1 lb/454 g); N = number of cans applied per day in one application (cans); and TA = treated area (ft2 or A).
Alternatively, if the aerosol can contents are expressed as a volume in milliliters, the application rate for use in the exposure assessment can be calculated as follows:
AT
ARN *D*CF * A.I.* A productproduct= (5.11)
where:
AR = application rate (lb ai/ft2 or lb ai/A); A.I. = percent active ingredient in product (% ai); A product = amount of product per can (mL/can); CF = conversion factor (1 lb/454 g); D product = density of product (g/mL); N = number of cans per day in one application (cans); and TA = treated area (ft2 or A).
Post-application dermal and non-dietary ingestion exposure following applications of outdoor aerosol space sprays is generally considered short-term in duration, but is dependent on the use pattern of the specific product being assessed and the dissipation/degradation properties of the active ingredient. Refinement of this dose estimate to reflect a more accurate short-term multi-

Outdoor Fogging/Misting Systems
U.S. EPA Office of Pesticide Programs – Standard Operating Procedures for Assessing Residential Pesticide Exposure 5-12
day exposure profile can be accomplished by accounting for the various factors outlined in Sections 1.3.2 and 1.3.4 such as residue dissipation, product-specific re-treatment intervals, and activity patterns. If longer-term assessments (i.e., intermediate-, long-term, or lifetime exposures) are deemed necessary, similar refinements to more accurately reflect the exposure profile are recommended. Post-application Dermal and Non-Dietary Ingestion Algorithm Inputs and Assumptions The following provides a general discussion for each exposure factor and recommended point estimates for use in exposure assessment. Application Rate (AR) The application rate is the amount of spray applied per unit area. The application rate per day/spray can be determined from product-specific factors that are listed on the label or from generic factors listed above. This application rate is calculated in lbs ai/ft2 or lb ai/A. Amount of Product (A product) The amount of product (ounces, grams, or milliliters per can) is a product-specific value and should be stated on the label. Number of Cans per Day (cans) Absent product- or chemical-specific data, it is assumed that 1 full can of product is applied by a residential handler at one time, and that one can of product represents a residential handler’s complete insecticidal aerosol product use per day. According to the Residential Exposure Joint Venture (REJV) survey (REJV, 2002), no household surveyed used more than one outdoor aerosol space spray product in one day. If extensive pest pressure exists, residential users would likely seek alternative application equipment. Percent Active Ingredient in Product (A.I.) The percent active ingredient in the product being assessed can be determined from the product label. Treated Area (TA) An outdoor living space with dimensions of 20 ft. x 20 ft. x 8 ft. (i.e., 400 ft2) is assumed when calculating airborne concentration levels and turf deposition. The recommended treated area is based on a recent survey on U.S. decking market, which was conducted by the Center for International Trade in Forest Products (CINTRAFOR). This deck size was selected to represent the typical area treated on a patio, deck, or yard. In this survey, CINTRAFOR contacted a random sample of U.S. homebuilders via telephone. Based on the survey results, the mean deck size for “spec” homes (n=109) was 361ft2. This translates to approximately a 20 ft x 18 ft surface area. The mean deck size for custom homes (n=174) was 490 ft2 (Eastin et al., 2005). This translates to approximately 20 ft x 24.5 ft surface area. The overall mean deck size identified in this survey is believed to be an appropriate surrogate for the amount of outdoor living space treated by aerosol fogging products. Therefore, in the absence of additional
Outdoor Fogging/Misting Systems
U.S. EPA Office of Pesticide Programs – Standard Operating Procedures for Assessing Residential Pesticide Exposure 5-13
information, 20 ft. x 20 ft. x 8 ft. is used as the volume of space that is treated with an outdoor aerosol space spray and 20 ft x 20 ft is used as the surface area of a treated area. Density (D product) The density should represent the product being assessed. If product-specific densities are available, they should be used in the assessment. Otherwise, if the product is water-based, the assessor should use the density of water (1.0 g/mL). If the product is solvent-based, the assessor should use 0.8 g/mL, an average based on an informal survey of various organic solvents described in CRC (Lide, 1981). Future Research/Data Needs There are four main potential research/data needs with respect to the post-application exposure from the outdoor aerosol space spray scenario.
• The OASS exposure scenario assumes that residential users treat a 20 ft x 20 ft space unless otherwise specified on the product label. Survey and efficacy data could be developed to examine the actual size of the amount of space treated by typical outdoor aerosol space sprays.
• Extremely limited data are available to indicate the spatio-temporal deposition pattern that results from the release of an aerosol spray can. Additional studies could be designed to capture the deposition pattern of aerosol spray pesticides in outdoor conditions.
• Survey data could be developed to examine the amounts of aerosol spray product/active ingredient handled during typical outdoor treatment scenarios.
• No data are available to indicate the extent of dermal deposition on skin from airborne particles as a result of aerosolized pesticide spray events. Studies could be designed to capture the extent of dermal deposition as a result of aerosolized pesticide sprays.
Exposure Characterization and Data Quality The OASS exposure scenario makes the following health protective assumptions:
• all the amount of the applied pesticide is in the air available for inhalation exposure, and • all the amount of the applied pesticide settles onto the turf and is available for dermal
exposure.
5.1.2.3 Combining Post-application Scenarios Risk estimates resulting from different exposure scenarios are combined when it is likely that they can occur simultaneously based on the use pattern and when the toxicological effects across different routes of exposure are the same. When combining scenarios, it is important to fully characterize the potential for co-occurrence as well as characterizing the risk inputs and estimates. Risk estimates should be combined even if any one scenario or route of exposure exceeds the level of concern because this allows for better risk characterization for risk managers.
Outdoor Fogging/Misting Systems
U.S. EPA Office of Pesticide Programs – Standard Operating Procedures for Assessing Residential Pesticide Exposure 5-14
It is likely that children could be exposed to an area treated by an OASS product via inhalation, dermal and non-dietary ingestion (hand-to-mouth) routes and that these scenarios could occur simultaneously. Therefore, these exposure scenarios should be combined when toxicological effects are the same across these routes of exposure.
5.2 Candles, Coils, Torches & Mats (CCTM) Candles, coils, torches, and mats (CCTM) are pesticide products that are ignited or placed on a burner to release the active ingredient as a smoke or vapor in order to repel insects. The scenario represents use of CCTM products for a gathering of people outdoors in a yard or on a patio using the product(s) to repel flying pests. This section provides standard methods for estimating potential exposure to pesticides from the use of pesticidal candle, coil, torch or mat for the purposes of outdoor pest control. Handler exposure, both dermal and inhalation, is expected to be negligible as the application activity (i.e., product activation) does not involve application (e.g., spraying liquids or spreading granules) in the typical sense. However, adult and child post-application inhalation exposure resulting from being in proximity to CCTM products following activation is the primary exposure route. Post-application dermal exposure from CCTM use is expected to be negligible.
5.2.1 Handler Exposure Assessment Pesticidal candles, coils, torches and mats are typically marketed for residential use to repel flying insects and pests. Upon activation (i.e., ignition or heating), these products emit small particles (<2 µm) over the useful life of the product (Lucas, J., EPA, Allethrins SMART Meeting, 10/17/03). Handler exposure does not need to be assessed quantitatively because the ignition or activation of these products is instantaneous and quantitative post-application exposure adequately assesses the exposure potential from CCTM.
5.2.2 Post-Application Exposure Assessment Post-application exposure can result from presence in a patio or yard during use of candles, coils, torches, or mats containing pesticides. While exposure may occur for people of all ages, adults and children 1 < 2 years old are considered the index lifestages based on behavioral characteristics and the strengths and limitations of available data (see Appendix A). This section addresses standard methods for estimating exposure and dose for three post-application exposure pathways resulting from use of candles, coils, torches, and mats:
• Section 5.2.2.1 - adult/children 1 < 2 years old inhalation exposure; and, • Section 5.2.2.2 - adult/children 1 < 2 years old dermal and children non-dietary exposure.

Outdoor Fogging/Misting Systems
U.S. EPA Office of Pesticide Programs – Standard Operating Procedures for Assessing Residential Pesticide Exposure 5-15
5.2.2.1 Post-application Inhalation Exposure Assessment Post-application inhalation exposure occurs as a result of inhalation of the airborne emission released by the pesticidal candle, coil, torch or mat. This section provides a standard method for completing post-application inhalation exposure assessments for adults and children during the use of pesticidal candles, coils, or mats for short-term pest control. As with the outdoor aerosol space sprays, the algorithm assumes a simple WMB model adequately represents the exposure scenario (See Section D.3 of Appendix D for additional details on the WMB). The algorithms presented in this scenario assume that no further inhalation exposure occurs after the CCTM is spent or extinguished. The exposure scenario assumes that the CCTM product is in use for the entire exposure time. The WMB model was used to develop the exposure equation for the CCTM post-application inhalation scenario (Fan et al, 2001). The CCTM scenario differs from the other exposure scenarios in this SOP section in that the WMB model includes a constant emission rate term during the exposure time and, thus, results in a more complex exposure equation. The WMB model was used to model pesticide air concentrations within an enclosed, fixed volume (i.e., a box) over time during the constant emission of a pesticide from a CCTM product. The WMB model incorporates a number of simplifying assumptions: fresh air (having no pesticide concentration) enters the box at a constant airflow rate; a turbulent internal airflow thoroughly mixes the fresh air with the pesticide-laden air resulting in a uniform pesticide air concentration within the box; and the perfectly mixed air exits the box at the same constant airflow rate (i.e., the inflow rate equals the outflow rate). Thus, the outdoor area where the CCTM product is being applied is assumed to be in an enclosed box. Using the WMB model is conservative for estimation of exposures for an open patio or deck where dissipation is expected to be greater than the enclosed space that the WMB depicts. The evacuation of the CCTM emission from the box depends on airflow. For an outdoor scenario, the airflow, Q, is the product of the cross-sectional area and the wind velocity. The cross-sectional area is dependent on the area/volume of the treated space, and is defined in each SOP sub-scenario. The WMB model developed for this scenario models the pesticide air concentrations during a constant emission of pesticide from a CCTM product. Only constant emission and dissipation due to airflow into and out of the box is modeled. For the inhalation route of exposure, the point of departure (POD) could be based on the reference concentration (RfC) methodology. In the RfC methodology, air concentrations are not converted to doses, rather, risks are assessed on the basis of comparison of exposure concentrations with reference concentrations typically determined from animal studies. This approach is not always available for every chemical; therefore, the exposure assessor should discuss the possibility of this approach with a toxicologist. Post-application Inhalation Exposure Algorithm The following algorithm is used to determine post-application inhalation exposure to the CCTM products (See Section D.3.2 of Appendix D for equation description and derivation):

Outdoor Fogging/Misting Systems
U.S. EPA Office of Pesticide Programs – Standard Operating Procedures for Assessing Residential Pesticide Exposure 5-16
(5.12) where:
E = exposure (mg/day); IR = inhalation rate (m3/hr); VE = vaporization efficiency (%); ER = emission rate (mg ai/hr); ET = exposure time (hr/day); V = volume of treated space (m3); and Q = airflow (m3/hr).
The airflow through the treated space can be calculated as follows: Q = AV *CF1* CF2 * Across-section (5.13) where: Q = airflow through treated space (m3/hr); AV = air velocity (m/s); CF1 = time unit conversion factor (60 seconds/1 minute); CF2 = time unit conversion factor (60 minutes / hour); and Across-section = cross-section of outdoor space treated (m2). The emission rate from a CCTM product can be calculated as follows:
UL
N *A ER P= (5.14)
where:
ER = emission rate (mg ai/hr); A = amount of mg ai in CCTM product (mg ai/product); NP = number of products used (products); and UL = useful life of product (hours).
Inhalation dose normalized to body weight is calculated as:
BW
AFED *= (5.15)
where:
D = dose (mg/kg-day); E = exposure (mg/day); AF = absorption factor (inhalation); and BW = body weight (kg).
−
⋅⋅=
QVET
QERVIRE E

Outdoor Fogging/Misting Systems
U.S. EPA Office of Pesticide Programs – Standard Operating Procedures for Assessing Residential Pesticide Exposure 5-17
Post-application inhalation exposure following uses of candles, coils, torches, or mats is generally considered short-term in duration, but is dependent on the use pattern of the specific product being assessed and the dissipation/degradation properties of the active ingredient. Refinement of this dose estimate to reflect a more accurate short-term multi-day exposure profile can be accomplished by accounting for the various factors outlined in Sections 1.3.2 and 1.3.4 such as residue dissipation, product-specific re-treatment intervals, and activity patterns. If longer-term assessments (i.e., intermediate-, long-term, or lifetime exposures) are deemed necessary, similar refinements to more accurately reflect the exposure profile are recommended. Post-application Inhalation Exposure Algorithm Inputs and Assumptions Recommended values for post-application inhalation exposure assessments are provided in Table 5-4 below. Following this table, each scenario-specific input parameter is described in more detail. This description includes a summary of: i) key assumptions; ii) data sources used to derive recommended input values; and iii) discussion of limitations that should be addressed when characterizing exposure.
Table 5-4: CCTM – Recommended Post-application Inhalation Exposure Factor Point Estimates Algorithm Notation
Exposure Factor (units) Point Estimate(s)
VE Vaporization efficiency (percent)
100% assumed unless registrant provides data for product
A Amount of ai in the product (mg) Product-specific
ER Emission rate (mg ai/hr) Calculated
UL Useful life (hours)
Candles/Coils/Torches 4 Mats 4
ET Exposure time (hours)
Adults 2.3 Children 1 < 2 years old 2.3
V Volume of treated space (m3) 51
Q Airflow through treated area (m3/hr) 4,000
AV Air velocity (m/s) 0.1
NP Number of products used (# products) 1 product per treated area
Across-
section Cross sectional area of area treated
(m2) 11
IR Inhalation rate (m3/hour)
Adults 0.64 Children 1 < 2 years old 0.33
BW Body Weight (kg)
Adults 80 Children 1 < 2 years old 11
Vaporization Efficiency (VE) Vaporization efficiency is the percentage of active ingredient in the product that becomes available for inhalation exposure through heating, burning, or activation of the product. As a CCTM product is heated or burned, it is likely that not all of the active ingredient in the product will be available for inhalation exposure. If this information is available through product
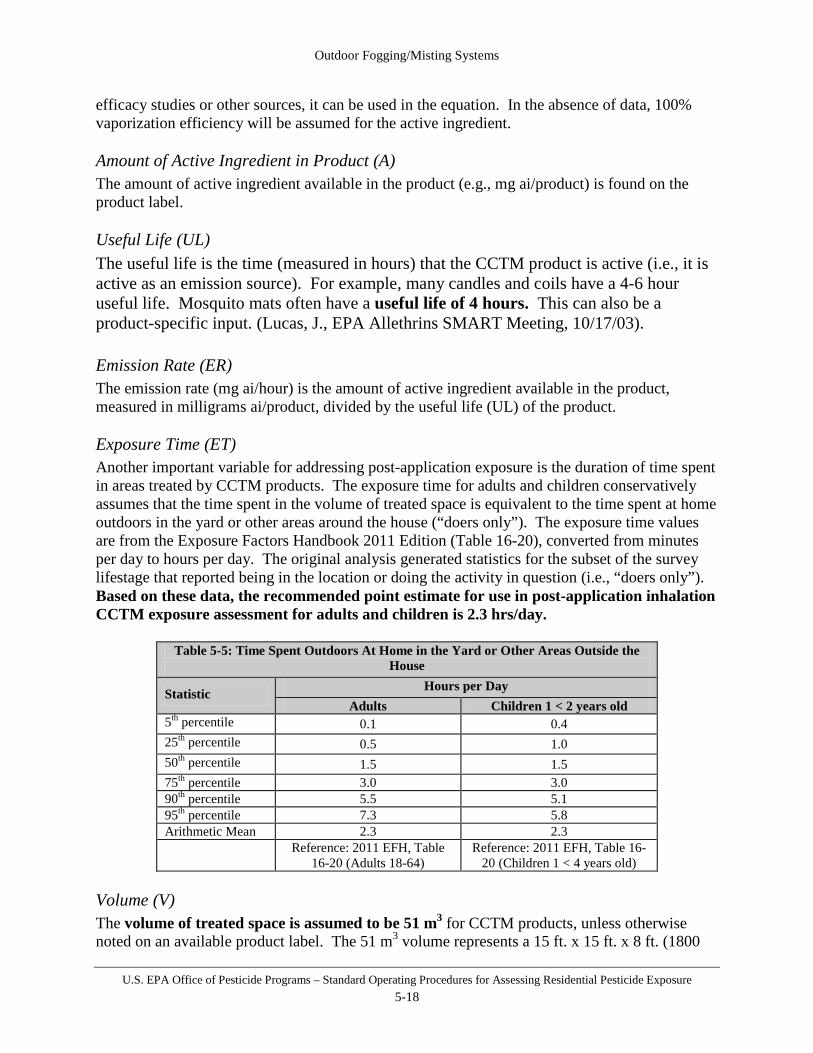
Outdoor Fogging/Misting Systems
U.S. EPA Office of Pesticide Programs – Standard Operating Procedures for Assessing Residential Pesticide Exposure 5-18
efficacy studies or other sources, it can be used in the equation. In the absence of data, 100% vaporization efficiency will be assumed for the active ingredient. Amount of Active Ingredient in Product (A) The amount of active ingredient available in the product (e.g., mg ai/product) is found on the product label. Useful Life (UL) The useful life is the time (measured in hours) that the CCTM product is active (i.e., it is active as an emission source). For example, many candles and coils have a 4-6 hour useful life. Mosquito mats often have a useful life of 4 hours. This can also be a product-specific input. (Lucas, J., EPA Allethrins SMART Meeting, 10/17/03). Emission Rate (ER) The emission rate (mg ai/hour) is the amount of active ingredient available in the product, measured in milligrams ai/product, divided by the useful life (UL) of the product. Exposure Time (ET) Another important variable for addressing post-application exposure is the duration of time spent in areas treated by CCTM products. The exposure time for adults and children conservatively assumes that the time spent in the volume of treated space is equivalent to the time spent at home outdoors in the yard or other areas around the house (“doers only”). The exposure time values are from the Exposure Factors Handbook 2011 Edition (Table 16-20), converted from minutes per day to hours per day. The original analysis generated statistics for the subset of the survey lifestage that reported being in the location or doing the activity in question (i.e., “doers only”). Based on these data, the recommended point estimate for use in post-application inhalation CCTM exposure assessment for adults and children is 2.3 hrs/day.
Table 5-5: Time Spent Outdoors At Home in the Yard or Other Areas Outside the House
Statistic Hours per Day Adults Children 1 < 2 years old
5th percentile 0.1 0.4 25th percentile 0.5 1.0 50th percentile 1.5 1.5 75th percentile 3.0 3.0 90th percentile 5.5 5.1 95th percentile 7.3 5.8 Arithmetic Mean 2.3 2.3
Reference: 2011 EFH, Table 16-20 (Adults 18-64)
Reference: 2011 EFH, Table 16-20 (Children 1 < 4 years old)
Volume (V) The volume of treated space is assumed to be 51 m3 for CCTM products, unless otherwise noted on an available product label. The 51 m3 volume represents a 15 ft. x 15 ft. x 8 ft. (1800

Outdoor Fogging/Misting Systems
U.S. EPA Office of Pesticide Programs – Standard Operating Procedures for Assessing Residential Pesticide Exposure 5-19
ft3) treated space. This represents a typical treated space based on experience and professional judgment and review of current product labels that pertain to this exposure scenario. Air Velocity (AV) The air velocity is the speed of the air moving through the treated volume defined for the well-mixed box model. The fraction of the chemical available for inhalation in outdoor air is a function of the movement of air into and out of the backyard “box”. The air velocity determines the rate at which the contents of the outdoor area treated are evacuated. Wind velocity is an influencing factor affecting flying pest nuisance. Bidlingmayer et al. 1995 examined the effect of wind velocity on suction trap catches. Their research noted that trap catches declined as wind velocities increased over the entire range of observed velocities. Wind velocities within the range of normal mosquito flights, about 1 m/s resulted in trap catch reductions on significant nights of approximately 50% by wind of 0.5 m/s and 75% at 1.0 m/s. The wind speed range considered here corresponds with the lower two tiers of the Beaufort wind force scale, an empirical measure for describing wind speed. The Beaufort wind force scale is a range on a numerical basis of 0-10, from still air conditions up to hurricane force winds. This SOP covers Beaufort numbers 0-1. The Beaufort number 0 corresponds to calm wind conditions of <0.3 m/s [18 meters/minute; 0.7 mph]. The Beaufort number 1 corresponds to light air conditions of 0.3-1.5 m/s [18-90 meters/minute; 0.7–3.4 mph]. Thus, this SOP provides a distribution of wind velocities from 0.1-1.5 m/s [0.2-3.4 mph], the upper limit for “light air” condition on the Beaufort scale and a reasonable upper bound for wind velocities where these products would be used to control flying pests. This windspeed represents a range of values foreseeable where CCTM products may be used (i.e., in a yard or on an outdoor patio where flying pests may pose a nuisance). When wind velocities are higher than 1.5 m/s, these products are less likely to be used because of reduced flying pest pressure. The recommended point estimate for use in a deterministic exposure assessment is 0.1 m/s (0.22 mph). The range of air velocities applicable to this assessment are 0.1 m/s to 1.5 m/s. Across section
Across-section represents the cross-sectional area of the volume of treated space for this exposure scenario, measured in m2. Unless otherwise specified by the product label, the exposure scenario for CCTM considers a 15ft x 15 ft x 8 ft space; therefore the cross-sectional area for the treated space is 120 ft2 (15 ft width x 8 ft height) or 11 m2. Airflow (Q) Airflow (Q) is defined as the volume of natural air that uniformly passes through a given area in a specified period of time. The airflow is a function of the cross-sectional area and wind velocity In the well-mixed box model, the airflow through the treated space is the product of the air velocity and the cross-sectional area, and is measured in m3/hour. As mentioned above, the cross-sectional area of the space treated is assumed to be 15 ft x 8 ft (120 ft2, or 11 m2). The range of air velocities to represent calm air conditions is 0.1 m/s to a maximum of 1.5 m/s. Therefore, the airflow for a typical space treated is assumed to range from 4,000 m3/hour (as the health-protective default value) to 60,000 m3/hour.

Outdoor Fogging/Misting Systems
U.S. EPA Office of Pesticide Programs – Standard Operating Procedures for Assessing Residential Pesticide Exposure 5-20
Number of Products Used (Np) The number of products is related to the size of the space treated by the product user. A product user is typically directed to use a proportional amount of product per area (e.g., if 1 CCTM treats a 15 ft x 15 ft area, then treating twice the space would require double the product). The airborne concentration of active ingredient is the same in both examples. Therefore, the CCTM exposure scenario considers the smallest typical treatment area (i.e., 15 ft x 15 ft). The recommended point estimate for use in a deterministic exposure assessment is 1 product used for the default treated space size (15 ft x 15 ft area). This value can be adjusted based on product-specific label directions for how many CCTM products can treat the typical 15 ft by 15 ft area. Future Research/Data Needs The following area areas for research/data need with respect to the post-application exposure from the CCTM scenario:
• the extent of post-application inhalation exposure potential as a result of airborne particles released from the activation of candles, coils, torches, and mats
• studies designed to capture the extent of inhalation exposure as a result of the activation and use of these types of consumer products.
Exposure Characterization and Data Quality
• The simplifying assumptions implicit in the well-mixed box model identified in the first two paragraphs of Section 5.2.2.1would tend to be health protective since the modeled air concentrations would dissipate less rapidly (resulting in higher pesticide concentrations) in the artificially defined fixed volume compared to a true open outdoor space.
• Due to the relative useful life (e.g., 4-6 hours for candles & mats) of CCTM products compared to the time spent outdoors, the algorithm models the air concentration during the “burn time” of the CCTM products. Exposure time is typically less than the burn time of the product. If time spent outdoors (ET) were to exceed the useful life of such products, the exposure equation derived for this section would need to be modified to account for the change in the emission rate of the product.
• A source emission continued beyond the useful life of the product would overestimate pesticide air concentrations, thus the use of the exposure equation in this section represents a health protective approach.
5.2.2.2 Post-application Dermal and Non-Dietary Ingestion Exposure Assessment
The inhalation route of exposure is expected to be the primary post-application exposure route. Residues deposited on patios or other surfaces are expected to be negligible after use of a CCTM product. Due to the size fraction of particles released from the activation of CCTM products, particles are expected to remain airborne rather than be deposited on surfaces. Therefore, dermal and incidental oral post-application exposures to surface residues do not need to be quantitatively assessed.

Outdoor Fogging/Misting Systems
U.S. EPA Office of Pesticide Programs – Standard Operating Procedures for Assessing Residential Pesticide Exposure 5-21
5.2.2.3 Combining Post-application Scenarios Risk estimates resulting from different exposure scenarios are combined when it is likely that they can occur simultaneously based on the use pattern and when the toxicological effects across different routes of exposure are the same. When combining scenarios, it is important to fully characterize the potential for co-occurrence as well as characterizing the risk inputs and estimates. Risk estimates should be combined even if any one scenario or route of exposure exceeds the level of concern because this allows for better risk characterization for risk managers. As no residues from CCTM products are expected to be deposited on patios or other surfaces, no post-application dermal and non-dietary ingestion exposures are expected to occur. Therefore, these exposure scenarios are not quantitatively assessed, and are not combined with post-application inhalation exposure.
5.3 Outdoor Residential Misting Systems (ORMS) Outdoor residential misting systems (sometimes called "mosquito misters") are application systems designed to spray pesticides in a fine mist to kill mosquitoes and other insects outdoors. Misting systems include spray nozzles that are mounted around the perimeter of a home in the lawn or landscaping, or on parts of the house or fence. The spray nozzles are connected by tubing to a supply of insecticide. These systems can operate automatically (i.e., at preset intervals) or manually (e.g., remote control or switch). This section provides standard methods for estimating potential doses from pesticides applied using outdoor residential misting systems (ORMS) in yards or on patios. Adults filling the ORMS drums with the pesticide may experience dermal and inhalation exposure. Adults and children occupying the yard or patio following the application of a pesticide using an ORMS may experience inhalation, dermal and incidental oral exposure. This section describes the methods for estimating the potential dose for handlers using ORMS, the method for estimating the potential dose from post-application inhalation exposure to a treated yard or patio, as well as the method for estimating residue deposited on the lawn following a pesticide treatment from the ORMS which can be used in conjunction with methods outlined in Section 3.2 to estimate dermal and oral post-application doses following direct applications to lawns.
5.3.1 Handler Exposure Assessment Misting systems are typically marketed as systems that include a mix tank, a timer controlled pump, and fixed pipes or hoses that run to the nozzles. The systems are often professionally installed and include a service contract to cover maintenance and insecticide refilling. Nevertheless, it is possible for residential homeowners to purchase the pesticide and load the tank (or drums) themselves; therefore, a residential handler assessment may be required.

Outdoor Fogging/Misting Systems
U.S. EPA Office of Pesticide Programs – Standard Operating Procedures for Assessing Residential Pesticide Exposure 5-22
This section provides a standard method for conducting handler exposure assessments for adults mixing and loading pesticides to be used in outdoor residential misting systems. It is assumed that only individuals 16 years of age or older mix and load (i.e., handle) pesticides. The basis for this scenario is that handler exposure occurs as the pesticide is poured into the drum by the applicator holding the product container; no applicator scenario is required as misting systems spray the pesticide in the treatment area automatically. This scenario assumes that pesticides can be inhaled or can come into contact with the skin during the mixing and loading of the pesticide products in the drums as part of the residential misting system. The method to determine handler inhalation and dermal exposure to pesticides from these activities relies on data measuring dermal and inhalation exposure during mixing and loading (i.e., pouring a liquid pesticide). Thus, this method should be used in the absence of chemical-specific data, or as a supplement to estimates based on chemical-specific data. Dermal and Inhalation Handler Exposure Algorithm As described in Section 1.3.3, daily dermal and inhalation exposure (mg/day) for residential pesticide handlers is estimated for a given formulation-application method combination by multiplying the formulation-application method-specific unit exposure by an estimate of the amount of active ingredient handled in a day, using the equation below: E = UE * AR (5.16) where:
E = exposure (mg/day); UE = unit exposure (mg/lb ai); and AR = application rate (lb ai/day).
The application rate can be calculated as follows: AR = VD * N * DR * A.I. * DH2O (5.17) where:
AR = application rate per day (lb ai/ day); VD = volume of the drum of the misting system (gallons/drum); N = number of drums filled per day (drums/day) DR = dilution rate (volume product /volume total solution); A.I. = percent active ingredient in product (%); and DH2O = water density (lb/gal).
Absorbed dermal and/or inhalation doses normalized to body weight are calculated as:
BW
AFED *= (5.18)
where:
D = dose (mg/kg-day);

Outdoor Fogging/Misting Systems
U.S. EPA Office of Pesticide Programs – Standard Operating Procedures for Assessing Residential Pesticide Exposure 5-23
E = exposure (mg/day); AF = absorption factor (dermal and/or inhalation); and BW = body weight (kg).
Handler exposure for outdoor residential misting systems is generally considered short-term in duration as filling the centralized reservoir tanks typically occur once in a 90-day period. Refinement of this dose estimate to reflect a more accurate short-term multi-day exposure profile can be accomplished by accounting for the various factors outlined in Sections 1.3.2 and 1.3.3 such as the product-specific application regimen. Dermal and Inhalation Handler Exposure Algorithm Inputs and Assumptions Recommended values for handler exposure (inhalation and dermal) assessments are provided in Table 5-6 and Table 5-7. Following these tables, each scenario-specific input parameter is described in more detail. This description includes a summary of: i) key assumptions; ii) data sources used to derive recommended input values; and iii) discussion of limitations that should be addressed when characterizing exposure.
Table 5-6: Outdoor Residential Misting Systems – Recommended Unit Exposure (mg/lb ai) Point Estimates
Formulation Equipment/ Application
Method
Dermal Inhalation Appendix Page
Reference Point Estimate Point Estimate
Liquid concentrates Mixing/loading 0.232 0.000219 NA
NA = not applicable – data from occupational handler data source (see: http://www.epa.gov/pesticides/science/handler-exposure-data.html)
Table 5-7: Outdoor Residential Misting Systems – Recommended Handler Exposure Factor Point
Estimates Algorithm Notation
Exposure Factor (units) Point Estimate(s)
AR Application rate (lb ai/ day) Product-specific
DH20 Density of product
(lb/gal) 8.34
VD Volume of Drum (gallons/drum) 55
DR Dilution Rate (volume product /volume total solution) Product-specific
N Number of drums filled per day (drums/day) 1
A.I. Percent ai in product (%) Product-specific
BW Body weight (kg) 80
Unit Exposure (UE)
Outdoor Fogging/Misting Systems
U.S. EPA Office of Pesticide Programs – Standard Operating Procedures for Assessing Residential Pesticide Exposure 5-24
As described in Section 1.3.3, the unit exposure is the ratio between exposure and the amount of active ingredient handled for a given formulation/application method combination, with units mass exposure per mass active ingredient handled (e.g., mg ai exposure/lb ai handled). Drum Volume (VD) The drum feeds into the plumbing that leads to the nozzles of the residential misting system. The default drum size is based on a typical drum size (30 or 55 gallons). Number of Drums Filled per Day (N) One drum is assumed to be filled per day, as residential misting systems are likely only connected to one drum. Dilution Rate (DR) The label should state the amount (e.g., gallons) of concentrated product per amount of water. This can also be given as parts of product per parts of water. Dilution rate is the volume of the product amount stated on the label divided by the sum of product volume and water volume (i.e., volume total solution). Water Density (DH2O) The dilute solution of pesticide for application through the misting system is assumed to have the same density as water (i.e., 8.34 lbs/gallon), since pesticide concentrate is typically mixed with large volumes of water. Future Research/Data Needs Potential research/data need with respect to the outdoor residential misting system scenario include:
• survey data to examine the prevalence of these systems in the United States • information detailing the breakdown of maintenance (i.e., characterizing the percentage
of systems that are professional maintained versus homeowner maintained), and • equipment type (e.g., how often the systems are refilled/reloaded, and the spray
frequency of these systems). Exposure Characterization and Data Quality
Unit Exposures • The unit exposures used for this scenario are from the “All Liquids, Open Mixing and
Loading” Scenario in EPA’s Occupational Pesticide Handler Unit Exposure Surrogate Reference Table (http://www.epa.gov/pesticides/science/handler-exposure-table.pdf). The use of occupational exposure data may overestimate homeowner exposure. Additionally, the values were adjusted to represent the type of clothing a homeowner or non-professional residential handler would wear (i.e., short-sleeved shirt, shorts and no chemical-resistant gloves) and are the best available data set for determining residential exposures during open pouring with liquid chemicals.
• The underlying assumption of the use of exposure data as unit exposures – proportionality between the amount of active ingredient handled and exposure – is
Outdoor Fogging/Misting Systems
U.S. EPA Office of Pesticide Programs – Standard Operating Procedures for Assessing Residential Pesticide Exposure 5-25
uncertain, though potentially conservative. However, as a prediction mechanism, it is considered practical and useful for the purposes of handler exposure assessment in a regulatory context. It provides a straightforward handler exposure calculation method and enables risk mitigation in the form of formulation comparison and decreased application rates.
• The extent to which an individual’s exposure (expressed via unit exposures) varies day-to-day or application-to-application is unknown; therefore, the assumption that there is no variation when assessing longer-term exposure durations is considered conservative.
5.3.2 Post-Application Exposure Assessment Post-application exposure can result from physical activities in areas previously treated by residential misting systems. While exposure may occur for people of all ages, adults and children 1 < 2 years old are considered the index lifestages depending on the exposure scenario based on behavioral characteristics and the strengths and limitations of available data (see Appendix A). Automatic spray systems were originally used in animal housing structures, such as dairy barns, to control flying insects. Recently, these systems have been adapted for use in residential sites, including residential yards, to control mosquitoes and other pests. These systems are fed from a central holding tank and utilize an array of spray nozzles to automatically deliver a fine mist of dilute solution at specified intervals throughout the day. It is currently unclear whether these systems are intended to target flying insects or insect resting surfaces. According to a discussion paper written by the Consumer Specialty Products Association (CSPA, 2005), these systems are designed to apply product to resting surfaces where insects seek harborage during non-feeding periods. However, in an efficacy study conducted by Florida A & M University, it was determined that the system was only efficacious against flying insects (Cilek et. al, 2008). Despite the discrepancy, it is reasonable to assume that some residue deposits on outdoor surfaces and is available for both dermal and non-dietary ingestion exposure. This section addresses standard methods for estimating exposure and dose for three post-application exposure pathways resulting from contact during outdoor activities in patios and backyards following use of an outdoor residential misting system:
• Section 5.3.2.1 - adult/children 1 < 2 years old inhalation exposure resulting from activities on patios and backyards; and,
• Section 5.3.2.2 - adult/children 1 < 2 years old dermal and children 1 < 2 years old non-dietary ingestion exposure.
5.3.2.1 Post-application Inhalation Exposure Assessment
This SOP provides a standard method for completing post-application inhalation exposure assessments for adults and children after a pesticide treatment in an outdoor space. The basis for this scenario is that inhalation exposure occurs from the airborne aerosols released by mister

Outdoor Fogging/Misting Systems
U.S. EPA Office of Pesticide Programs – Standard Operating Procedures for Assessing Residential Pesticide Exposure 5-26
nozzles. The well-mixed box (WMB) model was used to develop the exposure equation for the outdoor residential misting systems (ORMS) post-application inhalation scenario.9 The WMB model incorporates a number of simplifying assumptions: fresh air (having no pesticide concentration) enters the box at a constant airflow rate; a turbulent internal airflow thoroughly mixes the fresh air with the pesticide-laden air resulting in a uniform pesticide air concentration within the box; and the perfectly mixed air exits the box at the same constant airflow rate (i.e., the inflow rate equals the outflow rate). Thus, the outdoor area where the aerosol is being applied is assumed to be in an enclosed box. Using the WMB model is conservative for estimation of exposures for an open patio, deck or yard where dissipation is expected to be greater than the enclosed space that the WMB depicts. Also, this scenario assumes instantaneous spray releases, that is, the total amount of aerosol released at each spray event is modeled to occur instantaneously. The evacuation of the aerosol from the box depends on airflow. For an outdoor scenario, the airflow, Q, is the product of the cross-sectional area and the wind velocity. The cross-sectional area is dependent on the area/volume of the treated space, and is defined in each SOP sub-scenario. The WMB model developed for this scenario models the pesticide air concentrations after multiple instantaneous aerosol spray releases at regular time intervals10. Only dissipation due to airflow into and out of the box is modeled. For the inhalation route of exposure, the point of departure (POD) could be based on the reference concentration (RfC) methodology. In the RfC methodology, air concentrations are not converted to doses, rather, risks are assessed on the basis of comparison of exposure concentrations with reference concentrations typically determined from animal studies. This approach is not always available for every chemical; therefore, the exposure assessor should discuss the possibility of this approach with a toxicologist. Post-Application Inhalation Exposure Algorithm The following algorithm is used to determine post-application inhalation exposure to the ORMS (See Section D.3.3 of Appendix D for equation description and derivation):
−
−+⋅=
⋅
)1()1()int(
** )(0
RRPRET
QVCIR
EPRETfrac
(5.19)
where:
E = exposure (mg/day); IR = inhalation rate (m3/hr); C0 = initial air concentration (mg/m3); V = volume of treated space (m3); Q = airflow (m3/hr); ET = exposure time (hours/day);
9 For the ORMS and animal barn scenarios, the WMB models describing the air concentrations over time have the same form. The parameterization of these models is the only difference. For the ORMS scenario, the decay rate constant is specified by the ratio of the airflow rate and the volume of the treated space; whereas for the animal barn scenario, the decay rate constant is specified by the air changes per hour. 10 The regular spray applications are assumed to continue for the entire time spent outdoors.
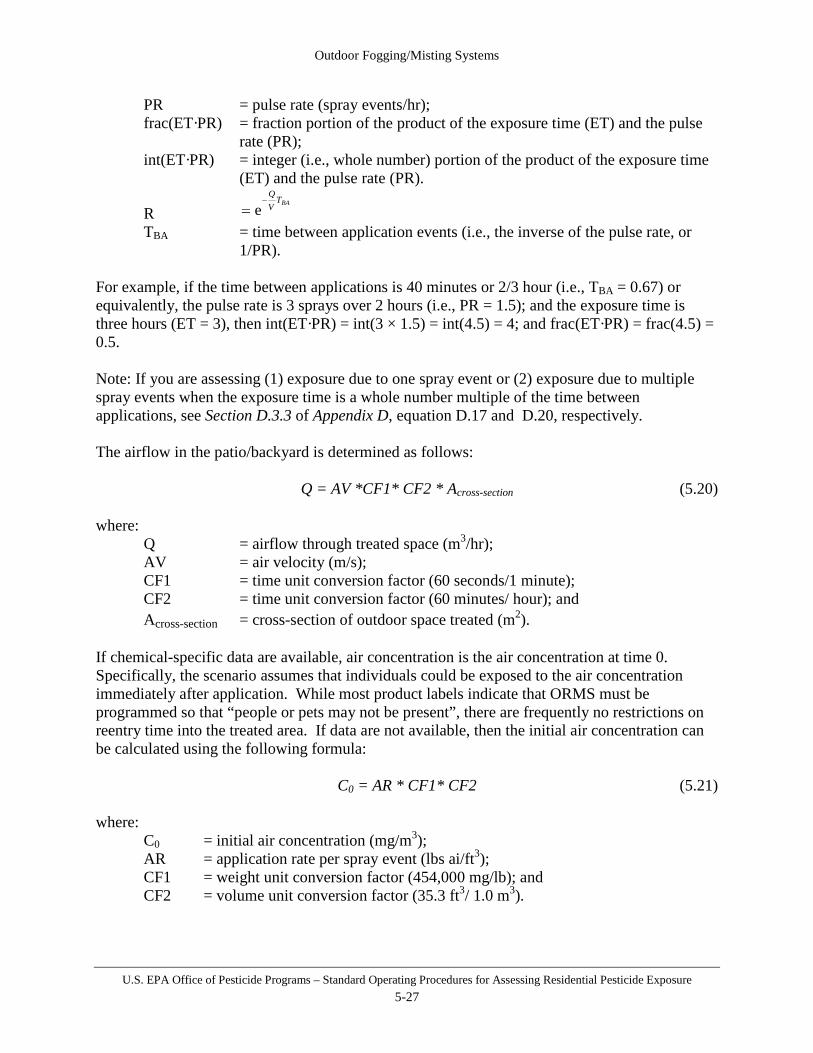
Outdoor Fogging/Misting Systems
U.S. EPA Office of Pesticide Programs – Standard Operating Procedures for Assessing Residential Pesticide Exposure 5-27
PR = pulse rate (spray events/hr); frac(ET·PR) = fraction portion of the product of the exposure time (ET) and the pulse
rate (PR); int(ET·PR) = integer (i.e., whole number) portion of the product of the exposure time
(ET) and the pulse rate (PR).
R BAT
VQ
−= e
TBA = time between application events (i.e., the inverse of the pulse rate, or 1/PR).
For example, if the time between applications is 40 minutes or 2/3 hour (i.e., TBA = 0.67) or equivalently, the pulse rate is 3 sprays over 2 hours (i.e., PR = 1.5); and the exposure time is three hours (ET = 3), then int(ET·PR) = int(3 × 1.5) = int(4.5) = 4; and frac(ET·PR) = frac(4.5) = 0.5. Note: If you are assessing (1) exposure due to one spray event or (2) exposure due to multiple spray events when the exposure time is a whole number multiple of the time between applications, see Section D.3.3 of Appendix D, equation D.17 and D.20, respectively. The airflow in the patio/backyard is determined as follows: Q = AV *CF1* CF2 * Across-section (5.20) where:
Q = airflow through treated space (m3/hr); AV = air velocity (m/s); CF1 = time unit conversion factor (60 seconds/1 minute); CF2 = time unit conversion factor (60 minutes/ hour); and Across-section = cross-section of outdoor space treated (m2).
If chemical-specific data are available, air concentration is the air concentration at time 0. Specifically, the scenario assumes that individuals could be exposed to the air concentration immediately after application. While most product labels indicate that ORMS must be programmed so that “people or pets may not be present”, there are frequently no restrictions on reentry time into the treated area. If data are not available, then the initial air concentration can be calculated using the following formula: C0 = AR * CF1* CF2 (5.21) where:
C0 = initial air concentration (mg/m3); AR = application rate per spray event (lbs ai/ft3); CF1 = weight unit conversion factor (454,000 mg/lb); and CF2 = volume unit conversion factor (35.3 ft3/ 1.0 m3).

Outdoor Fogging/Misting Systems
U.S. EPA Office of Pesticide Programs – Standard Operating Procedures for Assessing Residential Pesticide Exposure 5-28
If application rates are given on the label, these rates should be used. Application rates are typically given in ounces of solution per 1000 ft3 per spray event. The following equation can be used to convert this rate to pounds ai per ft3:
NCV
AR H2Olabel D * CF *A.I. * AR= (5.22)
where:
AR = application rate per spray (lb ai/ ft3); ARlabel = application rate on label (given as ounces per 1000 ft3) (oz); A.I. = percent active ingredient in product (%); CF = volume unit conversion factor (1 gallon/128 ounces); DH2O = water density (lb/gal); and VNC = nozzle coverage volume (as stated on label) (typically 1000 ft3, or as
otherwise stated on the product label). If application rate is not given on the label, it can be calculated as follows:
NCV
AR H2OD * SD*GPM*DR *A.I.= (5.23)
where:
AR = application rate per spray (lb ai/ft3); A.I. = percent active ingredient in product (%); DR = dilution rate (volume of product/volume total solution); GPM = nozzle flowrate (gal/min); SD = spray duration (min); DH2O = water density (lb/gal); and VNC = nozzle coverage volume (ft3).
Absorbed inhalation dose normalized to body weight is calculated as:
BW
AFED *= (5.24)
where:
D = dose (mg/kg-day); E = exposure (mg/day); AF = absorption factor (inhalation); and BW = body weight (kg).
Post-application inhalation exposure following applications by outdoor residential misting systems is generally considered short-term in duration but is dependent on the use pattern of the specific product being assessed and the dissipation/degradation properties of the active
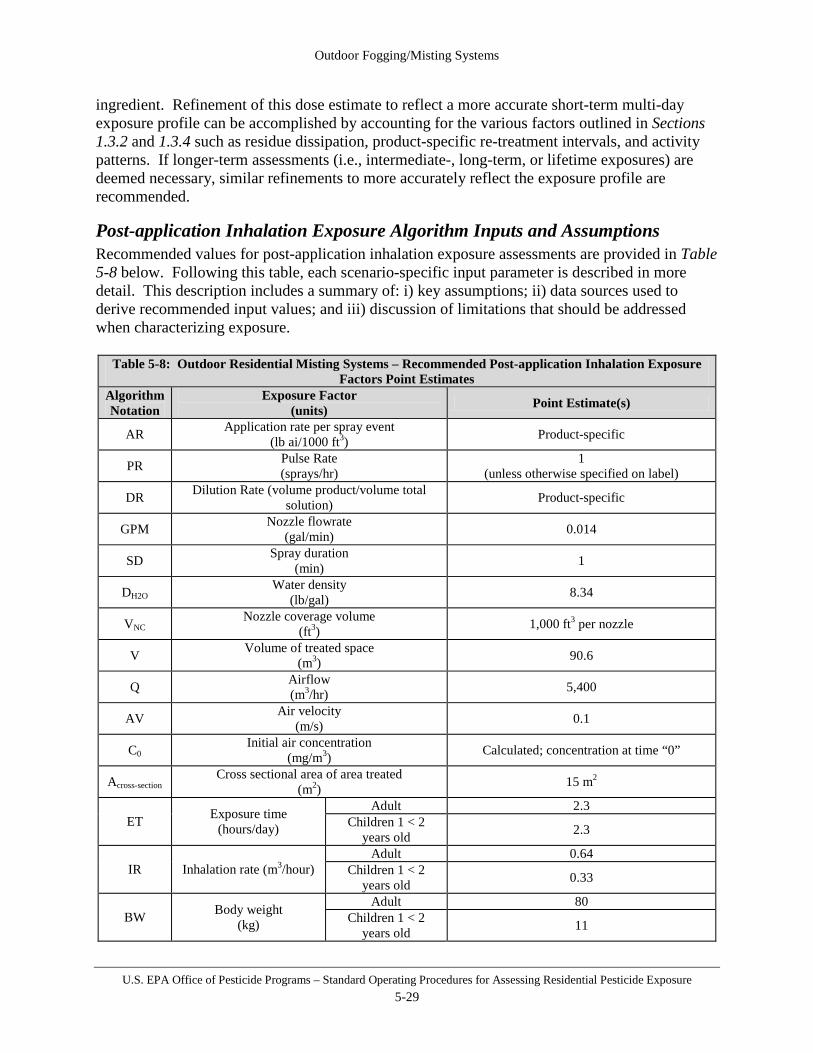
Outdoor Fogging/Misting Systems
U.S. EPA Office of Pesticide Programs – Standard Operating Procedures for Assessing Residential Pesticide Exposure 5-29
ingredient. Refinement of this dose estimate to reflect a more accurate short-term multi-day exposure profile can be accomplished by accounting for the various factors outlined in Sections 1.3.2 and 1.3.4 such as residue dissipation, product-specific re-treatment intervals, and activity patterns. If longer-term assessments (i.e., intermediate-, long-term, or lifetime exposures) are deemed necessary, similar refinements to more accurately reflect the exposure profile are recommended.
Post-application Inhalation Exposure Algorithm Inputs and Assumptions Recommended values for post-application inhalation exposure assessments are provided in Table 5-8 below. Following this table, each scenario-specific input parameter is described in more detail. This description includes a summary of: i) key assumptions; ii) data sources used to derive recommended input values; and iii) discussion of limitations that should be addressed when characterizing exposure.
Table 5-8: Outdoor Residential Misting Systems – Recommended Post-application Inhalation Exposure Factors Point Estimates
Algorithm Notation
Exposure Factor (units) Point Estimate(s)
AR Application rate per spray event (lb ai/1000 ft3) Product-specific
PR Pulse Rate (sprays/hr)
1 (unless otherwise specified on label)
DR Dilution Rate (volume product/volume total solution) Product-specific
GPM Nozzle flowrate (gal/min) 0.014
SD Spray duration (min) 1
DH2O Water density (lb/gal) 8.34
VNC Nozzle coverage volume
(ft3) 1,000 ft3 per nozzle
V Volume of treated space (m3) 90.6
Q Airflow (m3/hr) 5,400
AV Air velocity (m/s) 0.1
C0 Initial air concentration
(mg/m3) Calculated; concentration at time “0”
Across-section Cross sectional area of area treated
(m2) 15 m2
ET Exposure time (hours/day)
Adult 2.3 Children 1 < 2
years old 2.3
IR Inhalation rate (m3/hour) Adult 0.64
Children 1 < 2 years old 0.33
BW Body weight (kg)
Adult 80 Children 1 < 2
years old 11

Outdoor Fogging/Misting Systems
U.S. EPA Office of Pesticide Programs – Standard Operating Procedures for Assessing Residential Pesticide Exposure 5-30
Application Rate (AR) The application rate is the amount of spray applied per unit area times the number of sprays applied per day. The application rate can be determined from product-specific factors that are listed on the label or from generic factors listed above. This application rate needs to be determined on a volume basis (i.e., lb ai applied per 1,000 cubic feet) to determine inhalation exposures. Dilution Rate (DR) The label should state the amount (e.g., gallons) of concentrated product per amount of water. This can also be given as parts of product per parts of water. Dilution rate is the volume of the product amount stated on the label divided by the sum of product volume and water volume (i.e., volume total solution). Pulse Rate (PR): Number of Spray Events per hour The pulse rate, or number of spray events per hour, is label-specific. A default of 1 spray event per hour is assumed when no product-specific data are available (CSPA 2005). This value is combined with exposure time (hours/day) to determine exposure to the individual. It is assumed that the airborne residues would disperse between applications. Nozzle Flowrate (GPM) The nozzle flowrate is a function of the amount of water the system will use in a 24-hr period. For this SOP, a nozzle flowrate (gal/min) of 0.011-0.014 gal/min is assumed (CSPA, 2005; Cilek, et. al., 2008). The nozzle flow rate is a function of the number of nozzles on the system and the number of minutes that the system operates each day. This is the amount of diluted product released from the nozzle per unit of time. Spray Duration (SD) Available information indicates the spray duration is approximately 30-60 seconds (0.5 – 1.0 min) in length (CSPA, 2005). The recommended point estimate for use in a deterministic risk assessment is 60 seconds (1 minute). Water Density (DH2O) The dilute solution of pesticide for application through the misting system is assumed to have the same density as water (i.e., 8.34 lbs/gallon), as the pesticide concentrate is typically mixed with large volumes of water. Nozzle Coverage Volume (VNC) The nozzle coverage volume is specified in the product label. If no volume is specified, the volume coverage of 1,000 ft3 per nozzle is assumed. The range of volume coverage is 880-1440 ft3 per nozzle (CSPA, 2005; Cilek, et. al., 2008), Volume of Treated Space (V)

Outdoor Fogging/Misting Systems
U.S. EPA Office of Pesticide Programs – Standard Operating Procedures for Assessing Residential Pesticide Exposure 5-31
An outdoor living space with dimensions of 20 ft. x 20 ft. x 8 ft. (i.e., 3,200 ft3 or 90.6 m3) is assumed when calculating airborne concentration levels. This volume was selected to represent typical treated space – e.g., a patio, deck, or yard. This value is based on a recent survey on U.S. decking market which was conducted by the Center for International Trade in Forest Products (CINTRAFOR). In this survey, CINTRAFOR contacted a random sample of U.S. homebuilders via telephone. Based on the survey results, it was determined that the mean deck size for “spec” homes (n=109) was 361ft2. This translates to approximately a 20 ft x 18 ft surface area. The mean deck size for custom homes (n=174) was 490 ft2 (Eastin et al., 2005). This translates to approximately 20 ft x 24.5 ft surface area. The overall mean deck size identified in this survey is believed to be is an appropriate surrogate for the amount of outdoor living space treated by ORMS. Therefore, in the absence of additional information, 20 ft. x 20 ft. x 8 ft. is used as the volume of outdoor space that is treated with ORMS and other outdoor sprays and 20 ft x 20 ft is used as the surface area of a treated area. Across section
Across-section represents the cross-sectional area of the volume of treated space for this exposure scenario, measured in m2. Unless otherwise specified by the product label, the exposure scenario for misting systems considers a 20ft x 20 ft x 8 ft area; therefore, the cross-sectional area for the treated space is 160 ft2 (20 ft width x 8 ft height) or 15 m2. Air velocity (AV) The air velocity is the speed of the air moving through the treated area defined for the well-mixed box model. The fraction of the chemical available for inhalation in outdoor air is a function of the movement of air into and out of the backyard “box”. The air velocity determines the rate at which the contents of the outdoor area treated are evacuated. Wind velocity is an influencing factor affecting flying pest nuisance. Bidlingmayer et al., 1995 examined the effect of wind velocity on suction trap catches. Their research noted that trap catches declined as wind velocities increased over the entire range of observed velocities. Wind velocities within the range of normal mosquito flights, about 1 m/s resulted in trap catch reductions on significant nights of approximately 50% by wind of 0.5 m/s and 75% at 1.0 m/s. The wind speed range considered here corresponds with the lower two tiers of the Beaufort wind force scale, an empirical measure for describing wind speed. The Beaufort wind force scale is a range on a numerical basis of 0-10, from still air conditions up to hurricane force winds. This SOP covers Beaufort numbers 0-1. The Beaufort number 0 corresponds to calm wind conditions of <0.3 m/s [18 meters/minute; 0.7 mph]. The Beaufort number 1 corresponds to light air conditions of 0.3-1.5 m/s [18-90 meters/minute; 0.7–3.4 mph]. Thus, this SOP provides a distribution of wind velocities from 0.1-1.5 m/s [0.2-3.4 mph], the upper limit for “light air” condition on the Beaufort scale and a reasonable upper bound for wind velocities where these products would be used to control flying pests. This windspeed represents a range of values foreseeable in which ORMS may be used (i.e., in a yard or on an outdoor patio where flying pests may pose a nuisance). When wind velocities are higher than 1.5 m/s, ORMS are less likely to be used because of reduced flying pest pressure. The recommended point estimate for use in a deterministic exposure assessment is 0.1 m/s (0.22 mph). The range of air velocities applicable to this assessment are 0.1 m/s to 1.5 m/s.
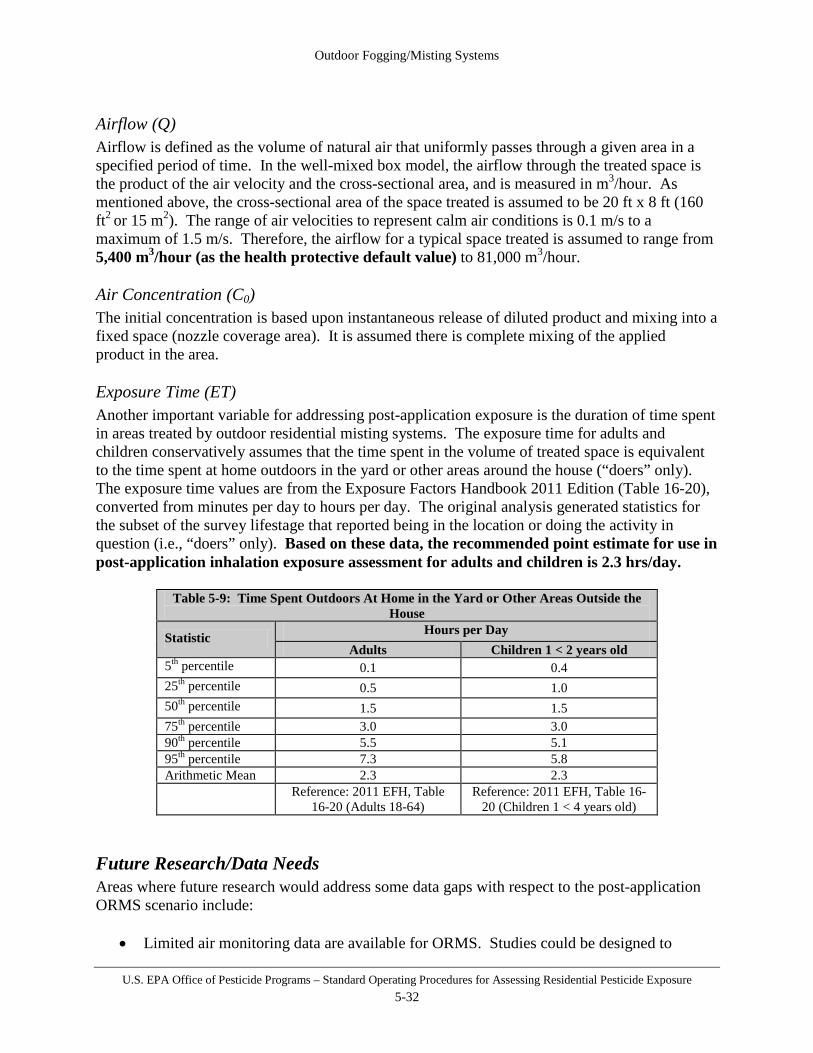
Outdoor Fogging/Misting Systems
U.S. EPA Office of Pesticide Programs – Standard Operating Procedures for Assessing Residential Pesticide Exposure 5-32
Airflow (Q) Airflow is defined as the volume of natural air that uniformly passes through a given area in a specified period of time. In the well-mixed box model, the airflow through the treated space is the product of the air velocity and the cross-sectional area, and is measured in m3/hour. As mentioned above, the cross-sectional area of the space treated is assumed to be 20 ft x 8 ft (160 ft2 or 15 m2). The range of air velocities to represent calm air conditions is 0.1 m/s to a maximum of 1.5 m/s. Therefore, the airflow for a typical space treated is assumed to range from 5,400 m3/hour (as the health protective default value) to 81,000 m3/hour. Air Concentration (C0) The initial concentration is based upon instantaneous release of diluted product and mixing into a fixed space (nozzle coverage area). It is assumed there is complete mixing of the applied product in the area. Exposure Time (ET) Another important variable for addressing post-application exposure is the duration of time spent in areas treated by outdoor residential misting systems. The exposure time for adults and children conservatively assumes that the time spent in the volume of treated space is equivalent to the time spent at home outdoors in the yard or other areas around the house (“doers” only). The exposure time values are from the Exposure Factors Handbook 2011 Edition (Table 16-20), converted from minutes per day to hours per day. The original analysis generated statistics for the subset of the survey lifestage that reported being in the location or doing the activity in question (i.e., “doers” only). Based on these data, the recommended point estimate for use in post-application inhalation exposure assessment for adults and children is 2.3 hrs/day.
Table 5-9: Time Spent Outdoors At Home in the Yard or Other Areas Outside the House
Statistic Hours per Day Adults Children 1 < 2 years old
5th percentile 0.1 0.4 25th percentile 0.5 1.0 50th percentile 1.5 1.5 75th percentile 3.0 3.0 90th percentile 5.5 5.1 95th percentile 7.3 5.8 Arithmetic Mean 2.3 2.3
Reference: 2011 EFH, Table 16-20 (Adults 18-64)
Reference: 2011 EFH, Table 16-20 (Children 1 < 4 years old)
Future Research/Data Needs Areas where future research would address some data gaps with respect to the post-application ORMS scenario include:
• Limited air monitoring data are available for ORMS. Studies could be designed to

Outdoor Fogging/Misting Systems
U.S. EPA Office of Pesticide Programs – Standard Operating Procedures for Assessing Residential Pesticide Exposure 5-33
characterize the air concentration of aerosolized pesticide sprays after misting applications.
• No data are available to characterize the prevalence of outdoor residential misting systems in different regions of the U.S. A survey could be conducted to determine ORMS use patterns.
Exposure Characterization and Data Quality
• The simplifying assumptions implicit in the well-mixed box model identified in the first two paragraphs of Section 5.3.2.1 would be health protective; the modeled air concentrations would dissipate less rapidly (i.e., resulting in higher pesticide concentrations) in the artificially defined fixed volume compared to a true open outdoor space.
• The ORMS exposure scenario makes the health protective assumption that all of the applied pesticide is in the air available for inhalation exposure, and then that all of the applied pesticide settles onto the turf and is available for dermal exposure.
5.3.2.2 Post-application Dermal and Non-dietary Ingestion Exposure Assessment
Dermal and incidental oral post-application exposures are expected to occur after the spray settles onto the treated areas of a yard (e.g., deck, patio, or turf). Based on the data available and the assumptions that would be considered for assessing dermal and non-dietary ingestion exposures from smooth surfaces (e.g., patios and decks) and textured surfaces (e.g., turf/lawns), this SOP makes a health protective assumption that all of the outdoor spray settles onto turf. This settling is assumed to occur in a uniform fashion throughout the treated area, similar to a direct lawn broadcast treatment. While exposure may occur for people of all ages, adults and children 1 < 2 years old are considered the index lifestages based on behavioral characteristics and the strengths and limitations of available data. Once the application rate is determined, the turf transferable residues and resulting dermal and incidental oral exposures should be assessed following the methodologies outlined in Section 3.2. To calculate the residue on turf, use one of the following equations. If application rates are given on the label, these rates should be used. Application rates are typically given in ounces per 1000 ft3. A high-end height estimate of 8 feet is assumed which allows for a smaller turf surface area for the pesticide to be deposited on and, therefore, a higher concentration of residue is available. The following equation can be used to convert the application rate in pounds ai per square foot as is deposited on the turf:
NCV
ARH * D * CF * A.I. * AR H2Olabel= (5.25)
where:
AR = application rate per spray (lb ai/ ft2);

Outdoor Fogging/Misting Systems
U.S. EPA Office of Pesticide Programs – Standard Operating Procedures for Assessing Residential Pesticide Exposure 5-34
ARlabel = application rate on label (in ounces per 1,000 cubic feet) (oz); A.I. = percent active ingredient in product (%); CF = conversion factor to convert ounces to gallons (1 gallon/128 ounces); DH2O = water density (lb/gal); H = height of nozzle (8 ft); and VNC = nozzle coverage volume (ft3).
If application rate is not given on the label, it can be calculated using the following formulas:
NCA
AR H2OD * SD * GPM * DR * A.I.= (5.26)
where:
AR = application rate per spray (lb ai/ft2); A.I. = percent active ingredient in product (%); DR = dilution rate (volume product/volume total solution); GPM = nozzle flowrate (gal/min); SD = spray duration (min); DH2O = water density (lb/gal); and ANC = nozzle coverage area (ft2).
Post-application dermal and non-dietary exposure following applications by outdoor residential misting systems is generally considered short-term in duration, but is dependent on the use pattern of the specific product being assessed and the dissipation/degradation properties of the active ingredient. Refinement of this dose estimate to reflect a more accurate short-term multi-day exposure profile can be accomplished by accounting for the various factors outlined in Sections 1.3.2 and 1.3.4 such as residue dissipation, product-specific re-treatment intervals, and activity patterns. If longer-term assessments (i.e., intermediate-, long-term, or lifetime exposures) are deemed necessary, similar refinements to more accurately reflect the exposure profile are recommended. Post-application Dermal and Non-Dietary Ingestion Algorithm Inputs and Assumptions The following provides a general discussion for each exposure factor and derivation of recommended point estimates for use in exposure assessment. Application Rate (AR) The application rate is the amount of spray applied per unit area times the number of sprays applied per day. The application rate can be determined from product-specific factors that are listed on the label or from generic factors listed above. This application rate needs to be determined on an area basis (i.e., lbs ai applied per square foot) to assess incidental oral and dermal exposures. Dilution Rate (DR)
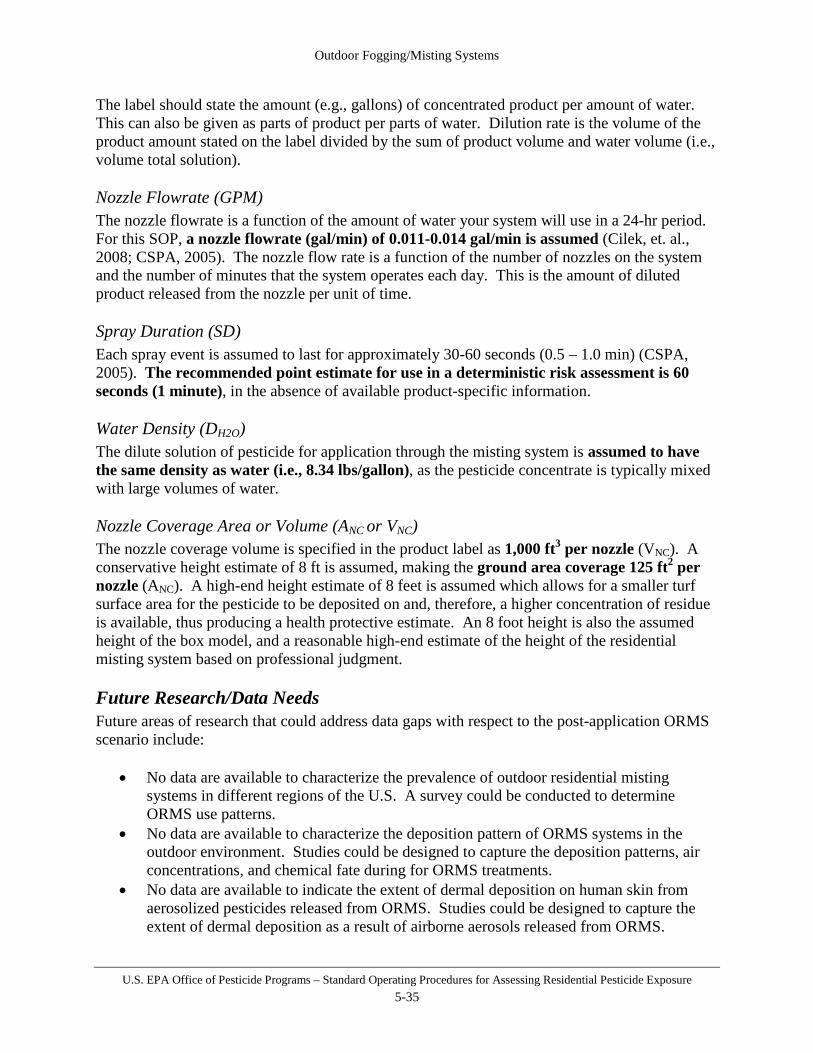
Outdoor Fogging/Misting Systems
U.S. EPA Office of Pesticide Programs – Standard Operating Procedures for Assessing Residential Pesticide Exposure 5-35
The label should state the amount (e.g., gallons) of concentrated product per amount of water. This can also be given as parts of product per parts of water. Dilution rate is the volume of the product amount stated on the label divided by the sum of product volume and water volume (i.e., volume total solution). Nozzle Flowrate (GPM) The nozzle flowrate is a function of the amount of water your system will use in a 24-hr period. For this SOP, a nozzle flowrate (gal/min) of 0.011-0.014 gal/min is assumed (Cilek, et. al., 2008; CSPA, 2005). The nozzle flow rate is a function of the number of nozzles on the system and the number of minutes that the system operates each day. This is the amount of diluted product released from the nozzle per unit of time. Spray Duration (SD) Each spray event is assumed to last for approximately 30-60 seconds (0.5 – 1.0 min) (CSPA, 2005). The recommended point estimate for use in a deterministic risk assessment is 60 seconds (1 minute), in the absence of available product-specific information. Water Density (DH2O) The dilute solution of pesticide for application through the misting system is assumed to have the same density as water (i.e., 8.34 lbs/gallon), as the pesticide concentrate is typically mixed with large volumes of water. Nozzle Coverage Area or Volume (ANC or VNC) The nozzle coverage volume is specified in the product label as 1,000 ft3 per nozzle (VNC). A conservative height estimate of 8 ft is assumed, making the ground area coverage 125 ft2 per nozzle (ANC). A high-end height estimate of 8 feet is assumed which allows for a smaller turf surface area for the pesticide to be deposited on and, therefore, a higher concentration of residue is available, thus producing a health protective estimate. An 8 foot height is also the assumed height of the box model, and a reasonable high-end estimate of the height of the residential misting system based on professional judgment. Future Research/Data Needs Future areas of research that could address data gaps with respect to the post-application ORMS scenario include:
• No data are available to characterize the prevalence of outdoor residential misting systems in different regions of the U.S. A survey could be conducted to determine ORMS use patterns.
• No data are available to characterize the deposition pattern of ORMS systems in the outdoor environment. Studies could be designed to capture the deposition patterns, air concentrations, and chemical fate during for ORMS treatments.
• No data are available to indicate the extent of dermal deposition on human skin from aerosolized pesticides released from ORMS. Studies could be designed to capture the extent of dermal deposition as a result of airborne aerosols released from ORMS.

Outdoor Fogging/Misting Systems
U.S. EPA Office of Pesticide Programs – Standard Operating Procedures for Assessing Residential Pesticide Exposure 5-36
Exposure Characterization and Data Quality • Outdoor Residential Misting Systems typically operate on timed applications or by
remote control activation. The ORMS scenario models residential bystander exposure in that it assumes bystanders are present immediately following a spray event, not during the application.
• The ORMS exposure scenario makes the health protective assumption that all of the applied pesticide is in the air available for inhalation exposure, and then that all of the applied pesticide settles onto the turf and is available for dermal and incidental oral exposure.
5.3.2.3 Combining Post-application Scenarios Risk estimates resulting from different exposure scenarios are combined when it is likely that they can occur simultaneously based on the use pattern and when the toxicological effects across different routes of exposure are the same. When combining scenarios, it is important to fully characterize the potential for co-occurrence as well as characterizing the risk inputs and estimates. Risk estimates should be combined even if any one scenario or route of exposure exceeds the level of concern because this allows for better risk characterization for risk managers. It is likely that children could be exposed to an area treated by ORMS via inhalation, dermal and non-dietary ingestion (hand-to-mouth) routes and that these scenarios could occur simultaneously. Therefore, these exposure scenarios should be combined when toxicological effects are the same across these routes of exposure.
5.4 Animal Barn Misting Systems Animal barn residential misting systems are application systems designed to spray an aerosolized insecticide to kill mosquitoes and other nuisance insects in and around barns. These systems are fed from a central holding tank and utilize an array of spray nozzles to automatically deliver an aerosolized insecticide at specified intervals throughout the day. The spray nozzles are typically mounted between 8-10 feet high. These systems operate automatically (i.e., at preset intervals) or manually (e.g., via remote control or switch). This section provides standard methods for estimating potential doses from pesticides applied using misting systems in animal barns. Adults filling the misting system drums with the pesticide have the potential for dermal and inhalation exposure. Adults and children occupying animal barns following the application of a pesticide using a misting system can experience inhalation, dermal and incidental oral exposure. This section provides the methods for estimating the potential dose for handlers using misting systems, the method for estimating the potential dose from post-application inhalation exposure to a treated barn, as well as the method for estimating residue deposited on hard surfaces following a pesticide treatment from a animal barn misting system which can be used in

Outdoor Fogging/Misting Systems
U.S. EPA Office of Pesticide Programs – Standard Operating Procedures for Assessing Residential Pesticide Exposure 5-37
conjunction with methods outlined in Section 3.2 source not found to estimate dermal and oral post-application doses following direct applications to indoor surfaces.
5.4.1 Handler Exposure Assessment Barn misters are typically marketed as systems that include a mix tank, a timer-controlled pump, and fixed plumbing that run to the spray nozzles. The systems are generally expected to be professionally installed and include a service contract to cover maintenance and insecticide refilling. However, it is possible for a residential user to purchase pesticide concentrates and load the drum/holding tank to refill these systems. Therefore, a residential handler scenario may be necessary. This section provides a standard method for completing handler exposure assessments for adults who are mixing and loading insecticides to be used in barn misting systems. The basis for this scenario is that handler exposure occurs as the pesticide is poured into the drum by the handler holding the product container; no applicator scenario is required to be assessed as the misting nozzles spray the pesticide in the treatment area automatically (without contact with the residential handlers). This scenario assumes that pesticides are available to be inhaled or have the potential to contact the skin during the mixing and loading of the pesticide products in drums/holding tanks as part of the barn misting system. It is assumed that only individuals 16 years of age or older mix and load (i.e., handle) pesticides. The method to determine handler inhalation and dermal exposure to pesticides from these activities relies on data measuring dermal and inhalation exposure during mixing and loading (e.g., pouring a liquid pesticide). Thus, this method should be used in the absence of chemical-specific data, or as a supplement to estimates based on chemical-specific data. Dermal and Inhalation Handler Exposure Algorithm As described in Section 1.3.3, daily dermal and inhalation exposure (mg/day) for residential pesticide handlers, for a given formulation-application method combination, is estimated by multiplying the formulation-application method-specific unit exposure by an estimate of the amount of active ingredient handled in a day, using the equation below: E = UE * AR (5.27) where:
E = exposure (mg/day); UE = unit exposure (mg/lb ai); and AR = application rate (lb ai/day).
The application rate can be calculated as follows: AR = VD * N * DR * A.I. * DH2O (5.28)
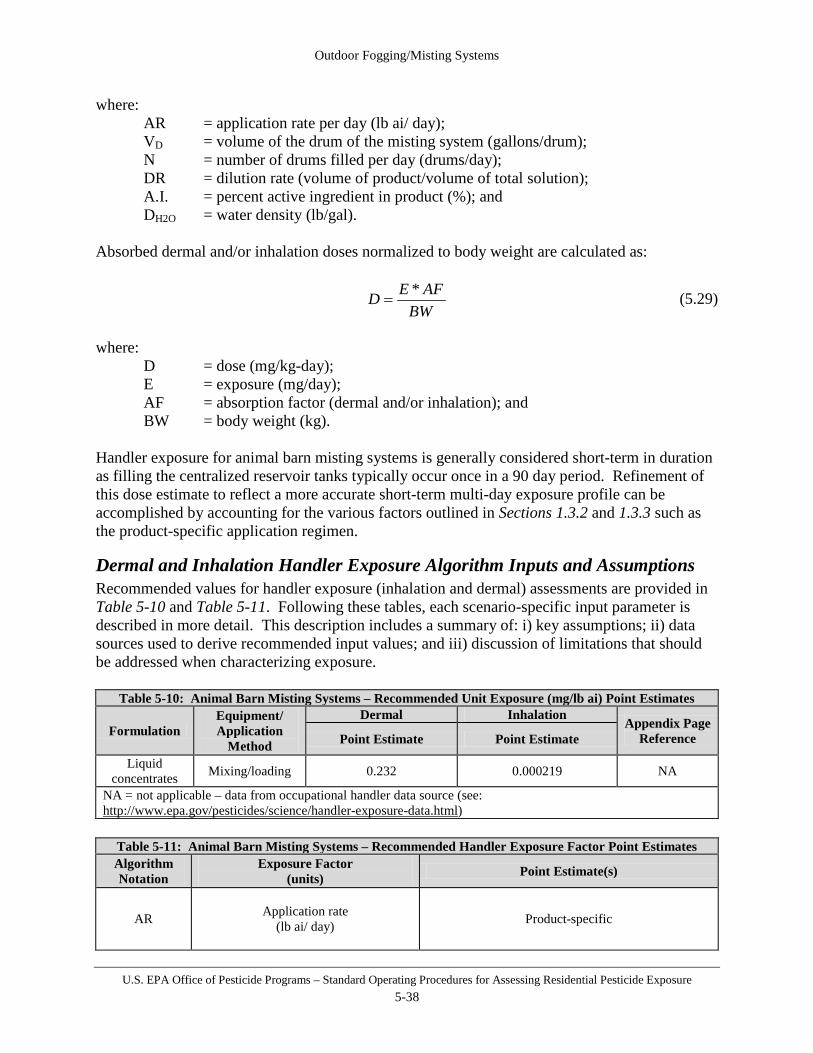
Outdoor Fogging/Misting Systems
U.S. EPA Office of Pesticide Programs – Standard Operating Procedures for Assessing Residential Pesticide Exposure 5-38
where: AR = application rate per day (lb ai/ day); VD = volume of the drum of the misting system (gallons/drum); N = number of drums filled per day (drums/day); DR = dilution rate (volume of product/volume of total solution); A.I. = percent active ingredient in product (%); and DH2O = water density (lb/gal).
Absorbed dermal and/or inhalation doses normalized to body weight are calculated as:
BW
AFED *= (5.29)
where:
D = dose (mg/kg-day); E = exposure (mg/day); AF = absorption factor (dermal and/or inhalation); and BW = body weight (kg).
Handler exposure for animal barn misting systems is generally considered short-term in duration as filling the centralized reservoir tanks typically occur once in a 90 day period. Refinement of this dose estimate to reflect a more accurate short-term multi-day exposure profile can be accomplished by accounting for the various factors outlined in Sections 1.3.2 and 1.3.3 such as the product-specific application regimen.
Dermal and Inhalation Handler Exposure Algorithm Inputs and Assumptions Recommended values for handler exposure (inhalation and dermal) assessments are provided in Table 5-10 and Table 5-11. Following these tables, each scenario-specific input parameter is described in more detail. This description includes a summary of: i) key assumptions; ii) data sources used to derive recommended input values; and iii) discussion of limitations that should be addressed when characterizing exposure.
Table 5-10: Animal Barn Misting Systems – Recommended Unit Exposure (mg/lb ai) Point Estimates
Formulation Equipment/ Application
Method
Dermal Inhalation Appendix Page Reference Point Estimate Point Estimate
Liquid concentrates Mixing/loading 0.232 0.000219 NA
NA = not applicable – data from occupational handler data source (see: http://www.epa.gov/pesticides/science/handler-exposure-data.html)
Table 5-11: Animal Barn Misting Systems – Recommended Handler Exposure Factor Point Estimates Algorithm Notation
Exposure Factor (units) Point Estimate(s)
AR Application rate (lb ai/ day) Product-specific

Outdoor Fogging/Misting Systems
U.S. EPA Office of Pesticide Programs – Standard Operating Procedures for Assessing Residential Pesticide Exposure 5-39
Table 5-11: Animal Barn Misting Systems – Recommended Handler Exposure Factor Point Estimates
DH20 Density of product
(lb/gal) 8.34
VD Volume of Drum (gallons/drum) 55
DR Dilution Rate (volume of product / volume of total solution) Product-specific
N Number of drums filled per day (drums/day) 1
A.I. Percent ai in product concentrate (%) Product-specific
BW Body weight (kg) 80
Unit Exposure (UE) As described in Section 1.3.3, the unit exposure is the ratio between exposure and the amount of active ingredient handled for a given formulation/application method combination, with units mass exposure per mass active ingredient handled (e.g., mg ai exposure/lb ai handled). Drum Volume (VD) The default assessment can provide risk estimates based on three typical drum/holding tank sizes (30, 55, or 125 gallons) as part of the animal barn misting system, unless additional scenario-specific information is provided on the product labels. The 30 and 55 gallon drums represent likely configurations of a residential animal barn misting system and the 55 and 125 gallon systems represent likely configurations of the commercial stable animal misting system. Number of Drums Filled per Day (N) One drum is assumed to be filled per day on an episodic basis, as residential misting systems are likely only connected to one drum. Dilution Rate (DR) The label should state the amount (e.g., gallons) of concentrated product per amount of water. This can also be given as parts of product per parts of water. Dilution rate is the volume of the product amount stated on the label divided by the sum of product volume and water volume (i.e., volume total solution). For example, a 1:3 dilution would be a 0.25 dilution rate. Water Density (DH2O) Pesticide products used in misting systems are typically mixed with large volumes of water. Therefore, the dilute insecticide solution applied through the misting system is assumed to have the same density as water (i.e., 8.34 lbs/gallon). Future Research/Data Needs Future research that could address data needs with respect to the animal barn misting system scenario include:
• survey data that could be produced to examine the prevalence of these systems in the

Outdoor Fogging/Misting Systems
U.S. EPA Office of Pesticide Programs – Standard Operating Procedures for Assessing Residential Pesticide Exposure 5-40
United States. • Information detailing the breakdown of maintenance (i.e., characterizing the percentage
of systems that are professional maintained versus homeowner maintained), and • equipment type (i.e., how often the systems are refilled/reloaded, and the spray frequency
of these systems) could be useful to fully characterize the residential handler exposure potential.
Exposure Characterization and Data Quality
Unit Exposures • The unit exposures used for this scenario are from the “All Liquids, Open Mixing and
Loading” Scenario in EPA’s Occupational Pesticide Handler Unit Exposure Surrogate Reference Table (http://www.epa.gov/pesticides/science/handler-exposure-table.pdf). The use of occupational exposure data may overestimate homeowner exposure. Additionally, the values were adjusted to represent the type of clothing a homeowner or non-professional residential handler would wear (i.e., short-sleeved shirt, shorts and no chemical-resistant gloves) and are the best available data set for determining residential exposures during open pouring with liquid chemicals.
• The underlying assumption of the use of exposure data as unit exposures – proportionality between the amount of active ingredient handled and exposure – is uncertain, though potentially conservative. However, as a prediction mechanism, it is considered practical and useful for the purposes of handler exposure assessment in a regulatory context. It provides a straightforward handler exposure calculation method and enables risk mitigation in the form of formulation comparison and decreased application rates.
• The extent to which an individual’s exposure (expressed via unit exposures) varies day-to-day or application-to-application is unknown; therefore, the assumption that there is no variation when assessing longer-term exposure durations is considered conservative.
5.4.2 Post-application Exposure Assessment Post-application exposure can result from presence in residential barns or commercial stables following pesticide applications. While exposure may occur for people of all ages, adults and children 3 < 6 years old are considered the index lifestage depending on the exposure scenario based on behavioral characteristics and the strengths and limitations of available data. This section addresses standard methods for estimating exposure and dose for three post-application exposure pathways resulting from time spent in animal barns that have previously been treated by a misting system:
• Section 5.4.2.1 - adult/children 3 < 6 years old inhalation exposure; and, • Section 5.4.2.2 - adult/children 3 < 6 years old dermal and children 3 < 6 years old non-
dietary ingestion exposure.

Outdoor Fogging/Misting Systems
U.S. EPA Office of Pesticide Programs – Standard Operating Procedures for Assessing Residential Pesticide Exposure 5-41
5.4.2.1 Post-application Inhalation Exposure Assessment
This section provides a standard method for completing post-application inhalation exposure assessments for adults and children after a pesticide treatment in a animal barn. The basis for this scenario is that inhalation exposure occurs from the airborne aerosols released by mister nozzles. As with the ORMS scenario, the well-mixed box (WMB) model was used to develop the exposure equation for the animal barn misting systems post-application inhalation scenario11. The WMB model incorporates a number of simplifying assumptions: fresh air (having no pesticide concentration) enters the box at a constant airflow rate (based on the number of air changes per hour), a turbulent internal airflow thoroughly mixes the fresh air with the pesticide-laden air resulting in a uniform pesticide air concentration within the box, and the perfectly mixed air exits the box at the same constant airflow rate (i.e., the inflow rate equals the outflow rate). Thus, the indoor area where the aerosol is being applied (i.e., barn) is assumed to be in an enclosed box, which is a reasonable assumption for a walled, indoor space. This scenario assumes instantaneous spray releases; that is, the total amount of aerosol released at each spray event is modeled to occur instantaneously. The evacuation of the aerosol from the box depends on airflow. For an indoor scenario, the airflow is the product of the volume of the treated space and the number of air changes per hour, ACH. The WMB model developed for this scenario models the pesticide air concentrations after multiple instantaneous aerosol spray releases at regular time intervals12. Only dissipation due to airflow into and out of the box is modeled. For the inhalation route of exposure, the point of departure (POD) could be based on the reference concentration (RfC) methodology. In the RfC methodology, air concentrations are not converted to doses, rather, risks are assessed on the basis of comparison of exposure concentrations with reference concentrations typically determined from animal studies. This approach is not always available for every chemical; therefore, the exposure assessor should discuss the possibility of this approach with a toxicologist. Post-Application Inhalation Exposure Algorithm Post-application inhalation exposure for adults/children resulting from animal barns that have been previously treated with pesticide can be calculated using the following equations (See Section D.3.4 of Appendix D for equation description and derivation): (5.30) where:
E = exposure (mg/day); IR = inhalation rate (m3/hr); ACH = air changes per hour (hour-1);
11 For the ORMS and animal barn scenarios, the WMB models describing the air concentrations over time have the same form. The parameterization of these models is the only difference. For the ORMS scenario, the decay rate constant is specified by the ratio of the airflow rate and the volume of the treated space; whereas for the animal barn scenario, the decay rate constant is specified by the air changes per hour. 12 The regular spray applications are assumed to continue for the entire time spent inside the animal barn.
ACHPRETCIRE ⋅⋅⋅
= 0
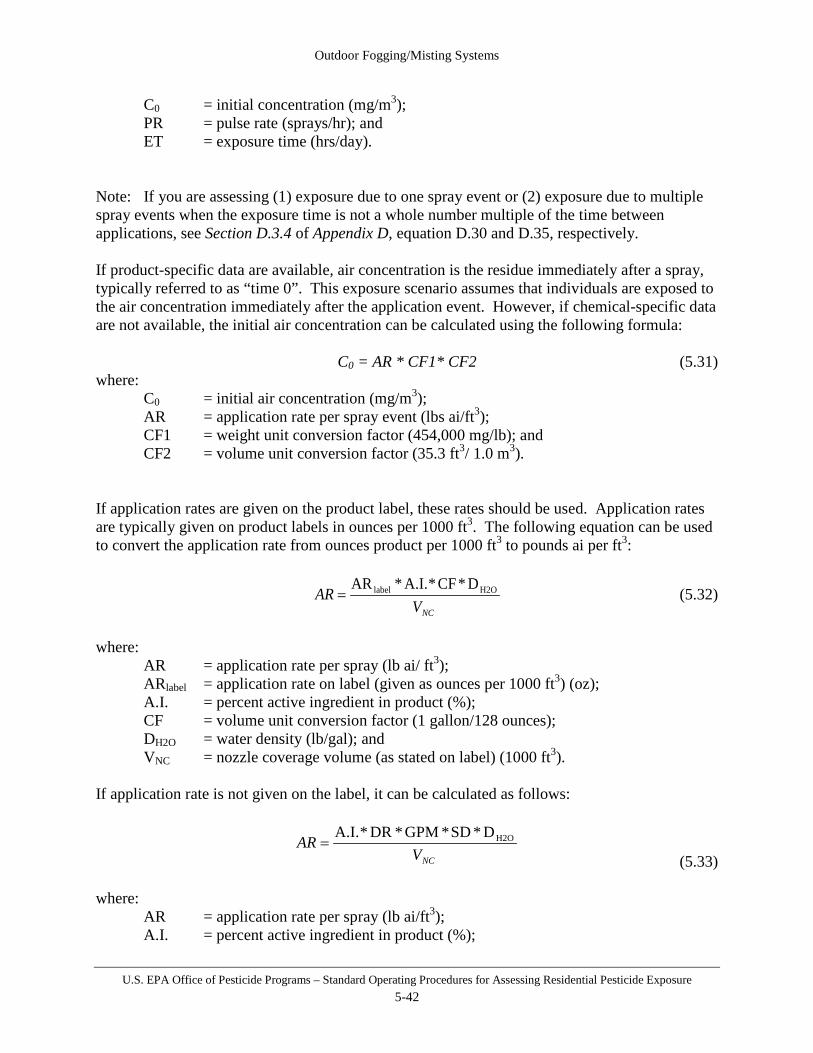
Outdoor Fogging/Misting Systems
U.S. EPA Office of Pesticide Programs – Standard Operating Procedures for Assessing Residential Pesticide Exposure 5-42
C0 = initial concentration (mg/m3); PR = pulse rate (sprays/hr); and ET = exposure time (hrs/day).
Note: If you are assessing (1) exposure due to one spray event or (2) exposure due to multiple spray events when the exposure time is not a whole number multiple of the time between applications, see Section D.3.4 of Appendix D, equation D.30 and D.35, respectively.
If product-specific data are available, air concentration is the residue immediately after a spray, typically referred to as “time 0”. This exposure scenario assumes that individuals are exposed to the air concentration immediately after the application event. However, if chemical-specific data are not available, the initial air concentration can be calculated using the following formula: C0 = AR * CF1* CF2 (5.31) where:
C0 = initial air concentration (mg/m3); AR = application rate per spray event (lbs ai/ft3); CF1 = weight unit conversion factor (454,000 mg/lb); and CF2 = volume unit conversion factor (35.3 ft3/ 1.0 m3).
If application rates are given on the product label, these rates should be used. Application rates are typically given on product labels in ounces per 1000 ft3. The following equation can be used to convert the application rate from ounces product per 1000 ft3 to pounds ai per ft3:
NCV
AR H2Olabel D * CF * A.I. * AR= (5.32)
where:
AR = application rate per spray (lb ai/ ft3); ARlabel = application rate on label (given as ounces per 1000 ft3) (oz); A.I. = percent active ingredient in product (%); CF = volume unit conversion factor (1 gallon/128 ounces); DH2O = water density (lb/gal); and VNC = nozzle coverage volume (as stated on label) (1000 ft3).
If application rate is not given on the label, it can be calculated as follows:
(5.33) where:
AR = application rate per spray (lb ai/ft3); A.I. = percent active ingredient in product (%);
NCVAR H2OD * SD * GPM * DR *A.I.
=
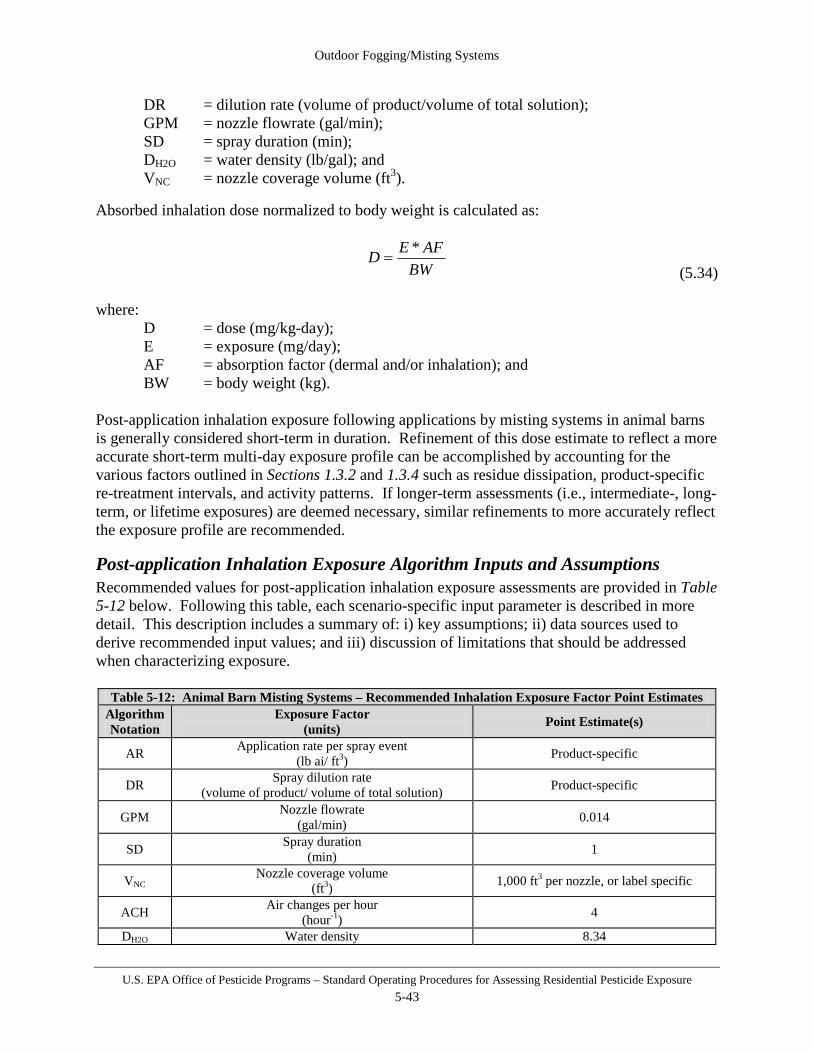
Outdoor Fogging/Misting Systems
U.S. EPA Office of Pesticide Programs – Standard Operating Procedures for Assessing Residential Pesticide Exposure 5-43
DR = dilution rate (volume of product/volume of total solution); GPM = nozzle flowrate (gal/min); SD = spray duration (min); DH2O = water density (lb/gal); and VNC = nozzle coverage volume (ft3).
Absorbed inhalation dose normalized to body weight is calculated as:
BWAFED *
= (5.34)
where:
D = dose (mg/kg-day); E = exposure (mg/day); AF = absorption factor (dermal and/or inhalation); and BW = body weight (kg).
Post-application inhalation exposure following applications by misting systems in animal barns is generally considered short-term in duration. Refinement of this dose estimate to reflect a more accurate short-term multi-day exposure profile can be accomplished by accounting for the various factors outlined in Sections 1.3.2 and 1.3.4 such as residue dissipation, product-specific re-treatment intervals, and activity patterns. If longer-term assessments (i.e., intermediate-, long-term, or lifetime exposures) are deemed necessary, similar refinements to more accurately reflect the exposure profile are recommended.
Post-application Inhalation Exposure Algorithm Inputs and Assumptions Recommended values for post-application inhalation exposure assessments are provided in Table 5-12 below. Following this table, each scenario-specific input parameter is described in more detail. This description includes a summary of: i) key assumptions; ii) data sources used to derive recommended input values; and iii) discussion of limitations that should be addressed when characterizing exposure.
Table 5-12: Animal Barn Misting Systems – Recommended Inhalation Exposure Factor Point Estimates Algorithm Notation
Exposure Factor (units) Point Estimate(s)
AR Application rate per spray event (lb ai/ ft3) Product-specific
DR Spray dilution rate (volume of product/ volume of total solution) Product-specific
GPM Nozzle flowrate (gal/min) 0.014
SD Spray duration (min) 1
VNC Nozzle coverage volume
(ft3) 1,000 ft3 per nozzle, or label specific
ACH Air changes per hour (hour-1) 4
DH2O Water density 8.34

Outdoor Fogging/Misting Systems
U.S. EPA Office of Pesticide Programs – Standard Operating Procedures for Assessing Residential Pesticide Exposure 5-44
Table 5-12: Animal Barn Misting Systems – Recommended Inhalation Exposure Factor Point Estimates (lb/gal)
PR Pulse Rate (sprays/hr) 1 spray event per hour
C0 Initial air concentration
(mg/m3) Calculated; Concentration at time “0”
ET Exposure time (hr/day)
Adult 4 Children 3 < 6 years old 2
IR Inhalation rate (m3/hour)
Adult 0.64 Children 3 < 6 years old 0.42
BW Body weight (kg)
Adult 80 Children 3 < 6 years old 19
Application Rate (AR) The application rate is the amount of spray applied per unit volume per spray event. The application rate can be determined from product specific factors that are listed on the label or from generic factors listed above. This application rate needs to be determined on a volume basis (i.e., lb ai applied per 1000 cubic feet) to determine inhalation exposures. Dilution Rate (DR) The label should state the amount (e.g., gallons) of concentrated product per amount of water. This can also be given as parts of product per parts of water. Dilution rate is the volume of the product amount stated on the label divided by the sum of product volume and water volume (i.e., volume total solution). Nozzle Flowrate (GPM) The nozzle flowrate is a function of the amount of water the system will use in a 24 hr period. A nozzle flowrate (gal/min) of 0.011-0.014 gal/min is assumed (CSPA, 2005; Cilek, et. al., 2008). The nozzle flow rate is a function of the number of nozzles on the system and the number of minutes that the system operates each day. This is the amount of dilute pesticide spray released from the nozzle per unit of time. Spray Duration (SD) Each spray event is assumed to last for approximately 30-60 seconds (0.5 – 1.0 min) (CSPA, 2005). The recommended point estimate for use in a deterministic risk assessment is 60 seconds (1 minute). Nozzle Coverage Volume (VNC) The nozzle coverage volume is specified in the product label. If no volume is specified, it is assumed that the nozzle coverage area is 1,000 ft3 per nozzle (CSPA, 2005; Cilek, et. al., 2008). The range is 880-1440 ft3. Air Changes per Hour (ACH) Air changes per hour is the rate that air within an indoor environment is replaced by outdoor air. For a typical barn, the air exchange rate ranges between 4 and 8 air changes per hour. This is the ratio of the airflow over the volume of space (Q/V). Typical equine references suggest this
Outdoor Fogging/Misting Systems
U.S. EPA Office of Pesticide Programs – Standard Operating Procedures for Assessing Residential Pesticide Exposure 5-45
range of air changes per hour to maintain fresh air conditions and good air quality in the more challenging stable environments. A lower number of air changes per hour reflect winter conditions and a higher number of air changes represent warmer weather conditions (Horse Stable Ventilation Publication, Penn State University 2003). Water Density (DH2O) Pesticide products used in these systems are typically mixed with large volumes of water. Therefore, the dilute pesticide solution applied through the misting system is assumed to have the same density as water (i.e., 8.34 lbs/gallon). Air Concentration (C0) The initial concentration is based upon instantaneous release of diluted product and mixing into a fixed space (nozzle coverage area). It is assumed there is complete mixing of the applied product in the area. Pulse Rate (PR): Number of Spray Events per Hour The number of spray events per hour is label-specific. A default value of 1 spray event per hour will be assumed when no product-specific data are available (CSPA, 2005). Based on an evaluation of product information, this value is considered a health protective assumption. Exposure Time (ET) The exposure time of adults who spend time in and around animal barns is 4 hours per day in the treated space. Children are assumed to spend 2 hours per day in the treated space. These recommended exposure time values are based on a study that examined the relationship between respiratory problems and time spent in animal barns (Mazan, 2009). In this study, it was reported that anecdotal evidence suggests that casual riders are unlikely to spend more than 1-2 hours per day and a total 2-5 days per week in a barn. Based on this anecdotal evidence, 4 hours per day is believed to be a conservative estimate of time spent inside an animal barn for the adult rider who also performs some non-occupational barn-related tasks. Similarly, since casual child riders are likely to spend less time performing non-riding activities than adults, 2 hours per day is believed to be a conservative estimate for children. Future Research/Data Needs There are three main research/data needs with respect to the post-application animal barn misting system scenario.
• Limited air monitoring data are available for animal barn misting systems. Studies could be designed to characterize the air concentration of aerosolized pesticide sprays.
• No data are available to characterize the prevalence of animal barn misting systems in different regions of the U.S. A survey could be conducted to determine animal barn misting system use patterns.
• No data are available to determine how much time a person spends in a residential animal barn and a commercial animal stable. A time-activity survey could be conducted to determine the breakdown of activities and time spent in animal barns.

Outdoor Fogging/Misting Systems
U.S. EPA Office of Pesticide Programs – Standard Operating Procedures for Assessing Residential Pesticide Exposure 5-46
Exposure Characterization and Data Quality • Animal Barn Misting Systems typically operate on timed applications or by remote
control activation. The scenario models residential post-application inhalation exposure and it assumes individuals are present immediately following a spray event, not during the application.
5.4.2.2 Post-application Dermal and Non-Dietary Ingestion Exposure Assessment
For pesticide use in an animal barn misting system, there is potential for post-application dermal and incidental oral exposure once the aerosol settles on surfaces inside the barn. A person could potentially be exposed to these residues when cleaning the barn, taking out equipment, and interacting with animals housed in barns. Dermal and incidental oral post-application exposures are expected to occur after the spray settles onto the areas inside the barn. While exposure may occur for people of all ages, adults and children 3 < 6 years old are considered to be the most representative index lifestages for the animal barn misting system scenarios. This assumption is based on the behavioral characteristics of the index lifestages, safety rules and precautions inside animal barns, and the strengths and limitations of available data. Aerosol settling is assumed to occur in a uniform fashion throughout the treated area, and exposure is assumed to be similar to a broadcast indoor treatment. The indoor post-application exposure scenario should be used as a surrogate to assess animal barn hard surfaces after a broadcast treatment. Thus, once the animal barn application rate is determined, the barn’s surface transferable residues and resulting dermal and incidental oral exposures should be assessed following the methodologies outlined in Section 7.2, with some exposure inputs more specific to animal barn circumstances. While the indoor post-application scenario assigns children 1 < 2 years old as the index lifestage, the index lifestage for animal barns is children 3 < 6 years old; thus, the transfer coefficient and body weight inputs should be representative of children 3 < 6 years old. In addition, exposure time (“ET”) should be the same as that used in the animal barn misting system post-application inhalation exposure assessment (Section 5.4.2.1). To calculate the residue on indoor hard surfaces, use one of the following equations. If application rates are given on the label, these rates should be used. Application rates are typically given in ounces per 1000 ft3. A high-end height estimate of 8 feet is assumed which allows for a smaller turf surface area for the pesticide to be deposited on and, therefore, a higher concentration of residue is available. The following equation can be used to convert the application rate in pounds ai per square foot as is deposited on indoor surfaces:
NCV
AR H *CF2* D * CF1 * A.I. * AR H2Olabel= (5.35)

Outdoor Fogging/Misting Systems
U.S. EPA Office of Pesticide Programs – Standard Operating Procedures for Assessing Residential Pesticide Exposure 5-47
where: AR = application rate per spray (lb ai/ cm2); ARlabel = application rate on label (in ounces per 1,000 cubic feet) (oz); A.I. = percent active ingredient in product (%); CF1 = conversion factor to convert ounces to gallons (1 gallon/128 ounces); DH2O = water density (lb/gal); CF2 = conversion factor (1 ft2/929 cm2); H = height of nozzle (8 ft); and VNC = nozzle coverage volume (ft3).
If application rate is not given on the label, it can be calculated using the following formulas:
NCA
AR H2OD* CF * SD * GPM * DR * A.I.= (5.36)
where:
AR = application rate per spray (lb ai/cm2); A.I. = percent active ingredient in product (%); DR = dilution rate (volume product/volume total solution); GPM = nozzle flowrate (gal/min); SD = spray duration (min); CF = conversion factor (1 ft2/929 cm2); DH2O = water density (lb/gal); and ANC = nozzle coverage area (ft2).
Post-application dermal exposure following applications by animal barn misting systems is generally considered short-term in duration. Refinement of this dose estimate to reflect a more accurate short-term multi-day exposure profile can be accomplished by accounting for the various factors outlined in Sections 1.3.2 and 1.3.4 such as residue dissipation, product-specific re-treatment intervals, and activity patterns. If longer-term assessments (i.e., intermediate-, long-term, or lifetime exposures) are deemed necessary, similar refinements to more accurately reflect the exposure profile are recommended. Post-application Dermal and Non-Dietary Ingestion Algorithm Inputs and Assumptions The following provides a general discussion for each exposure factor and derivation of recommended point estimates for use in exposure assessment. Application Rate (AR) The application rate is the amount of spray applied per unit area times the number of sprays applied per day. The application rate can be determined from product specific factors that are listed on the label or from generic factors listed above. This application rate needs to be determined on an area basis (i.e., lbs ai applied per square centimeter) to assess incidental oral and dermal exposures.

Outdoor Fogging/Misting Systems
U.S. EPA Office of Pesticide Programs – Standard Operating Procedures for Assessing Residential Pesticide Exposure 5-48
Dilution Rate (DR) The label should state the amount (e.g., gallons) of concentrated product per amount of water. This can also be given as parts of product per parts of water. Dilution rate is the volume of the product amount stated on the label divided by the sum of product volume and water volume (i.e., volume total solution). Nozzle Flowrate (GPM) The nozzle flowrate is a function of the amount of water your system will use in a 24-hr period. A nozzle flowrate (gal/min) of 0.011-0.014 gal/min is assumed (Cilek, et. al., 2008; CSPA, 2005). The nozzle flow rate is a function of the number of nozzles on the system and the number of minutes that the system operates each day. This is the amount of diluted product released from the nozzle per unit of time. Spray Duration (SD) Each spray event is assumed to last for 30-60 seconds approximately (0.5 – 1.0 min) (CSPA, 2005). The recommended point estimate for use in a deterministic risk assessment is 60 seconds (1 minute). Water Density (DH2O) The dilute solution of pesticide for application through the misting system is assumed to have the same density as water (i.e., 8.34 lbs/gallon), as the pesticide concentrate is typically mixed with large volumes of water. Nozzle Coverage Area or Volume (ANC or VNC) The nozzle coverage volume is specified in the product label as 1,000 ft3 per nozzle (VNC). A conservative height estimate of 8 ft is assumed, making the ground area coverage 125 ft2 per nozzle (ANC). A high-end height estimate of 8 feet is assumed which allows for a smaller turf surface area for the pesticide to be deposited on and, therefore, a higher concentration of residue is available, thus making the exposure estimate health-protective. An 8 foot height is also the assumed height of the box model, and a reasonable high end estimate of the height of the residential animal barn misting system based on professional judgment. Transfer Coefficient The transfer coefficient (TC) provides a measure of surface-to-skin residue transfer and is derived from concurrent measurements of exposure and surface residue. Specifically, the TC is the ratio of exposure rate, measured in mass of chemical per time (e.g., µg/hr), to residue, measured in mass of chemical per foliar surface area (e.g., µg/cm2). As the indoor environments scenario represents the best surrogate for the animal barn scenario, the transfer coefficients outlined in Section 7.2.2.1 should be utilized. For adults, the recommended transfer coefficient is therefore 6,800 cm2/hr as shown in Table 7-10: Transfer coefficients (TC; cm2/hr). For children 3 < 6 years old, the index lifestage for this scenario, the transfer coefficient is 2,700 cm2/hr (calculated using the adult TC and the corresponding adjustement factor, 0.39, shown in Table 2-4). Exposure Time (ET)

Outdoor Fogging/Misting Systems
U.S. EPA Office of Pesticide Programs – Standard Operating Procedures for Assessing Residential Pesticide Exposure 5-49
Though the indoor environments exposure scenario methodology is the best surrogate for post-application exposures in animal barns, some inputs, including exposure time, are different. The exposure time of adults who spend time in and around animal barns is 4 hours per day in the treated space. Children are assumed to spend 2 hours per day in the treated space. These recommended exposure time values are based on a study that examined the relationship between respiratory problems and time spent in animal barns (Mazan, 2009). In this study, it was reported that anecdotal evidence suggests that casual riders are unlikely to spend more than 1-2 hours per day and a total 2-5 days per week in a barn. Based on this anecdotal evidence, 4 hours per day is believed to be a conservative estimate of time spent inside an animal barn for the adult rider who also performs some non-occupational barn-related tasks. Similarly, since casual child riders are likely to spend less time performing non-riding activities than adults, 2 hours per day is believed to be a conservative estimate for children. Future Research/Data Needs There are three main research/data needs with respect to the post-application animal barn scenario.
• No data are available to characterize the prevalence of animal barn misting systems in different regions of the U.S. A survey could be conducted to determine animal barn misting systems use patterns.
• No data are available to characterize the deposition pattern of animal barn misting systems. Studies could be designed to capture the deposition patterns on hard surfaces for animal barn misting systems and residue available for transfer.
• No data are available to indicate the extent of dermal deposition on human skin from aerosolized pesticides released from animal barn misting systems. Studies could be designed to capture the extent of dermal deposition as a result of airborne aerosols released from animal barn misting systems.
Exposure Characterization and Data Quality
• Animal Barn Misting Systems typically operate on timed applications or by remote control activation. The animal barn scenario models residential post-application exposure and assumes individuals are present immediately following a spray event, not during the application.
• The animal barn exposure scenario makes the health protective assumption that all the amount of the applied pesticide is in the air available for inhalation exposure, and that all the amount of the applied pesticide settles onto the ground in the barn and is also available for dermal and incidental oral exposure.
• Quantitative dermal post-application exposure assessment is assumed to be health-protective for animal barn misting systems. Persons are not likely to be participating in activities on animal barn floors that would result in significant contact and/or transferable residue available for dermal exposure, such as the indoor activities assumed as part of the indoor hard surface post-application dermal assessment. Therefore, the surrogate post-application dermal methodology (derived as part of the Indoor Environments SOP) is a health protective surrogate to estimate animal barn post-application dermal exposure.
• Non-dietary ingestion post-application exposure is expected to be minimal compared to

Outdoor Fogging/Misting Systems
U.S. EPA Office of Pesticide Programs – Standard Operating Procedures for Assessing Residential Pesticide Exposure 5-50
the post-application dermal and inhalation exposure. It is expected that those children entering animal barns are typically under adult supervision. Therefore, a quantitative assessment of hand-to-mouth exposure is health protective.
5.4.2.3 Combining Post-application Scenarios Risk estimates resulting from different exposure pathways are combined when it is likely that they can occur simultaneously based on the use pattern, the behavior associated with the exposed lifestage, and when the toxicological effects across different routes of exposure are the same. When combining scenarios, it is important to fully characterize the potential for co-occurrence as well as characterizing the risk inputs and estimates. Risk estimates should be combined even if any one scenario or route of exposure exceeds the level of concern because this allows for better risk characterization for risk managers. For animal barn misting system scenarios, it is likely that children could be exposed to an area treated via the inhalation, dermal and non-dietary ingestion (hand-to-mouth) routes. Therefore, these exposure scenarios should be considered and combined, if appropriate, when toxicological effects are the same across these routes of exposure.

Insect Repellents
U.S. EPA Office of Pesticide Programs – Standard Operating Procedures for Assessing Residential Pesticide Exposure 6-1
Section 6 Insect Repellents
This section provides an outline of the procedures used to assess, estimate and characterize exposures resulting from the use of personal insect repellents available in many formulations such as aerosol sprays, lotions, pump sprays, gels, towelettes and wrist bands. It also includes repellents formulated with sunscreens. Other repellent-type products are covered under separate sections such as mosquito coils (Section 5.2), misting systems (Section 5.1), or repellent-impregnated clothing or textiles (Section 9). Exposure results from deliberate application to the skin and clothing of individuals. Repellent use can be on the order of days or weeks or longer, depending on the activity pattern and geographic area. Insect repellents are used on people of all ages. While exposure may occur for people of all ages, considering the strengths and limitations of available data and behavioral characteristics of potentially exposed lifestages, adults and children 1 < 2 years old are considered the index lifestages whose exposure assessments are expected to encompass those for all lifestages. Repellents are all “ready-to-use” (i.e., there is no mixing of liquid concentrates or powders) and are sprayed or otherwise applied onto the skin or clothing. The individual applying insect repellents is, for the purposes of this section, the “handler”. Adults are assumed to experience both dermal and inhalation handler exposure, as well as post-application dermal and, potentially, inhalation exposure. Adults are assumed to apply repellents to themselves or to others. However, for aerosol and pump-spray repellents, individuals to whom the products are being applied can experience indirect inhalation exposure during the application. For children, post-application exposure consists of dermal, (potentially) inhalation, and hand-to-mouth exposure.
6.1 Handler Exposure Assessment
Unlike other pesticide applications, “handler” and “post-application” exposures resulting from repellent applications are not truly separate events since many applications are self-applications. Therefore, for the purposes of this SOP, “handler” dermal exposure can be considered in concert with “post-application” dermal exposure (i.e., dermal exposure is only assessed as part of the post-application dermal scenario). However, for aerosol and pump-sprayer repellent products, inhalation exposure for adults and children during the application process is possible and can be assessed under the standard “handler” process described below. Dermal and Inhalation Handler Exposure Algorithm As described in Section 1.3.3, daily dermal and inhalation exposure (mg/day) for residential pesticide handlers, for a given formulation-application method combination, is estimated by multiplying the formula-application method-specific unit exposure by an estimate of the amount of active ingredient handled in a day, using the equation below:
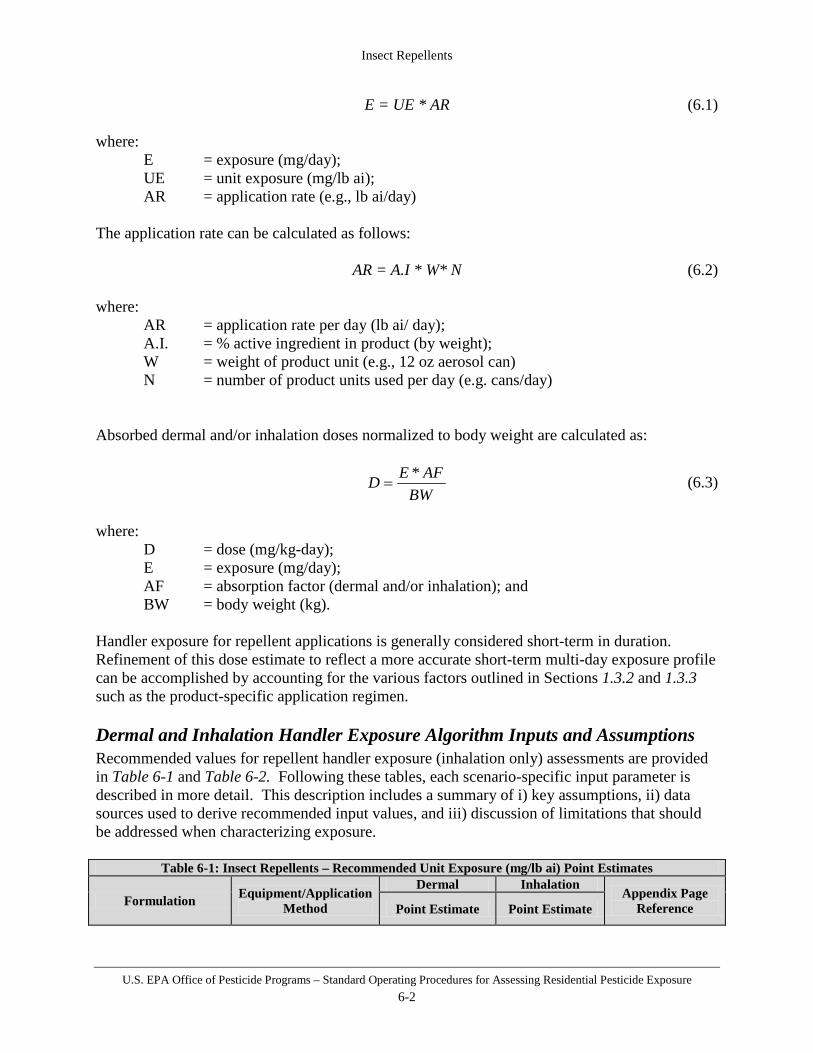
Insect Repellents
U.S. EPA Office of Pesticide Programs – Standard Operating Procedures for Assessing Residential Pesticide Exposure 6-2
E = UE * AR (6.1) where:
E = exposure (mg/day); UE = unit exposure (mg/lb ai); AR = application rate (e.g., lb ai/day)
The application rate can be calculated as follows: AR = A.I * W* N (6.2) where:
AR = application rate per day (lb ai/ day); A.I. = % active ingredient in product (by weight); W = weight of product unit (e.g., 12 oz aerosol can) N = number of product units used per day (e.g. cans/day)
Absorbed dermal and/or inhalation doses normalized to body weight are calculated as:
BW
AFED *= (6.3)
where:
D = dose (mg/kg-day); E = exposure (mg/day); AF = absorption factor (dermal and/or inhalation); and BW = body weight (kg).
Handler exposure for repellent applications is generally considered short-term in duration. Refinement of this dose estimate to reflect a more accurate short-term multi-day exposure profile can be accomplished by accounting for the various factors outlined in Sections 1.3.2 and 1.3.3 such as the product-specific application regimen. Dermal and Inhalation Handler Exposure Algorithm Inputs and Assumptions Recommended values for repellent handler exposure (inhalation only) assessments are provided in Table 6-1 and Table 6-2. Following these tables, each scenario-specific input parameter is described in more detail. This description includes a summary of i) key assumptions, ii) data sources used to derive recommended input values, and iii) discussion of limitations that should be addressed when characterizing exposure.
Table 6-1: Insect Repellents – Recommended Unit Exposure (mg/lb ai) Point Estimates
Formulation Equipment/Application Method
Dermal Inhalation Appendix Page
Reference Point Estimate Point Estimate

Insect Repellents
U.S. EPA Office of Pesticide Programs – Standard Operating Procedures for Assessing Residential Pesticide Exposure 6-3
Table 6-1: Insect Repellents – Recommended Unit Exposure (mg/lb ai) Point Estimates
Formulation Equipment/Application Method
Dermal Inhalation Appendix Page
Reference Point Estimate Point Estimate
Ready-to-Use (RTU)
Aerosol can Dermal handler
exposure for repellent
applications considered as part of post-application dermal exposure.
3.0 C-134
Trigger-pump sprayers 0.061 C-113
Table 6-2: Insect Repellents – Recommended Handler Exposure Factor Point Estimates
Exposure Factor (units)
Point Estimate(s)
Application Rate (% ai in product)
Maximum labeled rate
Amount used # aerosol cans or pump sprays per day
1
Body Weight (kg)
Adult 80 Children 1 < 2 years old 11
Unit Exposures As described in Section 1.3.3, the unit exposure is the ratio, for a given formulation/application method combination, between exposure and the amount of active ingredient handled, with units mass exposure per mass active ingredient handled (e.g., mg ai exposure/lb ai handled). The recommended point estimates are shown in Table 6-1. Data summaries can be found in Appendix C. Application Rate The algorithm for estimating handler exposure requires some estimate of the amount of active ingredient handled per day. For repellents, this factor varies based on the type of product being applied and is estimated based on the percentage of active ingredient specified on the product label and the amount of product being sprayed. Both of these can be determined on a product- and chemical-specific basis, however, as a default, 1 can or pump spray bottle per day for handlers is assumed based on professional judgment. Future Research/Data Needs Unavailable information that would refine handler exposure assessments for repellents include:
• Application intervals (i.e., how often repellents are applied) • Survey information detailing:
o Daily/weekly/monthly probability of using a repellent product; o Amount of product or formulation used per application; and,
• Handler exposure data: o Specific for repellent applications; o Describing the extent to which an individual’s exposure for a given formulation
and application method varies from application-to-application.
Insect Repellents
U.S. EPA Office of Pesticide Programs – Standard Operating Procedures for Assessing Residential Pesticide Exposure 6-4
Exposure Characterization and Data Quality Unit Exposures
• This section relies on surrogate data considered reasonable for estimating handler exposure for scenarios that are lacking data.
• The underlying assumption of the use of exposure data as unit exposures – proportionality between the amount of active ingredient handled and exposure – is uncertain, though potentially conservative. However, as a prediction mechanism, it is considered practical and useful for the purposes of handler exposure assessment in a regulatory context. It provides a straightforward handler exposure calculation method and enables risk mitigation in the form of formulation comparison and decreased application rates.
• The extent to which an individual’s exposure (expressed via unit exposures) varies day-to-day or application-to-application is unknown; therefore, the assumption that there is no variation when assessing longer-term exposure durations is considered conservative.
Amount of active ingredient handled
• Information on the amount of product/formulation (thus, active ingredient) handled per application is largely unavailable. The recommended point estimates are, therefore, intended to be conservative to ensure an appropriately health protective exposure estimate.
• The assumption that each the applicator (“handler”) and the person to whom the repellent is being applied to are equally exposed to an entire repellent product during application is a conservative estimate for screening-level purposes. It is not possible for them to be simultaneously exposed to the entire can, but the actual proportions of active ingredient to which each participant is exposed is unknown.
• The extent to which the amount an individual will handle per application varies from day-to-day or application-to-application is unknown; therefore, the assumption that there is no variation when assessing longer-term exposure durations is considered conservative.
6.2 Post-application Exposure Assessment Post-application dermal and non-dietary ingestion exposure may occur as a direct result of a repellent application via dermal absorption and hand-to-mouth activities, respectively. Post-application inhalation exposure should be considered based on the chemical’s volatility. While post-application exposure may occur for people of all ages, the assessment for adults and children 1 < 2 years old are expected to encompass the exposures for all lifestages. This section addresses standard methods for estimating exposure and dose for three individual scenarios resulting from use of insect repellents:
• Section 6.2.1 – adult/children 1 < 2 years old inhalation exposure; • Section 6.2.2 – adult/children 1 < 2 years old dermal exposure; and

Insect Repellents
U.S. EPA Office of Pesticide Programs – Standard Operating Procedures for Assessing Residential Pesticide Exposure 6-5
• Section 6.2.3 – children 1 < 2 years old non-dietary ingestion via hand-to-mouth activity.
6.2.1 Post-application Inhalation Exposure Assessment Post-application inhalation exposure resulting from insect repellents is generally not assessed and should be handled on a case-by-case basis. The combination of low vapor pressure for chemicals typically used as active ingredients in insect repellent products and dilution in outdoor air is expected to result in minimal inhalation exposure.
6.2.2 Post-application Dermal Exposure Assessment This SOP provides a standard method for estimating dermal doses among adults and children 1 < 2 years old from skin treated with insect repellents, as well as sunscreens containing insect repellents. Post-application Dermal Exposure Algorithm Post-application dermal exposure resulting from repellent treatments is a function of the amount of product applied to the body. Thus, it is dependent on three factors:
• The application rate (i.e., the target concentration of chemical on the skin per application);
• The total area of the body to which the repellent is applied; and, • The number of applications.
If reliable product-specific information is available that details the target concentration of active ingredient applied to the skin (e.g., mg active ingredient per square centimeter of skin), that information is preferable and should be used in this SOP in the formula below. However, in the event that such information is unavailable, or otherwise considered unreliable, the assessor can use a formulation-specific rate described in this SOP combined with the label-specified percentage of active ingredient to obtain a reasonable estimate of the target skin concentration of active ingredient (see the formula below). The algorithms to calculate dose are presented below. Discussion of each factor is presented in the remainder of this SOP. If product-specific information is available, absorbed dose is calculated as: D = ARP * #Apps * SA/BW * FBody * AF (6.4) where:
D = dose (mg/kg-day); ARP = product-specific application rate (mg ai/cm2 skin); #Apps = number of repellent applications per day; SA/BW = total body surface area to body weight ratio (cm2/kg); FBody = clothing-dependent fraction of body exposed (fraction exposed/application); AF = absorption factor.

Insect Repellents
U.S. EPA Office of Pesticide Programs – Standard Operating Procedures for Assessing Residential Pesticide Exposure 6-6
Or, if product-specific information is unavailable, absorbed dose is calculated as: D = ARF * FAI * #Apps * SA/BW * FBody * AF (6.5) where:
D = dose (mg/kg-day); ARF = formulation-specific application rate (mg product/cm2 skin); FAI = product-specific fraction of active ingredient (mg ai/mg product); #Apps = number of repellent applications per day SA/BW = total body surface area to body weight ratio (cm2/kg); FBody = clothing-dependent fraction of body exposed (fraction exposed/application); AF = absorption factor.
where (for either method): #Apps = ET * AppF (6.6)
#Apps = number of repellent applications per day ET = exposure time (hours/day); AppF = application frequency (applications/hour)
Post-application exposure following repellent applications is generally considered short-term in duration. Refinement of this dose estimate to reflect a more accurate short-term multi-day exposure profile can be accomplished by accounting for the various factors outlined in Sections 1.3.2 and 1.3.4 such as product-specific application intervals and activity patterns. If longer-term assessments (i.e., intermediate-term, long-term, or lifetime exposures) are deemed necessary, similar refinements to more accurately reflect the exposure profile are recommended. Post-application Dermal Exposure Algorithm Inputs and Assumptions Recommended values for post-application dermal exposure assessments are provided in Table 6-3 below. Following this table, each scenario-specific input parameter is described in more detail. This description includes a summary of i) key assumptions, ii) data sources used to derive recommended input values, and iii) discussion of limitations that should be addressed when characterizing exposure.
Table 6-3: Insect Repellents - Recommended Point Estimates for Post-Application Dermal Exposure Factors
Algorithm Notation
Exposure Factor (units)
Point Estimate(s)
ARF Formulation-specific application rate (mg product/cm2 skin)
Aerosol 1.1 Pump spray 0.62
Lotion 2.0 Towelette 1.1
FAI Amount of active ingredient
(%) Maximum labeled rate
(product-specific)
FBody Fraction of body exposed per application
(representing shorts for men and shorts/top for women) 0.75

Insect Repellents
U.S. EPA Office of Pesticide Programs – Standard Operating Procedures for Assessing Residential Pesticide Exposure 6-7
Application Rate (ARF; mg product/cm2 skin) Most of the products assessed will not have labels that state active-ingredient-based application rates in quantifiable terms (e.g., mg ai/cm2). Application rates vary depending on the formulation, with lotions being applied most heavily. Efficacy studies were used as the basis for application rates, since these data are formulation-specific and are from actual repellent applications (Carroll, S.P. 2007a, 2007b, 2007c, 2007d, 2007e, 2008a, 2008b). While the studies themselves vary with respect to the application location and different types of active ingredients the repellent efficacy studies that EPA receives are conducted by treating a portion of a subject’s skin with insect repellent, exposing the treated skin to mosquitoes, and observing the rate at which the insects “bite” the subject’s skin. Table 6-4 provides a summary for the formulation-based application rates. The recommended point estimates are shown in Table 6-3. See Section D.11 of Appendix D for detailed information on application rates for various formulations.
Table 6-4: Statistical Summary – Repellent Product Application Rate (mg product/cm2) Statistic Aerosol Pump-spray Lotion Towelette 50th percentile 0.92 0.50 1.9 1.1 75th percentile 1.5 0.78 2.4 1.3 95th percentile 2.9 1.5 3.5 1.8 99th percentile 4.7 2.3 4.6 2.3 AM (SD) 1.1 (0.93) 0.62 (0.45) 2.0 (0.80) 1.1 (0.36) GM (GSD) 0.92 (2.0) 0.50 (1.9) 1.9 (1.5) 1.1 (1.4) Range 0.17 – 3.5 0.056 – 2.3 0.68 – 4.5 0.5 – 2.5 N 144 420 120 240 Statistics based on lognormal distributions. AM (SD) = arithmetic mean (standard deviation) GM (GSD) = geometric mean (geometric standard deviation)
Number of Repellent Applications (#Apps) The number of applications of an insect repellent determines the amount of repellent ingredients available for absorption through the skin or other potential routes of exposure. Direct information on the number of repellent applications in a day is unavailable; thus, this variable is determined as a function of the amount of time someone spends in settings where repellents might be used and how often someone is expected to apply to themselves or someone else (i.e., based on the repellent efficacy). Descriptions of these two inputs are below.
SA/BW Surface Area to Body Weight Ratio (cm2/kg)
Adult 280 Children 1 < 2
years old 640
ET Exposure Time (hours/day) Adult 3.7
Children 1 < 2 years old 3.5
AppF Application Frequency (applications/hour)
Traditional 0.25
With sunscreen 0.5
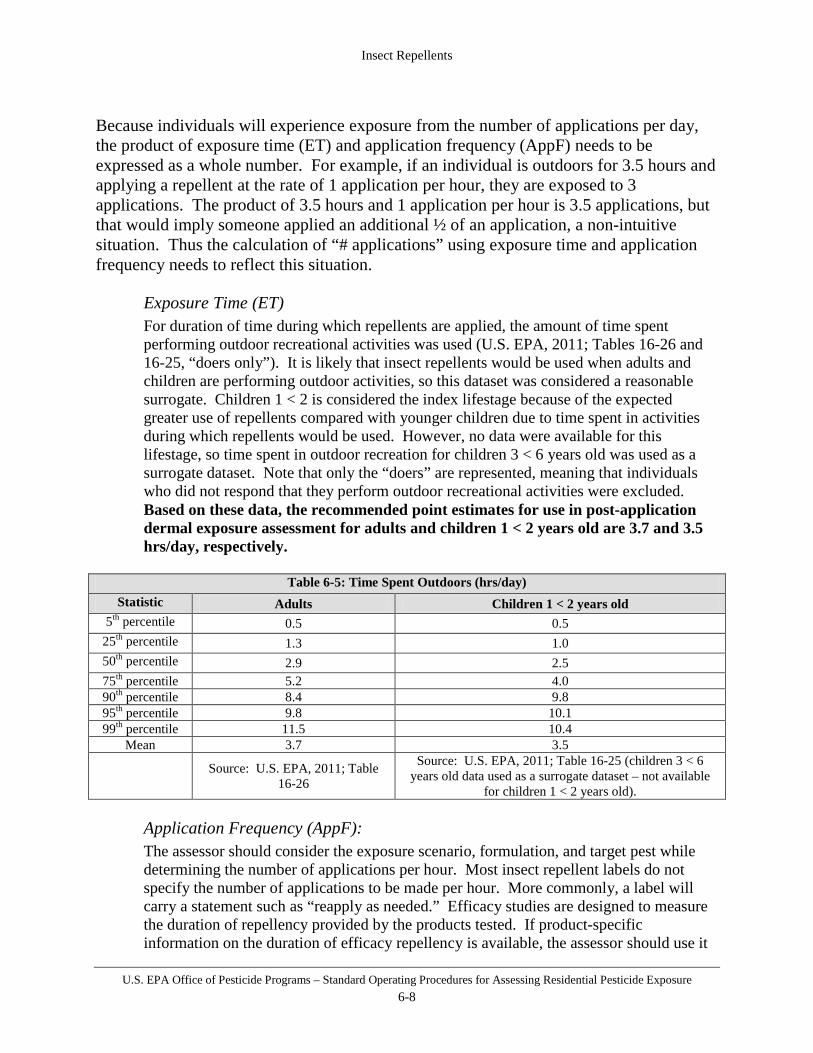
Insect Repellents
U.S. EPA Office of Pesticide Programs – Standard Operating Procedures for Assessing Residential Pesticide Exposure 6-8
Because individuals will experience exposure from the number of applications per day, the product of exposure time (ET) and application frequency (AppF) needs to be expressed as a whole number. For example, if an individual is outdoors for 3.5 hours and applying a repellent at the rate of 1 application per hour, they are exposed to 3 applications. The product of 3.5 hours and 1 application per hour is 3.5 applications, but that would imply someone applied an additional ½ of an application, a non-intuitive situation. Thus the calculation of “# applications” using exposure time and application frequency needs to reflect this situation.
Exposure Time (ET) For duration of time during which repellents are applied, the amount of time spent performing outdoor recreational activities was used (U.S. EPA, 2011; Tables 16-26 and 16-25, “doers only”). It is likely that insect repellents would be used when adults and children are performing outdoor activities, so this dataset was considered a reasonable surrogate. Children 1 < 2 is considered the index lifestage because of the expected greater use of repellents compared with younger children due to time spent in activities during which repellents would be used. However, no data were available for this lifestage, so time spent in outdoor recreation for children 3 < 6 years old was used as a surrogate dataset. Note that only the “doers” are represented, meaning that individuals who did not respond that they perform outdoor recreational activities were excluded. Based on these data, the recommended point estimates for use in post-application dermal exposure assessment for adults and children 1 < 2 years old are 3.7 and 3.5 hrs/day, respectively.
Table 6-5: Time Spent Outdoors (hrs/day)
Statistic Adults Children 1 < 2 years old 5th percentile 0.5 0.5
25th percentile 1.3 1.0 50th percentile 2.9 2.5 75th percentile 5.2 4.0 90th percentile 8.4 9.8 95th percentile 9.8 10.1 99th percentile 11.5 10.4
Mean 3.7 3.5
Source: U.S. EPA, 2011; Table 16-26
Source: U.S. EPA, 2011; Table 16-25 (children 3 < 6 years old data used as a surrogate dataset – not available
for children 1 < 2 years old).
Application Frequency (AppF): The assessor should consider the exposure scenario, formulation, and target pest while determining the number of applications per hour. Most insect repellent labels do not specify the number of applications to be made per hour. More commonly, a label will carry a statement such as “reapply as needed.” Efficacy studies are designed to measure the duration of repellency provided by the products tested. If product-specific information on the duration of efficacy repellency is available, the assessor should use it

Insect Repellents
U.S. EPA Office of Pesticide Programs – Standard Operating Procedures for Assessing Residential Pesticide Exposure 6-9
in their assessment to determine the application frequency specific to the individual product. However, if this information is unavailable, a generic application frequency of 1 every 4 hours (0.25 applications/hour) is recommended for traditional repellents, while an application frequency of 1 every 2 hours (0.5 applications/hour) is recommended for repellents formulated with sunscreens. Sunscreen applications are assumed to occur more frequently. This is based on information from the Center for Disease Control (CDC) indicating effective repellency times vary from 2-6 hours (i.e., 1 application every 2-6 hours) depending on the product and formulation (Fradin and Day, 2002).
Body Weight and Surface Area The exposure algorithm uses surface area (SA) and body weight (BW) as a ratio instead of as two separate factors. The recommended point estimate ratio for adults is 280 cm2/kg and 640 cm2/kg for children 1 < 2, from the Exposure Factors Handbook 2011 Edition, Table 7-15 (U.S. EPA, 2011). Table 6-6 below provides a summary of this exposure parameter.
Table 6-6: Surface Area to Body Weight Ratio (cm2/kg)
%tile Adult Youth Child Males and Females; > 18 yrs. Males and Females; 2-18 yrs. Males and Females; < 2 yrs.
95 330 590 850 90 320 500 780 75 300 450 720 50 290 420 620 25 270 380 560 10 240 330 510 5 240 290 470
Mean 280 420 640 Source: U.S. EPA, 2011, Table 7-15.
Fraction of Body Exposed (FBody) Clothing-dependent fraction of body exposed (surface area body exposed/total body surface area) are presented in Table 6-7 below. These estimates are based on Wong, et al. (2000) and are intended to represent a range of exposure scenarios in different activity and weather conditions. A default point estimate of 75% is recommended to reflect males and females in swimwear. Other estimates are shown – 17% represents an individual wearing a long-sleeve shirt, pants, socks, and shoes; 31% represents an individual wearing a short-sleeve shirt, shorts, socks, and shoes – to reflect additional clothing scenarios should the assessment require additional characterization.
Table 6-7: Percentage of Total Body Surface Area Exposed
Clothing Scenario Body Parts Exposed % of Body SA Exposed Per Body Part Total
Long-sleeve shirt, pants, socks, shoes Face/Neck 5%
17% Hands/wrists 6% Ankles 6%
Short-sleeve shirt, shorts, socks, shoes Lower thighs/upper shins 13% 31% Forearms 6%

Insect Repellents
U.S. EPA Office of Pesticide Programs – Standard Operating Procedures for Assessing Residential Pesticide Exposure 6-10
Face/Neck 6% Feet 7%
Shorts (males); Shorts and top (females)
Torso 38%
75%
Arms Lower thighs/upper shins 13%
Lower shins 6% Feet 7%
Hands 5% Face/Neck 5%
Future Research/Data Needs Unavailable information that would refine post-application dermal exposure assessments for pesticide applications to insect repellents include:
• Measurements of “whole body” exposure following repellent applications under differing situations (e.g., single-event as well as longitudinal repeated applications at campsites, beaches, etc.) to replace method of extrapolating from forearm or leg measurements.
• Survey information detailing: o Daily/weekly/monthly probability of using a repellent o Repellent application regimens (i.e., applications per day) – both daily and
longitudinal frequencies. Exposure Characterization and Data Quality Formulation-specific Application Rates: The formulation-specific application rates were derived from available repellent efficacy studies where the amount of repellent applied to a known surface area (i.e., the area of a certain section of forearm or leg) was measured typically via a “before-and-after” weighing. The extent to which the data in these studies present a true statistical representation of repellent application rates is unknown. Furthermore, because the applications were to legs or forearms only, the use of these rates in the post-application dermal exposure equation requires extrapolation to the rest of the body, assuming the same loading for across body parts. Fraction of Body Exposed: Though a default of 75% is recommended, three “scenarios” described by the amount of body exposed per application are meant to represent the broad range of repellent exposure situations and can be used for additional exposure characterization. This is because, for example, the proportion of total repellent applications comprising heavy-use repellent applications (i.e., an application to 75% of a person’s skin) is unknown.
Daily Application Frequency: The number of repellent applications per day would be highly chemical-specific, since it would be dependent on the product’s efficacy. However, in the event this information is unknown, the range of 1 application every 2-6 hours (Fradin and Day, 2002) is reasonable.
6.2.3 Post-application Non-Dietary Ingestion Exposure Assessment: Hand-to-Mouth
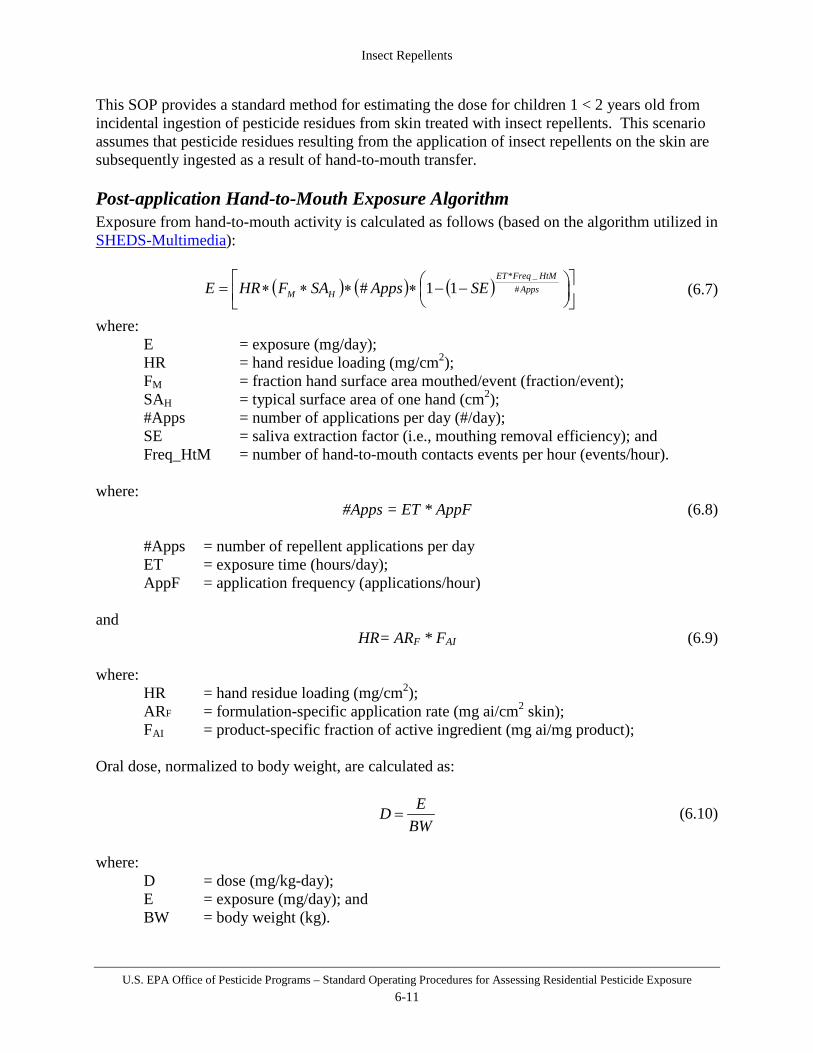
Insect Repellents
U.S. EPA Office of Pesticide Programs – Standard Operating Procedures for Assessing Residential Pesticide Exposure 6-11
This SOP provides a standard method for estimating the dose for children 1 < 2 years old from incidental ingestion of pesticide residues from skin treated with insect repellents. This scenario assumes that pesticide residues resulting from the application of insect repellents on the skin are subsequently ingested as a result of hand-to-mouth transfer. Post-application Hand-to-Mouth Exposure Algorithm Exposure from hand-to-mouth activity is calculated as follows (based on the algorithm utilized in SHEDS-Multimedia): (6.7) where:
E = exposure (mg/day); HR = hand residue loading (mg/cm2); FM = fraction hand surface area mouthed/event (fraction/event); SAH = typical surface area of one hand (cm2); #Apps = number of applications per day (#/day); SE = saliva extraction factor (i.e., mouthing removal efficiency); and Freq_HtM = number of hand-to-mouth contacts events per hour (events/hour).
where: #Apps = ET * AppF (6.8)
#Apps = number of repellent applications per day ET = exposure time (hours/day); AppF = application frequency (applications/hour)
and HR= ARF * FAI (6.9) where:
HR = hand residue loading (mg/cm2); ARF = formulation-specific application rate (mg ai/cm2 skin); FAI = product-specific fraction of active ingredient (mg ai/mg product);
Oral dose, normalized to body weight, are calculated as:
BWED = (6.10)
where:
D = dose (mg/kg-day); E = exposure (mg/day); and BW = body weight (kg).
( ) ( ) ( )
−−∗∗∗∗= Apps
HtMFreqET
HM SEAppsSAFHRE #_*
11#
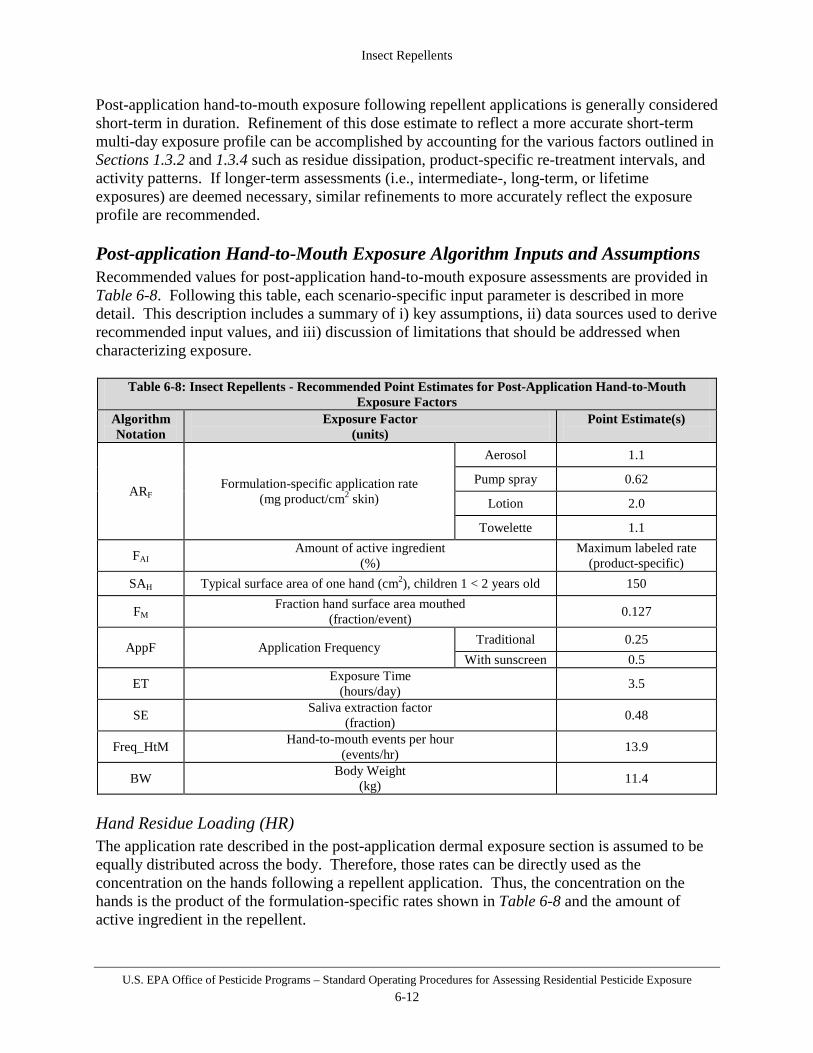
Insect Repellents
U.S. EPA Office of Pesticide Programs – Standard Operating Procedures for Assessing Residential Pesticide Exposure 6-12
Post-application hand-to-mouth exposure following repellent applications is generally considered short-term in duration. Refinement of this dose estimate to reflect a more accurate short-term multi-day exposure profile can be accomplished by accounting for the various factors outlined in Sections 1.3.2 and 1.3.4 such as residue dissipation, product-specific re-treatment intervals, and activity patterns. If longer-term assessments (i.e., intermediate-, long-term, or lifetime exposures) are deemed necessary, similar refinements to more accurately reflect the exposure profile are recommended.
Post-application Hand-to-Mouth Exposure Algorithm Inputs and Assumptions Recommended values for post-application hand-to-mouth exposure assessments are provided in Table 6-8. Following this table, each scenario-specific input parameter is described in more detail. This description includes a summary of i) key assumptions, ii) data sources used to derive recommended input values, and iii) discussion of limitations that should be addressed when characterizing exposure.
Table 6-8: Insect Repellents - Recommended Point Estimates for Post-Application Hand-to-Mouth Exposure Factors
Algorithm Notation
Exposure Factor (units)
Point Estimate(s)
ARF Formulation-specific application rate (mg product/cm2 skin)
Aerosol 1.1
Pump spray 0.62
Lotion 2.0
Towelette 1.1
FAI Amount of active ingredient
(%) Maximum labeled rate
(product-specific) SAH Typical surface area of one hand (cm2), children 1 < 2 years old 150
FM Fraction hand surface area mouthed (fraction/event) 0.127
AppF Application Frequency Traditional 0.25 With sunscreen 0.5
ET Exposure Time (hours/day) 3.5
SE Saliva extraction factor (fraction) 0.48
Freq_HtM Hand-to-mouth events per hour (events/hr) 13.9
BW Body Weight (kg) 11.4
Hand Residue Loading (HR) The application rate described in the post-application dermal exposure section is assumed to be equally distributed across the body. Therefore, those rates can be directly used as the concentration on the hands following a repellent application. Thus, the concentration on the hands is the product of the formulation-specific rates shown in Table 6-8 and the amount of active ingredient in the repellent.
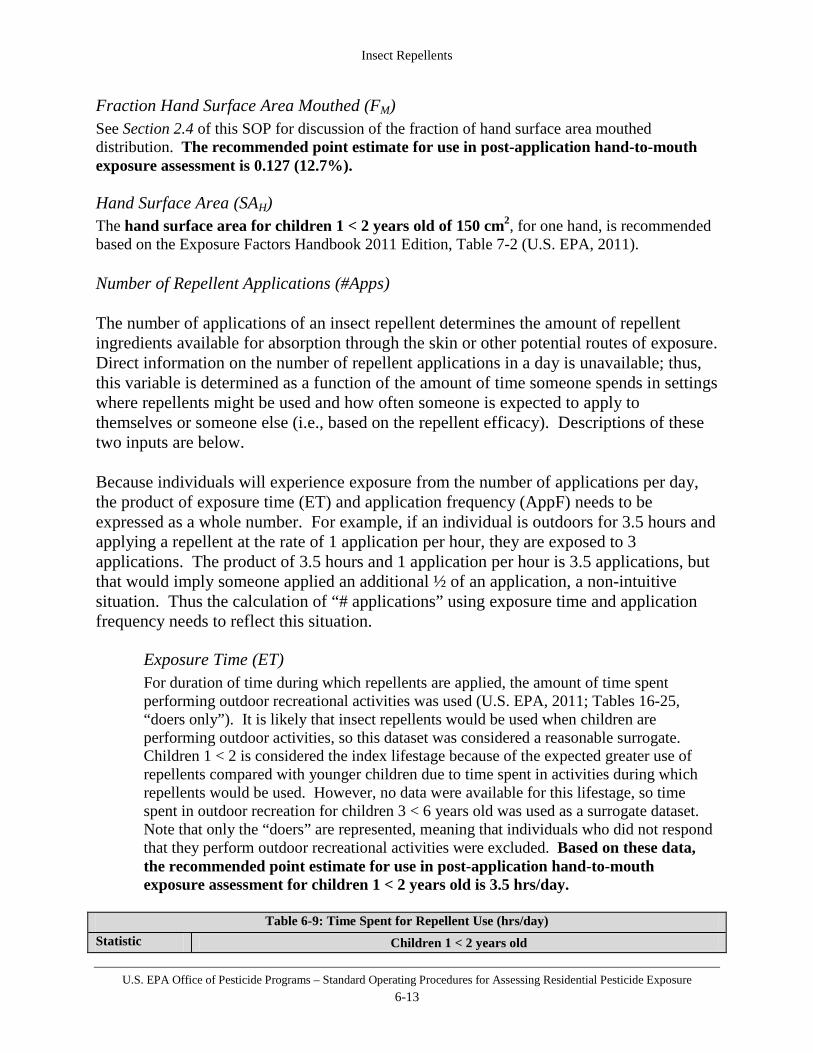
Insect Repellents
U.S. EPA Office of Pesticide Programs – Standard Operating Procedures for Assessing Residential Pesticide Exposure 6-13
Fraction Hand Surface Area Mouthed (FM) See Section 2.4 of this SOP for discussion of the fraction of hand surface area mouthed distribution. The recommended point estimate for use in post-application hand-to-mouth exposure assessment is 0.127 (12.7%). Hand Surface Area (SAH) The hand surface area for children 1 < 2 years old of 150 cm2, for one hand, is recommended based on the Exposure Factors Handbook 2011 Edition, Table 7-2 (U.S. EPA, 2011). Number of Repellent Applications (#Apps) The number of applications of an insect repellent determines the amount of repellent ingredients available for absorption through the skin or other potential routes of exposure. Direct information on the number of repellent applications in a day is unavailable; thus, this variable is determined as a function of the amount of time someone spends in settings where repellents might be used and how often someone is expected to apply to themselves or someone else (i.e., based on the repellent efficacy). Descriptions of these two inputs are below. Because individuals will experience exposure from the number of applications per day, the product of exposure time (ET) and application frequency (AppF) needs to be expressed as a whole number. For example, if an individual is outdoors for 3.5 hours and applying a repellent at the rate of 1 application per hour, they are exposed to 3 applications. The product of 3.5 hours and 1 application per hour is 3.5 applications, but that would imply someone applied an additional ½ of an application, a non-intuitive situation. Thus the calculation of “# applications” using exposure time and application frequency needs to reflect this situation.
Exposure Time (ET) For duration of time during which repellents are applied, the amount of time spent performing outdoor recreational activities was used (U.S. EPA, 2011; Tables 16-25, “doers only”). It is likely that insect repellents would be used when children are performing outdoor activities, so this dataset was considered a reasonable surrogate. Children 1 < 2 is considered the index lifestage because of the expected greater use of repellents compared with younger children due to time spent in activities during which repellents would be used. However, no data were available for this lifestage, so time spent in outdoor recreation for children 3 < 6 years old was used as a surrogate dataset. Note that only the “doers” are represented, meaning that individuals who did not respond that they perform outdoor recreational activities were excluded. Based on these data, the recommended point estimate for use in post-application hand-to-mouth exposure assessment for children 1 < 2 years old is 3.5 hrs/day.
Table 6-9: Time Spent for Repellent Use (hrs/day)
Statistic Children 1 < 2 years old

Insect Repellents
U.S. EPA Office of Pesticide Programs – Standard Operating Procedures for Assessing Residential Pesticide Exposure 6-14
5th percentile 0.5 25th percentile 1.0 50th percentile 2.5 75th percentile 4.0 90th percentile 9.8 95th percentile 10.1 99th percentile 10.4 Mean 3.5
Source: U.S. EPA, 2011; Table 16-25 (data for children 1 < 2 year unavailable – children 3 < 6 years old data used as a surrogate dataset).
Application Frequency (AppF): Unlike other hand-to-mouth scenarios where replenishment can come from treated indoor surfaces or treated turf, replenishment for insect repellents is assumed to only occur when an application occurs. As a result, application frequency is used to represent replenishment intervals per hour (see “N_Replen” in other hand-to-mouth exposure equations). The assessor should consider the exposure scenario, formulation, and target pest while determining the number of applications per hour. Most insect repellent labels do not specify the number of applications to be made per hour. More commonly, a label will carry a statement such as “reapply as needed.” Efficacy studies are designed to measure the duration of repellency provided by the products tested. If product-specific information on the duration of efficacy repellency is available, the assessor should use it in their assessment to determine the application frequency specific to the individual product. However, if this information is unavailable, a generic application frequency of 1 every 4 hours (0.25 apps/hour) is recommended for traditional repellents and 1 every 2 hours (0.5 apps/hour) is recommended for repellents formulated with sunscreens. This is based on information from the Center for Disease Control (CDC) indicating effective repellency times vary from 2-6 hours (i.e., 1 application every 2-6 hours) depending on the product and formulation (Fradin and Day, 2002).
Fraction of Pesticide Extracted by Saliva (SE) See Section 2.6 for discussion of the distribution of values for the fraction of pesticide extracted by saliva distribution. The recommended point estimate for use in post-application hand-to-mouth exposure assessment is 0.48. Hand-to-Mouth Events per Hour (Freq_HtM) Frequency of hand-to-mouth events is an important variable for hand-to-mouth post-application exposure assessments. However, there are currently no data available that specifically address the number of hand-to-mouth events that occur relative to the amount of time a child is in contact with an insect repellent. As a result, the estimates for frequency of hand-to-mouth events in outdoor environments from the Xue et al. (2007) meta-analysis were selected as a surrogate. The outdoor data were selected because they represent the most likely time when insect repellents will be used on children. The insect repellent SOP utilizes hand-to-mouth frequency data for the 1 < 2 year old lifestage to represent children. Distributions for different lifestages can be used if
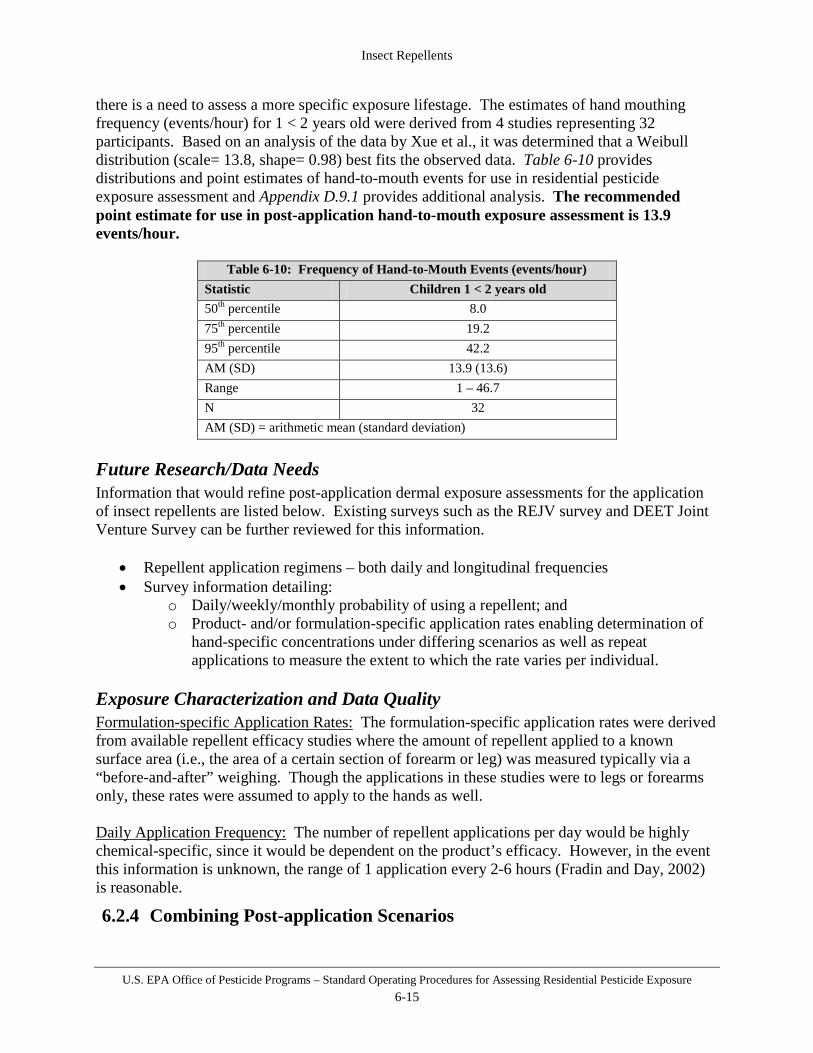
Insect Repellents
U.S. EPA Office of Pesticide Programs – Standard Operating Procedures for Assessing Residential Pesticide Exposure 6-15
there is a need to assess a more specific exposure lifestage. The estimates of hand mouthing frequency (events/hour) for 1 < 2 years old were derived from 4 studies representing 32 participants. Based on an analysis of the data by Xue et al., it was determined that a Weibull distribution (scale= 13.8, shape= 0.98) best fits the observed data. Table 6-10 provides distributions and point estimates of hand-to-mouth events for use in residential pesticide exposure assessment and Appendix D.9.1 provides additional analysis. The recommended point estimate for use in post-application hand-to-mouth exposure assessment is 13.9 events/hour.
Table 6-10: Frequency of Hand-to-Mouth Events (events/hour) Statistic Children 1 < 2 years old 50th percentile 8.0 75th percentile 19.2 95th percentile 42.2 AM (SD) 13.9 (13.6) Range 1 – 46.7 N 32 AM (SD) = arithmetic mean (standard deviation)
Future Research/Data Needs Information that would refine post-application dermal exposure assessments for the application of insect repellents are listed below. Existing surveys such as the REJV survey and DEET Joint Venture Survey can be further reviewed for this information.
• Repellent application regimens – both daily and longitudinal frequencies • Survey information detailing:
o Daily/weekly/monthly probability of using a repellent; and o Product- and/or formulation-specific application rates enabling determination of
hand-specific concentrations under differing scenarios as well as repeat applications to measure the extent to which the rate varies per individual.
Exposure Characterization and Data Quality Formulation-specific Application Rates: The formulation-specific application rates were derived from available repellent efficacy studies where the amount of repellent applied to a known surface area (i.e., the area of a certain section of forearm or leg) was measured typically via a “before-and-after” weighing. Though the applications in these studies were to legs or forearms only, these rates were assumed to apply to the hands as well. Daily Application Frequency: The number of repellent applications per day would be highly chemical-specific, since it would be dependent on the product’s efficacy. However, in the event this information is unknown, the range of 1 application every 2-6 hours (Fradin and Day, 2002) is reasonable.
6.2.4 Combining Post-application Scenarios
Insect Repellents
U.S. EPA Office of Pesticide Programs – Standard Operating Procedures for Assessing Residential Pesticide Exposure 6-16
Risks resulting from different exposure scenarios are combined when it is likely that they can occur simultaneously based on the use pattern and when the toxicological effects across different routes of exposure are the same (see Section 1.3.4). When combining scenarios, it is important to fully characterize the potential for co-occurrence as well as characterizing the risk inputs and estimates. Risks should be combined even if any one scenario or route of exposure exceeds the level of concern because this allows for better risk characterization for risk managers. For insect repellents, the post-application exposure scenarios that should be combined are the dermal and hand-to-mouth scenarios. This combination should be considered a protective estimate of children’s exposure from the use of insect repellents.

Indoor Environments
U.S. EPA Office of Pesticide Programs – Standard Operating Procedures for Assessing Residential Pesticide Exposure 7-1
Section 7 Indoor Environments
This section considers those individuals who are potentially exposed to pesticides from either treating indoor areas with a product available for sale to the general public or after contact with treated indoor surfaces in many settings including homes, schools, and daycares. Before the development of an exposure assessment for this scenario, the assessor should review the pesticide label to determine whether it is appropriate based on the usage of the product. For the purposes of the indoor SOP, the following definitions are used: A fogger (or total release aerosol) is a pesticide device designed to automatically release its total content in one operation for the purpose of creating a permeating fog within a confined space to deliver the pesticide throughout the space. Total release aerosols do not need any other application equipment (PR NOTICE 98-6, 1998). Broadcast application is defined as an application to broad expanses of surfaces such as walls, floors, and ceilings (U.S. EPA, 1996); a coarse spray of liquid insecticide or application of a dust insecticide in a room. Broadcast applications should be evenly distributed (University of Nebraska–Lincoln Extension, 2006). Perimeter/Spot/Bedbug (Coarse application) is defined as a coarse spray of liquid insecticide or application of a dust insecticide in a wide band or strip (University of Nebraska–Lincoln Extension, 2006) or over a small area (< 2 ft2) (38 FR 21685, 1973). These applications are typically done with a manually-pressurized handwand or an aerosol can with typical nozzles. Example label language that would indicate this type of application includes: “Use a coarse, manually-pressurized spray. Treat entry points such as around doors, windows, and eaves. Treat areas where pests normally feed or hide such as baseboards and corners.” “Use a manually-pressurized system with a fan-type nozzle to apply the dilution uniformly.” “Spot treat floor or rugs beneath furniture, in closets, and storage areas, but do not apply to entire floor area.” “…treat mattress, box springs, bed frames, and headboards.” Perimeter/Spot/Bedbug (Pin Stream application) is defined similarly to the coarse perimeter treatment except that the method of application utilizes a pin stream nozzle similar to what is used for crack and crevice applications. However, these types of applications are not made into cracks and crevices and a larger area is treated than would be expected with a crack and crevice application. Example label language that would indicate this type of application includes the language listed above for coarse applications with the exception of the type of nozzle used: “Use a manually-pressurized system with a pinpoint nozzle.” Crack and crevice application is defined as an application of pesticides with the use of a pin stream nozzle, into cracks and crevices in which pests hide or through which they may enter a

Indoor Environments
U.S. EPA Office of Pesticide Programs – Standard Operating Procedures for Assessing Residential Pesticide Exposure 7-2
building. Such openings commonly occur at expansion joints, between different elements of construction, and between equipment and floors. These openings may lead to voids such as hollow walls, equipment legs and bases, conduits, motor housings, and junction or switch boxes (U.S. EPA, 1996). Example label language that would indicate this type of application includes: “Treat areas where pests normally feed or hide such as around water pipes, behind or under refrigerators, cabinets, sinks and stoves.” “Place injector tips into cracks and crevices.” When reviewing proposed labels, the following key items should be considered to determine if an indoor assessment should be conducted, and if so, what type of application should be assessed:
• Look for statements describing or limiting the use of the proposed product. These statements may be on the front panel of the label associated with the brand or trade name or in the use directions section of the label. If a label indicates an indoor residential use, assume that the product is used at residential sites such as daycares, schools, or other sites where children may be present, unless a specific labeling statement indicates use in a non-residential setting. Examples of statements that restrict use in residential sites, and therefore, would preclude a residential assessment, include:
o For use in commercial sites only; and o For use in food handling establishments only.
A Restricted Use Pesticide (RUP) classification indicates that the product cannot be bought or applied by homeowners (i.e., no residential handler exposure/risk assessment required), but it may be applied by commercial applicators to residential sites; therefore, a post-application risk assessment may be required.
• Determine what type of application is allowed on the label. Check the label for directions for use as a broadcast, perimeter, spot or crack and crevice treatment. Use the definitions and key label language provided above as a guide.
• Determine whether the pesticide label contains directions for use on carpets or hard
surfaces, such as walls, countertops, hard floors, or cabinets. If no distinction is made as to what type of surface the product can be applied to, an assessment for both types of surfaces should be conducted.
If an indoor use is possible, the assessment should then characterize and estimate the potential for exposure by route (i.e., dermal, inhalation, non-dietary ingestion) following the methodology outlined in this SOP. The assessor should consider the durations of exposure for each route. Specific considerations include the number of applications allowed per year and the re-treatment interval required between those treatments. Depending on the specific product, this can indicate if intermediate- or long-term assessments are required.
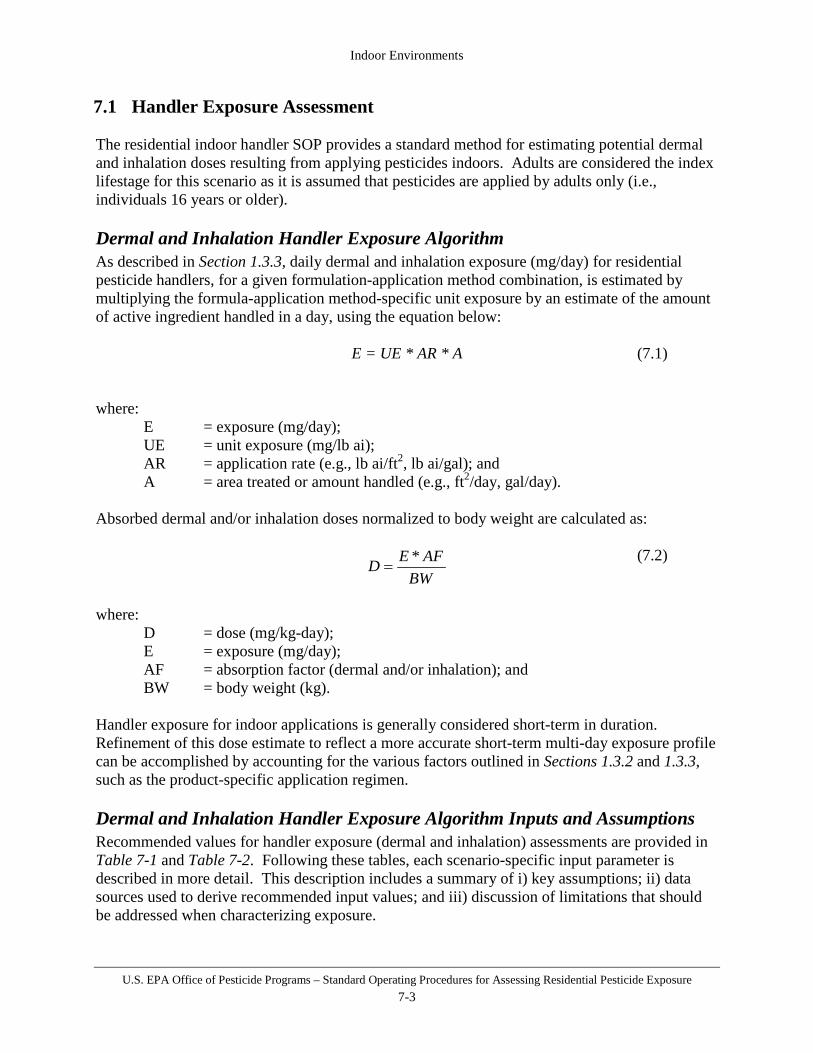
Indoor Environments
U.S. EPA Office of Pesticide Programs – Standard Operating Procedures for Assessing Residential Pesticide Exposure 7-3
7.1 Handler Exposure Assessment The residential indoor handler SOP provides a standard method for estimating potential dermal and inhalation doses resulting from applying pesticides indoors. Adults are considered the index lifestage for this scenario as it is assumed that pesticides are applied by adults only (i.e., individuals 16 years or older). Dermal and Inhalation Handler Exposure Algorithm As described in Section 1.3.3, daily dermal and inhalation exposure (mg/day) for residential pesticide handlers, for a given formulation-application method combination, is estimated by multiplying the formula-application method-specific unit exposure by an estimate of the amount of active ingredient handled in a day, using the equation below: E = UE * AR * A (7.1) where:
E = exposure (mg/day); UE = unit exposure (mg/lb ai); AR = application rate (e.g., lb ai/ft2, lb ai/gal); and A = area treated or amount handled (e.g., ft2/day, gal/day).
Absorbed dermal and/or inhalation doses normalized to body weight are calculated as:
BW
AFED *= (7.2)
where:
D = dose (mg/kg-day); E = exposure (mg/day); AF = absorption factor (dermal and/or inhalation); and BW = body weight (kg).
Handler exposure for indoor applications is generally considered short-term in duration. Refinement of this dose estimate to reflect a more accurate short-term multi-day exposure profile can be accomplished by accounting for the various factors outlined in Sections 1.3.2 and 1.3.3, such as the product-specific application regimen.
Dermal and Inhalation Handler Exposure Algorithm Inputs and Assumptions Recommended values for handler exposure (dermal and inhalation) assessments are provided in Table 7-1 and Table 7-2. Following these tables, each scenario-specific input parameter is described in more detail. This description includes a summary of i) key assumptions; ii) data sources used to derive recommended input values; and iii) discussion of limitations that should be addressed when characterizing exposure.

Indoor Environments
U.S. EPA Office of Pesticide Programs – Standard Operating Procedures for Assessing Residential Pesticide Exposure 7-4
Table 7-1: Indoor Environments – Recommended Unit Exposure (mg/lb ai) Point Estimates
Formulation Equipment/ Application Method
Dermal Inhalation Appendix Page Reference Point Estimate Point Estimate
Dusts/Powders
Plunger duster 250 1.7 C-32
Bulb duster No exposure data available for this application scenario. Exposure
data for plunger duster applications recommended as surrogate data.
Electric/power duster No exposure data available for this application scenario. Exposure data for shaker can applications of dusts/powders recommended as
surrogate data.
Hand crank duster No exposure data available for this application scenario. Exposure data for shaker can applications of dusts/powders recommended as
surrogate data.
Shaker can 4,300 18 C-36
Liquid concentrates
Manually-pressurized handwand
(w/ or w/o pin stream nozzle)
No exposure data available for this application scenario. Exposure data for manually-pressurized handwand applications of wettable
powder recommended as surrogate data.
Ready-to-Use (RTU)
Aerosol can (w/ or w/o pin stream
nozzle) 370 3.0 C-134
Trigger-sprayer 85.1 0.061 C-113
Gels No exposure data available for this application scenario; however, exposure is considered negligible.
Pastes No exposure data available for this application scenario; however, exposure is considered negligible.
Foams No exposure data available for this application scenario; however, exposure is considered negligible.
Bait (granular; hand dispersal) 160 0.38 B-39
Bait station / trap (enclosed in child
resistant packaging)
No exposure data available for this application scenario; however, exposure is considered negligible.
Pest Strip No exposure data available for this application scenario; however, exposure is considered negligible.
Wettable Powder
Manually-pressurized handwand
(w/ or w/o pin stream nozzle)
69 1.1 C-141
Wettable Powder in
Water-soluble Packaging
Manually-pressurized handwand
(w/ or w/o pin stream nozzle)
No exposure data available for this application scenario. Exposure data for manually-pressurized handwand applications of wettable
powders recommended as surrogate data.
Ll

Indoor Environments
U.S. EPA Office of Pesticide Programs – Standard Operating Procedures for Assessing Residential Pesticide Exposure 7-5
Table 7-2: Indoor Environments – Recommended Handler Exposure Factor Point Estimates
Exposure Factor (units)
Point Estimate(s)
Amount Applied (see units specified)
Amount product /
/solution used
Manually-pressurized handwand (gallons)
Broadcast
0.5
Perimeter/Spot/Bedbug (Coarse application)
Manually-pressurized handwand (w/pin stream nozzle)
(gallons)
Perimeter/Spot/Bedbug (Pin stream application)
Crack and crevice
Bulb duster (pounds dust)
Perimeter/Spot/Bedbug
Crack and crevice 0.25
Plunger duster (pounds dust)
Broadcast
Perimeter/Spot/Bedbug (Coarse application)
0.5 Electric/power duster (pounds dust)
Broadcast
Perimeter/Spot/Bedbug (Coarse application)
Hand crank duster pounds dust
Broadcast
Perimeter/Spot/Bedbug (Coarse application)
Shaker can (#containers)
Broadcast 1 Perimeter/Spot/Bedbug
(Coarse application) 0.5
Aerosol can (# 16-oz cans)
Broadcast Surface Spray 1
Perimeter/Spot/Bedbug (Coarse application) 0.5
Space spray 0.25
Aerosol can (w/ pin stream nozzle)
(# 16-oz cans)
Perimeter/Spot/Bedbug (Pin stream application)
Crack and crevice
0.5
Trigger-pump sprayer (#containers)
Broadcast 1 Perimeter/Spot/Bedbug
(Coarse application) 0.5
Body Weight (kg) 80
Unit Exposures As described in Section 1.3.3, the unit exposure is the ratio between exposure and the amount of active ingredient handled for a given formulation/application method combination, with units of

Indoor Environments
U.S. EPA Office of Pesticide Programs – Standard Operating Procedures for Assessing Residential Pesticide Exposure 7-6
mass exposure per mass active ingredient handled (e.g., mg ai exposure/lb ai handled). The recommended point estimate for use in handler dermal and inhalation exposure assessments represents approximately the arithmetic mean of the distribution. Data summaries can be found in Appendix C. Estimating the Amount of Active Ingredient Handled The algorithm for estimating handler exposure requires some estimate of the amount of active ingredient handled per day. This factor varies based on the type of equipment or application method used and is estimated based on the application rate specified on the product label. First, the assessor should assemble application rate information in terms of active ingredient per volume of spray (e.g., lb ai/gallon solution). For example, instructions for a liquid formulation might direct application of 0.5 gallons of solution per 100 square feet. For handler indoor assessments, the following are the recommended amounts of active ingredient handled for typical indoor application equipment.
• Manually-pressurized handwand: 0.5 gallons for broadcast, perimeter/spot/bedbug (coarse and pin stream applications) treatments and crack and crevice treatments. These values are supported by data from the Pesticide Handler Exposure Database (PHED), which indicate about 0.5 gallons for a commercial applicator crack/crevice and limited surface treatment in residences.
• Dusters: 0.5 pounds of dust for broadcast and for perimeter/spot/bedbug (coarse application) and 0.25 pounds of dust for perimeter/spot/bedbug (bulb duster application) and crack and crevice treatments. These values are based on best professional judgment since no data are available and may be refined based on label information.
• Shaker can: 1 can for broadcast and 0.5 can for perimeter/spot/bedbug (coarse application) treatments. These values are based on best professional judgment since no data are available and may be refined based on label information.
• Aerosol Can: 1 can for broadcast surface sprays. 0.5 can for perimeter/spot/bedbug (coarse and pin stream applications) treatment surface sprays and crack and crevice surface spray treatments, 0.25 for space sprays. These values are supported by data from the Pesticide Handler Exposure Database (PHED), which indicate one 15-oz can is used to make applications to crack, crevices, baseboards, under sinks, behind appliances, etc, as well as best professional judgment.
• Trigger-pump sprayer: 1 container for broadcast and ½ container for perimeter/spot/bedbug (coarse application) treatments. These values are based on best professional judgment since no data are available and may be refined based on label information.
Future Research/Data Needs Unavailable information that would refine handler exposure assessments for indoor pesticide applications include:
• Information on the amount handled or area treated for the various scenarios. • Information on unit exposures for several formulation/equipment combinations.
Indoor Environments
U.S. EPA Office of Pesticide Programs – Standard Operating Procedures for Assessing Residential Pesticide Exposure 7-7
Exposure Characterization and Data Quality The uncertainties associated with this assessment stem from the use of assumed amounts of active ingredient handled for typical indoor treatments. The estimated doses are believed to be high-end, conservative estimates. Unit Exposures
• The exposure data underlying unit exposures are considered reasonable for the purposes of estimating exposure. The data are from actual applications using standardized exposure sampling methodologies and laboratory analyses.
• The underlying assumption of the use of exposure data as unit exposures – proportionality between the amount of active ingredient handled and exposure – is uncertain, though potentially conservative. However, as a prediction mechanism, it is considered practical and useful for the purposes of handler exposure assessment in a regulatory context. It provides a straightforward handler exposure calculation method and enables risk mitigation in the form of formulation comparison and decreased application rates.
• The extent to which an individual’s exposure (expressed via unit exposures) varies day-to-day or application-to-application is unknown; therefore, the assumption that there is no variation when assessing longer-term exposure durations is considered conservative.
Amount of active ingredient handled
• Information on the amount of product/formulation (thus, active ingredient) handled per application is lacking, making the estimates highly uncertain. The recommended point estimates are, therefore, intended to be high-end to ensure an appropriately conservative exposure estimate.
• The extent to which the amount an individual will handle per application varies from day-to-day or application-to-application is unknown; therefore, the assumption that there is no variation when assessing longer-term exposure durations is considered conservative.
7.2 Post-application Exposure Assessment Post-application exposure can result from contact with indoor surfaces following a pesticide application. While exposure may occur for people of all ages, adults and children 1 < 2 years are considered the index lifestages for this exposure scenario based on behavioral characteristics and the strengths and limitations of available data. This section addresses standard methods for estimating exposure and dose for five individual post-application exposure pathways resulting from exposure to pesticides that have been used to treat indoor areas:
• Section 7.2.1 - Post-application inhalation exposures; • Section 7.2.2 - Post-application dermal exposures; • Section 7.2.3 –Non-dietary ingestion via hand-to-mouth activity; • Section 7.2.4 –Non-dietary ingestion via object-to-mouth activity; and • Section 7.2.5 –Non-dietary ingestion via dust ingestion.

Indoor Environments
U.S. EPA Office of Pesticide Programs – Standard Operating Procedures for Assessing Residential Pesticide Exposure 7-8
7.2.1 Post-application Inhalation Exposure Assessment This SOP provides a standard method for completing post-application inhalation exposure assessments for adults and children after a pesticide treatment indoors (e.g., in a house, school, daycare, etc). The basis for each scenario is that non-handler inhalation exposure occurs while occupying indoor areas after a pesticide treatment. It covers fogger, space spray, and surface-directed applications, as well as foundation/soil injection termiticide applications. Inhalation exposure primarily occurs through breathing air containing pesticide vapors or aerosols. Aerosols are a spray of fine particles, which tend to settle out of the air after a certain time period depending on the particle size. Some examples of indoor devices that produce aerosols include foggers and aerosol cans. Vapors occur when the pesticide volatilizes from a surface after an application (e.g., broadcast application with a manually-pressurized handwand). Volatilization of a pesticide indoors is dependent on many factors, including the vapor pressure of the chemical, the media on which it has been applied, and air temperature. For the inhalation route of exposure, there is a possibility that the point of departure (POD) used for risk assessment may be based on the reference concentration (RfC) methodology. In the RfC methodology, air concentrations are not converted to doses, rather, risks are assessed on the basis of comparison of air concentrations with reference concentrations typically determined from animal studies. This approach is not always available for every chemical; therefore, the exposure assessor should discuss the possibility of this approach with a toxicologist. If the post-application inhalation exposure assessment performed needs to be refined, it is recommended that specialized computer software be used. The computer model currently used by the Agency is the MCCEM model or Multi-Chamber Concentration and Exposure Model. The MCCEM was peer reviewed in 1998 (Eastern Research Group, 1998). The appendix to this SOP provides standard model inputs for using MCCEM in exposure assessments, but the assessor should refer to the MCCEM User's Manual for details on the operation of MCCEM and for information concerning the underlying assumptions and limitations of each (U.S. EPA, 1995). One notable limitation is that MCCEM treats all emissions as vapor or gas. Therefore, air concentration calculations for aerosols using the MCCEM model will not account for the fact that a certain amount of the pesticide in the air is expected to settle out. All specific model inputs and calculations represented in this SOP are based on MCCEM Version 1.2 (available on the EPA website: http://www.epa.gov/opptintr/exposure/pubs/mccem.htm). Post-application inhalation exposure following applications indoors is generally considered short-term in duration, but is dependent on the use pattern of the specific product being assessed and the dissipation/degradation properties of the active ingredient. Refinement of this dose estimate to reflect a more accurate short-term multi-day exposure profile can be accomplished by accounting for the various factors outlined in Sections 1.3.2 and 1.3.4 such as residue dissipation, product-specific re-treatment intervals, and activity patterns. If longer-term assessments (i.e., intermediate-, long-term, or lifetime exposures) are deemed necessary, similar refinements to more accurately reflect the exposure profile are recommended.

Indoor Environments
U.S. EPA Office of Pesticide Programs – Standard Operating Procedures for Assessing Residential Pesticide Exposure 7-9
The indoor post-application inhalation exposure assessment section is divided into 3 sections: indoor foggers (Section 7.2.1.1), indoor spray applications (Section 7.2.1.2; covering both space sprays and surface-directed sprays), and foundation/soil injection termiticide applications (Section 7.2.1.3). The following table provides a summary of the possible post-application inhalation scenarios following treatment of indoor areas. More information about each scenario is provided below. Decision Table for Post-application Inhalation Scenarios
Possible post-application assessments
Should an assessment be conducted for the type of applications below?
Fogger
(Section 7.2.1.1)
Indoor Spray Applications
(Section 7.2.1.2) Termiticide Applications
(Foundation and Soil Injection)
(Section 7.2.1.3)
Space Spray (i.e., Flying Insect Killer)
Surface-directed Spray (e.g., Broadcast/
Spot/Perimeter/Crack and Crevice spray w/
Manually-pressurized Handwand)
Exposure to pesticide aerosols in air
(Algorithm #1)
No
(reentry restriction and
ventilation requirements)
If label has reentry restriction/ventilation
requirements – No
If label does not have reentry
restriction/ventilation requirements -- Yes
No No
Exposure to pesticide vapors in air
(Algorithm #2)
Yes Yes Yes Yes
(using MCCEM model)
7.2.1.1 Indoor Foggers Fogger devices are designed to spread a fog of pesticide filling a room with aerosols, which will eventually settle out of the air. To address post-application inhalation exposure to pesticide aerosols following fogger applications, most fogger product labels typically require statements such as: “Do Not Reenter Building for Four Hours; then open exterior doors and windows and allow to air for 60 minutes before reoccupying area” with the intention of reducing inhalation exposure. Information provided by manufacturers indicate that the particle size distribution for most total release foggers ranges from 15 micrometers (um) to 60 um. The average settling time for various particle sizes can be calculated based on Stokes Law (see Section D-1 of Appendix D). According to calculations of settling time versus droplet size, it will take 2 hours for a 15 micrometer particle to settle and 8 minutes for a 60 micrometer particle to settle from an eight-foot ceiling height. Therefore, as long as fogger product labels include a statement restricting entry for at least 2 hours, post-application inhalation exposure to pesticide aerosols should be negligible. If there is no reentry time restriction on the product label, the ORE assessor should recommend that the Registration Division (RD) ensure the appropriate restrictions/directions are added to the label.

Indoor Environments
U.S. EPA Office of Pesticide Programs – Standard Operating Procedures for Assessing Residential Pesticide Exposure 7-10
After pesticide residues from a fogger deposit onto the indoor floor surface, there is the potential for volatilization of those residues into the air. Therefore, an assessment for exposure to pesticide vapors should be conducted according to algorithm #2 below; Exposure to pesticide vapors.
7.2.1.2 Indoor Spray Applications Indoor spray applications fall into two categories: (1) space sprays (e.g., flying insect killers), and (2) surface-directed sprays (e.g., broadcast applications made with a manually-pressurized handwand). For space sprays, it is assumed that there may be post-application inhalation exposure to pesticide aerosols that are still airborne after application. It should be noted that some space spray labels have directions similar to those for indoor foggers, where the user is instructed to leave the room for a period of time and to ventilate the room prior to re-entry. Labels include statements such as: “Direct the spray towards the ceiling and upper corners of the room. Keep areas closed for at least 1/2 hour. Do not remain in treated area. Ventilate area thoroughly before re-entry.” In those cases, post-application exposure to pesticide aerosols is expected to be negligible considering the re-entry restriction and the ventilation requirement. However, if the label does not contain such directions or requirements, then a post-application inhalation assessment for exposure to pesticide aerosols (algorithm #1 below) should be conducted. Similar to foggers, once the pesticide residues settle out of the air from the space spray application and deposit onto the indoor floor surface, there is the potential for volatilization of those residues into the air. Therefore, an assessment for exposure to pesticide vapors should be conducted according to algorithm #2 below; Exposure to pesticide vapors. For surface-directed spray applications, it is assumed that there may be post-application inhalation exposure to pesticide vapors emitted after an application to an indoor surface has been made. Therefore, an assessment for exposure to pesticide vapors should be conducted according to algorithm #2 below; Exposure to pesticide vapors. Post-Application Inhalation Exposure Algorithms The two post-application inhalation exposure algorithms outlined in this section are: (1) Exposure to pesticide aerosols, and (2) Exposure to pesticide vapors. (1) Exposure to pesticide aerosols In order to assess post-application inhalation exposure to pesticide aerosols from instantaneous release/aerosol applications (e.g., flying insect killers), the initial air concentration must first be calculated. If chemical-specific data are available, the initial air concentration is the air concentration at time 0 (assuming that individuals could be exposed to the air concentration

Indoor Environments
U.S. EPA Office of Pesticide Programs – Standard Operating Procedures for Assessing Residential Pesticide Exposure 7-11
immediately after application). If data are not available, then the initial air concentration can be calculated using the following formula:
C0 = AR * CF1
(7.3)
where: C0 = initial air concentration (mg/m3); AR = application rate (lbs ai/m3); and CF1 = conversion factor (454,000 mg/lb).
If an application rate is given on the label in terms of unit area, this should be used. The following equation can be used to calculate the application rate if it’s not provided:
room
productproduct
VCFCFDVAIAR 2*1***
= (7.4)
where:
AR = application rate (lbs ai/m3); A.I. = percent active ingredient in product (% ai); V product = volume of product in 1 can (mL); D product = density of product (g/mL); CF1 = conversion factor (1,000 mg/g); CF2 = conversion factor (2.2x10⁻⁶ lb/mg); and Vroom = volume of room (m3).
If the POD is based on the RfC methodology, then the calculated air concentration can be compared directly to the reference concentration. However, if the POD is a No-Observed-Adverse-Effect-Level (NOAEL) or Lowest-Observed-Adverse-Effect-Level (LOAEL), inhalation potential doses must be calculated in order to compare to the appropriate POD. The Instantaneous Release Box Model for aerosols can be used to calculate exposure for this type of application scenario. The basis for this scenario is that post-application inhalation exposure occurs from the airborne aerosols released after an aerosol application. The well-mixed box (WMB) model was used to develop the exposure equation for the instantaneous release/aerosol post-application inhalation scenario. The WMB model incorporates a number of simplifying assumptions: (1) fresh air (having no pesticide concentration) enters the box at a constant airflow rate
(based on the number of air changes per hour), (2) a turbulent internal airflow thoroughly mixes the fresh air with the pesticide-laden air
resulting in a uniform pesticide air concentration within the box, and (3) the perfectly mixed air exits the box at the same constant airflow rate (i.e., the inflow rate
equals the outflow rate).

Indoor Environments
U.S. EPA Office of Pesticide Programs – Standard Operating Procedures for Assessing Residential Pesticide Exposure 7-12
Thus, the indoor area where the aerosol is being applied is assumed to be in an enclosed box, which is a reasonable assumption for a walled, indoor space. This scenario assumes instantaneous spray release (i.e., the total amount of aerosol released is modeled to occur instantaneously). The evacuation of the aerosol from the box depends on airflow. For an indoor scenario, the airflow is the product of the volume of the treated space and the number of air changes per hour, ACH. The WMB model developed for this scenario models the pesticide air concentrations after an instantaneous aerosol spray release. It should be noted that this calculation does not take into account the settling of aerosol droplets. Only dissipation due to airflow into and out of the box is modeled. Post-application inhalation exposure for adults/children resulting from space sprays (e.g., flying insect killers) can be calculated using the following equation (See Section D.3.5 of Appendix D for equation description and derivation):
(7.5)
where:
E = exposure (mg/day); Co = initial concentration (mg/m3); IR = inhalation rate (m3/hr); ACH = air changes per hour (hour-1); and ET = exposure time (hr/day).
Absorbed inhalation dose normalized to body weight is calculated as:
BW
AFED *=
(7.6)
where:
D = dose (mg/kg-day); E = exposure (mg/day); AF = absorption factor (inhalation); and BW = body weight (kg).
[ ])*(1** ETACHO e
ACHIRC
E −−=

Indoor Environments
U.S. EPA Office of Pesticide Programs – Standard Operating Procedures for Assessing Residential Pesticide Exposure 7-13
(2) Exposure to pesticide vapors The basis for this scenario is that post-application inhalation exposure occurs from the emission of pesticide vapors from a treated surface. The well-mixed box (WMB) model was used to develop the exposure equation for assessing post-application inhalation exposure from vapor emissions. The WMB model was used to model pesticide air concentrations within an enclosed, fixed volume (i.e., a box) over time during the variable emission of a pesticide from a treated surface. The model incorporates a number of simplifying assumptions: (1) fresh air (having no pesticide concentration) enters the box at a constant airflow rate
(based on the number of air changes per hour), (2) a turbulent internal airflow thoroughly mixes the fresh air with the pesticide-laden air
resulting in a uniform pesticide air concentration within the box, and (3) the perfectly mixed air exits the box at the same constant airflow rate (i.e., the inflow rate
equals the outflow rate). Thus, the indoor area where the pesticide is being applied is assumed to be in an enclosed box, which is a reasonable assumption for a walled, indoor space. The removal of the pesticide from the box depends on airflow. For an indoor scenario, the airflow is the product of the volume of the treated space and the number of air changes per hour, ACH. The WMB model developed for this scenario models the pesticide air concentrations after a surface-directed spray application or after residues have settled onto the floor surface from a fogger or space spray application. Only dissipation due to airflow into and out of the box is modeled. Post-application inhalation exposure to vapors for adults/children resulting from indoor spray applications can be calculated using the following equation (See Section D.3.6 of Appendix D for equation description and derivation): (7.7) where:
E = exposure (mg/day); IR = inhalation rate (m3/hr); Mlabel = mass of active ingredient applied, determined from product label (mg); Vroom = volume of room (m3); ACH = air exchanges per hour (1/hr); k = first order decay rate (1/hr); and ET = exposure time (hr).
In the above equation, a mass of pesticide is applied to a surface and the emission of the pesticide from the surface is assumed to decline over time due to dissipation of the pesticide (i.e., emission from the treated surface and removal due to the air exchange rate). The mass of active ingredient applied can be calculated using the following formula:
( ) ( )
−−
−=−−
kACHekeACH
VACHMIR
EETACHETk
room
label** **1*
**

Indoor Environments
U.S. EPA Office of Pesticide Programs – Standard Operating Procedures for Assessing Residential Pesticide Exposure 7-14
Mlabel = AR * A * CF1
(7.8)
where: Mlabel = mass of active ingredient applied, determined from product label (mg); AR = application rate (e.g., lb ai/ft2, lb ai/gal); A = area treated or amount handled (e.g., ft2/day, gal/day); and CF1 = conversion factor (4.54x10⁵ mg/lb).
The exposure equation models an emission rate that decreases over time, which is based on a first-order decay rate constant (k). Evans (1994) proposed calculating such a decay rate based on work done by Chinn (1981). Chinn developed the following relationship between the volatility, or saturation concentration (Csat), of a chemical and the time required for 90% of the chemical to evaporate (EvapT):
EvapT = 10[7.3698 – 0.9546 * log10
(Csat
)]
(7.9)
where:
EvapT = evaporation time (sec); and Csat = saturation concentration (mg/m3).
Evans proposed the following equation to calculate the decay rate (or dissipation rate) that defines the change in the emission rate based on the evaporation time described by Chinn: (7.10) where:
k = first order decay rate (1/hr), CF1 = conversion factor (sec/hr), and EvapT = evaporation time (sec).
**Saturation concentration verification** In the vapor emission assessment, post-application inhalation exposure occurs from the release of vapors following a surface treatment indoors. The concentration of pesticide in the air is modeled over time to calculate exposure. The maximum concentration allowed in the air should be the saturation concentration, calculated as a function of the pesticide’s molecular weight and vapor pressure. The equation used to model the air concentration is not bound by the saturation concentration; therefore, the reviewer must perform a check to make sure the exposures being calculated are valid. The exposure equation above is based on the mass of pesticide applied, not the concentration of the pesticide in the air; therefore, the reviewer must check that the input for mass applied (Mlabel) is predicting an air concentration less than or equal to the saturation concentration. The following equation can be used to calculate the theoretical mass applied that would result in an air concentration that reaches the saturation concentration for a pesticide (MCsat):
( )
=
EvapTCFE 1*10ln
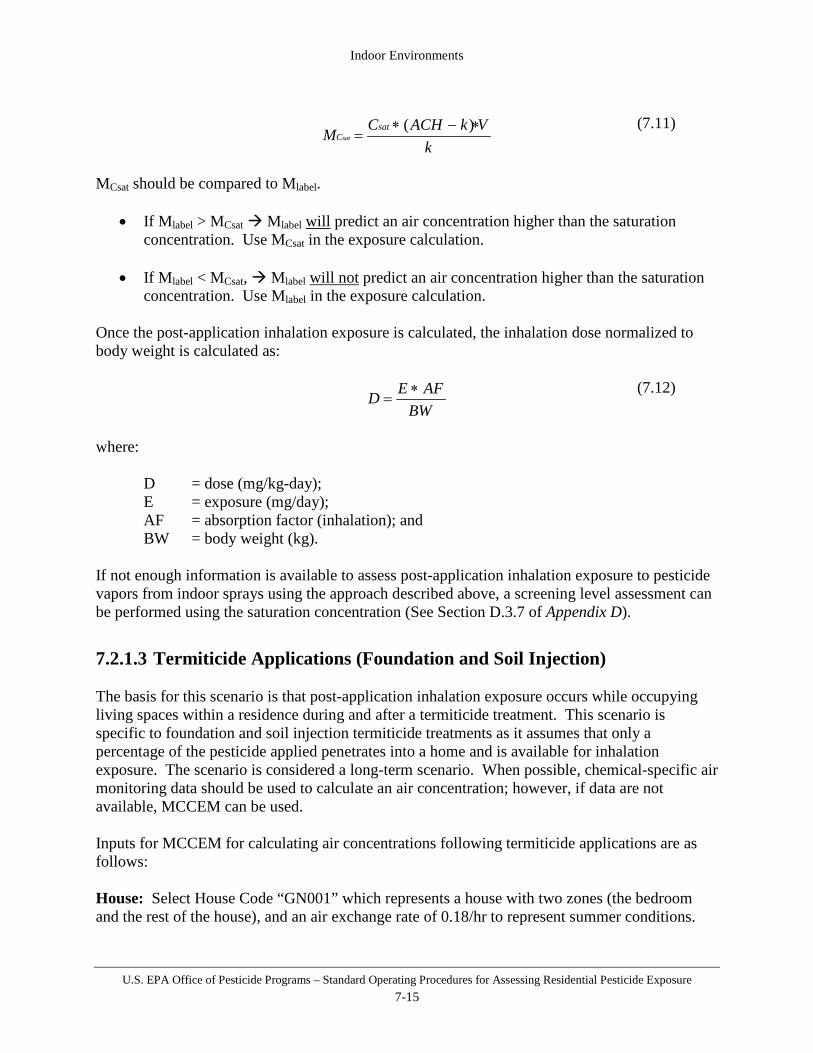
Indoor Environments
U.S. EPA Office of Pesticide Programs – Standard Operating Procedures for Assessing Residential Pesticide Exposure 7-15
k
VkACHCM satCsat
∗−∗=
)( (7.11)
MCsat should be compared to Mlabel.
• If Mlabel > MCsat Mlabel will predict an air concentration higher than the saturation concentration. Use MCsat in the exposure calculation.
• If Mlabel < MCsat, Mlabel will not predict an air concentration higher than the saturation
concentration. Use Mlabel in the exposure calculation. Once the post-application inhalation exposure is calculated, the inhalation dose normalized to body weight is calculated as:
BW
AFED ∗=
(7.12)
where:
D = dose (mg/kg-day); E = exposure (mg/day); AF = absorption factor (inhalation); and BW = body weight (kg).
If not enough information is available to assess post-application inhalation exposure to pesticide vapors from indoor sprays using the approach described above, a screening level assessment can be performed using the saturation concentration (See Section D.3.7 of Appendix D).
7.2.1.3 Termiticide Applications (Foundation and Soil Injection) The basis for this scenario is that post-application inhalation exposure occurs while occupying living spaces within a residence during and after a termiticide treatment. This scenario is specific to foundation and soil injection termiticide treatments as it assumes that only a percentage of the pesticide applied penetrates into a home and is available for inhalation exposure. The scenario is considered a long-term scenario. When possible, chemical-specific air monitoring data should be used to calculate an air concentration; however, if data are not available, MCCEM can be used. Inputs for MCCEM for calculating air concentrations following termiticide applications are as follows: House: Select House Code “GN001” which represents a house with two zones (the bedroom and the rest of the house), and an air exchange rate of 0.18/hr to represent summer conditions.
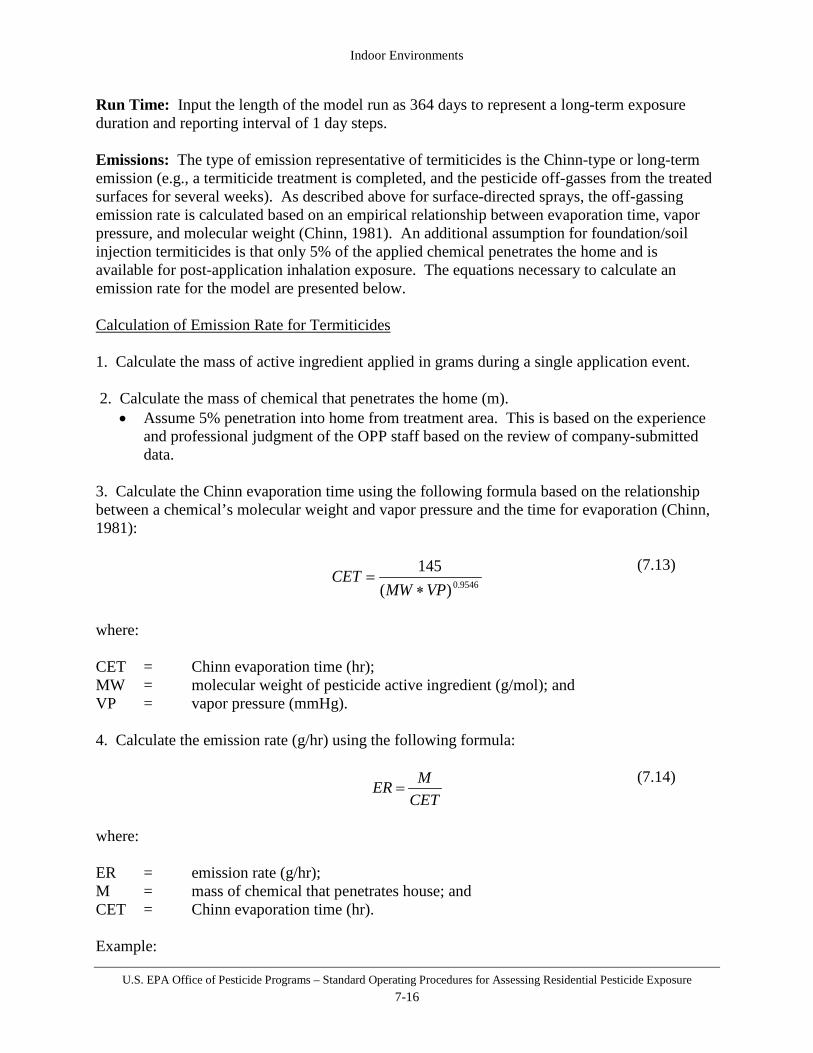
Indoor Environments
U.S. EPA Office of Pesticide Programs – Standard Operating Procedures for Assessing Residential Pesticide Exposure 7-16
Run Time: Input the length of the model run as 364 days to represent a long-term exposure duration and reporting interval of 1 day steps. Emissions: The type of emission representative of termiticides is the Chinn-type or long-term emission (e.g., a termiticide treatment is completed, and the pesticide off-gasses from the treated surfaces for several weeks). As described above for surface-directed sprays, the off-gassing emission rate is calculated based on an empirical relationship between evaporation time, vapor pressure, and molecular weight (Chinn, 1981). An additional assumption for foundation/soil injection termiticides is that only 5% of the applied chemical penetrates the home and is available for post-application inhalation exposure. The equations necessary to calculate an emission rate for the model are presented below. Calculation of Emission Rate for Termiticides 1. Calculate the mass of active ingredient applied in grams during a single application event. 2. Calculate the mass of chemical that penetrates the home (m).
• Assume 5% penetration into home from treatment area. This is based on the experience and professional judgment of the OPP staff based on the review of company-submitted data.
3. Calculate the Chinn evaporation time using the following formula based on the relationship between a chemical’s molecular weight and vapor pressure and the time for evaporation (Chinn, 1981):
9546.0)(145
VPMWCET
∗=
(7.13)
where: CET = Chinn evaporation time (hr); MW = molecular weight of pesticide active ingredient (g/mol); and VP = vapor pressure (mmHg). 4. Calculate the emission rate (g/hr) using the following formula:
CET
MER = (7.14)
where: ER = emission rate (g/hr); M = mass of chemical that penetrates house; and CET = Chinn evaporation time (hr). Example:

Indoor Environments
U.S. EPA Office of Pesticide Programs – Standard Operating Procedures for Assessing Residential Pesticide Exposure 7-17
Application rate = 5 lb ai/gal Vapor pressure of 5x10⁻³ mmHg Molecular weight of 500 g/mol Amount applied = 5 lb ai/gal * 100 gal/day = 500 lb ai/day * 454 g/lb = 227,000 g ai/day Amount penetrates home = 227,000 g * 0.05 = 11,350 g CET = 145/((500 * (5x10-3))0.9546) = 60.5 hours and ER = 11,350/60.5 = 188 grams/hour This emission rate should be input into the model as a constant rate with an end time of 364 days. Sinks/Activities/Dose/Monte Carlo: Not used for high-end assessments. Options: Choose to run a single-chamber model. Other options should stay as defaults. After all of the inputs have been entered into the model, the assessor should run the model and save the output files for review purposes. The concentration applicable to long-term termiticide applications is the average daily concentration (ADC). This value should be used in the dose equation below. Post-application inhalation dose normalized to body weight is calculated as:
BW
AFETIRADCD ∗∗∗=
(7.15)
where: D = dose (mg/kg-day); ADC = average daily concentration (mg/m3); IR = inhalation rate (m3/hr); ET = exposure time (hr); AF = absorption factor (inhalation); and BW = body weight (kg). Post-application Inhalation Exposure Algorithm Inputs and Assumptions Recommended values for post-application inhalation exposure assessments are provided in Table 7-3 below. Following this table, each scenario-specific input parameter is described in more detail. This description includes a summary of i) key assumptions, ii) data sources used to derive recommended input values, and iii) discussion of limitations that should be addressed when characterizing exposure.
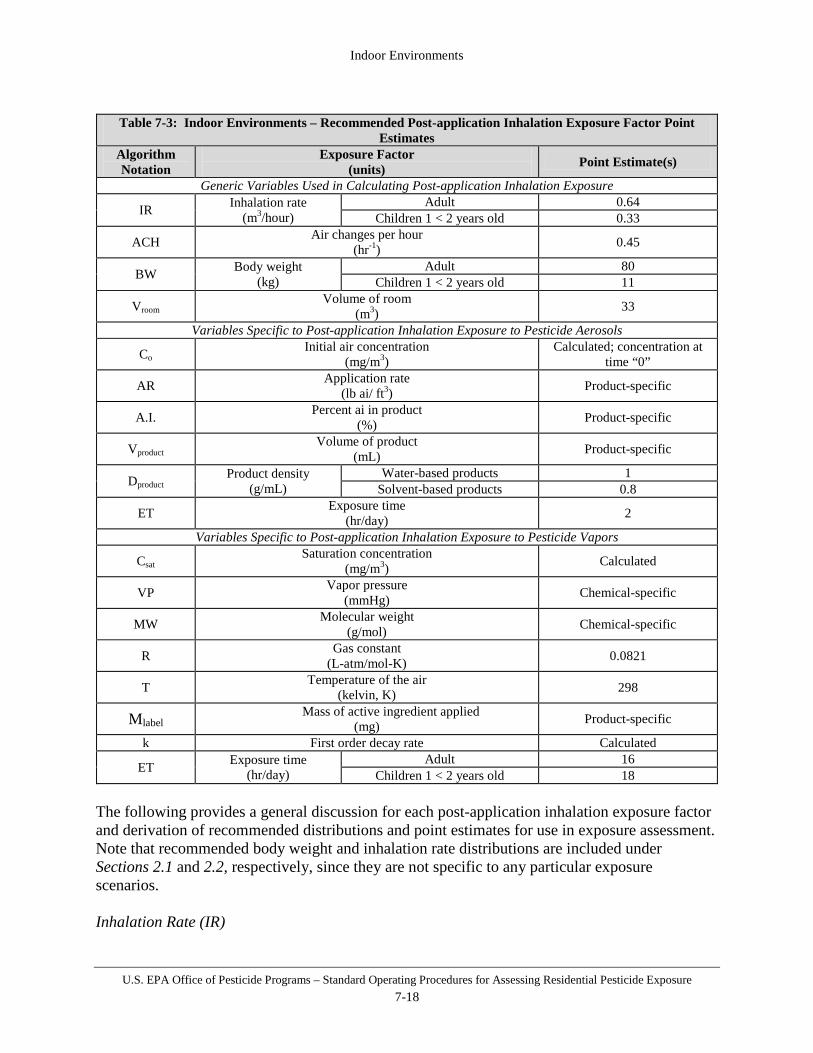
Indoor Environments
U.S. EPA Office of Pesticide Programs – Standard Operating Procedures for Assessing Residential Pesticide Exposure 7-18
Table 7-3: Indoor Environments – Recommended Post-application Inhalation Exposure Factor Point
Estimates Algorithm Notation
Exposure Factor (units) Point Estimate(s)
Generic Variables Used in Calculating Post-application Inhalation Exposure
IR Inhalation rate (m3/hour)
Adult 0.64 Children 1 < 2 years old 0.33
ACH Air changes per hour (hr-1) 0.45
BW Body weight (kg)
Adult 80 Children 1 < 2 years old 11
Vroom Volume of room
(m3) 33
Variables Specific to Post-application Inhalation Exposure to Pesticide Aerosols
Co Initial air concentration
(mg/m3) Calculated; concentration at
time “0”
AR Application rate (lb ai/ ft3) Product-specific
A.I. Percent ai in product (%) Product-specific
Vproduct Volume of product
(mL) Product-specific
Dproduct Product density
(g/mL) Water-based products 1
Solvent-based products 0.8
ET Exposure time (hr/day) 2
Variables Specific to Post-application Inhalation Exposure to Pesticide Vapors
Csat Saturation concentration
(mg/m3) Calculated
VP Vapor pressure (mmHg) Chemical-specific
MW Molecular weight (g/mol) Chemical-specific
R Gas constant (L-atm/mol-K) 0.0821
T Temperature of the air (kelvin, K) 298
Mlabel Mass of active ingredient applied
(mg) Product-specific
k First order decay rate Calculated
ET Exposure time (hr/day)
Adult 16 Children 1 < 2 years old 18
The following provides a general discussion for each post-application inhalation exposure factor and derivation of recommended distributions and point estimates for use in exposure assessment. Note that recommended body weight and inhalation rate distributions are included under Sections 2.1 and 2.2, respectively, since they are not specific to any particular exposure scenarios. Inhalation Rate (IR)
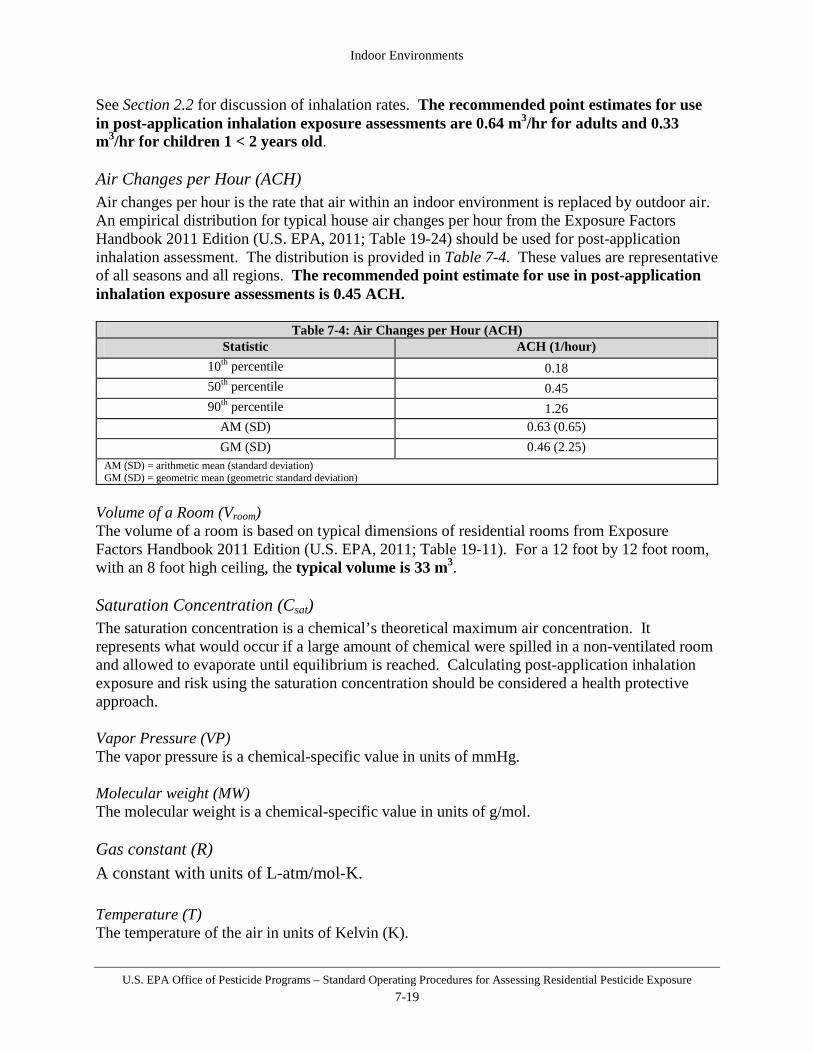
Indoor Environments
U.S. EPA Office of Pesticide Programs – Standard Operating Procedures for Assessing Residential Pesticide Exposure 7-19
See Section 2.2 for discussion of inhalation rates. The recommended point estimates for use in post-application inhalation exposure assessments are 0.64 m3/hr for adults and 0.33 m3/hr for children 1 < 2 years old. Air Changes per Hour (ACH) Air changes per hour is the rate that air within an indoor environment is replaced by outdoor air. An empirical distribution for typical house air changes per hour from the Exposure Factors Handbook 2011 Edition (U.S. EPA, 2011; Table 19-24) should be used for post-application inhalation assessment. The distribution is provided in Table 7-4. These values are representative of all seasons and all regions. The recommended point estimate for use in post-application inhalation exposure assessments is 0.45 ACH.
Table 7-4: Air Changes per Hour (ACH) Statistic ACH (1/hour)
10th percentile 0.18 50th percentile 0.45 90th percentile 1.26
AM (SD) 0.63 (0.65) GM (SD) 0.46 (2.25)
AM (SD) = arithmetic mean (standard deviation) GM (SD) = geometric mean (geometric standard deviation)
Volume of a Room (Vroom) The volume of a room is based on typical dimensions of residential rooms from Exposure Factors Handbook 2011 Edition (U.S. EPA, 2011; Table 19-11). For a 12 foot by 12 foot room, with an 8 foot high ceiling, the typical volume is 33 m3. Saturation Concentration (Csat) The saturation concentration is a chemical’s theoretical maximum air concentration. It represents what would occur if a large amount of chemical were spilled in a non-ventilated room and allowed to evaporate until equilibrium is reached. Calculating post-application inhalation exposure and risk using the saturation concentration should be considered a health protective approach. Vapor Pressure (VP) The vapor pressure is a chemical-specific value in units of mmHg. Molecular weight (MW) The molecular weight is a chemical-specific value in units of g/mol. Gas constant (R) A constant with units of L-atm/mol-K. Temperature (T) The temperature of the air in units of Kelvin (K).

Indoor Environments
U.S. EPA Office of Pesticide Programs – Standard Operating Procedures for Assessing Residential Pesticide Exposure 7-20
Mass of active ingredient applied (Mlabel) The mass of active ingredient applied can be determined from the application rate and the amount handled or area treated assumed for a residential handler (e.g., lb ai/gallon * gallons = lb applied). First Order Decay Rate (k) The decay rate, k, defines the change in the emission rate from the treated surface. As proposed by Evans (1994), the decay rate constant is based on the 90% drying time. The 90% drying time, in turn, is calculated based on the evaporation time and volatility of the chemical using equations from Chinn (1981) 13. Exposure Time (ET) For space sprays (e.g., flying insect killers), it is assumed that after application, the aerosol droplets will settle out of the air and will be dispersed due to air exchange within the house; therefore, based on information regarding particle size and settling time, a point estimate of 2 hours is used in the SOP. For vapor emissions from indoor applications and termiticides, it is assumed that the vapors can continue to emit over time; therefore, exposure time is related to time spent in a residence. Empirical distributions for adults and children are provided in the Exposure Factors Handbook 2011 Edition (U.S. EPA, 2011; Adults -- Tables 16-16 and 16-26; Children – Tables 16-15 and 16-25). The distribution for exposure time for adults and for children 1 < 2 years old is provided in Table 7-5. The recommended point estimates for use in post-application inhalation exposure assessments are 16 hours for adults and 18 hours for children 1 < 2 years old.
Table 7-5: Exposure Time (ET, hours) Statistic Adults 1 to <2 years
5th percentile 9 11 25th percentile 13 15 50th percentile 15 18 75th percentile 19 21 90th percentile 23 24 95th percentile 24 24
AM (SD) 16 (5) 18 (SD not listed) AM (SD) = arithmetic mean (standard deviation)
13 Based on information in Guo (2002; Part 2), one method to estimate first order decay rate constants was proposed by Evans (1994). Evans proposed estimating the decay rate constant (k) for solvent emissions (i.e., total volatile organic compounds) from coating materials (i.e., solvent based paint) based on the 90% drying time of the solvent (t0.9). This relationship is represented by the following equation: k = (ln10) / t0.9. The 90% drying time of a chemical can be calculated based on the volatility (or saturation concentration) of a chemical using the following equation: log10 t0.9 = 7.3698 – 0.9546 log10Cv. This relationship was determined by Chinn (1981) by measuring the time for 90% evaporation of a number of chemicals and graphing that against the volatility of those chemicals.
Indoor Environments
U.S. EPA Office of Pesticide Programs – Standard Operating Procedures for Assessing Residential Pesticide Exposure 7-21
Air Concentration (Co) The initial concentration is based upon instantaneous release of diluted product and complete mixing into an enclosed space. Application Rate (AR) The application rate is the amount of spray applied. The application rate can be determined from product specific factors that are listed on the label. Percent A.I. in product (A.I.) The percent of active ingredient (ai) in the product is a product-specific value and should be stated on the label. Volume of product (V product) The volume of product (mL/can) is a product-specific value and should be stated on the label. Product Density (Dproduct) The density should represent the product being assessed. If the product is water-based, the assessor should use the density of water (1.0 g/mL). If the product is solvent-based, the assessor should use 0.8 g/mL, an average based on an informal survey of various organic solvents described in CRC (Lide, 1981). Future Research/Data Needs Information that would refine post-application inhalation exposure assessments for indoor pesticide applications include:
• Air concentration data collected after space spray and surface-directed applications, both immediately after and over time. Measurements should include differentiation between aerosols, vapors and dusts/resuspension.
• For surface-directed spray applications, air concentration data for various types of application methods, including broadcast, perimeter and crack and crevice.
• More information on fogger particle sizes and settling time. • Resuspension of pesticide particles after initial application and potential for inhalation
exposure. • More information on the percent of the applied chemical that penetrates a house
following a termiticide application.
Exposure Characterization and Data Quality Air concentration
• The indoor post-application inhalation SOP makes the health protective assumption that all of the applied pesticide is in the air available for inhalation exposure, and then that all of the applied pesticide settles onto the floor and is available for dermal exposure. In addition, dissipation of pesticides indoors is not taken into account for post-application inhalation exposure.
• The well-mixed box model for the instantaneous release/aerosol scenario does not take
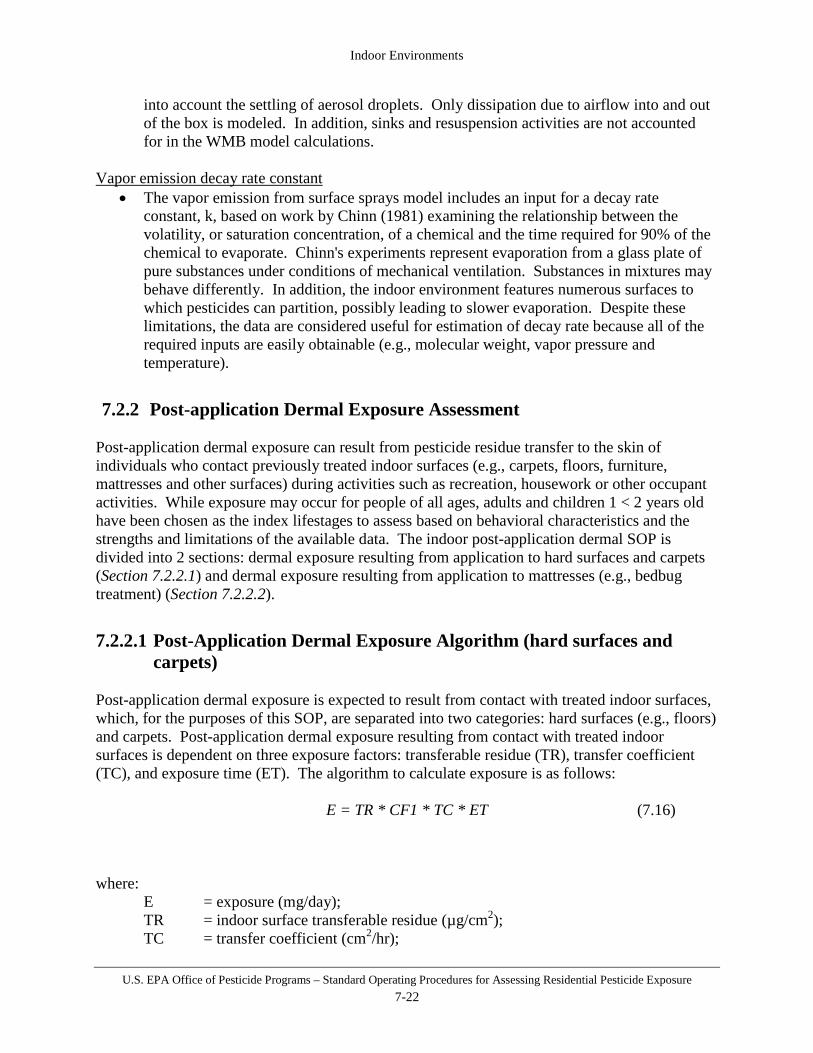
Indoor Environments
U.S. EPA Office of Pesticide Programs – Standard Operating Procedures for Assessing Residential Pesticide Exposure 7-22
into account the settling of aerosol droplets. Only dissipation due to airflow into and out of the box is modeled. In addition, sinks and resuspension activities are not accounted for in the WMB model calculations.
Vapor emission decay rate constant
• The vapor emission from surface sprays model includes an input for a decay rate constant, k, based on work by Chinn (1981) examining the relationship between the volatility, or saturation concentration, of a chemical and the time required for 90% of the chemical to evaporate. Chinn's experiments represent evaporation from a glass plate of pure substances under conditions of mechanical ventilation. Substances in mixtures may behave differently. In addition, the indoor environment features numerous surfaces to which pesticides can partition, possibly leading to slower evaporation. Despite these limitations, the data are considered useful for estimation of decay rate because all of the required inputs are easily obtainable (e.g., molecular weight, vapor pressure and temperature).
7.2.2 Post-application Dermal Exposure Assessment Post-application dermal exposure can result from pesticide residue transfer to the skin of individuals who contact previously treated indoor surfaces (e.g., carpets, floors, furniture, mattresses and other surfaces) during activities such as recreation, housework or other occupant activities. While exposure may occur for people of all ages, adults and children 1 < 2 years old have been chosen as the index lifestages to assess based on behavioral characteristics and the strengths and limitations of the available data. The indoor post-application dermal SOP is divided into 2 sections: dermal exposure resulting from application to hard surfaces and carpets (Section 7.2.2.1) and dermal exposure resulting from application to mattresses (e.g., bedbug treatment) (Section 7.2.2.2).
7.2.2.1 Post-Application Dermal Exposure Algorithm (hard surfaces and carpets)
Post-application dermal exposure is expected to result from contact with treated indoor surfaces, which, for the purposes of this SOP, are separated into two categories: hard surfaces (e.g., floors) and carpets. Post-application dermal exposure resulting from contact with treated indoor surfaces is dependent on three exposure factors: transferable residue (TR), transfer coefficient (TC), and exposure time (ET). The algorithm to calculate exposure is as follows:
E = TR * CF1 * TC * ET
(7.16)
where:
E = exposure (mg/day); TR = indoor surface transferable residue (µg/cm2); TC = transfer coefficient (cm2/hr);

Indoor Environments
U.S. EPA Office of Pesticide Programs – Standard Operating Procedures for Assessing Residential Pesticide Exposure 7-23
ET = exposure time (hr/day); and CF1 = conversion factor (0.001 mg/µg).
If chemical-specific TR data are available, this is preferred and should be used to calculate exposure. However, if chemical-specific TR data are not available, then TR can be calculated using the following formula:
TR = DepR * Fai
(7.17)
where:
TR = indoor surface transferable residue (µg/cm2); DepR = deposited residue (µg/cm2), based on (in order of preference): (1) Chemical-specific residue deposition data (µg/cm2), (2) Application rate (lb ai/area), or (3) Default residue based on type of application (µg/cm2); and Fai = fraction of ai available for transfer from carpet or hard surface (unitless).
Absorbed dermal dose, normalized to body weight, are calculated as:
BW
AFED *=
(7.18)
where:
D = dose (mg/kg-day); E = exposure (mg/day); AF = absorption factor; and BW = body weight (kg).
Post-application dermal exposure following applications indoors is generally considered short-term in duration, but is dependent on the use pattern of the specific product being assessed and the dissipation/degradation properties of the active ingredient. Refinement of this dose estimate to reflect a more accurate short-term multi-day exposure profile can be accomplished by accounting for the various factors outlined in Sections 1.3.2 and 1.3.4, such as residue dissipation, product-specific re-treatment intervals, and activity patterns. If longer-term assessments (i.e., intermediate-, long-term, or lifetime exposures) are deemed necessary, similar refinements to more accurately reflect the exposure profile are recommended. Post-application Dermal Exposure Algorithm Inputs and Assumptions (hard surfaces and carpets) Recommended values for post-application dermal exposure assessments for hard surfaces (e.g., floors) and carpets are provided in Table 7-6 below. Following this table, each scenario-specific input parameter is described in more detail. This description includes a summary of i) key assumptions; ii) data sources used to derive recommended input values; and iii) discussion of limitations that should be addressed when characterizing exposure.
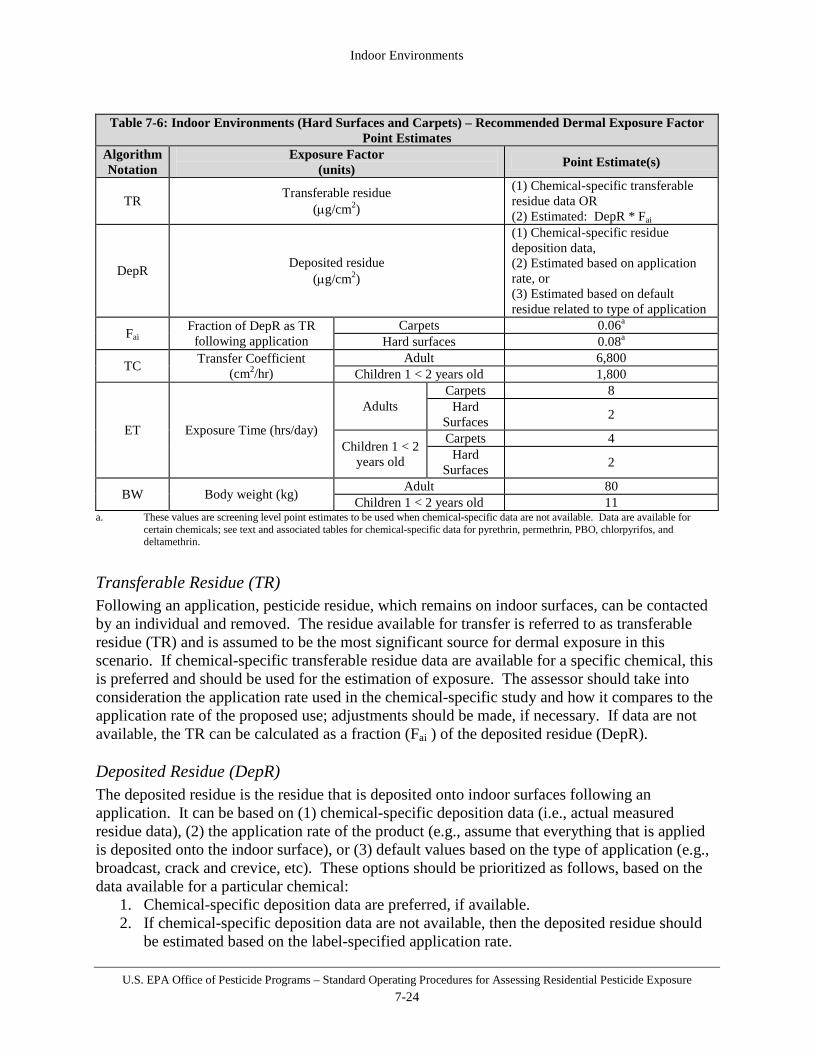
Indoor Environments
U.S. EPA Office of Pesticide Programs – Standard Operating Procedures for Assessing Residential Pesticide Exposure 7-24
Table 7-6: Indoor Environments (Hard Surfaces and Carpets) – Recommended Dermal Exposure Factor
Point Estimates Algorithm Notation
Exposure Factor (units) Point Estimate(s)
TR Transferable residue (µg/cm2)
(1) Chemical-specific transferable residue data OR (2) Estimated: DepR * Fai
DepR Deposited residue (µg/cm2)
(1) Chemical-specific residue deposition data, (2) Estimated based on application rate, or (3) Estimated based on default residue related to type of application
Fai Fraction of DepR as TR
following application Carpets 0.06a
Hard surfaces 0.08a
TC Transfer Coefficient (cm2/hr)
Adult 6,800 Children 1 < 2 years old 1,800
ET Exposure Time (hrs/day)
Adults Carpets 8
Hard Surfaces 2
Children 1 < 2 years old
Carpets 4 Hard
Surfaces 2
BW Body weight (kg) Adult 80 Children 1 < 2 years old 11
a. These values are screening level point estimates to be used when chemical-specific data are not available. Data are available for certain chemicals; see text and associated tables for chemical-specific data for pyrethrin, permethrin, PBO, chlorpyrifos, and deltamethrin.
Transferable Residue (TR) Following an application, pesticide residue, which remains on indoor surfaces, can be contacted by an individual and removed. The residue available for transfer is referred to as transferable residue (TR) and is assumed to be the most significant source for dermal exposure in this scenario. If chemical-specific transferable residue data are available for a specific chemical, this is preferred and should be used for the estimation of exposure. The assessor should take into consideration the application rate used in the chemical-specific study and how it compares to the application rate of the proposed use; adjustments should be made, if necessary. If data are not available, the TR can be calculated as a fraction (Fai ) of the deposited residue (DepR). Deposited Residue (DepR) The deposited residue is the residue that is deposited onto indoor surfaces following an application. It can be based on (1) chemical-specific deposition data (i.e., actual measured residue data), (2) the application rate of the product (e.g., assume that everything that is applied is deposited onto the indoor surface), or (3) default values based on the type of application (e.g., broadcast, crack and crevice, etc). These options should be prioritized as follows, based on the data available for a particular chemical:
1. Chemical-specific deposition data are preferred, if available. 2. If chemical-specific deposition data are not available, then the deposited residue should
be estimated based on the label-specified application rate.

Indoor Environments
U.S. EPA Office of Pesticide Programs – Standard Operating Procedures for Assessing Residential Pesticide Exposure 7-25
3. If neither chemical-specific data nor an application rate is available, default deposited residues should be used based on the type of application.
Figure 7-1 provides a summary of these three options and also shows the approaches for the different types of application methods [e.g., broadcast, perimeter/spot/bedbug (coarse application), perimeter/spot/bedbug (pinstream application), and crack and crevice], which are discussed in more detail below.

Indoor Environments
U.S. EPA Office of Pesticide Programs – Standard Operating Procedures for Assessing Residential Pesticide Exposure 7-26
DepR, ug/cm2 (Deposited Residue)
(1) Chemical-specific deposition data:
use residue measurements collected from a study
(1a) Broadcast (liquid and fogger/space spray
formulations) Use the average residue of all the
coupons in the study room
(1b) Perimeter/Spot/Bedbug (Coarse application)
Use a weighted average residue of 70% of the residue in the
untreated area of the room and 30% of the residue in the treated
area of the room
(1c) Perimeter/Spot/Bedbug (Pin Stream application)
Use a weighted average residue of 70% of the residue in the
untreated area of the room and 30% of the residue in the treated
area of the room
(1d) Crack and crevice Use a weighted average residue
of 90% of the residue in the untreated area of the room and
10% of the residue in the treated area of the room
(2) Application rate: use rate provided on label and
convert to ug/cm2
(2a) Broadcast (liquid and fogger /space spray
formulations) Use the application rate on the
label
(2b) Perimeter/Spot/Bedbug (Coarse application)
Use 50% of the application rate
on the label
(2c) Perimeter/Spot/Bedbug (Pin Stream application)
Use 50% of the application rate
on the label
(2d) Crack and crevice (Pin Stream application)
Use 10% of the application rate
on the label
(3) Default values: use default residue values based
on type of application
(3a) Broadcast (liquid and fogger formulations) Liquids: 15 ug/cm2 Fogger: 5.4 ug/cm2
(3b) Perimeter/Spot/Bedbug (Coarse application)
4.5 ug/cm2
(3c) Perimeter/Spot/Bedbug (Pin Stream application)
1.1 ug/cm2
(3d) Crack and crevice
0.3 ug/cm2
Figure 7-1: Summary of approaches for calculating the deposited residue for use in the dermal post-
application exposure calculation.
Indoor Environments
U.S. EPA Office of Pesticide Programs – Standard Operating Procedures for Assessing Residential Pesticide Exposure 7-27
Approach 1 for calculating deposited residue: (1) Chemical-specific deposition data -- use residue measurements collected from a study. For some chemicals, a study may be available in which the pesticide was applied to a room and residue data were collected from the floor using deposition coupons. It should be noted that in October of 2007, the Agency revised the data requirements that pertain to conventional pesticides. As part of these revisions, indoor surface residue studies were classified as required under 40 CFR 158, subpart K (158.1070; post-application exposure data requirements table). Deposition studies provide not only the magnitude of the deposited residue in a room, but also the distribution of residue in a room. The distribution of residue in a room will differ depending on the type of application made (i.e., broadcast, perimeter, or crack and crevice). For example, it is expected that residues will be evenly distributed throughout a room after a broadcast application, whereas after a perimeter application, residues will be higher near the outer edges of a room than in the center of a room. Both the magnitude and distribution of residues in a room will impact a person’s exposure.
An indoor deposition study should collect residue data after an application for a particular pesticide is made. As with chemical-specific transferable residue data, the assessor should take into consideration the application rate used in the chemical-specific study and how it compares to the application rate of the proposed use; adjustments should be made, if necessary. The assessor should also take into consideration the application method used in the study and make sure that it is representative of the proposed use being assessed. Once the data are analyzed, the following deposited residue values should be calculated using the available data. A discussion of these values is provided below.
(1a) Broadcast (liquid and fogger formulations): Use the average residue of all the coupons in the study room.
DepR = Average of residues measured on all coupons in room
(1b) Perimeter/Spot/Bedbug (Coarse application): Use a weighted average residue of 70% of the residue in the untreated area of the room and 30% of the residue in the treated area of the room.
DepR = (70% * average residue untreated area) + (30% * average residue treated area)
(1c) Perimeter/Spot/Bedbug (Pin Stream application): Use a weighted average residue of 70% of the residue in the untreated area of the room and 30% of the residue in the treated area of the room.
DepR = (70% * average residue untreated area) + (30% * average residue treated area)
(1d) Crack and crevice: Use a weighted average residue of 90% of the residue in the untreated area of the room and 10% of the residue in the treated area of the room.
DepR = (90% * average residue untreated area) + (10% * average residue treated area)
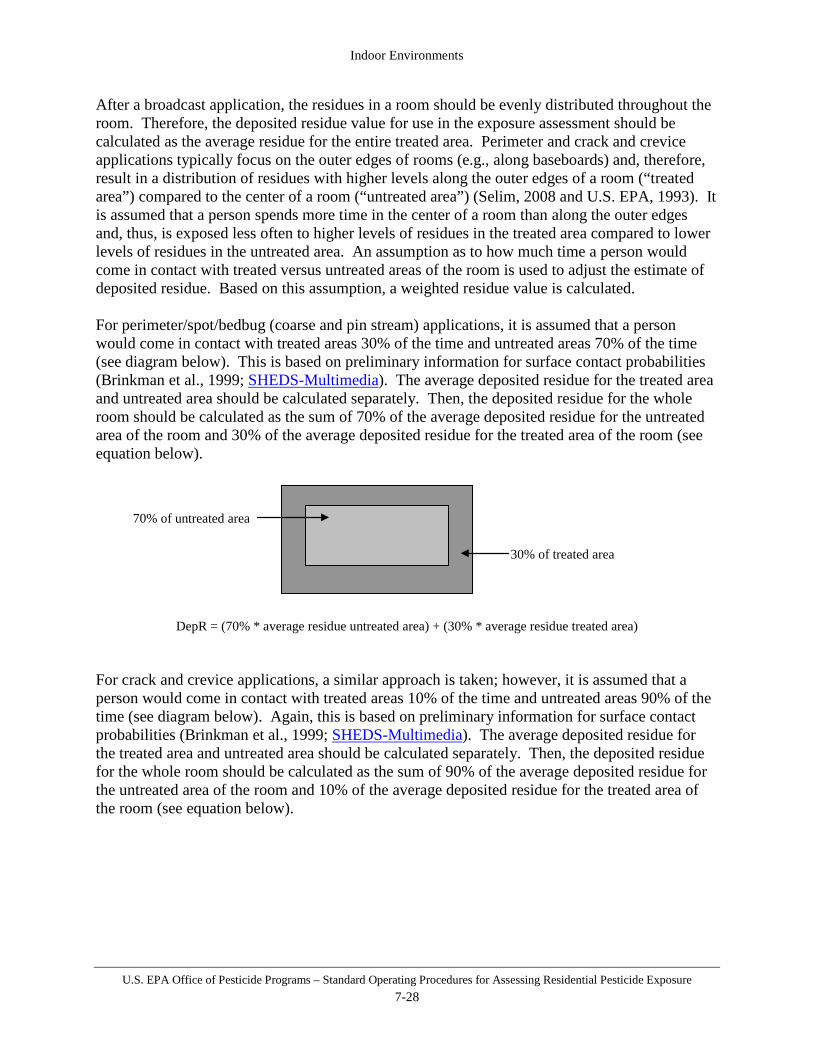
Indoor Environments
U.S. EPA Office of Pesticide Programs – Standard Operating Procedures for Assessing Residential Pesticide Exposure 7-28
After a broadcast application, the residues in a room should be evenly distributed throughout the room. Therefore, the deposited residue value for use in the exposure assessment should be calculated as the average residue for the entire treated area. Perimeter and crack and crevice applications typically focus on the outer edges of rooms (e.g., along baseboards) and, therefore, result in a distribution of residues with higher levels along the outer edges of a room (“treated area”) compared to the center of a room (“untreated area”) (Selim, 2008 and U.S. EPA, 1993). It is assumed that a person spends more time in the center of a room than along the outer edges and, thus, is exposed less often to higher levels of residues in the treated area compared to lower levels of residues in the untreated area. An assumption as to how much time a person would come in contact with treated versus untreated areas of the room is used to adjust the estimate of deposited residue. Based on this assumption, a weighted residue value is calculated.
For perimeter/spot/bedbug (coarse and pin stream) applications, it is assumed that a person would come in contact with treated areas 30% of the time and untreated areas 70% of the time (see diagram below). This is based on preliminary information for surface contact probabilities (Brinkman et al., 1999; SHEDS-Multimedia). The average deposited residue for the treated area and untreated area should be calculated separately. Then, the deposited residue for the whole room should be calculated as the sum of 70% of the average deposited residue for the untreated area of the room and 30% of the average deposited residue for the treated area of the room (see equation below).
DepR = (70% * average residue untreated area) + (30% * average residue treated area) For crack and crevice applications, a similar approach is taken; however, it is assumed that a person would come in contact with treated areas 10% of the time and untreated areas 90% of the time (see diagram below). Again, this is based on preliminary information for surface contact probabilities (Brinkman et al., 1999; SHEDS-Multimedia). The average deposited residue for the treated area and untreated area should be calculated separately. Then, the deposited residue for the whole room should be calculated as the sum of 90% of the average deposited residue for the untreated area of the room and 10% of the average deposited residue for the treated area of the room (see equation below).
70% of untreated area
30% of treated area
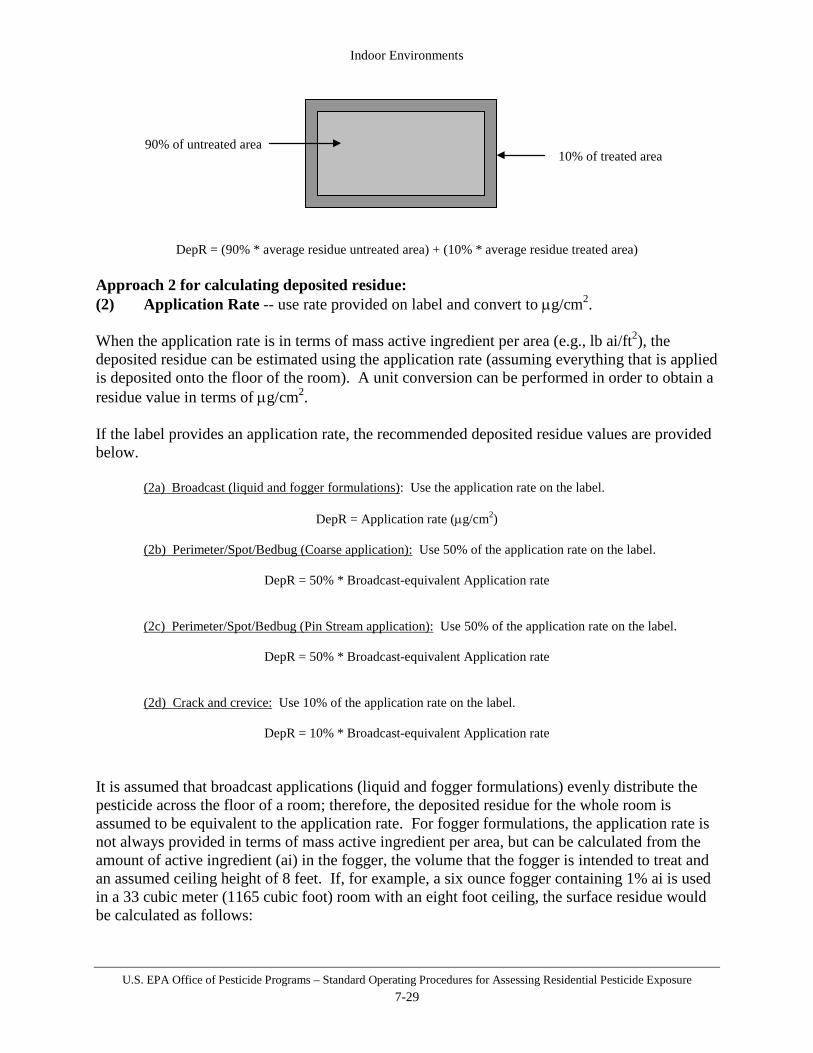
Indoor Environments
U.S. EPA Office of Pesticide Programs – Standard Operating Procedures for Assessing Residential Pesticide Exposure 7-29
DepR = (90% * average residue untreated area) + (10% * average residue treated area)
Approach 2 for calculating deposited residue: (2) Application Rate -- use rate provided on label and convert to µg/cm2. When the application rate is in terms of mass active ingredient per area (e.g., lb ai/ft2), the deposited residue can be estimated using the application rate (assuming everything that is applied is deposited onto the floor of the room). A unit conversion can be performed in order to obtain a residue value in terms of µg/cm2. If the label provides an application rate, the recommended deposited residue values are provided below.
(2a) Broadcast (liquid and fogger formulations): Use the application rate on the label.
DepR = Application rate (µg/cm2)
(2b) Perimeter/Spot/Bedbug (Coarse application): Use 50% of the application rate on the label.
DepR = 50% * Broadcast-equivalent Application rate
(2c) Perimeter/Spot/Bedbug (Pin Stream application): Use 50% of the application rate on the label.
DepR = 50% * Broadcast-equivalent Application rate
(2d) Crack and crevice: Use 10% of the application rate on the label.
DepR = 10% * Broadcast-equivalent Application rate
It is assumed that broadcast applications (liquid and fogger formulations) evenly distribute the pesticide across the floor of a room; therefore, the deposited residue for the whole room is assumed to be equivalent to the application rate. For fogger formulations, the application rate is not always provided in terms of mass active ingredient per area, but can be calculated from the amount of active ingredient (ai) in the fogger, the volume that the fogger is intended to treat and an assumed ceiling height of 8 feet. If, for example, a six ounce fogger containing 1% ai is used in a 33 cubic meter (1165 cubic foot) room with an eight foot ceiling, the surface residue would be calculated as follows:
90% of untreated area 10% of treated area
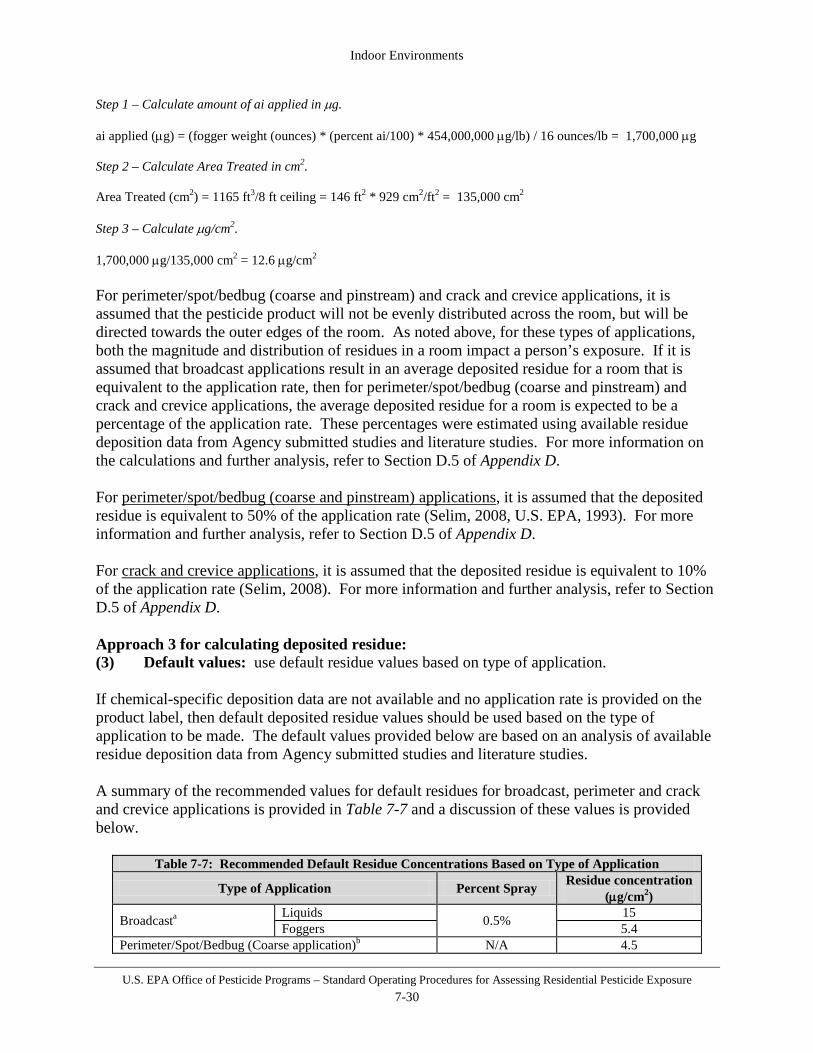
Indoor Environments
U.S. EPA Office of Pesticide Programs – Standard Operating Procedures for Assessing Residential Pesticide Exposure 7-30
Step 1 – Calculate amount of ai applied in µg.
ai applied (µg) = (fogger weight (ounces) * (percent ai/100) * 454,000,000 µg/lb) / 16 ounces/lb = 1,700,000 µg Step 2 – Calculate Area Treated in cm2.
Area Treated (cm2) = 1165 ft3/8 ft ceiling = 146 ft2 * 929 cm2/ft2 = 135,000 cm2 Step 3 – Calculate µg/cm2. 1,700,000 µg/135,000 cm2 = 12.6 µg/cm2 For perimeter/spot/bedbug (coarse and pinstream) and crack and crevice applications, it is assumed that the pesticide product will not be evenly distributed across the room, but will be directed towards the outer edges of the room. As noted above, for these types of applications, both the magnitude and distribution of residues in a room impact a person’s exposure. If it is assumed that broadcast applications result in an average deposited residue for a room that is equivalent to the application rate, then for perimeter/spot/bedbug (coarse and pinstream) and crack and crevice applications, the average deposited residue for a room is expected to be a percentage of the application rate. These percentages were estimated using available residue deposition data from Agency submitted studies and literature studies. For more information on the calculations and further analysis, refer to Section D.5 of Appendix D.
For perimeter/spot/bedbug (coarse and pinstream) applications, it is assumed that the deposited residue is equivalent to 50% of the application rate (Selim, 2008, U.S. EPA, 1993). For more information and further analysis, refer to Section D.5 of Appendix D.
For crack and crevice applications, it is assumed that the deposited residue is equivalent to 10% of the application rate (Selim, 2008). For more information and further analysis, refer to Section D.5 of Appendix D. Approach 3 for calculating deposited residue: (3) Default values: use default residue values based on type of application.
If chemical-specific deposition data are not available and no application rate is provided on the product label, then default deposited residue values should be used based on the type of application to be made. The default values provided below are based on an analysis of available residue deposition data from Agency submitted studies and literature studies.
A summary of the recommended values for default residues for broadcast, perimeter and crack and crevice applications is provided in Table 7-7 and a discussion of these values is provided below.
Table 7-7: Recommended Default Residue Concentrations Based on Type of Application
Type of Application Percent Spray Residue concentration (µg/cm2)
Broadcasta Liquids 0.5% 15 Foggers 5.4
Perimeter/Spot/Bedbug (Coarse application)b N/A 4.5
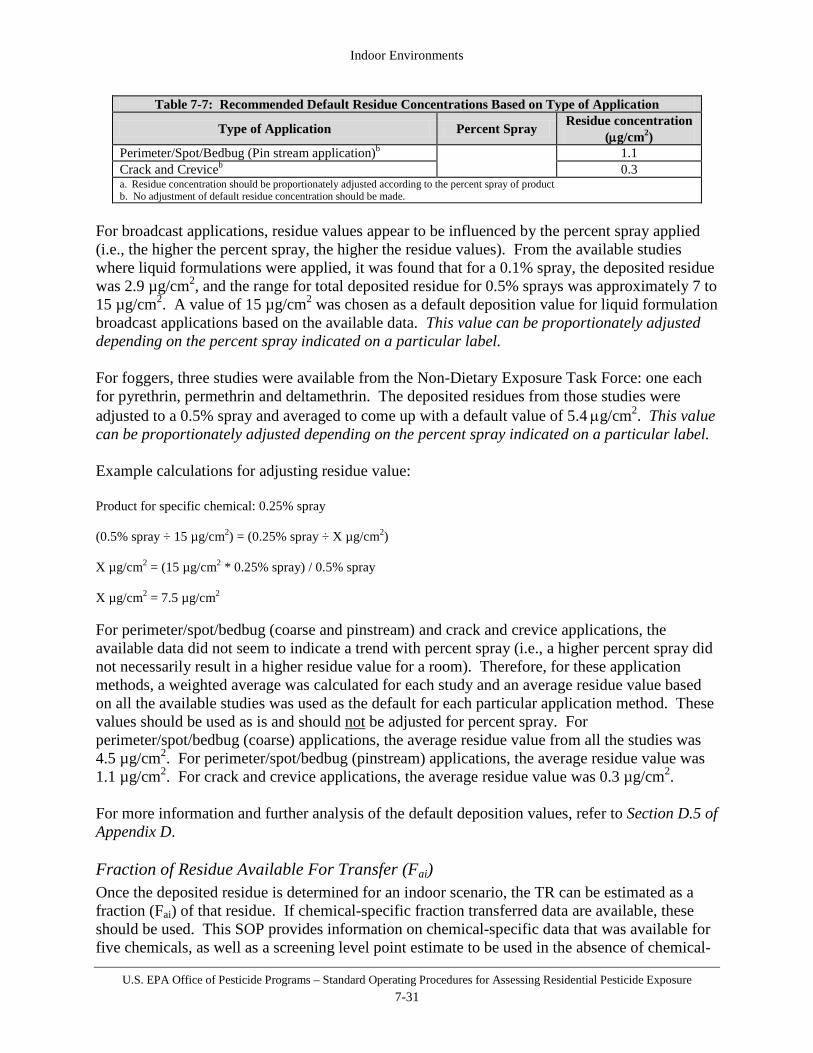
Indoor Environments
U.S. EPA Office of Pesticide Programs – Standard Operating Procedures for Assessing Residential Pesticide Exposure 7-31
Table 7-7: Recommended Default Residue Concentrations Based on Type of Application
Type of Application Percent Spray Residue concentration (µg/cm2)
Perimeter/Spot/Bedbug (Pin stream application)b 1.1 Crack and Creviceb 0.3 a. Residue concentration should be proportionately adjusted according to the percent spray of product b. No adjustment of default residue concentration should be made.
For broadcast applications, residue values appear to be influenced by the percent spray applied (i.e., the higher the percent spray, the higher the residue values). From the available studies where liquid formulations were applied, it was found that for a 0.1% spray, the deposited residue was 2.9 µg/cm2, and the range for total deposited residue for 0.5% sprays was approximately 7 to 15 µg/cm2. A value of 15 µg/cm2 was chosen as a default deposition value for liquid formulation broadcast applications based on the available data. This value can be proportionately adjusted depending on the percent spray indicated on a particular label. For foggers, three studies were available from the Non-Dietary Exposure Task Force: one each for pyrethrin, permethrin and deltamethrin. The deposited residues from those studies were adjusted to a 0.5% spray and averaged to come up with a default value of 5.4 µg/cm2. This value can be proportionately adjusted depending on the percent spray indicated on a particular label. Example calculations for adjusting residue value: Product for specific chemical: 0.25% spray (0.5% spray ÷ 15 µg/cm2) = (0.25% spray ÷ X µg/cm2) X µg/cm2 = (15 µg/cm2 * 0.25% spray) / 0.5% spray X µg/cm2 = 7.5 µg/cm2 For perimeter/spot/bedbug (coarse and pinstream) and crack and crevice applications, the available data did not seem to indicate a trend with percent spray (i.e., a higher percent spray did not necessarily result in a higher residue value for a room). Therefore, for these application methods, a weighted average was calculated for each study and an average residue value based on all the available studies was used as the default for each particular application method. These values should be used as is and should not be adjusted for percent spray. For perimeter/spot/bedbug (coarse) applications, the average residue value from all the studies was 4.5 µg/cm2. For perimeter/spot/bedbug (pinstream) applications, the average residue value was 1.1 µg/cm2. For crack and crevice applications, the average residue value was 0.3 µg/cm2. For more information and further analysis of the default deposition values, refer to Section D.5 of Appendix D. Fraction of Residue Available For Transfer (Fai) Once the deposited residue is determined for an indoor scenario, the TR can be estimated as a fraction (Fai) of that residue. If chemical-specific fraction transferred data are available, these should be used. This SOP provides information on chemical-specific data that was available for five chemicals, as well as a screening level point estimate to be used in the absence of chemical-

Indoor Environments
U.S. EPA Office of Pesticide Programs – Standard Operating Procedures for Assessing Residential Pesticide Exposure 7-32
specific data. Fraction transferred values are provided for both carpets and hard surfaces since the type of surface can influence the fraction of deposited residue that can be transferred. The values for fraction of residue transferred from carpets and hard surfaces are based on information provided from two sources, which examine transferability of a variety of chemicals from both surfaces.
1) Beamer et. al (2009): performed an extensive analysis of numerous transfer efficiency studies which covered various methods (including the cloth roller, drag sled, PUF roller, and bare hand press), surfaces (hard surfaces/sheet vinyl and carpets) and various chemicals (chlorpyrifos, pyrethrin and piperonyl butoxide (PBO)). Sources included: Camann, 1996; Fortune, 1997; Krieger, 2000; Ross, 1991; Clothier, 2000.
2) Non-Dietary Exposure Task Force (NDETF): examined transferability for bare hand-presses on carpets and vinyl/hard surfaces for deltamethrin, permethrin, PBO and pyrethrin.
Complete datasets (using data from all available sources) were compiled for five chemicals: pyrethrin, permethrin, piperonyl butoxide (PBO), chlorpyrifos and deltamethrin. These datasets were analyzed and the results are provided in Table 7-8 and Table 7-9, for carpets and hard surfaces, respectively. For the chemicals in Table 7-8 and Table 7-9, that have chemical-specific data available, the arithmetic means should be used in post-application dermal exposure assessments. For chemicals not included in those tables, chemical-specific data are preferred, but if not available, a screening level value is recommended based on the available data. For chemicals that do not have chemical-specific data available, the recommended screening level point estimates for use in post-application dermal exposure assessments are 0.06 for carpets and 0.08 for hard surfaces. For further information on the fraction transferred factor, see Section D.6 of Appendix D.
Table 7-8: Chemical-specific Fraction transferred (Fai) for Carpets Statistic Pyrethrin Permethrin PBO Chlorpyrifos Deltamethrin
50th percentile 0.02 0.02 0.02 0.01 0.01 75th percentile 0.04 0.02 0.03 0.02 0.02 90th percentile 0.05 0.03 0.04 0.03 0.02 95th percentile 0.07 0.03 0.05 0.03 0.03 99th percentile 0.11 0.04 0.07 0.05 0.04
99.9th percentile 0.19 0.05 0.10 0.08 0.05 AM (SD) 0.03 (0.12) 0.02 (0.06) 0.02 (0.08) 0.02 (0.06) 0.01 (0.05)
GM (GSD) 0.02 (2.00) 0.02 (1.38) 0.02 (1.70) 0.01 (1.72) 0.01 (1.56) Range 0.002 - 0.086 0.010 - 0.032 0.007 - 0.065 0.003 - 0.045 0.005 - 0.020
N 91 14 105 155 10 AM (SD) = arithmetic mean (standard deviation) GM (GSD) = geometric mean (geometric standard deviation)

Indoor Environments
U.S. EPA Office of Pesticide Programs – Standard Operating Procedures for Assessing Residential Pesticide Exposure 7-33
Table 7-9: Chemical-specific Fraction transferred (Fai) for Hard Surfaces
Statistic Pyrethrin Permethrin PBO Chlorpyrifos Deltamethrin 50th percentile 0.04 0.02 0.02 0.06 0.04 75th percentile 0.08 0.03 0.05 0.13 0.06 90th percentile 0.14 0.05 0.10 0.28 0.08 95th percentile 0.20 0.07 0.15 0.45 0.10 99th percentile 0.37 0.11 0.32 1.08 0.15
99.9th percentile 0.75 0.19 0.76 2.85 0.24 Arithmetic mean 0.07 (0.42) 0.03 (0.12) 0.05 (0.42) 0.13 (1.73) 0.05 (0.18) Geometric Mean 0.04 (2.49) 0.02 (2.06) 0.02 (3.03) 0.06 (3.57) 0.04 (1.80)
Range 0.002 - 0.449 0.006 - 0.049 0.004 - 0.571 0.005 - 0.601 0.017 - 0.124 N 60 14 74 24 10
AM (SD) = arithmetic mean (standard deviation) GM (GSD) = geometric mean (geometric standard deviation)
Transfer Coefficient (TC) The transfer coefficient (TC) provides a measure of surface-to-skin residue transfer and is derived from concurrent measurements of exposure and surface residue. Specifically, the TC is the ratio of exposure rate, measured in mass of chemical per time (i.e., µg/hr), to residue, measured in mass of chemical per surface area (i.e., µg/cm2). Table 7-10 provides the distribution for the transfer coefficient factor for indoor surfaces.
Table 7-10: Transfer coefficients (TC; cm2/hr) Statistic Adult Children 1 < 2 years old
50th percentile 4,700 1,300 75th percentile 7,800 2,100 95th percentile 17,000 4,600 99th percentile 28,000 7,600
99.9th percentile 50,000 14,000 AM (SD) 6,800 (8,200) 1,800 (2,200)
GM (GSD) 4,700 (2.16) 1,300 (2.16)
Range 1,200 – 49,000 330 – 13,000 a. A 73% reduction in the adult transfer coefficient is recommended because of the differences of body surface areas between adults and children (1 < 2 years old). AM (SD) = arithmetic mean (standard deviation) GM (GSD) = geometric mean (geometric standard deviation)
There are no studies available that measure both exposure and surface residue while subjects are performing typical indoor activities. Therefore, the transfer coefficients used for indoor scenarios are derived from information provided in three different studies: (1) two studies which measured exposure and surface residues while subjects performed a Jazzercise™ routine (Krieger, 2000 and Selim, 2004) and (2) a study which measured biomonitoring doses while adults performed scripted activities for 4 hours on carpet (Vaccaro, 1991). In the Krieger and Selim studies, a Jazzercise™ routine was performed to achieve maximum contact of the entire body with a surface using low impact aerobic movements. All body surfaces (dorsal, ventral, and lateral) contacted the treated surface. The potential dermal

Indoor Environments
U.S. EPA Office of Pesticide Programs – Standard Operating Procedures for Assessing Residential Pesticide Exposure 7-34
exposure was measured by using whole-body dosimetry. The dosimeters were expected to normalize differences in surface contact and to increase the total sample area relative to patches. The assumption is that the dosimeter represents the skin and that the dose retained by the dosimeter is equivalent to dermal exposure. In the Vaccaro study, adult males, dressed in bathing suits only, performed different activities over a 4-hour activity period. These activities included: sitting-playing with blocks, on hands and knees crawling, walking on carpet, laying on back, and laying on abdomen. Although activity was minimal during the last 2 activities, considerable surface area was in contact with the carpets during these times. Using information from these studies on residue transfer, exposure and dose provides an estimated transfer coefficient for indoor activities. It is assumed that the shorter duration of high contact activity (i.e., Jazzercise™) can be used to estimate exposure during longer durations of low contact activity. For more information and full analysis of the transfer coefficient factor, see Section D.7.3 of Appendix D. For adults, the recommended TC point estimate for post-application dermal exposure assessments is 6,800 cm2/hr. The transfer coefficient for children 1 < 2 years old is calculated based on an adjustment of the adult transfer coefficient for differences in body surface area outlined in Section 2.3. A factor of 0.27 (i.e., a 73% TC reduction) is used for this lifestage. For children 1 < 2 years old, the recommended TC point estimate for post-application dermal exposure assessments is 1,800 cm2/hr. Exposure Time (ET) An empirical distribution based on values from the Exposure Factors Handbook 2011 Edition (U.S. EPA, 2011; Adults -- Tables 16-16 and 16-26; Children – Tables 16-15 and 16-25) should be used for indoor post-application dermal assessments. The distributions for exposure time for adults and for children 1 < 2 years old are provided in Table 7-11. A study which provides information specific to time spent on different types of surfaces indoors is not available. The Exposure Factors Handbook 2011 Edition provides information on total time spent in a residence and time spent in various rooms within a residence. In order to develop inputs for exposure time on carpets and hard surfaces, two assumptions were made: (1) kitchens and bathrooms would represent time spent on hard surfaces and (2) time spent in a residence, less time spent sleeping and napping, would represent time spent on carpets. For adults, the recommended ET point estimates for post-application dermal exposure assessments are 8 and 2 hours on carpets and hard surfaces, respectively. For children 1 < 2 years old, the recommended ET point estimate for post-application dermal exposure assessments are 4 and 2 hours on carpets and hard surfaces, respectively.
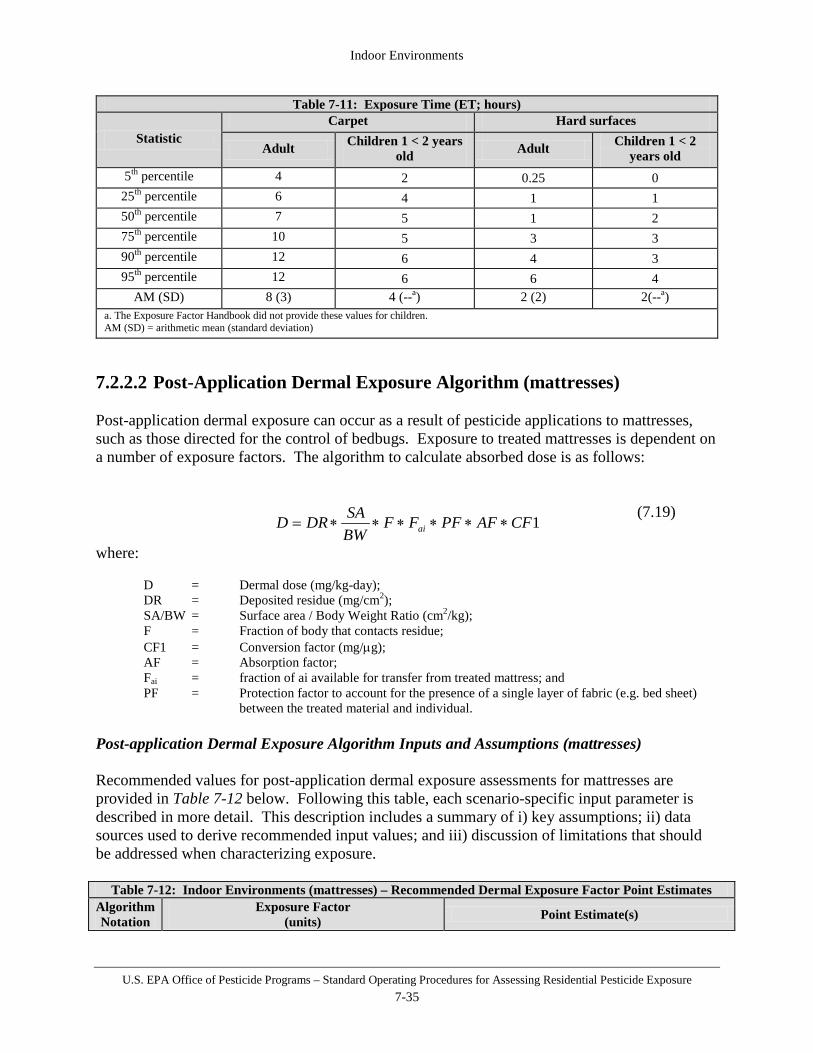
Indoor Environments
U.S. EPA Office of Pesticide Programs – Standard Operating Procedures for Assessing Residential Pesticide Exposure 7-35
Table 7-11: Exposure Time (ET; hours)
Statistic Carpet Hard surfaces
Adult Children 1 < 2 years old Adult Children 1 < 2
years old 5th percentile 4 2 0.25 0
25th percentile 6 4 1 1 50th percentile 7 5 1 2 75th percentile 10 5 3 3 90th percentile 12 6 4 3 95th percentile 12 6 6 4
AM (SD) 8 (3) 4 (--a) 2 (2) 2(--a) a. The Exposure Factor Handbook did not provide these values for children. AM (SD) = arithmetic mean (standard deviation)
7.2.2.2 Post-Application Dermal Exposure Algorithm (mattresses) Post-application dermal exposure can occur as a result of pesticide applications to mattresses, such as those directed for the control of bedbugs. Exposure to treated mattresses is dependent on a number of exposure factors. The algorithm to calculate absorbed dose is as follows:
1CFAFPFFFBWSADRD ai ∗∗∗∗∗∗=
(7.19)
where: D = Dermal dose (mg/kg-day); DR = Deposited residue (mg/cm2); SA/BW = Surface area / Body Weight Ratio (cm2/kg); F = Fraction of body that contacts residue; CF1 = Conversion factor (mg/µg); AF = Absorption factor; Fai = fraction of ai available for transfer from treated mattress; and PF = Protection factor to account for the presence of a single layer of fabric (e.g. bed sheet) between the treated material and individual. Post-application Dermal Exposure Algorithm Inputs and Assumptions (mattresses) Recommended values for post-application dermal exposure assessments for mattresses are provided in Table 7-12 below. Following this table, each scenario-specific input parameter is described in more detail. This description includes a summary of i) key assumptions; ii) data sources used to derive recommended input values; and iii) discussion of limitations that should be addressed when characterizing exposure.
Table 7-12: Indoor Environments (mattresses) – Recommended Dermal Exposure Factor Point Estimates Algorithm Notation
Exposure Factor (units) Point Estimate(s)

Indoor Environments
U.S. EPA Office of Pesticide Programs – Standard Operating Procedures for Assessing Residential Pesticide Exposure 7-36
Table 7-12: Indoor Environments (mattresses) – Recommended Dermal Exposure Factor Point Estimates Algorithm Notation
Exposure Factor (units) Point Estimate(s)
DR Deposited residue (µg/cm2)
(1) Calculated based on information provided on label OR
(2) based on default residue values
SA/BW Surface area / Body Weight
Ratio (cm2/kg)
Adult 280 Children 1 < 2
years old 640
F Fraction of body that contacts residue 0.5
Fai Fraction of DR available for transfer 0.06
PF Protection Factor 0.5
Deposited Residue (DR) Following an application to a mattress, pesticide residue deposited onto the surface of the mattress could be contacted by an individual and removed. This residue can be estimated based on information on the product label and high end assumptions or by using default residue values. If an application rate is provided on the label, assumptions can be made in terms of the size of the mattress and the amount of product applied. It is assumed that an adult or child sleeps on a twin-sized mattress, since it is believed that this scenario would result in the greatest body surface area to treated surface area ratio and, therefore, the highest exposure. The following assumptions can be made to determine a deposited residue: Percent of mattress treated:
• If the product label includes use directions that indicate the product should be applied to “tufts, seams, folds and edges” of the mattress, a reasonable assumption is that this equates to 20% of the total surface area. This value should be adjusted according to the specific instructions on the label (i.e., if the label use directions indicate application to the entire mattress, the assumption should be 100% of the total surface area).
Volume of product applied to mattress:
• A typical twin-sized mattress has dimensions of 39” x 75”14, resulting in a total surface area of approximately 3,000 in2 or 19,000 cm2.
• To calculate the total treated surface area:
Total treated surface area (cm2) = Percent of mattress treated (%) * total surface area (19,000 cm2)
• Unless specific information is provided on the product label, assume that a reasonable estimate for amount of product used for a twin mattress application is 5 gallons of solution for 1000 square feet (0.005 gal/ft2).
• To calculate the volume of product applied (gallons) to the mattress:
14 http://www.mattresssizes.info/
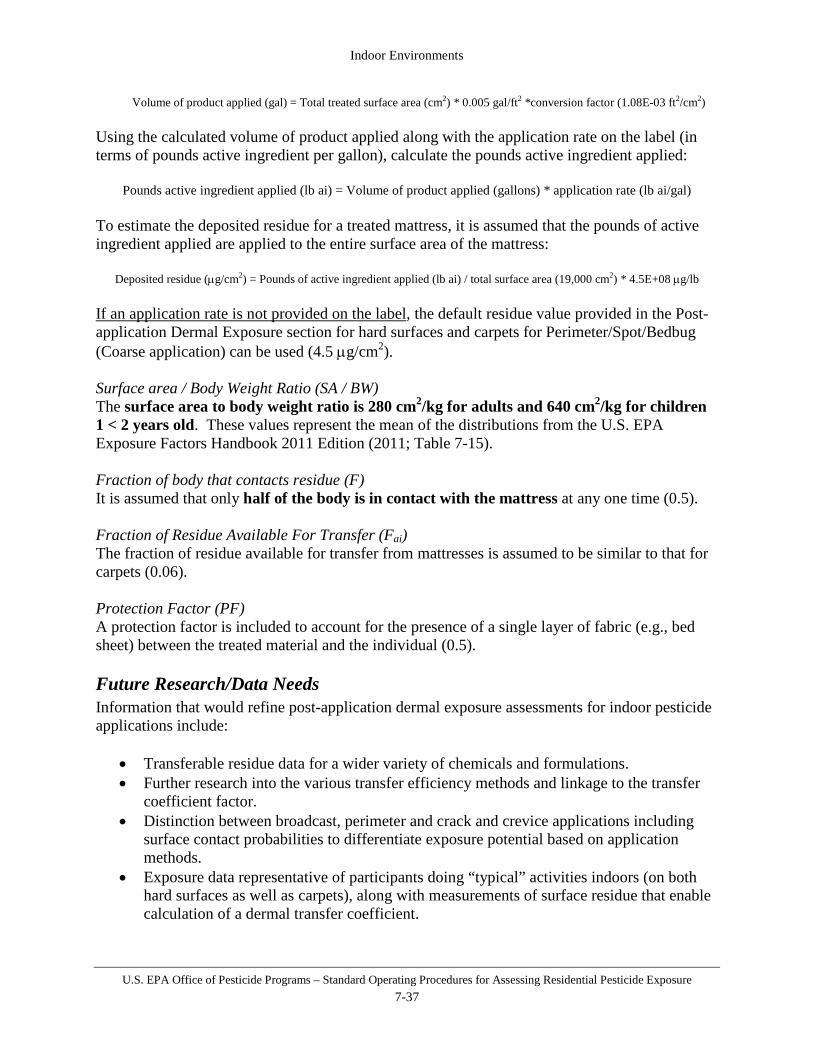
Indoor Environments
U.S. EPA Office of Pesticide Programs – Standard Operating Procedures for Assessing Residential Pesticide Exposure 7-37
Volume of product applied (gal) = Total treated surface area (cm2) * 0.005 gal/ft2 *conversion factor (1.08E-03 ft2/cm2)
Using the calculated volume of product applied along with the application rate on the label (in terms of pounds active ingredient per gallon), calculate the pounds active ingredient applied:
Pounds active ingredient applied (lb ai) = Volume of product applied (gallons) * application rate (lb ai/gal) To estimate the deposited residue for a treated mattress, it is assumed that the pounds of active ingredient applied are applied to the entire surface area of the mattress:
Deposited residue (µg/cm2) = Pounds of active ingredient applied (lb ai) / total surface area (19,000 cm2) * 4.5E+08 µg/lb If an application rate is not provided on the label, the default residue value provided in the Post-application Dermal Exposure section for hard surfaces and carpets for Perimeter/Spot/Bedbug (Coarse application) can be used (4.5 µg/cm2). Surface area / Body Weight Ratio (SA / BW) The surface area to body weight ratio is 280 cm2/kg for adults and 640 cm2/kg for children 1 < 2 years old. These values represent the mean of the distributions from the U.S. EPA Exposure Factors Handbook 2011 Edition (2011; Table 7-15). Fraction of body that contacts residue (F) It is assumed that only half of the body is in contact with the mattress at any one time (0.5). Fraction of Residue Available For Transfer (Fai) The fraction of residue available for transfer from mattresses is assumed to be similar to that for carpets (0.06). Protection Factor (PF) A protection factor is included to account for the presence of a single layer of fabric (e.g., bed sheet) between the treated material and the individual (0.5). Future Research/Data Needs Information that would refine post-application dermal exposure assessments for indoor pesticide applications include:
• Transferable residue data for a wider variety of chemicals and formulations. • Further research into the various transfer efficiency methods and linkage to the transfer
coefficient factor. • Distinction between broadcast, perimeter and crack and crevice applications including
surface contact probabilities to differentiate exposure potential based on application methods.
• Exposure data representative of participants doing “typical” activities indoors (on both hard surfaces as well as carpets), along with measurements of surface residue that enable calculation of a dermal transfer coefficient.
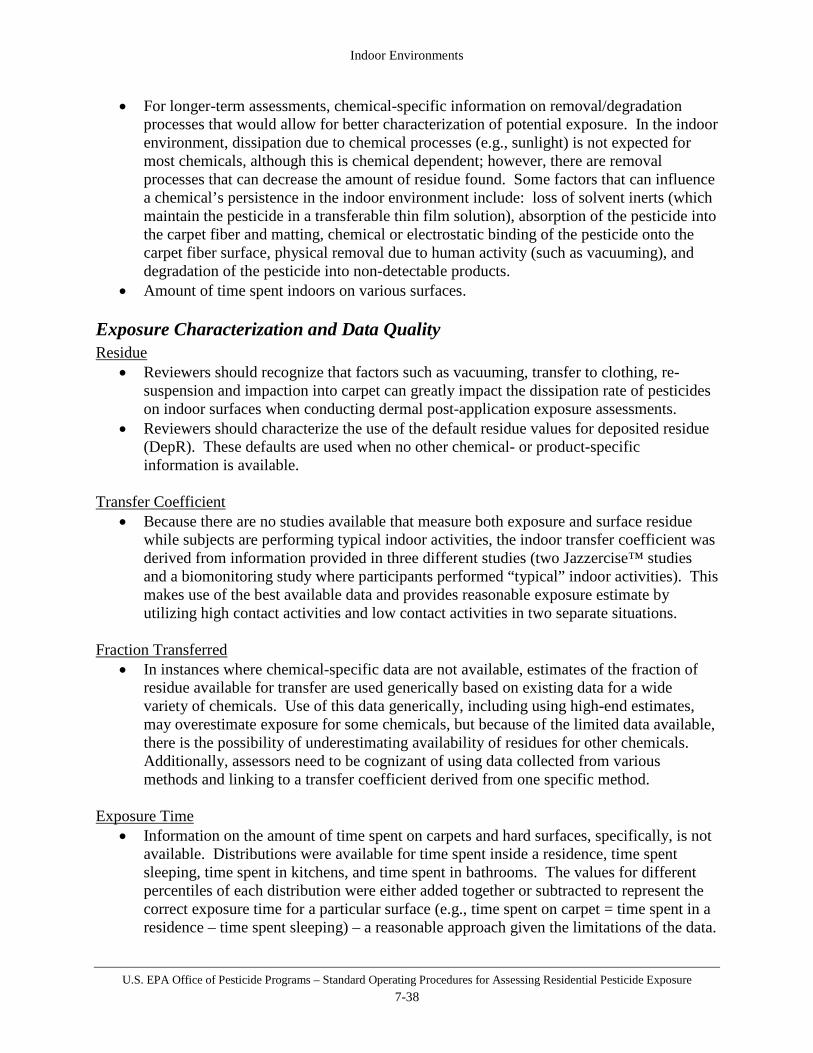
Indoor Environments
U.S. EPA Office of Pesticide Programs – Standard Operating Procedures for Assessing Residential Pesticide Exposure 7-38
• For longer-term assessments, chemical-specific information on removal/degradation processes that would allow for better characterization of potential exposure. In the indoor environment, dissipation due to chemical processes (e.g., sunlight) is not expected for most chemicals, although this is chemical dependent; however, there are removal processes that can decrease the amount of residue found. Some factors that can influence a chemical’s persistence in the indoor environment include: loss of solvent inerts (which maintain the pesticide in a transferable thin film solution), absorption of the pesticide into the carpet fiber and matting, chemical or electrostatic binding of the pesticide onto the carpet fiber surface, physical removal due to human activity (such as vacuuming), and degradation of the pesticide into non-detectable products.
• Amount of time spent indoors on various surfaces.
Exposure Characterization and Data Quality Residue
• Reviewers should recognize that factors such as vacuuming, transfer to clothing, re-suspension and impaction into carpet can greatly impact the dissipation rate of pesticides on indoor surfaces when conducting dermal post-application exposure assessments.
• Reviewers should characterize the use of the default residue values for deposited residue (DepR). These defaults are used when no other chemical- or product-specific information is available.
Transfer Coefficient
• Because there are no studies available that measure both exposure and surface residue while subjects are performing typical indoor activities, the indoor transfer coefficient was derived from information provided in three different studies (two Jazzercise™ studies and a biomonitoring study where participants performed “typical” indoor activities). This makes use of the best available data and provides reasonable exposure estimate by utilizing high contact activities and low contact activities in two separate situations.
Fraction Transferred
• In instances where chemical-specific data are not available, estimates of the fraction of residue available for transfer are used generically based on existing data for a wide variety of chemicals. Use of this data generically, including using high-end estimates, may overestimate exposure for some chemicals, but because of the limited data available, there is the possibility of underestimating availability of residues for other chemicals. Additionally, assessors need to be cognizant of using data collected from various methods and linking to a transfer coefficient derived from one specific method.
Exposure Time
• Information on the amount of time spent on carpets and hard surfaces, specifically, is not available. Distributions were available for time spent inside a residence, time spent sleeping, time spent in kitchens, and time spent in bathrooms. The values for different percentiles of each distribution were either added together or subtracted to represent the correct exposure time for a particular surface (e.g., time spent on carpet = time spent in a residence – time spent sleeping) – a reasonable approach given the limitations of the data.
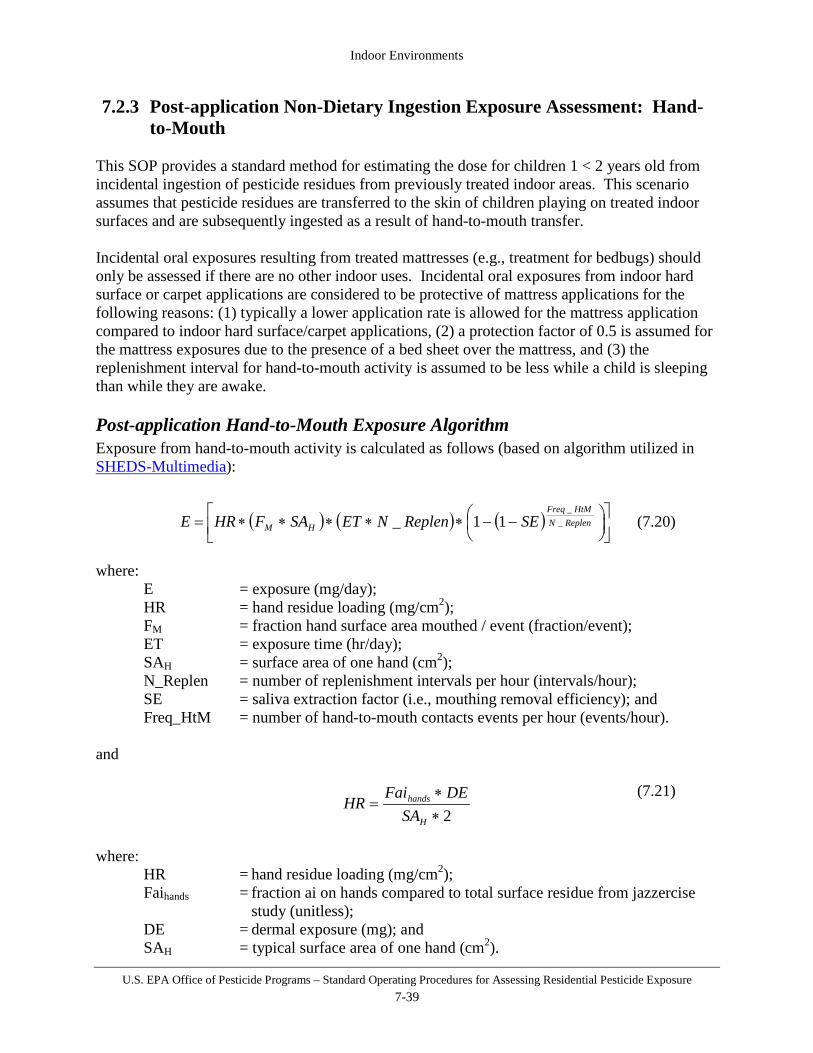
Indoor Environments
U.S. EPA Office of Pesticide Programs – Standard Operating Procedures for Assessing Residential Pesticide Exposure 7-39
7.2.3 Post-application Non-Dietary Ingestion Exposure Assessment: Hand-to-Mouth
This SOP provides a standard method for estimating the dose for children 1 < 2 years old from incidental ingestion of pesticide residues from previously treated indoor areas. This scenario assumes that pesticide residues are transferred to the skin of children playing on treated indoor surfaces and are subsequently ingested as a result of hand-to-mouth transfer. Incidental oral exposures resulting from treated mattresses (e.g., treatment for bedbugs) should only be assessed if there are no other indoor uses. Incidental oral exposures from indoor hard surface or carpet applications are considered to be protective of mattress applications for the following reasons: (1) typically a lower application rate is allowed for the mattress application compared to indoor hard surface/carpet applications, (2) a protection factor of 0.5 is assumed for the mattress exposures due to the presence of a bed sheet over the mattress, and (3) the replenishment interval for hand-to-mouth activity is assumed to be less while a child is sleeping than while they are awake. Post-application Hand-to-Mouth Exposure Algorithm Exposure from hand-to-mouth activity is calculated as follows (based on algorithm utilized in SHEDS-Multimedia): (7.20) where:
E = exposure (mg/day); HR = hand residue loading (mg/cm2); FM = fraction hand surface area mouthed / event (fraction/event); ET = exposure time (hr/day); SAH = surface area of one hand (cm2); N_Replen = number of replenishment intervals per hour (intervals/hour); SE = saliva extraction factor (i.e., mouthing removal efficiency); and Freq_HtM = number of hand-to-mouth contacts events per hour (events/hour).
and
2∗∗
=H
hands
SADEFai
HR (7.21)
where: HR = hand residue loading (mg/cm2);
Faihands = fraction ai on hands compared to total surface residue from jazzercise study (unitless);
DE = dermal exposure (mg); and SAH = typical surface area of one hand (cm2).
( ) ( ) ( )
−−∗∗∗∗∗= ReplenN
HtMFreq
HM SEReplenNETSAFHRE __
11_

Indoor Environments
U.S. EPA Office of Pesticide Programs – Standard Operating Procedures for Assessing Residential Pesticide Exposure 7-40
and Dose, normalized to body weight, is calculated as:
BWED =
(7.22)
where:
D = dose (mg/kg-day); E = exposure (mg/day); and BW = body weight (kg).
Post-application hand-to-mouth exposure following indoor applications is generally considered short-term in duration. Refinement of this dose estimate to reflect a more accurate short-term multi-day exposure profile can be accomplished by accounting for the various factors outlined in Sections 1.3.2 and 1.3.4, such as residue dissipation, product-specific re-treatment intervals, and activity patterns. If longer-term assessments (i.e., intermediate-, long-term, or lifetime exposures) are deemed necessary, similar refinements to more accurately reflect the exposure profile are recommended. Post-application Hand-to-Mouth Exposure Algorithm Inputs and Assumptions Recommended values for post-application hand-to-mouth exposure assessments are provided in Table 7-13 below. Following this table, each scenario-specific input parameter is described in more detail. This description includes a summary of i) key assumptions; ii) data sources used to derive recommended input values; and iii) discussion of limitations that should be addressed when characterizing exposure.
Table 7-13: Indoor Environments – Recommended Hand-to-Mouth Exposure Factor Point Estimates Algorithm Notation
Exposure Factor (units) Point Estimate(s)
Faihands Fraction of ai on hands from jazzercise study
(unitless) 0.15
DE Dermal exposure calculated in Section 7.2.2 (mg) Calculated
HR Residue available on the hands (mg/cm2) Calculated
SAH Surface area of one hand (cm2) Children 1 < 2 years old 150
AR Application rate (mass active ingredient per unit area) Maximum labeled rate
FM Fraction of hand mouthed per event (fraction/event) 0.13
N_Replen Replenishment intervals per hour (intervals/hr) 4
ET Exposure time (hours per day)
Children 1 < 2 years old Carpets 4
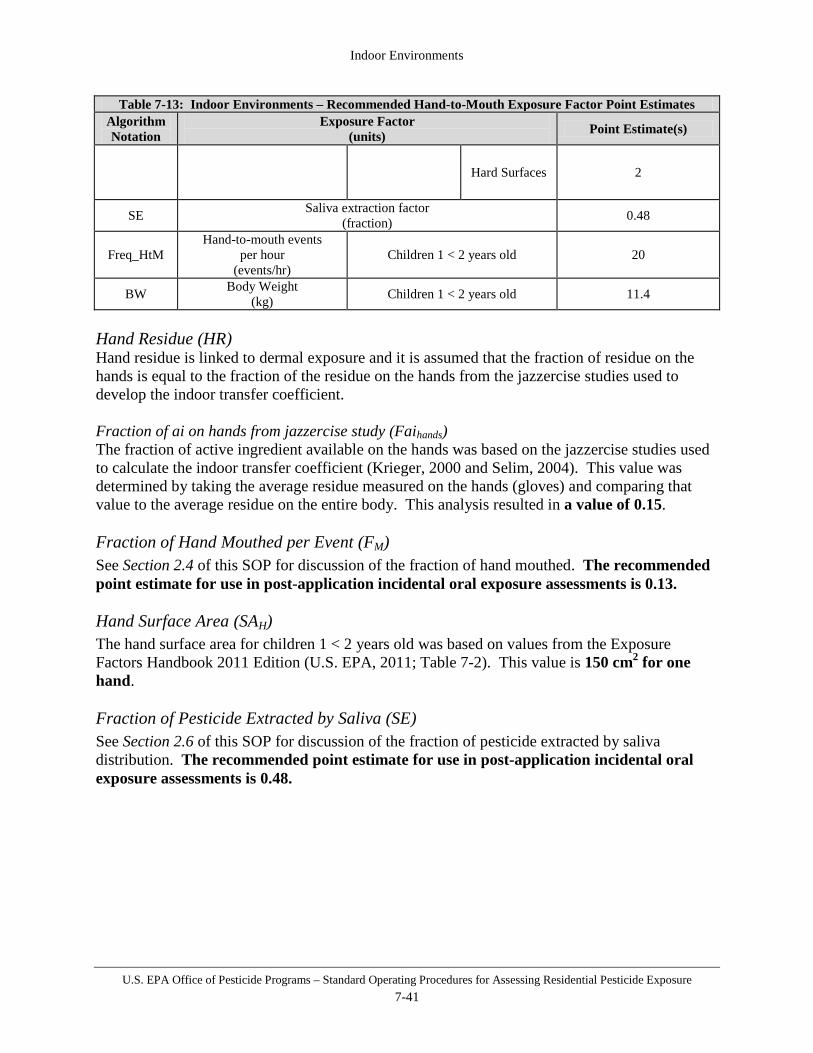
Indoor Environments
U.S. EPA Office of Pesticide Programs – Standard Operating Procedures for Assessing Residential Pesticide Exposure 7-41
Table 7-13: Indoor Environments – Recommended Hand-to-Mouth Exposure Factor Point Estimates Algorithm Notation
Exposure Factor (units) Point Estimate(s)
Hard Surfaces 2
SE Saliva extraction factor (fraction) 0.48
Freq_HtM Hand-to-mouth events
per hour (events/hr)
Children 1 < 2 years old 20
BW Body Weight (kg) Children 1 < 2 years old 11.4
Hand Residue (HR) Hand residue is linked to dermal exposure and it is assumed that the fraction of residue on the hands is equal to the fraction of the residue on the hands from the jazzercise studies used to develop the indoor transfer coefficient. Fraction of ai on hands from jazzercise study (Faihands) The fraction of active ingredient available on the hands was based on the jazzercise studies used to calculate the indoor transfer coefficient (Krieger, 2000 and Selim, 2004). This value was determined by taking the average residue measured on the hands (gloves) and comparing that value to the average residue on the entire body. This analysis resulted in a value of 0.15. Fraction of Hand Mouthed per Event (FM) See Section 2.4 of this SOP for discussion of the fraction of hand mouthed. The recommended point estimate for use in post-application incidental oral exposure assessments is 0.13. Hand Surface Area (SAH) The hand surface area for children 1 < 2 years old was based on values from the Exposure Factors Handbook 2011 Edition (U.S. EPA, 2011; Table 7-2). This value is 150 cm2 for one hand. Fraction of Pesticide Extracted by Saliva (SE) See Section 2.6 of this SOP for discussion of the fraction of pesticide extracted by saliva distribution. The recommended point estimate for use in post-application incidental oral exposure assessments is 0.48.
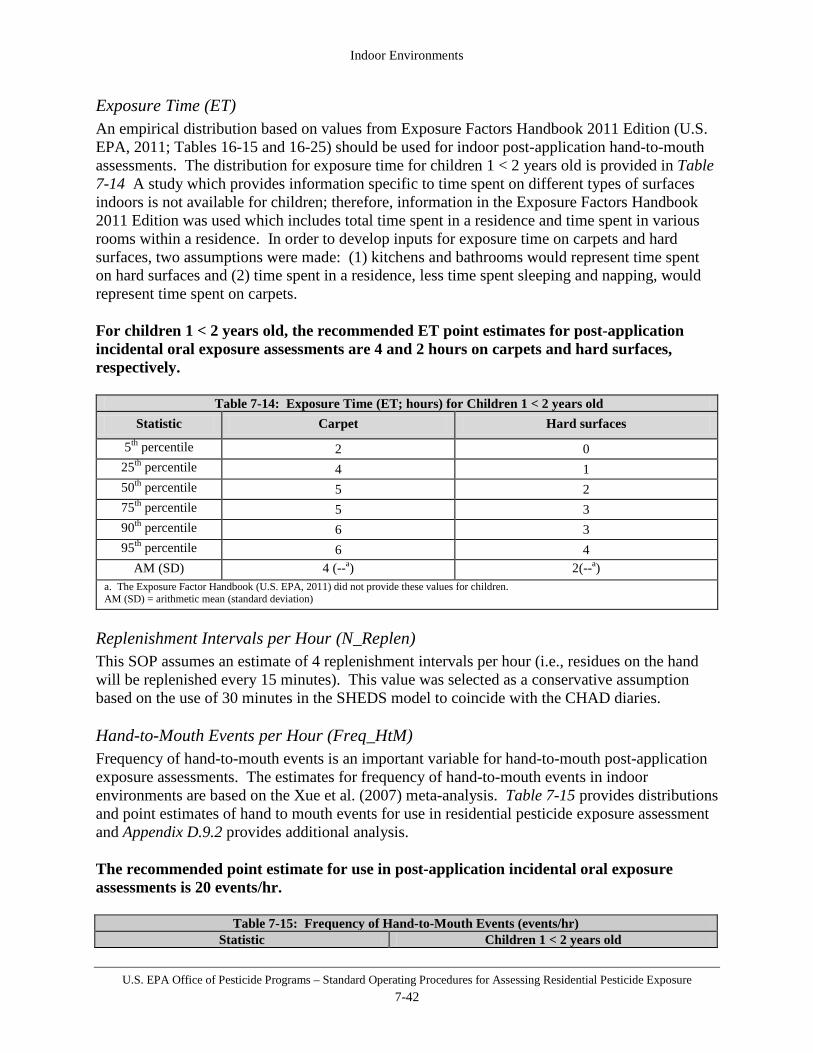
Indoor Environments
U.S. EPA Office of Pesticide Programs – Standard Operating Procedures for Assessing Residential Pesticide Exposure 7-42
Exposure Time (ET) An empirical distribution based on values from Exposure Factors Handbook 2011 Edition (U.S. EPA, 2011; Tables 16-15 and 16-25) should be used for indoor post-application hand-to-mouth assessments. The distribution for exposure time for children 1 < 2 years old is provided in Table 7-14 A study which provides information specific to time spent on different types of surfaces indoors is not available for children; therefore, information in the Exposure Factors Handbook 2011 Edition was used which includes total time spent in a residence and time spent in various rooms within a residence. In order to develop inputs for exposure time on carpets and hard surfaces, two assumptions were made: (1) kitchens and bathrooms would represent time spent on hard surfaces and (2) time spent in a residence, less time spent sleeping and napping, would represent time spent on carpets. For children 1 < 2 years old, the recommended ET point estimates for post-application incidental oral exposure assessments are 4 and 2 hours on carpets and hard surfaces, respectively.
Table 7-14: Exposure Time (ET; hours) for Children 1 < 2 years old Statistic Carpet Hard surfaces
5th percentile 2 0 25th percentile 4 1 50th percentile 5 2 75th percentile 5 3 90th percentile 6 3 95th percentile 6 4
AM (SD) 4 (--a) 2(--a) a. The Exposure Factor Handbook (U.S. EPA, 2011) did not provide these values for children. AM (SD) = arithmetic mean (standard deviation)
Replenishment Intervals per Hour (N_Replen) This SOP assumes an estimate of 4 replenishment intervals per hour (i.e., residues on the hand will be replenished every 15 minutes). This value was selected as a conservative assumption based on the use of 30 minutes in the SHEDS model to coincide with the CHAD diaries. Hand-to-Mouth Events per Hour (Freq_HtM) Frequency of hand-to-mouth events is an important variable for hand-to-mouth post-application exposure assessments. The estimates for frequency of hand-to-mouth events in indoor environments are based on the Xue et al. (2007) meta-analysis. Table 7-15 provides distributions and point estimates of hand to mouth events for use in residential pesticide exposure assessment and Appendix D.9.2 provides additional analysis. The recommended point estimate for use in post-application incidental oral exposure assessments is 20 events/hr.
Table 7-15: Frequency of Hand-to-Mouth Events (events/hr) Statistic Children 1 < 2 years old

Indoor Environments
U.S. EPA Office of Pesticide Programs – Standard Operating Procedures for Assessing Residential Pesticide Exposure 7-43
Table 7-15: Frequency of Hand-to-Mouth Events (events/hr) Statistic Children 1 < 2 years old
5th percentile 0 25th percentile 6 50th percentile 14 75th percentile 27 95th percentile 63
AM (SD) 20 (20) GM (GSD) --a
Range --a N 245
Weibull distribution – Scale: 18.79 and Shape: 0.91 AM (SD) = arithmetic mean (standard deviation) GM (GSD) = geometric mean (geometric standard deviation) a Not provided
Future Research/Data Needs Information that would refine post-application incidental oral hand-to-mouth exposure assessments for indoor pesticide applications include:
• Application intervals (i.e., how often products are applied indoor) – either chemical-specific or generic intervals.
• Survey information (preferably longitudinal) detailing: o General pesticide use to obtain, on a per capita basis, the probability of treating
indoor surfaces with pesticides; o Product-specific application rates to obtain the likelihood that the maximum rate
is used; and, o Daily activity patterns specific to hand-to-mouth activities indoors (e.g.,
replenishment interval, hand-to-surface contacts). Exposure Characterization and Data Quality Residue
• Reviewers should recognize that factors such as vacuuming, transfer to clothing, re-suspension and impaction into carpet can greatly impact the dissipation rate of pesticides on indoor surfaces when conducting dermal post-application exposure assessments.
Fraction of Pesticide Extracted by Saliva
• Though based on limited data, the determination of the fraction of pesticide extracted by saliva from the hand is considered reasonable.
7.2.4 Post-application Non-Dietary Ingestion Exposure Assessment: Object-to-Mouth
This SOP provides a standard method for estimating the dose for children 1 < 2 years old from incidental ingestion of pesticide residues from previously treated indoor surfaces. This scenario assumes that pesticide residues are transferred to a child’s toy and are subsequently ingested as a result of object-to-mouth transfer.

Indoor Environments
U.S. EPA Office of Pesticide Programs – Standard Operating Procedures for Assessing Residential Pesticide Exposure 7-44
Post-application Object-to-Mouth Exposure Algorithm Exposure from object-to-mouth activity is calculated as follows (based on algorithm utilized in SHEDS-Multimedia): (7.23) where:
E = exposure (mg/day); OR = chemical residue loading on an object (µg/cm2); CF1 = weight unit conversion factor (0.001 mg/µg); SAMO = area of the object surface that is mouthed (cm2/event); ET = exposure time (hr/day); N_Replen = number of replenishment intervals per hour (intervals/hour); SE = saliva extraction factor (i.e., mouthing removal efficiency); and Freq_OtM = number of object-to-mouth contact events per hour (events/hour).
and OFDepROR ∗= (7.24) where:
OR = chemical residue loading on the object (μg/cm2); DepR = deposited residue (μg/cm2); and FO = fraction of residue transferred to an object (unitless). and Oral dose, normalized to body weight, is calculated as:
BWED =
(7.25)
where:
D = dose (mg/kg-day); E = exposure (mg/day); and BW = body weight (kg). Post-application object-to-mouth exposure following indoor applications is generally considered short-term in duration. Refinement of this dose estimate to reflect a more accurate short-term multi-day exposure profile can be accomplished by accounting for the various factors outlined in Sections 1.3.2 and 1.3.4, such as residue dissipation, product-specific re-treatment intervals, and
( ) ( )
−−∗∗= ReplenN
OtMFreq
O SEReplenNETSAMCFORE __
11_**1*

Indoor Environments
U.S. EPA Office of Pesticide Programs – Standard Operating Procedures for Assessing Residential Pesticide Exposure 7-45
activity patterns. If longer-term assessments (i.e., intermediate-, long-term, or lifetime exposures) are deemed necessary, similar refinements to more accurately reflect the exposure profile are recommended. Post-application Object-to-Mouth Exposure Algorithm Inputs and Assumptions Recommended values for post-application object-to-mouth exposure assessments are provided in Table 7-16 below. Following this table, each scenario-specific input parameter is described in more detail. This description includes a summary of i) key assumptions; ii) data sources used to derive recommended input values; and iii) discussion of limitations that should be addressed when characterizing exposure.
Table 7-16: Indoor Environments – Recommended Object-to-Mouth Exposure Factor Point Estimates Algorithm Notation
Exposure Factor (units) Point Estimate(s)
AR Application rate (mass active ingredient per unit area) Maximum labeled rate
FO Fraction of residue transferred to an object
Carpets 0.06a
Hard surfaces 0.08a
SAMO Surface area of object mouthed (cm2/event) 10
N_Replen Replenishment intervals per hour (intervals/hour) 4
SE Saliva extraction factor 0.48
ET Exposure Time (hours per day)
Children 1 < 2 years old
Carpets 4
Hard Surfaces 2
Freq_OtM Object-to-mouth events
per hour (events/hour)
Children 1 < 2 years old 14
BW Body Weight (kg) Children 1 < 2 years old 11.4
a. These values are screening level point estimates to be used when chemical-specific data are not available. Data are available for certain chemicals; see text and associated tables for chemical-specific data for pyrethrin, permethrin, PBO, chlorpyrifos, and deltamethrin.
Fraction of Residue to an Object (FO) Following an application, some pesticide residue remains on indoor surfaces. Some of this residue may be transferred to a child’s toy and subsequently ingested via object-to-mouth activities. For this SOP, it is assumed that the residue that could be transferred to the object is the same as what is available for dermal transfer. As a result, the fraction of residue available for transfer assumed for dermal exposure for both carpets and hard surfaces (see discussion above in Section 7.2.2 for more detail) should be used as a conservative estimate for the fraction of residue transferred to an object. For carpets and hard surfaces, the recommended point estimates for use in post-application incidental oral exposure assessments are 0.06 and 0.08, respectively.

Indoor Environments
U.S. EPA Office of Pesticide Programs – Standard Operating Procedures for Assessing Residential Pesticide Exposure 7-46
Surface Area of Object Mouthed (SAMO) See Section 2.5 of this SOP for discussion of surface area of object mouthed. The recommended value for use in exposure assessments is 10 cm2/event. Fraction of Pesticide Extracted by Saliva (SE) See Section 2.6 of this SOP for discussion of fraction of pesticide extracted by saliva distribution. The recommended point estimate for use in post-application incidental oral exposure assessments is 0.48. Exposure Time (ET) An empirical distribution based on values from the Exposure Factors Handbook 2011 Edition (U.S. EPA, 2011; Tables 16-15 and 16-25) should be used for indoor post-application object-to-mouth assessments. The distribution for exposure time for children 1 < 2 years old is provided in Table 7-17. A study which provides information specific to time spent on different types of surfaces indoors is not available for children; therefore, information in the Exposure Factors Handbook 2011 Edition was used which includes total time spent in a residence and time spent in various rooms within a residence. In order to develop inputs for exposure time on carpets and hard surfaces, two assumptions were made: (1) kitchens and bathrooms would represent time spent on hard surfaces and (2) time spent in a residence, less time spent sleeping and napping, would represent time spent on carpets. For children 1 < 2 years old, the recommended point estimates for use in post-application incidental oral exposure assessments are 4 and 2 hours on carpets and hard surfaces, respectively.
Table 7-17: Exposure Time (ET; hours) for Children 1 < 2 years old Statistic Carpet Hard surfaces
5th percentile 2 0 25th percentile 4 1 50th percentile 5 2 75th percentile 5 3 90th percentile 6 3 95th percentile 6 4
AM (SD) 4 (--a) 2(--a) a. The Exposure Factor Handbook (U.S. EPA, 2011) did not provide these values for children. AM (SD) = arithmetic mean (standard deviation)
Replenishment Intervals per Hour (N_Replen) This SOP assumes an estimate of 4 replenishment intervals per hour (i.e., residues on the hand will be replenished every 15 minutes). This value was selected as a conservative assumption based on the use of 30 minutes in the SHEDS model to coincide with the CHAD diaries. Object-to-Mouth Events per Hour (Freq_OtM)
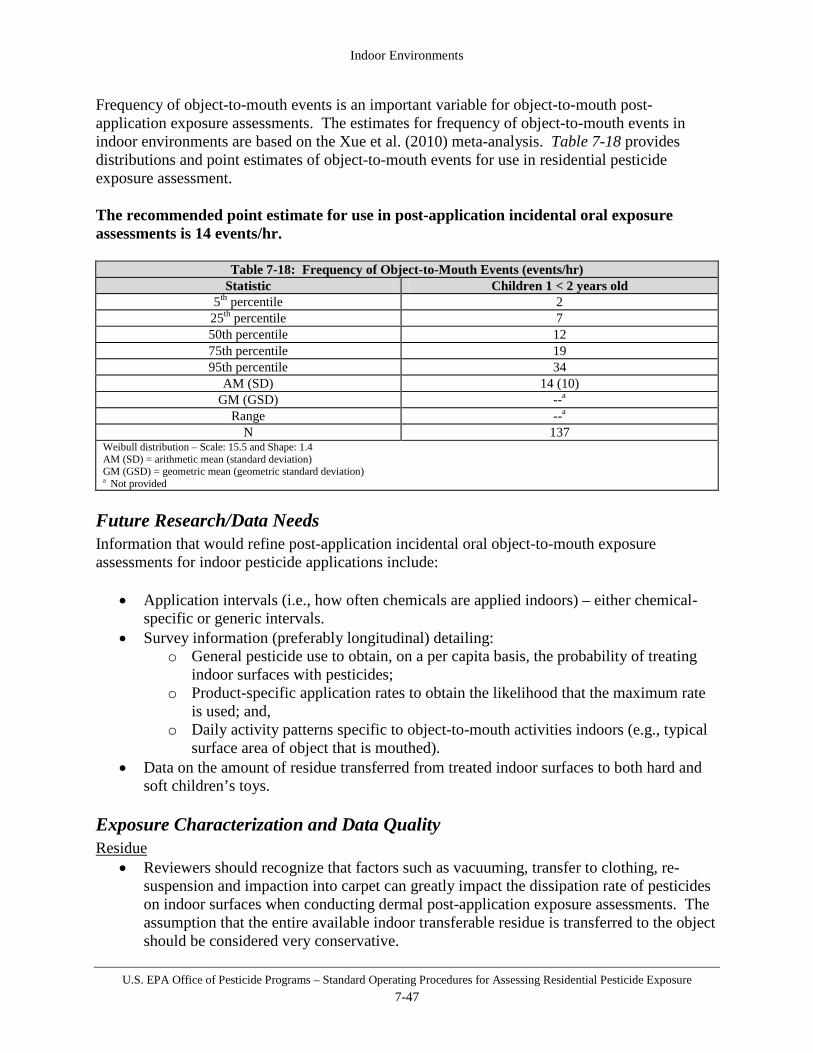
Indoor Environments
U.S. EPA Office of Pesticide Programs – Standard Operating Procedures for Assessing Residential Pesticide Exposure 7-47
Frequency of object-to-mouth events is an important variable for object-to-mouth post-application exposure assessments. The estimates for frequency of object-to-mouth events in indoor environments are based on the Xue et al. (2010) meta-analysis. Table 7-18 provides distributions and point estimates of object-to-mouth events for use in residential pesticide exposure assessment. The recommended point estimate for use in post-application incidental oral exposure assessments is 14 events/hr.
Table 7-18: Frequency of Object-to-Mouth Events (events/hr) Statistic Children 1 < 2 years old
5th percentile 2 25th percentile 7 50th percentile 12 75th percentile 19 95th percentile 34
AM (SD) 14 (10) GM (GSD) --a
Range --a N 137
Weibull distribution – Scale: 15.5 and Shape: 1.4 AM (SD) = arithmetic mean (standard deviation) GM (GSD) = geometric mean (geometric standard deviation) a Not provided
Future Research/Data Needs Information that would refine post-application incidental oral object-to-mouth exposure assessments for indoor pesticide applications include:
• Application intervals (i.e., how often chemicals are applied indoors) – either chemical-specific or generic intervals.
• Survey information (preferably longitudinal) detailing: o General pesticide use to obtain, on a per capita basis, the probability of treating
indoor surfaces with pesticides; o Product-specific application rates to obtain the likelihood that the maximum rate
is used; and, o Daily activity patterns specific to object-to-mouth activities indoors (e.g., typical
surface area of object that is mouthed). • Data on the amount of residue transferred from treated indoor surfaces to both hard and
soft children’s toys.
Exposure Characterization and Data Quality Residue
• Reviewers should recognize that factors such as vacuuming, transfer to clothing, re-suspension and impaction into carpet can greatly impact the dissipation rate of pesticides on indoor surfaces when conducting dermal post-application exposure assessments. The assumption that the entire available indoor transferable residue is transferred to the object should be considered very conservative.
Indoor Environments
U.S. EPA Office of Pesticide Programs – Standard Operating Procedures for Assessing Residential Pesticide Exposure 7-48
Fraction of Pesticide Extracted by Saliva
• Though based on limited data, the determination of the fraction of pesticide extracted by saliva from the hand is considered reasonable.
7.2.5 Post-application Non-Dietary Ingestion Exposure Assessment: Dust Ingestion
House dust is a heterogeneous mixture of various particles with varying sizes, shapes, and densities. The basic composition of house dust varies throughout a home as well as between homes, across seasons, and across regions. In the indoor environment, it is known that pesticides can partition into house dust and persist for periods of time, but assessing exposure to house dust from a particular application of a pesticide product is difficult for several reasons. In order to do an assessment of incidental oral ingestion exposure to house dust, information on the pesticide concentration in dust is needed. There is uncertainty surrounding the ability to estimate pesticide concentrations in dust from a single application. Pesticide concentrations in house dust reported in the literature are not typically related to a single application event. Pesticide residues in house dust can originate from either recent or historical applications and from either indoor or outdoor sources; therefore, available measurements of dust concentrations in house dust are unlikely to be representative of concentrations resulting from a particular application. Additionally, for measured concentrations in dust, there is difficulty in ensuring that the sampling method utilized would be able to collect dust material that would be available for human exposure. Most vacuum methods employed for the collection of household dust collect the material from all depths of the carpet; whereas, incidental oral exposure to house dust would primarily be to dust located on the surface of the carpet. At this point in time, knowledge of dust ingestion patterns is somewhat limited due to the fact that only a few researchers have attempted to quantify dust ingestion patterns in children. Values are available in the Exposure Factors Handbook 2011 Edition (EFH, 2011); however, the dust ingestion recommendations include treated soil from the outdoor environment tracked into the indoor setting, indoor settled dust and air-suspended particulate matter that is inhaled and swallowed. The EFH notes that the confidence rating for the dust ingestion recommendation is low due to limitations in the studies available. A SOP for assessing incidental oral exposure to indoor house dust is not being proposed at this time due to the issues discussed above; however, HED believes that the current method of hand-to-mouth exposure assessment for indoor pesticide residues is protective of exposure to indoor house dust. The current approach accounts for exposure to residues immediately after application, which are assumed to be available in much higher concentrations than concentrations found in house dust. Therefore, this approach is considered a conservative measure of incidental oral exposure to a pesticide after application indoors and would be protective of exposure to any partitioning of the pesticide into house dust.
Indoor Environments
U.S. EPA Office of Pesticide Programs – Standard Operating Procedures for Assessing Residential Pesticide Exposure 7-49
Future Research/Data Needs Information that would useful for understanding the potential for exposure to house dust would include:
• Identifying best practices for house dust collection; and • Collection of longitudinal measurements of surface residues and house dust
concentrations after a pesticide application.
7.2.6 Combining Post-application Scenarios Risks resulting from different exposure scenarios are combined when it is likely that they can occur simultaneously based on the use pattern and when the toxicological effects across different routes of exposure are the same. When combining scenarios, it is important to fully characterize the potential for co-occurrence as well as characterizing the risk inputs and estimates. Risks should be combined even if any one scenario or route of exposure exceeds the level of concern because this allows for better risk characterization for risk managers. The following issues should be considered when combining scenarios for the residential indoor SOP:
• There are a number of non-dietary ingestion exposure scenarios that could potentially be combined with the dermal exposure scenario. These non-dietary ingestion scenarios should be considered inter-related and it is likely that they occur interspersed amongst each other across time. For example, a child may place his hand in his mouth “X” number of times as well as place an object in his mouth “Y” number of times during a certain period of time. The potential combinations of co-occurrence of the hand-to-mouth/object-to-mouth scenarios across a particular period of time are limitless. Combining both of these scenarios with the dermal exposure scenario would be overly-conservative because of the conservative nature of each individual assessment. Based on this discussion, it is recommended that the dermal and hand-to-mouth scenarios be combined for short-term exposure durations and this combination should be considered a protective estimate of children’s exposure to pesticides used on indoor surfaces.
Treated Pets
U.S. EPA Office of Pesticide Programs – Standard Operating Procedures for Assessing Residential Pesticide Exposure 8-1
Section 8 Treated Pets
This section provides the methods for estimating potential exposure that individuals may receive from dermal, inhalation and/or hand-to-mouth exposure resulting from the treatment of pets with a pesticide product. Products in this marketplace include liquid concentrates (dips, shampoos and sponges), liquid ready-to-use (RTU) formulations (aerosol cans, collars, spot-ons and trigger pump sprayers) and solid RTU formulations (dusts and powders). Exposure from treated pets is anticipated to occur through dermal and inhalation routes when handling or applying the treatment (adults). Further, exposure is anticipated to occur from the dermal (adults and children) and hand-to-mouth routes (children only) from contact with treated pets. This SOP updates the algorithms and inputs previously used to estimate handler and post-application dermal and post-application hand-to-mouth exposure. While the SOP builds on methods previously developed by the Agency, it relies mainly upon review of data submitted to EPA in support of specific pet pesticide product registrations. The submitted data were used to estimate potential exposure from 1) the application of pet pesticide treatments and 2) post-application activity with treated pets. The Agency also used data from open literature when available, though few sources were identified. The exposure assessor should check the label language for directions on pet use. Look for statements describing or limiting the use of the product (e.g., some dust/powder products marketed for use indoors also allow for use on pets). These statements may be on the front panel of the label associated with the brand or trade name or in the use-directions section of the labeling. Restricted Use Pesticide (RUP) classification indicates that the product cannot be bought or applied by pet owners and, therefore, a residential handler exposure assessment is not applicable. However, because pets often return to residential sites following professional treatments, a residential post-application exposure assessment is required. Label language such as such as "for use by veterinarians or veterinary assistants only" or “only available from veterinarians” is considered unenforceable and does not preclude use in residential settings. In this case, therefore, both a residential handler and post-application exposure assessment is required. The following definitions of common pet product formulations should be applied for use of the Treated Pet SOP: Liquid Formulations - An aerosol product is a can formulation packaged under pressure for the dispersion of pesticide to the hair coat of the treated animal. A pet collar is a product formulated to be worn around the neck of a treated pet. Collars are designed so that the pesticide is impregnated into the material of the collar and acts by slowly releasing over the product active lifetime onto the hair coat of the pet.
Treated Pets
U.S. EPA Office of Pesticide Programs – Standard Operating Procedures for Assessing Residential Pesticide Exposure 8-2
A dip is a product that is applied to pets via dipping or immersion in a concentrated liquid solution. A shampoo is a product formulation that is applied to the wetted coat of the animal to be lathered or shampooed into the hair coat of the treated pet. A spot-on is a product formulated for application to pets via tube or vial to one or more small, localized areas on the body of the animal. The products work by means of spreading from the application site over the dermal surface of the treated pet. A trigger pump sprayer is a product formulated to be distributed onto the hair coat of the treated animal by means of pump spray applicator. Solid Product Formulations – Dust and powder formulations are RTU products applied to the treated pet by means of direct application to the hair coat of the animal.
8.1 Handler Exposure Assessment As described in Section 1.3.3, handler exposure refers to an adult individual exposed during mixing, loading, and applying of a pesticide. The Agency assumes that dermal and inhalation pesticide handler exposure can occur while applying pesticides to pets. This SOP provides unit exposures for each formulation/application equipment combination that are relevant to calculating handler exposure to pet pesticide products in the absence of chemical-specific handler data. The unit exposures in this section are based on a review of 6 studies of varying formulations which provided information on the amount of active ingredient applied and resulting exposure to the handler. Formulations for which data have been identified include dips, dusts, trigger-pump spray, shampoo and spot-on. No formulation-specific data were identified for pet collar, powder or aerosol spray formulations; however, surrogate unit exposures that closely approximate these types of exposures have been recommended for the assessment of these formulations. More information can be found in Section C.1 of Appendix C. Label information is important for selecting appropriate data inputs for the handler exposure assessment. The maximum application rate specified on the label should be used. Additional information provided by the label such as use directions, application-specific animal weight ranges and re-treatment intervals should be considered as a part of the exposure assessment. Prior to the development of a handler exposure assessment for a pet treatment scenario, the assessor should review the pesticide label to determine whether the scenario is appropriate based upon the pesticide formulation and usage characteristics of the product. Specific labeling considerations for pet treatment products are as follows:

Treated Pets
U.S. EPA Office of Pesticide Programs – Standard Operating Procedures for Assessing Residential Pesticide Exposure 8-3
• Determine whether the labeling contains directions for use on pets. • Identify from product labeling the formulation of the pet pesticide. • Determine maximum rate(s) of application for differing ranges of animal weight. • For formulations of pet pesticides which specify application rate as it corresponds to
animal weight (i.e., spot-ons), labeled weight ranges should be used to determine application rate. The weight range which corresponds to the greatest amount of active ingredient applied should be used for the assessment of handler exposure. Many application methods of pet products (i.e., dips, shampoos and aerosol/trigger-pump sprays) do not specify application rate as it corresponds to pet weight ranges. When not specified it should be assumed that 1/2 of the contents of the can or bottle of product is applied per animal treated based on best professional judgment. The majority of pet collar formulations are registered as a single collar for use on all animal weight ranges with directions to fit the collar to the treated animal and trim off the excess length. Because the trimmed length and corresponding active ingredient loss cannot be determined, the maximum application rate of the collar as labeled should be assumed for assessment of applicator risk.
• Only adults (individuals 16 years and older) are assumed to handle/apply pesticides to pets.
Dermal and Inhalation Handler Exposure Algorithm Daily dermal and inhalation exposure (mg/day) for residential pesticide handlers, for a given formulation-application method combination, is estimated by multiplying the formula-application method-specific unit exposure by an estimate of the amount of active ingredient handled in a day, using the equation below: E = UE * AR * A ( 8.1) where:
E = exposure (mg/day); UE = unit exposure (mg/lb ai); AR = application rate (lb ai/pet); and A = number of animals treated per day.
Absorbed dermal and/or inhalation dose normalized to body weight is calculated as:
BW
AFED ∗= (8.2)
where:
D = dose (mg/kg-day); E = exposure (mg/day); AF = absorption factor (dermal and/or inhalation); and BW = body weight (kg).
Handler exposure for applications to pets is generally considered short-term in duration. Refinement of this dose estimate to reflect a more accurate short-term, multi-day exposure

Treated Pets
U.S. EPA Office of Pesticide Programs – Standard Operating Procedures for Assessing Residential Pesticide Exposure 8-4
profile can be accomplished by accounting for the various factors outlined in Sections 1.3.2 and 1.3.3 such as the product-specific application regimen. Dermal and Inhalation Handler Exposure Algorithm Inputs and Assumptions Recommended values for handler exposure (inhalation and dermal) assessments are provided in Table 8-1. Following this table, each scenario-specific input parameter is described in more detail. This description includes a summary of i) key assumptions; ii) data sources used to derive recommended input values; and iii) discussion of limitations that should be addressed when characterizing exposure.
Table 8-1: Pet Treatments – Recommended Unit Exposure (mg/lb ai) Point Estimates
Formulation Equipment/ Application
Method
Dermal Inhalation Appendix Page
Reference Point Estimate Point Estimate
Liquid-Concentrate
Dip 100 0.027 C-71
Sponge 1,600 0.21 C-75
Ready-to-Use (RTU) - Liquid
Trigger-pump sprayers 820 3.3 C-113
Shampoo 2,000 0.29 C-124
Spot-on 120 Inhalation exposure is considered negligible. C-130
Collar No exposure data available for this application scenario. Exposure data for spot-on applications recommended as surrogate data.
Aerosol Can No exposure data available for this application scenario. Exposure data for trigger sprayer applications recommended as surrogate data.
Dusts/Powder Shaker Can 4,300 18 C-36
Unit Exposures As described in Section 1.3.3, the unit exposure is the ratio of exposure and the amount of active ingredient handled for a given formulation/application method combination, with units of mass exposure per mass active ingredient handled (e.g., mg exposure/lb ai handled). The recommended point estimates shown in Table 8-1 represent the arithmetic mean. Data summaries for all UE inputs can be found in Section C.1 of Appendix C. Number of Animals Treated It is assumed that residential handlers of pet treatment products will treat 2 animals per application (N). This estimate is based upon information available from The Humane Society of the United States15 which references data from the American Pet Products Manufacturers Association (APPA) 2011-2012 National Pet Owners Survey that reports pet owners have an average of 1.7 dogs and 2.2 cats.
15 http://www.humanesociety.org/issues/pet_overpopulation/facts/pet_ownership_statistics.html
Treated Pets
U.S. EPA Office of Pesticide Programs – Standard Operating Procedures for Assessing Residential Pesticide Exposure 8-5
8.2 Post-application Exposure Assessment Post-application exposure can result from conducting physical activities such as petting or otherwise interacting with pets following pesticide applications. While exposure may occur for people of all ages, adults and children 1 < 2 years old are considered the index lifestage for this exposure scenario based on behavioral characteristics and the strengths and limitations of available data. An analysis of index lifestages for the Treated Pet section can be found in Appendix A. It is assumed that individuals contact previously treated pets on the same day the pesticide treatment is applied. Therefore, the assessment of post-application exposure must be representative of the day of application residues (i.e., Day 0). However, the assessment can be refined to reflect exposure over longer periods of time (e.g., several months) if post-application exposure (transferable residue) data, toxicological endpoint, or activity information is available to allow for such calculations. This section addresses standard methods for estimating exposure and dose for three individual post-application scenarios resulting from exposure to pesticides that have been used to treat pets:
• Section 8.2.1 – Post-application inhalation exposures; • Section 8.2.2 – Post-application dermal exposures; and • Section 8.2.3 – Non-dietary ingestion via hand-to-mouth activity.
8.2.1 Post-application Inhalation Exposure Assessment Post-application inhalation exposure is generally not assessed for pets and should be handled on a case-by-case basis. The combination of low vapor pressure for chemicals typically used as active ingredients in pet pesticide products and the small amounts of pesticide applied to pets is expected to result in negligible inhalation exposure.
8.2.2 Post-application Dermal Exposure Assessment This SOP provides a revised standard method for estimating potential dermal pesticide exposure among adults and/or children that contact pets previously treated with pesticide products. The method for determining post-application dermal exposure is based on the relationship between the amount of pesticide applied and contact activities. It was developed to incorporate chemical-specific data; however, standard values and assumptions are included that can be used in the absence of data as described below in the sub-Section, Post-application Dermal Exposure Algorithm Inputs and Assumptions.
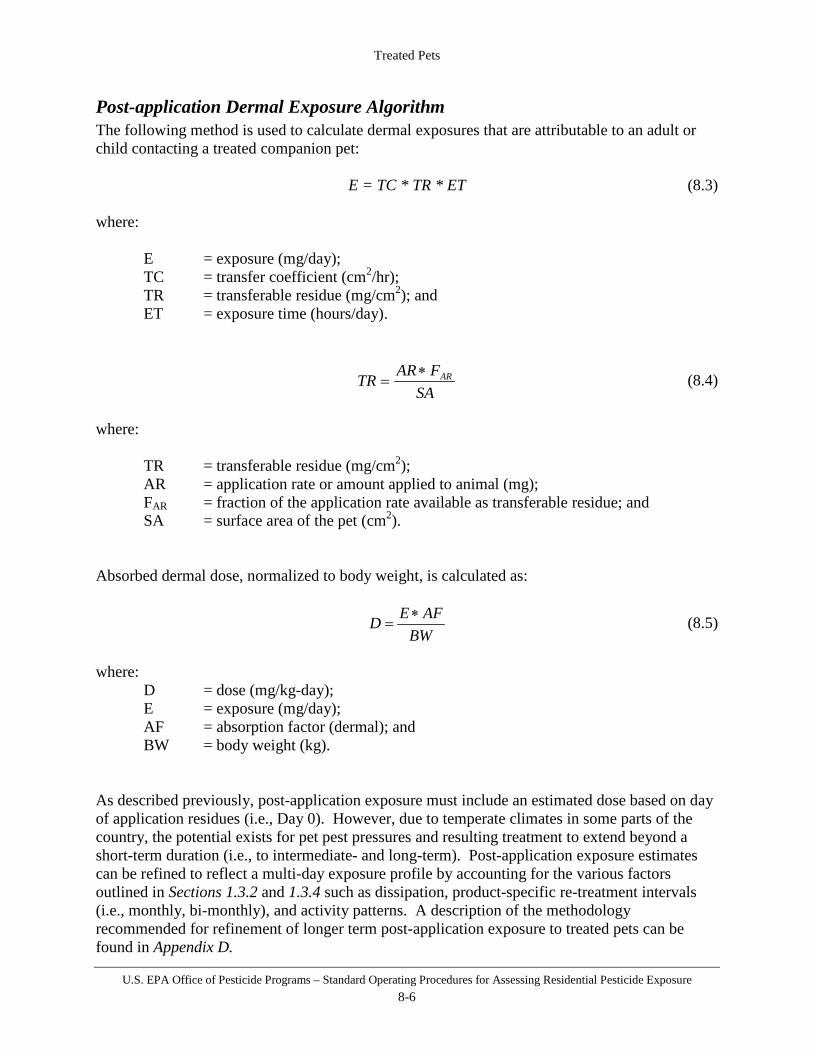
Treated Pets
U.S. EPA Office of Pesticide Programs – Standard Operating Procedures for Assessing Residential Pesticide Exposure 8-6
Post-application Dermal Exposure Algorithm The following method is used to calculate dermal exposures that are attributable to an adult or child contacting a treated companion pet: E = TC * TR * ET (8.3) where:
E = exposure (mg/day); TC = transfer coefficient (cm2/hr); TR = transferable residue (mg/cm2); and ET = exposure time (hours/day).
SA
FARTR AR∗= (8.4)
where:
TR = transferable residue (mg/cm2); AR = application rate or amount applied to animal (mg); FAR = fraction of the application rate available as transferable residue; and SA = surface area of the pet (cm2).
Absorbed dermal dose, normalized to body weight, is calculated as:
BW
AFED ∗= (8.5)
where:
D = dose (mg/kg-day); E = exposure (mg/day); AF = absorption factor (dermal); and BW = body weight (kg).
As described previously, post-application exposure must include an estimated dose based on day of application residues (i.e., Day 0). However, due to temperate climates in some parts of the country, the potential exists for pet pest pressures and resulting treatment to extend beyond a short-term duration (i.e., to intermediate- and long-term). Post-application exposure estimates can be refined to reflect a multi-day exposure profile by accounting for the various factors outlined in Sections 1.3.2 and 1.3.4 such as dissipation, product-specific re-treatment intervals (i.e., monthly, bi-monthly), and activity patterns. A description of the methodology recommended for refinement of longer term post-application exposure to treated pets can be found in Appendix D.

Treated Pets
U.S. EPA Office of Pesticide Programs – Standard Operating Procedures for Assessing Residential Pesticide Exposure 8-7
Post-application Dermal Exposure Algorithm Inputs and Assumptions Recommended values for post-application dermal exposure assessments are provided in Table 8-2 below. Following this table, each scenario-specific input parameter is described in more detail. This description includes a summary of i) key assumptions; ii) data sources used to derive recommended input values; and iii) discussion of limitations that should be addressed when characterizing exposure.
Table 8-2: Residential Post-application Scenario – Pet Treatment SOP Dermal Exposure Factors: Recommended Point Estimates
Algorithm Notation
Exposure Factor Units Point Estimates
AR Application rate (mg)
Labeled Rate for Each Weight Range Specified (Small, Medium, Large)
SA Surface Area of Animal (cm2)
Small Cat, Dog Cat – 1,500 Dog – 3,000
Medium Cat, Dog Cat – 2,500 Dog – 7,000
Large Cat, Dog Cat – 4,000 Dog – 11,000
FAR Fraction of AR Available for Transfer 0.02
TC
Transfer Coefficient – Liquids (cm2/hr)
Adult 5,200
Children 1 < 2 years old 1,400
Transfer Coefficient – Solids
(cm2/hr)
Adult 140,000
Children 1 < 2 years old 38,000
ET Exposure Time (hours per day)
Adult 0.77
Children 1 < 2 years old 1.0
BW Body weight (kg)
Adult 80
Children 1 < 2 years old 11
Transfer Coefficient (TC) Post-application dermal exposure can be predicted using estimates for residue transfer to individuals contacting treated pets during certain activities and exposure times. Exposure rates resulting from residue transfer associated with a given formulation and activity is an empirical value, known as the transfer coefficient (TC). For the purpose of determining exposure to treated pets, TC can be defined as animal surface area contact per unit time (cm2/hr). It is the ratio of exposure rate, measured in mass of chemical per time (e.g., µg/hr), to residue, measured in mass of active ingredient per surface area of the animal (e.g., µg/cm2).
The transfer coefficients used for pet exposure were derived from two studies representing application and grooming activities with dogs, one using a carbaryl shampoo product (Mester, 1998) and the other using a carbaryl dust product (Merricks, 1997); these are used to represent

Treated Pets
U.S. EPA Office of Pesticide Programs – Standard Operating Procedures for Assessing Residential Pesticide Exposure 8-8
TCs for liquid and solid formulations, respectively. Data were gathered while human volunteers applied pet pesticide products to various dogs of differing sizes and fur lengths. The information identified best approximates the exposures that could occur from interactions with treated pets because these studies included the direct measurement of exposures to applicators or pet groomers. Since these individuals directly handled pesticide products and had direct contact with treated pets, it is expected that their resulting exposures are a reasonable approximation of upper bound estimates of contact with a treated animal. In the absence of direct exposure data for this scenario (e.g., homeowner activity with a treated pet), the Agency assumes that the application and grooming activities are likely to result in a protective estimate of exposure than just the evaluation of petting, hugging or sleeping with a pet.
Because TCs were established from studies using adult volunteers, they have been scaled to adjust for assessment of children 1 < 2 years old exposure as outlined in Section 2.3 using a factor of 0.27 (i.e., a 73% reduction in the adult TC).
A TC of 5,200 cm2/hr for adults and 1,400 cm2/hr for children (based on the arithmetic mean) is recommended for addressing all durations of post-application exposure for all liquid formulations (or formulations that behave as liquids) including RTU liquid formulations (i.e., aerosol/trigger sprays, dips, pet collars, shampoos and spot-ons). Table 8-3 provides a statistical summary of dermal exposure TCs derived for liquid formulations. A transfer coefficient of 140,000 cm2/hr for adults and 38,000 cm2/hr for children (based on the arithmetic mean) is recommended for assessing post-application exposure for RTU solid formulations (i.e., dust and powder). Table 8-4 provides a statistical summary of dermal exposure TCs derived for solid formulations. A description of these studies and statistical derivations can be found in Section D.7.4 of Appendix D.
Table 8-3: Dermal Exposure Transfer Coefficients - Liquid Formulations Statistic Transfer Coefficient (cm2/hr) a, b
Liquids (Dips, Shampoos, Aerosol/Trigger Sprays, Collars and Spot-Ons) Children 1 < 2 years old Adult 50th Percentile 980 3,600 75th Percentile 1,700 6,400 95th Percentile 3,900 15,000 99th Percentile 7,000 26,000 AM (SD) 1,400 (1,400) 5,200 (5,300) GM (GSD) 980 (2.3) 3,600 (2.3) Range NA c 522-12,846 N NA c 16 a. Representative of individuals wearing short-sleeve shirts, shorts, and no gloves b. Dermal liquid formulation TC based on a lognormal distribution fit with data from MRID 46658401 (See Section D.7.4 of Appendix D). c. NA = Not applicable. Child values were derived by scaling adult data.
Table 8-4: Dermal Exposure Transfer Coefficients - Solid Formulations
Statistic Transfer Coefficient (cm2/hr) a, b Solids (Dusts/Powders)
Children 1 < 2 years old Adult 50th Percentile 31,000 120,000 75th Percentile 47,000 170,000
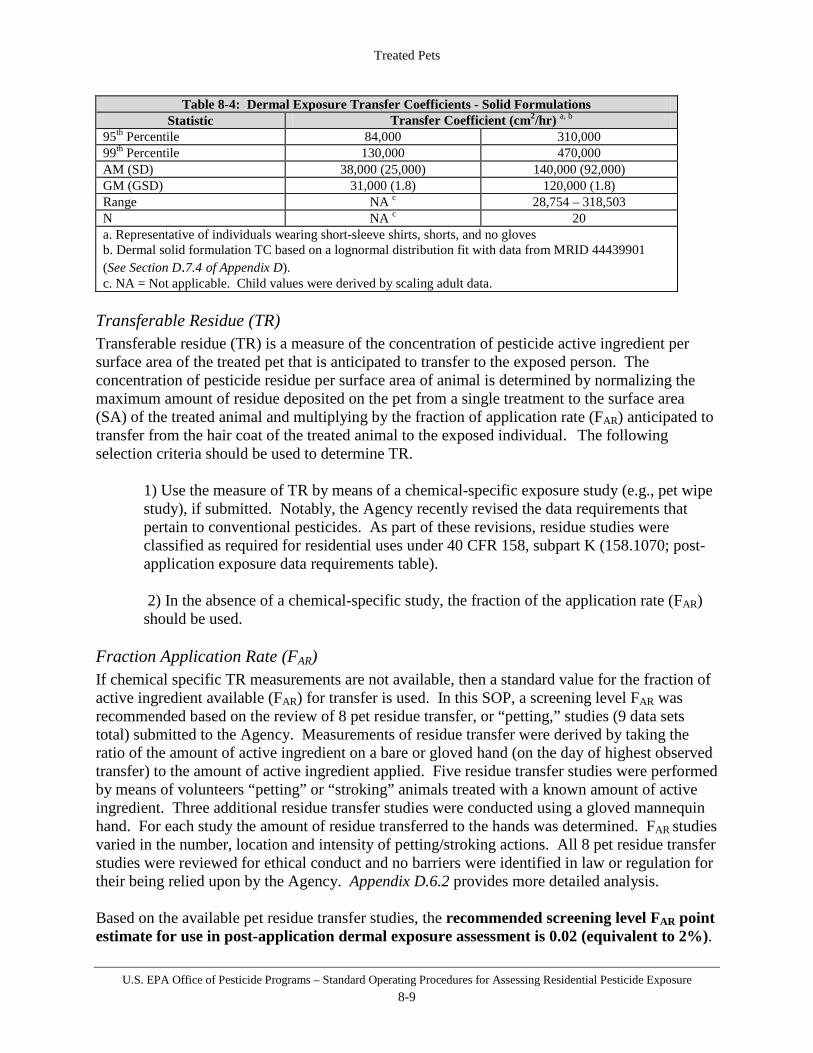
Treated Pets
U.S. EPA Office of Pesticide Programs – Standard Operating Procedures for Assessing Residential Pesticide Exposure 8-9
Table 8-4: Dermal Exposure Transfer Coefficients - Solid Formulations Statistic Transfer Coefficient (cm2/hr) a, b
95th Percentile 84,000 310,000 99th Percentile 130,000 470,000 AM (SD) 38,000 (25,000) 140,000 (92,000) GM (GSD) 31,000 (1.8) 120,000 (1.8) Range NA c 28,754 – 318,503 N NA c 20 a. Representative of individuals wearing short-sleeve shirts, shorts, and no gloves b. Dermal solid formulation TC based on a lognormal distribution fit with data from MRID 44439901 (See Section D.7.4 of Appendix D). c. NA = Not applicable. Child values were derived by scaling adult data.
Transferable Residue (TR) Transferable residue (TR) is a measure of the concentration of pesticide active ingredient per surface area of the treated pet that is anticipated to transfer to the exposed person. The concentration of pesticide residue per surface area of animal is determined by normalizing the maximum amount of residue deposited on the pet from a single treatment to the surface area (SA) of the treated animal and multiplying by the fraction of application rate (FAR) anticipated to transfer from the hair coat of the treated animal to the exposed individual. The following selection criteria should be used to determine TR.
1) Use the measure of TR by means of a chemical-specific exposure study (e.g., pet wipe study), if submitted. Notably, the Agency recently revised the data requirements that pertain to conventional pesticides. As part of these revisions, residue studies were classified as required for residential uses under 40 CFR 158, subpart K (158.1070; post-application exposure data requirements table). 2) In the absence of a chemical-specific study, the fraction of the application rate (FAR) should be used.
Fraction Application Rate (FAR) If chemical specific TR measurements are not available, then a standard value for the fraction of active ingredient available (FAR) for transfer is used. In this SOP, a screening level FAR was recommended based on the review of 8 pet residue transfer, or “petting,” studies (9 data sets total) submitted to the Agency. Measurements of residue transfer were derived by taking the ratio of the amount of active ingredient on a bare or gloved hand (on the day of highest observed transfer) to the amount of active ingredient applied. Five residue transfer studies were performed by means of volunteers “petting” or “stroking” animals treated with a known amount of active ingredient. Three additional residue transfer studies were conducted using a gloved mannequin hand. For each study the amount of residue transferred to the hands was determined. FAR studies varied in the number, location and intensity of petting/stroking actions. All 8 pet residue transfer studies were reviewed for ethical conduct and no barriers were identified in law or regulation for their being relied upon by the Agency. Appendix D.6.2 provides more detailed analysis. Based on the available pet residue transfer studies, the recommended screening level FAR point estimate for use in post-application dermal exposure assessment is 0.02 (equivalent to 2%).

Treated Pets
U.S. EPA Office of Pesticide Programs – Standard Operating Procedures for Assessing Residential Pesticide Exposure 8-10
Exposure Time (ET) The exposure time (ET) for adults and children were derived from Tsang and Klepeis, 1996 (as presented in 1997 Exposure Factors Handbook Table 15-77). Animal care is defined in the 1997 Exposure Factors Handbook as “care of household pets including activities with pets, playing with the dog, walking the dog and caring for pets of relatives, and friends.” The data identified the time spent with an animal while performing household activities as recorded in 24 hour diaries by study volunteers. While the activities defined do not necessarily represent the time volunteers were actively engaged in constant contact with the animal as is implicit in the post-application dermal and incidental oral algorithms, the data are the most accurate representation of time spent with pets available and, therefore, it is assumed that contact is continual throughout the timed activity. The distribution for exposure time for children 1 < 2 years old is provided in Table 8-5 and adults in Table 8-6. The recommended point estimate for use in post-application dermal exposure assessments, 1.0, represents approximately the arithmetic mean. A description of the input and study can be found in Section D.7.4 Appendix D.
Table 8-5: Daily Exposure Time (ET) with Pets (Children 1 < 2 years old) Statistic Time (hours)
5th percentile 0.05 25th percentile 0.5 50th percentile 1.0 75th percentile 1.5 90th percentile 2.3 95th percentile 2.3
AM (SD) 1.0 (0.74) AM (SD) = arithmetic mean (standard deviation) Data presented for children 1 < 4 years old from Tsang and Klepeis, 1996 (as presented in the 1997 Exposure Factors Handbook).
Table 8-6: Daily Exposure Time (ET) with Pets (Adults)
Statistic Time (hours) 5th percentile 0.05
25th percentile 0.17 50th percentile 0.5 75th percentile 1.0 90th percentile 1.8 95th percentile 2.5
AM (SD) 0.77 (1.1) AM (SD) = arithmetic mean (standard deviation) Data presented for adults 18-64 years old from Tsang and Klepeis, 1996 (as presented in the 1997 Exposure Factors Handbook).

Treated Pets
U.S. EPA Office of Pesticide Programs – Standard Operating Procedures for Assessing Residential Pesticide Exposure 8-11
Application Rate (AR) The pesticide label should be used to determine the amount of active ingredient used during each treatment. The maximum application rates allowed by labels are always considered in risk assessments. For pet pesticide formulations which specify application rate in relation to animal weight (i.e., spot-ons), a rate should be quantified for small, medium and large weight classifications as assigned by the Agency. The weight ranges are as follow:
• Cats – Small (up to 5 lbs), Medium (6 to 12 lbs), Large (13 lbs and up). • Dogs - Small (up to 20 pounds), Medium (21 to 50 lbs) and Large (51 lbs and up).
Many application methods of pet pesticides (i.e., dips, shampoos and aerosol/trigger sprays) are not specific about application rate in relation to pet weight. If not specified, then it should be assumed that 1/2 of the contents of the can or bottle of product is applied to the pet based on professional judgment. The majority of pet collar formulations are registered as a single collar for use on all animal weight ranges with directions to fit the collar to the treated animal and trim off the excess length. Because the trimmed length and corresponding active ingredient loss cannot be determined, the maximum application rate of the collar as labeled should be assumed for assessment of post-application risk. Surface Area (SA) Animal surface area (SA) is determined by inputting animal weight (lbs) into an algorithm (12.3*((animal body weight (lbs)*454)^0.65)) as referenced from U.S. EPA (1993) Wildlife Exposure Factors Handbook. Representative surface areas have been calculated for the assigned cat and dog weight ranges. The surface areas for assessment are as follows:
• Cats – Small (1500 cm2), Medium (2500 cm2) and Large (4000 cm2). • Dogs – Small (3000 cm2), Medium (7000 cm2) and Large (11000 cm2).
Future Research/Data Needs Areas of research and data needs for the assessment of post-application dermal exposure from treated pets include:
• Product survey data could be useful in refinement of the Agency’s current, high-end assumptions for use patterns of particular pet pesticide application methods.
• Studies conducted to determine residue transfer occurring from actual adult and child activities with treated pets could provide a more realistic estimate of transfer (TC)
• Activity durations and pet contacts (either video or reported recordings) would help the Agency to refine its exposure time assumption.
Exposure Characterization and Data Quality
• Information on the amount of product applied to the animal for particular application methods (e.g., aerosol and trigger sprays, powders/dusts and shampoos) is largely unavailable. Due to the lack of specific product labeling and the lack of data to inform typical application method use patterns, the Agency assumes that ½ of the can or bottle can be applied for each animal based on best professional judgment. This estimate is

Treated Pets
U.S. EPA Office of Pesticide Programs – Standard Operating Procedures for Assessing Residential Pesticide Exposure 8-12
considered a high-end assumption resulting in a health-protective exposure estimate. • The Agency did not identify any studies which were conducted to capture the range of
exposures which could occur as a result of normal residential interactions with a treated pet. While studies were conducted to determine the fraction of the application rate transferred from the treated pet to an exposed person, these data are limited in that they used scripted activity patterns (i.e., petting) and only measured exposure to the hands of the study participants. Thus, these studies are limited for assessing exposure from actual activities to the whole body of people contacting treated pets. As a result of these limitations, EPA recommended the use of applicator and groomer studies that are assumed to represent vigorous contact with an animal. These activities are likely to result in higher, more consistent and reliable contact factors than petting, hugging or sleeping with a pet and, therefore, were used to derive a TC assumed to be health-protective.
• The exposure time (ET) assumed by the Agency represents daily contact associated with pet care (i.e., feeding, playing, walking, etc.). The NCEA data include the entirety of time spent daily, including high, as well as low contact activities. Therefore, the Agency believes that the recommended point estimates for children and adults (1.0 and 0.77 hours per day of continual exposure, respectively) in conjunction with high-end TCs derived from groomer studies, represents a health-protective estimate of adult and child exposure to a treated pet. Furthermore, the study was the only identified by the Agency which specifically monitored human activity duration, as well as contact with pets and is therefore the best available source of data.
8.2.3 Post-application Non-Dietary Ingestion Exposure Assessment: Hand-to-Mouth
This SOP provides a standard method for estimating the potential dose from incidental ingestion of pesticide residues from previously treated pets. Considering the strengths and limitations of available data and behavioral characteristics of potentially exposed lifestages, exposure for children is calculated in this scenario. This scenario assumes that pesticide residues are transferred to the skin of children contacting treated pets and are subsequently ingested as a result of hand-to-mouth transfer. Post-application Hand-to-Mouth Exposure Algorithm Exposure from hand-to-mouth activity is calculated as follows (based on algorithm utilized in SHEDS-Multimedia): (8.6) where:
E = exposure (mg/day); HR = hand residue loading (mg/cm2); SAH = surface area of one child hand (cm2); FM = fraction hand surface area mouthed /event (fraction/event); ET = exposure time (hr/day);
( ) ( ) ( )
−−∗∗∗∗∗= ReplenN
HtMFreq
HM SEReplenNETSAFHRE __
11_

Treated Pets
U.S. EPA Office of Pesticide Programs – Standard Operating Procedures for Assessing Residential Pesticide Exposure 8-13
N_Replen = number of replenishment intervals per hour (intervals/hour); SE = saliva extraction factor (i.e., mouthing removal efficiency); and Freq_HtM = number of hand-to-mouth contacts events per hour (events/hour).
and
2* SADE* Fai
HRH
hands= (8.7)
where:
HR = hand residue loading (mg/cm2); DE = dermal exposure (mg); Faihands = fraction of a.i. on hands compared to total residue from dermal transfer
coefficient study (unitless); and SAH = surface area of one child hand (cm2).
Oral dose, normalized to body weight, is calculated as:
BWED = (8.8)
where: D = dose (mg/kg-day); E = exposure (mg/day); and BW = body weight (kg).
Post-application Hand-to-Mouth Exposure Algorithm Inputs and Assumptions Recommended values for post-application hand-to-mouth exposure assessments are provided in Table 8-7 below. Following this table, each scenario-specific input parameter is described in more detail. This description includes a summary of i) key assumptions; ii) data sources used to derive recommended input values; and iii) discussion of limitations that should be addressed when characterizing exposure.
Table 8-7: Pet Treatments – Recommended Hand-to-Mouth Exposure Factor Point Algorithm Notation
Exposure Factor (units) Point Estimate(s)
Fai hands Fraction of a.i. on hands from transfer coefficient
studies (unitless) Solid = 0.37
Liquid = 0.040
FM Fraction hand surface area mouthed /event
(fraction/event) 0.13
N_Replen Replenishment intervals per hour (intervals/hr) 4
ET Exposure time (hours/day)
Children 1 < 2 years old 1.0
SE Saliva extraction factor 0.48
Freq_HtM Hand-to-mouth events per
hour (events/hr)
Children 1 < 2 years old Mean = 20
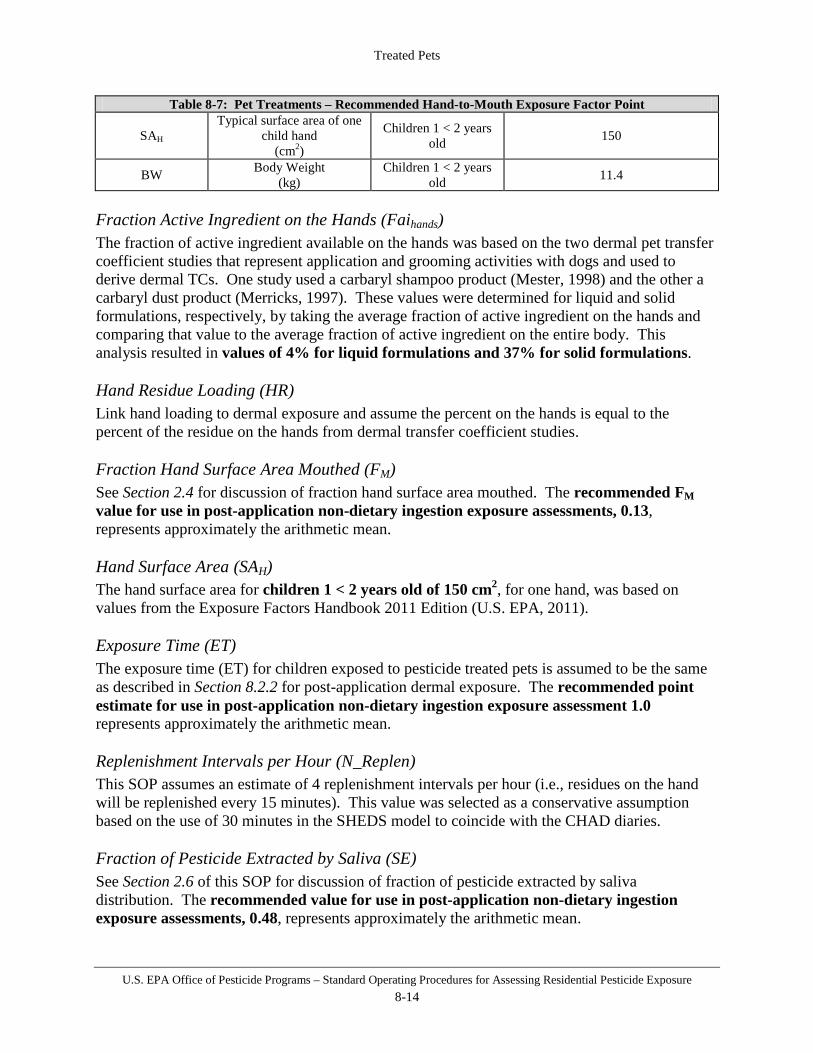
Treated Pets
U.S. EPA Office of Pesticide Programs – Standard Operating Procedures for Assessing Residential Pesticide Exposure 8-14
Table 8-7: Pet Treatments – Recommended Hand-to-Mouth Exposure Factor Point
SAH
Typical surface area of one child hand
(cm2)
Children 1 < 2 years old 150
BW Body Weight (kg)
Children 1 < 2 years old 11.4
Fraction Active Ingredient on the Hands (Faihands) The fraction of active ingredient available on the hands was based on the two dermal pet transfer coefficient studies that represent application and grooming activities with dogs and used to derive dermal TCs. One study used a carbaryl shampoo product (Mester, 1998) and the other a carbaryl dust product (Merricks, 1997). These values were determined for liquid and solid formulations, respectively, by taking the average fraction of active ingredient on the hands and comparing that value to the average fraction of active ingredient on the entire body. This analysis resulted in values of 4% for liquid formulations and 37% for solid formulations. Hand Residue Loading (HR) Link hand loading to dermal exposure and assume the percent on the hands is equal to the percent of the residue on the hands from dermal transfer coefficient studies. Fraction Hand Surface Area Mouthed (FM) See Section 2.4 for discussion of fraction hand surface area mouthed. The recommended FM value for use in post-application non-dietary ingestion exposure assessments, 0.13, represents approximately the arithmetic mean. Hand Surface Area (SAH) The hand surface area for children 1 < 2 years old of 150 cm2, for one hand, was based on values from the Exposure Factors Handbook 2011 Edition (U.S. EPA, 2011). Exposure Time (ET) The exposure time (ET) for children exposed to pesticide treated pets is assumed to be the same as described in Section 8.2.2 for post-application dermal exposure. The recommended point estimate for use in post-application non-dietary ingestion exposure assessment 1.0 represents approximately the arithmetic mean.
Replenishment Intervals per Hour (N_Replen) This SOP assumes an estimate of 4 replenishment intervals per hour (i.e., residues on the hand will be replenished every 15 minutes). This value was selected as a conservative assumption based on the use of 30 minutes in the SHEDS model to coincide with the CHAD diaries.
Fraction of Pesticide Extracted by Saliva (SE) See Section 2.6 of this SOP for discussion of fraction of pesticide extracted by saliva distribution. The recommended value for use in post-application non-dietary ingestion exposure assessments, 0.48, represents approximately the arithmetic mean.
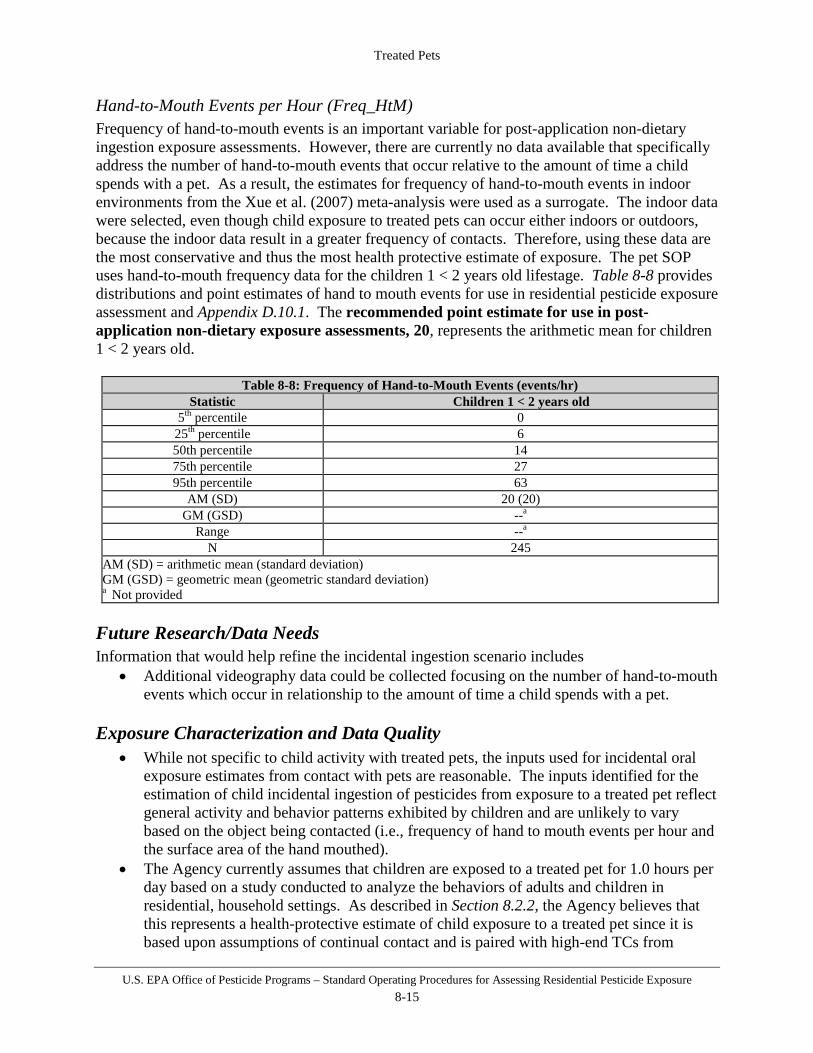
Treated Pets
U.S. EPA Office of Pesticide Programs – Standard Operating Procedures for Assessing Residential Pesticide Exposure 8-15
Hand-to-Mouth Events per Hour (Freq_HtM) Frequency of hand-to-mouth events is an important variable for post-application non-dietary ingestion exposure assessments. However, there are currently no data available that specifically address the number of hand-to-mouth events that occur relative to the amount of time a child spends with a pet. As a result, the estimates for frequency of hand-to-mouth events in indoor environments from the Xue et al. (2007) meta-analysis were used as a surrogate. The indoor data were selected, even though child exposure to treated pets can occur either indoors or outdoors, because the indoor data result in a greater frequency of contacts. Therefore, using these data are the most conservative and thus the most health protective estimate of exposure. The pet SOP uses hand-to-mouth frequency data for the children 1 < 2 years old lifestage. Table 8-8 provides distributions and point estimates of hand to mouth events for use in residential pesticide exposure assessment and Appendix D.10.1. The recommended point estimate for use in post-application non-dietary exposure assessments, 20, represents the arithmetic mean for children 1 < 2 years old.
Table 8-8: Frequency of Hand-to-Mouth Events (events/hr)
Statistic Children 1 < 2 years old 5th percentile 0
25th percentile 6 50th percentile 14 75th percentile 27 95th percentile 63
AM (SD) 20 (20) GM (GSD) --a
Range --a N 245
AM (SD) = arithmetic mean (standard deviation) GM (GSD) = geometric mean (geometric standard deviation) a Not provided
Future Research/Data Needs Information that would help refine the incidental ingestion scenario includes
• Additional videography data could be collected focusing on the number of hand-to-mouth events which occur in relationship to the amount of time a child spends with a pet.
Exposure Characterization and Data Quality
• While not specific to child activity with treated pets, the inputs used for incidental oral exposure estimates from contact with pets are reasonable. The inputs identified for the estimation of child incidental ingestion of pesticides from exposure to a treated pet reflect general activity and behavior patterns exhibited by children and are unlikely to vary based on the object being contacted (i.e., frequency of hand to mouth events per hour and the surface area of the hand mouthed).
• The Agency currently assumes that children are exposed to a treated pet for 1.0 hours per day based on a study conducted to analyze the behaviors of adults and children in residential, household settings. As described in Section 8.2.2, the Agency believes that this represents a health-protective estimate of child exposure to a treated pet since it is based upon assumptions of continual contact and is paired with high-end TCs from

Treated Pets
U.S. EPA Office of Pesticide Programs – Standard Operating Procedures for Assessing Residential Pesticide Exposure 8-16
applicator and groomer studies.
8.2.4 Combining Post-application Scenarios Risks resulting from different exposure scenarios are combined when it is likely that they can occur simultaneously based on the use pattern and when the toxicological effects across different routes of exposure are the same. When combining scenarios, it is important to fully characterize the potential for co-occurrence as well as characterizing the risk inputs and estimates. Risks should be combined even if any one scenario or route of exposure exceeds the level of concern because this allows for better risk characterization for risk managers. It is likely that children could be exposed to a treated pet via post-application dermal and non-dietary ingestion (hand-to-mouth) routes and that these scenarios could occur simultaneously. Therefore, these exposure scenarios should be combined when toxicological effects are the same across these routes of exposure.

Impregnated Materials
U.S. EPA Office of Pesticide Programs – Standard Operating Procedures for Assessing Residential Pesticide Exposure 9-1
Section 9 Impregnated Materials
This section provides methodologies for assessing pesticide exposures from pesticide impregnated materials, including textiles (e.g. clothing, mattress linings, upholstery, etc.), carpets, flooring, and plastic materials. The exposure assessment methodologies provide a general approach and conceptual framework for evaluating a broad range of impregnated materials. Therefore, it is recommended that exposure assessors evaluate whether the methods outlined in this section represent the specific type of impregnated materials under assessment and review exposure assessment methodologies established by the World Health Organization’s International Programme on Chemical Safety for treated bednets and other appropriate regulatory agencies (WHO/IPCS, 2004). When assessing pesticide exposure from impregnated materials, the primary exposure routes that may need to be addressed include post-application dermal absorption and non-dietary ingestion. Exposure from these routes may result in pesticide exposures in the general population. However, some population groups, such as military personnel, outdoor workers, and children, may display activity patterns that have the potential to result in higher levels of exposure (e.g., military personnel and outdoor workers who wear impregnated clothing for extended periods of time, children who display hand-to-mouth activity), which may need to be addressed more explicitly when performing exposure assessments. Before developing an exposure assessment for an impregnated material, the appropriate exposure scenarios should be identified using information on the product’s pesticide label. Specific label information that should be considered is described below.
• Impregnated Materials with Pesticidal Claims: Some impregnated materials contain conventional pesticides and have a pesticide label. The labels of such products make claims about pest control, such as "repels fleas and ticks" or "repels flying insects." These labels contain information on the active ingredient and should be used when performing exposure assessments using the methods described in this chapter.
• Impregnated Materials with No Pesticidal Claims: Many impregnated materials (e.g.,
mattress covers, shower curtains, paper, and adhesives) contain biocide pesticides and do not require a pesticide label. The pesticide in these products is present as a biocide, which is added during the manufacturing process. Biocides are more routinely assessed by OPP’s Antimicrobial Division (OPP/AD) and are not addressed in this chapter.
• Limiting and Descriptive Statements: It should be assumed that impregnated products
may be used in non-occupational settings, unless otherwise indicated on the label. Examples of labels that may appear on products that are intended for non-occupational settings include:
o Insect repellent apparel;
Impregnated Materials
U.S. EPA Office of Pesticide Programs – Standard Operating Procedures for Assessing Residential Pesticide Exposure 9-2
o For treatment of nets, tents, sleeping bags; and o For fabric product on and around beds.
9.1 Handler Exposure Assessment For impregnated materials treated with non-biocide pesticides (e.g. insecticides and repellents), exposure during the manufacturing process is not typically assessed by EPA.16 There are some situations following the treatment process, however, where individuals may contact large volumes of impregnated material. The handling of impregnated materials following the treatment process is addressed in the post-application dermal exposure scenario described in Section 9.2.3. 9.2 Post-Application Exposure Assessment Post-application exposure can result from contacting impregnated materials, such as wearing pesticide impregnated clothing and hand- or object-to-mouth behavior. Depending on the application of the impregnated material, potential exposed populations include both adults and children. While exposure may occur for people of all ages, adults and children 1 < 2 years old are considered the index lifestages based on behavioral characteristics and the strengths and limitations of available data. This section addresses standard methods for estimating exposure and dose for four post-application scenarios resulting from pesticide impregnated materials:
• Section 9.2.1 – inhalation exposures; • Section 9.2.3 – adult/children 1 < 2 years old dermal exposures; • Section 9.2.4 – children 1 < 2 years old non-dietary ingestion via object-to-mouth
activity; and • Section 9.2.5 – children 1 < 2 years old non-dietary ingestion via hand-to-mouth activity.
9.2.1 Post-Application Inhalation Exposure Assessment In most cases inhalation exposure from impregnated materials is expected to be negligible, since many pesticides that are used in impregnated materials have relatively low vapor pressures. As a result, inhalation exposure is not expected to result in appreciable exposure when compared with dermal and non-dietary ingestion exposure, and is not explicitly addressed in these SOPs.
9.2.2 Post-Application Surface Residue Concentration When assessing dermal and non-dietary ingestion scenarios, the product label and registrant should be consulted to obtain information on the surface residue concentration in terms of active
16 Safety issues associated with potential chemical exposure during the manufacturing process are more typically addressed by the Occupational Safety and Health Administration, but may also be addressed in the occupational pesticide exposure assessment.
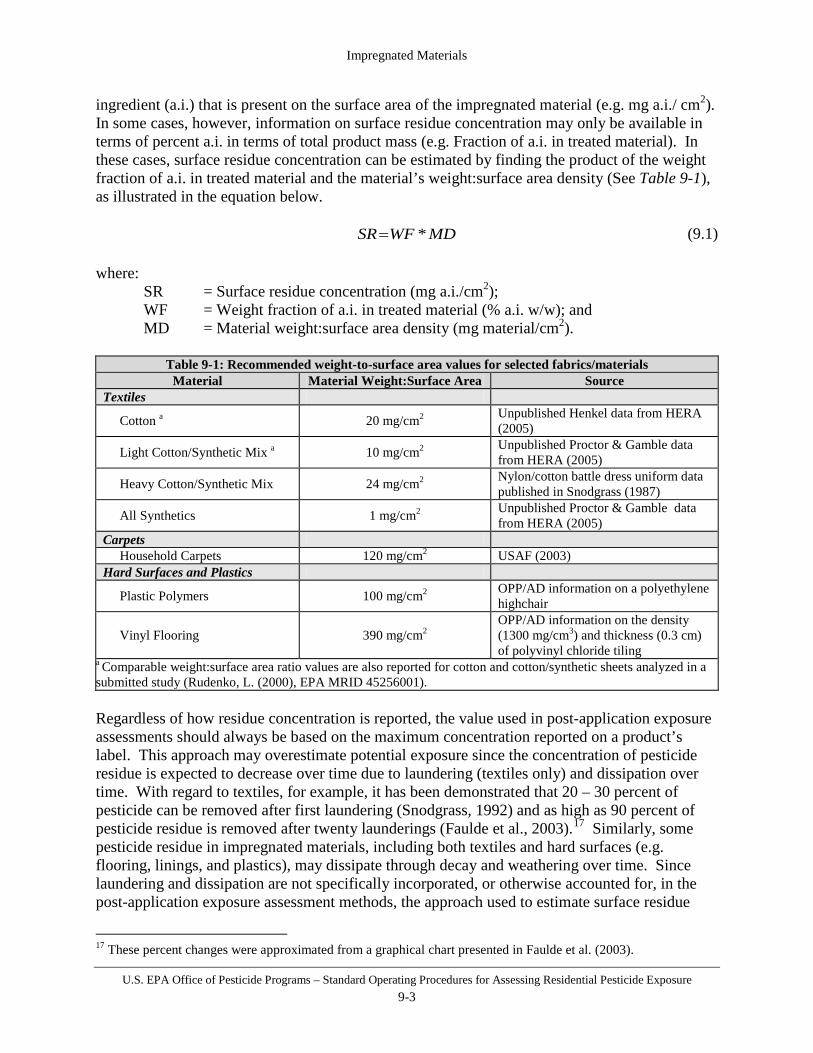
Impregnated Materials
U.S. EPA Office of Pesticide Programs – Standard Operating Procedures for Assessing Residential Pesticide Exposure 9-3
ingredient (a.i.) that is present on the surface area of the impregnated material (e.g. mg a.i./ cm2). In some cases, however, information on surface residue concentration may only be available in terms of percent a.i. in terms of total product mass (e.g. Fraction of a.i. in treated material). In these cases, surface residue concentration can be estimated by finding the product of the weight fraction of a.i. in treated material and the material’s weight:surface area density (See Table 9-1), as illustrated in the equation below. MDWFSR *= (9.1) where:
SR = Surface residue concentration (mg a.i./cm2); WF = Weight fraction of a.i. in treated material (% a.i. w/w); and MD = Material weight:surface area density (mg material/cm2).
Table 9-1: Recommended weight-to-surface area values for selected fabrics/materials
Material Material Weight:Surface Area Source Textiles
Cotton a 20 mg/cm2 Unpublished Henkel data from HERA (2005)
Light Cotton/Synthetic Mix a 10 mg/cm2 Unpublished Proctor & Gamble data from HERA (2005)
Heavy Cotton/Synthetic Mix 24 mg/cm2 Nylon/cotton battle dress uniform data published in Snodgrass (1987)
All Synthetics 1 mg/cm2 Unpublished Proctor & Gamble data from HERA (2005)
Carpets Household Carpets 120 mg/cm2 USAF (2003)
Hard Surfaces and Plastics
Plastic Polymers 100 mg/cm2 OPP/AD information on a polyethylene highchair
Vinyl Flooring 390 mg/cm2 OPP/AD information on the density (1300 mg/cm3) and thickness (0.3 cm) of polyvinyl chloride tiling
a Comparable weight:surface area ratio values are also reported for cotton and cotton/synthetic sheets analyzed in a submitted study (Rudenko, L. (2000), EPA MRID 45256001). Regardless of how residue concentration is reported, the value used in post-application exposure assessments should always be based on the maximum concentration reported on a product’s label. This approach may overestimate potential exposure since the concentration of pesticide residue is expected to decrease over time due to laundering (textiles only) and dissipation over time. With regard to textiles, for example, it has been demonstrated that 20 – 30 percent of pesticide can be removed after first laundering (Snodgrass, 1992) and as high as 90 percent of pesticide residue is removed after twenty launderings (Faulde et al., 2003).17 Similarly, some pesticide residue in impregnated materials, including both textiles and hard surfaces (e.g. flooring, linings, and plastics), may dissipate through decay and weathering over time. Since laundering and dissipation are not specifically incorporated, or otherwise accounted for, in the post-application exposure assessment methods, the approach used to estimate surface residue
17 These percent changes were approximated from a graphical chart presented in Faulde et al. (2003).
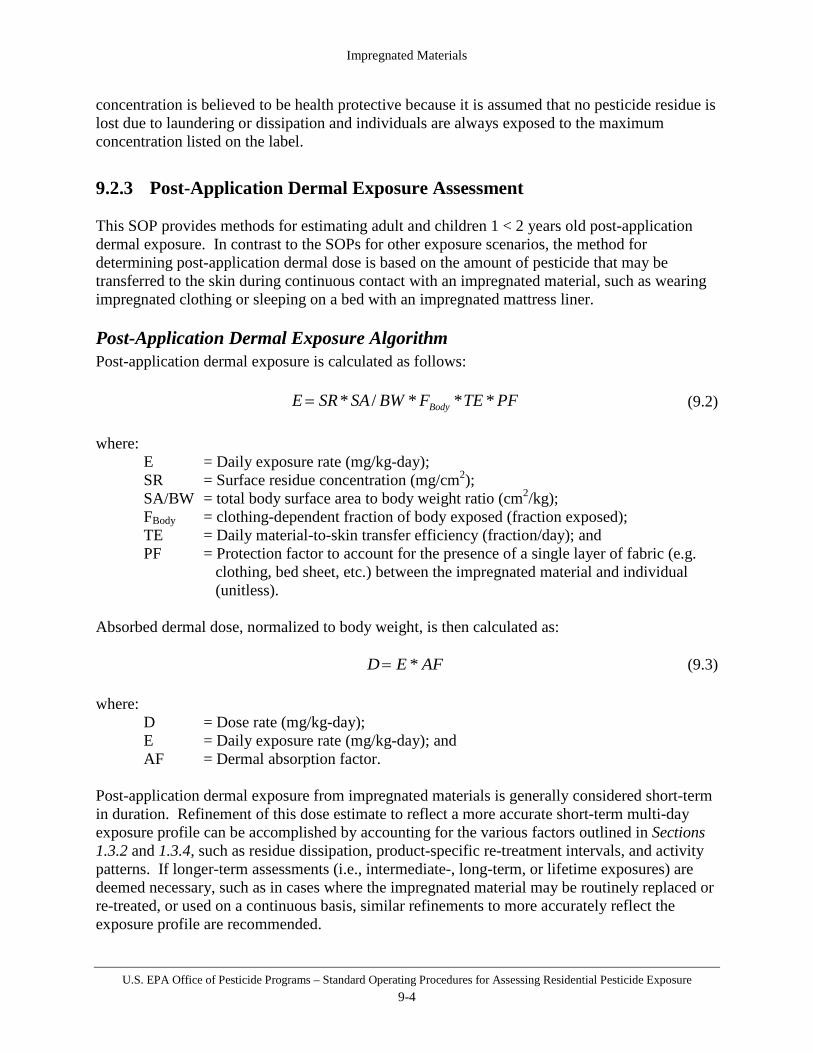
Impregnated Materials
U.S. EPA Office of Pesticide Programs – Standard Operating Procedures for Assessing Residential Pesticide Exposure 9-4
concentration is believed to be health protective because it is assumed that no pesticide residue is lost due to laundering or dissipation and individuals are always exposed to the maximum concentration listed on the label.
9.2.3 Post-Application Dermal Exposure Assessment This SOP provides methods for estimating adult and children 1 < 2 years old post-application dermal exposure. In contrast to the SOPs for other exposure scenarios, the method for determining post-application dermal dose is based on the amount of pesticide that may be transferred to the skin during continuous contact with an impregnated material, such as wearing impregnated clothing or sleeping on a bed with an impregnated mattress liner. Post-Application Dermal Exposure Algorithm Post-application dermal exposure is calculated as follows: PFTEFBWSASRE Body ***/*= (9.2) where:
E = Daily exposure rate (mg/kg-day); SR = Surface residue concentration (mg/cm2); SA/BW = total body surface area to body weight ratio (cm2/kg); FBody = clothing-dependent fraction of body exposed (fraction exposed); TE = Daily material-to-skin transfer efficiency (fraction/day); and PF = Protection factor to account for the presence of a single layer of fabric (e.g.
clothing, bed sheet, etc.) between the impregnated material and individual (unitless).
Absorbed dermal dose, normalized to body weight, is then calculated as: AFED *= (9.3) where:
D = Dose rate (mg/kg-day); E = Daily exposure rate (mg/kg-day); and AF = Dermal absorption factor.
Post-application dermal exposure from impregnated materials is generally considered short-term in duration. Refinement of this dose estimate to reflect a more accurate short-term multi-day exposure profile can be accomplished by accounting for the various factors outlined in Sections 1.3.2 and 1.3.4, such as residue dissipation, product-specific re-treatment intervals, and activity patterns. If longer-term assessments (i.e., intermediate-, long-term, or lifetime exposures) are deemed necessary, such as in cases where the impregnated material may be routinely replaced or re-treated, or used on a continuous basis, similar refinements to more accurately reflect the exposure profile are recommended.

Impregnated Materials
U.S. EPA Office of Pesticide Programs – Standard Operating Procedures for Assessing Residential Pesticide Exposure 9-5
Post-Application Dermal Exposure Assessment Inputs and Assumptions Recommended values for post-application dermal exposure assessments of impregnated materials are provided in Table 9-2. Following this table, each scenario-specific input parameter is described in more detail. This description includes a summary of i) key assumptions; ii) data sources used to derive recommended input values; and iii) discussion of limitations that should be addressed when characterizing exposure.
Table 9-2: Summary of recommended values for post-application dermal exposure assessment. Algorithm Notation Exposure Factor (Units) Recommended
Input Values SR Residue Concentration (mg a.i. /cm2) Label WF Percent A.I. by Weight (% w/w) Label
MD Material weight:surface area density (mg/cm2)
Textile: Cotton 20 Textile: Light
Cotton/Synthetic Mix 10
Textile: Heavy Cotton/Synthetic Mix 24
Textile: All Synthetics 1 Household Carpets 120 Plastic Polymers 100 Vinyl Flooring 390
SA/BW total body surface area to body weight ratio (cm2/kg)
Adult 280 Children 1 to < 2 years old 640
FBody Fraction of body exposed
Pants, Jacket, or Shirts 0.50 Total Body Coverage 1.0
Mattresses, Carpets, or Flooring 0.50 Handlers 0.11
TE Daily Material-to-Skin Transfer Efficiency (fraction/day)
Textiles or Carpeting 0.06 Flooring or Hard Surfaces 0.08
PF Protection Factor Protective layer present
(Mattresses) 0.50
Protective layer not present 1.0 Surface Residue Concentration (SR) Surface residue concentration is the concentration of pesticide residue on the surface of an impregnated material. Product-specific information, such as weight fraction of a.i., should be used to estimate the residue concentration. This information may be found on labels or other information provided by the registrant/manufacturer. After obtaining this information, the surface residue concentration can be estimated using the methods described in Section 9.2.2. Fraction of Body Exposed (F) Fraction of body that contacts residue should be representative of the parts of the body that are expected to frequently contact the impregnated material. Table 9-3 provides the recommended inputs for assessing exposures from impregnated textiles, including jackets/shirts, total body coverage, and garment workers who may handle large volumes of clothing during their workday, and exposures from impregnated carpets, flooring, and hard surfaces. The recommended values are based on the surface area of different parts of the body and judgment about the fraction of the body that could potentially be exposed to different garments and surfaces. An impregnated shirt

Impregnated Materials
U.S. EPA Office of Pesticide Programs – Standard Operating Procedures for Assessing Residential Pesticide Exposure 9-6
or pants, for example, contacts roughly half of the body. Similarly, it is assumed that no more than half of the body contacts a mattress, carpet, or flooring. This assumption recognizes that the entire surface of the body has the potential to contact an impregnated surface. It is believed to be a reasonable assumption because it is unlikely that more half the body can contact a surface at a given time (e.g. roughly half of the body is in contact with a mattress when sleeping).
Table 9-3: Recommended input values for fraction of body surface area that contacts residue. Exposure Scenario (s) Representative Body Part Fraction of Body Pants, Jacket, or Shirts 50 percent of total body 0.50
Mattresses, Carpets, or Flooring 50 percent of total body 0.50 Total Body Coverage Complete upper and lower torso 1.0
Handlers Hands and Forearms a 0.11 a Derived using percent of body surface area exposed for hands and forearms from Table 6- 7. Daily Material-to-Skin Transfer Efficiency (TE) Daily material-to-skin transfer efficiency is the percent of pesticide residue that is transferred from an impregnated material to an individual’s skin during a one-day period. There is currently only limited data available to characterize the daily material-to-skin pesticide transfer efficiency for impregnated materials. In the absence of application-specific data, the amount of material-to-skin transfer can be determined using a worst-case screening where it is assumed that all of the a.i. that is available on the surface of an impregnated material is transferred to the skin. For refinement a lower fraction of residue is assume transferred, based on data on the fraction of a.i. that is available for transfer after carpet or hard surface pesticide treatment. Based on this approach, daily material-to-skin transfer efficiency values have been estimated using more recent data on the fraction of a.i. that is available for transfer from carpets and hard surfaces, which is described in the indoor exposure assessment SOPs provided in Section 7.2.2 of the Indoor Environments Section. Based on the data, the recommended values for textiles/carpets and hard surfaces are 0.06 and 0.08 per day, respectively.
Table 9-4: Recommended daily material-to-skin transfer efficiency values for textiles and hard surfaces. Material Daily Material-to-Skin Transfer Efficiency
Textiles or Carpeting 0.06/day Flooring or Hard Surfaces 0.08/day
While this approach has its limitations, it is expected to overestimate dermal exposure to impregnated materials. This is because the default material-to-skin transfer efficiency rates are based on data from carpets and hard surfaces that have had a pesticide applied to their external surface only. A lower fraction of pesticide is expected to be available for transfer because the pesticide compound is impregnated to the material and believed to have a lower potential for transfer. Additionally, the limited data that are available suggest that the material-to-skin transfer rate may more typically be an order of magnitude lower than the recommended values. Specifically, data that are available to characterize material-to-skin transfer efficiency from impregnated materials are described in more detail below.
• Permethrin-Treated Clothing: Snodgrass (1992) characterized the material-to-skin transfer rate for permethrin-treated battle-dress uniforms (BDUs). In this study, which
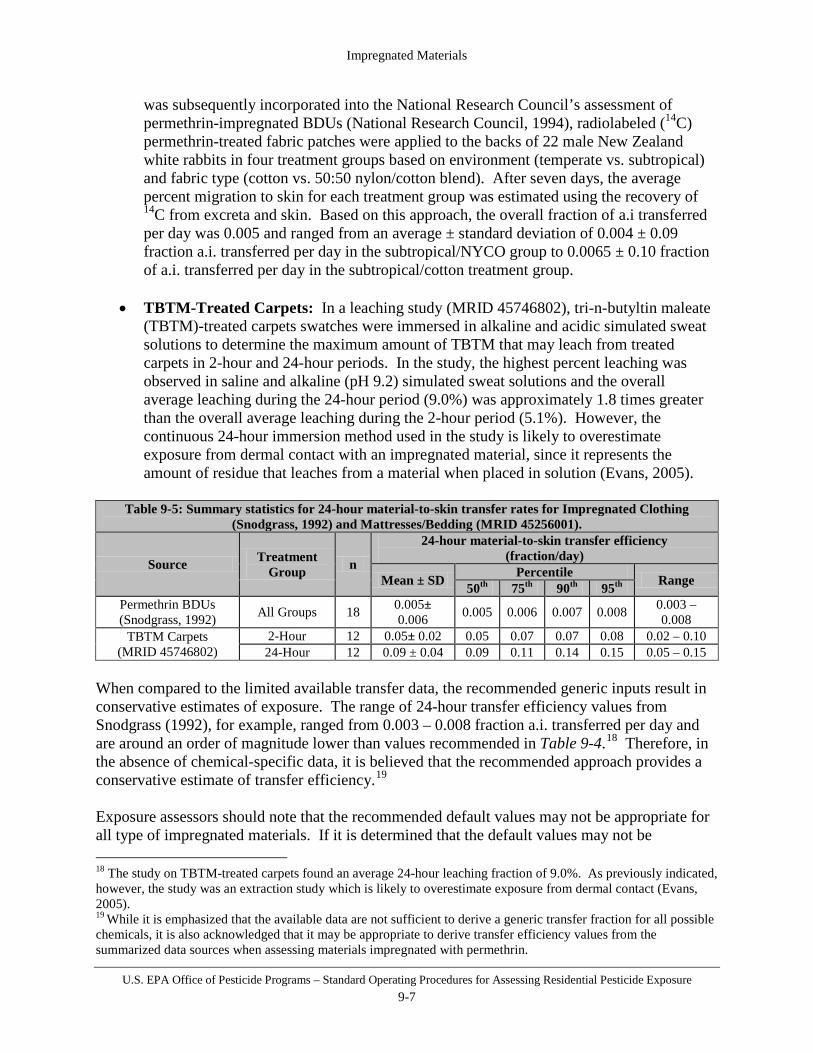
Impregnated Materials
U.S. EPA Office of Pesticide Programs – Standard Operating Procedures for Assessing Residential Pesticide Exposure 9-7
was subsequently incorporated into the National Research Council’s assessment of permethrin-impregnated BDUs (National Research Council, 1994), radiolabeled (14C) permethrin-treated fabric patches were applied to the backs of 22 male New Zealand white rabbits in four treatment groups based on environment (temperate vs. subtropical) and fabric type (cotton vs. 50:50 nylon/cotton blend). After seven days, the average percent migration to skin for each treatment group was estimated using the recovery of 14C from excreta and skin. Based on this approach, the overall fraction of a.i transferred per day was 0.005 and ranged from an average ± standard deviation of 0.004 ± 0.09 fraction a.i. transferred per day in the subtropical/NYCO group to 0.0065 ± 0.10 fraction of a.i. transferred per day in the subtropical/cotton treatment group.
• TBTM-Treated Carpets: In a leaching study (MRID 45746802), tri-n-butyltin maleate
(TBTM)-treated carpets swatches were immersed in alkaline and acidic simulated sweat solutions to determine the maximum amount of TBTM that may leach from treated carpets in 2-hour and 24-hour periods. In the study, the highest percent leaching was observed in saline and alkaline (pH 9.2) simulated sweat solutions and the overall average leaching during the 24-hour period (9.0%) was approximately 1.8 times greater than the overall average leaching during the 2-hour period (5.1%). However, the continuous 24-hour immersion method used in the study is likely to overestimate exposure from dermal contact with an impregnated material, since it represents the amount of residue that leaches from a material when placed in solution (Evans, 2005).
Table 9-5: Summary statistics for 24-hour material-to-skin transfer rates for Impregnated Clothing
(Snodgrass, 1992) and Mattresses/Bedding (MRID 45256001).
Source Treatment Group n
24-hour material-to-skin transfer efficiency (fraction/day)
Mean ± SD Percentile Range 50th 75th 90th 95th Permethrin BDUs (Snodgrass, 1992) All Groups 18 0.005±
0.006 0.005 0.006 0.007 0.008 0.003 – 0.008
TBTM Carpets (MRID 45746802)
2-Hour 12 0.05± 0.02 0.05 0.07 0.07 0.08 0.02 – 0.10 24-Hour 12 0.09 ± 0.04 0.09 0.11 0.14 0.15 0.05 – 0.15
When compared to the limited available transfer data, the recommended generic inputs result in conservative estimates of exposure. The range of 24-hour transfer efficiency values from Snodgrass (1992), for example, ranged from 0.003 – 0.008 fraction a.i. transferred per day and are around an order of magnitude lower than values recommended in Table 9-4.18 Therefore, in the absence of chemical-specific data, it is believed that the recommended approach provides a conservative estimate of transfer efficiency.19 Exposure assessors should note that the recommended default values may not be appropriate for all type of impregnated materials. If it is determined that the default values may not be 18 The study on TBTM-treated carpets found an average 24-hour leaching fraction of 9.0%. As previously indicated, however, the study was an extraction study which is likely to overestimate exposure from dermal contact (Evans, 2005). 19 While it is emphasized that the available data are not sufficient to derive a generic transfer fraction for all possible chemicals, it is also acknowledged that it may be appropriate to derive transfer efficiency values from the summarized data sources when assessing materials impregnated with permethrin.
Impregnated Materials
U.S. EPA Office of Pesticide Programs – Standard Operating Procedures for Assessing Residential Pesticide Exposure 9-8
appropriate and underestimate exposure, additional data may need to be requested to refine the estimate of the transfer efficiency value. Body Weight and Surface Area The exposure algorithm uses surface area (SA) and body weight (BW) as a ratio instead of as two separate factors. The recommended point estimate ratio for adults is 280 cm2/kg and 640 cm2/kg for children 1 < 2, from the Exposure Factors Handbook 2011 Edition, Table 7-15 (U.S. EPA, 2011). Protection Factor (PF) Bed sheets and other fabrics can act as a protective barrier when placed between an impregnated surface and an exposed individual’s skin. The protection factor, therefore, accounts for a decrease in pesticide residue transfer that is expected when bed sheets or other protective barriers are present. In these cases, the recommended input value is 0.50- meaning that it is assumed that only 50% of the available pesticide residue is transferred from the material to the potentially exposed individual’s skin. This default value is based on the PHED protection factor for a single layer of clothing and is also used by OPP/AD when conducting biocide exposure assessments involving mattresses. In cases other than mattresses, it should generally be assumed that no protective barrier is present. When no protective barrier is present, the recommended input value is 1.0. Future Research/Data Needs
• There is currently only limited data available to characterize the daily material-to-skin pesticide transfer efficiency for impregnated materials. While recommended methods are believed to provide health-protective estimates of exposure, additional research is needed to more fully characterize the dermal transfer of pesticide residue from impregnated materials.
• Survey data on the use patterns of impregnated materials could also help further characterize exposure.
Exposure Characterization and Data Quality
• Due to insufficient exposure data on impregnated materials, the exposure assessment scenarios presented in this chapter are based on data on externally treated surfaces that may not be completely representative of impregnated materials. As a consequence, the methods rely on conservative assumptions that cannot be completely characterized quantitatively. These assumptions include: 1) laundering and dissipation are not accounted for in the algorithm, so it is assumed that individuals are continually exposed to the maximum surface residue concentration; and 2) daily material-to-skin transfer efficiency was characterized using data on residue transfer from treated surfaces, rather than impregnated materials.

Impregnated Materials
U.S. EPA Office of Pesticide Programs – Standard Operating Procedures for Assessing Residential Pesticide Exposure 9-9
9.2.4 Post-Application Non-Dietary Ingestion Exposure Assessment: Object-to-Mouth (Textiles Only)
This SOP provides the methods for assessing non-dietary object-to-mouth ingestion of pesticide residues from impregnated materials by children. In general, object-to-mouth exposure assessments should be used to assess non-dietary exposure to impregnated textiles (e.g. clothing and other impregnated fabrics), but not other impregnated materials, such as carpeting and flooring, which are less likely to be mouthed. Non-Dietary Object-to-Mouth Ingestion Algorithm Exposure from object-to-mouth activity is calculated as follows (based on algorithm utilized in SHEDS-Multimedia):
(9.4) where:
E = exposure (mg/day); OR = chemical residue loading on an object (μg/cm2); CF1 = weight unit conversion factor (0.001 mg/µg); SAMO = area of the object surface that is mouthed (cm2/event); ET = exposure time (hr/day); N_Replen = number of replenishment intervals per hour (intervals/hour); SE = saliva extraction factor (i.e., mouthing removal efficiency); and Freq_OtM = number of object-to-mouth contact events per hour (events/hour).
and OR = SR * FO (9.5)
where:
OR = chemical residue loading on the object (μg/cm2); SR = surface residue (μg/cm2); and FO = fraction of residue available on the object (unitless).
Non-dietary oral dose, normalized to body weight, is then calculated as:
BW
AFED *= (9.6)
where:
D = dose rate (mg/kg-day); E = exposure (mg/day); AF = oral absorption factor; and BW = body weight (kg).
( ) ( )
−−∗∗= ReplenN
OtMFreq
O SEReplenNETSAMCFORE __
11_**1*
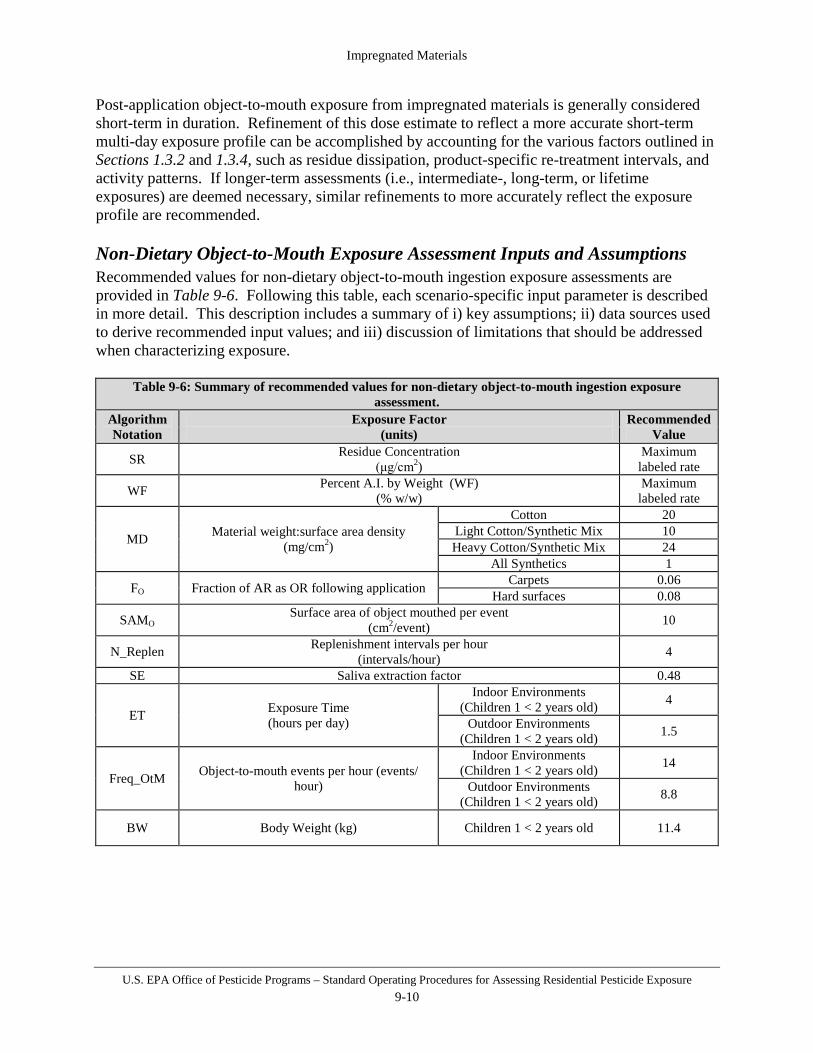
Impregnated Materials
U.S. EPA Office of Pesticide Programs – Standard Operating Procedures for Assessing Residential Pesticide Exposure 9-10
Post-application object-to-mouth exposure from impregnated materials is generally considered short-term in duration. Refinement of this dose estimate to reflect a more accurate short-term multi-day exposure profile can be accomplished by accounting for the various factors outlined in Sections 1.3.2 and 1.3.4, such as residue dissipation, product-specific re-treatment intervals, and activity patterns. If longer-term assessments (i.e., intermediate-, long-term, or lifetime exposures) are deemed necessary, similar refinements to more accurately reflect the exposure profile are recommended. Non-Dietary Object-to-Mouth Exposure Assessment Inputs and Assumptions Recommended values for non-dietary object-to-mouth ingestion exposure assessments are provided in Table 9-6. Following this table, each scenario-specific input parameter is described in more detail. This description includes a summary of i) key assumptions; ii) data sources used to derive recommended input values; and iii) discussion of limitations that should be addressed when characterizing exposure.
Table 9-6: Summary of recommended values for non-dietary object-to-mouth ingestion exposure assessment.
Algorithm Notation
Exposure Factor (units)
Recommended Value
SR Residue Concentration (μg/cm2)
Maximum labeled rate
WF Percent A.I. by Weight (WF) (% w/w)
Maximum labeled rate
MD Material weight:surface area density (mg/cm2)
Cotton 20 Light Cotton/Synthetic Mix 10 Heavy Cotton/Synthetic Mix 24
All Synthetics 1
FO Fraction of AR as OR following application Carpets 0.06 Hard surfaces 0.08
SAMO Surface area of object mouthed per event (cm2/event) 10
N_Replen Replenishment intervals per hour (intervals/hour) 4
SE Saliva extraction factor 0.48
ET Exposure Time (hours per day)
Indoor Environments (Children 1 < 2 years old) 4
Outdoor Environments (Children 1 < 2 years old) 1.5
Freq_OtM Object-to-mouth events per hour (events/ hour)
Indoor Environments (Children 1 < 2 years old) 14
Outdoor Environments (Children 1 < 2 years old) 8.8
BW Body Weight (kg) Children 1 < 2 years old 11.4

Impregnated Materials
U.S. EPA Office of Pesticide Programs – Standard Operating Procedures for Assessing Residential Pesticide Exposure 9-11
Surface Residue Concentration (SR) Surface residue concentration is the concentration of pesticide residue on the surface of an impregnated material. Product-specific information, such as weight fraction of a.i., should be used to estimate the residue concentration. This information may be found on labels or other information provided by the manufacturer. After obtaining this information, the surface residue concentration can be estimated using the methods described in Section 9.2.2. Fraction of Residue Available on the Object (FO) For this SOP, it is assumed that the residue that could be transferred to the object is the same as what is available for dermal transfer. As a result, the fraction of residue available for transfer assumed for dermal exposure for both carpets and hard surfaces should be used, which is provided in Section 7.2.2. Surface area of object mouthed (SAMO) Surface area of object mouthed (SAMO) is the area of an impregnated object that may contact a child’s mouth during mouthing behavior. SAMO is a universal exposure factor that is described in more detail in Section 2.5. The recommended value for use in exposure assessments is 10 cm2/event. Replenishment interval (N_Replen) This SOP assumes an estimate of 4 replenishment intervals per hour (i.e., residues on the hand will be replenished every 15 minutes). This value was selected as a conservative assumption based on the use of 30 minutes in the SHEDS model to coincide with the CHAD diaries. Fraction of Pesticide Extracted by Saliva (SE) See Section 2.6 of this SOP for discussion of the fraction of pesticide extracted by saliva distribution. The recommended point estimate for use in post-application incidental oral exposure assessments is 0.48. Exposure Time (ET) Exposure time is the amount of time that a child is an environment where they may contact a surface containing an impregnated material. There is currently no data available to characterize the amount of time that children spend in indoor and outdoor environments where they may contact impregnated materials. In the absence of scenario-specific data, recommended exposure time value for exposures that may occur in indoor environments is based on the children 1 < 2 years old exposure time values discussed in Section 7.2.4 of the Indoor Environment SOPs. Similarly, the recommended exposure time for outdoor environments is based on the children 1 < 2 years old exposure time values discussed in Section 3.2.4 of the Lawn/Turf SOP. Object-to-Mouth Events (Freq_OtM) Frequency of object-to-mouth events is the number of mouthing events that occur per hour. There is currently no data available that specifically address the number of object-to-mouth events that occur relative to the amount of time a child is in contact with an impregnated material. As a result, the estimate for frequency of object-to-mouth events in outdoor
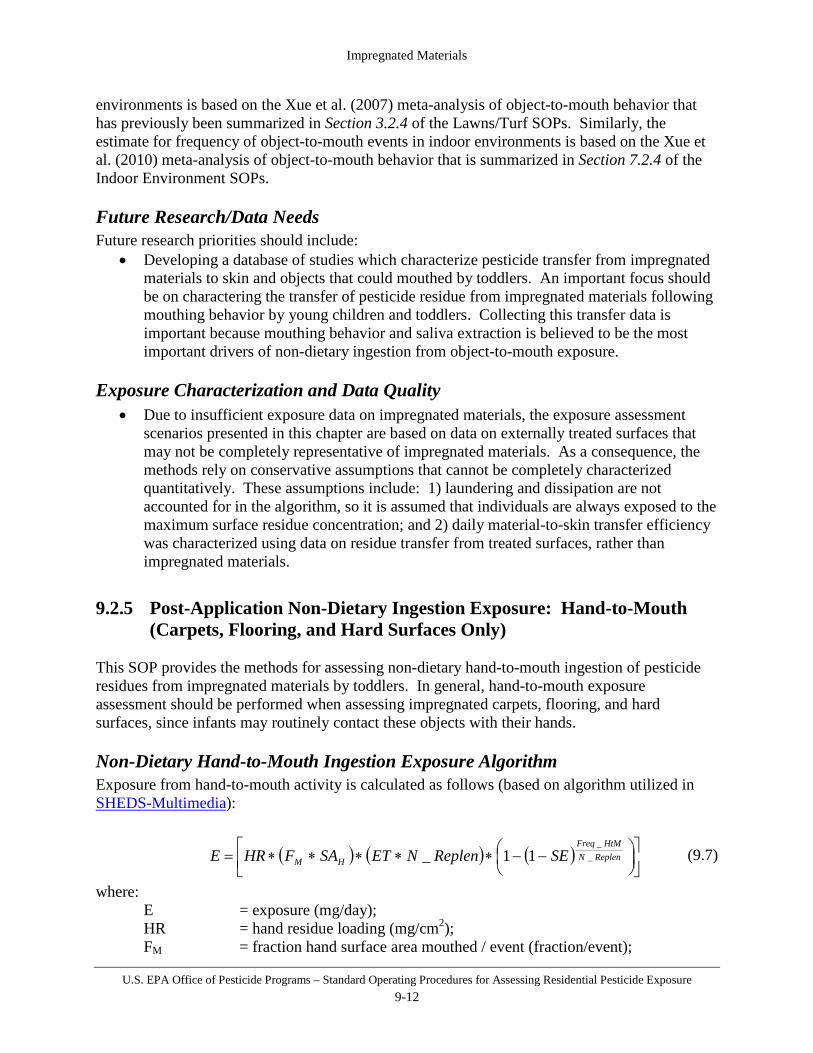
Impregnated Materials
U.S. EPA Office of Pesticide Programs – Standard Operating Procedures for Assessing Residential Pesticide Exposure 9-12
environments is based on the Xue et al. (2007) meta-analysis of object-to-mouth behavior that has previously been summarized in Section 3.2.4 of the Lawns/Turf SOPs. Similarly, the estimate for frequency of object-to-mouth events in indoor environments is based on the Xue et al. (2010) meta-analysis of object-to-mouth behavior that is summarized in Section 7.2.4 of the Indoor Environment SOPs. Future Research/Data Needs Future research priorities should include:
• Developing a database of studies which characterize pesticide transfer from impregnated materials to skin and objects that could mouthed by toddlers. An important focus should be on charactering the transfer of pesticide residue from impregnated materials following mouthing behavior by young children and toddlers. Collecting this transfer data is important because mouthing behavior and saliva extraction is believed to be the most important drivers of non-dietary ingestion from object-to-mouth exposure.
Exposure Characterization and Data Quality
• Due to insufficient exposure data on impregnated materials, the exposure assessment scenarios presented in this chapter are based on data on externally treated surfaces that may not be completely representative of impregnated materials. As a consequence, the methods rely on conservative assumptions that cannot be completely characterized quantitatively. These assumptions include: 1) laundering and dissipation are not accounted for in the algorithm, so it is assumed that individuals are always exposed to the maximum surface residue concentration; and 2) daily material-to-skin transfer efficiency was characterized using data on residue transfer from treated surfaces, rather than impregnated materials.
9.2.5 Post-Application Non-Dietary Ingestion Exposure: Hand-to-Mouth (Carpets, Flooring, and Hard Surfaces Only)
This SOP provides the methods for assessing non-dietary hand-to-mouth ingestion of pesticide residues from impregnated materials by toddlers. In general, hand-to-mouth exposure assessment should be performed when assessing impregnated carpets, flooring, and hard surfaces, since infants may routinely contact these objects with their hands. Non-Dietary Hand-to-Mouth Ingestion Exposure Algorithm Exposure from hand-to-mouth activity is calculated as follows (based on algorithm utilized in SHEDS-Multimedia): (9.7) where:
E = exposure (mg/day); HR = hand residue loading (mg/cm2); FM = fraction hand surface area mouthed / event (fraction/event);
( ) ( ) ( )
−−∗∗∗∗∗= ReplenN
HtMFreq
HM SEReplenNETSAFHRE __
11_

Impregnated Materials
U.S. EPA Office of Pesticide Programs – Standard Operating Procedures for Assessing Residential Pesticide Exposure 9-13
SAH = surface area of one hand (cm2); ET = exposure time (hr/day); N_Replen = number of replenishment intervals per hour (intervals/hour); SE = saliva extraction factor (ie, mouthing removal efficiency); and Freq_HtM = number of hand-to-mouth contacts events per hour (events/hour).
In this algorithm, hand residue concentration is calculated as: HF*SRHR = (9.8) where:
HR = hand residue concentration (mg/cm2); SR = surface residue (μg/cm2); and FH = fraction ai transferred to hands.
After calculating exposure, oral dose, normalized to body weight, is calculated as:
BWED = (9.9)
where:
D = dose (mg/kg-day); E = exposure (mg/day); and BW = body weight (kg).
Post-application hand-to-mouth exposure from impregnated materials is generally considered short-term in duration. Refinement of this dose estimate to reflect a more accurate short-term multi-day exposure profile can be accomplished by accounting for the various factors outlined in Sections 1.3.2 and 1.3.4, such as residue dissipation, product-specific re-treatment intervals, and activity patterns. If longer-term assessments (i.e., intermediate-, long-term, or lifetime exposures) are deemed necessary, such as in cases where the impregnated material may be routinely replaced or re-treated, similar refinements to more accurately reflect the exposure profile are recommended. Non-Dietary Hand-to-Mouth Exposure Assessment Inputs and Assumptions Recommended values for non-dietary hand-to-mouth ingestion exposure assessments are provided in Table 9-7. Following this table, each scenario-specific input parameter is described in more detail. This description includes a summary of i) key assumptions; ii) data sources used to derive recommended input values; and iii) discussion of limitations that should be addressed when characterizing exposure.
Table 9-7: Summary of recommended values for non-dietary hand-to-mouth ingestion exposure assessment.
Algorithm Notation
Exposure Factor (units) Point Estimate(s)
SR Surface Residue Concentration (mg a.i. /cm2) Product-Specific

Impregnated Materials
U.S. EPA Office of Pesticide Programs – Standard Operating Procedures for Assessing Residential Pesticide Exposure 9-14
Table 9-7: Summary of recommended values for non-dietary hand-to-mouth ingestion exposure assessment.
Label WF Percent A.I. by Weight (WF) (% w/w)
MD Material weight:surface area
density (mg/cm2)
Cotton 20 Light Cotton/ Synthetic Mix 10 Heavy Cotton/ Synthetic Mix 24
All Synthetics 1
FH Fraction ai transferred to hands Carpets 0.06 Hard Surfaces 0.08
FM Fraction of hand mouthed per event (fraction/event) 0.13 SAH Typical surface area of one toddler hand (cm2) 150
N_Replen Replenishment intervals (intervals/hr) 4
ET Exposure Time (hours per day)
Children 1 < 2 years old
Carpets 4 Hard Surfaces 2
SE Saliva extraction factor (fraction) 0.48
Freq_HtM Hand-to-mouth events per hour (events/hour) Children 1 < 2 years old 20
BW Body Weight (kg) Children 1 < 2 years old 11.4
Surface Residue Concentration (SR) Surface residue concentration is the concentration of pesticide residue on the surface of an impregnated material. Product-specific information, such as weight fraction of a.i., should be used to estimate the residue concentration. This information may be found on labels or other information provided by the manufacturer. After obtaining this information, the surface residue concentration can be estimated using the methods described in Section 9.2.2. Fraction ai transferred to hands (FH) For this SOP, it is assumed that the residue that could be transferred to the object is the same as what is available for dermal transfer. As a result, the fraction of residue available for transfer assumed for dermal exposure for both carpets and hard surfaces should be used, which are provided in Section 7.2.2 of the Indoor Environments Section. Fraction of Hand Mouthed per Event (FM) See Section 2.4 of this SOP for discussion of the fraction of hand mouthed. The recommended point estimate for use in post-application incidental oral exposure assessments is 0.13. Hand Surface Area (SAH) The hand surface area for children 1 < 2 years old was based on values from the Exposure Factors Handbook 2011 Edition (U.S. EPA, 2011; Table 7-2). This value is 150 cm2 for one hand. Replenishment Intervals per Hour (N_Replen)
Impregnated Materials
U.S. EPA Office of Pesticide Programs – Standard Operating Procedures for Assessing Residential Pesticide Exposure 9-15
This SOP assumes an estimate of 4 replenishment intervals per hour (i.e., residues on the hand will be replenished every 15 minutes). This value was selected as a conservative assumption based on the use of 30 minutes in the SHEDS model to coincide with the CHAD diaries. Exposure Time (ET) Exposure time is the amount of time that a child is an environment where they may contact a surface containing an impregnated material. There is currently no data available to characterize the amount of time that children spend in environments where they may contact impregnated materials. In the absence of scenario-specific data, recommended exposure time values are based on Section 7.2.4 of the Indoor Environment SOPs. For children 1 < 2 years old on carpets and hard surfaces, the recommended ET point estimates for post-application incidental oral exposure assessments are 4 and 2 hours, respectively. Fraction of Pesticide Extracted by Saliva (SE) See Section 2.6 of this SOP for discussion of the fraction of pesticide extracted by saliva distribution. The recommended point estimate for use in post-application incidental oral exposure assessments is 0.48. Hand-to-mouth events (Freq_HtM) Frequency of hand-to-mouth events refers to the number of hand-to-mouth events per hour. There is currently no data available to characterize children’s hand-to-mouth behavior that is associated with impregnated materials. In the absence of scenario-specific data, recommended frequency of hand-to-mouth events is based on Section 7.2.4 of the Indoor Environment SOPs. The estimates for frequency of hand-to-mouth events in indoor environments from the Xue et al. (2007) meta-analysis were used as a surrogate. The recommended point estimate for use in post-application incidental oral exposure assessments is 20 events/hr. Future Research/Data Needs Future research priorities should include:
• Developing a database of studies which characterize pesticide transfer from impregnated materials to skin and objects that could mouthed by toddlers. An important focus should be on charactering the transfer of pesticide residue from impregnated materials following mouthing behavior by young children and toddlers. Collecting this transfer data are important because mouthing behavior and saliva extraction is believed to be the most important drivers of non-dietary ingestion from object-to-mouth exposure.
Exposure Characterization and Data Quality
• Due to insufficient exposure data on impregnated materials, the exposure assessment scenarios presented in this chapter are based on data on externally treated surfaces that may not be completely representative of impregnated materials. As a consequence, the methods rely on conservative assumptions that cannot be completely characterized quantitatively. These assumptions include: 1) laundering and dissipation are not accounted for in the algorithm, so it is assumed that individuals are always exposed to the maximum surface residue concentration; and 2) daily material-to-skin transfer efficiency

Impregnated Materials
U.S. EPA Office of Pesticide Programs – Standard Operating Procedures for Assessing Residential Pesticide Exposure 9-16
was characterized using data on residue transfer from treated surfaces, rather than impregnated materials.
9.2.6 Combining Post-application Scenarios Risks resulting from different exposure scenarios are combined when it is likely that they can occur simultaneously based on the use pattern and when the toxicological effects across different routes of exposure are the same. When combining scenarios, it is important to fully characterize the potential for co-occurrence as well as characterizing the risk inputs and estimates. Risks should be combined even if any one scenario or route of exposure exceeds the level of concern because this allows for better risk characterization for risk managers. For impregnated materials, there is potential for exposure from both dermal and non-dietary ingestion exposure assessment pathways. When assessing impregnated textiles, including impregnated clothing and other textiles, exposure assessments should only combine dermal and non-dietary object-to-mouth ingestion exposure pathways. Similarly, when assessing impregnated surfaces, including carpets and flooring, exposure assessments should only combine dermal and non-dietary hand-to-mouth ingestion exposure pathways.

Treated Paints & Preservatives
U.S. EPA Office of Pesticide Programs – Standard Operating Procedures for Assessing Residential Pesticide Exposure 10-1
Section 10 Treated Paints & Preservatives
This chapter provides the standard operating procedures (SOPs) for assessing pesticide exposures from pesticide-treated paints and wood preservatives. The sources of pesticide exposure that are addressed in this chapter include pesticide-treated paints and wood preservatives and materials containing pesticide-treated paints and preservatives. Exposure assessment scenarios that are addressed in this chapter include residential handler exposure during mixing and application activities, post-application dermal and non-dietary incidental ingestion exposure, and potential inhalation of volatile pesticide compounds.20 Before the development of an exposure assessment of a paint/preservative, the appropriate exposure scenarios should be identified using information on the product’s pesticide label. Specific label information that should be considered is described below.
• Paints/Preservatives with Pesticide Claims: Paints/preservatives may be treated with conventional pesticides and contain a pesticide label that makes claims, such as "kills mildew," "prevents wood rot," or "kills algae." These labels contain information on the active ingredient and should be used when performing exposure assessments using the methods described in this chapter.
• Paints/Preservatives without Pesticide Claims: Many paints/preservatives do not have a pesticide label on their container and their labels do not make claims about pest control. The pesticide in these paints/preservatives is present as a biocide, which is added during the manufacturing process. Biocides are more routinely assessed by OPP’s Antimicrobial Division (OPP/AD) and are not addressed in this chapter.
• Limiting and Descriptive Statements: Assume that a pesticide-containing
paint/preservative is used in residential settings and/or applied by homeowners, unless specific label language indicates otherwise. Examples include labels that specify paints/preservatives for commercial use only (e.g., warehouses, shipyards, etc.). Additionally, “Restricted Use Pesticide” classification indicates that the product cannot be bought or applied by homeowners (i.e., no residential handler exposure/risk assessment required), but it may be applied by commercial applicators to residential sites; therefore, a post-application risk assessment may be required.
10.1 Residential Handler Exposure Assessment This SOP provides the standard methods for assessing dermal and inhalation exposures that can result from mixing and applying treated paints and preservatives by residential handlers. There
20 In the past, exposure assessment procedures have been provided for ingestion of paint chips. There procedures are no longer provided, since it is believed that children would have to ingest an unreasonably high quantity of pesticide-containing paint chips to have an exposure that represents an unacceptable risk.

Treated Paints & Preservatives
U.S. EPA Office of Pesticide Programs – Standard Operating Procedures for Assessing Residential Pesticide Exposure 10-2
are currently limited exposure data on treated paint and preservative activities, so it is assumed that they are similar to other handler activities as described below:
• Aerosol spray cans handler activities are represented by pesticide aerosol data; • Paints brush handler activities are represented by paint brush data; • Roller painting handler activities are represented by paint roller data; • Painting/staining with a manually-pressurized sprayer handler activities are represented
by mixer/loader/applicator manually-pressurized sprayer data; and • Painting/staining with an airless sprayer handler activities are represented by
mixer/loader/applicator airless sprayer data. When assessing risks associated with dermal exposure, the methods described in the remainder of this section are recommended. Since this approach relies on surrogate data, it is recommended that it should only be used in the absence of, or as a supplement to adequate existing chemical-specific data.
Dermal and Inhalation Handler Exposure Algorithm Residue concentration is most commonly reported as percent a.i. in terms of total paint/preservative mass (e.g. Weight fraction of a.i. in treated paint/preservative). In these cases, residue concentration can be estimated and subsequently used to determine the potential daily dose rate, as shown below. 1*** CFWFVAR ρ= (10.1) where:
AR = Mass of active ingredient applied per paint can (lbs a.i./can); V = Volume of paint contained in each can (mL/can); ρ = Paint density (g/mL); WF = Weight fraction of a.i. in treated paint/preservative (% a.i. w/w); and CF1 = Gram-to-pound conversion factor (2.2*10-3 lbs/g).
NARUEE **= (10.2) where:
E = Daily exposure rate (mg/day); UE = unit exposure (mg/lb a.i. applied); AR = Mass of active ingredient applied per paint can (lbs a.i./can); and N = number of cans paint used per exposure day (cans/day).
After calculating exposure, absorbed dose, normalized to body weight, is calculated as:
BW
AFED *= (10.3)
where:
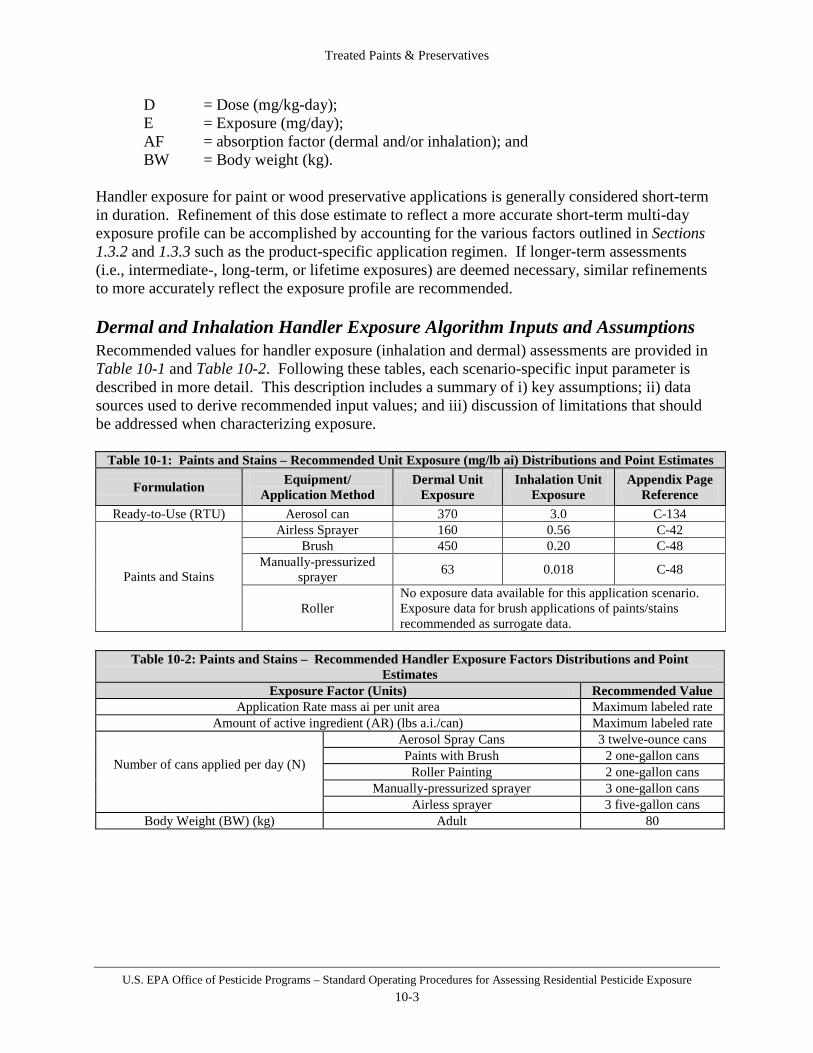
Treated Paints & Preservatives
U.S. EPA Office of Pesticide Programs – Standard Operating Procedures for Assessing Residential Pesticide Exposure 10-3
D = Dose (mg/kg-day); E = Exposure (mg/day); AF = absorption factor (dermal and/or inhalation); and BW = Body weight (kg).
Handler exposure for paint or wood preservative applications is generally considered short-term in duration. Refinement of this dose estimate to reflect a more accurate short-term multi-day exposure profile can be accomplished by accounting for the various factors outlined in Sections 1.3.2 and 1.3.3 such as the product-specific application regimen. If longer-term assessments (i.e., intermediate-, long-term, or lifetime exposures) are deemed necessary, similar refinements to more accurately reflect the exposure profile are recommended. Dermal and Inhalation Handler Exposure Algorithm Inputs and Assumptions Recommended values for handler exposure (inhalation and dermal) assessments are provided in Table 10-1 and Table 10-2. Following these tables, each scenario-specific input parameter is described in more detail. This description includes a summary of i) key assumptions; ii) data sources used to derive recommended input values; and iii) discussion of limitations that should be addressed when characterizing exposure.
Table 10-1: Paints and Stains – Recommended Unit Exposure (mg/lb ai) Distributions and Point Estimates
Formulation Equipment/ Application Method
Dermal Unit Exposure
Inhalation Unit Exposure
Appendix Page Reference
Ready-to-Use (RTU) Aerosol can 370 3.0 C-134
Paints and Stains
Airless Sprayer 160 0.56 C-42 Brush 450 0.20 C-48
Manually-pressurized sprayer 63 0.018 C-48
Roller No exposure data available for this application scenario. Exposure data for brush applications of paints/stains recommended as surrogate data.
Table 10-2: Paints and Stains – Recommended Handler Exposure Factors Distributions and Point
Estimates Exposure Factor (Units) Recommended Value
Application Rate mass ai per unit area Maximum labeled rate Amount of active ingredient (AR) (lbs a.i./can) Maximum labeled rate
Number of cans applied per day (N)
Aerosol Spray Cans 3 twelve-ounce cans Paints with Brush 2 one-gallon cans
Roller Painting 2 one-gallon cans Manually-pressurized sprayer 3 one-gallon cans
Airless sprayer 3 five-gallon cans Body Weight (BW) (kg) Adult 80

Treated Paints & Preservatives
U.S. EPA Office of Pesticide Programs – Standard Operating Procedures for Assessing Residential Pesticide Exposure 10-4
Unit Exposure (UE) Unit exposure values for paints/preservatives are summarized in Appendix B. As indicated, there are some exposure data on painting with a brush or roller, but limited exposure data on paint/preservative exposure scenarios involving aerosols, manually-pressurized sprayers, and airless sprayers. In these cases, data for conventional pesticide application activities are assumed to be reasonable surrogates of exposure. Amount of Active Ingredient (AR) The amount of a.i. applied per paint/preservative container should be determined using label information on the maximum concentration of a.i. that is mixed with a paint/preservative. In some cases, this information may not be directly reported on the label. When this information is not directly available, however, data on the volume of paint per container, specific gravity of paint/preservative solution, and weight fraction of a.i. in paint/preservative can be used to estimate the amount of active ingredient applied per container Number of Paint Cans (N) The number of paint cans is the amount of paint that is handled during a residential application. The recommended input values for each handler exposure scenario are based on data presented in U.S. EPA’s Exposure Factors Handbook (2011) and summarized in Table 10-3.
Table 10-3: Recommended number of gallon input values for paint and wood preservative exposure scenarios.
Exposure Scenario Paint Cans Number Justification
Aerosol Spray Cans 3 twelve-ounce cans
Upper-percentile assumption for the amount handled is 3 cans (12 ounces each) used per event ( the 90th percentile amount of spray paint used per event is 36.11 oz/use (U.S. EPA Exposure Factors Handbook ,2011, Table 17-18).
Paints with Brush 2 one-gallon cans
90th percentile value of 8 gallons of latex paint used per year divided by the mean frequency of 4 painting events per year (U.S. EPA Exposure Factors Handbook, 2011, Table 17-6).
Roller Painting 2 one-gallon cans
90th percentile value of 8 gallons of latex paint used per year divided by the mean frequency of 4 painting events per year (U.S. EPA’s Exposure Factors Handbook, 2011, Table 17-6).
Manually-pressurized sprayer painting/staining 3 one-gallon cans
Professional judgment assuming that more products would be used with a manually-pressurized sprayer than with a roller or brush, but less than that used with a high pressure sprayer.
Airless sprayer painting/staining 3 five-gallon cans
A homeowner is assumed to use three 5-gallon cans of ready-to-use product or of finished spray prepared from a concentrated product and water. This is based on a coverage rate of 200 ft2/gallon and a house size with a surface area of 2,800 ft2.
Future Research/Data Needs Iinformation that could refine the handler exposure assessment methods include:
• General use information on treated paints;

Treated Paints & Preservatives
U.S. EPA Office of Pesticide Programs – Standard Operating Procedures for Assessing Residential Pesticide Exposure 10-5
• Frequency of treated paint/preservative applications; • Location of treated paint/preservatives in residential environments; and • Typical surface of area of treated areas.
Exposure Characterization and Data Quality
Unit Exposures • The exposure data underlying unit exposures are considered reasonable for the purposes
of establishing distributions and estimating exposure. The data are from actual applications using standardized exposure sampling methodologies and laboratory analyses.
• The underlying assumption of the use of exposure data as unit exposures – proportionality between the amount of active ingredient handled and exposure – is uncertain, though potentially conservative. However, as a prediction mechanism, it is considered practical and useful for the purposes of handler exposure assessment in a regulatory context. It provides a straightforward handler exposure calculation method and enables risk mitigation in the form of formulation comparison and decreased application rates.
• The extent to which an individual’s exposure (expressed via unit exposures) varies day-to-day or application-to-application is unknown; therefore, the assumption that there is no variation when assessing longer-term exposure durations is considered conservative.
Amount of active ingredient handled • Information on the amount of product/formulation (thus, active ingredient) handled per
application is largely unavailable. The approach used is believed to provide conservative estimates of exposure because the amount of paint/preservative handled is based on information on the use of non-treated painted that is more commonly used. The recommended point estimates are, therefore, intended to be conservative to ensure an appropriately health protective exposure estimate.
• The extent to which the amount an individual will handle per application varies from day-to-day or application-to-application is unknown; therefore, the assumption that there is no variation when assessing longer-term exposure durations is considered conservative.
10.2 Post-Application Exposure Assessment Post-application exposure can result from contacting surfaces that have been painted with treated paint or wood preservative. Potential exposed populations include both adults and children. While exposure may occur for people of all ages, adults and children 1 < 2 years old are considered index lifestages based on behavioral characteristics and the strengths and limitations of available data. This section addresses standard methods for estimating exposure and dose for three individual post-application scenarios resulting from exposure to pesticide-containing paints, stains, or wood preservatives:
• Section 10.2.1 - adult/children 1 < 2 years old dermal exposures;

Treated Paints & Preservatives
U.S. EPA Office of Pesticide Programs – Standard Operating Procedures for Assessing Residential Pesticide Exposure 10-6
• Section 10.2.2 – children 1 < 2 years old non-dietary ingestion via hand-to-mouth activity; and
• Section 10.2.3 - adult/children 1 < 2 years old inhalation exposures.
10.2.1 Post-Application Dermal Exposure Assessment This SOP provides the standard methods for assessing dermal exposure scenarios following the application of pesticide-treated paint or wood preservatives on indoor and outdoor surfaces, such as home walls, outdoor decks, and play-sets. The exposure assessment methods presented in this section are based primarily on the approach developed for an exposure assessment of children who contact chromated copper arsenate treated playsets using the EPA/ORD Stochastic Human Exposure and Dose Simulation Model for the Wood Preservative Scenario (SHEDS-WOOD) (U.S. EPA, 2005). Post-Application Dermal Exposure Algorithm The algorithm to calculate post-application dermal exposure is calculated as follows: PFTEFBWSASRE Body ***/*= (10.4) where:
E = Daily exposure rate (mg/kg-day); SR = Surface residue concentration (mg/cm2); SA/BW = total body surface area to body weight ratio (cm2/kg); FBody = Fraction of total body skin surface area that is unclothed (unitless); and TE = Daily material-to-skin transfer efficiency (fraction/day).
Absorbed dermal dose, normalized to body weight, is then calculated as: AFED *= (10.5) where:
D = Dose rate (mg/kg-day); E = Daily Exposure (mg/kg-day); and AF = Dermal absorption factor.
Post-application dermal exposure from paints or wood preservatives containing pesticides is generally considered short-term in duration. Refinement of this dose estimate to reflect a more accurate short-term multi-day exposure profile can be accomplished by accounting for the various factors outlined in Sections 1.3.2 and 1.3.4, such as residue dissipation, product-specific re-treatment intervals, and activity patterns. If longer-term assessments (i.e., intermediate-, long-term, or lifetime exposures) are deemed necessary, such as in cases where the impregnated material may be routinely replaced or re-treated, similar refinements to more accurately reflect the exposure profile are recommended.

Treated Paints & Preservatives
U.S. EPA Office of Pesticide Programs – Standard Operating Procedures for Assessing Residential Pesticide Exposure 10-7
Post-Application Dermal Exposure Assessment Assumptions and Recommendations A summary table of the recommended values for post-application dermal exposure assessment of paints/preservatives is provided in Table 10-4. Following this summary table, each scenario-specific input parameter, excluding the universal body surface area and bodyweight inputs, is described in more detail. This description includes a summary of i) key assumptions; ii) data sources used to derive recommended input values; and iii) discussion of limitations that should be addressed when characterizing exposure.
Surface Residue Concentration (SR) Surface residue concentration is the concentration of pesticide residue on the surface of a painted/treated surface. Whenever possible, product-specific information should be used to estimate the surface residue concentration. This information may be found on labels or other information provided by the manufacturer. Material-to-Skin Transfer Efficiency (TE) Surface-to-skin transfer efficiency is the fraction of pesticide residue that is transferred from a painted/treated surface to the skin. Whenever possible, product -specific information should be used to estimate the surface-to-skin transfer efficiency. In the absence of product-specific information, the recommended transfer efficiency is based on warm weather data on the transfer of arsenic from chromated copper arsenate treated wood (American Chemistry Council, 2003). This data was incorporated into the SHEDS-CCA assessment and used to obtain a lognormal distribution with a geometric mean and geometric standard deviation of 0.143 and 2.33, respectively. Fraction of Total Body Exposed (Fbody) This term refers to the fraction of the body that is unclothed. The recommended default value for this input was derived using information presented previously in Table 6-7. Specifically, the recommended input value of 0.31 represents the fraction of surface area of the torso and arms, lower thighs, shins, feet, hands, and neck. This value is believed to be representative of the fraction of the body that may be exposed in warm weather. Future Research/Data Needs Specific information that could help refine the exposure assessment methods include:
Table 10-4: Summary of recommended values for post-application dermal absorption. Algorithm Notation Exposure Factor (Units) Recommended Input
Values SR Surface Residue Concentration (mg a.i. /cm2) Maximum Labeled Rate WF Percent A.I. by Weight (% w/w) Label
Fbody Fraction of body that contacts residue 0.31
TE Material-to-skin transfer efficiency (fraction/day) 0.14
SA/BW total body surface area to body weight ratio (cm2/kg)
Adult 280 Children 1 < 2 years old 640

Treated Paints & Preservatives
U.S. EPA Office of Pesticide Programs – Standard Operating Procedures for Assessing Residential Pesticide Exposure 10-8
• Additional research/ data on the transfer of non-preservative pesticide additives, as available data are limited to transfer of arsenic from chromated copper arsenate.
• Information on how treated paints/preservatives are used by residential home owners could help improve the exposure assessment methods.
• General use information on treated paints; • Frequency of treated paint/preservative applications; • Location of treated paint/preservatives in residential environments; and • Typical surface of area of treated areas.
Exposure Characterization and Data Quality
• Many of the methods presented in this section are based on the approach used to assess chromated copper arsenate treated playsets. Therefore, an important limitation of the exposure assessment methods presented is that they are based on a single chemical that is used a wood preservative, rather than conventional pesticide (e.g. insecticide, herbicide, fungicide, etc.).
10.2.2 Post-Application Non-Dietary Ingestion Exposure Assessment: Hand-to-Mouth
This SOP provides the dose estimation methods for assessing incidental ingestion from hand-to-mouth behavior following contact with treated paint/preservative surfaces. Non-Dietary Hand-to-Mouth Ingestion Exposure Algorithm Exposure from hand-to-mouth activity is calculated as follows (based on algorithm utilized in SHEDS-Multimedia): (10.6)
where:
E = exposure (mg/day); HR = hand residue loading (mg/cm2); FM = fraction hand surface area mouthed / event (fraction/event); SAH = surface area of one hand (cm2); ET = exposure time (hr/day); N_Replen = number of replenishment intervals per hour (intervals/hour); SE = saliva extraction factor (ie, mouthing removal efficiency); and Freq_HtM = number of hand-to-mouth contacts events per hour (events/hour).
In this algorithm, hand residue concentration is calculated as: TE*SRHR = (10.7) where:
( ) ( ) ( )
−−∗∗∗∗∗= ReplenN
HtMFreq
HM SEReplenNETSAFHRE __
11_
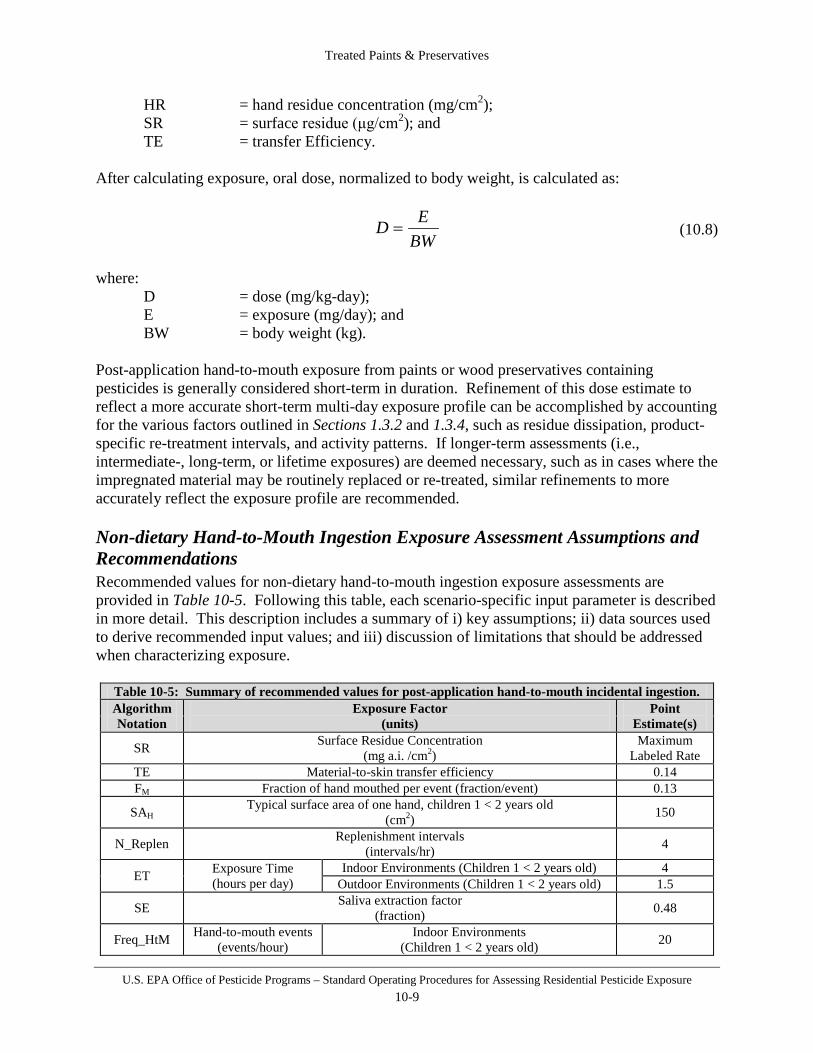
Treated Paints & Preservatives
U.S. EPA Office of Pesticide Programs – Standard Operating Procedures for Assessing Residential Pesticide Exposure 10-9
HR = hand residue concentration (mg/cm2); SR = surface residue (μg/cm2); and TE = transfer Efficiency.
After calculating exposure, oral dose, normalized to body weight, is calculated as:
BWED = (10.8)
where:
D = dose (mg/kg-day); E = exposure (mg/day); and BW = body weight (kg).
Post-application hand-to-mouth exposure from paints or wood preservatives containing pesticides is generally considered short-term in duration. Refinement of this dose estimate to reflect a more accurate short-term multi-day exposure profile can be accomplished by accounting for the various factors outlined in Sections 1.3.2 and 1.3.4, such as residue dissipation, product-specific re-treatment intervals, and activity patterns. If longer-term assessments (i.e., intermediate-, long-term, or lifetime exposures) are deemed necessary, such as in cases where the impregnated material may be routinely replaced or re-treated, similar refinements to more accurately reflect the exposure profile are recommended. Non-dietary Hand-to-Mouth Ingestion Exposure Assessment Assumptions and Recommendations Recommended values for non-dietary hand-to-mouth ingestion exposure assessments are provided in Table 10-5. Following this table, each scenario-specific input parameter is described in more detail. This description includes a summary of i) key assumptions; ii) data sources used to derive recommended input values; and iii) discussion of limitations that should be addressed when characterizing exposure.
Table 10-5: Summary of recommended values for post-application hand-to-mouth incidental ingestion. Algorithm Notation
Exposure Factor (units)
Point Estimate(s)
SR Surface Residue Concentration (mg a.i. /cm2)
Maximum Labeled Rate
TE Material-to-skin transfer efficiency 0.14 FM Fraction of hand mouthed per event (fraction/event) 0.13
SAH Typical surface area of one hand, children 1 < 2 years old (cm2) 150
N_Replen Replenishment intervals (intervals/hr) 4
ET Exposure Time (hours per day)
Indoor Environments (Children 1 < 2 years old) 4 Outdoor Environments (Children 1 < 2 years old) 1.5
SE Saliva extraction factor (fraction) 0.48
Freq_HtM Hand-to-mouth events (events/hour)
Indoor Environments (Children 1 < 2 years old) 20

Treated Paints & Preservatives
U.S. EPA Office of Pesticide Programs – Standard Operating Procedures for Assessing Residential Pesticide Exposure 10-10
Table 10-5: Summary of recommended values for post-application hand-to-mouth incidental ingestion. Outdoor Environments
(Children 1 < 2 years old) 13.9
BW Body Weight (kg) Children 1 < 2 years old 11.4
Surface Residue Concentration (SR) Surface residue concentration is the concentration of pesticide residue on the surface of an impregnated material. Product-specific information, such as weight fraction of a.i., should be used to estimate the residue concentration. This information may be found on labels or other information provided by the manufacturer. After obtaining this information, the surface residue concentration can be estimated using the methods described in Section 9.2.2. Material-to-Skin Transfer Efficiency (TE) Surface-to-skin transfer efficiency is the fraction of pesticide residue that is transferred from a painted/treated surface to the skin. Whenever possible, product -specific information should be used to estimate the surface-to-skin transfer efficiency. In the absence of product-specific information, the recommended transfer efficiency is based on warm weather data on the transfer of arsenic from chromated copper arsenate treated wood (American Chemistry Council, 2003). This data was incorporated into the SHEDS-CCA assessment and used to obtain a lognormal distribution with a geometric mean and geometric standard deviation of 0.143 and 2.33, respectively. Fraction of Hand Mouthed per Event (FM) See Section 2.4 of this SOP for discussion of the fraction of hand mouthed. The recommended point estimate for use in post-application incidental oral exposure assessments is 0.13. Hand Surface Area (SAH) The hand surface area for children 1 < 2 years old of 150 cm2, for one hand, was based on values from the Exposure Factors Handbook 2011 Edition (U.S. EPA, 2011). Replenishment Intervals (N_Replen) This SOP assumes an estimate of 4 replenishment intervals per hour (i.e., residues on the hand will be replenished every 15 minutes). This value was selected as a conservative assumption based on the use of 30 minutes in the SHEDS model to coincide with the CHAD diaries. Exposure Time (ET) Exposure time is the amount of time that a child is an environment where they may contact a surface containing an impregnated material. There is currently no data available to characterize the amount of time that children spend in environments where they may contact surfaces with treated paints and preservatives. In the absence of scenario-specific data, recommended exposure time value for exposures that may occur in indoor environments is based on the children 1 < 2 years old exposure time values discussed in Section 7.2.4 of the Indoor Environment SOPs. Similarly, the recommended exposure time for outdoor environments is

Treated Paints & Preservatives
U.S. EPA Office of Pesticide Programs – Standard Operating Procedures for Assessing Residential Pesticide Exposure 10-11
based on the children 1 < 2 years old exposure time values discussed in Section 3.2.2 of the Lawns/Turf SOPs. Fraction of Pesticide Extracted by Saliva (SE) See Section 2.6 of this SOP for discussion of the fraction of pesticide extracted by saliva distribution. The recommended point estimate for use in post-application incidental oral exposure assessments is 0.48. Hand-to-mouth events per hour (Freq_HtM) Frequency of hand-to-mouth events refers to the number of hand-to-mouth events per hour. There is currently no data available that specifically address the number of hand-to-mouth events that occur relative to the amount of time a child is in contact surfaces containing treated paints/preservatives. In the absence of scenario-specific data, the frequency of hand-to-mouth events in indoor environments is based on Section 7.2.4 of the Indoor Environment SOPs, which provides a summary of data from a meta-analysis performed by Xue et al. (2007). Similarly, the frequency of hand-to-mouth events in outdoor environments is based on Section 3.2.3 of the Lawns/Turf SOPs, which provides a summary of the outdoor hand-to-mouth data from the same Xue et al. (2007) meta-analysis. Future Research/Data Needs Specific information that could help refine the exposure assessment methods include:
• Additional research/ data on the transfer of non-preservative pesticide additives, as available data are limited to transfer of arsenic from chromated copper arsenate.
• Information on how treated paints/preservatives are used by residential home owners could help improve the exposure assessment methods.
• General use information on treated paints; • Frequency of treated paint/preservative applications; • Location of treated paint/preservatives in residential environments; and • Typical surface of area of treated areas.
Exposure Characterization and Data Quality
• Many of the methods presented in this section are based on the approach used to assess chromated copper arsenate treated playsets. Therefore, an important limitation of the exposure assessment methods presented is that they are based on a single chemical that is used a wood preservative, rather than conventional pesticide (e.g. insecticide, herbicide, fungicide, etc.).
Treated Paints & Preservatives
U.S. EPA Office of Pesticide Programs – Standard Operating Procedures for Assessing Residential Pesticide Exposure 10-12
10.2.3 Post-Application Inhalation Exposure Assessment In many cases, inhalation exposure from impregnated paints is expected to be negligible, since many non-preservative pesticides have low vapor pressures and would be designed to be incorporated into the treated surface. When treated paints/wood preservatives contain more volatile pesticide chemicals, however, it may be necessary to assess post-application inhalation exposures. The recommended methodology is described in the remainder of this section. Wall Paint Exposure Model EPA’s Wall Paint Exposure Model (WPEM) version 3.2 is used estimate post-application air concentrations resulting from the use of paint preserved with volatile chemicals (2001). WPEM was developed under a contract by Geomet Technologies for EPA OPPT to provide estimates of potential air concentrations and consumer/worker exposures to chemicals emitted from wall paint which is applied using a roller or a brush. WPEM uses mathematical models developed from small chamber data to estimate the emissions of chemicals from oil-based (alkyd) and latex wall paint. The emission data can then be combined with detailed use, workload and occupancy data (e.g., amount of time spent in the painted room, etc,) to estimate exposure. Specific input parameters include: the type of paint (latex or alkyd) being assessed, density of the paint (default values available), and the chemical weight fraction, molecular weight, and vapor pressure. Detailed information and the executable model can be downloaded from http://www.epa.gov/opptintr/exposure/pubs/wpem.htm.
It should be noted that WPEM’s emission models are based on a limited set of chemicals and an associated range of molecular weights and vapor pressures. The models may not be valid for chemicals outside of these ranges. The valid vapor pressure ranges are 0.4 to 18.7 torr (or mmHg) for chemicals in alkyd paint and 0.002 to 0.2 torr (or mmHg) for chemicals in latex paint. For volatile chemicals, use WPEM and chemical specific data (i.e., vapor pressure and molecular weight) to determine air concentrations. For the do-it-yourself residential painter, use the default WPEM scenario “RESDIY” to estimate chemical specific air concentrations. This WPEM default scenario assumes that a do-it-yourself painter is exposed to a chemical in paint while applying one coat paint to the bedroom of a house. For a detailed description of the default RESDIY scenario, see the WPEM User’s Guide.
The model provides several dose measures (i.e., LADD, ADD), air concentration measures (i.e., peak, 15-min, 8hr), and a comma-separated (.csv) file as outputs. The comma-separated file contains details on time-varying concentrations within the modeled building (i.e., conc in zone 1, conc in zone 2) as well as concentrations to which the individual is exposed (i.e., Conc@person). This file can be read directly into spreadsheet software (e.g., Excel) for calculating additional summary statistics. The output data in comma-separated file should be used to estimate air concentrations over time durations that are in comparable time-durations to the toxicity endpoints. For the adult DIY painter, a 4-hr average air concentration (i.e., the time it takes to paint the bedroom) should be used in the following equation used for calculating the absorbed inhalation dose:
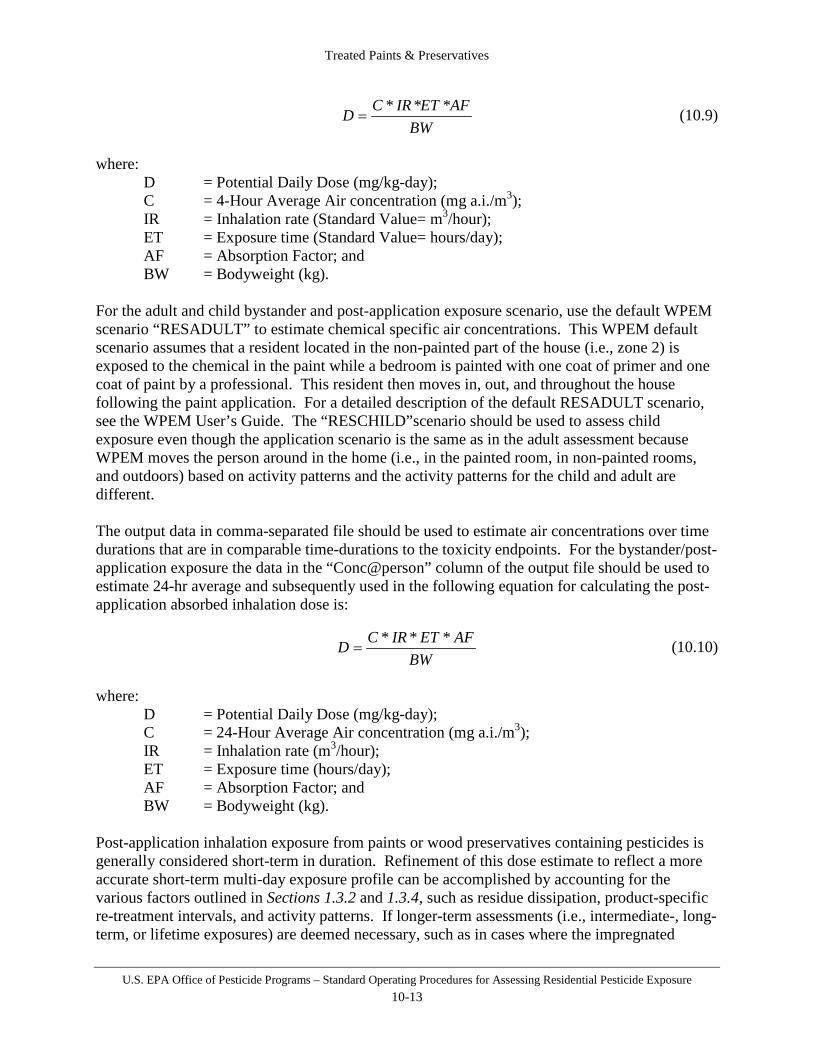
Treated Paints & Preservatives
U.S. EPA Office of Pesticide Programs – Standard Operating Procedures for Assessing Residential Pesticide Exposure 10-13
BW
AFETIRCD ***= (10.9)
where:
D = Potential Daily Dose (mg/kg-day); C = 4-Hour Average Air concentration (mg a.i./m3); IR = Inhalation rate (Standard Value= m3/hour); ET = Exposure time (Standard Value= hours/day); AF = Absorption Factor; and BW = Bodyweight (kg).
For the adult and child bystander and post-application exposure scenario, use the default WPEM scenario “RESADULT” to estimate chemical specific air concentrations. This WPEM default scenario assumes that a resident located in the non-painted part of the house (i.e., zone 2) is exposed to the chemical in the paint while a bedroom is painted with one coat of primer and one coat of paint by a professional. This resident then moves in, out, and throughout the house following the paint application. For a detailed description of the default RESADULT scenario, see the WPEM User’s Guide. The “RESCHILD”scenario should be used to assess child exposure even though the application scenario is the same as in the adult assessment because WPEM moves the person around in the home (i.e., in the painted room, in non-painted rooms, and outdoors) based on activity patterns and the activity patterns for the child and adult are different. The output data in comma-separated file should be used to estimate air concentrations over time durations that are in comparable time-durations to the toxicity endpoints. For the bystander/post-application exposure the data in the “Conc@person” column of the output file should be used to estimate 24-hr average and subsequently used in the following equation for calculating the post-application absorbed inhalation dose is:
BW
AFETIRCD ***= (10.10)
where:
D = Potential Daily Dose (mg/kg-day); C = 24-Hour Average Air concentration (mg a.i./m3); IR = Inhalation rate (m3/hour); ET = Exposure time (hours/day); AF = Absorption Factor; and BW = Bodyweight (kg).
Post-application inhalation exposure from paints or wood preservatives containing pesticides is generally considered short-term in duration. Refinement of this dose estimate to reflect a more accurate short-term multi-day exposure profile can be accomplished by accounting for the various factors outlined in Sections 1.3.2 and 1.3.4, such as residue dissipation, product-specific re-treatment intervals, and activity patterns. If longer-term assessments (i.e., intermediate-, long-term, or lifetime exposures) are deemed necessary, such as in cases where the impregnated

Treated Paints & Preservatives
U.S. EPA Office of Pesticide Programs – Standard Operating Procedures for Assessing Residential Pesticide Exposure 10-14
material may be routinely replaced or re-treated, similar refinements to more accurately reflect the exposure profile are recommended.

References
U.S. EPA Office of Pesticide Programs – Standard Operating Procedures for Assessing Residential Pesticide Exposure 11-1
Section 11 References
American Chemistry Council (ACC). (2003). CCA fixation and its implications on availability of hexavalent chromium (CrVI) for dislodgeability and leaching. Prepared by Paul A. Cooper, University of Toronto. Submitted for publication. Bach, T. (2002). Stroking Test in Dogs after Topical Application of Imidacloprid 10% (w/v) + Permethrin 50% (w/v) Spot-On. Lab Project Number: V 02-004. Unpublished study prepared by Bayer AG. EPA MRID 46594103 Baugher, D.; Klonne, D.; Mihlan, G.; et. al. (2004) The ORETF Algorithm for Defining the Relationship of Transferable Turf Residues to Post-Application Dermal Exposure. Project Number: ORF030, ML02/1003/ORE. Unpublished study prepared by EXP Corp., Toxicology & Exposure Assessment and Bayer Crop Science LP. 835 p. (MRID 46190501). Beamer, P; Canales, RA; Leckie, JO. (2009). Developing probability distributions for transfer efficiencies for dermal exposure. Journal of Exposure Science and Environmental Epidemiology. 19: 274-283. Bidlingmayer, W.L., J.F. Day and D.G. Evans. (1995). Effect of Wind Velocity on Suction Trap Catches of Some Florida Mosquitoes. Journal of the American Mosquito Control Association 11(3): 295-301. Brickel, P. (1997). Dislodgeable Residues of Fipronil Following Topical Application of Frontline® Spot-on Treatment to Dogs. Lab Project Number: MET416. Unpublished study prepared by Merial Limited. EPA MRID 44531203. Brinkman S., Gialamas A., Jones L., Edwards P., and Maynard E. (1999). Child Activity Patterns for Environmental Exposure Assessment in the Home, National Environmental Health Forum Monographs Exposure Series No. 1 Department of Human Services, Adelaide. Bureau of Labor Statistics American Time Use Survey. 2007. (http://www.bls.gov/tus/datafiles_2007.htm). Byrne SL, Shurdut BA, Saunders DG. (1998). Potential Chlorpyrifos Exposure to Residents Following Standard Crack-and-Crevice Treatment. Environmental Health Perspectives 106:725–731. Camann, D. E., Majumadar, T. K., and Geno, P. (1989). Determination of Pesticide Removal Efficiency from Human hands Wiped with Gauze Moistened with Three Salivary Fluids. Final Report to EPA by ManTech under Contract 68-D5-0049.

References
U.S. EPA Office of Pesticide Programs – Standard Operating Procedures for Assessing Residential Pesticide Exposure 11-2
Camann, D.; Harding, H.; Geno, P.; and Agrawl S. (1996). Comparison of Methods to Determine Dislodgeable Residue Transfer from Floors (EPA/600/R96/089) United States Environmental Protection Agency, Research Triangle Park, NC. Carroll, S. P. (2007a). Test of an Oil of Lemon Eucalyptus-based Personal Insect Repellent. Laboratory Project ID WPC-001. Unpublished study; Performing Laboratory: Carroll-Loye Biological Research, Davis, CA 95616; 225 pp. EPA MRID 47217601. Carroll, S. P. (2007b). Test of Coulston's Duranon Personal Insect Repellent. Laboratory Project ID SCI-001-5. Unpublished study; Performing Laboratory: Carroll-Loye Biological Research, Davis, CA 95616; 180 pp. EPA MRID 47322401. Carroll, S. P. (2007c). Test of Dermaegis Lipodeet 302 Personal Insect Repellent. Laboratory Project ID SCI-001-4. Unpublished study; Performing Laboratory: Carroll-Loye Biological Research, Davis, CA 95616; 180 pp. EPA MRID 47322501. Carroll, S. (2007d). Test of Personal Insect Repellents (Revised). Project Number: EMD/003.3 (Aerosol), EMD/003. Unpublished study prepared by Carroll-Loye Biological Research. 143 p.. EPA MRID 47049501. Carroll, S. (2007e). Test of Personal Insect Repellents (Revised). Project Number: EMD 004.3 (Aerosol), EMD/004. Unpublished study prepared by Carroll-Loye Biological Research. 147 p. EPA MRID 47049502. Carroll, S. P. (2008a). Efficacy Test of Picaridin-based Personal Repellents with Mosquitoes under Filed Conditions. Laboratory Project ID SPC-001. Unpublished study; Performing Laboratory: Carroll-Loye Biological Research, Davis, CA 95616; 336 pp. EPA MRID 47535201. Carroll, S. P. (2008b). Efficacy Test of Picaridin-based Personal Tick Repellents. Laboratory Project ID SPC-002. Unpublished study; Performing Laboratory: Carroll-Loye Biological Research, Davis, CA 95616; 295 pp. MRID 47535202. Center for Golf Course Management. (1992). Golf Course Operations: Cost of Doing Business/Profitability. Library of Congress GV975.G56. Chinn, K.S.K. (1981) A Simple Method for Predicting Chemical Agent Evaporation. September 1981. Dugway, UT: U.S. Army Proving Ground. DPG Document No. DPG-TR-401. Cilek, J.E., C.F. Hallmon, and R. Johnson. (2008). Evaluation of Automatic Spray Systems for the Control of Backyard Mosquitoes. Journal of the American Mosquito Control Association 24(4): 560-565. Clothier, J. (2000). Dermal Transfer Efficiency of Pesticides from New Vinyl Sheet Flooring to Dry and Wetted Palms. (EPA/600/R00/029). United States Environmental Protection Agency, Research Triangle Park, NC.

References
U.S. EPA Office of Pesticide Programs – Standard Operating Procedures for Assessing Residential Pesticide Exposure 11-3
Consumer Specialty Products Association (CSPA). (2005). Pyrethrin Steering Committee/Joint Venture and Piperonyl Butoxide Task Force II. Discussion Paper: Intermittent Aerosols, Residential Mosquito Misters, and Dairy Barn Misters. Cowell, J. and Johnson, D. (1999). Evaluation of Transferable Turf Residue Techniques: Evaluation Study of Transferable Residue Techniques (OMD001) and Transferable Residue Technique Modification Study: An Evaluation of Three Turf Sampling Techniques (OMD002). October 7, 1999. Outdoor Residential Exposure Task Force. EPA MRID 44972203. Eastern Research Group. (1998). Multi-Chamber Concentration and Exposure Model Peer Review Summary. EPA Contract No. 68-W6-0022. Eastin, I.; Ganguly, I.; Shook, S.; Brackley, A. (2005). Material use in the US deck market: an assessment of the market potential for Alaska yellow cedar. Working Paper 98. Seattle, WA: Center for International Trade in Forest Products (CINTRAFOR), University of Washington, College of Forest Resource: 87 p. Evans, J. (2005). Tributyltin maleate (TBTM): Non-Dietary Residential Exposure Considerations for Proposed Registration of Ultra-Fresh® DM-50 as a New Indoor Use Pattern for TBTM. DP Barcode 314711. Sent from Jeff Evans to Meta Bonner. March 30, 2005. Evans, WC. (1994). Development of Continuous-application Source Terms and Analytical Solution for One- and Two-Compartment System. In: Tichenor, B.A. (Ed.), Characterizing sources of Indoor Air Pollution and Related Sink Effects, ASTM STP 1287. American Society of Testing and Materials, Philadelphia, 279-293. Fan, C., Zhang J. (2001). Characterization of Emissions from Portable Household Combustion Devices: Particle Size Distributions, Emission Rates and Factors, and Potential Exposures. Atmospheric Environment 35: 1281-1290. Faulde MK, Uedelhoven WM, and Robbins RG (2003). Contact Toxicity and Residual Activity of Different Permethrin-Based Fabric Impregnation Methods for Aedes aegypti (Diptera: Culicidae), Ixodes ricinus (Acari: Ixodidae), and Lepisma saccharina (Thysanura: Lepismatidae). Journal of Medical Entomology, 40(6): 935-941. Federal Register Notice. (1973) 38 FR 21685, 1973 Fenske, R.A.; Black, K.G.; Elkner, K.P.; Lee, C.; Methner, M.N.; Soto, R. (1990). Potential Exposure and Health Risks of Infants Following Indoor Residential Pesticide Applications. Amer. Jour. Publ. Health. 80:689-693. Fortune, C. (1997). Round-Robin Testing of Methods for Collecting Dislodgeable Residues from Carpets. (EPA/600/R97/107). United States Environmental Protection Agency, Research Triangle Park, NC.

References
U.S. EPA Office of Pesticide Programs – Standard Operating Procedures for Assessing Residential Pesticide Exposure 11-4
Fradin, M.S, and Day, J.F. (2002). Comparative Efficacy of Insect Repellents Against Mosquito Bites. N Engl J Med, Vol. 347, No. 1. Freeman, N. C., M. Jimenez, K. J. Reed, S. Gurunathan, R. D. Edwards, A. Roy, J. L. Adgate, E. D. Pellizzari, J. Quackenboss, K. Sexton, and P. J. Lioy. (2001). Quantitative Analysis of Children’s Microactivity Patterns: The Minnesota Children’s Pesticide Exposure Study. Journal of Exposure Analysis and Environmental Epidemiology, (2001) 11, 501 – 509. Guo, Z. (2002) Review of indoor emission source models - part 2. Parameter estimation. Environmental Pollution. 120: 551-564. Gurunathan, S; Robson, M; Freeman, N; Buckley, B; Roy, A; Meyer, R; Bukowski, J; and Lioy, P. (1998). Accumulation of Chlorpyrifos on Residential Surfaces and Toys Accessible to Children. Environmental Health Perspectives. 106:9-16. Horse Stable Ventilation Publication. (2003) College of Agricultural Sciences, Agricultural Research and Cooperative Extension, Pennsylvania State University, 2003. Available online at: http://pubs.cas.psu.edu/freepubs/pdfs/ub039.pdf Horse Stable Ventilation. Eileen Fabian Wheeler. Agricultural and Biological Engineering. The Pennsylvania State University. Available online at: http://web.nfba.org/html/files/programs/Wheeler%20-%20Horse%20Barn%20Ventilation.pps Hughes, D.L. (1997a). Dislodgeable Residues of Fipronil Following Application of Frontline® Spray Treatment to Dogs. Lab Project Number: 6848-100. Unpublished study prepared by Covance Laboratory for Merial Limited. EPA MRID 44433306. Hughes, D.L. (1997b). Dislodgeable Residues of Fipronil Following Application of Frontline® Spray Treatment to Cats. Lab Project Number: 6848-100. Unpublished study prepared by Covance Laboratory for Merial Limited. EPA MRID 44433307. Human & Environmental Risk Assessment (HERA). (2005). Human & Environmental Risk Assessment on Ingredients of Household Cleaning Products. Iwata, Y.; Knaak, J.B.; Spear, R.C.; Foster, R.J. (1977). Worker Reentry into Pesticide Treated Crops. Procedure For The Determination of Dislodgeable Residues on Foliage, Bull. Environ. Contam. Toxicol. 18:649-655. Johnson, D.; Thompson, R.; Butterfield, B. (1999). Outdoor Residential Pesticide Use and Usage Survey and National Gardening Association Survey. Unpublished study prepared by Doane Marketing Research, Inc. EPA MRID 46883825 (also EPA MRID 44972202). Keenan, J. (2007). Potential Exposures of Children and Adults to Cypermethrin and other Pyrethroid Insecticides Following Treatment and Control of Indoor Pests. (Doctoral Dissertation, University of California, Riverside, June 2007).
References
U.S. EPA Office of Pesticide Programs – Standard Operating Procedures for Assessing Residential Pesticide Exposure 11-5
Klein, D (2002). Leaching of TBTM from Nylon Carpet Sample Treated with Ultra-Fresh DM-50 Using Acidic, Neutral and Alkaline Artificial Sweat. MRID 45746802. Klepeis NE, Nelson WC, Ott WR et al. (2001). The National Human Activity Pattern Survey (NHAPS): A Resource for Assessing Exposure to Environmental Pollutants. Journal of Exposure Analysis and Environmental Epidemiology. 11(3):231-252. Klonne, D.; Artz, S.; Bruce, E. (1999). Determination of Dermal and Inhalation Exposure to Reentry Workers During Scouting in Grapes (Chlorothalonil): Lab Project Number: ARF023: ERS98011: 44835. Unpublished study prepared by ABC Laboratories, Inc., and Excel Research Services, Inc. EPA MRID 45005910. Klonne, D.; Artz, S.; Prochaska, C. et al. (1999). Determination of Dermal and Inhalation Exposure to Reentry Workers During Scouting in Cauliflower (Chlorothalonil): Lab Project Number: 97-296: ARF012: 98-0005. Unpublished study prepared by Grayson Research LLC, and Ricerca, Inc. EPA MRID 45005907. Klonne, D.; Artz, S.; Rotondaro, A. (1999). Determination of Dermal and Inhalation Exposure to Reentry Workers During Scouting in Cauliflower (Chlorothalonil): Lab Project Number: ARF011: 97-295: 7443-98-0027-CR-001. Unpublished study prepared by Grayson Research LLC, and Ricerca, Inc. EPA MRID 45005906. Klonne, D.; Artz, S.; Prochaska, C. et al. (1999). Determination of Dermal and Inhalation Exposure to Reentry Workers During Scouting in Tobacco (Chlorothalonil): Lab Project Number: ARF024: 98-327: ML98-0739-ART. Unpublished study prepared by Grayson Research, LLC. and Morse Laboratories, Inc. EPA MRID 45005911. Klonne, D.; Fuller, R.; Honeycutt, R. (1999). Determination of Dermal and Inhalation Exposure to Reentry Workers During Scouting in Sweet Corn (Chlorothalonil): Lab Project Number: ARF009: 97-708HE: 017-03. Unpublished study prepared by H.E.R.A.C., Inc., and Centre Analytical Laboratories, Inc. EPA MRID 45005904. Klonne, D.; Artz, S.; Rotondaro, A. (1999) Determination of Dermal and Inhalation Exposure to Reentry Workers During Scouting in Dry Peas (Chlorothalonil): Lab Project Number: ARF021: 98-326: 7608-98-0111-CR-001. Unpublished study prepared by Grayson Research LLC, and Ricerca, Inc. EPA MRID 45005908. Klonne, D.; Artz, S.; Rotondaro, A. (1999) Determination of Dermal and Inhalation Exposure to Reentry Workers During Scouting in Dry Peas (Chlorothalonil): Lab Project Number: ARF021: 98-326: 7608-98-0111-CR-001. Unpublished study prepared by Grayson Research LLC, and Ricerca, Inc. EPA MRID 45005905. Klonne, D.; Bruce, E.; Artz, S. (1999) Determination of Dermal and Inhalation Exposure to Reentry Workers During Scouting in Sunflower (Chlorothalonil): Lab Project Number: ARF022: 44500: A048.007. Unpublished study prepared by ABC Laboratories, Inc. and Maxim Technologies, Inc. EPA MRID 45005909.
References
U.S. EPA Office of Pesticide Programs – Standard Operating Procedures for Assessing Residential Pesticide Exposure 11-6
Klonne, D.; Fuller, R.; Merricks, D. (2000) Determination of Dermal and Inhalation Exposure to Reentry Workers During Harvesting in Apples: (Malathion): Lab Project Number: ARF025: 3901: 44868. Unpublished study prepared by Agrisearch Incorporated and ABC Laboratories, Inc. EPA MRID 45138202. Klonne, D.; Fuller, R.; Belcher, T. (2000) Determination of Dermal and Inhalation Exposure to Reentry Workers During Hand Harvesting in Oranges: Lab Project Number: ARF028: ERS99004: 10231. Unpublished study prepared by Excel Research Services, Inc. and Horizon Laboratories, Inc. EPA MRID 45175101. Klonne, D.; Merricks, D. (2000) Determination of Dermal and Inhalation Exposure to Reentry Workers During Harvesting in Juice Oranges: Study Number ARF041: Lab Project Number: ARF041: 3903. Unpublished study prepared by Agrisearch Incorporated and Morse Laboratories. EPA MRID 45432301. Klonne, D.; Merricks, D.; Fuller, R. (2000) Determination of Dermal and Inhalation Exposure to Reentry Workers During Harvesting in Juice Grapefruit Study Number ARF042: Lab Project Number: ARF042: 3904. Unpublished study prepared by Agrisearch Incorporated and Maxim Technologies, Inc. EPA MRID 45432302. Klonne, D.; Fuller, R.; Rotondaro, A. (2000) Determination of Dermal and Inhalation Exposure to Reentry Workers During Chrysanthemum Pinching in a Greenhouse: Lab Project Number: ARF039: 45647. Unpublished study prepared by Grayson Research, LLC. and ABC Laboratories, Inc. EPA MRID 45344501. Klonne, D.; Fuller, R.; Howell, C. (2000) Determination of Dermal and Inhalation Exposure to Reentry Workers during Pruning in Nursery Stock: Lab Project Number: ARF043: 45949: HL 10258. Unpublished study prepared by ABC Laboratories, Inc. EPA MRID 45469501. Klonne, D.; Fuller, R.; Howell, C. (2000) Determination of Dermal and Inhalation Exposure to Reentry Workers during Harvesting in Nursery Stock: Lab Project Number: 45950: ARF044. Unpublished study prepared by ABC Laboratories, Inc. EPA MRID 45469502 Klonne, D.; Fuller, R.; Belcher, T. (2000) Determination of Dermal and Inhalation Exposure to Reentry Workers During Weeding in Cabbage: (Carbaryl): Lab Project Number: ARF037: ERS99007: A048. 008. Unpublished study prepared by Excel Research services, Inc. and Maxim Technologies, Inc. EPA MRID 45191701. Klonne, D.; Fuller, R.; Rotondaro, A. (2001) Determination of Dermal and Inhalation Exposure to Reentry Workers During Harvesting in Summer Squash: Lab Project Number: AFR049: 46083. Unpublished study prepared by Grayson Research LLC., and ABC Laboratories. EPA MRID 45491902.
References
U.S. EPA Office of Pesticide Programs – Standard Operating Procedures for Assessing Residential Pesticide Exposure 11-7
Klonne, D.; Fuller, R.; Merricks, D. (2001) Determination of Dermal and Inhalation Exposure to Reentry Workers During Tying in Tomatoes: Lab Project Number: 3905: HL10267: ARF051. Unpublished study prepared by Agrisearch Inc. EPA MRID 45530103. Klonne, D.; Fuller, R.; Belcher, T. (2001) Determination of Dermal and Inhalation Exposure to Reentry Workers During Harvesting in Wine Grapes: Lab Project Number: ARF048: ERS20019: HL10259. Unpublished study prepared by Excel Research Service, Inc., and Horizon Laboratories, Inc. EPA MRID 45491901. Klonne, D. and Johnson, D. (2004) Determination of Potential Dermal Exposure to Adults and Children Reentering a Pesticide-Treated Turf Area Study Number: ORFO3O. Unpublished study prepared by Outdoor Residential Exposure Task Force, LLC. 56 p. (MRID 47292001). Klonne, D. and Bruce, E. (2005). Determination of Dermal and Inhalation Exposure to Reentry Workers During Maintenance Activities in Golf Courses: (Chlorothalonil). Project Number: ARTF/ARF057, ARF057/MG, ARF057/CC. Unpublished study prepared by Agricultural Reentry Task Force and Ricerca Biosciences, LLC. 485 p. (MRID 46734001). Krieger, R. I., C. E. Bernard, T. M. Dinoff, L. Fell, T. Osimitz, J. H. Ross, and T. Thongsinthusak. (2000). Biomonitoring and Whole Body Cotton Dosimetry to Estimate Potential Human Dermal Exposure to Semivolatile Chemicals. J. Exposure Analysis & Environ. Epidemiol. 10: 50-57. Krieger, RI; Bernard, CE; Dinoff, TM; Ross, JH; and Williams, RL. (2001). Biomonitoring of Persons Exposed to Insecticides used in Residences. Annals of Occupational Hygiene. 45(1001):S143-S153. Leckie, J. O., Naylor, K. A., Canales, R. A., Ferguson, A. C., Cabrera, N. L., Hurtado, A. L., Lee, K., Lin, A. Y., Ramirez, J.D.,& Vieira, V. M. (2000). Quantifying Children’s Microlevel Activity Data from Existing Videotapes. Contract Report Submitted to U.S. EPA, ORD, NERL, Reference No. U2F112OT-RT. Leidy R.B., Wright C.G., Dupree H.E. (1996) Distribution of Chlorpyrifos in Air and on Surfaces Following Crack and Crevice Application to Rooms. Environ. Monit. Assess. 42:253-263. Lide D.R. (1981). CRC Handbook of Chemistry and Physics, 61th Edition. Boca Raton, Florida: CRC Press Inc. Lucas, John. (2003). “The Allethrins: Chemistry and Formulations” SMART Meeting. Valent BioScience Corporation Environmental Science Division. U.S. EPA Arlington, VA. 10/7/03. Mazan, M.R., Svatek, J., Maranda, L., Christiani, D., Ghio, A., Nadeau, J. and Hoffman A.M. (2009). Questionnaire Assessment of Airway Disease Symptoms in Equine Barn Personnel. Occupational Medicine.

References
U.S. EPA Office of Pesticide Programs – Standard Operating Procedures for Assessing Residential Pesticide Exposure 11-8
McKeown, K. (2001). Determination of the Dislodgeability of Tetrachlorvinphos (TCVP) from the Fur of Dogs Following the Application of an Insecticide Powder, Pump Spray or Aerosol. Lab Project Number: Hartz Test No. 1555. Unpublished study prepared by The Hartz Mountain Corporation. EPA MRID 45485501. Merricks, D. L. (1997). Carbaryl Applicator Exposure Study During Application of Sevin® Dust To Dogs By the Non-Professional. Lab Project Number: 1517. Unpublished study prepared by Agrisearch Incorporated for Rhone-Poulenc Ag Company. EPA MRID 44439901. Merricks, D.L. (1998). Carbaryl Mixer/Loader/Applicator Exposure Study During Application of RP-2 Liquid (21%) to Fruit Trees and Ornamental Plants : Lab Project Number: 1518. Unpublished study prepared by Agrisearch Inc., Rhone-Poulenc Ag Co., and Morse Laboratories, Inc. 320 p. EPA MRID 44518501. Mester, T.C. (1998). Dermal Exposure and Inhalation Exposure to Carbaryl by Commercial Pet Groomers During Applications of Adams ™ Carbaryl Flea and Tick Shampoo. Lab Project Number: 97649. Unpublished study prepared by ABC Laboratories California for Pfizer Animal Health. EPA MRID 44658401. NAFTA - Dept. of Pesticide Regulation (DPR), California EPA, HSM-98014, April 24, 1998. National Research Council. (1994). Health Effects of Permethrin-Impregnated Army Battle-Dress Uniforms. Subcommittee to Review Permethrin Toxicity from Military Uniforms, Committee on Toxicology, Board on Environmental Studies and Toxicology, Commission on Life Sciences. Washington, DC: NRC. National Research Council, Committee on Improving Risk Analysis Approaches Used by the U.S. EPA (2009). Science and Decisions: Advancing Risk Assessment. National Academies Press. 500 Fifth St. N.W. Washington, DC 20001. Pesticide Regulation Notice 98-6. (1998). Flammability Labeling Requirements for Total Release Fogger Pesticides. Putnam, R.A., Doherty, J. J., and Clark, J. M. (2008). Golfer Exposure to Chlorpyrifos and Carbaryl Following Application to Turfgrass. Journal of Agricultural and Food Chemistry. Reiss, R. and Griffin, J. A. (2004). Probabilistic Exposure and Risk Model for Fumigant Bystander Exposures Using Iodomethane as a Case Study. Sponsored by Arvesta Corporation. July 28, 2004. Residential Exposure Joint Venture (REJV) Survey. Consumer Specialty Products Association: 2002.03-REJV-12M-002. Ross, J; Fong, HR; Thongsinthusak, T; Margetich, S; Krieger, R. (1991). Measuring Potential Dermal Transfer of Surface Pesticide Residue Generated From Indoor Fogger Use: using the CDFA roller methods. Chemosphere 22: 975 – 984.
References
U.S. EPA Office of Pesticide Programs – Standard Operating Procedures for Assessing Residential Pesticide Exposure 11-9
Rudenko, L. (2000). Supplemental Submission to the US Environmental Protection Agency: Permethrin Rub-Off Trial from Astex Mattress Liners. Prepared for Protec Health International Ltd. by The Life Sciences Consultancy, LLC. October 31, 2000. EPA MRID 45256001. Selim, S. (2000a) Measurement of Transfer of Pyrethrin and Piperonyl Butoxide Residues from Vinyl Flooring Treated with a Fogger Formulation. Unpublished study prepared by Non-Dietary Exposure Task Force. (MRID 46188605). Selim, S. (2000b) Post-Application Deposition Measurements for Pyrethrins and Piperonyl Butoxide Following Use of a Total Release Indoor Fogger. Unpublished study prepared by Non-Dietary Exposure Task Force. (MRID 46188602). Selim, S. (2000c) Post Application Measurements for Deltamethrin Following Use of a Total Release Fogger. Unpublished study prepared by Non-Dietary Exposure Task Force. (MRID 46609901). Selim, S. (2002a) Determination of Pyrethrin (PY) and Piperonyl Butoxide (PBO) Residue on the Hand from Treated Vinyl Flooring Sections Following Hand Press on Untreated Surfaces. Unpublished study prepared by Non-Dietary Exposure Task Force. (MRID 46188614). Selim, S. (2002b) Determination of Pyrethrin (PY) and Piperonyl Butoxide (PBO) Residue on the Hand following Hand Press on Treated and Untreated Carpet. Unpublished study prepared by Non-Dietary Exposure Task Force. (MRID 46188620). Selim, S. (2003a) Measurement of Transfer of Permethrin and Piperonyl Butoxide Residues from Vinyl and Carpet Flooring Treated with a Fogger Formulation Following a Single Hand Press. Unpublished study prepared by Non-Dietary Exposure Task Force. (MRID 46188625). Selim, S. (2003b) Determination of Permethrin (PER) and Piperonyl Butoxide (PBO) Residue on the Hand Following Hand Press on Treated and Untreated Vinyl and Carpet. Unpublished study prepared by Non-Dietary Exposure Task Force. (MRID 46188628). Selim, S. (2003c) Post-Application Deposition Measurements For Permethrin and Piperonyl Butoxide Following Use of a Total Release Indoor Fogger. Unpublished study prepared by Non-Dietary Exposure Task Force. (MRID 46188623). Selim, S. (2004) Measurement of Transfer of Deltamethrin Residues from Vinyl and Carpet flooring Treated with a Fogger Formulation Following a Single Hand Press. Unpublished study prepared by Non-Dietary Exposure Task Force. (MRID 46297602). Selim, S. (2008). Determination of Floor Residues of Esfenvalerate Following a Crack and Crevice or Broadcast Application of EVERCIDE® Residual Ant and Roach Spray 27523. MRID: 47547701

References
U.S. EPA Office of Pesticide Programs – Standard Operating Procedures for Assessing Residential Pesticide Exposure 11-10
SHEDS-Multimedia: ORD/NERL’s Model to Estimate Aggregate and Cumulative Exposures to Chemicals. Available online at: http://www.epa.gov/heasd/products/sheds_multimedia/sheds_mm.html Smith, C. (2011). Review of ORD Test House Study, D390098. Snodgrass (1987). PERMETHRIN: Fabric/Skin Contact From Wearing The Army Battle Dress Uniform. (MRID No. 407668-12) Snodgrass (1992). Permethrin Transfer from Treated Cloth to the Skin Surface: Potential for Exposure in Humans. Journal of Toxicology and Environmental Health, 35: 91-105. Stout II, D. M. and Mason, M.A. (2003). The Distribution of Chlorpyrifos Following a Crack and Crevice Type Application in the U.S. EPA Indoor Air Quality Research House. Atmospheric Environment, 37, 5539-5549. Tsang, A.M.; Klepeis, N.E. (1996). Results tables from a detailed analysis of the National Human Activity Pattern Survey (NHAPS) responses. Draft Report prepared for the U.S. Environmental Protection Agency by Lockheed Martin, Contract No. 68-W6-001, Delivery Order No. 13. University of Nebraska–Lincoln Extension. (2006). Insecticide Applications. Cockroach Control Manual. Second Edition. Lincoln: Nebraska. 53-57. U.S. Air Force (USAF). (2003). Department of The Air Force - Headquarters Air Force Civil Engineer Support Agency, April 16, 2003 memo with the subject "Engineering Technical Letter (ETL) 03-3: Air Force Carpet Standard." U.S. EPA. (1992). Guidelines for Exposure Assessment. U.S. Environmental Protection Agency, Washington, DC, Federal Register Notice. Vol. 57. No. 104, pp. 22888-22938. U.S. EPA. (1993). Wildlife Exposure Factors Handbook. Office of Research and Development, Washington, DC. EPA/600/R-93/187a. U.S. EPA. (1993) Protocol for Dermal Exposure Assessment: A Technical Report. Environmental Monitoring Systems Laboratory. EPA/600/X-93/005. U.S. EPA. (1995). Data Call-In Notice for Post-Application Exposure Data. U.S. Environmental Protection Agency, Washington, DC. U.S. EPA. (1995) Multi-Chamber Concentration and Exposure Model (MCCEM): User's Guide, Version 2.4. U.S. Environmental Protection Agency, Office of Pollution Prevention and Toxics, Economics, Exposure and Technology Division, Exposure Assessment Branch, Washington D.C. U.S. EPA. (1996). Residue Chemistry Test Guidelines: OPPTS 860.1460 - Food Handling. EPA 712–C–96–181.
References
U.S. EPA Office of Pesticide Programs – Standard Operating Procedures for Assessing Residential Pesticide Exposure 11-11
U.S. EPA. (1997). Exposure Factors Handbook. U.S. Environmental Protection Agency, Washington, DC. U.S. EPA. (1997). Series 875 - Occupational and Residential Exposure Test Guidelines, Group B - Post-application Exposure Monitoring Test Guidelines. Draft Document (Version 5.2). U.S. Environmental Protection Agency, Washington, DC. U.S. EPA. (2001). Wall Paint Exposure Assessment Model (WPEM) Available online at: http://www.epa.gov/opptintr/exposure/pubs/wpem.htm. U.S. EPA. (2001). General Principles for Performing Aggregate Exposure and Risk Assessments. U.S. Environmental Protection Agency, Washington, DC. U.S. EPA. (2002). Determination of the Appropriate FQPA Safety Factor(s) in Tolerance Assessment. U.S. Environmental Protection Agency, Washington, DC. February 28, 2002. U.S. EPA. (2005). Guidance on Selecting Age Groups for Monitoring and Assessing Childhood Exposures to Environmental Contaminants (Final). U.S. Environmental Protection Agency, Washington, DC, EPA/630/P-03/003F.
U.S. EPA. (2005). Guidelines for Carcinogen Risk Assessment. U.S. Environmental Protection Agency, Washington, DC, EPA/630/P-03/001F.
U.S. EPA. (2005). Supplemental Guidance for Assessing Susceptibility from Early-Life Exposure to Carcinogens. U.S. Environmental Protection Agency, Washington, DC, EPA/630/R-03/003F. U.S. EPA. (2009). Metabolically Derived Human Ventilation Rates: A Revised Approach Based Upon Oxygen Consumption Rates. U.S. Environmental Protection Agency, Washington, DC, EPA/600/R-06/129F. U.S. EPA. (2011). Exposure Factors Handbook 2011 Edition (Final). U.S. Environmental Protection Agency, Washington, DC, EPA/600/R-09/052F. Vaccaro (1991). Evaluation of Dislodgeable Residues and Absorbed Doses of Chlorpyrifos to Crawling Infants following of a Chlorpyrifos Based Emulsifiable Concentrate Indoor Broadcast Applications. MRID 42008401. Reviewed by EPA: D168824 8/18/1995 World Health Organization (2004). A Generic Risk Assessment Model for Insecticide Treatment and Subsequent Use of Mosquito Nets. World Health Organization Communicable Disease Control, Prevention and Eradication WHO Pesticide Evaluation Scheme (WHOPES) & Protection of the Human Environment Programme on Chemical Safety (PCS). Available at: <ttp://whqlibdoc.who.int/hq/2004/WHO_PCS_04.1.pdf>
References
U.S. EPA Office of Pesticide Programs – Standard Operating Procedures for Assessing Residential Pesticide Exposure 11-12
Wright, CG and Jackson MD. (1975). Insecticide residues in non-target areas of rooms after two methods of crack-and-crevice application. Bulletin of Environmental Contamination and Toxicology 13:123–128. Wrzesinski, C. (2009). Dislodgeable Residue Study of SCH 783460 from Spot-On Treated Beagle Dogs. Lab Project Number: N09-039-01. Unpublished study prepared by Intervet Inc. EPA MRID 47834502. Wrzesinski, C. (2010). One-Month Dislodgeable Residue Study of SCH 783460 from Spot-On Treated Cats. Lab Project Number: N09-110-01. Unpublished study prepared by Intervet Inc. EPA MRID 48010801. Wrzesinski, C. (2010). One-Month Dislodgeable Residue Study of Indoxacarb and Permethrin from Spot-On Treated Beagle Dogs. Lab Project Number: N09-064-01. Unpublished study prepared by Intervet Inc. EPA MRID 48135326. Wong, et al (2000). Adult proxy responses to a survey of children’s dermal soil contact activities. J Expo Anal Environ Epidemiol 10:509-517. Xue, J., Zartarian, V., Moya, J., Freeman, N., Beamer, P., Black, K., Tulve, N., Shalat, S. (2007), A Meta-Analysis of Children's Hand-to-Mouth Frequency Data for Estimating Nondietary Ingestion Exposure. Risk Analysis, 27(2):411-420. Xue, J; Zartarian, V; Tulve, N; Moya, J; Freeman, N; AuYeung, W; Beamer, P. (2010). A Meta-Analysis of Children’s Object-to-Mouth Frequency Data for Estimating Non-Dietary Ingestion Exposure. 20: 536-545. Zartarian V.G., J. Xue, H. A. Ozkaynak, W. Dang, G. Glen, L. Smith, and C. Stallings. (2005). A Probabilistic Exposure Assessment for Children Who Contact CCA-treated Playsets and Decks Using the Stochastic Human Exposure and Dose Simulation Model for the Wood Preservative Scenario (SHEDS-WOOD). Final Report. U.S. Environmental Protection Agency, Washington, DC, EPA/600/X-05/009.
Appendix A
U.S. EPA Office of Pesticide Programs – Standard Operating Procedures for Assessing Residential Pesticide Exposure A-1
Appendix A Health Effects Division Residential Standard Operating Procedures “Index Lifestage” White Paper
Introduction In the beginning phase of an exposure and risk assessment, exposure assessors must first identify the relevant lifestages for each exposure scenario (i.e., adults, children 1 < 2 years old, children 3 < 6 years old, etc.). In most cases, there are multiple lifestages that could be potentially exposed within a particular exposure scenario. To simplify the exposure and risk assessment process, an exposure assessor generally focuses the exposure assessment towards the lifestage (or lifestages) of highest concern due to unique behavioral characteristics that may lead to higher levels of exposure. This process is referred to as “selecting an index lifestage”. The index lifestage approach utilizes quantitative assessments of the index lifestage to protect for the exposures and risks for all potentially exposed lifestages. This approach simplifies and streamlines the assessment process and allows risk managers to focus on the area(s) of highest concern. Children engage in behaviors and consumption that can increase their risk of pesticide exposures compared to adults. In the 1997 version of the Health Effects Division’s (HED’s) Residential Standard Operating Procedures (ResSOPs), the children 3 < 6 years old lifestage was used to represent children’s exposure to pesticides in residential environments. At the time, the Agency believed that this lifestage was the appropriate index lifestage for children based mainly on behavioral aspects (e.g., mobility, mouthing characteristics). In the 2011 revised version of HED’s ResSOPs, different index lifestage were selected for each individual SOP based on behavioral aspects (e.g., mobility, mouthing characteristics) as well as the types and quality of data used in the individual SOPs. In October 2009, the Agency presented the revised ResSOPs to the Federal Insecticide Fungicide and Rodenticide Act (FIFRA) Science Advisory Panel (SAP). The FIFRA SAP provided a number of comments on the revised ResSOPs specifically related to the issue of the selection of index lifestages for children. The SAP agreed with the Agency’s use of the index lifestage approach but recommended that additional explanation be included in the ResSOPs regarding the selection of the specific index lifestage for the individual SOPs. Based on the FIFRA SAP’s comments, the Agency decided to further analyze the index lifestage issue. The Agency analyzed this issue using both quantitative exposure assessments as well as qualitative considerations. Quantitative exposure assessments were performed for a variety of younger lifestages as defined in the Agency’s Guidance on Selecting Age Groups for Monitoring and Assessing Childhood Exposures for Environmental Contaminants21. This analysis was performed for each individual SOP and it includes the following lifestages: 6 < 12 months, 1 < 2 years, 2 < 3 years, and 3 < 6 years. While children younger than 6 months may potentially have exposure in the residential setting, it is believed that exposure for children older than 6 months will be equivalent, if not greater, due to behavioral and anatomical/physiological development; therefore, the focus of the quantitative assessment was on children older than 6 months.
21 http://www.epa.gov/raf/publications/guidance-on-selecting-age-groups.htm
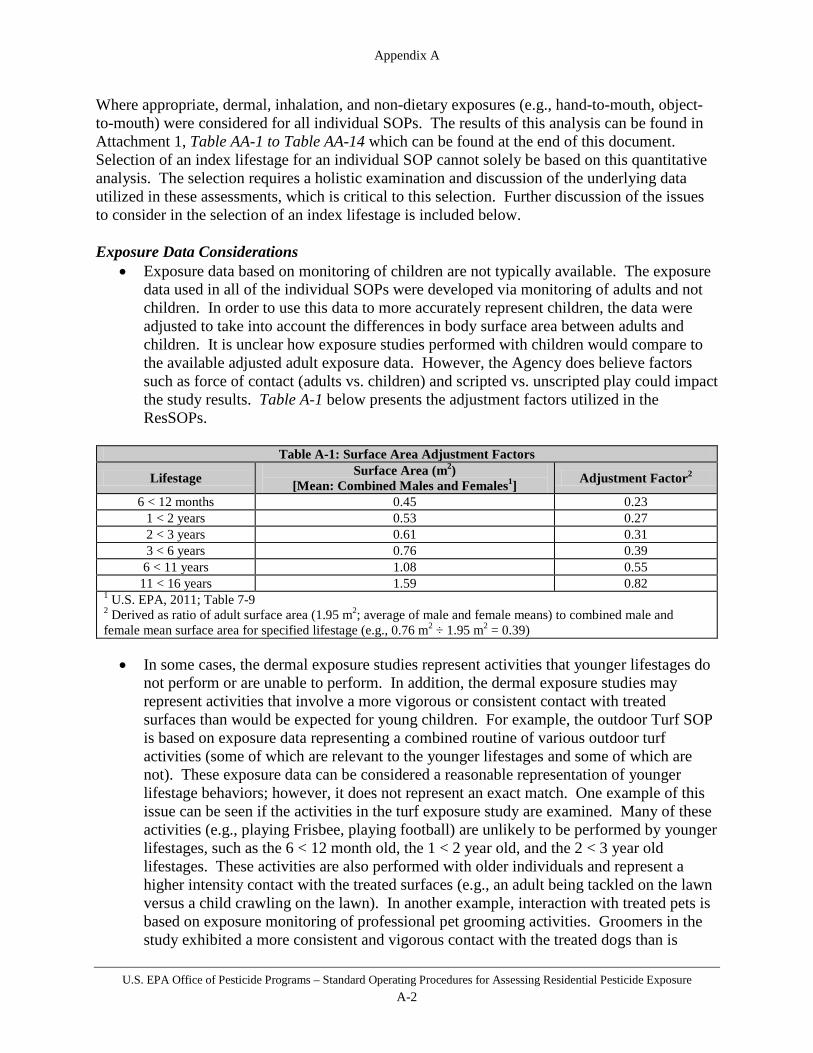
Appendix A
U.S. EPA Office of Pesticide Programs – Standard Operating Procedures for Assessing Residential Pesticide Exposure A-2
Where appropriate, dermal, inhalation, and non-dietary exposures (e.g., hand-to-mouth, object-to-mouth) were considered for all individual SOPs. The results of this analysis can be found in Attachment 1, Table AA-1 to Table AA-14 which can be found at the end of this document. Selection of an index lifestage for an individual SOP cannot solely be based on this quantitative analysis. The selection requires a holistic examination and discussion of the underlying data utilized in these assessments, which is critical to this selection. Further discussion of the issues to consider in the selection of an index lifestage is included below. Exposure Data Considerations
• Exposure data based on monitoring of children are not typically available. The exposure data used in all of the individual SOPs were developed via monitoring of adults and not children. In order to use this data to more accurately represent children, the data were adjusted to take into account the differences in body surface area between adults and children. It is unclear how exposure studies performed with children would compare to the available adjusted adult exposure data. However, the Agency does believe factors such as force of contact (adults vs. children) and scripted vs. unscripted play could impact the study results. Table A-1 below presents the adjustment factors utilized in the ResSOPs.
Table A-1: Surface Area Adjustment Factors
Lifestage Surface Area (m2) [Mean: Combined Males and Females1] Adjustment Factor2
6 < 12 months 0.45 0.23 1 < 2 years 0.53 0.27 2 < 3 years 0.61 0.31 3 < 6 years 0.76 0.39 6 < 11 years 1.08 0.55
11 < 16 years 1.59 0.82 1 U.S. EPA, 2011; Table 7-9 2 Derived as ratio of adult surface area (1.95 m2; average of male and female means) to combined male and female mean surface area for specified lifestage (e.g., 0.76 m2 ÷ 1.95 m2 = 0.39)
• In some cases, the dermal exposure studies represent activities that younger lifestages do
not perform or are unable to perform. In addition, the dermal exposure studies may represent activities that involve a more vigorous or consistent contact with treated surfaces than would be expected for young children. For example, the outdoor Turf SOP is based on exposure data representing a combined routine of various outdoor turf activities (some of which are relevant to the younger lifestages and some of which are not). These exposure data can be considered a reasonable representation of younger lifestage behaviors; however, it does not represent an exact match. One example of this issue can be seen if the activities in the turf exposure study are examined. Many of these activities (e.g., playing Frisbee, playing football) are unlikely to be performed by younger lifestages, such as the 6 < 12 month old, the 1 < 2 year old, and the 2 < 3 year old lifestages. These activities are also performed with older individuals and represent a higher intensity contact with the treated surfaces (e.g., an adult being tackled on the lawn versus a child crawling on the lawn). In another example, interaction with treated pets is based on exposure monitoring of professional pet grooming activities. Groomers in the study exhibited a more consistent and vigorous contact with the treated dogs than is
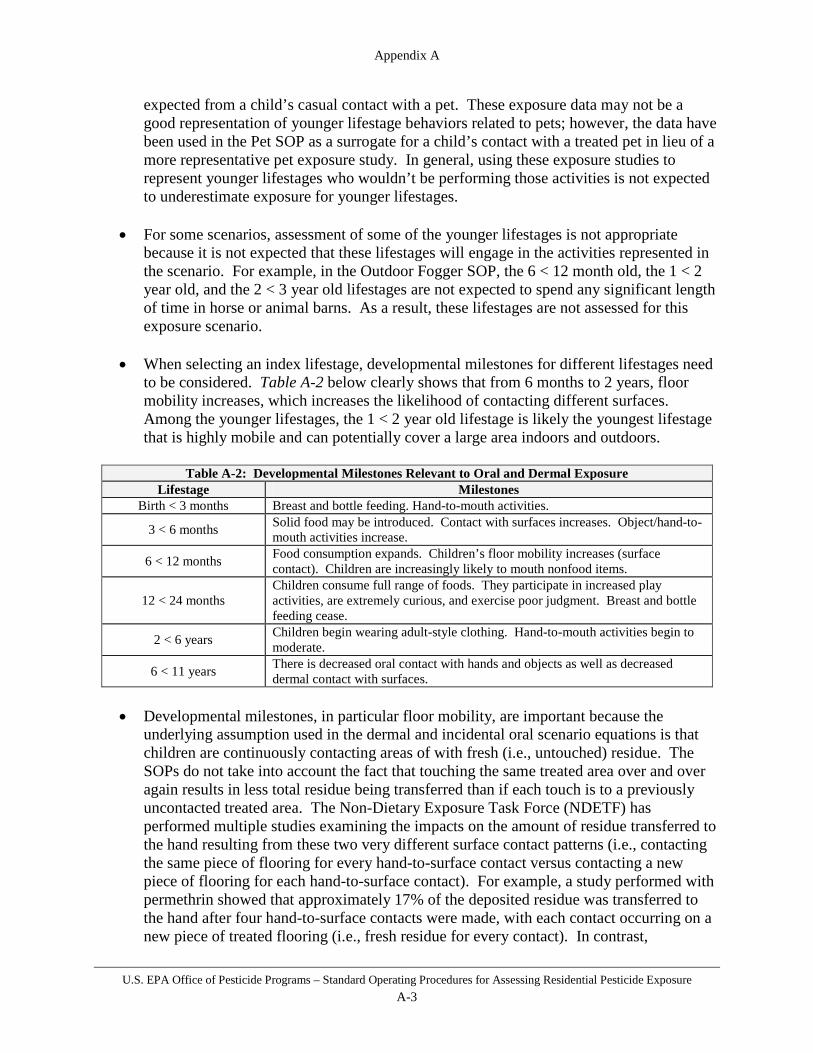
Appendix A
U.S. EPA Office of Pesticide Programs – Standard Operating Procedures for Assessing Residential Pesticide Exposure A-3
expected from a child’s casual contact with a pet. These exposure data may not be a good representation of younger lifestage behaviors related to pets; however, the data have been used in the Pet SOP as a surrogate for a child’s contact with a treated pet in lieu of a more representative pet exposure study. In general, using these exposure studies to represent younger lifestages who wouldn’t be performing those activities is not expected to underestimate exposure for younger lifestages.
• For some scenarios, assessment of some of the younger lifestages is not appropriate
because it is not expected that these lifestages will engage in the activities represented in the scenario. For example, in the Outdoor Fogger SOP, the 6 < 12 month old, the 1 < 2 year old, and the 2 < 3 year old lifestages are not expected to spend any significant length of time in horse or animal barns. As a result, these lifestages are not assessed for this exposure scenario.
• When selecting an index lifestage, developmental milestones for different lifestages need
to be considered. Table A-2 below clearly shows that from 6 months to 2 years, floor mobility increases, which increases the likelihood of contacting different surfaces. Among the younger lifestages, the 1 < 2 year old lifestage is likely the youngest lifestage that is highly mobile and can potentially cover a large area indoors and outdoors.
Table A-2: Developmental Milestones Relevant to Oral and Dermal Exposure
Lifestage Milestones Birth < 3 months Breast and bottle feeding. Hand-to-mouth activities.
3 < 6 months Solid food may be introduced. Contact with surfaces increases. Object/hand-to-mouth activities increase.
6 < 12 months Food consumption expands. Children’s floor mobility increases (surface contact). Children are increasingly likely to mouth nonfood items.
12 < 24 months Children consume full range of foods. They participate in increased play activities, are extremely curious, and exercise poor judgment. Breast and bottle feeding cease.
2 < 6 years Children begin wearing adult-style clothing. Hand-to-mouth activities begin to moderate.
6 < 11 years There is decreased oral contact with hands and objects as well as decreased dermal contact with surfaces.
• Developmental milestones, in particular floor mobility, are important because the
underlying assumption used in the dermal and incidental oral scenario equations is that children are continuously contacting areas of with fresh (i.e., untouched) residue. The SOPs do not take into account the fact that touching the same treated area over and over again results in less total residue being transferred than if each touch is to a previously uncontacted treated area. The Non-Dietary Exposure Task Force (NDETF) has performed multiple studies examining the impacts on the amount of residue transferred to the hand resulting from these two very different surface contact patterns (i.e., contacting the same piece of flooring for every hand-to-surface contact versus contacting a new piece of flooring for each hand-to-surface contact). For example, a study performed with permethrin showed that approximately 17% of the deposited residue was transferred to the hand after four hand-to-surface contacts were made, with each contact occurring on a new piece of treated flooring (i.e., fresh residue for every contact). In contrast,

Appendix A
U.S. EPA Office of Pesticide Programs – Standard Operating Procedures for Assessing Residential Pesticide Exposure A-4
approximately 6% of the total deposited residue was transferred to the hand after four hand-to-surface contacts were made, with each contact occurring on the same piece of treated flooring. The NDETF data clearly show that, all other things being equal (e.g., exposure time, hand-to-mouth frequency, etc), repeated exposure to the same treated surface will result in a lower overall exposure than repeated exposure to uncontacted treated surfaces. Based on this data, assuming repeated contact with areas of fresh residue is not expected to underestimate exposure.
Activity Data Considerations • The data available describing exposure time for young children in various environments
do not typically distinguish between the specific younger lifestages. The data are typically presented for all children or subsets of children (e.g., 3-12 years old or 1-4 and 5-11 years old). As a result, the exposure times used as an input in the individual SOPs are identical across many lifestages. This is likely a health protective use of these data as it is unlikely the exposure time to treated turf or a treated pet would be the same for the 6 < 12 month old lifestage vs. the 1 < 2 year old lifestage vs. the 2 < 3 year old lifestage.
• Frequency of hand-to-mouth events is an important variable for hand-to-mouth post-
application exposure assessments. Data on the frequency of hand-to-mouth events are limited and difficult to collect. The meta-analysis presented in Xue et al. (2007) examined hand-to-mouth frequency data from 9 studies representing 429 subjects and more than 2,000 hours of behavior observation. This meta-analysis shows that mouthing activity across the younger lifestages is very similar (see Table A-3); particularly for the 6 < 12 months and 1 < 2 years old lifestages.
Table A-3: Hand-to-Mouth Activity Data Summary
Scenario Lifestage Mean HTM events 95th percentile HTM events
Indoor
6 < 12 months (N=119) 18.9 52 1 < 2 year old (N=245) 19.6 63 2 < 3 year old (N=160) 12.8 37.5 3 < 6 year old (N=160) 14.3 56.5
Outdoor
6 < 12 months (N=10) 14.5 46.7 1 < 2 year old (N=32) 13.9 42.2 2 < 3 year old (N=46) 5.3 20 3 < 6 year old (N=55) 8.5 36
It is believed that a majority of the hand-to-mouth activity observed in the studies included in the Xue, et al. 2007 meta-analysis occurred during eating intervals. Some research supporting this belief has already been performed (AuYeung et. al, Poster presented at 15th Annual Meeting of the International Society of Exposure Analysis; 2005) but more work needs to be done. Thus, the use of these hand-to-mouth activity data is unlikely to underestimate exposure because hand contact with treated surfaces (and thus transfer of residues) is likely limited during the time a child is eating. In addition, it should be noted that hand-to-mouth events in these studies are defined as when a child’s hand touches anywhere near the mouth (i.e., each event did not necessarily result in the hand entering the mouth). For example, if a child brought their
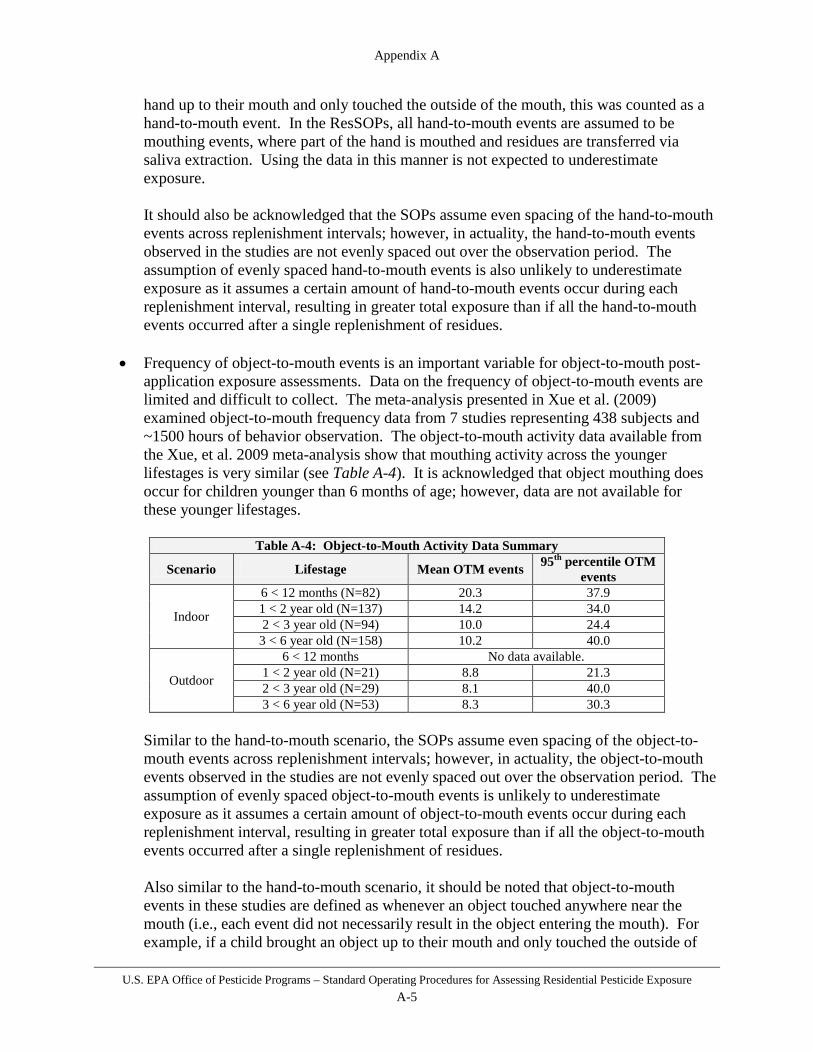
Appendix A
U.S. EPA Office of Pesticide Programs – Standard Operating Procedures for Assessing Residential Pesticide Exposure A-5
hand up to their mouth and only touched the outside of the mouth, this was counted as a hand-to-mouth event. In the ResSOPs, all hand-to-mouth events are assumed to be mouthing events, where part of the hand is mouthed and residues are transferred via saliva extraction. Using the data in this manner is not expected to underestimate exposure. It should also be acknowledged that the SOPs assume even spacing of the hand-to-mouth events across replenishment intervals; however, in actuality, the hand-to-mouth events observed in the studies are not evenly spaced out over the observation period. The assumption of evenly spaced hand-to-mouth events is also unlikely to underestimate exposure as it assumes a certain amount of hand-to-mouth events occur during each replenishment interval, resulting in greater total exposure than if all the hand-to-mouth events occurred after a single replenishment of residues.
• Frequency of object-to-mouth events is an important variable for object-to-mouth post-
application exposure assessments. Data on the frequency of object-to-mouth events are limited and difficult to collect. The meta-analysis presented in Xue et al. (2009) examined object-to-mouth frequency data from 7 studies representing 438 subjects and ~1500 hours of behavior observation. The object-to-mouth activity data available from the Xue, et al. 2009 meta-analysis show that mouthing activity across the younger lifestages is very similar (see Table A-4). It is acknowledged that object mouthing does occur for children younger than 6 months of age; however, data are not available for these younger lifestages.
Table A-4: Object-to-Mouth Activity Data Summary
Scenario Lifestage Mean OTM events 95th percentile OTM events
Indoor
6 < 12 months (N=82) 20.3 37.9 1 < 2 year old (N=137) 14.2 34.0 2 < 3 year old (N=94) 10.0 24.4
3 < 6 year old (N=158) 10.2 40.0
Outdoor
6 < 12 months No data available. 1 < 2 year old (N=21) 8.8 21.3 2 < 3 year old (N=29) 8.1 40.0 3 < 6 year old (N=53) 8.3 30.3
Similar to the hand-to-mouth scenario, the SOPs assume even spacing of the object-to-mouth events across replenishment intervals; however, in actuality, the object-to-mouth events observed in the studies are not evenly spaced out over the observation period. The assumption of evenly spaced object-to-mouth events is unlikely to underestimate exposure as it assumes a certain amount of object-to-mouth events occur during each replenishment interval, resulting in greater total exposure than if all the object-to-mouth events occurred after a single replenishment of residues. Also similar to the hand-to-mouth scenario, it should be noted that object-to-mouth events in these studies are defined as whenever an object touched anywhere near the mouth (i.e., each event did not necessarily result in the object entering the mouth). For example, if a child brought an object up to their mouth and only touched the outside of
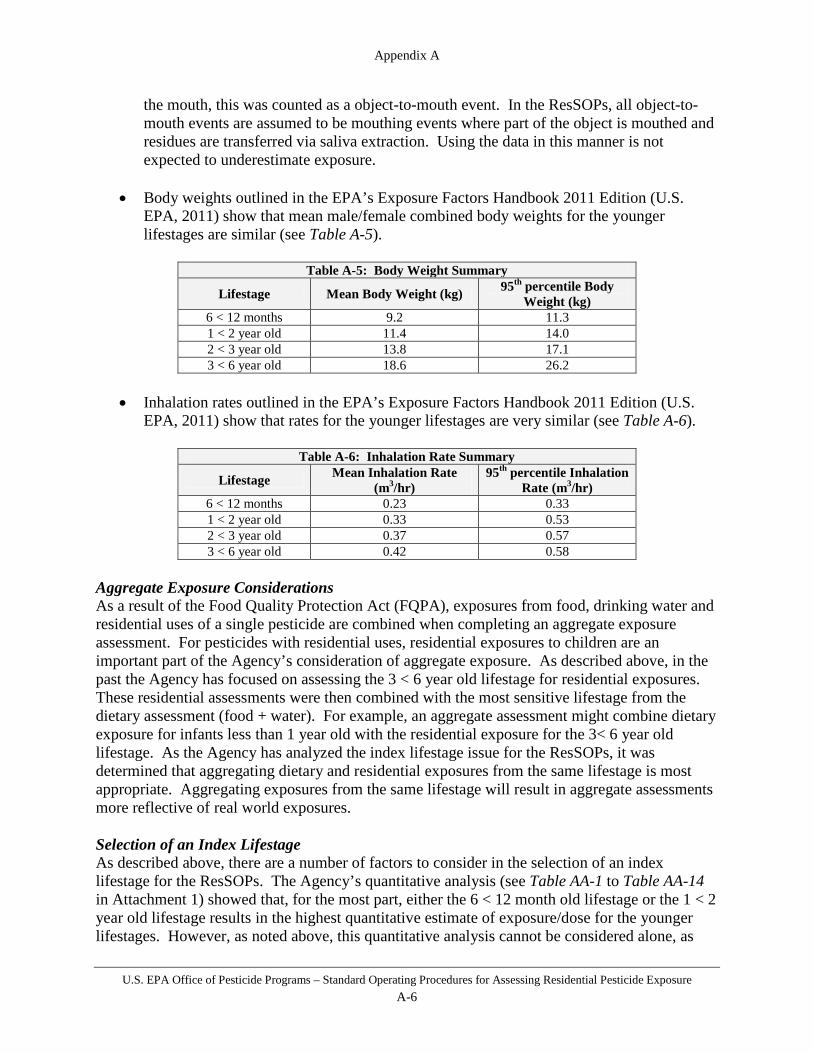
Appendix A
U.S. EPA Office of Pesticide Programs – Standard Operating Procedures for Assessing Residential Pesticide Exposure A-6
the mouth, this was counted as a object-to-mouth event. In the ResSOPs, all object-to-mouth events are assumed to be mouthing events where part of the object is mouthed and residues are transferred via saliva extraction. Using the data in this manner is not expected to underestimate exposure.
• Body weights outlined in the EPA’s Exposure Factors Handbook 2011 Edition (U.S. EPA, 2011) show that mean male/female combined body weights for the younger lifestages are similar (see Table A-5).
Table A-5: Body Weight Summary
Lifestage Mean Body Weight (kg) 95th percentile Body Weight (kg)
6 < 12 months 9.2 11.3 1 < 2 year old 11.4 14.0 2 < 3 year old 13.8 17.1 3 < 6 year old 18.6 26.2
• Inhalation rates outlined in the EPA’s Exposure Factors Handbook 2011 Edition (U.S.
EPA, 2011) show that rates for the younger lifestages are very similar (see Table A-6).
Table A-6: Inhalation Rate Summary
Lifestage Mean Inhalation Rate (m3/hr)
95th percentile Inhalation Rate (m3/hr)
6 < 12 months 0.23 0.33 1 < 2 year old 0.33 0.53 2 < 3 year old 0.37 0.57 3 < 6 year old 0.42 0.58
Aggregate Exposure Considerations As a result of the Food Quality Protection Act (FQPA), exposures from food, drinking water and residential uses of a single pesticide are combined when completing an aggregate exposure assessment. For pesticides with residential uses, residential exposures to children are an important part of the Agency’s consideration of aggregate exposure. As described above, in the past the Agency has focused on assessing the 3 < 6 year old lifestage for residential exposures. These residential assessments were then combined with the most sensitive lifestage from the dietary assessment (food + water). For example, an aggregate assessment might combine dietary exposure for infants less than 1 year old with the residential exposure for the 3< 6 year old lifestage. As the Agency has analyzed the index lifestage issue for the ResSOPs, it was determined that aggregating dietary and residential exposures from the same lifestage is most appropriate. Aggregating exposures from the same lifestage will result in aggregate assessments more reflective of real world exposures. Selection of an Index Lifestage As described above, there are a number of factors to consider in the selection of an index lifestage for the ResSOPs. The Agency’s quantitative analysis (see Table AA-1 to Table AA-14 in Attachment 1) showed that, for the most part, either the 6 < 12 month old lifestage or the 1 < 2 year old lifestage results in the highest quantitative estimate of exposure/dose for the younger lifestages. However, as noted above, this quantitative analysis cannot be considered alone, as
Appendix A
U.S. EPA Office of Pesticide Programs – Standard Operating Procedures for Assessing Residential Pesticide Exposure A-7
there are also a number of qualitative factors that impact the selection of an index lifestage for the ResSOPs. Based on the combined quantitative and qualitative analysis of the index lifestage issue, the Agency has determined that the 1 < 2 year old lifestage represents the most appropriate index lifestage for children for most of the exposure scenarios. There are some exceptions to this selection within the ResSOPs. For example, as mentioned above, in some of the individual SOPs, selecting some of the younger lifestages (e.g., the 6 <12 month old lifestage in horse or animal barns) is inappropriate because children in that age range are not expected to engage in the activities represented in the scenario.

Appendix B
U.S. EPA Office of Pesticide Programs – Standard Operating Procedures for Assessing Residential Pesticide Exposure A-1
Attachment 1: Quantitative Sensitivity Analysis Turf SOP
Table AA-1: Turf Dermal Index Lifestage Analysis
TTR Calculations when Chemical Specific TTR Data are Not Available
Application Rate (lb ai/acre) F a FD t
Weight unit conversion
factor
Area unit conversion
factor TTRt (ug/cm2)
Liquid Product 0.87 0.01 0.1 0 450000000 0.0000000247 0.097
Granular Product 0.67 0.002 0.1 0 450000000 0.0000000247 0.015
Dermal Exposure for High Contact Lawn Activities
Exposure Scenario Lifestage TTRt (ug/cm2) Weight unit conversion
factor
Transfer Coefficient
(cm2/hr)
Hours of Exposure (hr)
Exposure (mg/day)
Average Daily Dose
(mg/kg/day)
High Contact Lawn Activities (Liquids)
Adult 0.097 0.001 180,000 1.5 26.11 0.33 11 <16 years 0.097 0.001 150,000 1.5 21.76 0.38 6 <11 years 0.097 0.001 99,000 1.5 14.36 0.45 3 <6 years 0.097 0.001 70,000 1.5 10.15 0.55 2 <3 years 0.097 0.001 56,000 1.5 8.12 0.59 1 <2 years 0.097 0.001 49,000 1.5 7.11 0.62
6 <12 months 0.097 0.001 41,000 1.5 5.95 0.65
High Contact Lawn Activities (Granulars)
Adult 0.015 0.001 200,000 1.5 4.47 0.06 11 <16 years 0.015 0.001 160,000 1.5 3.57 0.06 6 <11 years 0.015 0.001 110,000 1.5 2.46 0.08 3 <6 years 0.015 0.001 78,000 1.5 1.74 0.09 2 <3 years 0.015 0.001 62,000 1.5 1.39 0.10 1 <2 years 0.015 0.001 54,000 1.5 1.21 0.11
6 <12 months 0.015 0.001 46,000 1.5 1.03 0.11 a. The screening level value was selected for the F value in this example. This value would be refined if chemical specific turf transferable residue data
are available.

Appendix B
U.S. EPA Office of Pesticide Programs – Standard Operating Procedures for Assessing Residential Pesticide Exposure A-2
Table AA-2: Turf Hand-to-Mouth Lifestage Analysis
Hand Residue Calculations
Exposure Scenario Lifestage Faihands Children Dermal
Exposure SAH (cm2) HRt (mg/cm2)
Hand Residue Liquid Product
3 <6 years 0.06 10.154 225 0.0014
2 <3 years 0.06 8.123 160 0.0015
1 <2 years 0.06 7.107 150 0.0014
6 <12 months 0.06 5.947 120 0.0015
Hand Residue Granular Product
3 <6 years 0.027 1.743 225 0.00010
2 <3 years 0.027 1.385 160 0.00012
1 <2 years 0.027 1.206 150 0.00011
6 <12 months 0.027 1.028 120 0.00012
Hand-to-Mouth Exposure for Lawn Activities
Exposure Scenario Lifestage
HRt FM
SAH (cm2) Exposure
Time (hours/day)
N_Replen SE Freq_HtM
Exposure (mg/day)
Average Daily Dose (mg/kg/day)
Hand Residue
(mg/cm2)
Fraction of Hand Surface Area
Mouthed / Event
Number of replenishment intervals per hr (intervals/hr)
Extraction by Saliva
H-t-M events per hour
HtM Exposure Liquid Product
3 <6 years 0.00135 0.127 225 1.5 4 0.5 8.5 0.18 0.0096 2 <3 years 0.00152 0.127 160 1.5 4 0.5 5.3 0.11 0.0081 1 <2 years 0.00142 0.127 150 1.5 4 0.5 13.9 0.15 0.013
6 <12 months 0.00149 0.127 120 1.5 4 0.5 14.5 0.12 0.014
HtM Exposure Granular Product
3 <6 years 0.00010 0.127 150 1.5 4 0.5 8.5 0.0092 0.0005 2 <3 years 0.00012 0.127 150 1.5 4 0.5 5.3 0.0080 0.0006 1 <2 years 0.00011 0.127 150 1.5 4 0.5 13.9 0.011 0.0010
6 <12 months 0.00012 0.127 150 1.5 4 0.5 14.5 0.012 0.0013

Appendix B
U.S. EPA Office of Pesticide Programs – Standard Operating Procedures for Assessing Residential Pesticide Exposure A-3
Table AA-3: Turf Object-to-Mouth Lifestage Analysis Object Residue Calculations
Exposure Scenario
Application Rate (lb ai/acre) FO Weight unit
conversion factor Area unit
conversion factor ORt (ug/cm2)
Object Residue Liquid Product 0.87 0.0 450000000 0.0000000247 0.097
Object Residue Granular Product 0.67 0.0 450000000 0.0000000247 0.074
Object-to-Mouth Exposure for Lawn Activities
Exposure Scenario Lifestage
ORt Weight
unit conversion
factor
SAMO
Exposure Time
(hours/day)
N_Replen SE Freq_OtM Average
Daily Dose (mg/kg/day
)
Object Residue (mg/cm2
)
Object Surface Area
Mouthed / Event
(cm2/event)
Number of replenishment intervals per
hr (intervals/hr)
Extraction by Saliva
O-t-M events per
hour
Exposure (mg/day)
OtM Exposure Liquid Product
3 <6 years 0.097 0.001 10 1.5 4 0.5 8.3 0.0044 0.00024 2 <3 years 0.097 0.001 10 1.5 4 0.5 8.1 0.0044 0.00032 1 <2 years 0.097 0.001 10 1.5 4 0.5 8.8 0.0045 0.00040
6 <12 months Data on outdoor object-to-mouth event per hour are not available for this lifestage.
OtM Exposure Granular Product
3 <6 years 0.074 0.001 10 1.5 4 0.5 8.8 0.0035 0.00019 2 <3 years 0.074 0.001 10 1.5 4 0.5 8.8 0.0035 0.00025 1 <2 years 0.074 0.001 10 1.5 4 0.5 8.8 0.0035 0.00031
6 <12 months Data on outdoor object-to-mouth event per hour are not available for this lifestage.

Appendix B
U.S. EPA Office of Pesticide Programs – Standard Operating Procedures for Assessing Residential Pesticide Exposure A-4
Indoor SOP
Table AA-4: Indoor Dermal Lifestage Analysis Indoor Surface Residue Calculations when Chemical Specific Data are Not Available
Type of Application
Application Rate (lb ai/acre)
Conversion Factor (ug/lb)
Conversion Factor (ft2 to
cm2)
Percent of application rate
deposited
Deposited residue
(ug/cm2)
Broadcast 0.0001 4.5E+08 1.08E-03 100% 49.03 Dermal Exposure for Indoor Activities
Exposure Scenario Lifestage
Deposited Residue (ug/cm2)
Conversion Factor (mg/ug)
Fraction transferred
Transfer Coefficient
(cm2/hr)
Hours of Exposure
(hr)
Exposure (mg/day)
Body Weight
(kg)
Average Daily Dose
(mg/kg/day)
Carpet
Adult 49.03 0.001 0.06 6,800 8 160.0 79.5 2.0 11 <16 years 49.03 0.001 0.06 5,500 5 80.9 56.8 1.4 6 <11 years 49.03 0.001 0.06 3,800 5 55.9 31.8 1.8 3 <6 years 49.03 0.001 0.06 2,700 5 39.7 18.6 2.1 2 <3 years 49.03 0.001 0.06 2,200 4 25.9 13.8 1.9 1 <2 years 49.03 0.001 0.06 1,800 4 21.2 11.4 1.9
6 <12 months 49.03 0.001 0.06 1,600 5 23.5 9.2 2.6
Hard surfaces
Adult 49.03 0.001 0.08 6,800 2 53.3 79.5 0.7 11 <16 years 49.03 0.001 0.08 5,500 1 21.6 56.8 0.4 6 <11 years 49.03 0.001 0.08 3,800 2 29.8 31.8 0.9 3 <6 years 49.03 0.001 0.08 2,700 2 21.2 18.6 1.1 2 <3 years 49.03 0.001 0.08 2,200 2 17.3 13.8 1.3 1 <2 years 49.03 0.001 0.08 1,800 2 14.1 11.4 1.2
6 <12 months 49.03 0.001 0.08 1,600 2 12.6 9.2 1.4

Appendix B
U.S. EPA Office of Pesticide Programs – Standard Operating Procedures for Assessing Residential Pesticide Exposure A-5
Table AA-5: Indoor Inhalation (Aerosols) Lifestage Analysis
Lifestage Application rate (lb ai/m3)
CF (mg/lb) Co (mg/m3) IR (m3/hr) ACH
(1/hr) ET (hr) Exposure (mg/day)
Body Weight (kg)
Inhalation Dose (mg/kg/day)
Adult 0.000158 4.54E+05 71.58 0.64 0.45 2 60.41 79.5 0.8 11 <16 years 0.000158 4.54E+05 71.58 0.63 0.45 2 59.47 56.8 1.0 6 <11 years 0.000158 4.54E+05 71.58 0.5 0.45 2 47.20 31.8 1.5 3 <6 years 0.000158 4.54E+05 71.58 0.42 0.45 2 39.65 18.6 2.1 2 <3 years 0.000158 4.54E+05 71.58 0.37 0.45 2 34.93 13.8 2.5 1 <2 years 0.000158 4.54E+05 71.58 0.33 0.45 2 31.15 11.4 2.7
6 <12 months 0.000158 4.54E+05 71.58 0.23 0.45 2 21.71 9.2 2.4
Table AA-6: Indoor Inhalation (Vapors) Lifestage Analysis
Lifestage Inhalation Rate (m3/hr)
Mass of active ingredient
applied (mg)
Hours of Exposure
(hr)
k (first order decay
rate)
Air exchange
rate (1/hr)
Volume of room (m3) Exposure (mg/day)
Body Weight
(kg)
Inhalation Dose
(mg/kg/day)
Adult 0.64 454 16 2.08E-05 0.45 33 0.006 79.5 0.00007 11 <16 years 0.63 454 15 2.08E-05 0.45 33 0.005 56.8 0.00009 6 <11 years 0.5 454 15 2.08E-05 0.45 33 0.004 31.8 0.00012 3 <6 years 0.42 454 16 2.08E-05 0.45 33 0.004 18.6 0.00020 2 <3 years 0.37 454 16 2.08E-05 0.45 33 0.003 13.8 0.00024 1 <2 years 0.33 454 18 2.08E-05 0.45 33 0.003 11.4 0.00029
6 <12 months 0.23 454 18 2.08E-05 0.45 33 0.002 9.2 0.00025
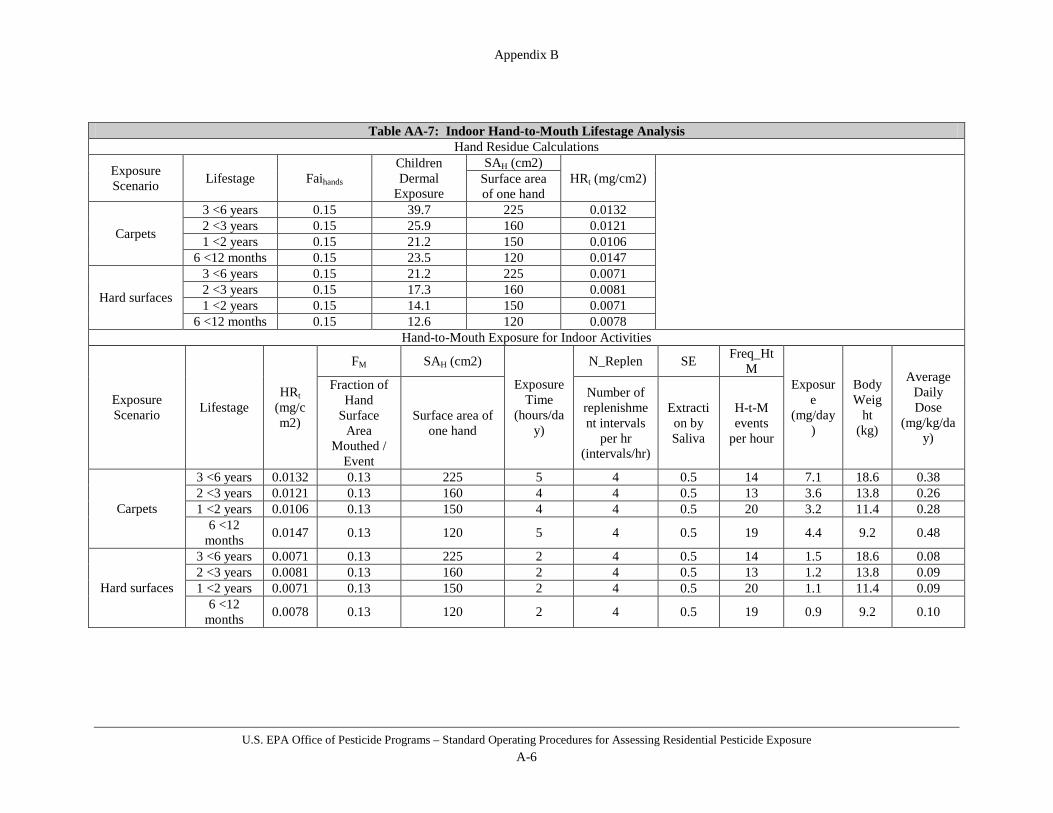
Appendix B
U.S. EPA Office of Pesticide Programs – Standard Operating Procedures for Assessing Residential Pesticide Exposure A-6
Table AA-7: Indoor Hand-to-Mouth Lifestage Analysis Hand Residue Calculations
Exposure Scenario Lifestage Faihands
Children Dermal
Exposure
SAH (cm2) HRt (mg/cm2)
Surface area of one hand
Carpets
3 <6 years 0.15 39.7 225 0.0132 2 <3 years 0.15 25.9 160 0.0121 1 <2 years 0.15 21.2 150 0.0106
6 <12 months 0.15 23.5 120 0.0147
Hard surfaces
3 <6 years 0.15 21.2 225 0.0071 2 <3 years 0.15 17.3 160 0.0081 1 <2 years 0.15 14.1 150 0.0071
6 <12 months 0.15 12.6 120 0.0078 Hand-to-Mouth Exposure for Indoor Activities
Exposure Scenario Lifestage
HRt (mg/cm2)
FM SAH (cm2)
Exposure Time
(hours/day)
N_Replen SE Freq_HtM
Exposure
(mg/day)
Body Weig
ht (kg)
Average Daily Dose
(mg/kg/day)
Fraction of Hand
Surface Area
Mouthed / Event
Surface area of one hand
Number of replenishment intervals
per hr (intervals/hr)
Extraction by Saliva
H-t-M events
per hour
Carpets
3 <6 years 0.0132 0.13 225 5 4 0.5 14 7.1 18.6 0.38 2 <3 years 0.0121 0.13 160 4 4 0.5 13 3.6 13.8 0.26 1 <2 years 0.0106 0.13 150 4 4 0.5 20 3.2 11.4 0.28
6 <12 months 0.0147 0.13 120 5 4 0.5 19 4.4 9.2 0.48
Hard surfaces
3 <6 years 0.0071 0.13 225 2 4 0.5 14 1.5 18.6 0.08 2 <3 years 0.0081 0.13 160 2 4 0.5 13 1.2 13.8 0.09 1 <2 years 0.0071 0.13 150 2 4 0.5 20 1.1 11.4 0.09
6 <12 months 0.0078 0.13 120 2 4 0.5 19 0.9 9.2 0.10

Appendix B
U.S. EPA Office of Pesticide Programs – Standard Operating Procedures for Assessing Residential Pesticide Exposure A-7
Table AA-8: Indoor Object-to-Mouth Lifestage Analysis Object Residue Calculations
Exposure Scenario Lifestage
Application Rate (lb ai/acre)
Fo (fraction transferred to
object)
Conversion Factor (ug/lb)
Conversion Factor (ft2 to cm2)
Conversion Factor (mg/ug)
Object residue loading
(mg/cm2)
Carpet
3 <6 years
0.0001
0.06
4.50E+08 1.08E-03 0.001
0.003 2 <3 years 0.003 1 <2 years 0.003
6 <12 months 0.003
Hard surface
3 <6 years
0.08
0.004 2 <3 years 0.004 1 <2 years 0.004
6 <12 months 0.004 Object-to-Mouth Exposure for Indoor Activities
Exposure Scenario Lifestage
Object residue loading
(mg/cm2)
SAM
Exposure Time
(hours/day)
N_Replen SE Freq_OtM
Exposure (mg/day)
Body Weight
(kg)
Average Daily Dose (mg/kg/day)
Surface Area of Object Mouthed /
Event (cm2/event)
Number of replenishment intervals per hr (intervals/hr)
Extraction by Saliva
O-t-M events per
hour
Carpet
3 <6 years 0.003
10
5 4 0.5 10 0.48 18.6 0.03 2 <3 years 0.003 4 4 0.5 10 0.38 13.8 0.03 1 <2 years 0.003 4 4 0.5 14 0.43 11.4 0.04
6 <12 months 0.003 5 4 0.5 20 0.56 9.2 0.06
Hard surface
3 <6 years 0.004 2 4 0.5 10 0.26 18.6 0.01 2 <3 years 0.004 2 4 0.5 10 0.26 13.8 0.02 1 <2 years 0.004 2 4 0.5 14 0.28 11.4 0.02
6 <12 months 0.004 2 4 0.5 20 0.30 9.2 0.03

Appendix B
U.S. EPA Office of Pesticide Programs – Standard Operating Procedures for Assessing Residential Pesticide Exposure A-8
Pet SOP
Table AA-9: Pet Dermal Lifestage Analysis
Dermal Exposure for High Contact Pet Activities
Exposure Scenario Lifestage Application Rate (mg)
Surface area of pet (cm2) FAR
a Transfer
Coefficient (cm2/hr)
Hours of Exposure
(hr)
Exposure (mg/day)
Body Weight (kg)
Average Daily Dose
(mg/kg/day)
Pet Post-application (Liquids) Medium Dog
Adult 300 7000 0.02 5,200 0.77 3.432 79.5 0.0432 3 <6 years 300 7000 0.02 2,000 1.0 1.714 18.6 0.092 2 <3 years 300 7000 0.02 1,600 1.0 1.372 13.8 0.0994 1 <2 years 300 7000 0.02 1,400 1.0 1.2 11.4 0.1052
6 <12 months 300 7000 0.02 1,200 1.0 1.028 9.2 0.1118
Pet Post-application (Solids) Medium Dogs
Adult 300 7000 0.02 140,000 0.77 92.4 79.5 1.162 3 <6 years 300 7000 0.02 55,000 1.0 47.14 18.6 2.534 2 <3 years 300 7000 0.02 43,000 1.0 36.86 13.8 2.67 1 <2 years 300 7000 0.02 38,000 1.0 32.572 11.4 2.858
6 <12 months 300 7000 0.02 32,000 1.0 27.428 9.2 2.982 b. The screening level value was selected for the FAR value in this example. This value would be refined if chemical specific pet residue data are
available.
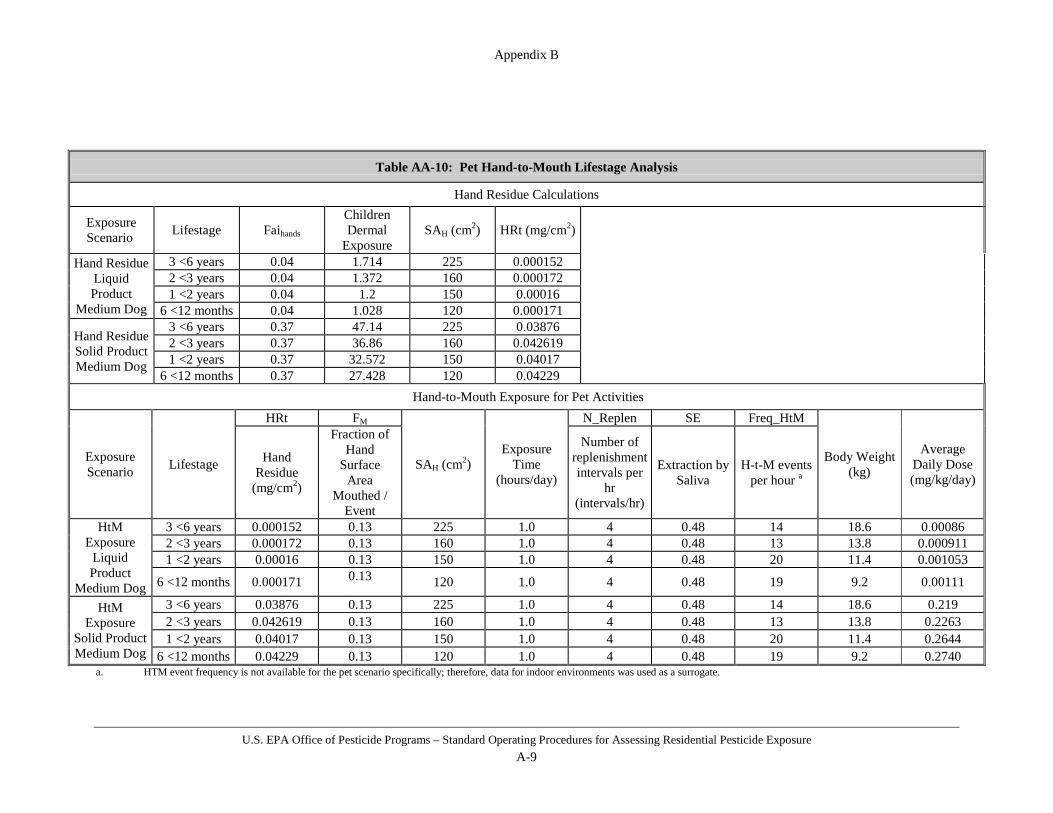
Appendix B
U.S. EPA Office of Pesticide Programs – Standard Operating Procedures for Assessing Residential Pesticide Exposure A-9
Table AA-10: Pet Hand-to-Mouth Lifestage Analysis
Hand Residue Calculations
Exposure Scenario Lifestage Faihands
Children Dermal
Exposure SAH (cm2) HRt (mg/cm2)
Hand Residue Liquid Product
Medium Dog
3 <6 years 0.04 1.714 225 0.000152 2 <3 years 0.04 1.372 160 0.000172 1 <2 years 0.04 1.2 150 0.00016
6 <12 months 0.04 1.028 120 0.000171
Hand Residue Solid Product Medium Dog
3 <6 years 0.37 47.14 225 0.03876 2 <3 years 0.37 36.86 160 0.042619 1 <2 years 0.37 32.572 150 0.04017
6 <12 months 0.37 27.428 120 0.04229 Hand-to-Mouth Exposure for Pet Activities
Exposure Scenario Lifestage
HRt FM
SAH (cm2) Exposure
Time (hours/day)
N_Replen SE Freq_HtM
Body Weight (kg)
Average Daily Dose (mg/kg/day)
Hand Residue
(mg/cm2)
Fraction of Hand
Surface Area
Mouthed / Event
Number of replenishment intervals per
hr (intervals/hr)
Extraction by Saliva
H-t-M events per hour a
HtM Exposure
Liquid Product
Medium Dog
3 <6 years 0.000152 0.13 225 1.0 4 0.48 14 18.6 0.00086 2 <3 years 0.000172 0.13 160 1.0 4 0.48 13 13.8 0.000911 1 <2 years 0.00016 0.13 150 1.0 4 0.48 20 11.4 0.001053
6 <12 months 0.000171 0.13 120 1.0 4 0.48 19 9.2 0.00111
HtM Exposure
Solid Product Medium Dog
3 <6 years 0.03876 0.13 225 1.0 4 0.48 14 18.6 0.219 2 <3 years 0.042619 0.13 160 1.0 4 0.48 13 13.8 0.2263 1 <2 years 0.04017 0.13 150 1.0 4 0.48 20 11.4 0.2644
6 <12 months 0.04229 0.13 120 1.0 4 0.48 19 9.2 0.2740 a. HTM event frequency is not available for the pet scenario specifically; therefore, data for indoor environments was used as a surrogate.

Appendix B
U.S. EPA Office of Pesticide Programs – Standard Operating Procedures for Assessing Residential Pesticide Exposure A-10
Outdoor Fogger SOP
Table AA-11: Aerosol Can Inhalation Lifestage Analysis
Inhalation Exposure– One 16 oz spray can
Exposure Scenario Lifestage Application Rate (mL/can) Number of cans Volume (V) (m3) Airflow (Q)
(m3/hr) IR (m3/hr) Average Daily Dose (mg/kg/day)
Inhalation - Aerosol Can
Adult 473 1 15 5400 0.64 0.705 3 <6 years 473 1 15 5400 0.42 1.98 2 <3 years 473 1 15 5400 0.37 2.35 1 <2 years 473 1 15 5400 0.33 2.53
6 <12 months 473 1 15 5400 0.23 2.19
Table AA-12: Candles, Coils, Torches, and Mats Inhalation Lifestage Analysis Inhalation Exposure- Four 0.25 ounce sticks
Exposure Scenario Lifestage
Application Rate
(mg/product)
Number of Products
Volume (V) (m3)
Hours of Exposure
(hr)
Airflow (Q) (m3/hr)
Useful Life (hrs) Acs (m2) IR (m3/hr)
Average Daily Dose (mg/kg/day)
Inhalation - Candles, Coils, Torches and Mats
Adult 7087 4 51 2.3 3960 4 11 0.64 0.032 3 <6 years 7087 4 51 2.5 3960 4 11 0.42 0.099 2 <3 years 7087 4 51 2.3 3960 4 11 0.37 0.106 1 <2 years 7087 4 51 2.3 3960 4 11 0.33 0.115
6 <12 months 7087 4 51 2.3 3960 4 11 0.23 0.079

Appendix B
U.S. EPA Office of Pesticide Programs – Standard Operating Procedures for Assessing Residential Pesticide Exposure A-11
Table AA-13: Residential Misting Systems Inhalation Lifestage Analysis Inhalation Exposure- One ounce spray nozzles
Exposure Scenario Lifestage
Application Rate
(oz/1000ft3)
Pulse Rate (spray/hr)
Volume (V) (m3)
Hours of Exposure (hr)
Airflow (Q) (m3/hr) Acs (m2) IR (m3/hr)
Average Daily Dose
(mg/kg/day) Inhalation - Outdoor Residential Misting System
Adult 1 1 91 2.3 5400 15 0.64 0.32 3 <6 years 1 1 91 2.5 5400 15 0.42 0.99 2 <3 years 1 1 91 2.3 5400 15 0.37 1.08 1 <2 years 1 1 91 2.3 5400 15 0.33 1.2
6 <12 months 1 1 91 2.3 5400 15 0.23 1.01
Table AA-14: Animal Barn Misting Systems Inhalation Lifestage Analysis a Inhalation Exposure- One ounce spray nozzles
Exposure Scenario Lifestage Application Rate (oz/1000ft3)
Pulse Rate (spray/hr) ACH Hours of Exposure
(hr) IR (m3/hr) Average Daily Dose (mg/kg/day)
Inhalation - Animal Barn
Adult 1 1 4 4 0.64 8.4 11<16 group 1 1 4 2 0.63 5.8 6 <11 years 1 1 4 2 0.50 8.2 3 <6 years 1 1 4 2 0.42 11.8 2 <3 years 1 1 4 2 0.37 13.9 1 <2 years 1 1 4 2 0.33 15.1
6 <12 months 1 1 4 2 0.23 13.1 a. The 6 < 12 month old, the 1 < 2 year old, and the 2 < 3 year old lifestages are not expected to be present in horse or animal barns for any significant length of time. For this scenario, HED
believes that the 3 < 6 year old lifestage is the youngest lifestage viable for the exposure scenario and the younger lifestages will not be assessed. However, the other lifestages have been included here for illustrative purposes.
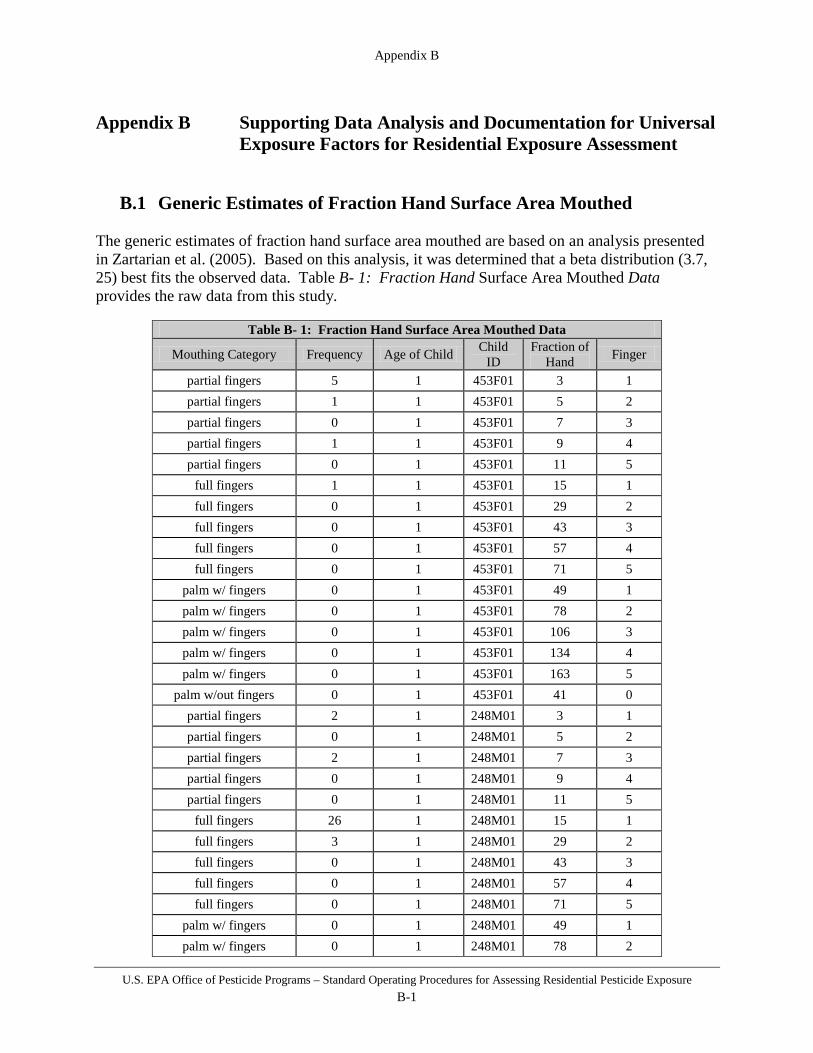
Appendix B
U.S. EPA Office of Pesticide Programs – Standard Operating Procedures for Assessing Residential Pesticide Exposure B-1
Appendix B Supporting Data Analysis and Documentation for Universal Exposure Factors for Residential Exposure Assessment
B.1 Generic Estimates of Fraction Hand Surface Area Mouthed The generic estimates of fraction hand surface area mouthed are based on an analysis presented in Zartarian et al. (2005). Based on this analysis, it was determined that a beta distribution (3.7, 25) best fits the observed data. Table B- 1: Fraction Hand Surface Area Mouthed Data provides the raw data from this study.
Table B- 1: Fraction Hand Surface Area Mouthed Data
Mouthing Category Frequency Age of Child Child ID
Fraction of Hand Finger
partial fingers 5 1 453F01 3 1 partial fingers 1 1 453F01 5 2 partial fingers 0 1 453F01 7 3 partial fingers 1 1 453F01 9 4 partial fingers 0 1 453F01 11 5
full fingers 1 1 453F01 15 1 full fingers 0 1 453F01 29 2 full fingers 0 1 453F01 43 3 full fingers 0 1 453F01 57 4 full fingers 0 1 453F01 71 5
palm w/ fingers 0 1 453F01 49 1 palm w/ fingers 0 1 453F01 78 2 palm w/ fingers 0 1 453F01 106 3 palm w/ fingers 0 1 453F01 134 4 palm w/ fingers 0 1 453F01 163 5
palm w/out fingers 0 1 453F01 41 0 partial fingers 2 1 248M01 3 1 partial fingers 0 1 248M01 5 2 partial fingers 2 1 248M01 7 3 partial fingers 0 1 248M01 9 4 partial fingers 0 1 248M01 11 5
full fingers 26 1 248M01 15 1 full fingers 3 1 248M01 29 2 full fingers 0 1 248M01 43 3 full fingers 0 1 248M01 57 4 full fingers 0 1 248M01 71 5
palm w/ fingers 0 1 248M01 49 1 palm w/ fingers 0 1 248M01 78 2
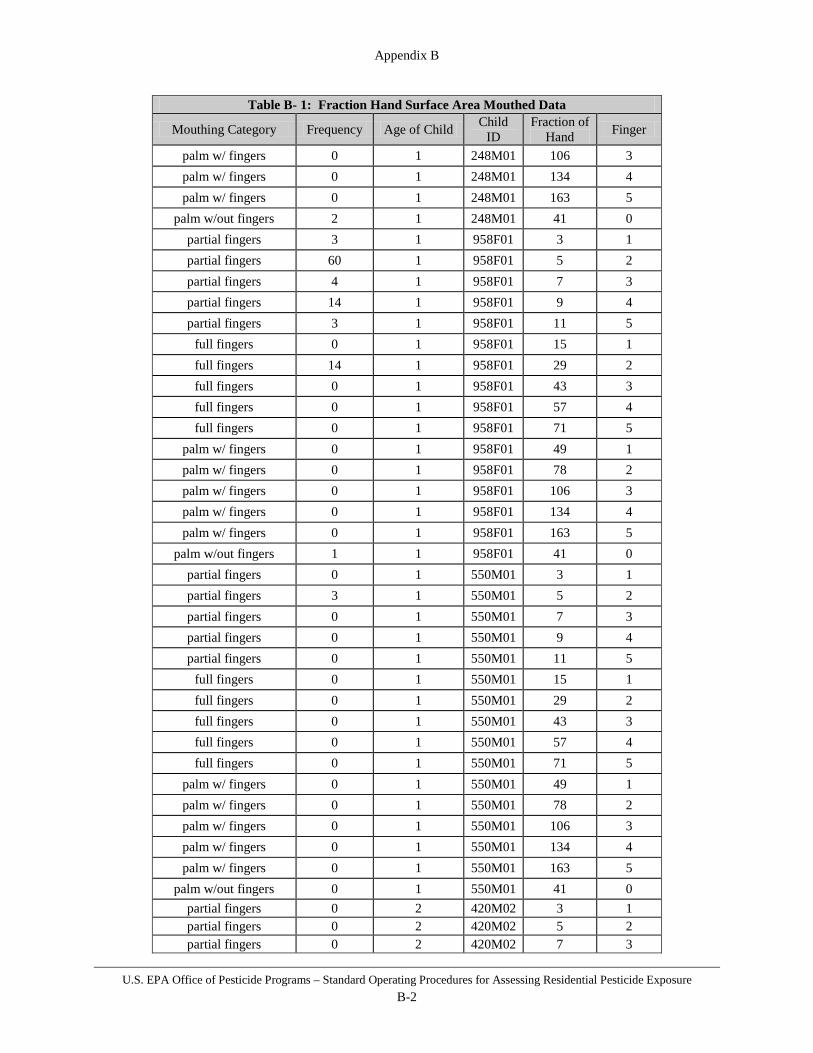
Appendix B
U.S. EPA Office of Pesticide Programs – Standard Operating Procedures for Assessing Residential Pesticide Exposure B-2
Table B- 1: Fraction Hand Surface Area Mouthed Data
Mouthing Category Frequency Age of Child Child ID
Fraction of Hand Finger
palm w/ fingers 0 1 248M01 106 3 palm w/ fingers 0 1 248M01 134 4 palm w/ fingers 0 1 248M01 163 5
palm w/out fingers 2 1 248M01 41 0 partial fingers 3 1 958F01 3 1 partial fingers 60 1 958F01 5 2 partial fingers 4 1 958F01 7 3 partial fingers 14 1 958F01 9 4 partial fingers 3 1 958F01 11 5
full fingers 0 1 958F01 15 1 full fingers 14 1 958F01 29 2 full fingers 0 1 958F01 43 3 full fingers 0 1 958F01 57 4 full fingers 0 1 958F01 71 5
palm w/ fingers 0 1 958F01 49 1 palm w/ fingers 0 1 958F01 78 2 palm w/ fingers 0 1 958F01 106 3 palm w/ fingers 0 1 958F01 134 4 palm w/ fingers 0 1 958F01 163 5
palm w/out fingers 1 1 958F01 41 0 partial fingers 0 1 550M01 3 1 partial fingers 3 1 550M01 5 2 partial fingers 0 1 550M01 7 3 partial fingers 0 1 550M01 9 4 partial fingers 0 1 550M01 11 5
full fingers 0 1 550M01 15 1 full fingers 0 1 550M01 29 2 full fingers 0 1 550M01 43 3 full fingers 0 1 550M01 57 4 full fingers 0 1 550M01 71 5
palm w/ fingers 0 1 550M01 49 1 palm w/ fingers 0 1 550M01 78 2 palm w/ fingers 0 1 550M01 106 3 palm w/ fingers 0 1 550M01 134 4 palm w/ fingers 0 1 550M01 163 5
palm w/out fingers 0 1 550M01 41 0 partial fingers 0 2 420M02 3 1 partial fingers 0 2 420M02 5 2 partial fingers 0 2 420M02 7 3

Appendix B
U.S. EPA Office of Pesticide Programs – Standard Operating Procedures for Assessing Residential Pesticide Exposure B-3
Table B- 1: Fraction Hand Surface Area Mouthed Data
Mouthing Category Frequency Age of Child Child ID
Fraction of Hand Finger
partial fingers 0 2 420M02 9 4 partial fingers 0 2 420M02 11 5
full fingers 0 2 420M02 15 1 full fingers 0 2 420M02 29 2 full fingers 0 2 420M02 43 3 full fingers 0 2 420M02 57 4 full fingers 0 2 420M02 71 5
palm w/ fingers 0 2 420M02 49 1 palm w/ fingers 0 2 420M02 78 2 palm w/ fingers 0 2 420M02 106 3 palm w/ fingers 0 2 420M02 134 4 palm w/ fingers 0 2 420M02 163 5
palm w/out fingers 0 2 420M02 41 0 partial fingers 2 2 638F02 3 1 partial fingers 1 2 638F02 5 2 partial fingers 0 2 638F02 7 3 partial fingers 1 2 638F02 9 4 partial fingers 0 2 638F02 11 5
full fingers 0 2 638F02 15 1 full fingers 0 2 638F02 29 2 full fingers 0 2 638F02 43 3 full fingers 0 2 638F02 57 4 full fingers 0 2 638F02 71 5
palm w/ fingers 0 2 638F02 49 1 palm w/ fingers 0 2 638F02 78 2 palm w/ fingers 0 2 638F02 106 3 palm w/ fingers 0 2 638F02 134 4 palm w/ fingers 0 2 638F02 163 5
palm w/out fingers 0 2 638F02 41 0 partial fingers 0 2 587F02 3 1 partial fingers 0 2 587F02 5 2 partial fingers 1 2 587F02 7 3 partial fingers 0 2 587F02 9 4 partial fingers 0 2 587F02 11 5
full fingers 6 2 587F02 15 1 full fingers 0 2 587F02 29 2 full fingers 0 2 587F02 43 3 full fingers 0 2 587F02 57 4 full fingers 0 2 587F02 71 5
palm w/ fingers 0 2 587F02 49 1 palm w/ fingers 0 2 587F02 78 2 palm w/ fingers 0 2 587F02 106 3 palm w/ fingers 0 2 587F02 134 4 palm w/ fingers 0 2 587F02 163 5
palm w/out fingers 1 2 587F02 41 0
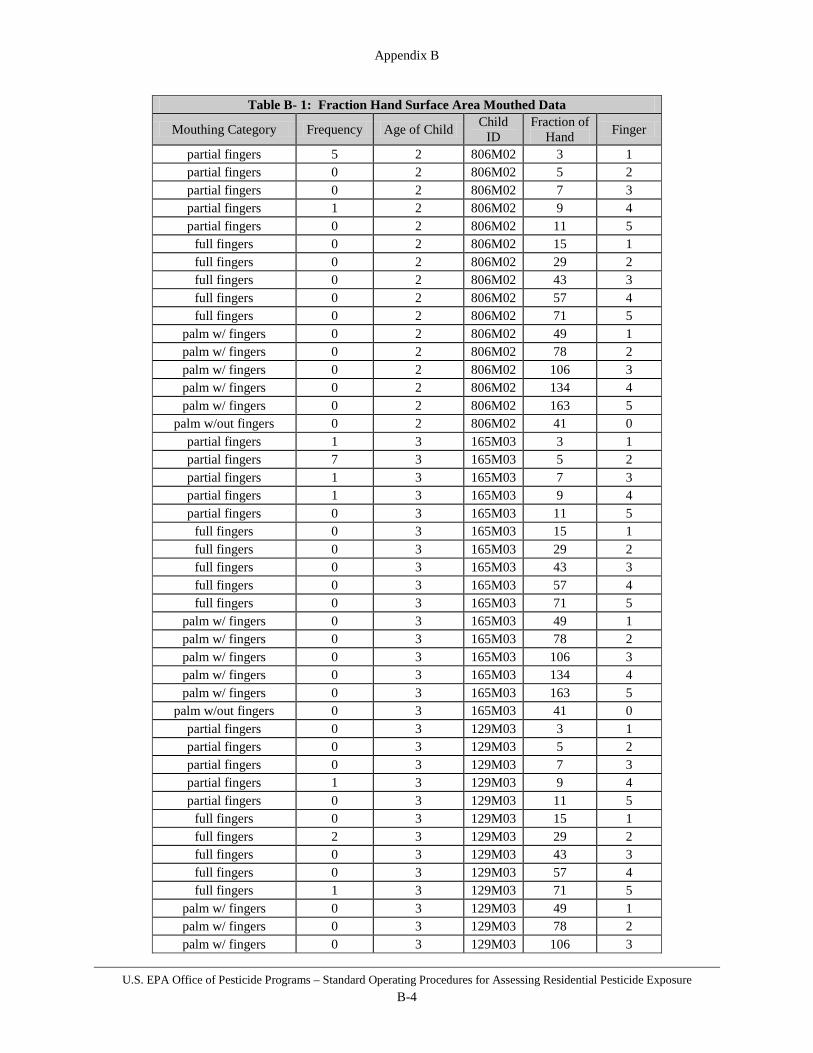
Appendix B
U.S. EPA Office of Pesticide Programs – Standard Operating Procedures for Assessing Residential Pesticide Exposure B-4
Table B- 1: Fraction Hand Surface Area Mouthed Data
Mouthing Category Frequency Age of Child Child ID
Fraction of Hand Finger
partial fingers 5 2 806M02 3 1 partial fingers 0 2 806M02 5 2 partial fingers 0 2 806M02 7 3 partial fingers 1 2 806M02 9 4 partial fingers 0 2 806M02 11 5
full fingers 0 2 806M02 15 1 full fingers 0 2 806M02 29 2 full fingers 0 2 806M02 43 3 full fingers 0 2 806M02 57 4 full fingers 0 2 806M02 71 5
palm w/ fingers 0 2 806M02 49 1 palm w/ fingers 0 2 806M02 78 2 palm w/ fingers 0 2 806M02 106 3 palm w/ fingers 0 2 806M02 134 4 palm w/ fingers 0 2 806M02 163 5
palm w/out fingers 0 2 806M02 41 0 partial fingers 1 3 165M03 3 1 partial fingers 7 3 165M03 5 2 partial fingers 1 3 165M03 7 3 partial fingers 1 3 165M03 9 4 partial fingers 0 3 165M03 11 5
full fingers 0 3 165M03 15 1 full fingers 0 3 165M03 29 2 full fingers 0 3 165M03 43 3 full fingers 0 3 165M03 57 4 full fingers 0 3 165M03 71 5
palm w/ fingers 0 3 165M03 49 1 palm w/ fingers 0 3 165M03 78 2 palm w/ fingers 0 3 165M03 106 3 palm w/ fingers 0 3 165M03 134 4 palm w/ fingers 0 3 165M03 163 5
palm w/out fingers 0 3 165M03 41 0 partial fingers 0 3 129M03 3 1 partial fingers 0 3 129M03 5 2 partial fingers 0 3 129M03 7 3 partial fingers 1 3 129M03 9 4 partial fingers 0 3 129M03 11 5
full fingers 0 3 129M03 15 1 full fingers 2 3 129M03 29 2 full fingers 0 3 129M03 43 3 full fingers 0 3 129M03 57 4 full fingers 1 3 129M03 71 5
palm w/ fingers 0 3 129M03 49 1 palm w/ fingers 0 3 129M03 78 2 palm w/ fingers 0 3 129M03 106 3
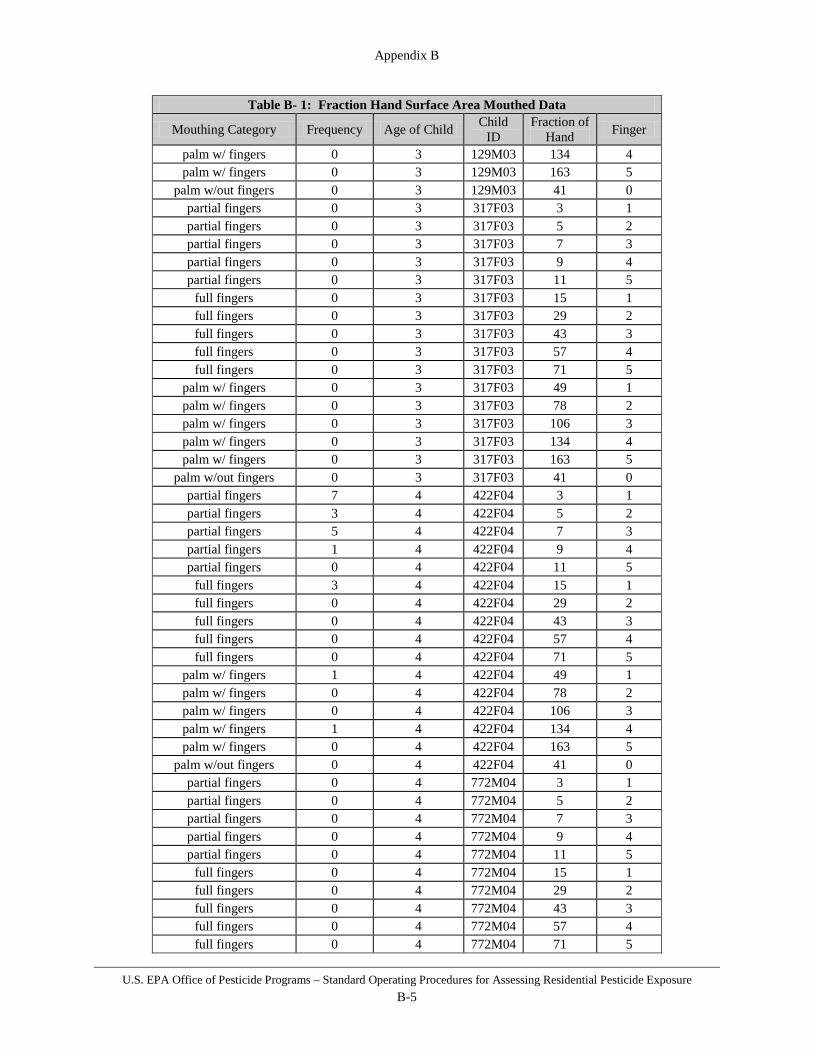
Appendix B
U.S. EPA Office of Pesticide Programs – Standard Operating Procedures for Assessing Residential Pesticide Exposure B-5
Table B- 1: Fraction Hand Surface Area Mouthed Data
Mouthing Category Frequency Age of Child Child ID
Fraction of Hand Finger
palm w/ fingers 0 3 129M03 134 4 palm w/ fingers 0 3 129M03 163 5
palm w/out fingers 0 3 129M03 41 0 partial fingers 0 3 317F03 3 1 partial fingers 0 3 317F03 5 2 partial fingers 0 3 317F03 7 3 partial fingers 0 3 317F03 9 4 partial fingers 0 3 317F03 11 5
full fingers 0 3 317F03 15 1 full fingers 0 3 317F03 29 2 full fingers 0 3 317F03 43 3 full fingers 0 3 317F03 57 4 full fingers 0 3 317F03 71 5
palm w/ fingers 0 3 317F03 49 1 palm w/ fingers 0 3 317F03 78 2 palm w/ fingers 0 3 317F03 106 3 palm w/ fingers 0 3 317F03 134 4 palm w/ fingers 0 3 317F03 163 5
palm w/out fingers 0 3 317F03 41 0 partial fingers 7 4 422F04 3 1 partial fingers 3 4 422F04 5 2 partial fingers 5 4 422F04 7 3 partial fingers 1 4 422F04 9 4 partial fingers 0 4 422F04 11 5
full fingers 3 4 422F04 15 1 full fingers 0 4 422F04 29 2 full fingers 0 4 422F04 43 3 full fingers 0 4 422F04 57 4 full fingers 0 4 422F04 71 5
palm w/ fingers 1 4 422F04 49 1 palm w/ fingers 0 4 422F04 78 2 palm w/ fingers 0 4 422F04 106 3 palm w/ fingers 1 4 422F04 134 4 palm w/ fingers 0 4 422F04 163 5
palm w/out fingers 0 4 422F04 41 0 partial fingers 0 4 772M04 3 1 partial fingers 0 4 772M04 5 2 partial fingers 0 4 772M04 7 3 partial fingers 0 4 772M04 9 4 partial fingers 0 4 772M04 11 5
full fingers 0 4 772M04 15 1 full fingers 0 4 772M04 29 2 full fingers 0 4 772M04 43 3 full fingers 0 4 772M04 57 4 full fingers 0 4 772M04 71 5
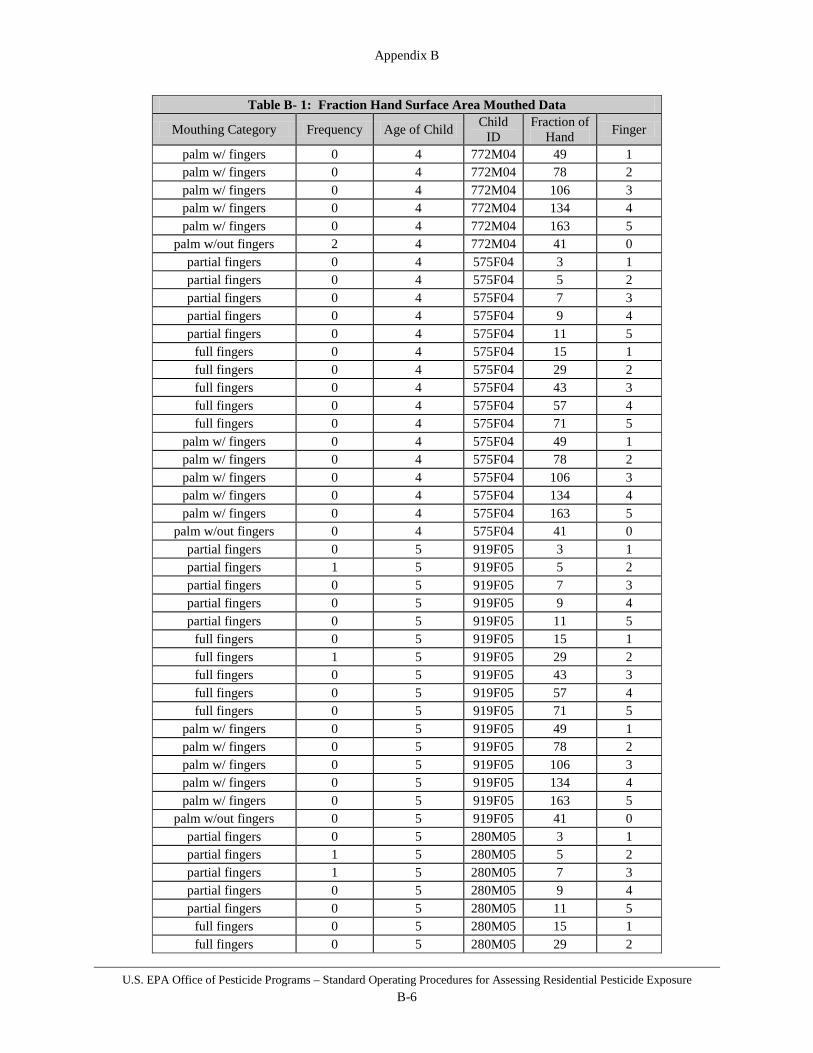
Appendix B
U.S. EPA Office of Pesticide Programs – Standard Operating Procedures for Assessing Residential Pesticide Exposure B-6
Table B- 1: Fraction Hand Surface Area Mouthed Data
Mouthing Category Frequency Age of Child Child ID
Fraction of Hand Finger
palm w/ fingers 0 4 772M04 49 1 palm w/ fingers 0 4 772M04 78 2 palm w/ fingers 0 4 772M04 106 3 palm w/ fingers 0 4 772M04 134 4 palm w/ fingers 0 4 772M04 163 5
palm w/out fingers 2 4 772M04 41 0 partial fingers 0 4 575F04 3 1 partial fingers 0 4 575F04 5 2 partial fingers 0 4 575F04 7 3 partial fingers 0 4 575F04 9 4 partial fingers 0 4 575F04 11 5
full fingers 0 4 575F04 15 1 full fingers 0 4 575F04 29 2 full fingers 0 4 575F04 43 3 full fingers 0 4 575F04 57 4 full fingers 0 4 575F04 71 5
palm w/ fingers 0 4 575F04 49 1 palm w/ fingers 0 4 575F04 78 2 palm w/ fingers 0 4 575F04 106 3 palm w/ fingers 0 4 575F04 134 4 palm w/ fingers 0 4 575F04 163 5
palm w/out fingers 0 4 575F04 41 0 partial fingers 0 5 919F05 3 1 partial fingers 1 5 919F05 5 2 partial fingers 0 5 919F05 7 3 partial fingers 0 5 919F05 9 4 partial fingers 0 5 919F05 11 5
full fingers 0 5 919F05 15 1 full fingers 1 5 919F05 29 2 full fingers 0 5 919F05 43 3 full fingers 0 5 919F05 57 4 full fingers 0 5 919F05 71 5
palm w/ fingers 0 5 919F05 49 1 palm w/ fingers 0 5 919F05 78 2 palm w/ fingers 0 5 919F05 106 3 palm w/ fingers 0 5 919F05 134 4 palm w/ fingers 0 5 919F05 163 5
palm w/out fingers 0 5 919F05 41 0 partial fingers 0 5 280M05 3 1 partial fingers 1 5 280M05 5 2 partial fingers 1 5 280M05 7 3 partial fingers 0 5 280M05 9 4 partial fingers 0 5 280M05 11 5
full fingers 0 5 280M05 15 1 full fingers 0 5 280M05 29 2
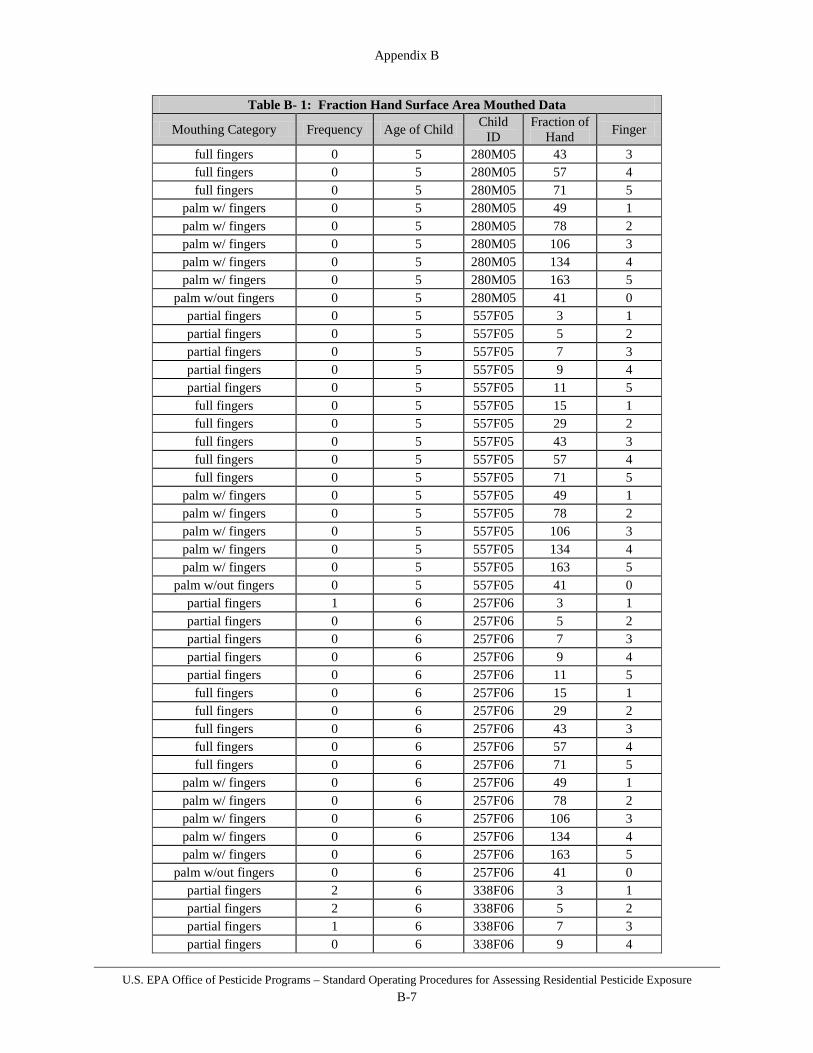
Appendix B
U.S. EPA Office of Pesticide Programs – Standard Operating Procedures for Assessing Residential Pesticide Exposure B-7
Table B- 1: Fraction Hand Surface Area Mouthed Data
Mouthing Category Frequency Age of Child Child ID
Fraction of Hand Finger
full fingers 0 5 280M05 43 3 full fingers 0 5 280M05 57 4 full fingers 0 5 280M05 71 5
palm w/ fingers 0 5 280M05 49 1 palm w/ fingers 0 5 280M05 78 2 palm w/ fingers 0 5 280M05 106 3 palm w/ fingers 0 5 280M05 134 4 palm w/ fingers 0 5 280M05 163 5
palm w/out fingers 0 5 280M05 41 0 partial fingers 0 5 557F05 3 1 partial fingers 0 5 557F05 5 2 partial fingers 0 5 557F05 7 3 partial fingers 0 5 557F05 9 4 partial fingers 0 5 557F05 11 5
full fingers 0 5 557F05 15 1 full fingers 0 5 557F05 29 2 full fingers 0 5 557F05 43 3 full fingers 0 5 557F05 57 4 full fingers 0 5 557F05 71 5
palm w/ fingers 0 5 557F05 49 1 palm w/ fingers 0 5 557F05 78 2 palm w/ fingers 0 5 557F05 106 3 palm w/ fingers 0 5 557F05 134 4 palm w/ fingers 0 5 557F05 163 5
palm w/out fingers 0 5 557F05 41 0 partial fingers 1 6 257F06 3 1 partial fingers 0 6 257F06 5 2 partial fingers 0 6 257F06 7 3 partial fingers 0 6 257F06 9 4 partial fingers 0 6 257F06 11 5
full fingers 0 6 257F06 15 1 full fingers 0 6 257F06 29 2 full fingers 0 6 257F06 43 3 full fingers 0 6 257F06 57 4 full fingers 0 6 257F06 71 5
palm w/ fingers 0 6 257F06 49 1 palm w/ fingers 0 6 257F06 78 2 palm w/ fingers 0 6 257F06 106 3 palm w/ fingers 0 6 257F06 134 4 palm w/ fingers 0 6 257F06 163 5
palm w/out fingers 0 6 257F06 41 0 partial fingers 2 6 338F06 3 1 partial fingers 2 6 338F06 5 2 partial fingers 1 6 338F06 7 3 partial fingers 0 6 338F06 9 4
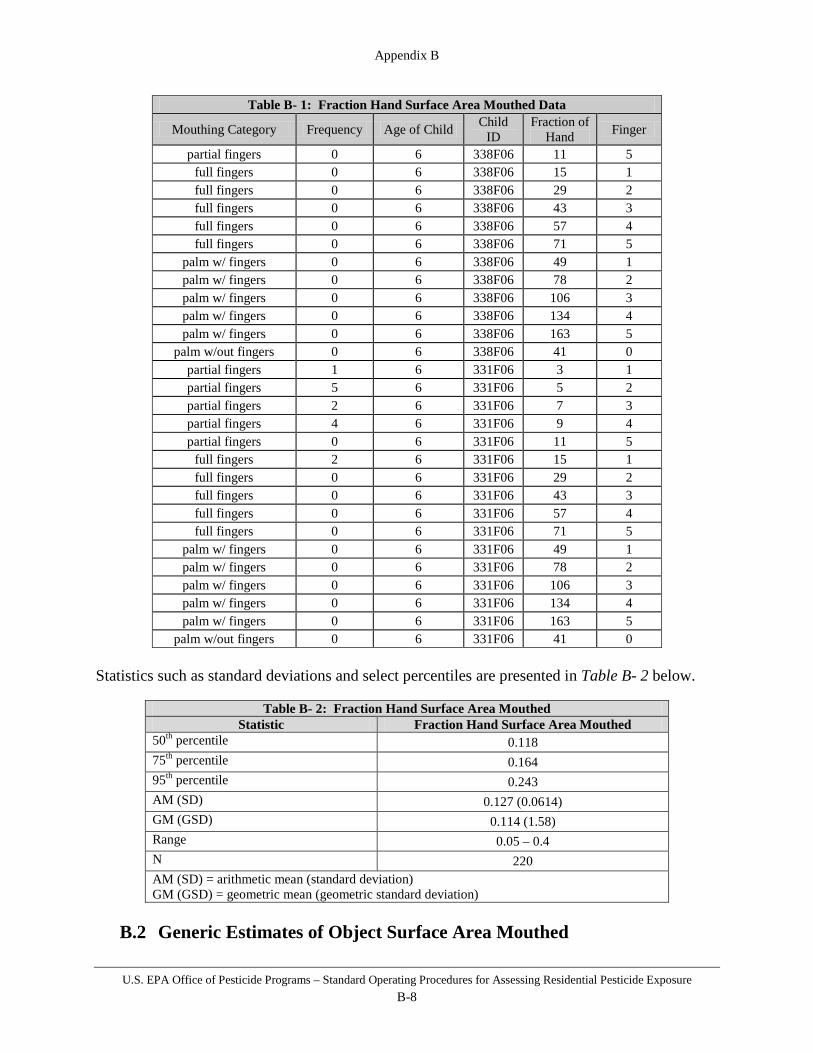
Appendix B
U.S. EPA Office of Pesticide Programs – Standard Operating Procedures for Assessing Residential Pesticide Exposure B-8
Table B- 1: Fraction Hand Surface Area Mouthed Data
Mouthing Category Frequency Age of Child Child ID
Fraction of Hand Finger
partial fingers 0 6 338F06 11 5 full fingers 0 6 338F06 15 1 full fingers 0 6 338F06 29 2 full fingers 0 6 338F06 43 3 full fingers 0 6 338F06 57 4 full fingers 0 6 338F06 71 5
palm w/ fingers 0 6 338F06 49 1 palm w/ fingers 0 6 338F06 78 2 palm w/ fingers 0 6 338F06 106 3 palm w/ fingers 0 6 338F06 134 4 palm w/ fingers 0 6 338F06 163 5
palm w/out fingers 0 6 338F06 41 0 partial fingers 1 6 331F06 3 1 partial fingers 5 6 331F06 5 2 partial fingers 2 6 331F06 7 3 partial fingers 4 6 331F06 9 4 partial fingers 0 6 331F06 11 5
full fingers 2 6 331F06 15 1 full fingers 0 6 331F06 29 2 full fingers 0 6 331F06 43 3 full fingers 0 6 331F06 57 4 full fingers 0 6 331F06 71 5
palm w/ fingers 0 6 331F06 49 1 palm w/ fingers 0 6 331F06 78 2 palm w/ fingers 0 6 331F06 106 3 palm w/ fingers 0 6 331F06 134 4 palm w/ fingers 0 6 331F06 163 5
palm w/out fingers 0 6 331F06 41 0 Statistics such as standard deviations and select percentiles are presented in Table B- 2 below.
Table B- 2: Fraction Hand Surface Area Mouthed Statistic Fraction Hand Surface Area Mouthed
50th percentile 0.118 75th percentile 0.164 95th percentile 0.243 AM (SD) 0.127 (0.0614) GM (GSD) 0.114 (1.58) Range 0.05 – 0.4 N 220 AM (SD) = arithmetic mean (standard deviation) GM (GSD) = geometric mean (geometric standard deviation)
B.2 Generic Estimates of Object Surface Area Mouthed

Appendix B
U.S. EPA Office of Pesticide Programs – Standard Operating Procedures for Assessing Residential Pesticide Exposure B-9
A factor used in object-to-mouth post-application assessments is the surface area of the object that a child puts in its mouth. This value (expressed in cm2) is utilized in a number of the SOPs in this document. Based on the area of hand mouthed by 2-5 years old as reported by Leckie et al. (2000), and the assumption that children mouth a smaller area of an object than their hand, an exponential distribution with a minimum of 1 cm2, a mean of 10 cm2, and a maximum of 50 cm2 was chosen. The maximum is comparable to the surface area of a ping-pong ball. Figure B-1 presents the Monte Carlo simulation based on the distribution derived from Leckie et al. (2000).
Figure B-1: Monte Carlo Simulation for Object Surface Area Mouthed (cm2) Assuming an Exponential Distribution (Minimum= 1 cm2, Mean= 10 cm2, Maximim= 50 cm2)
B.3 Generic Estimates of Fraction of Pesticide Extracted by Saliva
The fraction of pesticide extracted by saliva is an important variable for hand-to-mouth and object-to-mouth post-application exposure assessments. The fraction of pesticide extracted by saliva has historically been referred to as the saliva extraction factor or mouthing removal efficiency. It is used in hand-to-mouth and object-to-mouth assessments to account for removal of pesticides from hands or objects via saliva. Data to adequately characterize the fraction of pesticide extracted by saliva are limited and difficult to collect. However, one study, Camann et al. (1996), is available to determine generic values for the fraction of pesticide extracted by saliva. The Camann et al. study examined the removal efficiencies from hands with gauze moistened with artificial and human saliva. This activity was meant to simulate removal of pesticides resulting from placement of a hand into the mouth. Only the data collected with human saliva are presented here. Triplicate samples were collected three times for three different pesticides (chlorpyrifos, pyrethrin, and PBO). This resulted in a total of twenty-seven samples (nine for each pesticide). All data were compiled and it was determined that the distribution of saliva extraction values was best approximated by a beta distribution (α = 7.0, β = 7.6). Table B- 3 provides the raw data for the study. Following this table, Figure B-2 provides a comparison of
Frequency Chart
.000
.010
.020
.029
.039
0
98
196
294
392
0.00 8.75 17.50 26.25 35.00
10,000 Trials 256 Outliers
Forecast: Object Surface Area Mouthed

Appendix B
U.S. EPA Office of Pesticide Programs – Standard Operating Procedures for Assessing Residential Pesticide Exposure B-10
the recommended beta distribution and actual observed values and Figure B-3 provides the results of a Monte Carlo simulation using this distribution. Based on the recommended distribution, the summary statistics presented in Table B- 4 were derived for fraction of pesticide extracted by saliva. Note: This study focused specifically on fraction of pesticide extracted by saliva from hands; not objects. However, there are currently no data available to address the removal of residues from objects by saliva during mouthing events so this study is being used for both hands and objects.
Table B- 3: Fraction of Pesticide Extracted by Saliva Data
Subject Day Hand Amount
Transferred to Hand (ug)
Amount Removed by
Salivary Wipe (ug)
Salivary Wipe Efficiency
Chlorpyrifos
Subject A 1 RIGHT 5.58 2.01 0.360 Subject A 3 LEFT 6.63 2.13 0.321 Subject A 4 RIGHT 7.29 3.21 0.440 Subject B 2 LEFT 5.36 3.59 0.670 Subject B 3 RIGHT 6.47 3.16 0.488 Subject B 5 LEFT 4.7 2.74 0.583 Subject C 1 LEFT 7.46 3.75 0.503 Subject C 2 RIGHT 7.17 5.11 0.713 Subject C 4 LEFT 7.78 4.7 0.604
Pyrethrin
Subject A 1 RIGHT 24.8 10.6 0.427 Subject A 3 LEFT 26.8 10 0.373 Subject A 4 RIGHT 31.3 13.6 0.435 Subject B 2 LEFT 20.8 12.4 0.596 Subject B 3 RIGHT 26 15.5 0.596 Subject B 5 LEFT 19.4 9.6 0.495 Subject C: 1 LEFT 32.2 19 0.590 Subject C: 2 RIGHT 29.1 18.6 0.639 Subject C: 4 LEFT 33.3 18.2 0.547
PBO
Subject A 1 RIGHT 28.1 11.9 0.423 Subject A 3 LEFT 43.1 11.1 0.258 Subject A 4 RIGHT 53.3 15.1 0.283 Subject B 2 LEFT 20.5 10.7 0.522 Subject B 3 RIGHT 40.4 8.9 0.220 Subject B 5 LEFT 19.6 10.8 0.551 Subject C 1 LEFT 51.2 22.6 0.441 Subject C 2 RIGHT 51.9 31.1 0.599 Subject C 4 LEFT 58.7 21.1 0.359

Appendix B
U.S. EPA Office of Pesticide Programs – Standard Operating Procedures for Assessing Residential Pesticide Exposure B-11
Figure B-2: Comparison of the Recommended Beta Distribution (α = 7.0, β = 7.6) and the observed data points from Camann et al. (1995).
Figure B-3: Monte Carlo Simulation for Fraction of Pesticide Extracted by Saliva Using a Beta Distribution (α = 7.0, β = 7.6)
Frequency Chart
.000
.007
.013
.020
.026
0
66
132
198
264
0.10 0.30 0.50 0.70 0.90
10,000 Trials 2 Outliers
Forecast: Fraction of Pesticide Removed By Saliva

Appendix B
U.S. EPA Office of Pesticide Programs – Standard Operating Procedures for Assessing Residential Pesticide Exposure B-12
Table B- 4: Fraction of Pesticide Extracted by Saliva
Statistic Fraction of Pesticide Extracted by Saliva 50th percentile 0.50 75th percentile 0.57 90th percentile 0.64 95th percentile 0.68 99th percentile 0.80 Arithmetic Mean 0.48 Arithmetic Standard Deviation 0.13 Geometric Mean 0.46 Geometric Mean Standard Deviation 1.35

Appendix C
U.S. EPA Office of Pesticide Programs – Standard Operating Procedures for Assessing Residential Pesticide Exposure C-1
Appendix C Supporting Data Analysis and Documentation for Residential Handler Exposure Assessment
C.1 Summary of Exposure Data Used to Generate Residential Unit
Exposures Throughout the Residential SOPs, references are made to formulation- and application method-specific unit exposures for use in various handler exposure assessment scenarios. The following appendix provides summary information on the exposure studies that serve as the basis for those unit exposures. It includes: • Scenario summaries organized by formulation, equipment/application methods, and
application site(s); • References for all available studies that could potentially be used for residential exposure
assessment (note: for confidentiality reasons, PHED studies are referenced by their PHED code);
• Brief study descriptions; • Tables outlining relevant characteristics for each study with respect to its potential use in
residential handler exposure assessments; and, • Study-specific data summaries, including limitations and uncertainties.
Analytical commonalities for all studies include:
• Statistics for all exposure studies are based on fitting lognormal distributions. Given that environmental data routinely follow a lognormal distribution and many of the exposure studies display this trend, this is not an unreasonable assumption – including for scenarios based on small datasets or those that may not exhibit an exact match with a lognormal distribution with the data available;
• Lognormal probability plots are presented, providing a visual demonstration of the lognormal fit (or lack thereof) for the dataset. Additionally, plots that incorporate multiple datasets included study-specific coding (different shapes) to provide visual reference of the distribution of data points within studies and the studies within the overall distribution.
• Means and standard deviations are calculated using the minimum variance unbiased estimator for lognormal distributions:
o AM = GM *exp{0.5*((lnGSD)^2)}; o SD = AM * SQRT(exp((lnGSD)^2)-1); and o Where: AM = arithmetic mean; GM = geometric mean; GSD = geometric
standard deviation. • Unit exposures are representative of individuals wearing short-sleeve shirts; shorts,
shoes/socks, and no other protective equipment including chemical resistant gloves or respirators;
• Using ½ the limit of detection or limit of quantification for non-detect samples as is standard practice;

Appendix C
U.S. EPA Office of Pesticide Programs – Standard Operating Procedures for Assessing Residential Pesticide Exposure C-2
• 90% protection is assumed when back-calculating gloved hand exposure to bare hand exposure;
• 50% protection is assumed when back-calculating covered forearm and shin exposure to bare forearm and shin exposure;
• Corrections for field fortification recoveries as appropriate; and, • Using a breathing rate of 16.7 liters per minute, representing light activities (NAFTA-
CDPR, 1998), to extrapolate air samples to residential handler inhalation exposure. Note that the exposure studies recommended for use in residential handler exposure assessment inform only the default unit exposure data for each scenario and does not mean that a study not recommended for use cannot ever be used. Should a non-recommended study in this appendix be deemed useful given a unique situation, the assessment should provide justification for its use and deviation from the default data.
Table C-1: List of Handler Scenarios Formulation Equipment/Application
Method Application Site(s) Page
Number Granules Push-type Spreader outdoors (lawn, gardens) C-4
Belly grinder outdoors (lawn, gardens, trees/bushes, perimeter, mounds/nests, aquatic areas) C-11
Spoon outdoors (lawn, gardens, trees/bushes, perimeter, mounds/nests, aquatic areas) C-20
Cup outdoors (lawn, gardens, trees/bushes, perimeter, mounds/nests, aquatic areas) C-24
Hand dispersal outdoors (lawn, gardens, trees/bushes, perimeter, mounds/nests, aquatic areas) C-28
Dusts/Powders
Plunger duster outdoors (lawns, gardens, trees/bushes, perimeter, mounds/nests), indoors (general broadcast treatments)
C-32
Shaker can outdoors (lawns, gardens, trees/bushes, perimeter, mounds/nests), indoors (general broadcast treatments), pets/animals
C-36
Paints and Stains
Airless sprayer outdoors and indoors (general paint and stain applications) C-42
Brush outdoors and indoors (general paint and stain applications) C-48
Mothballs Hand placement cabinets, sheds, closets C-52
Liquids (emulsifiable concentrates, soluble concentrates, etc.)
Manually-pressurized handwand
outdoors (lawns, gardens, trees/bushes, perimeter, mounds/nests, aquatic areas), indoors (general broadcast treatments, baseboards, cracks and crevices)
C-56
Handheld Fogger outdoors (lawns, gardens, trees/bushes, perimeter, mounds/nests) C-68
Dipping pets/animals C-71 Sponge pets/animals C-75
Hose-end sprayer outdoors (lawns, gardens, trees/bushes, perimeter, mounds/nests, aquatic areas) C-79
Backpack sprayer outdoors (lawns, gardens, trees/bushes, perimeter, mounds/nests, aquatic areas) C-91
Ready-to-use (RTU)
Hose-end sprayer outdoors (lawns, gardens, trees/bushes, perimeter, mounds/nests, aquatic areas) C-107
Trigger-pump sprayer outdoors (lawns, gardens, trees/bushes, perimeter, C-113

Appendix C
U.S. EPA Office of Pesticide Programs – Standard Operating Procedures for Assessing Residential Pesticide Exposure C-3
mounds/nests, aquatic areas), indoors (plants, cracks and crevices), pets/animals
Shampoo pets/animals, children C-124 Spot-on pets/animals C-130
Aerosol can
outdoors (gardens, trees/bushes, perimeter, mounds/nests, aquatic areas), indoors (general broadcast treatments, baseboards, cracks and crevices), pets/animals
C-134
Wettable Powder (WP)
Manually-pressurized handwand
outdoors (lawns, gardens, trees/bushes, perimeter, mounds/nests, aquatic areas), indoors (general broadcast treatments, baseboards, cracks and crevices)
C-141
Backpack sprayer
outdoors (lawns, gardens, trees/bushes, perimeter, mounds/nests, aquatic areas), indoors (general broadcast treatments, baseboards, cracks and crevices)
C-148

Formulation: Granules Equipment/Application Method: Push-type Spreader
U.S. EPA Office of Pesticide Programs – Standard Operating Procedures for Assessing Residential Pesticide Exposure C-4
Scenario Summary
Table C-2: Scenario Description and Available Exposure Studies Formulation Granules Equipment/Application Method
Push-type Spreader (also: rotary spreader, cyclone spreader, “Scotts” spreader)
Application Site(s) Outdoors (lawn, gardens)
Available Exposure Studies Klonne, D. (1999); MRID 44972201 PHED 1027 Solomon, K. R., Harris, S. A, Stephenson, G. R. (1993)
Table C-3: Unit Exposures (mg/lb ai) – Granule Push-type Spreader Applications
Statistic Dermal Inhalation 50th percentile 0.66 0.0014 75th percentile 1.0 0.0029 95th percentile 1.9 0.0089 99th percentile 2.9 0.019 99.9th percentile 4.7 0.047 AM (SD) 0.81 (0.57) 0.0026 (0.0043) GM (GSD) 0.66 (1.9) 0.0014 (3.1) Range 0.25 – 7.0 0.00013 – 0.019 N 30 45
Dermal Unit Exposure Data Summary: The recommended dermal unit exposures for push-type spreader applications of granule pesticide formulations is based on a lognormal distribution fit with exposure monitoring data from Klonne, D. (1999) [EPA MRID 44972201]. This study monitored 30 applications of a granule formulation for approximately 20 minutes to approximately 10,000 square feet of turf in North Carolina using a rotary spreader. While other studies were available to potentially represent homeowner exposure potential, this study was the most reliable to represent the type of clothing a homeowner or amateur applicator would wear (i.e., shorts, short-sleeve shirt, no chemical-resistant gloves). Inhalation Unit Exposure Data Summary: The recommended inhalation unit exposures for push-type spreader applications of granule pesticide formulations is based on a lognormal distribution fit with exposure monitoring data from Klonne, D. (1999) [EPA MRID 44972201] and PHED 1027. Klonne, D. (1999) monitored 30 individuals while applying a granule formulation for approximately 20 minutes to approximately 10,000 square feet of turf in North Carolina using a rotary spreader. PHED 1027 monitored 15 applications of a granule formulation for approximately 30-40 minutes to turf in North Carolina using a push cyclone spreader. Since both available studies were accurate representations of homeowner or amatueur applicator inhalation exposure, and were generally of the same magnitude, they were combined and recommended for use as one dataset.
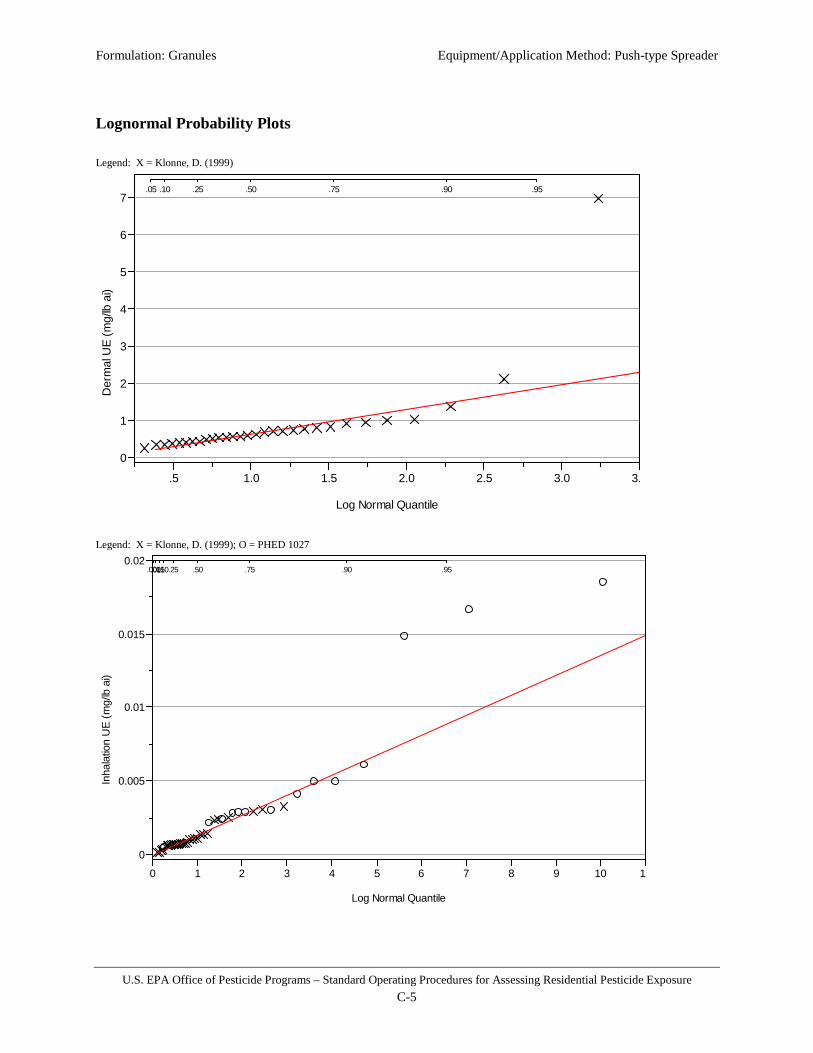
Formulation: Granules Equipment/Application Method: Push-type Spreader
U.S. EPA Office of Pesticide Programs – Standard Operating Procedures for Assessing Residential Pesticide Exposure C-5
Lognormal Probability Plots Legend: X = Klonne, D. (1999)
Legend: X = Klonne, D. (1999); O = PHED 1027
Der
mal
UE
(mg/
lb a
i)
0
1
2
3
4
5
6
7.05 .10 .25 .50 .75 .90 .95
.5 1.0 1.5 2.0 2.5 3.0 3.
Log Normal Quantile
Inha
latio
n U
E (m
g/lb
ai)
0
0.005
0.01
0.015
0.02.001.01.05.10.25 .50 .75 .90 .95
0 1 2 3 4 5 6 7 8 9 10 11
Log Normal Quantile

Formulation: Granules Equipment/Application Method: Push-type Spreader
U.S. EPA Office of Pesticide Programs – Standard Operating Procedures for Assessing Residential Pesticide Exposure C-6
Available Handler Exposure Studies
Table C-4: Study Identification Information
Citation
Klonne, D. (1999). Integrated Report on Evaluation of Potential Exposure to Homeowners and Professional Lawn Care Operators Mixing, Loading, and Applying Granular and Liquid Pesticides to Residential Lawns. Sponsor/Submitter: Outdoor Residential Exposure Task Force.
EPA MRID 449722201 ORETF Code OMA003
EPA Review D261948 EPA Memo from G. Bangs to D. Fuller (3/5/03)
MRID = Master Record Identification ORETF = Outdoor Residential Exposure Task Force
Study Description: A total of 30 individuals were monitored using passive dosimetry (inner and outer whole body dosimeters, hand washes, face/neck wipes, and personal inhalation monitors). Each test subject carried, loaded, and applied two 25-lb bags of a granule pesticide (a 0.89% dacthal, weed-and-feed fertilizer) with a rotary-type spreader to a lawn (a turf farm in North Carolina) covering 10,000 ft2 (one bag to each of the two 5000 ft2
test plots). The target application rate was approximately 2 lb ai/acre, with each individual handling approximately 0.45 lb of active ingredient. The average application time was 22 minutes, including loading the rotary push-spreader and disposing of empty bags. Dermal exposure was measured using inner and outer whole body dosimeters, hand washes, and face/neck washes, such that exposure could be constructed for various clothing scenarios (including a short-sleeve shirt and shorts). Inhalation exposure was measured using standard personal air monitoring devices set at 1.5 liters per minute. All fortified samples and field samples collected on the same study day were stored frozen and analyzed together, eliminating the need for storage stability determination. Seventy-seven percent (77%) of the face and neck washes were below the level of quantification (LOQ) for dacthal, and 10% of the air samples were also at or below the LOQ. Where results were less than the reported LOQ, ½ LOQ value was used for calculations, and no recovery corrections were applied. Lab spike recoveries for all matrices were in the range of 83-99%. Mean field fortification recoveries over the four study days for each fortification level ranged from 83 to 97%.
Table C-5: MRID 44972201 – Checklist and Use Recommendation
Study Criteria Exposure Component Dermal Inhalation
Does the study provide detailed characteristics on the activity, equipment type, and amount of active ingredient handled? Yes
Does dermal exposure monitoring allow for construction of an exposure estimate for individuals wearing short-sleeve shirts, shorts, shoes, socks? Yes NA
Was exposure to the hands representative of bare hands? Yes NA Was the study intended to simulate “residential” exposure via the scripted activity, amount of active ingredient handled, volunteers used, or the setting? Yes
Is the data of reasonable quality (i.e., are field fortification and laboratory recovery samples adequate)? Yes Yes
Should this study be recommended for use in residential handler exposure assessments? Yes Yes

Formulation: Granules Equipment/Application Method: Push-type Spreader
U.S. EPA Office of Pesticide Programs – Standard Operating Procedures for Assessing Residential Pesticide Exposure C-7
Data Summary: The following table summarizes pertinent exposure information from the above referenced study. Both dermal and inhalation exposure are included since both are recommended for use in residential handler exposure assessment. The submitted study itself or corresponding analytical spreadsheets should be reviewed for further information.
Table C-6: MRID 44972201 – Data Summary
Person ID AaiH1 (lbs)
Exposure (mg) Unit Exposure (mg/lb ai)4 Dermal2 Inhalation3 Dermal Inhalation
1 0.45 0.24 0.000058 0.53 0.00013 2 0.45 0.18 0.000311 0.39 0.00071 3 0.45 0.30 0.000449 0.67 0.00102 4 0.45 0.31 0.001113 0.69 0.00253 5 0.45 0.15 0.000056 0.33 0.00013 6 0.45 0.17 0.000278 0.37 0.00063 7 0.45 0.16 0.000286 0.36 0.00065 8 0.45 0.27 0.000585 0.60 0.00133 9 0.45 0.15 0.000298 0.34 0.00068 10 0.45 0.25 0.000564 0.56 0.00128 11 0.45 0.32 0.001048 0.71 0.00238 12 0.45 0.11 0.000242 0.25 0.00055 13 0.45 0.35 0.001436 0.79 0.00326 14 0.45 0.23 0.001324 0.51 0.00301 15 0.45 0.45 0.000601 1.00 0.00137 16 0.45 0.19 0.000311 0.41 0.00071 17 0.45 0.19 0.000289 0.43 0.00066 18 0.45 0.41 0.000438 0.92 0.00099 19 0.45 0.34 0.000423 0.76 0.00096 20 0.45 0.37 0.000334 0.83 0.00076 21 0.45 0.28 0.000253 0.62 0.00058 22 0.45 0.33 0.000115 0.73 0.00026 23 0.45 0.25 0.000251 0.55 0.00057 24 0.45 0.95 0.000461 2.10 0.00105 25 0.45 0.61 0.001290 1.36 0.00293 26 0.45 0.41 0.001025 0.91 0.00233 27 0.45 0.23 0.000265 0.52 0.00060 28 0.45 3.14 0.000322 6.98 0.00073 29 0.45 0.21 0.000276 0.46 0.00063 30 0.45 0.46 0.000138 1.02 0.00031
1 Amount of active ingredient Handled. 2 Representative of individuals wearing a short-sleeve shirt, shorts, shoes, socks and no chemical-resistant gloves. 3 Inhalation exposure (mg) = mg collected/pump flow rate (Lpm) * Breathing Rate (16.7 Lpm). 4 Unit Exposure = Exposure/AaiH.
Limitations: Though the above referenced study is useful for assessment of residential applications of granule pesticide formulations using a push-type spreader, the following limitations are noted:
• Each individual handled the same amount of active ingredient, making analysis of the relationship between exposure and the amount of active ingredient handled (the underlying basis of unit exposures) difficult.
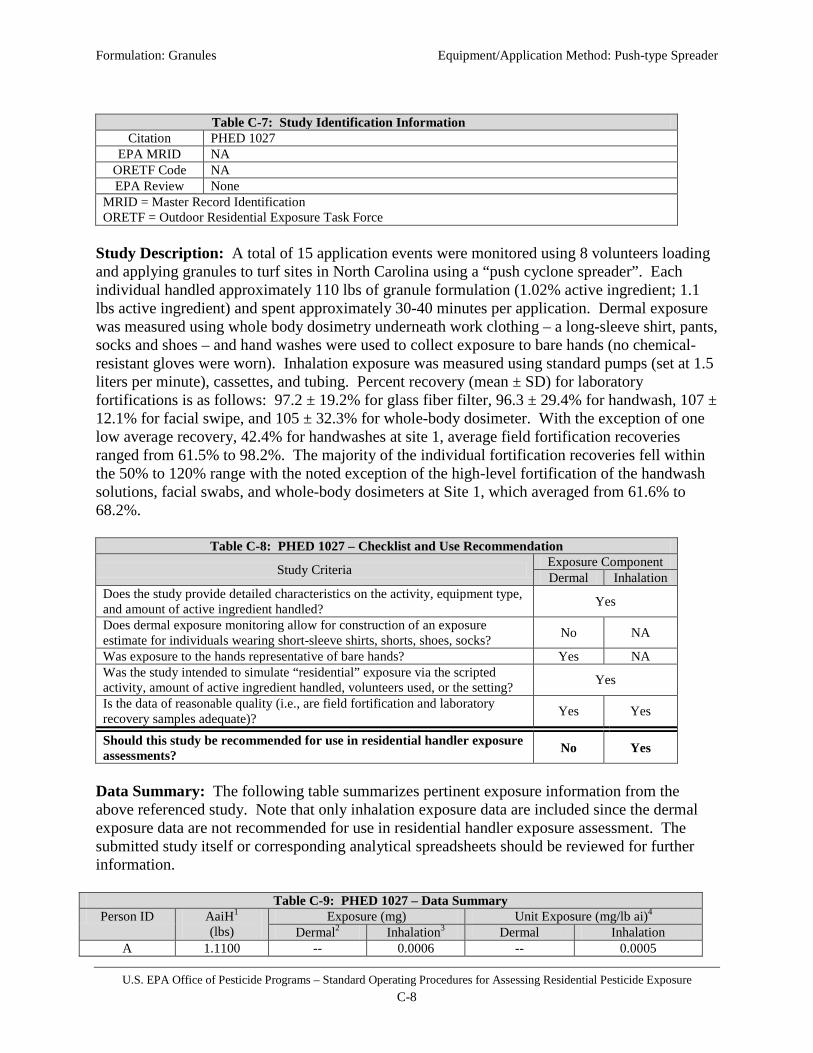
Formulation: Granules Equipment/Application Method: Push-type Spreader
U.S. EPA Office of Pesticide Programs – Standard Operating Procedures for Assessing Residential Pesticide Exposure C-8
Table C-7: Study Identification Information
Citation PHED 1027 EPA MRID NA
ORETF Code NA EPA Review None
MRID = Master Record Identification ORETF = Outdoor Residential Exposure Task Force
Study Description: A total of 15 application events were monitored using 8 volunteers loading and applying granules to turf sites in North Carolina using a “push cyclone spreader”. Each individual handled approximately 110 lbs of granule formulation (1.02% active ingredient; 1.1 lbs active ingredient) and spent approximately 30-40 minutes per application. Dermal exposure was measured using whole body dosimetry underneath work clothing – a long-sleeve shirt, pants, socks and shoes – and hand washes were used to collect exposure to bare hands (no chemical-resistant gloves were worn). Inhalation exposure was measured using standard pumps (set at 1.5 liters per minute), cassettes, and tubing. Percent recovery (mean ± SD) for laboratory fortifications is as follows: 97.2 ± 19.2% for glass fiber filter, 96.3 ± 29.4% for handwash, 107 ± 12.1% for facial swipe, and 105 ± 32.3% for whole-body dosimeter. With the exception of one low average recovery, 42.4% for handwashes at site 1, average field fortification recoveries ranged from 61.5% to 98.2%. The majority of the individual fortification recoveries fell within the 50% to 120% range with the noted exception of the high-level fortification of the handwash solutions, facial swabs, and whole-body dosimeters at Site 1, which averaged from 61.6% to 68.2%.
Table C-8: PHED 1027 – Checklist and Use Recommendation
Study Criteria Exposure Component Dermal Inhalation
Does the study provide detailed characteristics on the activity, equipment type, and amount of active ingredient handled? Yes
Does dermal exposure monitoring allow for construction of an exposure estimate for individuals wearing short-sleeve shirts, shorts, shoes, socks? No NA
Was exposure to the hands representative of bare hands? Yes NA Was the study intended to simulate “residential” exposure via the scripted activity, amount of active ingredient handled, volunteers used, or the setting? Yes
Is the data of reasonable quality (i.e., are field fortification and laboratory recovery samples adequate)? Yes Yes
Should this study be recommended for use in residential handler exposure assessments? No Yes
Data Summary: The following table summarizes pertinent exposure information from the above referenced study. Note that only inhalation exposure data are included since the dermal exposure data are not recommended for use in residential handler exposure assessment. The submitted study itself or corresponding analytical spreadsheets should be reviewed for further information.
Table C-9: PHED 1027 – Data Summary Person ID AaiH1
(lbs) Exposure (mg) Unit Exposure (mg/lb ai)4
Dermal2 Inhalation3 Dermal Inhalation A 1.1100 -- 0.0006 -- 0.0005

Formulation: Granules Equipment/Application Method: Push-type Spreader
U.S. EPA Office of Pesticide Programs – Standard Operating Procedures for Assessing Residential Pesticide Exposure C-9
Table C-9: PHED 1027 – Data Summary Person ID AaiH1
(lbs) Exposure (mg) Unit Exposure (mg/lb ai)4
Dermal2 Inhalation3 Dermal Inhalation A 1.1100 -- 0.0024 -- 0.0022 A 1.1100 -- 0.0032 -- 0.0029 A 1.1100 -- 0.0056 -- 0.0050 A 1.1100 -- 0.0046 -- 0.0041 A 1.1100 -- 0.0055 -- 0.0050 B 1.1100 -- 0.0206 -- 0.0186 B 1.1100 -- 0.0032 -- 0.0029 B 1.1100 -- 0.0032 -- 0.0028 B 1.1100 -- 0.0027 -- 0.0024 C 1.1100 -- 0.0068 -- 0.0061 C 1.1100 -- 0.0165 -- 0.0149 C 1.3900 -- 0.0042 -- 0.0030 C 1.3900 -- 0.0006 -- 0.0004 C 1.0500 -- 0.0175 -- 0.0167
1 Amount of active ingredient Handled. 2 Representative of individuals wearing a short-sleeve shirt, shorts, shoes, socks and no chemical-resistant gloves. 3 Inhalation exposure (mg) = mg collected/pump flow rate (Lpm) * Breathing Rate (16.7 Lpm). 4 Unit Exposure = Exposure/AaiH.
Limitations: Though the above referenced study is useful for assessment of residential applications of granule pesticide formulations using a push-type spreader, the following limitations are noted:
• Each individual handled practically the same amount of active ingredient, making analysis of the relationship between exposure and the amount of active ingredient handled (the underlying basis of unit exposures) difficult.
Table C-10: Study Identification Information
Citation Solomon, K. R., Harris, S. A, Stephenson, G. R. (1993). Applicator And Bystander Exposure To Home Garden And Landscape Pesticides. American Chemical Society, 1993, pp. 262-273
EPA MRID none ORETF Code NA EPA Review none
MRID = Master Record Identification ORETF = Outdoor Residential Exposure Task Force
Study Description: A total of 20 application events were monitored using volunteers loading and applying granules using a “drop spreader”. Eleven of the applications were conducted while wearing “protective” clothing, while 9 applications were conducted while wearing “normal” clothing. The exact nature of the clothing worn was not provided. Each individual handled approximately 0.3 – 2.6 lbs of 2, 4-D per application. Exposure was measured using biomonitoring with passive monitoring only conducted for inhalation exposure using standard pumps (set at 1 liter per minute), cassettes, and tubing. All except one inhalation exposure sample was a non-detect (limit of detection = 0.0001 µg/L). Recoveries from field fortifications of exposure sampling matrices were generally above 85% with little variation (standard deviation approximately 3%).

Formulation: Granules Equipment/Application Method: Push-type Spreader
U.S. EPA Office of Pesticide Programs – Standard Operating Procedures for Assessing Residential Pesticide Exposure C-10
Table C-11: Solomon, et al. (1993) – Checklist and Use Recommendation
Study Criteria Exposure Component Dermal Inhalation
Does the study provide detailed characteristics on the activity, equipment type, and amount of active ingredient handled? Yes
Does dermal exposure monitoring allow for construction of an exposure estimate for individuals wearing short-sleeve shirts, shorts, shoes, socks? No NA
Was exposure to the hands representative of bare hands? No NA Was the study intended to simulate “residential” exposure via the scripted activity, amount of active ingredient handled, volunteers used, or the setting? Yes
Is the data of reasonable quality (i.e., are field fortification and laboratory recovery samples adequate)? Yes Yes
Should this study be recommended for use in residential handler exposure assessments? No No
Data Summary: A summary of the data from this study is not provided since it is not recommended for use in residential handler exposure assessment. The submitted study itself should be reviewed for further information. Limitations: Any data limitations associated with the exposure data in this study are not provided since it is not recommended for use in residential handler exposure assessment. The submitted study itself should be reviewed for further information.

Formulation: Granules Equipment/Application Method: Belly Grinder
U.S. EPA Office of Pesticide Programs – Standard Operating Procedures for Assessing Residential Pesticide Exposure C-11
Scenario Summary
Table C-12: Scenario Description and Available Exposure Studies Formulation Granules Equipment/Application Method Belly grinder (also: hand cyclone spreader, whirly-bird spreader)
Application Site(s) outdoors (lawn, gardens, trees/bushes, perimeter, mounds/nests, aquatic areas)
Available Exposure Studies
PHED 1027 PHED 419 PHED 459 PHED 504 Spencer, et al. (1997)
Table C-13: Unit Exposures (mg/lb ai) – Granule Belly Grinder Applications
Statistic Dermal Inhalation 50th percentile 240 0.016 75th percentile 440 0.039 95th percentile 1100 0.142 99th percentile 2000 0.351 99.9th percentile 3900 0.966 AM (SD) 360 (405) 0.039 (0.085) GM (GSD) 240 (2.5) 0.016 (3.76) Range 49 – 992 0.0017 – 0.29 N 16 28
Dermal Unit Exposure Data Summary: The recommended dermal unit exposures for belly grinder applications of granule pesticide formulations is based on a lognormal distribution fit with exposure monitoring data from PHED 459. PHED 459 monitored 16 applications of a granule formulation foundations, patios, driveways, and sidewalks of houses using a “whirly-bird spreader”. While other available studies were reasonable representations of residential exposure, this study best represented a residential homeowner application while also providing a reliable representation of the type of clothing a homeowner or amateur applicator would wear (i.e., shorts, short-sleeve shirt, no chemical-resistant gloves). Inhalation Unit Exposure Data Summary: The recommended inhalation unit exposures for belly grinder applications of granule pesticide formulations is based on a lognormal distribution fit with exposure monitoring data from PHED 1027, PHED 419, and PHED 504. PHED 1027 monitored 15 applications of a granule formulation for approximately 30-40 minutes to turf in North Carolina using a hand cyclone spreader. PHED 419 monitored 5 applications of a granule formulation to approximately 2 acres of container ornamentals in California using chest-mounted application equipment. PHED 504 monitored 9 applications of a granule formulation for approximately 4 hours to approximately 1 acre of turf in Michigan using a “hand cyclone spreader”. These studies all provided a reasonable representation of residential exposure, including representing individuals without respiratory protection. As they were generally of similar magnitudes, the studies are utilized as a composite dataset.
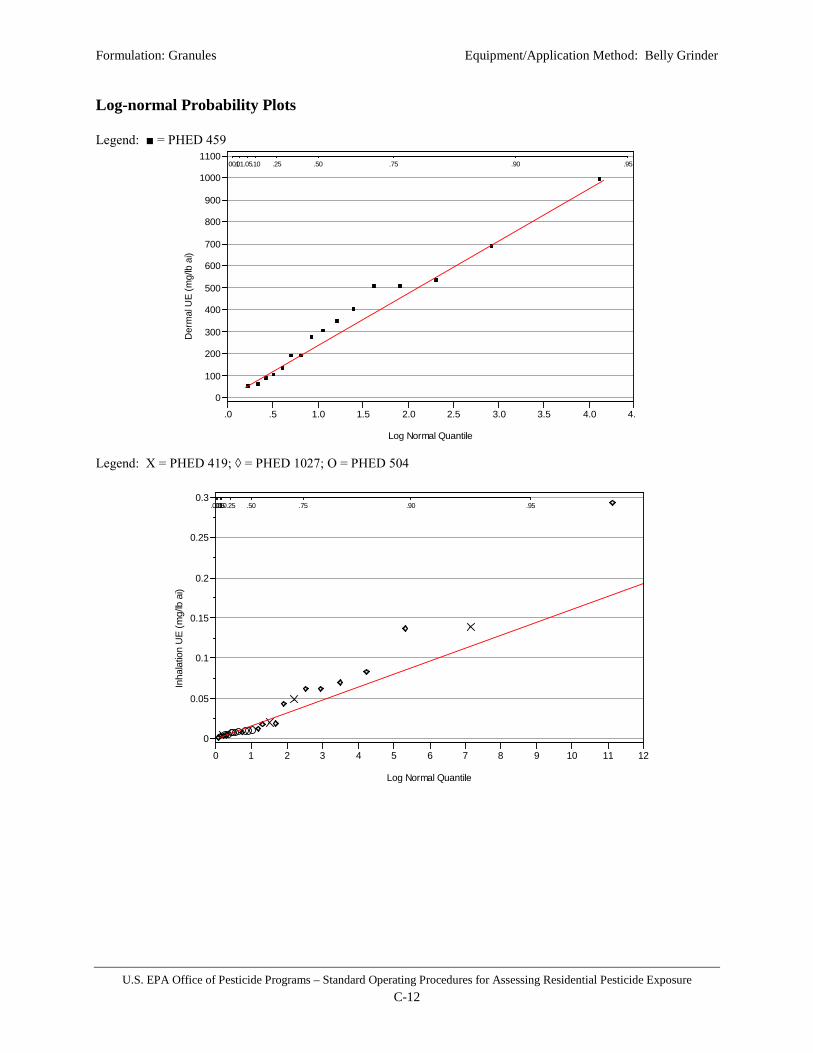
Formulation: Granules Equipment/Application Method: Belly Grinder
U.S. EPA Office of Pesticide Programs – Standard Operating Procedures for Assessing Residential Pesticide Exposure C-12
Log-normal Probability Plots Legend: ■ = PHED 459
Legend: X = PHED 419; ◊ = PHED 1027; O = PHED 504
Der
mal
UE
(mg/
lb a
i)
0
100
200
300
400
500
600
700
800
900
1000
1100.001.01.05.10 .25 .50 .75 .90 .95
.0 .5 1.0 1.5 2.0 2.5 3.0 3.5 4.0 4.
Log Normal Quantile
Inha
latio
n U
E (m
g/lb
ai)
0
0.05
0.1
0.15
0.2
0.25
0.3.001.01.05.10.25 .50 .75 .90 .95
0 1 2 3 4 5 6 7 8 9 10 11 12
Log Normal Quantile

Formulation: Granules Equipment/Application Method: Belly Grinder
U.S. EPA Office of Pesticide Programs – Standard Operating Procedures for Assessing Residential Pesticide Exposure C-13
Available Handler Exposure Studies
Table C-14: Exposure Study Identification Information Citation PHED 1027
EPA MRID NA ORETF Code NA EPA Review none
MRID = Master Record Identification ORETF = Outdoor Residential Exposure Task Force
Study Description: A total 15 application events were monitored using 8 volunteers loading and applying granules to turf sites in North Carolina using a “hand cyclone spreader” (i.e., a belly grinder). Each individual handled approximately 170 lbs granule formulation (1.02% active ingredient; 1.7 lbs active ingredient) and spent approximately 30-40 minutes per application. Dermal exposure monitoring represented an individual wearing a long-sleeve shirt, pants, shoes, socks, and no chemical-resistant gloves. Inhalation exposure was measured using standard pumps (set at 1.5 liters per minute), cassettes, and tubing. Percent recovery (mean ± SD) for laboratory fortifications is as follows: 97.2 ± 19.2% for glass fiber filter, 96.3 ± 29.4% for handwash, 107 ± 12.1% for facial swipe, and 105 ± 32.3% for whole-body dosimeter. With the exception of one low average recovery, 42.4% for handwashes at site 1, average field fortification recoveries ranged from 61.5% to 98.2%. The majority of the individual fortification recoveries fell within the 50% to 120% range with the noted exception of the high-level fortification of the handwash solutions, facial swabs, and whole-body dosimeters at Site 1, which averaged from 61.6% to 68.2%.
Table C-15: PHED 1027 – Checklist and Use Recommendation
Study Criteria Exposure Component Dermal Inhalation
Does the study provide detailed characteristics on the activity, equipment type, and amount of active ingredient handled? Yes
Does dermal exposure monitoring allow for construction of an exposure estimate for individuals wearing short-sleeve shirts, shorts, shoes, socks? No NA
Was exposure to the hands representative of bare hands? Yes NA Was the study intended to simulate “residential” exposure via the scripted activity, amount of active ingredient handled, volunteers used, or the setting? Yes
Is the data of reasonable quality (i.e., are field fortification and laboratory recovery samples adequate)? Yes Yes
Should this study be recommended for use in residential handler exposure assessments? No Yes
Data Summary: The following table summarizes pertinent exposure information from the above referenced study. Note that only inhalation exposure data are included since the dermal exposure data are not recommended for use in residential handler exposure assessment. The submitted study itself or corresponding analytical spreadsheets should be reviewed for further information.
Table C-16: PHED 1027 – Data Summary Person ID AaiH1
(lbs) Exposure (mg) Unit Exposure (mg/lb ai)4
Dermal2 Inhalation3 Dermal Inhalation D 1.84 -- 0.008 -- 0.0043
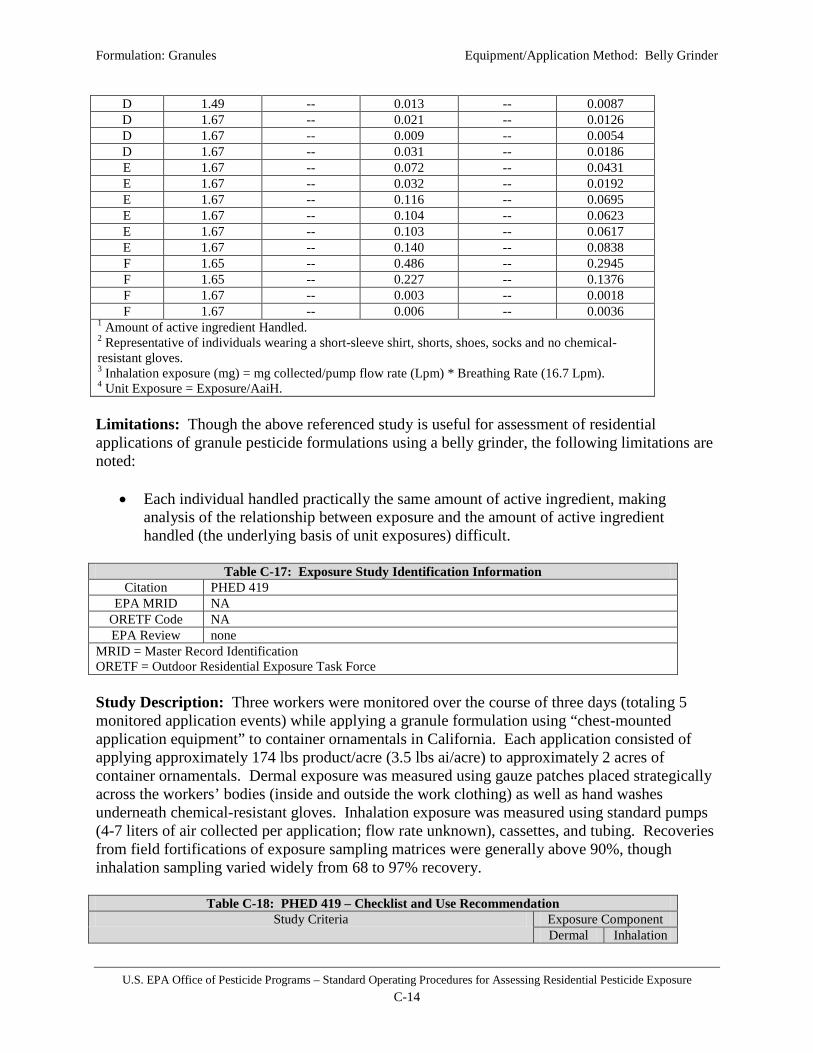
Formulation: Granules Equipment/Application Method: Belly Grinder
U.S. EPA Office of Pesticide Programs – Standard Operating Procedures for Assessing Residential Pesticide Exposure C-14
D 1.49 -- 0.013 -- 0.0087 D 1.67 -- 0.021 -- 0.0126 D 1.67 -- 0.009 -- 0.0054 D 1.67 -- 0.031 -- 0.0186 E 1.67 -- 0.072 -- 0.0431 E 1.67 -- 0.032 -- 0.0192 E 1.67 -- 0.116 -- 0.0695 E 1.67 -- 0.104 -- 0.0623 E 1.67 -- 0.103 -- 0.0617 E 1.67 -- 0.140 -- 0.0838 F 1.65 -- 0.486 -- 0.2945 F 1.65 -- 0.227 -- 0.1376 F 1.67 -- 0.003 -- 0.0018 F 1.67 -- 0.006 -- 0.0036
1 Amount of active ingredient Handled. 2 Representative of individuals wearing a short-sleeve shirt, shorts, shoes, socks and no chemical-resistant gloves. 3 Inhalation exposure (mg) = mg collected/pump flow rate (Lpm) * Breathing Rate (16.7 Lpm). 4 Unit Exposure = Exposure/AaiH. Limitations: Though the above referenced study is useful for assessment of residential applications of granule pesticide formulations using a belly grinder, the following limitations are noted:
• Each individual handled practically the same amount of active ingredient, making analysis of the relationship between exposure and the amount of active ingredient handled (the underlying basis of unit exposures) difficult.
Table C-17: Exposure Study Identification Information
Citation PHED 419 EPA MRID NA
ORETF Code NA EPA Review none
MRID = Master Record Identification ORETF = Outdoor Residential Exposure Task Force Study Description: Three workers were monitored over the course of three days (totaling 5 monitored application events) while applying a granule formulation using “chest-mounted application equipment” to container ornamentals in California. Each application consisted of applying approximately 174 lbs product/acre (3.5 lbs ai/acre) to approximately 2 acres of container ornamentals. Dermal exposure was measured using gauze patches placed strategically across the workers’ bodies (inside and outside the work clothing) as well as hand washes underneath chemical-resistant gloves. Inhalation exposure was measured using standard pumps (4-7 liters of air collected per application; flow rate unknown), cassettes, and tubing. Recoveries from field fortifications of exposure sampling matrices were generally above 90%, though inhalation sampling varied widely from 68 to 97% recovery.
Table C-18: PHED 419 – Checklist and Use Recommendation Study Criteria Exposure Component
Dermal Inhalation
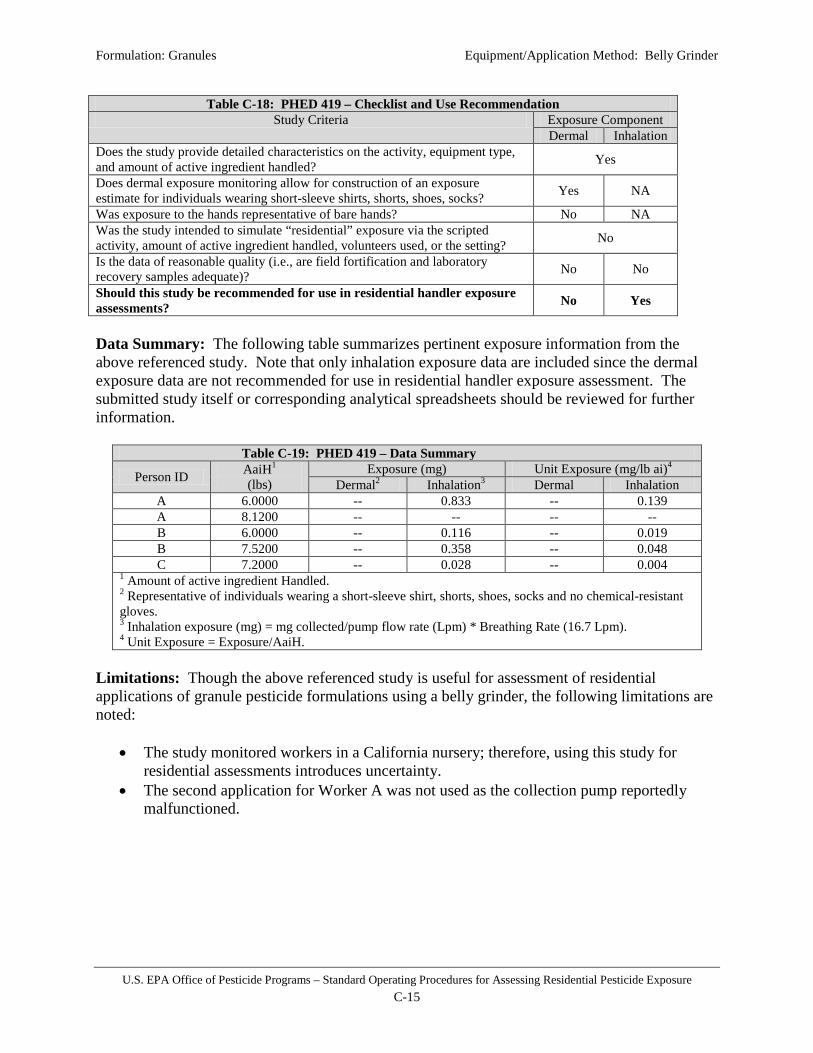
Formulation: Granules Equipment/Application Method: Belly Grinder
U.S. EPA Office of Pesticide Programs – Standard Operating Procedures for Assessing Residential Pesticide Exposure C-15
Table C-18: PHED 419 – Checklist and Use Recommendation Study Criteria Exposure Component
Dermal Inhalation Does the study provide detailed characteristics on the activity, equipment type, and amount of active ingredient handled? Yes
Does dermal exposure monitoring allow for construction of an exposure estimate for individuals wearing short-sleeve shirts, shorts, shoes, socks? Yes NA
Was exposure to the hands representative of bare hands? No NA Was the study intended to simulate “residential” exposure via the scripted activity, amount of active ingredient handled, volunteers used, or the setting? No
Is the data of reasonable quality (i.e., are field fortification and laboratory recovery samples adequate)? No No
Should this study be recommended for use in residential handler exposure assessments? No Yes
Data Summary: The following table summarizes pertinent exposure information from the above referenced study. Note that only inhalation exposure data are included since the dermal exposure data are not recommended for use in residential handler exposure assessment. The submitted study itself or corresponding analytical spreadsheets should be reviewed for further information.
Table C-19: PHED 419 – Data Summary
Person ID AaiH1 (lbs)
Exposure (mg) Unit Exposure (mg/lb ai)4 Dermal2 Inhalation3 Dermal Inhalation
A 6.0000 -- 0.833 -- 0.139 A 8.1200 -- -- -- -- B 6.0000 -- 0.116 -- 0.019 B 7.5200 -- 0.358 -- 0.048 C 7.2000 -- 0.028 -- 0.004
1 Amount of active ingredient Handled. 2 Representative of individuals wearing a short-sleeve shirt, shorts, shoes, socks and no chemical-resistant gloves. 3 Inhalation exposure (mg) = mg collected/pump flow rate (Lpm) * Breathing Rate (16.7 Lpm). 4 Unit Exposure = Exposure/AaiH.
Limitations: Though the above referenced study is useful for assessment of residential applications of granule pesticide formulations using a belly grinder, the following limitations are noted:
• The study monitored workers in a California nursery; therefore, using this study for residential assessments introduces uncertainty.
• The second application for Worker A was not used as the collection pump reportedly malfunctioned.

Formulation: Granules Equipment/Application Method: Belly Grinder
U.S. EPA Office of Pesticide Programs – Standard Operating Procedures for Assessing Residential Pesticide Exposure C-16
Table C-20: Exposure Study Identification Information Citation PHED 459
EPA MRID NA ORETF Code NA EPA Review none
MRID = Master Record Identification ORETF = Outdoor Residential Exposure Task Force Study Description: A total of 16 applications were monitored using 3 volunteers loading and applying 2% active ingredient granules around foundations, patios, driveways, and sidewalks of houses using a “whirly-bird spreader” (i.e., belly grinder). Each worker applied approximately 5.7 oz of the bait formulation per 1000 ft2 resulting in a range of 0.0069 to 0.0425 lbs of active ingredient per application. The sampling time ranged from 4 to 11 minutes. Dermal exposure was monitored using gauze patches strategically placed on each body part both inside and outside the individuals clothing. This methodology allows for representation of individuals wearing shorts, a short-sleeve shirt, shoes and socks. Chemical-resistant gloves were worn so exposure values to bare hands had to be back-calculated assuming 90% protection from chemical-resistant gloves. Inhalation exposure was measured using standard pumps (set at 1 liter per minute), cassettes, and tubing. All air samples were below the limit of quantification. Average laboratory recovery values are as follows, 103% with a standard deviation of 1.9% for air filters, 117% with a standard deviation of 7.7% for gauze pads, 116% with a standard deviation of 1.5% for low-level hand rinse and 122% with a standard deviation of 3.8% for high-level hand rinse. Average field recovery values are as follows, 95% with a standard deviation of 4.4% for air filters, 105% with a standard deviation of 2.9% for gauze pads (outside clothing), 90% with a standard deviation of 4.5% for gauze pads (outside clothing), 103% with a standard deviation of 3.5% for gauze pads (inside clothing), and 102% with a standard deviation of 1.4% for hand rinses.
Table C-21: PHED 459 – Checklist and Use Recommendation
Study Criteria Exposure Component Dermal Inhalation
Does the study provide detailed characteristics on the activity, equipment type, and amount of active ingredient handled? Yes
Does dermal exposure monitoring allow for construction of an exposure estimate for individuals wearing short-sleeve shirts, shorts, shoes, socks? Yes NA
Was exposure to the hands representative of bare hands? No NA Was the study intended to simulate “residential” exposure via the scripted activity, amount of active ingredient handled, volunteers used, or the setting? No
Is the data of reasonable quality (i.e., are field fortification and laboratory recovery samples adequate)? Yes Yes
Should this study be recommended for use in residential handler exposure assessments? Yes No
Data Summary: The following table summarizes pertinent exposure information from the above referenced study. Note that only dermal exposure is included, as inhalation exposure data was not recommended for use in residential handler exposure assessment. The submitted study itself or corresponding analytical spreadsheets should be reviewed for further information.

Formulation: Granules Equipment/Application Method: Belly Grinder
U.S. EPA Office of Pesticide Programs – Standard Operating Procedures for Assessing Residential Pesticide Exposure C-17
Table C-22: PHED 459 – Data Summary
Person ID AaiH1 (lbs)
Exposure (mg) Unit Exposure (mg/lb ai)4 Dermal2 Inhalation3 Dermal Inhalation
A 0.0288 1.40 -- 49 -- A 0.0425 4.31 -- 101 -- A 0.0106 3.17 -- 299 -- A 0.01 5.33 -- 533 -- B 0.0125 1.65 -- 132 -- B 0.0088 0.74 -- 84 -- B 0.0125 4.31 -- 345 -- B 0.0169 8.51 -- 503 -- B 0.0119 4.74 -- 398 -- B 0.015 14.89 -- 992 -- C 0.0075 1.40 -- 186 -- C 0.0088 6.03 -- 685 -- C 0.0081 2.22 -- 274 -- C 0.0069 3.48 -- 504 -- C 0.0138 0.78 -- 56 -- C 0.0081 1.50 -- 186 --
1 Amount of active ingredient Handled. 2 Representative of individuals wearing a short-sleeve shirt, shorts, shoes, socks and no chemical-resistant gloves. 3 Inhalation exposure (mg) = mg collected/pump flow rate (Lpm) * Breathing Rate (16.7 Lpm). 4 Unit Exposure = Exposure/AaiH.
Limitations: Though the above referenced study is useful for assessment of residential applications of granule pesticide formulations using a belly grinder, the following limitations are noted:
• The individuals monitored in the study wore chemical-resistant gloves. Because residential handler exposure assessments representative of individuals wearing chemical-resistant gloves are not typically conducted, a back-calculation (i.e., increasing hand exposures by 90%) to represent “bare hand” exposure was necessary, adding uncertainty to the unit exposures.
• All inhalation samples were non-detects. One-half the limit of detection (0.2 µg) was used in exposure calculations.
Table C-23: Exposure Study Identification Information
Citation PHED 504 EPA MRID NA
ORETF Code NA EPA Review none
MRID = Master Record Identification ORETF = Outdoor Residential Exposure Task Force Study Description: A total of 9 application events were monitored while loading and applying granules using a “hand cyclone spreader” to approximately 0.9 acres (six 0.15 acre plots) of turf in Michigan over the course of a 4 hour period. Each individual handled a total of approximately 400 lbs of formulation (1.4 lbs active ingredient), equivalent to approximately 1.5 lb ai per acre. Dermal exposure was monitored using gauze patches, though the placement only allows for

Formulation: Granules Equipment/Application Method: Belly Grinder
U.S. EPA Office of Pesticide Programs – Standard Operating Procedures for Assessing Residential Pesticide Exposure C-18
representation of individuals wearing a long-sleeve shirt, long pants, shoes and socks. Chemical-resistant gloves were not worn. Inhalation exposure was measured using standard pumps (set at 1 liter per minute), cassettes, and tubing. Average laboratory recoveries were as follows: 99.0 ± 10.2% for air filters and 98.0 ± 9.9% for tubes; 118.4 ± 6.5% for hand washes; and 100.3 ± 6.9% for the gauze patches. Travel spike average recoveries for the tube, filter, hand rinse, and gauze patch travel spikes were 104%, 112%, 101%, and 112%, respectively. Since the results were all equal to or greater than 100%, no corrections to the data were applied based on these spikes. Field fortification recoveries for the filter, hand rinse, and gauze patch field spikes were 104%, 98%, and 90%, respectively.
Table C-24: PHED 504 – Checklist and Use Recommendation
Study Criteria Exposure Component Dermal Inhalation
Does the study provide detailed characteristics on the activity, equipment type, and amount of active ingredient handled? Yes
Does dermal exposure monitoring allow for construction of an exposure estimate for individuals wearing short-sleeve shirts, shorts, shoes, socks? No NA
Was exposure to the hands representative of bare hands? Yes NA Was the study intended to simulate “residential” exposure via the scripted activity, amount of active ingredient handled, volunteers used, or the setting? No
Is the data of reasonable quality (i.e., are field fortification and laboratory recovery samples adequate)? Yes Yes
Should this study be recommended for use in residential handler exposure assessments? No Yes
Data Summary: The following table summarizes pertinent exposure information from the above referenced study. Note that only inhalation exposure data are included since the dermal exposure data are not recommended for use in residential handler exposure assessment. The submitted study itself or corresponding analytical spreadsheets should be reviewed for further information.
Table C-25: PHED 504 – Data Summary
Person ID AaiH1 (lbs)
Exposure (mg) Unit Exposure (mg/lb ai)4 Dermal2 Inhalation3 Dermal Inhalation
DS 1.33 -- 0.009 -- 0.007 DV 0.82 -- 0.006 -- 0.008 IC 1.29 -- 0.006 -- 0.005 JC 1.00 -- 0.011 -- 0.011 JJ 1.26 -- 0.012 -- 0.009
JM 1.24 -- 0.009 -- 0.007 MD 1.36 -- 0.007 -- 0.005 MS 1.28 -- 0.012 -- 0.010 NB 1.37 -- 0.010 -- 0.007
1 Amount of active ingredient Handled. 2 Representative of individuals wearing a short-sleeve shirt, shorts, shoes, socks and no chemical-resistant gloves. 3 Inhalation exposure (mg) = mg collected/pump flow rate (Lpm) * Breathing Rate (16.7 Lpm). 4 Unit Exposure = Exposure/AaiH.
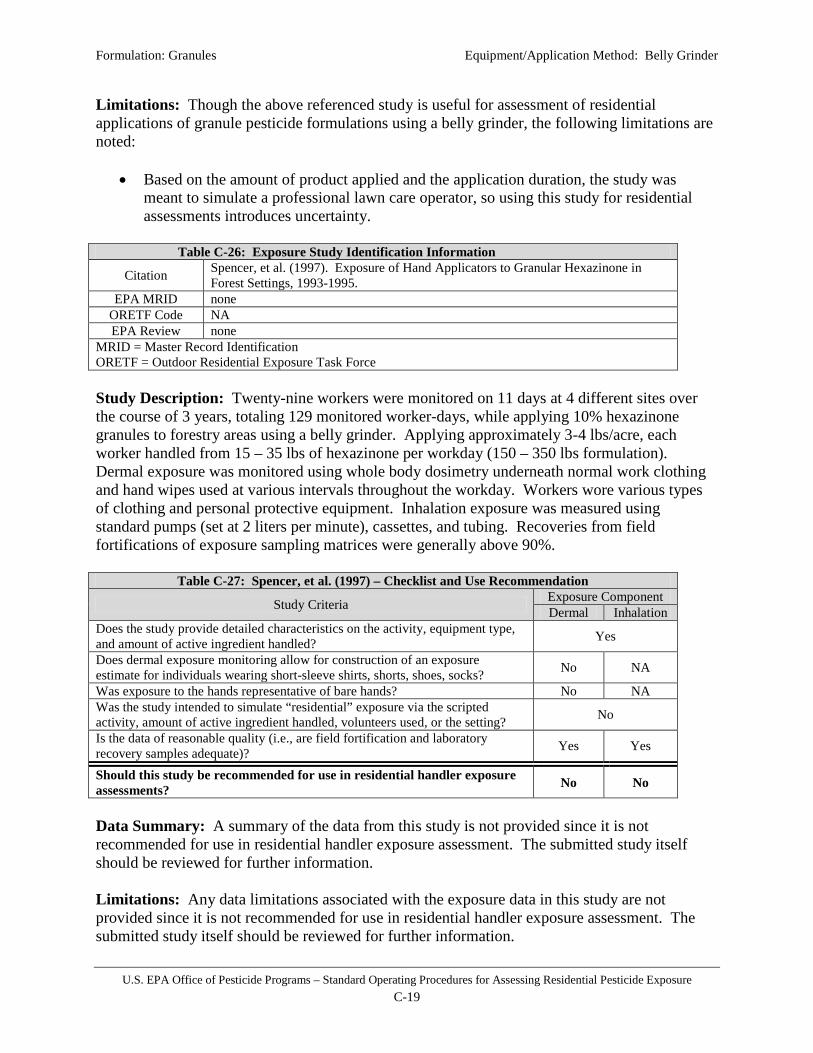
Formulation: Granules Equipment/Application Method: Belly Grinder
U.S. EPA Office of Pesticide Programs – Standard Operating Procedures for Assessing Residential Pesticide Exposure C-19
Limitations: Though the above referenced study is useful for assessment of residential applications of granule pesticide formulations using a belly grinder, the following limitations are noted:
• Based on the amount of product applied and the application duration, the study was meant to simulate a professional lawn care operator, so using this study for residential assessments introduces uncertainty.
Table C-26: Exposure Study Identification Information
Citation Spencer, et al. (1997). Exposure of Hand Applicators to Granular Hexazinone in Forest Settings, 1993-1995.
EPA MRID none ORETF Code NA EPA Review none
MRID = Master Record Identification ORETF = Outdoor Residential Exposure Task Force Study Description: Twenty-nine workers were monitored on 11 days at 4 different sites over the course of 3 years, totaling 129 monitored worker-days, while applying 10% hexazinone granules to forestry areas using a belly grinder. Applying approximately 3-4 lbs/acre, each worker handled from 15 – 35 lbs of hexazinone per workday (150 – 350 lbs formulation). Dermal exposure was monitored using whole body dosimetry underneath normal work clothing and hand wipes used at various intervals throughout the workday. Workers wore various types of clothing and personal protective equipment. Inhalation exposure was measured using standard pumps (set at 2 liters per minute), cassettes, and tubing. Recoveries from field fortifications of exposure sampling matrices were generally above 90%.
Table C-27: Spencer, et al. (1997) – Checklist and Use Recommendation
Study Criteria Exposure Component Dermal Inhalation
Does the study provide detailed characteristics on the activity, equipment type, and amount of active ingredient handled? Yes
Does dermal exposure monitoring allow for construction of an exposure estimate for individuals wearing short-sleeve shirts, shorts, shoes, socks? No NA
Was exposure to the hands representative of bare hands? No NA Was the study intended to simulate “residential” exposure via the scripted activity, amount of active ingredient handled, volunteers used, or the setting? No
Is the data of reasonable quality (i.e., are field fortification and laboratory recovery samples adequate)? Yes Yes
Should this study be recommended for use in residential handler exposure assessments? No No
Data Summary: A summary of the data from this study is not provided since it is not recommended for use in residential handler exposure assessment. The submitted study itself should be reviewed for further information. Limitations: Any data limitations associated with the exposure data in this study are not provided since it is not recommended for use in residential handler exposure assessment. The submitted study itself should be reviewed for further information.

Formulation: Granules Equipment/Application Method: Cup
U.S. EPA Office of Pesticide Programs – Standard Operating Procedures for Assessing Residential Pesticide Exposure C-20
Scenario Summary
Table C-28: Scenario Description and Available Exposure Studies Formulation Granules Equipment/Application Method Spoon
Application Site(s) outdoors (lawn, gardens, trees/bushes, perimeter, mounds/nests, aquatic areas)
Available Exposure Studies Pontal, P.G. (1996); MRID 45250702
Table C-29: Unit Exposures (mg/lb ai) – Granule Spoon Applications Statistic Dermal Inhalation
50th percentile 3.7 0.024 75th percentile 7.3 0.071 95th percentile 20 0.34 99th percentile 39 1.0 99.9th percentile 83 3.4 AM (SD) 6.2 (8.2) 0.087 (0.30) GM (GSD) 3.7 (2.7) 0.024 (5.0) Range 1 – 16 0.0024 – 0.33 N 10 10
Dermal Unit Exposure Data Summary: The recommended dermal unit exposures for applications of granule pesticide formulations using a spoon is based on a lognormal distribution fit with exposure monitoring data from Pontal, P.G. (1996) [EPA MRID 45250702]. Pontal, P.G. (1996) monitored 10 applications of a granule formulation to a 1 acre banana plantation in Cameroon using a spoon. Despite being an occupational exposure monitoring study, and thus potentially an inaccurate representation of residential exposure, this is the only available study for this application pattern. Inhalation Unit Exposure Data Summary: The recommended inhalation unit exposures for applications of granule pesticide formulations using a spoon is based on a lognormal distribution fit with exposure monitoring data from Pontal, P.G. (1996) [EPA MRID 45250702]. Pontal, P.G. (1996) monitored 10 applications of a granule formulation to a 1 acre banana plantation in Cameroon using a spoon. Despite being an occupational exposure monitoring study, and thus potentially an inaccurate representation of residential exposure, this is the only available study for this application pattern.

Formulation: Granules Equipment/Application Method: Cup
U.S. EPA Office of Pesticide Programs – Standard Operating Procedures for Assessing Residential Pesticide Exposure C-21
Log-normal Probability Plots Legend: ■ = Pontal, P.G. (1996)
Legend: ■ = Pontal, P.G. (1996)
Der
mal
UE
(mg/
lb a
i)
0
5
10
15
.001.01.05.10 .25 .50 .75 .90 .95
.0 .5 1.0 1.5 2.0 2.5 3.0 3.5 4.0 4.5 5.0 5.5 6.
Log Normal Quantile
Inha
latio
n U
E (m
g/lb
ai)
0
0.05
0.1
0.15
0.2
0.25
0.3
0.35.001.01.05.10.25 .50 .75 .90 .95
0 1 2 3 4 5 6 7 8 9 10 11 12 13 14 15 16
Log Normal Quantile

Formulation: Granules Equipment/Application Method: Cup
U.S. EPA Office of Pesticide Programs – Standard Operating Procedures for Assessing Residential Pesticide Exposure C-22
Available Handler Exposure Studies:
Table C-30: Exposure Study Identification Information
Citation Pontal, P.G. (1996). Worker Exposure Study During Application Of Regent 20GR In Banana Plantation, (RP Study 94/136 - Amended)
EPA MRID 45250702 ORETF Code NA EPA Review D270065
MRID = Master Record Identification ORETF = Outdoor Residential Exposure Task Force Study Description: A total of 10 applications were monitored on two days for workers applying a granule formulation of fipronil with a spoon in banana plantations in Cameroon. The workers covered approximately 1 acre per application-event, applying granules to approximately 800 plants at a rate of 0.15 gms active ingredient per plant (13 lbs product; 0.26 lbs fipronil). Dermal exposure was monitored using whole body dosimetry – which served as the workers normal clothing (i.e., measurements would be representative of workers without clothing). Clothing protection factors were required to estimate exposure for workers while wearing clothing. Workers wore chemical-resistant gloves with cotton gloves underneath serving as the hand exposure measurement method. Inhalation exposure was measured using standard pumps (set at 1 liter per minute), cassettes, and tubing. Overall recovery levels from field spiked samples were between 64% and 99% (average 87%) with only one recovery below 80%. Overall recovery levels from samples spiked in the laboratory were between 92 and 117.5%.
Table C-31: MRID 45250702 – Checklist and Use Recommendation
Study Criteria Exposure Component Dermal Inhalation
Does the study provide detailed characteristics on the activity, equipment type, and amount of active ingredient handled? Yes
Does dermal exposure monitoring allow for construction of an exposure estimate for individuals wearing short-sleeve shirts, shorts, shoes, socks? No NA
Was exposure to the hands representative of bare hands? No NA Was the study intended to simulate “residential” exposure via the scripted activity, amount of active ingredient handled, volunteers used, or the setting? No
Is the data of reasonable quality (i.e., are field fortification and laboratory recovery samples adequate)? Yes Yes
Should this study be recommended for use in residential handler exposure assessments? Yes Yes
Data Summary: The following table summarizes pertinent exposure information from the above referenced study. Both dermal and inhalation exposure are included since both are recommended for use in residential handler exposure assessment. The submitted study itself or corresponding analytical spreadsheets should be reviewed for further information.
Table C-32: MRID 45250702 – Data Summary Person ID AaiH1
(lbs) Exposure (mg) Unit Exposure (mg/lb ai)4
Dermal2 Inhalation3 Dermal Inhalation 1 0.368 1.13 0.0010 3.06 0.0027 2 0.368 3.84 0.0009 10.42 0.0024 3 0.368 5.06 0.1198 13.76 0.3255
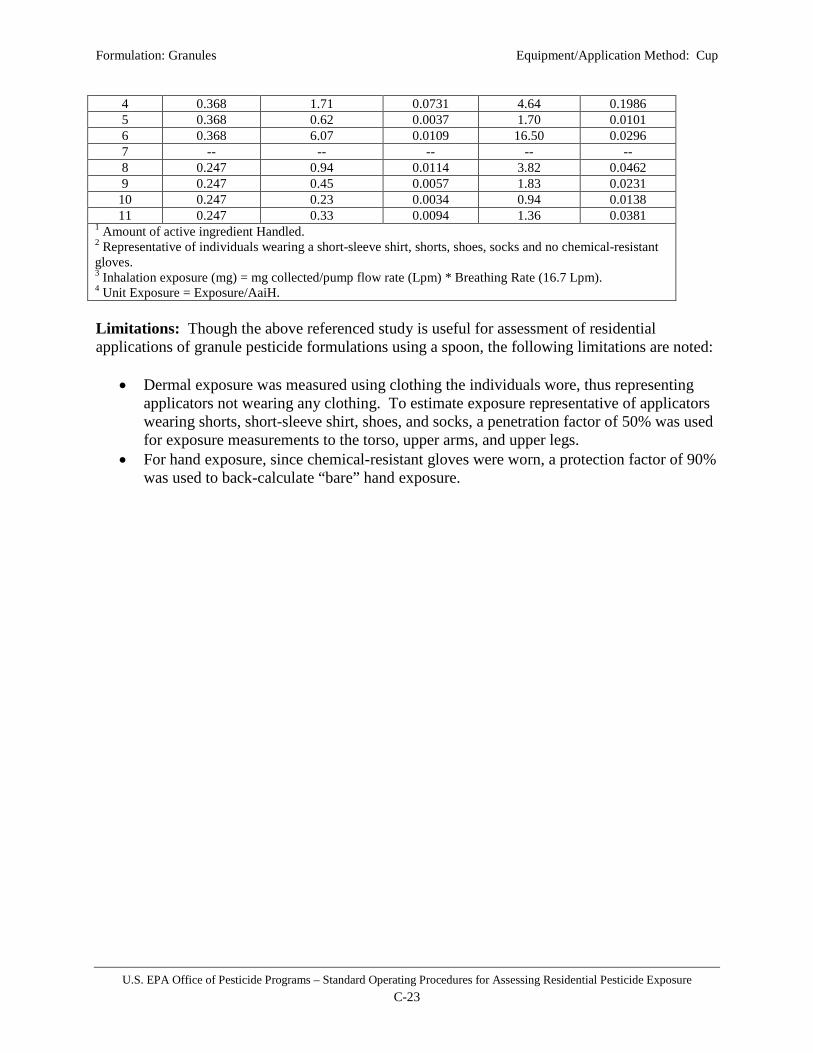
Formulation: Granules Equipment/Application Method: Cup
U.S. EPA Office of Pesticide Programs – Standard Operating Procedures for Assessing Residential Pesticide Exposure C-23
4 0.368 1.71 0.0731 4.64 0.1986 5 0.368 0.62 0.0037 1.70 0.0101 6 0.368 6.07 0.0109 16.50 0.0296 7 -- -- -- -- -- 8 0.247 0.94 0.0114 3.82 0.0462 9 0.247 0.45 0.0057 1.83 0.0231
10 0.247 0.23 0.0034 0.94 0.0138 11 0.247 0.33 0.0094 1.36 0.0381
1 Amount of active ingredient Handled. 2 Representative of individuals wearing a short-sleeve shirt, shorts, shoes, socks and no chemical-resistant gloves. 3 Inhalation exposure (mg) = mg collected/pump flow rate (Lpm) * Breathing Rate (16.7 Lpm). 4 Unit Exposure = Exposure/AaiH. Limitations: Though the above referenced study is useful for assessment of residential applications of granule pesticide formulations using a spoon, the following limitations are noted:
• Dermal exposure was measured using clothing the individuals wore, thus representing applicators not wearing any clothing. To estimate exposure representative of applicators wearing shorts, short-sleeve shirt, shoes, and socks, a penetration factor of 50% was used for exposure measurements to the torso, upper arms, and upper legs.
• For hand exposure, since chemical-resistant gloves were worn, a protection factor of 90% was used to back-calculate “bare” hand exposure.
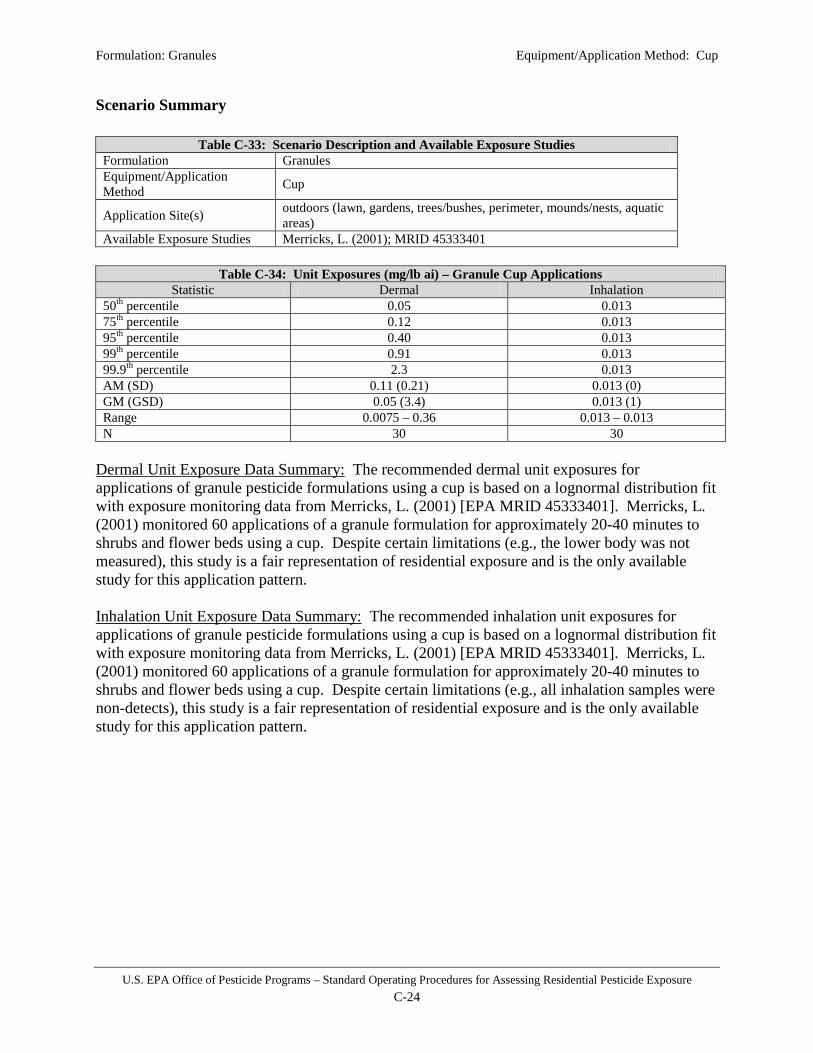
Formulation: Granules Equipment/Application Method: Cup
U.S. EPA Office of Pesticide Programs – Standard Operating Procedures for Assessing Residential Pesticide Exposure C-24
Scenario Summary
Table C-33: Scenario Description and Available Exposure Studies Formulation Granules Equipment/Application Method Cup
Application Site(s) outdoors (lawn, gardens, trees/bushes, perimeter, mounds/nests, aquatic areas)
Available Exposure Studies Merricks, L. (2001); MRID 45333401
Table C-34: Unit Exposures (mg/lb ai) – Granule Cup Applications Statistic Dermal Inhalation
50th percentile 0.05 0.013 75th percentile 0.12 0.013 95th percentile 0.40 0.013 99th percentile 0.91 0.013 99.9th percentile 2.3 0.013 AM (SD) 0.11 (0.21) 0.013 (0) GM (GSD) 0.05 (3.4) 0.013 (1) Range 0.0075 – 0.36 0.013 – 0.013 N 30 30
Dermal Unit Exposure Data Summary: The recommended dermal unit exposures for applications of granule pesticide formulations using a cup is based on a lognormal distribution fit with exposure monitoring data from Merricks, L. (2001) [EPA MRID 45333401]. Merricks, L. (2001) monitored 60 applications of a granule formulation for approximately 20-40 minutes to shrubs and flower beds using a cup. Despite certain limitations (e.g., the lower body was not measured), this study is a fair representation of residential exposure and is the only available study for this application pattern. Inhalation Unit Exposure Data Summary: The recommended inhalation unit exposures for applications of granule pesticide formulations using a cup is based on a lognormal distribution fit with exposure monitoring data from Merricks, L. (2001) [EPA MRID 45333401]. Merricks, L. (2001) monitored 60 applications of a granule formulation for approximately 20-40 minutes to shrubs and flower beds using a cup. Despite certain limitations (e.g., all inhalation samples were non-detects), this study is a fair representation of residential exposure and is the only available study for this application pattern.

Formulation: Granules Equipment/Application Method: Cup
U.S. EPA Office of Pesticide Programs – Standard Operating Procedures for Assessing Residential Pesticide Exposure C-25
Log-normal Probability Plots Legend: ■ = Merricks, L. (2001)
Note: Inhalation unit exposure lognormal probability plot not shown as all unit exposures were identical – all inhalation samples were non-detects and all individuals handled the same amount of active ingredient.
Der
mal
UE
(mg/
lb a
i)
0
0.05
0.1
0.15
0.2
0.25
0.3
0.35
0.4.001.01.05.10.25 .50 .75 .90 .95
0 1 2 3 4 5 6 7 8 9 10
Log Normal Quantile

Formulation: Granules Equipment/Application Method: Cup
U.S. EPA Office of Pesticide Programs – Standard Operating Procedures for Assessing Residential Pesticide Exposure C-26
Available Handler Exposure Studies
Table C-35: Exposure Study Identification Information
Citation
Merricks, L. (2001) Determination of Dermal (Hand and Forearm) and Inhalation Exposure to Disulfoton Resulting from Residential Application of Bayer Advanced Garden 2-in-1 Systematic Rose and Flower Care to Shrubs and Flower Beds: Lab Project Number: 4201. Unpublished study prepared by Agrisearch Inc. 178 p.
EPA MRID 45333401 ORETF Code NA EPA Review D273144
MRID = Master Record Identification ORETF = Outdoor Residential Exposure Task Force Study Description: Fifteen individuals were monitored during 4 applications (for a total of 60 application-events) of 1.04% disulfoton granules to shrubs and flower beds using a cup. An application consisted of pouring the product into the measuring cup/lid attached to the product package, then distributing the granules onto the soil around the base of the shrub or flower bed. Each application lasted between 20 and 40 minutes to apply approximately 10 pounds of formulation (0.1 lbs of disulfoton). Dermal exposure was measured for the hands and forearms only using detergent washes. Half of the applications were with chemical-resistant gloves and half were without (i.e., 30 applications with and 30 applications without chemical-resistant gloves). Inhalation exposure was measured using standard pumps (set at 1 liter per minute), cassettes, and tubing. All inhalation samples were non-detects. The overall mean percent recovery of concurrent laboratory fortifications from air sampling tubes was 99.9 ± 6.42%. The overall mean percent recovery from hand/forearm wash solution was 99.5 ± 9.15%. For air samples, the overall average fortified field recovery was 98.2 ± 6.32% with no apparent differences in mean recoveries between days or fortification levels. Overall field fortified recovery for hand/forearm wash samples collected from volunteers who did not wear gloves was 99.4 ± 7.95% with no apparent differences in recovery values between days.
Table C-36: MRID 45333401 – Checklist and Use Recommendation
Study Criteria Exposure Component Dermal Inhalation
Does the study provide detailed characteristics on the activity, equipment type, and amount of active ingredient handled? Yes
Does dermal exposure monitoring allow for construction of an exposure estimate for individuals wearing short-sleeve shirts, shorts, shoes, socks? No NA
Was exposure to the hands representative of bare hands? Yes NA Was the study intended to simulate “residential” exposure via the scripted activity, amount of active ingredient handled, volunteers used, or the setting? Yes
Is the data of reasonable quality (i.e., are field fortification and laboratory recovery samples adequate)? Yes Yes
Should this study be recommended for use in residential handler exposure assessments? Yes Yes
Data Summary: The following table summarizes pertinent exposure information from the above referenced study. Both dermal and inhalation exposure are included since both are recommended for use in residential handler exposure assessment. The submitted study itself or corresponding analytical spreadsheets should be reviewed for further information.
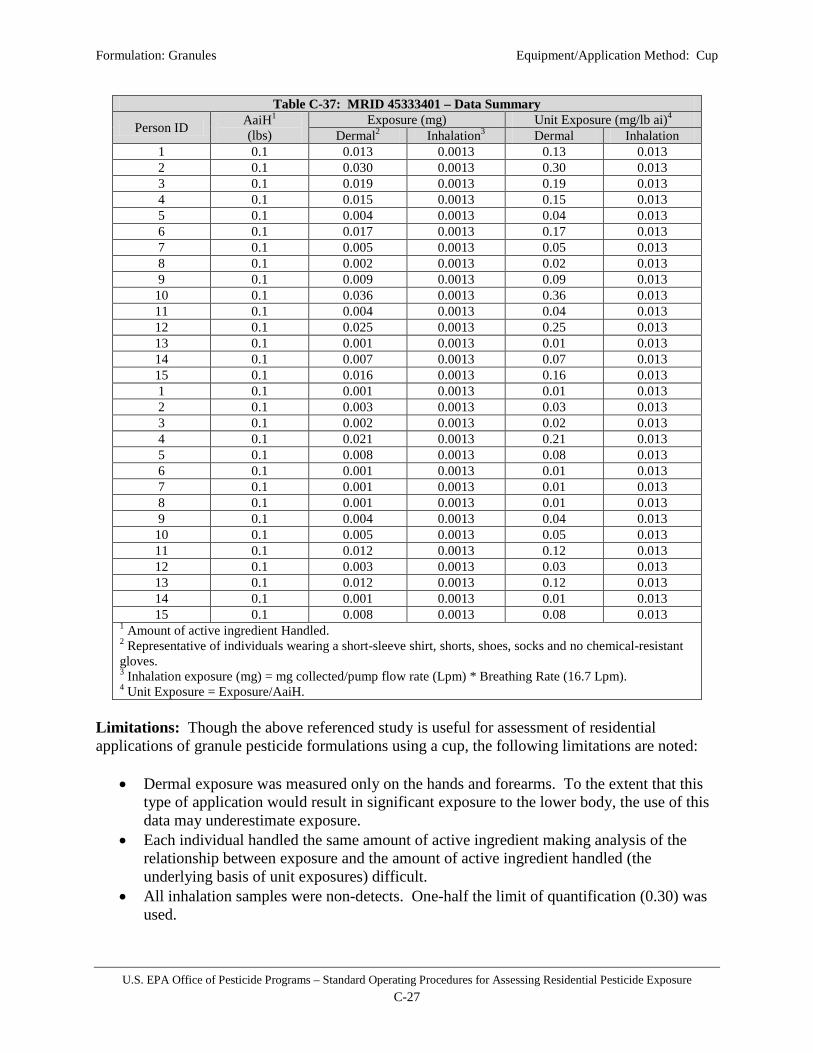
Formulation: Granules Equipment/Application Method: Cup
U.S. EPA Office of Pesticide Programs – Standard Operating Procedures for Assessing Residential Pesticide Exposure C-27
Table C-37: MRID 45333401 – Data Summary
Person ID AaiH1 (lbs)
Exposure (mg) Unit Exposure (mg/lb ai)4 Dermal2 Inhalation3 Dermal Inhalation
1 0.1 0.013 0.0013 0.13 0.013 2 0.1 0.030 0.0013 0.30 0.013 3 0.1 0.019 0.0013 0.19 0.013 4 0.1 0.015 0.0013 0.15 0.013 5 0.1 0.004 0.0013 0.04 0.013 6 0.1 0.017 0.0013 0.17 0.013 7 0.1 0.005 0.0013 0.05 0.013 8 0.1 0.002 0.0013 0.02 0.013 9 0.1 0.009 0.0013 0.09 0.013 10 0.1 0.036 0.0013 0.36 0.013 11 0.1 0.004 0.0013 0.04 0.013 12 0.1 0.025 0.0013 0.25 0.013 13 0.1 0.001 0.0013 0.01 0.013 14 0.1 0.007 0.0013 0.07 0.013 15 0.1 0.016 0.0013 0.16 0.013 1 0.1 0.001 0.0013 0.01 0.013 2 0.1 0.003 0.0013 0.03 0.013 3 0.1 0.002 0.0013 0.02 0.013 4 0.1 0.021 0.0013 0.21 0.013 5 0.1 0.008 0.0013 0.08 0.013 6 0.1 0.001 0.0013 0.01 0.013 7 0.1 0.001 0.0013 0.01 0.013 8 0.1 0.001 0.0013 0.01 0.013 9 0.1 0.004 0.0013 0.04 0.013 10 0.1 0.005 0.0013 0.05 0.013 11 0.1 0.012 0.0013 0.12 0.013 12 0.1 0.003 0.0013 0.03 0.013 13 0.1 0.012 0.0013 0.12 0.013 14 0.1 0.001 0.0013 0.01 0.013 15 0.1 0.008 0.0013 0.08 0.013
1 Amount of active ingredient Handled. 2 Representative of individuals wearing a short-sleeve shirt, shorts, shoes, socks and no chemical-resistant gloves. 3 Inhalation exposure (mg) = mg collected/pump flow rate (Lpm) * Breathing Rate (16.7 Lpm). 4 Unit Exposure = Exposure/AaiH.
Limitations: Though the above referenced study is useful for assessment of residential applications of granule pesticide formulations using a cup, the following limitations are noted:
• Dermal exposure was measured only on the hands and forearms. To the extent that this type of application would result in significant exposure to the lower body, the use of this data may underestimate exposure.
• Each individual handled the same amount of active ingredient making analysis of the relationship between exposure and the amount of active ingredient handled (the underlying basis of unit exposures) difficult.
• All inhalation samples were non-detects. One-half the limit of quantification (0.30) was used.

Formulation: Granules Equipment/Application Method: Hand
U.S. EPA Office of Pesticide Programs – Standard Operating Procedures for Assessing Residential Pesticide Exposure C-28
Scenario Summary
Table C-38: Scenario Description and Available Exposure Studies Formulation Granules Equipment/Application Method Hand dispersal
Application Site(s) outdoors (lawn, gardens, trees/bushes, perimeter, mounds/nests, aquatic areas)
Available Exposure Studies PHED 520
Table C-39: Unit Exposures (mg/lb ai) – Granule Applications by Hand Statistic Dermal Inhalation
50th percentile 120 0.28 75th percentile 205 0.47 95th percentile 430 1.0 99th percentile 740 1.7 99.9th percentile 1300 3.1 AM (SD) 160 (150) 0.38 (0.35) GM (GSD) 120 (2.2) 0.28 (2.2) Range 24 – 370 0.064 – 0.95 N 16 16
Dermal Unit Exposure Data Summary: The recommended dermal unit exposures for applications of granule pesticide formulations by hand is based on a lognormal distribution fit with exposure monitoring data from PHED 520. PHED 520 monitored 16 applications of a granule formulation to driveways, sidewalks, patios, foundations, and flower beds around private residences in Florida. Despite certain limitations (e.g., back-calculations were necessary to represent individuals wearing shorts, short-sleeve shirt and no chemical-resistant gloves), this study is a good respresentation of residential exposure and is the only available study for this application pattern. Inhalation Unit Exposure Data Summary: The recommended inhalation unit exposures for applications of granule pesticide formulations by hand is based on a lognormal distribution fit with exposure monitoring data from PHED 520. PHED 520 monitored 16 applications of a granule formulation to driveways, sidewalks, patios, foundations, and flower beds around private residences in Florida. Despite certain limitations (e.g., all inhalation samples were non-detects), this study is a good respresentation of residential exposure and is the only available study for this application pattern.
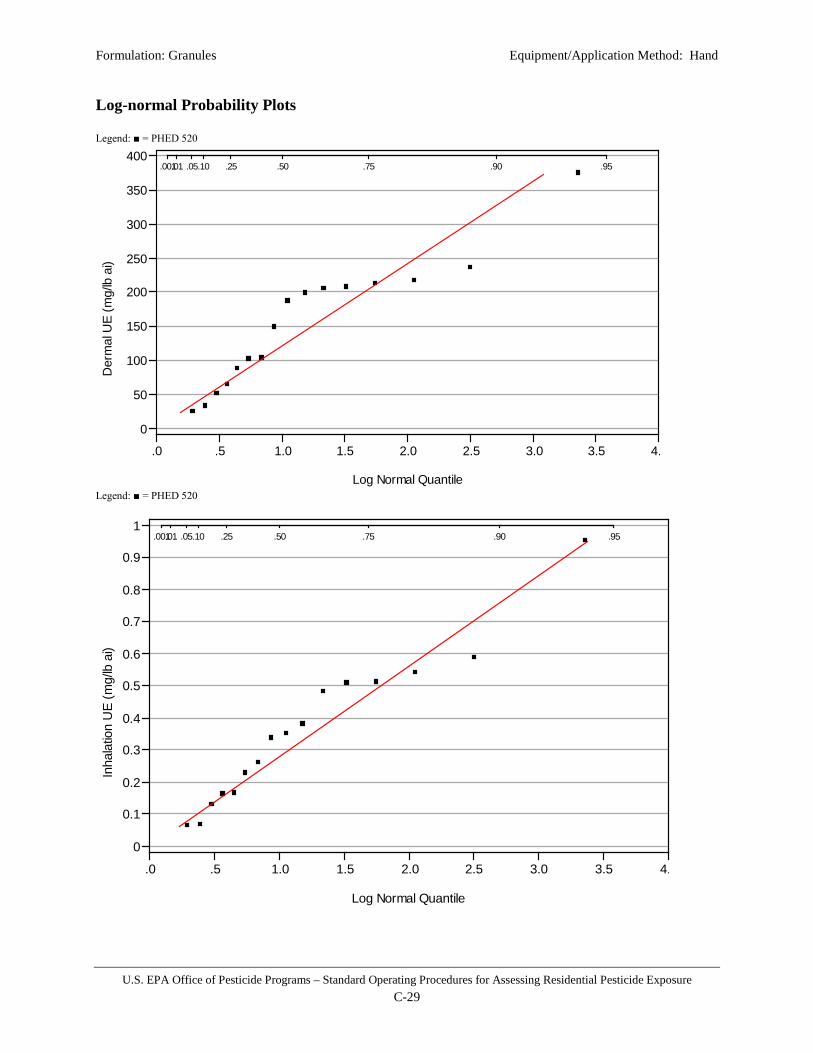
Formulation: Granules Equipment/Application Method: Hand
U.S. EPA Office of Pesticide Programs – Standard Operating Procedures for Assessing Residential Pesticide Exposure C-29
Log-normal Probability Plots Legend: ■ = PHED 520
Legend: ■ = PHED 520
Der
mal
UE
(mg/
lb a
i)
0
50
100
150
200
250
300
350
400.001.01 .05.10 .25 .50 .75 .90 .95
.0 .5 1.0 1.5 2.0 2.5 3.0 3.5 4.
Log Normal Quantile
Inha
latio
n U
E (m
g/lb
ai)
0
0.1
0.2
0.3
0.4
0.5
0.6
0.7
0.8
0.9
1.001.01 .05.10 .25 .50 .75 .90 .95
.0 .5 1.0 1.5 2.0 2.5 3.0 3.5 4.
Log Normal Quantile

Formulation: Granules Equipment/Application Method: Hand
U.S. EPA Office of Pesticide Programs – Standard Operating Procedures for Assessing Residential Pesticide Exposure C-30
Available Handler Exposure Studies
Table C-40: Exposure Study Identification Information Citation PHED 520
EPA MRID NA ORETF Code NA EPA Review none
MRID = Master Record Identification ORETF = Outdoor Residential Exposure Task Force
Study Description: Three commercial applicators were each monitored 5 times (for a total of 16 application-events) while applying 2% active ingredient granules by hand to driveways, sidewalks, patios, foundations, and flower beds around private residences in Florida. Each application consisted of treating one residences using less than 1 lb of product with gloved hands at a rate of approximately 4 ounces per 1000 ft2 (0.005 lb ai/1000 ft2). Dermal exposure was measured using gauze patches both inside and outside the normal work clothing (long-sleeve shirt, long pants, shoes, socks) as well as hand washes to measure exposure to hands underneath chemical-resistant gloves. Inhalation exposure was measured using standard pumps (set at 1 liter per minute), cassettes, and tubing. Recoveries from field fortifications of exposure sampling matrices were generally above 90%.
Table C-41: PHED 520 – Checklist and Use Recommendation
Study Criteria Exposure Component Dermal Inhalation
Does the study provide detailed characteristics on the activity, equipment type, and amount of active ingredient handled? Yes
Does dermal exposure monitoring allow for construction of an exposure estimate for individuals wearing short-sleeve shirts, shorts, shoes, socks? No NA
Was exposure to the hands representative of bare hands? No NA Was the study intended to simulate “residential” exposure via the scripted activity, amount of active ingredient handled, volunteers used, or the setting? Yes
Is the data of reasonable quality (i.e., are field fortification and laboratory recovery samples adequate)? Yes Yes
Should this study be recommended for use in residential handler exposure assessments? Yes Yes
Data Summary: The following table summarizes pertinent exposure information from the above referenced study. Both dermal and inhalation exposure are included since both are recommended for use in residential handler exposure assessment. The submitted study itself or corresponding analytical spreadsheets should be reviewed for further information.
Table C-42: PHED 520 – Data Summary Person
ID AaiH1 (lbs)
Exposure (mg) Unit Exposure (mg/lb ai)4 Dermal2 Inhalation3 Dermal Inhalation
A 0.026 0.635 0.0017 24 0.0654 A 0.003 0.635 0.0016 205 0.5333 A 0.003 0.635 0.0016 235 0.5333 A 0.005 0.970 0.0016 206 0.3200 A 0.005 0.970 0.0016 216 0.3200 B 0.013 0.635 0.0016 51 0.1231

Formulation: Granules Equipment/Application Method: Hand
U.S. EPA Office of Pesticide Programs – Standard Operating Procedures for Assessing Residential Pesticide Exposure C-31
B 0.003 0.635 0.0016 212 0.5333 B 0.002 0.635 0.0016 374 0.8000 B 0.003 0.635 0.0016 199 0.5333 B 0.006 0.635 0.0016 102 0.2667 C 0.010 0.635 0.0016 64 0.1600 C 0.007 0.635 0.0016 88 0.2286 C 0.003 0.635 0.0016 187 0.5333 C 0.004 0.635 0.0016 148 0.4000 C 0.010 1.034 0.0016 103 0.1600 C 0.024 0.780 0.0016 33 0.0667
1 Amount of active ingredient Handled. 2 Representative of individuals wearing a short-sleeve shirt, shorts, shoes, socks and no chemical-resistant gloves. 3 Inhalation exposure (mg) = mg collected/pump flow rate (Lpm) * Breathing Rate (16.7 Lpm). 4 Unit Exposure = Exposure/AaiH. Limitations: Though the above referenced study is useful for assessment of residential applications of granule pesticide formulations by hand, the following limitations are noted:
• The individuals monitored in the study wore chemical-resistant gloves and nearly all dermal measurements (hands and body) were non-detects. Exposure was therefore calculated using ½ of the limit of quantification (0.41 ug for body exposure; 41 ug for hand exposure) and hand measurements required a back-calculation using a 90% protection factor to represent “bare” hand exposure.
• All inhalation samples were non-detects. One-half the limit of detection (0.2 µg) was used.
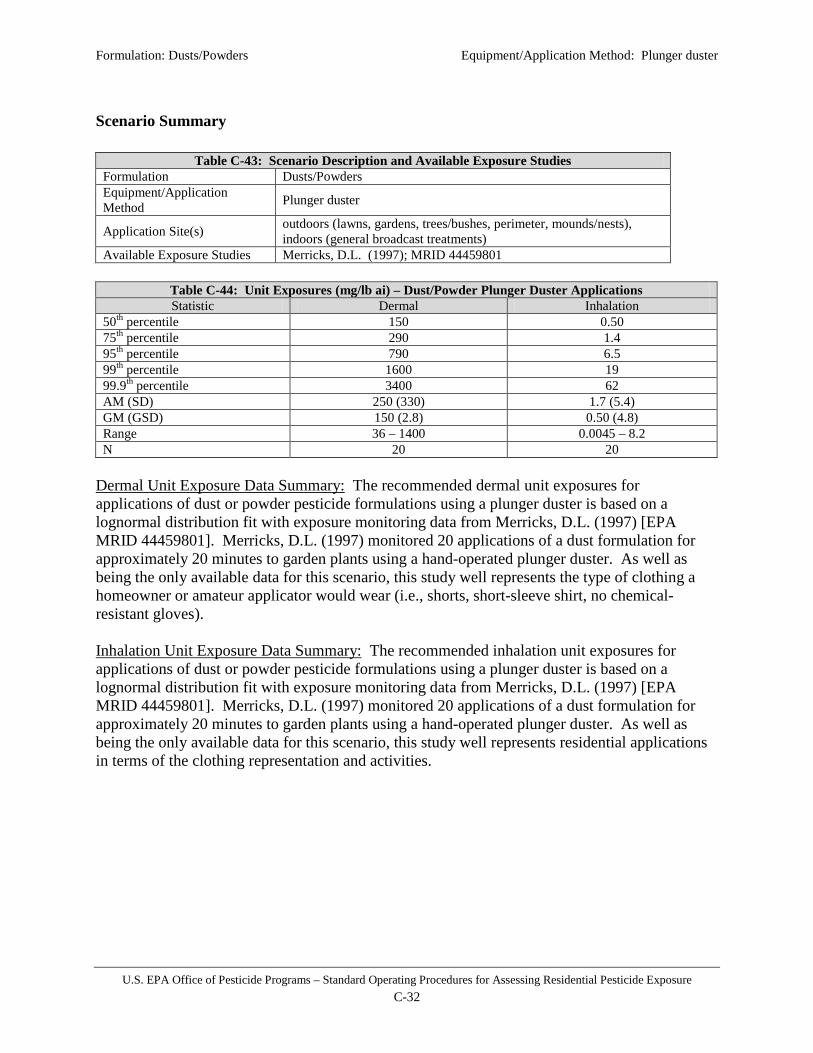
Formulation: Dusts/Powders Equipment/Application Method: Plunger duster
U.S. EPA Office of Pesticide Programs – Standard Operating Procedures for Assessing Residential Pesticide Exposure C-32
Scenario Summary
Table C-43: Scenario Description and Available Exposure Studies Formulation Dusts/Powders Equipment/Application Method Plunger duster
Application Site(s) outdoors (lawns, gardens, trees/bushes, perimeter, mounds/nests), indoors (general broadcast treatments)
Available Exposure Studies Merricks, D.L. (1997); MRID 44459801
Table C-44: Unit Exposures (mg/lb ai) – Dust/Powder Plunger Duster Applications Statistic Dermal Inhalation
50th percentile 150 0.50 75th percentile 290 1.4 95th percentile 790 6.5 99th percentile 1600 19 99.9th percentile 3400 62 AM (SD) 250 (330) 1.7 (5.4) GM (GSD) 150 (2.8) 0.50 (4.8) Range 36 – 1400 0.0045 – 8.2 N 20 20
Dermal Unit Exposure Data Summary: The recommended dermal unit exposures for applications of dust or powder pesticide formulations using a plunger duster is based on a lognormal distribution fit with exposure monitoring data from Merricks, D.L. (1997) [EPA MRID 44459801]. Merricks, D.L. (1997) monitored 20 applications of a dust formulation for approximately 20 minutes to garden plants using a hand-operated plunger duster. As well as being the only available data for this scenario, this study well represents the type of clothing a homeowner or amateur applicator would wear (i.e., shorts, short-sleeve shirt, no chemical-resistant gloves). Inhalation Unit Exposure Data Summary: The recommended inhalation unit exposures for applications of dust or powder pesticide formulations using a plunger duster is based on a lognormal distribution fit with exposure monitoring data from Merricks, D.L. (1997) [EPA MRID 44459801]. Merricks, D.L. (1997) monitored 20 applications of a dust formulation for approximately 20 minutes to garden plants using a hand-operated plunger duster. As well as being the only available data for this scenario, this study well represents residential applications in terms of the clothing representation and activities.

Formulation: Dusts/Powders Equipment/Application Method: Plunger duster
U.S. EPA Office of Pesticide Programs – Standard Operating Procedures for Assessing Residential Pesticide Exposure C-33
Lognormal Probability Plots Legend: ■ = Merricks, D.L. (1997)
Legend: ■ = Merricks, D.L. (1997)
Der
mal
UE
(mg/
lb a
i)
0
200
400
600
800
1000
1200
1400
.001.01.05.10 .25 .50 .75 .90 .95
0 1 2 3 4 5 6
Log Normal Quantile
Inha
latio
n U
E (m
g/lb
ai)
0
1
2
3
4
5
6
7
8
9.001.01.05.10.25 .50 .75 .90 .95
0 2 4 6 8 10 12 14
Log Normal Quantile

Formulation: Dusts/Powders Equipment/Application Method: Plunger duster
U.S. EPA Office of Pesticide Programs – Standard Operating Procedures for Assessing Residential Pesticide Exposure C-34
Available Handler Exposure Studies
Table C-45: Exposure Study Identification Information
Citation Merricks, D.L. (1997). Carbaryl Mixer/Loader/Applicator Exposure Study during Application of RP-2 Liquid (21%), Sevin® Ready to Use Insect Spray or Sevin® 10 Dust to Home Garden Vegetables
EPA MRID 44459801 ORETF Code OMA006
EPA Review EPA Memo from G. Bangs to D. Fuller (3/5/03) D287251
MRID = Master Record Identification ORETF = Outdoor Residential Exposure Task Force
Study Description: Twenty individuals were monitored while applying a dust formulation (10% carbaryl) to gardens using a hand-operated plunger duster (The SpritzerTM). Each application was approximately 20 minutes and consisted of loading the duster and applying approximately 0.16 lbs formulation (0.017 lbs carbaryl) to garden plants. Dermal exposure was measured using inner and outer whole body dosimetry and hand washes (without chemical-resistant gloves worn). Inhalation exposure was measured using standard pumps (set at 2 liters per minute), cassettes, and tubing. Field fortification recoveries for passive dosimeters averaged 84.3% for inner dosimeters and 77.7% for outer dosimeters. Face and neck wipe field fortifications averaged 84.8%. Both handwash and inhalation tube field fortification averaged >90%. Laboratory method validation for each matrix fell within the acceptable range of 70 to 120%. The limit of quantitation (LOQ) was 1.0 µg/sample for all media except the inhalation monitors where the LOQ was 0.01 µg/sample. The limit of detection (LOD) was 0.5 µg/sample for all media except the inhalation monitors where the LOQ was 0.005 µg/sample.
Table C-46: MRID 44459801 – Checklist and Use Recommendation
Study Criteria Exposure Component Dermal Inhalation
Does the study provide detailed characteristics on the activity, equipment type, and amount of active ingredient handled? Yes
Does dermal exposure monitoring allow for construction of an exposure estimate for individuals wearing short-sleeve shirts, shorts, shoes, socks? Yes NA
Was exposure to the hands representative of bare hands? Yes NA Was the study intended to simulate “residential” exposure via the scripted activity, amount of active ingredient handled, volunteers used, or the setting? Yes
Is the data of reasonable quality (i.e., are field fortification and laboratory recovery samples adequate)? Yes Yes
Should this study be recommended for use in residential handler exposure assessments? Yes Yes
Data Summary: The following table summarizes pertinent exposure information from the above referenced study. Both dermal and inhalation exposure are included since both are recommended for use in residential handler exposure assessment. The submitted study itself or corresponding analytical spreadsheets should be reviewed for further information.
Table C-47: MRID 44459801 – Data Summary Person ID AaiH1
(lbs) Exposure (mg) Unit Exposure (mg/lb ai)4
Dermal2 Inhalation3 Dermal Inhalation
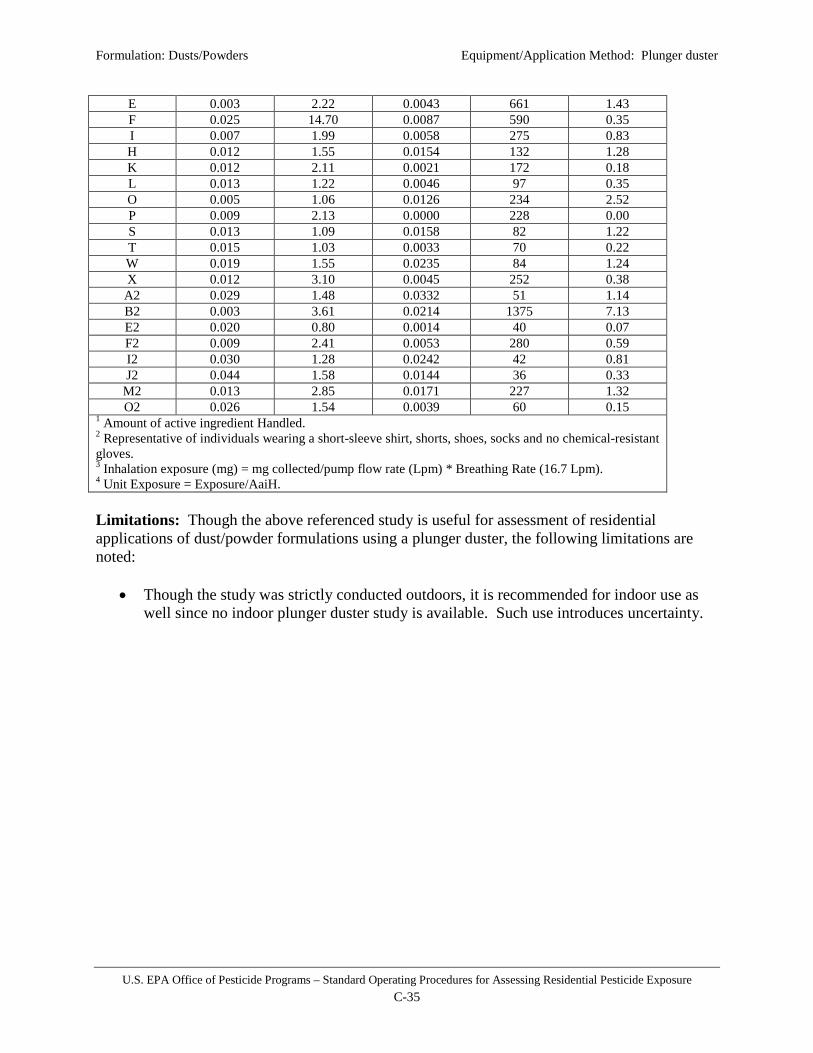
Formulation: Dusts/Powders Equipment/Application Method: Plunger duster
U.S. EPA Office of Pesticide Programs – Standard Operating Procedures for Assessing Residential Pesticide Exposure C-35
E 0.003 2.22 0.0043 661 1.43 F 0.025 14.70 0.0087 590 0.35 I 0.007 1.99 0.0058 275 0.83 H 0.012 1.55 0.0154 132 1.28 K 0.012 2.11 0.0021 172 0.18 L 0.013 1.22 0.0046 97 0.35 O 0.005 1.06 0.0126 234 2.52 P 0.009 2.13 0.0000 228 0.00 S 0.013 1.09 0.0158 82 1.22 T 0.015 1.03 0.0033 70 0.22 W 0.019 1.55 0.0235 84 1.24 X 0.012 3.10 0.0045 252 0.38
A2 0.029 1.48 0.0332 51 1.14 B2 0.003 3.61 0.0214 1375 7.13 E2 0.020 0.80 0.0014 40 0.07 F2 0.009 2.41 0.0053 280 0.59 I2 0.030 1.28 0.0242 42 0.81 J2 0.044 1.58 0.0144 36 0.33
M2 0.013 2.85 0.0171 227 1.32 O2 0.026 1.54 0.0039 60 0.15
1 Amount of active ingredient Handled. 2 Representative of individuals wearing a short-sleeve shirt, shorts, shoes, socks and no chemical-resistant gloves. 3 Inhalation exposure (mg) = mg collected/pump flow rate (Lpm) * Breathing Rate (16.7 Lpm). 4 Unit Exposure = Exposure/AaiH. Limitations: Though the above referenced study is useful for assessment of residential applications of dust/powder formulations using a plunger duster, the following limitations are noted:
• Though the study was strictly conducted outdoors, it is recommended for indoor use as well since no indoor plunger duster study is available. Such use introduces uncertainty.

Formulation: Dusts/Powders Equipment/Application Method: Shaker can
U.S. EPA Office of Pesticide Programs – Standard Operating Procedures for Assessing Residential Pesticide Exposure C-36
Scenario Summary
Table C-48: Scenario Description and Available Exposure Studies Formulation Dusts/Powders Equipment/Application Method Shaker can
Application Site(s) outdoors (lawns, gardens, trees/bushes, perimeter, mounds/nests), indoors (general broadcast treatments), pets/animals
Available Exposure Studies Merricks, D. (1997); MRID 44439901 McKeown, K. (2001); MRID 45519601
Table C-49: Unit Exposures (mg/lb ai) – Dust/Powder Shaker can Applications
Statistic Dermal Inhalation 50th percentile 3600 9.4 75th percentile 5300 20 95th percentile 9200 59 99th percentile 14000 130 99.9th percentile 21000 290 AM (SD) 4300 (2600) 18 (28) GM (GSD) 3600 (1.8) 9.4 (3.1) Range 1400 – 10000 0.36 – 74 N 20 55 Dermal Unit Exposure Data Summary: The recommended dermal unit exposures for applications of dust or powder pesticide formulations using a shaker can is based on a lognormal distribution fit with exposure monitoring data from Merricks, D. (1997) [EPA MRID 44439901]. Merricks, D. (1997) monitored 40 applications of a dust formulation to dogs for approximately 7 minutes using a 1 lb shaker can. While another study was also available and reasonably representative of residential applications, Merricks, D., (1997) employed monitoring methods that best represented the type of clothing a homeowner or amateur applicator would wear (i.e., shorts, short-sleeve shirt, no chemical-resistant gloves). Inhalation Unit Exposure Data Summary: The recommended inhalation unit exposures for applications of dust or powder pesticide formulations using a shaker can is based on a lognormal distribution fit with exposure monitoring data from Merricks, D. (1997) [EPA MRID 44439901] and McKeown, K. (2001) [MRID 45519601]. Merricks, D. (1997) monitored 40 applications of a dust formulation to dogs for approximately 7 minutes using a 1 lb shaker can. McKeown, K. (2001) monitored 15 applications of approximately 1 ounce of a dust formulation for approximately 2-3 minutes to dogs using a shaker can. Both studies were reasonably representative of residential applications with inhalation exposures of the same general magnitude, thus a composite dataset was utilized.
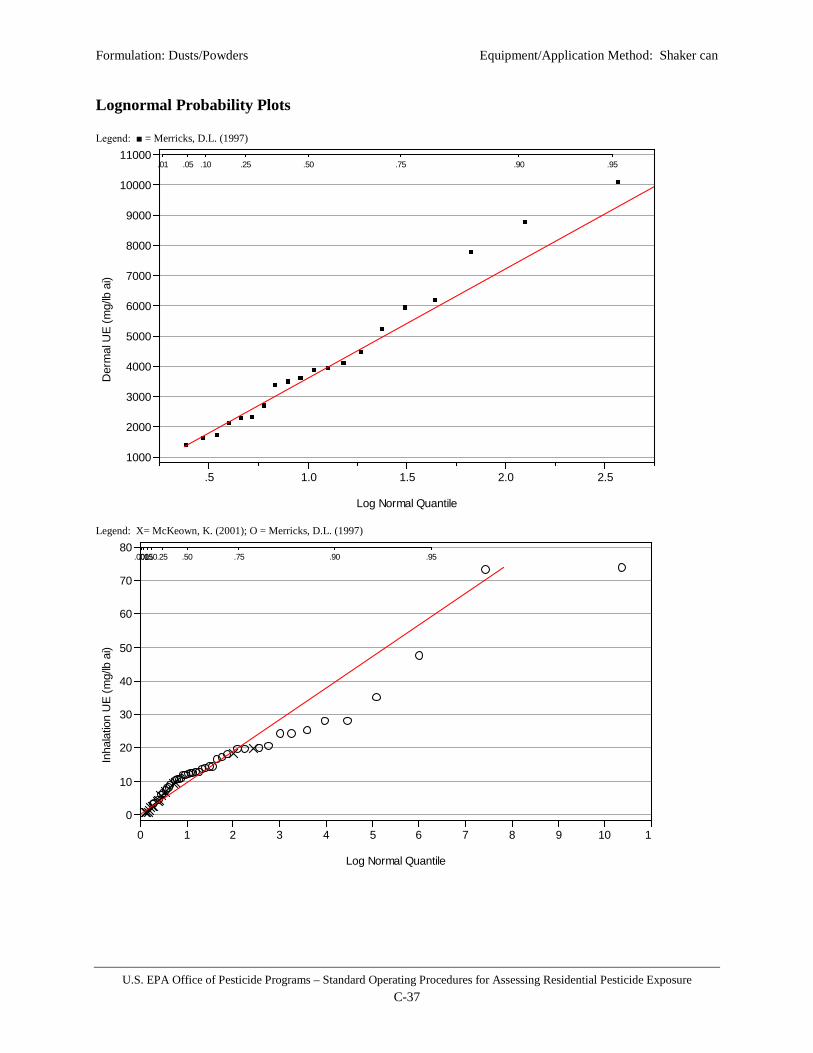
Formulation: Dusts/Powders Equipment/Application Method: Shaker can
U.S. EPA Office of Pesticide Programs – Standard Operating Procedures for Assessing Residential Pesticide Exposure C-37
Lognormal Probability Plots Legend: ■ = Merricks, D.L. (1997)
Legend: X= McKeown, K. (2001); O = Merricks, D.L. (1997)
Der
mal
UE
(mg/
lb a
i)
1000
2000
3000
4000
5000
6000
7000
8000
9000
10000
11000.01 .05 .10 .25 .50 .75 .90 .95
.5 1.0 1.5 2.0 2.5
Log Normal Quantile
Inha
latio
n U
E (m
g/lb
ai)
0
10
20
30
40
50
60
70
80.001.01.05.10.25 .50 .75 .90 .95
0 1 2 3 4 5 6 7 8 9 10 1
Log Normal Quantile

Formulation: Dusts/Powders Equipment/Application Method: Shaker can
U.S. EPA Office of Pesticide Programs – Standard Operating Procedures for Assessing Residential Pesticide Exposure C-38
Available Handler Exposure Studies
Table C-50: Exposure Study Identification Information
Citation
Merricks, D. (1997) Carbaryl Applicator Exposure Study During Application of Sevin 5 Dust to Dogs by the Non Professional: Lab Project Number: 1517: 10565: ML96 0662 RHP. Unpublished study prepared by Agrisearch Inc., Rhone Poulenc Ag Co. and Morse Laboratories, Inc. 212 p.
EPA MRID 44439901 ORETF Code NA EPA Review D287251
MRID = Master Record Identification ORETF = Outdoor Residential Exposure Task Force
Study Description: A total of 40 individuals – 20 with and 20 without chemical-resistant gloves – were monitored while applying a dust formulation (5% carbaryl) to dogs. Each application, lasting approximately 7 minutes, consisted of an individual using a 1 lb shaker can to apply an average of 0.15 lbs of dust (0.008 lbs carbaryl) to 3 dogs, then rubbing the dust into the dog’s coat. Dermal exposure was measured using inner and outer whole body dosimetry and hand washes. Inhalation exposure was measured using standard pumps (set at 2 liters per minute), cassettes, and tubing. Field fortification recoveries for passive dosimeters averaged >90% for inner and outer dosimeters. Face and neck wipe field fortifications average 87.6%. Inhalation tube field fortification averaged 100. Laboratory method validation for each matrix fell within the acceptable range of 70 to 120%.
Table C-51: MRID 44439901 – Checklist and Use Recommendation
Study Criteria Exposure Component Dermal Inhalation
Does the study provide detailed characteristics on the activity, equipment type, and amount of active ingredient handled? Yes
Does dermal exposure monitoring allow for construction of an exposure estimate for individuals wearing short-sleeve shirts, shorts, shoes, socks? Yes NA
Was exposure to the hands representative of bare hands? Yes NA Was the study intended to simulate “residential” exposure via the scripted activity, amount of active ingredient handled, volunteers used, or the setting? Yes
Is the data of reasonable quality (i.e., are field fortification and laboratory recovery samples adequate)? Yes Yes
Should this study be recommended for use in residential handler exposure assessments? Yes Yes
Data Summary: The following table summarizes pertinent exposure information from the above referenced study. Both dermal (individuals without chemical-resistant gloves only) and inhalation exposure are included since both are recommended for use in residential handler exposure assessment. The submitted study itself or corresponding analytical spreadsheets should be reviewed for further information.
Table C-52: MRID 44439901 – Data Summary
Person ID AaiH1 (lbs)
Exposure (mg) Unit Exposure (mg/lb ai)4 Dermal2 Inhalation3 Dermal Inhalation
1 0.005 -- 0.036 -- 7.20 2 0.015 -- 0.307 -- 20.47

Formulation: Dusts/Powders Equipment/Application Method: Shaker can
U.S. EPA Office of Pesticide Programs – Standard Operating Procedures for Assessing Residential Pesticide Exposure C-39
Table C-52: MRID 44439901 – Data Summary
Person ID AaiH1 (lbs)
Exposure (mg) Unit Exposure (mg/lb ai)4 Dermal2 Inhalation3 Dermal Inhalation
3 0.0034 34.15 0.220 10044 64.71 4 0.016 82.94 0.134 5184 8.38 5 0.005 -- 0.016 -- 3.20 6 0.008 -- 0.100 -- 12.50 7 0.0079 10.84 0.145 1372 18.35 8 0.0042 25.84 0.140 6152 33.33 9 0.01 -- 0.120 -- 12.00 10 0.0083 64.13 0.086 7726 10.36 11 0.002 -- 0.029 -- 14.50 12 0.007 -- 0.137 -- 19.57 13 0.0025 10.19 0.022 4076 8.80 14 0.003 10.76 0.038 3586 12.67 15 0.008 -- 0.062 -- 7.75 16 0.0068 18.19 0.098 2676 14.41 17 0.009 -- 0.094 -- 10.44 18 0.011 -- 0.221 -- 20.09 19 0.0068 15.49 0.091 2278 13.38 20 0.012 104.75 0.302 8729 25.17 21 0.008 -- 0.225 -- 28.13 22 0.017 -- 0.280 -- 16.47 23 0.0047 20.82 0.140 4431 29.79 24 0.022 84.35 0.280 3834 12.73 25 0.004 -- 0.048 -- 12.00 26 0.009 15.91 0.099 1711 11.00 27 0.002 -- 0.024 -- 12.00 28 0.008 -- 0.591 -- 73.88 29 0.0014 8.28 0.048 5914 34.29 30 0.0093 13.59 0.124 1599 13.33 31 0.005 -- 0.072 -- 14.40 32 0.005 -- 0.044 -- 8.80 33 0.014 29.36 0.293 2097 20.93 34 0.0069 23.17 0.120 3359 17.39 35 0.007 -- 0.043 -- 6.14 36 0.0064 24.96 0.039 3900 6.09 37 0.006 -- 0.027 -- 4.50 38 0.011 -- 0.269 -- 24.45 39 0.006 13.65 0.021 2275 3.50 40 0.004 13.86 0.098 3465 24.50
1 Amount of active ingredient Handled. 2 Representative of individuals wearing a short-sleeve shirt, shorts, shoes, socks and no chemical-resistant gloves. 3 Inhalation exposure (mg) = mg collected/pump flow rate (Lpm) * Breathing Rate (16.7 Lpm). 4 Unit Exposure = Exposure/AaiH.
Limitations: Though the above referenced study is useful for assessment of residential applications of dust/powder formulations using a shaker can, the following limitations are noted:
• Though the study was strictly conducted on dogs, it is recommended for all other uses as well since studies measuring exposure during shaker can applications of dust/powders to other sites are available. Such use introduces uncertainty.

Formulation: Dusts/Powders Equipment/Application Method: Shaker can
U.S. EPA Office of Pesticide Programs – Standard Operating Procedures for Assessing Residential Pesticide Exposure C-40
Table C-53: Exposure Study Identification Information
Citation
McKeown, K. (2001). Determination of Dermal and Inhalation Exposures to Tetrachlorvinphos (TCVP) During the Application of an Insecticide Powder to a Dog: Lab Project Number: 1556. Unpublished study prepared by The Hartz Mountain Corp. 215 p.
EPA MRID 45519601 ORETF Code NA EPA Review D278626
MRID = Master Record Identification ORETF = Outdoor Residential Exposure Task Force
Study Description: Five different applicators applied insecticidal powder (3.29% TCVP) using a shaker can to 3 different dogs for a total of 15 application events. Each application of approximately 1 ounce of product (approximately 0.0017 lbs TCVP) ranged between 2 and 3 minutes. Dermal exposure was measured using inner dosimetry underneath shorts and a short-sleeve shirt and hand washes (face/neck exposure was not measured). Inhalation exposure was measured using standard pumps (set at 15 liters per minute), cassettes, and tubing. Recoveries from field fortifications of exposure sampling matrices were variable. Field fortification recoveries averaged 96.9% ± 12.1 for handwipes, 82.12% ± 2.3 for inhalation samples, and 64.1% ± 12.4 for whole body dosimeters. For the whole body dosimeters, recoveries were low (48% ± 2 at the low fortification level of 10 μg and 72.2% ± 3.2 at the higher fortification levels of 500 and 3000 μg). Laboratory recoveries averaged 104.8% ± 7.1 for handwipes, 100.2% ± 9.3 for inhalation samples for the air filter/PUF plug, and 97.9% ± 9.2 whole body dosimeters.
Table C-54: MRID 45519601 – Checklist and Use Recommendation
Study Criteria Exposure Component Dermal Inhalation
Does the study provide detailed characteristics on the activity, equipment type, and amount of active ingredient handled? Yes
Does dermal exposure monitoring allow for construction of an exposure estimate for individuals wearing short-sleeve shirts, shorts, shoes, socks? Yes NA
Was exposure to the hands representative of bare hands? Yes NA Was the study intended to simulate “residential” exposure via the scripted activity, amount of active ingredient handled, volunteers used, or the setting? Yes
Is the data of reasonable quality (i.e., are field fortification and laboratory recovery samples adequate)? No Yes
Should this study be recommended for use in residential handler exposure assessments? No Yes
Data Summary: The following table summarizes pertinent exposure information from the above referenced study. Note that only inhalation exposure data are presented as the dermal exposure data are not recommended for use in residential handler exposure assessment. The submitted study itself or corresponding analytical spreadsheets should be reviewed for further information.
Table C-55: MRID 45519601 Data Summary
Person ID AaiH1 (lbs)
Exposure (mg) Unit Exposure (mg/lb ai)4 Dermal2 Inhalation3 Dermal Inhalation
A 0.0017 -- 0.0040 -- 2.35

Formulation: Dusts/Powders Equipment/Application Method: Shaker can
U.S. EPA Office of Pesticide Programs – Standard Operating Procedures for Assessing Residential Pesticide Exposure C-41
Table C-55: MRID 45519601 Data Summary
Person ID AaiH1 (lbs)
Exposure (mg) Unit Exposure (mg/lb ai)4 Dermal2 Inhalation3 Dermal Inhalation
A 0.0015 -- 0.0105 -- 7.00 A 0.0016 -- 0.0008 -- 0.50 B 0.0019 -- 0.0105 -- 5.53 B 0.0019 -- 0.0076 -- 4.00 B 0.0017 -- 0.0340 -- 20.00 C 0.0019 -- 0.0177 -- 9.32 C 0.0018 -- 0.0036 -- 2.00 C 0.0019 -- 0.0082 -- 4.32 D 0.0019 -- 0.0168 -- 8.84 D 0.0017 -- 0.0037 -- 2.18 D 0.0019 -- 0.0354 -- 18.63 E 0.0017 -- 0.0018 -- 1.06 E 0.0019 -- 0.0007 -- 0.37 E 0.0018 -- 0.0011 -- 0.61
1 Amount of active ingredient Handled. 2 Representative of individuals wearing a short-sleeve shirt, shorts, shoes, socks and no chemical-resistant gloves. 3 Inhalation exposure (mg) = mg collected/pump flow rate (Lpm) * Breathing Rate (16.7 Lpm). 4 Unit Exposure = Exposure/AaiH.
Limitations:
• Each individual handled the same amount of active ingredient making analysis of the relationship between exposure and the amount of active ingredient handled (the underlying basis of unit exposures) difficult.
• The use of 15 liters per minute is much higher than the standard setting of 1- 2 liters per minute and could complicate air sampling.

Formulation: Paints and Stains Equipment/Application Method: Airless sprayer
U.S. EPA Office of Pesticide Programs – Standard Operating Procedures for Assessing Residential Pesticide Exposure C-42
Scenario Summary
Table C-56: Scenario Description and Available Exposure Studies Formulation Paints and Stains Equipment/Application Method Airless sprayer
Application Site(s) outdoors and indoors (general paint and stain applications)
Available Exposure Studies Formella, T. (1995); MRID 43600102 PHED 467
Table C-57: Unit Exposures (mg/lb ai) – Paint/Stain Airless Sprayer Applications
Statistic Dermal Inhalation 50th percentile 88 0.38 75th percentile 190 0.69 95th percentile 540 1.6 99th percentile 1100 2.9 99.9th percentile 2700 5.7 AM (SD) 160 (250) 0.56 (0.60) GM (GSD) 88 (3.01) 0.38 (2.4) Range 12 – 480 0.078 – 1.6 N 15 51
Dermal Unit Exposure Data Summary: The recommended dermal unit exposures for applications of pesticide-containing paints or stains using an airless sprayer is based on a lognormal distribution fit with exposure monitoring data from PHED 467. PHED 467 monitored 15 applications of approximately 5 gallons of pesticide-containing stain with an airless sprayer. While another study was available that was also reasonably representative of residential applications, PHED 467 employed exposure monitoring methods that best represented the type of clothing a homeowner or amateur applicator would wear (i.e., shorts, short-sleeve shirt, no chemical-resistant gloves). Inhalation Unit Exposure Data Summary: The recommended inhalation unit exposures for applications of pesticide-containing paints or stains using an airless sprayer is based on a lognormal distribution fit with exposure monitoring data from Formella, T. (1995) [EPA MRID 43600102] and PHED 467. Formella, T. (1995) monitored 36 applications of approximately 5 gallons of pesticide-containing paint inside and outside houses for approximately 22-81 minutes using an airless sprayer. PHED 467 monitored 15 applications of approximately 5 gallons of pesticide-containing stain with an airless sprayer. Both studies were reasonably representative of residential applications with inhalation exposures of the same general magnitude, thus a composite dataset was utilized.

Formulation: Paints and Stains Equipment/Application Method: Airless sprayer
U.S. EPA Office of Pesticide Programs – Standard Operating Procedures for Assessing Residential Pesticide Exposure C-43
Lognormal Probability Plots Legend: ■ = PHED 467
Legend: X= Formella, T. (1995); O = PHED 467
Der
mal
UE
(mg/
lb a
i)
0
100
200
300
400
500.001.01.05.10 .25 .50 .75 .90 .95
0 1 2 3 4 5 6
Log Normal Quantile
Inha
latio
n U
E (m
g/lb
ai)
0
0.5
1
1.5
.001.01.05.10 .25 .50 .75 .90 .95
0 1 2 3 4 5 6
Log Normal Quantile
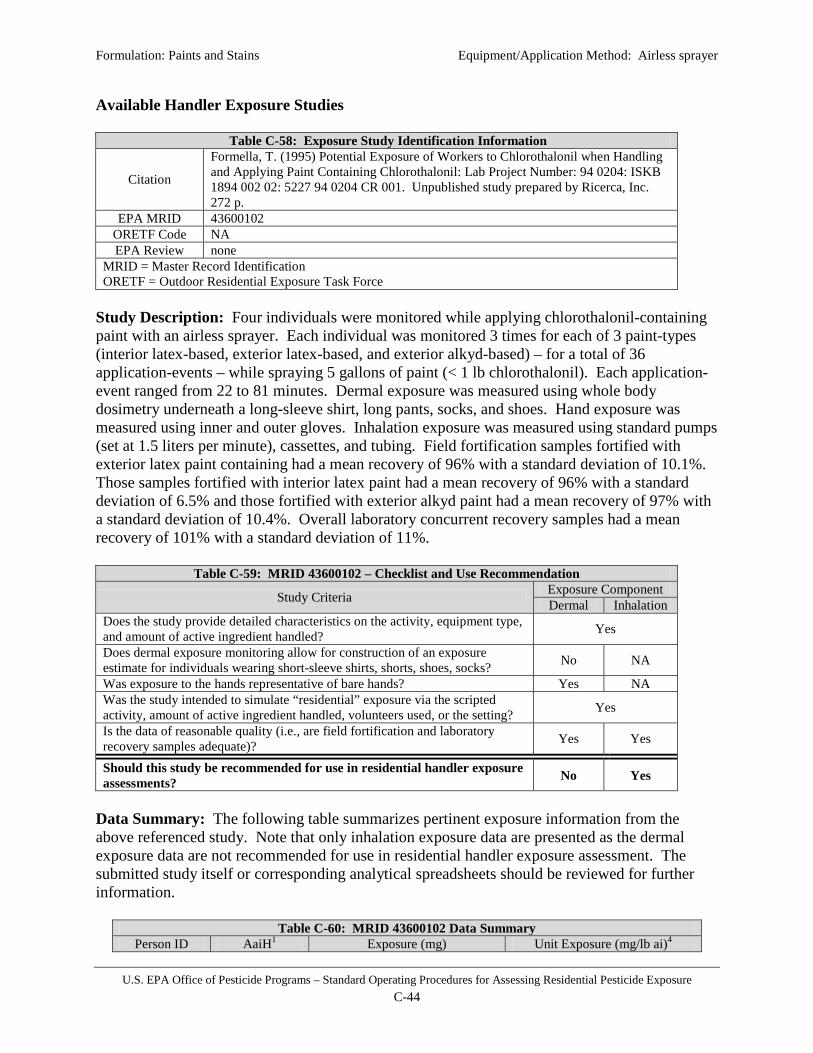
Formulation: Paints and Stains Equipment/Application Method: Airless sprayer
U.S. EPA Office of Pesticide Programs – Standard Operating Procedures for Assessing Residential Pesticide Exposure C-44
Available Handler Exposure Studies
Table C-58: Exposure Study Identification Information
Citation
Formella, T. (1995) Potential Exposure of Workers to Chlorothalonil when Handling and Applying Paint Containing Chlorothalonil: Lab Project Number: 94 0204: ISKB 1894 002 02: 5227 94 0204 CR 001. Unpublished study prepared by Ricerca, Inc. 272 p.
EPA MRID 43600102 ORETF Code NA EPA Review none
MRID = Master Record Identification ORETF = Outdoor Residential Exposure Task Force
Study Description: Four individuals were monitored while applying chlorothalonil-containing paint with an airless sprayer. Each individual was monitored 3 times for each of 3 paint-types (interior latex-based, exterior latex-based, and exterior alkyd-based) – for a total of 36 application-events – while spraying 5 gallons of paint (< 1 lb chlorothalonil). Each application-event ranged from 22 to 81 minutes. Dermal exposure was measured using whole body dosimetry underneath a long-sleeve shirt, long pants, socks, and shoes. Hand exposure was measured using inner and outer gloves. Inhalation exposure was measured using standard pumps (set at 1.5 liters per minute), cassettes, and tubing. Field fortification samples fortified with exterior latex paint containing had a mean recovery of 96% with a standard deviation of 10.1%. Those samples fortified with interior latex paint had a mean recovery of 96% with a standard deviation of 6.5% and those fortified with exterior alkyd paint had a mean recovery of 97% with a standard deviation of 10.4%. Overall laboratory concurrent recovery samples had a mean recovery of 101% with a standard deviation of 11%.
Table C-59: MRID 43600102 – Checklist and Use Recommendation
Study Criteria Exposure Component Dermal Inhalation
Does the study provide detailed characteristics on the activity, equipment type, and amount of active ingredient handled? Yes
Does dermal exposure monitoring allow for construction of an exposure estimate for individuals wearing short-sleeve shirts, shorts, shoes, socks? No NA
Was exposure to the hands representative of bare hands? Yes NA Was the study intended to simulate “residential” exposure via the scripted activity, amount of active ingredient handled, volunteers used, or the setting? Yes
Is the data of reasonable quality (i.e., are field fortification and laboratory recovery samples adequate)? Yes Yes
Should this study be recommended for use in residential handler exposure assessments? No Yes
Data Summary: The following table summarizes pertinent exposure information from the above referenced study. Note that only inhalation exposure data are presented as the dermal exposure data are not recommended for use in residential handler exposure assessment. The submitted study itself or corresponding analytical spreadsheets should be reviewed for further information.
Table C-60: MRID 43600102 Data Summary Person ID AaiH1 Exposure (mg) Unit Exposure (mg/lb ai)4
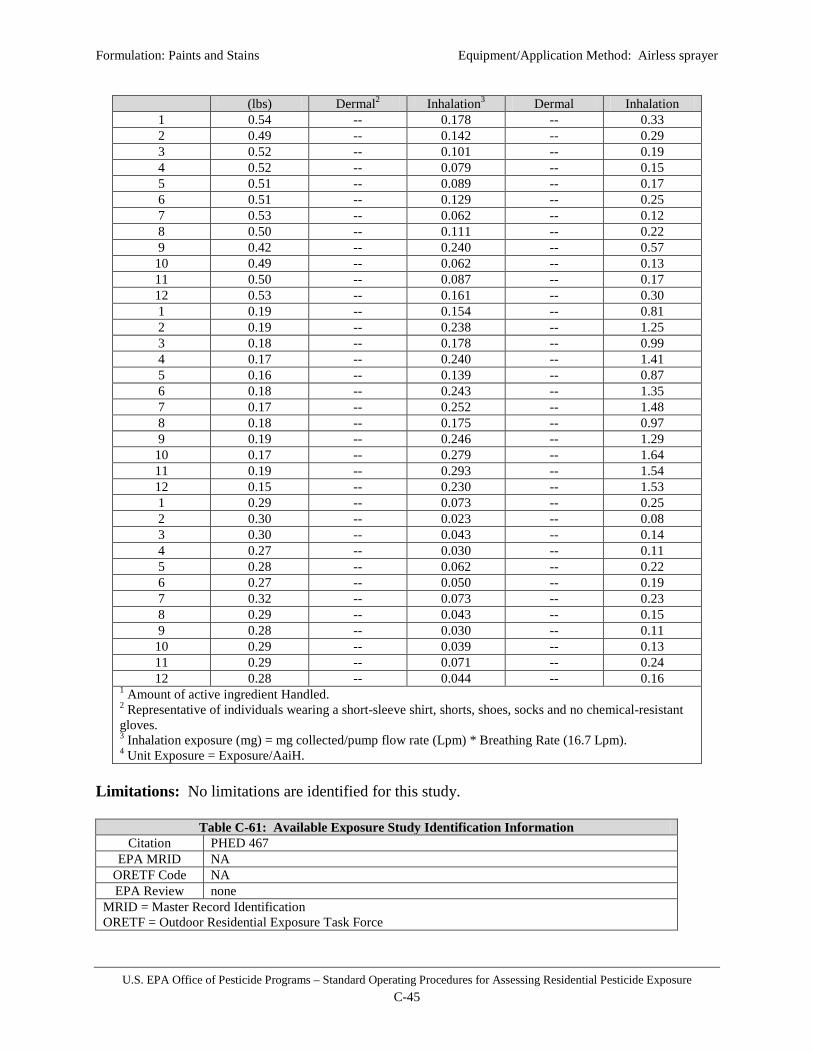
Formulation: Paints and Stains Equipment/Application Method: Airless sprayer
U.S. EPA Office of Pesticide Programs – Standard Operating Procedures for Assessing Residential Pesticide Exposure C-45
(lbs) Dermal2 Inhalation3 Dermal Inhalation 1 0.54 -- 0.178 -- 0.33 2 0.49 -- 0.142 -- 0.29 3 0.52 -- 0.101 -- 0.19 4 0.52 -- 0.079 -- 0.15 5 0.51 -- 0.089 -- 0.17 6 0.51 -- 0.129 -- 0.25 7 0.53 -- 0.062 -- 0.12 8 0.50 -- 0.111 -- 0.22 9 0.42 -- 0.240 -- 0.57 10 0.49 -- 0.062 -- 0.13 11 0.50 -- 0.087 -- 0.17 12 0.53 -- 0.161 -- 0.30 1 0.19 -- 0.154 -- 0.81 2 0.19 -- 0.238 -- 1.25 3 0.18 -- 0.178 -- 0.99 4 0.17 -- 0.240 -- 1.41 5 0.16 -- 0.139 -- 0.87 6 0.18 -- 0.243 -- 1.35 7 0.17 -- 0.252 -- 1.48 8 0.18 -- 0.175 -- 0.97 9 0.19 -- 0.246 -- 1.29 10 0.17 -- 0.279 -- 1.64 11 0.19 -- 0.293 -- 1.54 12 0.15 -- 0.230 -- 1.53 1 0.29 -- 0.073 -- 0.25 2 0.30 -- 0.023 -- 0.08 3 0.30 -- 0.043 -- 0.14 4 0.27 -- 0.030 -- 0.11 5 0.28 -- 0.062 -- 0.22 6 0.27 -- 0.050 -- 0.19 7 0.32 -- 0.073 -- 0.23 8 0.29 -- 0.043 -- 0.15 9 0.28 -- 0.030 -- 0.11 10 0.29 -- 0.039 -- 0.13 11 0.29 -- 0.071 -- 0.24 12 0.28 -- 0.044 -- 0.16
1 Amount of active ingredient Handled. 2 Representative of individuals wearing a short-sleeve shirt, shorts, shoes, socks and no chemical-resistant gloves. 3 Inhalation exposure (mg) = mg collected/pump flow rate (Lpm) * Breathing Rate (16.7 Lpm). 4 Unit Exposure = Exposure/AaiH.
Limitations: No limitations are identified for this study.
Table C-61: Available Exposure Study Identification Information Citation PHED 467
EPA MRID NA ORETF Code NA EPA Review none
MRID = Master Record Identification ORETF = Outdoor Residential Exposure Task Force

Formulation: Paints and Stains Equipment/Application Method: Airless sprayer
U.S. EPA Office of Pesticide Programs – Standard Operating Procedures for Assessing Residential Pesticide Exposure C-46
Study Description: Eight different individuals were monitored at 3 different sites (for a total of 15 application-events) while apply stain with an airless sprayer. Each application consisted of an individual applying a 5 gallon container of stain to approximately 1000 ft2. Dermal exposure was measured using gauze patches outside and inside standard cotton clothing. Hand exposure was measured using cotton gloves on the outside of protective latex gloves. Inhalation exposure was measured using standard pumps (set at 2 liters per minute), cassettes, and tubing. Field fortification recoveries averaged 80.3% for the patches, 90.7% for the filters, and 82.4% for the cotton gloves. The average recovery from laboratory fortified control samples that were analyzed with each set of test samples was 90.0% for white cotton gloves and 108.2% for polyurethane foam filters.
Table C-62: PHED 467 – Checklist and Use Recommendation
Study Criteria Exposure Component Dermal Inhalation
Does the study provide detailed characteristics on the activity, equipment type, and amount of active ingredient handled? Yes
Does dermal exposure monitoring allow for construction of an exposure estimate for individuals wearing short-sleeve shirts, shorts, shoes, socks? Yes NA
Was exposure to the hands representative of bare hands? Yes NA Was the study intended to simulate “residential” exposure via the scripted activity, amount of active ingredient handled, volunteers used, or the setting? Yes
Is the data of reasonable quality (i.e., are field fortification and laboratory recovery samples adequate)? Yes Yes
Should this study be recommended for use in residential handler exposure assessments? Yes Yes
Data Summary: The following table summarizes pertinent exposure information from the above referenced study. Both dermal and inhalation exposure are included since both are recommended for use in residential handler exposure assessment. The submitted study itself or corresponding analytical spreadsheets should be reviewed for further information.
Table C-63: PHED 467 Data Summary
Person ID AaiH1 (lbs)
Exposure (mg) Unit Exposure (mg/lb ai)4 Dermal2 Inhalation3 Dermal Inhalation
A 0.1667 80.16 0.073 481 0.441 A 0.1667 22.17 0.168 133 1.007 B 0.1667 5.15 0.036 31 0.215 C 0.1667 23.31 0.140 140 0.842 B 0.1667 25.11 0.114 151 0.681 D 0.1667 1.95 0.045 12 0.270 C 0.1667 16.88 0.084 101 0.501 D 0.1667 2.27 0.046 14 0.275 E 0.1667 43.29 0.120 260 0.721 E 0.1667 14.45 0.107 87 0.641 F 0.1667 24.01 0.114 144 0.686 G 0.1667 24.23 0.060 145 0.361 F 0.1667 44.72 0.037 268 0.220 G 0.1667 3.72 0.073 22 0.436 H 0.1667 12.94 0.114 78 0.686
1 Amount of active ingredient Handled. 2 Representative of individuals wearing a short-sleeve shirt, shorts, shoes, socks and no chemical-resistant

Formulation: Paints and Stains Equipment/Application Method: Airless sprayer
U.S. EPA Office of Pesticide Programs – Standard Operating Procedures for Assessing Residential Pesticide Exposure C-47
gloves. 3 Inhalation exposure (mg) = mg collected/pump flow rate (Lpm) * Breathing Rate (16.7 Lpm). 4 Unit Exposure = Exposure/AaiH.
Limitations: Though the above referenced study is useful for assessment of paint/stain applications using an airless sprayer, the following limitations are noted:
• Cotton gloves were used to measure hand exposure which, though used in the past as a frequent collection method for hand exposure may result in an overestimate.

Formulation: Paints and Stains Equipment/Application Method: Brush
U.S. EPA Office of Pesticide Programs – Standard Operating Procedures for Assessing Residential Pesticide Exposure C-48
Scenario Summary
Table C-64: Scenario Description and Available Exposure Studies Formulation Paints and Stains Equipment/Application Method Brush
Application Site(s) outdoors and indoors (general paint and stain applications) Available Exposure Studies PHED 467
Table C-65: Unit Exposures (mg/lb ai) – Paint/Stain Brush Applications
Statistic Dermal Inhalation 50th percentile 390 0.19 75th percentile 570 0.23 95th percentile 970 0.30 99th percentile 1400 0.37 99.9th percentile 2200 0.46 AM (SD) 450 (270) 0.20 (0.058) GM (GSD) 390 (1.7) 0.19 (1.3) Range 180 – 900 0.16 – 0.33 N 15 15
Dermal Unit Exposure Data Summary: The recommended dermal unit exposures for applications of pesticide-containing paints or stains using a brush is based on a lognormal distribution fit with exposure monitoring data from PHED 467. PHED 467 monitored 15 applications of approximately 1 gallon of pesticide-containing paint to an interior bathroom for approximately 34-94 minutes with 2- or 4-inch brushes. This was the only available study for this exposure scenario. Inhalation Unit Exposure Data Summary: The recommended inhalation unit exposures for applications of pesticide-containing paints or stains using a brush is based on a lognormal distribution fit with exposure monitoring data from PHED 467. PHED 467 monitored 15 applications of approximately 1 gallon of pesticide-containing paint to an interior bathroom for approximately 34-94 minutes with 2- or 4-inch brushes. This was the only available study for this exposure scenario.

Formulation: Paints and Stains Equipment/Application Method: Brush
U.S. EPA Office of Pesticide Programs – Standard Operating Procedures for Assessing Residential Pesticide Exposure C-49
Lognormal Probability Plots Legend: ■ = PHED 467
Legend: ■ = PHED 467
Derm
al UE
(mg/
lb ai)
100
200
300
400
500
600
700
800
900.01 .05 .10 .25 .50 .75 .90 .95
.5 1.0 1.5 2.0 2.5 3.
Log Normal Quantile
Inha
lation
UE
(mg/
lb ai)
0.15
0.2
0.25
0.3
0.35.05 .10 .25 .50 .75 .90 .95
.6 .7 .8 .9 1.0 1.1 1.2 1.3 1.4 1.5 1.6 1.7 1.8 1.
Log Normal Quantile

Formulation: Paints and Stains Equipment/Application Method: Brush
U.S. EPA Office of Pesticide Programs – Standard Operating Procedures for Assessing Residential Pesticide Exposure C-50
Available Exposure Studies
Table C-66: Exposure Study Identification Information Citation PHED 467
EPA MRID NA ORETF Code NA EPA Review none
MRID = Master Record Identification ORETF = Outdoor Residential Exposure Task Force Study Description: Ten different individuals were monitored at 3 different sites (for a total of 15 application-events) while applying approximately 1 gallon of paint with 2- or 4-inch brushes to an interior bathroom. Each application ranged from 34-94 minutes. Dermal exposure was measured using gauze patches outside and inside standard cotton clothing. Hand exposure was measured using cotton gloves on the outside of protective latex gloves. Inhalation exposure was measured using standard pumps (set at 2 liters per minute), cassettes, and tubing. Field fortification recoveries average 82.5% for patches, 87.5% for filters, and 74.7% for gloves. A laboratory storage stability study was initiated with each type of matrix. Patch samples had a recovery of 75.6%, gloves had 81.5%, and filters had a recovery of 94.6% after 89 days storage. The average recovery from laboratory fortified control samples averaged 87.5% for white cotton gloves and 99.0% for polyurethane foam air filters.
Table C-67: PHED 467 – Checklist and Use Recommendation
Study Criteria Exposure Component Dermal Inhalation
Does the study provide detailed characteristics on the activity, equipment type, and amount of active ingredient handled? Yes
Does dermal exposure monitoring allow for construction of an exposure estimate for individuals wearing short-sleeve shirts, shorts, shoes, socks? Yes NA
Was exposure to the hands representative of bare hands? Yes NA Was the study intended to simulate “residential” exposure via the scripted activity, amount of active ingredient handled, volunteers used, or the setting? Yes
Is the data of reasonable quality (i.e., are field fortification and laboratory recovery samples adequate)? Yes Yes
Should this study be recommended for use in residential handler exposure assessments? Yes Yes
Data Summary: The following table summarizes pertinent exposure information from the above referenced study. Both dermal and inhalation exposure are included since both are recommended for use in residential handler exposure assessment. The submitted study itself or corresponding analytical spreadsheets should be reviewed for further information.
Table C-68: PHED 467 – Data Summary
Person ID AaiH1 (lbs)
Exposure (mg) Unit Exposure (mg/lb ai)4 Dermal2 Inhalation3 Dermal Inhalation
AA 0.0253 5.82 0.00835 230 0.330 BB 0.0253 4.87 0.00835 193 0.330 CC 0.051 18.32 0.00835 359 0.164 DD 0.051 12.35 0.00835 488 0.164 EE 0.051 4.75 0.00835 188 0.164
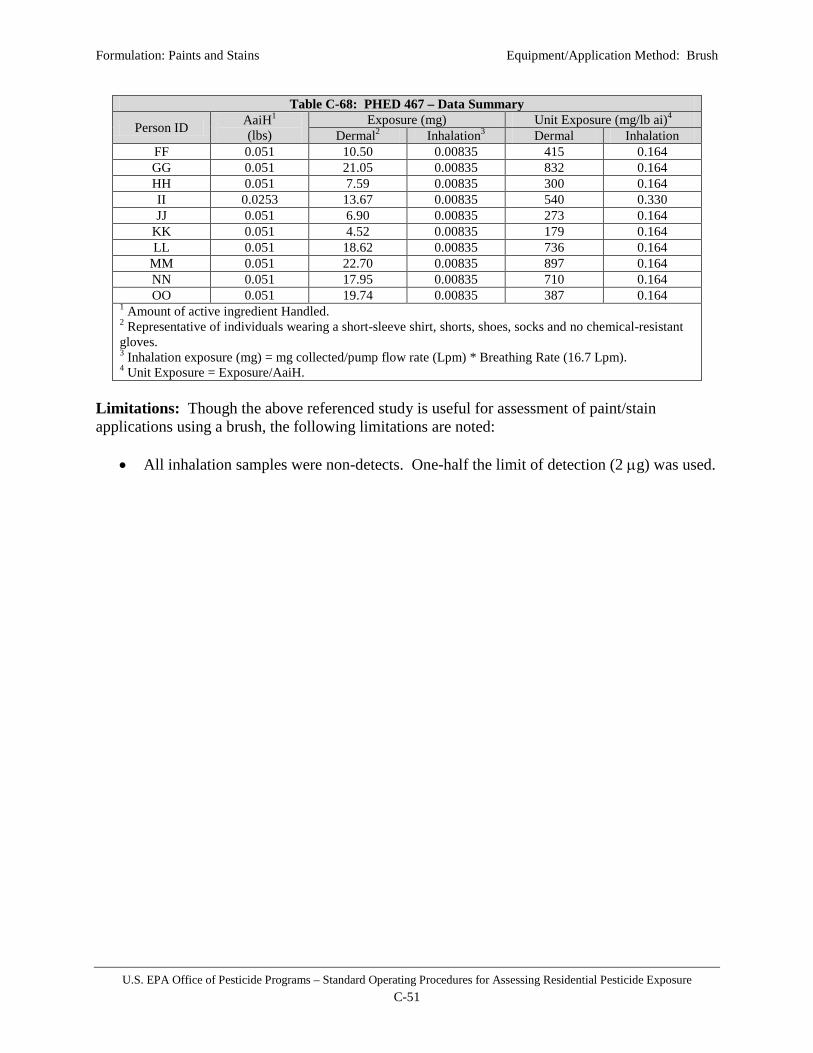
Formulation: Paints and Stains Equipment/Application Method: Brush
U.S. EPA Office of Pesticide Programs – Standard Operating Procedures for Assessing Residential Pesticide Exposure C-51
Table C-68: PHED 467 – Data Summary
Person ID AaiH1 (lbs)
Exposure (mg) Unit Exposure (mg/lb ai)4 Dermal2 Inhalation3 Dermal Inhalation
FF 0.051 10.50 0.00835 415 0.164 GG 0.051 21.05 0.00835 832 0.164 HH 0.051 7.59 0.00835 300 0.164 II 0.0253 13.67 0.00835 540 0.330 JJ 0.051 6.90 0.00835 273 0.164
KK 0.051 4.52 0.00835 179 0.164 LL 0.051 18.62 0.00835 736 0.164
MM 0.051 22.70 0.00835 897 0.164 NN 0.051 17.95 0.00835 710 0.164 OO 0.051 19.74 0.00835 387 0.164
1 Amount of active ingredient Handled. 2 Representative of individuals wearing a short-sleeve shirt, shorts, shoes, socks and no chemical-resistant gloves. 3 Inhalation exposure (mg) = mg collected/pump flow rate (Lpm) * Breathing Rate (16.7 Lpm). 4 Unit Exposure = Exposure/AaiH.
Limitations: Though the above referenced study is useful for assessment of paint/stain applications using a brush, the following limitations are noted:
• All inhalation samples were non-detects. One-half the limit of detection (2 µg) was used.

Formulation: Mothballs Equipment/Application Method: Hand
U.S. EPA Office of Pesticide Programs – Standard Operating Procedures for Assessing Residential Pesticide Exposure C-52
Scenario Summary
Table C-69: Scenario Description and Available Exposure Studies Formulation Mothballs Equipment/Application Method Hand placement Application Site(s) Cabinets, sheds, closets Available Exposure Studies Waggoner, T. (1994); MRID 43716501
Table C-70: Unit Exposures (mg/lb ai) – Mothball Applications by Hand Statistic Dermal Inhalation
50th percentile 0.021
Inhalation exposure while placing mothballs in cabinets, closets, etc. is
assumed negligible. The post-application inhalation exposure
assessment is considered protective of handler inhalation exposure.
75th percentile 0.060 95th percentile 0.28 99th percentile 0.81 99.9th percentile 2.7 AM (SD) 0.072 (0.24) GM (GSD) 0.021 (4.8) Range 0.032 – 0.078 N 3 Dermal Unit Exposure Data Summary: The recommended dermal unit exposures for applications of pesticide-containing mothballs by hand is based on a lognormal distribution fit with exposure monitoring data from Waggoner, T. (1990) [EPA MRID 43716501]. Waggoner, T. (1990) monitored 3 applications of mothballs in closets and dresser drawers in 3 residences in Georgia by hand. This was the only study available for this exposure scenario. Inhalation Unit Exposure Data Summary: Inhalation exposure while placing mothballs in cabinets, closets, etc. is assumed negligible.
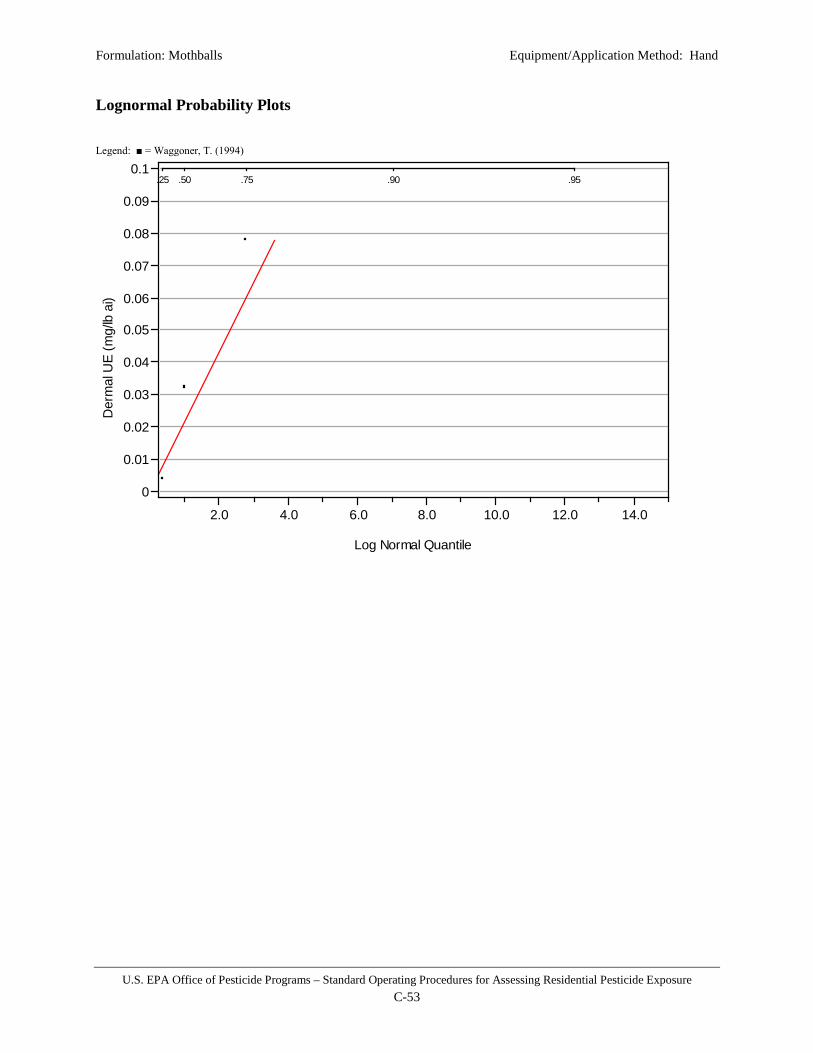
Formulation: Mothballs Equipment/Application Method: Hand
U.S. EPA Office of Pesticide Programs – Standard Operating Procedures for Assessing Residential Pesticide Exposure C-53
Lognormal Probability Plots Legend: ■ = Waggoner, T. (1994)
Der
mal
UE
(mg/
lb a
i)
0
0.01
0.02
0.03
0.04
0.05
0.06
0.07
0.08
0.09
0.1.25 .50 .75 .90 .95
2.0 4.0 6.0 8.0 10.0 12.0 14.0
Log Normal Quantile

Formulation: Mothballs Equipment/Application Method: Hand
U.S. EPA Office of Pesticide Programs – Standard Operating Procedures for Assessing Residential Pesticide Exposure C-54
Available Exposure Studies
Table C-71: Exposure Study Identification Information
Citation
Waggoner, T. (1994) Estimation of Homeowner Exposure to LX1298-01 (Napthalene) Resulting from Simulated Residential Use as an Insect Repellent: Final Report: Lab Project Number: 93-9083: 92-298-01-21H-02: 92-298-01-21H-03. Unpublished study prepared by Landis International, Inc. and Pharmaco LSR, Inc. 100 p.
EPA MRID 43716501 ORETF Code NA EPA Review D340008
MRID = Master Record Identification ORETF = Outdoor Residential Exposure Task Force
Study Description: Three individuals were monitored while placing mothballs in closets and dresser drawers in 3 residences in Georgia (1 person monitored in each residence for a total of 3 application-events). Each application consisted of weighing the mothballs (so as to place approximately 1.0 lb naphthalene per 50 ft3 of space), placing mothballs in closets and/or dresser drawers and closing the closet or dresser drawer. The amount of naphthalene used ranged from 1.34 lbs to 2.2 lbs. Dermal exposure was monitored for hands only using cotton gloves. Inhalation exposure was monitored during the placement of the mothballs using standard pumps (set at 0.5 liter per minute), cassettes, and tubing – but the results were not reported. Recoveries from field fortifications of exposure sampling matrices were not reported.
Table C-72: MRID 43716501 – Checklist and Use Recommendation
Study Criteria Exposure Component Dermal Inhalation
Does the study provide detailed characteristics on the activity, equipment type, and amount of active ingredient handled? No
Does dermal exposure monitoring allow for construction of an exposure estimate for individuals wearing short-sleeve shirts, shorts, shoes, socks? No NA
Was exposure to the hands representative of bare hands? Yes NA Was the study intended to simulate “residential” exposure via the scripted activity, amount of active ingredient handled, volunteers used, or the setting? Yes
Is the data of reasonable quality (i.e., are field fortification and laboratory recovery samples adequate)? No No
Should this study be recommended for use in residential handler exposure assessments? Yes No
Data Summary: The following table summarizes pertinent exposure information from the above referenced study. Both dermal and inhalation exposure are included since both are recommended for use in residential handler exposure assessment. The submitted study itself or corresponding analytical spreadsheets should be reviewed for further information.
Table C-73: MRID 43716501 – Data Summary
Person ID AaiH1 (lbs)
Exposure (mg) Unit Exposure (mg/lb ai)4 Dermal2 Inhalation3 Dermal Inhalation
A 2.2 0.0081 -- 0.004 -- B 1.3 0.1040 -- 0.078 --

Formulation: Mothballs Equipment/Application Method: Hand
U.S. EPA Office of Pesticide Programs – Standard Operating Procedures for Assessing Residential Pesticide Exposure C-55
C 1.5 0.0465 -- 0.032 -- 1 Amount of active ingredient Handled. 2 Representative of individuals wearing a short-sleeve shirt, shorts, shoes, socks and no chemical-resistant gloves. 3 Inhalation exposure (mg) = mg collected/pump flow rate (Lpm) * Breathing Rate (16.7 Lpm). Since “applicator” inhalation samples were not reported, the highest reported post-application inhalation exposures are shown. 4 Unit Exposure = Exposure/AaiH.
Limitations:
• The adequacy of the results is compromised due to the limited sample size. • Inhalation exposure during application of mothballs was not reported.

Formulation: Liquids Equipment/Application Method: Manually-pressurized handwand
U.S. EPA Office of Pesticide Programs – Standard Operating Procedures for Assessing Residential Pesticide Exposure C-56
Scenario Summary
Table C-74: Scenario Description and Available Exposure Studies Formulation Liquids (emulsifiable concentrates, soluble concentrates, etc.) Equipment/Application Method Manually-pressurized handwand (also: handheld pump sprayer)
Application Site(s) outdoors (lawns, gardens, trees/bushes, perimeter, mounds/nests, aquatic areas), indoors (general broadcast treatments, baseboards, cracks and crevices)
Available Exposure Studies
Merricks, D.L. (1997); MRID 44459801 Merricks, D.L. (1998); MRID 44518501 PHED 471 PHED 1024 Stewart, P., et al. (1999) PHED 468 Rosenheck, L. (2000); MRID 45184305
Table C-75: Unit Exposures (mg/lb ai) – Liquid Manually-pressurized Handwand Applications
Statistic Indoor Uses Outdoor Uses Dermal Inhalation Dermal Inhalation
50th percentile Studies measuring exposure while
mixing/loading/applying liquid formulations indoors using a manually-pressurized
handwand are unavailable. The dataset for mixing/loading/applying wettable powder formulations indoors should be used as a
surrogate.
36 0.0069 75th percentile 73 0.018 95th percentile 204 0.069 99th percentile 422 0.178 99.9th percentile 949 0.517 AM (SD) 63 (91) 0.018 (0.045) GM (GSD) 36 (2.89) 0.0069 (4.0) Range 1.75 – 354 0.0021 – 0.742 N 50 69
Dermal Unit Exposure Data Summary
Outdoor Environments: The recommended dermal unit exposures for applications of liquid pesticide formulations using a manually-pressurized handwand in outdoor environments is based on a lognormal distribution fit with exposure monitoring data from Merricks, D.L. (1997) [EPA MRID 44459801], Merricks, D.L. (1998) [EPA MRID 44518501], and Rosenheck, L. (2000) [EPA MRID 45184305]. Merricks, D.L. (1997) monitored 40 applications of a liquid pesticide formulation for approximately 20 minutes to tomato and cucumber gardens using a manually-pressurized handwand. Merricks, D.L. (1998) monitored 20 applications of a liquid pesticide formulation for approximately 20 minutes to citrus trees and shrubs using a manually-pressurized handwand. Rosenheck, L. (2000) monitored 10 applications of a liquid pesticide formulation ranging from 25 to 44 minutes to lawns, gardens, ornamentals, shrubs, and house foundations. These studies best represent outdoor residential use of this type of equipment – while other studies are more occupational in nature – and the exposure monitoring enables representation of the type of clothing a homeowner or amateur applicator would wear (i.e., shorts, short-sleeve shirt, no chemical-resistant gloves). As the results were generally of the same magnitude, they were combined into one dataset.
Formulation: Liquids Equipment/Application Method: Manually-pressurized handwand
U.S. EPA Office of Pesticide Programs – Standard Operating Procedures for Assessing Residential Pesticide Exposure C-57
Indoor Environments: Dermal exposure monitoring data for applications of liquid pesticide formulations using a manually-pressurized handwand in indoor environments is unavailable; dermal unit exposures for applications of wettable powder pesticide formulations using a manually-pressurized handwand in indoor environments are recommended as surrogate data.
Inhalation Unit Exposure Data Summary
Outdoor Environments: The recommended inhalation unit exposures for applications of liquid pesticide formulations using a manually-pressurized handwand in outdoor environments is based on a lognormal distribution fit with exposure monitoring data from Merricks, D.L. (1997) [EPA MRID 44459801], Merricks, D.L. (1998) [EPA MRID 44518501], and Rosenheck, L. (2000). Merricks, D.L. (1997) monitored 40 applications of a liquid pesticide formulation for approximately 20 minutes to tomato and cucumber gardens using a manually-pressurized handwand. Merricks, D.L. (1998) monitored 20 applications of a liquid pesticide formulation for approximately 20 minutes to citrus trees and shrubs using a manually-pressurized handwand. Rosenheck, L. (2000) monitored 10 applications of a liquid pesticide formulation ranging from 25 to 44 minutes to lawns, gardens, ornamentals, shrubs, and house foundations. These studies best represent outdoor residential use of this type of equipment – other available studies are more occupational in nature. Additionally, despite Rosenheck, L. (2000) resulting in considerably higher inhalation exposures, the datasets were combined. Indoor Environments: Inhalation exposure monitoring data for applications of liquid pesticide formulations using a manually-pressurized handwand in indoor environments is unavailable; inhalation unit exposures for applications of wettable powder pesticide formulations using a manually-pressurized handwand in indoor environments are recommended as surrogate data.
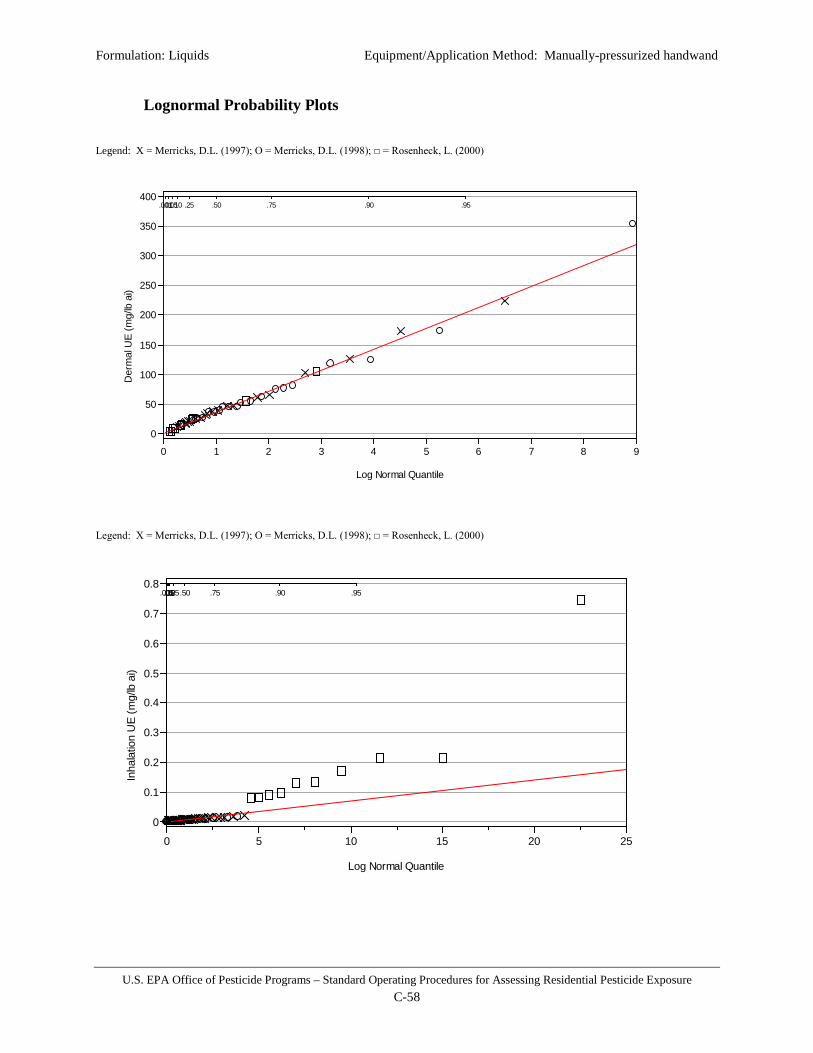
Formulation: Liquids Equipment/Application Method: Manually-pressurized handwand
U.S. EPA Office of Pesticide Programs – Standard Operating Procedures for Assessing Residential Pesticide Exposure C-58
Lognormal Probability Plots Legend: X = Merricks, D.L. (1997); O = Merricks, D.L. (1998); □ = Rosenheck, L. (2000)
Legend: X = Merricks, D.L. (1997); O = Merricks, D.L. (1998); □ = Rosenheck, L. (2000)
Der
mal
UE
(mg/
lb a
i)
0
50
100
150
200
250
300
350
400.001.01.05.10 .25 .50 .75 .90 .95
0 1 2 3 4 5 6 7 8 9
Log Normal Quantile
Inha
latio
n U
E (m
g/lb
ai)
0
0.1
0.2
0.3
0.4
0.5
0.6
0.7
0.8.001.01.05.10.25.50 .75 .90 .95
0 5 10 15 20 25
Log Normal Quantile

Formulation: Liquids Equipment/Application Method: Manually-pressurized handwand
U.S. EPA Office of Pesticide Programs – Standard Operating Procedures for Assessing Residential Pesticide Exposure C-59
Available Exposure Studies
Table C-76: Exposure Study Identification Information
Citation Merricks, D.L. (1997). Carbaryl Mixer/Loader/Applicator Exposure Study during Application of RP-2 Liquid (21%), Sevin® Ready to Use Insect Spray or Sevin® 10 Dust to Home Garden Vegetables
EPA MRID 44459801 ORETF Code OMA006
EPA Review Memo from G. Bangs to D. Fuller (3/5/03) D287251
MRID = Master Record Identification ORETF = Outdoor Residential Exposure Task Force Study Description: Forty individuals were monitored while mixing, loading, and applying a liquid formulation (21% carbaryl) to tomato and cucumber gardens using a manually-pressurized handwand. Each application was approximately 20 minutes and consisted of loading the manually-pressurized handwand and applying approximately 0.07 lbs formulation (approximately 0.01 gallons; 0.02 lbs carbaryl) in 2 gallons of water to garden plants. Dermal exposure was measured using inner and outer whole body dosimetry and hand washes (20 individuals were monitored without gloves). Inhalation exposure was measured using standard pumps (set at 2 liters per minute), cassettes, and tubing. Field fortification recoveries for passive dosimeters averaged 84.3% for inner dosimeters and 77.7% for outer dosimeters. Face and neck wipe field fortifications averaged 84.8%. Both handwash and inhalation tube field fortification averaged >90%. Laboratory method validation for each matrix fell within the acceptable range of 70 to 120%. The limit of quantitation (LOQ) was 1.0 µg/sample for all media except the inhalation monitors where the LOQ was 0.01 µg/sample. The limit of detection (LOD) was 0.5 µg/sample for all media except the inhalation monitors where the LOQ was 0.005 µg/sample.
Table C-77: MRID 44459801 – Checklist and Use Recommendation for
Study Criteria Exposure Component Dermal Inhalation
Does the study provide detailed characteristics on the activity, equipment type, and amount of active ingredient handled? Yes
Does dermal exposure monitoring allow for construction of an exposure estimate for individuals wearing short-sleeve shirts, shorts, shoes, socks? Yes NA
Was exposure to the hands representative of bare hands? Yes NA Was the study intended to simulate “residential” exposure via the scripted activity, amount of active ingredient handled, volunteers used, or the setting? Yes
Is the data of reasonable quality (i.e., are field fortification and laboratory recovery samples adequate)? Yes Yes
Should this study be recommended for use in residential handler exposure assessments? Yes Yes
Data Summary: The following table summarizes pertinent exposure information from the above referenced study. Both dermal and inhalation exposure are included since both are recommended for use in residential handler exposure assessment. Note that only dermal exposure data representative of individuals wearing short-sleeve shirt, shorts, shoes, socks, and no chemical-resistant gloves are presented. The submitted study itself or corresponding analytical spreadsheets should be reviewed for further information.

Formulation: Liquids Equipment/Application Method: Manually-pressurized handwand
U.S. EPA Office of Pesticide Programs – Standard Operating Procedures for Assessing Residential Pesticide Exposure C-60
Table C-78: MRID 44459801 – Data Summary
Person ID AaiH1 (lbs)
Exposure (mg) Unit Exposure (mg/lb ai)4 Dermal2 Inhalation3 Dermal Inhalation
P2 0.018 -- 0.00017 -- 0.0094 Q2 0.019 -- 0.00004 -- 0.0023 R2 0.015 -- 0.00009 -- 0.0067 S2 0.017 -- 0.00008 -- 0.0041 V2 0.013 -- 0.00004 -- 0.0041 W2 0.017 -- 0.00004 -- 0.0041 X2 0.019 -- 0.00004 -- 0.0033 Y2 0.019 -- 0.00004 -- 0.0022 B3 0.017 -- 0.00004 -- 0.0032 C3 0.019 -- 0.00008 -- 0.0044 D3 0.019 -- 0.00004 -- 0.0021 E3 0.013 -- 0.00004 -- 0.0027 H3 0.018 -- 0.00017 -- 0.0131 I3 0.019 -- 0.00025 -- 0.0129 J3 0.019 -- 0.00004 -- 0.0023 K3 0.019 -- 0.00004 -- 0.0027 N3 0.015 -- 0.00004 -- 0.0027 O3 0.019 -- 0.00004 -- 0.0027 P3 0.015 -- 0.00016 -- 0.0107 Q3 0.019 -- 0.00017 -- 0.0101 A 0.018 1.16 0.00008 65 0.0047 B 0.018 0.88 0.00004 46 0.0022 G 0.013 0.30 0.00008 20 0.0053 C 0.020 2.84 0.00026 171 0.0155 J 0.010 0.21 0.00004 17 0.0033 D 0.010 3.71 0.00008 224 0.0050 M 0.013 0.33 0.00008 17 0.0044 N 0.019 1.14 0.00025 60 0.0131 Q 0.013 0.32 0.00004 19 0.0025 R 0.019 0.65 0.00017 34 0.0087 U 0.020 0.21 0.00004 11 0.0022 V 0.015 0.59 0.00025 46 0.0197 Y 0.013 1.81 0.00004 102 0.0023 Z 0.019 0.47 0.00004 25 0.0022
C2 0.018 2.39 0.00017 125 0.0087 D2 0.015 0.69 0.00008 36 0.0044 G2 0.015 0.45 0.00004 30 0.0027 H2 0.015 0.49 0.00017 26 0.0087 K2 0.015 0.16 0.00004 10 0.0027 L2 0.017 0.72 0.00008 38 0.0044
1 Amount of active ingredient Handled. 2 Representative of individuals wearing a short-sleeve shirt, shorts, shoes, socks and no chemical-resistant gloves. 3 Inhalation exposure (mg) = mg collected/pump flow rate (Lpm) * Breathing Rate (16.7 Lpm). 4 Unit Exposure = Exposure/AaiH.
Limitations: Though the above referenced study is useful for assessment of residential applications of liquid concentrate formulations using a manually-pressurized handwand, the following limitations are noted:

Formulation: Liquids Equipment/Application Method: Manually-pressurized handwand
U.S. EPA Office of Pesticide Programs – Standard Operating Procedures for Assessing Residential Pesticide Exposure C-61
• Each individual handled the same amount of active ingredient, making analysis of the relationship between exposure and the amount of active ingredient handled (the underlying basis of unit exposures) difficult.
Table C-79: Exposure Study Identification Information
Citation Merricks, D.L. (1998). Carbaryl Mixer/Loader/Applicator Exposure Study During Application of RP-2 Liquid (21%) to Fruit Trees and Ornamental Plants
EPA MRID 44518501 ORETF Code OMA005
EPA Review Memo from G. Bangs to D. Fuller (3/5/03) D287251
MRID = Master Record Identification ORETF = Outdoor Residential Exposure Task Force Study Description: Twenty individuals were monitored while loading and applying a liquid formulation (21% carbaryl) to citrus trees and shrubs using a manually-pressurized handwand. Each application consisted of pouring the formulation into the tank and spraying the trees – all lasting less than 20 minutes. The amount of carbaryl handled ranged from 0.02 to 0.09 lbs. Dermal exposure was measured using inner and outer whole body dosimetry and hand washes (individuals were monitored without gloves). Inhalation exposure was measured using standard pumps (set at 2 liters per minute), cassettes, and tubing. Field fortification recoveries for passive dosimeters averaged 88.3% for inner and 76.2% for outer dosimeters. Face and neck wipe fortifications averaged 82.5%. Handwash fortifications averaged 93.6% and air sampler tube fortification was 91.8%. Laboratory method validation for each matrix fell within the acceptable range of 70 to 120%. The limit of quantitation (LOQ) was 1.0 µg/sample for all media except the inhalation monitors where the LOQ was 0.01 µg/sample. The limit of detection (LOD) was 0.5 µg/sample for all media except the inhalation monitors where the LOQ was 0.005 µg/sample.
Table C-80: MRID 44518501 – Checklist and Use Recommendation
Study Criteria Exposure Component Dermal Inhalation
Does the study provide detailed characteristics on the activity, equipment type, and amount of active ingredient handled? Yes
Does dermal exposure monitoring allow for construction of an exposure estimate for individuals wearing short-sleeve shirts, shorts, shoes, socks? Yes NA
Was exposure to the hands representative of bare hands? Yes NA Was the study intended to simulate “residential” exposure via the scripted activity, amount of active ingredient handled, volunteers used, or the setting? Yes
Is the data of reasonable quality (i.e., are field fortification and laboratory recovery samples adequate)? Yes Yes
Should this study be recommended for use in residential handler exposure assessments? Yes Yes
Data Summary: The following table summarizes pertinent exposure information from the above referenced study. Both dermal and inhalation exposure are included since both are recommended for use in residential handler exposure assessment. The submitted study itself or corresponding analytical spreadsheets should be reviewed for further information.
Table C-81: MRID 44518501 – Data Summary Person ID AaiH1 Exposure (mg) Unit Exposure (mg/lb ai)4

Formulation: Liquids Equipment/Application Method: Manually-pressurized handwand
U.S. EPA Office of Pesticide Programs – Standard Operating Procedures for Assessing Residential Pesticide Exposure C-62
(lbs) Dermal2 Inhalation3 Dermal Inhalation 2 0.018 0.45 0.000042 25 0.0023 4 0.015 0.79 0.000042 52 0.0027 6 0.020 2.57 0.000042 126 0.0021 8 0.019 0.51 0.000042 27 0.0022 10 0.013 4.52 0.000042 354 0.0033 12 0.014 0.78 0.000043 56 0.0031 14 0.018 2.12 0.000042 119 0.0023 16 0.020 3.52 0.000167 174 0.0083 18 0.017 0.75 0.000084 45 0.0050 20 0.015 0.61 0.000167 40 0.0109 22 0.019 0.88 0.000042 46 0.0022 24 0.018 0.27 0.000042 15 0.0023 26 0.018 0.64 0.000043 36 0.0024 28 0.020 1.66 0.000042 82 0.0021 30 0.015 1.17 0.000257 77 0.0168 32 0.018 1.34 0.000086 75 0.0048 34 0.020 0.92 0.000042 46 0.0021 36 0.017 0.61 0.000251 37 0.0151 38 0.020 0.50 0.000042 25 0.0021 40 0.018 1.13 0.000167 63 0.0094
1 Amount of active ingredient Handled. 2 Representative of individuals wearing a short-sleeve shirt, shorts, shoes, socks and no chemical-resistant gloves. 3 Inhalation exposure (mg) = mg collected/pump flow rate (Lpm) * Breathing Rate (16.7 Lpm). 4 Unit Exposure = Exposure/AaiH.
Limitations: Though the above referenced study is useful for assessment of residential applications of liquid concentrate formulations using a manually-pressurized handwand, the following limitations are noted:
• Each individual handled the same amount of active ingredient, making analysis of the relationship between exposure and the amount of active ingredient handled (the underlying basis of unit exposures) difficult.
Table C-82: Exposure Study Identification Information
Citation PHED 471 EPA MRID NA
ORETF Code NA EPA Review None
MRID = Master Record Identification ORETF = Outdoor Residential Exposure Task Force Study Description: Four workers at 4 different sites (for a total of 16 application events) were monitored while mixing, loading, and applying a liquid formulation to poultry litter using a manually-pressurized handwand. Each applicator mixed and applied 3, 2-gallon solutions (equal to approximately 0.052 lbs active ingredient), a task that lasted on average 53 minutes. Dermal exposure was measured using gauze patches (both inside and outside normal work clothing) and cotton gloves (underneath chemical-resistant gloves) for hand exposure. Inhalation exposure was measured using standard pumps (set at 2 liters per minute), cassettes, and tubing. All inhalation samples were non-detects. An average of 84.9 ± 5.2 (n=18) was recovered from field
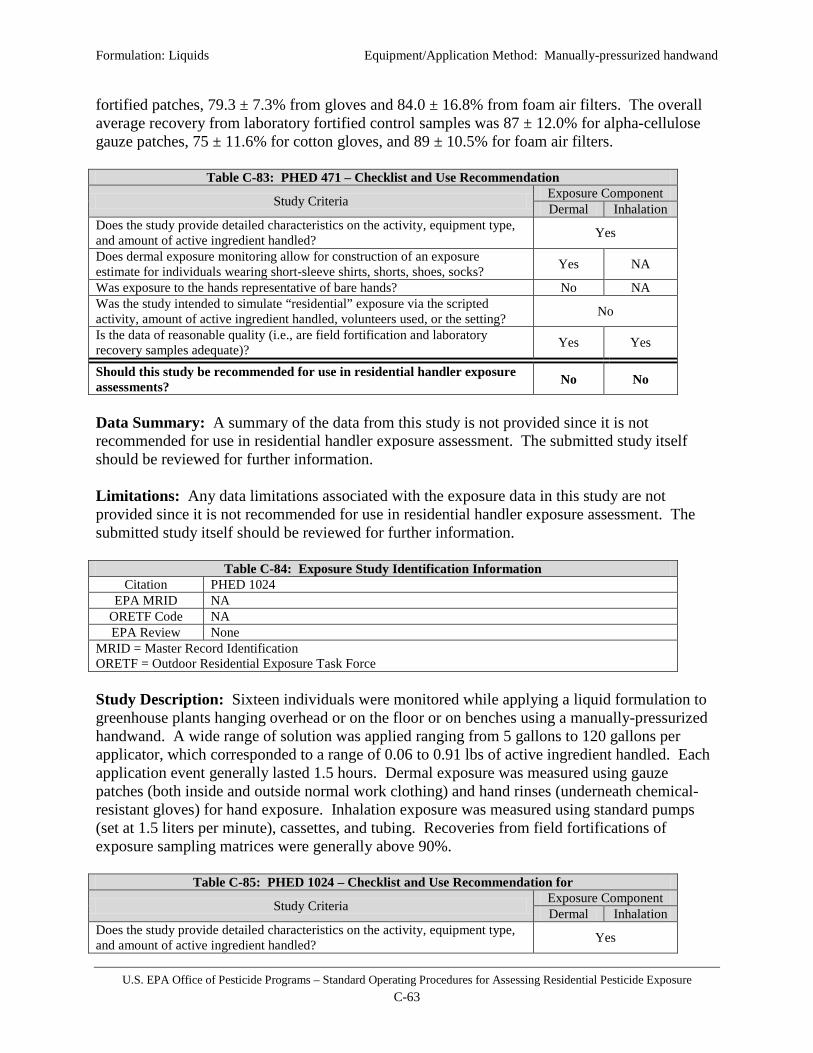
Formulation: Liquids Equipment/Application Method: Manually-pressurized handwand
U.S. EPA Office of Pesticide Programs – Standard Operating Procedures for Assessing Residential Pesticide Exposure C-63
fortified patches, 79.3 ± 7.3% from gloves and 84.0 ± 16.8% from foam air filters. The overall average recovery from laboratory fortified control samples was 87 ± 12.0% for alpha-cellulose gauze patches, 75 ± 11.6% for cotton gloves, and 89 ± 10.5% for foam air filters.
Table C-83: PHED 471 – Checklist and Use Recommendation
Study Criteria Exposure Component Dermal Inhalation
Does the study provide detailed characteristics on the activity, equipment type, and amount of active ingredient handled? Yes
Does dermal exposure monitoring allow for construction of an exposure estimate for individuals wearing short-sleeve shirts, shorts, shoes, socks? Yes NA
Was exposure to the hands representative of bare hands? No NA Was the study intended to simulate “residential” exposure via the scripted activity, amount of active ingredient handled, volunteers used, or the setting? No
Is the data of reasonable quality (i.e., are field fortification and laboratory recovery samples adequate)? Yes Yes
Should this study be recommended for use in residential handler exposure assessments? No No
Data Summary: A summary of the data from this study is not provided since it is not recommended for use in residential handler exposure assessment. The submitted study itself should be reviewed for further information. Limitations: Any data limitations associated with the exposure data in this study are not provided since it is not recommended for use in residential handler exposure assessment. The submitted study itself should be reviewed for further information.
Table C-84: Exposure Study Identification Information Citation PHED 1024
EPA MRID NA ORETF Code NA EPA Review None
MRID = Master Record Identification ORETF = Outdoor Residential Exposure Task Force Study Description: Sixteen individuals were monitored while applying a liquid formulation to greenhouse plants hanging overhead or on the floor or on benches using a manually-pressurized handwand. A wide range of solution was applied ranging from 5 gallons to 120 gallons per applicator, which corresponded to a range of 0.06 to 0.91 lbs of active ingredient handled. Each application event generally lasted 1.5 hours. Dermal exposure was measured using gauze patches (both inside and outside normal work clothing) and hand rinses (underneath chemical-resistant gloves) for hand exposure. Inhalation exposure was measured using standard pumps (set at 1.5 liters per minute), cassettes, and tubing. Recoveries from field fortifications of exposure sampling matrices were generally above 90%.
Table C-85: PHED 1024 – Checklist and Use Recommendation for
Study Criteria Exposure Component Dermal Inhalation
Does the study provide detailed characteristics on the activity, equipment type, and amount of active ingredient handled? Yes
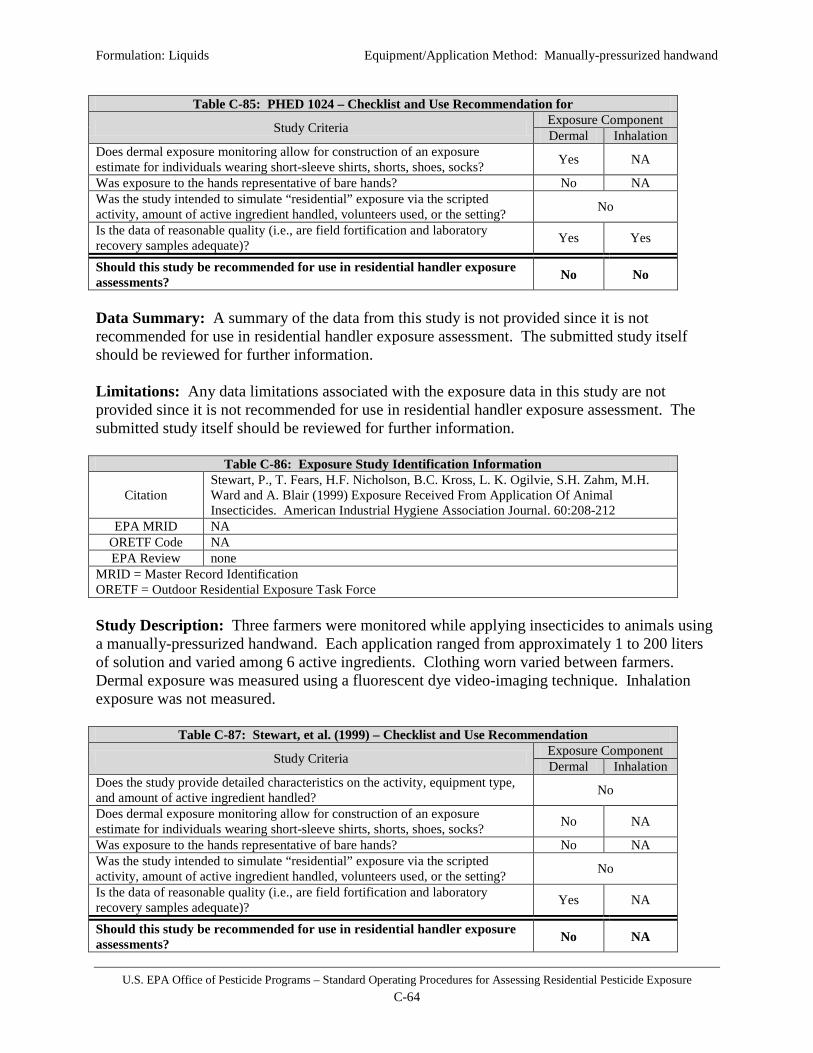
Formulation: Liquids Equipment/Application Method: Manually-pressurized handwand
U.S. EPA Office of Pesticide Programs – Standard Operating Procedures for Assessing Residential Pesticide Exposure C-64
Table C-85: PHED 1024 – Checklist and Use Recommendation for
Study Criteria Exposure Component Dermal Inhalation
Does dermal exposure monitoring allow for construction of an exposure estimate for individuals wearing short-sleeve shirts, shorts, shoes, socks? Yes NA
Was exposure to the hands representative of bare hands? No NA Was the study intended to simulate “residential” exposure via the scripted activity, amount of active ingredient handled, volunteers used, or the setting? No
Is the data of reasonable quality (i.e., are field fortification and laboratory recovery samples adequate)? Yes Yes
Should this study be recommended for use in residential handler exposure assessments? No No
Data Summary: A summary of the data from this study is not provided since it is not recommended for use in residential handler exposure assessment. The submitted study itself should be reviewed for further information. Limitations: Any data limitations associated with the exposure data in this study are not provided since it is not recommended for use in residential handler exposure assessment. The submitted study itself should be reviewed for further information.
Table C-86: Exposure Study Identification Information
Citation Stewart, P., T. Fears, H.F. Nicholson, B.C. Kross, L. K. Ogilvie, S.H. Zahm, M.H. Ward and A. Blair (1999) Exposure Received From Application Of Animal Insecticides. American Industrial Hygiene Association Journal. 60:208-212
EPA MRID NA ORETF Code NA EPA Review none
MRID = Master Record Identification ORETF = Outdoor Residential Exposure Task Force Study Description: Three farmers were monitored while applying insecticides to animals using a manually-pressurized handwand. Each application ranged from approximately 1 to 200 liters of solution and varied among 6 active ingredients. Clothing worn varied between farmers. Dermal exposure was measured using a fluorescent dye video-imaging technique. Inhalation exposure was not measured.
Table C-87: Stewart, et al. (1999) – Checklist and Use Recommendation
Study Criteria Exposure Component Dermal Inhalation
Does the study provide detailed characteristics on the activity, equipment type, and amount of active ingredient handled? No
Does dermal exposure monitoring allow for construction of an exposure estimate for individuals wearing short-sleeve shirts, shorts, shoes, socks? No NA
Was exposure to the hands representative of bare hands? No NA Was the study intended to simulate “residential” exposure via the scripted activity, amount of active ingredient handled, volunteers used, or the setting? No
Is the data of reasonable quality (i.e., are field fortification and laboratory recovery samples adequate)? Yes NA
Should this study be recommended for use in residential handler exposure assessments? No NA

Formulation: Liquids Equipment/Application Method: Manually-pressurized handwand
U.S. EPA Office of Pesticide Programs – Standard Operating Procedures for Assessing Residential Pesticide Exposure C-65
Data Summary: A summary of the data from this study is not provided since it is not recommended for use in residential handler exposure assessment. The submitted study itself should be reviewed for further information. Limitations: Any data limitations associated with the exposure data in this study are not provided since it is not recommended for use in residential handler exposure assessment. The submitted study itself should be reviewed for further information.
Table C-88: Exposure Study Identification Information Citation PHED 468
EPA MRID NA ORETF Code NA EPA Review none
MRID = Master Record Identification ORETF = Outdoor Residential Exposure Task Force Study Description: Nine individuals were monitored on two days (4 on the 1st day, 5 on the 2nd day) while applying a plant growth regulator to ornamentals in a 2000 ft2 greenhouse. Each worker was suited with sampling media separately for the mixing/loading portion of the task and the application portion. Each application consisted of spraying 2 gallons of spray solution for approximately 30 minutes at a rate of 1 gallon per 200 ft2. The solution was 100 ppm (active ingredient unknown) so each applicator handled approximately 0.0017 lbs of active ingredient. Dermal exposure was measured using gauze patches (both inside and outside normal work clothing) and cotton gloves worn over chemical-resistant gloves for hand exposure. Inhalation exposure was measured using standard pumps (set at 1.5 liters per minute), cassettes, and tubing. All inhalation samples were non-detects. The overall recovery from samples fortified in the laboratory and analyzed with each set of field samples averaged 102% for alpha-cellulose, 106% for gloves, and 101% for foam filters.
Table C-89: PHED 468 – Checklist and Use Recommendation
Study Criteria Exposure Component Dermal Inhalation
Does the study provide detailed characteristics on the activity, equipment type, and amount of active ingredient handled? Yes
Does dermal exposure monitoring allow for construction of an exposure estimate for individuals wearing short-sleeve shirts, shorts, shoes, socks? Yes NA
Was exposure to the hands representative of bare hands? No NA Was the study intended to simulate “residential” exposure via the scripted activity, amount of active ingredient handled, volunteers used, or the setting? No
Is the data of reasonable quality (i.e., are field fortification and laboratory recovery samples adequate)? Yes Yes
Should this study be recommended for use in residential handler exposure assessments? No No
Data Summary: A summary of the data from this study is not provided since it is not recommended for use in residential handler exposure assessment. The submitted study itself should be reviewed for further information.
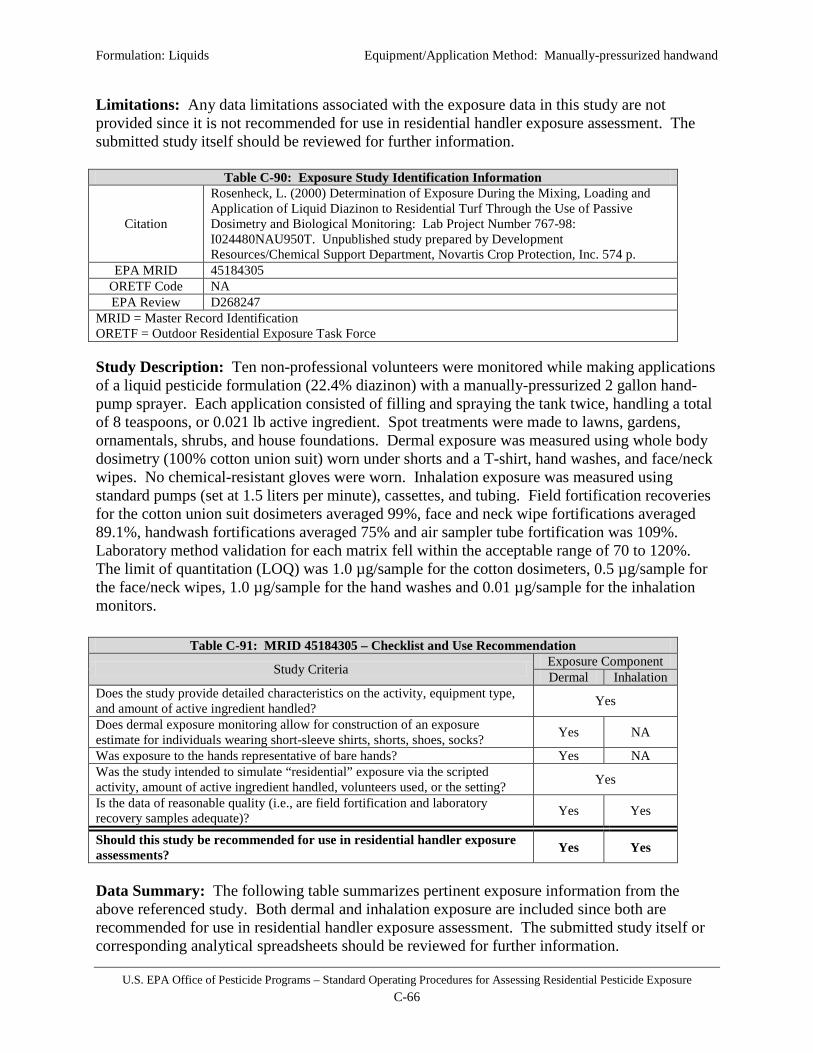
Formulation: Liquids Equipment/Application Method: Manually-pressurized handwand
U.S. EPA Office of Pesticide Programs – Standard Operating Procedures for Assessing Residential Pesticide Exposure C-66
Limitations: Any data limitations associated with the exposure data in this study are not provided since it is not recommended for use in residential handler exposure assessment. The submitted study itself should be reviewed for further information.
Table C-90: Exposure Study Identification Information
Citation
Rosenheck, L. (2000) Determination of Exposure During the Mixing, Loading and Application of Liquid Diazinon to Residential Turf Through the Use of Passive Dosimetry and Biological Monitoring: Lab Project Number 767-98: I024480NAU950T. Unpublished study prepared by Development Resources/Chemical Support Department, Novartis Crop Protection, Inc. 574 p.
EPA MRID 45184305 ORETF Code NA EPA Review D268247
MRID = Master Record Identification ORETF = Outdoor Residential Exposure Task Force
Study Description: Ten non-professional volunteers were monitored while making applications of a liquid pesticide formulation (22.4% diazinon) with a manually-pressurized 2 gallon hand-pump sprayer. Each application consisted of filling and spraying the tank twice, handling a total of 8 teaspoons, or 0.021 lb active ingredient. Spot treatments were made to lawns, gardens, ornamentals, shrubs, and house foundations. Dermal exposure was measured using whole body dosimetry (100% cotton union suit) worn under shorts and a T-shirt, hand washes, and face/neck wipes. No chemical-resistant gloves were worn. Inhalation exposure was measured using standard pumps (set at 1.5 liters per minute), cassettes, and tubing. Field fortification recoveries for the cotton union suit dosimeters averaged 99%, face and neck wipe fortifications averaged 89.1%, handwash fortifications averaged 75% and air sampler tube fortification was 109%. Laboratory method validation for each matrix fell within the acceptable range of 70 to 120%. The limit of quantitation (LOQ) was 1.0 µg/sample for the cotton dosimeters, 0.5 µg/sample for the face/neck wipes, 1.0 µg/sample for the hand washes and 0.01 µg/sample for the inhalation monitors.
Table C-91: MRID 45184305 – Checklist and Use Recommendation
Study Criteria Exposure Component Dermal Inhalation
Does the study provide detailed characteristics on the activity, equipment type, and amount of active ingredient handled? Yes
Does dermal exposure monitoring allow for construction of an exposure estimate for individuals wearing short-sleeve shirts, shorts, shoes, socks? Yes NA
Was exposure to the hands representative of bare hands? Yes NA Was the study intended to simulate “residential” exposure via the scripted activity, amount of active ingredient handled, volunteers used, or the setting? Yes
Is the data of reasonable quality (i.e., are field fortification and laboratory recovery samples adequate)? Yes Yes
Should this study be recommended for use in residential handler exposure assessments? Yes Yes
Data Summary: The following table summarizes pertinent exposure information from the above referenced study. Both dermal and inhalation exposure are included since both are recommended for use in residential handler exposure assessment. The submitted study itself or corresponding analytical spreadsheets should be reviewed for further information.

Formulation: Liquids Equipment/Application Method: Manually-pressurized handwand
U.S. EPA Office of Pesticide Programs – Standard Operating Procedures for Assessing Residential Pesticide Exposure C-67
Table C-92: MRID 45184305 – Data Summary
Person ID AaiH1 (lbs)
Exposure (mg) Unit Exposure (mg/lb ai)4 Dermal2 Inhalation3 Dermal Inhalation
33 0.021 0.261 0.00167 12.43 0.0795 37 0.021 0.0368 0.00189 1.75 0.0901 38 0.021 0.507 0.00356 24.14 0.1697 39 0.021 0.137 0.00278 6.52 0.1325 40 0.021 1.12 0.00445 53.33 0.2121 41 0.021 0.156 0.00267 7.43 0.1272 42 0.021 0.278 0.00445 13.24 0.2121 43 0.021 0.473 0.01559 22.52 0.7422 31 0.021 2.176 0.00200 103.62 0.0954 32 0.021 0.0423 -- 2.01 --
1 Amount of active ingredient Handled. 2 Representative of individuals wearing a short-sleeve shirt, shorts, shoes, socks and no chemical-resistant gloves. 3 Inhalation exposure (mg) = mg collected/pump flow rate (Lpm) * Breathing Rate (16.7 Lpm). 4 Unit Exposure = Exposure/AaiH.
Limitations: Though the above referenced study is useful for assessment of residential applications of liquid concentrate formulations using a manually-pressurized handwand, the following limitations are noted:
• Each individual handled the same amount of active ingredient, making analysis of the relationship between exposure and the amount of active ingredient handled (the underlying basis of unit exposures) difficult.

Formulation: Liquids Equipment/Application Method: Handheld fogger
U.S. EPA Office of Pesticide Programs – Standard Operating Procedures for Assessing Residential Pesticide Exposure C-68
Scenario Summary
Table C-93: Scenario Description and Available Exposure Studies Formulation Liquids (emulsifiable concentrates, soluble concentrates, etc.) Equipment/Application Method Handheld Fogger
Application Site(s) outdoors (lawns, gardens, trees/bushes, perimeter, mounds/nests, aquatic areas)
Available Exposure Studies Nigg, et al (1987); MRID 40350501 Bergman, J. (2003); MRID 45869301
Table C-94: Unit Exposures (mg/lb ai) – Liquid Handheld Fogger Applications
Statistic Dermal Inhalation 50th percentile
Studies measuring exposure while mixing/loading/applying liquid formulations using a handheld fogger are available, but not recommended for
residential handler exposure assessment. Therefore, the exposure studies recommended for applying an aerosol should be used as a surrogate.
75th percentile 95th percentile 99th percentile 99.9th percentile AM (SD) GM (GSD) Range N

Formulation: Liquids Equipment/Application Method: Handheld fogger
U.S. EPA Office of Pesticide Programs – Standard Operating Procedures for Assessing Residential Pesticide Exposure C-69
Available Handler Exposure Studies
Table C-95: Exposure Study Identification Information
Citation Nigg, et al (1987) Pesticide Exposure to Florida Greenhouse Applicators, Nigg, H.N., Stamper, J.H. and Mahon, W.D., University of Florida, 1987
EPA MRID 40350501 ORETF Code NA EPA Review None
MRID = Master Record Identification ORETF = Outdoor Residential Exposure Task Force
Study Description: Four different workers were monitored while using a pulse-fogging device in a Florida greenhouse. Four active ingredients were used at rates ranging from 0.03 lbs/hr to 0.2 lbs/hr. Dermal exposure was measured using gauze patches (both inside and outside normal work clothing) and hand rinses were used for hand exposure (hand exposure was measured only when gloves were not worn). Inhalation exposure was measured using standard pumps (set at 3 liters per minute), cassettes, and tubing. Recoveries from field fortifications of exposure sampling matrices were poor, ranging from 13% to 94% depending on the chemical and matrix. Mean recoveries (%) from 10 µg fortifications of fluvalinate on gauze pads was 75% ± 6%, for handwashes was 62 ± 6%, and for air sampler plugs was 51 ± 4%. Mean recoveries from 10 µg fortifications of the compound chlorpyrifos on gauze pads was 82 ± 3%, for handwashes was 79 ± 4%, and for air sampler plugs was 73 ± 4%. Mean recoveries from 10 µg fortifications of the compound ethazol on gauze pads was 51 ± 7%, for handwashes was 45 ± 10%, and for air sampler plugs was 68 ± 8%. Mean recoveries (%) from 10 µg fortifications of the compound dicofol on gauze pads was 89 ± 5%, for handwashes was 76 ± 4%, and for air sampler plugs was 90 ± 9%. Mean recoveries (%) from 10 µg fortifications of the compound captan on gauze pads was 61 ± 8%, for handwashes was 13 ± 2%, and for air sampler plugs was 63 ± 14%. Mean recoveries (%) from 10 µg fortifications of the compound chlorothalonil on gauze pads was 94 ± 3%, for handwashes was 25 ± 14%, and for air sampler plugs was 67 ± 8%.
Table C-96: MRID 40350501 – Checklist and Use Recommendation
Study Criteria Exposure Component Dermal Inhalation
Does the study provide detailed characteristics on the activity, equipment type, and amount of active ingredient handled? Yes
Does dermal exposure monitoring allow for construction of an exposure estimate for individuals wearing short-sleeve shirts, shorts, shoes, socks? Yes NA
Was exposure to the hands representative of bare hands? Yes NA Was the study intended to simulate “residential” exposure via the scripted activity, amount of active ingredient handled, volunteers used, or the setting? No
Is the data of reasonable quality (i.e., are field fortification and laboratory recovery samples adequate)? Yes Yes
Should this study be recommended for use in residential handler exposure assessments? No No
Data Summary: A summary of the data from this study is not provided since it is not recommended for use in residential handler exposure assessment. The submitted study itself or corresponding analytical spreadsheets should be reviewed for further information.

Formulation: Liquids Equipment/Application Method: Handheld fogger
U.S. EPA Office of Pesticide Programs – Standard Operating Procedures for Assessing Residential Pesticide Exposure C-70
Limitations: This study has been identified to have ethical concerns.
Table C-97: Exposure Study Identification Information
Citation
Bergman, J. (2003) Applicator Exposure and Air Sampling Following Application of ETOC Fogging Concentrate 2764 by ULV Fogging: Lab Project Number: GLP-1648. Unpublished study prepared by McLaughlin Gormley King Company. 107 p. {OPPTS 875.1400 and 875.2500}
EPA MRID 45869301 ORETF Code NA EPA Review D289337
MRID = Master Record Identification ORETF = Outdoor Residential Exposure Task Force
Study Description: One individual was monitored during 25 applications of a liquid concentrate (active ingredient prallethrin) to a 5500 ft3 test chamber using a handheld ultra low-volume (ULV) fogger at the maximum application rate of 1 fl. oz. per 1000 ft3 (equivalent to approximately 0.001 lb ai/1000 ft3). Dermal exposure was not monitored in this study. Inhalation exposure was measured using standard pumps (set at 0.03 liter per minute), cassettes, and tubing. One set of recovery results were provided, however, the study author did not specify whether the recovery samples represented laboratory fortified samples or field fortified samples. The results for these fortification recoveries are discussed in the Field Recovery section of this study review. Three fortification samples were prepared at three concentrations (LOQ, 10 X LOQ, and 100 X LOQ) for each application. Sample preparation and storage were not discussed. Recoveries ranged from 76.8% to 147.3%. The average percent recovery for samples fortified at the LOQ, at 10X LOQ and at 100X LOQ were 119.6%, 113.1%, and 92.3%, respectively. The overall average percent recovery was 108.3 ± 14.3%.
Table C-98: MRID 45869301 – Checklist and Use Recommendation
Study Criteria Exposure Component Dermal Inhalation
Does the study provide detailed characteristics on the activity, equipment type, and amount of active ingredient handled? No
Does dermal exposure monitoring allow for construction of an exposure estimate for individuals wearing short-sleeve shirts, shorts, shoes, socks? No NA
Was exposure to the hands representative of bare hands? No NA Was the study intended to simulate “residential” exposure via the scripted activity, amount of active ingredient handled, volunteers used, or the setting? No
Is the data of reasonable quality (i.e., are field fortification and laboratory recovery samples adequate)? Yes Yes
Should this study be recommended for use in residential handler exposure assessments? No No
Data Summary: A summary of the data from this study is not provided since it is not recommended for use in residential handler exposure assessment. The submitted study itself or corresponding analytical spreadsheets should be reviewed for further information. Limitations: This study has been identified to have ethical concerns.

Formulation: Liquids Equipment/Application Method: Dipping
U.S. EPA Office of Pesticide Programs – Standard Operating Procedures for Assessing Residential Pesticide Exposure C-71
Scenario Summary
Table C-99: Scenario Description and Available Exposure Studies Formulation Liquids (emulsifiable concentrates, soluble concentrates, etc.) Equipment/Application Method Dipping
Application Site(s) Pets/animals Available Exposure Studies McKeown, K. (2001); MRID 45528801
Table C-100: Unit Exposures (mg/lb ai) – Liquid Dipping Applications
Statistic Dermal Inhalation 50th percentile 67 0.026 75th percentile 120 0.028 95th percentile 300 0.031 99th percentile 560 0.034 99.9th percentile 1100 0.037 AM (SD) 100 (120) 0.027 (0.0028) GM (GSD) 67 (2.5) 0.026 (1.1) Range 17 – 430 0.022 – 0.032 N 15 15
Dermal Unit Exposure Data Summary: The recommended dermal unit exposures for dipping pets or animals in liquid pesticide formulations is based on a lognormal distribution fit with exposure monitoring data from McKeown, K. (2001) [EPA MRID 45528801]. McKeown, K. (2001) monitored 15 applications of dipping dogs in a tub containing a liquid pesticide solution for approximately 4 to 5 minutes. This was the only available study for this exposure scenario. Inhalation Unit Exposure Data Summary: The recommended inhalation unit exposures for dipping pets or animals in liquid pesticide formulations is based on a lognormal distribution fit with exposure monitoring data from McKeown, K. (2001) [EPA MRID 45528801]. McKeown, K. (2001) monitored 15 applications of dipping dogs in a tub containing a liquid pesticide solution for approximately 4 to 5 minutes. This was the only available study for this exposure scenario.

Formulation: Liquids Equipment/Application Method: Dipping
U.S. EPA Office of Pesticide Programs – Standard Operating Procedures for Assessing Residential Pesticide Exposure C-72
Lognormal Probability Plots Legend: ■ = McKeown, K. (2001)
Legend: ■ = McKeown, K. (2001)
Derm
al UE
(mg/
lb ai)
0
50
100
150
200
250
300
350
400
450.001.01.05.10 .25 .50 .75 .90 .95
.0 .5 1.0 1.5 2.0 2.5 3.0 3.5 4.0 4.5 5.0 5.
Log Normal Quantile
Inha
latio
n U
E (m
g/lb
ai)
0.022
0.023
0.024
0.025
0.026
0.027
0.028
0.029
0.03
0.031
0.032.10 .25 .50 .75 .90 .95
.85 .90 .95 1.00 1.05 1.10 1.15 1.20
Log Normal Quantile
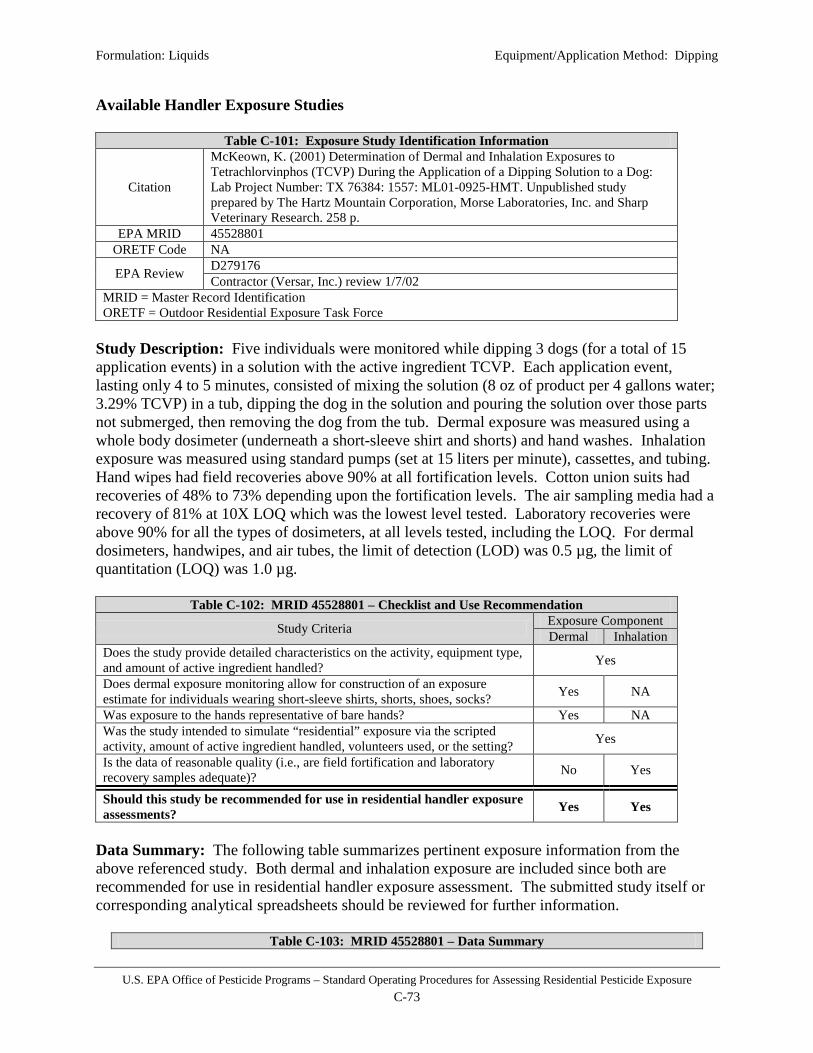
Formulation: Liquids Equipment/Application Method: Dipping
U.S. EPA Office of Pesticide Programs – Standard Operating Procedures for Assessing Residential Pesticide Exposure C-73
Available Handler Exposure Studies
Table C-101: Exposure Study Identification Information
Citation
McKeown, K. (2001) Determination of Dermal and Inhalation Exposures to Tetrachlorvinphos (TCVP) During the Application of a Dipping Solution to a Dog: Lab Project Number: TX 76384: 1557: ML01-0925-HMT. Unpublished study prepared by The Hartz Mountain Corporation, Morse Laboratories, Inc. and Sharp Veterinary Research. 258 p.
EPA MRID 45528801 ORETF Code NA
EPA Review D279176 Contractor (Versar, Inc.) review 1/7/02
MRID = Master Record Identification ORETF = Outdoor Residential Exposure Task Force
Study Description: Five individuals were monitored while dipping 3 dogs (for a total of 15 application events) in a solution with the active ingredient TCVP. Each application event, lasting only 4 to 5 minutes, consisted of mixing the solution (8 oz of product per 4 gallons water; 3.29% TCVP) in a tub, dipping the dog in the solution and pouring the solution over those parts not submerged, then removing the dog from the tub. Dermal exposure was measured using a whole body dosimeter (underneath a short-sleeve shirt and shorts) and hand washes. Inhalation exposure was measured using standard pumps (set at 15 liters per minute), cassettes, and tubing. Hand wipes had field recoveries above 90% at all fortification levels. Cotton union suits had recoveries of 48% to 73% depending upon the fortification levels. The air sampling media had a recovery of 81% at 10X LOQ which was the lowest level tested. Laboratory recoveries were above 90% for all the types of dosimeters, at all levels tested, including the LOQ. For dermal dosimeters, handwipes, and air tubes, the limit of detection (LOD) was 0.5 µg, the limit of quantitation (LOQ) was 1.0 µg.
Table C-102: MRID 45528801 – Checklist and Use Recommendation
Study Criteria Exposure Component Dermal Inhalation
Does the study provide detailed characteristics on the activity, equipment type, and amount of active ingredient handled? Yes
Does dermal exposure monitoring allow for construction of an exposure estimate for individuals wearing short-sleeve shirts, shorts, shoes, socks? Yes NA
Was exposure to the hands representative of bare hands? Yes NA Was the study intended to simulate “residential” exposure via the scripted activity, amount of active ingredient handled, volunteers used, or the setting? Yes
Is the data of reasonable quality (i.e., are field fortification and laboratory recovery samples adequate)? No Yes
Should this study be recommended for use in residential handler exposure assessments? Yes Yes
Data Summary: The following table summarizes pertinent exposure information from the above referenced study. Both dermal and inhalation exposure are included since both are recommended for use in residential handler exposure assessment. The submitted study itself or corresponding analytical spreadsheets should be reviewed for further information.
Table C-103: MRID 45528801 – Data Summary

Formulation: Liquids Equipment/Application Method: Dipping
U.S. EPA Office of Pesticide Programs – Standard Operating Procedures for Assessing Residential Pesticide Exposure C-74
Person ID AaiH1 (lbs)
Exposure (mg) Unit Exposure (mg/lb ai)4 Dermal2 Inhalation3 Dermal Inhalation
A 0.015 1.36 0.00041 90.7 0.0274 A 0.015 2.09 0.00048 139.3 0.0318 A 0.015 0.89 0.00043 59.3 0.0285 B 0.015 2.59 0.00034 172.7 0.0229 B 0.015 1.31 0.00037 87.3 0.0246 B 0.015 1.01 0.00033 67.3 0.0222 C 0.015 0.44 0.00043 29.3 0.0290 C 0.015 0.29 0.00041 19.3 0.0275 C 0.015 1.51 0.00039 100.7 0.0263 D 0.015 0.37 0.00039 24.7 0.0264 D 0.015 0.25 0.00038 16.7 0.0259 D 0.015 0.74 0.00037 49.3 0.0247 E 0.015 2.55 0.00039 170.0 0.0264 E 0.015 6.35 0.00036 423.3 0.0242 E 0.015 0.53 0.00047 35.3 0.0316
1 Amount of active ingredient Handled. 2 Representative of individuals wearing a short-sleeve shirt, shorts, shoes, socks and no chemical-resistant gloves. 3 Inhalation exposure (mg) = mg collected/pump flow rate (Lpm) * Breathing Rate (16.7 Lpm). All samples were non-detects. Reported as ½ LOD (0.01 ug/m3). 4 Unit Exposure = Exposure/AaiH.
Limitations: Though the above referenced study is useful for assessment of dipping pets or animals in a dilute liquid pesticide solution, the following limitations are noted:
• All inhalation samples were non-detects. One-half the limit of detection (0.5 µg) was used.
• Each individual handled the same amount of active ingredient making analysis of the relationship between exposure and the amount of active ingredient handled (the underlying basis of unit exposures) difficult.
• The use of 15 liters per minute is much higher than the standard setting of 1- 2 liters per minute and could complicate air sampling.

Formulation: Liquids Equipment/Application Method: Sponge
U.S. EPA Office of Pesticide Programs – Standard Operating Procedures for Assessing Residential Pesticide Exposure C-75
Scenario Summary
Table C-104: Scenario Description and Available Exposure Studies Formulation Liquids (emulsifiable concentrates, soluble concentrates, etc.) Equipment/Application Method Sponge
Application Site(s) Pets/animals Available Exposure Studies McKeown, K. (2001); MRID 45528801
Table C-105: Unit Exposures (mg/lb ai) – Liquid Sponge Applications
Statistic Dermal Inhalation 50th percentile 917 0.20 75th percentile 1860 0.24 95th percentile 5150 0.31 99th percentile 10500 0.37 99.9th percentile 23400 0.45 AM (SD) 1600 (2250) 0.21 (0.055) GM (GSD) 917 (2.9) 0.20 (1.3) Range 267 – 4842 0.143 – 0.268 N 5 5
Dermal Unit Exposure Data Summary: The recommended dermal unit exposures for applications of liquid pesticide formulations using a sponge is based on a lognormal distribution fit with exposure monitoring data from McKeown, K. (2001) [EPA MRID 45528801]. McKeown, K. (2001) monitored 5 applications of a liquid pesticide solution for approximately 4 to 5 minutes using a sponge. This was the only available study for this exposure scenario. Inhalation Unit Exposure Data Summary: The recommended dermal unit exposures for applications of liquid pesticide formulations using a sponge is based on a lognormal distribution fit with exposure monitoring data from McKeown, K. (2001) [EPA MRID 45528801]. McKeown, K. (2001) monitored 5 applications of a liquid pesticide solution for approximately 4 to 5 minutes using a sponge. This was the only available study for this exposure scenario.
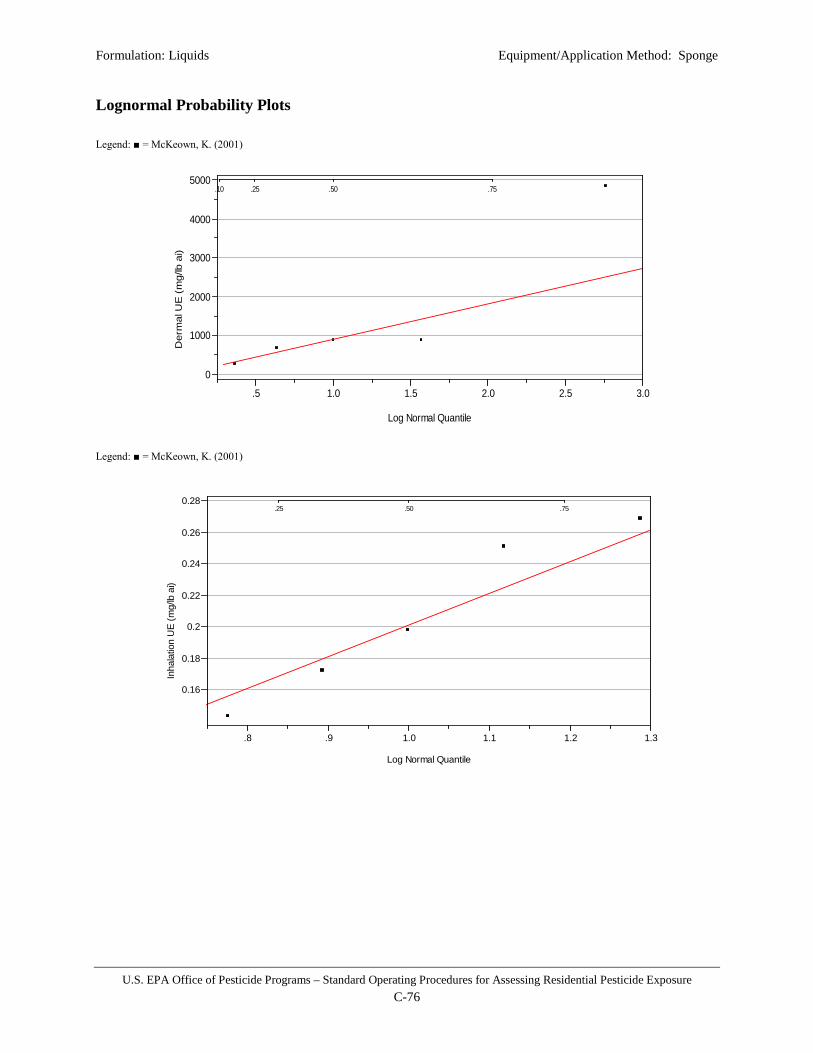
Formulation: Liquids Equipment/Application Method: Sponge
U.S. EPA Office of Pesticide Programs – Standard Operating Procedures for Assessing Residential Pesticide Exposure C-76
Lognormal Probability Plots Legend: ■ = McKeown, K. (2001)
Legend: ■ = McKeown, K. (2001)
Der
mal
UE
(m
g/lb
ai)
0
1000
2000
3000
4000
5000.10 .25 .50 .75
.5 1.0 1.5 2.0 2.5 3.0
Log Normal Quantile
Inha
latio
n U
E (m
g/lb
ai)
0.16
0.18
0.2
0.22
0.24
0.26
0.28.25 .50 .75
.8 .9 1.0 1.1 1.2 1.3
Log Normal Quantile
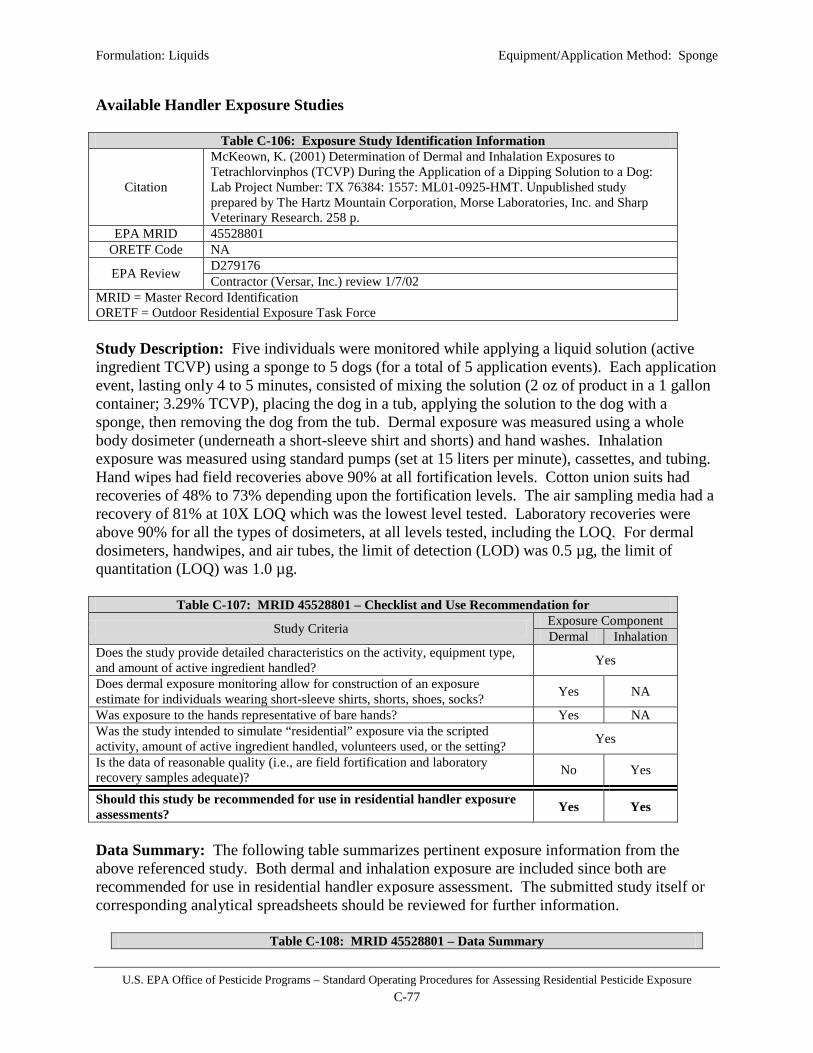
Formulation: Liquids Equipment/Application Method: Sponge
U.S. EPA Office of Pesticide Programs – Standard Operating Procedures for Assessing Residential Pesticide Exposure C-77
Available Handler Exposure Studies
Table C-106: Exposure Study Identification Information
Citation
McKeown, K. (2001) Determination of Dermal and Inhalation Exposures to Tetrachlorvinphos (TCVP) During the Application of a Dipping Solution to a Dog: Lab Project Number: TX 76384: 1557: ML01-0925-HMT. Unpublished study prepared by The Hartz Mountain Corporation, Morse Laboratories, Inc. and Sharp Veterinary Research. 258 p.
EPA MRID 45528801 ORETF Code NA
EPA Review D279176 Contractor (Versar, Inc.) review 1/7/02
MRID = Master Record Identification ORETF = Outdoor Residential Exposure Task Force Study Description: Five individuals were monitored while applying a liquid solution (active ingredient TCVP) using a sponge to 5 dogs (for a total of 5 application events). Each application event, lasting only 4 to 5 minutes, consisted of mixing the solution (2 oz of product in a 1 gallon container; 3.29% TCVP), placing the dog in a tub, applying the solution to the dog with a sponge, then removing the dog from the tub. Dermal exposure was measured using a whole body dosimeter (underneath a short-sleeve shirt and shorts) and hand washes. Inhalation exposure was measured using standard pumps (set at 15 liters per minute), cassettes, and tubing. Hand wipes had field recoveries above 90% at all fortification levels. Cotton union suits had recoveries of 48% to 73% depending upon the fortification levels. The air sampling media had a recovery of 81% at 10X LOQ which was the lowest level tested. Laboratory recoveries were above 90% for all the types of dosimeters, at all levels tested, including the LOQ. For dermal dosimeters, handwipes, and air tubes, the limit of detection (LOD) was 0.5 µg, the limit of quantitation (LOQ) was 1.0 µg.
Table C-107: MRID 45528801 – Checklist and Use Recommendation for
Study Criteria Exposure Component Dermal Inhalation
Does the study provide detailed characteristics on the activity, equipment type, and amount of active ingredient handled? Yes
Does dermal exposure monitoring allow for construction of an exposure estimate for individuals wearing short-sleeve shirts, shorts, shoes, socks? Yes NA
Was exposure to the hands representative of bare hands? Yes NA Was the study intended to simulate “residential” exposure via the scripted activity, amount of active ingredient handled, volunteers used, or the setting? Yes
Is the data of reasonable quality (i.e., are field fortification and laboratory recovery samples adequate)? No Yes
Should this study be recommended for use in residential handler exposure assessments? Yes Yes
Data Summary: The following table summarizes pertinent exposure information from the above referenced study. Both dermal and inhalation exposure are included since both are recommended for use in residential handler exposure assessment. The submitted study itself or corresponding analytical spreadsheets should be reviewed for further information.
Table C-108: MRID 45528801 – Data Summary

Formulation: Liquids Equipment/Application Method: Sponge
U.S. EPA Office of Pesticide Programs – Standard Operating Procedures for Assessing Residential Pesticide Exposure C-78
Person ID AaiH1 (lbs)
Exposure (mg) Unit Exposure (mg/lb ai)4 Dermal2 Inhalation3 Dermal Inhalation
A 0.0024 0.63 0.00050 267 0.209735 B 0.0019 1.26 0.00058 664 0.305605 C 0.0016 7.69 0.00052 4842 0.326541 D 0.0024 2.08 0.00042 870 0.17405 E 0.0019 1.61 0.00045 868 0.240907
1 Amount of active ingredient Handled. 2 Representative of individuals wearing a short-sleeve shirt, shorts, shoes, socks and no chemical-resistant gloves. 3 Inhalation exposure (mg) = mg collected/pump flow rate (Lpm) * Breathing Rate (16.7 Lpm). 4 Unit Exposure = Exposure/AaiH.
Limitations: Though the above referenced study is useful for assessment of applying dilute liquid pesticide solutions to pets or animals with a sponge, the following limitations are noted:
• All inhalation samples were non-detects. One-half the limit of detection (0.5 µg) was used.
• Each individual handled approximately the same amount of active ingredient making analysis of the relationship between exposure and the amount of active ingredient handled (the underlying basis of unit exposures) difficult.
• The use of 15 liters per minute is much higher than the standard setting of 1- 2 liters per minute and could complicate air sampling.

Formulation: Liquids Equipment/Application Method: Hose-end sprayer
U.S. EPA Office of Pesticide Programs – Standard Operating Procedures for Assessing Residential Pesticide Exposure C-79
Scenario Summary
Table C-109: Scenario Description and Available Exposure Studies Formulation Liquids (emulsifiable concentrates, soluble concentrates, etc.) Equipment/Application Method Hose-end sprayer
Application Site(s) outdoors (lawns, gardens, trees/bushes, perimeter, mounds/nests, aquatic areas)
Available Exposure Studies
Solomon, K. R., Harris, S. A, Stephenson, G. R. (1993). Klonne, D. (1999); MRID 44972201 Merricks, D.L. (1998); MRID 44518501 Merricks, D.L. (1997); MRID 44459801 Rosenheck, L. (2000); MRID 45184305
Table C-110: Unit Exposures (mg/lb ai) – Liquid Hose-end Sprayer Applications
Statistic Lawns / Mounds / Nests / Aquatic areas Gardens / Trees / Perimeter Dermal Inhalation Dermal Inhalation
50th percentile 8.61 0.015 37 0.0012 75th percentile 16.2 0.027 69 0.0017 95th percentile 40.5 0.064 180 0.0029 99th percentile 76.9 0.12 340 0.0043 99.9th percentile 158 0.23 710 0.0065 AM (SD) 13.4 (16) 0.022 (0.024) 58 (71) 0.0014 (0.00082) GM (GSD) 8.61 (2.56) 0.015 (2.4) 37 (2.6) 0.0012 (1.7) Range 0.874 – 49 0.003 – 0.082 5.0 – 280 0.0004 – 0.0062 N 42 41 40 60 Dermal Unit Exposure Data Summary
Gardens, Trees, and Perimeter Treatments: The recommended dermal unit exposures for applications of liquid pesticide formulations using a dial-type hose-end sprayer to gardens, trees, and perimeters of houses is based on a lognormal distribution fit with exposure monitoring data from Merricks, D.L. (1998) [EPA MRID 44518501] and Merricks, D.L. (1997) [EPA MRID 44459801]. Merricks, D.L. (1998) monitored 20 applications of a liquid formulation for approximately 20 minutes to citrus trees and shrubs using a dial-type hose-end sprayer. Merricks, D.L. (1997) monitored 40 applications of a liquid formulation for approximately 20 minutes to tomato and cucumber gardens using a dial-type hose-end sprayer. Lawns, Insect Mounds and Nests, and Aquatic Areas: The recommended dermal unit exposures for applications of liquid pesticide formulations using a dial-type hose-end sprayer to lawns, insect mounds and nests, and aquatic areas is based on a lognormal distribution fit with exposure monitoring data from Klonne, D. (1999) [EPA MRID 44972201] and Rosenheck, L. (2000) [EPA MRID 45184305]. Klonne, D. (1999) monitored 30 applications of a liquid pesticide formulation for approximately 75 minutes to approximately 5000 ft2 of residential lawns using a dial-type hose-end sprayer. Rosenheck, L. (2000) monitored 12 applications of a liquid pesticide formulation ranging from 18 to 78 minutes to approximately 5000 ft2 of residential lawns using a conventional
Formulation: Liquids Equipment/Application Method: Hose-end sprayer
U.S. EPA Office of Pesticide Programs – Standard Operating Procedures for Assessing Residential Pesticide Exposure C-80
hose-end sprayer. These studies best represents residential use for this scenario and the exposure monitoring enabled representation of the type of clothing a homeowner or amateur applicator would wear (i.e., shorts, short-sleeve shirt, no chemical-resistant gloves).
Inhalation Unit Exposure Data Summary
Gardens, Trees, and Perimeter Treatments: The recommended inhalation unit exposures for applications of liquid pesticide formulations using a dial-type hose-end sprayer to gardens, trees, and perimeters of houses is based on a lognormal distribution fit with exposure monitoring data from Merricks, D.L. (1998) [EPA MRID 44518501] and Merricks, D.L. (1997) [EPA MRID 44459801]. Merricks, D.L. (1998) monitored 20 applications of a liquid formulation for approximately 20 minutes to citrus trees and shrubs using a dial-type hose-end sprayer. Merricks, D.L. (1997) monitored 40 applications of a liquid formulation for approximately 20 minutes to tomato and cucumber gardens using a dial-type hose-end sprayer. Of the available studies these were most representative of residential uses for this scenario. Lawns, Insect Mounds and Nests, and Aquatic Areas: The recommended inhalation unit exposures for applications of liquid pesticide formulations using a dial-type hose-end sprayer to lawns, insect mounds and nests, and aquatic areas is based on a lognormal distribution fit with exposure monitoring data from Klonne, D. (1999) [EPA MRID 44972201] and Rosenheck, L. (2000) [EPA MRID 45184305]. Klonne, D. (1999) monitored 30 applications of a liquid pesticide formulation for approximately 75 minutes to approximately 5000 ft2 of residential lawns using a dial-type hose-end sprayer. Rosenheck, L. (2000) monitored 12 applications of a liquid pesticide formulation ranging from 18 to 78 minutes to approximately 5000 ft2 of residential lawns using a conventional hose-end sprayer. Of the available studies these were the most representative of residential uses for this scenario.

Formulation: Liquids Equipment/Application Method: Hose-end sprayer
U.S. EPA Office of Pesticide Programs – Standard Operating Procedures for Assessing Residential Pesticide Exposure C-81
Lognormal Probability Plots Turf/Mounds/Nests/Aquatic Legend: ■ = Klonne, D. (1999); X = Rosenheck, L. (2000)
Turf/Mounds/Nests/Aquatic Legend: ■ = Klonne, D. (1999); X = Rosenheck, L. (2000)
Der
mal
UE
(m
g/lb
ai)
0
10
20
30
40
50.001.01.05.10 .25 .50 .75 .90 .95
0 1 2 3 4 5 6 7
Log Normal Quantile
Inha
latio
n U
E (m
g/lb
ai)
0
0.01
0.02
0.03
0.04
0.05
0.06
0.07
0.08
0.09.001.01.05.10 .25 .50 .75 .90 .95
0 1 2 3 4 5 6
Log Normal Quantile

Formulation: Liquids Equipment/Application Method: Hose-end sprayer
U.S. EPA Office of Pesticide Programs – Standard Operating Procedures for Assessing Residential Pesticide Exposure C-82
Gardens & Trees/Perimeter Legend: X = Merricks, D.L. (1997); O = Merricks, D.L. (1998)
Gardens & Trees/Perimeter Legend: X = Merricks, D.L. (1997); O = Merricks, D.L. (1998)
Der
mal
UE
(mg/
lb a
i)
0
50
100
150
200
250
300.001.01.05.10 .25 .50 .75 .90 .95
0 1 2 3 4 5 6 7
Log Normal Quantile
Inha
latio
n U
E (
mg/
lb a
i)
0
0.001
0.002
0.003
0.004
0.005
0.006.01 .05 .10 .25 .50 .75 .90 .95
.5 1.0 1.5 2.0 2.5 3.0
Log Normal Quantile
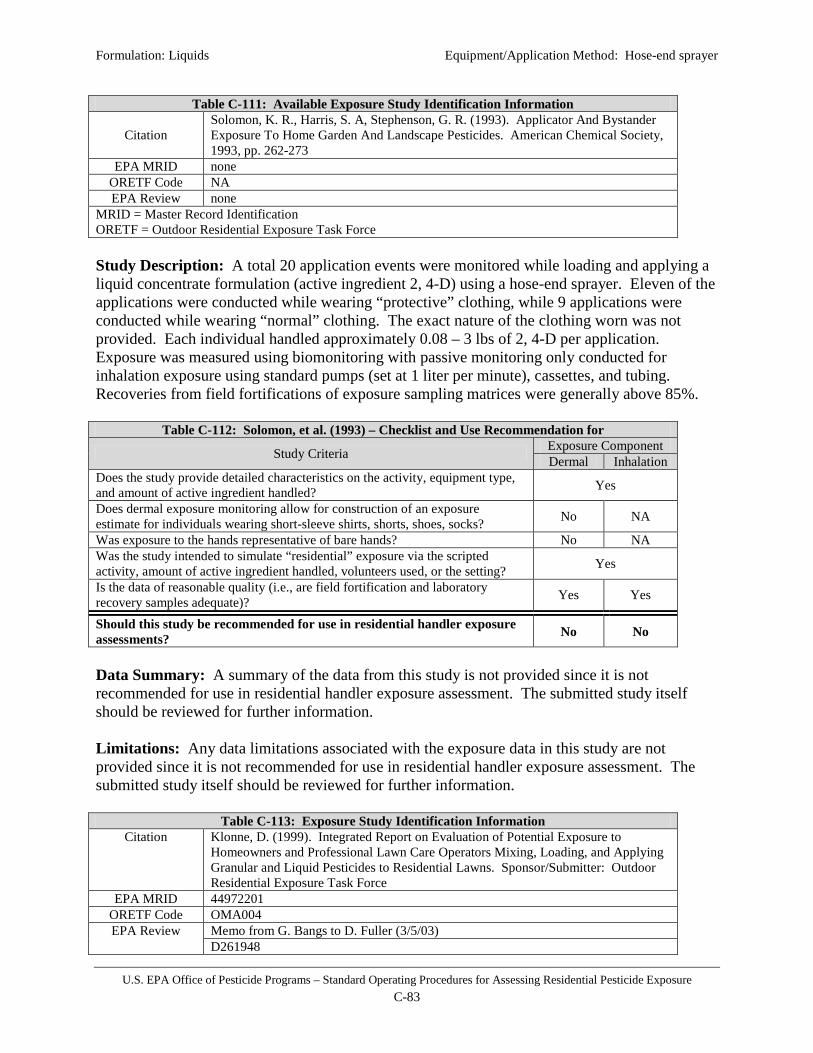
Formulation: Liquids Equipment/Application Method: Hose-end sprayer
U.S. EPA Office of Pesticide Programs – Standard Operating Procedures for Assessing Residential Pesticide Exposure C-83
Table C-111: Available Exposure Study Identification Information
Citation Solomon, K. R., Harris, S. A, Stephenson, G. R. (1993). Applicator And Bystander Exposure To Home Garden And Landscape Pesticides. American Chemical Society, 1993, pp. 262-273
EPA MRID none ORETF Code NA EPA Review none
MRID = Master Record Identification ORETF = Outdoor Residential Exposure Task Force Study Description: A total 20 application events were monitored while loading and applying a liquid concentrate formulation (active ingredient 2, 4-D) using a hose-end sprayer. Eleven of the applications were conducted while wearing “protective” clothing, while 9 applications were conducted while wearing “normal” clothing. The exact nature of the clothing worn was not provided. Each individual handled approximately 0.08 – 3 lbs of 2, 4-D per application. Exposure was measured using biomonitoring with passive monitoring only conducted for inhalation exposure using standard pumps (set at 1 liter per minute), cassettes, and tubing. Recoveries from field fortifications of exposure sampling matrices were generally above 85%.
Table C-112: Solomon, et al. (1993) – Checklist and Use Recommendation for
Study Criteria Exposure Component Dermal Inhalation
Does the study provide detailed characteristics on the activity, equipment type, and amount of active ingredient handled? Yes
Does dermal exposure monitoring allow for construction of an exposure estimate for individuals wearing short-sleeve shirts, shorts, shoes, socks? No NA
Was exposure to the hands representative of bare hands? No NA Was the study intended to simulate “residential” exposure via the scripted activity, amount of active ingredient handled, volunteers used, or the setting? Yes
Is the data of reasonable quality (i.e., are field fortification and laboratory recovery samples adequate)? Yes Yes
Should this study be recommended for use in residential handler exposure assessments? No No
Data Summary: A summary of the data from this study is not provided since it is not recommended for use in residential handler exposure assessment. The submitted study itself should be reviewed for further information. Limitations: Any data limitations associated with the exposure data in this study are not provided since it is not recommended for use in residential handler exposure assessment. The submitted study itself should be reviewed for further information.
Table C-113: Exposure Study Identification Information Citation Klonne, D. (1999). Integrated Report on Evaluation of Potential Exposure to
Homeowners and Professional Lawn Care Operators Mixing, Loading, and Applying Granular and Liquid Pesticides to Residential Lawns. Sponsor/Submitter: Outdoor Residential Exposure Task Force
EPA MRID 44972201 ORETF Code OMA004 EPA Review Memo from G. Bangs to D. Fuller (3/5/03)
D261948

Formulation: Liquids Equipment/Application Method: Hose-end sprayer
U.S. EPA Office of Pesticide Programs – Standard Operating Procedures for Assessing Residential Pesticide Exposure C-84
D287251 MRID = Master Record Identification ORETF = Outdoor Residential Exposure Task Force Study Description: A total of 30 application events were collected from 30 individuals using passive dosimetry (inner and outer whole body dosimeters, hand washes, face/neck wipes, and personal inhalation monitors). Each test subject poured a 32 fl. oz. plastic container into a dial-type sprayer (DTS), which was then screwed onto the end of the hose. Each application consisted of treating approximately 5000 ft2 of residential lawns and handling approximately 0.5 lb active ingredient (diazinon) over the course of 75 minutes. Dermal exposure was measured using inner and outer whole body dosimeters, hand washes, and face/neck washes, such that exposure can be constructed for various clothing scenarios (including a short-sleeve shirt, shorts, and no chemical-resistant gloves). Inhalation exposure was measured using standard personal air monitoring devices set at 1.5 liters per minute. All fortified samples and field samples collected on the same study day were stored frozen and analyzed together, eliminating the need for storage stability determination. Lab spike recoveries for all matrices were in the range of 87-103%. Mean field fortification recoveries ranged from 79 to 104%.
Table C-114: MRID 44972201 – Checklist and Use Recommendation
Study Criteria Exposure Component Dermal Inhalation
Does the study provide detailed characteristics on the activity, equipment type, and amount of active ingredient handled? Yes
Does dermal exposure monitoring allow for construction of an exposure estimate for individuals wearing short-sleeve shirts, shorts, shoes, socks? Yes NA
Was exposure to the hands representative of bare hands? Yes NA Was the study intended to simulate “residential” exposure via the scripted activity, amount of active ingredient handled, volunteers used, or the setting? Yes
Is the data of reasonable quality (i.e., are field fortification and laboratory recovery samples adequate)? Yes Yes
Should this study be recommended for use in residential handler exposure assessments? Yes Yes
Data Summary: The following table summarizes pertinent exposure information from the above referenced study. Both dermal and inhalation exposure are included since both are recommended for use in residential handler exposure assessment. The submitted study itself or corresponding analytical spreadsheets should be reviewed for further information.
Table C-115: MRID 44972201 – Data Summary
Person ID AaiH1 (lbs)
Exposure (mg) Unit Exposure (mg/lb ai)4 Dermal2 Inhalation3 Dermal Inhalation
3 0.5 1.29 0.007 2.58 0.014 4 0.5 9.01 -- 18.03 -- 7 0.5 12.80 0.025 25.60 0.050 8 0.5 7.60 0.015 15.21 0.030 10 0.5 5.20 0.005 10.40 0.010 14 0.5 3.52 0.008 7.04 0.016 15 0.5 2.97 0.021 5.94 0.042 16 0.5 6.56 0.015 13.12 0.030 18 0.5 3.60 0.014 7.19 0.028
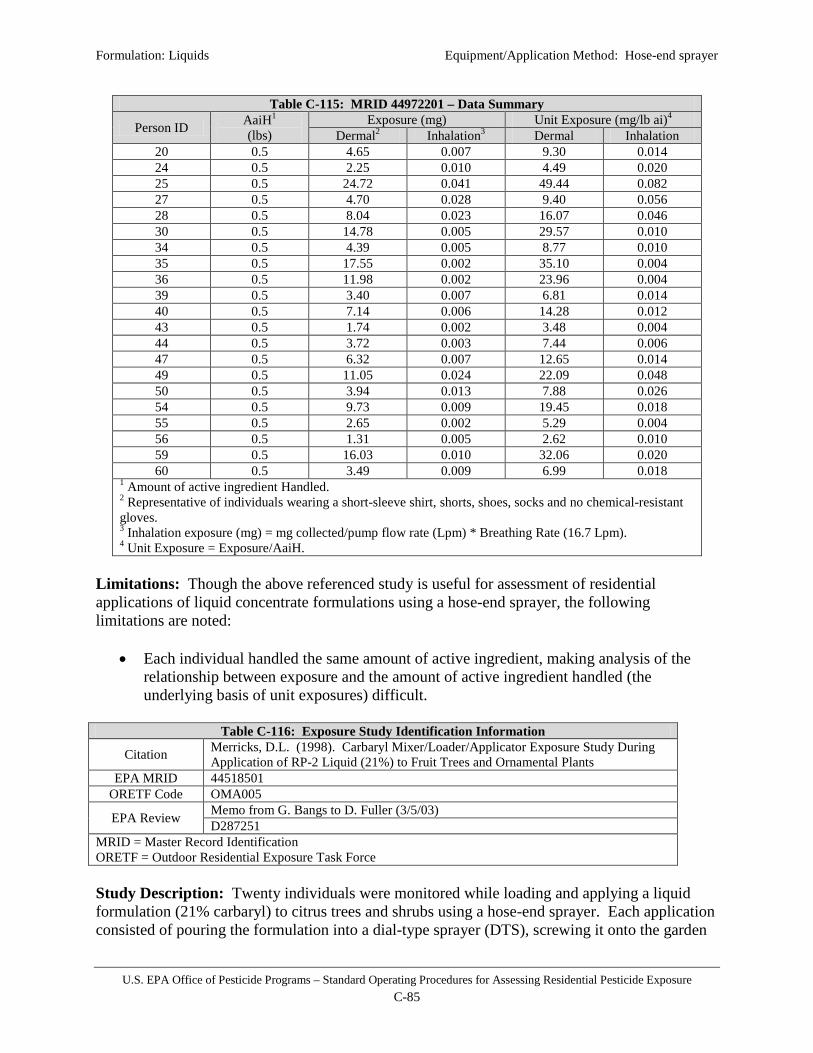
Formulation: Liquids Equipment/Application Method: Hose-end sprayer
U.S. EPA Office of Pesticide Programs – Standard Operating Procedures for Assessing Residential Pesticide Exposure C-85
Table C-115: MRID 44972201 – Data Summary
Person ID AaiH1 (lbs)
Exposure (mg) Unit Exposure (mg/lb ai)4 Dermal2 Inhalation3 Dermal Inhalation
20 0.5 4.65 0.007 9.30 0.014 24 0.5 2.25 0.010 4.49 0.020 25 0.5 24.72 0.041 49.44 0.082 27 0.5 4.70 0.028 9.40 0.056 28 0.5 8.04 0.023 16.07 0.046 30 0.5 14.78 0.005 29.57 0.010 34 0.5 4.39 0.005 8.77 0.010 35 0.5 17.55 0.002 35.10 0.004 36 0.5 11.98 0.002 23.96 0.004 39 0.5 3.40 0.007 6.81 0.014 40 0.5 7.14 0.006 14.28 0.012 43 0.5 1.74 0.002 3.48 0.004 44 0.5 3.72 0.003 7.44 0.006 47 0.5 6.32 0.007 12.65 0.014 49 0.5 11.05 0.024 22.09 0.048 50 0.5 3.94 0.013 7.88 0.026 54 0.5 9.73 0.009 19.45 0.018 55 0.5 2.65 0.002 5.29 0.004 56 0.5 1.31 0.005 2.62 0.010 59 0.5 16.03 0.010 32.06 0.020 60 0.5 3.49 0.009 6.99 0.018
1 Amount of active ingredient Handled. 2 Representative of individuals wearing a short-sleeve shirt, shorts, shoes, socks and no chemical-resistant gloves. 3 Inhalation exposure (mg) = mg collected/pump flow rate (Lpm) * Breathing Rate (16.7 Lpm). 4 Unit Exposure = Exposure/AaiH.
Limitations: Though the above referenced study is useful for assessment of residential applications of liquid concentrate formulations using a hose-end sprayer, the following limitations are noted:
• Each individual handled the same amount of active ingredient, making analysis of the relationship between exposure and the amount of active ingredient handled (the underlying basis of unit exposures) difficult.
Table C-116: Exposure Study Identification Information
Citation Merricks, D.L. (1998). Carbaryl Mixer/Loader/Applicator Exposure Study During Application of RP-2 Liquid (21%) to Fruit Trees and Ornamental Plants
EPA MRID 44518501 ORETF Code OMA005
EPA Review Memo from G. Bangs to D. Fuller (3/5/03) D287251
MRID = Master Record Identification ORETF = Outdoor Residential Exposure Task Force Study Description: Twenty individuals were monitored while loading and applying a liquid formulation (21% carbaryl) to citrus trees and shrubs using a hose-end sprayer. Each application consisted of pouring the formulation into a dial-type sprayer (DTS), screwing it onto the garden

Formulation: Liquids Equipment/Application Method: Hose-end sprayer
U.S. EPA Office of Pesticide Programs – Standard Operating Procedures for Assessing Residential Pesticide Exposure C-86
hose and spraying the trees and shrubs. The activity lasted less than 20 minutes and the amount of carbaryl handled ranged from 0.02 to 0.09 lbs. Dermal exposure was measured using inner and outer whole body dosimetry and hand washes (individuals were monitored without gloves). Inhalation exposure was measured using standard pumps (set at 2 liters per minute), cassettes, and tubing. Field fortification recoveries for passive dosimeters averaged 88.3% for inner and 76.2% for outer dosimeters. Face and neck wipe fortifications averaged 82.5%. Handwash fortifications averaged 93.6% and air sampler tube fortification was 91.8%. Laboratory method validation for each matrix fell within the acceptable range of 70 to 120%. The limit of quantitation (LOQ) was 1.0 µg/sample for all media except the inhalation monitors where the LOQ was 0.01 µg/sample. The limit of detection (LOD) was 0.5 µg/sample for all media except the inhalation monitors where the LOQ was 0.005 µg/sample.
Table C-117: MRID 44518501 – Checklist and Use Recommendation
Study Criteria Exposure Component Dermal Inhalation
Does the study provide detailed characteristics on the activity, equipment type, and amount of active ingredient handled? Yes
Does dermal exposure monitoring allow for construction of an exposure estimate for individuals wearing short-sleeve shirts, shorts, shoes, socks? Yes NA
Was exposure to the hands representative of bare hands? Yes NA Was the study intended to simulate “residential” exposure via the scripted activity, amount of active ingredient handled, volunteers used, or the setting? Yes
Is the data of reasonable quality (i.e., are field fortification and laboratory recovery samples adequate)? Yes Yes
Should this study be recommended for use in residential handler exposure assessments? Yes Yes
Data Summary: The following table summarizes pertinent exposure information from the above referenced study. Both dermal and inhalation exposure are included since both are recommended for use in residential handler exposure assessment. The submitted study itself or corresponding analytical spreadsheets should be reviewed for further information.
Table C-118: MRID 44518501 – Data Summary
Person ID AaiH1 (lbs)
Exposure (mg) Unit Exposure (mg/lb ai)4 Dermal2 Inhalation3 Dermal Inhalation
A 0.026 0.19 0.000042 7.3 0.0016 B 0.020 2.25 0.000042 112.5 0.0021 C 0.066 8.71 0.000042 132.0 0.0006 D 0.052 14.65 0.000084 281.7 0.0016 E 0.027 1.64 0.000167 60.7 0.0062 F 0.025 0.31 0.000042 12.4 0.0017 G 0.020 1.38 0.000042 69.0 0.0021 H 0.022 0.99 0.000042 45.0 0.0019 I 0.021 0.90 0.000042 42.9 0.0020 J 0.020 0.99 0.000042 49.5 0.0021 K 0.035 0.42 0.000044 12.0 0.0013 L 0.046 0.23 0.000042 5.0 0.0009 M 0.042 2.51 0.000042 59.8 0.0010 N 0.090 3.80 0.000134 42.2 0.0015 O 0.029 0.75 0.000042 25.9 0.0015 P 0.027 3.08 0.000042 114.1 0.0016

Formulation: Liquids Equipment/Application Method: Hose-end sprayer
U.S. EPA Office of Pesticide Programs – Standard Operating Procedures for Assessing Residential Pesticide Exposure C-87
Table C-118: MRID 44518501 – Data Summary
Person ID AaiH1 (lbs)
Exposure (mg) Unit Exposure (mg/lb ai)4 Dermal2 Inhalation3 Dermal Inhalation
Q 0.062 1.60 0.000042 25.8 0.0007 R 0.024 2.20 0.000042 91.7 0.0018 S 0.073 1.22 0.000043 16.7 0.0006 T 0.024 0.66 0.000042 27.5 0.0018
1 Amount of active ingredient Handled. 2 Representative of individuals wearing a short-sleeve shirt, shorts, shoes, socks and no chemical-resistant gloves. 3 Inhalation exposure (mg) = mg collected/pump flow rate (Lpm) * Breathing Rate (16.7 Lpm). 4 Unit Exposure = Exposure/AaiH.
Limitations: Though the above referenced study is useful for assessment of residential applications of liquid concentrate formulations using a hose-end sprayer, the following limitations are noted:
• Seventeen of 20 inhalation exposure measurements were non-detects. Use of ½ the limit of detection (0.01 µg) was necessary, thus introducing uncertainty.
Table C-119: Exposure Study Identification Information
Citation Merricks, D.L. (1997). Carbaryl Mixer/Loader/Applicator Exposure Study during Application of RP-2 Liquid (21%), Sevin® Ready to Use Insect Spray or Sevin® 10 Dust to Home Garden Vegetables
EPA MRID 44459801 ORETF Code OMA006
EPA Review Memo from G. Bangs to D. Fuller (3/5/03) D287251
MRID = Master Record Identification ORETF = Outdoor Residential Exposure Task Force Study Description: Forty individuals were monitored while mixing, loading, and applying a liquid formulation (21% carbaryl) to tomato and cucumber gardens using a hose-end sprayer. Each application consisted of pouring the formulation into a dial-type sprayer (DTS), screwing it onto the garden hose and spraying the garden. The activity lasted less than 20 minutes and the amount of carbaryl handled ranged from 0.02 to 0.11 lbs. Dermal exposure was measured using inner and outer whole body dosimetry and hand washes (20 individuals were monitored without gloves). Inhalation exposure was measured using standard pumps (set at 2 liters per minute), cassettes, and tubing. Field fortification recoveries for passive dosimeters averaged 84.3% for inner dosimeters and 77.7% for outer dosimeters. Face and neck wipe field fortifications averaged 84.8%. Both handwash and inhalation tube field fortification averaged >90%. Laboratory method validation for each matrix fell within the acceptable range of 70 to 120%. The limit of quantitation (LOQ) was 1.0 µg/sample for all media except the inhalation monitors where the LOQ was 0.01 µg/sample. The limit of detection (LOD) was 0.5 µg/sample for all media except the inhalation monitors where the LOQ was 0.005 µg/sample.
Table C-120: MRID 44459801 – Checklist and Use Recommendation for
Study Criteria Exposure Component Dermal Inhalation
Does the study provide detailed characteristics on the activity, equipment type, Yes

Formulation: Liquids Equipment/Application Method: Hose-end sprayer
U.S. EPA Office of Pesticide Programs – Standard Operating Procedures for Assessing Residential Pesticide Exposure C-88
Table C-120: MRID 44459801 – Checklist and Use Recommendation for
Study Criteria Exposure Component Dermal Inhalation
and amount of active ingredient handled? Does dermal exposure monitoring allow for construction of an exposure estimate for individuals wearing short-sleeve shirts, shorts, shoes, socks? Yes NA
Was exposure to the hands representative of bare hands? Yes NA Was the study intended to simulate “residential” exposure via the scripted activity, amount of active ingredient handled, volunteers used, or the setting? Yes
Is the data of reasonable quality (i.e., are field fortification and laboratory recovery samples adequate)? Yes Yes
Should this study be recommended for use in residential handler exposure assessments? Yes Yes
Data Summary: The following table summarizes pertinent exposure information from the above referenced study. Both dermal and inhalation exposure are included since both are recommended for use in residential handler exposure assessment. Note that only dermal exposure data representative of individuals wearing short-sleeve shirt, shorts, shoes, socks, and no chemical-resistant gloves are presented. The submitted study itself or corresponding analytical spreadsheets should be reviewed for further information.
Table C-121: MRID 44459801 – Data Summary
Person ID AaiH1 (lbs)
Exposure (mg) Unit Exposure (mg/lb ai)4 Dermal2 Inhalation3 Dermal Inhalation
P2 0.11 3.43 0.000142 31.2 0.0013 Q2 0.08 3.59 0.000042 44.9 0.0005 T2 0.05 0.96 0.000042 19.2 0.0009 U2 0.03 1.92 0.000042 64.0 0.0017 V2 0.05 2.90 0.000043 58.0 0.0009 W2 0.08 6.30 0.000146 78.8 0.0018 Z2 0.05 1.18 0.000084 23.6 0.0018 A3 0.05 1.63 0.000134 32.6 0.0026 B3 0.04 0.79 0.000041 19.8 0.0010 C3 0.05 0.92 0.000042 18.4 0.0008 F3 0.07 2.34 0.000042 33.4 0.0006 G3 0.05 4.30 0.000125 86.0 0.0025 H3 0.03 0.73 0.000043 24.3 0.0014 I3 0.07 4.21 0.000042 60.1 0.0006
M3 0.03 0.20 0.000042 6.7 0.0016 L3 0.04 7.16 0.000094 179.0 0.0026 N3 0.05 8.33 0.000042 166.6 0.0008 O3 0.1 1.06 0.000042 10.6 0.0004 R3 0.05 1.09 0.000134 21.8 0.0025 S3 0.02 0.18 0.000042 9.0 0.0017 A 0.05 -- 0.000042 -- 0.0008 B 0.04 -- 0.000042 -- 0.0011 G 0.04 -- 0.000042 -- 0.0011 C 0.05 -- 0.000042 -- 0.0008 J 0.04 -- 0.000042 -- 0.0011 D 0.07 -- 0.000042 -- 0.0006 M 0.02 -- 0.000042 -- 0.0020 N 0.08 -- 0.000042 -- 0.0005

Formulation: Liquids Equipment/Application Method: Hose-end sprayer
U.S. EPA Office of Pesticide Programs – Standard Operating Procedures for Assessing Residential Pesticide Exposure C-89
Table C-121: MRID 44459801 – Data Summary
Person ID AaiH1 (lbs)
Exposure (mg) Unit Exposure (mg/lb ai)4 Dermal2 Inhalation3 Dermal Inhalation
Q 0.03 -- 0.000042 -- 0.0013 R 0.04 -- 0.000042 -- 0.0010 U 0.04 -- 0.000043 -- 0.0010 V 0.07 -- 0.000042 -- 0.0006 Y 0.05 -- 0.000042 -- 0.0009 Z 0.04 -- 0.000042 -- 0.0009
C2 0.05 -- 0.000042 -- 0.0009 D2 0.07 -- 0.000041 -- 0.0006 G2 0.01 -- 0.000042 -- 0.0038 H2 0.07 -- 0.000042 -- 0.0006 K2 0.03 -- 0.000042 -- 0.0013 L2 0.06 -- 0.000042 -- 0.0006
1 Amount of active ingredient Handled. 2 Representative of individuals wearing a short-sleeve shirt, shorts, shoes, socks and no chemical-resistant gloves. 3 Inhalation exposure (mg) = mg collected/pump flow rate (Lpm) * Breathing Rate (16.7 Lpm). 4 Unit Exposure = Exposure/AaiH.
Limitations: Though the above referenced study is useful for assessment of residential applications of liquid concentrate formulations using a hose-end sprayer, the following limitations are noted:
• Thirty-six of 40 inhalation exposure measurements were non-detects. Use of ½ the limit of detection (0.01 µg) was necessary, thus introducing uncertainty.
Table C-122: Exposure Study Identification Information
Citation
Rosenheck, L. (2000) Determination of Exposure During the Mixing, Loading and Application of Liquid Diazinon to Residential Turf Through the Use of Passive Dosimetry and Biological Monitoring: Lab Project Number 767-98: I024480NAU950T. Unpublished study prepared by Development Resources/Chemical Support Department, Novartis Crop Protection, Inc. 574 p.
EPA MRID 45184305 ORETF Code NA EPA Review D268247
MRID = Master Record Identification ORETF = Outdoor Residential Exposure Task Force Study Description: Twelve non-professional volunteers were monitored while making applications of a liquid pesticide formulation (22.4% diazinon) with a conventional hose-end sprayer to approximately 5000 ft2 of lawn. The applications ranged from 18 to 78 minutes with all individuals 0.5 lbs of active ingredient (diazinon). Dermal exposure was measured using whole body dosimetry (100% cotton union suit) worn under shorts and a T-shirt, hand washes, and face/neck wipes. No chemical-resistant gloves were worn. Inhalation exposure was measured using standard pumps (set at 1.5 liters per minute), cassettes, and tubing. Field fortification recoveries for the cotton union suit dosimeters averaged 99%, face and neck wipe fortifications averaged 89.1%, handwash fortifications averaged 75% and air sampler tube fortification was 109%. Laboratory method validation for each matrix fell within the acceptable range of 70 to 120%. The limit of quantitation (LOQ) was 1.0 µg/sample for the cotton

Formulation: Liquids Equipment/Application Method: Hose-end sprayer
U.S. EPA Office of Pesticide Programs – Standard Operating Procedures for Assessing Residential Pesticide Exposure C-90
dosimeters, 0.5 µg/sample for the face/neck wipes, 1.0 µg/sample for the hand washes and 0.01 µg/sample for the inhalation monitors.
Table C-123: MRID 45184305 – Checklist and Use Recommendation
Study Criteria Exposure Component Dermal Inhalation
Does the study provide detailed characteristics on the activity, equipment type, and amount of active ingredient handled? Yes
Does dermal exposure monitoring allow for construction of an exposure estimate for individuals wearing short-sleeve shirts, shorts, shoes, socks? Yes NA
Was exposure to the hands representative of bare hands? Yes NA Was the study intended to simulate “residential” exposure via the scripted activity, amount of active ingredient handled, volunteers used, or the setting? Yes
Is the data of reasonable quality (i.e., are field fortification and laboratory recovery samples adequate)? Yes Yes
Should this study be recommended for use in residential handler exposure assessments? Yes Yes
Data Summary: The following table summarizes pertinent exposure information from the above referenced study. Both dermal and inhalation exposure are included since both are recommended for use in residential handler exposure assessment. The submitted study itself or corresponding analytical spreadsheets should be reviewed for further information.
Table C-124: MRID 45184305 – Data Summary
Person ID AaiH1 (lbs)
Exposure (mg) Unit Exposure (mg/lb ai)4 Dermal2 Inhalation3 Dermal Inhalation
18 0.5 1.07 0.0278 2.14 0.0557 17 0.5 16.72 0.0056 33.44 0.0111 16 0.5 4.12 0.0012 8.23 0.0024 19 0.5 4.06 0.0094 8.11 0.0187 27 0.5 1.63 0.0057 3.26 0.0114 24 0.5 1.35 0.0036 2.70 0.0071 25 0.5 2.84 0.0267 5.68 0.0534 26 0.5 11.36 0.0046 22.71 0.0091 20 0.5 3.48 0.0049 6.96 0.0098 21 0.5 0.58 0.0022 1.17 0.0045 29 0.5 0.44 0.0045 0.87 0.0089 30 0.5 1.42 -- 2.84 --
1 Amount of active ingredient Handled. 2 Representative of individuals wearing a short-sleeve shirt, shorts, shoes, socks and no chemical-resistant gloves. 3 Inhalation exposure (mg) = mg collected/pump flow rate (Lpm) * Breathing Rate (16.7 Lpm). 4 Unit Exposure = Exposure/AaiH.
Limitations: Though the above referenced study is useful for assessment of residential applications of liquid concentrate formulations using a conventional hose-end sprayer, the following limitations are noted:
• Each individual handled the same amount of active ingredient, making analysis of the relationship between exposure and the amount of active ingredient handled (the underlying basis of unit exposures) difficult.
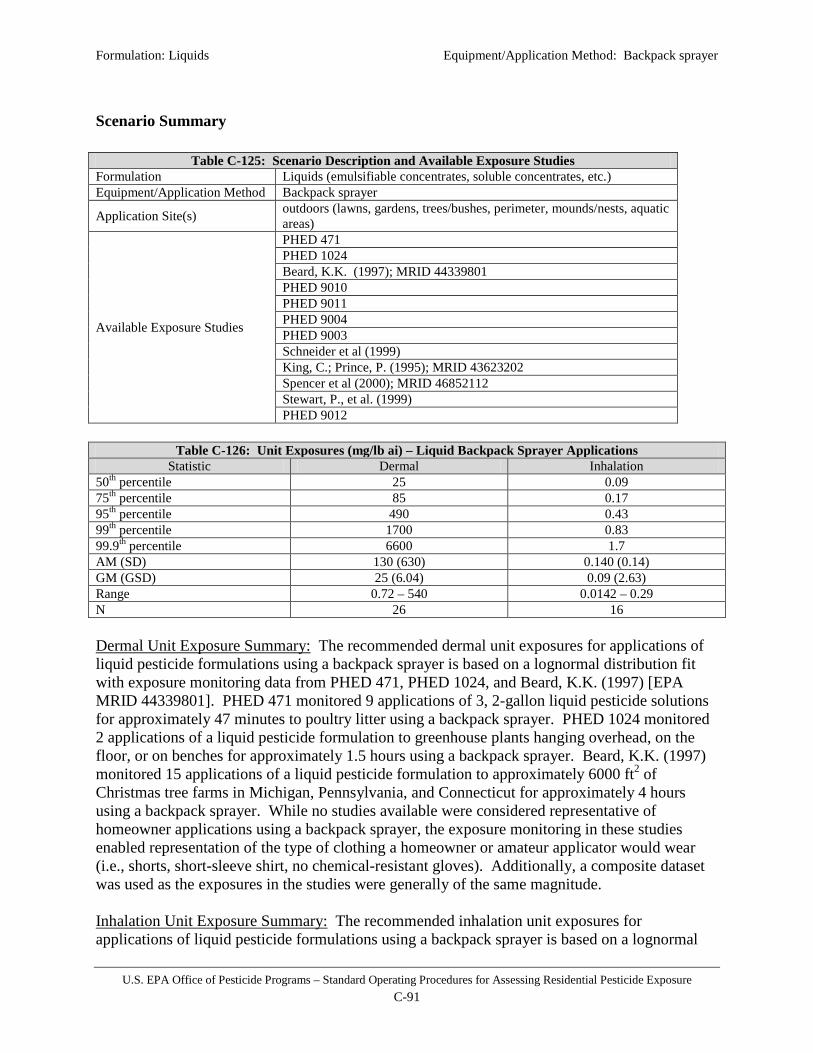
Formulation: Liquids Equipment/Application Method: Backpack sprayer
U.S. EPA Office of Pesticide Programs – Standard Operating Procedures for Assessing Residential Pesticide Exposure C-91
Scenario Summary
Table C-125: Scenario Description and Available Exposure Studies Formulation Liquids (emulsifiable concentrates, soluble concentrates, etc.) Equipment/Application Method Backpack sprayer
Application Site(s) outdoors (lawns, gardens, trees/bushes, perimeter, mounds/nests, aquatic areas)
Available Exposure Studies
PHED 471 PHED 1024 Beard, K.K. (1997); MRID 44339801 PHED 9010 PHED 9011 PHED 9004 PHED 9003 Schneider et al (1999) King, C.; Prince, P. (1995); MRID 43623202 Spencer et al (2000); MRID 46852112 Stewart, P., et al. (1999) PHED 9012
Table C-126: Unit Exposures (mg/lb ai) – Liquid Backpack Sprayer Applications
Statistic Dermal Inhalation 50th percentile 25 0.09 75th percentile 85 0.17 95th percentile 490 0.43 99th percentile 1700 0.83 99.9th percentile 6600 1.7 AM (SD) 130 (630) 0.140 (0.14) GM (GSD) 25 (6.04) 0.09 (2.63) Range 0.72 – 540 0.0142 – 0.29 N 26 16 Dermal Unit Exposure Summary: The recommended dermal unit exposures for applications of liquid pesticide formulations using a backpack sprayer is based on a lognormal distribution fit with exposure monitoring data from PHED 471, PHED 1024, and Beard, K.K. (1997) [EPA MRID 44339801]. PHED 471 monitored 9 applications of 3, 2-gallon liquid pesticide solutions for approximately 47 minutes to poultry litter using a backpack sprayer. PHED 1024 monitored 2 applications of a liquid pesticide formulation to greenhouse plants hanging overhead, on the floor, or on benches for approximately 1.5 hours using a backpack sprayer. Beard, K.K. (1997) monitored 15 applications of a liquid pesticide formulation to approximately 6000 ft2 of Christmas tree farms in Michigan, Pennsylvania, and Connecticut for approximately 4 hours using a backpack sprayer. While no studies available were considered representative of homeowner applications using a backpack sprayer, the exposure monitoring in these studies enabled representation of the type of clothing a homeowner or amateur applicator would wear (i.e., shorts, short-sleeve shirt, no chemical-resistant gloves). Additionally, a composite dataset was used as the exposures in the studies were generally of the same magnitude. Inhalation Unit Exposure Summary: The recommended inhalation unit exposures for applications of liquid pesticide formulations using a backpack sprayer is based on a lognormal

Formulation: Liquids Equipment/Application Method: Backpack sprayer
U.S. EPA Office of Pesticide Programs – Standard Operating Procedures for Assessing Residential Pesticide Exposure C-92
distribution fit with exposure monitoring data from King, C.; Prince, P. (1995) [EPA MRID 43623202; AH605]. King, C.; Prince, P. (1995) monitored 16 applications of a liquid pesticide formulation for approximately 63-94 minutes to greenhouse ornamentals in Florida, Maryland, and California. No studies adequately represented homeowner applications using a backpack sprayer. This study was therefore selected as it resulted in the highest inhalation exposure estimates of the available studies.

Formulation: Liquids Equipment/Application Method: Backpack sprayer
U.S. EPA Office of Pesticide Programs – Standard Operating Procedures for Assessing Residential Pesticide Exposure C-93
Lognormal Probability Plots Legend: O = Beard, K.K. (1997); X = PHED 471; ■ = PHED 1024
Legend: ■ = King, C., Prince, P., (1995)
Der
mal
UE
(mg/
lb a
i)
0
100
200
300
400
500.001.01.05.10.25 .50 .75 .90 .95
0 5 10 15 20 25
Log Normal Quantile
Inha
latio
n U
E (
mg/
lb a
i)
0
0.05
0.1
0.15
0.2
0.25
0.3.001.01 .05.10 .25 .50 .75 .90 .95
0 1 2 3 4 5
Log Normal Quantile
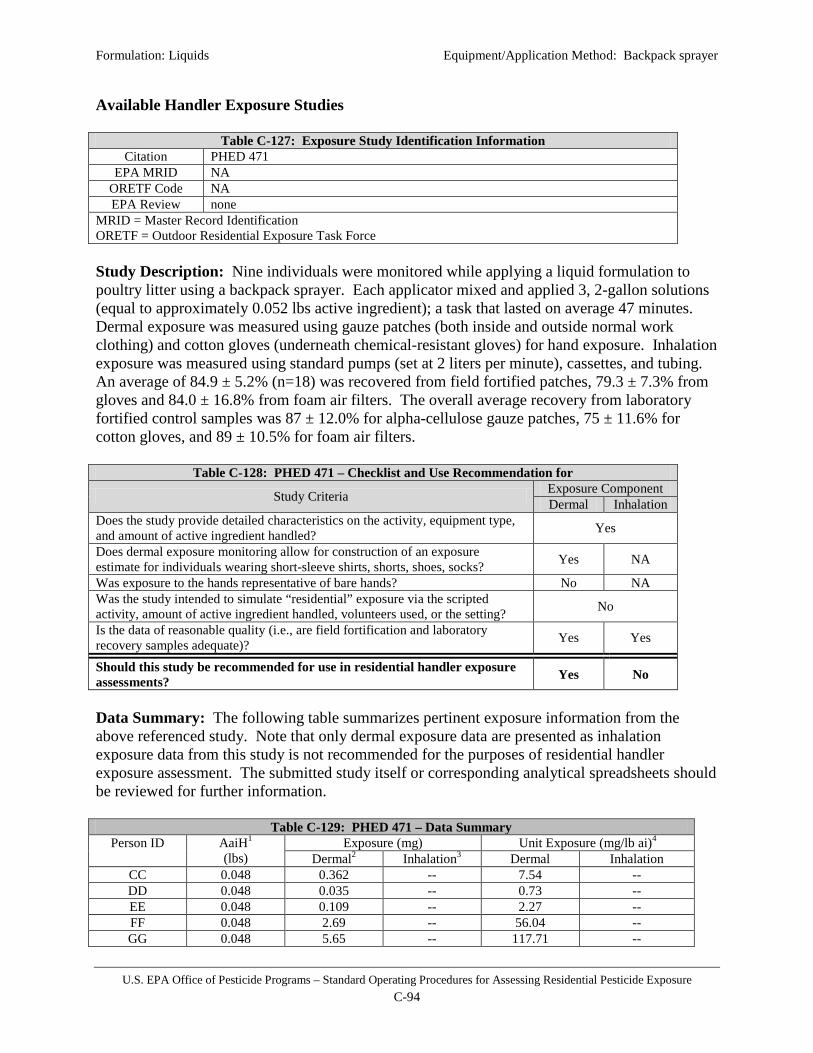
Formulation: Liquids Equipment/Application Method: Backpack sprayer
U.S. EPA Office of Pesticide Programs – Standard Operating Procedures for Assessing Residential Pesticide Exposure C-94
Available Handler Exposure Studies
Table C-127: Exposure Study Identification Information Citation PHED 471
EPA MRID NA ORETF Code NA EPA Review none
MRID = Master Record Identification ORETF = Outdoor Residential Exposure Task Force Study Description: Nine individuals were monitored while applying a liquid formulation to poultry litter using a backpack sprayer. Each applicator mixed and applied 3, 2-gallon solutions (equal to approximately 0.052 lbs active ingredient); a task that lasted on average 47 minutes. Dermal exposure was measured using gauze patches (both inside and outside normal work clothing) and cotton gloves (underneath chemical-resistant gloves) for hand exposure. Inhalation exposure was measured using standard pumps (set at 2 liters per minute), cassettes, and tubing. An average of 84.9 ± 5.2% (n=18) was recovered from field fortified patches, 79.3 ± 7.3% from gloves and 84.0 ± 16.8% from foam air filters. The overall average recovery from laboratory fortified control samples was 87 ± 12.0% for alpha-cellulose gauze patches, 75 ± 11.6% for cotton gloves, and 89 ± 10.5% for foam air filters.
Table C-128: PHED 471 – Checklist and Use Recommendation for
Study Criteria Exposure Component Dermal Inhalation
Does the study provide detailed characteristics on the activity, equipment type, and amount of active ingredient handled? Yes
Does dermal exposure monitoring allow for construction of an exposure estimate for individuals wearing short-sleeve shirts, shorts, shoes, socks? Yes NA
Was exposure to the hands representative of bare hands? No NA Was the study intended to simulate “residential” exposure via the scripted activity, amount of active ingredient handled, volunteers used, or the setting? No
Is the data of reasonable quality (i.e., are field fortification and laboratory recovery samples adequate)? Yes Yes
Should this study be recommended for use in residential handler exposure assessments? Yes No
Data Summary: The following table summarizes pertinent exposure information from the above referenced study. Note that only dermal exposure data are presented as inhalation exposure data from this study is not recommended for the purposes of residential handler exposure assessment. The submitted study itself or corresponding analytical spreadsheets should be reviewed for further information.
Table C-129: PHED 471 – Data Summary Person ID AaiH1
(lbs) Exposure (mg) Unit Exposure (mg/lb ai)4
Dermal2 Inhalation3 Dermal Inhalation CC 0.048 0.362 -- 7.54 -- DD 0.048 0.035 -- 0.73 -- EE 0.048 0.109 -- 2.27 -- FF 0.048 2.69 -- 56.04 -- GG 0.048 5.65 -- 117.71 --

Formulation: Liquids Equipment/Application Method: Backpack sprayer
U.S. EPA Office of Pesticide Programs – Standard Operating Procedures for Assessing Residential Pesticide Exposure C-95
Table C-129: PHED 471 – Data Summary Person ID AaiH1
(lbs) Exposure (mg) Unit Exposure (mg/lb ai)4
Dermal2 Inhalation3 Dermal Inhalation HH 0.048 1.58 -- 32.92 -- II 0.048 0.68 -- 14.17 -- JJ 0.048 1.08 -- 22.50 --
KK 0.048 0.18 -- 3.75 -- 1 Amount of active ingredient Handled. 2 Representative of individuals wearing a short-sleeve shirt, shorts, shoes, socks and no chemical-resistant gloves. 3 Inhalation exposure (mg) = mg collected/pump flow rate (Lpm) * Breathing Rate (16.7 Lpm). All samples were non-detects. 4 Unit Exposure = Exposure/AaiH. Limitations: Though the above referenced study is useful for assessment of residential applications of liquid concentrate formulations using a backpack sprayer, the following limitations are noted:
• All monitored individuals wore chemical-resistant gloves, thus a back-calculation using a 90% protection factor to “bare hands” exposure was necessary.
• The study was conducted using workers in a poultry house, so use for residential handler exposure assessments introduces uncertainty.
Table C-130: Exposure Study Identification Information
Citation PHED 1024 EPA MRID NA
ORETF Code NA EPA Review none
MRID = Master Record Identification ORETF = Outdoor Residential Exposure Task Force Study Description: Two individuals were monitored while applying a liquid formulation to greenhouse plants hanging overhead or on the floor or on benches using a backpack sprayer. Each applicator sprayed over 100 gallons of solution, corresponding to 0.13 lbs of active ingredient handled. Each application event generally lasted 1.5 hours. Dermal exposure was measured using gauze patches (both inside and outside normal work clothing) and hand rinses (underneath chemical-resistant gloves) for hand exposure. Inhalation exposure was measured using standard pumps (set at 1.5 liters per minute), cassettes, and tubing. Recoveries from field fortifications of exposure sampling matrices were generally above 90%.
Table C-131: PHED 1024 – Checklist and Use Recommendation Study Criteria Exposure Component
Dermal Inhalation Does the study provide detailed characteristics on the activity, equipment type, and amount of active ingredient handled?
Yes
Does dermal exposure monitoring allow for construction of an exposure estimate for individuals wearing short-sleeve shirts, shorts, shoes, socks? Yes NA
Was exposure to the hands representative of bare hands? No NA Was the study intended to simulate “residential” exposure via the scripted activity, amount of active ingredient handled, volunteers used, or the setting? No
Is the data of reasonable quality (i.e., are field fortification and laboratory Yes Yes

Formulation: Liquids Equipment/Application Method: Backpack sprayer
U.S. EPA Office of Pesticide Programs – Standard Operating Procedures for Assessing Residential Pesticide Exposure C-96
Table C-131: PHED 1024 – Checklist and Use Recommendation Study Criteria Exposure Component
Dermal Inhalation recovery samples adequate)? Should this study be recommended for use in residential handler exposure assessments? Yes No
Data Summary: The following table summarizes pertinent exposure information from the above referenced study. Note that only dermal exposure data are presented as inhalation exposure data from this study is not recommended for the purposes of residential handler exposure assessment. The submitted study itself or corresponding analytical spreadsheets should be reviewed for further information.
Table C-132: PHED 1024 – Data Summary
Person ID AaiH1 (lbs)
Exposure (mg) Unit Exposure (mg/lb ai)4 Dermal2 Inhalation3 Dermal Inhalation
L 0.13 0.56 -- 4.30 -- N 0.13 3.39 -- 26.10 --
1 Amount of active ingredient Handled. 2 Representative of individuals wearing a short-sleeve shirt, shorts, shoes, socks and no chemical-resistant gloves. 3 Inhalation exposure (mg) = mg collected/pump flow rate (Lpm) * Breathing Rate (16.7 Lpm). 4 Unit Exposure = Exposure/AaiH.
Limitations: Though the above referenced study is useful for assessment of residential applications of liquid concentrate formulations using a backpack sprayer, the following limitations are noted:
• All monitored individuals wore chemical-resistant gloves, thus a back-calculation using a 90% protection factor to “bare hands” exposure was necessary.
• The study was conducted using workers in a greenhouse, so use for residential handler exposure assessments introduces uncertainty.
Table C-133: Exposure Study Identification Information
Citation Beard, K.K. (1997)Evaluation of Applicator Exposures to SURFLAN® A.S. During Mixing, Loading, and Application with Backpack Sprayers
EPA MRID 44339801 ORETF Code NA
EPA Review D284121 D242325
MRID = Master Record Identification ORETF = Outdoor Residential Exposure Task Force Study Description: Fifteen individuals (14 loader/applicators, 1 mixer/loader/applicator) were monitored while applying a liquid formulation of oryzalin to Christmas tree farms in Michigan, Pennsylvania, and Connecticut using a backpack sprayer. Each application was at least 4 hours and each worker treated an area of at least 6000 ft2 handling from 5 to 70 lbs of oryzalin. Dermal exposure was measured using whole body dosimetry (both outside and underneath normal work clothing) and hand exposure was measured using wipes. Inhalation exposure was measured using standard pumps (set at 1 liter per minute), cassettes, and tubing. The average

Formulation: Liquids Equipment/Application Method: Backpack sprayer
U.S. EPA Office of Pesticide Programs – Standard Operating Procedures for Assessing Residential Pesticide Exposure C-97
recoveries for spikes prepared with the filter/tube combinations, denim, long underwear, socks and hand wipes were 106 ± 5.1%, 113 ± 4.7%, 102 ± 7.2%, 93.3 ± 56%, and 84 ± 8.3%, respectively. The average recovery for spikes prepared with coverall portions was 85 ± 15%, for spikes prepared with long underwear portions was 104 ± 22%, for spikes prepared with pairs of socks was 87 ± 17%.
Table C-134: MRID 44339801 – Checklist and Use Recommendation
Study Criteria Exposure Component Dermal Inhalation
Does the study provide detailed characteristics on the activity, equipment type, and amount of active ingredient handled? Yes
Does dermal exposure monitoring allow for construction of an exposure estimate for individuals wearing short-sleeve shirts, shorts, shoes, socks? Yes NA
Was exposure to the hands representative of bare hands? No NA Was the study intended to simulate “residential” exposure via the scripted activity, amount of active ingredient handled, volunteers used, or the setting? No
Is the data of reasonable quality (i.e., are field fortification and laboratory recovery samples adequate)? Yes Yes
Should this study be recommended for use in residential handler exposure assessments? Yes No
Data Summary: The following table summarizes pertinent exposure information from the above referenced study. Note that only dermal exposure data are presented as inhalation exposure data from this study is not recommended for the purposes of residential handler exposure assessment. The submitted study itself or corresponding analytical spreadsheets should be reviewed for further information.
Table C-135: MRID 44339801 – Data Summary
Person ID AaiH1 (lbs)
Exposure (mg) Unit Exposure (mg/lb ai)4 Dermal2 Inhalation3 Dermal Inhalation
1 8.3 226 -- 27.21 -- 2 8.3 222 -- 26.80 -- 3 68.6 63 -- 0.92 -- 4 8.3 245 -- 29.57 -- 5 8.3 12 -- 1.41 -- 7 16 2957 -- 184.82 -- 8 16 8673 -- 542.06 -- 9 16 1285 -- 80.32 -- 10 16 2841 -- 177.54 -- 11 16 5171 -- 323.16 -- 13 4.9 770 -- 157.11 -- 14 4.9 419 -- 85.57 -- 15 4.9 376 -- 76.71 -- 16 4.9 203 -- 41.44 -- 17 23.3 359 -- 15.40 --
1 Amount of active ingredient Handled. 2 Representative of individuals wearing a short-sleeve shirt, shorts, shoes, socks and no chemical-resistant gloves. 3 Inhalation exposure (mg) = mg collected/pump flow rate (Lpm) * Breathing Rate (16.7 Lpm). 4 Unit Exposure = Exposure/AaiH.
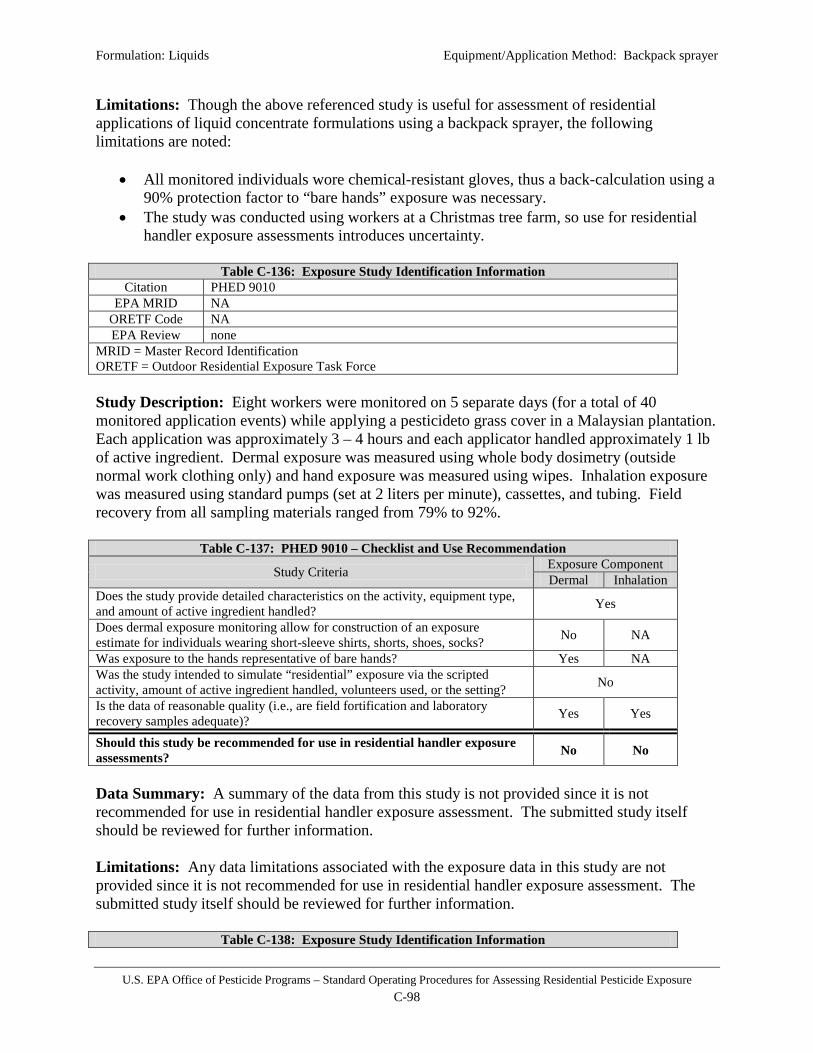
Formulation: Liquids Equipment/Application Method: Backpack sprayer
U.S. EPA Office of Pesticide Programs – Standard Operating Procedures for Assessing Residential Pesticide Exposure C-98
Limitations: Though the above referenced study is useful for assessment of residential applications of liquid concentrate formulations using a backpack sprayer, the following limitations are noted:
• All monitored individuals wore chemical-resistant gloves, thus a back-calculation using a 90% protection factor to “bare hands” exposure was necessary.
• The study was conducted using workers at a Christmas tree farm, so use for residential handler exposure assessments introduces uncertainty.
Table C-136: Exposure Study Identification Information
Citation PHED 9010 EPA MRID NA
ORETF Code NA EPA Review none
MRID = Master Record Identification ORETF = Outdoor Residential Exposure Task Force Study Description: Eight workers were monitored on 5 separate days (for a total of 40 monitored application events) while applying a pesticideto grass cover in a Malaysian plantation. Each application was approximately 3 – 4 hours and each applicator handled approximately 1 lb of active ingredient. Dermal exposure was measured using whole body dosimetry (outside normal work clothing only) and hand exposure was measured using wipes. Inhalation exposure was measured using standard pumps (set at 2 liters per minute), cassettes, and tubing. Field recovery from all sampling materials ranged from 79% to 92%.
Table C-137: PHED 9010 – Checklist and Use Recommendation
Study Criteria Exposure Component Dermal Inhalation
Does the study provide detailed characteristics on the activity, equipment type, and amount of active ingredient handled? Yes
Does dermal exposure monitoring allow for construction of an exposure estimate for individuals wearing short-sleeve shirts, shorts, shoes, socks? No NA
Was exposure to the hands representative of bare hands? Yes NA Was the study intended to simulate “residential” exposure via the scripted activity, amount of active ingredient handled, volunteers used, or the setting? No
Is the data of reasonable quality (i.e., are field fortification and laboratory recovery samples adequate)? Yes Yes
Should this study be recommended for use in residential handler exposure assessments? No No
Data Summary: A summary of the data from this study is not provided since it is not recommended for use in residential handler exposure assessment. The submitted study itself should be reviewed for further information. Limitations: Any data limitations associated with the exposure data in this study are not provided since it is not recommended for use in residential handler exposure assessment. The submitted study itself should be reviewed for further information.
Table C-138: Exposure Study Identification Information

Formulation: Liquids Equipment/Application Method: Backpack sprayer
U.S. EPA Office of Pesticide Programs – Standard Operating Procedures for Assessing Residential Pesticide Exposure C-99
Citation PHED 9011 EPA MRID NA
ORETF Code NA EPA Review none
MRID = Master Record Identification ORETF = Outdoor Residential Exposure Task Force Study Description: Five workers were monitored during 4 applications of a pesticide to grass cover in a Malaysian plantation using backpack sprayers. The application time and amount of active ingredient handled were unclear based on the study report. Dermal exposure was measured using gauze patches (most placed outside normal work clothing only). Hand exposure was not measured. Inhalation exposure was measured for only 9 of the 20 application events using standard pumps (set at 2 liters per minute), cassettes, and tubing. Only laboratory recoveries were reported which averaged 59%.
Table C-139: PHED 9011 – Checklist and Use Recommendation Study Criteria Exposure Component
Dermal Inhalation Does the study provide detailed characteristics on the activity, equipment type, and amount of active ingredient handled?
No
Does dermal exposure monitoring allow for construction of an exposure estimate for individuals wearing short-sleeve shirts, shorts, shoes, socks? No NA
Was exposure to the hands representative of bare hands? No NA Was the study intended to simulate “residential” exposure via the scripted activity, amount of active ingredient handled, volunteers used, or the setting? No
Is the data of reasonable quality (i.e., are field fortification and laboratory recovery samples adequate)? No No
Should this study be recommended for use in residential handler exposure assessments? No No
Data Summary: A summary of the data from this study is not provided since it is not recommended for use in residential handler exposure assessment. The submitted study itself should be reviewed for further information. Limitations: Any data limitations associated with the exposure data in this study are not provided since it is not recommended for use in residential handler exposure assessment. The submitted study itself should be reviewed for further information.
Table C-140: Exposure Study Identification Information Citation PHED 9004
EPA MRID NA ORETF Code NA EPA Review none
MRID = Master Record Identification ORETF = Outdoor Residential Exposure Task Force Study Description: Six workers were monitored for a total of 12 application events during applications of a pesticide to grassland in England using a backpack sprayer. Each application consisted of spraying 3, 16 liter tanks over the course of 1 day. The amount of active ingredient handled ranged from 0.5 to 5 lbs per application. The application time was not reported in the

Formulation: Liquids Equipment/Application Method: Backpack sprayer
U.S. EPA Office of Pesticide Programs – Standard Operating Procedures for Assessing Residential Pesticide Exposure C-100
study report. Dermal exposure was measured for 9 of the 12 applications using whole body dosimetry (outside normal work clothing only) and cotton gloves. Inhalation exposure was measured for 3 of the 12 applications using standard pumps (set at 3 liters per minute), cassettes, and tubing. Laboratory recoveries were generally above 85%, although field recoveries were not reported.
Table C-141: PHED 9004 – Checklist and Use Recommendation
Study Criteria Exposure Component Dermal Inhalation
Does the study provide detailed characteristics on the activity, equipment type, and amount of active ingredient handled? Yes
Does dermal exposure monitoring allow for construction of an exposure estimate for individuals wearing short-sleeve shirts, shorts, shoes, socks? No NA
Was exposure to the hands representative of bare hands? Yes NA Was the study intended to simulate “residential” exposure via the scripted activity, amount of active ingredient handled, volunteers used, or the setting? No
Is the data of reasonable quality (i.e., are field fortification and laboratory recovery samples adequate)? No No
Should this study be recommended for use in residential handler exposure assessments? No No
Data Summary: A summary of the data from this study is not provided since it is not recommended for use in residential handler exposure assessment. The submitted study itself should be reviewed for further information. Limitations: Any data limitations associated with the exposure data in this study are not provided since it is not recommended for use in residential handler exposure assessment. The submitted study itself should be reviewed for further information.
Table C-142: Exposure Study Identification Information Citation PHED 9003
EPA MRID NA ORETF Code NA EPA Review none
MRID = Master Record Identification ORETF = Outdoor Residential Exposure Task Force Study Description: Ten workers were monitored during 2 applications of a pesticide to weeds in a Sri Lankan tea plantation using a backpack sprayer. Each application consisted of spraying 4 tank loads over the course of approximately 1 hour. Each worker handled approximately 0.05 lbs of active ingredient per application. Dermal exposure was measured using whole body dosimetry (outside normal work clothing only) and cotton gloves. Inhalation exposure was not measured. Field recovery summary from the light procedural recoveries are for sock 90% and for glove 110%, and for dark procedural recoveries are for sock 94% and for glove 85%.
Table C-143: PHED 9003 – Checklist and Use Recommendation
Study Criteria Exposure Component Dermal Inhalation
Does the study provide detailed characteristics on the activity, equipment type, and amount of active ingredient handled? Yes
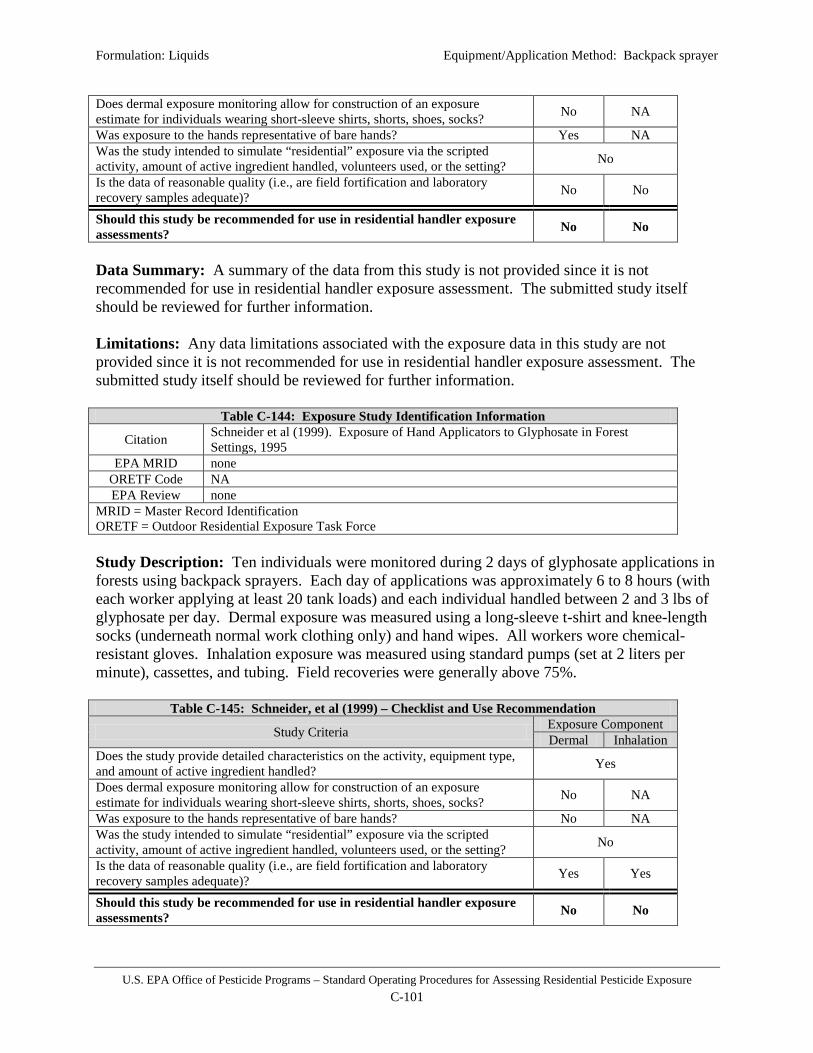
Formulation: Liquids Equipment/Application Method: Backpack sprayer
U.S. EPA Office of Pesticide Programs – Standard Operating Procedures for Assessing Residential Pesticide Exposure C-101
Does dermal exposure monitoring allow for construction of an exposure estimate for individuals wearing short-sleeve shirts, shorts, shoes, socks? No NA
Was exposure to the hands representative of bare hands? Yes NA Was the study intended to simulate “residential” exposure via the scripted activity, amount of active ingredient handled, volunteers used, or the setting? No
Is the data of reasonable quality (i.e., are field fortification and laboratory recovery samples adequate)? No No
Should this study be recommended for use in residential handler exposure assessments? No No
Data Summary: A summary of the data from this study is not provided since it is not recommended for use in residential handler exposure assessment. The submitted study itself should be reviewed for further information. Limitations: Any data limitations associated with the exposure data in this study are not provided since it is not recommended for use in residential handler exposure assessment. The submitted study itself should be reviewed for further information.
Table C-144: Exposure Study Identification Information
Citation Schneider et al (1999). Exposure of Hand Applicators to Glyphosate in Forest Settings, 1995
EPA MRID none ORETF Code NA EPA Review none
MRID = Master Record Identification ORETF = Outdoor Residential Exposure Task Force Study Description: Ten individuals were monitored during 2 days of glyphosate applications in forests using backpack sprayers. Each day of applications was approximately 6 to 8 hours (with each worker applying at least 20 tank loads) and each individual handled between 2 and 3 lbs of glyphosate per day. Dermal exposure was measured using a long-sleeve t-shirt and knee-length socks (underneath normal work clothing only) and hand wipes. All workers wore chemical-resistant gloves. Inhalation exposure was measured using standard pumps (set at 2 liters per minute), cassettes, and tubing. Field recoveries were generally above 75%.
Table C-145: Schneider, et al (1999) – Checklist and Use Recommendation
Study Criteria Exposure Component Dermal Inhalation
Does the study provide detailed characteristics on the activity, equipment type, and amount of active ingredient handled? Yes
Does dermal exposure monitoring allow for construction of an exposure estimate for individuals wearing short-sleeve shirts, shorts, shoes, socks? No NA
Was exposure to the hands representative of bare hands? No NA Was the study intended to simulate “residential” exposure via the scripted activity, amount of active ingredient handled, volunteers used, or the setting? No
Is the data of reasonable quality (i.e., are field fortification and laboratory recovery samples adequate)? Yes Yes
Should this study be recommended for use in residential handler exposure assessments? No No

Formulation: Liquids Equipment/Application Method: Backpack sprayer
U.S. EPA Office of Pesticide Programs – Standard Operating Procedures for Assessing Residential Pesticide Exposure C-102
Data Summary: A summary of the data from this study is not provided since it is not recommended for use in residential handler exposure assessment. The submitted study itself should be reviewed for further information. Limitations: Any data limitations associated with the exposure data in this study are not provided since it is not recommended for use in residential handler exposure assessment. The submitted study itself should be reviewed for further information.
Table C-146: Exposure Study Identification Information
Citation
King, C.; Prince, P. (1995) Chlorothalonil Worker Exposure During Application of Daconil 2787 Flowable Fungicide in Greenhouses: Lab Project Number: 5968-94-0104-CR-001: 94-0104: SDS-2787. Unpublished study prepared by Ricerca, Inc. AHETF study: AH605
EPA MRID 43623202 ORETF Code NA
EPA Review D393093 Contractor review (Versar, Inc.) 8/4/11
MRID = Master Record Identification ORETF = Outdoor Residential Exposure Task Force Study Description: Sixteen backpack applications in greenhouses – 6 workers in Florida, and 5 each in Maryland and California – were monitored. Each application was approximately 63 to 94 minutes and consisted of each individual mixing, loading, and applying 3 tank loads (approximately 0.1 lbs chlorothalonil) to ornamental plants. Dermal exposure was measured using inner whole body dosimetry (underneath normal work clothing) and hand rinses. All workers wore chemical-resistant gloves. Inhalation exposure was measured using standard pumps (set at 2 liters per minute), cassettes, and tubing. Inhalation samples in Maryland were adjusted for the average background level (0.051 µg) following previous use of the product. Field fortified travel spikes had mean recoveries greater than or equal to 77% for each site and matrix. Weathered samples had recoveries greater than or equal to 75% at higher fortification levels. Recoveries ranged between 30 to 70% for alpha-cellulose patches, dosimeter patches, and air monitoring samples. Analytical laboratory generated recovery samples were analyzed concurrently with the worker exposure samples as a check on losses due to the extraction procedure. These samples had a mean recovery of 100% with a standard deviation of 9.7%.
Table C-147: Checklist and Use Recommendation for MRID 43623202
Study Criteria Exposure Component Dermal Inhalation
Does the study provide detailed characteristics on the activity, equipment type, and amount of active ingredient handled? Yes
Does dermal exposure monitoring allow for construction of an exposure estimate for individuals wearing short-sleeve shirts, shorts, shoes, socks? No NA
Was exposure to the hands representative of bare hands? No NA Was the study intended to simulate “residential” exposure via the scripted activity, amount of active ingredient handled, volunteers used, or the setting? No
Is the data of reasonable quality (i.e., are field fortification and laboratory recovery samples adequate)? Yes Yes
Should this study be recommended for use in residential handler exposure assessments? No Yes

Formulation: Liquids Equipment/Application Method: Backpack sprayer
U.S. EPA Office of Pesticide Programs – Standard Operating Procedures for Assessing Residential Pesticide Exposure C-103
Data Summary: The following table summarizes pertinent exposure information from the above referenced study. Note that only inhalation exposure data are presented as the dermal exposure data are not recommended for use in residential handler exposure assessment. The submitted study itself or corresponding analytical spreadsheets should be reviewed for further information.
Table C-148: MRID 43623202 – Data Summary
Person ID AaiH1 (lbs)
Exposure (mg) Unit Exposure (mg/lb ai)4 Dermal2 Inhalation3 Dermal Inhalation
1 0.086 -- 0.0098 -- 0.1145 2 0.098 -- 0.0099 -- 0.1009 3 0.065 -- 0.0144 -- 0.2218 4 0.081 -- 0.0235 -- 0.2896 5 0.092 -- 0.0195 -- 0.2121
1A 0.085 -- 0.0139 -- 0.1638 6 0.106 -- 0.0015 -- 0.0142
7A 0.063 -- 0.0014 -- 0.0218 8 0.064 -- 0.0030 -- 0.0361 9 0.094 -- 0.0033 -- 0.0353 10 0.065 -- 0.0016 -- 0.0247 11 0.071 -- 0.0133 -- 0.1878 12 0.057 -- 0.0142 -- 0.2487 13 0.053 -- 0.0076 -- 0.1425 14 0.099 -- 0.0101 -- 0.1019 15 0.076 -- 0.0055 -- 0.0720
1 Amount of active ingredient Handled. 2 Representative of individuals wearing a short-sleeve shirt, shorts, shoes, socks and no chemical-resistant gloves. 3 Inhalation exposure (mg) = mg collected/pump flow rate (Lpm) * Breathing Rate (16.7 Lpm). 4 Unit Exposure = Exposure/AaiH.
Limitations: Though the above referenced study is useful for assessment of residential applications of liquid concentrate formulations using a backpack sprayer, the following limitations are noted:
• The study was conducted using workers in a greenhouse, so use for residential handler exposure assessments introduces uncertainty.
Table C-149: Exposure Study Identification Information
Citation Spencer et al (2000). HS-1769. Exposure of Hand Applicators to Triclopyr in Forest Settings, 1995
EPA MRID 46852112 ORETF Code NA EPA Review Contractor (Versar, Inc.) review 9/30/03
MRID = Master Record Identification ORETF = Outdoor Residential Exposure Task Force Study Description: Ten individuals were monitored during 2 applications of triclopyr in forests using backpack sprayers. Each application consisted of loading and applying 3 tank loads over

Formulation: Liquids Equipment/Application Method: Backpack sprayer
U.S. EPA Office of Pesticide Programs – Standard Operating Procedures for Assessing Residential Pesticide Exposure C-104
the course of approximately 6 hours with each individual handling approximately 3 lbs of triclopyr per application. Dermal exposure was measured using a long-sleeve t-shirt and knee-length socks (underneath normal work clothing only) and hand wipes. All workers wore chemical-resistant gloves. Inhalation exposure was measured using standard pumps (set at 2 liters per minute), cassettes, and tubing. The average field fortification recoveries from air filters was 58.98% with a standard deviation of 20.95%, from wipes was 95.90% with a standard deviation of 8.67%, from socks was 85.62% with a standard deviation of 7.98%, and from T-shirt was 98.23% with a standard deviation of 5.06%.
Table C-150: MRID 46852112 – Checklist and Use Recommendation Study Criteria Exposure Component
Dermal Inhalation Does the study provide detailed characteristics on the activity, equipment type, and amount of active ingredient handled?
Yes
Does dermal exposure monitoring allow for construction of an exposure estimate for individuals wearing short-sleeve shirts, shorts, shoes, socks? No NA
Was exposure to the hands representative of bare hands? No NA Was the study intended to simulate “residential” exposure via the scripted activity, amount of active ingredient handled, volunteers used, or the setting? No
Is the data of reasonable quality (i.e., are field fortification and laboratory recovery samples adequate)? Yes No
Should this study be recommended for use in residential handler exposure assessments? No No
Data Summary: A summary of the data from this study is not provided since it is not recommended for use in residential handler exposure assessment. The submitted study itself should be reviewed for further information. Limitations: Any data limitations associated with the exposure data in this study are not provided since it is not recommended for use in residential handler exposure assessment. The submitted study itself should be reviewed for further information.
Table C-151: Exposure Study Identification Information
Citation Stewart, P., T. Fears, H.F. Nicholson, B.C. Kross, L. K. Ogilvie, S.H. Zahm, M.H. Ward and A. Blair (1999) Exposure Received From Application Of Animal Insecticides. American Industrial Hygiene Association Journal. 60:208-212
EPA MRID none ORETF Code NA EPA Review none
MRID = Master Record Identification ORETF = Outdoor Residential Exposure Task Force Study Description: Two farmers were monitored while applying insecticides to animals using a backpack sprayer. Each application ranged from approximately 1 to 200 liters of solution and varied among 6 active ingredients. Clothing worn varied between farmers. Dermal exposure was measured using a fluorescent dye video-imaging technique. Inhalation exposure was not measured.
Table C-152: Stewart, et al (1999) – Checklist and Use Recommendation Study Criteria Exposure Component
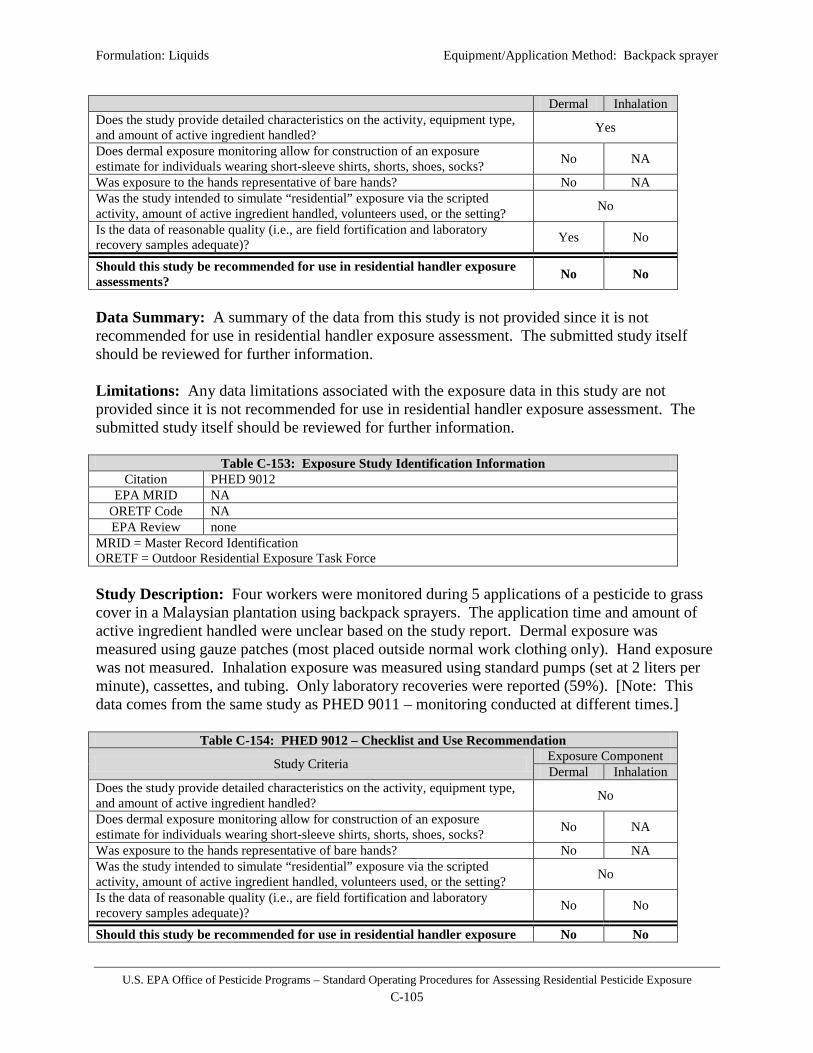
Formulation: Liquids Equipment/Application Method: Backpack sprayer
U.S. EPA Office of Pesticide Programs – Standard Operating Procedures for Assessing Residential Pesticide Exposure C-105
Dermal Inhalation Does the study provide detailed characteristics on the activity, equipment type, and amount of active ingredient handled? Yes
Does dermal exposure monitoring allow for construction of an exposure estimate for individuals wearing short-sleeve shirts, shorts, shoes, socks? No NA
Was exposure to the hands representative of bare hands? No NA Was the study intended to simulate “residential” exposure via the scripted activity, amount of active ingredient handled, volunteers used, or the setting? No
Is the data of reasonable quality (i.e., are field fortification and laboratory recovery samples adequate)? Yes No
Should this study be recommended for use in residential handler exposure assessments? No No
Data Summary: A summary of the data from this study is not provided since it is not recommended for use in residential handler exposure assessment. The submitted study itself should be reviewed for further information. Limitations: Any data limitations associated with the exposure data in this study are not provided since it is not recommended for use in residential handler exposure assessment. The submitted study itself should be reviewed for further information.
Table C-153: Exposure Study Identification Information Citation PHED 9012
EPA MRID NA ORETF Code NA EPA Review none
MRID = Master Record Identification ORETF = Outdoor Residential Exposure Task Force Study Description: Four workers were monitored during 5 applications of a pesticide to grass cover in a Malaysian plantation using backpack sprayers. The application time and amount of active ingredient handled were unclear based on the study report. Dermal exposure was measured using gauze patches (most placed outside normal work clothing only). Hand exposure was not measured. Inhalation exposure was measured using standard pumps (set at 2 liters per minute), cassettes, and tubing. Only laboratory recoveries were reported (59%). [Note: This data comes from the same study as PHED 9011 – monitoring conducted at different times.]
Table C-154: PHED 9012 – Checklist and Use Recommendation
Study Criteria Exposure Component Dermal Inhalation
Does the study provide detailed characteristics on the activity, equipment type, and amount of active ingredient handled? No
Does dermal exposure monitoring allow for construction of an exposure estimate for individuals wearing short-sleeve shirts, shorts, shoes, socks? No NA
Was exposure to the hands representative of bare hands? No NA Was the study intended to simulate “residential” exposure via the scripted activity, amount of active ingredient handled, volunteers used, or the setting? No
Is the data of reasonable quality (i.e., are field fortification and laboratory recovery samples adequate)? No No
Should this study be recommended for use in residential handler exposure No No

Formulation: Liquids Equipment/Application Method: Backpack sprayer
U.S. EPA Office of Pesticide Programs – Standard Operating Procedures for Assessing Residential Pesticide Exposure C-106
assessments? Data Summary: A summary of the data from this study is not provided since it is not recommended for use in residential handler exposure assessment. The submitted study itself should be reviewed for further information. Limitations: Any data limitations associated with the exposure data in this study are not provided since it is not recommended for use in residential handler exposure assessment. The submitted study itself should be reviewed for further information.

Formulation: Ready-to-Use (RTU) Equipment/Application Method: Hose-end sprayer
U.S. EPA Office of Pesticide Programs – Standard Operating Procedures for Assessing Residential Pesticide Exposure C-107
Scenario Summary
Table C-155: Scenario Description and Available Exposure Studies Formulation Ready-to-use (RTU) Equipment/Application Method Hose-end sprayer
Application Site(s) outdoors (lawns, gardens, trees/bushes, perimeter, mounds/nests, aquatic areas)
Available Exposure Studies Klonne, D. (1999); MRID 44972201 Rosenheck, L. (2000); MRID45184305
Table C-156: Unit Exposures (mg/lb ai) – RTU Hose-end Sprayer Applications
Statistic Dermal Inhalation 50th percentile 2.28 0.015 75th percentile 5.96 0.036 95th percentile 23.6 0.121 99th percentile 62.2 0.285 99.9th percentile 184 0.745 AM (SD) 6.26 (16) 0.034 (0.066) GM (GSD) 2.28 (4.14) 0.015 (3.52) Range 0.078 – 33.0 0.00067 – 0.156 N 41 41 Dermal Unit Exposure Summary: The recommended dermal unit exposures for applications using a RTU hose-end sprayer is based on a lognormal distribution fit with exposure monitoring data from Klonne, D. (1999) [EPA MRID 44972201] and Rosenheck, L. (2000) [EPA MRID 45184305]. Klonne, D. (1999) monitored 30 applications of pesticide formulations to approximately 5000 ft2 of residential lawns for approximately 75 minutes using a RTU hose-end sprayer. Rosenheck, L. (2000) monitored 11 applications of ready-to-use liquid formulations to approximately 5000 ft2 of lawns for 32 to 119 minutes. These studies were representative of homeowner or amateur applications for this scenario and the exposure monitoring enabled representation of the type of clothing a homeowner or amateur applicator would wear (i.e., shorts, short-sleeve shirt, no chemical-resistant gloves). Additionally, a composite dataset was used as the exposures in the studies were generally of the same magnitude. Inhalation Unit Exposure Summary: The recommended inhalation unit exposures for applications using a RTU hose-end sprayer is based on a lognormal distribution fit with exposure monitoring data from Klonne, D. (1999) [EPA MRID 44972201] and Rosenheck, L. (2000) [EPA MRID 45184305]. Klonne, D. (1999) monitored 30 applications of pesticide formulations to approximately 5000 ft2 of residential lawns for approximately 75 minutes using a RTU hose-end sprayer. Rosenheck, L. (2000) monitored 11 applications of ready-to-use liquid formulations to approximately 5000 ft2 of lawns for 32 to 119 minutes. These studies were representative of homeowner or amateur applications for this scenario and a composite dataset was formed despite Rosenheck, L. (2000) resulting in higher estimates of inhalation exposure.
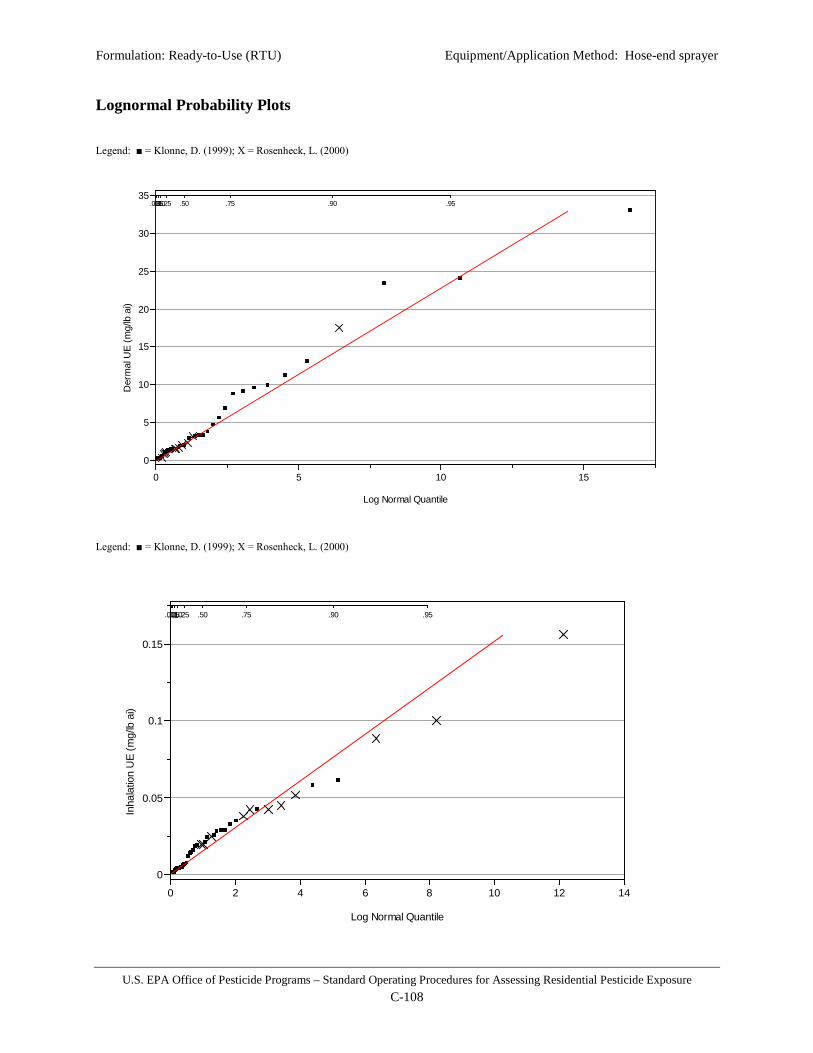
Formulation: Ready-to-Use (RTU) Equipment/Application Method: Hose-end sprayer
U.S. EPA Office of Pesticide Programs – Standard Operating Procedures for Assessing Residential Pesticide Exposure C-108
Lognormal Probability Plots Legend: ■ = Klonne, D. (1999); X = Rosenheck, L. (2000)
Legend: ■ = Klonne, D. (1999); X = Rosenheck, L. (2000)
Der
mal
UE
(mg/
lb a
i)
0
5
10
15
20
25
30
35.001.01.05.10.25 .50 .75 .90 .95
0 5 10 15
Log Normal Quantile
Inha
latio
n U
E (m
g/lb
ai)
0
0.05
0.1
0.15
.001.01.05.10.25 .50 .75 .90 .95
0 2 4 6 8 10 12 14
Log Normal Quantile

Formulation: Ready-to-Use (RTU) Equipment/Application Method: Hose-end sprayer
U.S. EPA Office of Pesticide Programs – Standard Operating Procedures for Assessing Residential Pesticide Exposure C-109
Available Handler Exposure Studies
Table C-157: Exposure Study Identification Information
Citation
Klonne, D. (1999). Integrated Report on Evaluation of Potential Exposure to Homeowners and Professional Lawn Care Operators Mixing, Loading, and Applying Granular and Liquid Pesticides to Residential Lawns. Sponsor/Submitter: Outdoor Residential Exposure Task Force.
EPA MRID 44972201 ORETF Code OMA004
EPA Review D261948 EPA Memo from G. Bangs to D. Fuller (3/5/03) D287251
MRID = Master Record Identification ORETF = Outdoor Residential Exposure Task Force Study Description: A total of 30 application events were monitored for 30 different volunteers using passive dosimetry (inner and outer whole body dosimeters, hand washes, face/neck wipes, and personal inhalation monitors). Each test subject screwed a ready-to-use (RTU) 32 fl. oz. plastic container onto the end of the hose and treated approximately 5000 ft2 of residential lawns. Each applicator handled approximately 0.5 lb active ingredient (diazinon) over the course of 75 minutes. Dermal exposure was measured using inner and outer whole body dosimeters, hand washes, and face/neck washes, such that exposure can be constructed for various clothing scenarios (including a short-sleeve shirt, shorts, and no chemical-resistant gloves). Inhalation exposure was measured using standard personal air monitoring devices set at 1.5 liters per minute. All fortified samples and field samples collected on the same study day were stored frozen and analyzed together, eliminating the need for storage stability determination. Concurrent lab spikes produced mean recoveries in the range of 78-125% for the various matrices. Mean field fortification recoveries ranged from 76% to 110% for all matrices. Mean percent field fortification recovery for outer dosimeter with a spike level of 50 µg was 80.6% with a standard deviation of 7.95%, of 500 µg was 79.4% with a standard deviation of 19.3%, and of 5000 µg was 75.5% with a standard deviation of 5.81%. Mean percent field fortification recovery for inner dosimeter with a spike level of 5 µg was 99.3% with a standard deviation of 10.7%, and of 50 µg was 89.5% with a standard deviation of 8.33%. Mean percent field fortification recovery for hand wash with a spike level of 5 µg was 83.7% with a standard deviation of 9.13%, of 25 µg was 83.9% with a standard deviation of 10.0%, and of 100 µg was 85.6% with a standard deviation of 11.1%. Mean percent field fortification recovery for neck/face wash with a spike level of 5 µg was 102% with a standard deviation of 2.81, of 10 µg was 101% with a standard deviation of 13.9%, and of 25 µg was 93.0% with a standard deviation of 2.93%.
Table C-158: MRID 44972201 – Checklist and Use Recommendation Study Criteria Exposure Component
Dermal Inhalation Does the study provide detailed characteristics on the activity, equipment type, and amount of active ingredient handled?
Yes
Does dermal exposure monitoring allow for construction of an exposure estimate for individuals wearing short-sleeve shirts, shorts, shoes, socks? Yes NA
Was exposure to the hands representative of bare hands? Yes NA Was the study intended to simulate “residential” exposure via the scripted activity, amount of active ingredient handled, volunteers used, or the setting? Yes
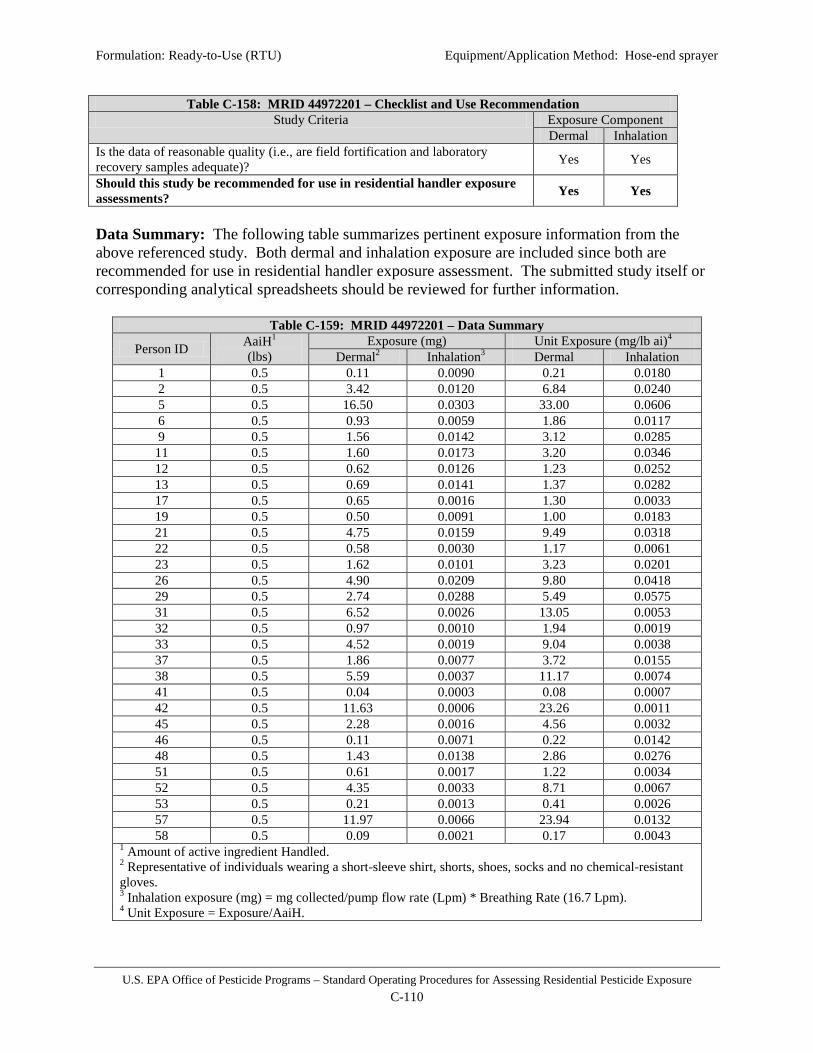
Formulation: Ready-to-Use (RTU) Equipment/Application Method: Hose-end sprayer
U.S. EPA Office of Pesticide Programs – Standard Operating Procedures for Assessing Residential Pesticide Exposure C-110
Table C-158: MRID 44972201 – Checklist and Use Recommendation Study Criteria Exposure Component
Dermal Inhalation Is the data of reasonable quality (i.e., are field fortification and laboratory recovery samples adequate)? Yes Yes
Should this study be recommended for use in residential handler exposure assessments? Yes Yes
Data Summary: The following table summarizes pertinent exposure information from the above referenced study. Both dermal and inhalation exposure are included since both are recommended for use in residential handler exposure assessment. The submitted study itself or corresponding analytical spreadsheets should be reviewed for further information.
Table C-159: MRID 44972201 – Data Summary
Person ID AaiH1 (lbs)
Exposure (mg) Unit Exposure (mg/lb ai)4 Dermal2 Inhalation3 Dermal Inhalation
1 0.5 0.11 0.0090 0.21 0.0180 2 0.5 3.42 0.0120 6.84 0.0240 5 0.5 16.50 0.0303 33.00 0.0606 6 0.5 0.93 0.0059 1.86 0.0117 9 0.5 1.56 0.0142 3.12 0.0285 11 0.5 1.60 0.0173 3.20 0.0346 12 0.5 0.62 0.0126 1.23 0.0252 13 0.5 0.69 0.0141 1.37 0.0282 17 0.5 0.65 0.0016 1.30 0.0033 19 0.5 0.50 0.0091 1.00 0.0183 21 0.5 4.75 0.0159 9.49 0.0318 22 0.5 0.58 0.0030 1.17 0.0061 23 0.5 1.62 0.0101 3.23 0.0201 26 0.5 4.90 0.0209 9.80 0.0418 29 0.5 2.74 0.0288 5.49 0.0575 31 0.5 6.52 0.0026 13.05 0.0053 32 0.5 0.97 0.0010 1.94 0.0019 33 0.5 4.52 0.0019 9.04 0.0038 37 0.5 1.86 0.0077 3.72 0.0155 38 0.5 5.59 0.0037 11.17 0.0074 41 0.5 0.04 0.0003 0.08 0.0007 42 0.5 11.63 0.0006 23.26 0.0011 45 0.5 2.28 0.0016 4.56 0.0032 46 0.5 0.11 0.0071 0.22 0.0142 48 0.5 1.43 0.0138 2.86 0.0276 51 0.5 0.61 0.0017 1.22 0.0034 52 0.5 4.35 0.0033 8.71 0.0067 53 0.5 0.21 0.0013 0.41 0.0026 57 0.5 11.97 0.0066 23.94 0.0132 58 0.5 0.09 0.0021 0.17 0.0043
1 Amount of active ingredient Handled. 2 Representative of individuals wearing a short-sleeve shirt, shorts, shoes, socks and no chemical-resistant gloves. 3 Inhalation exposure (mg) = mg collected/pump flow rate (Lpm) * Breathing Rate (16.7 Lpm). 4 Unit Exposure = Exposure/AaiH.

Formulation: Ready-to-Use (RTU) Equipment/Application Method: Hose-end sprayer
U.S. EPA Office of Pesticide Programs – Standard Operating Procedures for Assessing Residential Pesticide Exposure C-111
Limitations: Though the above referenced study is useful for assessment of residential applications of ready-to-use formulations using a hose-end sprayer, the following limitations are noted:
• Each individual handled the same amount of active ingredient, making analysis of the relationship between exposure and the amount of active ingredient handled (the underlying basis of unit exposures) difficult.
Table C-160: Exposure Study Identification Information
Citation
Rosenheck, L. (2000) Determination of Exposure During the Mixing, Loading and Application of Liquid Diazinon to Residential Turf Through the Use of Passive Dosimetry and Biological Monitoring: Lab Project Number 767-98: I024480NAU950T. Unpublished study prepared by Development Resources/Chemical Support Department, Novartis Crop Protection, Inc. 574 p.
EPA MRID 45184305 ORETF Code NA EPA Review D268247
MRID = Master Record Identification ORETF = Outdoor Residential Exposure Task Force
Study Description: Eleven non-professional volunteers were monitored while making applications of a liquid pesticide formulation (22.4% diazinon) with a ready-to-use hose-end sprayer to approximately 5000 ft2 of lawn. The applications ranged from 32 to 119 minutes with all individuals 0.5 lbs of active ingredient (diazinon). Dermal exposure was measured using whole body dosimetry (100% cotton union suit) worn under shorts and a T-shirt, hand washes, and face/neck wipes. No chemical-resistant gloves were worn. Inhalation exposure was measured using standard pumps (set at 1.5 liters per minute), cassettes, and tubing. Field fortification recoveries for the cotton union suit dosimeters averaged 99%, face and neck wipe fortifications averaged 89.1%, handwash fortifications averaged 75% and air sampler tube fortification was 109%. Laboratory method validation for each matrix fell within the acceptable range of 70 to 120%. The limit of quantitation (LOQ) was 1.0 µg/sample for the cotton dosimeters, 0.5 µg/sample for the face/neck wipes, 1.0 µg/sample for the hand washes and 0.01 µg/sample for the inhalation monitors.
Table C-161: MRID 45184305 – Checklist and Use Recommendation
Study Criteria Exposure Component Dermal Inhalation
Does the study provide detailed characteristics on the activity, equipment type, and amount of active ingredient handled? Yes
Does dermal exposure monitoring allow for construction of an exposure estimate for individuals wearing short-sleeve shirts, shorts, shoes, socks? Yes NA
Was exposure to the hands representative of bare hands? Yes NA Was the study intended to simulate “residential” exposure via the scripted activity, amount of active ingredient handled, volunteers used, or the setting? Yes
Is the data of reasonable quality (i.e., are field fortification and laboratory recovery samples adequate)? Yes Yes
Should this study be recommended for use in residential handler exposure assessments? Yes Yes

Formulation: Ready-to-Use (RTU) Equipment/Application Method: Hose-end sprayer
U.S. EPA Office of Pesticide Programs – Standard Operating Procedures for Assessing Residential Pesticide Exposure C-112
Data Summary: The following table summarizes pertinent exposure information from the above referenced study. Both dermal and inhalation exposure are included since both are recommended for use in residential handler exposure assessment. The submitted study itself or corresponding analytical spreadsheets should be reviewed for further information.
Table C-162: MRID 45184305 – Data Summary
Person ID AaiH1 (lbs)
Exposure (mg) Unit Exposure (mg/lb ai)4 Dermal2 Inhalation3 Dermal Inhalation
2 0.5 1.522 0.0501 3.04 0.1002 3 0.5 0.163 0.0122 0.33 0.0245 4 0.5 0.706 0.0096 1.41 0.0191 12 0.5 0.446 0.0223 0.89 0.0445 7 0.5 0.701 0.0779 1.40 0.1559 5 0.5 0.774 0.0212 1.55 0.0423 6 0.5 0.397 0.0094 0.79 0.0187 14 0.5 0.474 0.0189 0.95 0.0379 15 0.5 0.95 0.0209 1.90 0.0418 13 0.5 2.854 0.0145 17.42 0.0884 46 0.5 1.15 0.0256 2.30 0.0512
1 Amount of active ingredient Handled. 2 Representative of individuals wearing a short-sleeve shirt, shorts, shoes, socks and no chemical-resistant gloves. 3 Inhalation exposure (mg) = mg collected/pump flow rate (Lpm) * Breathing Rate (16.7 Lpm). 4 Unit Exposure = Exposure/AaiH.
Limitations: Though the above referenced study is useful for assessment of residential applications of liquid concentrate formulations using a conventional hose-end sprayer, the following limitations are noted:
• Each individual handled the same amount of active ingredient, making analysis of the relationship between exposure and the amount of active ingredient handled (the underlying basis of unit exposures) difficult.

Formulation: Ready-to-Use (RTU) Equipment/Application Method: Trigger-pump sprayer
U.S. EPA Office of Pesticide Programs – Standard Operating Procedures for Assessing Residential Pesticide Exposure C-113
Scenario Summary
Table C-163: Scenario Description and Available Exposure Studies Formulation Ready-to-use (RTU) Equipment/Application Method Trigger-pump sprayer
Application Site(s) outdoors (lawns, gardens, trees/bushes, perimeter, mounds/nests, aquatic areas), indoors (plants, cracks and crevices), pets/animals
Available Exposure Studies
Merricks, D.L. (1997); MRID 44459801 Meo, N.; Gonzalez, C.; Mester, T. (1997); MRID 44433302 Knarr, R.D. (1988); MRID 41054701 Barnekow, D.E.; Cook, W.L.; Meitl, T.J.; Shurdut, B.A. (1999); MRID 44739301
Table C-164: Unit Exposures (mg/lb ai) – Liquid Trigger-pump sprayer Applications
Statistic Outdoors / Indoors Pets/Animals Dermal Inhalation Dermal Inhalation
50th percentile 54 0.046 510 2.2 75th percentile 103 0.077 990 4.0 95th percentile 260 0.16 2600 9.6 99th percentile 490 0.26 5000 18 99.9th percentile 1020 0.46 10500 36 AM (SD) 85.1 (103) 0.061 (0.053) 820 (1040) 3.3 (3.7) GM (GSD) 54.2 (2.56) 0.046 (2.10) 510 (2.7) 2.2 (2.5) Range 11.0 – 253 0.016 – 0.21 101 – 2400 0.30 – 8.4 N 20 70 16 16 Dermal Unit Exposure Summary
Outdoor and Indoor Environments: The recommended dermal unit exposures for applications of liquid pesticide formulations using a trigger-pump sprayer to outdoor and indoor environments is based on a lognormal distribution fit with exposure monitoring data from Merricks, D.L. (1997) [EPA MRID 44459801]. Merricks, D.L. (1997) monitored 40 applications to tomatoes and cucumbers using a ready-to-use (RTU) trigger-spray bottle. While other studies were available which potentially could represent residential applications, the exposure monitoring in this study enabled the best representation of the type of clothing a homeowner or amateur applicator would wear (i.e., shorts, short-sleeve shirt, no chemical-resistant gloves). Pets and Animals: The recommended dermal unit exposures for applications of liquid pesticide formulations using a trigger-pump sprayer to pets or animals is based on a lognormal distribution fit with exposure monitoring data from Meo, N. et al (1997) [EPA MRID 44433302]. Meo, N. et al (1997) monitored 16 applications by commercial pet groomers treating 8 dogs for approximately 38-72 minutes using a ready-to-use (RTU) trigger-spray bottle. This is the only study available for this exposure scenario.

Formulation: Ready-to-Use (RTU) Equipment/Application Method: Trigger-pump sprayer
U.S. EPA Office of Pesticide Programs – Standard Operating Procedures for Assessing Residential Pesticide Exposure C-114
Inhalation Unit Exposure Summary
Outdoor and Indoor Environments: The recommended inhalation unit exposures for applications of liquid pesticide formulations using a trigger-pump sprayer to outdoor and indoor environments is based on a lognormal distribution fit with exposure monitoring data from Merricks, D.L. (1997) [EPA MRID 44459801], Knarr, R.D. (1998) [EPA MRID 41054701], and Barnekow, D.E., et al (1999) [EPA MRID 47739301]. Merricks, D.L. (1997) monitored 40 applications to tomatoes and cucumbers using a ready-to-use (RTU) trigger-spray bottle. Knarr, R.D. (1998) monitored 5 applications of a liquid pesticide formulation to door frames, screens, patios, and stoops for approximately 9-21 minutes using a trigger sprayer attached to a ½ gallon container with an 18-inch hose. Barnekow, D.E., et al (1999) monitored 15 applications of a liquid pesticide formulation to outdoor foundations, perimeters, and flower beds for approximately 1 hour using a 24 oz. ready-to-use trigger spray bottle. All available studies were considered reasonably representative of residential application inhalation exposure, and, since they were generally of the same magnitude, combined into a single dataset. Pets and Animals: The recommended inhalation unit exposures for applications of liquid pesticide formulations using a trigger-pump sprayer to pets or animals is based on a lognormal distribution fit with exposure monitoring data from Meo, N. et al (1997) [EPA MRID 44433302]. Meo, N. et al (1997) monitored 16 applications by commercial pet groomers treating 8 dogs for approximately 38-72 minutes using a ready-to-use (RTU) trigger-spray bottle. This is the only study available for this exposure scenario.

Formulation: Ready-to-Use (RTU) Equipment/Application Method: Trigger-pump sprayer
U.S. EPA Office of Pesticide Programs – Standard Operating Procedures for Assessing Residential Pesticide Exposure C-115
Lognormal Probability Plots Outdoor/Indoor Environments Legend: ■ = Merricks, D.L. (1997)
Outdoor/Indoor Environments Legend: ■ = Barnekow, D.E. et al (1997); O = Knarr, R.D. (1998); X = Merricks, D.L. (1997)
Der
mal
UE
(mg/
lb a
i)
0
50
100
150
200
250.001.01.05.10 .25 .50 .75 .90 .95
0 1 2 3 4 5
Log Normal Quantile
Inha
latio
n U
E (m
g/lb
ai)
0
0.05
0.1
0.15
0.2
.001.01 .05.10 .25 .50 .75 .90 .95
0 1 2 3 4 5
Log Normal Quantile
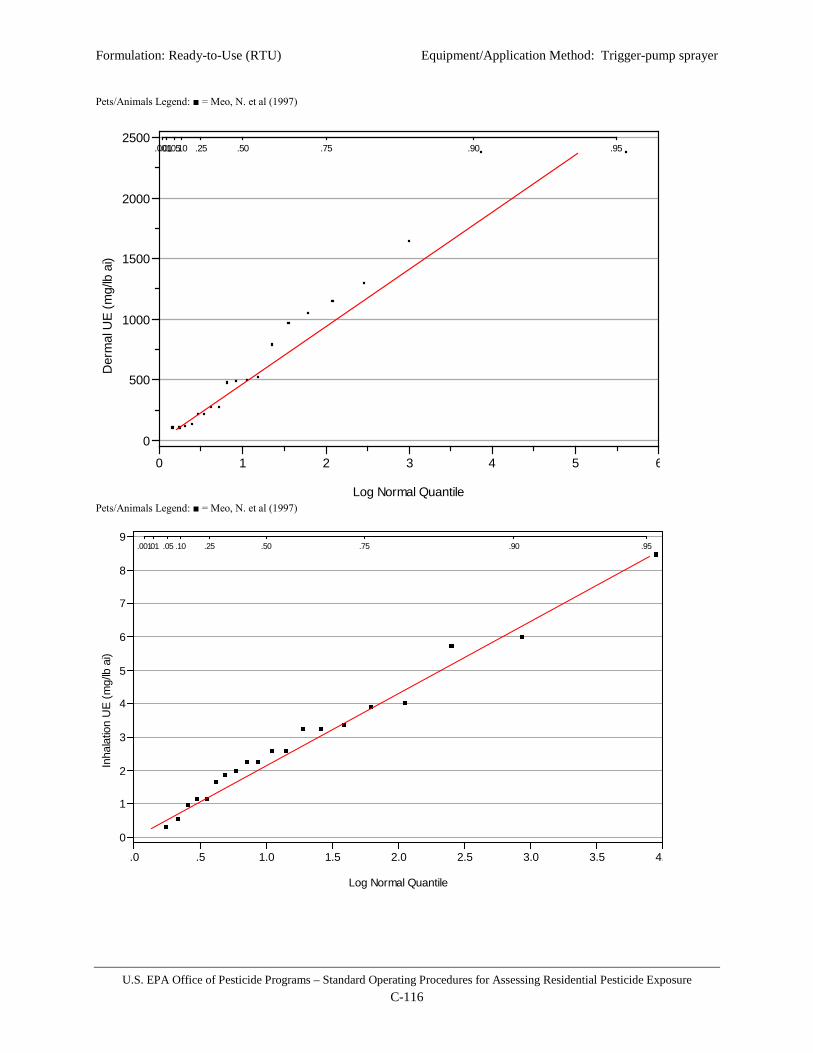
Formulation: Ready-to-Use (RTU) Equipment/Application Method: Trigger-pump sprayer
U.S. EPA Office of Pesticide Programs – Standard Operating Procedures for Assessing Residential Pesticide Exposure C-116
Pets/Animals Legend: ■ = Meo, N. et al (1997)
Pets/Animals Legend: ■ = Meo, N. et al (1997)
Der
mal
UE
(mg/
lb a
i)
0
500
1000
1500
2000
2500.001.01.05.10 .25 .50 .75 .90 .95
0 1 2 3 4 5 6
Log Normal Quantile
Inha
latio
n U
E (m
g/lb
ai)
0
1
2
3
4
5
6
7
8
9.001.01 .05 .10 .25 .50 .75 .90 .95
.0 .5 1.0 1.5 2.0 2.5 3.0 3.5 4.
Log Normal Quantile

Formulation: Ready-to-Use (RTU) Equipment/Application Method: Trigger-pump sprayer
U.S. EPA Office of Pesticide Programs – Standard Operating Procedures for Assessing Residential Pesticide Exposure C-117
Available Handler Exposure Studies
Table C-165: Exposure Study Identification Information
Citation Merricks, D.L. (1997). Carbaryl Mixer/Loader/Applicator Exposure Study during Application of RP-2 Liquid (21%), Sevin® Ready to Use Insect Spray or Sevin® 10 Dust to Home Garden Vegetables
EPA MRID 44459801 ORETF Code OMA006
EPA Review EPA Memo from G. Bangs to D. Fuller (3/5/03) D287251
MRID = Master Record Identification ORETF = Outdoor Residential Exposure Task Force Study Description: Forty individuals were monitored while spraying tomatoes and cucumbers using a ready-to-use (RTU) trigger-spray bottle (i.e., no mixing was necessary). Each application was approximately 20 minutes and consisted of approximately 2 lbs formulation (approximately 0.24 gallons; 0.002 lbs carbaryl) to garden plants. Dermal exposure was measured using inner and outer whole body dosimetry and hand washes (20 individuals were monitored without gloves). Inhalation exposure was measured using standard pumps (set at 2 liters per minute), cassettes, and tubing. Field fortification recoveries for passive dosimeters averaged 84.3% for inner dosimeters and 77.7% for outer dosimeters. Face and neck wipe field fortifications averaged 84.8%. Both handwash and inhalation tube field fortification averaged >90%. Laboratory method validation for each matrix fell within the acceptable range of 70 to 120%. The limit of quantitation (LOQ) was 1.0 µg/sample for all media except the inhalation monitors where the LOQ was 0.01 µg/sample. The limit of detection (LOD) was 0.5 µg/sample for all media except the inhalation monitors where the LOQ was 0.005 µg/sample.
Table C-166: MRID 44459801 – Checklist and Use Recommendation
Study Criteria Exposure Component Dermal Inhalation
Does the study provide detailed characteristics on the activity, equipment type, and amount of active ingredient handled? Yes
Does dermal exposure monitoring allow for construction of an exposure estimate for individuals wearing short-sleeve shirts, shorts, shoes, socks? Yes NA
Was exposure to the hands representative of bare hands? Yes NA Was the study intended to simulate “residential” exposure via the scripted activity, amount of active ingredient handled, volunteers used, or the setting? Yes
Is the data of reasonable quality (i.e., are field fortification and laboratory recovery samples adequate)? Yes Yes
Should this study be recommended for use in residential handler exposure assessments? Yes Yes
Data Summary: The following table summarizes pertinent exposure information from the above referenced study. Both dermal and inhalation exposure are included since both are recommended for use in residential handler exposure assessment. Note that only dermal exposure data representative of individuals wearing short-sleeve shirt, shorts, shoes, socks, and no chemical-resistant gloves are presented. The submitted study itself or corresponding analytical spreadsheets should be reviewed for further information.
Table C-167: MRID 44459801 – Data Summary

Formulation: Ready-to-Use (RTU) Equipment/Application Method: Trigger-pump sprayer
U.S. EPA Office of Pesticide Programs – Standard Operating Procedures for Assessing Residential Pesticide Exposure C-118
Person ID AaiH1 (lbs)
Exposure (mg) Unit Exposure (mg/lb ai)4 Dermal2 Inhalation3 Dermal Inhalation
R2 0.0024 0.30 0.000418 126 0.1739 S2 0.0022 0.13 0.000334 61 0.1532 T2 0.0028 0.70 0.000163 253 0.0592 U2 0.0025 0.33 0.000251 129 0.0989 X2 0.0020 0.29 0.000167 143 0.0824 Y2 0.0022 0.20 0.000042 93 0.0191 Z2 0.0020 0.33 0.000167 165 0.0824 A3 0.0022 0.17 0.000251 76 0.1149 D3 0.0021 0.05 0.000042 24 0.0202 E3 0.0022 0.10 0.000042 47 0.0188 F3 0.0021 0.05 0.000042 24 0.0195 G3 0.0022 0.22 0.000084 98 0.0375 J3 0.0022 0.05 0.000042 25 0.0191 K3 0.0021 0.05 0.000167 21 0.0782 M3 0.0020 0.04 0.000042 20 0.0208 L3 0.0022 0.48 0.000042 219 0.0191 P3 0.0022 0.02 0.000042 11 0.0193 Q3 0.0022 0.04 0.000042 18 0.0186 R3 0.0022 0.09 0.000041 43 0.0189 S3 0.0022 0.05 0.000041 22 0.0187 E 0.0025 -- 0.000042 -- 0.0166 F 0.0025 -- 0.000042 -- 0.0169 I 0.0022 -- 0.000042 -- 0.0186 H 0.0028 -- 0.000084 -- 0.0301 K 0.0025 -- 0.000042 -- 0.0165 L 0.0024 -- 0.000042 -- 0.0177 O 0.0024 -- 0.000043 -- 0.0180 P 0.0020 -- 0.000042 -- 0.0213 S 0.0025 -- 0.000042 -- 0.0168 T 0.0025 -- 0.000042 -- 0.0165 W 0.0026 -- 0.000167 -- 0.0654 X 0.0025 -- 0.000501 -- 0.2013
A2 0.0024 -- 0.000042 -- 0.0177 B2 0.0026 -- 0.000251 -- 0.0980 E2 0.0023 -- 0.000167 -- 0.0736 F2 0.0022 -- 0.000167 -- 0.0766 I2 0.0027 -- 0.000086 -- 0.0319 J2 0.0026 -- 0.000084 -- 0.0327
M2 0.0027 -- 0.000167 -- 0.0611 N2 0.0021 -- 0.000167 -- 0.0782
1 Amount of active ingredient Handled. 2 Representative of individuals wearing a short-sleeve shirt, shorts, shoes, socks and no chemical-resistant gloves. 3 Inhalation exposure (mg) = mg collected/pump flow rate (Lpm) * Breathing Rate (16.7 Lpm). 4 Unit Exposure = Exposure/AaiH.
Limitations: Though the above referenced study is useful for assessment of exposure during use of ready-to-use trigger sprayers, the following limitations are noted:
• An estimated 90% of all dermal exposure samples (underneath the individuals clothing) were non-detects. One-half the limit of detection (1.0 µg) was used.
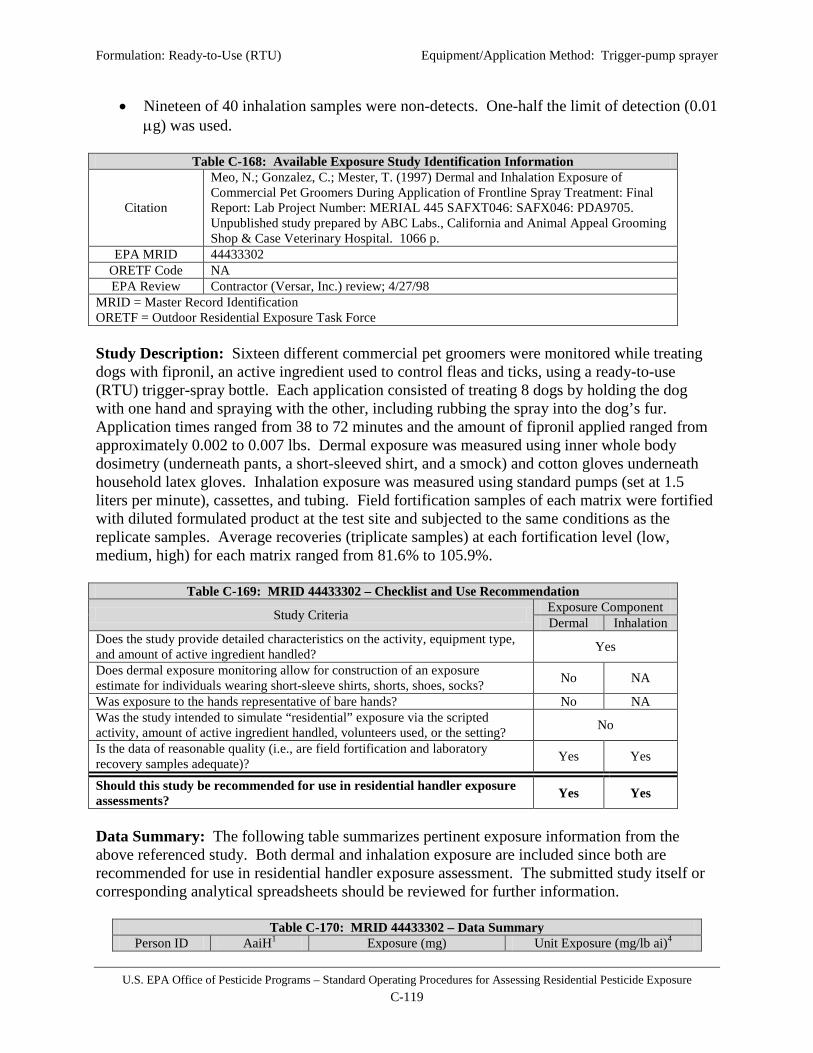
Formulation: Ready-to-Use (RTU) Equipment/Application Method: Trigger-pump sprayer
U.S. EPA Office of Pesticide Programs – Standard Operating Procedures for Assessing Residential Pesticide Exposure C-119
• Nineteen of 40 inhalation samples were non-detects. One-half the limit of detection (0.01 µg) was used.
Table C-168: Available Exposure Study Identification Information
Citation
Meo, N.; Gonzalez, C.; Mester, T. (1997) Dermal and Inhalation Exposure of Commercial Pet Groomers During Application of Frontline Spray Treatment: Final Report: Lab Project Number: MERIAL 445 SAFXT046: SAFX046: PDA9705. Unpublished study prepared by ABC Labs., California and Animal Appeal Grooming Shop & Case Veterinary Hospital. 1066 p.
EPA MRID 44433302 ORETF Code NA EPA Review Contractor (Versar, Inc.) review; 4/27/98
MRID = Master Record Identification ORETF = Outdoor Residential Exposure Task Force Study Description: Sixteen different commercial pet groomers were monitored while treating dogs with fipronil, an active ingredient used to control fleas and ticks, using a ready-to-use (RTU) trigger-spray bottle. Each application consisted of treating 8 dogs by holding the dog with one hand and spraying with the other, including rubbing the spray into the dog’s fur. Application times ranged from 38 to 72 minutes and the amount of fipronil applied ranged from approximately 0.002 to 0.007 lbs. Dermal exposure was measured using inner whole body dosimetry (underneath pants, a short-sleeved shirt, and a smock) and cotton gloves underneath household latex gloves. Inhalation exposure was measured using standard pumps (set at 1.5 liters per minute), cassettes, and tubing. Field fortification samples of each matrix were fortified with diluted formulated product at the test site and subjected to the same conditions as the replicate samples. Average recoveries (triplicate samples) at each fortification level (low, medium, high) for each matrix ranged from 81.6% to 105.9%.
Table C-169: MRID 44433302 – Checklist and Use Recommendation
Study Criteria Exposure Component Dermal Inhalation
Does the study provide detailed characteristics on the activity, equipment type, and amount of active ingredient handled? Yes
Does dermal exposure monitoring allow for construction of an exposure estimate for individuals wearing short-sleeve shirts, shorts, shoes, socks? No NA
Was exposure to the hands representative of bare hands? No NA Was the study intended to simulate “residential” exposure via the scripted activity, amount of active ingredient handled, volunteers used, or the setting? No
Is the data of reasonable quality (i.e., are field fortification and laboratory recovery samples adequate)? Yes Yes
Should this study be recommended for use in residential handler exposure assessments? Yes Yes
Data Summary: The following table summarizes pertinent exposure information from the above referenced study. Both dermal and inhalation exposure are included since both are recommended for use in residential handler exposure assessment. The submitted study itself or corresponding analytical spreadsheets should be reviewed for further information.
Table C-170: MRID 44433302 – Data Summary Person ID AaiH1 Exposure (mg) Unit Exposure (mg/lb ai)4
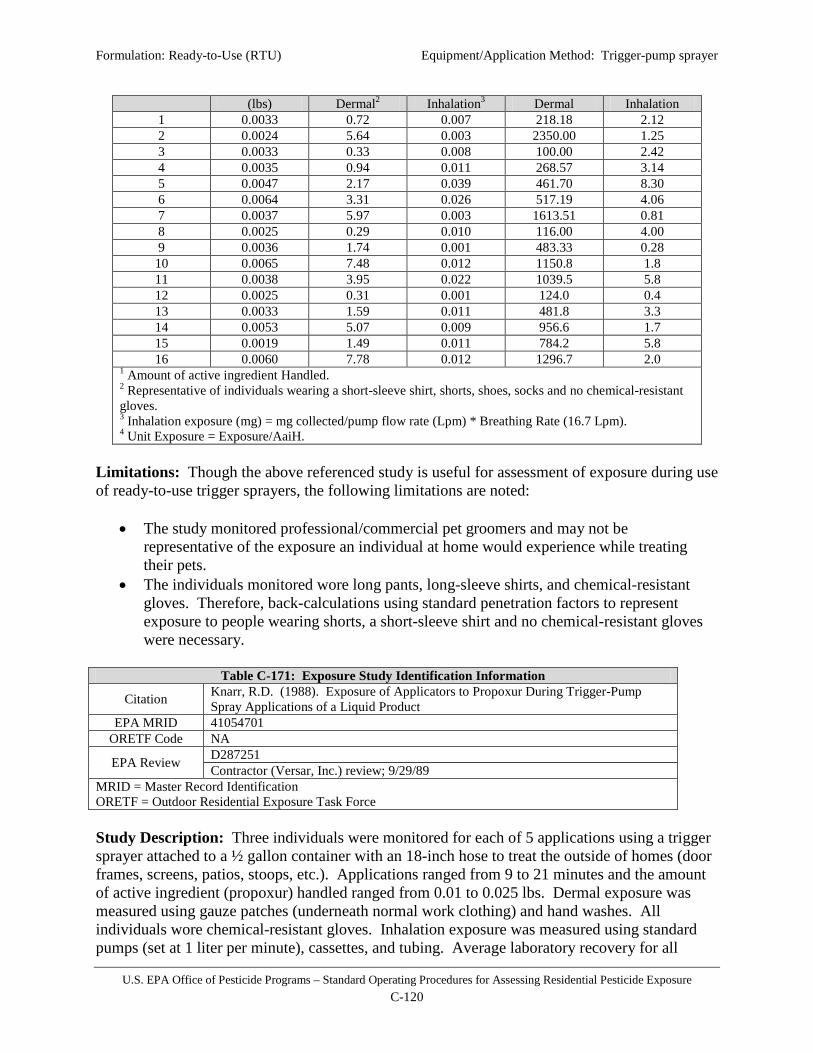
Formulation: Ready-to-Use (RTU) Equipment/Application Method: Trigger-pump sprayer
U.S. EPA Office of Pesticide Programs – Standard Operating Procedures for Assessing Residential Pesticide Exposure C-120
(lbs) Dermal2 Inhalation3 Dermal Inhalation 1 0.0033 0.72 0.007 218.18 2.12 2 0.0024 5.64 0.003 2350.00 1.25 3 0.0033 0.33 0.008 100.00 2.42 4 0.0035 0.94 0.011 268.57 3.14 5 0.0047 2.17 0.039 461.70 8.30 6 0.0064 3.31 0.026 517.19 4.06 7 0.0037 5.97 0.003 1613.51 0.81 8 0.0025 0.29 0.010 116.00 4.00 9 0.0036 1.74 0.001 483.33 0.28 10 0.0065 7.48 0.012 1150.8 1.8 11 0.0038 3.95 0.022 1039.5 5.8 12 0.0025 0.31 0.001 124.0 0.4 13 0.0033 1.59 0.011 481.8 3.3 14 0.0053 5.07 0.009 956.6 1.7 15 0.0019 1.49 0.011 784.2 5.8 16 0.0060 7.78 0.012 1296.7 2.0
1 Amount of active ingredient Handled. 2 Representative of individuals wearing a short-sleeve shirt, shorts, shoes, socks and no chemical-resistant gloves. 3 Inhalation exposure (mg) = mg collected/pump flow rate (Lpm) * Breathing Rate (16.7 Lpm). 4 Unit Exposure = Exposure/AaiH.
Limitations: Though the above referenced study is useful for assessment of exposure during use of ready-to-use trigger sprayers, the following limitations are noted:
• The study monitored professional/commercial pet groomers and may not be representative of the exposure an individual at home would experience while treating their pets.
• The individuals monitored wore long pants, long-sleeve shirts, and chemical-resistant gloves. Therefore, back-calculations using standard penetration factors to represent exposure to people wearing shorts, a short-sleeve shirt and no chemical-resistant gloves were necessary.
Table C-171: Exposure Study Identification Information
Citation Knarr, R.D. (1988). Exposure of Applicators to Propoxur During Trigger-Pump Spray Applications of a Liquid Product
EPA MRID 41054701 ORETF Code NA
EPA Review D287251 Contractor (Versar, Inc.) review; 9/29/89
MRID = Master Record Identification ORETF = Outdoor Residential Exposure Task Force Study Description: Three individuals were monitored for each of 5 applications using a trigger sprayer attached to a ½ gallon container with an 18-inch hose to treat the outside of homes (door frames, screens, patios, stoops, etc.). Applications ranged from 9 to 21 minutes and the amount of active ingredient (propoxur) handled ranged from 0.01 to 0.025 lbs. Dermal exposure was measured using gauze patches (underneath normal work clothing) and hand washes. All individuals wore chemical-resistant gloves. Inhalation exposure was measured using standard pumps (set at 1 liter per minute), cassettes, and tubing. Average laboratory recovery for all

Formulation: Ready-to-Use (RTU) Equipment/Application Method: Trigger-pump sprayer
U.S. EPA Office of Pesticide Programs – Standard Operating Procedures for Assessing Residential Pesticide Exposure C-121
media ranged from 99.2% to 109%. Patches and filters were fortified at 1 µg/sample while hand rinses were fortified at either 200 or 1000 µg/sample. Average field recovery results ranged from 90.3% to 102.2%. Patches were fortified at levels from 1 to 50 µg/sample, hand rinses were fortified at 200 µg/sample, and filters were fortified at 0.2 µg/sample.
Table C-172: MRID 41054701 – Checklist and Use Recommendation
Study Criteria Exposure Component Dermal Inhalation
Does the study provide detailed characteristics on the activity, equipment type, and amount of active ingredient handled? Yes
Does dermal exposure monitoring allow for construction of an exposure estimate for individuals wearing short-sleeve shirts, shorts, shoes, socks? No NA
Was exposure to the hands representative of bare hands? No NA Was the study intended to simulate “residential” exposure via the scripted activity, amount of active ingredient handled, volunteers used, or the setting? No
Is the data of reasonable quality (i.e., are field fortification and laboratory recovery samples adequate)? Yes Yes
Should this study be recommended for use in residential handler exposure assessments? No Yes
Data Summary: The following table summarizes pertinent exposure information from the above referenced study. Only inhalation exposure results are presented as dermal exposure monitoring was not recommended for use in residential handler exposure assessment. The submitted study itself or corresponding analytical spreadsheets should be reviewed for further information.
Table C-173: MRID 41054701 – Data Summary
Person ID AaiH1 (lbs)
Exposure (mg) Unit Exposure (mg/lb ai)4 Dermal2 Inhalation3 Dermal Inhalation
A 0.0188 -- 0.0026 -- 0.136 A 0.0188 -- 0.0016 -- 0.087 A 0.0250 -- 0.0016 -- 0.065 A 0.0250 -- 0.0019 -- 0.075 A 0.0250 -- 0.0052 -- 0.210 B 0.0188 -- 0.0019 -- 0.100 B 0.0188 -- 0.0013 -- 0.071 B 0.0250 -- 0.0029 -- 0.114 B 0.0250 -- 0.0019 -- 0.076 B 0.0206 -- 0.0015 -- 0.074 C 0.0100 -- 0.0004 -- 0.038 C 0.0188 -- 0.0008 -- 0.041 C 0.0188 -- 0.0009 -- 0.048 C 0.0131 -- 0.0014 -- 0.109 C 0.0250 -- 0.0009 -- 0.036
1 Amount of active ingredient Handled. 2 Representative of individuals wearing a short-sleeve shirt, shorts, shoes, socks and no chemical-resistant gloves. 3 Inhalation exposure (mg) = mg collected/pump flow rate (Lpm) * Breathing Rate (16.7 Lpm). 4 Unit Exposure = Exposure/AaiH.
Limitations: No limitations were identified for this study.

Formulation: Ready-to-Use (RTU) Equipment/Application Method: Trigger-pump sprayer
U.S. EPA Office of Pesticide Programs – Standard Operating Procedures for Assessing Residential Pesticide Exposure C-122
Table C-174: Exposure Study Identification Information
Citation Barnekow, D.E.; Cook, W.L.; Meitl, T.J.; Shurdut, B.A. (1999). Exposure to Chlorpyrifos While Applying a Ready to Use Formulation. January 14, 1999. Laboratory Project Study ID: HEA 976046.
EPA MRID 44739301 ORETF Code NA EPA Review D252733
MRID = Master Record Identification ORETF = Outdoor Residential Exposure Task Force Study Description: Fifteen individuals were monitored during applications to outdoor areas of houses (foundations, perimeters, flower beds) using a ready-to-use trigger spray bottle (24 oz.; 0.5% chlorpyrifos). Applications lasted 1 hour or until 5 bottles were exhausted, whichever was longer. Dermal exposure was measured using whole body dosimetry (underneath long pants, short-sleeve shirt) and hand washes (no chemical-resistant gloves were worn). Inhalation exposure was measured using standard pumps (set at 1.5 liters per minute), cassettes, and tubing. Laboratory recoveries for coveralls resulted in a mean percent recovery of 94.3% and RSD of 5.1%, while recoveries for handwash had a mean percent recovery of 107.6% and RSD of 3.9%. Field recoveries for coveralls resulted in a mean percent recovery of 99.1 and RSD of 4.7%, while recoveries for handwash had a mean percent recovery of 93.6% and RSD of 5.1%.
Table C-175: MRID 44739301 – Checklist and Use Recommendation
Study Criteria Exposure Component Dermal Inhalation
Does the study provide detailed characteristics on the activity, equipment type, and amount of active ingredient handled? Yes
Does dermal exposure monitoring allow for construction of an exposure estimate for individuals wearing short-sleeve shirts, shorts, shoes, socks? No NA
Was exposure to the hands representative of bare hands? Yes NA Was the study intended to simulate “residential” exposure via the scripted activity, amount of active ingredient handled, volunteers used, or the setting? Yes
Is the data of reasonable quality (i.e., are field fortification and laboratory recovery samples adequate)? Yes Yes
Should this study be recommended for use in residential handler exposure assessments? No Yes
Data Summary: The following table summarizes pertinent exposure information from the above referenced study. Note that only inhalation exposure data are presented as the dermal exposure data are not recommended for use in residential handler exposure assessment. The submitted study itself or corresponding analytical spreadsheets should be reviewed for further information.
Table C-176: MRID 44739301 – Data Summary Person ID AaiH1
(lbs) Exposure (mg) Unit Exposure (mg/lb ai)4
Dermal2 Inhalation3 Dermal Inhalation 1 0.036 -- 0.0024 -- 0.066 2 0.030 -- 0.0012 -- 0.041 3 0.030 -- 0.0016 -- 0.055

Formulation: Ready-to-Use (RTU) Equipment/Application Method: Trigger-pump sprayer
U.S. EPA Office of Pesticide Programs – Standard Operating Procedures for Assessing Residential Pesticide Exposure C-123
Table C-176: MRID 44739301 – Data Summary Person ID AaiH1
(lbs) Exposure (mg) Unit Exposure (mg/lb ai)4
Dermal2 Inhalation3 Dermal Inhalation 4 0.036 -- 0.0022 -- 0.062 5 0.038 -- 0.0022 -- 0.059 6 0.037 -- 0.0029 -- 0.079 7 0.015 -- 0.0024 -- 0.161 8 0.030 -- 0.0018 -- 0.058 9 0.035 -- 0.0036 -- 0.102
10 0.037 -- 0.0011 -- 0.030 11 0.038 -- 0.0011 -- 0.030 12 0.023 -- 0.0016 -- 0.069 13 0.038 -- 0.0016 -- 0.042 14 0.038 -- 0.0014 -- 0.037 15 0.037 -- 0.0018 -- 0.049
1 Amount of active ingredient Handled. 2 Representative of individuals wearing a short-sleeve shirt, shorts, shoes, socks and no chemical-resistant gloves. 3 Inhalation exposure (mg) = mg collected/pump flow rate (Lpm) * Breathing Rate (16.7 Lpm). 4 Unit Exposure = Exposure/AaiH.
Limitations: No limitations were identified in this study.

Formulation: Ready-to-Use (RTU) Equipment/Application Method: Shampoo
U.S. EPA Office of Pesticide Programs – Standard Operating Procedures for Assessing Residential Pesticide Exposure C-124
Scenario Summary
Table C-177: Scenario Description and Available Exposure Studies Formulation Ready-to-use (RTU) Equipment/Application Method Shampoo Application Site(s) Pets/animals, children
Available Exposure Studies Mester, T.C. (1998); MRID 44658401 Selim, S. (2005); MRID 46601001
Table C-178: Unit Exposures (mg/lb ai) – RTU Shampoo Applications
Statistic Dermal Inhalation 50th percentile 1700 0.169 75th percentile 2500 0.342 95th percentile 4700 0.942 99th percentile 7200 1.92 99.9th percentile 12000 4.26 AM (SD) 2000 (1400) 0.29 (0.41) GM (GSD) 1700 (1.9) 0.17 (2.8) Range 340 – 8300 0.0197 – 0.496 N 64 16 Dermal Unit Exposure Summary: The recommended dermal unit exposures for shampoo applications of liquid pesticide formulations to pets, animals, or children is based on a lognormal distribution fit with exposure monitoring data from Mester, T.C. (1998) [EPA MRID 44658401] and Selim, S. (2005) [EPA MRID 46601001]. Mester, T.C. (1998) monitored 16 applications by commercial pet groomers of shampoo to 8 dogs for approximately 149-295 minutes. Selim, S. (2005) monitored 16 shampoo applications to one dog each for approximately 30 minutes. Both studies were considered reasonably representative of activities related to shampooing pets and both had limitations with respect to exposure monitoring representing the type of clothing a homeowner or amateur applicator would wear (i.e., shorts, short-sleeve shirt, no chemical-resistant gloves). Additionally, since the exposure results were generally of the same magnitude, the datasets were combined. Inhalation Unit Exposure Summary: The recommended inhalation unit exposures for shampoo applications of liquid pesticide formulations to pets, animals, or children is based on a lognormal distribution fit with exposure monitoring data from Mester, T.C. (1998) [EPA MRID 44658401]. Mester, T.C. (1998) monitored 16 applications by commercial pet groomers of shampoo to 8 dogs for approximately 149-295 minutes. Another available study did not monitor inhalation exposure.

Formulation: Ready-to-Use (RTU) Equipment/Application Method: Shampoo
U.S. EPA Office of Pesticide Programs – Standard Operating Procedures for Assessing Residential Pesticide Exposure C-125
Lognormal Probability Plots Legend: O = Mester, T.C. (1998); X = Selim, S. (2005)
Legend: ■ = Mester, T.C. (1998)
Der
mal
UE
(mg/
lb a
i)
0
1000
2000
3000
4000
5000
6000
7000
8000
9000.001.01 .05.10 .25 .50 .75 .90 .95
.0 .5 1.0 1.5 2.0 2.5 3.0 3.5 4.
Log Normal Quantile
Inhalat
ion UE
(mg/lb
ai)
0
0.1
0.2
0.3
0.4
0.5.001.01.05.10.25 .50 .75 .90
0 1 2 3 4 5
Log Normal Quantile

Formulation: Ready-to-Use (RTU) Equipment/Application Method: Shampoo
U.S. EPA Office of Pesticide Programs – Standard Operating Procedures for Assessing Residential Pesticide Exposure C-126
Available Handler Exposure Studies
Table C-179: Exposure Study Identification Information
Citation Mester, T.C. (1998). Dermal Exposure and Inhalation Exposure to Carbaryl by Commercial Pet Groomers During Applications of Adams ™ Carbaryl Shampoo
EPA MRID 44658401 ORETF Code NA
EPA Review D287251 Contractor (Versar, Inc.) review 12/4/98
MRID = Master Record Identification ORETF = Outdoor Residential Exposure Task Force Study Description: Sixteen different commercial pet groomers were monitored while treating dogs with carbaryl, an active ingredient used to control fleas and ticks, using a ready-to-use (RTU) disposable shampoo bottle. Each application consisted of treating 8 dogs by soaking (2-3 minutes), treating with the shampoo, letting the shampoo sit for 5 minutes, then rinsing, drying and combing the dog. Application times for treating all 8 dogs ranged from 149 to 295 minutes and the amount of carbaryl applied ranged from approximately 0.0008 to 0.008 lbs. Dermal exposure was measured using inner whole body dosimetry (underneath pants, a short-sleeved shirt and a smock) and hand washes (no chemical-resistant gloves were worn). Inhalation exposure was measured using standard pumps (set at 1.5 liters per minute), cassettes, and tubing. Laboratory control samples for hand wash solutions were fortified with carbaryl with four rates of concurrent recovery determination, which ranged in percent recovery from 88% to 120%, with a mean percent recovery of 104% and a standard deviation of 8.7%. Field fortifications for hand wash solutions were prepared at three spiking levels, with a mean of all three spiking levels at 100% and a standard deviation of 5.9%. Laboratory control samples for whole body dosimeters were fortified with carbaryl with two rates for concurrent recovery determination, which ranged in percent recovery from 91% to 119%, with a mean percent recovery of 107% and a standard deviation of 6.9%. Field fortification samples for whole body dosimeters were prepared at three spiking levels with a mean of all three spiking levels at 83% and a standard deviation of 5.0%.
Table C-180: MRID 44658401 – Checklist and Use Recommendation
Study Criteria Exposure Component Dermal Inhalation
Does the study provide detailed characteristics on the activity, equipment type, and amount of active ingredient handled? Yes
Does dermal exposure monitoring allow for construction of an exposure estimate for individuals wearing short-sleeve shirts, shorts, shoes, socks? No NA
Was exposure to the hands representative of bare hands? Yes NA Was the study intended to simulate “residential” exposure via the scripted activity, amount of active ingredient handled, volunteers used, or the setting? No
Is the data of reasonable quality (i.e., are field fortification and laboratory recovery samples adequate)? Yes Yes
Should this study be recommended for use in residential handler exposure assessments? Yes Yes
Data Summary: The following table summarizes pertinent exposure information from the above referenced study. Both dermal and inhalation exposure are included since both are

Formulation: Ready-to-Use (RTU) Equipment/Application Method: Shampoo
U.S. EPA Office of Pesticide Programs – Standard Operating Procedures for Assessing Residential Pesticide Exposure C-127
recommended for use in residential handler exposure assessment. The submitted study itself or corresponding analytical spreadsheets should be reviewed for further information.
Table C-181: MRID 44658401 – Data Summary
Person ID AaiH1 (lbs)
Exposure (mg) Unit Exposure (mg/lb ai)4 Dermal2 Inhalation3 Dermal Inhalation
1 0.0050 15.36 0.00196 3072 0.3878 2 0.0015 11.72 0.00005 7813 0.0332 3 0.0020 2.61 0.00086 1305 0.4256 4 0.0044 5.51 0.00057 1252 0.1291 5 0.0036 10.40 0.00065 2889 0.1788 6 0.0027 3.99 0.00054 1478 0.2036 7 0.0015 4.49 0.00059 2993 0.4031 8 0.0008 5.13 0.00041 6413 0.4958 9 0.0013 2.20 0.00005 1692 0.0378 10 0.0039 27.88 0.00140 7149 0.3627 11 0.0021 1.76 0.00022 838 0.1066 12 0.0082 15.00 0.00097 1829 0.1185 13 0.0025 8.29 0.00118 3316 0.4732 14 0.0025 8.60 0.00005 3440 0.0197 15 0.0016 2.54 0.00076 1588 0.4865 16 0.0043 1.44 0.00048 335 0.1129
1 Amount of active ingredient Handled. 2 Representative of individuals wearing a short-sleeve shirt, shorts, shoes, socks and no chemical-resistant gloves. 3 Inhalation exposure (mg) = mg collected/pump flow rate (Lpm) * Breathing Rate (16.7 Lpm). 4 Unit Exposure = Exposure/AaiH.
Limitations: Though the above referenced study is useful for assessment of exposure during shampoo applications, the following limitations are noted:
• The study monitored professional/commercial pet groomers and may not be representative of the exposure an individual at home would experience while treating their pets.
• The individuals monitored wore long pants, long-sleeve shirts, a smock and chemical-resistant gloves. Therefore, back-calculations using standard penetration factors to represent exposure to people wearing shorts, a short-sleeve shirt and no chemical-resistant gloves were necessary.
Table C-182: Exposure Study Identification Information
Citation
Selim, S. (2005) Human Exposure During and Following Use of a Pyrethrins/Piperonyl Butoxide/MGK-264 Shampoo Formulation on Dogs: Final Report. Project Number: 040154. Unpublished study prepared by Young Veterinary Research Services and Golden Pacific Laboratories, LLC (GPL). 466 p.
EPA MRID 46601001 ORETF Code NA EPA Review D319806
MRID = Master Record Identification ORETF = Outdoor Residential Exposure Task Force

Formulation: Ready-to-Use (RTU) Equipment/Application Method: Shampoo
U.S. EPA Office of Pesticide Programs – Standard Operating Procedures for Assessing Residential Pesticide Exposure C-128
Study Description: Sixteen individuals were monitored while treating dogs with a shampoo containing the active ingredients pyrethrins, piperonyl butoxide (PBO), and MGK-264. Each application took approximately 30 minutes and consisted of shampooing, rinsing, and drying a single dog. The amount of active ingredient ranged from 12 mg (pyrethrins) to 663 mg (PBO). Dermal exposure was measured using a t-shirt (no inner dosimeter, so exposure represents bare upper body) and hand washes or wipes (no chemical-resistant gloves were worn) both immediately following the treatment and 4 hours after. Lower body exposure was not measured. Inhalation exposure was not measured. Overall average laboratory recoveries for PYI (pyrethrins) ranged from 83.5% (shampoo rinse) to 98.0% (paper towels), for PBO (piperonyl butoxide) ranged from 84.2% (dog hair) to 98.6% (shampoo rinse), for MGK 264 ranged from 86.3% (hand washes) to 98.2% (paper towels). For CDCA, the overall average recovery was 92.1%. Field fortification samples were not discussed in the Study Report.
Table C-183: MRID 46601001 – Checklist and Use Recommendation
Study Criteria Exposure Component Dermal Inhalation
Does the study provide detailed characteristics on the activity, equipment type, and amount of active ingredient handled? Yes
Does dermal exposure monitoring allow for construction of an exposure estimate for individuals wearing short-sleeve shirts, shorts, shoes, socks? No NA
Was exposure to the hands representative of bare hands? Yes NA Was the study intended to simulate “residential” exposure via the scripted activity, amount of active ingredient handled, volunteers used, or the setting? Yes
Is the data of reasonable quality (i.e., are field fortification and laboratory recovery samples adequate)? Yes No
Should this study be recommended for use in residential handler exposure assessments? Yes No
Data Summary: The following table summarizes pertinent exposure information from the above referenced study. Note that only dermal exposure data are presented as inhalation exposure was not measured. The submitted study itself or corresponding analytical spreadsheets should be reviewed for further information.
Table C-184: MRID 46601001 – Data Summary Person ID AaiH1
(lbs) Exposure (mg) Unit Exposure (mg/lb ai)4
Dermal2 Inhalation3 Dermal Inhalation A1 (PY) 0.000056 0.063 -- 1125 -- A2 (PY) 0.000049 0.063 -- 1286 -- A3 (PY) 0.000063 0.080 -- 1270 -- A4 (PY) 0.000060 0.058 -- 967 -- A5 (PY) 0.000027 0.031 -- 1148 -- A6 (PY) 0.000039 0.063 -- 1615 -- A7 (PY) 0.000039 0.255 -- 6538 -- A8 (PY) 0.000048 0.048 -- 1000 -- A9 (PY) 0.000049 0.124 -- 2531 --
A10 (PY) 0.000052 0.105 -- 2019 -- A11 (PY) 0.000051 0.051 -- 1000 -- A12 (PY) 0.000040 0.064 -- 1600 -- A13 (PY) 0.000080 0.114 -- 1425 -- A14 (PY) 0.000047 0.062 -- 1319 --

Formulation: Ready-to-Use (RTU) Equipment/Application Method: Shampoo
U.S. EPA Office of Pesticide Programs – Standard Operating Procedures for Assessing Residential Pesticide Exposure C-129
Table C-184: MRID 46601001 – Data Summary Person ID AaiH1
(lbs) Exposure (mg) Unit Exposure (mg/lb ai)4
Dermal2 Inhalation3 Dermal Inhalation A15 (PY) 0.000051 0.045 -- 882 -- A16 (PY) 0.000056 0.042 -- 750 -- A1 (PBO) 0.00103 1.25 -- 1214 -- A2 (PBO) 0.00089 1.20 -- 1348 -- A3 (PBO) 0.00116 1.41 -- 1216 -- A4 (PBO) 0.00109 1.16 -- 1064 -- A5 (PBO) 0.00049 0.74 -- 1510 -- A6 (PBO) 0.00071 1.48 -- 2085 -- A7 (PBO) 0.00072 5.67 -- 7875 -- A8 (PBO) 0.00088 1.86 -- 2114 -- A9 (PBO) 0.00090 2.24 -- 2489 --
A10 (PBO) 0.00095 1.74 -- 1832 -- A11 (PBO) 0.00094 0.83 -- 883 -- A12 (PBO) 0.00073 1.12 -- 1534 -- A13 (PBO) 0.00146 2.07 -- 1418 -- A14 (PBO) 0.00086 1.08 -- 1256 -- A15 (PBO) 0.00092 0.90 -- 978 -- A16 (PBO) 0.00101 0.80 -- 792 --
A1 (MGK-264) 0.00035 0.646 -- 1846 -- A2 (MGK-264) 0.00030 0.493 -- 1643 -- A3 (MGK-264) 0.00040 0.678 -- 1695 -- A4 (MGK-264) 0.00037 0.450 -- 1216 -- A5 (MGK-264) 0.00017 0.273 -- 1606 -- A6 (MGK-264) 0.00024 0.552 -- 2300 -- A7 (MGK-264) 0.00025 2.055 -- 8220 -- A8 (MGK-264) 0.00030 0.461 -- 1537 -- A9 (MGK-264) 0.00031 0.786 -- 2535 --
A10 (MGK-264) 0.00033 0.596 -- 1806 -- A11 (MGK-264) 0.00032 0.288 -- 900 -- A12 (MGK-264) 0.00025 0.338 -- 1352 -- A13 (MGK-264) 0.00050 0.725 -- 1450 -- A14 (MGK-264) 0.00029 0.331 -- 1141 -- A15 (MGK-264) 0.00032 0.266 -- 831 -- A16 (MGK-264) 0.00035 0.244 -- 697 --
1 Amount of active ingredient Handled. 2 Representative of individuals wearing a short-sleeve shirt, shorts, shoes, socks and no chemical-resistant gloves. 3 Inhalation exposure (mg) = mg collected/pump flow rate (Lpm) * Breathing Rate (16.7 Lpm). 4 Unit Exposure = Exposure/AaiH.
Limitations: Though the above referenced study is useful for assessment of exposure during shampoo applications, the following limitations are noted:
• Dermal exposure to the legs was not measured. However, since dermal exposure was measured using the t-shirt that the individuals were wearing (i.e., measurements represent a bare upper body), the potential overrepresentation of the upper body exposure likely compensates for the lack of lower body measurements.

Formulation: Ready-to-Use (RTU) Equipment/Application Method: Spot-on
U.S. EPA Office of Pesticide Programs – Standard Operating Procedures for Assessing Residential Pesticide Exposure C-130
Scenario Summary
Table C-185: Scenario Description and Available Exposure Studies Formulation Ready-to-use (RTU) Equipment/Application Method Spot-on Application Site(s) Pets/animals Available Exposure Studies Meo, N.; Gonzalez, C.; Belcher, T. (1997); MRID 44433303
Table C-186: Unit Exposures (mg/lb ai) – RTU Spot-on Applications Statistic Dermal Inhalation
50th percentile 29
Inhalation exposure data during application of spot-on treatments is unavailable, however is considered
negligible.
75th percentile 91 95th percentile 460 99th percentile 1400 99.9th percentile 5100 AM (SD) 120 (470) GM (GSD) 29 (5.3) Range 1.1 – 370 N 16 Dermal Unit Exposure Summary: The recommended dermal unit exposures for spot-on applications to pets or animals is based on a lognormal distribution fit with exposure monitoring data from Meo, N., et al (1997) [EPA MRID 44433303]. Meo, N., et al (1997) monitored 16 applications by commercial pet groomers to 8 dogs for approximately 14-32 minutes using a ready-to-use (RTU), disposable, snap-top, plastic-backed pipette. This was the only available monitoring study for this exposure scenario. Inhalation Unit Exposure Summary: Inhalation exposure data during application of spot-on treatments is unavailable, however is considered negligible.

Formulation: Ready-to-Use (RTU) Equipment/Application Method: Spot-on
U.S. EPA Office of Pesticide Programs – Standard Operating Procedures for Assessing Residential Pesticide Exposure C-131
Lognormal Probability Plots Legend: ■ = Meo, N. et al (1997)
Der
mal
UE
(mg/
lb a
i)
0
50
100
150
200
250
300
350
400.001.01.05.10.25 .50 .75 .90 .95
0 2 4 6 8 10 12 14 16
Log Normal Quantile

Formulation: Ready-to-Use (RTU) Equipment/Application Method: Spot-on
U.S. EPA Office of Pesticide Programs – Standard Operating Procedures for Assessing Residential Pesticide Exposure C-132
Available Handler Exposure Studies
Table C-187: Exposure Study Identification Information
Citation
Meo, N.; Gonzalez, C.; Belcher, T. (1997) Dermal Exposure of Commercial Pet Groomers During Application of Frontline Top Spot: Final Report: Lab Project Number: MERIAL 445 SAFXT047: SAFXT047: EC 97 390. Unpublished study prepared by ABC Labs., California and Animal Appeal Grooming Shop & Case Veterinary Hospital. 925 p.
EPA MRID 44433303 ORETF Code NA
EPA Review DER by W. Britton (EPA); no barcode Contractor review (Versar, Inc.) 9/9/08
MRID = Master Record Identification ORETF = Outdoor Residential Exposure Task Force Study Description: Sixteen different commercial pet groomers were monitored while treating dogs with fipronil, an active ingredient used to control fleas and ticks, using a ready-to-use (RTU), disposable, snap-top, plastic-backed pipette. Each application consisted of applying 2 or 3 pre-measured unit doses with a pipette to the neck area of each of 8 dogs with some groomers rubbing the material into the dogs’ fur. Application times ranged from 14 to 32 minutes and the amount of fipronil applied ranged from approximately 0.001 to 0.004 lbs. Dermal exposure was measured using inner whole body dosimetry (underneath pants, a short-sleeved shirt and a smock) and cotton gloves underneath household latex gloves. Inhalation exposure was not measured. Data generated in the frozen stability phase of the study indicated that fipronil was stable in two dermal matrices after mean recoveries from field fortification samples which fell between 79% and 103% of theoretical concentration.
Table C-188: MRID 44433303 – Checklist and Use Recommendation
Study Criteria Exposure Component Dermal Inhalation
Does the study provide detailed characteristics on the activity, equipment type, and amount of active ingredient handled? Yes
Does dermal exposure monitoring allow for construction of an exposure estimate for individuals wearing short-sleeve shirts, shorts, shoes, socks? No NA
Was exposure to the hands representative of bare hands? No NA Was the study intended to simulate “residential” exposure via the scripted activity, amount of active ingredient handled, volunteers used, or the setting? No
Is the data of reasonable quality (i.e., are field fortification and laboratory recovery samples adequate)? Yes No
Should this study be recommended for use in residential handler exposure assessments? Yes No
Data Summary: The following table summarizes pertinent exposure information from the above referenced study. Note that only dermal exposure data are presented as inhalation exposure was not measured. The submitted study itself or corresponding analytical spreadsheets should be reviewed for further information.
Table C-189: MRID 44433303 – Data Summary Person ID AaiH1
(lbs) Exposure (mg) Unit Exposure (mg/lb ai)4
Dermal2 Inhalation3 Dermal Inhalation

Formulation: Ready-to-Use (RTU) Equipment/Application Method: Spot-on
U.S. EPA Office of Pesticide Programs – Standard Operating Procedures for Assessing Residential Pesticide Exposure C-133
Table C-189: MRID 44433303 – Data Summary Person ID AaiH1
(lbs) Exposure (mg) Unit Exposure (mg/lb ai)4
Dermal2 Inhalation3 Dermal Inhalation 1 0.00236 0.033 -- 13.93 -- 2 0.00207 0.032 -- 15.59 -- 3 0.00251 0.727 -- 289.35 -- 4 0.00162 0.090 -- 55.40 -- 5 0.00325 0.031 -- 9.67 -- 6 0.00162 0.037 -- 23.03 -- 7 0.00399 0.004 -- 1.12 -- 8 0.00177 0.252 -- 142.25 -- 9 0.00251 0.013 -- 5.20 --
10 0.00148 0.084 -- 56.94 -- 11 0.00207 0.767 -- 370.84 -- 12 0.00192 0.024 -- 12.56 -- 13 0.00192 0.009 -- 4.82 -- 14 0.00266 0.337 -- 126.71 -- 15 0.00251 0.031 -- 12.50 -- 16 0.00266 0.603 -- 226.66 --
1 Amount of active ingredient Handled. 2 Representative of individuals wearing a short-sleeve shirt, shorts, shoes, socks and no chemical-resistant gloves. 3 Inhalation exposure (mg) = mg collected/pump flow rate (Lpm) * Breathing Rate (16.7 Lpm). 4 Unit Exposure = Exposure/AaiH. Limitations: Though the above referenced study is useful for assessment of exposure during spot-on pet treatments, the following limitations are noted:
• The study monitored professional/commercial pet groomers and may not be representative of the exposure an individual at home would experience while treating their pets.
• The individuals monitored wore long pants, long-sleeve shirts, a smock and chemical-resistant gloves. Therefore, back-calculations using standard penetration factors to represent exposure to people wearing shorts, a short-sleeve shirt and no chemical-resistant gloves were necessary.

Formulation: Ready-to-Use (RTU) Equipment/Application Method: Aerosol can
U.S. EPA Office of Pesticide Programs – Standard Operating Procedures for Assessing Residential Pesticide Exposure C-134
Scenario Summary
Table C-190: Scenario Description and Available Exposure Studies Formulation Ready-to-use (RTU) Equipment/Application Method Aerosol can
Application Site(s) outdoors (gardens, trees/bushes, perimeter, mounds/nests, aquatic areas), indoors (general broadcast treatments, baseboards, cracks and crevices), pets/animals
Available Exposure Studies PHED 521 PHED 456 Selim, S. (2002); MRID 46188618
Table C-191: Unit Exposures (mg/lb ai) – RTU Aerosol can Applications
Statistic Outdoors/Indoors Pets/Animals Dermal Inhalation Dermal Inhalation
50th percentile 330 2.3
Studies measuring exposure while treating pets or animals using an aerosol can are
unavailable. Therefore, the exposure studies recommended for use for treating pets or animals using RTU trigger-pump sprayers should be used as a surrogate.
75th percentile 450 3.7 95th percentile 720 7.4 99th percentile 990 11 99.9th percentile 1400 20 AM (SD) 370 (180) 3.0 (2.4) GM (GSD) 330 (1.6) 2.3 (2.0) Range 140 – 1000 0.38 – 4.9 N 15 15 Dermal Unit Exposure Summary
Outdoor and Indoor Environments: The recommended dermal unit exposures for aerosol can applications to outdoor and indoor environments is based on a lognormal distribution fit with exposure monitoring data from PHED 521. PHED 521 monitored 15 applications to cracks, crevices, baseboards, under sinks, and behind appliances in 15 separate houses using an entire 16 oz. aerosol can. Though another study was available this study best represented the type of clothing a homeowner or amateur applicator would wear (i.e., shorts, short-sleeve shirt, no chemical-resistant gloves). Pets and Animals: Dermal exposure monitoring data for aerosol can applications to pets and animals are unavailable; dermal unit exposures for trigger-sprayers applications to pets and animals are recommended as surrogate data.
Inhalation Unit Exposure Summary
Outdoor and Indoor Environments: The recommended inhalation unit exposures for aerosol can applications to outdoor and indoor environments is based on a lognormal distribution fit with exposure monitoring data from PHED 456. PHED 456 monitored 15 applications to cracks, crevices, baseboards, under sinks, and behind appliances in 15 separate houses using an entire 16 oz. aerosol can. This study was selected for use for
Formulation: Ready-to-Use (RTU) Equipment/Application Method: Aerosol can
U.S. EPA Office of Pesticide Programs – Standard Operating Procedures for Assessing Residential Pesticide Exposure C-135
inhalation exposure estimates due to its lack of non-detect samples compared with another available study. Pets and Animals: Inhalation exposure monitoring data for aerosol can applications to pets and animals is unavailable; inhalation unit exposures for trigger-sprayers applications to pets and animals is recommended as surrogate data.

Formulation: Ready-to-Use (RTU) Equipment/Application Method: Aerosol can
U.S. EPA Office of Pesticide Programs – Standard Operating Procedures for Assessing Residential Pesticide Exposure C-136
Lognormal Probability Plots Outdoor/Indoor Environments Legend: ■ = PHED 521
Outdoor/Indoor Environments Legend: ■ = PHED 456
Der
mal
UE
(mg/
lb a
i)
100
200
300
400
500
600
700
800
900
1000
1100.01 .05 .10 .25 .50 .75 .90 .95
.5 1.0 1.5 2.0
Log Normal Quantile
Inha
latio
n U
E (m
g/lb
ai)
0
1
2
3
4
5.05.10 .25 .50 .75 .90 .95
.5 1.0 1.5 2.0 2.5 3.0 3.5 4.
Log Normal Quantile

Formulation: Ready-to-Use (RTU) Equipment/Application Method: Aerosol can
U.S. EPA Office of Pesticide Programs – Standard Operating Procedures for Assessing Residential Pesticide Exposure C-137
Available Handler Exposure Studies
Table C-192: Available Exposure Study Identification Information Citation PHED 521
EPA MRID NA ORETF Code NA EPA Review none
MRID = Master Record Identification ORETF = Outdoor Residential Exposure Task Force Study Description: Five different individuals were monitored on 3 consecutive days while spraying an entire 16 oz. aerosol can (1% active ingredient) to cracks, crevices, baseboards, under sinks, and behind appliances in 15 separate houses. Dermal exposure was measured using gauze patches (both inside and outside normal work clothing) and hand rinses (without chemical-resistant gloves). Inhalation exposure was measured using standard pumps (set at 1 liter per minute), cassettes, and tubing. Thirteen of 15 inhalation samples were non-detects (limit of detection = 1 µg per sample). Recoveries from field fortifications of exposure sampling matrices were generally above 90%.
Table C-193: PHED 521 – Checklist and Use Recommendation
Study Criteria Exposure Component Dermal Inhalation
Does the study provide detailed characteristics on the activity, equipment type, and amount of active ingredient handled? Yes
Does dermal exposure monitoring allow for construction of an exposure estimate for individuals wearing short-sleeve shirts, shorts, shoes, socks? Yes NA
Was exposure to the hands representative of bare hands? Yes NA Was the study intended to simulate “residential” exposure via the scripted activity, amount of active ingredient handled, volunteers used, or the setting? No
Is the data of reasonable quality (i.e., are field fortification and laboratory recovery samples adequate)? Yes Yes
Should this study be recommended for use in residential handler exposure assessments? Yes No
Data Summary: The following table summarizes pertinent exposure information from the above referenced study. Note that only dermal exposure data are presented as inhalation exposure data from this study is not recommended for the purposes of residential handler exposure assessment. The submitted study itself or corresponding analytical spreadsheets should be reviewed for further information.
Table C-194: PHED 521 – Data Summary Person ID AaiH1
(lbs) Exposure (mg) Unit Exposure (mg/lb ai)4
Dermal2 Inhalation3 Dermal Inhalation A 0.01 4.25 -- 425 -- A 0.01 2.99 -- 299 -- A 0.01 2.88 -- 288 -- B 0.01 2.61 -- 261 -- B 0.01 4.43 -- 443 -- B 0.01 1.42 -- 142 -- C 0.01 5.77 -- 577 --
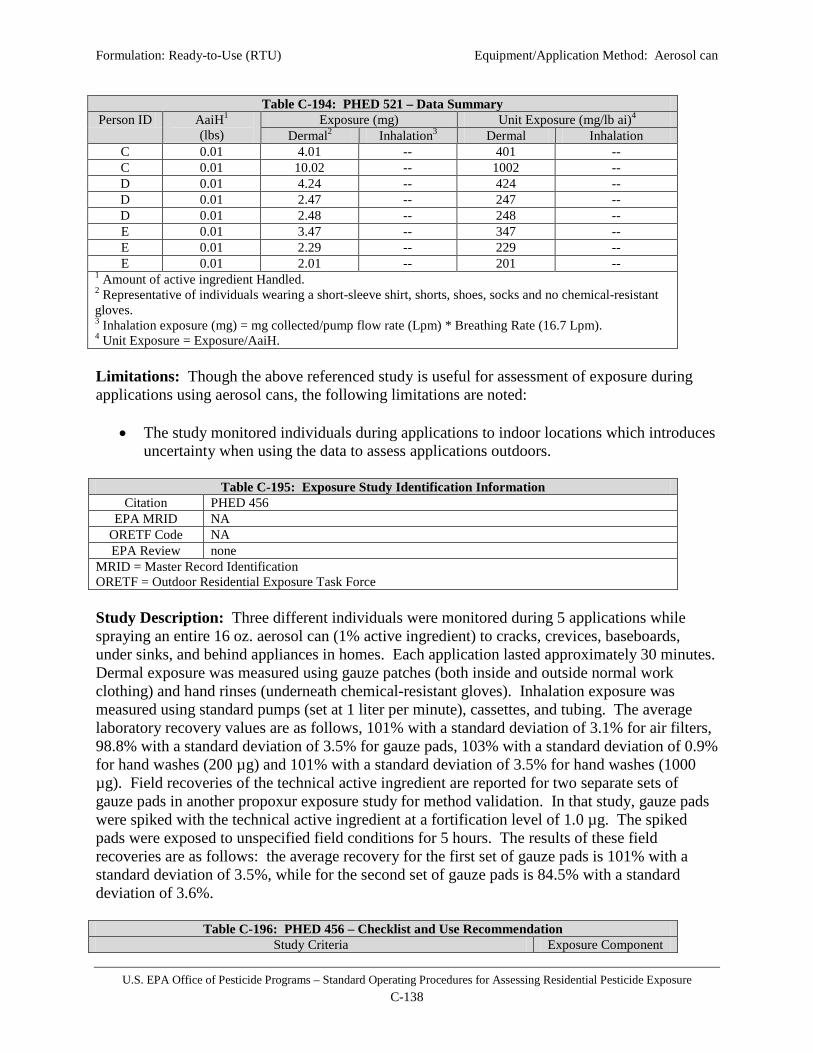
Formulation: Ready-to-Use (RTU) Equipment/Application Method: Aerosol can
U.S. EPA Office of Pesticide Programs – Standard Operating Procedures for Assessing Residential Pesticide Exposure C-138
Table C-194: PHED 521 – Data Summary Person ID AaiH1
(lbs) Exposure (mg) Unit Exposure (mg/lb ai)4
Dermal2 Inhalation3 Dermal Inhalation C 0.01 4.01 -- 401 -- C 0.01 10.02 -- 1002 -- D 0.01 4.24 -- 424 -- D 0.01 2.47 -- 247 -- D 0.01 2.48 -- 248 -- E 0.01 3.47 -- 347 -- E 0.01 2.29 -- 229 -- E 0.01 2.01 -- 201 --
1 Amount of active ingredient Handled. 2 Representative of individuals wearing a short-sleeve shirt, shorts, shoes, socks and no chemical-resistant gloves. 3 Inhalation exposure (mg) = mg collected/pump flow rate (Lpm) * Breathing Rate (16.7 Lpm). 4 Unit Exposure = Exposure/AaiH. Limitations: Though the above referenced study is useful for assessment of exposure during applications using aerosol cans, the following limitations are noted:
• The study monitored individuals during applications to indoor locations which introduces uncertainty when using the data to assess applications outdoors.
Table C-195: Exposure Study Identification Information
Citation PHED 456 EPA MRID NA
ORETF Code NA EPA Review none
MRID = Master Record Identification ORETF = Outdoor Residential Exposure Task Force Study Description: Three different individuals were monitored during 5 applications while spraying an entire 16 oz. aerosol can (1% active ingredient) to cracks, crevices, baseboards, under sinks, and behind appliances in homes. Each application lasted approximately 30 minutes. Dermal exposure was measured using gauze patches (both inside and outside normal work clothing) and hand rinses (underneath chemical-resistant gloves). Inhalation exposure was measured using standard pumps (set at 1 liter per minute), cassettes, and tubing. The average laboratory recovery values are as follows, 101% with a standard deviation of 3.1% for air filters, 98.8% with a standard deviation of 3.5% for gauze pads, 103% with a standard deviation of 0.9% for hand washes (200 µg) and 101% with a standard deviation of 3.5% for hand washes (1000 µg). Field recoveries of the technical active ingredient are reported for two separate sets of gauze pads in another propoxur exposure study for method validation. In that study, gauze pads were spiked with the technical active ingredient at a fortification level of 1.0 µg. The spiked pads were exposed to unspecified field conditions for 5 hours. The results of these field recoveries are as follows: the average recovery for the first set of gauze pads is 101% with a standard deviation of 3.5%, while for the second set of gauze pads is 84.5% with a standard deviation of 3.6%.
Table C-196: PHED 456 – Checklist and Use Recommendation Study Criteria Exposure Component
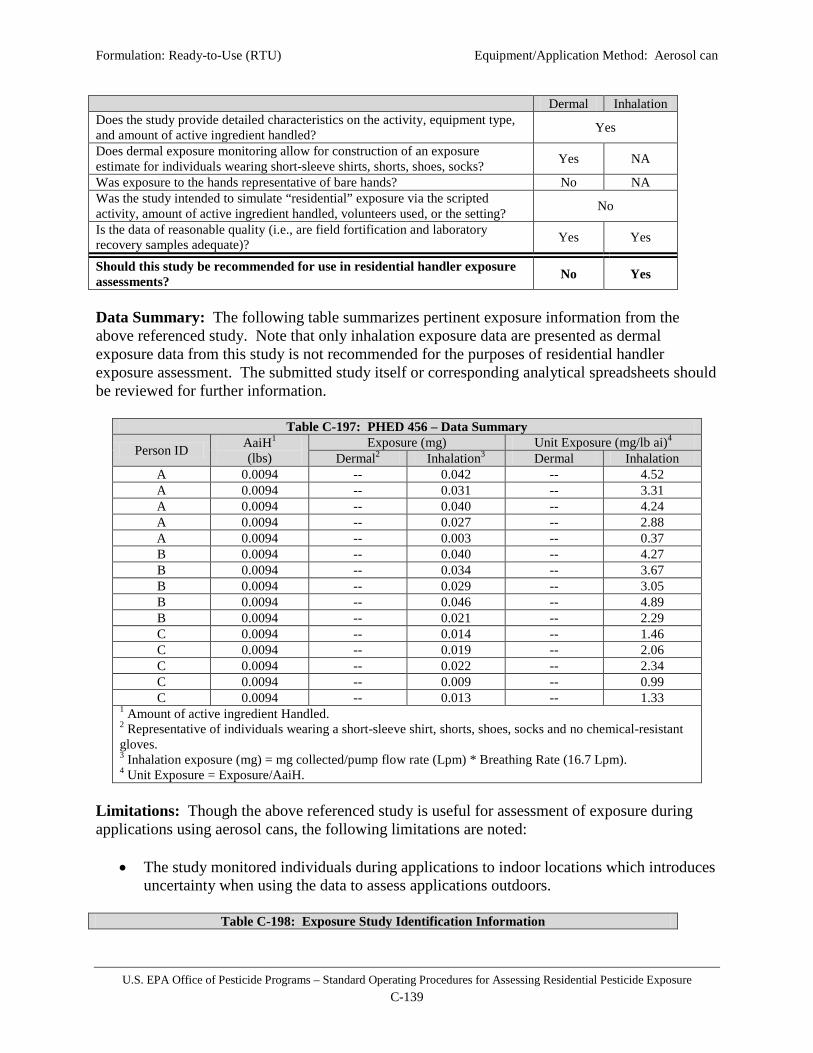
Formulation: Ready-to-Use (RTU) Equipment/Application Method: Aerosol can
U.S. EPA Office of Pesticide Programs – Standard Operating Procedures for Assessing Residential Pesticide Exposure C-139
Dermal Inhalation Does the study provide detailed characteristics on the activity, equipment type, and amount of active ingredient handled? Yes
Does dermal exposure monitoring allow for construction of an exposure estimate for individuals wearing short-sleeve shirts, shorts, shoes, socks? Yes NA
Was exposure to the hands representative of bare hands? No NA Was the study intended to simulate “residential” exposure via the scripted activity, amount of active ingredient handled, volunteers used, or the setting? No
Is the data of reasonable quality (i.e., are field fortification and laboratory recovery samples adequate)? Yes Yes
Should this study be recommended for use in residential handler exposure assessments? No Yes
Data Summary: The following table summarizes pertinent exposure information from the above referenced study. Note that only inhalation exposure data are presented as dermal exposure data from this study is not recommended for the purposes of residential handler exposure assessment. The submitted study itself or corresponding analytical spreadsheets should be reviewed for further information.
Table C-197: PHED 456 – Data Summary
Person ID AaiH1 (lbs)
Exposure (mg) Unit Exposure (mg/lb ai)4 Dermal2 Inhalation3 Dermal Inhalation
A 0.0094 -- 0.042 -- 4.52 A 0.0094 -- 0.031 -- 3.31 A 0.0094 -- 0.040 -- 4.24 A 0.0094 -- 0.027 -- 2.88 A 0.0094 -- 0.003 -- 0.37 B 0.0094 -- 0.040 -- 4.27 B 0.0094 -- 0.034 -- 3.67 B 0.0094 -- 0.029 -- 3.05 B 0.0094 -- 0.046 -- 4.89 B 0.0094 -- 0.021 -- 2.29 C 0.0094 -- 0.014 -- 1.46 C 0.0094 -- 0.019 -- 2.06 C 0.0094 -- 0.022 -- 2.34 C 0.0094 -- 0.009 -- 0.99 C 0.0094 -- 0.013 -- 1.33
1 Amount of active ingredient Handled. 2 Representative of individuals wearing a short-sleeve shirt, shorts, shoes, socks and no chemical-resistant gloves. 3 Inhalation exposure (mg) = mg collected/pump flow rate (Lpm) * Breathing Rate (16.7 Lpm). 4 Unit Exposure = Exposure/AaiH.
Limitations: Though the above referenced study is useful for assessment of exposure during applications using aerosol cans, the following limitations are noted:
• The study monitored individuals during applications to indoor locations which introduces uncertainty when using the data to assess applications outdoors.
Table C-198: Exposure Study Identification Information

Formulation: Ready-to-Use (RTU) Equipment/Application Method: Aerosol can
U.S. EPA Office of Pesticide Programs – Standard Operating Procedures for Assessing Residential Pesticide Exposure C-140
Citation Selim, S. (2002) Measurement of Air Concentration, Dermal Exposure, and Deposition of Pyrethrin and Piperonyl Butoxide Following the Use of an Aerosol Spray
EPA MRID 46188618 ORETF Code NA EPA Review none
MRID = Master Record Identification ORETF = Outdoor Residential Exposure Task Force Study Description: One individual performed a total of 4 applications (2 per day) using an aerosol can to treat a 16 ft. x 16 ft. x 8 ft. room. Each application consisted of holding the can upright and spraying for approximately 10 seconds in a sweeping motion. It was unclear from the study report the amount of active ingredient handled per application. Dermal exposure was measured for hands only, using cotton gloves. Inhalation exposure was measured using standard pumps (set at 1 liter per minute), cassettes, and tubing. The overall average recoveries ± standard deviation of laboratory fortified controls for air sampling tubes were 83.5 ± 11.8% and 93.5 ± 12.1 % for PYI (pyrethrin) and PBO (piperonyl butoxide) respectively. The overall average recoveries ± standard deviation of laboratory fortified controls for cotton gloves were 83.0 ± 12.1% and 87.3 ± 9.52% for PYI (pyrethrin) and PBO (piperonyl butoxide) respectively. The overall average recoveries ± standard deviation of field fortified controls for air sampling tubes were 84.9 ± 8.87% for PYI (pyrethrin) and 93.6 ± 6.04% for PBO (piperonyl butoxide), and 79.6 ± 3.07% for PYI (pyrethrin) and 83.3 ± 6.64% for PBO (piperonyl butoxide) for cotton gloves.
Table C-199: MRID 46186618 – Checklist and Use Recommendation
Study Criteria Exposure Component Dermal Inhalation
Does the study provide detailed characteristics on the activity, equipment type, and amount of active ingredient handled? No
Does dermal exposure monitoring allow for construction of an exposure estimate for individuals wearing short-sleeve shirts, shorts, shoes, socks? No NA
Was exposure to the hands representative of bare hands? No NA Was the study intended to simulate “residential” exposure via the scripted activity, amount of active ingredient handled, volunteers used, or the setting? No
Is the data of reasonable quality (i.e., are field fortification and laboratory recovery samples adequate)? Yes Yes
Should this study be recommended for use in residential handler exposure assessments? No No
Data Summary: A summary of the data from this study is not provided since it is not recommended for use in residential handler exposure assessment. The submitted study itself should be reviewed for further information. Limitations: Any data limitations associated with the exposure data in this study are not provided since it is not recommended for use in residential handler exposure assessment. The submitted study itself should be reviewed for further information.
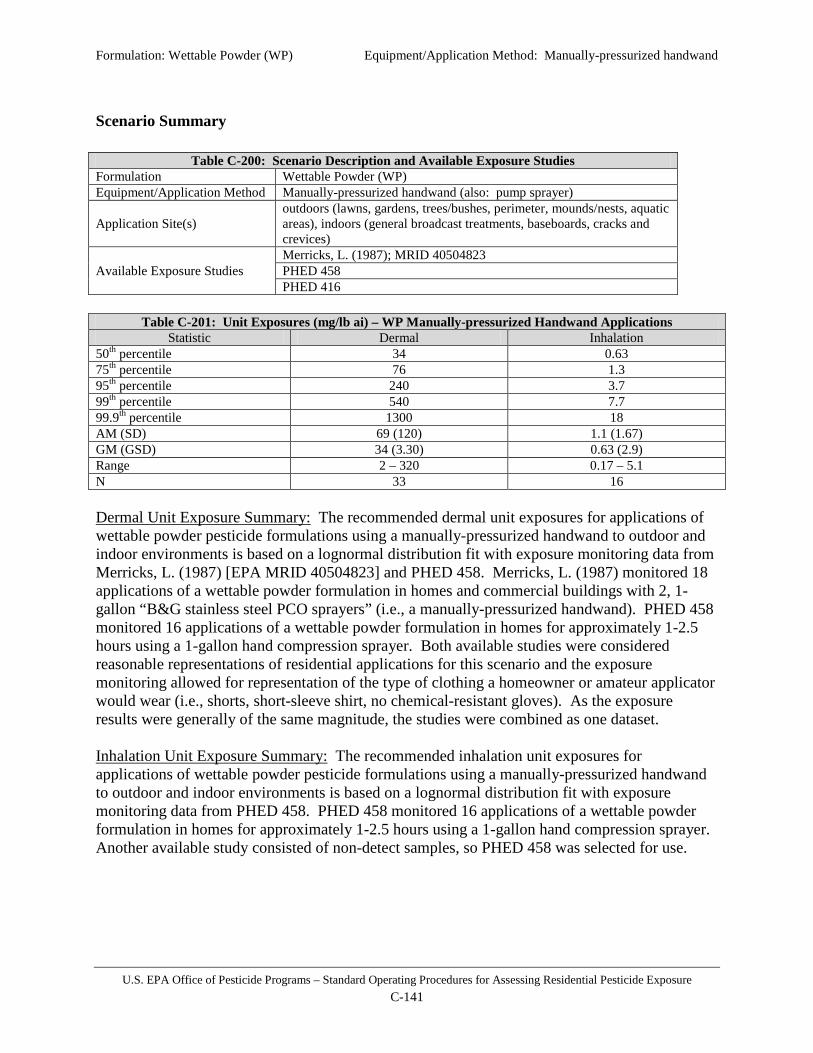
Formulation: Wettable Powder (WP) Equipment/Application Method: Manually-pressurized handwand
U.S. EPA Office of Pesticide Programs – Standard Operating Procedures for Assessing Residential Pesticide Exposure C-141
Scenario Summary
Table C-200: Scenario Description and Available Exposure Studies Formulation Wettable Powder (WP) Equipment/Application Method Manually-pressurized handwand (also: pump sprayer)
Application Site(s) outdoors (lawns, gardens, trees/bushes, perimeter, mounds/nests, aquatic areas), indoors (general broadcast treatments, baseboards, cracks and crevices)
Available Exposure Studies Merricks, L. (1987); MRID 40504823 PHED 458 PHED 416
Table C-201: Unit Exposures (mg/lb ai) – WP Manually-pressurized Handwand Applications
Statistic Dermal Inhalation 50th percentile 34 0.63 75th percentile 76 1.3 95th percentile 240 3.7 99th percentile 540 7.7 99.9th percentile 1300 18 AM (SD) 69 (120) 1.1 (1.67) GM (GSD) 34 (3.30) 0.63 (2.9) Range 2 – 320 0.17 – 5.1 N 33 16 Dermal Unit Exposure Summary: The recommended dermal unit exposures for applications of wettable powder pesticide formulations using a manually-pressurized handwand to outdoor and indoor environments is based on a lognormal distribution fit with exposure monitoring data from Merricks, L. (1987) [EPA MRID 40504823] and PHED 458. Merricks, L. (1987) monitored 18 applications of a wettable powder formulation in homes and commercial buildings with 2, 1-gallon “B&G stainless steel PCO sprayers” (i.e., a manually-pressurized handwand). PHED 458 monitored 16 applications of a wettable powder formulation in homes for approximately 1-2.5 hours using a 1-gallon hand compression sprayer. Both available studies were considered reasonable representations of residential applications for this scenario and the exposure monitoring allowed for representation of the type of clothing a homeowner or amateur applicator would wear (i.e., shorts, short-sleeve shirt, no chemical-resistant gloves). As the exposure results were generally of the same magnitude, the studies were combined as one dataset. Inhalation Unit Exposure Summary: The recommended inhalation unit exposures for applications of wettable powder pesticide formulations using a manually-pressurized handwand to outdoor and indoor environments is based on a lognormal distribution fit with exposure monitoring data from PHED 458. PHED 458 monitored 16 applications of a wettable powder formulation in homes for approximately 1-2.5 hours using a 1-gallon hand compression sprayer. Another available study consisted of non-detect samples, so PHED 458 was selected for use.
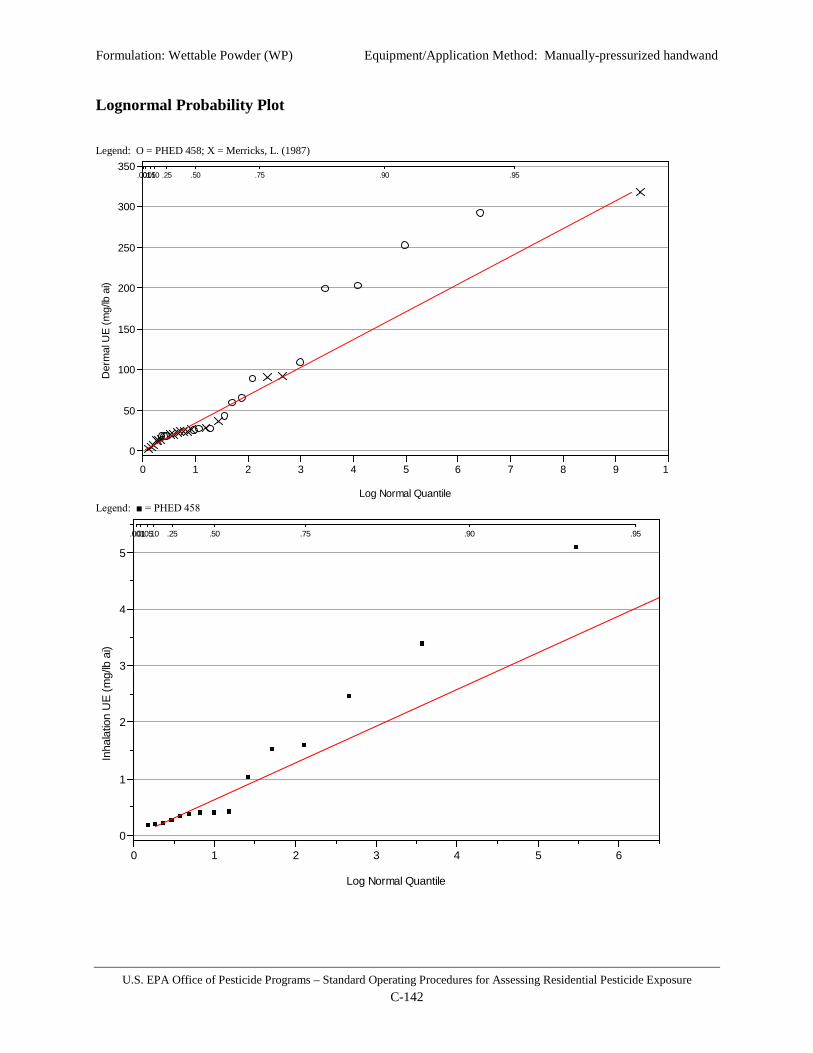
Formulation: Wettable Powder (WP) Equipment/Application Method: Manually-pressurized handwand
U.S. EPA Office of Pesticide Programs – Standard Operating Procedures for Assessing Residential Pesticide Exposure C-142
Lognormal Probability Plot Legend: O = PHED 458; X = Merricks, L. (1987)
Legend: ■ = PHED 458
Der
mal
UE
(mg/
lb a
i)
0
50
100
150
200
250
300
350.001.01.05.10 .25 .50 .75 .90 .95
0 1 2 3 4 5 6 7 8 9 10
Log Normal Quantile
Inha
latio
n U
E (m
g/lb
ai)
0
1
2
3
4
5
.001.01.05.10 .25 .50 .75 .90 .95
0 1 2 3 4 5 6
Log Normal Quantile
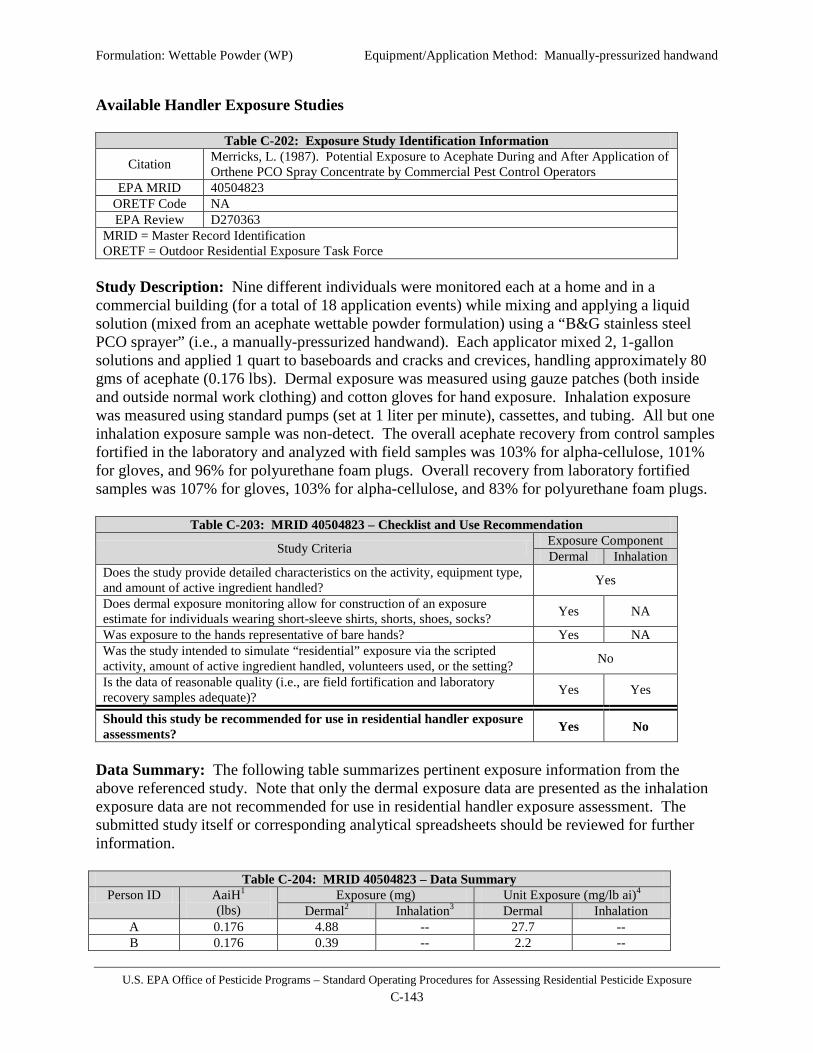
Formulation: Wettable Powder (WP) Equipment/Application Method: Manually-pressurized handwand
U.S. EPA Office of Pesticide Programs – Standard Operating Procedures for Assessing Residential Pesticide Exposure C-143
Available Handler Exposure Studies
Table C-202: Exposure Study Identification Information
Citation Merricks, L. (1987). Potential Exposure to Acephate During and After Application of Orthene PCO Spray Concentrate by Commercial Pest Control Operators
EPA MRID 40504823 ORETF Code NA EPA Review D270363
MRID = Master Record Identification ORETF = Outdoor Residential Exposure Task Force
Study Description: Nine different individuals were monitored each at a home and in a commercial building (for a total of 18 application events) while mixing and applying a liquid solution (mixed from an acephate wettable powder formulation) using a “B&G stainless steel PCO sprayer” (i.e., a manually-pressurized handwand). Each applicator mixed 2, 1-gallon solutions and applied 1 quart to baseboards and cracks and crevices, handling approximately 80 gms of acephate (0.176 lbs). Dermal exposure was measured using gauze patches (both inside and outside normal work clothing) and cotton gloves for hand exposure. Inhalation exposure was measured using standard pumps (set at 1 liter per minute), cassettes, and tubing. All but one inhalation exposure sample was non-detect. The overall acephate recovery from control samples fortified in the laboratory and analyzed with field samples was 103% for alpha-cellulose, 101% for gloves, and 96% for polyurethane foam plugs. Overall recovery from laboratory fortified samples was 107% for gloves, 103% for alpha-cellulose, and 83% for polyurethane foam plugs.
Table C-203: MRID 40504823 – Checklist and Use Recommendation
Study Criteria Exposure Component Dermal Inhalation
Does the study provide detailed characteristics on the activity, equipment type, and amount of active ingredient handled? Yes
Does dermal exposure monitoring allow for construction of an exposure estimate for individuals wearing short-sleeve shirts, shorts, shoes, socks? Yes NA
Was exposure to the hands representative of bare hands? Yes NA Was the study intended to simulate “residential” exposure via the scripted activity, amount of active ingredient handled, volunteers used, or the setting? No
Is the data of reasonable quality (i.e., are field fortification and laboratory recovery samples adequate)? Yes Yes
Should this study be recommended for use in residential handler exposure assessments? Yes No
Data Summary: The following table summarizes pertinent exposure information from the above referenced study. Note that only the dermal exposure data are presented as the inhalation exposure data are not recommended for use in residential handler exposure assessment. The submitted study itself or corresponding analytical spreadsheets should be reviewed for further information.
Table C-204: MRID 40504823 – Data Summary Person ID AaiH1
(lbs) Exposure (mg) Unit Exposure (mg/lb ai)4
Dermal2 Inhalation3 Dermal Inhalation A 0.176 4.88 -- 27.7 -- B 0.176 0.39 -- 2.2 --
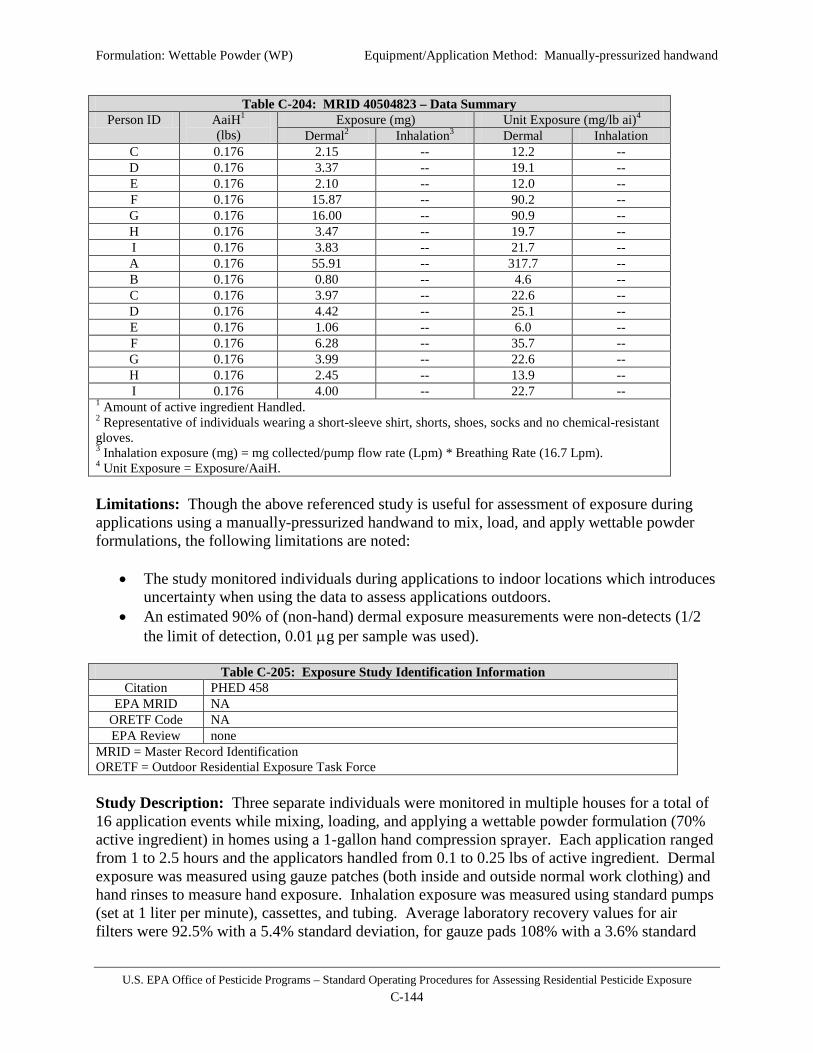
Formulation: Wettable Powder (WP) Equipment/Application Method: Manually-pressurized handwand
U.S. EPA Office of Pesticide Programs – Standard Operating Procedures for Assessing Residential Pesticide Exposure C-144
Table C-204: MRID 40504823 – Data Summary Person ID AaiH1
(lbs) Exposure (mg) Unit Exposure (mg/lb ai)4
Dermal2 Inhalation3 Dermal Inhalation C 0.176 2.15 -- 12.2 -- D 0.176 3.37 -- 19.1 -- E 0.176 2.10 -- 12.0 -- F 0.176 15.87 -- 90.2 -- G 0.176 16.00 -- 90.9 -- H 0.176 3.47 -- 19.7 -- I 0.176 3.83 -- 21.7 -- A 0.176 55.91 -- 317.7 -- B 0.176 0.80 -- 4.6 -- C 0.176 3.97 -- 22.6 -- D 0.176 4.42 -- 25.1 -- E 0.176 1.06 -- 6.0 -- F 0.176 6.28 -- 35.7 -- G 0.176 3.99 -- 22.6 -- H 0.176 2.45 -- 13.9 -- I 0.176 4.00 -- 22.7 --
1 Amount of active ingredient Handled. 2 Representative of individuals wearing a short-sleeve shirt, shorts, shoes, socks and no chemical-resistant gloves. 3 Inhalation exposure (mg) = mg collected/pump flow rate (Lpm) * Breathing Rate (16.7 Lpm). 4 Unit Exposure = Exposure/AaiH. Limitations: Though the above referenced study is useful for assessment of exposure during applications using a manually-pressurized handwand to mix, load, and apply wettable powder formulations, the following limitations are noted:
• The study monitored individuals during applications to indoor locations which introduces uncertainty when using the data to assess applications outdoors.
• An estimated 90% of (non-hand) dermal exposure measurements were non-detects (1/2 the limit of detection, 0.01 µg per sample was used).
Table C-205: Exposure Study Identification Information
Citation PHED 458 EPA MRID NA
ORETF Code NA EPA Review none
MRID = Master Record Identification ORETF = Outdoor Residential Exposure Task Force Study Description: Three separate individuals were monitored in multiple houses for a total of 16 application events while mixing, loading, and applying a wettable powder formulation (70% active ingredient) in homes using a 1-gallon hand compression sprayer. Each application ranged from 1 to 2.5 hours and the applicators handled from 0.1 to 0.25 lbs of active ingredient. Dermal exposure was measured using gauze patches (both inside and outside normal work clothing) and hand rinses to measure hand exposure. Inhalation exposure was measured using standard pumps (set at 1 liter per minute), cassettes, and tubing. Average laboratory recovery values for air filters were 92.5% with a 5.4% standard deviation, for gauze pads 108% with a 3.6% standard

Formulation: Wettable Powder (WP) Equipment/Application Method: Manually-pressurized handwand
U.S. EPA Office of Pesticide Programs – Standard Operating Procedures for Assessing Residential Pesticide Exposure C-145
deviation, for hand washes (200 µg) 99.2% with a 0.5% standard deviation, and for hand washes (1,000 µg) 97.3% with a 0.8% standard deviation. Field recovery experiments were not performed for this specific study. The registrant assumed that the indoor laboratory conditions were similar to the indoor environmental conditions of the study houses. However, temperature and humidity were not reported for the laboratory or the study houses to allow comparison of the indoor environments. Furthermore, the study report does not specify the length of time the gauze pads and hand rinse solutions were exposed to the laboratory conditions.
Table C-206: PHED 458 – Checklist and Use Recommendation
Study Criteria Exposure Component Dermal Inhalation
Does the study provide detailed characteristics on the activity, equipment type, and amount of active ingredient handled? Yes
Does dermal exposure monitoring allow for construction of an exposure estimate for individuals wearing short-sleeve shirts, shorts, shoes, socks? Yes NA
Was exposure to the hands representative of bare hands? No NA Was the study intended to simulate “residential” exposure via the scripted activity, amount of active ingredient handled, volunteers used, or the setting? No
Is the data of reasonable quality (i.e., are field fortification and laboratory recovery samples adequate)? No Yes
Should this study be recommended for use in residential handler exposure assessments? Yes Yes
Data Summary: The following table summarizes pertinent exposure information from the above referenced study. Both dermal and inhalation exposure are included since both are recommended for use in residential handler exposure assessment. The submitted study itself or corresponding analytical spreadsheets should be reviewed for further information.
Table C-207: PHED 458 – Data Summary
Person ID AaiH1 (lbs)
Exposure (mg) Unit Exposure (mg/lb ai)4 Dermal2 Inhalation3 Dermal Inhalation
A 0.09 17.78 0.296 198 3.29 A 0.08 23.82 0.413 298 5.16 A 0.13 31.63 0.306 243 2.35 A 0.09 17.75 0.035 197 0.39 B 0.16 14.09 0.251 88 1.57 B 0.09 5.17 0.132 57 1.47 B 0.22 5.94 0.083 27 0.38 B 0.22 9.49 0.071 43 0.32 B 0.24 26.21 0.095 109 0.40 B 0.13 8.52 0.135 66 1.04 C 0.11 1.94 0.022 18 0.20 C 0.09 2.39 0.038 27 0.42 C 0.13 3.48 0.032 27 0.25 C 0.11 2.02 0.022 18 0.20 C 0.13 2.35 0.023 18 0.18
1 Amount of active ingredient Handled. 2 Representative of individuals wearing a short-sleeve shirt, shorts, shoes, socks and no chemical-resistant gloves. 3 Inhalation exposure (mg) = mg collected/pump flow rate (Lpm) * Breathing Rate (16.7 Lpm). 4 Unit Exposure = Exposure/AaiH.

Formulation: Wettable Powder (WP) Equipment/Application Method: Manually-pressurized handwand
U.S. EPA Office of Pesticide Programs – Standard Operating Procedures for Assessing Residential Pesticide Exposure C-146
Limitations: Though the above referenced study is useful for assessment of exposure during applications using a manually-pressurized handwand to mix, load, and apply wettable powder formulations, the following limitations are noted:
• The study monitored individuals during applications to indoor locations which introduces uncertainty when using the data to assess applications outdoors.
• The individuals monitored wore chemical-resistant gloves; therefore back-calculation using a standard penetration factor of 90% was required.
Table C-208: Exposure Study Identification Information
Citation PHED 416 EPA MRID NA
ORETF Code NA EPA Review none
MRID = Master Record Identification ORETF = Outdoor Residential Exposure Task Force Study Description: Four individuals were monitored while spraying greenhouse ornamentals using a hand pump sprayer – the loading and mixing of the wettable powder formulation into the sprayer tank was monitored separately. Each application lasted approximately 1 hour and consisted of spraying approximately 12 tank loads (3 gallons each) and handling approximately 1.2 lbs of active ingredient. Dermal exposure was measured using gauze patches (outside and underneath long-sleeve shirt and long pants) and hand rinses. All workers wore chemical-resistant gloves. Inhalation exposure was measured using standard pumps (set at 2 liters per minute), cassettes, and tubing. Mean laboratory control and spiked samples for handwash solutions, gauze pads, and air filters are 85.4%, 97.7%, and 119.3%, respectively. The average recovery for field spike samples for handwash solutions, gauze pads, and air filters were 89.4%, 96.8%, and 104.5% respectively.
Table C-209: PHED 416 – Checklist and Use Recommendation for
Study Criteria Exposure Component Dermal Inhalation
Does the study provide detailed characteristics on the activity, equipment type, and amount of active ingredient handled? Yes
Does dermal exposure monitoring allow for construction of an exposure estimate for individuals wearing short-sleeve shirts, shorts, shoes, socks? Yes NA
Was exposure to the hands representative of bare hands? No NA Was the study intended to simulate “residential” exposure via the scripted activity, amount of active ingredient handled, volunteers used, or the setting? No
Is the data of reasonable quality (i.e., are field fortification and laboratory recovery samples adequate)? Yes Yes
Should this study be recommended for use in residential handler exposure assessments? No No
Data Summary: A summary of the data from this study is not provided since it is not recommended for use in residential handler exposure assessment. The submitted study itself should be reviewed for further information.

Formulation: Wettable Powder (WP) Equipment/Application Method: Manually-pressurized handwand
U.S. EPA Office of Pesticide Programs – Standard Operating Procedures for Assessing Residential Pesticide Exposure C-147
Limitations: Any data limitations associated with the exposure data in this study are not provided since it is not recommended for use in residential handler exposure assessment. The submitted study itself should be reviewed for further information.

Formulation: Wettable Powder (WP) Equipment/Application Method: Backpack sprayer
U.S. EPA Office of Pesticide Programs – Standard Operating Procedures for Assessing Residential Pesticide Exposure C-148
Scenario Summary
Table C-210: Scenario Description and Available Exposure Studies Formulation Wettable Powder (WP) Equipment/Application Method Backpack sprayer
Application Site(s) outdoors (lawns, gardens, trees/bushes, perimeter, mounds/nests, aquatic areas), indoors (general broadcast treatments, baseboards, cracks and crevices)
Findlay, M.L. (1998); MRID 44493001
Table C-211: Unit Exposures (mg/lb ai) – WP Backpack Sprayer Applications Statistic Dermal Inhalation
50th percentile
Studies measuring exposure while mixing/loading/applying wettable powder formulations using a backpack sprayer are available, but not recommended for
residential handler exposure assessment. Therefore, the exposure studies recommended for mixing/loading/applying wettable powder formulations
using a manually-pressurized handwand should be used as a surrogate.
75th percentile 95th percentile 99th percentile 99.9th percentile AM (SD) GM (GSD) Range N Dermal Unit Exposure Summary: Dermal exposure monitoring data for applications of wettable powder formulations using backpack sprayer is available but not recommended for use in residential exposure assessments; dermal unit exposures for applications of wettable powder pesticide formulations using a manually-pressurized handwand are recommended as surrogate data. Inhalation Unit Exposure Summary: Inhalation exposure monitoring data for applications of wettable powder formulations using backpack sprayer is available but not recommended for use in residential exposure assessments; inhalation unit exposures for applications of wettable powder pesticide formulations using a manually-pressurized handwand are recommended as surrogate data.
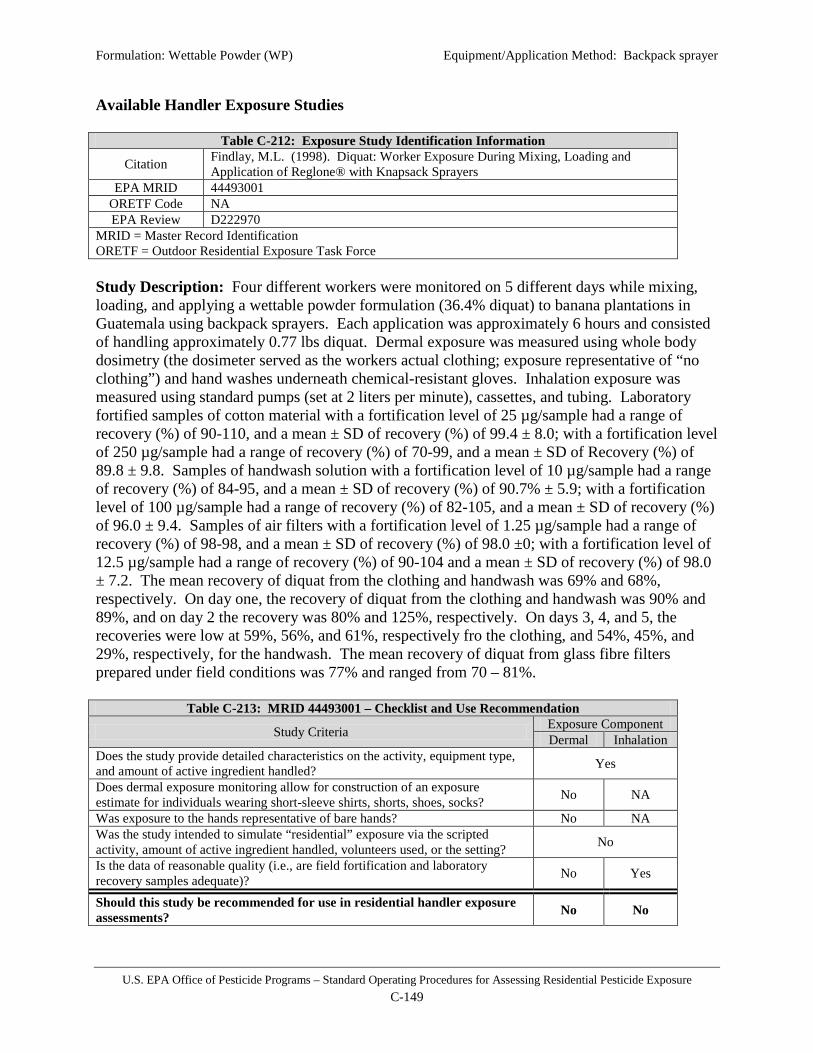
Formulation: Wettable Powder (WP) Equipment/Application Method: Backpack sprayer
U.S. EPA Office of Pesticide Programs – Standard Operating Procedures for Assessing Residential Pesticide Exposure C-149
Available Handler Exposure Studies
Table C-212: Exposure Study Identification Information
Citation Findlay, M.L. (1998). Diquat: Worker Exposure During Mixing, Loading and Application of Reglone® with Knapsack Sprayers
EPA MRID 44493001 ORETF Code NA EPA Review D222970
MRID = Master Record Identification ORETF = Outdoor Residential Exposure Task Force Study Description: Four different workers were monitored on 5 different days while mixing, loading, and applying a wettable powder formulation (36.4% diquat) to banana plantations in Guatemala using backpack sprayers. Each application was approximately 6 hours and consisted of handling approximately 0.77 lbs diquat. Dermal exposure was measured using whole body dosimetry (the dosimeter served as the workers actual clothing; exposure representative of “no clothing”) and hand washes underneath chemical-resistant gloves. Inhalation exposure was measured using standard pumps (set at 2 liters per minute), cassettes, and tubing. Laboratory fortified samples of cotton material with a fortification level of 25 µg/sample had a range of recovery (%) of 90-110, and a mean ± SD of recovery (%) of 99.4 ± 8.0; with a fortification level of 250 µg/sample had a range of recovery (%) of 70-99, and a mean ± SD of Recovery (%) of 89.8 ± 9.8. Samples of handwash solution with a fortification level of 10 µg/sample had a range of recovery (%) of 84-95, and a mean ± SD of recovery (%) of 90.7% ± 5.9; with a fortification level of 100 µg/sample had a range of recovery (%) of 82-105, and a mean ± SD of recovery (%) of 96.0 ± 9.4. Samples of air filters with a fortification level of 1.25 µg/sample had a range of recovery (%) of 98-98, and a mean ± SD of recovery (%) of 98.0 ±0; with a fortification level of 12.5 µg/sample had a range of recovery (%) of 90-104 and a mean ± SD of recovery (%) of 98.0 ± 7.2. The mean recovery of diquat from the clothing and handwash was 69% and 68%, respectively. On day one, the recovery of diquat from the clothing and handwash was 90% and 89%, and on day 2 the recovery was 80% and 125%, respectively. On days 3, 4, and 5, the recoveries were low at 59%, 56%, and 61%, respectively fro the clothing, and 54%, 45%, and 29%, respectively, for the handwash. The mean recovery of diquat from glass fibre filters prepared under field conditions was 77% and ranged from 70 – 81%.
Table C-213: MRID 44493001 – Checklist and Use Recommendation
Study Criteria Exposure Component Dermal Inhalation
Does the study provide detailed characteristics on the activity, equipment type, and amount of active ingredient handled? Yes
Does dermal exposure monitoring allow for construction of an exposure estimate for individuals wearing short-sleeve shirts, shorts, shoes, socks? No NA
Was exposure to the hands representative of bare hands? No NA Was the study intended to simulate “residential” exposure via the scripted activity, amount of active ingredient handled, volunteers used, or the setting? No
Is the data of reasonable quality (i.e., are field fortification and laboratory recovery samples adequate)? No Yes
Should this study be recommended for use in residential handler exposure assessments? No No

Formulation: Wettable Powder (WP) Equipment/Application Method: Backpack sprayer
U.S. EPA Office of Pesticide Programs – Standard Operating Procedures for Assessing Residential Pesticide Exposure C-150
Data Summary: A summary of the data from this study is not provided since it is not recommended for use in residential handler exposure assessment. The submitted study itself should be reviewed for further information. Limitations: Any data limitations associated with the exposure data in this study are not provided since it is not recommended for use in residential handler exposure assessment. The submitted study itself should be reviewed for further information.
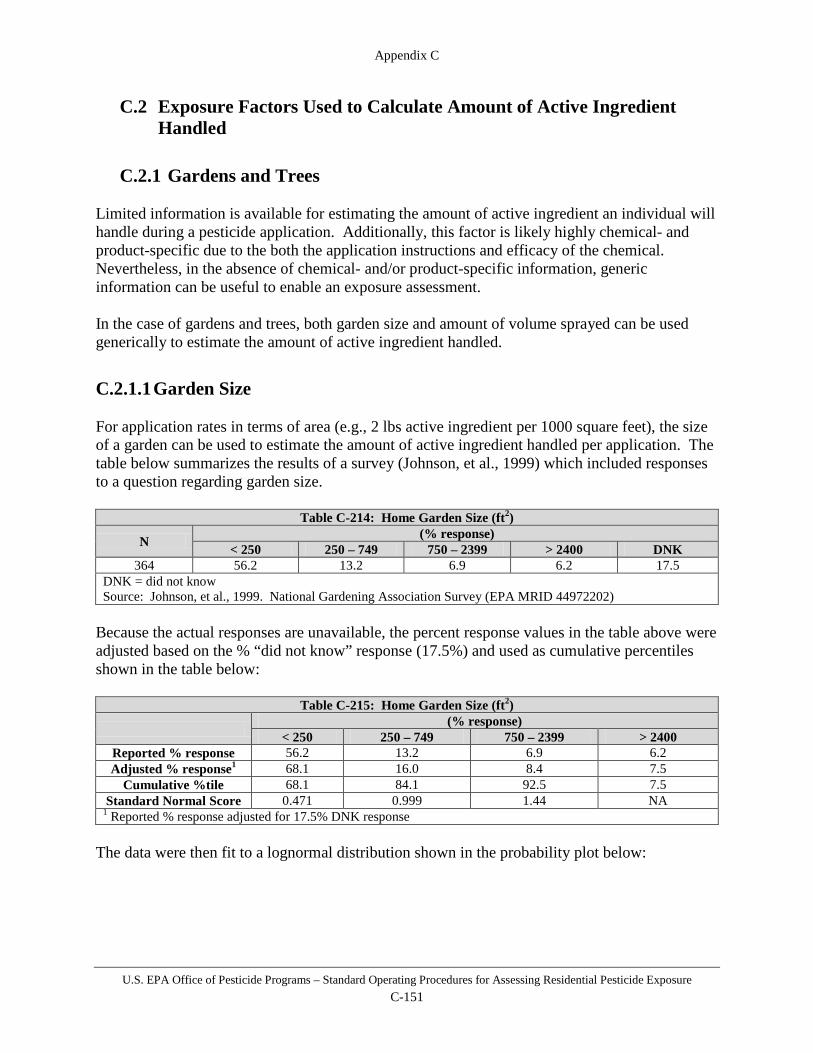
Appendix C
U.S. EPA Office of Pesticide Programs – Standard Operating Procedures for Assessing Residential Pesticide Exposure C-151
C.2 Exposure Factors Used to Calculate Amount of Active Ingredient Handled
C.2.1 Gardens and Trees Limited information is available for estimating the amount of active ingredient an individual will handle during a pesticide application. Additionally, this factor is likely highly chemical- and product-specific due to the both the application instructions and efficacy of the chemical. Nevertheless, in the absence of chemical- and/or product-specific information, generic information can be useful to enable an exposure assessment. In the case of gardens and trees, both garden size and amount of volume sprayed can be used generically to estimate the amount of active ingredient handled.
C.2.1.1 Garden Size For application rates in terms of area (e.g., 2 lbs active ingredient per 1000 square feet), the size of a garden can be used to estimate the amount of active ingredient handled per application. The table below summarizes the results of a survey (Johnson, et al., 1999) which included responses to a question regarding garden size.
Table C-214: Home Garden Size (ft2)
N (% response) < 250 250 – 749 750 – 2399 > 2400 DNK
364 56.2 13.2 6.9 6.2 17.5 DNK = did not know Source: Johnson, et al., 1999. National Gardening Association Survey (EPA MRID 44972202)
Because the actual responses are unavailable, the percent response values in the table above were adjusted based on the % “did not know” response (17.5%) and used as cumulative percentiles shown in the table below:
Table C-215: Home Garden Size (ft2)
(% response) < 250 250 – 749 750 – 2399 > 2400
Reported % response 56.2 13.2 6.9 6.2 Adjusted % response1 68.1 16.0 8.4 7.5
Cumulative %tile 68.1 84.1 92.5 7.5 Standard Normal Score 0.471 0.999 1.44 NA
1 Reported % response adjusted for 17.5% DNK response The data were then fit to a lognormal distribution shown in the probability plot below:

Appendix C
U.S. EPA Office of Pesticide Programs – Standard Operating Procedures for Assessing Residential Pesticide Exposure C-152
Summary statistics based on the above distribution area provided in the table below.
Table C-216: Statistical Summary – Garden Size (ft2) 50th percentile 80 75th percentile 385 90th percentile 1583 95th percentile 3690 99th percentile 18043 99.9th percentile 106887 AM (SD) 1205 (18109) GM (GSD) 80 (10.3) Range unknown N 364 AM (SD) = arithmetic mean (standard deviation) GM (GSD) = geometric mean (geometric standard deviation)
C.2.1.2 Hose-end Sprayer Application Volumes An estimate for the amount of spray solution volume sprayed is necessary if the application rate is used in terms of active ingredient per volume solution. Such a rate would be used for spraying trees where an “area-based” approach would not be appropriate or useful. However, this factor is likely application method-specific (i.e., one might apply more solution using a hose-end sprayer than a sprinkler can) and explicit information on volumes sprayed in home applications is unavailable. For hose-end sprayers, application volume was derived from a study measuring exposure during applications of liquid formulations to fruit trees and ornamental shrubs using a hose-end sprayer
Garden Size (ft2)Lognormal Probability Plot
5.00
5.50
6.00
6.50
7.00
7.50
8.00
0.00 0.20 0.40 0.60 0.80 1.00 1.20 1.40 1.60
Standard Normal Score
ln G
arde
n Si
ze (f
t2 )
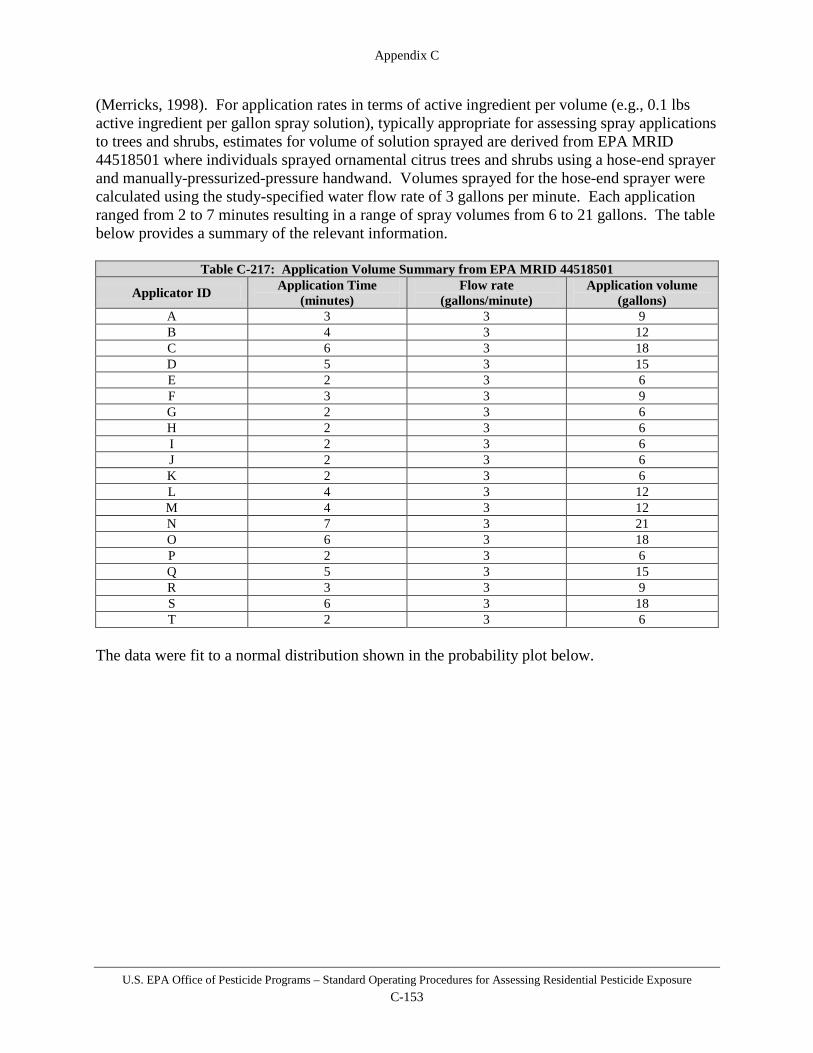
Appendix C
U.S. EPA Office of Pesticide Programs – Standard Operating Procedures for Assessing Residential Pesticide Exposure C-153
(Merricks, 1998). For application rates in terms of active ingredient per volume (e.g., 0.1 lbs active ingredient per gallon spray solution), typically appropriate for assessing spray applications to trees and shrubs, estimates for volume of solution sprayed are derived from EPA MRID 44518501 where individuals sprayed ornamental citrus trees and shrubs using a hose-end sprayer and manually-pressurized-pressure handwand. Volumes sprayed for the hose-end sprayer were calculated using the study-specified water flow rate of 3 gallons per minute. Each application ranged from 2 to 7 minutes resulting in a range of spray volumes from 6 to 21 gallons. The table below provides a summary of the relevant information.
Table C-217: Application Volume Summary from EPA MRID 44518501
Applicator ID Application Time (minutes)
Flow rate (gallons/minute)
Application volume (gallons)
A 3 3 9 B 4 3 12 C 6 3 18 D 5 3 15 E 2 3 6 F 3 3 9 G 2 3 6 H 2 3 6 I 2 3 6 J 2 3 6 K 2 3 6 L 4 3 12 M 4 3 12 N 7 3 21 O 6 3 18 P 2 3 6 Q 5 3 15 R 3 3 9 S 6 3 18 T 2 3 6
The data were fit to a normal distribution shown in the probability plot below.
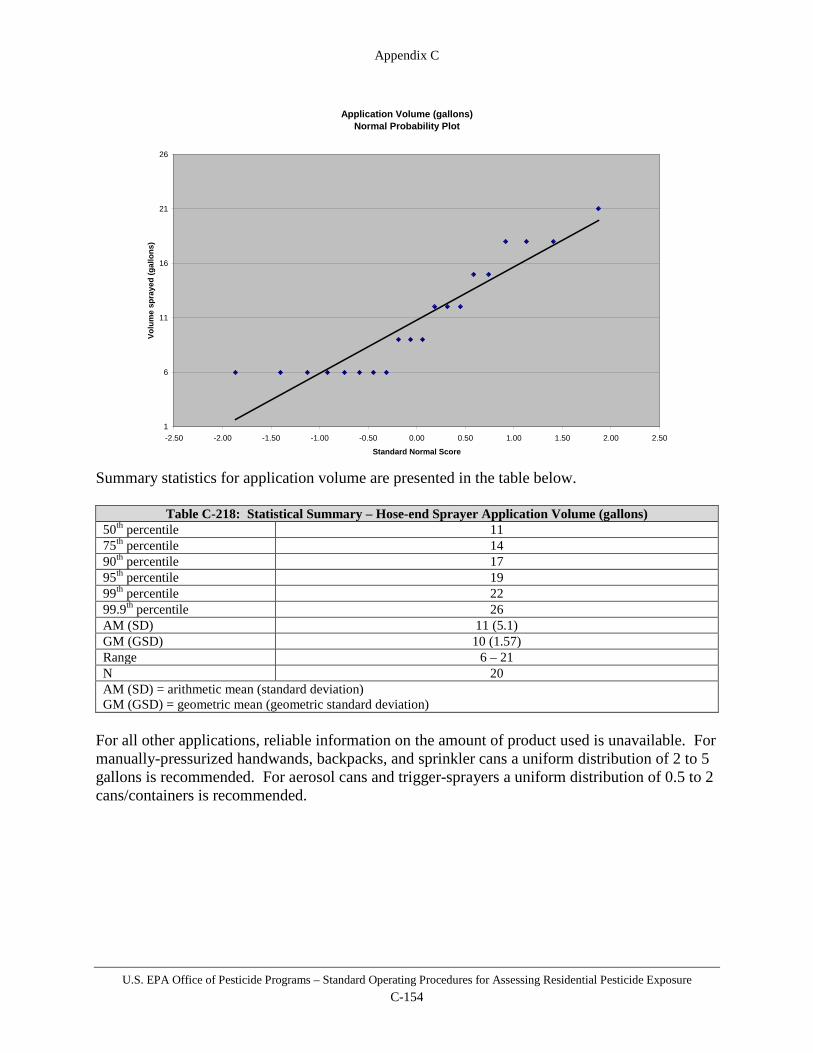
Appendix C
U.S. EPA Office of Pesticide Programs – Standard Operating Procedures for Assessing Residential Pesticide Exposure C-154
Summary statistics for application volume are presented in the table below.
Table C-218: Statistical Summary – Hose-end Sprayer Application Volume (gallons) 50th percentile 11 75th percentile 14 90th percentile 17 95th percentile 19 99th percentile 22 99.9th percentile 26 AM (SD) 11 (5.1) GM (GSD) 10 (1.57) Range 6 – 21 N 20 AM (SD) = arithmetic mean (standard deviation) GM (GSD) = geometric mean (geometric standard deviation)
For all other applications, reliable information on the amount of product used is unavailable. For manually-pressurized handwands, backpacks, and sprinkler cans a uniform distribution of 2 to 5 gallons is recommended. For aerosol cans and trigger-sprayers a uniform distribution of 0.5 to 2 cans/containers is recommended.
Application Volume (gallons)Normal Probability Plot
1
6
11
16
21
26
-2.50 -2.00 -1.50 -1.00 -0.50 0.00 0.50 1.00 1.50 2.00 2.50
Standard Normal Score
Volu
me
spra
yed
(gal
lons
)

Appendix D
U.S. EPA Office of Pesticide Programs – Standard Operating Procedures for Assessing Residential Pesticide Exposure D-1
Appendix D Supporting Data Analysis and Documentation for Residential Post-Application Exposure Assessment
D.1 Indoor Fogger Settling Time
For indoor foggers, post-application inhalation exposure is not anticipated because the fogger labels typically require re-entry restrictions. If necessary, the time needed for particle settling can be calculated using Stokes law. The settling velocity (in m/s) is calculated as a function of the droplet diameter (m), the particle density (kg/m3), the gravity constant (m/s2) and the viscosity of air (kg/m-s). Information provided by manufacturers indicates that the particle size distribution for most total release foggers ranges from 15 micrometers (µm) to 60 µm. According to calculations of settling time versus droplet size, it will take 2 hours for a 15 micrometer particle to settle and 8 minutes for a 60 micrometer particle to settle from an eight-foot ceiling height, assuming 1% non-volatile ingredients. This calculation is based on the assumption that a 15 micrometer droplet will decrease to a 3 micrometer nuclei and a 60 micrometer droplet will decrease to a 13 micrometer nuclei due to evaporation.
Table D-1: Droplet Diameter After Evaporation (i.e., nuclei diameter) Drop Diameter
(µm) Drop Radius
(µm)a % Non-
volatilesb Drop Volume
(µm3)c Nuclei Volume
(µm3)d Nuclei Radius
(µm)e Nuclei Diameter
(µm)f 1 0.5 1% 1 0.01 0.11 0.22
5 2.5 1% 65 1 1 1
10 5 1% 523 5 1 2
15 7.5 1% 1766 18 2 3 20 10 1% 4187 42 2 4
30 15 1% 14130 141 3 6
40 20 1% 33493 335 4 9
50 25 1% 65417 654 5 11
60 30 1% 113040 1130 6 13 70 35 1% 179503 1795 8 15
80 40 1% 267947 2679 9 17
90 45 1% 381510 3815 10 19
100 50 1% 523333 5233 11 22 a. Drop radius = drop diameter / 2 b. Nuclei = non-volatile portion of droplet; assume percent non-volatiles of pesticide particle = 1% c. Volume of sphere = 4/3 * π * (r^3) d. Nuclei volume = drop volume * percent non-volatiles e. Nuclei radius = (nuclei volume / (1.33 * π ))^0.333 f. Nuclei diameter = nuclei radius * 2
Table D-2: Settling Time
Drop Diameter
(µm)
Nuclei Diameter Density of particles (kg/m3)b
Gravity constant (m/s2)
Viscosity of air
(kg/m-s @ 25oC)
Settling Velocity
(m/s)c
Settling Time (Release Height = 8 feet)
µm ma Secondsd Minutese Hoursf
1 0.22 2.2E-07 1000 9.807 1.86E-05 1.4E-06 1782494 29708 495
5 1.08 1.1E-06 1000 9.807 1.86E-05 3.4E-05 71530 1192 20

Appendix D
U.S. EPA Office of Pesticide Programs – Standard Operating Procedures for Assessing Residential Pesticide Exposure D-2
Table D-2: Settling Time
Drop Diameter
(µm)
Nuclei Diameter Density of particles (kg/m3)b
Gravity constant (m/s2)
Viscosity of air
(kg/m-s @ 25oC)
Settling Velocity
(m/s)c
Settling Time (Release Height = 8 feet)
µm ma Secondsd Minutese Hoursf
10 2.16 2.2E-06 1000 9.807 1.86E-05 1.4E-04 17907 298 5
15 3.23 3.2E-06 1000 9.807 1.86E-05 3.1E-04 7965 133 2 20 4.31 4.3E-06 1000 9.807 1.86E-05 5.4E-04 4483 75 1
30 6.46 6.5E-06 1000 9.807 1.86E-05 1.2E-03 1994 33 1
40 8.61 8.6E-06 1000 9.807 1.86E-05 2.2E-03 1122 19 0.3
50 10.76 1.1E-05 1000 9.807 1.86E-05 3.4E-03 719 12 0.2
60 12.91 1.3E-05 1000 9.807 1.86E-05 4.9E-03 499 8 0.14 70 15.06 1.5E-05 1000 9.807 1.86E-05 6.6E-03 367 6 0.10
80 17.21 1.7E-05 1000 9.807 1.86E-05 8.7E-03 281 5 0.08
90 19.36 1.9E-05 1000 9.807 1.86E-05 1.1E-02 222 4 0.06
100 21.51 2.2E-05 1000 9.807 1.86E-05 1.4E-02 180 3 0.05
150 32.25 3.2E-05 1000 9.807 1.86E-05 3.0E-02 80 1 0.02
200 42.99 4.3E-05 1000 9.807 1.86E-05 5.4E-02 45 1 0.013
300 64.46 6.4E-05 1000 9.807 1.86E-05 1.2E-01 20 0.3 0.006
400 85.93 8.6E-05 1000 9.807 1.86E-05 2.2E-01 11 0.2 0.003
500 107.38 1.1E-04 1000 9.807 1.86E-05 3.4E-01 7 0.1 0.002 a. 1 µm = 1 x 10⁻⁶ m b. Assumption based on literature search: (1) Bennett and Furtaw. 2004. Fugacity-Based Indoor Residential Pesticide Fate Model. Environmental Science & Technology, 38 (7): 2142-2152. (2) Lai and Nazaroff. 2000. Modeling Indoor Particle Deposition from Turbulent Flow onto Smooth Surfaces. J. Aerosol Sci. 31 (4): 463-476. (3) Riley et al. 2002. Indoor Particulate Matter of Outdoor Origin: Importance of Size-Dependent Removal Mechanisms. 36: 200-207. c. Settling velocity (m/s) = [(density of particle, kg/m3) * (nuclei diameter, m)2 * (gravity constant, m/s2)] / [18 * (viscosity of air, kg/m-s)] d. Settling time from height of 8 feet in seconds = [8 ft * (0.3048 m/ft)] * (settling velocity, m/s) e. Settling time in minutes = settling time in seconds / 60 f. Settling time in hours = settling time in minutes / 60
D.2 Background on Multi-Chamber Concentration and Exposure Model (MCCEM)
Indoor air concentrations can be calculated using a computer model, Multi- Chamber Concentration and Exposure Model (MCCEM). MCCEM is a model that is capable of calculating indoor air concentrations for various exposure durations. MCCEM contains a database of various default house data, such as air exchange rates, geographically based inter-room air flows, and house/room volumes. Unique house specifications may also be created according to the scenario being assessed. Chemical source emission rates of pollutants are entered into the model and MCCEM can account for removal processes and the contribution of outdoor concentrations. The model is also capable of performing sensitivity analyses and Monte Carlo analyses. However, because this SOP is focused on high-end assessments, only the aspects of MCCEM determined to produce high end results are addressed herein. The essential aspects of MCCEM that must be defined to complete a high-end assessment include the following:
• type of house (selection based on number of stories and house volume),

Appendix D
U.S. EPA Office of Pesticide Programs – Standard Operating Procedures for Assessing Residential Pesticide Exposure D-3
• definition of zones for selected house (single or multi-zone up to 4 indoor zones), • selection of model (run time and reporting intervals), • selection/calculation of appropriate emission rate inputs for chemical/product, and • selection of removal processes for the chemical/product (presence of sinks).
Input parameters can be adjusted according to scenarios unique to specific assessments, however, Table D-3 includes MCCEM parameters that are appropriate for a high-end calculation. MCCEM requires further input to operate the model.
Table D-3: High-end Scenario Guidance for MCCEM
Use Scenario
House Selection (GN001) Chamber
Type (Number Zones)b
Durationc (days) Emissions Parametersd MCCEM
Decay Ratee
House Type/
Season
Air Exchange
Ratea (xch/hr)
Run Time (days)
Time Steps (hours)
Type
Rate Acute Chronic
Total Release Aerosolf
Generic/ Summer 0.18 Multi (2) 90 1 24 Instant
Release Total/hr 0
Indoor Space Spraysf
Generic/ Summer 0.18 Multi (2) 90 1 24 Instant
Release Total/h 0
Broadcast Generic/ Summer 0.18 Multi (2) 90 1 24 Chinn
Evaporation Chinn Rate 0
Perimeter Generic/ Summer 0.18 Multi (2) 90 1 24 Chinn
Evaporation Chinn Rate 0
Crack and Crevice
Generic/ Summer 0.18 Single (1) 90 1 24 Chinn
Evaporation Chinn Rate 0
Termiticides Generic/ Summer 0.18 Single (1) 365 Chinn
Evaporation Chinn Rate 0
Carpet Dusting Generic/ Summer 0.18 Multi (2) 90 1 24 Chinn
Evaporation Chinn Rate 0
a. The value of 0.18 ACH corresponds to the 10th percentile of the estimated national distribution for residential air exchange rates. (U.S. EPA 2011).
b. Chamber type is reflected in the house selection and must correlate with the Execution Mode (Step 8). c. Duration refers to the length of time that the chemical exposure concentration is modeled, as well as the time steps for recording the
calculated exposure concentration. d. Instant release represents when a chemical is "thrown up" in the air of a residence as an aerosol immediately -- less than 1 hour; Chinn
Evaporation is when a pesticide offgasses from the treated surfaces for several weeks; See Step 3 and the associated Figure D-1 below for details concerning the calculation of Chinn release emission rates.
e. Decay rate is chemical specific. For high-end estimates the chemical is considered non-reactive. f. These two use scenarios include the use of aerosol sprays for which this model may be an overestimation of air concentrations. Step-by-step procedures for completing a high-end assessment using MCCEM Version 1.2 are presented below. Step 1: House Tab: Select the "Generic House" (House Code: GN001) option within the
Residence Type section. This provides a conservative air exchange rate of 0.18 ACH.
Step 2: Run Time: The long-term model is appropriate for all high-end assessments. For
the purposes of this SOP, 1-hour steps should be used for an acute endpoint while a 24-hour step should be used for a longer-term endpoint.

Appendix D
U.S. EPA Office of Pesticide Programs – Standard Operating Procedures for Assessing Residential Pesticide Exposure D-4
Step 3: Emission Rate & Exposure Zone Inputs: For the high-end assessment requirement, select “Constant” as the source model definition. Two emission mechanisms may be inputted for the constant emissions rate:
For instant release scenarios, the emissions rate is calculated as the mass of product released per hour.
For the Chinn type or long-term emission (e.g., offgassing from treated surfaces for several weeks), the emission rate is calculated based on an empirical relationship between evaporation time, vapor pressure, and molecular weight (Chinn, 1981). The equations used to calculate a Chinn Type emission rate and an example calculation are presented in Figure D-1.
Step 4: Sinks: No inputs are entered in this field. Unless information regarding the
absorption rate and sink area for reversible and/or irreversible sinks are available to characterize the sink, the chemical is considered to be nonreactive.
Step 5: Activities: No contributions of occupant activities or breathing rates are entered. Step 6: Dose: Dose is not calculated for high end estimates for the purposes of this SOP.
No values are inputted. Step 7: Monte Carlo Options: Ensure that “Apply Model Once” and “Randomly Select
Seed” are selected. Monte Carlo Assessments are not conducted for the purpose of a high-end assessment.
Step 8: Options: Ensure that “Use Interzonal Airflow Rates Provided” (“Single Chamber
Model” may be run if the application is throughout all rooms in the house) and the appropriate “Output Concentration Units” are selected. Unless initial concentration data exists, input parameters should be “0”.
Step 9: Execute the Model: Run the model and save the output and data (.csv) files for
review purposes.

Appendix D
U.S. EPA Office of Pesticide Programs – Standard Operating Procedures for Assessing Residential Pesticide Exposure D-5
Selection of the proper air concentration value (ACt) from MCCEM to be used in the exposure assessment depends on the inhalation toxicological endpoint (i.e., acute or chronic). The "average concentration in the Zone 1" is selected for an acute endpoint. This value is used even if a multi-chamber model run is completed because Zone 1 will have slightly higher concentration values as it will always be designated as the release zone. If the endpoint is chronic, the “Time-Weighted-Average (TWA)" value is selected for Zone 1.
Figure D-1: Calculation of Chinn Release Emission Rates Calculate the mass of active ingredient applied (m) in grams during a single application event. Next calculate the Chinn Evaporation time using the following formula (Chinn, 1981):
( ) 9546.0*145vpmw
d =
where:
d = Chinn evaporation time (hr); mw = molecular weight of pesticide active ingredient (unitless); and vp = vapor pressure (torr).
Finally, calculate the emission rate (g/hr) using the following formula
dmwer =
Example: 3 gallons of solution containing 500 grams of ai with a vapor pressure of 5x10⁻⁴ torr and a molecular weight of 500 are applied in a typical crack-and-crevice scenario, then:
( )hoursd 545
10*5*500
1459546.04
==−
and
hourgramser 91.0
545500
==

Appendix D
U.S. EPA Office of Pesticide Programs – Standard Operating Procedures for Assessing Residential Pesticide Exposure D-6
D.3 Background on Well-Mixed Box Model
D.3.1 Outdoor Fogging/Misting Systems - Aerosol Spray Area Foggers The well-mixed box (WMB) model was used to develop the exposure equation (5.5) for the aerosol spray area foggers post-application inhalation scenario. The WMB was used to model pesticide air concentrations within an enclosed, fixed volume (i.e. a box) over time after an initial aerosol spray application of an area fogger. The WMB model incorporates a number of simplifying assumptions: fresh air (having zero pesticide concentration) enters the box at a constant airflow rate, a turbulent internal airflow thoroughly mixes the fresh air with the pesticide-laden air resulting in a uniform pesticide air concentration within the box, and the perfectly mixed air exits the box at the same constant airflow rate (i.e. the inflow rate equals the outflow rate). Thus the outdoor area where the aerosol is being applied is assumed to be in an enclosed box, therefore, using the WMB model is conservative for estimation of exposures for an open patio or deck. The removal of the aerosol from the box depends on airflow. For an outdoor scenario, the airflow, Q, is the product of the cross-sectional area and the wind velocity. The WMB model developed for this scenario models the pesticide air concentrations after an initial, instantaneous release of an aerosol spray area repellant. Only dissipation due to airflow into and out of the box is modeled. The mass balance within the box can be described by the following differential equation: where C is the air concentration, Q is the airflow (the product of the cross-sectional area of the box and the wind speed), and V is the volume of the box. Integrating the differential equation and simplifying and combining terms yields an equation describing the air concentration over time.
CQdtdCV ⋅−=
dtVQ
CdC
−=
∫∫ −= dtVQ
CdC
atVQC +−=)ln(
atVQ
C ee+−
=)ln(

Appendix D
U.S. EPA Office of Pesticide Programs – Standard Operating Procedures for Assessing Residential Pesticide Exposure D-7
where A = ea is a constant whose value is determined by the initial condition that at time t = 0, the pesticide air concentration is equal to initial air concentration, i.e. C(0) = C0. Based on this initial constraint, the WMB model described above for modeling pesticide air concentrations over time can be written as follows: (D.1) where C(t) is the air concentration at time t, C0 is the initial air concentration (i.e. concentration at time t=0), Q is the airflow (the product of the cross-sectional area of the box and the wind speed), and V is the volume of the box. The air concentration equation (D.1) is then used to calculate the exposure, E: (D.2) The exposure, E is based on integrating equation (D.1) over the exposure time, ET which is then multiplied by an inhalation rate, IR. The final exposure equation is derived from equation (D.2) by performing the integration and simplifying terms.
(D.3)
The term ET
VQ
e−
in equation (D.3) represents the fraction of the initial concentration, C0 present in the treated area at the end of the exposure time, ET. To the extent that the pesticide rapidly dissipates, this term will rapidly approach zero. For this scenario, the assumed volume of the outdoor treated space is 20 × 20 × 8 ft3 and the minimum flow rate is 52.5 ft3/sec, which based on the minimum air velocity of 0.1 m/s and the cross sectional area of 20 × 8 ft2 (~15 m2) from
Table 5-3. Given these values for V and Q, one can determine the time after which the term t
VQ
e−
would be less than 0.001 (i.e. the time after which less than 0.1% of the original concentration remains).
dteCIREET t
VQ
∫−
=0
0
dtC(t)IREET
∫=0
tVQ
eCC(t)−
= 0
( ) ( )
−
−
⋅=−− 0
01 V
QETVQ
eeV
QCIRE
( )
−
⋅=
− ETVQ
eV
QCIRE 10
( ) mft
sm ft ft Q ftftftV 28.31.0820 ; 82020 ×××=××=

Appendix D
U.S. EPA Office of Pesticide Programs – Standard Operating Procedures for Assessing Residential Pesticide Exposure D-8
The above calculation demonstrates that after an exposure time of about 7 minutes, less than 0.1% of the initial concentration would be left in the treated space. This implies that the released pesticide fog would be almost completely dissipated for any significant exposure time.
Therefore the term ET
VQ
e−
in equation (D.3) approaches zero very quickly, and the exposure equation can be simplified to:
(D.4) The initial concentration, C0, can be replaced by the term application rate, AR (which is specified to have units mg-AI/day for this scenario) divided by V, the volume of the treated space. Thus equation (D.4) can be rewritten as:
After canceling out the volume terms, the final exposure equation can be expressed as:
(D.5)
VQ
VARIR
E⋅
=
QARIRE ⋅
=
VQ
CIRE 0⋅=
( ) ( )Q
VttVQe
tVQ ×
−=⇒=−⇒=− 001.0ln001.0ln001.0
( ) ( )( )
min 7.02sec 42128.31.0820
82020001.0ln==
×××
×××−=
mft
sm ft ft
ftftftt

Appendix D
U.S. EPA Office of Pesticide Programs – Standard Operating Procedures for Assessing Residential Pesticide Exposure D-9
D.3.2 Outdoor Fogging/Misting Systems - Candles, Coils, Torches, and Mats (CCTM)
The well-mixed box (WMB) model was used to develop exposure equation (5.12) for the candles, coils, torches, and mats (CCTM) post-application inhalation scenario. The CCTM scenario differs from the other exposure scenarios in this Outdoor Fogging/Misting System SOP section in that the WMB model includes a constant emission rate term during the exposure time and thus results in a more complicated exposure equation. The WMB was used to model pesticide air concentrations within an enclosed, fixed volume (i.e. a box) over time during the constant emission of a pesticide from a CCTM product. The WMB model incorporates a number of simplifying assumptions: fresh air (having zero pesticide concentration) enters the box at a constant airflow rate, a turbulent internal airflow thoroughly mixes the fresh air with the pesticide-laden air resulting in a uniform pesticide air concentration within the box, and the perfectly mixed air exits the box at the same constant airflow rate (i.e. the inflow rate equals the outflow rate). Thus the outdoor area where the aerosol is being applied is assumed to be in an enclosed box, therefore, using the WMB model is conservative for estimation of exposures for an open patio or deck. The removal of the CCTM emission from the box depends on airflow. For an outdoor scenario, the airflow, Q is the product of the cross-sectional area and the wind velocity. The WMB model developed for this scenario models the pesticide air concentrations during a constant emission of pesticide from a CCTM product. Only constant emission and dissipation due to airflow into and out of the box is modeled. The mass balance within the box can be described by the following differential equation: where C is the air concentration, VE is the vaporization efficiency, ER is the emission rate, Q is the airflow (the product of the cross-sectional area of the box and the wind speed), and V is the volume of the box. Based on the method of undetermined coefficients, the solution to this differential equation has the form:
CQERVdtdCV E ⋅−⋅=
CVQ
VERV
dtdC E ⋅−
⋅=
tVQE
eA
VQV
ERV
tC−
⋅−
⋅
=)(
tVQ
E eAQ
ERVtC−
⋅−⋅
=)(
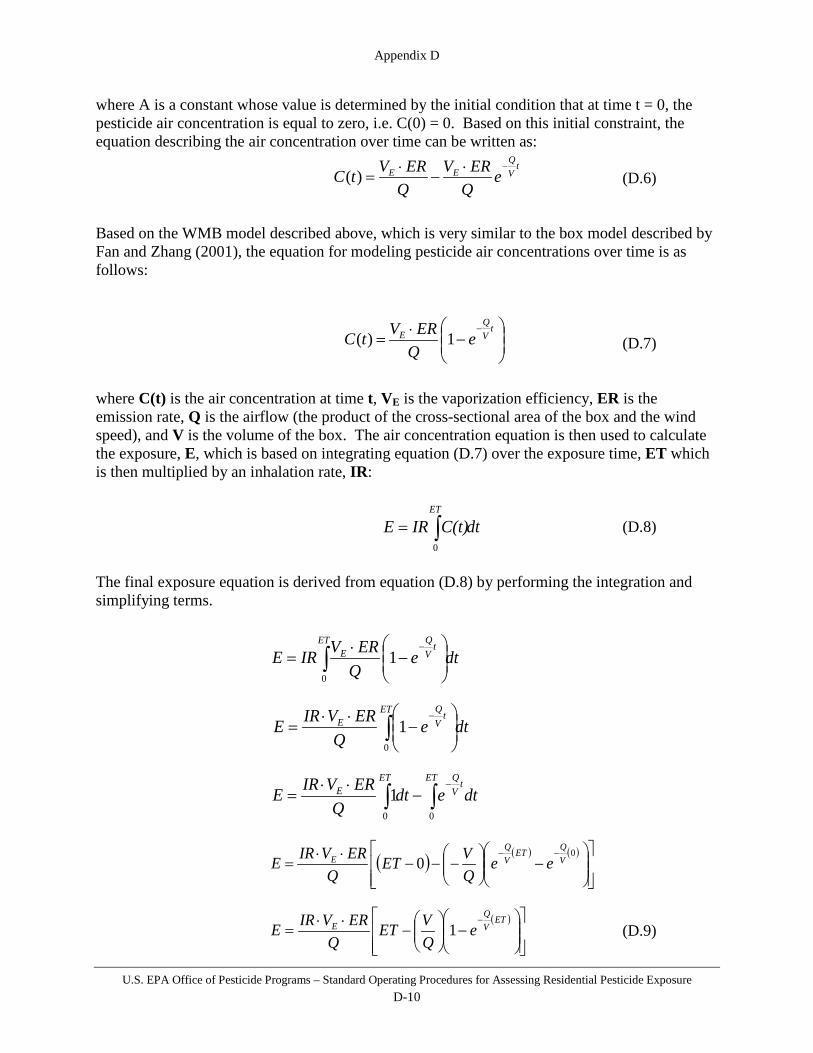
Appendix D
U.S. EPA Office of Pesticide Programs – Standard Operating Procedures for Assessing Residential Pesticide Exposure D-10
where A is a constant whose value is determined by the initial condition that at time t = 0, the pesticide air concentration is equal to zero, i.e. C(0) = 0. Based on this initial constraint, the equation describing the air concentration over time can be written as:
(D.6) Based on the WMB model described above, which is very similar to the box model described by Fan and Zhang (2001), the equation for modeling pesticide air concentrations over time is as follows: (D.7) where C(t) is the air concentration at time t, VE is the vaporization efficiency, ER is the emission rate, Q is the airflow (the product of the cross-sectional area of the box and the wind speed), and V is the volume of the box. The air concentration equation is then used to calculate the exposure, E, which is based on integrating equation (D.7) over the exposure time, ET which is then multiplied by an inhalation rate, IR: (D.8) The final exposure equation is derived from equation (D.8) by performing the integration and simplifying terms.
(D.9)
−
⋅=
− tVQ
E eQ
ERVtC 1)(
dteQ
ERVIREET t
VQ
E ∫
−
⋅⋅=
−
0
1
dtedtQ
ERVIREET t
VQET
E ∫∫−
−⋅⋅
=00
1
dtC(t)IREET
∫=0
dteQ
ERVIREET t
VQ
E∫
−
⋅=
−
0
1
tVQ
EE eQ
ERVQ
ERVtC−⋅
−⋅
=)(
( ) ( ) ( )
−
−−−
⋅⋅=
−− 00 V
QETVQ
E eeQVET
QERVIRE
( )
−
−
⋅⋅=
− ETVQ
E eQVET
QERVIRE 1

Appendix D
U.S. EPA Office of Pesticide Programs – Standard Operating Procedures for Assessing Residential Pesticide Exposure D-11
As in equation (D.3), the term ET
VQ
e−
in equation (D.9) is less than one and approaches zero as exposure time, ET increases. To the extent that the pesticide air concentration rapidly approaches steady state, this term will rapidly approach zero. For this scenario, the assumed volume of the outdoor treated space is 15 × 15 × 8 ft3 and the minimum flow rate is 39.4 ft3/sec, which is based on the minimum air velocity of 0.1 m/s and the cross sectional area of 15 × 8 ft2 (~11 m2) from Table 5-4. Given these values for V and Q, one can determine the time after
which the term t
VQ
e−
would be less than 0.001 (i.e. the time after which the air concentration is 99.9% of the steady-state value).
The above calculation demonstrates that after an exposure time of less than 6 minutes, the air concentration would be more than 99.9% of the steady-state value in the treated space. This implies that the air flow would practically cease to dissipate the pesticide after any significant
exposure time. Therefore the term ET
VQ
e−
in equation (D.9) approaches zero very quickly. Thus the final exposure equation can be simplified to: (D.10)
( ) mft
sm ft ft Q ftftftV 28.31.0815 ; 81515 ×××=××=
( ) ( )Q
VttVQe
tVQ ×
−=⇒=−⇒=− 001.0ln001.0ln001.0
( ) ( )( )
min 5.27sec 16328.31.0815
81515001.0ln==
×××
×××−=
mft
sm ft ft
ftftftt
−
⋅⋅=
QVET
QERVIRE E

Appendix D
U.S. EPA Office of Pesticide Programs – Standard Operating Procedures for Assessing Residential Pesticide Exposure D-12
D.3.3 Outdoor Fogging/Misting Systems - Outdoor Residential Misting Systems (ORMS)
The well-mixed box (WMB) model was used to develop exposure equation (5.19) for the outdoor residential misting systems (ORMS) post-application inhalation scenario22. The WMB model incorporates a number of simplifying assumptions: fresh air (having zero pesticide concentration) enters the box at a constant airflow rate, a turbulent internal airflow thoroughly mixes the fresh air with the pesticide-laden air resulting in a uniform pesticide air concentration within the box, and the perfectly mixed air exits the box at the same constant airflow rate (i.e. the inflow rate equals the outflow rate). Thus the outdoor area where the aerosol is being applied is assumed to be in an enclosed box, therefore, using the WMB model is conservative for estimation of exposures for an open patio, deck, or yard. Also, this scenario assumes instantaneous spray releases, that is, the total amount of aerosol released at each spray event is modeled to occur instantaneously. The removal of the pesticide from the box depends on airflow. For an outdoor scenario, the airflow, Q is the product of the cross-sectional area and the wind velocity. The WMB model developed for this scenario models the pesticide air concentrations after multiple instantaneous aerosol spray releases at regular time intervals23. Only dissipation due to airflow into and out of the box is modeled. The mass balance within the box can be described by the following differential equation: where C is the air concentration, Q is the airflow (the product of the cross-sectional area of the box and the wind speed), and V is the volume of the box. Integrating the differential equation and simplifying and combining terms yields an equation describing the air concentration over time. 22 For the ORMS and animal barn scenarios, the WMB models describing the air concentrations over time have the same form. The parameterization of these models is the only difference. For the ORMS scenario, the decay rate constant is specified by the ratio of the airflow rate and the volume of the treated space; whereas for the animal barn scenario, the decay rate constant is specified by the air changes per hour. 23 The regular spray applications are assumed to continue for the entire time spent outdoors.
CQdtdCV ⋅−=
dtVQ
CdC
−=
∫∫ −= dtVQ
CdC
atVQC +−=)ln(
atVQ
C ee+−
=)ln(

Appendix D
U.S. EPA Office of Pesticide Programs – Standard Operating Procedures for Assessing Residential Pesticide Exposure D-13
where A = ea is a constant whose value is determined by the initial condition that at time t = 0, the pesticide air concentration is equal to initial air concentration, i.e. C(0) = C0. Based on this initial constraint, A is set equal to C0. The WMB model described above for the ORMS scenario is similar to the model used for aerosol area fogger scenario. In fact, the equation for modeling pesticide air concentrations over time after the first spray event (but before the second spray) is exactly the same as equation (D.1) except for the subscript on the left-hand side denoting the number of applications: (D.11) where C(t) is the air concentration at time t after the initial spray, C0 is the initial air concentration (i.e. concentration at time t=0), Q is the airflow (the product of the cross-sectional area of the box and the wind speed), and V is the volume of the box. Assuming the same amount of pesticide is released at each spray event, the equation describing the air concentrations after the second spray event (t ≥ TBA), but before the third spray (t < 2×TBA) is:
TBA ≤ t < (2 × TBA) (D.12) where TBA is the time between application. The first C0 term represents the (entire) air
concentration released at the second spray event; the BATC V
Q
0 e−
term represents the remaining air
concentration from the first application at the time of the second spray event; and the ( )BAT−− t
VQ
eterm specifies that the sum of the air concentrations (from the first and second spray events) will dissipate at the same decay rate constant, Q/V, but that the dissipation will begin at time TBA. The term (t - TBA) shifts the origin of dissipation process from zero to TBA. The equation describing the air concentrations over time after a series of regularly-spaced spray events can be generalized for the (n+1)th spray event as follows:
(D.13) when , that is from the time of the (n+1)th spray event to the time just
prior to the (n+2)th spray event24. By specifying BATR V
Q
e−
= , equation (D.13) can be rewritten as 24 Note that the 1st spray event occurs at time t = 0 (or t = 0 × TBA), the 2nd spray event at t = TBA (or t = 1 × TBA), the 3rd at t = 2 × TBA, the nth at t = (n - 1) × TBA, and the (n + 1)th at t = n × TBA.
tVQ
eC(t)C−
= 01
( )BABA TtVQT
VQ
eeCC(t)C−−−
+= 002
( ) ( ) ( ) ( ) ( )BABABABABABA TntVQTn
VQT)(n
VQT
VQT
VQT
VQ
n eCeeeee(t)C×−−×−×−−×−×−−
+
++++++= 0
132
1 1
tVQ
eAC−
⋅=
( ) ( )( )BABA TntTn ×+<≤× 1

Appendix D
U.S. EPA Office of Pesticide Programs – Standard Operating Procedures for Assessing Residential Pesticide Exposure D-14
(D.14)
where the R term is the fraction of air concentration remaining from the previous spray event. The summation of these progressively higher order R terms is referred to as a geometric series. The resulting sum of which can be written as:
(D.15) By substituting equation (D.15) into (D.14), the general equation describing air concentrations after a series of (n+1) regularly-spaced spray events can be written as:
(D.16) After several spray events, the air concentration at the beginning of each dissipation period approaches a fixed value determined by the geometric series in equation (D.15). This value can be determined by allowing ∞→n , which implies that 01 →+nR since R < 1. Thus after a sufficient number of spray events, the general equation describing air concentrations after a series of (n+1) regularly-spaced spray events can be written as:
(D.17)
Since R < 1, the term R
C−1
0 > C0. In other words, after a sufficient number of spray events, the
(total) air concentration immediately after the spray event will approach a fixed value that is larger than the (initial) concentration released during the spray event (due to the remaining air concentration from previous spray events). Therefore, it is more health protective to calculate inhalation exposure after the total air concentration approaches this larger, fixed value (i.e. after a sufficient number of spray applications have occurred). The air concentration equation (D.17) can be used to calculate the exposure, E, over the time period (n × TBA) to ((n+1) ×TBA), that is, the entire time period from the (n+1)th spray event until the time just prior to the (n+2)th spray event (i.e. the next spray event). The exposure equation is based on integrating equation (D.17) and multiplying by an inhalation rate, IR.
( ) ( )BATntVQ
nnn eCRRRRR(t)C
×−−−+ ++++++= 0
1321 1
( )BATntVQn
n eCR
R(t)C×−−+
+
−−
= 0
1
1 11
( )BATntVQ
n eR
C(t)C×−−
+
−
=1
01
( )
dt(t)CIREBA
BA
Tn
Tnn∫
×+
×+=
1
1
( )( )
dteR
CIREBA
BA
BATn
Tn
TntVQ
∫×+
×
×−−
−
=1
0
1
( )R
RRRRRRn
nn
−−
=+++++++
−
111
1132
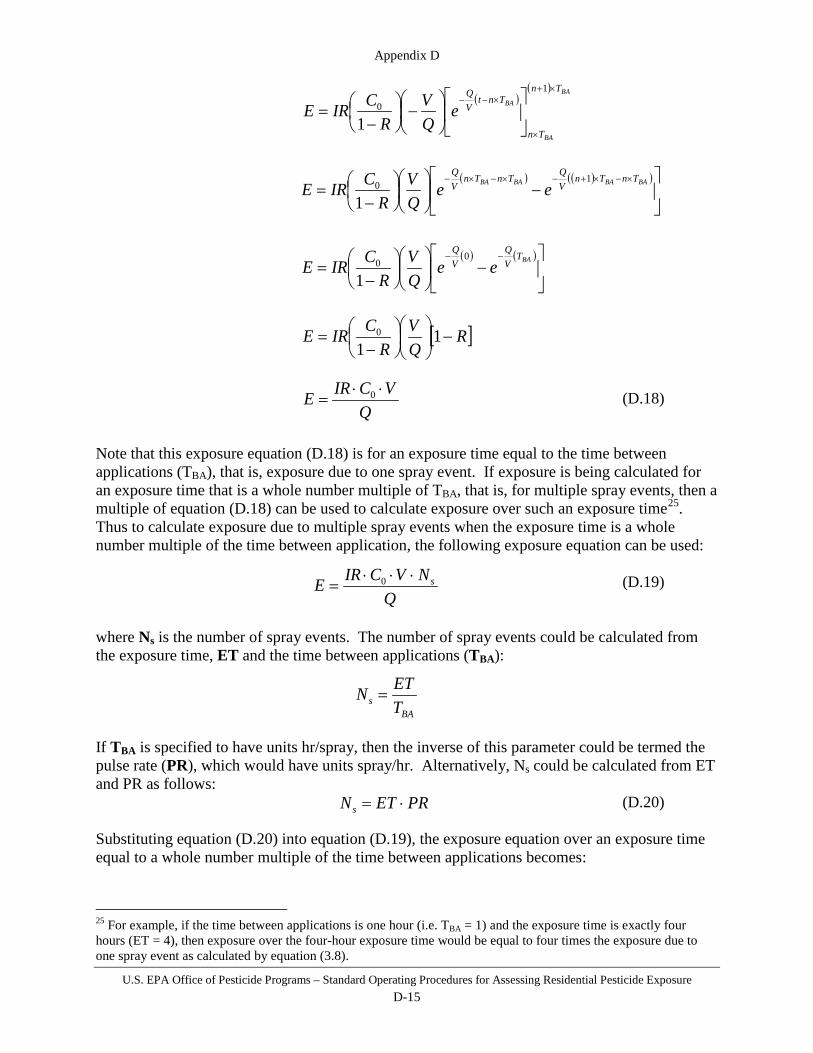
Appendix D
U.S. EPA Office of Pesticide Programs – Standard Operating Procedures for Assessing Residential Pesticide Exposure D-15
(D.18) Note that this exposure equation (D.18) is for an exposure time equal to the time between applications (TBA), that is, exposure due to one spray event. If exposure is being calculated for an exposure time that is a whole number multiple of TBA, that is, for multiple spray events, then a multiple of equation (D.18) can be used to calculate exposure over such an exposure time25. Thus to calculate exposure due to multiple spray events when the exposure time is a whole number multiple of the time between application, the following exposure equation can be used:
(D.19) where Ns is the number of spray events. The number of spray events could be calculated from the exposure time, ET and the time between applications (TBA): If TBA is specified to have units hr/spray, then the inverse of this parameter could be termed the pulse rate (PR), which would have units spray/hr. Alternatively, Ns could be calculated from ET and PR as follows:
(D.20) Substituting equation (D.20) into equation (D.19), the exposure equation over an exposure time equal to a whole number multiple of the time between applications becomes:
25 For example, if the time between applications is one hour (i.e. TBA = 1) and the exposure time is exactly four hours (ET = 4), then exposure over the four-hour exposure time would be equal to four times the exposure due to one spray event as calculated by equation (3.8).
( )( ) BA
BA
BA
Tn
Tn
TntVQ
eQV
RCIRE
×+
×
×−−
−
−
=1
0
1
( ) ( )( )
−
−
=×−×+−×−×− BABABABA TnTn
VQTnTn
VQ
eeQV
RCIRE
10
1
( ) ( )
−
−
=−− BAT
VQ
VQ
eeQV
RCIRE
00
1
[ ]RQV
RCIRE −
−
= 11
0
QVCIRE ⋅⋅
= 0
QNVCIRE s⋅⋅⋅
= 0
BAs T
ETN =
PRETNs ⋅=
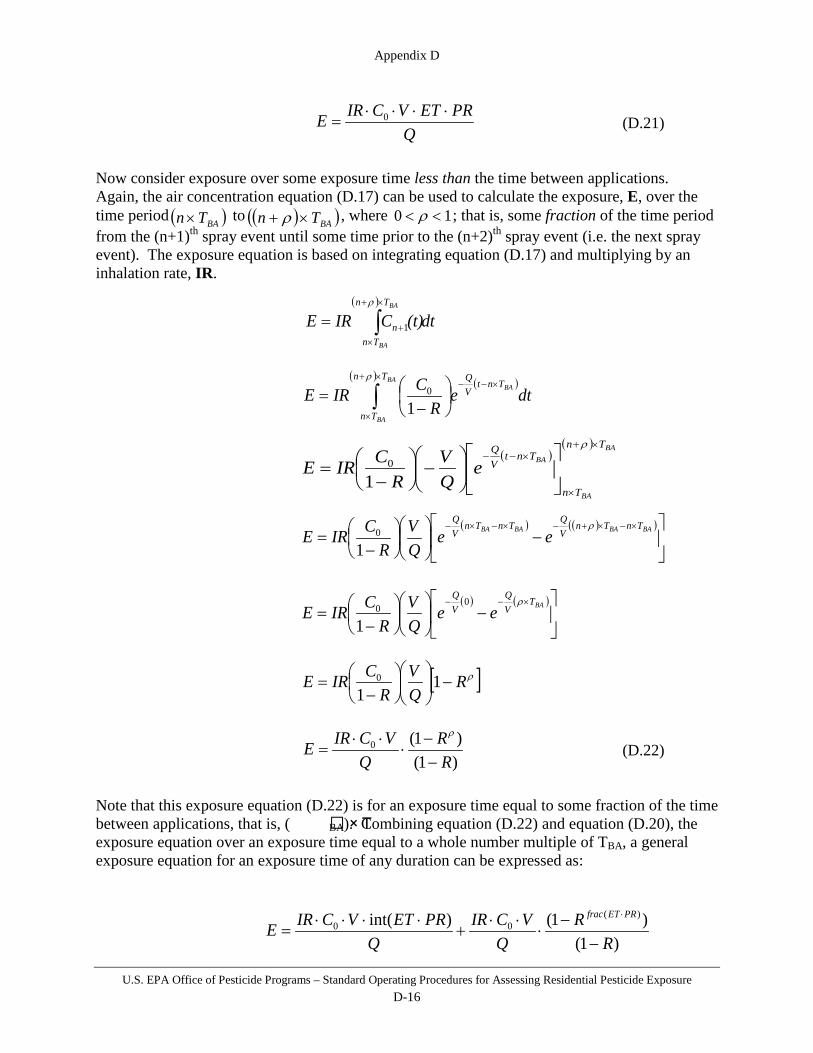
Appendix D
U.S. EPA Office of Pesticide Programs – Standard Operating Procedures for Assessing Residential Pesticide Exposure D-16
(D.21)
Now consider exposure over some exposure time less than the time between applications. Again, the air concentration equation (D.17) can be used to calculate the exposure, E, over the time period to , where 10 << ρ ; that is, some fraction of the time period from the (n+1)th spray event until some time prior to the (n+2)th spray event (i.e. the next spray event). The exposure equation is based on integrating equation (D.17) and multiplying by an inhalation rate, IR.
(D.22) Note that this exposure equation (D.22) is for an exposure time equal to some fraction of the time between applications, that is, ( × TBA). Combining equation (D.22) and equation (D.20), the exposure equation over an exposure time equal to a whole number multiple of TBA, a general exposure equation for an exposure time of any duration can be expressed as: )1(
)1()int( )(00
RR
QVCIR
QPRETVCIRE
PRETfrac
−−
⋅⋅⋅
+⋅⋅⋅⋅
=⋅
QPRETVCIRE ⋅⋅⋅⋅
= 0
( )
dt(t)CIREBA
BA
Tn
Tnn∫
×+
×+=
ρ
1
( )( )
dteR
CIREBA
BA
BATn
Tn
TntVQ
∫×+
×
×−−
−
=ρ
10
( )( ) BA
BA
BA
Tn
Tn
TntVQ
eQV
RCIRE
×+
×
×−−
−
−
=ρ
10
( ) ( )( )
−
−
=×−×+−×−×− BABABABA TnTn
VQTnTn
VQ
eeQV
RCIRE
ρ
10
( ) ( )
−
−
=×−− BAT
VQ
VQ
eeQV
RCIRE
ρ00
1
[ ]ρRQV
RCIRE −
−
= 11
0
)1()1(0
RR
QVCIRE
−−
⋅⋅⋅
=ρ
( )BATn × ( )( )BATn ×+ ρ

Appendix D
U.S. EPA Office of Pesticide Programs – Standard Operating Procedures for Assessing Residential Pesticide Exposure D-17
(D.23)
where BAT
VQ
R−
= e , int(ET·PR) is the integer (i.e. whole number) part of the product of the exposure time, ET and the pulse rate, PR (i.e. number of spray events per hour) and frac(ET·PR) is the fractional part of the product of the exposure time and the pulse rate26. Note that according to equation (D.19), the product of the exposure time and pulse rate is simply the numbers of spray events, Ns for which inhalation exposure is being estimated.
D.3.4 Outdoor Fogging/Misting Systems - Animal Barn Misting Systems As with the ORMS scenario, the well-mixed box (WMB) model was used to develop exposure equation (5.30) for the animal barn misting systems post-application inhalation scenario27. The WMB model incorporates a number of simplifying assumptions: fresh air (having zero pesticide concentration) enters the box at a constant airflow rate (based on the number of air changes per hour), a turbulent internal airflow thoroughly mixes the fresh air with the pesticide-laden air resulting in a uniform pesticide air concentration within the box, and the perfectly mixed air exits the box at the same constant airflow rate (i.e. the inflow rate equals the outflow rate). Thus the indoor area where the aerosol is being applied (i.e. barn) is assumed to be in an enclosed box, which seems a reasonable assumption for a walled, indoor space. This scenario assumes instantaneous spray releases, that is, the total amount of aerosol released at each spray event is modeled to occur instantaneously. The removal of the pesticide from the box depends on airflow. The WMB model developed for this scenario models the pesticide air concentrations after multiple instantaneous aerosol spray releases at regular time intervals28. Only dissipation due to airflow into and out of the box is modeled. The mass balance within the box can be described by the following differential equation:
26 For example, if the time between applications is 40 minutes or 2/3 hour (i.e. TBA = 0.67) or equivalently, the pulse rate is 3 sprays over 2 hours (i.e. PR = 1.5), and the exposure time is three hours (ET = 3), then int(ET·PR) = int(3 × 1.5) = int(4.5) = 4; and frac(ET·PR) = frac(4.5) = 0.5. 27 For the ORMS and animal barn scenarios, the WMB models describing the air concentrations over time have the same form. The parameterization of these models is the only difference. For the ORMS scenario, the decay rate constant is specified by the ratio of the airflow rate and the volume of the treated space, whereas for the animal barn scenario, the decay rate constant is specified by the air changes per hour. 28 The regular spray applications are assumed to continue for the entire time spent inside the animal barn.
−
−+⋅
⋅⋅=
⋅
)1()1()int(
)(0
RRPRET
QVCIRE
PRETfrac
CQdtdCV ⋅−=
dtVQ
CdC
−=
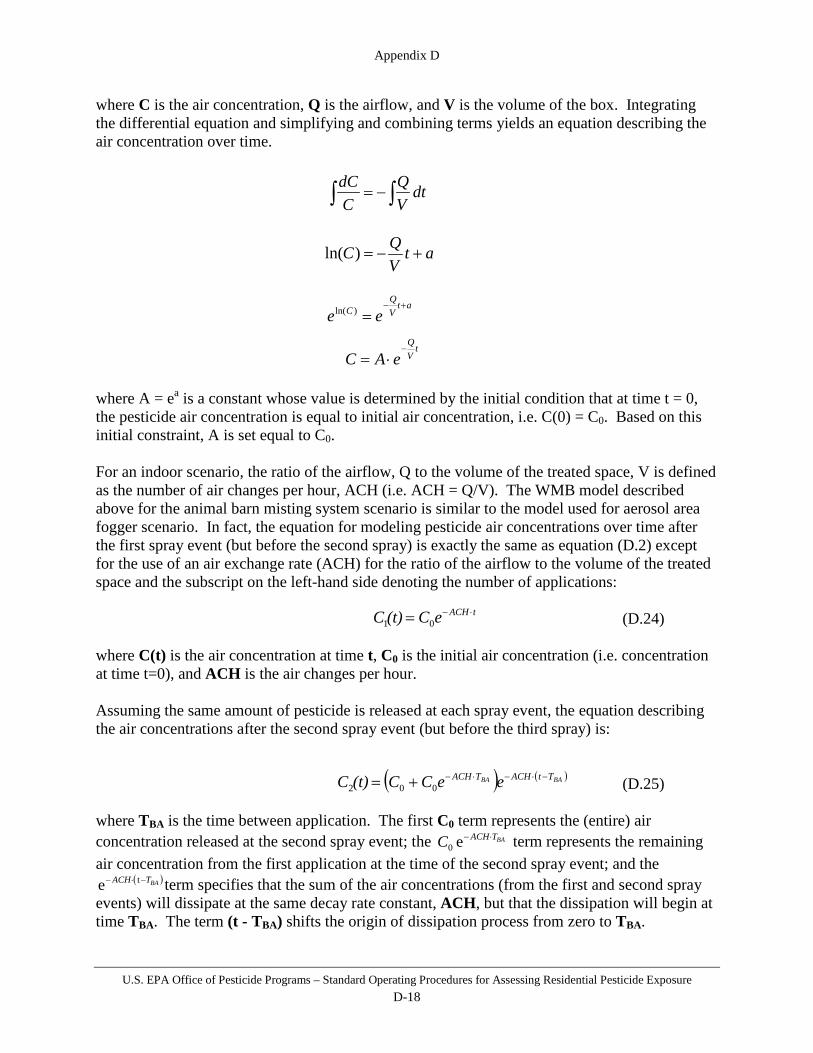
Appendix D
U.S. EPA Office of Pesticide Programs – Standard Operating Procedures for Assessing Residential Pesticide Exposure D-18
where C is the air concentration, Q is the airflow, and V is the volume of the box. Integrating the differential equation and simplifying and combining terms yields an equation describing the air concentration over time. where A = ea is a constant whose value is determined by the initial condition that at time t = 0, the pesticide air concentration is equal to initial air concentration, i.e. C(0) = C0. Based on this initial constraint, A is set equal to C0. For an indoor scenario, the ratio of the airflow, Q to the volume of the treated space, V is defined as the number of air changes per hour, ACH (i.e. ACH = Q/V). The WMB model described above for the animal barn misting system scenario is similar to the model used for aerosol area fogger scenario. In fact, the equation for modeling pesticide air concentrations over time after the first spray event (but before the second spray) is exactly the same as equation (D.2) except for the use of an air exchange rate (ACH) for the ratio of the airflow to the volume of the treated space and the subscript on the left-hand side denoting the number of applications: (D.24) where C(t) is the air concentration at time t, C0 is the initial air concentration (i.e. concentration at time t=0), and ACH is the air changes per hour. Assuming the same amount of pesticide is released at each spray event, the equation describing the air concentrations after the second spray event (but before the third spray) is:
(D.25) where TBA is the time between application. The first C0 term represents the (entire) air concentration released at the second spray event; the BATACHC ⋅−e0 term represents the remaining air concentration from the first application at the time of the second spray event; and the
( )BATACH −⋅− te term specifies that the sum of the air concentrations (from the first and second spray events) will dissipate at the same decay rate constant, ACH, but that the dissipation will begin at time TBA. The term (t - TBA) shifts the origin of dissipation process from zero to TBA.
tACHeC(t)C ⋅−= 01
( ) ( )BABA TtACHTACH eeCC(t)C −⋅−⋅−+= 002
∫∫ −= dtVQ
CdC
atVQC +−=)ln(
atVQ
C ee+−
=)ln(
tVQ
eAC−
⋅=

Appendix D
U.S. EPA Office of Pesticide Programs – Standard Operating Procedures for Assessing Residential Pesticide Exposure D-19
The equation describing the air concentrations over time after a series of regularly-spaced spray events can be generalized for the (n+1)th spray event as follows:
(D.26)
when , that is from the time of the (n+1)th spray event to the time just prior to the (n+2)th spray event29. By specifying BATACHR ⋅−= e , equation (D.26) can be rewritten as (D.27)
where the term R is the fraction of air concentration remaining from the previous spray event. Since R <1 by definition, the sum of the R terms is a geometric series, which can be written as:
(D.28) By substituting equation (D.27) into (D.26), the general equation describing air concentrations after a series of (n+1) regularly-spaced spray events can be written as:
(D.29) After several spray events, the air concentration at the beginning of each dissipation period approaches a fixed value determined by the geometric series in equation (D.28). This value can be determined by allowing ∞→n , which implies that 01 →−nR since R < 1. Thus after a sufficient number of spray events, the general equation describing air concentrations after a series of (n+1) regularly-spaced spray events can be written as:
(D.30)
Since R < 1, the term R
C−1
0 > C0. In other words, after a sufficient number of spray events, the
(total) air concentration present immediately after the spray event will approach a fixed value that is larger than the (initial) concentration released during the spray event (due to the remaining air concentration from previous spray events). Therefore, it is more health protective to calculate inhalation exposure after the total air concentration approaches this larger, fixed value (i.e. after a sufficient number of spray applications have occurred).
29 Note that the 1st spray event occurs at time t = 0 (or t = 0 × TBA), the 2nd spray event at t = TBA (or t = 1 × TBA), the 3rd at t = 2 × TBA, the nth at t = (n - 1) × TBA, and the (n + 1)th at t = n × TBA.
( ) ( ) ( ) ( )( ) ( )BABABABABABA TntACHTnACHT)(nACHTACHTACHTACHn eCeeeee(t)C ×−⋅−×⋅−×−⋅−×⋅−×⋅−⋅−+ ++++++= 0
1321 1
( ) ( )BATntACHnnn eCRRRRR(t)C ×−⋅−−+ ++++++= 0
1321 1
( )BATntACHn
n eCR
R(t)C ×−⋅−−
+
−−
= 0
1
1 11
( )BATntACHn e
RC(t)C ×−⋅−
+
−
=1
01
( )R
RRRRRRn
nn
−−
=++++++−
−
111
1132
( ) ( )( )BABA TntTn ×+<≤× 1

Appendix D
U.S. EPA Office of Pesticide Programs – Standard Operating Procedures for Assessing Residential Pesticide Exposure D-20
The air concentration equation (D.30) can be used to calculate the exposure, E, over the time period to , that is, the entire time period from the (n+1)th spray event until the time just prior to the (n+2)th spray event (i.e. the next spray event). The exposure equation is based on integrating equation (D.30) and multiplying by an inhalation rate, IR. (D.31) Note that this exposure equation (D.31) is for an exposure time equal to the time between applications (TBA), that is, exposure due to one spray event and is also same as Eqn. D.17 given earlier. If exposure is being calculated for an exposure time that is a whole number multiple of TBA, that is, for multiple spray events, then a multiple of equation (D.30) can be used to calculate exposure over such an exposure time30. Thus to calculate exposure due to multiple spray events when the exposure time is a whole number multiple of the time between application [i.e. ET = 0 mod(TBA)], the following exposure equation can be used:
(D.32)
30 For example, if the time between applications is one hour (i.e. TBA = 1) and the exposure time is exactly four hours (ET = 4), then exposure over the four-hour exposure time would be equal to four times the exposure due to one spray event as calculated by equation (3.8).
( )
dt(t)CIREBA
BA
Tn
Tnn∫
×+
×+=
1
1
( )( )
dteR
CIREBA
BA
BA
Tn
Tn
TntACH∫×+
×
×−⋅−
−
=1
0
1
( )[ ]( ) BA
BA
BATn
TnTntACHe
ACHRCIRE ×+
××−⋅−
−
−
=10 1
1
( ) ( )( )[ ]BABABABA TnTnACHTnTnACH eeACHR
CIRE ×−×+⋅−×−×⋅− −
−
= 10 11
( ) ( )[ ]BATACHACH eeACHR
CIRE ⋅−⋅− −
−
= 00 11
[ ]RACHR
CIRE −
−
= 111
0
ACHCIRE 0⋅
=
ACHNCIRE s⋅⋅
= 0
( )BATn × ( )( )BATn ×+1
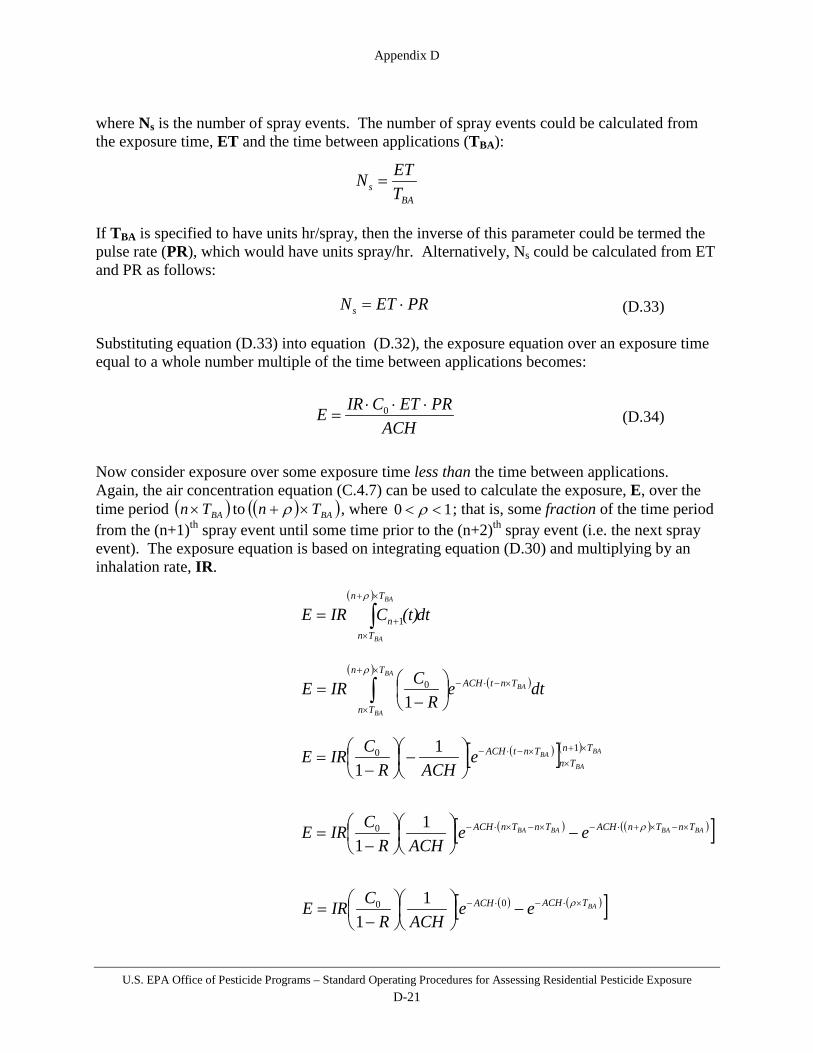
Appendix D
U.S. EPA Office of Pesticide Programs – Standard Operating Procedures for Assessing Residential Pesticide Exposure D-21
where Ns is the number of spray events. The number of spray events could be calculated from the exposure time, ET and the time between applications (TBA): If TBA is specified to have units hr/spray, then the inverse of this parameter could be termed the pulse rate (PR), which would have units spray/hr. Alternatively, Ns could be calculated from ET and PR as follows:
(D.33) Substituting equation (D.33) into equation (D.32), the exposure equation over an exposure time equal to a whole number multiple of the time between applications becomes: (D.34) Now consider exposure over some exposure time less than the time between applications. Again, the air concentration equation (C.4.7) can be used to calculate the exposure, E, over the time period to , where 10 << ρ ; that is, some fraction of the time period from the (n+1)th spray event until some time prior to the (n+2)th spray event (i.e. the next spray event). The exposure equation is based on integrating equation (D.30) and multiplying by an inhalation rate, IR.
BAs T
ETN =
PRETNs ⋅=
ACHPRETCIRE ⋅⋅⋅
= 0
( )
dt(t)CIREBA
BA
Tn
Tnn∫
×+
×+=
ρ
1
( )( )
dteR
CIREBA
BA
BA
Tn
Tn
TntACH∫×+
×
×−⋅−
−
=ρ
10
( )[ ]( ) BA
BA
BATn
TnTntACHe
ACHRCIRE ×+
××−⋅−
−
−
=10 1
1
( ) ( )( )[ ]BABABABA TnTnACHTnTnACH eeACHR
CIRE ×−×+⋅−×−×⋅− −
−
= ρ11
0
( ) ( )[ ]BATACHACH eeACHR
CIRE ×⋅−⋅− −
−
= ρ00 11
( )BATn × ( )( )BATn ×+ ρ

Appendix D
U.S. EPA Office of Pesticide Programs – Standard Operating Procedures for Assessing Residential Pesticide Exposure D-22
(D.35) Note that this exposure equation (D.35) is for an exposure time equal to some fraction of the time between applications, that is, ( × TBA). Combining equation (D.35) and equation (D.33), the exposure equation over an exposure time equal to a whole number multiple of TBA, a general exposure equation for an exposure time of any duration can be expressed as: (D.36) where BATACHR ⋅−= e , int(ET·PR) is the integer (i.e. whole number) part of the product of the exposure time, ET and the pulse rate, PR (i.e. number of spray events per hour) and frac(ET·PR) is the fractional part of the product of the exposure time and the pulse rate31. Note that according to equation (D.33), the product of the exposure time and pulse rate is simply the numbers of spray events, Ns for which inhalation exposure is being estimated.
31 For example, if the time between applications is 40 minutes or 2/3 hour (i.e. TBA = 0.67) or equivalently, the pulse rate is 3/2 sprays/hour (i.e. PR = 1.5); and the exposure time is three hours (ET = 3), then int(ET·PR) = int(3 × 1.5) = int(4.5) = 4; and frac(ET·PR) = frac(4.5) = 0.5.
)1()1()int( )(
00
RR
ACHCIR
ACHPRETCIRE
PRETfrac
−−
⋅⋅
+⋅⋅⋅
=⋅
[ ]ρRACHR
CIRE −
−
= 111
0
)1()1(0
RR
ACHCIRE
−−
⋅⋅
=ρ
−
−+⋅
⋅=
⋅
)1()1()int(
)(0
RRPRET
ACHCIRE
PRETfrac
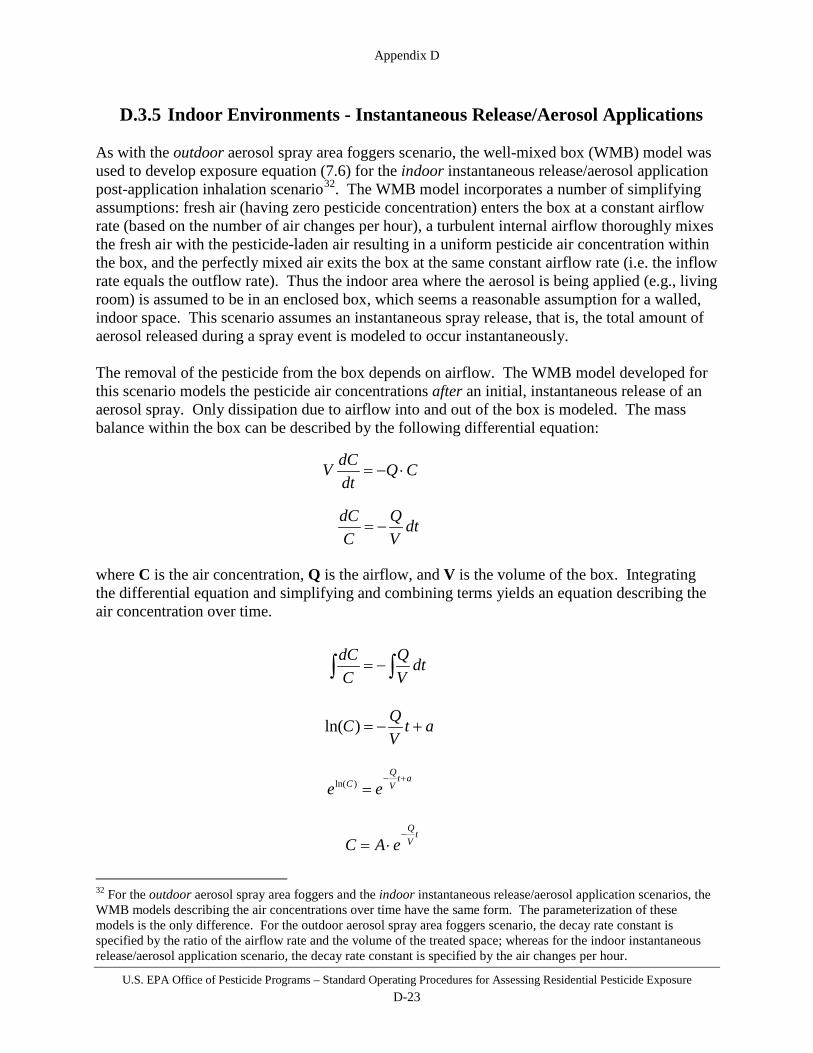
Appendix D
U.S. EPA Office of Pesticide Programs – Standard Operating Procedures for Assessing Residential Pesticide Exposure D-23
D.3.5 Indoor Environments - Instantaneous Release/Aerosol Applications As with the outdoor aerosol spray area foggers scenario, the well-mixed box (WMB) model was used to develop exposure equation (7.6) for the indoor instantaneous release/aerosol application post-application inhalation scenario32. The WMB model incorporates a number of simplifying assumptions: fresh air (having zero pesticide concentration) enters the box at a constant airflow rate (based on the number of air changes per hour), a turbulent internal airflow thoroughly mixes the fresh air with the pesticide-laden air resulting in a uniform pesticide air concentration within the box, and the perfectly mixed air exits the box at the same constant airflow rate (i.e. the inflow rate equals the outflow rate). Thus the indoor area where the aerosol is being applied (e.g., living room) is assumed to be in an enclosed box, which seems a reasonable assumption for a walled, indoor space. This scenario assumes an instantaneous spray release, that is, the total amount of aerosol released during a spray event is modeled to occur instantaneously. The removal of the pesticide from the box depends on airflow. The WMB model developed for this scenario models the pesticide air concentrations after an initial, instantaneous release of an aerosol spray. Only dissipation due to airflow into and out of the box is modeled. The mass balance within the box can be described by the following differential equation: where C is the air concentration, Q is the airflow, and V is the volume of the box. Integrating the differential equation and simplifying and combining terms yields an equation describing the air concentration over time.
32 For the outdoor aerosol spray area foggers and the indoor instantaneous release/aerosol application scenarios, the WMB models describing the air concentrations over time have the same form. The parameterization of these models is the only difference. For the outdoor aerosol spray area foggers scenario, the decay rate constant is specified by the ratio of the airflow rate and the volume of the treated space; whereas for the indoor instantaneous release/aerosol application scenario, the decay rate constant is specified by the air changes per hour.
CQdtdCV ⋅−=
dtVQ
CdC
−=
∫∫ −= dtVQ
CdC
atVQC +−=)ln(
atVQ
C ee+−
=)ln(
tVQ
eAC−
⋅=

Appendix D
U.S. EPA Office of Pesticide Programs – Standard Operating Procedures for Assessing Residential Pesticide Exposure D-24
where A = ea is a constant whose value is determined by the initial condition that at time t = 0, the pesticide air concentration is equal to initial air concentration, i.e. C(0) = C0. Based on this initial constraint, A is set equal to C0. Also, for an indoor scenario, the ratio of the airflow, Q to the volume of the treated space, V is defined as the number of air changes per hour, ACH (i.e. ACH = Q/V). Based on the initial constraint that C(0) = C0 and that ACH = Q/V, the WMB model described above for modeling pesticide air concentrations over time can be written as follows: (D.37) where C(t) is the air concentration at time t, C0 is the initial air concentration (i.e. concentration at time t=0), and ACH is the air changes per hour. The air concentration equation (D.37) is then used to calculate the exposure, E: (D.38) The exposure, E is based on integrating equation (D.36) over the exposure time, ET which is then multiplied by an inhalation rate, IR. The final exposure equation is derived from equation (D.38) by performing the integration and simplifying terms.
(D.39)
D.3.6 Indoor Environments - Vapor Emission for Surface Sprays As with the outdoor candles, coils, torches, and mats scenario, the well-mixed box (WMB) model was used to develop exposure equation (7.11) for the indoor vapor emission for surface sprays post-application inhalation scenario33. The vapor emission for surface sprays scenario differs from the other exposure scenarios based on the WMB model because it includes a variable emission rate term and thus results in a more complicated exposure equation. The WMB was used to model pesticide air concentrations within an enclosed, fixed volume (i.e. a
33 For the outdoor candles, coils, torches, and mats and the indoor vapor emission for surface sprays scenarios, the WMB models describing the air concentrations over time have a similar form. The parameterization of these models is one of the differences. For the outdoor candles, coils, torches, and mats scenario, the decay rate constant is specified by the ratio of the airflow rate and the volume of the treated space, whereas for the indoor vapor emission for surface sprays scenario, the decay rate constant is specified in part by the air changes per hour.
dteCIREET
tACH∫ ⋅−=0
0
dtC(t)IREET
∫=0
tACHeCC(t) ⋅−= 0
( )( )ETACHeACH
CIRE −−⋅
= 10
( )( )0)(1 ACHETACHO ee
ACHCIRE −− −
−
∗=
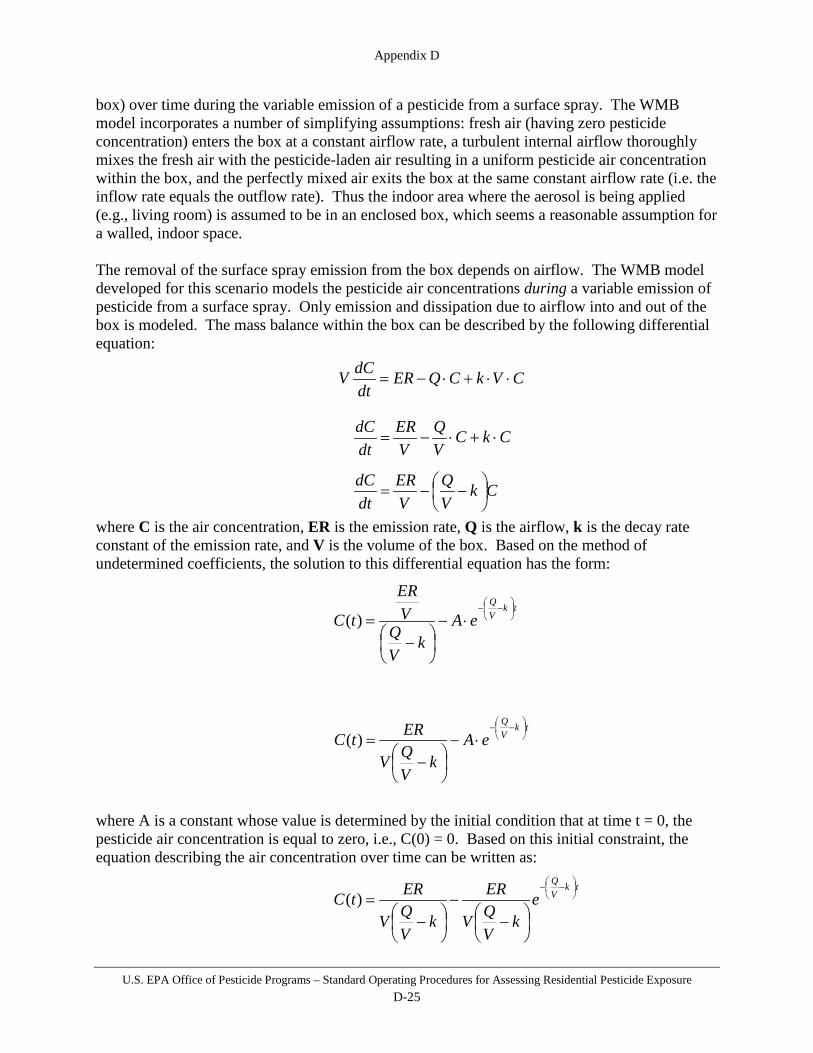
Appendix D
U.S. EPA Office of Pesticide Programs – Standard Operating Procedures for Assessing Residential Pesticide Exposure D-25
box) over time during the variable emission of a pesticide from a surface spray. The WMB model incorporates a number of simplifying assumptions: fresh air (having zero pesticide concentration) enters the box at a constant airflow rate, a turbulent internal airflow thoroughly mixes the fresh air with the pesticide-laden air resulting in a uniform pesticide air concentration within the box, and the perfectly mixed air exits the box at the same constant airflow rate (i.e. the inflow rate equals the outflow rate). Thus the indoor area where the aerosol is being applied (e.g., living room) is assumed to be in an enclosed box, which seems a reasonable assumption for a walled, indoor space. The removal of the surface spray emission from the box depends on airflow. The WMB model developed for this scenario models the pesticide air concentrations during a variable emission of pesticide from a surface spray. Only emission and dissipation due to airflow into and out of the box is modeled. The mass balance within the box can be described by the following differential equation: where C is the air concentration, ER is the emission rate, Q is the airflow, k is the decay rate constant of the emission rate, and V is the volume of the box. Based on the method of undetermined coefficients, the solution to this differential equation has the form: where A is a constant whose value is determined by the initial condition that at time t = 0, the pesticide air concentration is equal to zero, i.e., C(0) = 0. Based on this initial constraint, the equation describing the air concentration over time can be written as:
CVkCQERdtdCV ⋅⋅+⋅−=
CkCVQ
VER
dtdC
⋅+⋅−=
tkVQ
eAk
VQ
VER
tC
−−
⋅−
−
=)(
tkVQ
ek
VQV
ER
kVQV
ERtC
−−
−
−
−
=)(
tkVQ
eAk
VQV
ERtC
−−
⋅−
−
=)(
CkVQ
VER
dtdC
−−=

Appendix D
U.S. EPA Office of Pesticide Programs – Standard Operating Procedures for Assessing Residential Pesticide Exposure D-26
Based on the WMB model described above, the equation for modeling pesticide air concentrations over time is as follows: (D.40) where C(t) is the air concentration at time t, ER is the emission rate, Q is the airflow, k is the decay rate constant of the emission rate, and V is the volume of the box. For an indoor scenario, the ratio of the airflow, Q to the volume of the treated space, V is defined as the number of air changes per hour, ACH: (D.41) For the indoor vapor emission for surface sprays scenario, the decreasing emission rate, ER is based on decay rate constant, k34 which can be calculated from various physical and chemical properties of the pesticide. (D.42) where M is the amount (i.e. mass) of the surface spray application. Substituting equations (D.41) and (D.42) into equation (D.40) and yields the equation for modeling pesticide air concentrations over time following surface spray application base on a variable emission rate: Which can be rewritten as: (D.43) The air concentration equation is then used to calculate the exposure, E, which is based on integrating equation (D.43) over the exposure time, ET which is then multiplied by an inhalation rate, IR: (D.44) The final exposure equation is derived from equation (D.44) by performing the integration and simplifying terms.
34 As discussed in Guo (2002), Evans (1994) proposed estimating the decay rate constant, k based on the 90% drying time which, in turn, is estimated by a method developed by Chinn (1981).
−
−
=
−− tk
VQ
ek
VQV
ERtC 1)(
dtC(t)IREET
∫=0
VQACH =
tkeMkER ⋅−⋅⋅=
( )( )[ ]tkACH
tk
ekACHV
eMktC −−⋅−
−−
⋅⋅= 1)(
( ) [ ]tACHtk eekACHV
MktC ⋅−⋅− −−
⋅=)(
( ) [ ]dteekACHV
MkIREET
tACHtk 0∫ ⋅−⋅− −
−⋅
=

Appendix D
U.S. EPA Office of Pesticide Programs – Standard Operating Procedures for Assessing Residential Pesticide Exposure D-27
(D.45)
D.3.7 Vapor Emission for Surface-directed Sprays – Using the Saturation Concentration
If the information necessary to conduct an assessment for post-application inhalation exposure following surface-directed sprays is not available, a screening level approach can be performed using the saturation concentration of the chemical. This approach relies only on chemical properties such as molecular weight and vapor pressure to estimate an air concentration. It should be noted that using the saturation concentration to estimate inhalation exposure is a very conservative approach. The saturation concentration is a chemical’s theoretical maximum air concentration. It represents what would occur if a large amount of chemical were spilled in a non-ventilated room and allowed to evaporate until equilibrium is reached.
( )ET
tACHtk eACH
ekkACHV
MkIRE0
11
+−
−⋅⋅
= ⋅−⋅−
( )( ) ( )
−−
−
−⋅⋅
= ⋅−⋅−⋅−⋅− ETACHETkACHk eACH
ek
eACH
ekkACHV
MkIRE 1111 00
( )
⋅
⋅−⋅−
⋅−
−⋅⋅
=⋅−⋅−
ACHkekeACH
ACHkkACH
kACHVMkIRE
ETACHETk
−⋅−⋅
−
−−
⋅⋅⋅⋅
=⋅−⋅−
kACHekeACH
kACHkACH
ACHkVMkIRE
ETACHETk
−⋅−⋅
−⋅⋅
=⋅−⋅−
kACHekeACH
ACHVMIRE
ETACHETk
1
( )ET
tACHtk eACH
ekkACHV
MkIRE0
11
−
−⋅⋅
= ⋅−⋅−
( )
−−
−
−⋅⋅
= ⋅−⋅− ETACHETk eACH
ekACHkkACHV
MkIRE 1111
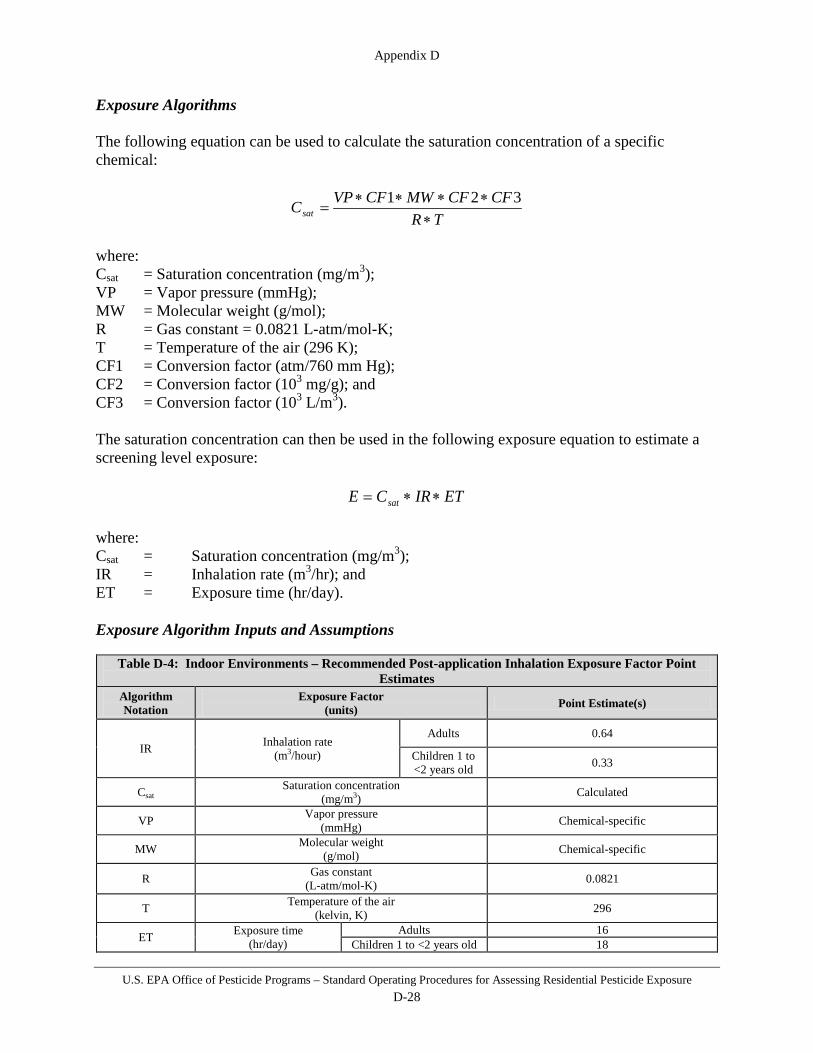
Appendix D
U.S. EPA Office of Pesticide Programs – Standard Operating Procedures for Assessing Residential Pesticide Exposure D-28
Exposure Algorithms The following equation can be used to calculate the saturation concentration of a specific chemical:
TRCFCFMWCFVPCsat ∗
∗∗∗∗=
321
where: Csat = Saturation concentration (mg/m3); VP = Vapor pressure (mmHg); MW = Molecular weight (g/mol); R = Gas constant = 0.0821 L-atm/mol-K; T = Temperature of the air (296 K); CF1 = Conversion factor (atm/760 mm Hg); CF2 = Conversion factor (103 mg/g); and CF3 = Conversion factor (103 L/m3). The saturation concentration can then be used in the following exposure equation to estimate a screening level exposure:
ETIRCE sat ∗∗= where: Csat = Saturation concentration (mg/m3); IR = Inhalation rate (m3/hr); and ET = Exposure time (hr/day). Exposure Algorithm Inputs and Assumptions
Table D-4: Indoor Environments – Recommended Post-application Inhalation Exposure Factor Point Estimates
Algorithm Notation
Exposure Factor (units) Point Estimate(s)
IR Inhalation rate (m3/hour)
Adults 0.64
Children 1 to <2 years old 0.33
Csat Saturation concentration
(mg/m3) Calculated
VP Vapor pressure (mmHg) Chemical-specific
MW Molecular weight (g/mol) Chemical-specific
R Gas constant (L-atm/mol-K) 0.0821
T Temperature of the air (kelvin, K) 296
ET Exposure time (hr/day)
Adults 16 Children 1 to <2 years old 18

Appendix D
U.S. EPA Office of Pesticide Programs – Standard Operating Procedures for Assessing Residential Pesticide Exposure D-29
Inhalation Rate (IR) See Section 2.2 for discussion of inhalation rates. The recommended point estimates for use in post-application inhalation exposure assessments are 0.64 m3/hr for adults and 0.33 m3/hr for children 1 to < 2 years old. Saturation Concentration (Csat) The saturation concentration is a chemical’s theoretical maximum air concentration. It represents what would occur if a large amount of chemical were spilled in a non-ventilated room and allowed to evaporate until equilibrium is reached. Calculating post-application inhalation exposure and risk using the saturation concentration should be considered a very conservative approach. Vapor Pressure (VP) The vapor pressure is a chemical-specific value in units of mmHg. Molecular weight (MW) The molecular weight is a chemical-specific value in units of g/mol. Gas constant (R) A constant with units of L-atm/mol-K. Temperature (T) The temperature of the air in units of kelvin (K). Exposure Time (ET) For vapor emissions from surface-directed sprays, it is assumed that the vapors can continue to emit over time; therefore, exposure time is related to time spent in a residence. Empirical distributions for adults and children are provided in the Exposure Factors Handbook 2011 Edition (U.S. EPA, 2011; Adults -- Table 16-16 and Children -- Table 16-15). The distribution for exposure time for adults and for children 1 to < 2 years old is provided in Table D-5. The recommended point estimates for use in post-application inhalation exposure assessments are 16 hours for adults and 18 hours for children 1 to < 2 years old.
Table D-5: Exposure Time (ET, hours) Statistic Adults Children 1 to < 2 years
5th percentile 9 11 25th percentile 13 15 50th percentile 15 18 75th percentile 19 21 90th percentile 23 24 95th percentile 24 24
AM (SD) 16 (5) 18 AM (SD) = arithmetic mean (standard deviation)
Exposure Characterization and Data Quality When using the saturation concentration to estimate inhalation exposure, the assessor should note that this is a very conservative approach. The saturation concentration is a chemical’s

Appendix D
U.S. EPA Office of Pesticide Programs – Standard Operating Procedures for Assessing Residential Pesticide Exposure D-30
theoretical maximum air concentration. It represents what would occur if a large amount of chemical were spilled in a non-ventilated room and allowed to evaporate until equilibrium is reached. Combining Post-application Scenarios Post-application inhalation exposure from surface-directed sprays can be calculated using the saturation concentration as an estimate of air concentration. As was mentioned, the saturation concentration is a highly conservative assumption of air concentration; a chemical’s theoretical maximum air concentration. It represents what would occur if a large amount of chemical were spilled in a non-ventilated room and allowed to evaporate until equilibrium is reached. Therefore, the exposure value calculated for this route should not be combined with the other potential routes of exposure.
D.4 Selection of Air Velocity Meteorological data from National Weather Service (NWS) and other appropriate meteorological monitoring stations was considered in this SOP. Such data have been widely used for dispersion modeling in the Agency’s fumigant human health risk assessments. The six weather stations were located around the country and recorded wind velocity (i.e., meters/second or m/s) and other meteorological parameters. The meteorological conditions for these sites represent a broad range of situations, including inland and coastal sites in California and Florida as well as the Midwest and desert plain of the Pacific Northwest. These types of weather stations typically use cup and vane anemometers to measure windspeed and typically do not record velocities below 1 m/s. Any meteorological monitor recording velocities less than 1 m/s are recorded as 0 m/s. Table D-6 reports the results from each weather station considered and the percentage of hourly wind speed data that were recorded below 1 m/s and 1.5 m/s, respectively. Both flying pest pressure and post-application inhalation exposure will likely be highest in the assessed scenarios for days when the air conditions are “calm” (>0.3 m/s) as defined on the Beaufort Wind Force Scale because less mixing will occur at lower windspeeds.
Table D-6: Wind Velocity from National Weather Stations (1999-2003)
City Source Percent of the hourly wind speed data below 1 m/s
Percent of the hourly wind speed data below 1.5 m/s
Bakersfield CA
ASOS or Automated Surface Observing
System operated by the FAA
18% 18%
Ventura CA CIMIS or California
Irrigation Management Information System
22% 29%
Bradenton FL FAWN or Florida
Automated Weather Network
25% 42%
Tallahassee FL NWS or National Weather Service 26% 42%

Appendix D
U.S. EPA Office of Pesticide Programs – Standard Operating Procedures for Assessing Residential Pesticide Exposure D-31
Table D-6: Wind Velocity from National Weather Stations (1999-2003)
City Source Percent of the hourly wind speed data below 1 m/s
Percent of the hourly wind speed data below 1.5 m/s
Flint MI NWS or National Weather Service 4% 4%
Yakima WA NWS or National Weather Service 9% 9%
D.5 Estimates of Deposited Residue (DepR)
For indoor environments, post-application dermal exposure resulting from contact with treated indoor surfaces is dependent on three exposure factors: transferable residue (TR), transfer coefficient (TC), and exposure time (ET). If chemical-specific TR data are available, this is preferred and should be used to calculate exposure. However, if chemical-specific TR data are not available, then TR can be calculated based on the deposited residue and the fraction of active ingredient available for transfer. The deposited residue is the residue that is deposited onto indoor surfaces following an application. It can be obtained either from (1) chemical-specific deposition data, (2) the application rate of the product, or (3) default values based on the type of application. Information on each of these methods is provided in the main body of the SOP, but more in-depth information on the analyses for calculating residue values for each option is provided below.
D.5.1 Deposited Residue Based on Chemical-specific Data Deriving deposited residue values from chemical-specific deposition data is the preferred option for determining the residue value to use in the dermal exposure calculation. These types of data will best reflect the residue pattern and magnitude of deposition after an application. As was discussed in the Indoor SOP, chemical-specific data can be used to calculate a residue value for estimating dermal exposure based on the type of treatment performed (i.e., broadcast, perimeter, or crack and crevice). It is assumed that a chemical-specific deposition study is performed using deposition coupons, which are placed on the floor of the treated room. Coupons should be placed throughout the room so as to capture deposition both near and away from the target application site. A key point to remember in using chemical-specific data is to check the application rate used in the study against the proposed rate and adjust the data if necessary for any differences. In the case of broadcast treatments, the product is typically applied evenly to the floor throughout the room. Therefore, the deposited residue for the room would be calculated as the average residue of all the coupons in the room. In the case of perimeter/spot/bedbug (coarse and pinstream) treatments, the product is typically applied only to the outer edges of the room (e.g., along the baseboards). This area is considered the “treated area”, while the area in the center of the room is considered the “untreated area”. The deposited residue for the room is calculated as a weighted average of the residues in the treated area and the residues in the untreated area. Coupons placed along the outer edge of the room are considered to be representative of the “treated area” while those placed closer to the center of the room are considered to be representative of the “untreated area”. The residues

Appendix D
U.S. EPA Office of Pesticide Programs – Standard Operating Procedures for Assessing Residential Pesticide Exposure D-32
measured on the coupons in each area are averaged together to come up with an average residue for the treated area and an average residue for the untreated area. Then, the following formula is used to calculate a weighted average for the entire room:
(70% * average residue untreated area) + (30% * average residue treated area)
In the case of crack and crevice treatments, the product is typically applied only to voids and crevices in the room. For the purposes of calculating the deposited residue, the area along the outer edges of the room is considered the “treated area” (similar to perimeter treatments), while the area in the center of the room is considered the “untreated area”. The deposited residue for the room is calculated similar to the perimeter treatments – a weighted average of the residues in the treated area and the residues in the untreated area. Coupons placed along the outer edge of the room are considered to be representative of the “treated area” while those placed closer to the center of the room are considered to be representative of the “untreated area”. The residues measured on the coupons in each area are averaged together to come up with an average residue for the treated area and an average residue for the untreated area. Then, the following formula is used to calculate a weighted average for the entire room:
(90% * average residue untreated area) + (10% * average residue treated area)
D.5.2 Deposited Residue Based on Application Rate If chemical-specific deposition data are not available, but the label provides an application rate in terms of mass per unit area, then residue values may be estimated using the application rate. Broadcast Treatments: Deposited residue = application rate Assumed that application evenly distributes the pesticide across the floor of a room. Deposited residue for the whole room is assumed to be equivalent to the application rate.
Perimeter/Spot/Bedbug (coarse and pinstream) Treatments: Deposited residue = 50% of application rate Application only to outer edges of room. Residues will not be evenly distributed within room –higher residues near outer edges
than center of room. Method of application and distribution of residues in room is considered when calculating
the residue value for the whole room. Appropriate residue value to use for whole room would be a weighted average based on
distribution of residues in room and likelihood of contacting higher residues found near outer edges (for perimeter/spot/bedbug treatments, assume a 70/30 ratio of untreated/treated areas).
Deposited residue value used for the whole room in the exposure equation will be some percentage of the application rate.

Appendix D
U.S. EPA Office of Pesticide Programs – Standard Operating Procedures for Assessing Residential Pesticide Exposure D-33
It is assumed that the deposited residue for perimeter/spot/bedbug (coarse and pinstream) treatments is equivalent to 50% of the application rate. This is based on studies that have measured residues resulting from broadcast and perimeter treatments. A summary of the studies and comparisons is provided in Table D-7 through Table D-9. Considerations: Based on two comparisons only, one of which includes applications from different
studies which had different application and sampling schemes.

Appendix D
U.S. EPA Office of Pesticide Programs – Standard Operating Procedures for Assessing Residential Pesticide Exposure D-34
Table D-7: Comparison of Perimeter and Broadcast Treatment Residues (residues from different studies Perimeter Treatment
SOURCE RESIDUE (µg/cm2)
U.S. EPA (1993) 0.5% Malathion compressed air sprayer
Collection media: cotton dosimeter patches. Sampling time: 0 and 4 hours; no difference identified between 2 sampling times. Number of samples: divided floor into 16 blocks; 100 samples collected. Size of room: 12 ft x 12 ft (366 cm x 366 cm). Treated area = 0-30 cm from wall. Untreated area = >90 cm from wall. 9 ug/cm2 = (30% of average residue from treated area) + (70% of average residue
from untreated area)
9
Broadcast Treatments SOURCE RESIDUE (µg/cm2)
Fenske (1990) 0.5% Chlorpyrifos
manually-pressurized handwand
Collection media: aluminum foil samples. 5 coupons collected immediately after application. 13.6
Gurunathan et al. (1998)
0.5% Chlorpyrifos
manually-pressurized handwand
Surface wipe samples collected from surface of dressers and toys placed on floor. Value reported is max concentration measured on toys 1 week following
application. 11.5
Krieger (2001) 0.5% Chlorpyrifos
manually-pressurized handwand
Foil samples collected in 3 treated rooms (no information on number of samples per room).
Residue value reported is average for three rooms. 15
Comparison of Residues from Perimeter and Broadcast Treatments
Broadcast residue (µg/cm2) Perimeter residue (µg/cm2) Perimeter Residue =
X% of Broadcast Residues
13.6
9
66%
11.5 78%
15 60%

Appendix D
U.S. EPA Office of Pesticide Programs – Standard Operating Procedures for Assessing Residential Pesticide Exposure D-35
Table D-8: Comparison of Perimeter and Broadcast Treatment Residues (residues from the same study) Perimeter Treatment
SOURCE RESIDUE (µg/cm2)
Selim (2008) 0.1% esfenvalerate aerosol can
Collection media: alpha-cellulose coupons. Sampling time: collected 30 minutes after application. Number of samples: at each sampling time, samples were collected from 61
locations on the floor. Size of room: 15 ft 2 in x 15 ft 2 in (462 cm x 462 cm). Treated area = based on figure in study which showed which coupons were
within treated area. Untreated area = based on figure in study which showed which coupons were
within untreated area. 0.9 µg/cm2 = (30% of average residue from treated area) + (70% of average
residue from untreated area).
0.9
Broadcast Treatment SOURCE RESIDUE (µg/cm2)
Selim (2008) 0.1% esfenvalerate aerosol can
Collection media: alpha-cellulose coupons. Sampling time: collected 30 minutes after application. Number of samples: at each sampling time, samples were collected from 61
locations on the floor. Size of room: 15 ft 2 in x 15 ft 2 in (462 cm x 462 cm).
2.901
Comparison of Residues from Perimeter and Broadcast Treatments
Broadcast residue (ug/cm2) Perimeter residue (ug/cm2) Perimeter Residue =
X% of Broadcast Residue
2.901 0.9 31%
Table D-9: Summary of Perimeter Residues as a Percent of Broadcast Residues from Two Comparisons
Minimum: 31% Maximum: 78% Average: 59%
Proposed in SOP: 50%
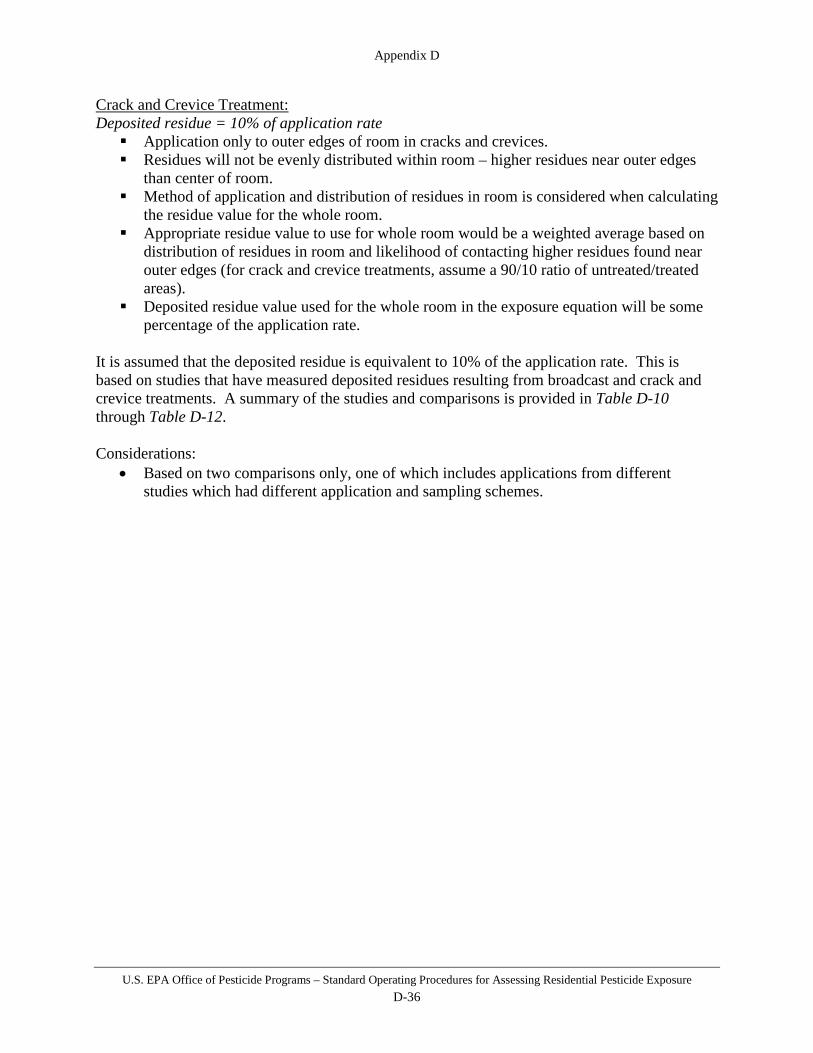
Appendix D
U.S. EPA Office of Pesticide Programs – Standard Operating Procedures for Assessing Residential Pesticide Exposure D-36
Crack and Crevice Treatment: Deposited residue = 10% of application rate Application only to outer edges of room in cracks and crevices. Residues will not be evenly distributed within room – higher residues near outer edges
than center of room. Method of application and distribution of residues in room is considered when calculating
the residue value for the whole room. Appropriate residue value to use for whole room would be a weighted average based on
distribution of residues in room and likelihood of contacting higher residues found near outer edges (for crack and crevice treatments, assume a 90/10 ratio of untreated/treated areas).
Deposited residue value used for the whole room in the exposure equation will be some percentage of the application rate.
It is assumed that the deposited residue is equivalent to 10% of the application rate. This is based on studies that have measured deposited residues resulting from broadcast and crack and crevice treatments. A summary of the studies and comparisons is provided in Table D-10 through Table D-12. Considerations:
• Based on two comparisons only, one of which includes applications from different studies which had different application and sampling schemes.
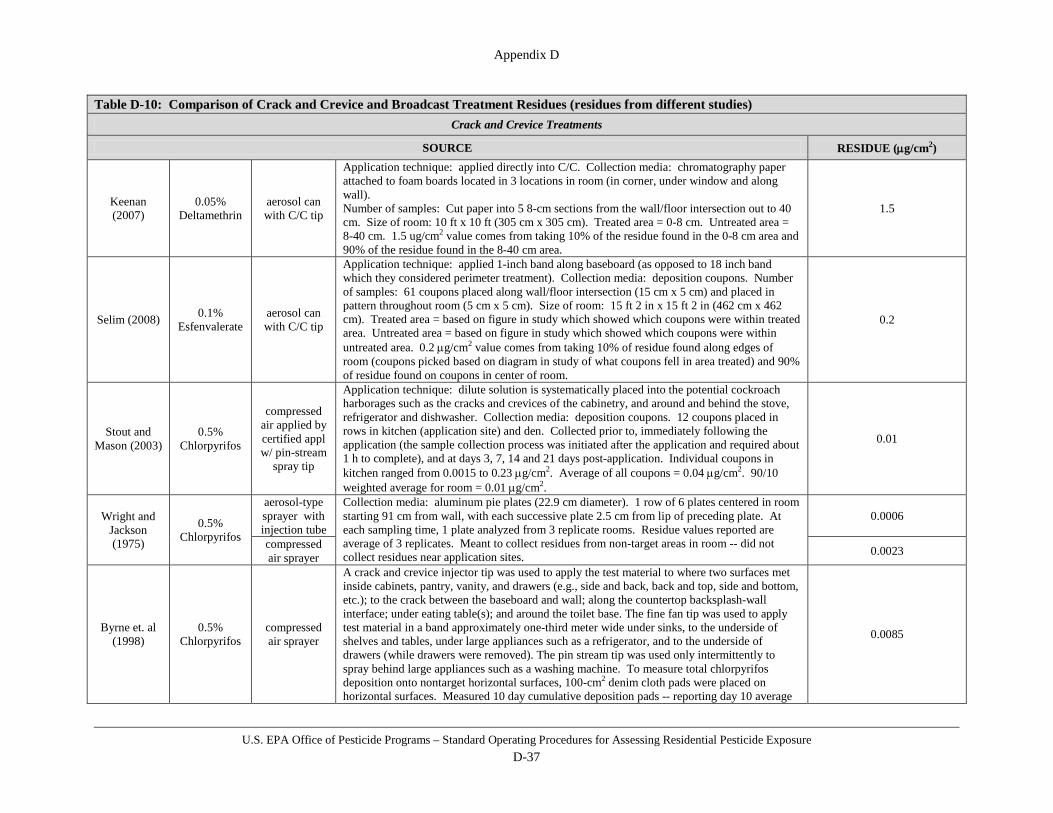
Appendix D
U.S. EPA Office of Pesticide Programs – Standard Operating Procedures for Assessing Residential Pesticide Exposure D-37
Table D-10: Comparison of Crack and Crevice and Broadcast Treatment Residues (residues from different studies) Crack and Crevice Treatments
SOURCE RESIDUE (µg/cm2)
Keenan (2007)
0.05% Deltamethrin
aerosol can with C/C tip
Application technique: applied directly into C/C. Collection media: chromatography paper attached to foam boards located in 3 locations in room (in corner, under window and along wall). Number of samples: Cut paper into 5 8-cm sections from the wall/floor intersection out to 40 cm. Size of room: 10 ft x 10 ft (305 cm x 305 cm). Treated area = 0-8 cm. Untreated area = 8-40 cm. 1.5 ug/cm2 value comes from taking 10% of the residue found in the 0-8 cm area and 90% of the residue found in the 8-40 cm area.
1.5
Selim (2008) 0.1% Esfenvalerate
aerosol can with C/C tip
Application technique: applied 1-inch band along baseboard (as opposed to 18 inch band which they considered perimeter treatment). Collection media: deposition coupons. Number of samples: 61 coupons placed along wall/floor intersection (15 cm x 5 cm) and placed in pattern throughout room (5 cm x 5 cm). Size of room: 15 ft 2 in x 15 ft 2 in (462 cm x 462 cm). Treated area = based on figure in study which showed which coupons were within treated area. Untreated area = based on figure in study which showed which coupons were within untreated area. 0.2 µg/cm2 value comes from taking 10% of residue found along edges of room (coupons picked based on diagram in study of what coupons fell in area treated) and 90% of residue found on coupons in center of room.
0.2
Stout and Mason (2003)
0.5% Chlorpyrifos
compressed air applied by certified appl w/ pin-stream
spray tip
Application technique: dilute solution is systematically placed into the potential cockroach harborages such as the cracks and crevices of the cabinetry, and around and behind the stove, refrigerator and dishwasher. Collection media: deposition coupons. 12 coupons placed in rows in kitchen (application site) and den. Collected prior to, immediately following the application (the sample collection process was initiated after the application and required about 1 h to complete), and at days 3, 7, 14 and 21 days post-application. Individual coupons in kitchen ranged from 0.0015 to 0.23 µg/cm2. Average of all coupons = 0.04 µg/cm2. 90/10 weighted average for room = 0.01 µg/cm2.
0.01
Wright and Jackson (1975)
0.5% Chlorpyrifos
aerosol-type sprayer with injection tube
Collection media: aluminum pie plates (22.9 cm diameter). 1 row of 6 plates centered in room starting 91 cm from wall, with each successive plate 2.5 cm from lip of preceding plate. At each sampling time, 1 plate analyzed from 3 replicate rooms. Residue values reported are average of 3 replicates. Meant to collect residues from non-target areas in room -- did not collect residues near application sites.
0.0006
compressed air sprayer 0.0023
Byrne et. al (1998)
0.5% Chlorpyrifos
compressed air sprayer
A crack and crevice injector tip was used to apply the test material to where two surfaces met inside cabinets, pantry, vanity, and drawers (e.g., side and back, back and top, side and bottom, etc.); to the crack between the baseboard and wall; along the countertop backsplash-wall interface; under eating table(s); and around the toilet base. The fine fan tip was used to apply test material in a band approximately one-third meter wide under sinks, to the underside of shelves and tables, under large appliances such as a refrigerator, and to the underside of drawers (while drawers were removed). The pin stream tip was used only intermittently to spray behind large appliances such as a washing machine. To measure total chlorpyrifos deposition onto nontarget horizontal surfaces, 100-cm2 denim cloth pads were placed on horizontal surfaces. Measured 10 day cumulative deposition pads -- reporting day 10 average
0.0085

Appendix D
U.S. EPA Office of Pesticide Programs – Standard Operating Procedures for Assessing Residential Pesticide Exposure D-38
Table D-10: Comparison of Crack and Crevice and Broadcast Treatment Residues (residues from different studies) values for 2 rooms for each house.
Leidy et. al (1996)
0.5% Chlorpyrifos
aerosol can w/ C&C tip
(residue at floor/wall interface)
Collection media = 2.5 cm x 30.2 cm aluminum template (plate). Samples collected in 3 rooms at wall/floor interface and in center of room. Residues reported from pre-application to 84 days post application. Residues reported here are Day 0 residues. 0.008
aerosol can w/ C&C tip
(residue from center of
room)
0.01
Wright and Jackson (1975)
1% Chlorpyrifos
aerosol-type sprayer with injection tube
Collection media: aluminum pie plates (22.9 cm diameter). 1 row of 6 plates centered in room starting 91 cm from wall, with each successive plate 2.5 cm from lip of preceding plate. At each sampling time, 1 plate analyzed from 3 replicate rooms. Residue values reported are average of 3 replicates. Meant to collect residues from non-target areas in room -- did not collect residues near application sites.
0.0012
compressed air sprayer 0.011
1% Diazinon
aerosol-type sprayer with injection tube
0.0011
compressed air sprayer 0.0053
2% Diazinon
aerosol-type sprayer with injection tube
0.001
compressed air sprayer 0.016
Broadcast Treatments
SOURCE RESIDUE (µg/cm2)
Fenske (1990)
0.5% Chlorpyrifos
manually-pressurized handwand
Collection media: aluminum foil samples. 5 coupons collected immediately after application.
15 Gurunathan et al. (1998)
0.5% Chlorpyrifos
manually-pressurized handwand
Surface wipe samples collected from surface of dressers and toys placed on floor. Value reported is max concentration measured on toys 1 week following application
Krieger (2001)
0.5% Chlorpyrifos
manually-pressurized handwand
Foil samples collected in 3 treated rooms (no information on number of samples per room). Residue value reported is average for three rooms.
Comparison of Residues from Crack and Crevice and Broadcast Treatments
Broadcast residue (µg/cm2) Crack and Crevice residue (µg/cm2) Crack and Crevice Residues = X% of Broadcast Residue

Appendix D
U.S. EPA Office of Pesticide Programs – Standard Operating Procedures for Assessing Residential Pesticide Exposure D-39
Table D-10: Comparison of Crack and Crevice and Broadcast Treatment Residues (residues from different studies)
15
1.5 10% 0.2 1%
0.01 0.07% 0.0006 0.004% 0.0023 0.02% 0.0085 0.06% 0.008 0.05% 0.01 0.07%
0.0012 0.01% 0.011 0.07% 0.0011 0.01% 0.0053 0.04% 0.001 0.01% 0.016 0.11%

Appendix D
U.S. EPA Office of Pesticide Programs – Standard Operating Procedures for Assessing Residential Pesticide Exposure D-40
Table D-11: Comparison of Crack and Crevice and Broadcast Treatment Residues (residues from the same study)
Crack and Crevice Treatment
SOURCE RESIDUE (µg/cm2)
Selim (2008) 0.1% Esfenvalerate
aerosol can with C/C tip
Application technique: applied 1-inch band along baseboard (as opposed to 18 inch band which they considered perimeter treatment). Collection media: deposition coupons. Number of samples: 61 coupons placed along wall/floor intersection (15 cm x 5 cm) and placed in pattern throughout room (5 cm x 5 cm). Size of room: 15 ft 2 in x 15 ft 2 in (462 cm x 462 cm). Treated area = based on figure in study which showed which coupons were within treated area. Untreated area = based on figure in study which showed which coupons were within untreated area. 0.2 ug/cm2 value comes from taking 10% of residue found along edges of room (coupons picked based on diagram in study of what coupons fell in area treated) and 90% of residue found on coupons in center of room.
0.2
Broadcast Treatment
SOURCE RESIDUE (µg/cm2)
Selim (2008) 0.1% Esfenvalerate aerosol can
Collection media: alpha-cellulose coupons. Sampling time: collected 30 minutes after application. Number of samples: at each sampling time, samples were collected from 61 locations on the floor. Size of room: 15 ft 2 in x 15 ft 2 in (462 cm x 462 cm)
2.901
Comparison of Residues from Crack and Crevice and Broadcast Treatments
Broadcast residue (µg/cm2) Crack and Crevice residue (µg/cm2) Crack and Crevice Residue = X% of Broadcast Residue
2.901 0.2 7%
Table D-12: Summary of Crack and Crevice Residues as a Percent of Broadcast Residues from Two Comparisons MINIMUM: 0.004% MAXIMUM: 10% AVERAGE: 1%
Proposed in SOP: 10%

Appendix D
U.S. EPA Office of Pesticide Programs – Standard Operating Procedures for Assessing Residential Pesticide Exposure D-41
D.5.3 Default residue values based on type of application If chemical-specific deposition data are not available and the label does not provide an application rate in terms of mass per unit area, then default residue values may be used based on the percent spray of the product. These values are meant to be high-end conservative values to use when little to no other information is available to calculate a product-specific residue value. Broadcast Treatment (liquids and foggers): Recommended default residue value: 15 µg/cm2 for a 0.5% liquid spray 5.4 µg/cm2 for a 0.5% fogger The default residue value proposed for broadcast liquid formulation treatments is based on a review of four literature studies which measured deposition following application of 0.5% spray pesticide products to indoor residences. The maximum residue value measured was chosen as the default residue value as a conservative approach. The following table provides a summary of the studies considered and further details about each study are provided after the table. It is assumed that the more active ingredient applied (i.e., higher percent spray), the higher the measured residue value would be; therefore, it is proposed in the Indoor SOP that the residue value be adjusted depending on the percent spray.
Table D-13: Summary of Broadcast Default Residue Analysis Active
Ingredient and Percent
Solution Applied
Source Application Equipment
Residue (µg/cm2) Notes on Study
Average residue: 10
Minimum: 2.9
Maximum: 15
0.10% esfenvalerate Selim (2008) aerosol can 2.901
Application technique: The test substance was applied as a broadcast spray across an 8 ft by 8 ft area in the center of the room. Application was performed from a distance of approximately 18 inches, in one foot wide swaths, sweeping across the area in one foot wide rows, while moving backwards, to evenly cover the area, as if applying to a carpet. Sample Collection: Collection media: alpha-cellulose coupons. Sampling time: collected 30 minutes after application. Number of samples: at each sampling time, samples were collected from 61 locations on the floor. Size of room: 15 ft 2 in x 15 ft 2 in (462 cm x 462 cm)
0.50% chlorpyrifos
Vaccaro (1991)
manually-pressurized handwand
7.19
Application technique: Pesticide product diluted with water and applied as an emulsion using a manually-pressurized handwand. Sample collection: Collection media: gauze coupons. Placed randomly on floor in treated room. 4 coupons sampled in room w/o activity and 2 coupons sampled in rooms w/activity (3 rooms). Value reported is average coupon residue for all 4 rooms sampled.
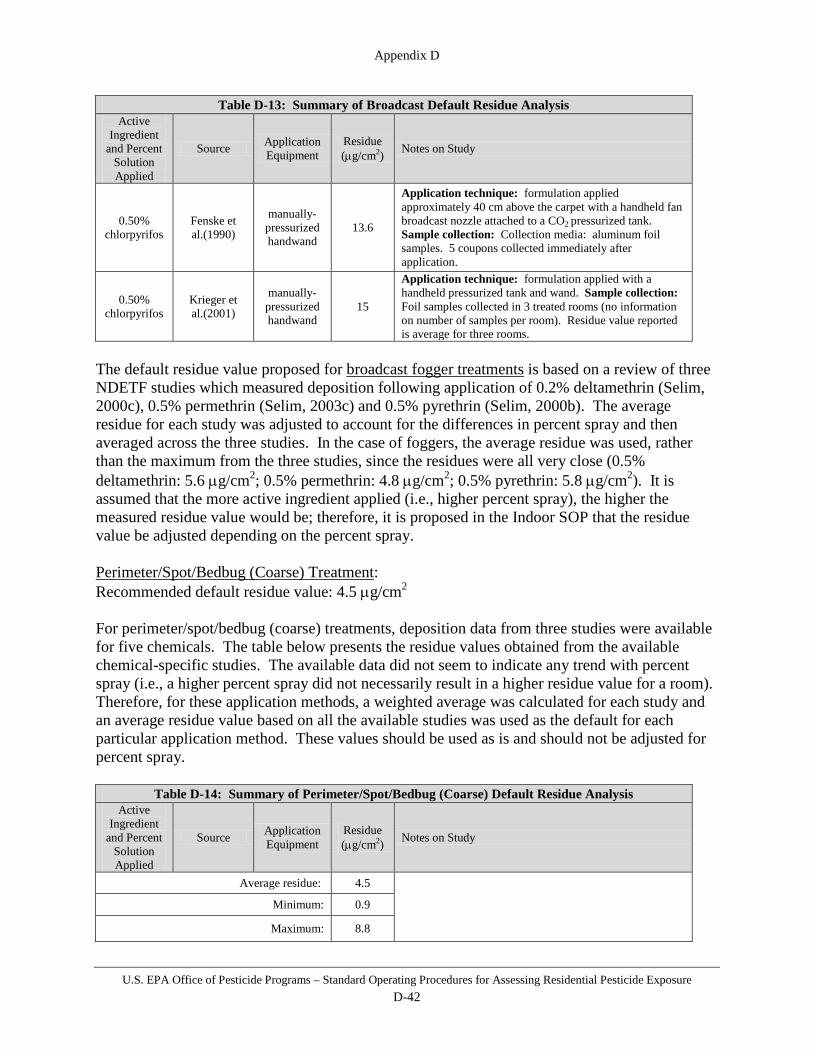
Appendix D
U.S. EPA Office of Pesticide Programs – Standard Operating Procedures for Assessing Residential Pesticide Exposure D-42
Table D-13: Summary of Broadcast Default Residue Analysis Active
Ingredient and Percent
Solution Applied
Source Application Equipment
Residue (µg/cm2) Notes on Study
0.50% chlorpyrifos
Fenske et al.(1990)
manually-pressurized handwand
13.6
Application technique: formulation applied approximately 40 cm above the carpet with a handheld fan broadcast nozzle attached to a CO2 pressurized tank. Sample collection: Collection media: aluminum foil samples. 5 coupons collected immediately after application.
0.50% chlorpyrifos
Krieger et al.(2001)
manually-pressurized handwand
15
Application technique: formulation applied with a handheld pressurized tank and wand. Sample collection: Foil samples collected in 3 treated rooms (no information on number of samples per room). Residue value reported is average for three rooms.
The default residue value proposed for broadcast fogger treatments is based on a review of three NDETF studies which measured deposition following application of 0.2% deltamethrin (Selim, 2000c), 0.5% permethrin (Selim, 2003c) and 0.5% pyrethrin (Selim, 2000b). The average residue for each study was adjusted to account for the differences in percent spray and then averaged across the three studies. In the case of foggers, the average residue was used, rather than the maximum from the three studies, since the residues were all very close (0.5% deltamethrin: 5.6 µg/cm2; 0.5% permethrin: 4.8 µg/cm2; 0.5% pyrethrin: 5.8 µg/cm2). It is assumed that the more active ingredient applied (i.e., higher percent spray), the higher the measured residue value would be; therefore, it is proposed in the Indoor SOP that the residue value be adjusted depending on the percent spray. Perimeter/Spot/Bedbug (Coarse) Treatment: Recommended default residue value: 4.5 µg/cm2 For perimeter/spot/bedbug (coarse) treatments, deposition data from three studies were available for five chemicals. The table below presents the residue values obtained from the available chemical-specific studies. The available data did not seem to indicate any trend with percent spray (i.e., a higher percent spray did not necessarily result in a higher residue value for a room). Therefore, for these application methods, a weighted average was calculated for each study and an average residue value based on all the available studies was used as the default for each particular application method. These values should be used as is and should not be adjusted for percent spray.
Table D-14: Summary of Perimeter/Spot/Bedbug (Coarse) Default Residue Analysis Active
Ingredient and Percent
Solution Applied
Source Application Equipment
Residue (µg/cm2) Notes on Study
Average residue: 4.5
Minimum: 0.9
Maximum: 8.8
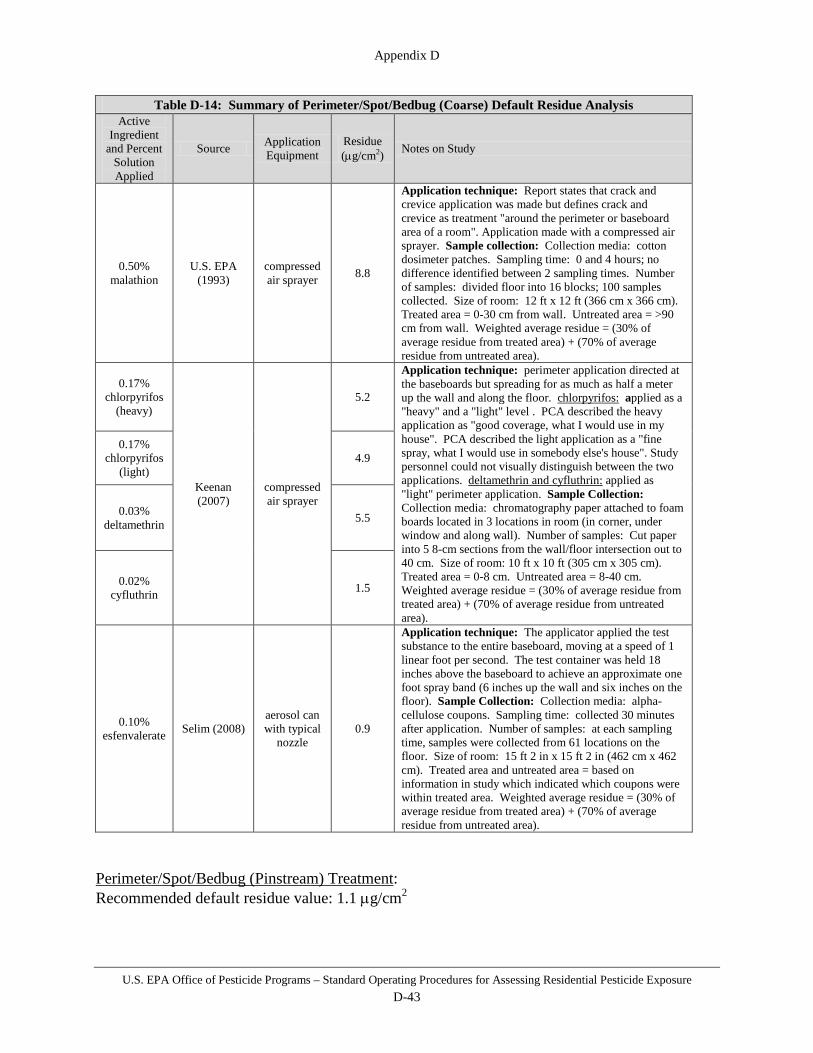
Appendix D
U.S. EPA Office of Pesticide Programs – Standard Operating Procedures for Assessing Residential Pesticide Exposure D-43
Table D-14: Summary of Perimeter/Spot/Bedbug (Coarse) Default Residue Analysis Active
Ingredient and Percent
Solution Applied
Source Application Equipment
Residue (µg/cm2) Notes on Study
0.50% malathion
U.S. EPA (1993)
compressed air sprayer 8.8
Application technique: Report states that crack and crevice application was made but defines crack and crevice as treatment "around the perimeter or baseboard area of a room". Application made with a compressed air sprayer. Sample collection: Collection media: cotton dosimeter patches. Sampling time: 0 and 4 hours; no difference identified between 2 sampling times. Number of samples: divided floor into 16 blocks; 100 samples collected. Size of room: 12 ft x 12 ft (366 cm x 366 cm). Treated area = 0-30 cm from wall. Untreated area = >90 cm from wall. Weighted average residue = (30% of average residue from treated area) + (70% of average residue from untreated area).
0.17% chlorpyrifos
(heavy)
Keenan (2007)
compressed air sprayer
5.2
Application technique: perimeter application directed at the baseboards but spreading for as much as half a meter up the wall and along the floor. chlorpyrifos: applied as a "heavy" and a "light" level . PCA described the heavy application as "good coverage, what I would use in my house". PCA described the light application as a "fine spray, what I would use in somebody else's house". Study personnel could not visually distinguish between the two applications. deltamethrin and cyfluthrin: applied as "light" perimeter application. Sample Collection: Collection media: chromatography paper attached to foam boards located in 3 locations in room (in corner, under window and along wall). Number of samples: Cut paper into 5 8-cm sections from the wall/floor intersection out to 40 cm. Size of room: 10 ft x 10 ft (305 cm x 305 cm). Treated area = 0-8 cm. Untreated area = 8-40 cm. Weighted average residue = (30% of average residue from treated area) + (70% of average residue from untreated area).
0.17% chlorpyrifos
(light) 4.9
0.03% deltamethrin 5.5
0.02% cyfluthrin 1.5
0.10% esfenvalerate Selim (2008)
aerosol can with typical
nozzle 0.9
Application technique: The applicator applied the test substance to the entire baseboard, moving at a speed of 1 linear foot per second. The test container was held 18 inches above the baseboard to achieve an approximate one foot spray band (6 inches up the wall and six inches on the floor). Sample Collection: Collection media: alpha-cellulose coupons. Sampling time: collected 30 minutes after application. Number of samples: at each sampling time, samples were collected from 61 locations on the floor. Size of room: 15 ft 2 in x 15 ft 2 in (462 cm x 462 cm). Treated area and untreated area = based on information in study which indicated which coupons were within treated area. Weighted average residue = (30% of average residue from treated area) + (70% of average residue from untreated area).
Perimeter/Spot/Bedbug (Pinstream) Treatment: Recommended default residue value: 1.1 µg/cm2
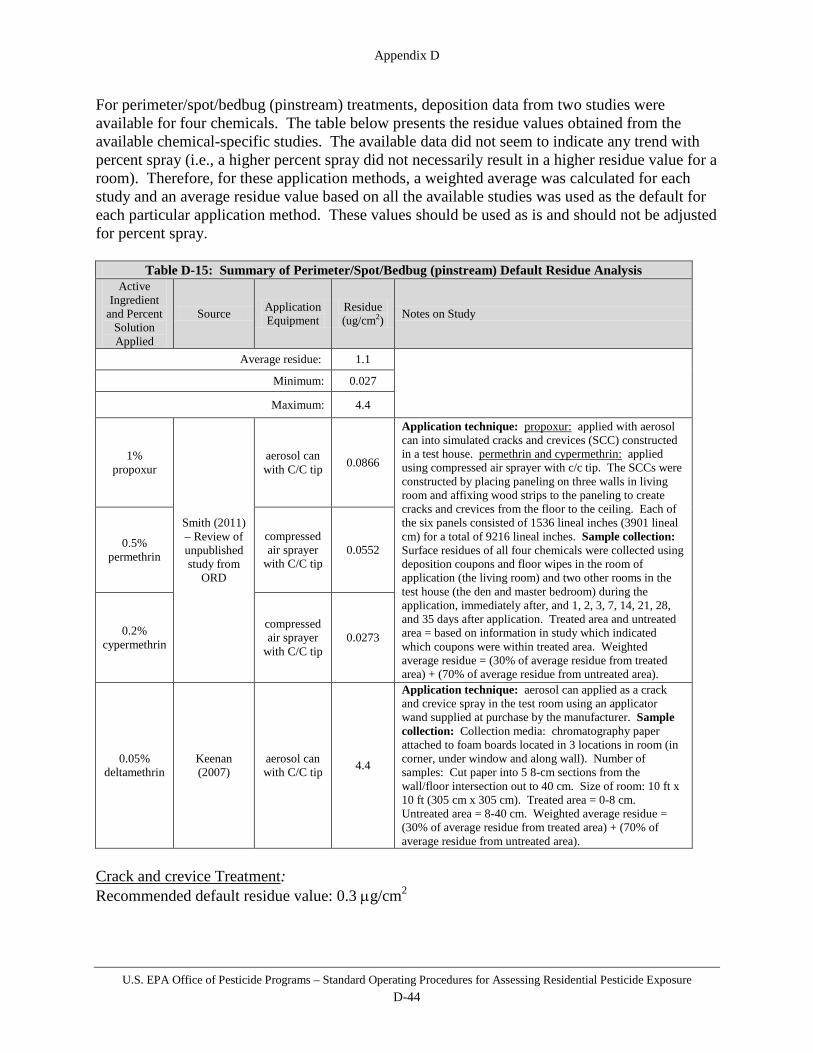
Appendix D
U.S. EPA Office of Pesticide Programs – Standard Operating Procedures for Assessing Residential Pesticide Exposure D-44
For perimeter/spot/bedbug (pinstream) treatments, deposition data from two studies were available for four chemicals. The table below presents the residue values obtained from the available chemical-specific studies. The available data did not seem to indicate any trend with percent spray (i.e., a higher percent spray did not necessarily result in a higher residue value for a room). Therefore, for these application methods, a weighted average was calculated for each study and an average residue value based on all the available studies was used as the default for each particular application method. These values should be used as is and should not be adjusted for percent spray.
Table D-15: Summary of Perimeter/Spot/Bedbug (pinstream) Default Residue Analysis Active
Ingredient and Percent
Solution Applied
Source Application Equipment
Residue (ug/cm2) Notes on Study
Average residue: 1.1
Minimum: 0.027
Maximum: 4.4
1% propoxur
Smith (2011) – Review of unpublished study from
ORD
aerosol can with C/C tip 0.0866
Application technique: propoxur: applied with aerosol can into simulated cracks and crevices (SCC) constructed in a test house. permethrin and cypermethrin: applied using compressed air sprayer with c/c tip. The SCCs were constructed by placing paneling on three walls in living room and affixing wood strips to the paneling to create cracks and crevices from the floor to the ceiling. Each of the six panels consisted of 1536 lineal inches (3901 lineal cm) for a total of 9216 lineal inches. Sample collection: Surface residues of all four chemicals were collected using deposition coupons and floor wipes in the room of application (the living room) and two other rooms in the test house (the den and master bedroom) during the application, immediately after, and 1, 2, 3, 7, 14, 21, 28, and 35 days after application. Treated area and untreated area = based on information in study which indicated which coupons were within treated area. Weighted average residue = (30% of average residue from treated area) + (70% of average residue from untreated area).
0.5% permethrin
compressed air sprayer
with C/C tip 0.0552
0.2% cypermethrin
compressed air sprayer
with C/C tip 0.0273
0.05% deltamethrin
Keenan (2007)
aerosol can with C/C tip 4.4
Application technique: aerosol can applied as a crack and crevice spray in the test room using an applicator wand supplied at purchase by the manufacturer. Sample collection: Collection media: chromatography paper attached to foam boards located in 3 locations in room (in corner, under window and along wall). Number of samples: Cut paper into 5 8-cm sections from the wall/floor intersection out to 40 cm. Size of room: 10 ft x 10 ft (305 cm x 305 cm). Treated area = 0-8 cm. Untreated area = 8-40 cm. Weighted average residue = (30% of average residue from treated area) + (70% of average residue from untreated area).
Crack and crevice Treatment: Recommended default residue value: 0.3 µg/cm2

Appendix D
U.S. EPA Office of Pesticide Programs – Standard Operating Procedures for Assessing Residential Pesticide Exposure D-45
For crack and crevice treatments, deposition data from two studies were available for four chemicals. The table below presents the residue values obtained from the available chemical-specific studies. The available data did not seem to indicate any trend with percent spray (i.e., a higher percent spray did not necessarily result in a higher residue value for a room). Therefore, for these application methods, a weighted average was calculated for each study and an average residue value based on all the available studies was used as the default for each particular application method. These values should be used as is and should not be adjusted for percent spray.
Table D-16: Summary of Crack and Crevice Default Residue Analysis Active
Ingredient and Percent
Solution Applied
Source Application Equipment
Residue (µg/cm2) Notes on Study
Average residue: 0.3
Minimum: 0.00956
Maximum: 1.5
1% propoxur
Smith (2011) – Review of unpublished study from
ORD
aerosol can with C/C tip 0.0319
Application technique: propoxur: applied with aerosol can into simulated cracks and crevices (SCC) constructed in a test house. permethrin and cypermethrin: applied using compressed air sprayer with c/c tip. The SCCs were constructed by placing paneling on three walls in living room and affixing wood strips to the paneling to create cracks and crevices from the floor to the ceiling. Each of the six panels consisted of 1536 lineal inches (3901 lineal cm) for a total of 9216 lineal inches. Sample collection: Surface residues of all four chemicals were collected using deposition coupons and floor wipes in the room of application (the living room) and two other rooms in the test house (the den and master bedroom) during the application, immediately after, and 1, 2, 3, 7, 14, 21, 28, and 35 days after application. Treated area and untreated area = based on information in study which indicated which coupons were within treated area. Weighted average residue = (10% of average residue from treated area) + (90% of average residue from untreated area).
0.5% permethrin
compressed air sprayer
with C/C tip 0.019
0.2% cypermethrin
compressed air sprayer
with C/C tip 0.00956
0.5% chlorpyrifos
Stout and Mason (2003)
compressed air applied by certified appl w/ pin-stream spray
tip
0.01
Application technique: dilute solution is systematically placed into the potential cockroach harborages such as the cracks and crevices of the cabinetry, and around and behind the stove, refrigerator and dishwasher. Sample collection: Collection media: deposition coupons. 12 coupons placed in rows in kitchen (application site) and den. Collected prior to, immediately following the application (the sample collection process was initiated after the application and required about 1 h to complete), and at days 3, 7, 14 and 21 days post-application. Individual coupons in kitchen ranged from 0.0015 to 0.23 ug/cm2. Weighted average residue = (10% of average residue from treated area) + (90% of average residue from untreated area).

Appendix D
U.S. EPA Office of Pesticide Programs – Standard Operating Procedures for Assessing Residential Pesticide Exposure D-46
Table D-16: Summary of Crack and Crevice Default Residue Analysis Active
Ingredient and Percent
Solution Applied
Source Application Equipment
Residue (µg/cm2) Notes on Study
0.1% esfenvalerate Selim (2008) aerosol can
with C/C tip 0.2
Application technique: The applicator applied the test substance to the entire baseboard (corner), moving at a speed of 1 linear foot per second. The test container was held 12 to 18 inches above the baseboard to achieve an approximate one inch spray band at the floor/wall interface. Sample Collection: Collection media: deposition coupons. Number of samples: 61 coupons placed along wall/floor intersection (15 cm x 5 cm) and placed in pattern throughout room (5 cm x 5 cm). Size of room: 15 ft 2 in x 15 ft 2 in (462 cm x 462 cm). Treated area = based on figure in study which showed which coupons were within treated area. Untreated area = based on figure in study which showed which coupons were within untreated area. Weighted average residue = (10% of average residue from treated area) + (90% of average residue from untreated area)
0.05% deltamethrin
Keenan (2007)
aerosol can with C/C tip 1.5
Application technique: applied directly into C/C. Sample collection: Collection media: chromatography paper attached to foam boards located in 3 locations in room (in corner, under window and along wall). Number of samples: Cut paper into 5 8-cm sections from the wall/floor intersection out to 40 cm. Size of room: 10 ft x 10 ft (305 cm x 305 cm). Treated area = 0-8 cm. Untreated area = 8-40 cm. Weighted average residue = (10% of average residue from treated area) + (90% of average residue from untreated area)
D.6 Generic Estimates of Transferable Residue Following an application, pesticide residue that remains on target surfaces (e.g., carpets, leaves, turf, etc.) and thus available for surface-to-skin transfer is referred to as transferable residue. Examples of non-transferable residue would be residue that evaporates, adheres to carpet fibers, or absorbs into plant surfaces. Typically, chemical-specific studies are submitted quantifying transferable residue using standardized and replicable methodologies on the day of application (i.e., “day 0”) and subsequent days (i.e., 1, 3, 5, 7 days) following application. This data can then be directly used in mathematical models to estimate daily residue. When a chemical-specific study is unavailable, however, transferable residue on the day of application (i.e., “day 0”) can be estimated as a fraction of the application rate (e.g., 10% of the application rate as transferable residue on the day of application) and transferable residue on subsequent days can be calculated using a daily dissipation rate (e.g., 15% of the transferable residue on the day of application is present on the day after application). Existing transferable residue studies for a variety of chemicals can provide a basis for generic approximations of the “day 0” transferable residue and daily dissipation when chemical-specific studies are unavailable to assess post-application exposure in outdoor and indoor residential settings. “Day 0” transferable residue, as a fraction of the application rate, is derived as the ratio
Appendix D
U.S. EPA Office of Pesticide Programs – Standard Operating Procedures for Assessing Residential Pesticide Exposure D-47
of the application rate as a mass per area target surface concentration (e.g., lbs active ingredient per acre) to the measured mass per area “day 0” concentration. Converting each value to the same units provides a unitless ratio which can also be considered as a percentage (i.e., 10% of the application is transferable residue on the day of application). Daily residue dissipation is typically derived using a first-order exponential decay model. Each day’s measured transferable residue is log-transformed and regressed against the day of application using ordinary least squares (OLS). The resulting slope represents a constant fraction, or percentage, of residue that dissipates per day. The following sections present analyses of existing studies for various residential settings.
D.6.1 Turf Transferable residue on turf has historically been referred to as transferable turf residue (TTR), and can be measured using a number of different techniques. The industry-based Occupational and Residential Exposure Task Force (ORETF) tested five techniques in 1996: the California roller method, the shoe method, the polyurethane foam (PUF) roller method, the drag sled method, and the foliar wash method. A follow-up study was conducted on a turf farm in 1997 using three modified techniques: the modified California roller method, the modified shoe method, and the ORETF roller method. The data from both of these studies is summarized and analyzed in a 1999 ORETF report (Cowell, J., and Johnson, D., 1999). Ultimately – based on the information provided by ORETF and working in conjunction with the California Department of Pesticide Regulation (DPR) and Canada’s Pest Management Regulatory Agency (PMRA) – a TTR collection method (the Modified California Roller Method) was agreed upon for all future TTR studies. The Modified California Roller was selected because it produced the most consistent results across individuals, active ingredients, formulation types, and time than the other techniques. It also was sensitive enough to detect low levels of residues and was one of the easier techniques to use. In a typical TTR study, triplicate samples are collected using the Modified California Roller Method before the day of application, on the day of application, and for several days following the application (e.g., 1, 3, 5, 7 days after application). Each sample is then extracted in solution to yield a mass of chemical which can be expressed as a turf residue concentration (e.g., [X] µg per [X] cm2). This data can then be directly used in mathematical models to estimate daily residue. TTR studies can also be used as surrogates in the event chemical-specific information is unavailable for a particular pesticide. The Agency analyzed 36 TTR studies using liquid formulations, 11 TTR studies using wettable powders/water dispersible granular (WP/WDG) formulations, and 12 studies using granular formulations for the purposes of establishing generic transferable residue factors. Since they are applied as sprays, residue data resulting from applications with the liquid/wettable powder/water dispersible granular formulation were combined while residues from applications of granular formulations were treated separately. Table D-17 and Table D-18 present the “day 0” transferable residue as a fraction of the application rate (F) for each of the 47 liquid/wettable powder/water dispersible granular studies and each of the 12 granular studies, respectively.

Appendix D
U.S. EPA Office of Pesticide Programs – Standard Operating Procedures for Assessing Residential Pesticide Exposure D-48
Table D-17: Residential Turf – Liquid/WP/WDG Transferable Residue Data
MRID Number Active Ingredient Site Formulation
Fraction of Application
Rate Available for Transfer
(F)
45040701 Isoxaban CA DF 0.015 IN DF 0.011 MS DF 0.0070
44901001 Chlorothalonil GA DF 0.010 NY DF 0.0042 OR DF 0.006
44955501 Permethrin GA EC 0.0064 CA EC 0.0085 PA EC 0.0061
45288601 Propiconazole IN EC 0.0016 CA EC 0.0097 PA EC 0.0045
45361602 Fluroxypyr CA EC 0.0043 MS EC 0.0035 PA EC 0.0074
45118725 Pyraclostrobin NC EC 0.0018 CA EC 0.0062 PA EC 0.0022
46684102 Pendimethalin PA EC 0.0019 GA EC 0.0016 CA EC 0.0021
45260201 Trinexapac-methyl GA EC 0.0047 CA EC 0.0031 IN EC 0.0069
44958501 Mancozeb NC F 0.00077 PA F 0.00041 CA F 0.00097
44958701 Simazine CA L 0.0027 FL L 0.0032
44958901 Monosodium Methanearsonate
NY L 0.0029 NC L 0.0014 CA L 0.015
45067201 Trichlorfon GA L 0.00015 MO L 0.000033 NY L 0.0000050
44687101 Pentachloronitrobenzene CA L 0.011 OR L 0.0081 MO L 0.0067
45251501 Propamocarb CA L 0.0043 MO L 0.0035 VA L 0.0090
45894314 Propamocarb hydrochloride
CA L 0.013 PA L 0.011
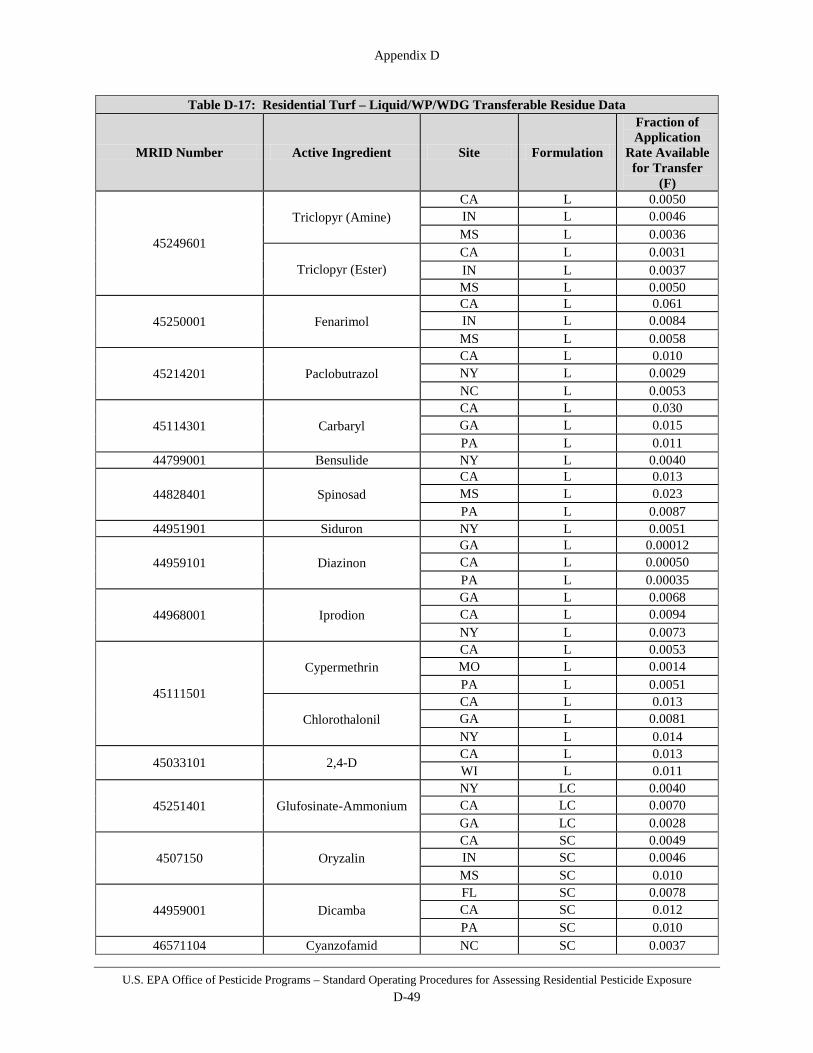
Appendix D
U.S. EPA Office of Pesticide Programs – Standard Operating Procedures for Assessing Residential Pesticide Exposure D-49
Table D-17: Residential Turf – Liquid/WP/WDG Transferable Residue Data
MRID Number Active Ingredient Site Formulation
Fraction of Application
Rate Available for Transfer
(F)
45249601
Triclopyr (Amine) CA L 0.0050 IN L 0.0046 MS L 0.0036
Triclopyr (Ester) CA L 0.0031 IN L 0.0037 MS L 0.0050
45250001 Fenarimol CA L 0.061 IN L 0.0084 MS L 0.0058
45214201 Paclobutrazol CA L 0.010 NY L 0.0029 NC L 0.0053
45114301 Carbaryl CA L 0.030 GA L 0.015 PA L 0.011
44799001 Bensulide NY L 0.0040
44828401 Spinosad CA L 0.013 MS L 0.023 PA L 0.0087
44951901 Siduron NY L 0.0051
44959101 Diazinon GA L 0.00012 CA L 0.00050 PA L 0.00035
44968001 Iprodion GA L 0.0068 CA L 0.0094 NY L 0.0073
45111501
Cypermethrin CA L 0.0053 MO L 0.0014 PA L 0.0051
Chlorothalonil CA L 0.013 GA L 0.0081 NY L 0.014
45033101 2,4-D CA L 0.013 WI L 0.011
45251401 Glufosinate-Ammonium NY LC 0.0040 CA LC 0.0070 GA LC 0.0028
4507150 Oryzalin CA SC 0.0049 IN SC 0.0046 MS SC 0.010
44959001 Dicamba FL SC 0.0078 CA SC 0.012 PA SC 0.010
46571104 Cyanzofamid NC SC 0.0037

Appendix D
U.S. EPA Office of Pesticide Programs – Standard Operating Procedures for Assessing Residential Pesticide Exposure D-50
Table D-17: Residential Turf – Liquid/WP/WDG Transferable Residue Data
MRID Number Active Ingredient Site Formulation
Fraction of Application
Rate Available for Transfer
(F)
45576801 Triticonazole GA SC 0.0060 CA SC 0.0032 NY SC 0.0017
46703508 Penoxsulam GA SC 0.043 FL SC 0.0068
47172301 Mesotrione NY SC 0.00096 CA SC 0.0032 GA SC 0.0017
45251201
Deltamethrin NY SC 0.0058 GA SC 0.0086 CA SC 0.014
Oryzalin CA SC 0.061 IN SC 0.011 MS SC 0.013
45640010 Dinotefuran CA SG 0.0061 PA SG 0.0066 GA SG 0.0047
44969901 Pendimethalin CA WDG 0.030
45071501 Chlorothalonil (Daconil, Ultrex)
CA WDG 0.0049 GA WDG 0.0046 NY WDG 0.010
45405301 Nicotinamide PA WDG 0.011 GA WDG 0.0044 CA WDG 0.0090
45102911
methyl 2,4-[o-(methylphenoxymethyl)ph
enyl]-2-methoxyimino) acetamide
NC WDG 0.0043 CA WDG 0.014
PA WDG 0.017
45260401 Prodimaine GA WDG 0.0098 CA WDG 0.0012 PA WDG 0.00091
45149001 Cyfluthrin
GA WP 0.011 MS WP 0.015 NY WP 0.0034 CA WP 0.012 MO WP 0.0069 PA WP 0.017
44952501 Pronamide NC WP 0.027
44952901 Myclobutanil NC WP 0.012 CA WP 0.024
44806401 Acephate Fl WSP 0.0052 44995502 Oxadiazon GA WSP 0.026
F = Fraction of residue available on day 0 Range of Data = 0.000005 – 0.061 (n = 131)

Appendix D
U.S. EPA Office of Pesticide Programs – Standard Operating Procedures for Assessing Residential Pesticide Exposure D-51
Table D-18: Residential Turf – Granular Transferable Residue Data
MRID Number Active Ingredient Site Formulation
Fraction of Application
Rate Available for Transfer (F)
44958801 Atrazine GA G 0.0021 FL G 0.0069
45260401 Prodimaine GA G 0.00021 CA G 0.00022 PA G 0.00039
44829601 Chlorpyrifos CA G 0.0013 IN G 0.00075 MS G 0.00075
44959101 Diazinon GA G 0.000039 CA G 0.000012 PA G 0.000028
45067201 Trichlorfon GA G 0.000006 MO G 0.000032
44998301
Benefin CA G 0.000109 IN G 0.000087 MS G 0.000047
Trifluralin CA G 0.00012 IN G 0.000094 MS G 0.000067
46673901 Carbaryl FL G 0.0062 KS G 0.0019 CA G 0.0051
47172301 Mesotrione NY G 0.00077 CA G 0.0016 GA G 0.0017
45249601 Triclopyr, Clopyralid CA G 0.0051 IN G 0.0025 MS G 0.0023
45040701
Isoxaben (Gallery) CA G 0.00080 IN G 0.0020 MS G 0.00030
Isoxaben (Gallery plus Surflan)
CA G 0.0059 IN G 0.0027 MS G 0.00030
Oryzalin (Gallery plus Surflan)
CA G 0.0060 IN G 0.0030 MS G 0.00020
F = Fraction of residue available on day 0 Range of Data = 0.0000064 – 0.0069 (n = 37)

Appendix D
U.S. EPA Office of Pesticide Programs – Standard Operating Procedures for Assessing Residential Pesticide Exposure D-52
D.6.2 Gardens, Trees, and “Pick-your-own” Farms Transferable residue in vegetable, fruit, and flower gardens, trees, shrubs, bushes, and “pick-your-own” farms has historically been referred to as dislodgeable foliar residue (DFR). In chemical-specific studies, DFR is measured using a “leaf-punch” technique. Three (3) samples, each containing 40 leaf punches equal to approximately 400 square centimeters (cm2) of 2-sided foliar surface area, are collected on the day of application and for several days following the application (e.g., 1, 3, 5, 7 days after application). Each of the 3 samples is then “dislodged” in solution to yield a mass of chemical which can be expressed as a foliar concentration (e.g., [X] µg per 400 cm2). DFR studies can also be used as surrogates in the event chemical-specific information is unavailable for a particular pesticide. Nineteen (19) studies conducted by the Agricultural Reentry Task Force (ARTF) were analyzed for the purposes of establishing generic transferable residue factors. Table D-19 below presents the “day 0” transferable residue as a fraction of the application rate (FAR) and the fraction per day daily dissipation (FD) for each of the 19 studies.
Table D-19: Gardens, Trees, and “Pick-your-own” Farms – Transferable Residue Data
Study Reference
Crop Chemical Application
Rate (lb ai/acre)
Day 0 DFR (measured; µg ai/cm2)
Transferable Residue as fraction of
Application Rate (FAR)
Fraction per Day Daily
Dissipation (FD)
ARTF # MRID
ARF025 45138202 Apple Malathion 1.25 2.45 0.17
0.09 2.18 0.16 2.33 0.17
ARF028 45175101 Orange Cyfluthrin 0.10 0.03 0.02
0.03 0.04 0.04 0.04 0.03
ARF044 45469502 Nursery Citrus Malathion 1.20 1.38 0.10
0.47 1.77 0.13 1.26 0.09
ARF009 45005904 Sweet Corn Chlorothalonil 1.40 1.82 0.12
0.19 4.43 0.28 4.80 0.31
ARF021 45005908 Dry Bean/Pea Chlorothalonil 1.40 1.78 0.11
0.07 1.57 0.10 1.45 0.09
ARF041 45432301 Orange Carbaryl 7.07 24.20 0.31
0.04 24.60 0.31 30.00 0.38
ARF010 45005905 Sweet Corn Chlorothalonil 1.40 3.83 0.24
0.32 2.31 0.15 2.27 0.14
ARF022 45005909 Sunflower Carbaryl 1.50 4.93 0.29
0.13 6.05 0.36 4.78 0.28
ARF048 45491901 Wine Grapes Malathion 0.93 0.44 0.04
0.32 0.69 0.07 0.78 0.07
ARF023 45005910 Raisin Grapes Malathion 0.94 1.37 0.13 0.10
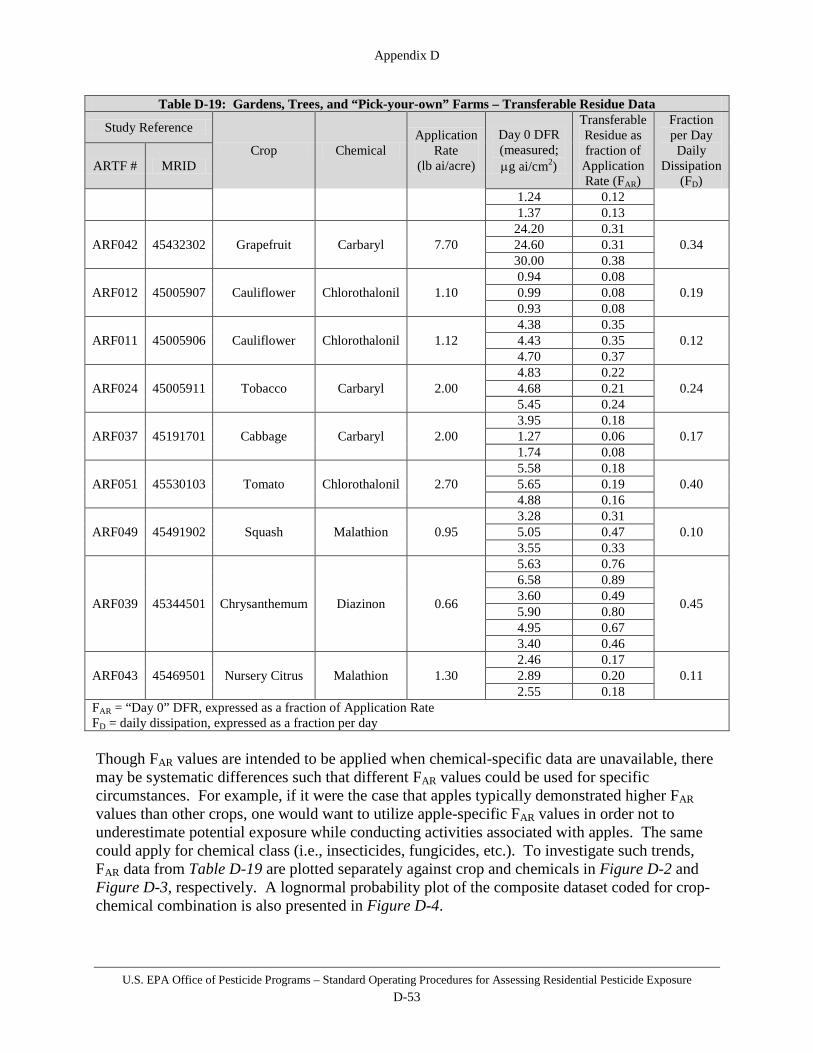
Appendix D
U.S. EPA Office of Pesticide Programs – Standard Operating Procedures for Assessing Residential Pesticide Exposure D-53
Table D-19: Gardens, Trees, and “Pick-your-own” Farms – Transferable Residue Data
Study Reference
Crop Chemical Application
Rate (lb ai/acre)
Day 0 DFR (measured; µg ai/cm2)
Transferable Residue as fraction of
Application Rate (FAR)
Fraction per Day Daily
Dissipation (FD)
ARTF # MRID
1.24 0.12 1.37 0.13
ARF042 45432302 Grapefruit Carbaryl 7.70 24.20 0.31
0.34 24.60 0.31 30.00 0.38
ARF012 45005907 Cauliflower Chlorothalonil 1.10 0.94 0.08
0.19 0.99 0.08 0.93 0.08
ARF011 45005906 Cauliflower Chlorothalonil 1.12 4.38 0.35
0.12 4.43 0.35 4.70 0.37
ARF024 45005911 Tobacco Carbaryl 2.00 4.83 0.22
0.24 4.68 0.21 5.45 0.24
ARF037 45191701 Cabbage Carbaryl 2.00 3.95 0.18
0.17 1.27 0.06 1.74 0.08
ARF051 45530103 Tomato Chlorothalonil 2.70 5.58 0.18
0.40 5.65 0.19 4.88 0.16
ARF049 45491902 Squash Malathion 0.95 3.28 0.31
0.10 5.05 0.47 3.55 0.33
ARF039 45344501 Chrysanthemum Diazinon 0.66
5.63 0.76
0.45
6.58 0.89 3.60 0.49 5.90 0.80 4.95 0.67 3.40 0.46
ARF043 45469501 Nursery Citrus Malathion 1.30 2.46 0.17
0.11 2.89 0.20 2.55 0.18
FAR = “Day 0” DFR, expressed as a fraction of Application Rate FD = daily dissipation, expressed as a fraction per day Though FAR values are intended to be applied when chemical-specific data are unavailable, there may be systematic differences such that different FAR values could be used for specific circumstances. For example, if it were the case that apples typically demonstrated higher FAR values than other crops, one would want to utilize apple-specific FAR values in order not to underestimate potential exposure while conducting activities associated with apples. The same could apply for chemical class (i.e., insecticides, fungicides, etc.). To investigate such trends, FAR data from Table D-19 are plotted separately against crop and chemicals in Figure D-2 and Figure D-3, respectively. A lognormal probability plot of the composite dataset coded for crop-chemical combination is also presented in Figure D-4.

Appendix D
U.S. EPA Office of Pesticide Programs – Standard Operating Procedures for Assessing Residential Pesticide Exposure D-54
Figure D-2: Fraction of Transferable Residue, By Chemical
F-AR
0
0.1
0.2
0.3
0.4
0.5
0.6
0.7
0.8
0.9
Carb
aryl
(ARF
022)
Carb
aryl
(ARF
024)
Carb
aryl
(ARF
037)
Carb
aryl
(ARF
041)
Carb
aryl
(ARF
042)
Chlor
otha
lonil (
ARF0
09)
Chlor
otha
lonil (
ARF0
10)
Chlor
otha
lonil (
ARF0
11)
Chlor
otha
lonil (
ARF0
12)
Chlor
otha
lonil (
ARF0
21)
Chlor
otha
lonil (
ARF0
51)
Cyflu
thrin
(ARF
028)
Diaz
inon
(ARF
039)
Mala
thion
(ARF
023)
Mala
thion
(ARF
025)
Mala
thion
(ARF
043)
Mala
thion
(ARF
044)
Mala
thion
(ARF
048)
Mala
thion
(ARF
049)
Chemical
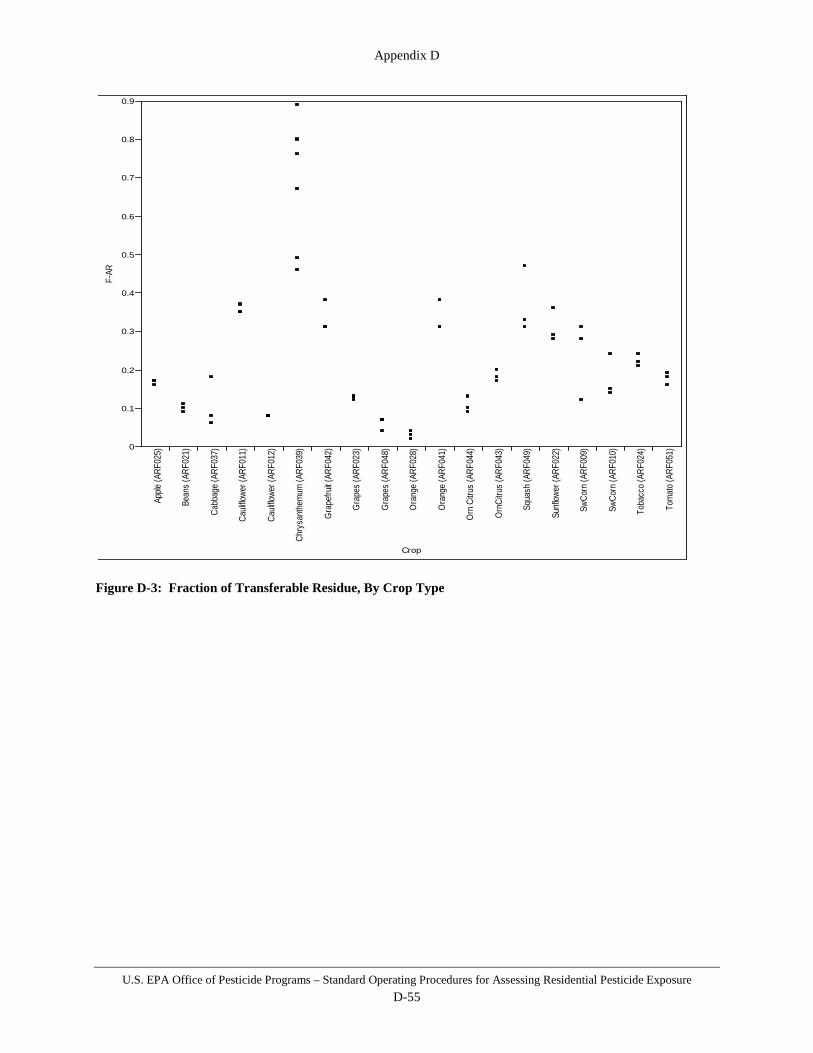
Appendix D
U.S. EPA Office of Pesticide Programs – Standard Operating Procedures for Assessing Residential Pesticide Exposure D-55
Figure D-3: Fraction of Transferable Residue, By Crop Type
F-AR
0
0.1
0.2
0.3
0.4
0.5
0.6
0.7
0.8
0.9
Apple
(ARF
025)
Bean
s (A
RF02
1)
Cabb
age
(ARF
037)
Cauli
flowe
r (AR
F011
)
Cauli
flowe
r (AR
F012
)
Chry
sant
hem
um (A
RF03
9)
Gra
pefru
it (AR
F042
)
Gra
pes
(ARF
023)
Gra
pes
(ARF
048)
Ora
nge
(ARF
028)
Ora
nge
(ARF
041)
Orn
Citr
us (A
RF04
4)
Orn
Citru
s (A
RF04
3)
Squa
sh (A
RF04
9)
Sunf
lower
(ARF
022)
SwCo
rn (A
RF00
9)
SwCo
rn (A
RF01
0)
Toba
cco
(ARF
024)
Tom
ato
(ARF
051)
Crop

Appendix D
U.S. EPA Office of Pesticide Programs – Standard Operating Procedures for Assessing Residential Pesticide Exposure D-56
Figure D-4: Gardens and Trees – Fraction of Available Residue Lognormal Probability Plot It is not clear from the data whether any broad categories can be defined for FAR values. For example, Figure D-4 shows that while malathion demonstrates relatively high FAR values (0.31 – 0.47; ARF049) it also demonstrates some of the lowest (0.04 – 0.07; ARF048). The same appears to be the case for specific crops with oranges, as one example, demonstrating fairly high FAR values (0.31 – 0.38; ARF041) and low FAR values (0.02 – 0.04; ARF028). Due to the the lack of meaningful trends or patterns in these datasets, the FAR values (as well as residue dissipation values) are pooled into composite datasets for the purposes of providing generic transferable residue factors for exposure assessment. Lognormal probability plots for these composite datasets are presented below in Figure D-5 and Figure D-6.
Lognormal Probability PlotGardens and Trees: FAR
-4.00
-3.50
-3.00
-2.50
-2.00
-1.50
-1.00
-0.50
0.00
-3.00 -2.00 -1.00 0.00 1.00 2.00 3.00
Standard Normal Score
ln (F
)Oranges_cyfluthrin (ARF028)
Mums_diazinon (ARF039)
Cabbage_carbaryl (ARF037)
Orange_carbaryl (ARF041)
Grapefruit_carbary (ARF042)l
Tobacco_carbaryl (ARF024)
Sunflower_carbaryl (ARF022)
Tomato_chlorothalonil (ARF051)
Peas_chlorothalonil (ARF021)
SwCorn_chlorothalonil (ARF009)
SwCorn_chlorothalonil (ARF010)
Cauliflower_chlorothalonil(ARF012)
Cauliflower_chlorothalonil(ARF011)
Grape_malathion (ARF048)
Grape_malathion (ARF023)
Apple_malathion (ARF025)
OrnCtirus_malathion (ARF043)
Squash_malathion (ARF049)
OrnCitrus_malathion (ARF044)
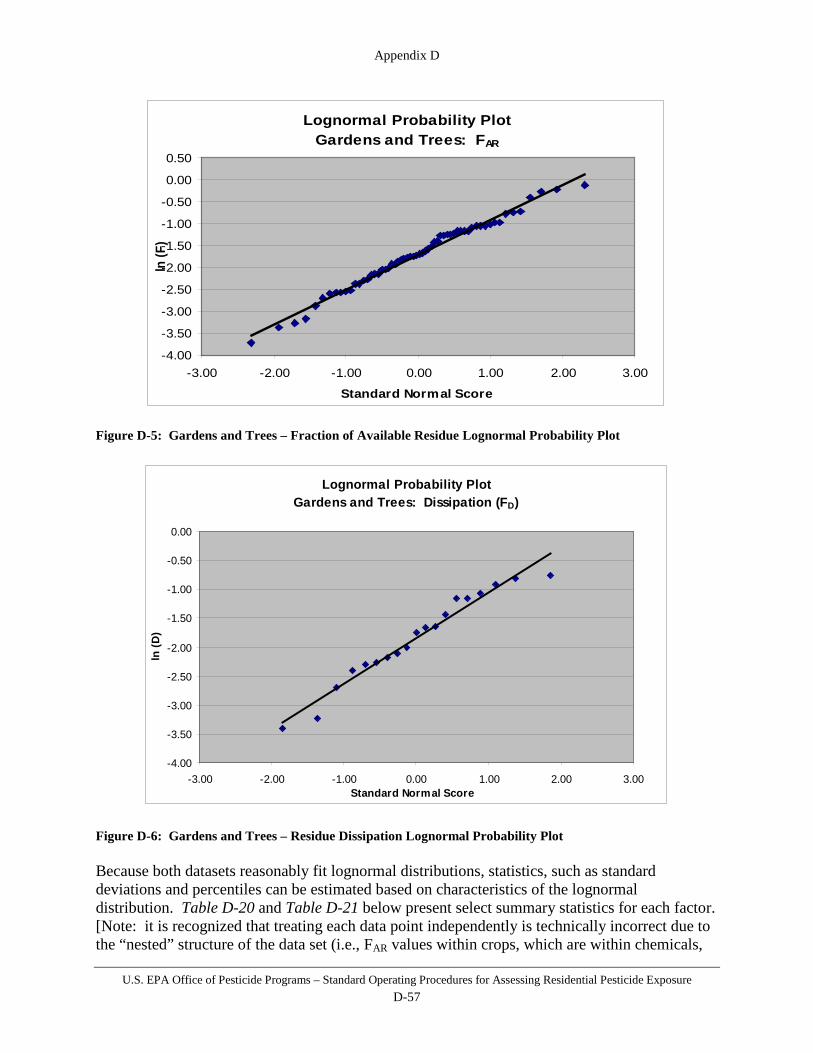
Appendix D
U.S. EPA Office of Pesticide Programs – Standard Operating Procedures for Assessing Residential Pesticide Exposure D-57
Figure D-5: Gardens and Trees – Fraction of Available Residue Lognormal Probability Plot
Figure D-6: Gardens and Trees – Residue Dissipation Lognormal Probability Plot Because both datasets reasonably fit lognormal distributions, statistics, such as standard deviations and percentiles can be estimated based on characteristics of the lognormal distribution. Table D-20 and Table D-21 below present select summary statistics for each factor. [Note: it is recognized that treating each data point independently is technically incorrect due to the “nested” structure of the data set (i.e., FAR values within crops, which are within chemicals,
Lognormal Probability PlotGardens and Trees: FAR
-4.00
-3.50
-3.00
-2.50
-2.00
-1.50
-1.00
-0.50
0.00
0.50
-3.00 -2.00 -1.00 0.00 1.00 2.00 3.00
Standard Normal Score
ln (F
)
Lognormal Probability PlotGardens and Trees: Dissipation (FD)
-4.00
-3.50
-3.00
-2.50
-2.00
-1.50
-1.00
-0.50
0.00
-3.00 -2.00 -1.00 0.00 1.00 2.00 3.00Standard Normal Score
ln (D
)
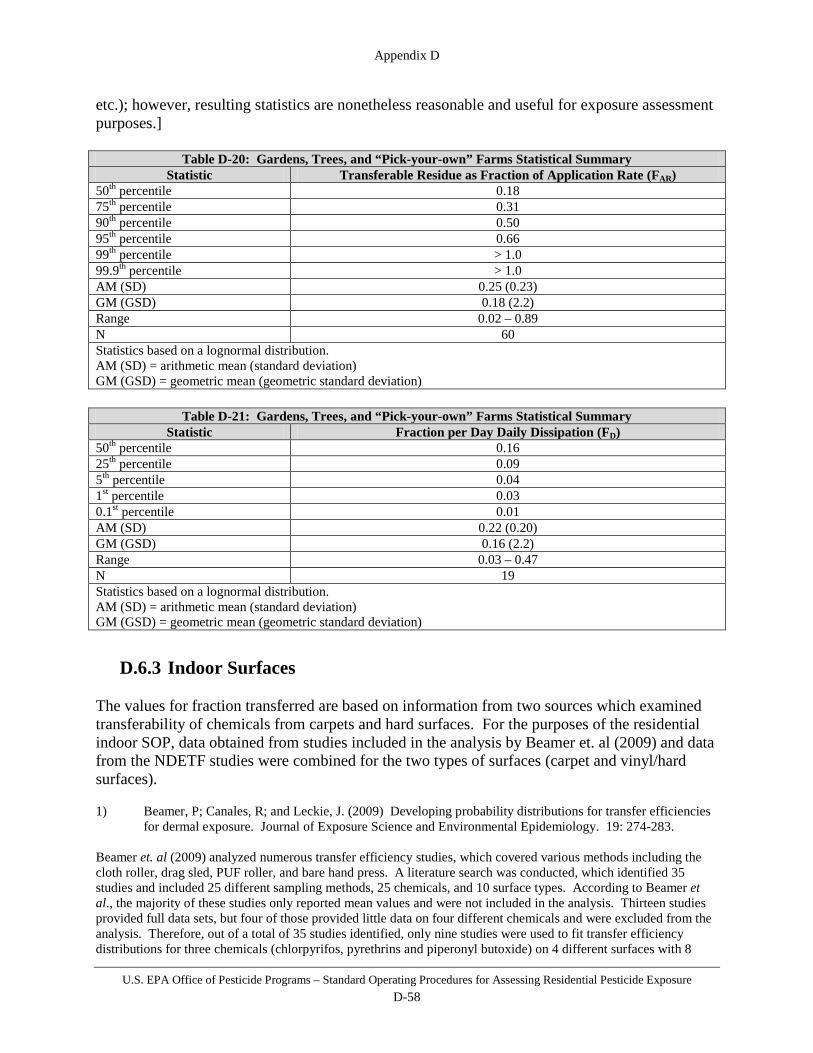
Appendix D
U.S. EPA Office of Pesticide Programs – Standard Operating Procedures for Assessing Residential Pesticide Exposure D-58
etc.); however, resulting statistics are nonetheless reasonable and useful for exposure assessment purposes.]
Table D-20: Gardens, Trees, and “Pick-your-own” Farms Statistical Summary Statistic Transferable Residue as Fraction of Application Rate (FAR)
50th percentile 0.18 75th percentile 0.31 90th percentile 0.50 95th percentile 0.66 99th percentile > 1.0 99.9th percentile > 1.0 AM (SD) 0.25 (0.23) GM (GSD) 0.18 (2.2) Range 0.02 – 0.89 N 60 Statistics based on a lognormal distribution. AM (SD) = arithmetic mean (standard deviation) GM (GSD) = geometric mean (geometric standard deviation)
Table D-21: Gardens, Trees, and “Pick-your-own” Farms Statistical Summary Statistic Fraction per Day Daily Dissipation (FD)
50th percentile 0.16 25th percentile 0.09 5th percentile 0.04 1st percentile 0.03 0.1st percentile 0.01 AM (SD) 0.22 (0.20) GM (GSD) 0.16 (2.2) Range 0.03 – 0.47 N 19 Statistics based on a lognormal distribution. AM (SD) = arithmetic mean (standard deviation) GM (GSD) = geometric mean (geometric standard deviation)
D.6.3 Indoor Surfaces The values for fraction transferred are based on information from two sources which examined transferability of chemicals from carpets and hard surfaces. For the purposes of the residential indoor SOP, data obtained from studies included in the analysis by Beamer et. al (2009) and data from the NDETF studies were combined for the two types of surfaces (carpet and vinyl/hard surfaces). 1) Beamer, P; Canales, R; and Leckie, J. (2009) Developing probability distributions for transfer efficiencies
for dermal exposure. Journal of Exposure Science and Environmental Epidemiology. 19: 274-283. Beamer et. al (2009) analyzed numerous transfer efficiency studies, which covered various methods including the cloth roller, drag sled, PUF roller, and bare hand press. A literature search was conducted, which identified 35 studies and included 25 different sampling methods, 25 chemicals, and 10 surface types. According to Beamer et al., the majority of these studies only reported mean values and were not included in the analysis. Thirteen studies provided full data sets, but four of those provided little data on four different chemicals and were excluded from the analysis. Therefore, out of a total of 35 studies identified, only nine studies were used to fit transfer efficiency distributions for three chemicals (chlorpyrifos, pyrethrins and piperonyl butoxide) on 4 different surfaces with 8

Appendix D
U.S. EPA Office of Pesticide Programs – Standard Operating Procedures for Assessing Residential Pesticide Exposure D-59
different methods. Most of the transfer efficiencies were measured relatively soon after application (i.e., within 24 hours). Data sets were compared using a non-parametric analysis of variance method and the Kruskal-Wallis test to determine whether different combinations of data sets arise from the same distribution. The data sets were initially separated by chemical and surface type. The Kruskall-Wallis test was used to determine whether data sets from different sampling methods, but for the same chemical and surface could be combined. All data sets for a specific chemical and surface type were evaluated and data sets were eliminated one by one, with the attempt being to maximize the number of data points until the p-value was greater than 0.05. The experimental methods of the combined data sets were assessed to determine whether there were any consistent trends related to the inclusion/exclusion of data sets. No consistent trends were observed with respect to different transfer efficiency methods, dry versus wet hand presses, different application concentrations and formulations and different sampling time points after application. The combined data set was assessed to determine which distribution was a best fit and it was determined to be the lognormal distribution. The Kruskal-Wallis p-value for all surface and chemical combinations was less than 0.0001, indicating that distributions are statistically different. A trend for pesticide transfer was observed for surface type with transfer from vinyl being higher than from carpet. Full data sets were provided for 5 studies which were utilized for this SOP and included the following studies: Camann, D.; Harding, H.; Geno, P.; and Agrawl S. (1996). Comparison of Methods to Determine Dislodgeable Residue Transfer from Floors (EPA/600/R96/089) United States Environmental Protection Agency, Research Triangle Park, NC.
Three methods were evaluated for measurement of freshly-applied pesticide residues on carpeted and vinyl floors. Tests were conducted to determine the relative performance of the three methods for removal of dislodgeable residues and to compare them with human skin. The Dow drag sled and the Southwest Research Institute polyurethane foam (PUF) roller performed better than the California cloth roller. Moistening the sampling media increased the transfer by the drag sled and the PUF roller, but substantially increased measurement variability. An isopropanol handwipe method efficiently removed dried pesticide residues from the hands of volunteers (104% of chlorpyrifos, 92% of pyrethrin I). Both the drag sled and the PUF roller were found to be acceptable dislodgeable residue methods on the basis of these studies. The transfer efficiency of the drag sled consistently exceeded the transfer efficiency of the PUF roller, which consistently exceeded the transfer efficiency of human hand presses. This relationship was observed for a variety of pesticides, loadings, application methods, and surfaces. The pliable polyurethane foam sampling surface of the PUF roller with its rolling action is likely to better simulate human skin in its transfer via contact with surfaces than is the denim cloth of the Dow sled with its drag action. Either memanical method can be used to estimate dermal transfer of pesticide residues from recently treated floors. Round-robin testing of the drag sled and PUF roller by potential registrants under strict QA/QC guidance from EPA is recommended.
Fortune, C. (1997). Round-Robin Testing of Methods for Collecting Dislodgeable Residues from Carpets. (EPA/600/R97/107). United States Environmental Protection Agency, Research Triangle Park, NC.
A round-robin test was conducted using six volunteers to evaluate three dislodgeable residue methods sampling new carpets treated with a commercial pesticide formulation. Seven separate tests were performed, each using a formulation containing three target pesticides (chlorpyrifos, pyrethrin I, and piperonyl butoxide). Strict QA/QC guidelines were followed as each participant collected three replicate samples each with the polyurethane foam (PUF) roller, the California roller, and the Dow drag sled methods. Sampling precision was high for all three methods for measurements of this type. The overall results (mean % RSD, relative standard deviation, N=21) show the Dow sled with the best sampling precision (25.4% RSD), followed by the California roller (30.7%), and then the PUF roller (37.9%). Mean transfer efficiency, the ratio of the method transfer rate to the pesticide deposition rate, was highest for the California roller (5.0%), followed by the Dow sled (2.1%) and the PUF roller (1.7%). The mean transfer efficiency rates in this study were substantially higher than those reported in earlier studies of this type. Information relating to ease of use, simplicity, time requirements, and other criteria for each of the test methods was obtained from written subjective evaluation and critique by each volunteer. A compilation of that information revealed that both the Dow sled and PUF roller methods were rated highly and equal to

Appendix D
U.S. EPA Office of Pesticide Programs – Standard Operating Procedures for Assessing Residential Pesticide Exposure D-60
one another, while the California roller was rated lower. Further testing is recommended to determine the effect on transfer efficiency rates due to carpet age, type and prior cleaning or chemical treatment.
Krieger, R. I., C. E. Bernard, T. M. Dinoff, L. Fell, T. Osimitz, J. H. Ross, and T. Thongsinthusak. (2000). Biomonitoring and whole body cotton dosimetry to estimate potential human dermal exposure to semivolatile chemicals. J. Exposure Analysis & Environ. Epidemiol. 10: 50-57.
Current methods of estimating absorbed dosage (AD) of chemicals were evaluated to determine residue transfer from a carpet treated with chlorpyrifos (CP) to humans who performed a structured exercise routine. To determine the dislodgeability of residue, a California Department of Food and Agriculture (CDFA) roller was applied to a flat cotton cloth upon a treated carpet. Levels ranged from 0.06 to 0.99 µg CP/cm2. Cotton whole body dosimeters (WBD) were also used to assess residue transfer. The dosimeters retained 1.5 to 38 mg CP/person. Urine biomonitoring (3 days) for 3,5,6-trichloro-2-pyridinol(TCP) of persons who wore only swimsuits revealed a mean AD of 176 µg CP equivalents/person. The results show that the AD depends on the extent of contact transfer and dermal absorption of the residue. Default exposure assessments based upon environmental levels of chemicals and hypothetical transport pathways predict excessive exposure. The cotton WBD retains chemical residues and may be effectively used to predict dermal dose under experimental conditions.
Ross, J; Fong, HR; Thongsinthusak, T; Margetich, S; Krieger, R. (1991). Measuring potential dermal transfer of surface pesticide residue generated from indoor fogger use: using the CDFA roller methods. Chemosphere 22: 975 – 984.
A standardized, reproducible method of surrogate dermal monitoring was devised to supplement knowledge of the potential transfer of pesticide residues from floor surfaces to persons in contact with the floor. This device was a 12 kg foam-covered rolling cylinder equipped with stationary handles. The device was rolled over a cotton cloth (the actual collection media) placed over carpet to be sampled. This method transfers between 1 and 3 percent of the potential available pesticide material from nylon carpeting to the collection media. Transfer from carpet to cotton cloth correlates highly with transfer to cotton clothing worn by persons exercising on the carpet.
Clothier, J. (2000). Dermal Transfer Efficiency of Pesticides from New Vinyl Sheet Flooring to Dry and Wetted Palms. (EPA/600/R00/029). United States Environmental Protection Agency, Research Triangle Park, NC.
This report presents results of a study to determine the transfer efficiencies from carpet to human skin of four pesticides commonly used for residential indoor insect control. Formulations of the insecticides chlorpyrifos, pyrethrin I and piperonyl butoxide were applied to new, cut-pile nylon carpeting by broadcast spray and allowed to dry for 4 hours. Deposition coupons were used to estimate initial surface loadings and the PUF Roller was to measure dislodgeable residues. After the 4-hour drying period, adult volunteers performed hand presses (left and right hands, palm only) with either dry or wetted skin. Water, an aqueous dioctylsulfosuccinate (DSS) surfactant solution, and the participant's own saliva were used as wetting agents. Transfer efficiencies for wetted palms were two to six higher than those for dry palms. The mean (six presses) transfer efficiencies for chlorpyrifos were 1.64% for water-wetted (W), 0.90% for saliva-wetted (S), 1.21% for DSS-wetted, and 0.48% for dry skin (D). Transfer efficiencies for the other two freshly-applied pesticides were higher in most cases (W = 2.50%, S = 1.87%, DSS = 1.39%, and D = 0.32% for pyrethrin I and W = 2.58%, S = 2.03%, DSS = 1.72%, and D = 0.44% for piperonyl butoxide). Transfer efficiencies for aged permethrin residues in used carpet of similar composition were on the same order as those observed for freshly-applied residues: 2.45% for palms moistened with water, 2.3% with saliva, and 0.6% for dry palms.
2) An analysis of data provided by the Non-Dietary Exposure Task Force (NDETF) was conducted. This
analysis included data for bare hand presses on carpets and vinyl surfaces for deltamethrin, permethrin, piperonyl butoxide and pyrethrin.
2a) MRID 46188605: Measurement of Transfer of Pyrethrin and Piperonyl Butoxide Residues from Vinyl
Flooring Treated with a Fogger Formulation.

Appendix D
U.S. EPA Office of Pesticide Programs – Standard Operating Procedures for Assessing Residential Pesticide Exposure D-61
The purpose of the study was to determine the degree of transfer of pyrethrin (PY) and piperonyl butoxide (PBO) residue from treated vinyl flooring to dry bare hands after a single application of a fogger formulation containing 0.778% PY and 1.55% PBO. A total release aerosol fogger product was applied using a sprayboom apparatus in the center of four 16 ft. x 16 ft. x 8 ft. test rooms. Additionally, the study compared residue transfer from bare hands using alternate methods (indoor roller and drag sled) for measuring residue transfer from the application of an indoor aerosol fogger. Total deposition was measured using coupons, collected after the product application and drying period, respectively. During the application, and for three hours thereafter, the ventilation system in the room was turned off with the dampers closed to allow for deposition of the spray onto the test surfaces. After the three hours, the dampers were opened for a 30 minute drying period and then the flooring sections were transferred to a hand press test room. Residues remaining on bare and gloved hands, percale from indoor roller, and denium from a drag sled following contact with treated vinyl surfaces were determined. The analysis of the alpha cellulose deposition coupons for the roller, drag samples and first and second hand presses (bare and gloved) show that the mean deposition rate of PY and PBO is consistent from application to application and is reproducible. A comparison of the percent transfer of PY and PBO residues from the roller, drag sled, bare and gloved hands shows that for all procedures the percent transferability of PY is higher than that of PBO.
2b) MRID 46188614: Determination of Pyrethrin (PY) and Piperonyl Butoxide (PBO) Residue on the Hand
from Treated Vinyl Flooring Sections Following Hand Press on Untreated Surfaces.
The purpose of the study was to determine the amount of residue left on a hand exposed to vinyl flooring treated with a formulation containing pyrethrin (PY) and piperonyl butoxide (PBO) following hand contact with untreated vinyl flooring surfaces. In this study, three test rooms were used, with one containing the application equipment (the sprayboom). Sixty-six vinyl flooring sections were pinned onto a sheet of plastic-covered plywood attached to the top of six 40 in x 40 in wooden platforms. Total deposition was measured using deposition coupons, which were collected after application of the test material, followed by a drying period. After collection of the deposition coupons, four vinyl flooring sections were removed and moved to a hand press room. Two male test subjects performed one hand press on the treated surface and 4 separate hand presses on untreated pieces of vinyl flooring. Each subject performed hand presses with each hand, for a total of four replicates. The subjects’ hands were then cleaned with isopropyl alcohol dressing sponges to remove any remaining residues. Hand residues averaged 34.3 ng/cm2 for PY and 38.4 ng/cm2
for PBO. Corrected deposition coupon residues averaged 5.91 ± 1.68 µg/cm2 for PY and 14.52 ± 3.54 µg/cm2 for PBO. PY and PBO residues on the hand were estimated to be 0.58% and 0.26% of the PY and PBO applied to the vinyl flooring, as determined from the deposition coupons.
2c) MRID 46297602: Measurement of Transfer of Deltamethrin Residue from Vinyl and Carpet Flooring
Treated with a Fogger Formulation Following a Single Hand Press.
The purpose of the study was two-fold. The first objective was to determine the amount of deltamethrin residue transferred from treated vinyl and carpet flooring to dry hands using both a hand press and roller technique. The second objective was to compare the degree of residue transferred for each collection methodology: isopropyl alcohol (IPA) hand wipes and cotton gloves used for the hand press technique and cotton percale cloth used for the modified California indoor roller technique. The test formulation contained a target weight percentage of 0.15% deltamethrin (DTM) (wt/wt). It was applied via a sprayboom that was meant to simulate a fogger spray. Total deposition was monitored using alpha cellulose deposition coupons placed at various randomly selected locations on the platforms. Residues resulting from a single, dry hand press approximately 3.5 hours following application were measured on vinyl and carpet flooring using the following sampling techniques and collection methodologies: IPA hand wipes and cotton gloves for the hand press, and percale cloth for the indoor modified California roller. Calculation of the percent transferability is a function of the measured hand residue and the DTM deposition on the corresponding flooring. Residue transfer using the modified indoor California roller appears to be higher for carpets than vinyl (2.8% to 1.5%, respectively). Residue transfer using cotton gloves appears to be higher for carpets than vinyl (2.7% to 1.9%, respectively). Residue transfer using IPA wipes appears to be higher for vinyl flooring than carpet (4.7% to 1.4%, respectively). Overall, after

Appendix D
U.S. EPA Office of Pesticide Programs – Standard Operating Procedures for Assessing Residential Pesticide Exposure D-62
combining % transferability across residue collection methodologies, transfer from vinyl flooring appears to be higher than carpet (2.6% to 2.1%, respectively). It should be noted that this is likely because of the relatively high % transferability from vinyl measured using IPA wipes (4.7%) compared with all the other methodologies (range of 1.4% to 2.8%).
2d) MRID 46188625: Measurement of Transfer of Permethrin and Piperonyl Butoxide Residues from Vinyl
and Carpet Flooring Treated with a Fogger Formulation Following a Single Hand Press.
The purpose of the study was twofold. The first objective was to determine the amount of permethrin (PER) and piperonyl butoxide (PBO) residue transferred from treated vinyl and carpet flooring to bare and gloved adult hands utilizing a single hand press collection technique. The second objective was to compare the degree of residue transferred via two sampling strategies, i.e., (1) transfer from the single hand press technique versus (2) transfer to cotton percale cloth using the modified California indoor roller method. The test formulation contained a target weight percentage of 0.77% permethrin (PER) (wt/wt) and 0.77% piperonyl butoxide (PBO) (wt/wt). It was applied via a sprayboom that was meant to simulate the use of a ready-to-use fogger. Total deposition was monitored using alpha cellulose deposition coupons placed at various randomly selected locations on the platforms. Residues resulting from a single, dry hand press approximately 3.5 hours following application were measured on vinyl and carpet flooring using the following sampling techniques and collection methodologies: IPA hand wipes and cotton gloves for the hand press, and percale cloth for the indoor modified California roller. Calculation of the percent transferability is a function of the measured hand residue and the DTM deposition on the corresponding flooring. For the indoor California roller, the findings illustrate that the percentage of PBO and PER residue transferred from carpet flooring sections to percale was higher than the percentage transferred from vinyl flooring sections. Also, the percentage of PBO transferred from vinyl to percale was less than half the percentage of PER transferred, while for carpet flooring surfaces, the percentage of PBO and PER transferred was similar. For treated vinyl surfaces, the percent of PER transferred to the percale, gloved or bare hands, was always higher than the percent of PBO transferred. For carpet treated samples, the percent of PER and PBO residues transferred onto bare or gloved hands, are similar.
2e) MRID 46188628: Determination of Permethrin (PER) and Piperonyl Butoxide (PBO) Residue on the Hand
Following Hand Press on Treated and Untreated Vinyl and Carpet.
The purpose of the study was to determine residue concentrations of permethrin (PER) and piperonyl butoxide (PBO) on bare hands following: 1) contact with either a treated vinyl tile or carpet swatch and then 2) contact with respective untreated vinyl tiles or carpet swatches. The study was conducted in two climate controlled test rooms. One room was outfitted with a fixed overhead sprayboom system. The carpet swatches and vinyl tiles were arranged beneath the spray boom for treatment in the first room while the hand procedures were performed in the second room. The formulation applied was meant to simulate a single application of a total release fogger product containing 0.77% PER and 0.77% PBO. During the spray application, and for three hours thereafter, the ventilation system in the room was turned off with the dampers closed to allow for deposition of the spray onto the test surfaces. After the three hours, the dampers were opened for a 30 minute drying period and then the carpet swatches and vinyl tiles were transferred to the second room to perform the hand press procedures. For the bare hand presses, two subjects were recruited to press their hands on a single treated swatch or vinyl tile followed by four separate presses (one each) on untreated carpet swatches or vinyl tiles respectively. Four samples were collected (two subjects times two hands). The residues remaining on the hands following this procedure were collected via isopropanol moistened dressing sponges. The mean percent of the application rate (deposition) collected from the hands was 0.83% (PER) and 0.48% (PBO) for the vinyl tiles and 1.55% (PER) and 1.49% (PBO) for the carpet swatches.
2f) MRID 46188620: Determination of Pyrethrin (PY) and Piperonyl Butoxide (PBO) Residue on the Hand
Following Hand Press on Treated and Untreated Carpet.
The purpose of the study was to determine residue concentrations of pyrethrin (PY) and piperonyl butoxide (PBO) on bare hands following: 1) contact with a treated carpet swatch and then 2) contact with untreated carpet swatches. The study was conducted in two climate controlled test rooms. One room was outfitted

Appendix D
U.S. EPA Office of Pesticide Programs – Standard Operating Procedures for Assessing Residential Pesticide Exposure D-63
with a fixed overhead sprayboom system. The carpet swatches were arranged beneath the spray boom for treatment in the first room while the hand procedures were performed in the second room. The formulation applied was meant to simulate a single application of a total release fogger product containing 0.77% PY and 1.55% PBO. During the spray application, and for three hours thereafter, the ventilation system in the room was turned off with the dampers closed to allow for deposition of the spray onto the test surfaces. After the three hours, the dampers were opened for a 30 minute drying period and then the carpet swatches were transferred to the second room to perform the hand press procedures. For the bare hand presses, two subjects were recruited to press their hands on a single treated swatch and then to make an additional four separate presses (one each) on untreated carpet swatches. Four samples were collected (two subjects times two hands). The residues remaining on the hands following this procedure were collected via isopropanol moistened dressing sponges. The mean percent of the application rate (deposition) collected from the hands was 4.43% (PY) and 4.57% (PBO).
Carpets
Table D-22: Indoor Environments – Fraction Transferred Data for Carpets (Fai)
Chemical Information Source Study Method Transferable Residue as Fraction of Application Rate
Deltamethrin NDETF 46297602 handpress 0.0204 Deltamethrin NDETF 46297602 handpress 0.0167 Deltamethrin NDETF 46297602 handpress 0.0204 Deltamethrin NDETF 46297602 handpress 0.0185 Deltamethrin NDETF 46297602 handpress 0.0130 Deltamethrin NDETF 46297602 handpress 0.0139 Deltamethrin NDETF 46297602 handpress 0.0130 Deltamethrin NDETF 46297602 handpress 0.0046 Deltamethrin NDETF 46297602 handpress 0.0093 Deltamethrin NDETF 46297602 handpress 0.0157 Permethrin NDETF 46188625 handpress 0.0170 Permethrin NDETF 46188625 handpress 0.0312 Permethrin NDETF 46188625 handpress 0.0188 Permethrin NDETF 46188625 handpress 0.0098 Permethrin NDETF 46188625 handpress 0.0186 Permethrin NDETF 46188625 handpress 0.0146 Permethrin NDETF 46188625 handpress 0.0158 Permethrin NDETF 46188625 handpress 0.0172 Permethrin NDETF 46188625 handpress 0.0230 Permethrin NDETF 46188625 handpress 0.0324 Permethrin NDETF 46188628 handpress 0.0188 Permethrin NDETF 46188628 handpress 0.0137 Permethrin NDETF 46188628 handpress 0.0167 Permethrin NDETF 46188628 handpress 0.0128 Pyrethrin NDETF 46188620 handpress 0.0591 Pyrethrin NDETF 46188620 handpress 0.0615 Pyrethrin NDETF 46188620 handpress 0.0568 Pyrethrin NDETF 46188620 handpress 0.0418
PBO NDETF 46188625 handpress 0.0192 PBO NDETF 46188625 handpress 0.0359 PBO NDETF 46188625 handpress 0.0205 PBO NDETF 46188625 handpress 0.0107 PBO NDETF 46188625 handpress 0.0214 PBO NDETF 46188625 handpress 0.0178
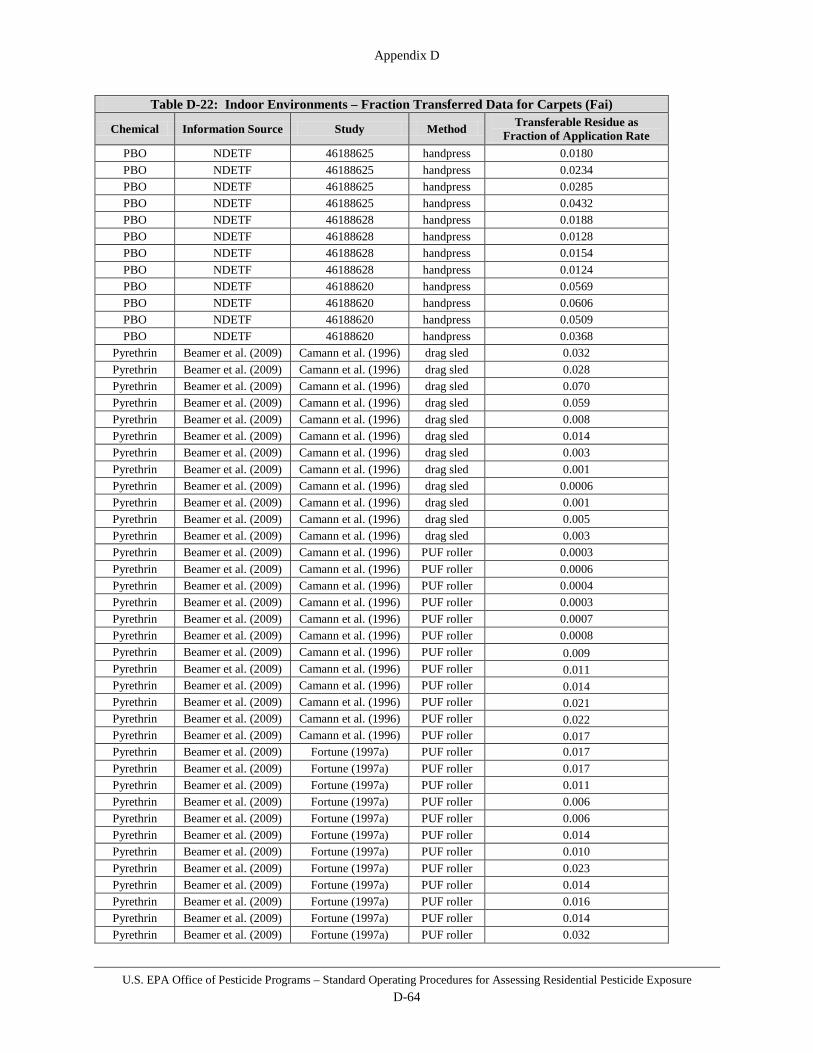
Appendix D
U.S. EPA Office of Pesticide Programs – Standard Operating Procedures for Assessing Residential Pesticide Exposure D-64
Table D-22: Indoor Environments – Fraction Transferred Data for Carpets (Fai)
Chemical Information Source Study Method Transferable Residue as Fraction of Application Rate
PBO NDETF 46188625 handpress 0.0180 PBO NDETF 46188625 handpress 0.0234 PBO NDETF 46188625 handpress 0.0285 PBO NDETF 46188625 handpress 0.0432 PBO NDETF 46188628 handpress 0.0188 PBO NDETF 46188628 handpress 0.0128 PBO NDETF 46188628 handpress 0.0154 PBO NDETF 46188628 handpress 0.0124 PBO NDETF 46188620 handpress 0.0569 PBO NDETF 46188620 handpress 0.0606 PBO NDETF 46188620 handpress 0.0509 PBO NDETF 46188620 handpress 0.0368
Pyrethrin Beamer et al. (2009) Camann et al. (1996) drag sled 0.032 Pyrethrin Beamer et al. (2009) Camann et al. (1996) drag sled 0.028 Pyrethrin Beamer et al. (2009) Camann et al. (1996) drag sled 0.070 Pyrethrin Beamer et al. (2009) Camann et al. (1996) drag sled 0.059 Pyrethrin Beamer et al. (2009) Camann et al. (1996) drag sled 0.008 Pyrethrin Beamer et al. (2009) Camann et al. (1996) drag sled 0.014 Pyrethrin Beamer et al. (2009) Camann et al. (1996) drag sled 0.003 Pyrethrin Beamer et al. (2009) Camann et al. (1996) drag sled 0.001 Pyrethrin Beamer et al. (2009) Camann et al. (1996) drag sled 0.0006 Pyrethrin Beamer et al. (2009) Camann et al. (1996) drag sled 0.001 Pyrethrin Beamer et al. (2009) Camann et al. (1996) drag sled 0.005 Pyrethrin Beamer et al. (2009) Camann et al. (1996) drag sled 0.003 Pyrethrin Beamer et al. (2009) Camann et al. (1996) PUF roller 0.0003 Pyrethrin Beamer et al. (2009) Camann et al. (1996) PUF roller 0.0006 Pyrethrin Beamer et al. (2009) Camann et al. (1996) PUF roller 0.0004 Pyrethrin Beamer et al. (2009) Camann et al. (1996) PUF roller 0.0003 Pyrethrin Beamer et al. (2009) Camann et al. (1996) PUF roller 0.0007 Pyrethrin Beamer et al. (2009) Camann et al. (1996) PUF roller 0.0008 Pyrethrin Beamer et al. (2009) Camann et al. (1996) PUF roller 0.009 Pyrethrin Beamer et al. (2009) Camann et al. (1996) PUF roller 0.011 Pyrethrin Beamer et al. (2009) Camann et al. (1996) PUF roller 0.014 Pyrethrin Beamer et al. (2009) Camann et al. (1996) PUF roller 0.021 Pyrethrin Beamer et al. (2009) Camann et al. (1996) PUF roller 0.022 Pyrethrin Beamer et al. (2009) Camann et al. (1996) PUF roller 0.017 Pyrethrin Beamer et al. (2009) Fortune (1997a) PUF roller 0.017 Pyrethrin Beamer et al. (2009) Fortune (1997a) PUF roller 0.017 Pyrethrin Beamer et al. (2009) Fortune (1997a) PUF roller 0.011 Pyrethrin Beamer et al. (2009) Fortune (1997a) PUF roller 0.006 Pyrethrin Beamer et al. (2009) Fortune (1997a) PUF roller 0.006 Pyrethrin Beamer et al. (2009) Fortune (1997a) PUF roller 0.014 Pyrethrin Beamer et al. (2009) Fortune (1997a) PUF roller 0.010 Pyrethrin Beamer et al. (2009) Fortune (1997a) PUF roller 0.023 Pyrethrin Beamer et al. (2009) Fortune (1997a) PUF roller 0.014 Pyrethrin Beamer et al. (2009) Fortune (1997a) PUF roller 0.016 Pyrethrin Beamer et al. (2009) Fortune (1997a) PUF roller 0.014 Pyrethrin Beamer et al. (2009) Fortune (1997a) PUF roller 0.032

Appendix D
U.S. EPA Office of Pesticide Programs – Standard Operating Procedures for Assessing Residential Pesticide Exposure D-65
Table D-22: Indoor Environments – Fraction Transferred Data for Carpets (Fai)
Chemical Information Source Study Method Transferable Residue as Fraction of Application Rate
Pyrethrin Beamer et al. (2009) Fortune (1997a) PUF roller 0.012 Pyrethrin Beamer et al. (2009) Fortune (1997a) PUF roller 0.024 Pyrethrin Beamer et al. (2009) Fortune (1997a) PUF roller 0.023 Pyrethrin Beamer et al. (2009) Fortune (1997a) PUF roller 0.017 Pyrethrin Beamer et al. (2009) Fortune (1997a) PUF roller 0.015 Pyrethrin Beamer et al. (2009) Fortune (1997a) PUF roller 0.086 Pyrethrin Beamer et al. (2009) Fortune (1997a) PUF roller 0.012 Pyrethrin Beamer et al. (2009) Fortune (1997a) PUF roller 0.039 Pyrethrin Beamer et al. (2009) Fortune (1997a) PUF roller 0.034 Pyrethrin Beamer et al. (2009) Fortune (1997a) CA roller 0.073 Pyrethrin Beamer et al. (2009) Fortune (1997a) CA roller 0.059 Pyrethrin Beamer et al. (2009) Fortune (1997a) CA roller 0.041 Pyrethrin Beamer et al. (2009) Fortune (1997a) CA roller 0.017 Pyrethrin Beamer et al. (2009) Fortune (1997a) CA roller 0.023 Pyrethrin Beamer et al. (2009) Fortune (1997a) CA roller 0.024 Pyrethrin Beamer et al. (2009) Fortune (1997a) CA roller 0.030 Pyrethrin Beamer et al. (2009) Fortune (1997a) CA roller 0.072 Pyrethrin Beamer et al. (2009) Fortune (1997a) CA roller 0.021 Pyrethrin Beamer et al. (2009) Fortune (1997a) CA roller 0.038 Pyrethrin Beamer et al. (2009) Fortune (1997a) CA roller 0.035 Pyrethrin Beamer et al. (2009) Fortune (1997a) CA roller 0.039 Pyrethrin Beamer et al. (2009) Fortune (1997a) CA roller 0.035 Pyrethrin Beamer et al. (2009) Fortune (1997a) CA roller 0.064 Pyrethrin Beamer et al. (2009) Fortune (1997a) CA roller 0.034 Pyrethrin Beamer et al. (2009) Fortune (1997a) CA roller 0.071 Pyrethrin Beamer et al. (2009) Fortune (1997a) CA roller 0.047 Pyrethrin Beamer et al. (2009) Fortune (1997a) CA roller 0.033 Pyrethrin Beamer et al. (2009) Fortune (1997a) CA roller 0.013 Pyrethrin Beamer et al. (2009) Fortune (1997a) CA roller 0.095 Pyrethrin Beamer et al. (2009) Fortune (1997a) CA roller 0.052 Pyrethrin Beamer et al. (2009) Fortune (1997a) drag sled 0.029 Pyrethrin Beamer et al. (2009) Fortune (1997a) drag sled 0.016 Pyrethrin Beamer et al. (2009) Fortune (1997a) drag sled 0.010 Pyrethrin Beamer et al. (2009) Fortune (1997a) drag sled 0.009 Pyrethrin Beamer et al. (2009) Fortune (1997a) drag sled 0.010 Pyrethrin Beamer et al. (2009) Fortune (1997a) drag sled 0.014 Pyrethrin Beamer et al. (2009) Fortune (1997a) drag sled 0.010 Pyrethrin Beamer et al. (2009) Fortune (1997a) drag sled 0.031 Pyrethrin Beamer et al. (2009) Fortune (1997a) drag sled 0.008 Pyrethrin Beamer et al. (2009) Fortune (1997a) drag sled 0.014 Pyrethrin Beamer et al. (2009) Fortune (1997a) drag sled 0.028 Pyrethrin Beamer et al. (2009) Fortune (1997a) drag sled 0.021 Pyrethrin Beamer et al. (2009) Fortune (1997a) drag sled 0.012 Pyrethrin Beamer et al. (2009) Fortune (1997a) drag sled 0.053 Pyrethrin Beamer et al. (2009) Fortune (1997a) drag sled 0.016 Pyrethrin Beamer et al. (2009) Fortune (1997a) drag sled 0.022 Pyrethrin Beamer et al. (2009) Fortune (1997a) drag sled 0.083 Pyrethrin Beamer et al. (2009) Fortune (1997a) drag sled 0.063

Appendix D
U.S. EPA Office of Pesticide Programs – Standard Operating Procedures for Assessing Residential Pesticide Exposure D-66
Table D-22: Indoor Environments – Fraction Transferred Data for Carpets (Fai)
Chemical Information Source Study Method Transferable Residue as Fraction of Application Rate
Pyrethrin Beamer et al. (2009) Fortune (1997a) drag sled 0.012 Pyrethrin Beamer et al. (2009) Fortune (1997a) drag sled 0.065 Pyrethrin Beamer et al. (2009) Fortune (1997a) drag sled 0.023
PBO Beamer et al. (2009) Camann et al. (1996) PUF roller 0.013 PBO Beamer et al. (2009) Camann et al. (1996) PUF roller 0.013 PBO Beamer et al. (2009) Camann et al. (1996) PUF roller 0.014 PBO Beamer et al. (2009) Camann et al. (1996) PUF roller 0.019 PBO Beamer et al. (2009) Camann et al. (1996) PUF roller 0.015 PBO Beamer et al. (2009) Camann et al. (1996) PUF roller 0.013 PBO Beamer et al. (2009) Camann et al. (1996) drag sled 0.002 PBO Beamer et al. (2009) Camann et al. (1996) drag sled 0.001 PBO Beamer et al. (2009) Camann et al. (1996) drag sled 0.0005 PBO Beamer et al. (2009) Camann et al. (1996) drag sled 0.001 PBO Beamer et al. (2009) Camann et al. (1996) drag sled 0.002 PBO Beamer et al. (2009) Camann et al. (1996) drag sled 0.001 PBO Beamer et al. (2009) Camann et al. (1996) drag sled 0.034 PBO Beamer et al. (2009) Camann et al. (1996) drag sled 0.031 PBO Beamer et al. (2009) Camann et al. (1996) drag sled 0.056 PBO Beamer et al. (2009) Camann et al. (1996) drag sled 0.047 PBO Beamer et al. (2009) Camann et al. (1996) drag sled 0.026 PBO Beamer et al. (2009) Camann et al. (1996) drag sled 0.010 PBO Beamer et al. (2009) Camann et al. (1996) PUF roller 0.0004 PBO Beamer et al. (2009) Camann et al. (1996) PUF roller 0.0009 PBO Beamer et al. (2009) Camann et al. (1996) PUF roller 0.0003 PBO Beamer et al. (2009) Camann et al. (1996) PUF roller 0.0002 PBO Beamer et al. (2009) Camann et al. (1996) PUF roller 0.0002 PBO Beamer et al. (2009) Camann et al. (1996) PUF roller 0.0005 PBO Beamer et al. (2009) Fortune (1997) PUF roller 0.013 PBO Beamer et al. (2009) Fortune (1997) PUF roller 0.039 PBO Beamer et al. (2009) Fortune (1997) PUF roller 0.007 PBO Beamer et al. (2009) Fortune (1997) PUF roller 0.008 PBO Beamer et al. (2009) Fortune (1997) PUF roller 0.007 PBO Beamer et al. (2009) Fortune (1997) PUF roller 0.012 PBO Beamer et al. (2009) Fortune (1997) PUF roller 0.011 PBO Beamer et al. (2009) Fortune (1997) PUF roller 0.017 PBO Beamer et al. (2009) Fortune (1997) PUF roller 0.014 PBO Beamer et al. (2009) Fortune (1997) PUF roller 0.016 PBO Beamer et al. (2009) Fortune (1997) PUF roller 0.009 PBO Beamer et al. (2009) Fortune (1997) PUF roller 0.033 PBO Beamer et al. (2009) Fortune (1997) PUF roller 0.015 PBO Beamer et al. (2009) Fortune (1997) PUF roller 0.027 PBO Beamer et al. (2009) Fortune (1997) PUF roller 0.024 PBO Beamer et al. (2009) Fortune (1997) PUF roller 0.017 PBO Beamer et al. (2009) Fortune (1997) PUF roller 0.017 PBO Beamer et al. (2009) Fortune (1997) PUF roller 0.021 PBO Beamer et al. (2009) Fortune (1997) PUF roller 0.014 PBO Beamer et al. (2009) Fortune (1997) PUF roller 0.036 PBO Beamer et al. (2009) Fortune (1997) PUF roller 0.034
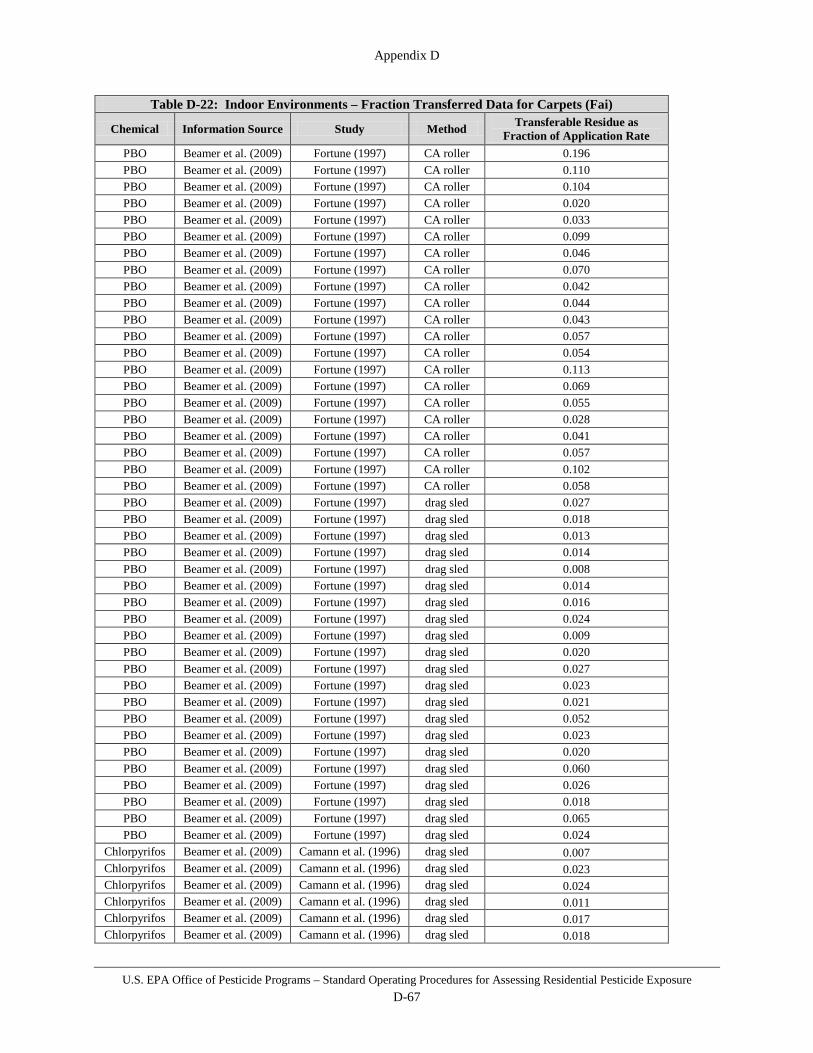
Appendix D
U.S. EPA Office of Pesticide Programs – Standard Operating Procedures for Assessing Residential Pesticide Exposure D-67
Table D-22: Indoor Environments – Fraction Transferred Data for Carpets (Fai)
Chemical Information Source Study Method Transferable Residue as Fraction of Application Rate
PBO Beamer et al. (2009) Fortune (1997) CA roller 0.196 PBO Beamer et al. (2009) Fortune (1997) CA roller 0.110 PBO Beamer et al. (2009) Fortune (1997) CA roller 0.104 PBO Beamer et al. (2009) Fortune (1997) CA roller 0.020 PBO Beamer et al. (2009) Fortune (1997) CA roller 0.033 PBO Beamer et al. (2009) Fortune (1997) CA roller 0.099 PBO Beamer et al. (2009) Fortune (1997) CA roller 0.046 PBO Beamer et al. (2009) Fortune (1997) CA roller 0.070 PBO Beamer et al. (2009) Fortune (1997) CA roller 0.042 PBO Beamer et al. (2009) Fortune (1997) CA roller 0.044 PBO Beamer et al. (2009) Fortune (1997) CA roller 0.043 PBO Beamer et al. (2009) Fortune (1997) CA roller 0.057 PBO Beamer et al. (2009) Fortune (1997) CA roller 0.054 PBO Beamer et al. (2009) Fortune (1997) CA roller 0.113 PBO Beamer et al. (2009) Fortune (1997) CA roller 0.069 PBO Beamer et al. (2009) Fortune (1997) CA roller 0.055 PBO Beamer et al. (2009) Fortune (1997) CA roller 0.028 PBO Beamer et al. (2009) Fortune (1997) CA roller 0.041 PBO Beamer et al. (2009) Fortune (1997) CA roller 0.057 PBO Beamer et al. (2009) Fortune (1997) CA roller 0.102 PBO Beamer et al. (2009) Fortune (1997) CA roller 0.058 PBO Beamer et al. (2009) Fortune (1997) drag sled 0.027 PBO Beamer et al. (2009) Fortune (1997) drag sled 0.018 PBO Beamer et al. (2009) Fortune (1997) drag sled 0.013 PBO Beamer et al. (2009) Fortune (1997) drag sled 0.014 PBO Beamer et al. (2009) Fortune (1997) drag sled 0.008 PBO Beamer et al. (2009) Fortune (1997) drag sled 0.014 PBO Beamer et al. (2009) Fortune (1997) drag sled 0.016 PBO Beamer et al. (2009) Fortune (1997) drag sled 0.024 PBO Beamer et al. (2009) Fortune (1997) drag sled 0.009 PBO Beamer et al. (2009) Fortune (1997) drag sled 0.020 PBO Beamer et al. (2009) Fortune (1997) drag sled 0.027 PBO Beamer et al. (2009) Fortune (1997) drag sled 0.023 PBO Beamer et al. (2009) Fortune (1997) drag sled 0.021 PBO Beamer et al. (2009) Fortune (1997) drag sled 0.052 PBO Beamer et al. (2009) Fortune (1997) drag sled 0.023 PBO Beamer et al. (2009) Fortune (1997) drag sled 0.020 PBO Beamer et al. (2009) Fortune (1997) drag sled 0.060 PBO Beamer et al. (2009) Fortune (1997) drag sled 0.026 PBO Beamer et al. (2009) Fortune (1997) drag sled 0.018 PBO Beamer et al. (2009) Fortune (1997) drag sled 0.065 PBO Beamer et al. (2009) Fortune (1997) drag sled 0.024
Chlorpyrifos Beamer et al. (2009) Camann et al. (1996) drag sled 0.007 Chlorpyrifos Beamer et al. (2009) Camann et al. (1996) drag sled 0.023 Chlorpyrifos Beamer et al. (2009) Camann et al. (1996) drag sled 0.024 Chlorpyrifos Beamer et al. (2009) Camann et al. (1996) drag sled 0.011 Chlorpyrifos Beamer et al. (2009) Camann et al. (1996) drag sled 0.017 Chlorpyrifos Beamer et al. (2009) Camann et al. (1996) drag sled 0.018

Appendix D
U.S. EPA Office of Pesticide Programs – Standard Operating Procedures for Assessing Residential Pesticide Exposure D-68
Table D-22: Indoor Environments – Fraction Transferred Data for Carpets (Fai)
Chemical Information Source Study Method Transferable Residue as Fraction of Application Rate
Chlorpyrifos Beamer et al. (2009) Camann et al. (1996) drag sled 0.010 Chlorpyrifos Beamer et al. (2009) Camann et al. (1996) drag sled 0.013 Chlorpyrifos Beamer et al. (2009) Camann et al. (1996) drag sled 0.013 Chlorpyrifos Beamer et al. (2009) Camann et al. (1996) drag sled 0.019 Chlorpyrifos Beamer et al. (2009) Camann et al. (1996) drag sled 0.031 Chlorpyrifos Beamer et al. (2009) Camann et al. (1996) drag sled 0.015 Chlorpyrifos Beamer et al. (2009) Camann et al. (1996) drag sled 0.002 Chlorpyrifos Beamer et al. (2009) Camann et al. (1996) drag sled 0.004 Chlorpyrifos Beamer et al. (2009) Camann et al. (1996) drag sled 0.004 Chlorpyrifos Beamer et al. (2009) Camann et al. (1996) drag sled 0.007 Chlorpyrifos Beamer et al. (2009) Camann et al. (1996) drag sled 0.002 Chlorpyrifos Beamer et al. (2009) Camann et al. (1996) drag sled 0.002 Chlorpyrifos Beamer et al. (2009) Camann et al. (1996) drag sled 0.0003 Chlorpyrifos Beamer et al. (2009) Camann et al. (1996) drag sled 0.001 Chlorpyrifos Beamer et al. (2009) Camann et al. (1996) drag sled 0.001 Chlorpyrifos Beamer et al. (2009) Camann et al. (1996) drag sled 0.001 Chlorpyrifos Beamer et al. (2009) Camann et al. (1996) PUF roller 0.005 Chlorpyrifos Beamer et al. (2009) Camann et al. (1996) PUF roller 0.016 Chlorpyrifos Beamer et al. (2009) Camann et al. (1996) PUF roller 0.015 Chlorpyrifos Beamer et al. (2009) Camann et al. (1996) PUF roller 0.008 Chlorpyrifos Beamer et al. (2009) Camann et al. (1996) PUF roller 0.007 Chlorpyrifos Beamer et al. (2009) Camann et al. (1996) PUF roller 0.018 Chlorpyrifos Beamer et al. (2009) Camann et al. (1996) PUF roller 0.017 Chlorpyrifos Beamer et al. (2009) Camann et al. (1996) PUF roller 0.013 Chlorpyrifos Beamer et al. (2009) Camann et al. (1996) PUF roller 0.015 Chlorpyrifos Beamer et al. (2009) Camann et al. (1996) PUF roller 0.009 Chlorpyrifos Beamer et al. (2009) Camann et al. (1996) PUF roller 0.011 Chlorpyrifos Beamer et al. (2009) Camann et al. (1996) PUF roller 0.029 Chlorpyrifos Beamer et al. (2009) Camann et al. (1996) PUF roller 0.002 Chlorpyrifos Beamer et al. (2009) Camann et al. (1996) PUF roller 0.003 Chlorpyrifos Beamer et al. (2009) Camann et al. (1996) PUF roller 0.003 Chlorpyrifos Beamer et al. (2009) Camann et al. (1996) PUF roller 0.003 Chlorpyrifos Beamer et al. (2009) Camann et al. (1996) PUF roller 0.0003 Chlorpyrifos Beamer et al. (2009) Camann et al. (1996) PUF roller 0.0007 Chlorpyrifos Beamer et al. (2009) Camann et al. (1996) PUF roller 0.0002 Chlorpyrifos Beamer et al. (2009) Camann et al. (1996) PUF roller 0.0001 Chlorpyrifos Beamer et al. (2009) Camann et al. (1996) PUF roller 0.0002 Chlorpyrifos Beamer et al. (2009) Camann et al. (1996) PUF roller 0.0003 Chlorpyrifos Beamer et al. (2009) Camann et al. (1996) cloth roller 0.021 Chlorpyrifos Beamer et al. (2009) Camann et al. (1996) cloth roller 0.121 Chlorpyrifos Beamer et al. (2009) Camann et al. (1996) cloth roller 0.058 Chlorpyrifos Beamer et al. (2009) Camann et al. (1996) cloth roller 0.029 Chlorpyrifos Beamer et al. (2009) Camann et al. (1996) cloth roller 0.058 Chlorpyrifos Beamer et al. (2009) Camann et al. (1996) cloth roller 0.100 Chlorpyrifos Beamer et al. (2009) Camann et al. (1996) cloth roller 0.035 Chlorpyrifos Beamer et al. (2009) Camann et al. (1996) cloth roller 0.024 Chlorpyrifos Beamer et al. (2009) Camann et al. (1996) cloth roller 0.041 Chlorpyrifos Beamer et al. (2009) Camann et al. (1996) cloth roller 0.025

Appendix D
U.S. EPA Office of Pesticide Programs – Standard Operating Procedures for Assessing Residential Pesticide Exposure D-69
Table D-22: Indoor Environments – Fraction Transferred Data for Carpets (Fai)
Chemical Information Source Study Method Transferable Residue as Fraction of Application Rate
Chlorpyrifos Beamer et al. (2009) Camann et al. (1996) cloth roller 0.016 Chlorpyrifos Beamer et al. (2009) Camann et al. (1996) cloth roller 0.020 Chlorpyrifos Beamer et al. (2009) Fortune (1997) PUF roller 0.012 Chlorpyrifos Beamer et al. (2009) Fortune (1997) PUF roller 0.018 Chlorpyrifos Beamer et al. (2009) Fortune (1997) PUF roller 0.007 Chlorpyrifos Beamer et al. (2009) Fortune (1997) PUF roller 0.007 Chlorpyrifos Beamer et al. (2009) Fortune (1997) PUF roller 0.008 Chlorpyrifos Beamer et al. (2009) Fortune (1997) PUF roller 0.004 Chlorpyrifos Beamer et al. (2009) Fortune (1997) PUF roller 0.011 Chlorpyrifos Beamer et al. (2009) Fortune (1997) PUF roller 0.012 Chlorpyrifos Beamer et al. (2009) Fortune (1997) PUF roller 0.012 Chlorpyrifos Beamer et al. (2009) Fortune (1997) PUF roller 0.022 Chlorpyrifos Beamer et al. (2009) Fortune (1997) PUF roller 0.010 Chlorpyrifos Beamer et al. (2009) Fortune (1997) PUF roller 0.022 Chlorpyrifos Beamer et al. (2009) Fortune (1997) PUF roller 0.013 Chlorpyrifos Beamer et al. (2009) Fortune (1997) PUF roller 0.022 Chlorpyrifos Beamer et al. (2009) Fortune (1997) PUF roller 0.018 Chlorpyrifos Beamer et al. (2009) Fortune (1997) PUF roller 0.011 Chlorpyrifos Beamer et al. (2009) Fortune (1997) PUF roller 0.017 Chlorpyrifos Beamer et al. (2009) Fortune (1997) PUF roller 0.016 Chlorpyrifos Beamer et al. (2009) Fortune (1997) PUF roller 0.015 Chlorpyrifos Beamer et al. (2009) Fortune (1997) PUF roller 0.025 Chlorpyrifos Beamer et al. (2009) Fortune (1997) PUF roller 0.029 Chlorpyrifos Beamer et al. (2009) Fortune (1997) CA roller 0.079 Chlorpyrifos Beamer et al. (2009) Fortune (1997) CA roller 0.099 Chlorpyrifos Beamer et al. (2009) Fortune (1997) CA roller 0.029 Chlorpyrifos Beamer et al. (2009) Fortune (1997) CA roller 0.013 Chlorpyrifos Beamer et al. (2009) Fortune (1997) CA roller 0.059 Chlorpyrifos Beamer et al. (2009) Fortune (1997) CA roller 0.016 Chlorpyrifos Beamer et al. (2009) Fortune (1997) CA roller 0.040 Chlorpyrifos Beamer et al. (2009) Fortune (1997) CA roller 0.038 Chlorpyrifos Beamer et al. (2009) Fortune (1997) CA roller 0.036 Chlorpyrifos Beamer et al. (2009) Fortune (1997) CA roller 0.034 Chlorpyrifos Beamer et al. (2009) Fortune (1997) CA roller 0.025 Chlorpyrifos Beamer et al. (2009) Fortune (1997) CA roller 0.047 Chlorpyrifos Beamer et al. (2009) Fortune (1997) CA roller 0.035 Chlorpyrifos Beamer et al. (2009) Fortune (1997) CA roller 0.044 Chlorpyrifos Beamer et al. (2009) Fortune (1997) CA roller 0.035 Chlorpyrifos Beamer et al. (2009) Fortune (1997) CA roller 0.043 Chlorpyrifos Beamer et al. (2009) Fortune (1997) CA roller 0.039 Chlorpyrifos Beamer et al. (2009) Fortune (1997) CA roller 0.035 Chlorpyrifos Beamer et al. (2009) Fortune (1997) CA roller 0.058 Chlorpyrifos Beamer et al. (2009) Fortune (1997) CA roller 0.074 Chlorpyrifos Beamer et al. (2009) Fortune (1997) CA roller 0.047 Chlorpyrifos Beamer et al. (2009) Fortune (1997) drag sled 0.029 Chlorpyrifos Beamer et al. (2009) Fortune (1997) drag sled 0.030 Chlorpyrifos Beamer et al. (2009) Fortune (1997) drag sled 0.019 Chlorpyrifos Beamer et al. (2009) Fortune (1997) drag sled 0.005

Appendix D
U.S. EPA Office of Pesticide Programs – Standard Operating Procedures for Assessing Residential Pesticide Exposure D-70
Table D-22: Indoor Environments – Fraction Transferred Data for Carpets (Fai)
Chemical Information Source Study Method Transferable Residue as Fraction of Application Rate
Chlorpyrifos Beamer et al. (2009) Fortune (1997) drag sled 0.015 Chlorpyrifos Beamer et al. (2009) Fortune (1997) drag sled 0.008 Chlorpyrifos Beamer et al. (2009) Fortune (1997) drag sled 0.018 Chlorpyrifos Beamer et al. (2009) Fortune (1997) drag sled 0.017 Chlorpyrifos Beamer et al. (2009) Fortune (1997) drag sled 0.012 Chlorpyrifos Beamer et al. (2009) Fortune (1997) drag sled 0.014 Chlorpyrifos Beamer et al. (2009) Fortune (1997) drag sled 0.014 Chlorpyrifos Beamer et al. (2009) Fortune (1997) drag sled 0.016 Chlorpyrifos Beamer et al. (2009) Fortune (1997) drag sled 0.012 Chlorpyrifos Beamer et al. (2009) Fortune (1997) drag sled 0.042 Chlorpyrifos Beamer et al. (2009) Fortune (1997) drag sled 0.017 Chlorpyrifos Beamer et al. (2009) Fortune (1997) drag sled 0.024 Chlorpyrifos Beamer et al. (2009) Fortune (1997) drag sled 0.036 Chlorpyrifos Beamer et al. (2009) Fortune (1997) drag sled 0.022 Chlorpyrifos Beamer et al. (2009) Fortune (1997) drag sled 0.015 Chlorpyrifos Beamer et al. (2009) Fortune (1997) drag sled 0.042 Chlorpyrifos Beamer et al. (2009) Fortune (1997) drag sled 0.019 Chlorpyrifos Beamer et al. (2009) Krieger et al. (2000) cloth roller 0.032 Chlorpyrifos Beamer et al. (2009) Krieger et al. (2000) cloth roller 0.018 Chlorpyrifos Beamer et al. (2009) Krieger et al. (2000) cloth roller 0.118 Chlorpyrifos Beamer et al. (2009) Krieger et al. (2000) cloth roller 0.171 Chlorpyrifos Beamer et al. (2009) Krieger et al. (2000) cloth roller 0.179 Chlorpyrifos Beamer et al. (2009) Krieger et al. (2000) cloth roller 0.063 Chlorpyrifos Beamer et al. (2009) Krieger et al. (2000) cloth roller 0.209 Chlorpyrifos Beamer et al. (2009) Krieger et al. (2000) cloth roller 0.015 Chlorpyrifos Beamer et al. (2009) Krieger et al. (2000) cloth roller 0.006 Chlorpyrifos Beamer et al. (2009) Krieger et al. (2000) cloth roller 0.113 Chlorpyrifos Beamer et al. (2009) Krieger et al. (2000) cloth roller 0.019 Chlorpyrifos Beamer et al. (2009) Krieger et al. (2000) cloth roller 0.064 Chlorpyrifos Beamer et al. (2009) Ross et al. (1991) cloth roller 0.030 Chlorpyrifos Beamer et al. (2009) Ross et al. (1991) cloth roller 0.081 Chlorpyrifos Beamer et al. (2009) Ross et al. (1991) cloth roller 0.258 Chlorpyrifos Beamer et al. (2009) Ross et al. (1991) cloth roller 0.059 Chlorpyrifos Beamer et al. (2009) Ross et al. (1991) cloth roller 0.047 Chlorpyrifos Beamer et al. (2009) Ross et al. (1991) cloth roller 0.034 Chlorpyrifos Beamer et al. (2009) Ross et al. (1991) cloth roller 0.025 Chlorpyrifos Beamer et al. (2009) Ross et al. (1991) cloth roller 0.055 Chlorpyrifos Beamer et al. (2009) Ross et al. (1991) cloth roller 0.051 Chlorpyrifos Beamer et al. (2009) Ross et al. (1991) cloth roller 0.034 Chlorpyrifos Beamer et al. (2009) Ross et al. (1991) cloth roller 0.025 Chlorpyrifos Beamer et al. (2009) Ross et al. (1991) cloth roller 0.034 Chlorpyrifos Beamer et al. (2009) Ross et al. (1991) cloth roller 0.020 Chlorpyrifos Beamer et al. (2009) Ross et al. (1991) cloth roller 0.045 Chlorpyrifos Beamer et al. (2009) Ross et al. (1991) cloth roller 0.017 Chlorpyrifos Beamer et al. (2009) Ross et al. (1991) cloth roller 0.011 Chlorpyrifos Beamer et al. (2009) Ross et al. (1991) cloth roller 0.025 Chlorpyrifos Beamer et al. (2009) Ross et al. (1991) cloth roller 0.010 Chlorpyrifos Beamer et al. (2009) Ross et al. (1991) cloth roller 0.006

Appendix D
U.S. EPA Office of Pesticide Programs – Standard Operating Procedures for Assessing Residential Pesticide Exposure D-71
Table D-22: Indoor Environments – Fraction Transferred Data for Carpets (Fai)
Chemical Information Source Study Method Transferable Residue as Fraction of Application Rate
Chlorpyrifos Beamer et al. (2009) Ross et al. (1991) cloth roller 0.011 Chlorpyrifos Beamer et al. (2009) Ross et al. (1991) cloth roller 0.024 Chlorpyrifos Beamer et al. (2009) Ross et al. (1991) cloth roller 0.008 Chlorpyrifos Beamer et al. (2009) Ross et al. (1991) cloth roller 0.006 Chlorpyrifos Beamer et al. (2009) Ross et al. (1991) cloth roller 0.007
Table D-23: Indoor Environments Summary of Fraction Transferred (Fai) for Carpets
Statistic Fraction Transferred Arithmetic Mean 0.04
Standard Deviation 0.58 Range 0.0001 – 0.258
N 375 Hard Surfaces
Table D-24: Indoor Environments – Fraction Transferred Data for Hard Surfaces (Fai)
Chemical Information Source Study Method Transferable
Residue as Fraction of Application Rate
Pyrethrin NDETF 46188605 handpress 0.0140 Pyrethrin NDETF 46188605 handpress 0.0316 Pyrethrin NDETF 46188605 handpress 0.0365 Pyrethrin NDETF 46188605 handpress 0.0411 Pyrethrin NDETF 46188605 handpress 0.0134 Pyrethrin NDETF 46188605 handpress 0.0776 Pyrethrin NDETF 46188605 handpress 0.1509 Pyrethrin NDETF 46188605 handpress 0.0657 Pyrethrin NDETF 46188605 handpress 0.0640 Pyrethrin NDETF 46188605 handpress 0.0684 Pyrethrin NDETF 46188605 handpress 0.0186 Pyrethrin NDETF 46188605 handpress 0.0258 Pyrethrin NDETF 46188605 handpress 0.0664 Pyrethrin NDETF 46188605 handpress 0.1610 Pyrethrin NDETF 46188605 handpress 0.0597 Pyrethrin NDETF 46188605 handpress 0.0496 Pyrethrin NDETF 46188605 handpress 0.0739 Pyrethrin NDETF 46188605 handpress 0.0336 Pyrethrin NDETF 46188605 handpress 0.0336 Pyrethrin NDETF 46188605 handpress 0.0217 Pyrethrin NDETF 46188605 handpress 0.0453 Pyrethrin NDETF 46188605 handpress 0.0313 Pyrethrin NDETF 46188605 handpress 0.0623 Pyrethrin NDETF 46188605 handpress 0.0306 Pyrethrin NDETF 46188605 handpress 0.0080 Pyrethrin NDETF 46188605 handpress 0.0109 Pyrethrin NDETF 46188605 handpress 0.0386 Pyrethrin NDETF 46188605 handpress 0.0440 Pyrethrin NDETF 46188605 handpress 0.0526

Appendix D
U.S. EPA Office of Pesticide Programs – Standard Operating Procedures for Assessing Residential Pesticide Exposure D-72
Table D-24: Indoor Environments – Fraction Transferred Data for Hard Surfaces (Fai)
Chemical Information Source Study Method Transferable
Residue as Fraction of Application Rate
Pyrethrin NDETF 46188605 handpress 0.0526 Pyrethrin NDETF 46188605 handpress 0.0351 Pyrethrin NDETF 46188605 handpress 0.0912 Pyrethrin NDETF 46188614 handpress 0.0075 Pyrethrin NDETF 46188614 handpress 0.0097 Pyrethrin NDETF 46188614 handpress 0.0092 Pyrethrin NDETF 46188614 handpress 0.0067
PBO NDETF 46188625 handpress 0.0175 PBO NDETF 46188625 handpress 0.0196 PBO NDETF 46188625 handpress 0.0331 PBO NDETF 46188625 handpress 0.0255 PBO NDETF 46188625 handpress 0.0208 PBO NDETF 46188625 handpress 0.0086 PBO NDETF 46188625 handpress 0.0139 PBO NDETF 46188625 handpress 0.0269 PBO NDETF 46188625 handpress 0.0259 PBO NDETF 46188625 handpress 0.0291 PBO NDETF 46188605 handpress 0.0078 PBO NDETF 46188605 handpress 0.0185 PBO NDETF 46188605 handpress 0.0183 PBO NDETF 46188605 handpress 0.0206 PBO NDETF 46188605 handpress 0.0083 PBO NDETF 46188605 handpress 0.0411 PBO NDETF 46188605 handpress 0.0800 PBO NDETF 46188605 handpress 0.0368 PBO NDETF 46188605 handpress 0.0330 PBO NDETF 46188605 handpress 0.0348 PBO NDETF 46188605 handpress 0.0116 PBO NDETF 46188605 handpress 0.0128 PBO NDETF 46188605 handpress 0.0346 PBO NDETF 46188605 handpress 0.0881 PBO NDETF 46188605 handpress 0.0369 PBO NDETF 46188605 handpress 0.0297 PBO NDETF 46188605 handpress 0.0372 PBO NDETF 46188605 handpress 0.0174 PBO NDETF 46188605 handpress 0.0153 PBO NDETF 46188605 handpress 0.0108 PBO NDETF 46188605 handpress 0.0327 PBO NDETF 46188605 handpress 0.0184 PBO NDETF 46188605 handpress 0.0373 PBO NDETF 46188605 handpress 0.0192 PBO NDETF 46188605 handpress 0.0094 PBO NDETF 46188605 handpress 0.0069 PBO NDETF 46188605 handpress 0.0240 PBO NDETF 46188605 handpress 0.0269 PBO NDETF 46188605 handpress 0.0290 PBO NDETF 46188605 handpress 0.0277
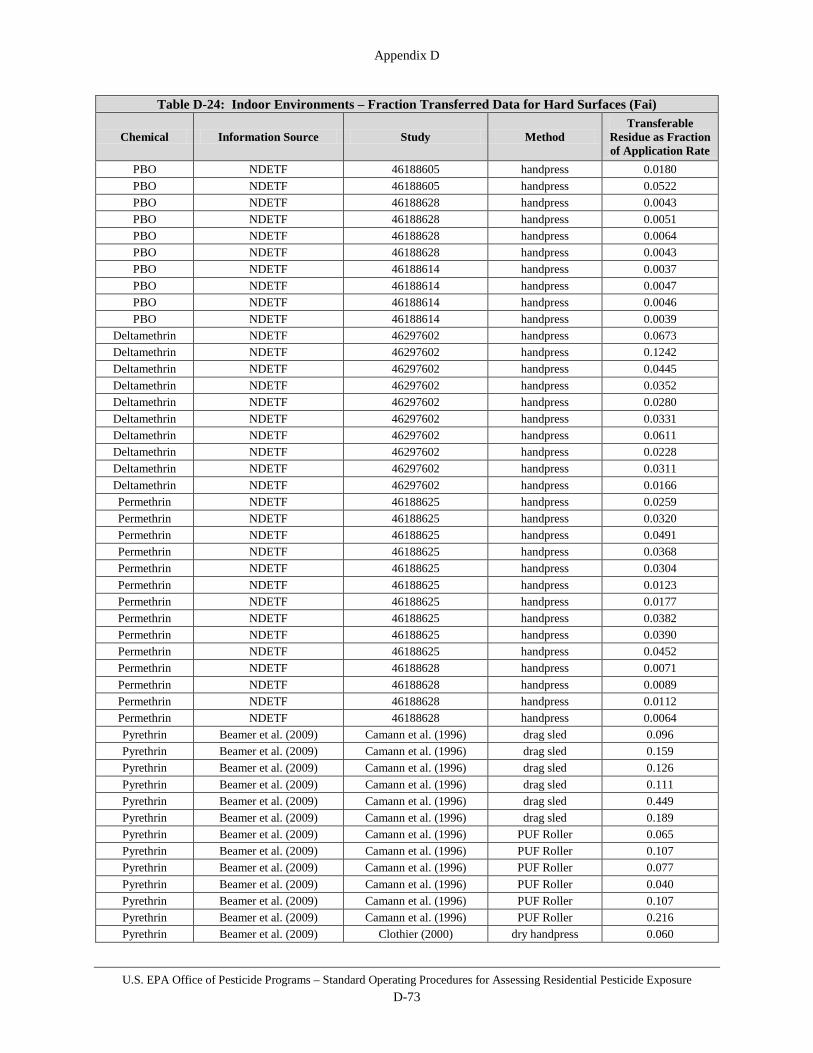
Appendix D
U.S. EPA Office of Pesticide Programs – Standard Operating Procedures for Assessing Residential Pesticide Exposure D-73
Table D-24: Indoor Environments – Fraction Transferred Data for Hard Surfaces (Fai)
Chemical Information Source Study Method Transferable
Residue as Fraction of Application Rate
PBO NDETF 46188605 handpress 0.0180 PBO NDETF 46188605 handpress 0.0522 PBO NDETF 46188628 handpress 0.0043 PBO NDETF 46188628 handpress 0.0051 PBO NDETF 46188628 handpress 0.0064 PBO NDETF 46188628 handpress 0.0043 PBO NDETF 46188614 handpress 0.0037 PBO NDETF 46188614 handpress 0.0047 PBO NDETF 46188614 handpress 0.0046 PBO NDETF 46188614 handpress 0.0039
Deltamethrin NDETF 46297602 handpress 0.0673 Deltamethrin NDETF 46297602 handpress 0.1242 Deltamethrin NDETF 46297602 handpress 0.0445 Deltamethrin NDETF 46297602 handpress 0.0352 Deltamethrin NDETF 46297602 handpress 0.0280 Deltamethrin NDETF 46297602 handpress 0.0331 Deltamethrin NDETF 46297602 handpress 0.0611 Deltamethrin NDETF 46297602 handpress 0.0228 Deltamethrin NDETF 46297602 handpress 0.0311 Deltamethrin NDETF 46297602 handpress 0.0166 Permethrin NDETF 46188625 handpress 0.0259 Permethrin NDETF 46188625 handpress 0.0320 Permethrin NDETF 46188625 handpress 0.0491 Permethrin NDETF 46188625 handpress 0.0368 Permethrin NDETF 46188625 handpress 0.0304 Permethrin NDETF 46188625 handpress 0.0123 Permethrin NDETF 46188625 handpress 0.0177 Permethrin NDETF 46188625 handpress 0.0382 Permethrin NDETF 46188625 handpress 0.0390 Permethrin NDETF 46188625 handpress 0.0452 Permethrin NDETF 46188628 handpress 0.0071 Permethrin NDETF 46188628 handpress 0.0089 Permethrin NDETF 46188628 handpress 0.0112 Permethrin NDETF 46188628 handpress 0.0064 Pyrethrin Beamer et al. (2009) Camann et al. (1996) drag sled 0.096 Pyrethrin Beamer et al. (2009) Camann et al. (1996) drag sled 0.159 Pyrethrin Beamer et al. (2009) Camann et al. (1996) drag sled 0.126 Pyrethrin Beamer et al. (2009) Camann et al. (1996) drag sled 0.111 Pyrethrin Beamer et al. (2009) Camann et al. (1996) drag sled 0.449 Pyrethrin Beamer et al. (2009) Camann et al. (1996) drag sled 0.189 Pyrethrin Beamer et al. (2009) Camann et al. (1996) PUF Roller 0.065 Pyrethrin Beamer et al. (2009) Camann et al. (1996) PUF Roller 0.107 Pyrethrin Beamer et al. (2009) Camann et al. (1996) PUF Roller 0.077 Pyrethrin Beamer et al. (2009) Camann et al. (1996) PUF Roller 0.040 Pyrethrin Beamer et al. (2009) Camann et al. (1996) PUF Roller 0.107 Pyrethrin Beamer et al. (2009) Camann et al. (1996) PUF Roller 0.216 Pyrethrin Beamer et al. (2009) Clothier (2000) dry handpress 0.060

Appendix D
U.S. EPA Office of Pesticide Programs – Standard Operating Procedures for Assessing Residential Pesticide Exposure D-74
Table D-24: Indoor Environments – Fraction Transferred Data for Hard Surfaces (Fai)
Chemical Information Source Study Method Transferable
Residue as Fraction of Application Rate
Pyrethrin Beamer et al. (2009) Clothier (2000) dry handpress 0.050 Pyrethrin Beamer et al. (2009) Clothier (2000) dry handpress 0.018 Pyrethrin Beamer et al. (2009) Clothier (2000) dry handpress 0.022 Pyrethrin Beamer et al. (2009) Clothier (2000) dry handpress 0.058 Pyrethrin Beamer et al. (2009) Clothier (2000) dry handpress 0.010 Pyrethrin Beamer et al. (2009) Clothier (2000) PUF Roller 0.044 Pyrethrin Beamer et al. (2009) Clothier (2000) PUF Roller 0.106 Pyrethrin Beamer et al. (2009) Clothier (2000) PUF Roller 0.019 Pyrethrin Beamer et al. (2009) Clothier (2000) PUF Roller 0.066 Pyrethrin Beamer et al. (2009) Clothier (2000) PUF Roller 0.087 Pyrethrin Beamer et al. (2009) Clothier (2000) PUF Roller 0.019
PBO Beamer et al. (2009) Camann et al. (1996) drag sled 0.118 PBO Beamer et al. (2009) Camann et al. (1996) drag sled 0.571 PBO Beamer et al. (2009) Camann et al. (1996) drag sled 0.149 PBO Beamer et al. (2009) Camann et al. (1996) drag sled 0.087 PBO Beamer et al. (2009) Camann et al. (1996) drag sled 0.436 PBO Beamer et al. (2009) Camann et al. (1996) drag sled 0.271 PBO Beamer et al. (2009) Camann et al. (1996) PUF Roller 0.039 PBO Beamer et al. (2009) Camann et al. (1996) PUF Roller 0.129 PBO Beamer et al. (2009) Camann et al. (1996) PUF Roller 0.068 PBO Beamer et al. (2009) Camann et al. (1996) PUF Roller 0.024 PBO Beamer et al. (2009) Camann et al. (1996) PUF Roller 0.105 PBO Beamer et al. (2009) Camann et al. (1996) PUF Roller 0.278 PBO Beamer et al. (2009) Clothier (2000) dry handpress 0.018 PBO Beamer et al. (2009) Clothier (2000) dry handpress 0.016 PBO Beamer et al. (2009) Clothier (2000) dry handpress 0.007 PBO Beamer et al. (2009) Clothier (2000) dry handpress 0.012 PBO Beamer et al. (2009) Clothier (2000) dry handpress 0.025 PBO Beamer et al. (2009) Clothier (2000) dry handpress 0.006 PBO Beamer et al. (2009) Clothier (2000) PUF Roller 0.023 PBO Beamer et al. (2009) Clothier (2000) PUF Roller 0.085 PBO Beamer et al. (2009) Clothier (2000) PUF Roller 0.009 PBO Beamer et al. (2009) Clothier (2000) PUF Roller 0.052 PBO Beamer et al. (2009) Clothier (2000) PUF Roller 0.077 PBO Beamer et al. (2009) Clothier (2000) PUF Roller 0.011
Chlorpyrifos Beamer et al. (2009) Camann et al. (1996) PUF roller 0.051 Chlorpyrifos Beamer et al. (2009) Camann et al. (1996) PUF roller 0.159 Chlorpyrifos Beamer et al. (2009) Camann et al. (1996) PUF roller 0.076 Chlorpyrifos Beamer et al. (2009) Camann et al. (1996) PUF roller 0.030 Chlorpyrifos Beamer et al. (2009) Camann et al. (1996) PUF roller 0.161 Chlorpyrifos Beamer et al. (2009) Camann et al. (1996) PUF roller 0.242 Chlorpyrifos Beamer et al. (2009) Camann et al. (1996) drag sled 0.140 Chlorpyrifos Beamer et al. (2009) Camann et al. (1996) drag sled 0.601 Chlorpyrifos Beamer et al. (2009) Camann et al. (1996) drag sled 0.136 Chlorpyrifos Beamer et al. (2009) Camann et al. (1996) drag sled 0.103 Chlorpyrifos Beamer et al. (2009) Camann et al. (1996) drag sled 0.507 Chlorpyrifos Beamer et al. (2009) Camann et al. (1996) drag sled 0.218

Appendix D
U.S. EPA Office of Pesticide Programs – Standard Operating Procedures for Assessing Residential Pesticide Exposure D-75
Table D-24: Indoor Environments – Fraction Transferred Data for Hard Surfaces (Fai)
Chemical Information Source Study Method Transferable
Residue as Fraction of Application Rate
Chlorpyrifos Beamer et al. (2009) Clothier (2000) dry handpress 0.020 Chlorpyrifos Beamer et al. (2009) Clothier (2000) dry handpress 0.017 Chlorpyrifos Beamer et al. (2009) Clothier (2000) dry handpress 0.008 Chlorpyrifos Beamer et al. (2009) Clothier (2000) dry handpress 0.014 Chlorpyrifos Beamer et al. (2009) Clothier (2000) dry handpress 0.026 Chlorpyrifos Beamer et al. (2009) Clothier (2000) dry handpress 0.007 Chlorpyrifos Beamer et al. (2009) Clothier (2000) PUF Roller 0.024 Chlorpyrifos Beamer et al. (2009) Clothier (2000) PUF Roller 0.071 Chlorpyrifos Beamer et al. (2009) Clothier (2000) PUF Roller 0.012 Chlorpyrifos Beamer et al. (2009) Clothier (2000) PUF Roller 0.054 Chlorpyrifos Beamer et al. (2009) Clothier (2000) PUF Roller 0.076 Chlorpyrifos Beamer et al. (2009) Clothier (2000) PUF Roller 0.015
Table D-25: Indoor Environments Statistical Summary – Fraction Transferred (Fai) for Hard Surfaces Statistic Fraction Transferred
Arithmetic Mean 0.06 Standard Deviation 0.51
Range 0.004 – 0.601 N 182
D.6.4 Treated Pets If chemical specific transferable residue (TR) measurements are not available, then a standard value for the fraction of active ingredient available for transfer (FAR) is used. A screening level FAR was recommended based on the review of 8 pet residue transfer studies (9 data sets total) submitted to the Agency. Measurements of residue transfer were derived by taking the ratio of the amount of active ingredient on a bare or gloved hand (on the day of application) to the amount of active ingredient applied. Five residue transfer studies were performed by means of volunteers “petting” or “stroking” animals treated with a known amount of active ingredient. Three additional petting studies were conducted using a gloved mannequin hand. For each study the amount of residue transferred to the hands was determined. FAR studies varied in the number, location and intensity of petting/stroking actions. All 8 pet residue transfer studies were reviewed for ethical conduct and no barriers were identified in law or regulation for their being relied upon by the Agency. All but one of the petting studies used in the selection of FAR were conducted with a liquid formulation application method (i.e., aerosol and pump sprays, dip, shampoo and spot-on). The study, “Determination of the Dislodgeability of Tetrachlorvinphos (TCVP) from the Fur of Dogs Following the Application of an Insecticide Powder, Pump Spray or Aerosol (MRID 45485501)” includes a segment which was conducted to analyze a solid formulation application method, powder. While these data are the only identified by the Agency which are specific to solid formulations, several issues preclude its use. The data resulting from the powder dislodgeability study segment consist of a sample size of 5 (N = 5). In contrast, the data available for all liquid
Appendix D
U.S. EPA Office of Pesticide Programs – Standard Operating Procedures for Assessing Residential Pesticide Exposure D-76
formulation application methods combined consist of a sample size of 171 (N = 171). Furthermore, the average FAR values resulting for the solid and combined liquid formulations are 0.00031 and 0.0096, respectively. The Agency recognizes that the physical differences between the solid and liquid formulations may account for the observed comparison; however, the small sample size of the solid formulation data and the large difference observed in anticipated FAR (order of magnitude), limit the reliability of the data set. Therefore, the Agency has identified the liquid formulation FAR data set as the most reliable for the assessment of post-application exposure from treated pets for all formulations assessed. Based on the available studies, the recommended screening level FAR point estimate for use in post-application dermal exposure assessment is 0.02 (equivalent to 2%). Description of Available Studies Used for Dermal Exposure Fraction of Application Rate (FAR) Below is a description of the available studies used to determine the input values for FAR.
Table D-26: Available Exposure Study Identification Information
Citation Hughes, D.L. (1997a). Dislodgeable Residues of Fipronil Following Application of Frontline® Spray Treatment to Dogs
EPA MRID 44433306 EPA Review Contractor (Versar, Inc.) review 4/30/98
MRID = Master Record Identification ORETF = Outdoor Residential Exposure Task Force
Table D-27: Available Exposure Study Identification Information
Citation Hughes, D.L. (1997b). Dislodgeable Residues of Fipronil Following Application of Frontline® Spray Treatment to Cats
EPA MRID 44433307 EPA Review Contractor (Versar, Inc.) review 4/30/98
MRID = Master Record Identification Two post-application studies, the “Dislodgeable Residues of Fipronil Following Application of Frontline Spray Treatment to Dogs” (MRID 44433306), and the “Dislodgeable Residues of Fipronil Following Application of Frontline Spray Treatment to Cats” (MRID 44433307) were conducted to examine dislodgeable residues of fipronil, the active ingredient of Frontline®, on the hair coats of dogs and cats, respectively, following their treatment with the pesticide. The dislodgeability residues of fipronil was studied in 10 female dogs (5 short-haired dogs and 5 long-haired dogs) weighing 9.5 to 19.2 kg and 5 female cats (varying hair lengths) weighing 2.8 to 3.5 kg after a topical application of Frontline® Spray Treatment. Dogs and cats were topically treated with the Frontline® spray treatment. Each animal received one treatment on Day 1 with the maximum label rate of 6 mL of product per kg of body weight. Dye free 100 percent cotton gloves were used for collecting residues at the following sampling time intervals: before dosing; 2, 4, and 12 hours after dosing; and 2, 3, 5, 8, 15, 22, and 29 days after dosing. A total of five strokes were applied which uniform medium pressure to each dog
Appendix D
U.S. EPA Office of Pesticide Programs – Standard Operating Procedures for Assessing Residential Pesticide Exposure D-77
and a total of four strokes were applied to each cat to cover the whole body surface at each sampling interval. One glove was used for each test animal at each of the sampling intervals. The residue levels of fipronil in each glove were reported and used for calculating the percent of dislodgeable residues. The percent of dislodgeable residues was calculated based on the total residues levels divided by the actual amount of fipronil sprayed for each treatment. Most of the laboratory recoveries for both studies fell within the range of 70 -120%.
Table D-28: Available Exposure Study Identification Information
Citation McKeown, K. (2001). Determination of the Dislodgeability of Tetrachlorvinphos (TCVP) from the Fur of Dogs Following the Application of an Insecticide Powder, Pump Spray or Aerosol
EPA MRID 45485501
EPA Review D277543 Contractor (Versar, Inc.) review 11/19/2001
MRID = Master Record Identification The study, “Determination of the Dislodgeability of Tetrachlorvinphos (TCVP) from the Fur of Dogs Following the Application of an Insecticide Powder, Pump Spray or Aerosol,” was conducted to determine the potential for TCVP to become dislodged from an animal and be available for human exposure. This study provides data on the amount of TCVP dislodged by the human hand when stroking a dog following the application onto the dog of an aerosol, spray, or powder product. The study determined the total amount of TCVP on the fur of 5 dogs after a single treatment by one of three types of product (aerosol, powder and pump spray) applied according to label direction. The study concurrently determined the amount of TCVP which was dislodged onto the hand from 5 strokes of the full length of the animals’ body. Both of these parameters were measured at baseline and at 4 hours, 1 day, 2 days, 4 days, 8 days, 16 days and 32 days after treatment (DAT). The study used three types of products, each with different delivery systems, the application by 5 different applicators, and the use of 5 different dogs. The study used a “split-back” methodology. In this methodology, one side of the dog’s back is stroked by a human hand to determine dislodgeability residues of TCVP, and samples of fur are taken from the opposite side of the dog’s back to determine total residues of TCVP. This study uses the bare human hand to model the dislodgeability rather than a cotton glove. Fortified sample recoveries were in an acceptable range and no significant QA/QC problems were identified. The study results are similar or lower to the findings found in the earlier study where a cotton glove was used.
Table D-29: Available Exposure Study Identification Information
Citation Brickel, P. et al. (1997). Dislodgeable Residues of Fipronil Following Topical Application of Frontline® Spot-on Treatment to Dogs
EPA MRID 44531203
EPA Review Contractor (Versar, Inc.) review 1/9/2008
MRID = Master Record Identification
Appendix D
U.S. EPA Office of Pesticide Programs – Standard Operating Procedures for Assessing Residential Pesticide Exposure D-78
The study, “Dislodgeable Residues of Fipronil Following Topical Application of Frontline® Spot-on Treatment to Dogs, was conducted to measure the dislodgeability of the test substance, Frontline®”, over time from the hair coat of dogs treated with a spot-on formulation containing fipronil as the active ingredient. The test substance was administered to six Beagle dogs by topical application to the back (between the shoulders) using ready-to-use pipettes intended for commercial application. Each dog received a maximum label specified application dose of 1.34 mL (131,722 µg ai) of the test product on Day 0. The subsequent field sampling consisted of stroking the entire body surface of the dog by taking 5 strokes along the body of the dog using the palmar surface of one hand, while wearing cotton gloves to collect the residues. Glove samples were collected from each dog prior to treatment and at 10 intervals following treatment (1 hr to 28 days). The cotton gloves were analyzed for fipronil and the results were reported as µg/glove fipronil per glove. None of the residues were corrected since average recoveries of fipronil were greater than 90%. In addition, the Registrant reported the percent of the applied dose that was dislodgeable at each sampling period after application.
Table D-30: Available Exposure Study Identification Information
Citation Bach, T. (2002). Stroking Test in Dogs After Topical Application of Imidacloprid 10% (w/v) + Permethrin 50% (w/v) Spot-On
EPA MRID 46594103 EPA Review Contractor (Versar, Inc.) review 9/12/2005
MRID = Master Record Identification The purpose of this study was to measure the dislodgeability of the test substance (imidacloprid and permethrin) from the hair coat of dogs treated with a spot-on formulation. The substance was applied to beagle dogs by topical application to the back (spine) using pipettes intended for commercial application. The test substance was applied in a quantity of 2.5 ml to each animal in the study, with each receiving a dose equivalent to 250 mg imidacloprid and 1250 mg permethrin. Residues were collected to assess post-application exposure to the treated dogs by stroking the dogs 3 times from head to tail over the application areas while wearing absorbent cotton gloves. "Medium" pressure was applied for each stroking procedure. Samples were collected at intervals of 30 minutes, 2 hours, 12 hours, and 24 hours after application. Four groups of 5 beagle dogs were established, and each group was sampled for one of the 4 sampling intervals only. Dog weights ranged between 10 and 25 kg. The limit of quantitation (LOQ) for imidacloprid was determined to be 0.25 mg/glove and 1.25 mg/glove for permethrin. If individual sample results were below the LOQ, 1/2 the LOQ for the chemical was used for quantitative purposes.
Table D-31: Available Exposure Study Identification Information
Citation Wrzesinski, C. (2009). Dislodgeable Residue Study of SCH 783460 from Spot-On Treated Beagle Dogs
EPA MRID 47834502 EPA Review Contractor (Versar, Inc.) review 2/22/2010
MRID = Master Record Identification

Appendix D
U.S. EPA Office of Pesticide Programs – Standard Operating Procedures for Assessing Residential Pesticide Exposure D-79
Table D-32: Available Exposure Study Identification Information Citation Wrzesinski, C. (2010). One-Month Dislodgeable Residue Study of SCH 783460
from Spot-On Treated Cats EPA MRID 48010801 EPA Review Contractor (Versar, Inc.) review 4/09/2010
MRID = Master Record Identification Two post-application pre-registration studies, the “Dislodgeable Residue Study of SCH 783460 from Spot-On Treated Beagle Dogs” (MRID 47834502), and the “One-Month Dislodgeable Residue Study of SCH 783460 from Spot-On Treated Cats” (MRID 48010801) were conducted to measure the transferability of the test substance SCH 783460, a spot-on formulation of indoxacarb, over time from the hair coat of treated pets to a gloved mannequin hand. The dislodgeability residues of indoxacarb were studied in 10 beagle dogs (5 female and 5 male), weighing 10.7 to 19.08 kg at dose administration, and 10 cats (5 female and 5 male) weighing 3.24 to 7.7 kg after a topical application of an indoxacarb spot-on treatment. Dogs and cats were topically treated with the indoxacarb spot-on formulation by parting the hair at the base of the skull and applying the test substance directly onto the skin. Each animal received one treatment on Day 0 with the maximum label rate of 1.5 mL of product per kg of body weight for dogs and 1.0 mL of product per kg for cats. On each study the test substance, SCH 783460, was administered to 10 pets (10 beagle dogs for the dog study and 10 cats for the cat study), by topical application to the back using plastic syringes. Indoxacarb residues were measured on treated pets after stroking the pets three times per simulation, for 10 simulations (30 strokes total) with a mannequin hand fitted with two cotton gloves over top of a nitrile glove. Residues were extracted from the nitrile and cotton gloves. Samples were collected from each pet at the following intervals: prior to treatment, at 4, and 8 hours after treatment and at 1, 2, 4, 7, 14, 21, and 28 days after treatment. The cotton and nitrile glove samples were analyzed for indoxacarb (SCH 783460) and the active metabolite JT333. No detectable residues of the metabolite, JT333, were determined in the inner glove or nitrile glove samples, on either study, therefore only outer glove results were presented. The residue levels of indoxacarb in each glove were reported and used for calculating the percent of dislodgeable residues. Residues were calculated in µg/glove, µg/cm2 of dog/cat surface area, and percent of applied dose transferred. For the dog study, indoxacarb average residues from all three gloves combined increased from 4,037 µg/glove (1.78% of applied dose and 0.65 µg/cm2) at 4 hours after application to a maximum of 5,690 µg/glove (2.55% of applied dose and 0.926 µg/cm2) at 1 day after application. Residues then declined to 177 µg/glove (0.078% of applied dose and 0.028 µg/cm2) by Day 28 after application. For the cat study, indoxacarb average residues from all three gloves combined decreased from 1,941 µg/glove (1.24% of applied dose and 0.56 µg/cm2) at 4 hours after application to 227 µg/glove (0.141% of applied dose and 0.064 µg/cm2) by Day 28 after application.

Appendix D
U.S. EPA Office of Pesticide Programs – Standard Operating Procedures for Assessing Residential Pesticide Exposure D-80
Table D-33: Available Exposure Study Identification Information
Citation Wrzesinski, C., (2010). One-Month Dislodgeable Residue Study of Indoxacarb and Permethrin from Spot-On Treated Beagle Dogs
EPA MRID 48135326 EPA Review Contractor (Versar, Inc.) review 12/14/2010 MRID = Master Record Identification
A post-application pre-registration study, “One-Month Dislodgeable Residue Study of Indoxacarb and Permethrin from Spot-On Treated Beagle Dogs” (MRID 48135326), was conducted to measure the transferability of the test substance SCH 900560, a spot-on formulation of indoxacarb and permethrin, over time from the hair coat of treated dogs to a gloved mannequin hand. The dislodgeability residues of indoxacarb and permethrin were studied in 10 beagle dogs (5 female and 5 male), weighing 9.54 to 13.62 kg at dose administration. Dogs were topically treated with the indoxacarb-permethrin spot-on formulation by parting the hair at the base of the skull and applying the test substance directly onto the skin. Each animal received one treatment and actual doses ranged from 1.0 to 1.4 mL formulated product/dog (150 to 210 mg indoxacarb/dog and 480 to 672 permethrin/dog). The test substance, SCH 900560, was administered to 10 beagle dogs by topical application to the skin on the back shoulder blade area using plastic syringes in a spot-on procedure. Indoxacarb and permethrin residues were measured on treated dogs after 25 petting simulations, with each simulation consisting of three strokes (75 strokes total). The strokes were conducted using a mannequin hand fitted with two cotton gloves over top of a nitrile glove. Residues were extracted from the nitrile and cotton gloves. Samples were collected from each dog at the following intervals: prior to treatment, at 4, and 8 hours after treatment and at 1, 2, 4, 7, 14, 21, and 28 days after treatment. The cotton and nitrile glove samples were analyzed for indoxacarb (SCH 783460) and for permethrin (SCH 169937). The cis and trans isomers of permethrin were analyzed separately and the results summed to provide total permethrin values. The residue levels of indoxacarb and permethrin in each glove were reported and used for calculating the percent of dislodgeable residues. Residues were calculated in µg/glove, µg/cm2
of dog surface area, and percent of applied dose transferred. For indoxacarb, average residues from all three gloves combined increased from 2,842 µg/gloves (1.56% of applied dose and 0.87 µg/cm2) at 4 hours after application to a maximum of 3,212 µg/gloves (1.77% of applied dose and 0.99 µg/cm2) at 8 hours after application. Residues then declined to 247 µg/gloves (0.14% of applied dose and 0.078 µg/cm2) by Day 28 after application. For total permethrin, average residues from all three gloves combined increased from 9,686 µg/gloves (1.67% of applied dose and 2.98 µg/cm2) at 4 hours after application to a maximum of 11,125 µg/gloves (1.93% of applied dose and 3.43 µg/cm2) at 8 hours after application. Residues then declined to 821 µg/gloves (0.15% of applied dose and 0.26 µg/cm2) by Day 28 after application.

Appendix D
U.S. EPA Office of Pesticide Programs – Standard Operating Procedures for Assessing Residential Pesticide Exposure D-81
Data Summary for Available Studies for FAR Summary: Table D-34 summarizes pertinent exposure information from the above referenced petting/transfer study data sets identified for use in development of the FAR input presented individually and combined, respectively.
Table D-34: Fraction Application Rate (FAR) Transferred Study MRID N Fraction Application Rate
Transferred
Dislodgeable Residues of Fipronil Following
Application of Frontline® Spray
Treatment to Dogs
44433306 30
0.0041 0.0052 0.0053 0.0088 0.011 0.012
0.0067 0.0076 0.0081 0.0043 0.0049 0.0047 0.0076 0.0099 0.015
0.0061 0.0069 0.0047 0.0070 0.0072 0.0058 0.0045 0.0038 0.0045 0.0055 0.0077 0.0071 0.0056 0.0088 0.0076
Average 0.0069
Dislodgeable Residues of Fipronil Following
Application of Frontline® Spray Treatment to Cats
44433307 15
0.0021 0.0036 0.0030 0.0034 0.0047 0.0021 0.0046 0.0055 0.0044 0.0056 0.0020 0.0036 0.0049

Appendix D
U.S. EPA Office of Pesticide Programs – Standard Operating Procedures for Assessing Residential Pesticide Exposure D-82
Table D-34: Fraction Application Rate (FAR) Transferred 0.0028 0.0059
Average 0.0039
Determination of the Dislodgeability of Tetrachlorvinphos
(TCVP) from the Fur of Dogs Following the
Application of an Insecticide Powder,
Pump Spray or Aerosol
45485501 10
Aerosol/ Pump Spray 0.0056 0.0029 0.0035 0.0084 0.0035 0.0034 0.0038 0.0028 0.0025 0.0022
Average 0.0030
Dislodgeable Residues of Fipronil Following Topical Application of
Frontline® Spot-on Treatment to Dogs
44531203
18
0.0018 0.0068 0.0044 0.0021 0.0061 0.0047 0.0010 0.0039 0.0022 0.031 0.021
0.0069 0.0092 0.011
0.0046 0.0032 0.013
0.0043 Average 0.0076
Stroking Test in Dogs After Topical Application of
Imidacloprid 10% (w/v) + Permethrin 50% (w/v) Spot-On
46594103 18
0.0016 0.0016 0.0010 0.0062 0.0010 0.0018 0.0040 0.0033 0.0024 0.0042 0.0013 0.0015 0.0070 0.0016 0.0032 0.0023 0.0024 0.0026
Appendix D
U.S. EPA Office of Pesticide Programs – Standard Operating Procedures for Assessing Residential Pesticide Exposure D-83
Table D-34: Fraction Application Rate (FAR) Transferred Average 0.0027
Dislodgeable Residue Study of SCH 783460
(Indoxacarb) from Spot-On Treated
Beagle Dogs
47834502
20
0.015 0.018 0.014 0.014 0.028 0.011 0.018 0.019 0.013 0.027 0.016 0.019 0.019 0.031 0.043 0.01
0.026 0.023 0.015 0.037
Average 0.0208
One-Month Dislodgeable Residue Study of SCH 783460
(Indoxacarb) from Spot-On Treated Cats
48010801
20
0.0072 0.0370 0.0035 0.0140 0.019
0.0072 0.01
0.0061 0.0053 0.015
0.0047 0.014
0.0016 0.0051
0.01 0.0065 0.0059 0.013
0.0056 0.0084
Average 0.0100
0.0085 0.0053 0.0032 0.0088

Appendix D
U.S. EPA Office of Pesticide Programs – Standard Operating Procedures for Assessing Residential Pesticide Exposure D-84
Table D-34: Fraction Application Rate (FAR) Transferred
One-Month Dislodgeable Residue Study of Indoxacarb
from Spot-On Treated Beagle Dogs
48135326
20
0.0076 0.011
0.0144 0.0147 0.0049 0.0094 0.0113 0.0063 0.0056 0.0079 0.0092
0.01 0.016
0.0149 0.0081 0.0099
Average 0.0094
One-Month Dislodgeable Residue Study of Permethrin
from Spot-On Treated Beagle Dogs
48135326
20
0.0155 0.0106 0.0051 0.0174 0.017
0.0197 0.0268 0.0285 0.0096 0.0169 0.0119 0.0119 0.0119 0.0164 0.0199 0.0196 0.0294 0.0271 0.0166 0.0197
Average 0.0176 Combined Average of All Studies 0.0096
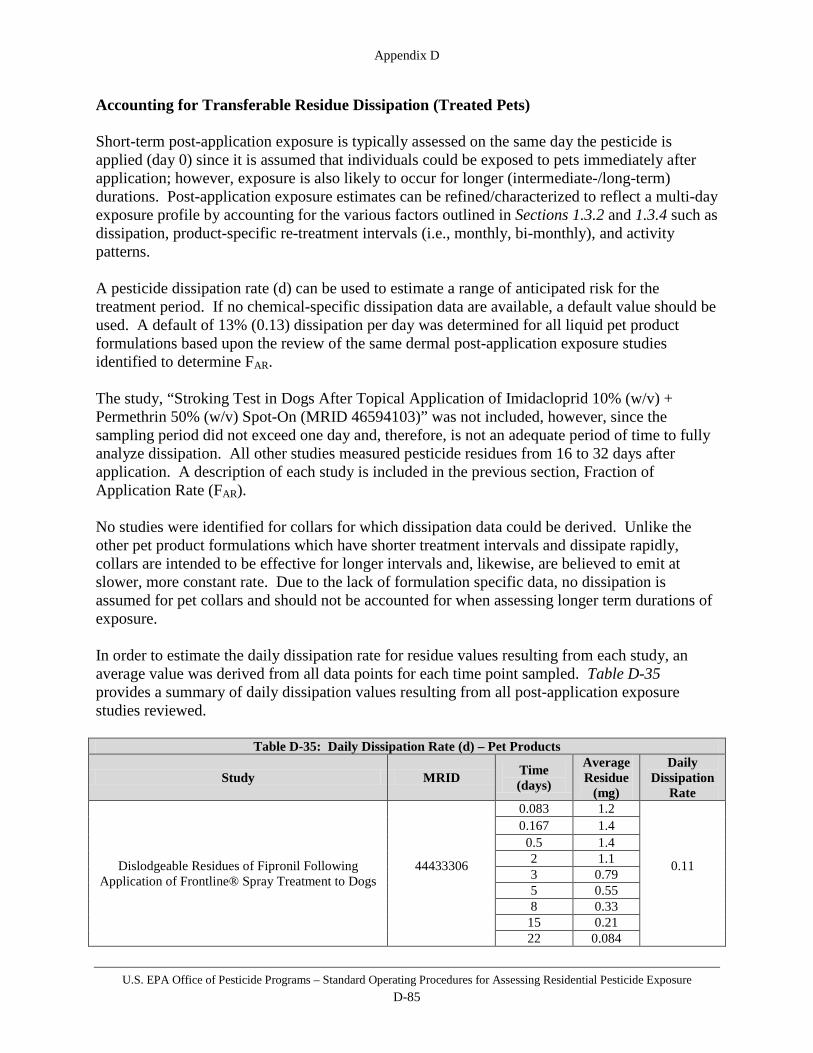
Appendix D
U.S. EPA Office of Pesticide Programs – Standard Operating Procedures for Assessing Residential Pesticide Exposure D-85
Accounting for Transferable Residue Dissipation (Treated Pets) Short-term post-application exposure is typically assessed on the same day the pesticide is applied (day 0) since it is assumed that individuals could be exposed to pets immediately after application; however, exposure is also likely to occur for longer (intermediate-/long-term) durations. Post-application exposure estimates can be refined/characterized to reflect a multi-day exposure profile by accounting for the various factors outlined in Sections 1.3.2 and 1.3.4 such as dissipation, product-specific re-treatment intervals (i.e., monthly, bi-monthly), and activity patterns. A pesticide dissipation rate (d) can be used to estimate a range of anticipated risk for the treatment period. If no chemical-specific dissipation data are available, a default value should be used. A default of 13% (0.13) dissipation per day was determined for all liquid pet product formulations based upon the review of the same dermal post-application exposure studies identified to determine FAR. The study, “Stroking Test in Dogs After Topical Application of Imidacloprid 10% (w/v) + Permethrin 50% (w/v) Spot-On (MRID 46594103)” was not included, however, since the sampling period did not exceed one day and, therefore, is not an adequate period of time to fully analyze dissipation. All other studies measured pesticide residues from 16 to 32 days after application. A description of each study is included in the previous section, Fraction of Application Rate (FAR). No studies were identified for collars for which dissipation data could be derived. Unlike the other pet product formulations which have shorter treatment intervals and dissipate rapidly, collars are intended to be effective for longer intervals and, likewise, are believed to emit at slower, more constant rate. Due to the lack of formulation specific data, no dissipation is assumed for pet collars and should not be accounted for when assessing longer term durations of exposure. In order to estimate the daily dissipation rate for residue values resulting from each study, an average value was derived from all data points for each time point sampled. Table D-35 provides a summary of daily dissipation values resulting from all post-application exposure studies reviewed.
Table D-35: Daily Dissipation Rate (d) – Pet Products
Study MRID Time (days)
Average Residue
(mg)
Daily Dissipation
Rate
Dislodgeable Residues of Fipronil Following Application of Frontline® Spray Treatment to Dogs
44433306
0.083 1.2
0.11
0.167 1.4 0.5 1.4 2 1.1 3 0.79 5 0.55 8 0.33 15 0.21 22 0.084

Appendix D
U.S. EPA Office of Pesticide Programs – Standard Operating Procedures for Assessing Residential Pesticide Exposure D-86
Table D-35: Daily Dissipation Rate (d) – Pet Products
Study MRID Time (days)
Average Residue
(mg)
Daily Dissipation
Rate 29 0.044
Dislodgeable Residues of Fipronil Following Application of Frontline® Spray Treatment to Cats 44433307
0.083 0.17
0.13
0.167 0.23 0.5 0.20 2 0.19 3 0.082 5 0.030 8 0.010 15 0.0057 22 0.0057 29 0.0057
Determination of the Dislodgeability of Tetrachlorvinphos (TCVP) from the Fur of Dogs
Following the Application of an Insecticide Powder, Pump Spray or Aerosol – Pump Spray
45485501
0.17 1.7
0.19
1 0.87 2 0.32 4 0.071 8 0.019 16 0.002
32 0.002
Determination of the Dislodgeability of Tetrachlorvinphos (TCVP) from the Fur of Dogs
Following the Application of an Insecticide Powder, Pump Spray or Aerosol – Aerosol
45485501
0.17 1.3
0.18
1 0.83 2 0.70 4 0.19 8 0.026 16 0.038 32 0.033
Dislodgeable Residues of Fipronil Following Topical Application of Frontline® Spot-on Treatment to
Dogs 44531203
0.04 1.1
0.17
1.17 1.4 0.33 0.60
1 0.63 2 0.59 4 0.29 7 0.21 14 0.047 21 0.021 28 0.0047
Dislodgeable Residue Study of SCH 783460 (Indoxacarb) from Spot-On Treated Beagle Dogs 47834502
0.17 4.04
0.12
0.33 5.29 1 5.69 2 4.39 4 3.46 7 2.24 14 0.71 28 0.18
One-Month Dislodgeable Residue Study of SCH 783460 (Indoxacarb) from Spot-On Treated Cats 48010801
0.17 1.94
0.056 0.33 1.21
1 0.87 2 0.93 4 1.0

Appendix D
U.S. EPA Office of Pesticide Programs – Standard Operating Procedures for Assessing Residential Pesticide Exposure D-87
Table D-35: Daily Dissipation Rate (d) – Pet Products
Study MRID Time (days)
Average Residue
(mg)
Daily Dissipation
Rate 7 0.85 14 0.75 28 0.23
One-Month Dislodgeable Residue Study of Indoxacarb from Spot-On Treated Beagle Dogs 48135326
0.17 2.8
0.090
0.33 3.2 1 3.2 2 2.8 4 2.1 7 1.4 14 0.70 28 0.25
One-Month Dislodgeable Residue Study of Permethrin from Spot-On Treated Beagle Dogs 48135326
0.17 9.7
0.090
0.33 11 1 11 2 9.2 4 7.0 7 4.5 14 2.7 28 0.82
Average 0.13 The following algorithm should be used for the purpose of refining/characterizing estimated post-application dermal exposures attributable to an adult or child 1 < 2 years old contacting a treated companion pet [Note: When d=0 (i.e., when one assumes no dissipation), the integration equation used to derive the exposure equation below reduces to Equation 8.3.]: E = TC * TR * (1 – e-ET * K) * (1 – (1 – d)n) n * K d where:
E = exposure (mg/day); TC = transfer coefficient (cm2/hr); TR = transferable residue (mg/cm2); d = daily dissipation rate (unitless); ET = exposure time (hours/day); n = number of days of exposure; and K = decay constant.
and K = ln (1 – d)
-24 TR = AR * FAR SA
Appendix D
U.S. EPA Office of Pesticide Programs – Standard Operating Procedures for Assessing Residential Pesticide Exposure D-88
where: TR = transferable residue (mg/cm2); AR = application rate or amount applied to animal (mg); FAR = fraction of the application rate available as transferable residue; and SA = surface area of the pet (cm2).
Dermal dose, normalized to body weight, is calculated as: D = E * AF BW where:
D = dose (mg/kg-day); E = exposure (mg/day); AF = absorption factor (dermal); and BW = body weight (kg).
D.7 Generic Estimates of Residential Transfer Coefficients A transfer coefficient is a measure of surface-to-skin residue transfer dependent on factors such as surface type and contact intensity. It is derived from concurrent measurements of exposure and foliar residue, and is the ratio of exposure, measured in mass of chemical per time (e.g., µg/hr), to residue, measured in mass of chemical per foliar surface area (e.g., µg/cm2), with resulting units cm2/hr. It follows that the use of this ratio precludes the necessity to measure exposure because it can be reasonably predicted from measured residue using a scenario-specific transfer coefficient. Additionally, based on analysis of various studies, it is apparent that transfer coefficients differ based on different activities and scenarios. For example, the transfer of residues while harvesting apples is different than while weeding cabbage; or a child playing on a treated carpet experiences a different level of residue transfer than a child playing on a treated lawn. Chemical- and scenario-specific exposure measurements are preferable to predicting exposure using residue and transfer coefficients. However, in the event chemical- and scenario-specific exposure data are unavailable, generic transfer coefficients have been derived for use in specific residential situations.
D.7.1 Turf Residential Turf Exposure Data to adequately characterize exposure for individuals who contact previously treated residential turf are scarce. However, a residential re-entry exposure study is available to establish reliable transfer coefficients for representative activities in residential settings. This study (D. Klonne and D. Johnson, MRID 47292001) was conducted by the Outdoor Residential Exposure Task Force (ORETF) to determine dermal exposure to residents re-entering a treated turf plot after granular and liquid applications.

Appendix D
U.S. EPA Office of Pesticide Programs – Standard Operating Procedures for Assessing Residential Pesticide Exposure D-89
Two types of re-entry activities were monitored in the study. The first activity was an approximate 20-minute Jazzercise routine (represented by JAZZ) and the second activity was an approximate 2-hour composite routine consisting of many typical children’s activities (represented by CHAPS). The Jazzercise routine is a highly choreographed routine of exercises performed to music. The CHAPS routine is a series of 12 sequential activities that simulated activities in which children routinely engage on residential turf. The activities were selected from activities listed in the National Human Activity Pattern Survey (NHAPS) for children aged 1 to 12 years (Klepeis, et. al., 2001). Table D-36 summarizes the activities and the time allotted for each activity.
Table D-36: Summary of the Activities and the Duration for Each Activity Act ivity Group Activ ity Duration (minutes) Passive Walking/Jogging 12
Playing catch 12 Crawling 12
Picnicking 12 Resting 12
Active Playing with toys 8 Playing Frisbee 8 Playing soccer 8
Playing games (spud) 8 Playing tag (steal the bacon) 8
Hard Direct Football 10 Tumbling 10
A total of 40 participants were used in this study. For each formulation, 20 participants (10 participants each during a morning and afternoon session) performed the JAZZ routine and 20 participants (10 participants each during a morning and afternoon session) performed the CHAPS routine. A two hour duration was chosen for the CHAPS routine because the NHAPS indicated that the upper-bound estimate of time children spend playing on turf is two hours per day. The potential dermal exposure during re-entry was assessed by using whole-body dosimetry (inner and outer dosimeters), socks (JAZZ only), foot washes (CHAPS only), hand washes, and face/neck wipes. Dermal transfer coefficients in cm2/hr were calculated by dividing the corrected residue value (μg) by the replicate duration (hr) and by the formulation-specific turf transferable residue value (μg/cm2). Within a given activity, total dermal dose (µg) was always lower for the granular formulation than the liquid formulation. Across each formulation, the normalized transfer coefficients (µg/hr) for the CHAPS routine were consistently higher than the JAZZ routine. Table D-37 presents the raw transfer coefficient data for both the liquid and granular formulation.
Table D-37: Liquid and Granular Formulation TC Data Used for Dermal Scenarios (shoes)
Lifestage Formulation TC Values (cm2/hr) Formulation TC Values (cm2/hr)
Adult Liquid
195,858
Granular
199,490 139,625 114,286 138,525 272,194 220,767 163,520

Appendix D
U.S. EPA Office of Pesticide Programs – Standard Operating Procedures for Assessing Residential Pesticide Exposure D-90
Table D-37: Liquid and Granular Formulation TC Data Used for Dermal Scenarios (shoes)
Lifestage Formulation TC Values (cm2/hr) Formulation TC Values (cm2/hr)
148,625 218,367 224,417 180,867 174,375 157,398 219,742 154,337 112,133 186,735 261,175 139,541 184,262 298,457 137,342 182,099 230,253 196,296 124,241 239,506 198,882 190,741 219,873 230,556 195,802 240,432 174,156 211,111 160,802 166,049 198,819 231,173
All transfer coefficient values are expressed as square centimeters per hour (cm2/hr). Each adult transfer coefficient was log-transformed and plotted to evaluate its fit to a lognormal distribution. The data appears to reasonably fit a lognormal distribution as shown in the figure below. This analysis also allowed for the assessment of the statistical differences between the transfer coefficients calculated using the liquid data vs. the granular data. It was determined that these two distributions should not be combined because the upper percentile values were 25% higher for the granular transfer coefficients vs. the liquid transfer coefficients even though the central tendency values of the two distributions were similar.
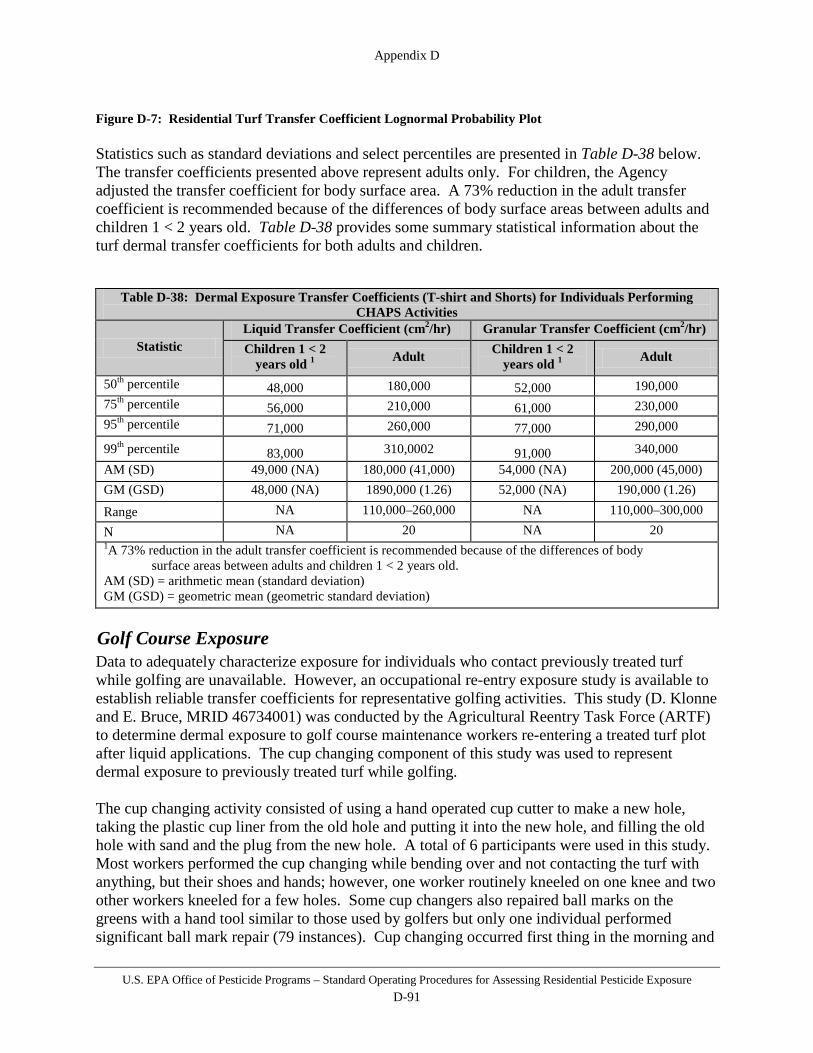
Appendix D
U.S. EPA Office of Pesticide Programs – Standard Operating Procedures for Assessing Residential Pesticide Exposure D-91
Figure D-7: Residential Turf Transfer Coefficient Lognormal Probability Plot Statistics such as standard deviations and select percentiles are presented in Table D-38 below. The transfer coefficients presented above represent adults only. For children, the Agency adjusted the transfer coefficient for body surface area. A 73% reduction in the adult transfer coefficient is recommended because of the differences of body surface areas between adults and children 1 < 2 years old. Table D-38 provides some summary statistical information about the turf dermal transfer coefficients for both adults and children.
Table D-38: Dermal Exposure Transfer Coefficients (T-shirt and Shorts) for Individuals Performing CHAPS Activities
Statistic Liquid Transfer Coefficient (cm2/hr) Granular Transfer Coefficient (cm2/hr) Children 1 < 2
years old 1 Adult Children 1 < 2 years old 1 Adult
50th percentile 48,000 180,000 52,000 190,000 75th percentile 56,000 210,000 61,000 230,000 95th percentile 71,000 260,000 77,000 290,000
99th percentile 83,000 310,0002 91,000 340,000 AM (SD) 49,000 (NA) 180,000 (41,000) 54,000 (NA) 200,000 (45,000) GM (GSD) 48,000 (NA) 1890,000 (1.26) 52,000 (NA) 190,000 (1.26)
Range NA 110,000–260,000 NA 110,000–300,000
N NA 20 NA 20 1A 73% reduction in the adult transfer coefficient is recommended because of the differences of body surface areas between adults and children 1 < 2 years old. AM (SD) = arithmetic mean (standard deviation) GM (GSD) = geometric mean (geometric standard deviation)
Golf Course Exposure Data to adequately characterize exposure for individuals who contact previously treated turf while golfing are unavailable. However, an occupational re-entry exposure study is available to establish reliable transfer coefficients for representative golfing activities. This study (D. Klonne and E. Bruce, MRID 46734001) was conducted by the Agricultural Reentry Task Force (ARTF) to determine dermal exposure to golf course maintenance workers re-entering a treated turf plot after liquid applications. The cup changing component of this study was used to represent dermal exposure to previously treated turf while golfing. The cup changing activity consisted of using a hand operated cup cutter to make a new hole, taking the plastic cup liner from the old hole and putting it into the new hole, and filling the old hole with sand and the plug from the new hole. A total of 6 participants were used in this study. Most workers performed the cup changing while bending over and not contacting the turf with anything, but their shoes and hands; however, one worker routinely kneeled on one knee and two other workers kneeled for a few holes. Some cup changers also repaired ball marks on the greens with a hand tool similar to those used by golfers but only one individual performed significant ball mark repair (79 instances). Cup changing occurred first thing in the morning and

Appendix D
U.S. EPA Office of Pesticide Programs – Standard Operating Procedures for Assessing Residential Pesticide Exposure D-92
a monitoring event consisted of changing 18 cups. This task took approximately 1.5 to 2.5 hours, including 33 to 110 minutes changing the cups, 43 to 52 minutes traveling between holes, and 0 to 20 minutes spent resting, talking to other workers, or performing tasks other than cup changing. Dermal transfer coefficients in cm2/hr were calculated by dividing the corrected residue value (μg) by the replicate duration (hr) and by the worker-specific turf transferable residue value (μg/cm2). Total dermal transfer coefficients were calculated for three clothing scenarios: (1) wearing long pants and a long sleeved shirt, (2) wearing long pants and a t-shirt, and (3) wearing shorts and a t-shirt. Table D-39 presents the transfer coefficient data for the shorts and t-shirt clothing scenario.
Table D-39: Dermal Exposure Transfer Coefficients (T-shirt and Shorts) for Individuals Golfing
Lifestage TC Values (cm2/hr)
Adult
988 1,097 1,253 2,667 7,165 18,863
All transfer coefficient values are expressed as square centimeters per hour (cm2/hr). Each adult transfer coefficient was log-transformed and plotted to evaluate its fit to a lognormal distribution. The data appears to reasonably fit a lognormal distribution as shown in the figure below.
Figure D-8: Golfing Turf Transfer Coefficient Lognormal Probability Plot
y = 1.2254x + 7.94
R2 = 0.8829
0
2
4
6
8
10
12
-1.50 -1.00 -0.50 0.00 0.50 1.00 1.50
Standard Normal Score
ln T
C (
ug/
cm2
)

Appendix D
U.S. EPA Office of Pesticide Programs – Standard Operating Procedures for Assessing Residential Pesticide Exposure D-93
The transfer coefficients presented above represent adults only. For children 11 < 16 years old, the transfer coefficient is adjusted for body surface area using a factor of 0.87 (i.e., a 13% reduction in the TC) as outlined in Section 2.3. For children 6 < 11 years old, the transfer coefficient is adjusted for body surface area using a factor of 0.59 (i.e., a 41% reduction in the TC) as outlined in Section 2.3. Table D-40 provides some summary statistical information about the turf dermal transfer coefficients for both adults and children.
Table D-40: Dermal Exposure Transfer Coefficients (T-shirt and Shorts) for Individuals Golfing
Statistic Adult Transfer Coefficient (cm2/hr)
Children 11 < 16 years old Transfer Coefficient
(cm2/hr) 1
Children 6 < 11 years old Transfer Coefficient
(cm2/hr) 2 50th percentile 2,800 2,300 1,500 75th percentile 6,400 5,300 3,500 95th percentile 21,000 17,000 12,000 99th percentile 49,000 40,000 27,000 AM (SD) 5,300 (7,000) 4,400 (NA) 2,900 (NA) GM (GSD) 2,800 (3.3) 2,300 (NA) 1,500 (NA)
Range 988–18,863 NA NA
N 6 NA NA 1 An 18% reduction in the adult transfer coefficient is recommended to account for the differences of body surface areas between adults and children 11 < 16 years old. 2 An 45% reduction in the adult transfer coefficient is recommended to account for the differences of body surface areas between adults and children 6 < 11 years old. AM (SD) = arithmetic mean (standard deviation) GM (GSD) = geometric mean (geometric standard deviation)
Lawn Mowers Exposure Data to adequately characterize exposure for individuals who contact previously treated turf while mowing are unavailable. However, an occupational re-entry exposure study is available to establish reliable transfer coefficients for representative mowing activities. This study (D. Klonne and E. Bruce, MRID 46734001) was conducted by the Agricultural Reentry Task Force (ARTF) to determine dermal exposure to golf course maintenance workers re-entering a treated turf plot after liquid applications. The mowing component of this study was used to represent dermal exposure to previously treated turf while mowing a residential lawn. The mowing activity consisted of two distinct types of mowing: mowing greens and mowing fairways. The mowing greens activity consisted of using a walk-behind reel mower with a grass catcher to make two perpendicular passes to cut the green to 7/32-inch height. A total of 8 participants performed this activity in the study. This activity included emptying the grass catchers and spreading clippings in the rough areas around the golf course as well as hosing off the mower with water at the conclusion of mowing. Greens mowing occurred in the morning (after cups had been changed) and a monitoring event consisted of mowing 4 to 5 greens. This task took approximately 2 to 3 hours, including 89 to 140 minutes mowing or emptying baskets, 23 to 43 minutes traveling between holes, and 0 to 29 minutes spent resting, talking to other workers, or performing tasks other than mowing. When the mower was engaged, the workers walked briskly behind the mower to keep up. At the end of each pass, the worker pushed down on the mower handle to the lift the reel off the ground and quickly turned the mower around to make the next

Appendix D
U.S. EPA Office of Pesticide Programs – Standard Operating Procedures for Assessing Residential Pesticide Exposure D-94
pass adjacent to the previous pass. Workers generally mowed in one direction, then the other, and then made a pass around the perimeter of the green to finish off the mowing process. The mowing fairways activity consisted of using either a 5-reel riding mower to mow fairways to ¾ inch height or a 3-reel riding mower to mow tee boxes and surrounds (areas around the greens) to ½-inch height. A total of 8 participants performed these activities in the study. This activity included emptying the grass catchers of the mower and spreading clippings in the rough areas around the golf course as well as hosing off the mower with water at the conclusion of mowing. Fairway mowing occurred in the morning and a monitoring event consisted of mowing either 5 to 6 fairways or surrounds for 9 holes. This task took approximately 2 to 4.5 hours, including 96 to 253 minutes mowing fairway or surrounds, 11 to 30 minutes traveling, and 0 to 4 minutes talking to other workers or repairing motor. The workers generally mowed the fairways and surrounds in one of two patterns: 1) mow the perimeter, then back-and-forth or 2) in a “spiral” pattern, from the outside to inside. The mowers were operated at a low speed (3.5 miles per hour) since it was found that moist grass clippings were not efficiently “thrown” into the grass catchers if the speed was higher. When the grass was wet, the 5-reel mower would frequently get clumps of turf caught in the reel mechanisms, which would require the operator to lift the reels, stop the mower, get off, and clear the clipping from the reels with his hands and/or a stick. The workers would also occasionally dismount to remove debris or to move 150-yard markers. Dermal transfer coefficients in cm2/hr were calculated by dividing the corrected residue value (μg) by the replicate duration (hr) and by the worker-specific turf transferable residue value (μg/cm2). Total dermal transfer coefficients were calculated for three clothing scenarios: (1) wearing long pants and a long sleeved shirt, (2) wearing long pants and a t-shirt, and (3) wearing shorts and a t-shirt. Table D-41 presents the transfer coefficient data for the shorts and t-shirt clothing scenario.
Table D-41: Dermal Exposure Transfer Coefficients (T-shirt and Shorts) for Individuals Mowing Lifestage Activity TC Values (cm2/hr)
Adult
Mowing Greens
661 1,035 2,245 6,913 1,982 319
25,860 18,875
Mowing Fairways
648 6,616 1,874 2,369 2,951 1,109 11,387 3,031
All transfer coefficient values are expressed as square centimeters per hour (cm2/hr). Each adult transfer coefficient was log-transformed and plotted to evaluate its fit to a lognormal distribution.

Appendix D
U.S. EPA Office of Pesticide Programs – Standard Operating Procedures for Assessing Residential Pesticide Exposure D-95
The data appears to reasonably fit a lognormal distribution as shown in the figure below. This analysis also allowed for the assessment of the statistical differences between the transfer coefficients calculated using the mowing greens data vs. the mowing fairways data. Based on this analysis, it was determined that there was no statistical difference between these datasets and thus, in calculating the adult dermal mowing transfer coefficient the data were combined.
Figure D-9: Mowing Turf Transfer Coefficient Lognormal Probability Plot The transfer coefficients presented above represent adults only. For youths/teens, the transfer coefficient is adjusted for body surface area by a factor of 0.82 (i.e., an 18% TC reduction) as outlined in Section 2.3. Table D-42 provides some summary statistical information about the turf dermal transfer coefficients for both adults and children.
Table D-42: Dermal Exposure Transfer Coefficients (T-shirt and Shorts) for Individuals Performing Mowing Activities
Statistic Adult Transfer Coefficient (cm2/hr) 1
Youth/Teen Transfer Coefficient (cm2/hr) 2
50th percentile 2,700 2,200 75th percentile 6,300 5,200 95th percentile 22,000 18,000 99th percentile 54,000 44,000 99.9th percentile 140,000 4,500 (NA) Arithmetic Mean 5,500 2,200 (NA) Arithmetic Standard Deviation 7,300 NA Geometric Mean 2,700 NA Geometric Mean Standard Deviation 3.5 NA Range 319–25,860 NA
Mowing Turf Transfer Coefficient Lognormal Probability
0
2
4
6
8
10
12
-2.00 -1.50 -1.00 -0.50 0.00 0.50 1.00 1.50 2.00
Standard Normal Score
ln T
C (u
g/cm
2)
Mowing Greens
Mowing Fairways

Appendix D
U.S. EPA Office of Pesticide Programs – Standard Operating Procedures for Assessing Residential Pesticide Exposure D-96
D.7.2 Gardens, Trees, and “Pick-your-own” Farms Data to adequately characterize exposure for individuals who contact previously treated residential gardens and trees and in “pick-your-own” farms is unavailable. Therefore, occupational re-entry exposure studies, all conducted by the Agricultural Reentry Task Force (ARTF), were used to establish transfer coefficients for representative crops and activities in residential settings. Unlike occupational settings where individuals generally perform one task (or, at most a few tasks) on a single crop throughout the day (e.g., harvesting apples), individuals in residential settings are likely to conduct various activities. Therefore, transfer coefficients from occupational reentry studies were used to establish composite transfer coefficients for distinct activities likely to occur in residential settings. Additionally, also unlike occupational settings, the transfer coefficients represent individuals wearing shorts and short-sleeve shirts, a standard assumption in residential exposure assessment. Activities are divided between those that would occur in gardens (vegetables, fruit, and flowers), those that would occur with trees (fruit and nut trees and ornamental shrubs and bushes), and those that would occur for indoor plants. Transfer coefficients for each category are then derived from select occupational reentry exposure studies considered to be representative of “residential-like” activities. Table D-43 below lists the occupational field reentry studies used to derive transfer coefficients for each of these scenarios.
Table D-43: Gardens, Trees, and “Pick-your-own” Farms – Transfer Coefficient Studies
Residential Post-application Activity Representative Crop/Activity Combinations
Study Code MRID ARTF #
Gardens (vegetables and flowers)
Cabbage weeding 45191701 ARF037 Tomato tying 45530103 ARF051
Squash harvesting 45491902 ARF049 Chrysanthemum pinching 45344501 ARF039
Trees and Retail Plants (fruits, nuts, ornamentals, shrubs,
bushes)
Ornamental citrus tree pruning 45469501 ARF043 Apple harvesting 45138202 ARF025 Orange harvesting 45432302 ARF041
Grapefruit harvesting 45432302 ARF042 Indoor Plants Ornamental citrus tree pruning 45469501 ARF043
Despite the uncertainty of using occupational reentry monitoring studies, where workers likely conduct activities in a much different fashion than those in residential settings, the transfer coefficients outlined are considered reasonable for use in risk assessment. Note that use of these transfer coefficients for youths should be used in combination with an adjustment factor of 0.55 for body surface area. Vegetable, Fruit, and Flower Gardening Activities at Home and at “Pick-your-own” Farms Transfer coefficients for residential gardening and picking vegetables, fruits, and flowers at “pick-your-own” farms were derived using studies considered adequately representative of activities in these settings such as weeding and picking vegetables and flowers. The studies used

Appendix D
U.S. EPA Office of Pesticide Programs – Standard Operating Procedures for Assessing Residential Pesticide Exposure D-97
measured exposure for workers during four different studies: cabbage weeding, tomato tying, squash harvesting, and chrysanthemum pinching. Table D-44 below presents the raw data for these studies.
Table D-44: Gardening at Home and at “Pick-your-own” Vegetable Farms: Transfer Coefficient Data Study Reference Crop Activity Person ID DAA Transfer
Coefficient ARTF # MRID
ARF037 45191701 Cabbage Weeding
A 1 29,612 2 41,329 3 31,947
B 1 19,910 2 28,428 3 24,226
C 1 21,134
D 1 24,149 2 28,601
E 2 16,482 3 23,976
F 2 29,683 3 20,604
ARF051 45530103 Tomato Tying
A 2 1,812 3 3,999
B 2 2,807 3 5,040 4 3,161
C 2 2,349 3 4,425 4 2,292
D 2 3,236 3 6,810 4 4,506
E 2 2,448 3 6,132 4 3,479
F 4 4,431
ARF049 45491902 Squash Harvesting
A 2 1,395 3 4,747 4 3,043
B 2 1,426 3 6,800 4 3,178
C 2 1,121 3 5,130 4 3,195
D 2 1,546 3 5,042 4 3,897
E 2 887 3 3,846 4 2,550
F 2 1,163 3 7,411 4 2,667
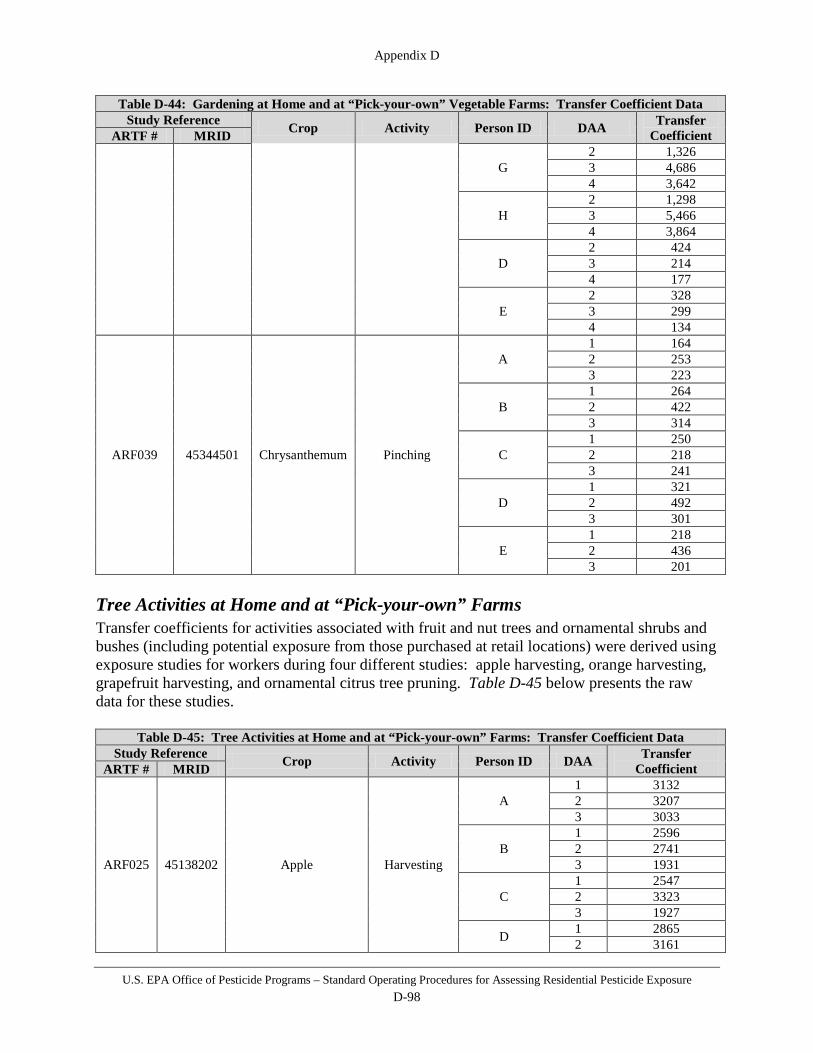
Appendix D
U.S. EPA Office of Pesticide Programs – Standard Operating Procedures for Assessing Residential Pesticide Exposure D-98
Table D-44: Gardening at Home and at “Pick-your-own” Vegetable Farms: Transfer Coefficient Data Study Reference Crop Activity Person ID DAA Transfer
Coefficient ARTF # MRID
G 2 1,326 3 4,686 4 3,642
H 2 1,298 3 5,466 4 3,864
D 2 424 3 214 4 177
E 2 328 3 299 4 134
ARF039 45344501 Chrysanthemum Pinching
A 1 164 2 253 3 223
B 1 264 2 422 3 314
C 1 250 2 218 3 241
D 1 321 2 492 3 301
E 1 218 2 436 3 201
Tree Activities at Home and at “Pick-your-own” Farms Transfer coefficients for activities associated with fruit and nut trees and ornamental shrubs and bushes (including potential exposure from those purchased at retail locations) were derived using exposure studies for workers during four different studies: apple harvesting, orange harvesting, grapefruit harvesting, and ornamental citrus tree pruning. Table D-45 below presents the raw data for these studies.
Table D-45: Tree Activities at Home and at “Pick-your-own” Farms: Transfer Coefficient Data Study Reference Crop Activity Person ID DAA Transfer
Coefficient ARTF # MRID
ARF025 45138202 Apple Harvesting
A 1 3132 2 3207 3 3033
B 1 2596 2 2741 3 1931
C 1 2547 2 3323 3 1927
D 1 2865 2 3161
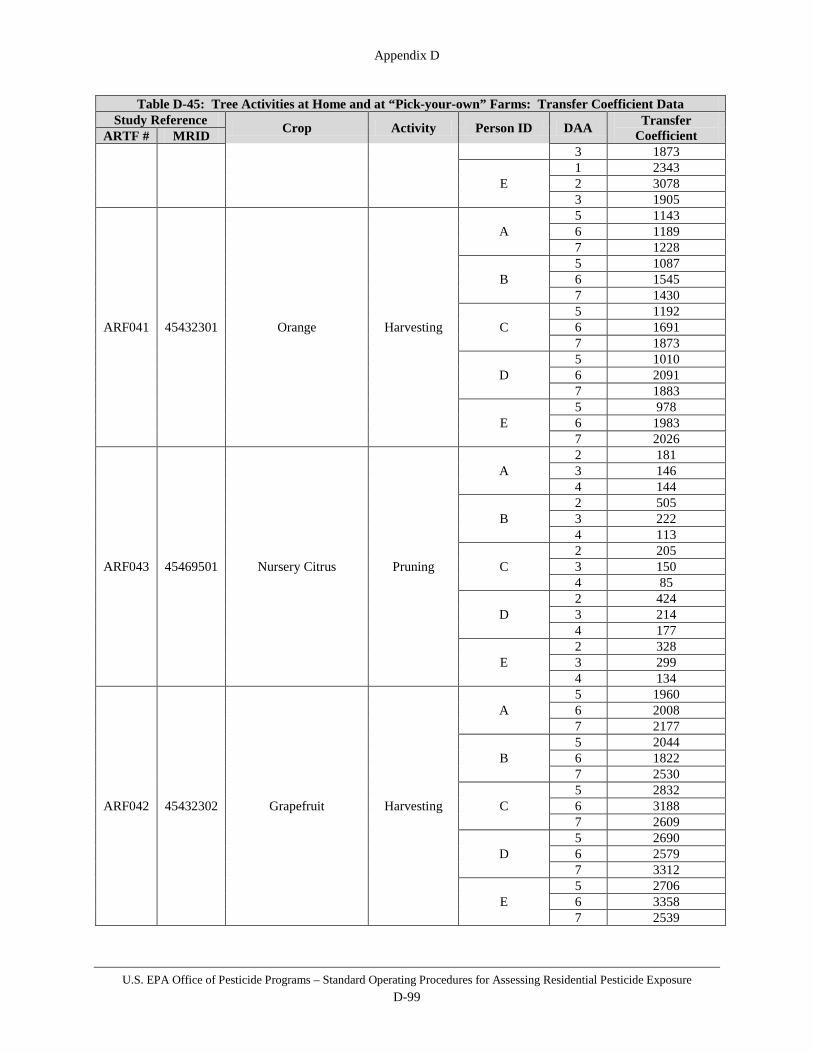
Appendix D
U.S. EPA Office of Pesticide Programs – Standard Operating Procedures for Assessing Residential Pesticide Exposure D-99
Table D-45: Tree Activities at Home and at “Pick-your-own” Farms: Transfer Coefficient Data Study Reference Crop Activity Person ID DAA Transfer
Coefficient ARTF # MRID 3 1873
E 1 2343 2 3078 3 1905
ARF041 45432301 Orange Harvesting
A 5 1143 6 1189 7 1228
B 5 1087 6 1545 7 1430
C 5 1192 6 1691 7 1873
D 5 1010 6 2091 7 1883
E 5 978 6 1983 7 2026
ARF043 45469501 Nursery Citrus Pruning
A 2 181 3 146 4 144
B 2 505 3 222 4 113
C 2 205 3 150 4 85
D 2 424 3 214 4 177
E 2 328 3 299 4 134
ARF042 45432302 Grapefruit Harvesting
A 5 1960 6 2008 7 2177
B 5 2044 6 1822 7 2530
C 5 2832 6 3188 7 2609
D 5 2690 6 2579 7 3312
E 5 2706 6 3358 7 2539

Appendix D
U.S. EPA Office of Pesticide Programs – Standard Operating Procedures for Assessing Residential Pesticide Exposure D-100
Indoor Plant Activities Transfer coefficients from the study measuring exposure while pruning ornamental citrus trees are recommended for use for activities associated with indoor plants. The data for this study is presented above in Table D-45. Transfer Coefficient Data Analysis Each transfer coefficient was log-transformed and plotted to evaluate its fit to a lognormal distribution. Each study appears to reasonably fit a lognormal distribution as shown in the figure below.
Figure D-10: Residential Transfer Coefficients: Lognormal Probability Plot of Individual Studies As previously stated, unlike these occupational studies where workers conducted a single activity for the duration of their workday, homeowners tending to their outdoor gardens and trees and individuals attending “pick-your-own” are likely to conduct various activities. For example, it is likely that individuals would weed both their gardens on the same day or trim their bushes and apple trees on the same day. In fact, it is likely that individuals would conduct some configuration of all outdoor activities on the same day. Note that in the case of indoor plants these activities are reasonably represented by ornamental citrus tree pruning alone. For the purposes of pesticide assessment, however, for which certain chemicals may only be used on gardens and trees composite transfer coefficient distributions have been developed to represent activities in gardens and trees. These were derived by constructing, via a 5000 trial
Residential Transfer Coefficients:Lognormal Probability Plot of Individual Studies
3.00
4.00
5.00
6.00
7.00
8.00
9.00
10.00
11.00
12.00
-3.00 -2.00 -1.00 0.00 1.00 2.00 3.00
Standard Normal Score
ln T
C (c
m2/
hr)
Weed Cabbage Tie Tomato Harvest Squash Harvest Apple Harvest Orange Harvest Grapefruit Pinch OrnMums Prune OrnCitrus

Appendix D
U.S. EPA Office of Pesticide Programs – Standard Operating Procedures for Assessing Residential Pesticide Exposure D-101
Monte Carlo simulation using Crystal Ball 4.0 (Microsoft Excel add-on), custom distributions using the lognormal distributions for each individual activity (See Figure D-10), but assigning equal probabilities of 25% for each activity. Essentially just a weighting mechanism, it assumes, for example that an individual while gardening conducts “cabbage weeding-like,” “squash harvesting-like,” “tomato tying-like,” and “chrysanthemum pinching-like” activities in equal proportions (i.e., 25% of the time spent conducting each). Additional data on specific gardening activities (or an exposure study representing actual homeowner gardening work) could confirm this assumption or inform a more accurate weight to each activity. Thus, absent exposure studies specific for activities in residential settings (e.g., a study in which individuals perform various activities following pesticides applications in various locations on their property), the approach outlined is considered reasonable. Parameters for each lognormal distribution are outlined in Table D-46 below.
Table D-46: Gardens, Trees, and “Pick-your-own” Farms – Transfer Coefficient Studies
Residential Post-application Activity Representative Crop/Activity Combinations
Lognormal TC Distribution Parameters
GM GSD
Gardening (vegetables, fruits, and flowers)
Cabbage weeding 25,463 1.27 Tomato tying 3,547 1.47
Squash harvesting 2,774 1.89 Chrysanthemum pinching 275 1.36
Tree maintenance (fruits, nuts, shrubs, bushes)
Ornamental citrus tree pruning 197 1.63 Apple harvesting 2,591 1.24 Orange harvesting 1,440 1.31
Grapefruit harvesting 2,513 1.21 As previously stated, a composite distribution for activities in gardens and trees was simulated by assigning equal probabilities (i.e., 25% for each representative activity) to each single activity’s distribution. The figures below present probability and cumulative density function for each of the resulting simulated distributions.

Appendix D
U.S. EPA Office of Pesticide Programs – Standard Operating Procedures for Assessing Residential Pesticide Exposure D-102
Figure D-11: Gardening Transfer Coefficient– Composite Probability Density Function Simulation
Figure D-12: Gardening Transfer Coefficient – Composite Cumulative Distribution Function Simulation
Frequency Chart
.000
.056
.112
.168
.224
0
279.7
559.5
839.2
1119
0.00 10,000.00 20,000.00 30,000.00 40,000.00
5,000 Trials 36 Outliers
Forecast: Gardening_Composite
Cumulative Chart
.000
.250
.500
.750
1.000
0
5000
0.00 10,000.00 20,000.00 30,000.00 40,000.00
5,000 Trials 36 Outliers
Forecast: TC Gardening_Composite
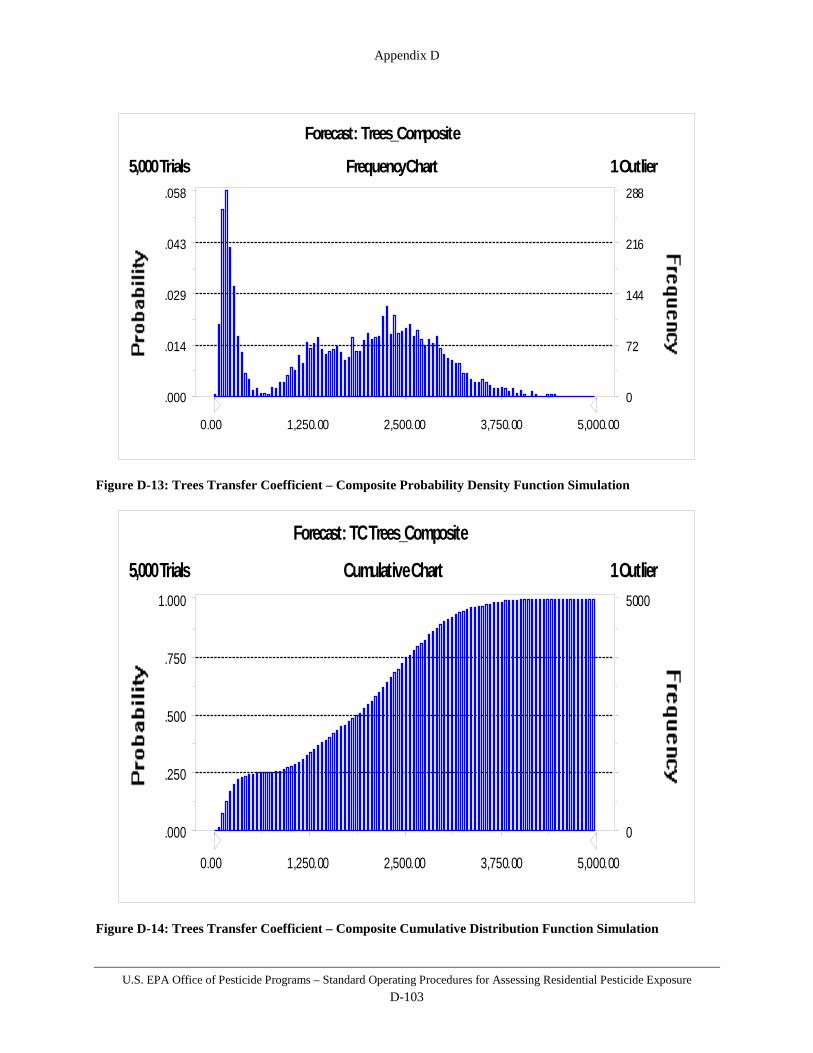
Appendix D
U.S. EPA Office of Pesticide Programs – Standard Operating Procedures for Assessing Residential Pesticide Exposure D-103
Figure D-13: Trees Transfer Coefficient – Composite Probability Density Function Simulation
Figure D-14: Trees Transfer Coefficient – Composite Cumulative Distribution Function Simulation
Frequency Chart
.000
.014
.029
.043
.058
0
72
144
216
288
0.00 1,250.00 2,500.00 3,750.00 5,000.00
5,000 Trials 1 Outlier
Forecast: Trees_Composite
Cumulative Chart
.000
.250
.500
.750
1.000
0
5000
0.00 1,250.00 2,500.00 3,750.00 5,000.00
5,000 Trials 1 Outlier
Forecast: TC Trees_Composite
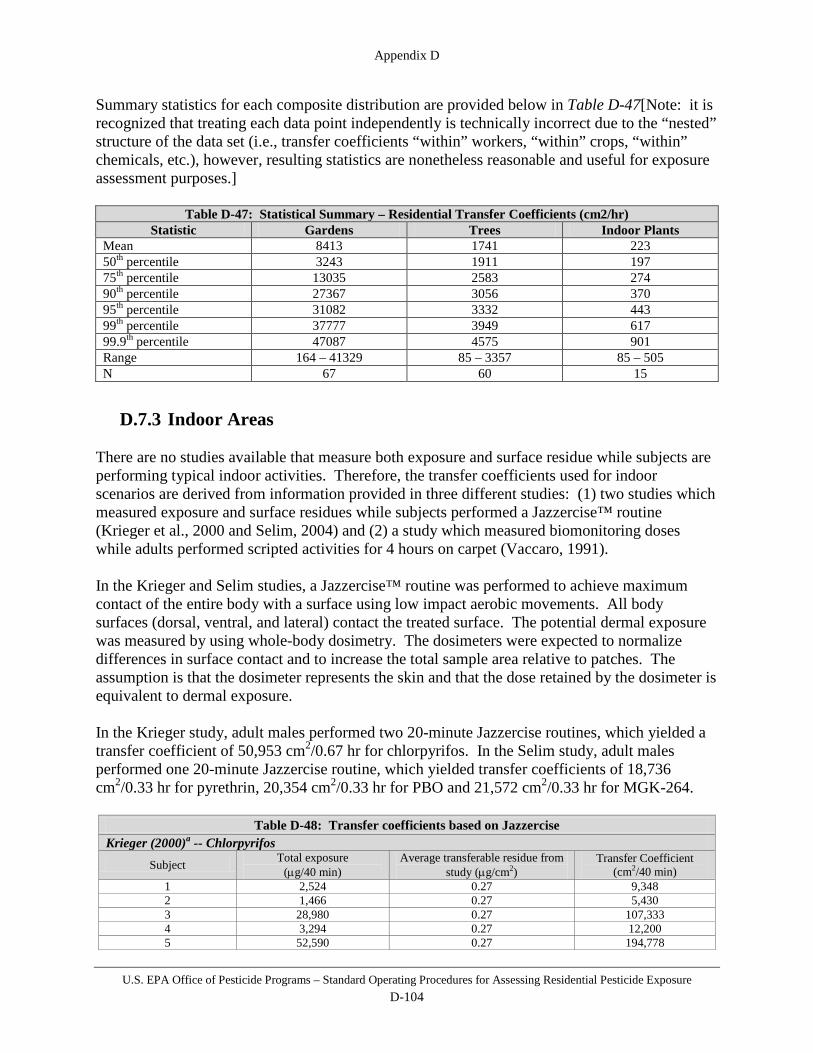
Appendix D
U.S. EPA Office of Pesticide Programs – Standard Operating Procedures for Assessing Residential Pesticide Exposure D-104
Summary statistics for each composite distribution are provided below in Table D-47[Note: it is recognized that treating each data point independently is technically incorrect due to the “nested” structure of the data set (i.e., transfer coefficients “within” workers, “within” crops, “within” chemicals, etc.), however, resulting statistics are nonetheless reasonable and useful for exposure assessment purposes.]
Table D-47: Statistical Summary – Residential Transfer Coefficients (cm2/hr) Statistic Gardens Trees Indoor Plants
Mean 8413 1741 223 50th percentile 3243 1911 197 75th percentile 13035 2583 274 90th percentile 27367 3056 370 95th percentile 31082 3332 443 99th percentile 37777 3949 617 99.9th percentile 47087 4575 901 Range 164 – 41329 85 – 3357 85 – 505 N 67 60 15
D.7.3 Indoor Areas There are no studies available that measure both exposure and surface residue while subjects are performing typical indoor activities. Therefore, the transfer coefficients used for indoor scenarios are derived from information provided in three different studies: (1) two studies which measured exposure and surface residues while subjects performed a Jazzercise™ routine (Krieger et al., 2000 and Selim, 2004) and (2) a study which measured biomonitoring doses while adults performed scripted activities for 4 hours on carpet (Vaccaro, 1991). In the Krieger and Selim studies, a Jazzercise™ routine was performed to achieve maximum contact of the entire body with a surface using low impact aerobic movements. All body surfaces (dorsal, ventral, and lateral) contact the treated surface. The potential dermal exposure was measured by using whole-body dosimetry. The dosimeters were expected to normalize differences in surface contact and to increase the total sample area relative to patches. The assumption is that the dosimeter represents the skin and that the dose retained by the dosimeter is equivalent to dermal exposure. In the Krieger study, adult males performed two 20-minute Jazzercise routines, which yielded a transfer coefficient of 50,953 cm2/0.67 hr for chlorpyrifos. In the Selim study, adult males performed one 20-minute Jazzercise routine, which yielded transfer coefficients of 18,736 cm2/0.33 hr for pyrethrin, 20,354 cm2/0.33 hr for PBO and 21,572 cm2/0.33 hr for MGK-264.
Table D-48: Transfer coefficients based on Jazzercise Krieger (2000)a -- Chlorpyrifos
Subject Total exposure (µg/40 min)
Average transferable residue from study (µg/cm2)
Transfer Coefficient (cm2/40 min)
1 2,524 0.27 9,348 2 1,466 0.27 5,430 3 28,980 0.27 107,333 4 3,294 0.27 12,200 5 52,590 0.27 194,778
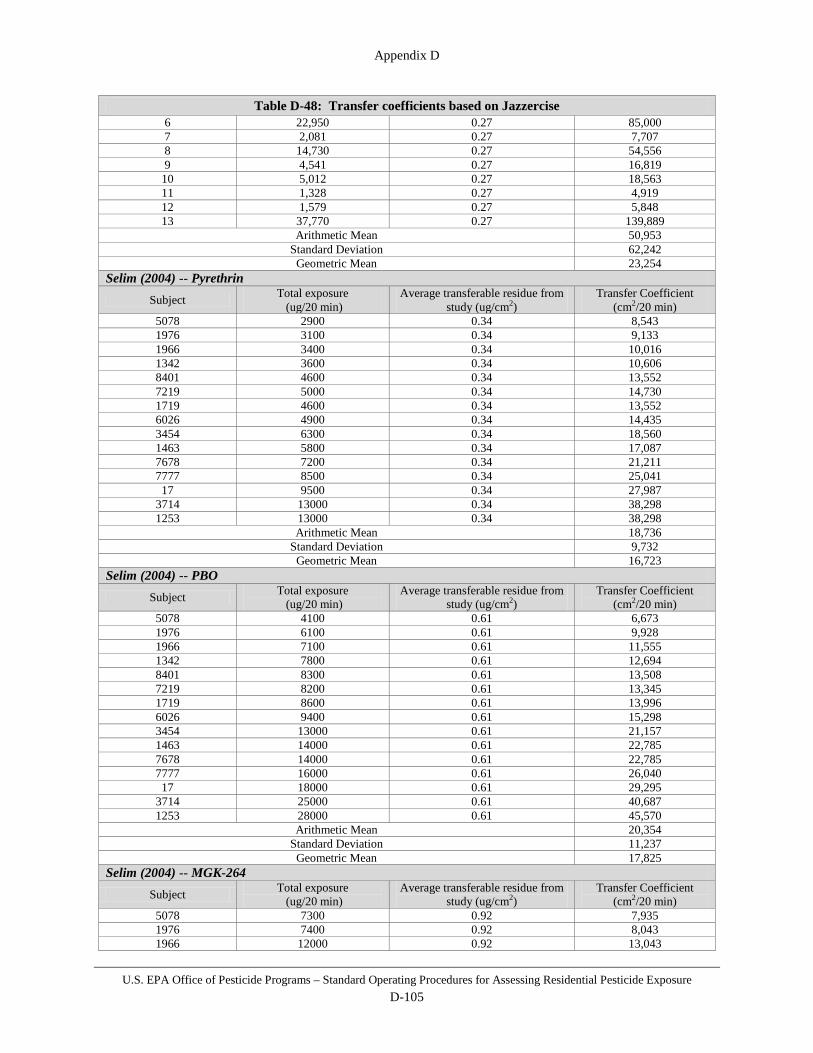
Appendix D
U.S. EPA Office of Pesticide Programs – Standard Operating Procedures for Assessing Residential Pesticide Exposure D-105
Table D-48: Transfer coefficients based on Jazzercise 6 22,950 0.27 85,000 7 2,081 0.27 7,707 8 14,730 0.27 54,556 9 4,541 0.27 16,819
10 5,012 0.27 18,563 11 1,328 0.27 4,919 12 1,579 0.27 5,848 13 37,770 0.27 139,889
Arithmetic Mean 50,953 Standard Deviation 62,242
Geometric Mean 23,254 Selim (2004) -- Pyrethrin
Subject Total exposure (ug/20 min)
Average transferable residue from study (ug/cm2)
Transfer Coefficient (cm2/20 min)
5078 2900 0.34 8,543 1976 3100 0.34 9,133 1966 3400 0.34 10,016 1342 3600 0.34 10,606 8401 4600 0.34 13,552 7219 5000 0.34 14,730 1719 4600 0.34 13,552 6026 4900 0.34 14,435 3454 6300 0.34 18,560 1463 5800 0.34 17,087 7678 7200 0.34 21,211 7777 8500 0.34 25,041 17 9500 0.34 27,987
3714 13000 0.34 38,298 1253 13000 0.34 38,298
Arithmetic Mean 18,736 Standard Deviation 9,732
Geometric Mean 16,723 Selim (2004) -- PBO
Subject Total exposure (ug/20 min)
Average transferable residue from study (ug/cm2)
Transfer Coefficient (cm2/20 min)
5078 4100 0.61 6,673 1976 6100 0.61 9,928 1966 7100 0.61 11,555 1342 7800 0.61 12,694 8401 8300 0.61 13,508 7219 8200 0.61 13,345 1719 8600 0.61 13,996 6026 9400 0.61 15,298 3454 13000 0.61 21,157 1463 14000 0.61 22,785 7678 14000 0.61 22,785 7777 16000 0.61 26,040 17 18000 0.61 29,295
3714 25000 0.61 40,687 1253 28000 0.61 45,570
Arithmetic Mean 20,354 Standard Deviation 11,237
Geometric Mean 17,825 Selim (2004) -- MGK-264
Subject Total exposure (ug/20 min)
Average transferable residue from study (ug/cm2)
Transfer Coefficient (cm2/20 min)
5078 7300 0.92 7,935 1976 7400 0.92 8,043 1966 12000 0.92 13,043
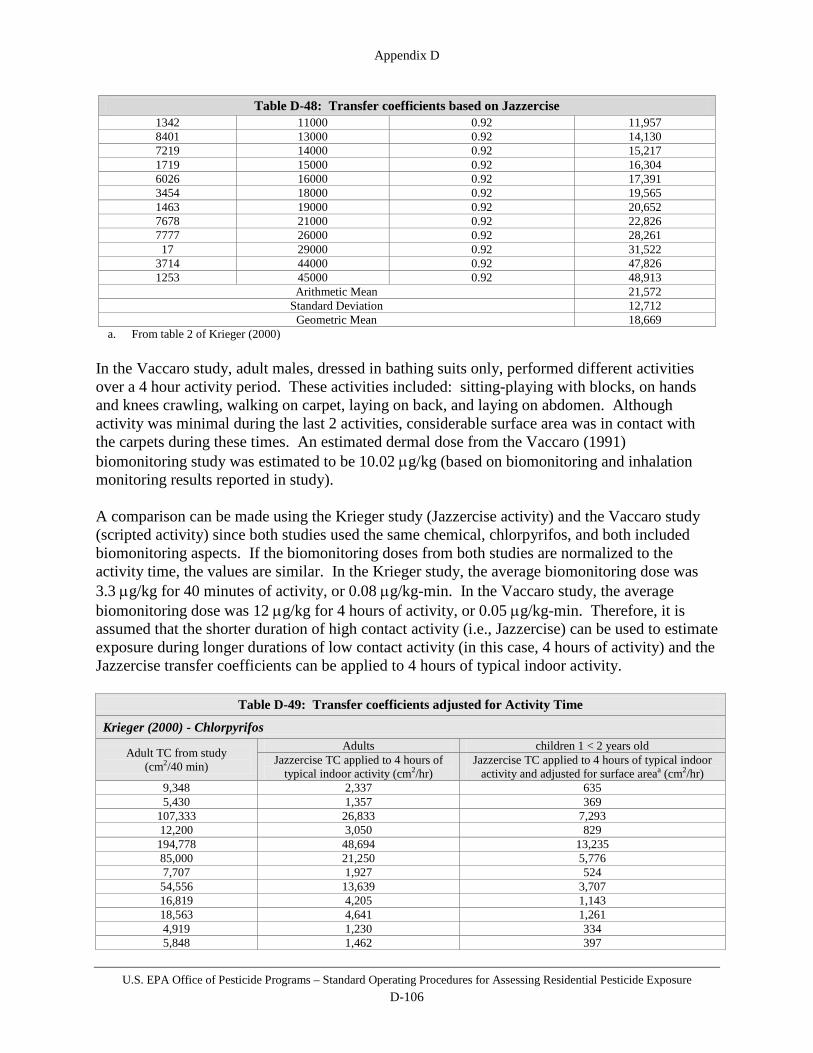
Appendix D
U.S. EPA Office of Pesticide Programs – Standard Operating Procedures for Assessing Residential Pesticide Exposure D-106
Table D-48: Transfer coefficients based on Jazzercise 1342 11000 0.92 11,957 8401 13000 0.92 14,130 7219 14000 0.92 15,217 1719 15000 0.92 16,304 6026 16000 0.92 17,391 3454 18000 0.92 19,565 1463 19000 0.92 20,652 7678 21000 0.92 22,826 7777 26000 0.92 28,261 17 29000 0.92 31,522
3714 44000 0.92 47,826 1253 45000 0.92 48,913
Arithmetic Mean 21,572 Standard Deviation 12,712
Geometric Mean 18,669 a. From table 2 of Krieger (2000)
In the Vaccaro study, adult males, dressed in bathing suits only, performed different activities over a 4 hour activity period. These activities included: sitting-playing with blocks, on hands and knees crawling, walking on carpet, laying on back, and laying on abdomen. Although activity was minimal during the last 2 activities, considerable surface area was in contact with the carpets during these times. An estimated dermal dose from the Vaccaro (1991) biomonitoring study was estimated to be 10.02 µg/kg (based on biomonitoring and inhalation monitoring results reported in study). A comparison can be made using the Krieger study (Jazzercise activity) and the Vaccaro study (scripted activity) since both studies used the same chemical, chlorpyrifos, and both included biomonitoring aspects. If the biomonitoring doses from both studies are normalized to the activity time, the values are similar. In the Krieger study, the average biomonitoring dose was 3.3 µg/kg for 40 minutes of activity, or 0.08 µg/kg-min. In the Vaccaro study, the average biomonitoring dose was 12 µg/kg for 4 hours of activity, or 0.05 µg/kg-min. Therefore, it is assumed that the shorter duration of high contact activity (i.e., Jazzercise) can be used to estimate exposure during longer durations of low contact activity (in this case, 4 hours of activity) and the Jazzercise transfer coefficients can be applied to 4 hours of typical indoor activity.
Table D-49: Transfer coefficients adjusted for Activity Time
Krieger (2000) - Chlorpyrifos
Adult TC from study (cm2/40 min)
Adults children 1 < 2 years old Jazzercise TC applied to 4 hours of
typical indoor activity (cm2/hr) Jazzercise TC applied to 4 hours of typical indoor
activity and adjusted for surface areaa (cm2/hr) 9,348 2,337 635 5,430 1,357 369
107,333 26,833 7,293 12,200 3,050 829
194,778 48,694 13,235 85,000 21,250 5,776 7,707 1,927 524 54,556 13,639 3,707 16,819 4,205 1,143 18,563 4,641 1,261 4,919 1,230 334 5,848 1,462 397
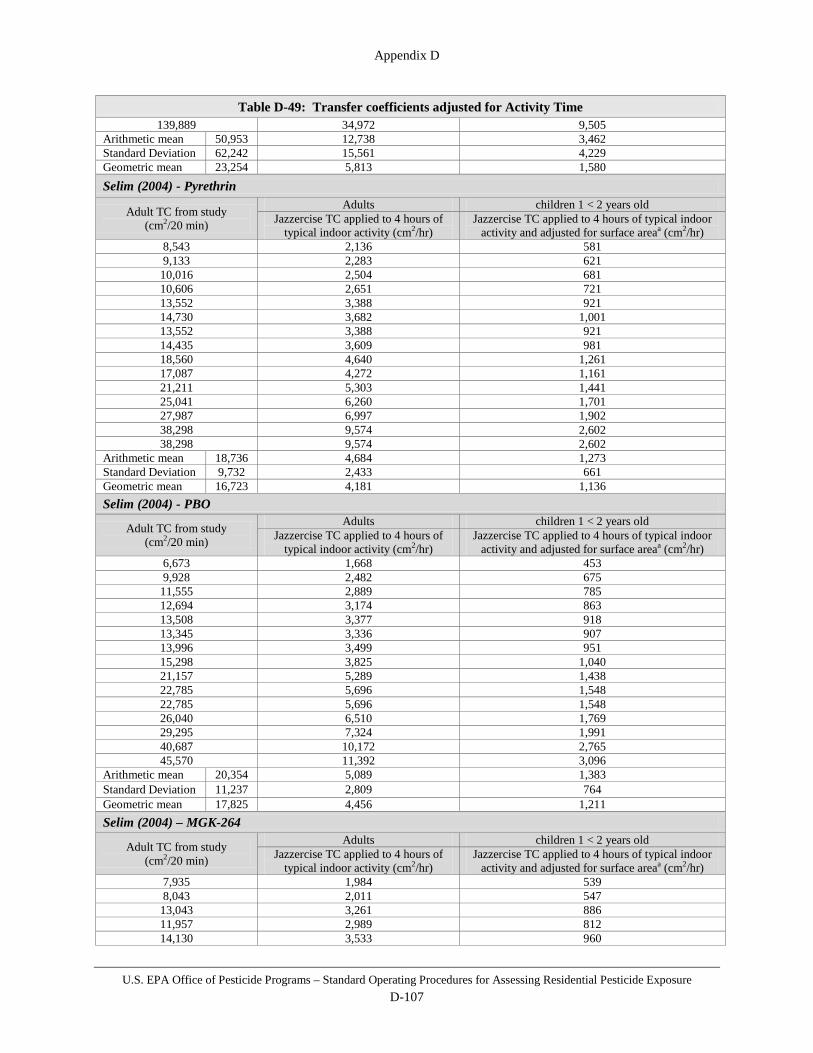
Appendix D
U.S. EPA Office of Pesticide Programs – Standard Operating Procedures for Assessing Residential Pesticide Exposure D-107
Table D-49: Transfer coefficients adjusted for Activity Time 139,889 34,972 9,505
Arithmetic mean 50,953 12,738 3,462 Standard Deviation 62,242 15,561 4,229 Geometric mean 23,254 5,813 1,580 Selim (2004) - Pyrethrin
Adult TC from study (cm2/20 min)
Adults children 1 < 2 years old Jazzercise TC applied to 4 hours of
typical indoor activity (cm2/hr) Jazzercise TC applied to 4 hours of typical indoor
activity and adjusted for surface areaa (cm2/hr) 8,543 2,136 581 9,133 2,283 621 10,016 2,504 681 10,606 2,651 721 13,552 3,388 921 14,730 3,682 1,001 13,552 3,388 921 14,435 3,609 981 18,560 4,640 1,261 17,087 4,272 1,161 21,211 5,303 1,441 25,041 6,260 1,701 27,987 6,997 1,902 38,298 9,574 2,602 38,298 9,574 2,602
Arithmetic mean 18,736 4,684 1,273 Standard Deviation 9,732 2,433 661 Geometric mean 16,723 4,181 1,136 Selim (2004) - PBO
Adult TC from study (cm2/20 min)
Adults children 1 < 2 years old Jazzercise TC applied to 4 hours of
typical indoor activity (cm2/hr) Jazzercise TC applied to 4 hours of typical indoor
activity and adjusted for surface areaa (cm2/hr) 6,673 1,668 453 9,928 2,482 675 11,555 2,889 785 12,694 3,174 863 13,508 3,377 918 13,345 3,336 907 13,996 3,499 951 15,298 3,825 1,040 21,157 5,289 1,438 22,785 5,696 1,548 22,785 5,696 1,548 26,040 6,510 1,769 29,295 7,324 1,991 40,687 10,172 2,765 45,570 11,392 3,096
Arithmetic mean 20,354 5,089 1,383 Standard Deviation 11,237 2,809 764 Geometric mean 17,825 4,456 1,211 Selim (2004) – MGK-264
Adult TC from study (cm2/20 min)
Adults children 1 < 2 years old Jazzercise TC applied to 4 hours of
typical indoor activity (cm2/hr) Jazzercise TC applied to 4 hours of typical indoor
activity and adjusted for surface areaa (cm2/hr) 7,935 1,984 539 8,043 2,011 547 13,043 3,261 886 11,957 2,989 812 14,130 3,533 960

Appendix D
U.S. EPA Office of Pesticide Programs – Standard Operating Procedures for Assessing Residential Pesticide Exposure D-108
Table D-49: Transfer coefficients adjusted for Activity Time 15,217 3,804 1,034 16,304 4,076 1,108 17,391 4,348 1,182 19,565 4,891 1,329 20,652 5,163 1,403 22,826 5,707 1,551 28,261 7,065 1,920 31,522 7,880 2,142 47,826 11,957 3,250 48,913 12,228 3,324
Arithmetic mean 21,572 5,393 1,466 Standard Deviation 12,712 3,178 864 Geometric mean 18,669 4,667 1,269
a. 73% reduction factor (0.53m2 / 1.95 m2).
Figure D-15: Indoor Environments – Adult Transfer Coefficient Lognormal Probability Plot
Table D-50: Indoor Environments Statistical Summary – Transfer Coefficient (cm2/hr) Statistic Adults children 1 < 2 years olda
50th percentile 4,700 1,300 75th percentile 7,800 2,100 95th percentile 17,000 4,600 99th percentile 28,000 7,600
99.9th percentile 50,000 14,000 AM (SD) 6,800 (8,200) 1,800 (2,200)
GM (GSD) 4,700 (2.16) 1,300 (2.16)
Range 1,200 – 49,000 330 – 13,000 a A 73% reduction in the adult transfer coefficient is recommended because of the differences of body surface areas between adults and children (1 < 2 years old). AM (SD) = arithmetic mean (standard deviation) GM (GSD) = geometric mean (geometric standard deviation)
0
2
4
6
8
10
12
-3.00 -2.00 -1.00 0.00 1.00 2.00 3.00
Ln
(Tra
nsfe
r coe
ffic
ient
, cm
2 /hr)
Standard Normal Score
Lognormal Probability Plot Transfer Coefficient for Adults (cm2/hr)

Appendix D
U.S. EPA Office of Pesticide Programs – Standard Operating Procedures for Assessing Residential Pesticide Exposure D-109
D.7.4 Treated Pets Post-application dermal exposure can be predicted using estimates for residue transfer to individuals contacting treated pets during certain activities and exposure durations. Residue transfer from a given formulation and activity is an empirical value, known as the transfer coefficient (TC). Dermal TCs were developed for liquid and solid pet product formulations. The following is a summary of the exposure studies used in the quantification of pet treatment TCs and the corresponding data sets of each exposure study. The Agency did not identify any studies which were conducted to observe homeowner activities with a treated pet. While studies were conducted to determine the fraction of application rate transferred from the treated pet to a human or artificial (mannequin) hand, these data are limited in that the scripted activity patterns employed (i.e., a pre-determined number of wipes to the animal’s coat) and hand only exposure measurements, limit their utility for the estimation of actual activities, contact and resulting exposure to the whole body of exposed individuals. An applicator and groomer study were reviewed and identified as the best measure of exposure that could occur from interactions with treated pets because these studies included the direct measurement of exposures to applicators or pet groomers. Since these individuals directly handled pesticide products and had direct contact with treated pets it is expected that their resulting exposures are a reasonable approximation of upper bound estimates of contact with a treated animal. In the absence of direct exposure data for this scenario (e.g., homeowner activity with a treated pet), the Agency assumes that the application and grooming activities are likely to result in a protective estimate of exposure than just the evaluation of petting, hugging or sleeping with a pet. The TCs used to assess dermal post-application pet exposure were developed from two studies representing application and grooming activities with dogs, one using carbaryl shampoo and the other using carbaryl dust; which represent TCs liquid and solid formulations, respectively. Data were gathered while human volunteers applied pesticide products to various dogs of differing sizes and fur lengths. Volunteers in the carbaryl shampoo study groomed the animals as well as applying the product. Pet exposure TCs can be defined as animal surface area contact per unit time (cm2/hr), or the ratio of exposure rate, measured in mass of chemical per time (e.g., µg/hr), to residue, measured in mass of active ingredient per surface area of the animal (e.g., µg/cm2). The mass of active ingredient per surface area of the animal (µg/cm2) used to determine the TCs were adjusted for the dust and shampoo studies. The applicator/groomer studies were not performed in a manner which measured active ingredient per surface area of the animal. Therefore, the residue available on the animal for transfer was predicted by multiplying an average fraction of application rate (FAR) value (0.0096) by the active ingredient per surface area (µg/cm2) estimated from the studies. This adjustment has the effect of increasing TC estimates, thus resulting in value which is more protective of human health. Furthermore, the selection of the arithmetic mean FAR value, in lieu of recommended screening level FAR value (0.020) further increases TC estimates for the dust and shampoo studies. A full description of the FAR input is detailed in the next section.

Appendix D
U.S. EPA Office of Pesticide Programs – Standard Operating Procedures for Assessing Residential Pesticide Exposure D-110
Since TCs were established from studies using adult volunteers, they have been scaled to adjust for assessment of child exposure. The Agency assumes that the surface area of a child 1 < 2 years old is 73% less than that of an average adult. The adjustment is based upon a ratio of the mean surface area of 1 < 2 year lifestage, 0.53 m2, and the value of the combined average of mean total surface area for males and females, 1.95 m², from the Exposure Factors Handbook 2011 Edition (U.S. EPA, 2011). Formulation: Liquid Application Method: Aerosols, Collars, Dips, Pump Sprays, Shampoos, Sponges and Spot-Ons
Table D-51: Adult and Child Transfer Coefficients for Liquid Formulations
Statistic Transfer Coefficent (cm2/hour)a,b
Adult 1 < 2 years old 50th percentile 3,600 980 75th percentile 6,400 1,700 95th percentile 15,000 3,900 99th percentile 26,000 7,000 99.9th percentile 49,000 13,000 AM (SD) 5,200 (5,300) 1,400 (1,400) GM 3,600 980 GSD 2.33 2.33 Range 522-12,846 NAc N 16 NAc Notes: a. Representative of individuals wearing short-sleeve shirts, shorts, and no chemical-resistant gloves. b. Dermal liquid formulation TC based on a lognormal distribution fit with data from MRID 46658401. c. NA = Not applicable. Child values were derived by scaling adult data.
Each adult transfer coefficient was log-transformed and plotted to evaluate its fit to a lognormal distribution. The data appears to reasonably fit a lognormal distribution as shown in the Figure D-16 below.
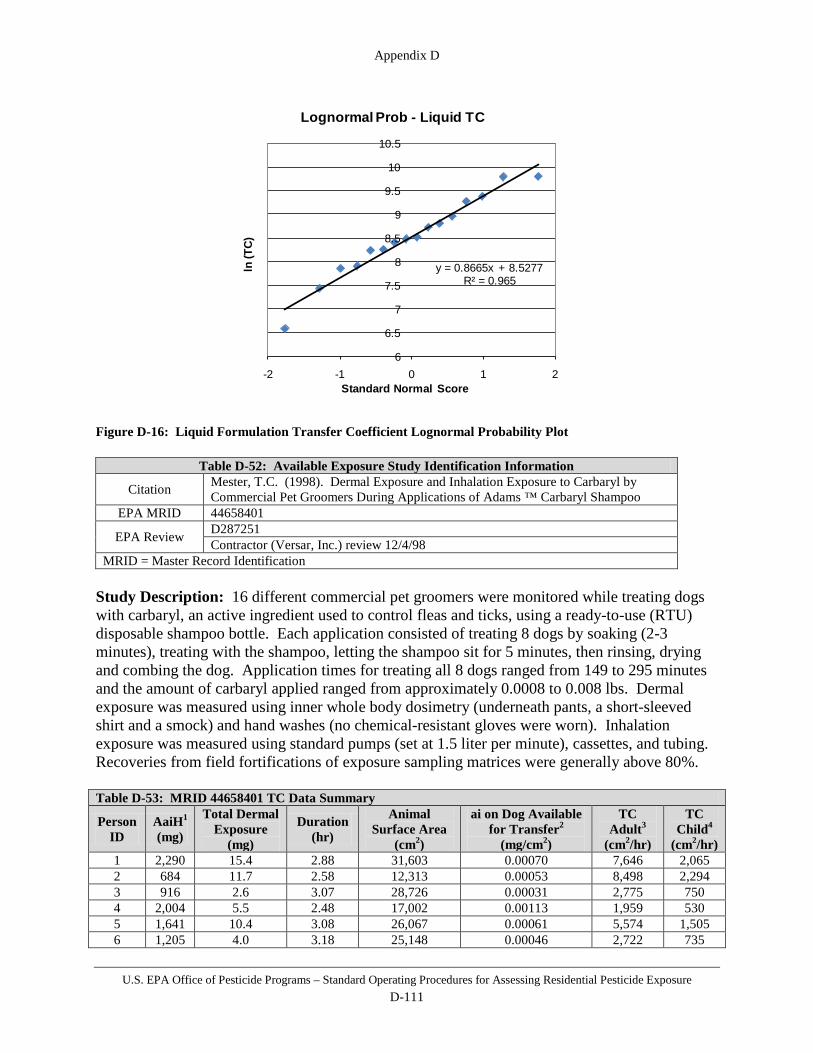
Appendix D
U.S. EPA Office of Pesticide Programs – Standard Operating Procedures for Assessing Residential Pesticide Exposure D-111
Figure D-16: Liquid Formulation Transfer Coefficient Lognormal Probability Plot
Table D-52: Available Exposure Study Identification Information
Citation Mester, T.C. (1998). Dermal Exposure and Inhalation Exposure to Carbaryl by Commercial Pet Groomers During Applications of Adams ™ Carbaryl Shampoo
EPA MRID 44658401
EPA Review D287251 Contractor (Versar, Inc.) review 12/4/98
MRID = Master Record Identification Study Description: 16 different commercial pet groomers were monitored while treating dogs with carbaryl, an active ingredient used to control fleas and ticks, using a ready-to-use (RTU) disposable shampoo bottle. Each application consisted of treating 8 dogs by soaking (2-3 minutes), treating with the shampoo, letting the shampoo sit for 5 minutes, then rinsing, drying and combing the dog. Application times for treating all 8 dogs ranged from 149 to 295 minutes and the amount of carbaryl applied ranged from approximately 0.0008 to 0.008 lbs. Dermal exposure was measured using inner whole body dosimetry (underneath pants, a short-sleeved shirt and a smock) and hand washes (no chemical-resistant gloves were worn). Inhalation exposure was measured using standard pumps (set at 1.5 liter per minute), cassettes, and tubing. Recoveries from field fortifications of exposure sampling matrices were generally above 80%. Table D-53: MRID 44658401 TC Data Summary
Person ID
AaiH1 (mg)
Total Dermal Exposure
(mg)
Duration (hr)
Animal Surface Area
(cm2)
ai on Dog Available for Transfer2
(mg/cm2)
TC Adult3
(cm2/hr)
TC Child4
(cm2/hr) 1 2,290 15.4 2.88 31,603 0.00070 7,646 2,065 2 684 11.7 2.58 12,313 0.00053 8,498 2,294 3 916 2.6 3.07 28,726 0.00031 2,775 750 4 2,004 5.5 2.48 17,002 0.00113 1,959 530 5 1,641 10.4 3.08 26,067 0.00061 5,574 1,505 6 1,205 4.0 3.18 25,148 0.00046 2,722 735
y = 0.8665x + 8.5277R² = 0.965
6
6.5
7
7.5
8
8.5
9
9.5
10
10.5
-2 -1 0 1 2
ln (T
C)
Standard Normal Score
Lognormal Prob - Liquid TC
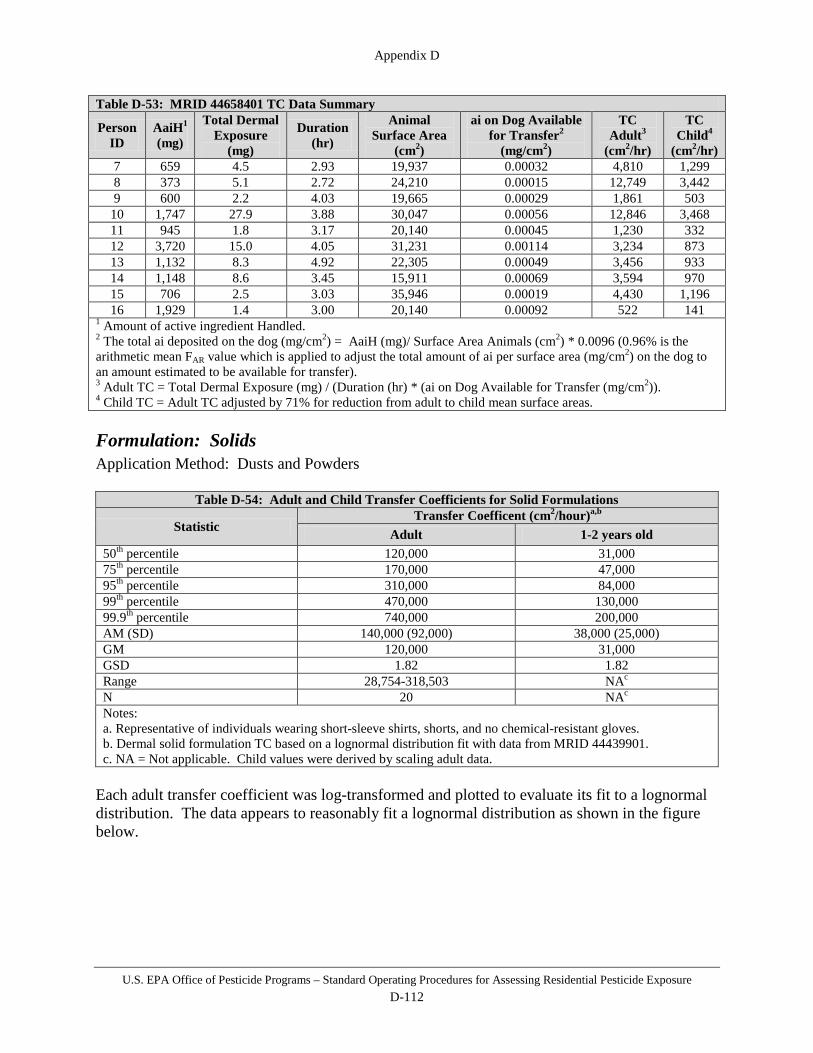
Appendix D
U.S. EPA Office of Pesticide Programs – Standard Operating Procedures for Assessing Residential Pesticide Exposure D-112
Table D-53: MRID 44658401 TC Data Summary
Person ID
AaiH1 (mg)
Total Dermal Exposure
(mg)
Duration (hr)
Animal Surface Area
(cm2)
ai on Dog Available for Transfer2
(mg/cm2)
TC Adult3
(cm2/hr)
TC Child4
(cm2/hr) 7 659 4.5 2.93 19,937 0.00032 4,810 1,299 8 373 5.1 2.72 24,210 0.00015 12,749 3,442 9 600 2.2 4.03 19,665 0.00029 1,861 503
10 1,747 27.9 3.88 30,047 0.00056 12,846 3,468 11 945 1.8 3.17 20,140 0.00045 1,230 332 12 3,720 15.0 4.05 31,231 0.00114 3,234 873 13 1,132 8.3 4.92 22,305 0.00049 3,456 933 14 1,148 8.6 3.45 15,911 0.00069 3,594 970 15 706 2.5 3.03 35,946 0.00019 4,430 1,196 16 1,929 1.4 3.00 20,140 0.00092 522 141
1 Amount of active ingredient Handled. 2 The total ai deposited on the dog (mg/cm2) = AaiH (mg)/ Surface Area Animals (cm2) * 0.0096 (0.96% is the arithmetic mean FAR value which is applied to adjust the total amount of ai per surface area (mg/cm2) on the dog to an amount estimated to be available for transfer). 3 Adult TC = Total Dermal Exposure (mg) / (Duration (hr) * (ai on Dog Available for Transfer (mg/cm2)). 4 Child TC = Adult TC adjusted by 71% for reduction from adult to child mean surface areas. Formulation: Solids Application Method: Dusts and Powders
Table D-54: Adult and Child Transfer Coefficients for Solid Formulations
Statistic Transfer Coefficent (cm2/hour)a,b
Adult 1-2 years old 50th percentile 120,000 31,000 75th percentile 170,000 47,000 95th percentile 310,000 84,000 99th percentile 470,000 130,000 99.9th percentile 740,000 200,000 AM (SD) 140,000 (92,000) 38,000 (25,000) GM 120,000 31,000 GSD 1.82 1.82 Range 28,754-318,503 NAc N 20 NAc Notes: a. Representative of individuals wearing short-sleeve shirts, shorts, and no chemical-resistant gloves. b. Dermal solid formulation TC based on a lognormal distribution fit with data from MRID 44439901. c. NA = Not applicable. Child values were derived by scaling adult data.
Each adult transfer coefficient was log-transformed and plotted to evaluate its fit to a lognormal distribution. The data appears to reasonably fit a lognormal distribution as shown in the figure below.

Appendix D
U.S. EPA Office of Pesticide Programs – Standard Operating Procedures for Assessing Residential Pesticide Exposure D-113
Figure D-17: Solid Formulation Transfer Coefficient Probability Plot
Table D-55: Available Exposure Study Identification Information
Citation Merricks, D. (1997) Carbaryl Applicator Exposure Study During Application of Sevin 5 Dust to Dogs by the Non Professional
EPA MRID 44439901
EPA Review Contractor (Versar, Inc.) review
MRID = Master Record Identification Study Description: A total of 40 individuals – 20 with and 20 without chemical-resistant gloves – were monitored while applying a dust formulation (5% carbaryl) to dogs. Each application, lasting approximately 7 minutes, consisted of an individual using a 1 lb shaker can to apply an average of 0.15 lbs of dust (0.008 lbs carbaryl) to 3 dogs, then rubbing the dust into the dog’s coat. Dermal exposure was measured using inner and outer whole body dosimetry and hand washes. Inhalation exposure was measured using standard pumps (set at 2 liter per minute), cassettes, and tubing. Recoveries from field fortifications of exposure sampling matrices were generally above 90%.
Table D-56: MRID 44439901 TC Data Summary
Person ID
AaiH1 (mg)
Total Dermal Exposure
(mg)
Duration (hr)
Animal Surface
Area (cm2)
ai on Dog Available for
Transfer2 (mg/cm2)
TC Adult3 (cm2/hr)
TC Child4
(cm2/hr)
3 1,361 30.1 0.13 12,921 0.0010 223,241 60,275 4 7,257 82.9 0.12 12,313 0.0057 125,492 33,883 7 3,629 10.9 0.22 19,801 0.0017 28,754 7,764
y = 0.5963x + 11.665R² = 0.917
6
7
8
9
10
11
12
13
14
-3.00 -2.00 -1.00 0.00 1.00 2.00 3.00
ln (T
C)
Standard Normal Score
Lognormal Prob - Solid TC
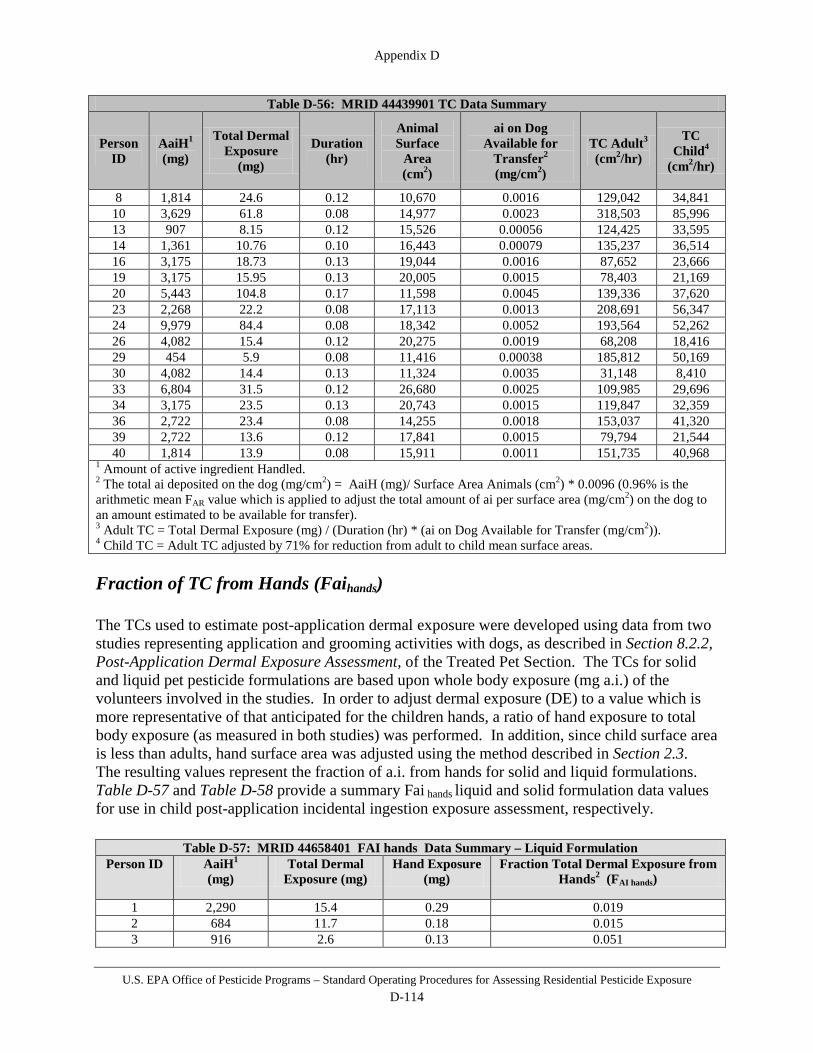
Appendix D
U.S. EPA Office of Pesticide Programs – Standard Operating Procedures for Assessing Residential Pesticide Exposure D-114
Table D-56: MRID 44439901 TC Data Summary
Person ID
AaiH1 (mg)
Total Dermal Exposure
(mg)
Duration (hr)
Animal Surface
Area (cm2)
ai on Dog Available for
Transfer2 (mg/cm2)
TC Adult3 (cm2/hr)
TC Child4
(cm2/hr)
8 1,814 24.6 0.12 10,670 0.0016 129,042 34,841 10 3,629 61.8 0.08 14,977 0.0023 318,503 85,996 13 907 8.15 0.12 15,526 0.00056 124,425 33,595 14 1,361 10.76 0.10 16,443 0.00079 135,237 36,514 16 3,175 18.73 0.13 19,044 0.0016 87,652 23,666 19 3,175 15.95 0.13 20,005 0.0015 78,403 21,169 20 5,443 104.8 0.17 11,598 0.0045 139,336 37,620 23 2,268 22.2 0.08 17,113 0.0013 208,691 56,347 24 9,979 84.4 0.08 18,342 0.0052 193,564 52,262 26 4,082 15.4 0.12 20,275 0.0019 68,208 18,416 29 454 5.9 0.08 11,416 0.00038 185,812 50,169 30 4,082 14.4 0.13 11,324 0.0035 31,148 8,410 33 6,804 31.5 0.12 26,680 0.0025 109,985 29,696 34 3,175 23.5 0.13 20,743 0.0015 119,847 32,359 36 2,722 23.4 0.08 14,255 0.0018 153,037 41,320 39 2,722 13.6 0.12 17,841 0.0015 79,794 21,544 40 1,814 13.9 0.08 15,911 0.0011 151,735 40,968
1 Amount of active ingredient Handled. 2 The total ai deposited on the dog (mg/cm2) = AaiH (mg)/ Surface Area Animals (cm2) * 0.0096 (0.96% is the arithmetic mean FAR value which is applied to adjust the total amount of ai per surface area (mg/cm2) on the dog to an amount estimated to be available for transfer). 3 Adult TC = Total Dermal Exposure (mg) / (Duration (hr) * (ai on Dog Available for Transfer (mg/cm2)). 4 Child TC = Adult TC adjusted by 71% for reduction from adult to child mean surface areas. Fraction of TC from Hands (Faihands) The TCs used to estimate post-application dermal exposure were developed using data from two studies representing application and grooming activities with dogs, as described in Section 8.2.2, Post-Application Dermal Exposure Assessment, of the Treated Pet Section. The TCs for solid and liquid pet pesticide formulations are based upon whole body exposure (mg a.i.) of the volunteers involved in the studies. In order to adjust dermal exposure (DE) to a value which is more representative of that anticipated for the children hands, a ratio of hand exposure to total body exposure (as measured in both studies) was performed. In addition, since child surface area is less than adults, hand surface area was adjusted using the method described in Section 2.3. The resulting values represent the fraction of a.i. from hands for solid and liquid formulations. Table D-57 and Table D-58 provide a summary Fai hands liquid and solid formulation data values for use in child post-application incidental ingestion exposure assessment, respectively.
Table D-57: MRID 44658401 FAI hands Data Summary – Liquid Formulation
Person ID AaiH1 (mg)
Total Dermal Exposure (mg)
Hand Exposure (mg)
Fraction Total Dermal Exposure from Hands2 (FAI hands)
1 2,290 15.4 0.29 0.019 2 684 11.7 0.18 0.015 3 916 2.6 0.13 0.051

Appendix D
U.S. EPA Office of Pesticide Programs – Standard Operating Procedures for Assessing Residential Pesticide Exposure D-115
D.8 Estimates for Residential Activity Duration
D.8.1 Gardens, Trees, and “Pick-your-own” Farms Based on analysis of a residential survey (Johnson, et al., 1999) and the U.S. EPA’s Exposure Factors Handbook 2011 Edition (U.S. EPA, 2011), considered the best available data sources for
4 2,004 5.5 0.25 0.045 5 1,641 10.4 0.12 0.012 6 1,205 4.0 0.16 0.041 7 659 4.5 0.082 0.018 8 373 5.1 0.11 0.020 9 600 2.2 0.062 0.028 10 1,747 27.9 0.47 0.017 11 945 1.8 0.29 0.17 12 3,720 15.0 0.15 0.0097 13 1,132 8.3 0.12 0.014 14 1,148 8.6 0.14 0.016 15 706 2.5 0.24 0.094 16 1,929 1.4 0.11 0.074
Average 0.040 1 Amount of active ingredient Handled 2 Fraction Total Dermal Exposure from Hands (FAI hands) = Hand Exposure/ Total Dermal Exposure
Table D-58: MRID 44439901 Faihands Data Summary – Solid Formulation Person
ID AaiH1 (mg)
Total Dermal Exposure (mg)
Hand Exposure (mg)
Fraction Total Dermal Exposure from Hands2 (Faihands)
3 1361 30.1 5.8 0.19 4 7257 82.9 12.5 0.15 7 3629 10.9 3.9 0.35 8 1814 24.6 5.4 0.22
10 3629 61.8 8.1 0.13 13 907 8.15 4.9 0.61 14 1361 10.76 4.5 0.42 16 3175 18.73 10.5 0.56 19 3175 15.95 11.6 0.73 20 5443 104.8 11.9 0.11 23 2268 22.2 7.3 0.33 24 9979 84.4 24.6 0.29 26 4082 15.4 4.4 0.28 29 454 5.9 3.9 0.65 30 4082 14.4 6.0 0.42 33 6804 31.5 5.1 0.16 34 3175 23.5 4.6 0.19 36 2722 23.4 6.8 0.29 39 2722 13.6 9.1 0.67 40 1814 13.9 7.7 0.55
Average 0.37 1 Amount of active ingredient Handled 2 Fraction Total Dermal Exposure from Hands (Fai hands) = Hand Exposure/ Total Dermal Exposure

Appendix D
U.S. EPA Office of Pesticide Programs – Standard Operating Procedures for Assessing Residential Pesticide Exposure D-116
this information, activity duration is presented below for similar activities conducted at home and at “pick-your-own” farms. Home Activities Activity durations for activities associated with gardens and trees at home were derived from a survey (Johnson, et al., 1999) and Tsang and Klepeis, 1996 (presented in 1997 EPA Exposure Factors Handbook; Vol. III, Table 15-62). While Tsang and Klepeis, 1996 includes information information on “time spent working with soil in a garden or other circumstances working” for all lifestages including youths, the data are presented as hours/month, thus difficult to interpret daily exposure times necessary for exposure assessments of short duration. The survey, on the other hand, asked about specific types of residential landscaping and maintenance activities and the amount of time an individual spends conducting such activities quantified in “hours per week” and “days per week”. However, because this survey only included individuals 18 years or older, Tsang and Klepeis, 1996 was used to adjust these results for those under 18 years. Johnson, et al., 1999 surveyed households regarding types of residential landscaping and maintenance activities and the amount of time an individual spends conducting such activities quantified in “hours per week” and “days per week”. Though the survey did not ask for specific crop/activity durations (i.e., how long do you pick apples per day?) – which could potentially correspond to transfer coefficients from specific reentry exposure studies – the information on general activities can be used in conjunction with the composite transfer coefficients derived to represent broad categories of residential garden and tree activities. Table D-59 and Table D-60 below present a summary of the survey data.
Table D-59: Residential Gardens and Trees – Activity Duration (% response)
Activity N Hours per week < 1 1 2 3 4-5 6-7 8-10 11-15 16-20 > 20 DNK
Vegetable Garden 364 0.1 15.1 13.5 11.9 14.7 8.8 6.7 4.2 2.6 2.1 20.2 Flower Garden 519 0.8 20.9 17.4 8.0 10.9 7.5 4.0 2.1 -- -- 27.9
Roses 252 1.4 34.2 22.8 5.5 9.4 2.6 0.8 0.5 -- -- 21.7 Shrubs/bushes 456 0.8 32.8 14.7 4.3 8.2 1.2 2.5 0.3 -- -- 34.9 Fruit/Nut trees 123 0.8 24.9 6.5 3.8 12.7 3.0 3.4 1.3 -- -- 41.9
Source: National Gardening Association Survey (Johnson, et al., 1999). DNK = did not know
Table D-60: Residential Gardens and Trees – Activity Duration (% response)
Activity N Days per week < 1 1 2 3 4 5 6 7 DNK
Vegetable Garden 364 0.2 17.4 22.2 15.3 7.7 11.3 3.9 10.3 11.9 Flower Garden 519 1.2 26.7 17.1 15.5 5.5 6.9 3.1 8.2 15.5
Roses 252 1.6 28.5 17.5 10.9 2.9 4.4 1.9 10.0 21.0 Shrubs/bushes 456 2.8 35.8 16.8 5.2 0.7 1.1 0.1 3.9 32.2 Fruit/Nut trees 123 2.4 22.8 13.0 5.2 1.0 1.7 2.3 6.7 43.7
Source: National Gardening Association Survey (Johnson, et al., 1999). DNK = did not know
Exposure assessment values for “hours per day” had to be implicitly derived from the survey since responses were given only in “hours per week” and “days per week”. To derive “hours per

Appendix D
U.S. EPA Office of Pesticide Programs – Standard Operating Procedures for Assessing Residential Pesticide Exposure D-117
day”, the “hours per week” values were divided by 2 (i.e., 2 days per week). The survey showed that greater than 60% of respondents for most activities reported 1 – 3 days performing that activity per week. Therefore, normalizing the “hours per week” responses by a factor of 2 is not an unreasonable assumption to derive daily exposure times for the purposes of exposure assessment. Additionally, the responses were adjusted proportionally to the fraction who responded “did not know” (i.e., 21% of “did not know” responses were distributed equally amongst the other responses). The results for “hours per day” are shown in Table D-61 below:
Table D-61: Residential Gardens and Trees – Activity Duration (% response)1
Activity Hours per day2 < 0.5 0.5 1 1.5 2-2.5 3-3.5 4-5 5.5-7.5 8-10 > 10
Vegetable Garden 0.13 18.9 16.9 14.9 18.4 11.0 8.4 5.3 3.3 2.6 Flower Garden 1.1 29.2 24.3 11.2 15.2 10.5 5.6 2.9 -- --
Roses 1.8 44.3 29.5 7.1 12.2 3.4 1.0 0.65 -- -- Shrubs/bushes 1.2 50.6 22.7 6.6 12.7 1.9 3.9 0.46 -- -- Fruit/Nut trees 1.4 44.1 11.5 6.7 22.5 5.3 6.0 2.3 -- --
1 Percent responses adjusted proportionally per activity’s “did not know”. 2 Hours per day derived by dividing “hours per week” values by 2. Source: National Gardening Association Survey (Johnson, et al., 1999). DNK = did not know
After calculating “hours per day”, the responses, given as percentages, were used in conjunction with the upper bound of each range to derive cumulative percentile distributions. The distributions were truncated at 16 hours per day to subtract for 8 hours of sleep. Also, note that vegetable gardening was the only activity with results reported for “8-10” and “> 10” hours per week (derived from 16-20 and > 20 hours per week). Table D-62 below presents the cumulative percentiles for each activity.
Table D-62: Cumulative Percentile Distributions for Activity Durations for Gardens and Trees Activity
Duration (hrs/day)
Cumulative %tiles
Vegetable Gardening Flower Gardening Roses Shrubs/Bushes Fruit/Nut Trees
0 0 0 0 0 0 0.5 19 30 46 52 46 1 36 55 76 75 57
1.5 51 66 83 81 64 2.5 69 81 95 94 86 3.5 80 91 98 96 92 5 89 97 99 99.5 97
7.5 94 99 99.5 99.9 99 10 97 -- -- -- -- 16 100 100 100 100 100
Note: Vegetable gardening was the only activity with results reported for “8-10” and “> 10” hours per week (derived from 16-20 and > 20 hours per week), thus the upper bound reported value for all activities except for vegetable gardening is 7.5 hours per day.
Next, custom cumulative distributions were constructed for gardens and trees, respectively. The distribution for activities in gardens was constructed by combining, via a 5000 trial Monte Carlo simulation, the cumulative distributions for each vegetable gardening and flower gardening in equal proportion (i.e., 50% each). The distribution for activities in trees was derived similarly

Appendix D
U.S. EPA Office of Pesticide Programs – Standard Operating Procedures for Assessing Residential Pesticide Exposure D-118
with the cumulative distributions for each roses, shrubs/bushes, and fruit/nut trees used in equal 33% proportions. Probability and cumulative density functions are provided in the figures below. A statistical summary follows in Table D-63.
Figure D-16: Gardening Exposure Duration – Composite Probability Density Function Simulation
Frequency Chart
.000
.013
.027
.040
.053
0
66.5
133
199.5
266
0.00 2.25 4.50 6.75 9.00
5,000 Trials 153 Outliers
Forecast: Hrs/day_Gardening_Composite

Appendix D
U.S. EPA Office of Pesticide Programs – Standard Operating Procedures for Assessing Residential Pesticide Exposure D-119
Figure D-17: Gardening Exposure Duration – Composite Cumulative Density Function Simulation
Figure D-20: Trees Exposure Duration – Composite Probability Density Function Simulation
Cumulative Chart
.000
.250
.500
.750
1.000
0
5000
0.00 2.25 4.50 6.75 9.00
5,000 Trials 153 Outliers
Forecast: Hrs/day_Gardening_Composite
Frequency Chart
.000
.013
.027
.040
.053
0
66.5
133
199.5
266
0.00 1.25 2.50 3.75 5.00
5,000 Trials 77 Outliers
Forecast: Hrs/day_Trees_Composite

Appendix D
U.S. EPA Office of Pesticide Programs – Standard Operating Procedures for Assessing Residential Pesticide Exposure D-120
Figure D-21: Trees Exposure Duration – Composite Cumulative Density Function Simulation Next, because the survey included only those older than 18, Tsang and Klepeis, 1996 (presented in 1997 EPA Exposure Factors Handbook; Vol. III, Table 15-62) was used to adjust this data for youths conducting similar activities. Tsang and Klepeis, 1996 (presented in 1997 EPA Exposure Factors Handbook; Vol. III, Table 15-62) provides distributions for “time spent working with soil in a garden or other circumstances” in hours per month. Comparing the distributions, it is apparent that adults spend approximately twice the amount of time as youths for this scenario. Table D-63 below presents these datasets. Table D-63: Adult to Youth Activity Duration Ratios from Tsang and Klepeis, 1996 (presented in 1997 EPA
Exposure Factors Handbook; Vol. III, Table 15-62) Percentile 5 10 25 50 75 90 95 98 99
Adults (18-64 yrs.) 0 0 0 0 3 16 40 90 200
Youths (5-11 yrs.) 0 0 0 0 2 10 20 50 60
Adult:Youth Ratio NA NA NA NA 1.5 1.6 2 1.8 3.3
Using the survey information from Johnson, et al., 1999 and Tsang and Klepeis, 1996, a statistical summary of activity durations associated with gardens and trees at home are presented below.
Table D-64: Home Gardens and Trees – Activity Duration (hrs/day) Statistical Summary Statistic Vegetable and Flower Gardens Fruit, Nut, and Ornamental
Trees/Bushes/Shrubs and Indoor Plants Adults Youths Adults Youths
Mean 2.2 1.1 1.0 0.5
Cumulative Chart
.000
.250
.500
.750
1.000
0
5000
0.00 1.25 2.50 3.75 5.00
5,000 Trials 77 Outliers
Forecast: Hrs/day_Trees_Composite

Appendix D
U.S. EPA Office of Pesticide Programs – Standard Operating Procedures for Assessing Residential Pesticide Exposure D-121
Table D-64: Home Gardens and Trees – Activity Duration (hrs/day) Statistical Summary Statistic Vegetable and Flower Gardens Fruit, Nut, and Ornamental
Trees/Bushes/Shrubs and Indoor Plants Adults Youths Adults Youths
50th percentile 1.4 0.7 0.5 0.25 75th percentile 2.9 1.5 1.4 0.7 90th percentile 4.5 2.3 2.4 1.2 95th percentile 6.9 3.5 3.4 1.7 99th percentile 13 6.5 6.3 3.2
99.9th percentile 16 8 15 7.5 Notes: - Distributions are truncated at 16 hours per day. - Durations for youths derived as ½ that of adult activity durations. “Pick-your-own” Farms Activities at “pick-your-own” farms are likely to be similar to those conducted at home (e.g., picking fruits), however the duration of the activities are likely to be different since people and families are away from their home and likely at the farm for recreation. Tsang and Klepeis, 1996 (presented in the 1997 EPA Exposure Factors Handbook; Vol. III Table 15-112) includes data for the amount of time “spent outdoors at a farm” and is considered a reasonable surrogate for time spent at a “pick-your-own” farm. The data indicates that adults ages 18-64 ranged from 5 minutes to 16 hours per day while youths aged 5-11 ranged from 25 minutes to 4.4 hours per day. Unlike the survey for home activities, it is possible to differentiate between adults and youths. The summary statistics are provided below in Table D-65.
Table D-65: Time Spent at “Pick-your-own” Farms (hrs/day) Statistical Summary Lifestage Age
(years) Statistics
N Mean Summary Percentiles 5 25 50 75 90 95 98 99
Adults 18-64 91 5.0 0.3 1.3 3.8 8.3 10.6 13.0 15.6 15.9 Youths 5-11 7 1.9 0.4 0.8 1.7 2.2 4.4 4.4 4.4 4.4
Source: Tsang and Klepeis, 1996 (presented in the 1997 EPA Exposure Factors Handbook; Vol. III Table 15-112)
D.8.2 Treated Pets Exposure Time (ET) The exposure time (ET) for adults and children were derived from Tsang and Klepeis, 1996 (as presented in 1997 Exposure Factors Handbook Table 15-77) and summarized in Tables D-67 and D-68 below. Animal care is defined in the 1997 Exposure Factors Handbook as “care of household pets including activities with pets, playing with the dog, walking the dog and caring for pets of relatives, and friends.” The data identified the time spent with an animal while performing household activities as recorded in 24 hour diaries by study volunteers. The defined activities may not necessarily represent the time volunteers were actively engaged in constant contact with the animal. However, HED conservatively assumes that the exposure times recorded represent continual contact. This assumption is implicit in the formulas used to assess
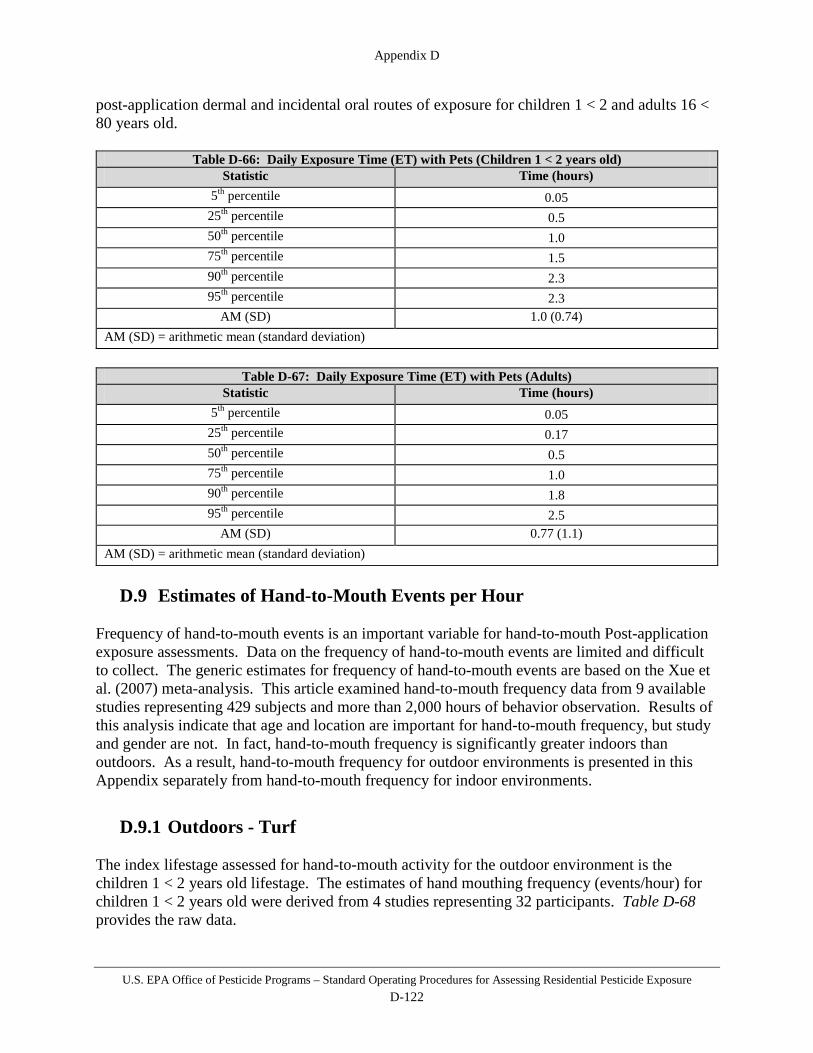
Appendix D
U.S. EPA Office of Pesticide Programs – Standard Operating Procedures for Assessing Residential Pesticide Exposure D-122
post-application dermal and incidental oral routes of exposure for children 1 < 2 and adults 16 < 80 years old.
Table D-66: Daily Exposure Time (ET) with Pets (Children 1 < 2 years old) Statistic Time (hours)
5th percentile 0.05 25th percentile 0.5 50th percentile 1.0 75th percentile 1.5 90th percentile 2.3 95th percentile 2.3
AM (SD) 1.0 (0.74) AM (SD) = arithmetic mean (standard deviation)
Table D-67: Daily Exposure Time (ET) with Pets (Adults)
Statistic Time (hours) 5th percentile 0.05
25th percentile 0.17 50th percentile 0.5 75th percentile 1.0 90th percentile 1.8 95th percentile 2.5
AM (SD) 0.77 (1.1) AM (SD) = arithmetic mean (standard deviation)
D.9 Estimates of Hand-to-Mouth Events per Hour
Frequency of hand-to-mouth events is an important variable for hand-to-mouth Post-application exposure assessments. Data on the frequency of hand-to-mouth events are limited and difficult to collect. The generic estimates for frequency of hand-to-mouth events are based on the Xue et al. (2007) meta-analysis. This article examined hand-to-mouth frequency data from 9 available studies representing 429 subjects and more than 2,000 hours of behavior observation. Results of this analysis indicate that age and location are important for hand-to-mouth frequency, but study and gender are not. In fact, hand-to-mouth frequency is significantly greater indoors than outdoors. As a result, hand-to-mouth frequency for outdoor environments is presented in this Appendix separately from hand-to-mouth frequency for indoor environments.
D.9.1 Outdoors - Turf The index lifestage assessed for hand-to-mouth activity for the outdoor environment is the children 1 < 2 years old lifestage. The estimates of hand mouthing frequency (events/hour) for children 1 < 2 years old were derived from 4 studies representing 32 participants. Table D-68 provides the raw data.

Appendix D
U.S. EPA Office of Pesticide Programs – Standard Operating Procedures for Assessing Residential Pesticide Exposure D-123
Table D-68: Outdoor-Turf Hand-to-Mouth Frequency Data
ID Study Age (years) Hand-to-Mouth Frequency (events/hr)
315M12
Beamer et al., 20081
1 1 081F13 1.13 18 764M20 1.666667 22 328F22 1.833333 2 768M23 1.916667 7 681M23 1.916667 26 453F01
Leckie, 20022
1 2 550M01 1 2 248M01 1 23 958F01 1 57 id104
Tulve et al., 20023
1.166667 0 id104 1.166667 6 id104 1.166667 12 id194 1.25 8 id120 1.75 17 id190 1.75 20 id190 1.75 35 id764 1.833333 8 id150 1.833333 10 id764 1.833333 17 id012
Black et al., 20054
1 3 id014 1 7 id015 1 42 id020 1.166667 5 id019 1.166667 7 id023 1.333333 1 id024 1.416667 39 id025 1.5 4 id026 1.583333 15 id027 1.666667 8 id029 1.75 5 id030 1.833333 16
1 Beamer, P., Key, M.E., Ferguson, A.C., Canales, R.A., Auyeung, W., Leckie, J.O. (2008). Time Activity Assessment of Young Farmworker Children in California. In revision, Journal of Environmental Research. 2 Greene, M.A. (2002). Mouthing times among young children from observational data. U.S. Consumer Product Safety Commission, Bethesda, MD. 3 Tulve, N., Suggs, J., McCurdy, T., Cohen Hubal, E., & Moya, J. (2002). Frequency of mouthing behavior in young children. Journal of Exposure Analysis and Environmental Epidemiology, 12(4), 259–264. 4 Black, K., Shalat, S. L., Freeman, N. C. G., Jimenez, M., Donnelly, K. C., & Calvin, J. A. (2005). Children’s mouthing and food handling behavior in an agricultural community on the U.S./Mexico border. Journal of Exposure Analysis and EnvironmentalEpidemiology, 15, 244–251.

Appendix D
U.S. EPA Office of Pesticide Programs – Standard Operating Procedures for Assessing Residential Pesticide Exposure D-124
D.9.2 Indoor The index lifestage assessed for hand-to-mouth activity for the indoor environment is the children 1 < 2 years old lifestage. The estimates of hand mouthing frequency (events/hour) for children 1 < 2 years old were derived from 5 studies representing 243 participants. Table D-69 provides the raw data.
Table D-69: Indoor Hand-to-Mouth Frequency Data
ID Study Age (years) Hand-to-Mouth Frequency (events/hr)
Children 1 < 2 years old 315M12
Beamer et. al, in prep1
1 15 081F13 1 48 764M20 2 63 674F22 2 14 328F22 2 35 768M23 2 29 681M23 2 30
00201136
Greene, 20022
1 50 00201136 1 82 00206446 1 13 00206446 1 20
TXK16769 1 20 TXK16769 1 31 00206443 1 4
TXK31661 1 15 00206443 1 17
TXK31661 1 31 ILK34447 1 24 ILK34447 1 24 ILK67031 1 5 ILK67031 1 13 ILK66422 1 36 ILK66422 1 63 TXK24860 1 7 TXK24860 1 22 ILK37758 1 10 ILK37758 1 40 ILK51607 1 5 ILK51607 1 13 ILK92729 1 22 ILK92729 1 68 TXK37439 1 4 TXK37439 1 11 00204534 1 7 00204534 1 10 ILK98213 1 32 ILK98213 1 43

Appendix D
U.S. EPA Office of Pesticide Programs – Standard Operating Procedures for Assessing Residential Pesticide Exposure D-125
Table D-69: Indoor Hand-to-Mouth Frequency Data
ID Study Age (years) Hand-to-Mouth Frequency (events/hr)
ILK83625 1 7 ILK83625 1 11 ILK93446 1 14 ILK93446 1 23 ILK44904 1 9 ILK44904 1 32 TXK12275 1 24 TXK12275 1 63 00203429 1 0 00203429 1 2 ILK63757 1 4 ILK63757 1 15 TXK10932 1 4 TXK10932 1 24 ILK92658 1 3 ILK92658 1 15 ILK64770 1 0 ILK64770 1 25 IL106650 1 3 IL106650 1 5
TXK47553 1 21 TXK47553 1 35 TXK15447 1 16 TXK15447 1 22 TXK57344 1 12 TXK57344 1 47 TXK39510 1 34 TXK39510 1 53 TXK03500 1 22 TXK03500 1 27 TXK15315 1 7 TXK15315 1 23 TXK34418 1 7 TXK34418 1 21 TXK14690 1 6 TXK14690 1 27 ILK39523 1 5 ILK39523 1 10 ILK88461 1 4 ILK88461 1 5 ILK43787 1 12 ILK43787 1 28 ILK91233 1 0 ILK91233 1 0 TXK02791 1 12 TXK02791 1 43
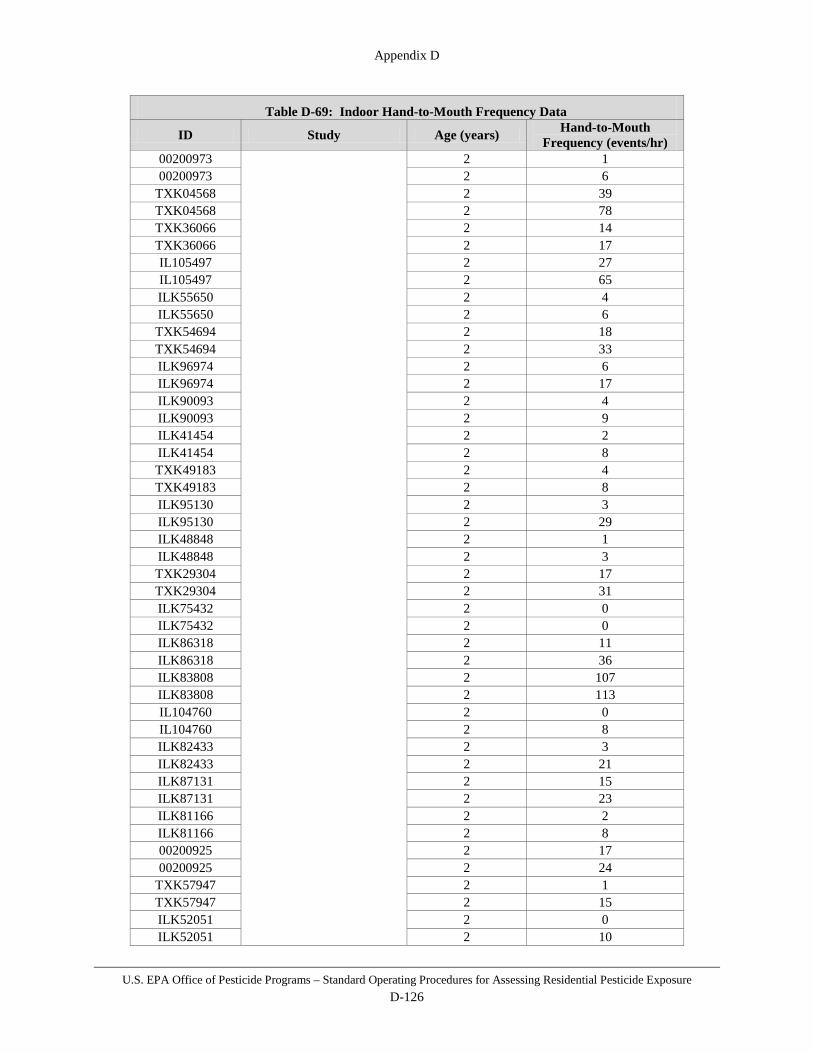
Appendix D
U.S. EPA Office of Pesticide Programs – Standard Operating Procedures for Assessing Residential Pesticide Exposure D-126
Table D-69: Indoor Hand-to-Mouth Frequency Data
ID Study Age (years) Hand-to-Mouth Frequency (events/hr)
00200973 2 1 00200973 2 6
TXK04568 2 39 TXK04568 2 78 TXK36066 2 14 TXK36066 2 17 IL105497 2 27 IL105497 2 65 ILK55650 2 4 ILK55650 2 6 TXK54694 2 18 TXK54694 2 33 ILK96974 2 6 ILK96974 2 17 ILK90093 2 4 ILK90093 2 9 ILK41454 2 2 ILK41454 2 8 TXK49183 2 4 TXK49183 2 8 ILK95130 2 3 ILK95130 2 29 ILK48848 2 1 ILK48848 2 3 TXK29304 2 17 TXK29304 2 31 ILK75432 2 0 ILK75432 2 0 ILK86318 2 11 ILK86318 2 36 ILK83808 2 107 ILK83808 2 113 IL104760 2 0 IL104760 2 8 ILK82433 2 3 ILK82433 2 21 ILK87131 2 15 ILK87131 2 23 ILK81166 2 2 ILK81166 2 8 00200925 2 17 00200925 2 24
TXK57947 2 1 TXK57947 2 15 ILK52051 2 0 ILK52051 2 10

Appendix D
U.S. EPA Office of Pesticide Programs – Standard Operating Procedures for Assessing Residential Pesticide Exposure D-127
Table D-69: Indoor Hand-to-Mouth Frequency Data
ID Study Age (years) Hand-to-Mouth Frequency (events/hr)
ILK49347 2 7 ILK49347 2 21 TXK36720 2 11 TXK36720 2 24 TXK28972 2 11 TXK28972 2 37 ILK52599 2 56 ILK52599 2 80
id890
Tulve et al., 20023
1 0 id876 1 2 id876 1 3 id876 1 4 id932 1 5 id932 1 8 id187 1 9 id932 1 10 id975 1 10 id876 1 15 id890 1 18 id890 1 24 id932 1 24 id975 1 30 id975 1 30 id187 1 38 id975 1 41 id187 1 87 id126 1 5 id126 1 14 id126 1 19 id126 1 23 id167 1 0 id711 1 5 id104 1 7 id711 1 10 id711 1 18 id167 1 19 id711 1 20 id167 1 32 id167 1 32 id705 1 10 id162 1 12 id705 1 14 id705 1 18 id705 1 20 id162 1 24
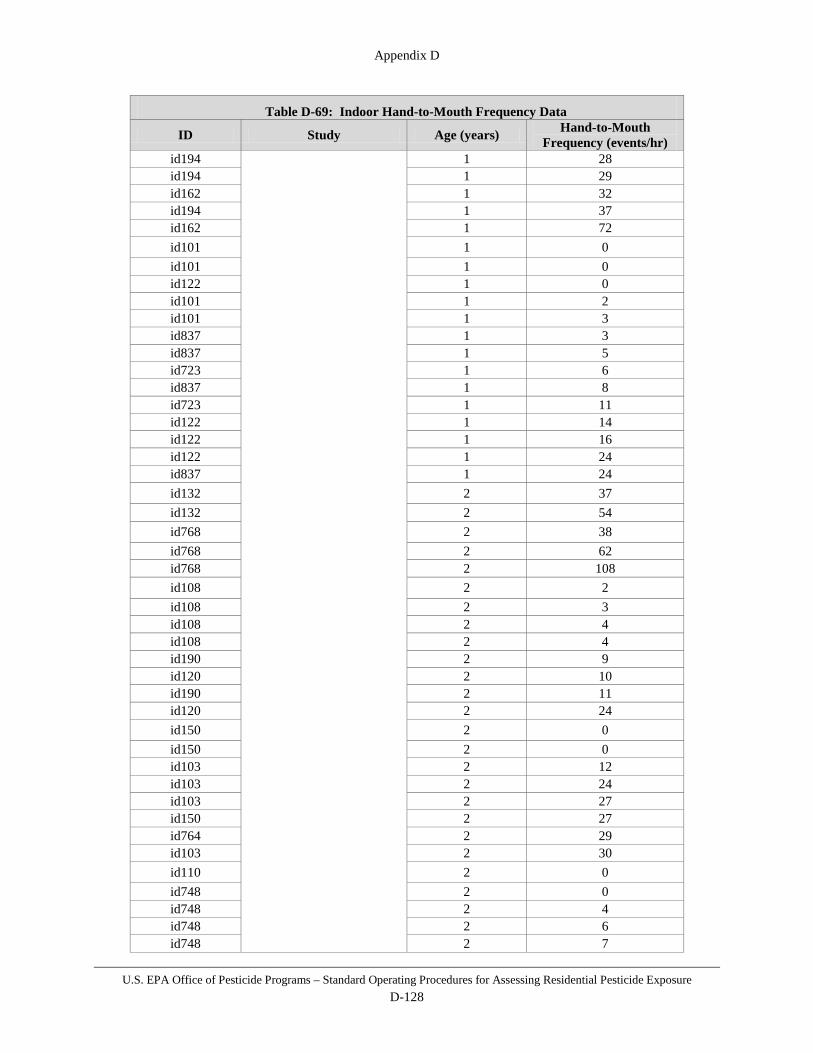
Appendix D
U.S. EPA Office of Pesticide Programs – Standard Operating Procedures for Assessing Residential Pesticide Exposure D-128
Table D-69: Indoor Hand-to-Mouth Frequency Data
ID Study Age (years) Hand-to-Mouth Frequency (events/hr)
id194 1 28 id194 1 29 id162 1 32 id194 1 37 id162 1 72 id101 1 0 id101 1 0 id122 1 0 id101 1 2 id101 1 3 id837 1 3 id837 1 5 id723 1 6 id837 1 8 id723 1 11 id122 1 14 id122 1 16 id122 1 24 id837 1 24 id132 2 37 id132 2 54 id768 2 38 id768 2 62 id768 2 108 id108 2 2 id108 2 3 id108 2 4 id108 2 4 id190 2 9 id120 2 10 id190 2 11 id120 2 24 id150 2 0 id150 2 0 id103 2 12 id103 2 24 id103 2 27 id150 2 27 id764 2 29 id103 2 30 id110 2 0 id748 2 0 id748 2 4 id748 2 6 id748 2 7

Appendix D
U.S. EPA Office of Pesticide Programs – Standard Operating Procedures for Assessing Residential Pesticide Exposure D-129
Table D-69: Indoor Hand-to-Mouth Frequency Data
ID Study Age (years) Hand-to-Mouth Frequency (events/hr)
id110 2 16 id110 2 32 id012
Black et al., 20054
1 5 id015 1 11 id013 1 21 id014 1 35 id018 1 4 id017 1 16 id016 1 29 id019 1 23 id020 1 26 id022 1 9 id021 1 13 id023 1 7 id024 1 21 id025 2 36 id026 2 14 id027 2 12 id028 2 8 id029 2 18 id030 2 24 id031 2 10 r208 Reed et al., 19995 2 11 r201 2 0
1 Beamer, P., Key, M. E., Ferguson, A. C., Canales, R. A., Auyeung, W., & Leckie, J. O. (in preparation). Time activity assessment of young farmworker children in California. 2 Greene, M.A. (2002). Mouthing times among young children from observational data. U.S. Consumer Product Safety Commission, Bethesda, MD. 3 Tulve, N., Suggs, J., McCurdy, T., Cohen Hubal, E., & Moya, J. (2002). Frequency of mouthing behavior in young children. Journal of Exposure Analysis and Environmental Epidemiology, 12(4), 259–264. 4 Black, K., Shalat, S. L., Freeman, N. C. G., Jimenez, M., Donnelly, K. C., & Calvin, J. A. (2005). Children’s mouthing and food handling behavior in an agricultural community on the U.S./Mexico border. Journal of Exposure Analysis and EnvironmentalEpidemiology, 15, 244–251. 5 Reed, K. J., Jimenez, M., Freeman, N. C. G., & Lioy, P. J. (1999). Quantification of children’s hand and mouthing activities through a videotaping methodology. Journal of Exposure Analysis and Environmental Epidemiology, 9, 513–520.
D.9.3 Pets There are currently no data available that specifically address the number of hand-to-mouth events that occur relative to the amount of time a child spends with a pet. As a result, the estimates for frequency of hand-to-mouth events in indoor environments from the Xue et al. (2007) meta-analysis were used as a surrogate. This article examined hand-to-mouth frequency data from 9 available studies representing 429 subjects and more than 2,000 hours of behavior observation. Results of this analysis indicate that age and location are important for hand-to-

Appendix D
U.S. EPA Office of Pesticide Programs – Standard Operating Procedures for Assessing Residential Pesticide Exposure D-130
mouth frequency, but study and gender are not. In fact, hand-to-mouth frequency is significantly greater indoors than outdoors. As a result, hand-to-mouth frequency for indoor environments was selected for risk analysis of children indoor ingestion from treated pets. Since the indoor environment data used are not specific to the pet SOP, raw data from the studies and resulting statistical analysis can be found in D.9.2 of the Appendix.
D.10 Estimates of Object-to-Mouth Events per Hour Frequency of object-to-mouth events is an important variable for object-to-mouth post-application exposure assessments. Data on the frequency of object-to-mouth events are limited and difficult to collect. The generic estimates for frequency of hand-to-mouth events are based on the Xue et al. (2010) meta-analysis. This article examined object-to-mouth frequency data from 7 available studies representing 438 participants and ~1500 hours of behavior observation. Results of this analysis indicate that age and location are important for object-to-mouth frequency. In fact, object-to-mouth frequency is significantly greater indoors than outdoors. As a result, object-to-mouth frequency for outdoor environments is presented in this Appendix separately from object-to-mouth frequency for indoor environments.
D.10.1 Outdoors - Turf The index lifestage assessed for object-to-mouth activity for the outdoor environment is the children 1 < 2 years old lifestage. The estimates of object mouthing frequency (events/hour) for children 1 < 2 years old were derived from 3 studies representing 21 participants. Table D-70 provides the raw data.
Table D-70: Outdoor-Turf Object-to-Mouth Frequency Data
ID Study Age (years) Object-to-Mouth Frequency (events/hr)
id021
AuYeung et al., 20041
1.2 10 id022 1.3 4 id012 1.4 17 id004 1.5 1 id001 1.5 8 id013 1.6 4 id023 1.6 9
315M12
Beamer et al., 20082
1 11 328F22 1.833333 3 681M23 1.916667 5 768M23 1.916667 21
104
Tulve et al., 20023
1.166667 0 104 1.166667 0 104 1.166667 14 194 1.25 5 190 1.75 6 120 1.75 8 190 1.75 14

Appendix D
U.S. EPA Office of Pesticide Programs – Standard Operating Procedures for Assessing Residential Pesticide Exposure D-131
150 1.833333 3 764 1.833333 4 764 1.833333 38
1 AuYeung, W., Canales, R.A., Beamer, P., Ferguson, A.C., Leckie, J.O. (2004). Young Children’s Mouthing Behavior: An Observational Study via Videotaping in a Primarily Outdoor Residential Setting. Journal of Children’s Health, 2(3-4), 271-295. 2 Beamer, P., Key, M.E., Ferguson, A.C., Canales, R.A., Auyeung, W., Leckie, J.O. (2008). Time Activity Assessment of Young Farmworker Children in California. In revision, Journal of Environmental Research. 3 Tulve, N., Suggs, J., McCurdy, T., Cohen Hubal, E., & Moya, J. (2002). Frequency of mouthing behavior in young children. Journal of Exposure Analysis and Environmental Epidemiology, 12(4), 259–264.
D.10.2 Indoors The index lifestage assessed for object-to-mouth activity for the indoor environment is the children 1 < 2 years old lifestage. The estimates of object mouthing frequency (events/hour) for children 1 < 2 years old were derived from 4 studies representing 137 participants. Table D-71 provides the raw data.
Table D-71: Indoor Object-to-Mouth Frequency Data ID Study Age (years) Object-to-Mouth Frequency (events/hr)
Children 1 < 2 years old id001 AuYeung et al., 20041 2 11
315M12
Beamer et al., 20082
1 32 081F13 1 32 764M20 2 29 328F22 2 11 674F22 2 21 681M23 2 18 768M23 2 44
00501670
Green, 20023
1 0 00501670 1 3 00206446 1 6 00206446 1 9 IL101540 1 11
TXK04115 1 18 00201136 1 19 ILK67044 1 21 ILK67044 1 25 00201136 1 25
TXK04115 1 26 IL101540 1 34 ILK54587 1 49 ILK54587 1 67 ILK67031 1 6 ILK66422 1 8

Appendix D
U.S. EPA Office of Pesticide Programs – Standard Operating Procedures for Assessing Residential Pesticide Exposure D-132
Table D-71: Indoor Object-to-Mouth Frequency Data ID Study Age (years) Object-to-Mouth Frequency (events/hr)
ILK92729 1 9 TXK31661 1 10 TXK24860 1 10 TXK31661 1 11 ILK51607 1 12 TXK16769 1 14 ILK67031 1 14 ILK66422 1 16 ILK51607 1 16 ILK92729 1 18 TXK37439 1 18 00206443 1 19
TXK37439 1 19 TXK16769 1 22 ILK34447 1 22 ILK37758 1 25 TXK24860 1 26 ILK34447 1 33 00206443 1 38 ILK37758 1 41 00203429 1 6 ILK98213 1 6 00203429 1 6 ILK98213 1 7 ILK63757 1 8 ILK63757 1 8 00204534 1 11
TXK12275 1 11 00204534 1 14 ILK83625 1 16 ILK83625 1 16 ILK44904 1 17 ILK44904 1 19 TXK10932 1 19 ILK93446 1 21 TXK10932 1 21 ILK93446 1 27 TXK12275 1 32 ILK92658 1 2 TXK47553 1 3 ILK92658 1 5 IL106650 1 6 IL106650 1 6
TXK47553 1 7 TXK57344 1 11 TXK15447 1 12
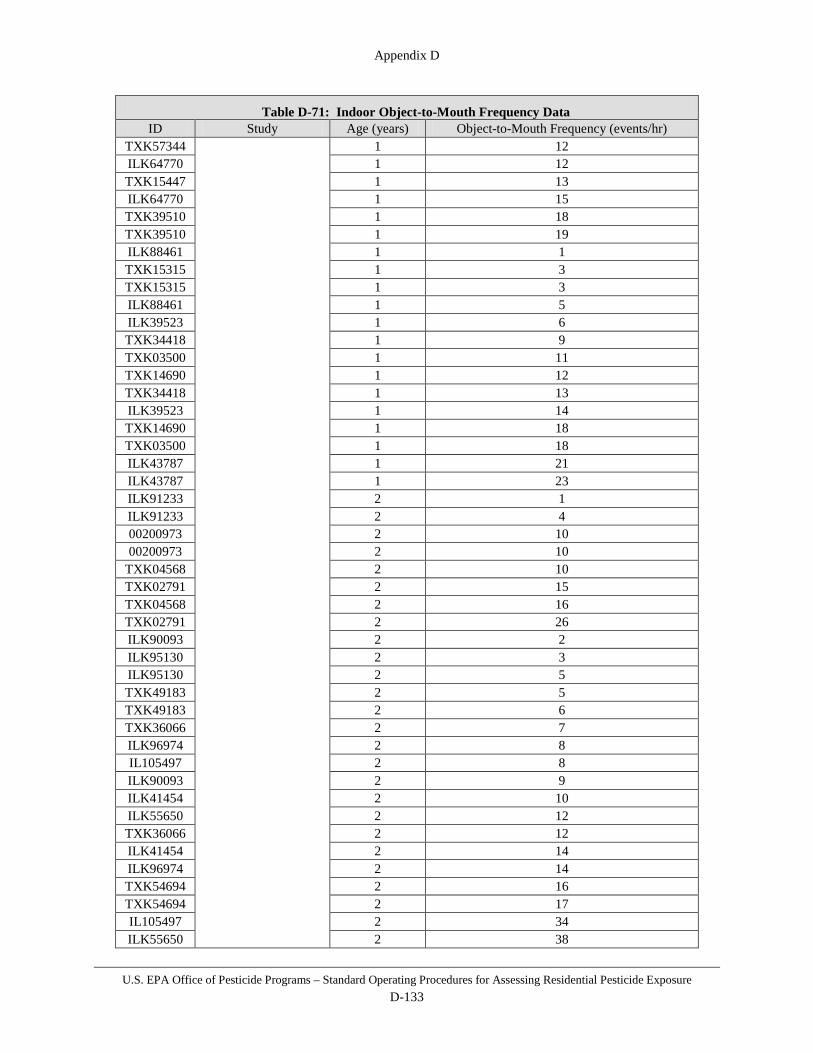
Appendix D
U.S. EPA Office of Pesticide Programs – Standard Operating Procedures for Assessing Residential Pesticide Exposure D-133
Table D-71: Indoor Object-to-Mouth Frequency Data ID Study Age (years) Object-to-Mouth Frequency (events/hr)
TXK57344 1 12 ILK64770 1 12 TXK15447 1 13 ILK64770 1 15 TXK39510 1 18 TXK39510 1 19 ILK88461 1 1 TXK15315 1 3 TXK15315 1 3 ILK88461 1 5 ILK39523 1 6 TXK34418 1 9 TXK03500 1 11 TXK14690 1 12 TXK34418 1 13 ILK39523 1 14 TXK14690 1 18 TXK03500 1 18 ILK43787 1 21 ILK43787 1 23 ILK91233 2 1 ILK91233 2 4 00200973 2 10 00200973 2 10
TXK04568 2 10 TXK02791 2 15 TXK04568 2 16 TXK02791 2 26 ILK90093 2 2 ILK95130 2 3 ILK95130 2 5 TXK49183 2 5 TXK49183 2 6 TXK36066 2 7 ILK96974 2 8 IL105497 2 8 ILK90093 2 9 ILK41454 2 10 ILK55650 2 12 TXK36066 2 12 ILK41454 2 14 ILK96974 2 14 TXK54694 2 16 TXK54694 2 17 IL105497 2 34 ILK55650 2 38

Appendix D
U.S. EPA Office of Pesticide Programs – Standard Operating Procedures for Assessing Residential Pesticide Exposure D-134
Table D-71: Indoor Object-to-Mouth Frequency Data ID Study Age (years) Object-to-Mouth Frequency (events/hr)
IL104760 2 1 ILK75432 2 2 ILK75432 2 2 IL104760 2 3
TXK29304 2 5 TXK29304 2 7 ILK86318 2 10 ILK48848 2 14 ILK83808 2 17 ILK48848 2 19 ILK83808 2 23 ILK86318 2 28 00200925 2 2 ILK81166 2 5 TXK57947 2 8 ILK82433 2 15 TXK57947 2 15 00200925 2 17 ILK87131 2 17 ILK82433 2 20 ILK81166 2 21 ILK87131 2 25 ILK52051 2 7 ILK52051 2 15 ILK49347 2 19 ILK49347 2 31
r208
Tulve et al., 20024
2 2 r201 2 0 890 1 9 876 1 18 932 1 19 876 1 21 932 1 24 876 1 33 932 1 34 187 1 41 975 1 45 975 1 50 890 1 58 890 1 58 876 1 69 187 1 84 187 1 84 932 1 89 975 1 90 975 1 112

Appendix D
U.S. EPA Office of Pesticide Programs – Standard Operating Procedures for Assessing Residential Pesticide Exposure D-135
Table D-71: Indoor Object-to-Mouth Frequency Data ID Study Age (years) Object-to-Mouth Frequency (events/hr) 126 1 36 126 1 38 126 1 62 126 1 73 711 1 12 104 1 17 711 1 32 167 1 37 167 1 51 711 1 54 167 1 67 167 1 72 711 1 87 705 1 17 194 1 24 705 1 30 194 1 31 162 1 43 162 1 45 194 1 47 705 1 48 705 1 72 162 1 98 162 1 204 101 1 0 101 1 0 122 1 0 101 1 10 837 1 10 101 1 24 837 1 27 122 1 28 837 1 36 723 1 38 122 1 50 837 1 54 122 1 62 723 1 72 132 2 32 132 2 59 768 2 22 768 2 24 768 2 53 108 2 7 190 2 18 108 2 19

Appendix D
U.S. EPA Office of Pesticide Programs – Standard Operating Procedures for Assessing Residential Pesticide Exposure D-136
Table D-71: Indoor Object-to-Mouth Frequency Data ID Study Age (years) Object-to-Mouth Frequency (events/hr) 108 2 20 190 2 31 108 2 40 120 2 41 120 2 120 150 2 2 103 2 8 764 2 21 150 2 68 150 2 75 103 2 82 103 2 96 103 2 147 748 2 2 748 2 6 748 2 24 748 2 54 110 2 60 110 2 64 110 2 81
1 AuYeung, W., Canales, R.A., Beamer, P., Ferguson, A.C., Leckie, J.O. (2004). Young Children’s Mouthing Behavior: An Observational Study via Videotaping in a Primarily Outdoor Residential Setting. Journal of Children’s Health, 2(3-4), 271-295. 2 Beamer, P., Key, M.E., Ferguson, A.C., Canales, R.A., Auyeung, W., Leckie, J.O. (2008). Time Activity Assessment of Young Farmworker Children in California. In revision, Journal of Environmental Research. 3 Greene, M.A. (2002). Mouthing times among young children from observational data. U.S. Consumer Product Safety Commission, Bethesda, MD. 4 Tulve, N., Suggs, J., McCurdy, T., Cohen Hubal, E., Moya, J. (2002). Frequency of Mouthing Behavior in Young Children. Journal of Exposure Analysis and Environmental Epidemiology, 12(4), 259-264.
D.11 Insect Repellent Application Rates
Background on Repellent Efficacy Studies Efficacy studies are required as part of the registration process for insect repellent products. Efficacy studies with dosimetry determination are available for aerosols, pump sprays, lotions, and towelettes – formulations that comprise the vast majority of repellent products. These studies are useful in determining an application rate estimate for some repellent exposure scenarios, and have been included in this SOP. Some insect repellent efficacy studies incorporate “dosimetry determination” that can be used as application rates in the form “mass repellent product per square centimeter of skin”. Rates in this form can then be extrapolated to the rest of the body for different application scenarios (e.g., weather, location, etc.) to estimate a total body application. “Dosimetry determination” in efficacy studies is used to determine the dosing rate of repellent products when tested for

Appendix D
U.S. EPA Office of Pesticide Programs – Standard Operating Procedures for Assessing Residential Pesticide Exposure D-137
efficacy under laboratory and field conditions. For an insect repellent to perform as claimed on the label, a certain concentration of the chemical and thorough coverage of the exposed area is essential. Dosimetry is conducted using 10-12 adult subjects, both males and females. The process starts by designating an area to treat (cm2) by measuring the length and circumference of the forearm and/or lower leg. Then the test subjects are given a copy of the instructions (part of the label of the proposed product) along with a product sample. After they become familiar with the instructions and the product's formulation and package they will practice treating themselves. During the practice session, a technician will show each test subject how to treat the forearm or leg with the test product to thoroughly and evenly cover the measured area without wasting the product and each test subject practices the treatment the way he/she would use the product under the actual use conditions. Then each subject performs three applications of the product which is measured and reported in mass product per skin surface area. Because there is large variation in the applied rate of repellent products by the consumers, dosimetry is used to capture that variability – a rate based on these consumer applications is then used as the amount applied during the efficacy trial portion of the study. Besides determining a rate to use in an efficacy trial however, the dosimetry aspect provides an estimate of the actual amount of product applied to a treatment area and also permits statistical analysis to capture the range of application rates individuals will apply for certain types of products. As previously stated, a product-specific estimate of the total amount of repellent applied to the entire body (e.g., total mass per application) would be the most accurate measure of repellent applications. However, absent this kind of information, an extrapolation to the whole body from the dosimetry estimates in these efficacy studies provide the most reliable available application estimates. The following sections provide an analysis of the dosimetry determination components of various efficacy studies for the purposes of generating product-specific application rates for use in estimating exposure to insect repellents. Variable ARF: Formulation-specific application rate (mg product/cm2skin) Several efficacy studies on insect repellents of different formulations have been submitted to the Agency and are available for analysis. These studies have been reviewed by OPP and the Human Studies Review Board. Each study used in the creation of this SOP has been found to be acceptable under both GLP and HSRB guidelines. Aerosols When aerosol (or pump spray) formulations are tested, the delivered quantity of spray is measured using dosimeter patches (i.e., four 1-inch wide strips of 3M Brand Nexcare Holdfast self adhesive roll gauze) placed strategically on the forearm or leg to intercept a portion of the spray applied which is then extrapolated to the rest of the treated area. Before each spray trial, a technician custom fits the four narrow rings of plastic-backed gauze patches around each person's forearm or leg. The dosimeters are narrow to minimize the extent to which the sensation of the spray falling on the bare skin is altered. For each treatment, there are 4 dosimeters per limb totaling 24 if both limbs are used. The amount of product captured by each dosimeter patch is determined by the weight difference before and after application. The total captured by all 4 patches (1 inch wide) per trial is added

Appendix D
U.S. EPA Office of Pesticide Programs – Standard Operating Procedures for Assessing Residential Pesticide Exposure D-138
and then any weight gain or loss in the paired control dosimeters is corrected to obtain a net total weight gain. The total weight of applied product per treated area was calculated by the following algorithm:
AT
LTSDDW
AR*
=
where:
AR = Application rate of spray product (g /cm2); AT = Area treated, leg or forearm (cm2); DW = Weight of product captured by 4 dosimeters (g); LT = Length of treated area, leg or forearm (cm); and SD = Total width of 4 dosimeter patches (10.16 cm).
Application rate data from two efficacy studies (EPA MRID 47049501 and 47049502), both measuring the repellent product IR 3535 which contains 20% ai in aerosol form, were available for analysis. Application rates, as measured using the dosimetry determination outlined above, ranged from 0.17 to 3.5 mg aerosol per cm2 of skin. A lognormal probability plot is presented below.
Figure D-22: Lognormal Probability Plot for Aerosol Application Rates
Lognormal Probability PlotAerosol Application Rates
-2
-1.5
-1
-0.5
0
0.5
1
1.5
-3.00 -2.00 -1.00 0.00 1.00 2.00 3.00
Standard Normal Score
ln (m
g/cm
2)
Aerosol_arm_47049501_20% Aerosol_leg_47049502_20%
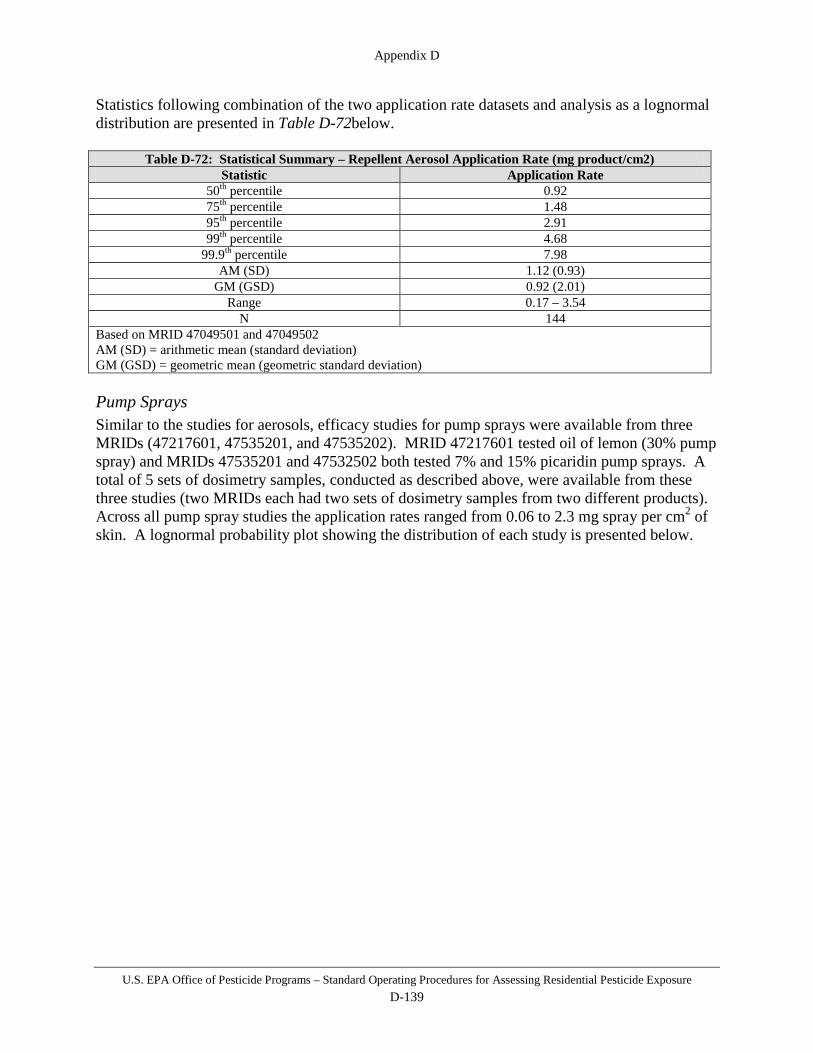
Appendix D
U.S. EPA Office of Pesticide Programs – Standard Operating Procedures for Assessing Residential Pesticide Exposure D-139
Statistics following combination of the two application rate datasets and analysis as a lognormal distribution are presented in Table D-72below.
Table D-72: Statistical Summary – Repellent Aerosol Application Rate (mg product/cm2) Statistic Application Rate
50th percentile 0.92 75th percentile 1.48 95th percentile 2.91 99th percentile 4.68
99.9th percentile 7.98 AM (SD) 1.12 (0.93)
GM (GSD) 0.92 (2.01) Range 0.17 – 3.54
N 144 Based on MRID 47049501 and 47049502 AM (SD) = arithmetic mean (standard deviation) GM (GSD) = geometric mean (geometric standard deviation) Pump Sprays Similar to the studies for aerosols, efficacy studies for pump sprays were available from three MRIDs (47217601, 47535201, and 47535202). MRID 47217601 tested oil of lemon (30% pump spray) and MRIDs 47535201 and 47532502 both tested 7% and 15% picaridin pump sprays. A total of 5 sets of dosimetry samples, conducted as described above, were available from these three studies (two MRIDs each had two sets of dosimetry samples from two different products). Across all pump spray studies the application rates ranged from 0.06 to 2.3 mg spray per cm2 of skin. A lognormal probability plot showing the distribution of each study is presented below.

Appendix D
U.S. EPA Office of Pesticide Programs – Standard Operating Procedures for Assessing Residential Pesticide Exposure D-140
Figure D-23: Pump Spray Application Rate Lognormal Probability Plots Statistics following combination of the datasets and analysis as a lognormal distribution are presented in Table D-73 below.
Table D-73: Statistical Summary – Repellent Pump Spray Application Rate (mg product/cm2) Summary Statistic Application Rate
50th percentile 0.50 75th percentile 0.78 95th percentile 1.47 99th percentile 2.29
99.9th percentile 3.78 AM (SD) 0.62 (0.45)
GM (GSD) 0.50 (1.93) Range 0.06 – 2.29
N 420 Based on MRID 47535201, 47535202, and 47217601 AM (SD) = arithmetic mean (standard deviation) GM (GSD) = geometric mean (geometric standard deviation)
Lotions Two studies (EPA MRID 47322401 and 47322501) measuring the efficacy of repellents formulated as lotions are available to estimate application rates based on dosimetry determination. The studies tested the efficacy of Coulston’s Duranon Personal Insect Repellent (30% DEET) and Dermaegis Lipo DEET (20% DEET). As previously described, each test
-3.5
-3
-2.5
-2
-1.5
-1
-0.5
0
0.5
1
1.5
-3.00 -2.00 -1.00 0.00 1.00 2.00 3.00
Standard Normal Score
ln (m
g/cm
2)
Pump_leg_47535201_7% Pic
Pump_leg_47535201_15% Pic
Pump_leg_47535201_15% Pic+SS
Pump_arm_47535202_7% Pic
Pump_arm_47535202_15% Pic
Pump_arm_47535202_15% Pic+SS
Pump_leg_47217601_OLE

Appendix D
U.S. EPA Office of Pesticide Programs – Standard Operating Procedures for Assessing Residential Pesticide Exposure D-141
subject applied the lotions three times to designated areas on each of their forearms for a total of 120 applications. The application rate (in mg lotion per cm2 forearm) is determined simply by weighing the product (bottle) before and after each application and dividing by the surface area of the arm treated. Overall the application rates in these studies ranged from 0.68 to 4.51 mg lotion per cm2 of skin. The application rates for each study were plotted on a lognormal probability plot, shown in the figure below, to evaluate the distributions of the datasets.
Figure D-24: Lotion Application Rate Lognormal Probability Plots It is not unexpected that there are differences between the two applications, though at the upper end of each distribution they appear to be fairly similar. Because the intention of this exercise is to yield a distribution of application rates for a future lotion repellent, the datasets were combined. Statistics of this distribution are summarized in Table D-74 below.
Table D-74: Statistical Summary – Repellent Lotion Application Rate (mg product/cm2) Statistic Application Rate
50th percentile 1.89 75th percentile 2.43 95th percentile 3.52 99th percentile 4.55
99.9th percentile 6.08 AM (SD) 2.03 (0.80)
GM (GSD) 1.89 (1.46)
-0.50
0.00
0.50
1.00
1.50
2.00
-3.00 -2.00 -1.00 0.00 1.00 2.00 3.00
Standard Normal Score
ln (m
g/cm
2)
Lotion_f-arm_47322401 Lotion_f-arm_47322501
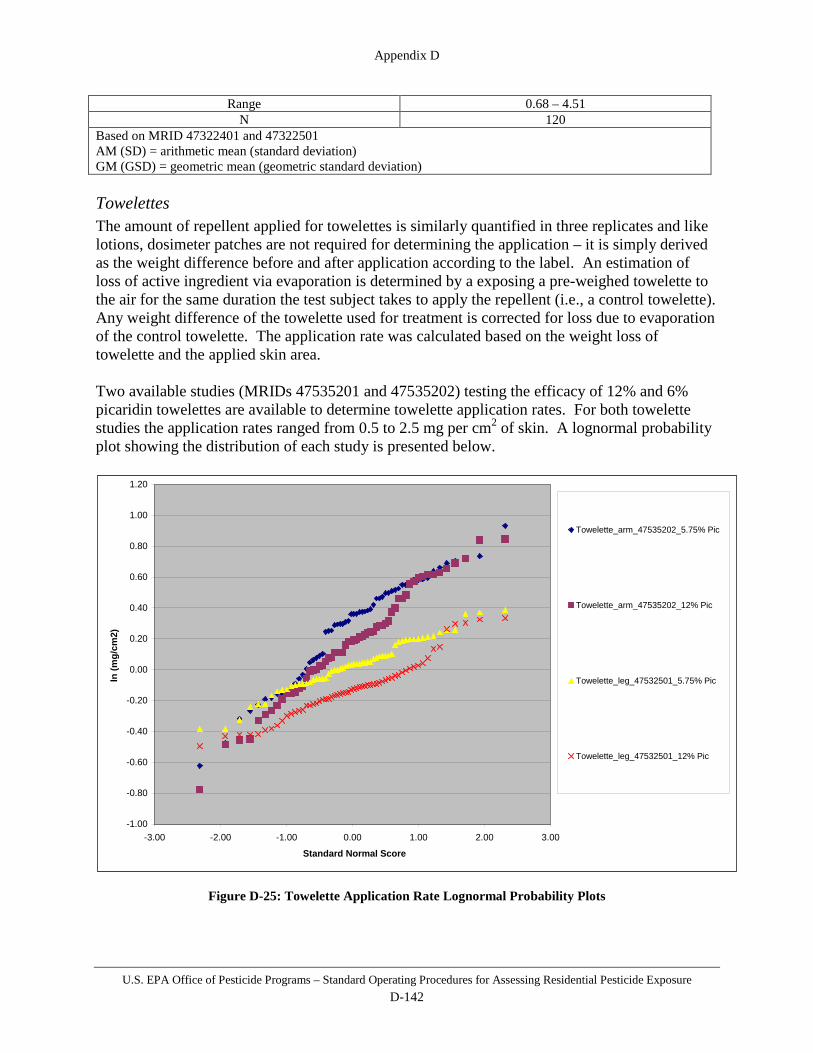
Appendix D
U.S. EPA Office of Pesticide Programs – Standard Operating Procedures for Assessing Residential Pesticide Exposure D-142
Range 0.68 – 4.51 N 120
Based on MRID 47322401 and 47322501 AM (SD) = arithmetic mean (standard deviation) GM (GSD) = geometric mean (geometric standard deviation) Towelettes The amount of repellent applied for towelettes is similarly quantified in three replicates and like lotions, dosimeter patches are not required for determining the application – it is simply derived as the weight difference before and after application according to the label. An estimation of loss of active ingredient via evaporation is determined by a exposing a pre-weighed towelette to the air for the same duration the test subject takes to apply the repellent (i.e., a control towelette). Any weight difference of the towelette used for treatment is corrected for loss due to evaporation of the control towelette. The application rate was calculated based on the weight loss of towelette and the applied skin area. Two available studies (MRIDs 47535201 and 47535202) testing the efficacy of 12% and 6% picaridin towelettes are available to determine towelette application rates. For both towelette studies the application rates ranged from 0.5 to 2.5 mg per cm2 of skin. A lognormal probability plot showing the distribution of each study is presented below.
Figure D-25: Towelette Application Rate Lognormal Probability Plots
-1.00
-0.80
-0.60
-0.40
-0.20
0.00
0.20
0.40
0.60
0.80
1.00
1.20
-3.00 -2.00 -1.00 0.00 1.00 2.00 3.00
Standard Normal Score
ln (m
g/cm
2)
Towelette_arm_47535202_5.75% Pic
Towelette_arm_47535202_12% Pic
Towelette_leg_47532501_5.75% Pic
Towelette_leg_47532501_12% Pic

Appendix D
U.S. EPA Office of Pesticide Programs – Standard Operating Procedures for Assessing Residential Pesticide Exposure D-143
Statistics following combination of the datasets and analysis as a lognormal distribution are presented in Table D-75below.
Table D-75: Statistical Summary – Repellent Towelette Spray Application Rate (mg product/cm2) Statistic Application Rate
50th percentile 1.09 75th percentile 1.34 95th percentile 1.82 99th percentile 2.25
99.9th percentile 2.85 AM (SD) 1.14 (0.36)
GM (GSD) 1.09 (1.36) Range 0.46 – 2.54
N 240 Based on MRID 47535201, 47535202 AM (SD) = arithmetic mean (standard deviation) GM (GSD) = geometric mean (geometric standard deviation)