standard operating procedures for analytical methods and
TRANSCRIPT

Standard Operating Procedures for Analytical Methods and Data Collection in Support of Pilot-Scale Cultivation of Microalgae
Report WP1A3.01

i
Energetic Algae (‘EnAlgae’)
Project no. 215G
Public Output
Output WP1A3.01 – Standard Operating Procedures for Analytical Methods and Data Collection in Support of Pilot-Scale Cultivation of Microalgae
Editors Alla Silkinaa, Kevin J. Flynna, Carole A. Llewellynd,a, Catherine Baylissa. aAlgal Research, Swansea University, Singleton Park, Swansea, SA28PP, UK Contributors Rhiannon Wilcoxa, Naomi Ginnevera, Craig Pooleya, Sofie Van Den Hendeb, Alexandra Lefoulonb, Laurent Cedricb, Matthew P. Daveyc, Anneliese Ernste, Chris de Visserf and Wim van Dijkf aAlgal Research, Swansea University, Singleton Park, Swansea, SA2 8PP, UK bDepartment of Industrial Biological Sciences (formerly Howest University College), Faculty of Bioscience Engineering, Ghent University, Campus Kortrijk, Karel de Goedelaan 5, 8500 Kortrijk, Belgium cDepartment of Plant Sciences, University of Cambridge, Downing Street, Cambridge CB2 3EA, UK dPlymouth Marine Laboratory, Prospect Place, The Hoe, Plymouth, PL13DH, UK eHochschule für Technik und Wirtschaft des Saarlandes, Göbenstraße 40, 66117 Saarbrücken, Germany
fWageningen UR including Plant Research International (WUR), Lelystad, The Netherlands Please cite this document as follows: Silkina A., Flynn K., Llewellyn C., Bayliss C. [eds] 2015. Standard Operating Procedures for Analytical Methods and Data Collection in Support of Pilot-Scale Cultivation of Microalgae. Public Output report WP1A3.01 of the EnAlgae project, Swansea, September 2015, 395 pp. Available online at http://www.enalgae.eu/public-deliverables.htm.

ii
This document is an output from the Energetic Algae (‘EnAlgae’) project, which has received European Regional Development Funding through the INTERREG IVB NWE programme. Swansea Universty would like to acknowledge co-funding provided by Swansea University and the Welsh Government’s Targeted Match Fund. Ghent University, Campus Kortrijk (formerly Howest University College) would like to acknowledge co-funding provided by the Flemish Government and Province West-Flanders. © EnAlgae project partnership, September 2015, all rights reserved.

iii
Standard Operating Procedures for Analytical Methods and Data Collection in Support of Pilot-Scale Cultivation of Microalgae
1 Executive summary
This document is a compilation of Standard Operating Procedures (SOPs) deployed by the EnAlgae microalgal pilot facilities. EnAlgae was a four year Strategic Initiative of INTERREG IVB North West Europe programme. One of the outputs of the EnAlgae project was the development of an integrated network of pilot plants for growing microalgae. An important part of this activity was an exchange of views on operating procedures both with respect to best practices (documented elsewhere) and SOPs. The use of such SOPs provides a unified mechanism for the acquisition and management of data collection. Methods of analysis are described together with data collection (continuous and discrete) on the following types of parameters: environmental parameters, nutrients, algal growth during cultivation, and composition of harvested biomass. Considerations of accuracy and precision are included, with the aim of standardising methods between different analysts and institutions. The document brings together SOPs used by the microalgal partners to serve as a useful starting point for those new to pilot and commercial scale algal cultivation. In addition the generation of such data series is an essential prerequisite for the parameterisation and validation of mathematical models of algal biomass production for commercial exploitation.

iv
TABLE OF CONTENTS Page
1 Executive Summary………………..……………………………………………….. iii.
2 Introduction………………………..…………………………………………………. 1
Pilot Study Sites………………………………………………………………… 1
Summary Table…………………………………………………………………. 4
3 Overview of Parameters
3.1. Environmental Parameters………………………………………………. 6
3.2. Dissolved Analytes………………………………………………………... 8
3.3. Growth Parameters……………………………………………………….. 12
3.4. Cellular Composition……………………………………………………… 14
3.5. Biomass valorization: biogas…………………………………………...... 16
4 References…………..………………………………………………………………. 17
5 SOPS
SOP: 1.1.b, 1.2.b Analysis of temperature and pH of water samples………... 18
SOP: 1.1.e, 1.2.e Temperature and pH– automated recording………………. 26
SOP: 1.1.f Automated measurement of culture temperature…………………. 29
SOP: 1.2.a, 1.3.a pH and Salinity – WTW Handheld probe…………………... 32
SOP: 1.2.c pH of Algal Cultures………………………………………………….. 37
SOP: 1.2.f Automated measurement of culture pH…………………………….. 39
SOP: 1.3.c Measuring salinity (sodium & chloride) and nitrate……………….. 43
SOP: 1.4.a Photosynthetically active photon flux density (PAR-PFD)……….. 46
SOP: 1.4.b Photosynthetic photon flux density (PPFD)……………………….. 49
SOP: 1.4.e Global Solar Radiation (GSR)………………………………………. 53
SOP: 1.4.e Photosynthetic Active Radiation (PAR)……………………………. 56
SOP: 2.1.a Ammonium/Ammonia - segmented flow analyser (SFA)………… 59
SOP: 2.1 b Analysis of dissolved ammonium (NH4+)…………………………... 66
SOP: 2.1.e Total Ammonia-N (TAN), NH4-N, manual assay………………….. 75
SOP: 2.2.a, 2.3.a Total Oxidised Nitrogen (TON); Nitrate and Nitrite – SFA.. 78
SOP: 2.2.b Analysis of dissolved nitrate (NO3-)………………………………… 86
SOP: 2.2.c Analysis of dissolved nitrate (NO3-)………………………………… 91
SOP: 2.2.e Nitrate-N (NO3-N), autoanalyzer……………………………………. 95
SOP: 2.2.e Nitrate-N (NO3-N) Manual Assay…………………………………... 99

v
SOP: 2.2.f Analysis of dissolved nitrate (NO3-)…………………………………. 102
SOP: 2.3.b Analysis of dissolved nitrite (NO2-)…………………………………. 107
SOP: 2.3.e Nitrite-N (NO2-N) Manual Assay…………………………………… 112
SOP: 2.4.a Total Dissolved Nitrogen (TDN) – SFA……………………………. 115
SOP: 2.4.b Analysis of total nitrogen in water samples (TN)…………………. 123
SOP: 2.5.a Phosphate – SFA…………………………………………………….. 130
SOP: 2.5.b Analysis of dissolved orthophosphate using colorimetric method 137
SOP: 2.5.e Phosphate-P (PO4-P) Manual Assay……………………………… 142
SOP: 2.6.a Total Dissolved Phosphorus (TDP) – SFA………………………… 145
SOP: 2.6.b Analysis of total phosphorous using a colorimetric method…….. 153
SOP: 2.7.a Silicate – SFA………………………………………………………… 159
SOP: 2.8.a Dissolved Inorganic Carbon (DIC) – SFA…………………………. 166
SOP: 2.8.b Analysis of total carbon (TC), total inorganic carbon (TIC) and total organic carbon (TOC) in water samples………………….… 174
SOP: 2.8.e TIC, TC, TOC, DOC Analysis………………………………………. 184
SOP: 2.9.a Dissolved Oxygen – OxyGuard Handheld probe…………………. 187
SOP: 2.9.b Analysis of dissolved oxygen (DO) with an optical sensor………. 189
SOP: 2.10.b Analysis of biochemical oxygen demand (BOD5)83…………….. 194
SOP: 2.11.a Chemical Oxygen Demand – Hach Photometer………………… 204
SOP: 2.11.b Analysis of chemical oxygen demand in wastewater (COD)…... 208
SOP: 2.12.e Iron (Fe), manual assay……………………………………………. 221
SOP: 3.1.a Dry Weight Determination…………………………………………… 223
SOP: 3.1.b Analysis of total suspended solids (TSS) and volatile suspended solids (VSS)…………………………………………………………... 227
SOP: 3.1.c Dry weight determination of fresh water algae…………………… 232
SOP: 3.1.e Biomass with Gravimetric Methods………………………………… 235
SOP: 3.1.f Analysis of dry weight algae biomass concentration……………… 239
SOP: 3.2.c Optical Density of Cultures………………………………………….. 241
SOP: 3.2.e Optical Methods for Biomass……………………………………….. 245
SOP: 3.3.a Cell Counting using the Beckman Coulter’s Multisizer TM4 particle counter…………………………...………………………….. 248
SOP: 3.3.c Algal Cell Counting…………………………………………………… 258
SOP: 3.3.e Biomass from Cells Counted in Thoma or Neubauer Chambers.. 264
SOP: 3.4.a EnAlgae SOP sheet – PAM fluorescence…………………………. 266

vi
SOP: 4.1.a Protein Analysis………………………………………………………. 270
SOP: 4.2.a Carbohydrate Analysis………………………………………………. 276
SOP: 4.3.a Total Lipid Analysis…………………………………………………... 282
SOP: 4.3.c Total Lipid Extraction………………………………………………… 287
SOP: 4.3.e Total Lipid Analysis…………………………………………………... 292
SOP: 4.4.a, 4.5.a Pigment Analysis……………………………………………… 294
SOP: 4.4.b Analysis of chlorophyll a (Chl a) and pheophytin a (Phe a) using UV-VIS spectrophotometry………………...………………………..
298
SOP: 4.4.c, 4.5.c Pigment Analysis……………………………………………… 306
SOP: 4.4.d Analysis of chlorophyll-a using UV-vis spectrophotometry……… 310
SOP: 4.4.e Chlorophyll a (Chl a)..................................................................... 315
SOP: 4.5.d Analysis of total carotenoids using UV-vis spectrophotometry….. 318
SOP: 4.6.a Carbon-Nitrogen Analysis…………………………………………… 323
SOP: 4.6.a Phosphorous Analysis……………………………………………….. 329
SOP: 4.6.d Carbon-Nitrogen Analysis............................................................. 335
SOP: 4.7.a Total FAME Analysis………………………………………………… 341
SOP: 4.7.c Total FAME Analysis………………………………………………… 346
SOP: 4.8.b Analysis of heavy metals in biomass………………………………. 351
SOP: 5.1.b Biochemical methane potential (BMP) of MaB-flocs……………... 363
SOP: 5.2.b Biogas analysis………………………………………………………. 367
SOP: 5.3.b Biogas sampling……………………………………………………… 378

1
2 INTRODUCTION
This document is a compilation of Standard Operating Procedures (SOPs) for analytical
procedures gathered from six North West Europe microalgal pilot cultivation facilities. It is an
output for Action 3, WP1, of the INTERREG IVB NWE project EnAlgae.
The assessment of algal growth, consumption of nutrients and allied features, are key
elements for the successful mass cultivation of microalgae. Despite this, there is great variety
in the approaches used to measure a given set and subset of each parameter type. The aim
of this document is thus to bring together analytical methods for key parameters and
descriptions of approaches. This compilation has been used to inform a Best Practice
document (this is considered in Best Practices for the Pilot-Scale Cultivation of Microalgae Report WP1A6.01).
The six microalgal pilot plants that participated in contributing to this document were at
locations indicated in Table (i).
Table (i) Partners of the EnAlgae Pilot Network contributing to this document, their institution abbreviations and identifiers used elsewhere in this document. Identifier Abbreviation Pilot Plant partner
a SU Algal Research, Swansea University (United Kingdom)
b UGent Ghent University, Campus Kortrijk (Belgium)
c Cambridge InCrops Enterprise Hub in partnership with the University of
Cambridge, Cambridge (United Kingdom)
d PML Plymouth Marine Laboratory, Nottingham Facilities, Nottingham
(United Kingdom)
e Htw saar Hochschule für Technik und Wirtschaft des Saarlandes
(Germany)
f WUR Wageningen UR / ACRRES (Netherlands)
A brief description of the pilot plant facilities follows:
a) Algal Research, Swansea University (United Kingdom) This facility has several
microalgal photobioreactors: 1x400L tubular horizontal PBR in a temperature and light
controlled laboratory; 2x 600L tubular horizontal PBR in a heated and vented greenhouse;
algal preparation laboratory: 30 x 20L plastic carboys and 15 x 80L plastic bag columnar
reactors. In addition there is a 2000L tubular vertical PBR combined with a flue gas supply

2
facility in a greenhouse on-site, and an additional flue gas linked facility at a major local
heavy industry site.
b) Ghent University (UGent), Campus Kortrijk (Belgium)
This facility includes a mobile pilot installation; a heated open pond with microalgal bacterial
flocs (MaB-flocs) and flue gas injection. It was constructed by the Belgian companies
Bebouwen & Bewaren nv and CATAEL bvba. It was operated on two different company
sites, treating parts of three different waste water streams; effluent from aquaculture (Inagro),
the digestate and effluent from a food company (Alpro). MaB-floc biomass was harvested by
filter press, and then tested for its potential for anaerobic digestion to biogas, slow-release
fertilizer, and inclusion in shrimp diets and pigments.
c) InCrops Enterprise Hub, University of East Anglia, UK in collaboration with the Department of Plant Sciences, University of Cambridge, United Kingdom
This facility was built to investigate how by-products of water purification (brine) can be used
to grow algae. This pilot plant has a range of facilities to study algal growth and physiology.
These are split between laboratory based studies using up to 1 L flasks in controlled
environment growth shakers and semi-natural environment reactors based inside a
polytunnel with 5-10 L plastic bag ‘sock’ reactors, 10 L upright tube reactors with aeration
systems and a 300 L tubular semi-closed bioreactor system. The facility provides data on
financial and environmental aspects of growing algae in North West Europe.
d) Plymouth Marine Laboratory, Nottingham Facilities, Nottingham (United Kingdom)
PML has upgraded a large-scale microalgae facility at the Boots PLC company site at
Nottingham. It consists of a 16000L photobioreactor system which is directly coupled to the
emission stack of a gas turbine power station. The facility provides data on cultivation and
maintenance of microalgae.
e) Hochschule für Technik und Wirtschaft des Saarlandes (Germany)
This facility deals with closed loop processes for aquaculture production. Several
recirculation aquaculture systems (RAS) for marine fish and crustacean are coupled with
photobioreactors for the production of microalgae. The water treatment system of the RAS
maintains clear seawater facilitating photoautotrophic co-production.
f) Wageningen UR / ACRRES (Netherlands)
This facility includes two open pond systems that are connected to an anaerobic digester
feeding flue gas, minerals and heat to the algae system. It has also built two open LED light

3
assisted pre-culture basins. These facilities provide data for algal growth under different
conditions.
The parameter types considered in this document are grouped into five sections. Table (ii)
provides an overview of these parameter types, analyses approach, and the pilot partner
contributing to the methodological description provided in this SOP document.
1. Environmental parameters
2. Dissolved analytes
3. Growth parameters of microalgal culture
4. Cellular composition
5. Biogas potential

4
Table (ii) Summary of the Standard Operating Procedures for analysis associated with algal cultivation by the EnAlgae partners together with the sub-document location. For Partner identifier (a- SU; b-UGhent, c-Cambridge, d-HTW Saar, e- PML, f- WUR) see Table (i).
Parameters Method Example units Pilot Site
a b c d e f
1. Environmental parameters
1.1 Temperature (see also pH SOPs) Sensor °C 1.1.b 1.1.e 1.1.f
1.2 pH (see also Temperature SOPs) pH electrode pH 1.2.a 1.2.b 1.2.c 1.2.e 1.2.f
1.3 Salinity (see also pH SOPs)
Electrical conductivity/refractometry - 1.3.a 1.3.c
1.4 Light (PAR PFD)*
Quantum sensor µmol PAR photons s-1 m-2
1.4.a 1.4.b 1.4.e
2. Dissolved Analytes
2.1 Ammonia, Ammonium (NH3, NH4
+) Colorimetric gN L-1 2.1.a 2.1.b 2.1.e
2.2 Nitrate (NO3
-) (see also nitrite SOPs) " " 2.2.a 2.2.b 2.2.c 2.2.e 2.2.f
2.3 Nitrite (NO2
-) (see also nitrate SOPs) " " 2.3.a 2.3.b 2.3.e
2.4 Total dissolved nitrogen / Total nitrogen (TN) " " 2.4.a 2.4.b
2.5 Soluble reactive phosphate (SRP; PO4
3-) " gP L-1 2.5.a 2.5.b 2.5.e
2.6 Total dissolved phosphorus / Total phosphorus (TP) " " 2.6.a 2.6.b
2.7 Silicon (Si) " gSi L-1 2.7.a
2.8 Total dissolved inorganic (DIC), dissolved organic carbon (DOC), total inorganic carbon (TIC), total organic carbon (TOC), total carbon (TC)
" gC L-1 2.8.a 2.8.b 2.8.e
2.9 Dissolved Oxygen (DO) " gDO L-1 2.9.a 2.9.b
2.10 Biological Oxygen Demand (BOD5) " gBOD L-1 2.10.b

5
2.11 Chemical Oxygen Demand (COD) " gCOD L-1 2.11.a 2.11.b
2.12 Iron (Fe) " gFe L-1 2.12.e
3. Growth Parameters in Microalgal Culture
3.1 Biomass weight (AFDW/DW/VSS/TSS) Centrifuge; oven g L-1 3.1.a 3.1.b 3.1.c 3.1.e 3.1.f
3.2 Optical density (OD) Spectrophotometer A 3.2.c 3.2.e
3.3 Cell count and biovolume
Microscope, coulter counter cell L-1; nL L-1 3.3.a 3.3.c 3.3.e
3.4 Chlorophyll & photosynthetic efficiency Phyto-Pam Fv:Fm 3.4.a
4. Cellular composition
4.1 Proteins Spectrophotometer g cell-1 4.1.a
4.2 Carbohydrates Spectrophotometer " 4.2.a
4.3 Lipids Gravimetric " 4.3.a 4.3.c 4.3.e
4.4 Chlorophyll a Spectrophotometer " 4.4.a 4.4.b 4.4.c 4.4.d 4.4.e
4.5 Carotenoids Spectrophotometer " 4.5.a 4.5.c 4.5.d
4.6 Elemental content (C,N,P)
Elemental analyser & colorimetric
gC cell-1, gN cell-1, gP cell-1
4.6.a 4.6.d
4.7 Fatty Acids (FAME) GC-MS FAME mg cell-1 4.7.a 4.7.c
4.8 Heavy metals (B,Cu,Fe,Mn,Zn,Al,Ca,K, Mg) ICP-OES g cell-1 4.8.b
5. Biogas outputs
5.1 Biochemical methane potential (BMP) Batch assays 5.1.b
5.2 Biogas analyses (CH4, CO2) GC-TCD 5.2.b
5.3 Biogas sampling Gas syringes and vials 5.3.b
AFDW - ash free dry weight; DOC - dissolved organic carbon; DW - dry weight; TIC - total inorganic carbon; BOD - biochemical oxygen demand; GC-MS - gas chromatograph with mass spectrometry; TC - total carbon; COD - chemical oxygen demand; GC-TCD - gas chromatograph with thermal conductivity detector; TOC - total organic carbon;
DIC - dissolved inorganic carbon; ICP-OES - inductively coupled plasma - optical emission spectrometry; VSS - volatile suspended solids
DO - dissolved oxygen; PAR - photosynthetic active radiation; PFD - photon flux density; TSS - total suspended solids

6
3 OVERVIEW OF PARAMETERS
3.1 ENVIROMENTAL PARAMETERS
3.1.1 Temperature
Perhaps the simplest parameter to measure, temperature affects growth rates (broadly with a
doubling in growth rate per increase in temperature by 10°C), but can also easily attain lethal
levels resulting in a sudden crash (death) of the culture. In consequence, algal cultures may
require cooling by a flow of cold water over the surface of the culture vessel or by controlling
the air temperature with air-conditioning units. In open-air ponds, evaporation leads to
surface cooling (and also requires the addition of replacement water), while changes in light
over the day-night cycle may produce significant variation in temperature over the day. The
latter may be advantageous, promoting photosynthetic growth during daylight hours and
minimising respiration at night, although the time taken for the algal culture to warm and cool
complicates matters.
Often, temperature is measured concurrently with pH.
3.1.2 pH
pH measures acidity and alkalinity on a log scale, as the activity of the hydrogen ion (typically
donated by [H+]). pH is given as -log[H+].
As microalgae photosynthesise they remove CO2, resulting in basification of the growth
medium, and the pH rises. Conversely during periods of net respiration (at night time with
CO2 release), the system becomes acidic and pH falls. pH also falls (or increases more
slowly) during growth based on consumption of ammonia/ammonium.
Changes in media pH may limit algal growth via metabolic inhibition (Goldman et al., 1982;
Juneja et al., 2013). This variation in pH can, at the extremes, prevent growth (notably at
high pH), or lead to cell death (at low pH). Such events are of lesser importance in marine
cultures (where bicarbonate buffers the pH and provides a level of CO2 for photosynthesis),
but at the biomass densities deployed in commercial systems, even elevated bicarbonate is
depleted rapidly and addition of inorganic C (as CO2 gas, or bicarbonate) is required.

7
For wastewater treatment by microalgal biomass, measurement of the pH is also needed for
effluent quality control (Van Den Hende et al., 2014a). Indeed, for most effluents in north-
west Europe, discharge is only allowed for a pH below 9 or 9.5 (Van Den Hende, 2014). To
effectively control the effluent pH, and ensure the health of the algal biomass, the reactor pH
should to be continuously measured and corrected as appropriate.
The most effective way to control pH, while also ensuring the microalgae have sufficient CO2
to support photosynthesis, is to link a pH monitoring system to a valve controlling the entry of
CO2 gas. However, this control (which can only counter basification) is inadequate to correct
for a decrease in pH, for example that associated with the consumption of
ammonia/ammonium (such as during growth of anaerobic digester liquor), or with respiration
in darkness.
Often pH is measured concurrently with temperature, not least because pH requires
correction with temperature.
It should be noted that accurate measurement of pH is problematic in high ionic waters,
which includes all marine media. In addition, probes left inserted in cultures for continuous
monitoring develop biofilms that interfere with accurate pH reading. All probes should be
cleaned and re-calibrated regularly.
3.1.3 Salinity
Salinity is usually set to support the growth of a particular species of microalga. In general
terms, marine species often grow at least as well at salinities lower than seawater (as they
then need to allocate less resources to synthesize osmoticums). Salinity affects physiology,
which may be exploited (most famously for glycerol production by Dunaliella), and higher
salinity may also increases algal lipid content (Zhila et al., 2011). Salinity can increase in
shallow ponds during evaporation, requiring regular addition of freshwater.
3.1.4 Light
Light radiation covers a wide spectrum, of which only the visible sector (400-700 nm)
comprises photosynthetically active radiation (PAR). Light measurements have been made in
a variety of units, some of which are no longer used (foot-candles, lumens, lux). Currently
used units of measurement are photon flux density (PFD; µmol photons m-2 s-1) or as energy
(W m-2). Some report PFD with the old units of µ Einsteins photons m-2 s-1; numerically these
values are the same as µmol photons m-2 s-1.
It should be noted that the relationship between photosynthesis and total daily light dose
provided over different light: dark periods (e.g., 8:16, 12:12, 16:8 light:dark hours) is not

8
simple. Thus, delivering twice the PFD for half the time will not give the same growth rate.
While many microalgae grow fastest under continuous illumination, many require a period of
darkness each day.
The amount of light being received by each microalgal cell depends on the illumination at the
surface of the culture vessel or pond, and the optical depth. For a pond, optical depth is the
pond depth, but for a bioreactor illuminated evenly on all sides then the optical depth is the
radius of the reactor tubes. Some light measurement probes allow insertion into the culture
itself; those that remain in such an environment become coated with biofilms over time with
microalgal growth, hence affecting the readings; these probes need to be cleaned regularly.
3.2 DISSOLVED ANALYTES
This category includes nutrients used during growth, and also chemicals released by the
microalgae.Most of these are ideally measured using colorimetric, spectrophotometer-based,
assays, often using expensive instrumentation. For primarily non-saline applications, ion-
selective probes (akin to pH probes) may be used.
3.2.1 Ammonia (NH3) and ammonium (NH4+); TAN
These reduced forms of N are typically preferred by microalgae. However, at concentrations
supplied in bulk culture systems, the unionised ammonia (NH3) enters cells uncontrolled and
becomes toxic. At lower pH, ammonium is the dominant form; during uncontrolled
basification of cultures (increase in pH) with photosynthesis, toxic ammonia can accumulate.
For this reason care must be taken to control residual concentrations of
ammonia/ammonium. Colorimetric assays quantify both forms as total ammonium nitrogen
(TAN). An ammonia calculator (http://www.hbuehrer.ch/Rechner/Ammonia.html) can be used
to estimate ammonia concentration at the current pH.
The form of N present in greatest abundance in most waste waters is as
ammonia/ammonium, often at extremely high levels and hence requiring much dilution
before being introduced to cultures (but see phosphate, below). Consumption of
ammonia/ammonium results in culture pH acidification (in contrast to the removal of CO2
during photosynthesis, which causes pH to rise).

9
Urea may be used as an alternative to ammonia/ammonium, as a non-toxic form of reduced-
N. Not all microalgae can use urea, and the enzyme urease has nickel co-factor at its core so
growth using this N-source can be limited by the bioavailability of Ni.
3.2.2 Nitrate (NO3-)
This is the most commonly used N-source in microalgal cultivation, due to it being safe for
algal growth at even extreme concentrations. It should be noted that the chemical content of
cells grown on nitrate can be quite different to those grown on ammonium. This is associated
with the high metabolic cost in assimilating nitrate, which must be reduced to ammonium
within the cells. This uses an amount of photoreductant of the order of 1/3rd total
photoreductant production. Despite this apparent high cost, cells grown on nitrate may not
grow more slowly than those using ammonium, and may contain a higher cellular C:N ratio.
In general, given that most waste-water streams are dominated by ammonia/ammonium, yet
most studies have used nitrate as the N-source, our knowledge of bulk microalgal growth is
thus incomplete.
It is worth noting that although colorimetric assays for oxidized N-sources often report
nitrate+nitrite; the nitrite contribution is typically so low (or assumed as such) that de facto
nitrate+nitrite equates to nitrate.
3.2.3 Nitrite (NO2-)
Nitrite is highly toxic for algal growth (though growth is possible for some algae - Van Den
Hende et al., 2012). Measurements specifically for nitrite are likely only to be taken to
monitor for its absence. In microalgal bacterial systems for wastewater treatment, monitoring
nitrite is of importance when investigating nitrification.
3.2.4 Total Dissolved N and Total Nitrogen (TN)
This is a measurement of the total of all forms of dissolved N, inorganic plus organic (the
latter including urea and amino acids). TN is not typically monitored but is of importance
when evaluating microalgal systems for wastewater treatment, as this parameter is often
included in the list of discharge norms.
3.2.5 Soluble Reactive Phosphorous (SRP)
Phosphates can form complexes with other chemicals and with particles in suspension. In
consequence, the concentration of dissolved inorganic P (DIP) available according to
chemical reactions (reported as SRP) may not exactly reflect the P available for microalgal
uptake. Ultimately, the only way to know how much P is within cells is to measure the

10
cellular-P, rather than to assume that the difference between SRP at the start of the culture
period and at any particular time point equates to cellular-P.
P may also be available in dissolved organic forms (DOP). Microalgae can typically use DOP
with high efficiency, by deploying the enzyme acid- (for freshwater species) or alkaline-
(marine species) phosphatase.
Concentrations of P in wastewaters are typically low relative to the concentration of N
(usually present as ammonia/ammonium). In consequence, the use of wastewaters may
require not only dilution to avoid toxicity due to ammonia (see 2.1), but an addition of DIP
may be required to prevent P-limited growth.
3.2.6 Total Dissolved P and Total P (TP)
This is a measurement of the total of all forms of dissolved P, inorganic plus organic.
Measuring TP is of importance when evaluating microalgal systems for wastewater
treatment, as this parameter is often included in the list of discharge norms.
3.2.7 Silicate
Diatoms require silicate to synthesise their cell walls. The commonly used diatom
Phaeodactylum tricornutum has a very low Si content. Grown in glass containers it can
obtain sufficient Si from the slow dissolution of glass at the alkaline pH of marine media.
However, other diatoms, and indeed Phaeodactylum grown in non-glass systems, require
addition of Si.
Si precipitates out of solution readily during media preparation; often initial concentrations of
Si measured in cultures do not accord with the intended addition.
Si-limitation of diatoms causes immediate cessation of growth, with a potential crash of the
culture.
3.2.8 Total and dissolved inorganic and organic carbon (TC/TIC/TOC/DOC/DIC)
This group includes both the inorganic forms of carbon that support photosynthesis
(specifically CO2 (aq) and HCO3-) and organic forms that leak from microalgal cells
(especially during N and P limited growth). These forms are typically dissolved, but as the
operational description of dissolved refers to passage through a 0.2µm pore size filter, some
forms that are particulate such as mucilage and coccoliths may be included in the “dissolved”
fraction.
Dissolved inorganic C (DIC) in water may be present as carbonate (CO32-), bicarbonate
(HCO3−) and CO2 (aq) depending upon pH, temperature and nutrient content:

11
CO2 + H2O ↔ H2CO3 ↔ H+ + HCO3 − ↔ 2H+ + CO3 2− (1)
At the average pH of seawater (8.2), 90% of the total DIC is present in the form of HCO3−;
only 1% exists as CO2(aq) and the rest is carbonate. With an increase in pH, the proportion
of DIC as carbonate increases while CO2(aq) and bicarbonate decrease (Chen and Durbin,
1994).
3.2.9 Dissolved Oxygen (DO)
Oxygen is produced by photosynthesis, and competes with CO2 as the substrate for the
primary CO2-assimilating enzyme in algae RuBisCO when present at high concentrations.
Conversely, low concentrations of O2 in darkness can lead to dangerously low respiration
rates, and potentially to algal death. Monitoring DO is thus important, and especially so in
stagnant (non-aerated) systems Moreover, for wastewater treatment it is of importance for
aerobic treatment, especially during darkness.
3.2.10 BOD- biochemical oxygen demand and 2.11. COD - chemical oxygen demand
Often algal cultures may be contaminated with bacteria which grow and consume the DOC
released during algal growth. Measuring BOD and COD provides a characterization of the
status of the culture in this regard. Here we consider BOD and COD of the dissolved fraction;
biomass itself contributes to oxygen debt on its decay.
Typically oxygen debt is measured in assays over 5 days; this is signified by BOD5.
BOD5 and COD are important parameters for wastewater treatment monitoring, as these
parameters are included in the discharge norms.
3.2.11 Iron
Iron is an important trace metal for normal growth and functioning of photosynthesis and
respiration in algae. Because oxidized forms of Fe precipitate out of solution, Fe-limitation
can occur unless sufficient chelating agents (as EDTA, citrate or humic acids) are present.
3.3 GROWTH PARAMETERS
3.3.1 Biomass Weight (ash free dry weight, dry weight, total solid substances, volatile solid substances)
Biomass may be analyzed by gravimetric approaches to determine dry weight (DW), ash free
dry weight (AFDW), total suspended solids (TSS), and volatile suspended solids (VSS).

12
An algal culture contains not only the particulate algal biomass but also variable amounts of
extracellular organic material, dissolved salts, and precipitates. In consequence there is
scope for significant variation between samples and results from different methodologies
depending on the organism being used, the growth medium (especially with respect to
salinity), and the exact method.
In essence, cells are collected by filtration or by centrifugation and rinsed with distilled water
before they are dried on a pre-weighed and ashed support (glass-fibre filter or reagent tube)
to constant weight. The rinse stage may be problematic if the cells are susceptible to the
osmotic shock caused by re-suspension in distilled water. In this case the organic material of
the biomass can be removed by combustion at 500°C, and the support reweighed to
determine the contribution made by the inorganic material. The difference between the DW
and the ashes that remain on the support after this treatment gives the AFDW.
If it is known that cells are surrounded by significant amounts of inorganic precipitates, which
remain on a filter or in a pellet together with cells. The preferred expression to use is total
solid substance (TSS) for the mass remaining after removal of water and dissolved
substances by filtration or centrifugation and subsequent drying process. As with AFDW, the
(major part of) biomass of TSS is determined from the mass difference before and after
combustion at 500°C.
The combusted organic material is referred to as volatile suspended solids (VSS) (APHA et
al., 2005). The loss of ignition is not confined to organic matter, it includes losses due to
decomposition or volatilization of some mineral salts (APHA et al., 2005). A more complete
characterisation of organic matter can be made by such tests as TOC and COD (APHA et
al., 2005).
3.3.2 Absorbance (optical density, OD)
The easiest and most rapid approach to the measurement of algal biomass is determination
of the absorbance of light in diluted cell suspensions; this yields the optical density (OD). For
this it is recommended to measure absorbance at 750mn, as this avoids wavelengths
attributed to photosynthetic pigments (from 480 to 668nm). This method is not suitable when
using media which is it highly colored, such as that containing a high concentration of
anaerobic digestate.
3.3.3 Cell count and biovolume
Cell counting gives a ready estimate of the growth of the microalgal population. Biovolume is
a function of the volume of the individual cell and the total cell count. Typically, biovolume

13
correlates well with biomass. However, cells change in size during growth, doubling and
halving with the cell cycle, often decreasing with light and N-limitation, but often becoming
larger with P-limitation.
As the relationship between linear size (e.g., cell diameter) and volume is cubic, significant
changes in total biovolume can go unnoticed unless efforts are taken to specifically measure
cell size. Instruments such as the Beckman Coulter Counter report both particle counts and
volume with high accuracy. However, it should be noted that particle counts may not equate
simply to cell count if cells clump together or extraneous particles are present (unlikely
perhaps in mass microalgal culture).
3.3.4 Chlorophyll fluorescence and photosynthetic efficiency
Chlorophyll (Chl) is often used in field and laboratory work as a surrogate for algal biomass.
Measurement may be as extracted Chl (see section 4 (4.4)) or as in vivo Chl (i.e., within the
living cell). The in vivo signal varies with nutrient status (doubling per unit Chl with N-
exhaustion) and per unit of real biomass (biomass determined as weight, protein, carbon) it
also varies with photoacclimation (cells under high light levels having less Chl than those
grown under low light). In reality then, Chl is not a particularly robust measure of biomass
(Kruskopf & Flynn 2006). Photosystem efficiency requires specialist equipment but has the
scope to report the health of the photosystems within the microalgae.
3.4 CELLULAR COMPOSITION
Regular sampling with subsequent detailed chemical analysis provides information on the
physiological status of the cells, as well as the potential commercial value of the crop. Care
must be taken to always measure at the same time (e.g., after sunrise) for reproducible
results.
3.4.1 Proteins
Protein is a fundamental component of cells, and an important commercial product
(especially for feeds). There are two basic approaches. One uses a colorimetric assay in
which the concentration of certain key amino acids of proteins is measured. The protein
content calculated according to standards (assuming the standards are representative of
algal protein in amino acid content). The other approach makes the assumption that most N
in the cell is protein and that each g of protein contains 6.28 g of N (Safi et al., 2013). The
latter approach is analogous to that based upon Kjeldahl digestion of cellular-N to

14
ammonia/ammonium-N (Safi et al., 2013). In reality, about 75% of cell-N is protein, and the
remainder is nucleic acids (DNA, RNA) (Geider & LaRoche 2002).
3.4.2 Carbohydrates
Next to proteins, carbohydrates form a significant component of algal biomass. The assay is
again colorimetric, requiring a spectrophotometer (DuBois et al. 1956). As polymeric
carbohydrates (starch, glycogen) from the dynamic energy storage of the photosynthetic cell,
the cellular concentration exhibits a regular daily variation.
3.4.3 Lipids
Lipids also form a significant component of algal biomass, and one that has attracted
increasing interest for biodiesel and feed production.
Total lipid is determined gravimetrically following extraction; detailed analysis is far more
complex using separation technology such as Gas Chromatography or Liquid
Chromatography linked to detection methods such as mass spectrometry.
3.4.4 Chlorophyll a
Extracted (in vitro) Chlorophyll a (Chl a), is often used as a surrogate for algal biomass (but
see comment under 3.4. Chlorophyll fluorescence and photosynthetic efficiency), and may
be readily measured using a fluorometer. The in vitro analysis is more precise, but cannot be
undertaken in real time, as may the in vivo analysis. More detailed analysis is undertaken
using a spectrophotometer; with high performance liquid chromatography (HPLC) giving
highly detailed results.
3.4.5 Carotenoids
Carotenoids are involved in light harvesting and stabilizing the structure and functioning of
photosynthetic complexes. In general terms, while bulk Chl correlates broadly with cellular-N,
bulk carotenoids correlate with cellular-C. Analysis is either by spectrophotometry (bulk
carotenoid), or in detail (and together with chlorophylls) by HPLC.
3.4.6 Elemental Content
Cells contain C, N and P as their major elements; these are obtained from the media and
hence one may expect to be able to equate the appearance of these elements in cells to
their disappearance from the growth medium.
Cellular C, N and P can be estimated in a well characterised system by reference to the cell
biovolume (assuming the relationship between biovolume and C is known; it is typically

15
around 200g C per L of biovolume), and to the remaining external nutrient concentrations
(assuming the balance has all been transferred into biomass, which is often not the case,
especially when working with wastewater and/or at high pH).
C and N are measured together in an elemental analyser, which is an expensive procedure.
Cellular-P is first oxidised to convert cell-P to phosphate and thence measured by
colorimetric methods with a spectrophotometer; the method is relatively cheap but somewhat
cumbersome.
The ratio of C:N and of C:P are important indicators of the physiological status (health) of
cells, and of their value as feeds in aquaculture. Excess C is deposited as lipid and/or
carbohydrate. The relationship between C:N and growth rate is linear, while that for C:P and
growth is curvi-linear (Flynn, 2008).
3.4.7 Fatty acids
The fatty acid content is important for specific aspects of commercial production related to
biofuels and nutritional supplements. A detailed analysis of fatty acids is usually undertaken
after conversion to methyl esters (FAMEs). This is a complex and expensive procedure,
making use of a gas chromatograph (GC-FID), or an GC-MS and without prior separation of
lipids (by TLC) it is not possible to determine whether the FAMEs are from free fatty acids,
polar membrane lipids or non-polar triacylglycerides (TAGs, which is what industry are
mainly interested in) (Davey et al. 2014; Scott et al. 2010).
3.4.8 Heavy metals
Knowledge of the heavy metal content is especially important where microalgae are grown
on waste nutrient streams where contamination is suspected. Analysis is non-trivial, requiring
specialist equipment such as ICP. Also when algal biomass is used as fertilizer for plant
growth, measurement of heavy metal/micronutrient/macronutrient content is of importance.
3.5 BIOMASS VALORISATION: BIOGAS
In case of production of biogas via anaerobic digestion of microalgal biomass, the primary
gas of interest here is methane (CH4). This gas is typically then combusted to generate
onsite electrical power and thermal energy to partially offset the costs of wastewater
treatment and biomass handling. The biochemical methane potential (BMP) is typically
determined in batch reactor tests. The produced biogas can then be analysed by a gas

16
chromatograph (GC). Special care needs to be taken when biogas samples are stored, to
avoid gas sample contamination and/or dissolving of biogas compounds in the biogas
container liquid.
© EnAlgae, 2015
17
4 REFERENCES APHA, AWWA, WEF, 2005. Standard methods for the examination of water and wastewater, in:
APHA (Ed.), 21nd edition. ed, USA,Washington DC.
Chen, C.Y., Durbin, E.G., 1994. Effects of pH on the growth and carbon uptake of marine phytoplankton MEPS 109, 83-94.
Cho, S., Park, S., Seon, J., Yu, J., Lee, T., 2013. Evaluation of thermal, ultrasonic and alkali pretreatments on mixed-microalgal biomass to enhance anaerobic methane production. Bioresource Technology 143, 330-336.
Davey MP, Duong GH, Tomsett E, Litvinenko ACP, Howe CJ, Horst I, Smith AG. 2014. Triacylglyceride production and autophagous responses in Chlamydomonas reinhardtii depend on resource allocation and carbon source. Eukaryotic Cell. 13: 392-400
Dubois, M., Gilles, K.A., Hamilton, J.K., Rebers, P.A., Smith, F., 1956. Colorimetric method for determination of sugars and related substances. Analytical Chemistry 28, 350-356.
Flynn, K.J., 2008. The importance of the form of the quota curve and control of non-limiting nutrient transport in phytoplankton models. Journal of Plankton Research 30, 423-438.
Geider RJ, La Roche J (2002) Redfield revisited: variability of C:N:P in marine microalgae and its biochemical basis. Eur. J. Phycol. 37: 1-17
Goldman, J.C., Azov, Y., Riley, C.B., Dennett, M.R., 1982. The effect of pH in intensive microalgal cultures. I. Biomass regulation. Journal of Experimental Marine Biology and Ecology 57, 1-13.
Juneja, A., Ceballos, R., Murthy, G., 2013. Effects of Environmental Factors and Nutrient Availability on the Biochemical Composition of Algae for Biofuels Production: A Review. Energies 6, 4607.
Kruskopf M, Flynn KJ (2006) Chlorophyll content and fluorescence responses cannot be used to gauge reliably phytoplankton biomass, nutrient status or growth rate. New Phytologist 169; 525-536.
Safi, C., Charton, M., Pignolet, O., Silvestre, F., Vaca-Garcia, C., Pontalier, P.-Y., 2013. Influence of microalgae cell wall characteristics on protein extractability and determination of nitrogen-to-protein conversion factors. Journal of Applied Phycology 25, 523-529.
Scott SA, Davey MP, Dennis JS, Horst I, Howe CJ, Lea-Smith DJ, Smith AG. 2010. Biodiesel from algae: challenges and prospects. Current Opinion in Biotechnology. 21(3):277-86.
Van Den Hende, S., 2014. Microalgal bacterial flocs for wastewater treatment: from concept to pilot scale. Ghent University, Ghent, p. 324.
Van Den Hende, S., Carré, E., Cocaud, E., Beelen, V., Boon, N., Vervaeren, H., 2014. Treatment of industrial wastewaters by microalgal bacterial flocs in sequencing batch reactors. Bioresource Technology 161, 245-254.
Van Den Hende, S., Vervaeren, H., Boon, N., 2012. Flue gas compounds and microalgae: (Bio-)chemical interactions leading to biotechnological opportunities. Biotechnology Advances 30, 1405-1424.
Zhila, N., Kalacheva, G., Volova, T., 2011. Effect of salinity on the biochemical composition of the alga Botryococcus braunii Kütz IPPAS H-252. Journal of Applied Phycology 23, 47-52.

18
SOP: 1.1.b, 1.2.b
Analysis of temperature and pH of water samples Sofie Van Den Hendeb
bDepartment of Industrial Biological Sciences (former Howest University College), Faculty of Bioscience
Engineering, Ghent University, Campus Kortrijk, Karel de Goedelaan 5, 8500 Kortrijk, Belgium
PURPOSE
This procedure is used to determine the pH and temperature of water samples using a hand meter
with a gel-filled pH probe with a built-in temperature sensor.
PRINCIPLE
What? The pH is defined as the negative logarithm of the hydrogen ion concentration
pH = -log [H+]
where: [H+] is the hydronium ion concentration (in molL-1.)
The pH is thus a measure of the degree of acidity or alkalinity of a solution (Hach Lange, 2010).
Principle (Kohlman, 2003) The general mathematical description of electrode behavior is described by the 19th century German
chemist, Hermann Walther Nernst (1864 – 1941). He introduced the Nernst equation in 1889, expressed
as:
where:
E = total potential (in millivolts) between two electrodes
E0 = standard potential of the ion
R = universal gas constant (in Joules mol-1 Kelvin-1)
T = absolute temperature (in Kelvin)
n = charge of the ion
F = Faraday constant (in Coulombs mol-1)
ai = activity of the ion
The entire term "2.3RT/nF" is called the Nernst factor, or slope factor. This term provides the amount
of change in total potential for every ten-fold change in ion concentration.
For hydrogen ion activity, where n = 1, the Nernst factor is 59.16 mV for every ten-fold change in
activity at 25°C. This means that for every pH unit change, the total potential will change 59.16 mV.

19
The following general equation may be stated for any temperature:
E = E0 + (1.98 x 10⁻⁴) TK pH
However, the Nernst factor will change when temperature changes (T is not constant). At 25°C the
slope of the pH electrode is 59.16 mV/pH unit. At 0°C the slope value is approximately 54 mV/pH, and at
100°C the slope value is approximately 74 mV/pH. The millivolt output of the glass pH electrode will
change with temperature in accordance with the Nernst equation. As the temperature increases, so does
the millivolt output. Specifically, the slope of the electrode is what changes.
The change in electrode output versus temperature is linear which can be compensated in the pH
meter. The linear function for temperature vs. pH change can be expressed as: 0.003 pH error/pH unit/°C
The Measuring Electrode (Kohlman, 2003) The galvanic voltage output produced by a measuring electrode will depend on the ionic activity of
the species of ions for which the electrode was designed to measure. In the case of pH electrodes, it is
the hydrogen ion activity. Based upon the Nernst equation, at 25°C, the output of a pH measuring
electrode is equal to 59.16 mV per pH unit. At 7.00 pH, which is the isopotential point for a perfect
electrode, the output is 0 mV. As the solution pH increases (less acidic), the mV potential becomes more
negative.
Conversely, as the solution pH decreases (more acidic), the mV potential becomes more positive.
The glass measuring electrode has been adopted as the measuring element for most pH sensors in
use today. The measurement is predicated on the principal that a hydrated gel layer forms between the
outer surface of the glass and the aqueous solution being measured (Figure 8).
The internal wire element of the measuring electrode has a potential, E3, with respect to the internal
fill solution (Fig. 1). Another potential, E2, exists between the internal fill solution and the inside surface of
the glass.
Depending on the pH of the solution being measured, hydrogen ions will migrate into or out of the gel
layer. In an alkaline solution, hydrogen ions migrate out of the gel layer and a negative charge is
developed on the outer gel layer.
Because the internal fill solution of the electrode is at a constant pH value, the internal potential
remains constant. Therefore, the potential that is measured across the glass membrane is the result of
the difference between the inner and outer electrical charge.

20
Figure 1. Ion migration between aqueous solution and pH sensitive glass
Probe The here described procedure is for the determination of pH in water samples using a handheld
meter. The PHC101 series probe is a non-refillable, gel-filled combination pH probe with a built-in
temperature sensor (Fig. 2.).
Figure. 2. Overview of a pH probe (Hach Lange, 2010)
1 shroud (rugged model) 6 locking ring (rugged model) 2 probe storage cap 7 rugged probe (5, 10, 15 or 30 meter cable) 3 probe soaker bottle 8 standard probe (1 or 3 meter cable) 4 glass bulb and temperature sensor 9 probe storage cap or soaker bottle holder 5 reference junctions and protective tape

21
REQUIREMENTS: EQUIPMENT AND MATERIALS
x gel-filled pH probe with built-in temperature sensor (IntelliCAL TM PHC101) and meter
(HQ 30d flexi) with display (Hach Lange, Germany)
x paper tissue
x plastic vessel for the KCl storage solution
x glass bottle of 100 mL
x waterproof marker
x wastewater sample recipient: beaker of minimum 100 mL or centrifuge tube of 50 mL
REAGENTS x for the pH storage solution of 3 M KCl : 100 mL deionized water and 22.3654 g KCl
x 5 mL of calibration buffer solution of pH 4.00 in a plastic centrifuge tube of 15 mL
x 5 mL of calibration buffer solution of pH 7.00 in a plastic centrifuge tube of 15 mL
x 5 mL of calibration buffer solution of pH 9.00 in a plastic centrifuge tube of 15 mL
x deionized water for probe rinsing (min. 50 mL)
x wastewater sample
HAZARDS AND PRECAUTIONARY STATEMENTS
x Not applicable.
PROCEDURE
STORAGE SOLUTION PREPARATION x Weigh 22.3654 g KCl and pour in a glass bottle.
x Dissolve with deionized water until 50 mL total volume. Shake well until all is dissolved.
x Add deionized water until 100 mL total volume in the glass bottle.
x Use this solution as probe storage solution. Store this solution in a plastic recipient and
label the recipient with a waterproof marker.
x Over time some crystalline precipitates may form around the neck of the bottle, but this
is normal.
PROBE CALIBRATION x The probe should be calibrated following this procedure (Hach Lange, 2010): Table 1

22
Table 1. Sample measurement steps (Hach Lange, 2010)
1. Connect the probe to the meter.
Make sure that the cable locking nut is securely connected to the meter.
Turn on the meter.
2. Push Calibrate.
The display shows the buffers that are necessary for calibration.
3. Prepare the fresh buffers in separate beakers or appropriate containers.
4. Rinse the probe with deionized water to remove KCl storage solution from the
probe.
Blot dry with a lint-free cloth.
5. Put the probe in the pH buffer solution and stir gently.
Make sure that the reference junctions are completely submerged. Shake the
probe from side to side in the standard solution to refresh the reference
junction.
6. Push Read.
Stir gently.
The display will show "Stabilizing" and a progress bar as the probe stabilizes
in the standard. The display shows the buffer that has just been read and
shows the temperature corrected pH value when the reading is stable.
7. Repeat steps 4 - 6 until the minimum number of calibration points specified in
the current method have been collected.
8. Push Done to view the calibration summary.
The display will not show Done until the minimum number of calibration points
have been collected.
9. Push Store to accept the calibration and go back to measurement mode.

23
SAMPLE MEASUREMENT The sample should be measured in 7 steps (Fig. 3).
Figure 3 Sample pH measurement procedure (HACH Lange 2010)
CALCULATION OF RESULTS
x The temperature is measured and displayed on the meter display in °C with an accuracy
of ± 0.3 °C.
x The pH value is unitless and is displayed on the meter display. No conversion is needed.
x Results are expressed as pH units, between 0 and 14 with higher being more alkaline,
which can be converted to the hydrogen ion concentration (H+) with the following
formula:
pH = -log[H+]
[H+] = 10-pH
QUALITY CONTROL
x The pH of buffer solutions can be measured as a quality control.

24
x The pH value should be in the range of the pH of the buffer solutions. If above 10, other
buffer solutions should be used (such as of pH 12.45).
x Minimum sample depth should be 20 mm.
ERRORS, CALIBRATION AND INTERFERENCES
x For water with a high pH, calibration buffer solutions of pH 10.00 or higher (12.45)
should be used.
x Operating temperature should be between 0 and 50 °C.
x Temperature has an effect on pH, therefore either measure pH at room temperature or
record the temperature at which the pH was measured. At a temperature of 25°C the
pH will have the smallest error. The meter will compensate for pH changes with
temperature.
x The electrode will age with time and the response of the probe may be erratic or slow.
Proper care and conditioning of the electrode can extend the life.
x Always use fresh buffer solution, as the pH of certain buffer solutions (such as of pH 9.0)
can change after using is a couple of times due to dissolution of CO2 in the buffer.
x Clean the probe when:
- Drifting/inaccurate readings occur as a result of contamination on the glass sensor
or the probe being left dry for extended periods of time.
- Slow stabilization time occurs as a result of contamination on the glass sensor.
- A calibration error occurs as a result of contamination on the glass sensor
x Cleaning for general contaminants:
1. Rinse the probe with deionized water and blot dry with a lint-free cloth.
2. Soak the glass bulb for 12 to 16 hours in Hach Electrode Cleaning Solution.
3. Rinse or soak the probe for 1 minute in deionized water.
4. Soak the probe in pH 4 buffer for up to 20 minutes, then rinse with deionized water.
5. Blot dry with a lint-free cloth.
x Cleaning for fats, grease and oils:
1. Soak the glass bulb in a warm detergent solution for up to 2 hours.
2. Rinse or soak the probe for 1 minute in deionized water.
3. Soak the probe in pH 4 buffer for up to 20 minutes, then rinse with deionized water.
4. Blot dry with a lint-free cloth.
x Short-term and long-term storage:
For the best probe performance, do not let the reference junction dry out.
1. Rinse the probe with deionized water. Dry the probe with a lint-free cloth.

25
2. Fill the probe storage cap or soaker bottle half full with Hach Electrode Storage
Solution
or 3 M potassium chloride (KCl) solution.
3. If a standard probe, put the soaker bottle on the probe and tighten the soaker bottle
cap.
4. Make sure that the solution in the storage cap or soaker bottle completely covers the
glass bulb and reference junction.
WASTE STREAM AND PROPER DISPOSAL
x Used buffer solutions and measured wastewater samples should be disposed in the
appropriate waste vessels.
REFERENCES
x Kohlmann F.J. (2003). What is pH, and how is it measured? A technical handbook for
industry. Hach Company, USA, 24 p.
x Hach Lange (2010). User Manual for gel-filled pH probe: model PHC10101, PHC10103,
PHC10105, PHC10115 or PHC10130. Doc022.53.80023. Hach Lange, Germany, 14 p.

26
SOP: 1.1.e, 1.2.e Temperature and pH– automated recording Anneliese Ernste
eHochschule für Technik und Wirtschaft des Saarlandes, Göbenstraße 40, 66117 Saarbrücken, Germany
PURPOSE
Through solar radiation and photosynthesis temperature and pH exhibit a strong diurnal
variability in natural algal habitats and in artificial growth systems such as PBR. Algae
are well adapted to these natural fluctuations, but performance and productivity can be
increased if these fluctuations can be kept within limits that do not impair cellular
activities.
PRINCIPLE
The here employed combination electrodes (3 in 1) comprise a pH measuring electrode,
a reference electrode (Ag/AgCl | HCl (1×10⁻⁷ mol L-1) | glass || probed solution |
reference electrode) and a platinum threat (Pt100 or Pt1000) for temperature
measurement.
pH electrodes are made of a doped glass membrane that is sensitive to hydrated
protons (hydronium ions). The reference electrode delivers a constant potential by being
submersed in HCl of 1×10⁻⁷ mol L-1. The resulting potential difference is measured in mV
and converted into hydronium ion concentration respectively pH (pH =10log[H3O+]) using
the Nernst equation.
REQUIREMENTS Equipment and materials
� Glass pH probe with Pt1000 temperature sensor (3 in 1) (Jumo, Germany)
� Transmitter/switching device for pH/Redox voltage and temperature (signal
converter) (Jumo ecoTRANS pH 03, Germany)
� Beakers (various)
� Tissue paper
Reagents:
Calibration Buffer 7.0
Calibration Buffer 10.0
Electrode storage solution, 3 M KCl

27
22.4 g Potassium chloride in 100 mL solution with deionised water
HAZARDS AND PRECAUTIONARY STATEMENTS N/A
PROCEDURE Samples
1. Rinse a recently calibrated pH probe with deionized water.
2. Rinse with 70% ethanol; shake off droplets (do not touch).
3. Sterilize probe-holder with 70% ethanol
4. Insert and fix pH probe in the holder (The tip of the electrode should point in a
turbulent position of the reactor. In the IGV-PBR probe holders were arranged in a
bypass tube that can be separated from the main liquid stream by closing valves at
each end. This allows to clean and calibrate probes without interrupting the cultivation
of the algae.)
5. Connect pH probe with the corresponding transmitter located in a water proof (IP
code 65) switch cabinet in the greenhouse.
6. Connected the transmitter with a PLC.
Calibration
To calibrate the electrode press the program button (P) on the transmitter and select the
program CALIB. Follow the instruction for a 2-point calibration.
x Submerse the cleaned electrode tip in the calibration buffer
x Write down the temperature of calibration buffer and infer from the listed
temperature dependence of pH the value to be shown by the calibration buffer.
x Wait until reading is stable before continuing the calibration.
x Note performance of electrode (deviations since last calibration, slope) in
protocol.
CALCULATION OF RESULTS Results are expressed as pH units and as temperature in °C, recorded every 4 sec.
Calculate 10-min averages before uploading to the EnAlgae data portal.
QUALITY CONTROL pH probes should be calibrated on a regular basis.

28
If the pH electrode is immersed in the culture volume directly, the electrode should be
cleaned and calibrated whenever the water level is low enough to remove the electrode
safely.
ERRORS AND INTERFERENCES Depending on culture conditions, electrodes will show fouling with time. The biofilm can
slow down the response of the electrode and even modify the pH reading. Therefore, the
electrode tip must be cleaned regularly. Cleaning should be combined with re-
calibration every 7 to 14 days.
The electrode will age with time and the response of the probe may become slow or
even erratic. Proper care and conditioning of the electrode can extend the life.
WASTE STREAM AND PROPER DISPOSAL
Samples and buffers can be disposed of.

29
SOP: 1.1.f Automated measurement of culture temperature Chris de Visserf, Wim van Dijkf
fWageningen UR including Plant Research International (WUR), Lelystad, The Netherlands
PURPOSE This SOP describes the automated registration of the temperature of the algae culture.
PRINCIPLE Continuous temperature measurements are made by using a Pt1000 temperature sensor
(Figure 1). The sensor measures the resistance in a platinum wire. Subsequently, the
temperature can be derived by using the positive linear relationship between the temperature of
the platinum wire and the resistance.
Generally, the platinum wire is wound on a frame of insulation material (in a coil). The coil is
protected by a stainless steel sheath or a protective tube.
REQUIREMENTS Equipment and materials:
x Sensor (Pt1000)
x Signal converter and microcontroller (Tendris, Netherlands)
x Datalogger equipment (Tendris, Netherlands)
HAZARDS AND PRECAUTIONARY STATEMENTS Not applicable
PROCEDURE The temperature probe is installed in a plastic tube that hangs in the water and that is
connected to an iron frame above the pond (Figure 1). The resistance of the platinum wire is
measured continuously and transformed to a signal (giving the temperature value) in the signal-
converter mounted nearby. The converted signal is processed by a microcontroller that sends
the recorded data to an online database.

30
Figure 1.Temperature probe (left) and continuous measuring of the temperature in the algae ponds (right, arrow denotes the plastic tube in which the temperature probe is inserted).
CALCULATION OF RESULTS Recorded temperature values are directly used. No additional calculations are done.
QUALITY CONTROL Check regularly for deviations of the signal and cross reference to the data from the pH meter
and manual measurements (with a handheld temperature meter).
ERRORS, CALIBRATION AND INTERFERENCES Generally, Pt1000 probes are characterized by a high accuracy and stability when installation is
done correctly (preferably a 3-4 lead wire connection is applied to prevent that the resistance of

31
the lead wires is added to the resistance of the platinum probe; using armature material with
high thermal conductivity, applying adequate insulation at the connection point between the
probe and the armature).
For an accurate measurement the temperature meter has to be calibrated regularly. This is
done by putting the probe in solutions with known temperature (e.g. measured with accurate
well calibrated handheld meters). If the measured values do not agree calibration is necessary.
Calibration is done by applying the specific meter calibration procedure.
WASTE STREAM AND PROPER DISPOSAL In the case of broken meters contact the supplier for information on applicable disposal
methods.
REFERENCES http://en.wikipedia.org/wiki/Resistance_thermometer

32
SOP: 1.2.a, 1.3.a pH and Salinity – WTW Handheld probe Craig Pooleya, Alla Silkinaa
aAlgal Research, Swansea University, Singleton Park, Swansea, SA28PP, UK
PURPOSE This procedure is to analyse seawater and freshwater for pH and salinity.
PRINCIPLE This procedure is for the determination of pH using a combined WTW handheld meter
and is a measure of the degree of acidity or alkalinity of a solution. The pH electrodes
are constructed from a special composition glass which senses the hydrogen ion
concentration. The alkali metal ions of the glass and the hydrogen ions in solution
undergo an ion exchange reaction generating a potential difference. In a combination pH
electrode there are two electrodes in one body. One portion is called the measuring
electrode, the other the reference electrode. The potential that is generated at the
junction site of the measuring portion is due to the free hydrogen ions present in
solution. The potential of the reference portion is produced by the internal element in
contact with the reference fill solution. This potential is always constant. In summary the
measuring electrode delivers a varying voltage and the reference electrode delivers a
constant voltage to the meter (Omega, n.d.).
The procedure for the determination of salinity uses the combined WTW handheld meter
and is a measure of the electrical conductance of a water sample related to the
dissolved salt concentration. The higher the dissolved salt concentration the greater
electrical charge can be conducted and the higher the electrical conductivity and salinity.
The main dissolved salts are sodium, magnesium, potassium, calcium, chloride,
sulphate and bicarbonate. These form ions with positive and negative charges
(Fondriest Environmental Inc., 2014).
REQUIREMENTS 1. Equipment and materials
� WTW pH/Cond 340i handheld meter
� SenTix 41 pH electrode

33
� TetraCon 325 conductivity cell
� Deionised water
� pH buffers – 7 and 10 (WTW)
� Salinity standard, 0.01 mol/L KCl
� Beakers (various)
� Tissue paper
2. Reagents
Technical Buffer 7.0
Technical Buffer 10.0
Storage solution, 3 M KCl 22.3654 g (+ 0.01 g) Potassium chloride
Into 100 ml deionised water
Shake well to mix and store in plastic bottle. Over time some crystalline
precipitate may form around the neck of the bottle, this is normal.
HAZARDS AND PRECAUTIONARY STATEMENTS N/A
PROCEDURE 1. Preparation of stock solutions
N/A
2. Preparation of standards and samples
Collect samples in a beaker or a bottle.
3. Measurement of standards and samples
Turn on pH meter using the symbol. Remove the storage solution cap from the end of
the electrode and place carefully to the side. Rinse the outside of the electrode with
deionised water and dry gently with a piece of tissue paper.
Rinse the electrode with the pH 7.0 buffer solution, and then immerse in the solution. If the
reading is correct then proceed with sample analysis, however if the reading is not correct
for the appropriate temperature then perform a calibration.

34
To calibrate the electrode press the CAL button. It will request the pH 7.0 buffer (Ct1),
when the electrode has been immersed press the RUN/ENTER button. The meter will wait
until the reading has stabilised and then it will request the pH 10.0 buffer (Ct2). Remove
the electrode from the pH 7.0 buffer and rinse with deionised water, pat gently with a piece
of tissue paper.
Rinse the electrode with the pH 10.0 buffer and then immerse, ensure that the top of the pH
10.0 buffer is covered to prevent CO2 escape. Press the RUN/ENTER button. The meter
will again wait until the reading has stabilised. Once it is complete the screen will display a
mV reading, press ENTER twice to return to the main screen.
The instrument evaluates the calibration and displays a probe symbol to the right hand
side, see Table 1. If E3 is displayed then the probe has possibly been exhausted, re-try the
calibration and if E3 is still displayed then the probe needs to be replaced. If the symbol
flashes then the probe has not been calibrated in 7 days.
Table 1 Key for pH and salinity probe calibration (WTW, 2004)
To measure a sample rinses the probe with deionised water and then gently pat dry with a
piece of tissue paper. Rinse the probe with some of the sample and then immerse. Gently
stir the sample. Wait until the reading has stabilised and then record the pH reading and the
temperature. It is best to measure pH at room temperature.

35
Remove the probe from the sample and rinse with deionised water, gently pat dry with a
tissue. Repeat the procedure for any additional samples, and when analysis is complete
rinse the probe and return to the conditioning solution. If the solution is low then top up with
3 M KCl.
To switch to the salinity measurement press the ‘M’ button, ensure that the TetraCon 325
probe is attached to the meter. This will show the salinity (Sal) and the temperature. Rinse
the probe with deionised water and gently pat dry. Rinse with a little of the sample and then
immerse in the sample, gently moving the probe until the reading stabilises. Record the
reading. Rinse the probe with deionised water and pat dry, the probe does not need to be
immersed in any solution.
Turn off the meter when finished.
CALCULATION OF RESULTS Results are expressed as pH units, between 0 and 14 with higher being more alkaline,
which can be converted to the hydrogen ion concentration (H+) with following formula.
pH = -log[H+]
[H+] = 10 –pH
Salinity is unitless, although has been previously reported as ppt (parts per thousand or g
per kilogram g/kg). Conductivity units are µS/cm (micro siemens per centimetre).
QUALITY CONTROL pH buffers sourced from WTW are used to determine the performance of the pH probe.
ERRORS AND INTERFERENCES Temperature has an effect on pH, therefore either measure pH at room temperature or
record the temperature at which the pH was measured. At a temperature of 25°C the pH
will have the smallest error (Omega, n.d.). The meter will compensate for pH changes with
temperature. The electrode will age with time and the response of the probe may be erratic
or slow. Proper care and conditioning of the electrode can extend the life. Temperature
also has an effect on conductivity and salinity, which is compensated for by the probe
sensor.

36
WASTE STREAM AND PROPER DISPOSAL Samples and buffers can be disposed of.
REFERENCES Fondriest Environmental Inc. (2014) Fundamentals of Environmental Measurements –
Conductivity, Salinity and Total Dissolved Solids [online] Available at
http://www.fondriest.com/environmental-measurements/parameters/water-
quality/conductivity-salinity-tds/#cond6
Omega (n.d.) pH Field and Lab Instruments, pH measurement and electrode basics [online]
Available at
http://www.omega.com/toc_asp/frameset.html?book=Green&file=pHbasics_REF
WTW (2004) pH/Cond 340i Operating manual

37
SOP: 1.2.c pH of Algal Cultures Matthew P. Daveyc
cDepartment of Plant Sciences, University of Cambridge, Downing Street, Cambridge CB2 3EA, UK
PURPOSE
Ion probe protocol for assessing pH
PRINCIPLE
The calibrated ion probe is directly placed into a liquid media solution and the pH is read off
the unit display
REQUIREMENTS pH meter to measure Ph (Denver Instrument Company)
HAZARDS AND PRECAUTIONARY STATEMENTS
Hazards include use of hydrochloric acid and sodium hydroxide solutions. Wear appropriate
PPE. PROCEDURE
Figure 1.pH measurement using an ion probe, showing probe and buffer solution
1. The pH probe is kept immersed in a buffer solution (Figure 1), remove the probe from
the solution and position it over an empty plastic beaker
2. Wash the probe with D.I water over a plastic beaker
Buffer solution
Probe

38
3. Immerse the electrode in the solution you wish to measure
4. Check the display is on pH and not mV
5. To adjust the pH of the solution add 1M NaOH to increase the alkalinity (reading higher
than 7) or add HCl to increase the acidity (reading lower than 7)
6. Use the glass pipettes with the red teats, only add a very small droplet at a time and wait
for the meter to react.
7. Remove probe from solution when the desired pH has been achieved
8. Clean off the probe as stated in step 2 and 3
9. Place probe back into the buffer solution
10. Make sure the buffer solution covers the probe, if it does not add more buffer solution
CALCULATION OF RESULTS
None
QUALITY CONTROL Each sample point should have two technical repeats (ie, samples from the same flask) that
should concur. Depending on the experimental design at least three replicate flasks should
be used per assay. If problems occur with the probe then the sample can be read again.
ERRORS AND INTERFERENCES Every sample should be duplicated, or triplicated where sample volume permits, to counter
variation in readings and possible human errors (e.g. in pipetting). Depending on the
experimental design at least three replicate flasks should be used per assay.
WASTE STREAM AND PROPER DISPOSAL
All chemicals need to be disposed of according to local regulations and protocols. Waste
chemicals generally need to be placed into a waste chemical bottle for collection and proper
disposal.

39
SOP 1.2.f Automated measurement of culture pH
Chris de Visserf, Wim van Dijkf
fWageningen UR including Plant Research International (WUR), Lelystad, The Netherlands
PURPOSE
This SOP describes the automated registration of the acidity (pH) of the algae culture. The
measured pH is used to regulate the flue gas addition in the algae pond (see procedure).
PRINCIPLE Continuous pH measurements are made by using a pH probe that contains two electrodes
(Figure 1): a glass or pH electrode and a reference electrode. Both electrodes are hollow
bulbs containing a silver wire and are filled with potassium chloride. The glass wall of the pH
electrode is made up of specific glass that interacts with the hydrogen ions in the solution
resulting in an electric potential depending on the concentration of the hydrogen ions. The
glass wall of the reference electrode is made up of material that does not interact with
hydrogen ions. The difference in electric potential between the two electrodes causes an
electric current that is measured by a voltage meter. The electric signal is converted in the
pH-value using the following formulae:
pH = (Eglass – Eref) * (F/(2.303*R*T)) Where:
Eglass = electric potential of glass/pH electrode (V)
Eref = electric potential reference electrode (V)
F = Faraday constant
R = gas constant
T = temperature (K) REQUIREMENTS Equipment and materials:
x Sensor (Amphel General Purpose pH Electrode)
http://www.hannainst.com/Usa/prods2.cfm?id=017013&ProdCode=HI%206291005 x Signal converter and microcontroller (Tendris, Netherlands)

40
x Datalogger equipment (Tendris, Netherlands)
x pH buffers (required for calibration) HAZARDS AND PRECAUTIONARY STATEMENTS
Not applicable PROCEDURE
The pH-probe is installed in a plastic tube that hangs in the water and that is connected to
an iron frame above the pond (Figure 1). The probe continuously generates a small current
(measured by a voltage meter) that is transformed to a signal (giving the pH value) in the
signal-converter mounted nearby. The converted signal is processed by a microcontroller
that sends the recorded data to an online database. In addition to the registration of data, the pH level is used for process control; the
microcontroller will make process adjustments according the pH level and programmed
settings. Above a given pH setpoint a flue gas valve will open which allows the addition of
flue gas into the airstream from the continuously operating blower. Dissolving carbon
dioxide will decrease the pH of the algae culture; when the pH drops below the setpoint
level, the flue gas valve closes.

41
Figure 1. pH probe (left) and continuously measuring of pH in the algae ponds (right, arrow denotes the plastic tube in which the pH probe is inserted).
CALCULATION OF RESULTS Recorded pH values are directly used. No additional calculations are done.
QUALITY CONTROL Check regularly for deviations of the signal and cross reference to the data from the
temperature meter (also PT100 based data) and manual measurements (with a handheld
pH meter).
ERRORS, CALIBRATION AND INTERFERENCES Generally, pH probes are sensitive equipment. Freezing or drying out of the pH probes will
cause damage. In addition, the signal from the probe is a weak electric current that is easily

42
influenced or disrupted. The signal cable from the probe to the signal converter should
therefore best kept separate from other electric cables. The probe will also pick up voltages
through the algae culture, this will influence the signal and in time damage the pH probe. Fouling (or contamination) of the pH probe may cause incorrect readings. Therefore the pH
probe, and specifically the pH bulb, should be kept free of contaminations. Never clean the
bulb with brushes or abrasive materials, instead stir vigorously in water or use a squirt bottle
for cleaning. For more persistent contaminations a 5-10% hydrochloric acid (HCl) can be
used, a few minutes of soaking removes many contaminations For an accurate measurement the pH meter has to be calibrated regularly. This is done by
putting the probe in pH buffers (solutions with known pH: 4, 7 and 11). If the measured
values do not agree with the buffer values calibration is necessary. Calibration is done by
applying the specific meter calibration procedure.
WASTE STREAM AND PROPER DISPOSAL In the case of broken meters contact the supplier for information on applicable disposal
methods.
REFERENCES Hanna instruments, Amphel General Purpose pH Electrode, HI 6291005 http://www.hannainst.com/Usa/prods2.cfm?id=017013&ProdCode=HI%206291005

43
SOP: 1.3.c Measuring salinity (sodium & chloride) and nitrate Matthew P. Daveyc
cDepartment of Plant Sciences, University of Cambridge, Downing Street, Cambridge CB2 3EA, UK
PURPOSE
Ion probe protocol for qualitatively assessing the concentration of nitrate, chloride and
sodium in seawater and other growth media (such as f/2) that contains high concentrations
of sodium chloride (NaCl) that interferes with nitrate measurements.
PRINCIPLE
The calibrated ion probe is directly placed into a liquid media solution and the concentration
of nitrate, chloride and sodium is read off the unit display
REQUIREMENTS Equipment, materials and reagents
http://www.aptisens.com/multi-ion-kit/
x 1 x multi-ion probe kit with seawater calibration solutions and conditioning solutions
(Figure 1)
x 250 mL clean glass beakers for waste and sample dilution
x Lab de-ionised (DI) water
Figure 1. Multi-Ion robe kit with seawater calibration and conditioning solutions

44
HAZARDS AND PRECAUTIONARY STATEMENTS
x Wear a laboratory coat, eye protection (goggles/safety glasses) and gloves (nitrile)
when handling biological material in the lab.
x For clean-up information please consult the MSDS information or your local health
and safety person.
PROCEDURE http://www.aptisens.com/multi-ion-kit/
Multi-ion meter and probe for seawater solutions
WARNING – THIS PROBE DOES NOT TEMPERATURE COMPENSTATE SO MAKE SURE THAT ALL SOLUTIONS AND SAMPLES ARE AT THE SAME LABORATORY TEMPERATURE
1. Place probe in conditioning solution for 1 hour if it has been stored for a while or 5
minutes for everyday use
2. Rinse the probe in D.I. water and dry the outer body of the probe when the conditioning
process is complete
3. Calibration should be conducted prior to every 5th sample (or more if readings are very
variable)
4. Press the OK/menu button on the meter
5. Select the ‘Calibrate’ option and press the OK/menu button on the meter
6. Follow the on-screen wizard to complete the calibration
7. Once the calibration is complete you will be shown the calibration results on the screen.
Only proceed to take a sample if the r2 value is greater than 0.98
8. Between solutions dry the probe
9. Rinse in D.I. water and dry the outer body of the probe when the calibration process is
complete
10. To take a reading place the probe in the liquid sample and press the OK/menu button
11. Follow the on-screen instructions. After 60 seconds, the readings will be displayed (Do
not leave the probe in the sample for longer than 2 minutes)
12. Press the save button to save the readings
13. Press the OK/menu button and go to Memory/Recall to view previously saved readings.
14. When finished with the probe rinse the probe with D.I. water, replace cap and store in
case (temperature under 50 °C)

45
CALCULATION OF RESULTS Values are read as PPM (THIS IS THE SAME AS mg L-1). If values are above or below the
calibration range then dilute the samples with DI water and remeasure. The values are then
multiplied by the dilution factor.
QUALITY CONTROL Each sample point should have two technical repeats (ie, samples from the same flask) that
should concur. Depending on the experimental design at least three replicate flasks should
be used per assay. If problems occur with the probe then the sample can be read again.
ERRORS AND INTERFERENCES Every sample should be duplicated or triplicated where sample volume permits, to counter
variation in readings and possible human errors (e.g. in pipetting). Depending on the
experimental design at least three replicate flasks should be used per assay.
WASTE STREAM AND PROPER DISPOSAL
All chemicals need to be disposed of according to local regulations and protocols. Waste
chemicals generally need to be placed into a waste chemical bottle for collection and proper
disposal.
REFERENCES
http://www.aptisens.com/multi-ion-kit/
OTHER POINTS Please read the probe manual carefully and make sure that the calibration system is for
seawater.

46
SOP: 1.4.a Photosynthetically active photon flux density (PAR-PFD) Craig Pooleya, Naomi Ginnevera, Alla Silkinaa aAlgal Research, Swansea University, Singleton Park, Swansea, SA28PP, UK
PURPOSE Photosynthetically active radiation (PAR) is a region of the electromagnetic spectrum
ranging from 400-700nm. This is the spectrum range which is measured by a light meter.
Light is measured as moles of quanta (photons) per unit time per surface area or µmol s-1
m-2 (Biggs et al., 1971).
This protocol describes how light levels can be measured by a PAR quantum sensor.
PRINCIPLE The ULM-500 PAR quantum sensor by Walz (Figure 1) is a cosign corrected light meter,
meaning it calculates the light levels arriving from every direction rather than a uni-
directional flat light sensor.
The photons hitting the photodiode are transformed into an electrical signal. This
photodiode uses cut-off filters to prevent wavelengths of light not between 400-700nm from
being detected and recorded.
Figure 1. ULM light meter (B) with spherical measuring head (A)
The light sensor is calibrated before purchase but can be re-calibrated using the guidelines
provided by the manufacturer. The Walz water PAM can be used to perform this calibration as it
outputs a standardized light level.
A B

47
REQUIREMENTS
EQUIPMENT AND MATERIALS - Logging Walz ULM-500 light meter
- Spherical measuring head
HAZARDS AND PRECAUTIONARY STATEMENTS x Be careful when placing the PAR sensor on the biofence ™.
PROCEDURE 1. The PAR logging sensor was fitted using cable ties to one of the 600L biofences ™.
Light was logged every 5 minutes to try and minimize the effect of brief light flecks
caused by fast moving clouds.
2. After each trial the data can be downloaded using the Walz Wincontrol 3 software, then
it can be transferred to excel.
CALCULATION OF RESULTS x The results do not need to be converted or re-calculated and can be recorded directly
from the logger or stored in an excel spreadsheet.
QUALITY CONTROL x Unusual data should be checked with near local met-office light readings.
x The PAR values measured in the UK are usually below 2500 µmol PAR photons s-1 m-2
during day, and zero in dark.
x Recalibration is recommended every 2 years which can be done by the manufacturer of
without assistance.
ERRORS AND INTERFERENCES x Clean the sensor surface on a regular basis using water and a non-abrasive tissue.
x Sensitivity: Typically 5 μA to 10 μA per 1000 μmol s-1 m-2.
x Operating Temperature: -30°C to 55°C.
x Relative Humidity: 0% to 100%.
x Detector: High stability spherical photovoltaic detector.
x Sensor Housing: Weatherproof plastic case with stainless steel measuring head shaft.

48
WASTE STREAM AND PROPER DISPOSAL x There is no waste stream produced during the measurement.
REFERENCES x Biggs, W.W., Edison A.R., Easton J.D., Brown K.W., Maranville J.W., Clegg M.D.,
1971. Photosynthesis light sensor and meter. Ecology 52:125-131.

49
SOP: 1.4.b Photosynthetic photon flux density (PPFD) Sofie Van Den Hendeb
bDepartment of Industrial Biological Sciences (former Howest University College)(, Faculty of Bioscience
Engineering, Ghent University, Campus Kortrijk, Karel de Goedelaan 5, 8500 Kortrijk, Belgium
PURPOSE During photosynthesis, plants use energy in the region of the electromagnetic spectrum
from 400-700 nm. This photosynthetically active radiation (PAR) is typically measured as
photosynthetic photon flux density (PPFD), which has units of quanta (photons) per unit time
per unit surface area (LI-COR, 2014). The unit used is micromoles of quanta per second per
square meter (µmol s-1 m-2) (Biggs et al., 1971).
This protocol describes how PPFD can be measured by a PAR quantum sensor.
PRINCIPLE The PAR quantum sensor of LI-COR is used to measure the PPFD in µmol photons s-1 m-2
(Fig. 1).
Light intensity is transformed to an electric signal by a photodiode. Colored glass filters are
used to tailor the silicon photodiode response to the desired quantum response. An interference
filter provides a sharp cutoff at 700 nm (LI-COR, 2014). The signal from the photodiode is then
transformed to a standardized signal by an adapter.
Fig. 1. Light sensor with mounting and levelling fixture (LI-COR, 2014)

50
The light sensor calibration is obtained at the manufacturer LI-COR using a standard
light source calibrated against a National Institute of Standards and Technology (NIST) lamp.
The photon flux density from the standardized lamp is known in terms of micromoles s-1 m-2
where one micromole = 6.022 x 10¹⁷ photons. The uncertainty of the calibration is ± 5%.
The following procedure is used to calculate the quantum flux output from the lamp. The
lamp flux density in watts m-2, in an increment at a wavelength can be expressed as:
where E is the spectral irradiance of the lamp at a certain wavelength λ.
The number of photons s-1 m-2 in ∆ λ :
where h is Plank's constant, and c is the velocity of light. This can be summed over the interval
of 400-700 nanometers (nm) to give:
The result is adjusted to μmol s-1 m-2 by dividing by 6.022 1017.
REQUIREMENTS EQUIPMENT AND MATERIALS
- Waterproof PAR light sensor LI 190 SA (LI-COR, USA)
- Millivolt adapter (LI-COR, USA)
- Mounting and leveling fixture (LI-COR, USA)
HAZARDS AND PRECAUTIONARY STATEMENTS
x Be careful when climbing on top of the container to clean the PAR sensor.

51
PROCEDURE The PAR sensor, millivolt adapter and mounting and leveling fixture were mounted on top
of the container of the EnAlgae MaB-floc reactor set-up during the construction of the MaB-floc
pilot reactor set-up.
The data can be read from the visualization screen on the EnAlgae MaB-floc pilot laptop.
CALCULATION OF RESULTS
x Calculation of results is not needed, as the values are presented directly in µmol PAR
photons s-1 m-2.
QUALITY CONTROL
x As a quality control, the values read should regularly be checked by comparing the
values read by means of the manual Li-COR probe (Li-250A; LI-COR, USA) present at
Ghent University, Campus Kortrijk. Check regularly for deviations of the signal, if
deviations occur check for proper functioning of the visualization system (contact
CATAEL) and accumulation of dirt on the sensor surface.
x The PPFD values measured in Belgium should be below 2500 µmol PAR photons s-1 m-2
during day, and zero in dark.
x Recalibration is recommended every 2 years, recalibration is done by the manufacturer.
ERRORS AND INTERFERENCES
x Clean the sensor surface on a regular basis (monthly) using water and a non-abrasive
tissue. LI-COR has found that vinegar can also be used to remove hard water deposits
from the diffusor element, if necessary.
x Absolute Calibration: ± 5% traceable to the National Institute of Standards and
Technology (NIST).
x Sensitivity: Typically 5 μA to 10 μA per 1000 μmol s-1 m-2.
x Linearity: Maximum deviation of 1% up to 10,000 μmol s-1 m-2.
x Stability: Typically < ± 2% change over a 1 year period.
x Response Time: 10 μs.
x Temperature Dependence: 0.15% per °C maximum.
x Azimuth: < ± 1% error over 360° at 45° elevation.
x Tilt: No error induced from orientation.
x Operating Temperature: -40°C to 65°C.
52
x Relative Humidity: 0% to 100%.
x Detector: High stability silicon photovoltaic detector (blue enhanced).
x Sensor Housing: Weatherproof anodized aluminum case with acrylic diffuser and
stainless steel hardware.
WASTE STREAM AND PROPER DISPOSAL
x There is no waste stream produced during the measurement.
REFERENCES
x LI-COR, 2014. LI-COR terrestrial radiation sensors – Instruction manual.
ftp://ftp.licor.com/perm/env/Radiation_Sensors/Manual/TerrestrialSensors_Manual.pdf
(3/11/2014).
x Biggs, W.W., Edison A.R., Easton J.D., Brown K.W., Maranville J.W., Clegg M.D., 1971.
Photosynthesis light sensor and meter. Ecology 52:125-131.

53
SOP: 1.4.e Global Solar Radiation (GSR) Anneliese Ernste
eHochschule für Technik und Wirtschaft des Saarlandes, Göbenstraße 40, 66117 Saarbrücken, Germany
PURPOSE Solar energy reaching the surface of earth and the upper layers of water is the driving force of
live and weather on earth. The global solar radiation is recorded on thousands of weather
stations around the world and, hence, the basis for estimates of potential algal productivity in
NWE.
PRINCIPLE The LI-200 Pyranometer is designed for field measurement of global solar radiation in
agricultural, meteorological, and solar energy studies. Current output, which is directly
proportional to solar radiation, is calibrated against an Eppley Precision Spectral Pyranometer
(PSP) under natural daylight conditions in units of watts per square meter (W m-2). The spectral
response of the LI-200SA does not include the entire solar spectrum, so it must be used in the
same lighting conditions as those under which it was calibrated, e.g. unobstructed direct
exposure to solar radiation.
TOTA
Figure 1. LI-200 Pyranometer spectral response illustrated along with the energy distribution in the solar
spectrum
Figure 2. (Eppley Precision Spectral Pyranometer
Calibration: Calibrated against an Eppley Precision Spectral Pyranometer (PSP) (Figure 2) under natural daylight conditions. Typical error under these conditions is ± 5%. Sensitivity: Typically 90 μA per 1000 W m-2. Linearity: Maximum deviation of 1% up to

54
(PSP). 3000 W m-2. Stability: < ± 2% change over a one-year period. Response Time: 10 μs. Temperature Dependence: 0.15% per °C maximum. Cosine Correction: Cosine corrected up to 80° angle of incidence. Azimuth: < ± 1% error over 360° at 45° elevation. Tilt: No error induced from orientation. Operating Temperature: -40 to 65°C. Relative Humidity: 0 to 100%. Detector: High stability silicon photovoltaic detector (blue enhanced). Sensor Housing: Weatherproof anodized aluminum case with acrylic diffuser and stainless steel hardware. Size: 2.38 cm Dia. ×� 2.54 cm H (0.94” × �1.0”). Weight: 28 g (1 oz). Cable Length: 3.0 m (10 ft). Cable Length: 3.0 m (10 ft).
EQUIPMENT AND MATERIALS
LICOR Pyranometer Li-200SZ, Mounting and Leveling Fixture. The sensor delivers a
microamp current output that is converted by a Universal Current Loop converter (LICOR) to
deliver a calibrated output to a PLC.
HAZARDS AND PRECAUTIONARY STATEMENTS Follow instructions and manual.
PROCEDURE 5 The pyranometer sensor was placed at the northern edge of the roof of the greenhouse (60
cm above the roof) and connected with the converter in the switch cabinet of the
greenhouse.
6 The converter was then connected to the Siemens SPC.
A JFC controller was programmed to automatically transfer data (measuring time, GSR) from
the SPC to a local PC and to a back-up system.

55
CALCULATION OF RESULTS Results are recorded in W/m2 every 4 seconds. New files are generated daily. Calculate 10-min
averages before uploading to the EnAlgae data portal.
QUALITY CONTROL
x Recalibration by the manufacturer is recommended every 2 years. It is possible between
March and September.
WASTE STREAM AND PROPER DISPOSAL
x There is no waste stream produced during the measurement.
REFERENCES Flowers, E.C. 1978. Comparison of solar radiation sensors from various manufacturers. In:
1978 annual report from NOAA to the DOE.

56
SOP: 1.4.e Photosynthetic Active Radiation (PAR) Anneliese Ernste
eHochschule für Technik und Wirtschaft des Saarlandes, Göbenstraße 40, 66117 Saarbrücken, Germany
PURPOSE In photosynthesis, algae and plants use energy of the electromagnetic spectrum between 400-
700 nm. This range of wavelengths is scarcely absorbed by the gaseous atmosphere of the
earth and by water. However, it is easily scattered by small droplets forming clouds and by dust.
Hence, solar radiation depends not only on the geographic location but also on prevailing
weather conditions. As availability of energy is the driving force of live, algal productivity in NWE
is directly coupled with the availability of PAR
PRINCIPLE The photosynthetic active radiation (PAR) is measured as photosynthetic photon flux density
(PPFD) in the range between 400 and 700 nm (Figure). It has the unit moles of quanta
(photons) per unit time per surface area or µmol s-1 m-2.
Table 1. Spectral response and LI-190 Specification
Figure 1. Typical spectral response of LI‑COR Quantum Sensors vs. Wavelength and the Ideal Quantum Response (equal response to all photons in the 400-700 nm waveband).
Figure 2. LI-COR LI-190 Quantum sensor
LI-190 Specifications (Figure 2) Absolute Calibration: ± 5% traceable to the National Institute of Standards and Technology (NIST). Sensitivity: Typical 5 μA per 1000 μmol s-1 m-2. Linearity: Maximum deviation of 1% up to 10,000 μmol s-1 m-2. Stability: Typically < ± 2% change over a one-year period.

57
Response Time: 10 μs. Temperature Dependence: 0.15% per °C maximum. Cosine Correction: Cosine corrected up to 80° angle of incidence. Azimuth: < ± 1% error over 360° at 45° elevation. Tilt: No error induced from orientation. Operating Temperature: -40°C to 65°C. Relative Humidity: 0% to 100%. Detector: High stability silicon photovoltaic detector (blue enhanced). Sensor Housing: Weatherproof anodized aluminum case withacrylic diffuser and stainless steel hardware. Size: 2.38 cm Dia. 2.54 cm H (0.94” 1.0”). Weight: 28 g (1 oz). Cable Length: 3.0 m (10 ft).
EQUIPMENT AND MATERIALS
LICOR Quantum Sensor Li-190SZ, Mounting and Leveling Fixture. The sensor delivers a
microamp current output that is converted by a Universal Current Loop converter (LICOR) to
deliver a calibrated output.
HAZARDS AND PRECAUTIONARY STATEMENTS Follow instructions and manual.
PROCEDURE
The PAR sensor was placed on the switch cabinet (IP code 65) in the greenhouse that housed
the signal converter. The sensor was connected to the data converter and to the SPC
(Siemens).
A JFK Controller was programmed to retrieve data (time and PAR reading) to a local PC and a
back-up system.
CALCULATION OF RESULTS
Results are recorded in µmoles s-1 m-2 every 4 seconds. New files are generated daily.
Calculate 10-min averages before uploading to the EnAlgae data portal.
QUALITY CONTROL
Recalibration by the manufacturer is recommended every 2 years.

58
WASTE STREAM AND PROPER DISPOSAL
x There is no waste stream produced during the measurement.
REFERENCES
x Biggs, W.W., Edison A.R., Easton J.D., Brown K.W., Maranville J.W., Clegg M.D.,
1971. Photosynthesis light sensor and meter. Ecology 52:125-131.

59
SOP: 2.1.a Ammonium/Ammonia - segmented flow analyser (SFA) Rhiannon Wilcoxa, Alla Silkinaa
aAlgal Research, Swansea University, Singleton Park, Swansea, SA28PP, UK
PURPOSE This procedure is to analyse seawater and freshwater for ammonia, comprising NH3 and
NH4.
PRINCIPLE Analysis is performed on a segmented flow analyser (SFA), model AutoAnalyser 3 (AA3)
from Seal Analytical. This analytical system in general consists of a chemistry module run by a
random access XY-2 Sampler, a high precision peristaltic pump, chemistry module trays where
actual reaction takes place and dual beam high resolution digital colorimeter which operates
within a wavelength range of 340 – 900 nm.
The pump transmits samples, reagents and air at defined flow rates through flexible
pump tubes. Individual sample segments are separated by the insertion of air or nitrogen
bubbles. Following the glass mixing coils in the chemistry tray is a heating bath, after which the
sample is passed into the colorimeter holding a krypton lamp and the coloured filter for the
appropriate method wavelength. The concentration of the sample is determined
colourmetrically, as each sample passes through the flowcell the maximum intensity of the
colour is measured. The absorbance is then compared to that of known concentration
calibration standards and the sample result calculated. Drift samples (the 2nd highest calibration
standard) are analysed from which the software determines if the baseline has changed from
the beginning of the run. Based on these the software adjusts sample readings to account for
baseline drift. The automated procedure for the determination of ammonia uses the Berthelot reaction,
in which a blue-green coloured complex is formed that is measured at 660 nm. A complexing
agent is used to prevent the precipitation of calcium and magnesium hydroxides. Sodium
nitroprusside is used to enhance the sensitivity (Bran+Luebbe™, 2005).
REQUIREMENTS Equipment and materials

60
� Seal Analytical AA3 Segmented Flow Analyser (Pumps, XY Sampler,
colorimeters, chemistry module MT19)
� AACE 6.03 software on PC
� 660 nm filter
� Autosampler 5 ml cups (polystyrene)
� Deionised water
� Volumetric flasks (various)
� Pipettes and tips (5 ml and 1 ml)
� Plastic Pasteur pipettes (1 ml and 3 ml)
� Analytical balance and weigh boats
� Desiccator
� Stirrer
� Fume cupboard
� Beakers (various)
� Measuring cylinders (various)
� 250 ml and 100 ml bottles, PE
� Tube racks
� Dilution containers, 7 ml Bijou or 30 ml Universal
� Reagent bottles, glass and plastic
� 12-14 ml calibrant tubes (x6)
Reagents Complexing Reagent 7.5 g Ethylenediamine tetra-acetic acid disodium salt (EDTA)
60 g Tri-sodium citrate dihydrate
0.25 g Sodium nitroprusside
Into 500 ml deionised water
Add 1.5 ml Brij-35
Store in an amber bottle. Stable for two weeks. Tri-sodium citrate takes a long time to
dissolve and will need to be put on a stirrer.
Salicylate 75 g Sodium salicylate
Into 250 ml deionised water
Store in an amber bottle. Stable for two weeks.

61
Dichloroisocyanuric acid (DCI) 3.5 g Sodium hydroxide
0.2 g Dichloroisocyanuric acid sodium salt dihydrate
Into 100 ml deionised water
Dissolve the sodium hydroxide completely before adding the dichloroisocyanuric acid
sodium salt dihydrate. Prepare fresh daily. Store in a glass bottle.
HAZARDS AND PRECAUTIONARY STATEMENTS
x Sodium nitroprusside is toxic and flammable, therefore it is stored in the poison’s cabinet.
Take great care when dealing with the chemical and record all amounts used in the
appropriate file.
x Sodium hydroxide is corrosive. DCI is dangerous to the environment so spillages should
be strictly contained and properly disposed of.
x All other chemicals are irritants and potentially harmful therefore proper PPE and risk
assessment should be adhered to. Consult the MSDS for precautionary measures.
PROCEDURE Preparation of stock solutions
Standard Stock Solution 1000 µmol/L 0.0661 g (+ 0.0001 g) Ammonium sulphate (Dried at 105°C for 2 hours, cool in a
desiccator)
Into 1000 ml deionised water (freshwater)
Or Artificial Seawater
35 g Sodium chloride
0.2 g Sodium hydrogen carbonate
Into 1000 ml deionised water
Quality Control Stock Solution 1000 µmol/L 0.0535 g (+ 0.0001 g) Ammonium chloride (Dried at 105°C for 2 hours, cool in a
desiccator)
Into 1000 ml deionised water
Or

62
Artificial Seawater
35 g Sodium chloride
0.2 g Sodium hydrogen carbonate
Into 1000 ml deionised water
Both Stock Solutions are stable for 3 months, store in the fridge.
Preparation of standards and samples
Pipette calibration standards and analytical quality controls (AQC’s) into deionised water
for freshwater analysis, or into artificial seawater for seawater analysis (see 4.1). Use
the following amounts;
Standard concentration µmol/L
Volumetric flask volume (mL)
Volume of 1000 µmol L-1 stock solution to pipette
0 N/A 0
5 100 0.5 250 1.25
10 100 1.0 250 2.5
20 100 2.0 250 5.0
30 100 3.0 250 7.5
40 100 4.0 250 10.0
60 100 6.0 250 15.0
Table 1 Preparation of working calibration standards and AQC’s
Pick a mid range value for the analytical quality control (AQC), i.e. the 0-60 µmolL-1
range requires 6 calibrants including a zero blank, so 30 is mid range and not normally
one of the calibrants used. Calibration standards are stored in plastic bottles, and are
stable for 1 week if stored in the fridge.
Dilute the samples to within the range using deionised water, targeting a concentration
between 20 – 50 µmol L-1. If the concentration of samples is unknown run them direct
without dilution and then when the preliminary results are charted add on a sample
dilution to the end of the run.

63
Measurement of standards and samples
1. Turn on computer and autosampler
2. Connect pump platen, turn on pump and put red toggle switch to Run.
3. Turn on colorimeter and install 660 nm filter
4. Load AACE 6.03 software from computer desktop
5. Click on Charting, click Change and find ‘Ammonia-Phosphate2’ on list. Select to highlight
and then press OK. Can be run as a multi-test with phosphate, if phosphate is not needed
then the additional chart can be closed after the baseline has been found.
6. Shake reagents to mix
7. When deionised water has been pumping for 15-20 minutes then insert labelled reagent
probes into reagent bottles (Channel 1 Reagent 1 – Complexing reagent; Channel 1
Reagent 2 - Salicylate; Channel 1 Reagent 3 - DCI).
8. Ensure deionised water containers are topped up.
9. Along the top of the main screen click ‘Set Up’, and then ‘Analysis’. Click onto an existing
tray and click ‘Copy run’. Give this a new reference name and check that the calibrants are
correct (see section 4.2).
10. Click on Tray protocol tab and amend list to reflect current sample references. Insert an
AQC at the end of each row (every 11 samples), and also a Null and Drift. Print a copy for
reference when loading samples. Click OK when done.
11. Once reagents have been pumping for 20-30 minutes, in the charting window labelled Ch3-
1- Ammonia right click and ‘Set base’
12. Fill a rinsed 14 ml calibrant tube with the top standard (i.e. 60 µmol L-1) and place in
position 1 on the rack. Double click on ‘XY Sampler’ and click ‘sample’. Time for 2 minutes
and then click ‘wash’. Click ‘cancel’ to close.
13. Wait 6-7 minutes for the peak to come through on the charting window, then when it starts
to stabilise (level off) right click and ‘Set gain’. This should be between 75-85%
absorbance. The gain should be around 170-180.
14. Fill the other rinsed calibrant tubes with fresh calibration standards and load into the rack in
high to low order, double check baseline is at 5% and click ‘Set base’ if necessary. Click
‘Run’, find the new tray name and double click. Press OK.
15. Load the samples according to the printed tray layout, rinsing the 5 ml cups with a little
volume before filling.
16. The calibration coefficient will be displayed before the sample peaks are shown, check that
this 0.9990 or better.

64
17. When run is finished a message will appear. Click OK. Switch reagent probes into
deionised water to rinse for 30 minutes – 1 hour. If running other analyses then use 1 N
HCl to wash out for 15 minutes. Turn off the colorimeter and the autosampler. When
finished rinsing put the red toggle switch on the pump to Stop. Disconnect the pump platen
and turn off the pump. Top up deionised water containers. Dispose of waste down the sink
and dispose of remaining samples as appropriate. Throw away used autosampler cups
and rinse calibrant tubes with deionised water. Rinse any pipette tips used for dilutions.
Rinse and throw away any dilution containers used.
18. Click ‘Retrieve’, and ‘View Chart’. Check all peaks are correct and then click on ‘Report’.
Print the results.
19. Export the results to Excel by clicking on ‘File’ along the top, then ‘Export to’, ‘ASCII file’,
find the correct run name and double click, click ‘Export’ and ‘Save’, then close. The Excel
file will be available in the ‘Data’ folder on the desktop. When finished turn off computer.
CALCULATION OF RESULTS Results are expressed as µmol L-1 as N. If dilution has been used then multiply by the
appropriate factor. The AACE software accounts for baseline drift during the run. The
range is 0 – 60 µmol L-1, however this can be lowered to 0 – 10 µmol L-1. The detection
limit of the method specified by the manufacturer is 0.05 µmol L-1.
QUALITY CONTROL AQC’s are run at the mid-range point of the calibration. They are usually analysed 1 per
11 samples, and the results are plotted on Quality Control Charts within Excel. If any
QC’s exceed + 10% and a cause cannot be determined then a repeat analysis will be
required. If a number of QC’s exceed + 5%, then prepare an additional AQC solution to
check. The QC stock is sourced and prepared separately to the standard stock (see
section 4.1). Sample spiking with a known concentration can also be used as a quality
control.
ERRORS AND INTERFERENCES The matrix of the samples and calibration standards can affect the chemistry, therefore
as close a match as possible should be made between matrices. For freshwater
samples use deionised water standards, but for seawater samples use Artificial
Seawater (see section 4.1). Interferences can occur if other chemistries are run on the
same manifold, all attempts should be made to completely wash out chemicals before

65
analysis, possibly using 1 N HCl. Coloured samples or particulates can interfere with the
light path and therefore read higher than actual.
Ammonia samples can be contaminated by touch and from the air. Gloves should be
worn to prevent skin contamination with reagents and samples, and the air quality
should be maintained.
Pipettes should be used to dilute samples into deionised water. Samples should be
defrosted in the fridge 12 hours before analysis if possible, and should only remain
frozen for as little time as possible before analysis.
WASTE STREAM AND PROPER DISPOSAL All waste can be flushed down the sink with copious amounts of tap water. The sink log
should also be completed for any chemicals disposed of. Large amounts of DCI reagent
should be separated for disposal over a longer period.
Dispose of used autosampler cups and dilution containers.
REFERENCES Bran+Luebbe™ (2005), AutoAnalyser Application, Method No: G-171-96 Rev 10.

66
SOP: 2.1 b. Analysis of dissolved ammonium (NH4
+) Bryan Lefevereb, Veerle Beelenb, Alexandra Lefoulonb, Sofie Van Den Hendeb
bDepartment of Industrial Biological Sciences (former Howest University College)(, Faculty of Bioscience
Engineering, Ghent University, Campus Kortrijk, Karel de Goedelaan 5, 8500 Kortrijk, Belgium
PURPOSE This procedure is used to determine the concentration of dissolved ammonium (NH4
+) in
water and wastewater, more specifically up to concentrations of 10 mg N-NH4+ L-1.
PRINCIPLE Samples are filtered to remove suspended solids. The concentration of ammonium (NH4
+) in
filtered samples can be determined with the addition of Nessler reagent and potassium sodium
tartrate solution. The addition of the Nessler reagent will produce a yellow to brown colour that
is dependent on the concentration of NH4+. By monitoring the colour change from the Nessler
reagent, the concentration of ammonia can be determined by spectrophotometry at the
wavelength of 400-425 nm. The potassium sodium tartrate solution improves the color quality
and reduces the susceptibility to interferences with calcium and magnesium.
REQUIREMENTS a. EQUIPMENT AND MATERIALS
i. Preparation of the Nessler reagent - a 100 mL graduated flask
- a 500 mL graduated flask
- an analytical balance
- a magnetic agitator
- a magnetic stirrer
- a Schott bottle of 500 mL
- a box (to store minimum 1 L of ice)
ii. Preparation of the potassium sodium tartrate solution (1.5M in H20) C4 H4 KNaO6 .4H2O (Rochelle salt solution) - a 1 L graduated flask
- an analytical balance

67
- a magnetic agitator
- a magnetic stirrer
- a Schott bottle of 1000 mL
iii. Preparation of the standards - a 1000 mL graduated flask
- an analytical balance
- a magnetic agitator
- a magnetic stirrer
- a Schott bottle of 1000 mL
- 5 plastic centrifugation tubes of 10 mL (VWR, Belgium) for standard dilutions
iv. Calibration curve - a micropipette of 1-5 mL and tips
- a spectrophometer (425 nm; Hach Lange DR 2800, Belgium)
- 11 spectrophotometer glass tubes of 10 mL (cleaned Hach Lange glass tubes of
used test kits can be used)
v. Preparation of the sample and analysis - a syringe filter with 0.2 µm pore size (Chromafil RC-20/25, Germany) and syringe
- a glass beaker of 100 mL
- 1 centrifuge tube of 10 mL (VWR, Belgium)
- a micropipette of 1-5 mL and tips
- 1 spectrophotometer glass tube of 10 mL for each sample REAGENTS
1. Preparation of the Nessler reagent - 70 g potassium iodide (KI) (Ghent University, Campus Kortrijk, ref 1850)
- 100 g mercury (II) iodide (HgI2) (Ghent University, Campus Kortrijk, ref 30530)
- deionized water
- 1 L of ice
2. Preparation of the 1.5 M potassium sodium tartrate solution (Rochelle salt solution)
- 350 g KNa-tartrate (C4 H4 KNaO6 .4H2O )(Ghent University, Campus Kortrijk, ref
1860)
- deionized water
3. Preparation of the standard - 3.819 g ammonium chloride(NH4Cl) (Ghent University, Campus Kortrijk, ref 20225)
- deionized water

68
HAZARDS AND PRECAUTIONARY STATEMENTS x Always operate in a ventilated fume hood.
x Always wear a laboratory coat, eye protection and laboratory gloves.
x Act carefully and take appropriate measure concerning the hazardous reagents.
Reagent Hazard statements Precautionary statements
Potassium iodide (KI)
- Harmful if swallowed. - Causes skin irritation. - Causes serious eye irrition.
- Wash skin thoroughly after handling.
- Do not eat, drink or smoke when using this product.
- Wear protective gloves/ eye protection/ face protection.
- If swallowed: call a Poison Center or doctor/ physician if you feel unwell.
- If on skin: wash with plenty of soap and water.
- If in eyes: rinse cautiously with water for several minutes. Remove contact lenses, if present and easy to do. Continue rinsing.
- If skin irritation occurs: get medical advice/ attention.
- If eye irritation persists: get medical advice/ attention.
- Take off contaminated clothing and wash before reuse.
Ammonium chloride (NH4Cl)
- Harmful if swallowed. - Causes serious eye
irritation. - Toxic to aquatic life with
long lasting effects.
- Wash skin thoroughly after handling.
- Do not eat, drink or smoke when using this product.
- Avoid release to the environment.
- Wear protective gloves/ eye protection/ face protection.
- If swallowed: call a Poison Center or doctor/ physician if you feel unwell.
- If in eyes: rinse cautiously with water for several minutes. Remove contact lenses, if present and easy to do. Continue rinsing.
- If eye irritation persists: get

69
medical advice/ attention. - Collect spillage.
Mecury (II) iodide (HgI2)
- Fatal if swallowedor in contat with skin.
- Fatal if inhaled. - May cause damage to
organs through prolonged or repeated exposure.
- Very toxic to aquatic life with long lasting effects.
- Do not breathe dust/ fume/ gas/ mist/ vapours/ spray.
- Wash hands thoroughly after handling.
- Avoid release to the environment.
- Wear protective gloves/ protective clothing;.
- Wear respiratory protection. - If on skin: gently wash with
plenty of soap and water. - Immediately call a Poison
Center or doctor/ physician. - Dispose of contents/
container to an approved waste disposal plant.
Potassium sodium tartrate
(C4H4KNaO6)
- No hazardous substance or mixture.
- If inhaled: move person into fresh air.
- In case of skin contact: wash off with soap and plenty of water.
- In case of eye contact: Fush eyes with water as a precution.
- If swallowed: never give anything by mouth to an unconscious person. Rinse mouth with water.
PROCEDURE a. PREPARATION OF STANDARDS AND STOCK SOLUTION
i. Preparation of Nessler reagent 1. Weight precisely 70.00 g KI and 100.00 g HgI2.
2. Add the 70.00 g of KI and 100.00 g of HgI2 in a graduated flask of 100 mL.
3. Add deionized water until around 50 mL.
4. Stir until all is dissolved.
5. Add deionized water until exactly 100 mL.
6. Weight precisely 160.00 g sodium hydroxide (NaOH).
7. Add the 160.00 g NaOH in a graduated flask of 500 mL.
8. Add deionized water until around 300 mL.
9. Stir until all is dissolved.
10. Add deionized water until exactly 500 mL.

70
11. Store in the fridge
12. Put the bottle with NaOH solution in a box with minimum 1 L of ice.
13. Slowly add the KI and HgI2 solution in the cooled NaOH solution.
14. Stir until all is well mixed.
15. Add deionized water until 1000 mL.
16. Pour the solution in a Schott bottle and label the bottle with “EnAlgae; Nessler
reagent for NH4+; preparation date; until end date”.
17. Store it at 4°C. The solution can be kept 4 months).
18. Use the upper part of the solution, after settling; so never shake this bottle before
using this reagent.
ii. Preparation of the 0.15 M potassium sodium tartrate solution 1. Weight precisely 350.00 g KNa-tartrate(C4 H4 KNaO6.4H2O; Rochelle salt solution).
2. Add the 350.00 g KNa-tartrate in a graduated flask of 1L.
3. Add deionized water until around 500 mL.
4. Stir until all is dissolved.
5. Add deionized water until exactly 1000 mL.
6. Pour in a Schott bottle and label the bottle with “EnAlgae; KNa-tartarate for NH4+;
preparation date; until end date”. This solution can be stored at 4°C for 4 months.
iii. Preparation of the standard 1. Dry NH4Cl during 2 hours in an oven at 105°C.
2. Weight precisely 3.819 g of NH4Cl.
3. Add the 3.819 g of NH4Cl in a graduated flask of 1000 mL.
4. Add deionized water until around 500 mL.
5. Stir until all is dissolved.
6. Add deionized water until exactly 1000 mL.
7. Pour in a Schott bottle and label the bottle with “EnAlgae; standard 1000 mg N L-1 for
NH4+; preparation date; until end date”.
8. This standard solution has an ammonium concentration of 1000 mg N L-1 and can be
stored for 1 month in the fridge at 4°C.
b. CALIBRATION CURVE 1. Dilute the standard of 1000 mg N L-1 to prepare to a standard solution of 10 mg N L-1.
2. Label centrifuge tubes with the name of the standards (Table 1).
3. Make all needed dilutions from this standard solution (Table 1).

71
4. Put in 11 spectrophotometer glass tubes a certain volume of standard solution and
deionized water according to Table 1.
5. Add 0.1 mL of the KNa-tartrate solution to each glass tube.
6. Add 0.1 mL of Nessler reagent to each glass tube.
7. Stir the solutions in the glass tubes and clean the outer glass walls.
8. Measure the absorbance at 425 nm of the solutions in the tubes.
9. Make the calibration curve in Excel (linear regression).
Table 1: Standard solutions
Standard concentration (mg
N-NH4+ L-1)
Volume of standard solution of 10 mg L-1
(mL)
Volume of deionized water (mL)
Total volume (mL)
0 0 5.0 5 1 0.5 4.5 5 2 1.0 4.0 5 3 1.5 3.5 5 4 2.0 3.0 5 5 2.5 2.5 5 6 3.0 2.0 5 7 3.5 1.5 5 8 4.0 1.0 5 9 4.5 0.5 5
10 5 0 5
c. SAMPLE ANALYSIS i. Sample preparation x The raw sample should be filtered as soon as possible after taking it from the reactor in
order not to change its ammonium concentration.
x Pour around 20 mL of sample in a glass beaker of 100 mL
x Take with a syringe 10 mL of sample, add the syringe filter and pour minimum 3 mL of
sample through the syringe filter in a labelled centrifuge tube.
x This filtered sample can be stored for 2 weeks at 4°C or longer at -18°C.
ii. Analysis - Pipette 5 mL of the sample in a glass tube.
- Pipette 0.1 mL of KNa-tartarate solution in the glass tube.
- Pipette 0.1 mL of Nessler reagent in the glass tube.
- Stir the solution and clean the outer glass wall of the tube.
- Measure the absorbance at 425 nm of the solution in the tube.

72
CALCULATION OF RESULTS d. CALIBRATION CURVE Use the measured ABS425nm values of the blank and standards to make a calibration curve:
measured ABS in function of the ammonium concentration (mg N-NH4+ L-1) (Fig. 1)
Figure 1. Calibration curve for ammonium analysis of samples containing 0-10 mg N L-1
e. SAMPLE ANALYSIS Calculate the NH4
+ concentration of the sample based on the calibration curve (Figure 1).
In the pH range of most natural waters, ammonia nitrogen will exist mainly as NH4+ .
In water, there exist unionised ammonia (NH3) and the ionized ammonium ion (NH4+) .Both
forms are easily converted into the other, with the ratio of ammonia to ammonium largely
depending upon pH, salinity and temperature (Figure 2). Ammonium is predominant when the
pH is below 8.75, and ammonia is predominant when pH is above 9.75 (Molin-Legua et al.,
2006). Total ammonia (TAN) is the sum of ammonium and ammonia concentrations. The
concentration of TAN, NH4+ and NH3 can be calculated based on the analytical result and the
ammonia/ammonium ratio (Fig. 2).

73
Figure 2: The concentration of NH3 and NH4
+ as a function of pH
QUALITY CONTROL Plausibility and methodology control can be performed by analyses of samples with
known concentrations and by spiking and dilution of the samples. ERRORS, CALIBRATION AND INTERFERENCES
x The sample should be analyzed as soon as possible after it has been taken.
x pH of the sample: 4-9.
x The final absorbance is reached after a reaction time of 15 minutes and then remains
constant for a further 15 min.
x A large excess of ammonium can cause result displays within the measuring range. It is
advisable to carry out a plausibility check by making dilutions.An overview of interfering
substances is given in Table 2.
Table 2. Overview of interferences Interfering substance Interference level
(mg L-1) Chloride (Cl-), sulfate (SO4
2-) 1000 Calcium (Ca2+), potassium (K+), sodium (Na+) 500 Mercury (Hg2+), nickel (Ni2+), cobalt (Co2+), copper (Cu2+), zinc (Zn2+), chrominum (Cr6+), iron (Fe3+),nitrate (NO3
-), carbonate (CO3
2-) 50
Iron (Fe2+) 25 Tin (Sn2+) 10 Lead (Pb2+) 5 Silver (Ag+) 2

74
WASTE STREAM AND PROPER DISPOSAL Empty all used vials in the correct liquid waste stream disposal barrel. Rinse the tubes two
more times with demineralized water and dispose the rinsing wastewater in the same way so no
deposits remain at bottom of the vials.
Thoroughly clean the vials and caps with soap and rinse them with demineralized water for
about 10 times to make sure no products remain that can influence readings of the analysis of
ammonium the next time. Finally put the vials (without caps) in a muffle oven at 550°C for about
30 minutes to make sure any remaining product gets oxidized. Put the caps in a drying oven of
105°C to completely dry them.
REFERENCES x APHA, Awwa, WEF, 2005. Standard Methods for the Examination of Water and Wastewater, 21st
ed. American Public Health Association, Washington DC.
x Beelen V., Lefevere B., Van Den Hende S., 2014. Verbal communication.
x Yuren S.H., Pollard A.G., 2006. The determination of nitrogen in agricultural materials by the
nessler reagent. I.-preparation of the reagent. Journal of the Science of Food and Agriculture,
Volume 3.
x Molins-Legue C., Meseguer-Lloret S., Moliner-Martinez Y., Campins-Falco P., 2006. A guide for
selecting the most appropriate method for ammonium determination in water analysis. Trends in
Analytical Chemistry 25, 282-290.
x Sigma-Aldrich, 2014. Mercury (II) iodide. Available on (27/06/2014):
http://www.sigmaaldrich.com/catalog/product/sial/221090?lang=fr®ion=FR.
x Sigma-Aldrich, 2014. Ammonium chloride. Available on (27/06/2014):
http://www.sigmaaldrich.com/catalog/product/aldrich/254134?lang=fr®ion=FR.
x Sigma-Aldrich, 2014. Potassium sodium tartrate solution. Available on (27/06/2014):
http://www.sigmaaldrich.com/catalog/product/sigma/81028?lang=fr®ion=FR.
x Sigma-Aldrich, 2014. Potassium iodide. Available on (27/06/2014):
http://www.sigmaaldrich.com/catalog/product/sigma/60399?lang=fr®ion=FR.
75
SOP: 2.1.e Total Ammonia-N (TAN), NH4-N, manual assay Anneliese Ernste
eHochschule für Technik und Wirtschaft des Saarlandes, Göbenstraße 40, 66117 Saarbrücken,
Germany
PURPOSE Ammonia is excreted by fish in the RAS and immediately oxidized to nitrate by nitrifying
bacteria in the biofilter 1. The function of the biofilter is regularly monitored by manual
measurement of TAN and remains < 1 mg L-1 TAN-N under normal operation conditions.
Ammonia is a good N-source for algae at low concentrations but can uncouple the energy
metabolism by transporting protons through the energetic membranes at concentrations >
10 mg L-1 TAN-N. As concentrations in RAS are far below that ammonia is not regularly
measured in the algal suspensions.
PRINCIPLE An alkaline solution of K2HgI4 is called Nessler's reagent. A mineral stabilizer complexes
hardness in the sample and a polyvinyl alcohol dispersing agent aids the colour formation in
the reaction of Nessler’s reagent with ammonia and certain other amines. A yellow color is
formed proportionally to the ammonia concentration. Test results are measured at 425 nm.
REQUIREMENTS Centrifuge, centrifuge tubes, spectrophotometer, timer, 10-ml sample cells (cuvettes) with
stopper (or use parafilm to close), pipette (10 ml), pipette tips, deionized water or saline
solution as blank and for dilution of samples, chemicals required for Nessler’s reaction.
HAZARDS AND PRECAUTIONARY STATEMENTS Nessler’s reagent contains mercuric iodide. Samples will contain mercury at a concentration
regulated as a hazardous waste.
PROCEDURE a. Sample collection, preservation and storage (once for all nutrients)
1. Collect samples in clean glass or plastic bottles.

76
2. Remove cells of suspension by centrifugation and analyse as soon as possible after
collection.
3. If necessary, preserve supernatants by freezing at -20°C.
b. Measurement
1. Dilute clear supernatant with deionized or saline water to reach measuring range
(0.02 – 2.5 mg L-1 TAN-N).
2. Fill a sample cell (cuvette) with 10 ml of (diluted) sample.
3. Add mineral stabilizer (50 µl for fresh water samples, 400 µl for seawater)
4. Swirl until mixed.
5. Add 50 µl of polyvinyl alcohol.
6. Swirl until evenly distributed.
7. Add 400 µl of Nessler’s reagent.
8. Swirl until mixed.
9. Start timer for a one-minute reaction period.
10. Wipe the prepared sample while waiting.
11. Insert sample in cell holder.
12. Read extinction.
CALCULATION OF RESULTS For calculation of results plot results of calibration inversly (i.e. extension on x-axis
concentration on y- axis) and calculate a linear trend line. Use equation to calculate
concentration.
For final result, multiply with dilution factor.
CALIBRATION AND QUALITY CONTROL Prepare standard solution in deionized water (for example (NH4)2SO4 with 100 mg L-1 TAN-
N), dilute with solution having similar salinity (adjusted to pH=7) as the sample to 2.5 mg L-1
TAN-N and prepare standards at 100%, 85%, 70%, 55%, 40%, 25%, 10%, 0% final
concentrations.
Add reagents and start the timer according to the description above.
Measure extinction at 425 nm. Plot results and add linear trend line.
Determine the reagent blank value for each lot of reagent.
ERRORS AND INTERFERENCES

77
This method is suitable for water and seawater. However the sensitivity of the test is
reduced in seawater. Thus a calibration is required using the same saline solution or
chloride concentration as samples. Iron and sulphide interfere by causing turbidity. Certain
amines may cause greenish or other off colours or turbidity.
WASTE STREAM AND PROPER DISPOSAL Nessler’s Reagent contains mercuric iodide. Samples and blanks will contain mercury at a
concentration regulated as a hazardous waste. Do not pour these solutions down the drain.
Refer to a current MSDS for safe disposal and handling instructions.
REFERENCES Hach Company 2007, 2010, 2012. Printed in the U.S.A.
Wodzinski RS, Labeda DP, Alexander M. Effects of low concentrations of bisulfite-sulfite
and nitrite on microorganisms. Applied and Environmental Microbiology. 1978;35(4):718-
723.
OTHER POINTS Ammonia is substrate for ubiquitous nitrifying bacteria. Therefore, samples should not stand
at room temperature. For later analysis collected supernatants need to be freeze directly
after centrifugation.
Ammoniac is in equilibrium with ammonia. At pH > 7 ammoniac can slowly leave
suspensions.

78
SOP: 2.2.a, 2.3.a Total Oxidised Nitrogen (TON); Nitrate and Nitrite – SFA Rhiannon Wilcoxa, Alla Silkinaa
aAlgal Research, Swansea University, Singleton Park, Swansea, SA28PP, UK PURPOSE This procedure is to analyse seawater and freshwater for total oxidized nitrogen and
nitrite.
PRINCIPLE Analysis is performed on a segmented flow analyser (SFA), model AutoAnalyser 3 (AA3)
from Seal Analytical. This analytical system in general consists of a chemistry module
run by a random access XY-2 Sampler, a high precision peristaltic pump, chemistry
module trays where actual reaction takes place and dual beam high resolution digital
colorimeter which operates within a wavelength range of 340 – 900 nm.
The pump transmits samples, reagents and air at defined flow rates through flexible
pump tubes. Individual sample segments are separated by the insertion of air or
nitrogen bubbles. Following the glass mixing coils in the chemistry tray is a heating
bath, after which the sample is passed into the colorimeter holding a krypton lamp and
the coloured filter for the appropriate method wavelength. The concentration of the
sample is determined colourmetrically, as each sample passes through the flowcell the
maximum intensity of the colour is measured. The absorbance is then compared to that
of known concentration calibration standards and the sample result calculated. Drift
samples (the 2nd highest calibration standard) are analysed from which the software
determines if the baseline has changed from the beginning of the run. Based on these
the software adjusts sample readings to account for baseline drift. The automated procedure for the determination of nitrate (NO3) and nitrite (NO2) uses
the process whereby nitrate is reduced to nitrite by a copper-cadmium reductor column
(Armstrong et al., 1967; Grasshoff, 1969). The nitrite then reacts with sulfanilamide
under acidic conditions to form a diazo compound. This compound then couples with N-
1-naphthylethylene diamine dihydrochloride to form a purple azo dye (Bran+Luebbe™,
2005).
REQUIREMENTS Equipment and materials

79
� Seal Analytical AA3 Segmented Flow Analyser (Pumps, XY Sampler,
colorimeters, chemistry module MT19)
� AACE 6.03 software on PC
� 550 nm filters (x2)
� Autosampler 5 ml cups (polystyrene)
� Deionised water
� Volumetric flasks (various)
� Pipettes and tips (5 ml and 1 ml)
� Plastic Pasteur pipettes (1 ml and 3 ml)
� Analytical balance and weigh boats
� Desiccator
� Stirrer
� Fume cupboard
� Beakers (various)
� Measuring cylinders (various)
� 250 ml and 100 ml bottles, PE
� Tube racks
� Dilution containers, 7 ml Bijou or 30 ml Universal
� Reagent bottles, glass and plastic
� 12-14 ml calibrant tubes (x6)
Reagents
Ammonium chloride reagent 2.5 g Ammonium chloride
2 ml Ammonia solution, 25%
Into 250 ml deionised water
Add 0.125 ml Brij-35
Add 2-3 drops of 2% Copper sulphate solution
Stable for one week, this can be extended if stored in the fridge.
Colour Reagent 50 ml Hydrochloric acid, conc
5 g Sulfanilamide
0.25 g N-1-Naphthylethylenediamine dihydrochloride
Into 500 ml deionised water

80
Water + Brij Solution 6 ml Brij-35
Into 1000 ml deionised water
Copper sulphate solution 2% (for cadmium column conditioning) 2 g Copper sulphate
Into 100 ml deionised water
Stable indefinitely.
Hydrochloric acid 2 M (for cadmium column conditioning) 167 ml Hydrochloric acid, conc
Into 1000 ml deionised water
Stable indefinitely.
HAZARDS AND PRECAUTIONARY STATEMENTS
Hydrochloric acid and Ammonia Solution are corrosive, therefore a fume cupboard is
necessary for the preparation of the colour reagent and ammonium chloride reagent.
Acids are stored in corrosive cabinets.
Sodium nitrite and potassium nitrite are toxic and are stored in the poisons cabinet. All
precautions should be used when preparing stock solutions.
Cadmium is toxic, the column is prepared separately and cadmium is stored in the
poisons cabinet. The column is separated from the manifold by a 4 way valve, any leaks
or loss of cadmium should be treated with all precautions.
Copper sulphate is dangerous to the environment so all spills and chemical solutions
should be strictly contained from release to the environment.
All other chemicals are irritants and potentially harmful therefore proper PPE and risk
assessment should be adhered to. Consult the MSDS for precautionary measures.
PROCEDURE Preparation of stock solutions
Standard Stock Solution 1000 µmol L-1 0.1011 g (+ 0.0001 g) Potassium nitrate (Dried at 105°C for 2 hours, cool in a
desiccator)

81
0.0690 g (+ 0.0001 g) Sodium nitrite (Dried at 105°C for 2 hours, cool in a
desiccator)
Into 1000 ml deionised water (freshwater)
Or Artificial Seawater
35 g Sodium chloride
0.2 g Sodium hydrogen carbonate
Into 1000 ml deionised water
Nitrate Quality Control Stock Solution 1000 µmol L-1 0.0850 g (+ 0.0001 g) Sodium nitrate (Dried at 105°C for 2 hours, cool in a
desiccator)
Into 1000 ml deionised water
Or Artificial Seawater
35 g Sodium chloride
0.2 g Sodium hydrogen carbonate
Into 1000 ml deionised water
Nitrite Quality Control Stock Solution 1000 µmol L-1 0.0850 g (+ 0.0001 g) Potassium nitrite (Dried at 105°C for 2 hours, cool in a
desiccator)
Into 1000 ml deionised water
Or Artificial Seawater
35 g Sodium chloride
0.2 g Sodium hydrogen carbonate
Into 1000 ml deionised water
All Stock Solutions are stable for 3 months, store in the fridge.
Preparation of standards and samples
Pipette calibration standards and analytical quality controls (AQC’s) into deionised water
for freshwater analysis, or into artificial seawater for seawater analysis (see 4.1). Use
the following amounts;

82
Table 1 Preparation of working calibration standards and AQC’s, TON is equal to twice
NO2
Standard concentration µmolL-1
Volumetric flask volume
Volume of 1000 µmol L-1 stock solution to pipette
0 N/A 0
5/10 100 0.5 250 1.25
10/20 100 1.0 250 2.5
20/40 100 2.0 250 5.0
30/60 100 3.0 250 7.5
40/80 100 4.0 250 10.0
60/120 100 6.0 250 15.0
Pick a mid range value for the analytical quality control (AQC), i.e. the 0-60 µmol L-1
range requires 6 calibrants including a zero blank, so 30 is mid range and not normally
one of the calibrants used. Calibration standards are stored in plastic bottles, and are
stable for 1 week if stored in the fridge.
Dilute the samples to within the range using deionised water, targeting a concentration
between 20 – 50 µmol L-1. If the concentration of samples is unknown run them direct
without dilution and then when the preliminary results are charted add on a sample
dilution to the end of the run.
Measurement of standards and samples
1. Turn on computer and autosampler
2. Connect pump platen, turn on pump and put red toggle switch to Run.
3. Turn on colorimeter and install both 550 nm filters
4. Load AACE 6.03 software from computer desktop
5. Click on Charting, click Change and find ‘TON-Nitrite2’ on list. Select to highlight and
then press OK.
6. Shake reagents to mix
7. When deionised water has been pumping for 15-20 minutes then insert labelled reagent
probes into reagent bottles (Channel 1 Reagent 1 – Ammonium chloride; Channel 1

83
Reagent 2 – deionised water; Channel 1 Reagent 3 – Colour reagent; Channel 2
Reagent 1 – Water + Brij; Channel 2 Reagent 2 – Colour reagent)
8. Ensure deionised water containers are topped up
9. Along the top of the main screen click ‘Set Up’, and then ‘Analysis’. Click onto an
existing tray and click ‘Copy run’. Give this a new reference name and check that the
calibrants are correct, the TON calibrants will be twice that of the Nitrite (see Table 1).
Ensure that the virtual channel tab is present and that the formula reads F1*A + F2*B +
F3*C.
10. Click on Tray protocol tab and amend list to reflect current sample references. Insert an
AQC at the end of each row (every 11 samples), and also a Null and Drift. Print a copy
for reference when loading samples. Click OK when done.
11. Once the reagents have been pumping for 10-15 minutes turn on the cadmium column
by turning the 4 way valve 45° clockwise. Using the ammonium chloride reagent probe
(Channel 1 Reagent 1) pump 2 M Hydrochloric acid through the column for 1 minute,
then 2% Copper sulphate for 3 minutes and then 2 M Hydrochloric acid again for 2
minutes. Return the probe to the ammonium chloride reagent.
12. Once reagents have been pumping for a further 15-20 minutes, in the charting windows
labelled Ch3-1- TON and Ch4-1 Nitrite right click and ‘Set base’
13. Fill a rinsed 14 ml calibrant tube with the top standard (i.e. 60 µmolL-1) and place in
position 1 on the rack. Double click on ‘XY Sampler’ and click ‘sample’. Time for 2
minutes and then click ‘wash’. Click ‘cancel’ to close.
14. Wait 6-8 minutes for the peak to come through on the charting window, then when it
starts to stabilise (level off) right click and ‘Set gain’. This should be between 75-85%
absorbance. The gains should both be between 34 and 36.
15. Fill the other rinsed calibrant tubes with fresh calibration standards and load into the rack
in high to low order, double check baseline is at 5% and click ‘Set base’ if necessary.
Click ‘Run’, find the new tray name and double click. Press OK.
16. Load the samples according to the printed tray layout, rinsing the 5 ml cups with a little
volume before filling.
17. The calibration coefficient will be displayed before the sample peaks are shown, check
that this 0.9990 or better.
18. When run is finished a message will appear. Click OK. Turn the cadmium column off by
turning the 4 way valve 45° anticlockwise. Switch reagent probes into deionised water to
rinse for 30 minutes – 1 hour. If running other analyses then use 1 N HCl to wash out for
15 minutes, especially the ammonium chloride line. Turn off the colorimeter and the
autosampler. When finished rinsing put the red toggle switch on the pump to Stop.

84
Disconnect the pump platen and turn off the pump. Top up deionised water containers.
Dispose of waste down the sink and dispose of remaining samples as appropriate.
Throw away used autosampler cups and rinse calibrant tubes with deionised water.
Rinse any pipette tips used for dilutions. Rinse and throw away any dilution containers
used.
19. Click ‘Retrieve’, and ‘View Chart’. Check all peaks are correct and then click on ‘Report’.
Print the results.
20. Export the results to Excel by clicking on ‘File’ along the top, then ‘Export to’, ‘ASCII file’,
find the correct run name and double click, click ‘Export’ and ‘Save’, then close. The
Excel file will be available in the ‘Data’ folder on the desktop. When finished turn off
computer.
CALCULATION OF RESULTS Results are expressed as µmol L-1 as N. If dilution has been used then multiply by the
appropriate factor. The AACE software accounts for baseline drift during the run. The
range is 0 – 60/120 µmol L-1, although the detection limit of the method specified by the
manufacturer is 0.05 µmol L-1. The range can be lowered to 0 – 10/20 µmol L-1.
QUALITY CONTROL
AQC’s are run at the mid range point of the calibration. They are usually analysed 1 per
11 samples, and the results are plotted on Quality Control Charts within Excel. Separate
nitrate and nitrite AQC’s are analysed in order to determine the reduction efficiency of
the cadmium column. If any QC’s exceed + 10% and a cause cannot be determined
then a repeat analysis will be required. If a number of QC’s exceed + 5%, then prepare
an additional AQC solution to check. The QC stock is sourced and prepared separately
to the standard stock (see section 4.1). Sample spiking with a known concentration can
also be used as a quality control.
ERRORS AND INTERFERENCES
The matrix of the samples and calibration standards can affect the chemistry, therefore
as close a match as possible should be made between matrices. For freshwater
samples use deionised water standards, but for seawater samples use Artificial
Seawater (see section 4.1). Interferences can occur if other chemistries are run on the
same manifold, all attempts should be made to completely wash out chemicals before
analysis, possibly using 1 N HCl. Coloured samples or particulates can interfere with the
light path and therefore read higher than actual.

85
In most normal water and seawater samples the concentration of oxidizing or reducing
agents and interfering metal ions is well below the limits causing interferences. When
present in sufficient concentration, metal ions may produce a positive error, i.e. divalent
mercury and divalent copper may form coloured complex ions having adsorption bands
in the region of the colour measurement. Significant amounts of sulphate, sulphide or
organic material, especially oil, interfere with the performance of the copper-cadmium
reductor column (Bran+Luebbe™, 2005).
Pipettes should be used to dilute samples into deionised water. Samples should be
defrosted in the fridge 12 hours before analysis if possible, and should only remain
frozen for as little time as possible before analysis.
WASTE STREAM AND PROPER DISPOSAL All waste can be flushed down the sink with copious amounts of tap water. The sink log
should also be completed for any chemicals disposed of. Large amounts of ammonium
chloride reagent and copper sulphate should be separated for disposal over a longer
period. Anything relating to the cadmium column must be separated for hazardous
waste disposal.
Dispose of used autosampler cups and dilution containers.
REFERENCES Armstrong, F.A.J., Sterns, C.R., Strickland, J.D.H. (1967) ‘The measurement of
upwelling and subsequent biological processes by means of the Technicon
AutoAnalyser and associated equipment’, Deep Sea Research, vol. 14, pp. 381-389
Bran+Luebbe™ (2005) AutoAnalyser Application, Method No: G-172-96 Rev 10.
Grasshoff, K. (1969) Technicon International Congress June 1969

86
SOP: 2.2.b Analysis of dissolved nitrate (NO3
-) Alexandra Lefoulonb, Sofie Van Den Hendeb
bDepartment of Industrial Biological Sciences (former Howest University College)(, Faculty of Bioscience
Engineering, Ghent University, Campus Kortrijk, Karel de Goedelaan 5, 8500 Kortrijk, Belgium
PURPOSE This procedure is used to determine the dissolved nitrate (NO3
-) concentration in water and
wastewater.
PRINCIPLE Samples are filtered at 0.2 µm to remove suspended solids from the water samples and
remain the dissolved nitrate ions. The nitrate ions in the filtered and acidified (sulphuric and
phosphoric acids) water samples react with 2,6-dimethylphenol (2,6-xylenol) to form 4-nitro-2.6-
dimethylphenol. The intensity of the coloration is measured spectrophotometrically.
REQUIREMENTS a. EQUIPMENT AND MATERIALS
Hach Lange kit LCK 339, 0.23-13.50 mg NO3-N L-1, 1-60 mg NO2 L-1
a spectrophotometer (Hach Lange DR 2800, Belgium)
a micropipette 1-5 mL and tips
a syringe filter with 0.2 µm pore size (Chromafil RC-20125, Germany) and syringe
a glass beaker of 100 mL
1 centrifuge tube of 10 mL (VWR, Belgium)
b. REAGENTS
reagents present in the HL kit LCK 339: ’Nitrate Solution A’
raw water sample (1 mL of prepared sample is needed for the analysis; around 10 mL of
sample is needed to filter) stored at 4°C.
demineralized water HAZARDS AND PRECAUTIONARY STATEMENTS
- Act carefully and take appropriate measure concerning the hazardous reagents.

87
Reagent Hazard statements Precautionary statements
Sulphuric acid (H2SO4)
- Causes severe skin burns and
eye damage. - Harmful to aquatic life with long
lasting effects.
- Avoid release to the environment.
- Wear protective gloves/ protective clothing/ eye protection/ face protection.
- If in eyes: Rinse cautiously with water for several minutes. Remove contact lenses, if present and easy to do. Continue rinsing.
- Immediately call a Poison Center or doctor/physician.
Phosphoric acid (H3PO4)
- May be corrosive to metals. - Causes severe skin burns and
eye damage.
- Wear protective gloves/ protective clothing/ eye protection/ face protection.
- If in eyes: Rinse cautiously with water for several minutes. Remove contact lenses, if present and easy to do. Continue rinsing.
- Immediately call a Poison Center or doctor/physician.
2,6-xylenol (C8H10O)
- Toxic if swallowed. - Toxic in contact with skin. - Causes severe skin burns and
eye damage. - Toxic to aquatic life with long
lasting effects.
- Avoid release to the environment.
- Wear protective gloves/ protective clothing/ eye protection/ face protection.
- If swallowed: immediately call a poison center or doctor/ physician.
- If in eye: rinse cautiously with water for several minutes. Remove contact lenses, if present and easy to do. Continue rinsing. Immediately call a Poison Center or doctor/physician

88
PROCEDURE SAMPLE PREPARATION
1. The raw sample should be filtered as soon as possible after taking it from the reactor in
order not to change its nitrite concentration.
2. Pour around 20 mL of sample in a glass beaker of 100 mL.
3. Take with a syringe 10 mL of sample, add the syringe filter and pour minimum 3 mL of
sample through the syringe filter in a labeled centrifuge tube.
4. This filtered sample can be stored for 2 weeks at 4°C or longer at -18°C.
SAMPLE ANALYSIS Here under follows the procedure for samples with concentration of 0.23-13.50 mg NO3-N L-1, 1-
60 mg NO3 L-1. For samples with concentration above, dilutions should be made with
demineralized water. All pictures are courtesy of Hach Lange (2014).
Figure 1. Sample analysis (Hach Lange 2014)
1. Pipette 1.0 mL of filtered sample in the
reaction tube.
2. Pipette 0.2 mL solution LCK 339 A into the
reaction tube.
3. Close the cuvette and invert a few times
until everything dissolved well and no more
streaks can be seen.

89
4. Wait exactly 15 min. Clean the outside of
the cuvette thoroughly with paper while
waiting.
5. Put the cleaned cuvette in the
spectrophotometer. The mode to determine
(LCK 339) will be automatically selected by
the bar code reader. The
spectrophotometer shows the nitrate in mg
NO3- L-1 or NO3
-–N L-1 the display.
CALCULATION OF RESULTS - The conversion of absorbance to NO3-–N is done by the spectrophotometer.
- For diluted samples, the used dilution factor should be taken into account.
QUALITY CONTROL
- Dilutions and spiking of samples can be done as a quality control.
- Wastewater samples can contain over 100 mg NO3 --N L-1 (Van Den Hende, 2014).
ERRORS, CALIBRATION AND INTERFERENCES
- High loads of oxidisable organic substances (COD, chemical oxygen demand) cause the
reagent to change colour and give high-bias results. Therefore, the sample should be
filtered, especially if the water sampled contains over 200 mg COD L-1.
- The range of measurement is 0.23-13.50 mg NO3-N L-1.
- If nitrite NO2- is present, then acid preservation can cause disproportionation of HNO2 to
NO3- and nitric oxide (NO). NO can be oxidized to nitrate. As a result, nitrate values may
be the sum of nitrate and nitrite. Therefore, do not acidify samples for nitrate
determination.
- Nitrite concentrations of more than 2.0 mg L-1 interfere (high-biased results) and can be
removed by addition of a spatula of amidosulphonic acid.
- High concentrations of chloride can interfere with the nitrate determination. The chloride
can be precipitated out as silver chloride by adding silver sulphate. Several other
compounds can interfere with this measurement (Tabel 1).

90
Table 1. Overview of substances which can interfere with nitrate measurements
Interfering substance Interference level (mg L-1) Chloride (Cl-), calcium (Ca2+), potassium (K+) 500
Silver (Ag+) 100
Cadmium (Cd2+), zinc (Zn2+), calcium (Ca2+), copper (Cu2+), tin (Sn2+), iron (Fe3+), lead (Pb2+), nickel (Ni2+)
50
Cobalt (Co2+), iron (Fe2+) 10
Chromium (Cr6+) 5
WASTE STREAM AND PROPER DISPOSAL
- Hach Lange local agencies accept used cuvettes to ensure their proper disposal in
accordance with local and national regulations. These used cuvettes should thus be
stored and send back to Hach Lange.
- Used syringe filters should be disposed in the correct waste stream disposal in the lab
(‘General waste’ in UGent, Campus Kortrijk).
REFERENCES
- APHA, Awwa, WEF, 2005. Standard Methods for the Examination of Water and
Wastewater, 21st ed. American Public Health Association, Washington DC.
- Beelen V., Van Den Hende S., 2014. Verbal communication. Ghent University, Campus
Kortrijk.
- Hach Lange, 2014. Safety Data Sheet LCK 339, Available on (27/06/2014):
http://www.hach-
lange.ma/countrysites/action_q/download%3Bmsds/msds_document/en%252FLCK339
%252Epdf/lkz/MA/spkz/fr/TOKEN/B8mJ3WjRArsLMinY16ndHWHZlvc/M/lyIJHw.
- Sigma-Aldrich, Sulphuric acid. Available on (25/06/2014):
http://www.sigmaaldrich.com/catalog/product/aldrich/339741?lang=fr®ion=FR.
- Sigma-Aldrich, Phosphoric acid. Available on (25/06/2014):
http://www.sigmaaldrich.com/catalog/product/sigma/p5811?lang=fr®ion=FR.
- Sigma-Aldrich, 2,6-Xylenol. Available on (25/06/2014):
http://www.sigmaaldrich.com/catalog/product/aldrich/w324906?lang=fr®ion=FR.

91
SOP: 2.2.c Analysis of dissolved nitrate (NO3
-) Alexandra Lefoulonb, Sofie Van Den Hendeb, Matthew P. Daveyc
bDepartment of Industrial Biological Sciences (former Howest University College)(, Faculty of Bioscience
Engineering, Ghent University, Campus Kortrijk, Karel de Goedelaan 5, 8500 Kortrijk, Belgium
cDepartment of Plant Sciences, University of Cambridge, Downing Street, Cambridge CB2 3EA, UK
PURPOSE This procedure is used to determine the dissolved nitrate (NO3
-) concentration in water and
wastewater. See also SOP 1.3.c for a method using probes.
PRINCIPLE Samples are filtered at 0.2 µm to remove suspended solids from the water samples and
remain the dissolved nitrate ions. The nitrate ions in the filtered and acidified (sulphuric and
phosphoric acids) water samples react with 2,6-dimethylphenol (2,6-xylenol) to form 4-nitro-2.6-
dimethylphenol. The intensity of the coloration is measured spectrophotometrically.
REQUIREMENTS EQUIPMENT AND MATERIALS
Hach Lange kit LCK 339, 0.23-13.50 mg NO3-N L-1, 1-60 mg NO2 L-1
A spectrophotometer (Hach Lange DR 2800, Belgium)
A micropipette 1-5 mL and tips
A syringe filter with 0.2 µm pore size and syringe
A glass beaker of 100 mL
1 centrifuge tube of 10 mL (VWR, Belgium)
REAGENTS
Reagents present in the HL kit LCK 339: ’Nitrate Solution A’
Raw water sample (1 mL of prepared sample is needed for the analysis; around 10 mL
of sample is needed to filter) stored at 4°C.
Demineralized water
HAZARDS AND PRECAUTIONARY STATEMENTS
- Act carefully and take appropriate measure concerning the hazardous reagents.

92
Reagent Hazard statements Precautionary statements
Sulphuric acid (H2SO4)
- Causes severe skin burns and
eye damage. - Harmful to aquatic life with
long lasting effects.
- Avoid release to the environment.
- Wear protective gloves/ protective clothing/ eye protection/ face protection.
- If in eyes: Rinse cautiously with water for several minutes. Remove contact lenses, if present and easy to do. Continue rinsing.
- Immediately call a Poison Center or doctor/physician.
Phosphoric acid (H3PO4)
- May be corrosive to metals. - Causes severe skin burns and
eye damage.
- Wear protective gloves/ protective clothing/ eye protection/ face protection.
- If in eyes: Rinse cautiously with water for several minutes. Remove contact lenses, if present and easy to do. Continue rinsing.
- Immediately call a Poison Center or doctor/physician.
2,6-xylenol (C8H10O)
- Toxic if swallowed. - Toxic in contact with skin. - Causes severe skin burns and
eye damage. - Toxic to aquatic life with long
lasting effects.
- Avoid release to the environment.
- Wear protective gloves/ protective clothing/ eye protection/ face protection.
- If swallowed: immediately call a poison center or doctor/ physician.
- If in eye: rinse cautiously with water for several minutes. Remove contact lenses, if present and easy to do. Continue rinsing. Immediately call a Poison Center or doctor/physician

93
PROCEDURE SAMPLE PREPARATION
x The raw sample should be filtered as soon as possible after taking it from the reactor in
order not to change its nitrite concentration.
x Pour around 20 mL of sample in a glass beaker of 100 mL.
x Take with a syringe 10 mL of sample, add the syringe filter and pour minimum 3 mL of
sample through the syringe filter in a labeled centrifuge tube.
x This filtered sample can be stored for 2 weeks at 4°C or longer at -18°C. SAMPLE ANALYSIS
Here under follows the procedure for samples with concentration of 0.23-13.50 mg NO3-N L-1, 1-
60 mg NO3 L-1. For samples with concentration above, dilutions should be made with
demineralized water. All pictures are courtesy of Hach Lange (2014).
Figure 1. Sample analysis (Hach Lange 2014)
1. Pipette 1.0 mL of filtered sample in the
reaction tube.
2. Pipette 0.2 mL solution LCK 339 A into the
reaction tube.
3. Close the cuvette and invert a few times
until everything dissolved well and no more
streaks can be seen.

94
4. Wait exactly 15 min. Clean the outside of
the cuvette thoroughly with paper while
waiting.
5. Put the cleaned cuvette in the
spectrophotometer. The mode to determine
(LCK 339) will be automatically selected by
the bar code reader. The
spectrophotometer shows the nitrate in mg
NO3- L-1 or NO3
-–N L-1 the display.
CALCULATION OF RESULTS - The conversion of absorbance to NO3-–N is done by the spectrophotometer.
- For diluted samples, the used dilution factor should be taken into account.
QUALITY CONTROL
- Dilutions and spiking of samples can be done as a quality control.
- Wastewater samples can contain over 100 mg NO3 --N L-1 (Van Den Hende, 2014).
ERRORS, CALIBRATION AND INTERFERENCES
- High loads of oxidisable organic substances (COD, chemical oxygen demand) cause the
reagent to change colour and give high-bias results. Therefore, the sample should be filtered,
especially if the water sampled contains over 200 mg COD L-1.
- The range of measurement is 0.23-13.50 mg NO3-N L-1.
- If nitrite NO2- is present, then acid preservation can cause disproportionation of HNO2 to NO3
-
and nitric oxide (NO). NO can be oxidized to nitrate. As a result, nitrate values may be the sum
of nitrate and nitrite. Therefore, do not acidify samples for nitrate determination.
- Nitrite concentrations of more than 2.0 mg L-1 interfere (high-biased results) and can be
removed by addition of a spatula of amidosulphonic acid.
- High concentrations of chloride can interfere with the nitrate determination. The chloride can be
precipitated out as silver chloride by adding silver sulphate. Several other compounds can
interfere with this measurement (Tabel 1).

95
Table 1. Overview of substances which can interfere with nitrate measurements
Interfering substance Interference level (mg L-1) Chloride (Cl-), calcium (Ca2+), potassium (K+) 500
Silver (Ag+) 100
Cadmium (Cd2+), zinc (Zn2+), calcium (Ca2+), copper (Cu2+), tin (Sn2+),
iron (Fe3+), lead (Pb2+), nickel (Ni2+) 50
Cobalt (Co2+), iron (Fe2+) 10
Chromium (Cr6+) 5
WASTE STREAM AND PROPER DISPOSAL - Hach Lange local agencies accept used cuvettes to ensure their proper disposal in
accordance with local and national regulations. These used cuvettes should thus be stored and
send back to Hach Lange.
- Used syringe filters should be disposed in the correct waste stream disposal in the lab
(‘General waste’ in UGent, Campus Kortrijk).
REFERENCES - APHA, Awwa, WEF, 2005. Standard Methods for the Examination of Water and
Wastewater, 21st ed. American Public Health Association, Washington DC.
- Beelen V., Van Den Hende S., 2014. Verbal communication. Ghent University, Campus
Kortrijk.
- Hach Lange, 2014. Safety Data Sheet LCK 339, Available on (27/06/2014):
http://www.hach-
lange.ma/countrysites/action_q/download%3Bmsds/msds_document/en%252FLCK339%252Ep
df/lkz/MA/spkz/fr/TOKEN/B8mJ3WjRArsLMinY16ndHWHZlvc/M/lyIJHw.
- Sigma-Aldrich, Sulphuric acid. Available on (25/06/2014):
http://www.sigmaaldrich.com/catalog/product/aldrich/339741?lang=fr®ion=FR.
- Sigma-Aldrich, Phosphoric acid. Available on (25/06/2014):
http://www.sigmaaldrich.com/catalog/product/sigma/p5811?lang=fr®ion=FR.
- Sigma-Aldrich, 2,6-Xylenol. Available on (25/06/2014):
http://www.sigmaaldrich.com/catalog/product/aldrich/w324906?lang=fr®ion=FR.

96
SOP: 2.2.e Nitrate-N (NO3-N), autoanalyzer Anneliese Ernste
eHochschule für Technik und Wirtschaft des Saarlandes, Göbenstraße 40, 66117 Saarbrücken,
Germany
PURPOSE As the manual method of nitrate-N is sensitive to technical performance, an autoanalyzer is
used for accurate determination of concentrations. The preparation of the autoanalyzer
takes several hours, so this analysis is not useful for daily monitoring. It is performed after
the completion of an experimental series, using samples previously stored in the freezer.
PRINCIPLE In the automated procedure for the determination, nitrate is reduced to nitrite by a copper-
cadmium reduction column at a pH of 8.0. The nitrite ion then reacts with sulfanilamide
under acidic conditions to from a diazo compound. This compound then couples with N-1-
naphtylethylenediamine dihydrochloride to form a reddish-purple azo dye (Grasshoff et al)
REQUIREMENTS Instrumentation AutoAnalyzer AA3 (Seal Analytical) equipped with MT7, 24” dialyzer, heating bath (37°C), 7
pump-tubes, 2 air tubes 1 sample wash.
Variable pipettes and tips.
Measuring cylinder, 6 1L- reagent bottles (PP); 2 2-L conical flasks for wash solutions etc.
List of raw materials: Ammonium chloride, NH4Cl
Ammonia solution, 25% NH3
Brij-35, 22 –30% solution
Cadmium coarse powder; particle size 0.3 – 1.5 mm
Copper sulfate pentahydrate, CuSO4 * 5H2O
Hydrochloric acid, conc., HCl
Phosphoric acid, H3PO4
N-1-naphtylethylenediamine dihydrochloride, C12H14N2*2HCl
Potassium nitrate, KNO3

97
Sodium nitrite, NaNO2
Sodium hydroxide, NaOH
Sodium hypochlorite
Deionized water
HAZARDS AND PRECAUTIONARY STATEMENTS Toxic chemicals: NaNO2, Cd
Beware: Cadmium is a highly toxic chemical! Wear gloves and dust protection, keep lab
clean. Prepare the cadmium column in a chemical hut, beware of cadmium dust!
Harmful chemicals: NH4Cl, NH3, CuSO4, C12H14N2*2HCl
Corrosive chemicals: HCl, H3PO4, NaOH
PROCEDURE
Preparation Prepare the solutions for the dye-reaction, for the preparation of the reductor column, for the
wash solution (between samples) and cleaning solutions (before and after the run). Refer to
the manufacturer’s manual for the exact composition of reagents.
Prepare reduction column.
Set-up the MT7 manifold for nitrate.
Standards, samples and sampler wash solutions must have the same matrix (e.g. seawater,
similar chloride concentration) as the sample. Dilute samples keeping in mind two rules: the
linear range for NO3-N is 0 – 6.5 mg L-1; the total salt concentration must be < 30 g L-1.
Dilute standards and samples for example to a final salinity of 5 g L-1 prior to measurement.
Operating notes: Refer to the manufacturer’s manual for reduction column preparation and the start-up
procedure.
Place standards in the designated positions for standards of the rack.
Place samples in the designated positions for samples of the rack.
Program measuring protocol.
Start measurement.
Finish measurement following the shut-down procedure.
CALCULATION OF RESULTS Automatically performed by AA3 according to measuring protocol

98
CALIBRATION AND QUALITY CONTROL Prepare a standard stock solution with 1 g L-1 NO3-N (for example 0722 g KNO3 in 100 ml of
deionized water).
Prepare a working standard of 10 mg L-1 NO3-N with the matrix solution (deionized water or
saline water).
Prepare dilutions with the final concentrations of (mg L-1 NO3-N) 6.5, 5.5, 4.5, 3.5, 2.5, 1.5,
0.5.
Consult manual for placing standards, blank, and efficiency controls in the rack positions
indicted and fill in measuring protocol as requested.
Calibration and quality control will then automatically be performed by the autoanalyzer
AA3.
ERRORS AND INTERFERENCES The reduction column should be pre-conditions by pumping through the sample line 100 mg
NO3-N for 5 min followed by pumping through 100 mg NO2-N. The efficiency of the reduction
column is tested in every run by comparing the colour reaction of nitrate and nitrite. If
reduction becomes inefficient, the Cu layer on the Cd beads must be renewed.
WASTE STREAM AND PROPER DISPOSAL Collect two waste streams. The sampler wash (contains water or saline matix) can be
disposed without any restriction. The chemical from the dye reaction are collected
separately and should be discarded as hazardous waste.
REFERENCES Autoanalyzer Method no. G-200-97 Rev 6, SEAL Analytical .
Grasshoff, Determination of nitrate. In: Grasshoff, K., Ehrhardt M., Kremling K. (eds.)
Methods of Seawater Analysis, Verlag Chemie, 1983, pp143-150.

99
SOP: 2.2.e Nitrate-N (NO3-N) Manual Assay Anneliese Ernste
eHochschule für Technik und Wirtschaft des Saarlandes, Göbenstraße 40, 66117 Saarbrücken,
Germany
PURPOSE Nitrate accumulates in a zero-exchange RAS. It is the major nitrogen source for algae
production integrated in RAS. Lack of a mineral nitrogen source inhibits growth of algae.
PRINCIPLE Cadmium reduction method. Cadmium metal reduces nitrates to nitrite in the sample. The
nitrite ion reacts in an acidic medium with sulfanilic acid to form an intermediate diazonium
salt. The salt couples with gentisic acid to form an amber coloured solution. Test results are
measured at 400 nm.
REQUIREMENTS Centrifuge, centrifuge tubes, spectrophotometer, timer, 10-ml sample cells (cuvettes) with
stopper (or use parafilm to close), adjustable pipettes (10 ml, 1ml), pipette tips, powder
pillows (for example NitraVer 5 Nitrate Reagent, Hach-Lange), deionized water or (saline)
seawater as blank and for dilution of samples
HAZARDS AND PRECAUTIONARY STATEMENTS Powder pillows and prepared samples contain cadmium, which is toxic. Wear lab coat, do
not spill the powder, make sure that the content of the pillow is completely transferred to the
sample cells. Dispose of sacs, wipes and samples according to hazardous waste
regulations.
PROCEDURE
Sample collection, preservation and storage (once for all nutrients) 1. Collect samples in clean glass or plastic bottles
2. Remove cells of suspension by centrifugation and analyse as soon as possible after
collection.

100
3. Preserve supernatants by freezing (-20°C). For more reproducible results, repeat
analysis after termination of the experiment with Æ autoanalyzer
Measurement 1. If working with saline samples, prepare 1 L volume of saline water that matches the
chloride concentration of the samples.
2. Dilute clear supernatant with saline dilution water to reach measuring range (for
example 0 – 10 mg L-1).
3. Fill a sample cell (cuvette) with 10 ml of (diluted) sample.
4. Use deionised water as blank.
5. Add the contents of one powder pillow.
6. Start the timer. Shake the cell vigorously for 1 minute.
7. Allow for another 6 minutes for colour development
8. Wipe cell and insert in spectrophotometer.
9. Read the result 7 min after start of reaction.
CALCULATION OF RESULTS Plot results of calibration inverse (i.e. extension on x-axis concentration on y- axis) and
calculate linear trend line.
Use the equation to calculate concentration (Note this equation contains a correction for the
reagent blank value at the corresponding salinity). Multiply the result with the dilution factor.
CALIBRATION AND QUALITY CONTROL
1. Prepare 1 L volume of (saline) water that matches the chloride concentration of the
samples.
2. Use this water as dilution water instead of deionized water when preparing the
nitrate standards for saline samples.
3. Prepare standard stock solution (100 mg L-1 NO3-N) and dilute to 10.0 mg L-1 NO3-N
with saline solution and prepare standards with final concentration of 100%, 85%,
70%, 55%, 40%, 25% 10%, 0%. Freeze stock solutions in 1.5 – 2 ml aliquots for later
use. Use deionized water as blank.
4. Add powder pillow and start the timer. Follow the steps and timing described above
5. Measure extinction at 400 nm
6. Prepare an inverse plot of results (Extension on x axis, concentration on y axis) and
calculate linear trend line.
7. Use this equation for calculating the concentration.

101
8. Determine a reagent blank in deionized water and compare with blank (0%) in
calibration. Determine a reagent blank value for each lot of reagents.
9. Test reproducibility of technique using stock solutions stored frozen.
ERRORS AND INTERFERENCES This method is technique-sensitive. Shaking time and technique influence colour
development! For accurate and reproducible results make successive tests on a 10.0 mg L-1
nitrate standard solution and adjust shaking times/vigour.
Chloride concentrations above 0.1 g L-1 will cause low results. To perform this test in
seawater a calibration must be done using standards prepared with the same chloride
concentration. (Note: 18.8 g L-1 is a typical seawater chloride concentration, chloride
concentration (g L-1) x 1.6485 0 g of ACS grade NaCl to 1 L of deionized water).
Highly buffered samples or extremes sample pH may exceed the buffering capacity of
reagents and require sample pretreatment.
Nitrite: Interference at all levels. Determine Nitrite-N and subtract if significant.
WASTE STREAM AND PROPER DISPOSAL Prepared samples contain cadmium and must be disposed of according to Federal, State,
and local hazardous waste regulations.
REFERENCES Hach Company 2007, 2010, 2012. Printed in the U.S.A.
OTHER POINTS Nitrate is substrate of ubiquitous denitrifying bacteria. Therefore, samples should not stand
at room temperature. For later analysis supernatants are required to be frozen directly after
centrifugation.
This method can result in differences of up to 100% if conducted by different persons and >
20% by one person. The critical factor is the distribution of the cadmium particles during the
1-min shaking period. The catalysis is temperature sensitive. For more accurate
determination refer to NO3-N with autoanalyzer.

102
SOP: 2.2.f Analysis of dissolved nitrate (NO3
-) Chris de Visserf, Wim van Dijkf fWageningen UR including Plant Research International (WUR), Lelystad, The Netherlands
PURPOSE
This procedure is used to determine the dissolved nitrate (NO3-) concentration in water and
wastewater.
PRINCIPLE
Samples are filtered at 0.2 µm to remove suspended solids from the water samples and
remain the dissolved nitrate ions. The nitrate ions in the filtered and acidified (sulphuric and
phosphoric acids) water samples react with 2,6-dimethylphenol (2,6-xylenol) to form 4-nitro-2.6-
dimethylphenol. The intensity of the coloration is measured spectrophotometrically.
REQUIREMENTS EQUIPMENT AND MATERIALS
x Hach Lange kit LCK 340, 5-35 mg NO3-N L-1,
x a spectrophotometer (Hach Lange DR 3900, Netherlands)
x a micropipette 20-200 µL and tips
x a micropipette 200-1000 µL and tips
x a syringe filter with 0.2 µm pore size and syringe
x a glass beaker of 100 mL
x 1 centrifuge tube of 10 mL
REAGENTS x reagents present in the HL kit LCK 339: ’Nitrate Solution A’
x sample (200 µL of prepared sample is needed for the analysis; around 10 mL of sample
is needed to filter) stored at 20°C.
x demineralized water
HAZARDS AND PRECAUTIONARY STATEMENTS - Act carefully and take appropriate measure concerning the hazardous reagents.

103
Reagent Hazard statements Precautionary statements
Sulphuric acid (H2SO4)
- Causes severe skin
burns and eye damage. - Harmful to aquatic life
with long lasting effects.
- Avoid release to the environment.
- Wear protective gloves/ protective clothing/ eye protection/ face protection.
- If in eyes: Rinse cautiously with water for several minutes. Remove contact lenses, if present and easy to do. Continue rinsing.
- Immediately call a Poison Center or doctor/physician.
Phosphoric acid (H3PO4)
- May be corrosive to
metals. - Causes severe skin
burns and eye damage.
- Wear protective gloves/ protective clothing/ eye protection/ face protection.
- If in eyes: Rinse cautiously with water for several minutes. Remove contact lenses, if present and easy to do. Continue rinsing.
- Immediately call a Poison Center or doctor/physician.
2,6-xylenol (C8H10O)
- Toxic if swallowed. - Toxic in contact with
skin. - Causes severe skin
burns and eye damage. - Toxic to aquatic life with
long lasting effects.
- Avoid release to the environment.
- Wear protective gloves/ protective clothing/ eye protection/ face protection.
- If swallowed: immediately call a poison center or doctor/ physician.
- If in eye: rinse cautiously with water for several minutes. Remove contact lenses, if present and easy to do. Continue rinsing. Immediately call a Poison Center or doctor/physician

104
PROCEDURE
SAMPLE PREPARATION
1. The raw sample should be filtered as soon as possible after taking it from the reactor
in order not to change its nitrate concentration.
2. Mix sample well,
3. Take with a syringe 5-10 mL of sample,
4. Add the syringe filter and pour full contents of syringe through the syringe filter
SAMPLE ANALYSIS
Follow the procedure described in the inside cap of the Hach Lange kit. Here under follows the
procedure for samples with concentration of 5-35 mg NO3-N L-1 (taken from Hach Lange guide form). For samples with concentration above the range, dilutions should be made with
demineralized water.
Figure 1. Sample analysis (Hach Lange 2014)
1. Pipette 0.2 mL of filtered sample in the reaction tube.
2. Pipette 1.0 mL solution LCK 340 A into the reaction tube.
3. Close the cuvette and invert a few times until everything dissolved well and no more streaks can be seen.

105
4. Wait exactly 15 min. Clean the outside of the cuvette thoroughly with paper while waiting.
5. Put the cleaned cuvette in the spectrophotometer. The mode to determine (LCK 339) will be automatically selected by the bar code reader. The spectrophotometer shows the nitrate in mg NO3
- L-1 or NO3-–N L-1 the display.
CALCULATION OF RESULTS
- The conversion of absorbance to NO3-–N is done by the spectrophotometer.
- For diluted samples, the used dilution factor should be taken into account.
QUALITY CONTROL
- Dilutions and spiking of samples can be done as a quality control.
ERRORS, CALIBRATION AND INTERFERENCES
- Sample should be between pH 3 and pH 10
- Sample and reagent temperature should be between 20°C and 24°C
- High loads of oxidizable organic substances (COD, chemical oxygen demand) cause the
reagent to change colour and give high-bias results. Therefore, the sample should be filtered to
remove algae.
- If nitrite NO2- is present, then acid preservation can cause disproportionation of HNO2 to NO3
-
and nitric oxide (NO). NO can be oxidized to nitrate. As a result, nitrate values may be the sum
of nitrate and nitrite. Therefore, do not acidify samples for nitrate determination.
- Several other compounds can interfere with this measurement (Tabel 1).
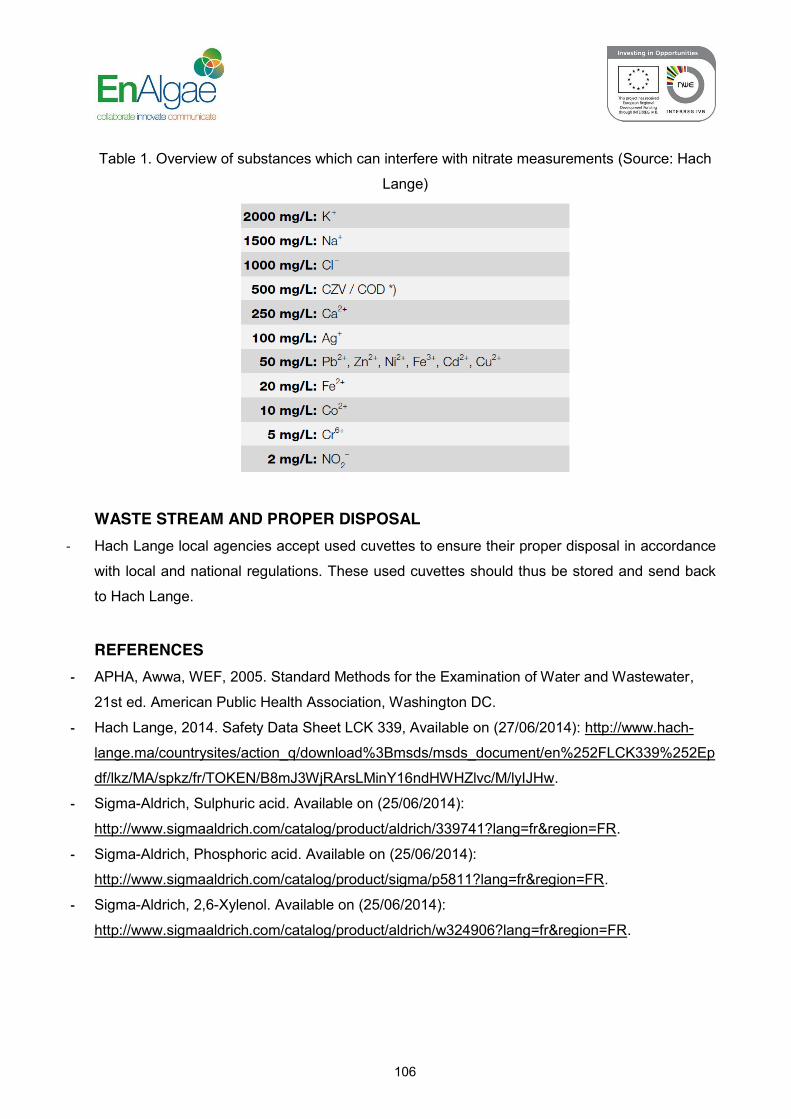
106
Table 1. Overview of substances which can interfere with nitrate measurements (Source: Hach
Lange)
WASTE STREAM AND PROPER DISPOSAL
- Hach Lange local agencies accept used cuvettes to ensure their proper disposal in accordance
with local and national regulations. These used cuvettes should thus be stored and send back
to Hach Lange.
REFERENCES
- APHA, Awwa, WEF, 2005. Standard Methods for the Examination of Water and Wastewater,
21st ed. American Public Health Association, Washington DC.
- Hach Lange, 2014. Safety Data Sheet LCK 339, Available on (27/06/2014): http://www.hach-
lange.ma/countrysites/action_q/download%3Bmsds/msds_document/en%252FLCK339%252Ep
df/lkz/MA/spkz/fr/TOKEN/B8mJ3WjRArsLMinY16ndHWHZlvc/M/lyIJHw.
- Sigma-Aldrich, Sulphuric acid. Available on (25/06/2014):
http://www.sigmaaldrich.com/catalog/product/aldrich/339741?lang=fr®ion=FR.
- Sigma-Aldrich, Phosphoric acid. Available on (25/06/2014):
http://www.sigmaaldrich.com/catalog/product/sigma/p5811?lang=fr®ion=FR.
- Sigma-Aldrich, 2,6-Xylenol. Available on (25/06/2014):
http://www.sigmaaldrich.com/catalog/product/aldrich/w324906?lang=fr®ion=FR.

107
SOP: 2.3.b Analysis of dissolved nitrite (NO2
-) Alexandra Lefoulonb, Sofie Van Den Hendeb
bDepartment of Industrial Biological Sciences (former Howest University College)(, Faculty of Bioscience
Engineering, Ghent University, Campus Kortrijk, Karel de Goedelaan 5, 8500 Kortrijk, Belgium
PURPOSE The purpose of this analysis is to determine the dissolved nitrite (NO2
-) concentration in water
and wastewater.
PRINCIPLE Samples are filtered at 0.2 µm to remove suspended solids. Nitrite ions in the filtered water
sample react with primary aromatic amines in acidic solution to form diazonium salts. These
combine with aromatic compounds that contain an amino group or a hydroxyl group to form
intensively colored azo dyes. The absorbance of the colored azo dyes is measured
spectrophotometrically at 520 nm.
Figure 1: Chemical reactions of the determination of nitrite in filtered water samples

108
REQUIREMENTS EQUIPMENT AND MATERIALS
x a syringe filter with 0.2 µm pore size (Chromafil RC-20125, Germany) and syringe
x a glass beaker of 100 mL
x a Hach Lange kit LCK 341, 0.015 – 0.6 mg NO2--N L-1, 0.05 -2.0 mg NO2
- L-1
x a spectrophotometer (Hach Lange DR 2800, Belgium)
x 1 centrifuge tube of 10 mL (VWR, Belgium)
x a micropipette of 1-5 mL and tips
x a micropipette 100-1000 µL and tips
REAGENTS
x 20 mL of sample (2 mL of filtered sample is needed for the analysis)
HAZARDS AND PRECAUTIONARY STATEMENTS
x Requirements for storage rooms and vessels: keep tightly closed in a dry, cool and
well-ventilated place.
x Always wear a laboratory coat, eye protection and laboratory gloves.
x Act carefully and take appropriate measure concerning the hazardous reagents.
Reagent Hazard statements Precautionary statements
Citric acid (C6H8O7)
- Causes serious eye irritation.
- If in eyes: rinse cautiously with water for several minutes. Remove contact lenses, if present and easy to do. Continue rinsing.
PROCEDURE SAMPLE PREPARATION
1. The raw sample should be filtered as soon as possible after taking it from the reactor in
order not to change its nitrite concentration.
2. Pour around 20 mL of sample in a glass beaker of 100 mL.
3. Take with a syringe 10 mL of sample, add the syringe filter and pour minimum 3 mL of
sample through the syringe filter in a labeled centrifuge tube.
4. This filtered sample can be stored for 2 weeks at 4°C or longer at -18°C.

109
SAMPLE ANALYSIS
Here under follows the procedure for filtered samples with concentration of 0.015–0.6 mg NO2--
N L-1, 0.05 -2.0 mg NO2- L-1. For samples with a higher concentration, dilutions should be made
with demineralized water. All pictures are courtesy of Hach Lange (2014).
Figure 2. Sample analysis (Hach Lange 2014)
1. Carefully remove the foil from the screwed-on DosiCap Zip.
2. Unscrew the DosiCap Zip.
3. Pipette 2.0 mL filtered sample from the centrifuge tube in the cuvette.
4. Immediately screw the DosiCap Zip back; fluting at the top.
5. Shake firmly until the freeze-dried contents are completely dissolved.
6. Wait exactly 10 min. Clean the outside of the cuvette thoroughly with paper while waiting.
7. Put the cleaned cuvette in the spectrophotometer. The
mode to determine (LCK 341) will be automatically selected by the bar code reader.

110
The spectrophotometer shows the amount of NO2- in mg NO2
- L-1 on the display.
CALCULATION OF RESULTS
x The conversion of absorbance to NO2- or NO2
--N is done by the spectrophotometer.
x For diluted samples, the used dilution factor should be taken into account.
QUALITY CONTROL
x Validity range: 0.015 – 0.6 mg NO2--N L-1, 0.05 -2.0 mg NO2
- L-1
pH: 3-10
Temperature: 15-25 °C
x The measurements results must be subjected to plausibility checks (dilute and/or spike
the sample).
ERRORS, CALIBRATION AND INTERFERENCES
x Chromium (VI) ions, amongst others, interfere with the determination (Table 1).
x Copper (II) ions interfere with the determination even at concentrations below 1 mg L-1.
x Confidence interval of 0.015 – 0.6 mg NO2-N L-1, 0.05 -2.0 mg NO2 L-1: (95%): ± 0.87
mg L-1.
x No more than 3 hours should elapse between sampling and filtering the sample.
Table 1. Substances which can interfere with nitrite measurements
Interfering substance Interference level (mg L-1)
Tin (Sn4+), iron (Fe3+) 5
Iron (Fe2+), silver (Ag+) 10 Nickel (Ni2+) 12
Cobalt (Co2+), zinc (Zn2+), cadmium (Cd2+), manganese (Mn2+), mercury (Hg2+)
25
Chromium (Cr3+) 50 Magnesium (Mg2+) 100
Ammonium (NH4+), phosphate (PO4
3-), calcium (Ca2+) 500 Potassium (K+), nitrate (NO3
-) 1000 Chloride (Cl-), sulfate (SO4
2-) 2000
WASTE STREAM AND PROPER DISPOSAL Hach Lange local agencies will accept used cuvettes to ensure their proper disposal in
accordance with local and national regulations.

111
Used syringe filters should be disposed in the correct waste stream disposal in the lab (
‘General waste’ in UGent, Campus Kortrijk).
REFERENCES
x APHA, Awwa, WEF, 2005. Standard Methods for the Examination of Water and
Wastewater, 21st ed. American Public Health Association, Washington DC.
x Beelen V., Van Den Hende S., 2014. Verbal communication. Ghent University, Campus
Kortrijk.
x Hach Lange, 2014. Safety Data Sheet LCK 341. Available on (01/06/2014):
http://www.camlab.co.uk/sitefiles/MSDS/Hach/HH_LCK341.pdf.
x Sigma-Aldrich, 2014. Citric acid. Available on (25/06/2014):
http://www.sigmaaldrich.com/catalog/product/sial/251275?lang=fr®ion=FR.
112
SOP: 2.3.e Nitrite-N (NO2-N) Manual Assay Anneliese Ernste
eHochschule für Technik und Wirtschaft des Saarlandes, Göbenstraße 40, 66117 Saarbrücken,
Germany
PURPOSE Nitrite is formed as an intermediate product of nitrification (biofilter 1). Nitrite is toxic for
cyanobacteria (14 mg L-1 NO2-N leading to 60 – 100% inhibition of photosynthesis at pH
6.0), but can be used as an (additional) N-source at low concentrations by many algae
(Wodzinski et al., 1978). Due to its high fish-toxicity it is monitored in the RAS. Under RAS
operation conditions, the nitrite-N concentration is < 0.2 mg L-1. Hence, nitrite is not regularly
measured in the algal suspensions.
PRINCIPLE Nitrite ions react in an acidic medium with sulfanilic acid to form an intermediate diazonium
salt. The salt couples with chromotrophic acid to form a pink colored complex directly
proportional to the nitrite concentration in the solution. Test results are measured at 507 nm.
REQUIREMENTS Centrifuge, centrifuge tubes, spectrophotometer, timer, 10-ml sample cells (cuvettes) with
stopper (or use parafilm to close), pipette (10 ml), pipette tips, powder pillows (for example
NitriVer® 3 Nitrite Reagent, Hach-Lange), deionized water as blank and for dilution of
samples.
HAZARDS AND PRECAUTIONARY STATEMENTS Hazards vary depending on the powder pillows used.
PROCEDURE a) Sample collection, preservation and storage (once for all nutrients)
1. Collect samples in clean glass or plastic bottles.
2. Remove cells of suspension by centrifugation and analyse as soon as possible after
collection.
3. If necessary, preserve supernatants by freezing at -20°C.

113
b) Measurement 1. Dilute clear supernatant with deionized water to reach measuring range (0 – 0.3 mg
L-1 NO2-N).
2. Fill a sample cell (cuvette) with 10 ml of (diluted) sample.
3. Add the contents of one powder pillow.
4. Swirl to dissolve.
5. Start timer for 20 min reaction period.
6. Wipe cell and insert in spectrophotometer and read the result.
7. Use sample or deionized water as blank.
CALCULATION OF RESULTS For calculation of results plot results of calibration inversely (i.e. extension on x-axis
concentration on y- axis) and calculate a linear trend line. Use equation to calculate
concentration (Note: this equation contains a correction for the reagent blank). For final
result, multiply with dilution factor.
CALIBRATION AND QUALITY CONTROL Prepare stock solution of standard (1 g L-1 NO2-N) dilute to 3 mg L-1 NO2-N; Prepare
standards with 0%, 10%, 25%, 40%, 55%, 70%, 85%, 100% final concentrations.
Add powder pillow and start the timer.
Use deionized water to zero the instrument at 507 nm.
Follow the steps and timing described above.
Measure extinction at 507 nm. Plot results and add linear trend line.
Determine the reagent blank value (0%) for each lot of reagent.
ERRORS AND INTERFERENCES This method is suitable for water wastewater and seawater. Strong oxidizing and reducing
substances interfere at all concentrations. Many ions of heavy metals can interfere by
causing precipitations (Au, Sb, Bi, PtCl6-, Pb, Hg, Ag, VO3- Fe3+) or low results (Cu2+, Fe2+).
High concentrations of nitrate (>100 mg L-1 NO3-N) appear to undergo a slight amount of
reduction in the test.
REFERENCES Hach Company 2007, 2010, 2012. Printed in the U.S.A.

114
Wodzinski RS, Labeda DP, Alexander M. Effects of low concentrations of bisulfite-sulfite
and nitrite on microorganisms. Applied and Environmental Microbiology. 1978;35(4):718-
723.
OTHER POINTS Nitrite is substrate of ubiquitous nitrifying bacteria. Therefore, samples should not stand at
room temperature.

115
SOP: 2.4.a Total Dissolved Nitrogen (TDN) – SFA Rhiannon Wilcoxa, Alla Silkinaa
aAlgal Research, Swansea University, Singleton Park, Swansea, SA28PP, UK
PURPOSE This procedure is to analyse seawater and freshwater for Total Dissolved Nitrogen (combined
ammonia, nitrate, nitrite and organic nitrogen).
PRINCIPLE Analysis is performed on a segmented flow analyser (SFA), model AutoAnalyser 3 (AA3) from
Seal Analytical. This analytical system in general consists of a chemistry module run by a
random access XY-2 Sampler, a high precision peristaltic pump, chemistry module trays where
actual reaction takes place and dual beam high resolution digital colorimeter which operates
within a wavelength range of 340 – 900 nm.
The pump transmits samples, reagents and air at defined flow rates through flexible pump
tubes. Individual sample segments are separated by the insertion of air or nitrogen bubbles.
Following the glass mixing coils in the chemistry tray is a heating bath, after which the sample is
passed into the colorimeter holding a krypton lamp and the coloured filter for the appropriate
method wavelength. The concentration of the sample is determined colourmetrically, as each
sample passes through the flowcell the maximum intensity of the colour is measured. The
absorbance is then compared to that of known concentration calibration standards and the
sample result calculated. Drift samples (the 2nd highest calibration standard) are analysed from
which the software determines if the baseline has changed from the beginning of the run.
Based on these the software adjusts sample readings to account for baseline drift. The automated procedure for the determination of total dissolved nitrogen is based on that
developed by the University of Hamburg. Inorganic and organic nitrogen compounds are
oxidised to nitrate by persulphate under alkaline conditions in an on-line UV digestor. The
nitrate is reduced to nitrite in a cadmium column and then determined using the
sulfanilamide/NEDD reaction with detection at 550 nm (Bran+Luebbe™, 2005).
REQUIREMENTS Equipment and materials
� Seal Analytical AA3 Segmented Flow Analyser (Pumps, XY Sampler, colorimeters,
chemistry module MT23)

116
� AACE 6.03 software on PC
� 550 nm filter
� Autosampler 5 ml cups (polystyrene)
� Deionised water
� Volumetric flasks (various)
� Pipettes and tips (5 ml and 1 ml)
� Plastic Pasteur pipettes (1 ml and 3 ml)
� Analytical balance and weigh boats
� Desiccator
� Stirrer
� Fume cupboard
� Beakers (various)
� Measuring cylinders (various)
� 250 ml and 100 ml bottles, PE
� Tube racks
� Dilution containers, 7 ml Bijou or 30 ml Universal
� Reagent bottles, glass and plastic
� 12-14 ml calibrant tubes (x6)
Reagents
Digestion Solution 3.75 g Sodium hydroxide
7.5 g Boric Acid
12.5 g Potassium persulphate
Into 250 ml deionised water
Store in glass bottle. Stable for 2 weeks. Persulphate will take a while to dissolve, may
need to be put on a stirrer.
Wetting Agent 24 ml Brij-35
Into 1000 ml deionised water
Stable for one month. The amount of Brij-35 can be increased if the bubble pattern is
irregular.
Colour reagent 75 ml Hydrochloric acid, conc

117
5 g Sulfanilamide
0.25 g N-1-Naphthylethylenediamine dihydrochloride
Into 500 ml deionised water
Stable for one month. Store in an amber bottle in the fridge.
Ammonium chloride 12.5 g Ammonium chloride
1 ml Ammonia solution, 25%
Into 250 ml deionised water
Add 0.5 ml Brij-35
Add 2-3 drops of 2% Copper sulphate solution
Stable for one week.
Copper sulphate solution 2% (for cadmium column conditioning) 2 g Copper sulphate
Into 100 ml deionised water
Stable indefinitely.
Hydrochloric acid 2 M (for cadmium column conditioning) 167 mL Hydrochloric acid, conc
Into 1000 ml deionised water
Stable indefinitely.
HAZARDS AND PRECAUTIONARY STATEMENTS
Hydrochloric acid and Ammonia solution are corrosive, therefore a fume cupboard is necessary
for the preparation of the colour reagent and ammonium chloride reagent. Acids are stored in
corrosive cabinets
Potassium nitrite is toxic and is stored in the poisons cabinet. All precautions should be used
when preparing stock solutions.
Cadmium is toxic, the column is prepared separately and cadmium is stored in the poisons
cabinet. The column is separated from the manifold by a 4 way valve, any leaks or loss of
cadmium should be treated with all precautions.
118
Copper sulphate is dangerous to the environment so all spills and chemical solutions should be
strictly contained from release to the environment.
All other chemicals are irritants and potentially harmful therefore proper PPE and risk
assessment should be adhered to. Consult the MSDS for precautionary measures.
PROCEDURE
Preparation of stock solutions
Standard Stock Solution 1000 µmol L-1
0.1011 g (+ 0.0001 g) Potassium nitrate (Dried at 105°C for 2 hours, cool in a
desiccator)
Into 1000 ml deionised water (freshwater)
Or Artificial Seawater
35 g Sodium chloride
0.2 g Sodium hydrogen carbonate
Into 1000 ml deionised water
Nitrate Quality Control Stock Solution 1000 µmol L-1 0.0850 g (+ 0.0001 g) Sodium nitrate (Dried at 105°C for 2 hours, cool in a
desiccator)
Into 1000 ml deionised water
Or Artificial Seawater
35 g Sodium chloride
0.2 g Sodium hydrogen carbonate
Into 1000 ml deionised water
Nitrite Quality Control Stock Solution 1000 µmol L-1 0.0850 g (+ 0.0001 g) Potassium nitrite (Dried at 105°C for 2 hours, cool in a
desiccator)
Into 1000 ml deionised water
Or Artificial Seawater
35 g Sodium chloride
0.2 g Sodium hydrogen carbonate

119
Into 1000 ml deionised water
All Stock Solutions are stable for 3 months, store in the fridge.
Preparation of standards and samples
Pipette calibration standards and analytical quality controls (AQC’s) into deionised water
for freshwater analysis, or into artificial seawater for seawater analysis. Use the
following amounts;
Table 1 Preparation of working calibration standards and AQC’s
Standard concentration µmol L-1
Volumetric flask volume
Volume of 1000 µmol L-1 stock solution to pipette
0 N/A 0
5 100 0.5 250 1.25
10 100 1.0 250 2.5
20 100 2.0 250 5.0
30 100 3.0 250 7.5
40 100 4.0 250 10.0
60 100 6.0 250 15.0
Pick a mid-range value for the analytical quality control (AQC), i.e. the 0-60 µmol L-1 range
requires 6 calibrants including a zero blank, so 30 is mid-range and not normally one of the
calibrants used. Calibration standards are stored in plastic bottles, and are stable for 1 week if
stored in the fridge.
Dilute the samples to within the range using deionised water, targeting a concentration between
20 – 50 µmol L-1. If the concentration of samples is unknown run them direct without dilution
and then when the preliminary results are charted add on a sample dilution to the end of the
run.

120
Measurement of standards and samples
1. Turn on computer and autosampler
2. Ensure the manifold is connected to the colorimeter and that the manifold for DOC is
connected to the waste line.
3. Move the autosampler line to the TN/TP sample line.
4. Connect pump platens, turn on both pumps and put red toggle switches to Run.
5. Turn on the UV digestor.
6. Turn on colorimeters and install 550 nm filter
7. Load AACE 6.03 software from computer desktop
8. Click on Charting, click Change and find ‘TDN’ on list. Select to highlight and then press
OK.
9. Shake reagents to mix
10. When deionised water has been pumping for 15-20 minutes then insert labelled reagent
probes into reagent bottles (ammonium chloride has two probes). Ensure deionised
water containers are topped up
11. Along the top of the main screen click ‘Set Up’, and then ‘Analysis’. Click onto an
existing tray and click ‘Copy run’. Give this a new reference name and check that the
calibrants are correct.
12. Click on Tray protocol tab and amend list to reflect current sample references. Insert an
AQC at the end of each row (every 11 samples), and also a Null and Drift. Print a copy
for reference when loading samples. Click OK when done.
13. Once the reagents have been pumping for 15-20 minutes turn on the cadmium column
by turning the 4 way valve 45° clockwise. Using the two ammonium chloride reagent
probes pump 2 M Hydrochloric acid through the column for 2 minutes, then 2% Copper
sulphate for 4 minutes and then 2 M Hydrochloric acid again for 5 minutes. Return the
probes to the ammonium chloride reagent.
14. Once reagents have been pumping for a further 20-30 minutes, in the charting window
labelled Ch2-1- Tot.Dis.N right click and ‘Set base’
15. Fill a rinsed 14 mL calibrant tube with the top standard (i.e. 60 µmol L-1) and place in
position 1 on the rack. Double click on ‘XY Sampler’ and click ‘sample’. Time for 2
minutes and then click ‘wash’. Click ‘cancel’ to close.
16. Wait 26 minutes for the peak to come through on the charting window, then when it
starts to stabilise (level off) right click and ‘Set gain’. This should be between 75-85%
absorbance. The gain should be around 7.

121
17. Fill the other rinsed calibrant tubes with fresh calibration standards and load into the rack
in high to low order, double check baseline is at 5% and click ‘Set base’ if necessary.
Click ‘Run’, find the new tray name and double click. Press OK.
18. Load the samples according to the printed tray layout, rinsing the 5 ml cups with a little
volume before filling.
19. The calibration coefficient will be displayed before the sample peaks are shown, check
that this 0.9990 or better.
20. When run is finished a message will appear. Click OK. Turn the cadmium column off by
turning the 4 way valve 45° anticlockwise. Switch reagent probes into deionised water to
rinse for 30 minutes – 1 hour. If running other analyses then use 1 N HCl to wash out for
15 minutes, especially the ammonium chloride lines. Turn off the colorimeters, the
autosampler and the UV digestor. When finished rinsing put the red toggle switches on
the pumps to Stop. Disconnect the pump platens and turn off the pumps. Top up
deionised water containers. Dispose of waste down the sink and dispose of remaining
samples as appropriate. Throw away used autosampler cups and rinse calibrant tubes
with deionised water. Rinse any pipette tips used for dilutions. Rinse and throw away
any dilution containers used.
21. Click ‘Retrieve’, and ‘View Chart’. Check all peaks are correct and then click on ‘Report’.
Print the results.
22. Export the results to Excel by clicking on ‘File’ along the top, then ‘Export to’, ‘ASCII file’,
find the correct run name and double click, click ‘Export’ and ‘Save’, then close. The
Excel file will be available in the ‘Data’ folder on the desktop. When finished turn off
computer.
CALCULATION OF RESULTS Results are expressed as µmol L-1 as N. If dilution has been used then multiply by the
appropriate factor. The AACE software accounts for baseline drift during the run. The range is
0 – 60 µmol L-1, although the detection limit of the method specified by the manufacturer is 0.1
µmol L-1.
QUALITY CONTROL AQC’s are run at the mid range point of the calibration. They are usually analysed 1 per 11
samples, and the results are plotted on Quality Control Charts within Excel. Separate nitrate
and nitrite AQC’s are analysed in order to determine the reduction efficiency of the cadmium
column. If any QC’s exceed + 10% and a cause cannot be determined then a repeat analysis

122
will be required. If a number of QC’s exceed + 5%, then prepare an additional AQC solution to
check. The QC stock is sourced and prepared separately to the standard stock. Sample
spiking with a known concentration can also be used as a quality control.
ERRORS AND INTERFERENCES The matrix of the samples and calibration standards can affect the chemistry, therefore as close
a match as possible should be made between matrices. For freshwater samples use deionised
water standards, but for seawater samples use Artificial Seawater. Interferences can occur if
other chemistries are run on the same manifold, this especially applies for total dissolved
phosphorus which uses an ammonium molybdate reagent that will need to be completely
washed out. All attempts should be made to completely wash out chemicals before analysis,
possibly using 1 N HCl. Coloured samples or particulates can interfere with the light path and
therefore read higher than actual.
Pipettes should be used to dilute samples into deionised water. Samples should be defrosted in
the fridge 12 hours before analysis if possible, and should only remain frozen for as little time as
possible before analysis.
Some potassium persulphate contains nitrogenous contaminants, so check the purity of the
chemical is the reagent absorbance is too high (Bran+Luebbe™, 2005).
WASTE STREAM AND PROPER DISPOSAL All waste can be flushed down the sink with copious amounts of tap water. The sink log should
also be completed for any chemicals disposed of. Large amounts of ammonium chloride
reagent and copper sulphate should be separated for disposal over a longer period. Anything
relating to the cadmium column must be separated for hazardous waste disposal.
Dispose of used autosampler cups and dilution containers.
REFERENCES Bran+Luebbe™ (2005), AutoAnalyser Application, Method No: G-218-98 Rev 8.

123
SOP: 2.4.b Analysis of total nitrogen in water samples (TN) Alexandra Lefoulonb, Sofie Van Den Hendeb
bDepartment of Industrial Biological Sciences (former Howest University College)(, Faculty of Bioscience
Engineering, Ghent University, Campus Kortrijk, Karel de Goedelaan 5, 8500 Kortrijk, Belgium
PURPOSE The purpose of this analysis is to determine the total nitrogen (TN) concentration in water
samples including wastewater. This TN includes organic N and inorganic N (NH3, NH4+, NO2
-
and NO3-).
PRINCIPLE
Inorganically and organically bonded nitrogen is oxidized to nitrate (NO3-) by digestion
(Koroleff digestion) with peroxodisulphate (S2082-) in an alkaline solution. The nitrate ions react
with 2,6-dimethylphenol (C8H10O; 2,6-xylenol) in a solution of sulphuric and phosphoric acid to
form a nitrophenol (C6H5NO3). The quantity of nitrophenol, a yellow product, is then determined
by spectrophotometry at 350 nm.

124
REQUIREMENTS EQUIPMENT AND MATERIALS
x Hach Lange kit LCK 238, 5-40 mg N L-1 including one dry reaction tube in glass for each
sample.
x spectrophotometer (Hach Lange DR 2800, Belgium)
x thermostat or HT 200 S machine
x micropipette 1-5 mL and tips
x micropipette 100-1000 µL and tips
x for samples with large suspended solids: a glass beaker of 500 mL, a blender or a
mixing device, one magnetic stirrer, a glass beaker of 100 mL and a stirring magnet
REAGENTS
x reagents present in the HL kit LCK 238: A: sodium hydroxide solution
B: oxidant tablet
C: microCap
x raw water sample (500 µL of prepared sample is needed for the analysis; around 100
mL of sample is needed if the sample needs to be mixed) stored at 4°C
x demineralized water
HAZARDS AND PRECAUTIONARY STATEMENTS
x Always wear a laboratory coat, eye protection and laboratory gloves.
x Use only Hach Lange kit LCK 238 in well-ventilated areas.
x Keep the test kit in tightly closed in a dry and well-ventilated place.
x To avoid thermal decomposition, do not overheat. Above 300°C, hazardous fumes may
be released.
x Act carefully and take appropriate measure concerning the hazardous reagents.
Reagent Hazard statements Precautionary statements
Sulphuric acid (H2SO4)
- Causes severe skin burns
and eye damage. - Harmful to aquatic life with
long lasting effects.
- Avoid release to the environment.
- Wear protective gloves/ protective clothing/ eye protection/ face protection.
- If in eyes: Rinse cautiously with water for several minutes. Remove contact lenses, if present and easy to do. Continue rinsing.

125
- Immediately call a Poison Center or doctor/physician.
Phosphoric acid (H3PO4)
- May be corrosive to metals. - Causes severe skin burns
and eye damage.
- Wear protective gloves/ protective clothing/ eye protection/ face protection.
- If in eyes: Rinse cautiously with water for several minutes. Remove contact lenses, if present and easy to do. Continue rinsing.
- Immediately call a Poison Center or doctor/physician.
Sodium hydroxide (NaOH)
- Causes severe skin burns
and eye damage.
- Wear protective gloves/protective clothing/ eye protection/ face protection.
- If in eye: rinse cautiously with water for several minutes. Remove contact lenses, if present and easy to do. Continue rinsing.
- Immediately call a Poison Center or doctor/physician.
Sodium persulfate (Na2S2O8)
- May intensify fire; oxidiser. - Harmful if swallowed. - Causes skin irritation. - May cause an allergic skin
reaction. - Causes serious eye irritation. - May cause allergy or asthma
symptoms or breathing difficulties if inhaled.
- May cause respiratory irritation.
- Keep/ Store away from clothing/ combustible materials.
- Avoid breathing dust. - Wear protective gloves. - If in eyes: rinse cautiously with
water for several minutes. Remove contact lenses, if present and easy to do. Continue rinsing.
- If experiencing respiratory symptoms: Call a Poison Center or doctor/ physician.
2,6-xylenol (C8H10O)
- Toxic if swallowed. - Toxic in contact with skin. - Causes severe skin burns
and eye damage.
- Avoid release to the environment.
- Wear protective gloves/ protective clothing/ eye protection/ face protection.
- If swallowed: immediately call a poison center or doctor/

126
- Toxic to aquatic life with long lasting effects.
physician. - If in eye: rinse cautiously with
water for several minutes. Remove contact lenses, if present and easy to do. Continue rinsing. Immediately call a Poison Center or doctor/physician
PROCEDURE
SAMPLE PREPARATION
Samples which contain large suspended particles should be blended to reduce the particle size
smaller than the micropipette tip, for example as follows:
1. Add 100 mL of sample in a beaker of 100 mL.
2. Mix the sample until the sample is homogenous and no large particles (not larger than
the pipette tip size) remain in the sample.
3. Add a stirring magnet to the sample and put on a magnetic stirrer.
4. The sample should be analyzed immediately after blending and while stirring.
Here under follows the procedure for samples with a TN concentration of 5-40 mg N L-1. For
samples with a TN concentration above 40 mg N L-1, dilutions should be made with
demineralized water. All pictures are courtesy of Hach Lange (2014).
Figure 1. Sample analysis (Hach Lange 2014)
1. Add in quick succession to a clean and dry
reaction tube in glass: 500 µL sample, 2.0 mL solution A and 1 tablet B. If the sample contains suspended particles, the sample should be taken with a micropipette while stirring on a magnetic stirrer. Close immediately the reaction tube. Do not invert this tube.
2. Heat immediately this glass tube with a: a) Thermostat: 60 min at 100°C; b) or a HT 200 S: in standard program HT for 15
min; c) Oven: 60 min at 100°C.

127
Figure 2. Sample analysis (Hach Lange 2014)
3. Cool down the tube to 18-20 °C and add 1 MicroCap C to the reaction tube.
4. Close the reaction tube and invert a few times until the powder content is fully removed from the MicroCap C and all streaks are vanished. This is the digested sample.
5. Slowly pipette 500 µL of digested sample into the HL test cuvette.
6. Slowly pipette 200 µL solution D in the test cuvette. Immediately close the cuvette and invert a few times until no more streaks are observed..
7. Wait exactly 15 min. Clean the outside of the cuvette thoroughly with paper while waiting.
SAMPLE ANALYSIS Put the cleaned cuvette in the spectrophotometer. The mode to determine (LCK 238) will be
automatically selected by the bar code reader. The selected wavelength should be 370 nm. The
spectrophotometer shows the TN in mg N L-1 on the display.

128
CALCULATION OF RESULTS - The conversion of absorbance to TN is done by the spectrophotometer.
- For diluted samples, the used dilution factor should be taken into account. QUALITY CONTROL
- Validity range of the sample: 5-40 mg N L-1, pH: 3-12 and temperature: 15-25 °C.
- The range of TN of wastewater samples strongly depend on the wastewater types and
values up to 1600 mg L-1 have been reported (Van Den Hende, 2014).
- The measurement results must be subjected to plausibility checks (dilute and/or spike
the sample).
ERRORS, CALIBRATION AND INTERFERENCES The glass reactions tubes should not be used more than 13 times. After use, clean
thoroughly with a brush and tap water, then rinse well with demineralized water and dry.
Slight turbidities present do not interfere. Strong turbidities after addition of the MicroCap
C should be allowed to settle or filtered by using membrane filtration set LCW 904.
After addition of reagents A, B and C the bottles must be reclosed immediately.
Low-bias results are to be expected if the samples contain a large amounts of reducing
agents or interfering substances (Table 1).
Confidence interval of 5-40 mg N L-1 (95 %): ± 0.87 mg N L-1.
Table 1. Substances which interfere with TN measurements
Interfering substance Interference level (mg L-1)
Chemical oxygen demand (COD) 1000 Chloride (Cl-) 2000
WASTE STREAM AND PROPER DISPOSAL
Hach Lange local agencies accept used cuvettes to ensure their proper disposal in
accordance with local and national regulations. These used cuvettes should thus be stored and
send back to Hach Lange.

129
REFERENCES - Van Den Hende S., 2014. Microalgal bacterial flocs for wastewater treatment: from
concept to pilot scale. PhD thesis, Ghent University, Ghent, 324p. - Beelen V., Van Den Hende S., 2014. Verbal communication. - Hach Lange, 2014. Safety Data Sheet LCK 238. Available on (01/06/2014):
http://www.hach-lange.hr/countrysites/action_q/download%3Bmsds/msds_document/en%252FLCK238%252Epdf/lkz/HR/spkz/hr/TOKEN/4y2c2Kaa11XumudHIv5qmfwG4UQ/M/SUBZkA.
- Leo M.L. Nollet, 2007. Handbook of Water Analysis, Second edition, CRC Press, 375p. Available on (25/06/2014): http://books.google.be/books?id=YZpW4Y4Q_PIC&pg=PA389&dq=digestion+koroleff&hl=fr&sa=X&ei=G8-qU9XbD-q00QWQ1oGIDQ&ved=0CB0Q6AEwAA#v=onepage&q=digestion%20koroleff&f=false.
- Sigma-Aldrich, Sulphuric acid. Available on (25/06/2014): http://www.sigmaaldrich.com/catalog/product/aldrich/339741?lang=fr®ion=FR.
- Sigma-Aldrich, Phosphoric acid. Available on (25/06/2014): http://www.sigmaaldrich.com/catalog/product/sigma/p5811?lang=fr®ion=FR.
- Sigma-Aldrich, Sodium hydroxide. Available on (25/06/2014): http://www.sigmaaldrich.com/catalog/product/fluka/38210?lang=fr®ion=FR.
- Sigma-Aldrich, 2014. Sodium persulfate. Available on (26/06/2014): http://www.sigmaaldrich.com/catalog/product/sial/216232?lang=fr®ion=FR.
- Sigma-Aldrich, 2,6-Xylenol. Available on (25/06/2014): http://www.sigmaaldrich.com/catalog/product/aldrich/w324906?lang=fr®ion=FR.

130
SOP: 2.5.a Phosphate – SFA Rhiannon Wilcoxa, Alla Silkinaa
aAlgal Research, Swansea University, Singleton Park, Swansea, SA28PP, UK
PURPOSE This procedure is to analyse seawater and freshwater for phosphate, PO4.
PRINCIPLE
Analysis is performed on a segmented flow analyser (SFA), model AutoAnalyser 3 (AA3)
from Seal Analytical. This analytical system in general consists of a chemistry module run by a
random access XY-2 Sampler, a high precision peristaltic pump, chemistry module trays where
actual reaction takes place and dual beam high resolution digital colorimeter which operates
within a wavelength range of 340 – 900 nm.
The pump transmits samples, reagents and air at defined flow rates through flexible
pump tubes. Individual sample segments are separated by the insertion of air or nitrogen
bubbles. Following the glass mixing coils in the chemistry tray is a heating bath, after which the
sample is passed into the colorimeter holding a krypton lamp and the coloured filter for the
appropriate method wavelength. The concentration of the sample is determined
colourmetrically, as each sample passes through the flowcell the maximum intensity of the
colour is measured. The absorbance is then compared to that of known concentration
calibration standards and the sample result calculated. Drift samples (the 2nd highest
calibration standard) are analysed from which the software determines if the baseline has
changed from the beginning of the run. Based on these the software adjusts sample readings
to account for baseline drift. The automated procedure for the determination of ortho-phosphate is based on the
colorimetric method in which a blue colour is formed by the reaction of ortho-phosphate,
molybdate ion and antimony ion followed by reduction with ascorbic acid at a pH<1. The
reduced blue phospho-molybdenum complex is read at 880 nm (Murphy and Riley, 1962;
Bran+Luebbe™, 2005).
REQUIREMENTS Equipment and materials

131
� Seal Analytical AA3 Segmented Flow Analyser (Pumps, XY Sampler,
colorimeters, chemistry module MT18)
� AACE 6.03 software on PC
� 880 nm filter
� Autosampler 5 mL cups (polystyrene)
� Deionised water
� Volumetric flasks (various)
� Pipettes and tips (5 mL and 1 mL)
� Plastic Pasteur pipettes (1 mL and 3 mL)
� Analytical balance and weigh boats
� Desiccator
� Stirrer
� Fume cupboard
� Beakers (various)
� Measuring cylinders (various)
� 250 mL and 100 mL bottles, PE
� Tube racks
� Dilution containers, 7 mL Bijou or 30 mL Universal
� Reagent bottles, glass and plastic
� 12-14 mL calibrant tubes (x6)
Reagents
Stock Antimony potassium tartrate 2.3 g Antimony potassium tartrate
Into 100 mL deionised water
Stable for one month.
Ammonium molybdate 32 mL Sulphuric acid, conc
3 g Ammonium molybdate
11 mL Stock antimony potassium tartrate
Into 500 mL deionised water
Will need to cool flask after addition of sulphuric acid. Store in a dark bottle. The
solution is stable for one month. The ammonium molybdate much be perfectly white and
the solution colourless.

132
Ascorbic acid 2 g Ascorbic acid
11.25 mL Acetone
2 g Sodium dodecyl sulphate
Into 250 mL deionised water
Store in a dark bottle in the fridge. Stable for one week.
HAZARDS AND PRECAUTIONARY STATEMENTS
x Sulphuric acid is corrosive and causes burns, therefore a fume cupboard is necessary for
preparation and dealing with acids. Acids are stored in corrosive cabinets.
x Acetone is flammable and therefore also requires a fume cupboard for preparation of the
Ascorbic acid reagent. Flammables are stored in a flammables cabinet.
x All other chemicals are irritants and potentially harmful therefore proper PPE and risk
assessment should be adhered to. Consult the MSDS for precautionary measures.
x Antimony potassium tartrate is dangerous to the environment so any solid chemical (i.e.
spills) should be strictly contained.
PROCEDURE
Preparation of stock solutions
Standard Stock Solution 1000 µmol L-1
0.1362 g (+ 0.0001 g) Potassium dihydrogen phosphate (Dried at 105°C for 2
hours, cool in a desiccator)
Into 1000 mL deionised water (freshwater)
Or Artificial Seawater
35 g Sodium chloride
0.2 g Sodium hydrogen carbonate
Into 1000 mL deionised water
Quality Control Stock Solution 1000 µmol L-1

133
0.1420 g (+ 0.0001 g) Sodium hydrogen phosphate (Dried at 105°C for 2 hours,
cool in a desiccator)
Into 1000 mL deionised water
Or Artificial Seawater
35 g Sodium chloride
0.2 g Sodium hydrogen carbonate
Into 1000 mL deionised water
Both Stock Solutions are stable for 3 months, store in the fridge.
Preparation of standards and samples
Pipette calibration standards and analytical quality controls (AQC’s) into deionised water
for freshwater analysis, or into artificial seawater for seawater analysis (see 4.1). Use the
following amounts;
Table 1 Preparation of working calibration standards and AQC’s
Standard concentration µmol L-1
Volumetric flask volume
Volume of 1000 µmol L-1 stock solution to pipette
0 N/A 0
5 100 0.5 250 1.25
10 100 1.0 250 2.5
20 100 2.0 250 5.0
30 100 3.0 250 7.5
40 100 4.0 250 10.0
60 100 6.0 250 15.0
Pick a mid range value for the analytical quality control (AQC), i.e. the 0-60 µmol L-1
range requires 6 calibrants including a zero blank, so 30 is mid range and not normally one of
the calibrants used. Calibration standards are stored in plastic bottles, and are stable for 1
week if stored in the fridge.

134
Dilute the samples to within the range using deionised water, targeting a concentration
between 20 – 50 µmol L-1. If the concentration of samples is unknown run them direct without
dilution and then when the preliminary results are charted add on a sample dilution to the end of
the run.
Measurement of standards and samples
1. Turn on computer and autosampler
2. Connect pump platen, turn on pump and put red toggle switch to Run.
3. Turn on colorimeter and install 880 nm filter 4. Load AACE 6.03 software from computer desktop
5. Click on Charting, click Change and find ‘Ammonia-Phosphate2’ on list. Select to
highlight and then press OK. Can be run as a multi-test with ammonia, if ammonia is not
needed then the additional chart can be closed after the baseline has been found.
6. Shake reagents to mix
7. When deionised water has been pumping for 15-20 minutes then insert labelled reagent
probes into reagent bottles (Channel 2 Reagent 1 – Ascorbic acid; Channel 2 Reagent 2
– Ammonium molybdate)
8. Ensure deionised water containers are topped up 9. Along the top of the main screen click ‘Set Up’, and then ‘Analysis’. Click onto an
existing tray and click ‘Copy run’. Give this a new reference name and check that the
calibrants are correct (see section 4.2). 10. Click on Tray protocol tab and amend list to reflect current sample references. Insert an
AQC at the end of each row (every 11 samples), and also a Null and Drift. Print a copy
for reference when loading samples. Click OK when done. 11. Once reagents have been pumping for 20-30 minutes, in the charting window labelled
Phosphate right click and ‘Set base’
12. Fill a rinsed 14 mL calibrant tube with the top standard (i.e. 60 µmol L-1) and place in
position 1 on the rack. Double click on ‘XY Sampler’ and click ‘sample’. Time for 2
minutes and then click ‘wash’. Click ‘cancel’ to close.
13. Wait 6-7 minutes for the peak to come through on the charting window, then when it
starts to stabilise (level off) right click and ‘Set gain’. This should be between 75-85%
absorbance. The gain should be around 74-77. 14. Fill the other rinsed calibrant tubes with fresh calibration standards and load into the rack
in high to low order, double check baseline is at 5% and click ‘Set base’ if necessary.
Click ‘Run’, find the new tray name and double click. Press OK.

135
15. Load the samples according to the printed tray layout, rinsing the 5 ml cups with a little
volume before filling. 16. The calibration coefficient will be displayed before the sample peaks are shown, check
that this 0.9990 or better. 17. When run is finished a message will appear. Click OK. Switch reagent probes into
deionised water to rinse for 30 minutes – 1 hour. If running other analyses then use 1 N
HCl to wash out for 15 minutes. Turn off the colorimeter and the autosampler. When
finished rinsing put the red toggle switch on the pump to Stop. Disconnect the pump
platen and turn off the pump. Top up deionised water containers. Dispose of waste
down the sink and dispose of remaining samples as appropriate. Throw away used
autosampler cups and rinse calibrant tubes with deionised water. Rinse any pipette tips
used for dilutions. Rinse and throw away any dilution containers used. 18. Click ‘Retrieve’, and ‘View Chart’. Check all peaks are correct and then click on ‘Report’.
Print the results.
19. Export the results to Excel by clicking on ‘File’ along the top, then ‘Export to’, ‘ASCII file’,
find the correct run name and double click, click ‘Export’ and ‘Save’, then close. The
Excel file will be available in the ‘Data’ folder on the desktop. When finished turn off
computer.
CALCULATION OF RESULTS Results are expressed as µmol L-1 as P. If dilution has been used then multiply by the
appropriate factor. The AACE software accounts for baseline drift during the run. The range is
0 – 60 µmol L-1, however this can be lowered to 0 – 10 µmol L-1. The detection limit of the
method specified by the manufacturer is 0.05 µmol L-1.
QUALITY CONTROL
AQC’s are run at the mid range point of the calibration. They are usually analysed 1 per
11 samples, and the results are plotted on Quality Control Charts within Excel. If any QC’s
exceed + 10% and a cause cannot be determined then a repeat analysis will be required. If a
number of QC’s exceed + 5%, then prepare an additional AQC solution to check. The QC stock
is sourced and prepared separately to the standard stock (see section 4.1). Sample spiking
with a known concentration can also be used as a quality control.
ERRORS AND INTERFERENCES
The matrix of the samples and calibration standards can affect the chemistry, therefore
as close a match as possible should be made between matrices. For freshwater samples use

136
deionised water standards, but for seawater samples use Artificial Seawater (see section 4.1).
Interferences can occur if other chemistries are run on the same manifold, all attempts should
be made to completely wash out chemicals before analysis, possibly using 1 N HCl. Coloured
samples or particulates can interfere with the light path and therefore read higher than actual.
Pipettes should be used to dilute samples into deionised water. Samples should be
defrosted in the fridge 12 hours before analysis if possible, and should only remain frozen for as
little time as possible before analysis.
WASTE STREAM AND PROPER DISPOSAL
All waste can be flushed down the sink with copious amounts of tap water. The sink log
should also be completed for any chemicals disposed of. Large amounts of Ammonium
molybdate reagent, and Antimony potassium tartrate stock should be separated for disposal
over a longer period.
Dispose of used autosampler cups and dilution containers.
REFERENCES
Bran+Luebbe™ (2005), AutoAnalyser Application, Method No: G-175-96 Rev 12.
Murphy, J., and Riley, J.P. (1962) ‘A modified single solution for the determination of
phosphate in natural waters’, Analytica Chimica Acta, vol. 27, pp. 31-36

137
SOP: 2.5.b Analysis of dissolved orthophosphate using a colorimetric method Sofie Van Den Hendeb
bDepartment of Industrial Biological Sciences (former Howest University College)(, Faculty of Bioscience
Engineering, Ghent University, Campus Kortrijk, Karel de Goedelaan 5, 8500 Kortrijk, Belgium
PURPOSE This procedure is used to determine the dissolved orthophosphate concentration of
wastewater using a colometric method.
PRINCIPLE This procedure for the determination of orthophosphate in wastewater according to
standards ISO 6878-1-1986, DIN 38405 D11-4 (Hach Lange test kit LCK 349 for ranges of 0.05
to 1.5 mg PO43--P L-1). Samples are filtered at 0.2 µm to remove suspended solids from the
water sample and remain dissolved ortho-phosphate ions. In the applied colometric phosphor-
molybdenum blue method, the orthophosphate ions (PO43-) in the acidified solution react with
ammonium molybdate and antimony potassium tartrate under acidic conditions to form a
complex. This blue-coloured phosphomolybdenum complex is reduced with ascorbic acid to
form a blue complex that adsorbs light at 880 nm. The absorbance is proportional to the
concentration of orthophosphate in the sample (Murphy and Riley, 1962; APHA et al., 2005).
REQUIREMENTS EQUIPMENT AND MATERIALS
x HL LCK 349 for 0.05-1.5 mg PO43-P L-1 (Hach Lange, Belgium)
x a spectrophotometer (Hach Lange DR 2800, Belgium)
x a micropipette of 100-1000 µL and tips
x a micropipette of 1-5 mL and tips
x a syringe filter with 0.2 µm pore size (Chromafil RC-20125, Germany) and plastic
syringe
x a glass beaker of 100 mL
x 1 centrifuge tube of 10 mL (VWR, Belgium) for the filtered sample
x 1 centrifuge tube of 10 mL (VWR, Belgium) for each sample dilution

138
REAGENTS
x reagents present in the HL kit LCK 349: ‘reagent LCK B’ and ‘grey DosiCap LCK 349
C’ (Hach Lange, Belgium)
x raw water sample stored at 4 °C (2 mL of prepared sample is needed for the analysis;
around 20 mL of sample is needed to filter)
x demineralized water
HAZARDS AND PRECAUTIONARY STATEMENTS x Act carefully and take appropriate measure concerning the hazardous reagent sulphuric
acid. The cuvette contains 11% sulphuric acid and reagent LCK 349 B contains 16%
sulphuric acid (Table 1). x Ascorbic acid is relatively non-hazardous in routine industrial situations. It is not
expected to present significant health risks to the workers who use it under the
concentrations used in this procedure.
Table 1. Hazardous reagents used in LCK 349 and precautionary statements Reagent Hazard statements Precautionary statements
Sulphuric acid (H2SO4)
- Causes severe skin burns and
eye damage. - Harmful to aquatic life with long
lasting effects.
- Avoid release to the environment.
- Wear protective gloves/ protective clothing/ eye protection/ face protection.
- If in eyes: Rinse cautiously with water for several minutes. Remove contact lenses, if present and easy to do. Continue rinsing.
- Immediately call a Poison Center or doctor/physician.
PROCEDURE
SAMPLE PREPARATION
x The raw sample should be filtered as soon as possible after sampling to not change its
phosphate concentration.
x Pour around 20 mL of sample in a glass beaker of 100 mL.
x Take with a syringe 10 mL of this sample, add the syringe filter and pour minimum 3 mL
of sample through the syringe filter in a labeled centrifuge tube.
x This filtered sample can be stored for 2 weeks at 4 °C or longer at -18 °C.

139
SAMPLE ANALYSIS
x Here under follows the procedure for samples with concentration of 0.05-1.50 mg P-
PO43--P L-1. For samples with higher concentrations, dilutions should be made with
demineralized water and the filtered sample. All pictures are courtesy of Hach Lange (2014).
Figure 1. Sample analysis (Hach Lange 2014)
.
1. Pipette 2.0 mL of filtered sample in the reaction cuvette.
2. Pipette 0.2 mL reagent LCK 349 B in the reaction cuvette. Close reagent B immediately after use.
3. Screw a grey DosiCap C (LCK 349 C) onto the cuvette.
4. Invert a few times. After 10 minutes invert a few times more, thoroughly clean the outside of the cuvette and evaluate. The spectrophotometer shows the phosphate in mg PO4
3- L-1 or PO43--P L-1 on its display.
CALCULATION OF RESULTS x The conversion of absorbance to P-PO4
3- is done by the spectrophotometer.
x The spectrophotometer shows the phosphate in mg PO43- L-1 or PO4
3--P L-1 on its display.
x If a diluted sample was analysed, then multiply the obtained result by the appropriate
dilution factor.
QUALITY CONTROL x Dilutions and spiking of samples can be done as a quality control.
x Wastewater samples may contain over 10 mg PO43--P L-1 (Van Den Hende, 2014).

140
ERRORS, CALIBRATION AND INTERFERENCES x High loads of oxidisable organic substances (COD, chemical oxygen demand) cause the
reagent to change colour and give high-bias results. This is another reason why the
sample should be filtered, especially if the water sampled contains over 200 mg COD
L-1.
x The range of measurement is 0.05-1.5 mg PO43-P L-1.
x Various compounds may interfere with this procedure (Table 2). Dilutions should be
made to lower their concentrations to below their interference level.
x Silica forms a pale blue complex that also absorbs at 880 nm. The interference is in
general insignificant because a silica concentration of minimum 30 mg L-1 would be
required to produce a 0.005 mg L-1 positive error in orthophosphate (APHA et al., 2005).
x Concentrations of ferric iron greater than 50 mg L-1 cause a negative errors due to
competition with the complex for the reducing agent ascorbic acid. Treat samples high in
iron with sodium bisulfite to eliminate this interference, as well as the interference due to
arsenates (APHA et al., 2005).
x Glassware contamination is a problem in low-level phosphorous determinations. Wash
glassware with hot dilute HCl and rinse with reagent water. Commercial detergents are
rarely needed but, if they are used, use special phosphate-free preparations (APHA et
al., 2005).
Table 2. Overview of substances which can interfere with phosphate measurements by means of test kit LCK 349 (Hach Lange, 2014)
Interfering substance Interference level (mg L-1)
Sulphate (SO42-) 5000
Chloride (Cl-) 2000 Potassium (K+), sodium (Na+) 1000 Nitrate (NO3-) 500 Calcium (Ca2+), 250 Magnesium (Mg2+) 100 Cobalt (Co2+), iron (Fe2+ and Fe3+), zinc (Zn2+), copper (Cu2+) , nickel (Ni2+), iodium (I-), nitrite (NO2
-), cadmium (Cd2+), ammonium (NH4+),
manganese (Mn 2+), aluminum (Al3+), cobalt (Co32-), silica dioxide (SiO2)
50
Tin (Sn4+), mercury (Hg2+) 5 Silver (Ag+), lead (Pb2+) 2.5 Chromium (Cr3+) 1 Chromium (Cr6+) 0.5

141
WASTE STREAM AND PROPER DISPOSAL x Hach Lange local agencies accept used cuvettes to ensure their proper disposal in
accordance with local and national regulations. These used cuvettes should thus be
stored and send back to Hach Lange.
x Used syringe filters should be disposed in the correct waste stream disposal in the lab
(‘General waste’ in UGent, Campus Kortrijk).
REFERENCES x APHA, Awwa, WEF, 2005. Standard Methods for the Examination of Water and
Wastewater, 21st ed. American Public Health Association, Washington DC.
x Murphy J., Riley J.P., 1962. A modified single solution for the determination of
phosphate in natural waters. Analytica Chimica Acta 27,31.
x Hach Lange, 2014. Safety Data Sheet LCK 339, Available on (28/07/2014):
https://www.hach-lange.co.uk/view/product/EU-LCK349/?productCode=EU-LCK349
x Sigma-Aldrich, Sulphuric acid. Available on (28/07/2014):
http://www.sigmaaldrich.com/catalog/product/aldrich/339741?lang=fr®ion=FR.

142
SOP: 2.5.e Phosphate-P (PO4-P) Manual Assay Anneliese Ernste
eHochschule für Technik und Wirtschaft des Saarlandes, Göbenstraße 40, 66117 Saarbrücken,
Germany
PURPOSE Monitoring nutrient concentration. Phosphorous (P) is part of the DNA and nucleotides. P is
taken up by algae as phosphate–ion. Many algae can store phosphate as poly-phosphate,
and remobilize it under P-starvation. Growth stops when nucleotides cannot become
phosphorylated any more.
PRINCIPLE Molybdovanadate Method: Liquid reagent test. Orthophosphate reacts with molybdate in an
acidic medium to produce a mixed phosphate/molybdate complex. In the presence of
vanadium, yellow molybdovanadophosphoric acid is formed. The intensity of the yellow
colour is proportional to the phosphate concentration. Test results are measured at 430 nm.
REQUIREMENTS Centrifuge, centrifuge tubes, spectrophotometer, timer, 10-mL sample cells (cuvettes),
pipette (10 mL), pipette tips, liquid reagent (for example from Hach-Lange).
HAZARDS AND PRECAUTIONARY STATEMENTS Hazards depend on the liquid reagent used, the relevant MSDS sheets should be checked
before use.
PROCEDURE
Sample collection, preservation and storage (once for all nutrients) 1. Collect samples in glass or plastic bottles that have been cleaned with 3 N Hydrochloric
acid solution and rinsed with deionized water.
2. Remove cells of suspension by centrifugation and analyse as soon as possible after
collection.
3. If necessary, preserve supernatants by freezing at -20°C.
4. Warm frozen samples to room temperature before analysing.

143
Measurement 5. Dilute clear supernatant with deionized water to reach measuring range (0.1 – 15 mg L-1
PO4-P).
6. Fill a sample cell (cuvette) with 10 mL of (diluted) sample.
7. Wipe cell and place in spectrophotometer to zero the instrument at 430 nm.
8. Add 0.5 mL of the liquid reagent.
9. Swirl to mix.
10. Start timer for 7 min reaction period.
11. Wipe cell and insert in spectrophotometer and read the result.
CALCULATION OF RESULTS For calculation of results plot results of calibration inverse (i.e. extension on x-axis
concentration on y- axis) and calculate a linear trend line. Use the equation to calculate
concentration in sample cell. (Note: this equation corrects for the reagent blank value!)
For final result, multiply with dilution factor.
CALIBRATION AND QUALITY CONTROL Prepare a standard stock solution with 1 g L-1 P in deionized water and dilute the stock to 15
mg L-1 PO4-P (approximately 45 mg L-1 PO43-). Prepare dilutions with final concentration of
0%, 10%, 25%, 40%, 55% 70%, 85% and 100%? Use deionized water as blank.
Add liquid reagent and start the timer. Follow the steps and timing described above
Measure extinction at 430 nm. Plot results and add linear trend line.
Determine the reagent blank value (i.e. 0%) for each new lot of reagent and correct if
necessary.
ERRORS AND INTERFERENCES This method is suitable for water and wastewater. pH extremes or highly buffered samples
my exceed buffering capacity of the reagent (pH should be around 7) Sufide causes
negative interference.
REFERENCES Hach Company 2007, 2010, 2012. Printed in the U.S.A.
OTHER POINTS

144
Detergents can contain phosphates. Therefore, equipment used for collection of samples
from RAS or PBR for nutrient analyses should not be washed with detergents. Usually it is
sufficient to rinse equipment thoroughly immediately after use with tap water and deionized
water.

145
SOP: 2.6.a Total Dissolved Phosphorus (TDP) – SFA Rhiannon Wilcoxa, Alla Silkinaa
aAlgal Research, Swansea University, Singleton Park, Swansea, SA28PP, UK
PURPOSE This procedure is to analyse seawater and freshwater for Total Dissolved Phosphorus
PRINCIPLE Analysis is performed on a segmented flow analyser (SFA), model AutoAnalyser 3 (AA3) from
Seal Analytical. This analytical system in general consists of a chemistry module run by a
random access XY-2 Sampler, a high precision peristaltic pump, chemistry module trays where
actual reaction takes place and dual beam high resolution digital colorimeter which operates
within a wavelength range of 340 – 900 nm.
The pump transmits samples, reagents and air at defined flow rates through flexible pump
tubes. Individual sample segments are separated by the insertion of air or nitrogen bubbles.
Following the glass mixing coils in the chemistry tray is a heating bath, after which the sample is
passed into the colorimeter holding a krypton lamp and the coloured filter for the appropriate
method wavelength. The concentration of the sample is determined colourmetrically, as each
sample passes through the flowcell the maximum intensity of the colour is measured. The
absorbance is then compared to that of known concentration calibration standards and the
sample result calculated. Drift samples (the 2nd highest calibration standard) are analysed from
which the software determines if the baseline has changed from the beginning of the run.
Based on these the software adjusts sample readings to account for baseline drift. The automated procedure for the determination of dissolved phosphorus takes place in three
stages. First the sample is irradiated in a UV digestor, where organic bound phosphorus is
released. Second acid persulphate is added to further break down organic phosphorus, and to
convert polyphosphates to ortho-phosphate by acid hydrolysis at 90°C. Third the ortho-
phosphate is determined by reaction with molybdate, antimony and ascorbic acid, producing a
phospho-molybdenum blue complex which is measured at 880 nm (Bran+Luebbe™, 2002).
REQUIREMENTS
Equipment and materials
� Seal Analytical AA3 Segmented Flow Analyser (Pumps, XY Sampler, colorimeters, chemistry module MT23)

146
� AACE 6.03 software on PC � 880 nm filter � Autosampler 5 mL cups (polystyrene) � Deionised water � Volumetric flasks (various) � Pipettes and tips (5 mL and 1 mL) � Plastic Pasteur pipettes (1 mL and 3 mL) � Analytical balance and weigh boats � Desiccator � Stirrer � Fume cupboard � Beakers (various) � Measuring cylinders (various) � 250 mL and 100 mL bottles, PE � Tube racks � Dilution containers, 7 mL Bijou or 30 mL Universal � Reagent bottles, glass and plastic � 12-14 mL calibrant tubes (x6)
Reagents
Sulphuric acid 4.9 N 68 mL Concentrated Sulphuric acid
Into 500 mL Deionised water
Will need to cool after addition. Stable indefinitely.
Digestion Mixture 0.04 g Potassium persulphate
0.2 g Sodium dodecyl sulphate
Into 100 mL 4.9 N Sulphuric Acid
Stable for one week, as long as it remains clear.
Sodium dodecyl sulphate Solution (SDS) 1 g Sodium dodecyl sulphate
Into 500 mL deionised water
Stable for 2 weeks, as long as it remains clear.
Ammonium molybdate Solution 4 g Ammonium molybdate
Into 100 mL deionised water

147
Solid chemical must be pure white, solution must be clear and colourless. Store in a
dark bottle. Stable for one month. Will take a while to dissolve, use stirrer.
Ascorbic acid Solution 4.5 g Ascorbic acid
12.5 mL Acetone
Into 250 mL deionised water
Store in a dark bottle in the refrigerator. Stable for one week.
Antimony potassium tartrate Solution 0.5 g Antimony potassium tartrate
Into 100 mL deionised water
Stable as long as solution remains clear with no precipitate.
Working colour reagent (Molybdate reagent) 43 mL 4.9 N Sulphuric acid
7 mL Deionised water
15 mL Ammonium molybdate solution
30 mL Ascorbic acid solution
5 mL Antimony potassium tartrate solution
Prepare in the order shown, mixing after each addition. Prepare fresh daily.
Sodium hydroxide Solution 10.8 g Sodium hydroxide
Into 100 mL deionised water
Stable indefinitely.
HAZARDS AND PRECAUTIONARY STATEMENTS
Sulphuric Acid is corrosive and causes burns, therefore a fume cupboard is necessary for
preparation and dealing with acids. Acids are stored in corrosive cabinets.
Acetone is flammable and therefore also requires a fume cupboard for preparation of the
Ascorbic acid reagent. Flammables are stored in a flammables cabinet.

148
All other chemicals are irritants and potentially harmful therefore proper PPE and risk
assessment should be adhered to. Consult the MSDS for precautionary measures.
Antimony potassium tartrate is dangerous to the environment so any solid chemical (i.e. spills)
should be strictly contained.
PROCEDURE
Preparation of stock solutions
Standard Stock Solution 1000 µmol L-1 0.1362 g (+ 0.0001 g) Potassium dihydrogen phosphate (Dried at 105°C for 2
hours, cool in a desiccator)
Into 1000 mL deionised water (freshwater)
Or Artificial Seawater
35 g Sodium chloride
0.2 g Sodium hydrogen carbonate
Into 1000 mL deionised water
Quality Control Stock Solution 1000 µmol L-1 0.1420 g (+ 0.0001 g) Sodium phosphate dibasic (Dried at 105°C for 2 hours,
cool in a desiccator)
Into 1000 mL deionised water
Or Artificial Seawater
35 g Sodium chloride
0.2 g Sodium hydrogen carbonate
Into 1000 mL deionised water
Both Stock Solutions are stable for 3 months, store in the fridge.
Preparation of standards and samples
Pipette calibration standards and analytical quality controls (AQC’s) into deionised water
for freshwater analysis, or into artificial seawater for seawater analysis (see 4.1). Use
the following amounts;

149
Table 1 Preparation of working calibration standards and AQC’s
Standard concentration µmol L-1
Volumetric flask volume
Volume of 1000 µmol L-1 stock solution to pipette
0 N/A 0
5 100 0.5 250 1.25
10 100 1.0 250 2.5
20 100 2.0 250 5.0
30 100 3.0 250 7.5
40 100 4.0 250 10.0
60 100 6.0 250 15.0
Pick a mid range value for the analytical quality control (AQC), i.e. the 0-60 µmol L-1 range
requires 6 calibrants including a zero blank, so 30 is mid range and not normally one of the
calibrants used. Calibration standards are stored in plastic bottles, and are stable for 1 week if
stored in the fridge.
Dilute the samples to within the range using deionised water, targeting a concentration between
20 – 50 µmol L-1. If the concentration of samples is unknown run them direct without dilution
and then when the preliminary results are charted add on a sample dilution to the end of the
run.
Measurement of standards and samples
1. Turn on computer and autosampler
2. Ensure the manifold is connected to the colorimeter and that the manifold for DOC is
connected to the waste line.
3. Move the autosampler line to the TN/TP sample line.
4. Connect pump platens, turn on both pumps and put red toggle switches to Run.
5. Turn on the UV digestor
6. Turn on colorimeters and install 880 nm filter
7. Load AACE 6.03 software from computer desktop
8. Click on Charting, click Change and find ‘TDP’ on list. Select to highlight and then press
OK.
9. Shake reagents to mix

150
10. When deionised water has been pumping for 15-20 minutes then insert labelled reagent
probes into reagent bottles (only Sodium hydroxide, Molybdate Reagent, SDS, Digestion
Mixture and DI water required)
11. Ensure deionised water containers are topped up
12. Along the top of the main screen click ‘Set Up’, and then ‘Analysis’. Click onto an existing
tray and click ‘Copy run’. Give this a new reference name and check that the calibrants are
correct (see section 4.2).
13. Click on Tray protocol tab and amend list to reflect current sample references. Insert an
AQC at the end of each row (every 11 samples), and also a Null and Drift. Print a copy for
reference when loading samples. Click OK when done.
14. Once reagents have been pumping for 30-40 minutes, in the charting window labelled Ch2-
1- Tot.Dis.P right click and ‘Set base’
15. Fill a rinsed 14 mL calibrant tube with the top standard (i.e. 60 µmol L-1) and place in
position 1 on the rack. Double click on ‘XY Sampler’ and click ‘sample’. Time for 2 minutes
and then click ‘wash’. Click ‘cancel’ to close.
16. Wait 26 minutes for the peak to come through on the charting window, then when it starts to
stabilise (level off) right click and ‘Set gain’. This should be between 75-85% absorbance.
The gain should be between 14 and 17.
17. Fill the other rinsed calibrant tubes with fresh calibration standards and load into the rack in
high to low order, double check baseline is at 5% and click ‘Set base’ if necessary. Click
‘Run’, find the new tray name and double click. Press OK.
18. Load the samples according to the printed tray layout, rinsing the 5 ml cups with a little
volume before filling.
19. The calibration coefficient will be displayed before the sample peaks are shown, check that
this 0.9990 or better.
20. When run is finished a message will appear. Click OK. Switch reagent probes into
deionised water to rinse for 30 minutes – 1 hour. If running other analyses then use 1 N
HCl to wash out for 15 minutes. Turn off the colorimeters, the autosampler and the UV
digestor. When finished rinsing put the red toggle switches on the pumps to Stop.
Disconnect the pump platens and turn off the pumps. Top up deionised water containers.
Dispose of waste down the sink and dispose of remaining samples as appropriate. Throw
away used autosampler cups and rinse calibrant tubes with deionised water. Rinse any
pipette tips used for dilutions. Rinse and throw away any dilution containers used.
21. Click ‘Retrieve’, and ‘View Chart’. Check all peaks are correct and then click on ‘Report’.
Print the results.

151
22. Export the results to Excel by clicking on ‘File’ along the top, then ‘Export to’, ‘ASCII file’,
find the correct run name and double click, click ‘Export’ and ‘Save’, then close. The Excel
file will be available in the ‘Data’ folder on the desktop. When finished turn off computer.
CALCULATION OF RESULTS Results are expressed as µmol L-1 as P. If dilution has been used then multiply by the
appropriate factor. The AACE software accounts for baseline drift during the run. The range is
0 – 60 µmol L-1, although the detection limit of the method specified by the manufacturer is 0.1
µmol L-1.
QUALITY CONTROL AQC’s are run at the mid range point of the calibration. They are usually analysed 1 per 11
samples, and the results are plotted on Quality Control Charts within Excel. If any QC’s exceed
+ 10% and a cause cannot be determined then a repeat analysis will be required. If a number
of QC’s exceed + 5%, then prepare an additional AQC solution to check. The QC stock is
sourced and prepared separately to the standard stock (see section 4.1). Sample spiking with a
known concentration can also be used as a quality control.
ERRORS AND INTERFERENCES The matrix of the samples and calibration standards can affect the chemistry, therefore as close
a match as possible should be made between matrices. For freshwater samples use deionised
water standards, but for seawater samples use Artificial Seawater (see section 4.1).
Interferences can occur if other chemistries are run on the same manifold, all attempts should
be made to completely wash out chemicals before analysis, possibly using 1 N HCl. Greater
amounts of SDS than specified in Section 3.2 can precipitate and cause interference. Coloured
samples or particulates can interfere with the light path and therefore read higher than actual.
Pipettes should be used to dilute samples into deionised water. Samples should be defrosted in
the fridge 12 hours before analysis if possible, and should only remain frozen for as little time as
possible before analysis.
WASTE STREAM AND PROPER DISPOSAL All waste can be flushed down the sink with copious amounts of tap water. The sink log should
also be completed for any chemicals disposed of. Large amounts of Ammonium molybdate
reagent, and Antimony potassium tartrate reagent should be separated for disposal over a
longer period.

152
Dispose of used autosampler cups and dilution containers.
REFERENCES Bran+Luebbe™ (2002), AutoAnalyser Application, Method No: G-219-98 Rev 6.

153
SOP: 2.6.b Analysis of total phosphorous using a colorimetric method Sofie Van Den Hendeb
bDepartment of Industrial Biological Sciences (former Howest University College)(, Faculty of Bioscience
Engineering, Ghent University, Campus Kortrijk, Karel de Goedelaan 5, 8500 Kortrijk, Belgium
PURPOSE This procedure is used to determine the total phosphorous (TP) concentration of wastewater
using a colometric method.
PRINCIPLE This procedure determines the total phosphorous concentration in wastewater according to
standards ISO 6878-1-1986, DIN 38405 D11-4 (Hach Lange test kit LCK 349 for ranges of 0.05
to 1.5 mg TP L-1). The raw wastewater sample is hydrolised to convert all phosphorous to
orthophosphate (PO43-). The colometric phosphorous-molybdenum blue method is then applied.
Orthophosphate ions react with ammonium molybdate and antimony potassium tartrate under
acidic conditions to form a complex. This phosphomolybdenum complex is reduced with
ascorbic acid to form a blue complex that adsorbs light at 880 nm. The absorbance is
proportional to the concentration of orthophosphate in the digested wastewater sample (Murphy
and Riley, 1962; APHA et al., 2005) and thus also proportional to the total phosphorous
concentration in the raw wastewater sample.
REQUIREMENTS EQUIPMENT AND MATERIALS
x Hach Lange kit LCK 349 for 0.05 - 1.5 mg P L-1
x a spectrophotometer (Hach Lange DR 2800, Belgium)
x an oven at 100°C or thermostat at 100 °C
x a micropipette of 100-1000 µL and tips
x a micropipette of 1-5 mL and tips
x 1 centrifuge tube of 10 mL (VWR, Belgium) for each sample dilution
x a blender (in case the sample contains large particles) and glass beaker of 100 mL

154
REAGENTS
x reagents and caps present in the HL kit LCK 349: ‘DosiCap Zip LCK 349 A’, ‘reagent
LCK B’ and ‘grey DosiCap LCK 349 C’ (Hach Lange, Belgium)
x raw water sample stored at 4 °C (2 mL of prepared sample is needed for the analysis;
100 mL is needed if the sample needs to be blended before analyses)
x demineralized water
HAZARDS AND PRECAUTIONARY STATEMENTS x Act carefully and take appropriate measure concerning the hazardous reagent sulphuric
acid. The cuvette contains 11 % sulphuric acid and reagent LCK 349 B contains 16 %
sulphuric acid (Table 1). x Ascorbic acid is relatively non-hazardous in routine industrial situations. It is not
expected to present significant health risks to the workers who use it under the
concentrations used in this procedure.
Table 1. Hazardous reagents used in LCK 349 and precautionary statements Reagent Hazard statements Precautionary statements
Sulphuric acid (H2SO4)
- Causes severe skin burns
and eye damage. - Harmful to aquatic life with
long lasting effects.
- Avoid release to the environment.
- Wear protective gloves/ protective clothing/ eye protection/ face protection.
- If in eyes: Rinse cautiously with water for several minutes. Remove contact lenses, if present and easy to do. Continue rinsing.
- Immediately call a Poison Center or doctor/physician.
PROCEDURE
SAMPLE PREPARATION
x The raw sample should be analysed soon as possible after sampling to not change its
total phosphorous concentration.
x If the sample contains large particles, then minimum 100 mL of the sample should be
blended in a glass beaker to reduce particle size to smaller than the filter tip size.
x Samples can be stored at -18 °C without pretreatment or filtering.

155
SAMPLE ANALYSIS
x Here under follows the procedure for wastewater samples with concentration of 0.05-
1.50 mg TP L-1. For samples with higher concentrations, dilutions should be made with
demineralized water and the raw sample.
x Note that the same testkit LCK 349 is used for orthophosphate analysis of wastewater,
but in the latter procedure lacks the digestion step. All pictures are courtesy of Hach Lange (2014).
Figure 1. Sample analysis (Hach Lange 2014)
.
1. Carefully remove the foil from the screwed-on DosiCap Zip.
2. Unscrew the DosiCap Zip.
3. Pipette 2.0 mL of filtered sample in the reaction cuvette. To take a representative 2.0 mL sample, the wastewater should be stirred in a glass beaker while pipetting.
4. Screw the DosiCap Zip back tightly; fluting at the top.
5. Shake firmly the closed cuvette.

156
Figure 2. Sample analysis (Hach Lange 2014)
6. Heat the cuvette in the thermostat or oven to 100°C for 60 minutes.
7. Allow to cool down the cuvette to room temperature. Shake firmly the cuvette.
8. Pipette into the cooled cuvette 0.2 mL reagent LCK 349 B. Close reagent B immediately after use.
9. Screw a grey DosiCap C (LCK 349 C) onto the cuvette.
10. Invert a few times. After 10 minutes invert a few times more, thoroughly clean the outside of the cuvette and evaluate. Make sure that the spectrophotometer shows the total phosphorous in mg PO4
3--P L-1 on its display. This is the amount of TP in mg L-1 of the wastewater sample.
CALCULATION OF RESULTS x The conversion of absorbance to TP is done by the spectrophotometer.
x The spectrophotometer shows the concentration as mg PO43--P L-1 on its display. This is
the amount of TP in mg L-1 of the wastewater sample, as all phosphorous has been
digested to orthophosphate prior to analysis.
x If a diluted sample was analysed, then multiply the obtained result by the appropriate
dilution factor.

157
QUALITY CONTROL x Dilutions and spiking of samples can be done as a quality control.
x Wastewater samples may contain over 10 mg TP L-1 (Van Den Hende, 2014).
ERRORS, CALIBRATION AND INTERFERENCES x The range of measurement is 0.05-1.5 mg TP L-1.
x Various compounds may interfere with this procedure (Table 2). Dilutions should be
made to lower their concentrations to below their interference level.
x Inverting the cuvette after hydrolysis improves the reliability of the result.
x In case of not working at the recommended temperature, an incorrect result may be
obtained.
x If phosphonic acids are present the time for hydrolysis in the thermostat must be
increased to 2 h at 100°C in order to prevent low-bias results.
x Silica forms a pale blue complex that also absorbs at 880 nm. The interference is in
general insignificant because a silica concentration of minimum 30 mg L-1 would be
required to produce a 0.005 mg L-1 positive error in orthophosphate (APHA et al., 2005).
x Concentrations of ferric iron greater than 50 mg L-1 cause a negative errors due to
competition with the complex for the reducing agent ascorbic acid. Treat samples high in
iron with sodium bisulfite to eliminate this interference, as well as the interference due to
arsenates (APHA et al., 2005).
x Glassware contamination is a problem in low-level phosphorous determinations. Wash
glassware with hot dilute HCl and rinse with reagent water. Commercial detergents are
rarely needed but, if they are used, use special phosphate-free preparations (APHA et
al., 2005).

158
Table 2. Overview of substances which can interfere with phosphate measurements by means of test kit LCK 349 (Hach Lange, 2014)
Interfering substance Interference level (mg L-1)
Sulphate (SO42-) 5000
Chloride (Cl-) 2000 Potassium (K+), sodium (Na+) 1000 Nitrate (NO3-) 500 Calcium (Ca2+), 250 Magnesium (Mg2+) 100 Cobalt (Co2+), iron (Fe2+ and Fe3+), zinc (Zn2+), copper (Cu2+) , nickel (Ni2+), iodium (I-), nitrite (NO2
-), cadmium (Cd2+), ammonium (NH4+),
manganese (Mn 2+), aluminum (Al3+), cobalt (Co32-), silica dioxide (SiO2)
50
Tin (Sn4+), mercury (Hg2+) 5 Silver (Ag+), lead (Pb2+) 2.5 Chromium (Cr3+) 1 Chromium (Cr6+) 0.5
WASTE STREAM AND PROPER DISPOSAL x Hach Lange local agencies accept used cuvettes to ensure their proper disposal in
accordance with local and national regulations. These used cuvettes should thus be
stored and send back to Hach Lange.
REFERENCES x APHA, Awwa, WEF, 2005. Standard Methods for the Examination of Water and
Wastewater, 21st ed. American Public Health Association, Washington DC.
x Murphy J., Riley J.P., 1962. A modified single solution for the determination of
phosphate in natural waters. Analytica Chimica Acta 27,31.
x Hach Lange, 2014. Safety Data Sheet LCK 339, Available on (28/07/2014):
https://www.hach-lange.co.uk/view/product/EU-LCK349/?productCode=EU-LCK349
x Sigma-Aldrich, Sulphuric acid. Available on (28/07/2014):
http://www.sigmaaldrich.com/catalog/product/aldrich/339741?lang=fr®ion=FR.

159
SOP: 2.7.a Silicate – SFA Rhiannon Wilcoxa, Alla Silkinaa
aAlgal Research, Swansea University, Singleton Park, Swansea, SA28PP, UK
PURPOSE This procedure is to analyse seawater and freshwater for silicate, SiO2.
PRINCIPLE Analysis is performed on a segmented flow analyser (SFA), model AutoAnalyser 3 (AA3) from
Seal Analytical. This analytical system in general consists of a chemistry module run by a
random access XY-2 Sampler, a high precision peristaltic pump, chemistry module trays where
actual reaction takes place and dual beam high resolution digital colorimeter which operates
within a wavelength range of 340 – 900 nm.
The pump transmits samples, reagents and air at defined flow rates through flexible pump
tubes. Individual sample segments are separated by the insertion of air or nitrogen bubbles.
Following the glass mixing coils in the chemistry tray is a heating bath, after which the sample is
passed into the colorimeter holding a krypton lamp and the coloured filter for the appropriate
method wavelength. The concentration of the sample is determined colourmetrically, as each
sample passes through the flowcell the maximum intensity of the colour is measured. The
absorbance is then compared to that of known concentration calibration standards and the
sample result calculated. Drift samples (the 2nd highest calibration standard) are analysed from
which the software determines if the baseline has changed from the beginning of the run.
Based on these the software adjusts sample readings to account for baseline drift. The automated procedure for the determination of soluble silicates is based on the reduction of
silico-molybdate in acidic solution to molybdenum blue by ascorbic acid. Oxalic acid is
introduced to the sample stream before the addition of ascorbic acid to minimise interference
from phosphates (Ehrhardt et al., 1983; Bran+Luebbe™, 2004).
REQUIREMENTS Equipment and materials
� Seal Analytical AA3 Segmented Flow Analyser (Pumps, XY Sampler,
colorimeters, chemistry module MT19)
� AACE 6.03 software on PC

160
� 820 nm filter
� Autosampler 5 mL cups (polystyrene)
� Deionised water
� Volumetric flasks (various)
� Pipettes and tips (5 mL and 1 mL)
� Plastic Pasteur pipettes (1 mL and 3 mL)
� Analytical balance and weigh boats
� Stirrer
� Fume cupboard
� Beakers (various)
� Measuring cylinders (various)
� 250 mL and 100 mL bottles, PE
� Tube racks
� Dilution containers, 7 mL Bijou or 30 mL Universal
� Reagent bottles, glass and plastic
� 12-14 mL calibrant tubes (x6)
Reagents
Ammonium molybdate 3.75 g Ammonium molybdate
1.05 mL Sulphuric acid, conc
1.25 g Sodium dodecyl sulphate (SDS)
Into 250 mL deionised water
Solution should be clear and free of precipitate on standing, discard if blue colour exists.
Store in an amber polyethylene bottle. Stable for two weeks.
Oxalic acid 23.75 g Oxalic acid
Into 250 mL deionised water
Store in an amber polyethylene container. Stable for 1-2 months.
Ascorbic acid 12.5 g Ascorbic acid
Into 250 mL deionised water
Store in a polyethylene container. Stable for one week.

161
HAZARDS AND PRECAUTIONARY STATEMENTS
Sulphuric acid is corrosive and causes burns, therefore a fume cupboard is necessary for
preparation and dealing with acids. Acids are stored in corrosive cabinets.
Sodium meta-silicate and oxalic acid are also minor corrosives.
All other chemicals are irritants and potentially harmful therefore proper PPE and risk
assessment should be adhered to. Consult the MSDS for precautionary measures.
PROCEDURE
Preparation of stock solutions
Standard Stock Solution 1000 µmol L-1
0.2843 g (+ 0.0001 g) Sodium meta-silicate nonahydrate
Into 1000 mL deionised water (freshwater)
Or Artificial Seawater
35 g Sodium chloride
0.2 g Sodium hydrogen carbonate
Into 1000 mL deionised water
Quality Control Stock Solution 1000 µmol L-1 0.2121 g (+ 0.0001 g) Sodium meta-silicate pentahydrate
Into 1000 mL deionised water
Or Artificial Seawater
35 g Sodium chloride
0.2 g Sodium hydrogen carbonate
Into 1000 mL deionised water
Both Stock Solutions are stable for 3 months, store in the fridge.
Preparation of standards and samples

162
Pipette calibration standards and analytical quality controls (AQC’s) into deionised water
for freshwater analysis, or into artificial seawater for seawater analysis (see 4.1). Use
the following amounts;
Table 1 Preparation of working calibration standards and AQC’s
Standard concentration µmol L-1
Volumetric flask volume
Volume of 1000 µmol L-1 stock solution to pipette
0 N/A 0
5 100 0.5 250 1.25
10 100 1.0 250 2.5
20 100 2.0 250 5.0
30 100 3.0 250 7.5
40 100 4.0 250 10.0
60 100 6.0 250 15.0
Pick a mid range value for the analytical quality control (AQC), i.e. the 0-60 µmol L-1 range
requires 6 calibrants including a zero blank, so 30 is mid range and not normally one of the
calibrants used. Calibration standards are stored in plastic bottles, and are stable for 1 week if
stored in the fridge.
Dilute the samples to within the range using deionised water, targeting a concentration between
20 – 50 µmol L-1. If the concentration of samples is unknown run them direct without dilution
and then when the preliminary results are charted add on a sample dilution to the end of the
run.
Measurement of standards and samples
1. Turn on computer and autosampler
2. Connect pump platen, turn on pump and put red toggle switch to Run.
3. Turn on colorimeter and install 820 nm filter
4. Load AACE 6.03 software from computer desktop
5. Click on Charting, click Change and find ‘Silicate-Phosphate2’ on list. Select to highlight
and then press OK. Can be run as a multi-test with phosphate, if phosphate is not needed
then the additional chart can be closed after the baseline has been found.

163
6. Shake reagents to mix
7. When deionised water has been pumping for 15-20 minutes then insert labelled reagent
probes into reagent bottles (Channel 1 Reagent 1 – Ammonium molybdate; Channel 1
Reagent 2 – Oxalic acid; Channel 1 Reagent 3 – Ascorbic acid)
8. Ensure deionised water containers are topped up
9. Along the top of the main screen click ‘Set Up’, and then ‘Analysis’. Click onto an existing
tray and click ‘Copy run’. Give this a new reference name and check that the calibrants are
correct (see section 4.2).
10. Click on Tray protocol tab and amend list to reflect current sample references. Insert an
AQC at the end of each row (every 11 samples), and also a Null and Drift. Print a copy for
reference when loading samples. Click OK when done.
11. Once reagents have been pumping for 20-30 minutes, in the charting window labelled
Silicate right click and ‘Set base’
12. Fill a rinsed 14 mL calibrant tube with the top standard (i.e. 60 µmol L-1) and place in
position 1 on the rack. Double click on ‘XY Sampler’ and click ‘sample’. Time for 2 minutes
and then click ‘wash’. Click ‘cancel’ to close.
13. Wait 6-7 minutes for the peak to come through on the charting window, then when it starts
to stabilise (level off) right click and ‘Set gain’. This should be between 75-85%
absorbance. The gain should be around 130 - 140.
14. Fill the other rinsed calibrant tubes with fresh calibration standards and load into the rack in
high to low order, double check baseline is at 5% and click ‘Set base’ if necessary. Click
‘Run’, find the new tray name and double click. Press OK.
15. Load the samples according to the printed tray layout, rinsing the 5 ml cups with a little
volume before filling.
16. The calibration coefficient will be displayed before the sample peaks are shown, check that
this 0.9990 or better.
17. When run is finished a message will appear. Click OK. Switch reagent probes into
deionised water to rinse for 30 minutes – 1 hour. If running other analyses then use 1 N
HCl to wash out for 15 minutes. Turn off the colorimeter and the autosampler. When
finished rinsing put the red toggle switch on the pump to Stop. Disconnect the pump platen
and turn off the pump. Top up deionised water containers. Dispose of waste down the sink
and dispose of remaining samples as appropriate. Throw away used autosampler cups
and rinse calibrant tubes with deionised water. Rinse any pipette tips used for dilutions.
Rinse and throw away any dilution containers used.
18. Click ‘Retrieve’, and ‘View Chart’. Check all peaks are correct and then click on ‘Report’.
Print the results.

164
19. Export the results to Excel by clicking on ‘File’ along the top, then ‘Export to’, ‘ASCII file’,
find the correct run name and double click, click ‘Export’ and ‘Save’, then close. The Excel
file will be available in the ‘Data’ folder on the desktop. When finished turn off computer.
CALCULATION OF RESULTS Results are expressed as µmol L-1 as SiO2. If dilution has been used then multiply by the
appropriate factor. The AACE software accounts for baseline drift during the run. The range is
0 – 60 µmol L-1, however this can be reduced to 0 – 40 µmol L-1 or extended to 0 – 140 µmol L-1.
The detection limit of the method specified by the manufacturer is 0.05 µmol L-1.
QUALITY CONTROL AQC’s are run at the mid range point of the calibration. They are usually analysed 1 per 11
samples, and the results are plotted on Quality Control Charts within Excel. If any QC’s exceed
+ 10% and a cause cannot be determined then a repeat analysis will be required. If a number
of QC’s exceed + 5%, then prepare an additional AQC solution to check. The QC stock is
sourced and prepared separately to the standard stock (see section 4.1). Sample spiking with a
known concentration can also be used as a quality control.
ERRORS AND INTERFERENCES Glassware interferes with silicate due to dissolution of silicic acid; all reagents, standards and
QC’s should be stored in plastic bottles and remain in glass for as little time as possible.
Samples should be in plastic containers and connection to glassware should be minimised.
Tannin, large amounts of iron, colour, turbidity and sulphide interfere (Bran+Luebbe™, 2004).
The matrix of the samples and calibration standards can affect the chemistry, therefore as close
a match as possible should be made between matrices. For freshwater samples use deionised
water standards, but for seawater samples use Artificial Seawater (see section 4.1).
Interferences can occur if other chemistries are run on the same manifold, all attempts should
be made to completely wash out chemicals before analysis, possibly using 1 N HCl or 1N
H2SO4. Coloured samples or particulates can interfere with the light path and therefore read
higher than actual.
Pipettes should be used to dilute samples into deionised water. Samples should be defrosted in
the fridge 12 hours before analysis if possible, and should only remain frozen for as little time as
possible before analysis.

165
WASTE STREAM AND PROPER DISPOSAL All waste can be flushed down the sink with copious amounts of tap water. The sink log should
also be completed for any chemicals disposed of. Large amounts of Ammonium molybdate
reagent should be separated for disposal over a longer period.
Dispose of used autosampler cups and dilution containers.
REFERENCES Bran+Luebbe™ (2004), AutoAnalyser Application, Method No: G-177-96 Rev 8.
Ehrhardt, M., Grasshoff, K., Kremling, K. & Almgren, T. (1983) Methods of seawater analysis, 2nd revised and extended edn, Weinheim, Wiley-VCH Verlag GmbH, ISBN 3–527-2599-8

166
SOP: 2.8.a Dissolved Organic Carbon (DOC) – SFA Rhiannon Wilcoxa, Alla Silkinaa
aAlgal Research, Swansea University, Singleton Park, Swansea, SA28PP, UK
PURPOSE This procedure is to analyse seawater and freshwater for dissolved organic carbon.
PRINCIPLE Analysis is performed on a segmented flow analyser (SFA), model AutoAnalyser 3 (AA3) from
Seal Analytical. This analytical system in general consists of a chemistry module run by a
random access XY-2 Sampler, a high precision peristaltic pump, chemistry module trays where
actual reaction takes place and dual beam high resolution digital colorimeter which operates
within a wavelength range of 340 – 900 nm.
The pump transmits samples, reagents and air at defined flow rates through flexible pump
tubes. Individual sample segments are separated by the insertion of air or nitrogen bubbles.
Following the glass mixing coils in the chemistry tray is a heating bath, after which the sample is
passed into the colorimeter holding a krypton lamp and the coloured filter for the appropriate
method wavelength. The concentration of the sample is determined colourmetrically, as each
sample passes through the flowcell the maximum intensity of the colour is measured. The
absorbance is then compared to that of known concentration calibration standards and the
sample result calculated. Drift samples (the 2nd highest calibration standard) are analysed from
which the software determines if the baseline has changed from the beginning of the run.
Based on these the software adjusts sample readings to account for baseline drift.
The automated procedure for the determination of dissolved organic carbon (DOC) requires the
removal of inorganic carbon which is present in samples. The inorganic carbon from carbonate,
bicarbonate and dissolved CO2 is removed by acidifying and removing the liberated CO2 with a
stream of air. An aliquot of the carbonate free sample is then segmented and mixed with
sodium tetraborate and potassium persulphate and subjected to UV radiation. When seawater
is analysed hydroxylamine chloride and sulphuric acid are added to reduce the liberated
chlorine from the sodium chloride. The resultant CO2 from the decomposition of the organic
compounds is dialysed through a silicone membrane and reacts with a weakly buffered
phenolphthalein indicator. The method is inverse, therefore higher concentrations of DOC
lessen the pink colour of the phenolphthalein (Bran+Luebbe™, 2004).

167
REQUIREMENTS Equipment and materials
� Seal Analytical AA3 Segmented Flow Analyser (Pumps, XY Sampler, colorimeters) � AACE 6.03 software on PC � 550 nm filter � Autosampler 5 ml cups (polystyrene) � Deionised water � Volumetric flasks (various) � Pipettes and tips (5 mL and 1 mL) � Plastic Pasteur pipettes (1 mL and 3 mL) � Analytical balance and weigh boats � Desiccator � Stirrer � Fume cupboard � Beakers (various) � Measuring cylinders (various) � 250 mL and 100 mL bottles, PE � Tube racks � Reagent bottles, glass and plastic � 12-14 mL calibrant tubes (x6)
Reagents
Stock Triton X-100 Solution 50 mL Triton X-100
50 mL Isopropanol (a.k.a. propan-2-ol/ 2-propanol/ isopropyl alcohol)
Store in the fridge. Stable indefinitely.
Sulphuric Acid, 0.3 N 4.2 mL Sulphuric acid
Into 500 mL deionised water
Stable indefinitely.
Stock Sodium carbonate, 0.1 M 5.3 g Sodium carbonate
Into 500 mL deionised water
Keep closed when not in use. Store in the fridge. Stable indefinitely.
Stock Sodium hydrogen carbonate, 0.1 M 4.2 g Sodium hydrogen carbonate

168
Into 500 mL deionised water
Keep closed when not in use. Store in the fridge. Stable indefinitely.
Stock buffer 150 mL Stock Sodium carbonate, 0.1 M
300 mL Stock Sodium hydrogen carbonate, 0.1 M
Keep well closed when not in use. Store in the fridge. Stable indefinitely.
Stock phenolphthalein 1 g Phenolphthalein
Into 100 mL Isopropanol
Store in the fridge. Stable indefinitely.
Colour reagent 8 mL Stock buffer
1 mL Stock phenolphthalein
0.5 mL Stock Triton X-100 Solution
Into 500 mL deionised water
Prepare as fresh as possible, stable for one week. Stability can be increased by adding
more stock buffer. Should be a bright pink colour. This should be protected from CO2
contamination from the air as much as possible.
Digestion mixture 6 g Potassium persulphate
8 g Sodium tetraborate
Into 250 mL deionised water
Store in a dark bottle. Stable for 2 weeks.
Sulphuric Acid, 5 N 34.5 mL Sulphuric acid
Into 250 mL deionised water
Stable indefinitely.
Hydroxylamine reagent (needed for seawater analysis) 17.5 g Hydroxylamine hydrochloride
50 mL Sulphuric acid, 5 N

169
5 mL Stock Triton X-100 Solution
Into 250 mL deionised water
Stable for 2 weeks.
HAZARDS AND PRECAUTIONARY STATEMENTS
Sulphuric acid, Triton X-100, Hydrogen peroxide and Sodium hydroxide are all corrosive. A
fume cupboard is necessary for preparation and dealing with acids. Acids are stored in
corrosive cabinets.
Isopropanol is flammable and requires a fume cupboard for preparation of the Triton X-100
Stock Solution and the Stock phenolphthalein reagent. Flammables are stored in a flammables
cabinet.
Phenolphthalein, Sodium tetraborate and Hydroxylamine hydrochloride have potential long term
health considerations, all precautions should be used and the MSDS and risk assessments
should be consulted for containment measures.
All other chemicals are irritants and potentially harmful therefore proper PPE and risk
assessment should be adhered to. Consult the MSDS for precautionary measures.
PROCEDURE
Preparation of stock solutions
Standard Stock Solution 6250 µmol L-1 0.1596 g (+ 0.0001 g) Potassium hydrogen phthalate (Dried at 105°C for 2 hours,
cool in a desiccator)
Into 1000 mL deionised water
Or Artificial Seawater
35 g Sodium chloride
0.2 g Sodium hydrogen carbonate
Into 1000 mL deionised water
Can also include 10 g Magnesium sulphate
Stable for 1-2 weeks if kept tightly closed, store in the fridge.
Preparation of standards and samples

170
Pipette calibration standards into deionised water for freshwater analysis, or into artificial
seawater for seawater analysis (see 4.1). Use the following amounts;
Table 1 Preparation of working calibration standards
Standard concentration µmol L-1
Volumetric flask volume
Volume of 6250 µmol L-1 stock solution to pipette
0 N/A 0
63 100 1.0 250 2.5
125 100 2.0 250 5.0
250 100 4.0 250 10.0
500 100 8.0 250 20.0
750 100 12.0 250 30.0
1000 100 16.0 250 40.0
Calibration standards are stored in plastic bottles, and are stable for 1 week if stored in the
fridge.
Dilute the samples to within the range using deionised water, targeting a concentration between
100 – 800 µmol L-1. If the concentration of samples is unknown run them direct without dilution
and then when the preliminary results are charted add on a sample dilution to the end of the
run.
Measurement of standards and samples
1. Turn on computer and autosampler
2. Ensure the manifold is connected to the colorimeter and that the manifold for TN/TP is
connected to the waste line.
3. Move the autosampler line to the DIC/DOC sample line.
4. Turn on the UV digestor
5. Connect pump platens, turn on both pumps and put red toggle switches to Run.
6. Turn on colorimeter and install 550 nm filter
7. Turn on the Nitrogen cylinder, ensuring that the tubing is all connected correctly, and aim to
achieve a pressure of 0.4 bar. The bubble pattern should be even and no air should be

171
drawn into the system or through the pump. Adjust the nitrogen pressure until this is
consistent.
8. Load AACE 6.03 software from computer desktop
9. Click on Charting, click Change and find ‘DOC-DIC’ on list. Select to highlight and then
press OK. Can be run as a multi-test with DIC, however if this is not needed it can be
closed once the baseline has been found.
10. Shake reagents to mix
11. When deionised water has been pumping for 15-20 minutes then insert labelled reagent
probes into reagent bottles (the acid probe is for the 0.3 N H2SO4). Cover all reagent
bottles with parafilm to exclude as much air as possible. The Colour reagent probe is
affixed to a bung and connected to sodium hydroxide.
12. Ensure deionised water containers are topped up
13. Along the top of the main screen click ‘Set Up’, and then ‘Analysis’. Click onto an existing
tray and click ‘Copy run’. Give this a new reference name and check that the calibrants are
correct (see section 4.2).
14. Click on Tray protocol tab and amend list to reflect current sample references. Insert a Null
and Drift at the end of each row. Print a copy for reference when loading samples. Click
OK when done.
15. Once reagents have been pumping for 30 minutes-1 hour, in the charting window right click
and ‘Set base’
16. Fill a rinsed 14 mL calibrant tube with the top standard (i.e. 1000 µmol L-1) and place in
position 1 on the rack. Double click on ‘XY Sampler’ and click ‘sample’. Time for 2 minutes
and then click ‘wash’. Click ‘cancel’ to close.
17. Wait 16 minutes for the peak to come through on the charting window, then when it starts to
stabilise (level off) right click and ‘Set gain’. This should be between 75-85% absorbance.
The gain should be around 25.
18. Fill the other rinsed calibrant tubes with fresh calibration standards and load into the rack in
high to low order, double check baseline is at 5% and click ‘Set base’ if necessary. Click
‘Run’, find the new tray name and double click. Press OK.
19. Load the samples according to the printed tray layout, rinsing the 5 ml cups with a little
volume before filling to the top. The samples cannot be exposed to the air for long without
the results changing so only load up 6 – 10 cups ahead of the autosampler to ensure most
accurate results.
20. The calibration coefficient will be displayed before the sample peaks are shown, check that
this 0.9990 or better. The calibration curve may not be completely linear, and may have a
slight upward curve at the bottom end.

172
21. When run is finished a message will appear. Click OK. Switch reagent probes into
deionised water to rinse for 30 minutes – 1 hour. Turn off the Nitrogen, the colorimeters,
the autosampler and the UV digestor. When finished rinsing put the red toggle switches on
the pumps to Stop. Disconnect the pump platens and turn off the pumps. Top up deionised
water containers. Dispose of waste down the sink and dispose of remaining samples as
appropriate. Throw away used autosampler cups and rinse calibrant tubes with deionised
water. Rinse any pipette tips used for dilutions. Rinse and throw away any dilution
containers used.
22. Click ‘Retrieve’, and ‘View Chart’. Check all peaks are correct and then click on ‘Report’.
Print the results.
23. Export the results to Excel by clicking on ‘File’ along the top, then ‘Export to’, ‘ASCII file’,
find the correct run name and double click, click ‘Export’ and ‘Save’, then close. The Excel
file will be available in the ‘Data’ folder on the desktop. When finished turn off computer.
CALCULATION OF RESULTS Results are expressed as µmol L-1 as C. If dilution has been used then multiply by the
appropriate factor. The AACE software accounts for baseline drift during the run. The range is
0 – 1000 µmol L-1, although the detection limit of the method specified by the manufacturer is 7
µmol L-1.
QUALITY CONTROL There is not currently any procedure in place for quality control of DOC analysis. Oxalic Acid
can be used as a stock, however it has a recovery rate of 107%, which will need to be adjusted
for. Phenylalanine or Sucrose have 100% recovery rates, so these are possible alternate
quality control compounds. Sample spiking with a known concentration can also be used as a
quality control.
ERRORS AND INTERFERENCES The matrix of the samples and calibration standards can affect the chemistry, therefore as close
a match as possible should be made between matrices. For freshwater samples use deionised
water standards, but for seawater samples use Artificial Seawater (see section 4.1). Coloured
samples or particulates can interfere with the light path and therefore read higher than actual.
Hydroxylamine hydrochloride is only necessary for seawater analysis, if freshwater analysis is
required then a reagent containing 2 ml L-1 Triton X-100 in deionised water is substitute.
Nitrogen is used for bubble segmentation to eliminate interference from atmospheric CO2.

173
Triton X-100 should not come into contact with the Sulphuric acid or Digestion mixture as it will
decompose and contribute to DOC reading.
Pipettes should be used to dilute samples into deionised water. Samples should be defrosted in
the fridge 12 hours before analysis if possible, and should only remain frozen for as little time as
possible before analysis.
WASTE STREAM AND PROPER DISPOSAL All waste can be flushed down the sink with copious amounts of tap water. The sink log should
also be completed for any chemicals disposed of. Large amounts of Hydroxylamine reagent,
Stock Triton X-100 and Stock phenolphthalein reagent should be separated for disposal over a
longer period.
Dispose of used autosampler cups and dilution containers.
REFERENCES Bran+Luebbe™ (2004), AutoAnalyser Application, Method No: G-115-94 Rev 3.

174
SOP: 2.8.b Analysis of total carbon (TC), total inorganic carbon (TIC) and total organic carbon (TOC) in water samples Alexandra Lefoulonb, Sofie Van Den Hendeb
bDepartment of Industrial Biological Sciences (former Howest University College)(, Faculty of Bioscience
Engineering, Ghent University, Campus Kortrijk, Karel de Goedelaan 5, 8500 Kortrijk, Belgium PURPOSE
The purpose of this analysis is to determine the total carbon (TC), total inorganic carbon (TIC)
and total organic carbon (TOC) in water and wastewater.
PRINCIPLE The TOC test measures the total amount of non-volatile organic carbon in a sample. Total
carbon (TC) and total inorganic carbon (TIC) are converted to carbon dioxide (CO2) by
persulfate oxidation (only for TC) and acidification. The CO2 passes from the digestion cuvette
through a membrane and into the indicator cuvette (Fig. 1). The change of color of the indicator
is photometrically evaluated. Total organic carbon (TOC) is determined as the difference
between the measured TC and TIC values.
𝑇𝑂𝐶 (𝑚𝑔 𝐿 ) = 𝑇𝐶 (𝑚𝑔 𝐿 ) − 𝑇𝐼𝐶 (𝑚𝑔 𝐿 )

175
Figure. 1: Reaction tube of Hach Lange kit LCK 238 to measure TOC (Hach, 2014)
REQUIREMENTS EQUIPMENT AND MATERIALS
x Hach Lange kit LCK 380, 2-65 mg TOC L-1 including reaction tubes, membrane filter
caps and reagents (Hach Lange, Belgium)
x a spectrophotometer (Hach Lange DR 2800, Belgium)
x a thermostat (100°C) or HT 200 S machine (100°C; Hach Lange, Belgium)
x a micropipette of 1-5 mL and tips
x for samples with large suspended solids: a glass beaker of 500 mL, a blender or mixing
device, a magnetic stirrer, a glass beaker of 100 mL and a stirring magnet
REAGENTS
TC determination
- reagent present in the HL kit LCK 380: digestion reagent A
- raw water sample (2 mL of prepared sample is needed for the analysis; around
100 mL of sample is needed if the sample needs to be mixed) stored at 4°C
- demineralized water

176
TIC determination
- raw water sample (2 mL of prepared sample is needed for the analysis; around
100 mL of sample is needed if the sample needs to be mixed) stored at 4°C
- demineralized water
HAZARDS AND PRECAUTIONARY STATEMENTS x Always wear a laboratory coat, eye protection and laboratory gloves.
x Use only Hach Lange kit LCK 380 in well-ventilated areas.
x Keep the test kit in tightly closed in a dry and well-ventilated place.
x Act carefully and take appropriate measure concerning the hazardous reagents.
Reagent Hazard statements Precautionary statements
Potassium chloride (KCI)
- Not a hazardous substance or mixture according too Regulation (EC) No. 1272/2008.
- Store in cool place.Keep container tighly closed in a dry and well-ventilated place.
Sodium hydroxide (NaOH)
- Causes severe skin burns and
eye damage.
- Wear protective gloves/protective clothing/ eye protection/ face protection.
- If in eye: rinse cautiously with water for several minutes. Remove contact lenses, if present and easy to do. Continue rinsing. Immediately call a Poison Center or doctor/physician.
Lithium hydroxide
(LiOH)
- Harmful if swallowed. - Causes severe skin burns and
eye damage.
- Wear protective gloves/protective clothing/ eye protection/ face protection.
- If in eye: rinse cautiously with water for several minutes. Remove contact lenses, if present and easy to do. Continue rinsing. Immediately call a Poison Center or doctor/physician.
Sodium persulfate (Na2S2O8)
- May intensify fire; oxidiser. - Harmful if swallowed. - Causes skin irritation. - May cause an allergic skin
reaction. - Causes serious eye irritation.
- Keep/ Store away from clothing/ combustible materials.
- Avoid breathing dust. - Wear protective gloves. - If in eyes: rinse cautiously
with water for several minutes. Remove contact lenses, if present and easy

177
- May cause allergy or asthma symptoms or breathing difficulties if inhaled.
- May cause respiratory irritation.
to do. Continue rinsing. - If experiencing respiratory
symptoms: Call a Poison Center or doctor/ physician.
Boric acid (H3BO3)
- May damge fertility. May damage
the unborn child.
- Obtain special instructions
before use. - If exposed or concerned:
get medical advice/ attention.

178
PROCEDURE SAMPLE PREPARATION
Samples which contain large (> 100 µm) suspended particles should be blended to reduce the
particle size to smaller than the micropipette tip, for example as follows:
Add 100 mL of sample in a beaker of 100 mL.
Mix the sample until the sample is homogenous and no large particles (not larger than the
pipette tip size) remain in the sample.
Add a stirring magnet to the sample and put on a magnetic stirrer. The sample is then taken
from this beaker with a micropipette while the water sample is being stirred.
SAMPLE ANALYSIS
Here under follows the procedure for samples with TOC concentration of 2-65 mg TOC L-1. All pictures are courtesy of Hach Lange (2014).For samples with a TOC concentration above 65
mg TOC L-1, dilutions should be made with demineralized water.
TC determination Figure 2. Sample analysis (Hach Lange 2014)
1. Screw powder dispenser on to digestion reagent A. Invert so that powder dispenser is under the reagent and shake. This causes the dispensing chamber to be filled. Position the centring recess of the powder dispenser above the TC cuvette and add one dose. Close digestion reagent A immediately with original cap.
2. Pipette 2 mL sample into the TC cuvette. If the sample contains suspended particles, the sample should be taken with a micropipette while the sample is stirring on a magnetic stirrer.

179
Figure 3. Sample analysis (Hach Lange 2014)
3. Close the TC cuvette immediately with the original cap and invert a few times.
4. Close the indicator cuvette very tightly with the membrane double-cap. The barcode label must be on lower half close to the indicator tube.
5. Open the TC cuvette and quickly screw the prepared indicator cuvette tightly on to the TC cuvette. Hold the cuvette combination vertically. Do not invert. The sample must not come into contact with the membrane of the double-cap!
TIC determination
6. Pipette 2 mL sample into the TIC cuvette. If the sample contains suspended particles, the sample should be taken with a micropipette while stirring on a magnetic stirrer.

180
Figure 4. Sample analysis (Hach Lange 2014)
7. Quickly close the TIC cuvette with the original cap and invert a few times.
8. Close the indicator cuvette very tightly with the membrane double-cap. The barcode label must be on lower half close to the indicator tube.
9. Open the TIC tube and quickly screw the prepared indicator cuvette tightly on to the cuvette. Hold cuvette combination vertically. Do not invert. The sample must not come into contact with the membrane of the double-cap!
10. Heat both cuvette combinations simultaneously in the preheated thermostat for 2 h at 100°C. The indicator tubes should not be put directly into the heating block to avoid heating up of the indicator solution; so a 100°C oven cannot be used for this analysis.

181
Figure 5. Sample analysis (Hach Lange 2014)
11. Take the cuvettes out of the thermostat block and allow to cool to room temperature without inverting the tubes Clean the indicator tubes with paper.
Invert the cleaned cuvette TC and TIC combination and put successively in the
spectrophotometer. Always measure the TC first, and the TIC second. The mode to determine
(LCK 380) will be automatically selected by the bar code reader. The wavelength selected
should be 440 nm. The TC, TIC and TOC are displayed on the spectrophotometer.
CALCULATION OF RESULTS The conversion of absorbance to TC, TIC, and TOC is done by the spectrophotometer.
For diluted samples, the used dilution factor should be taken into account.
QUALITY CONTROL The SOP can be screened by measuring samples with a known TIC, TC and TOC
concentration.
The TIC, TOC and TC values for wastewater are strongly dependent on the wastewater type.
Values between 40 and 500 mg C L-1 have been reported (Van Den Hende, 2014).
ERRORS, CALIBRATION AND INTERFERENCES The pH of the sample must be between pH 4 and pH 10.
The test reagents are stable at +15°C to +25°C up to the expiry date given on the package.
Avoid contamination by ambient air. Never leave cuvette open, because carbon dioxide in the
ambient air can cause high bias. Cuvettes must only be opened when necessary (e.g. to add
sample) and must be closed or further processed immediately afterwards.
If several samples are analyzed simultaneously, label them so that the TC and TIC cuvette
combinations of the same sample can be recognized.
Measuring range: 2-65 mg TOC L-1.
Various substances can interfere with this TIC/TOC/TC measurement (Table 1, Table 2). Higher
concentrations of these ions cause high-bias results with TIC and low-bias results with TC
measurements.

182
Table 1. Substances which interfere with the TIC determination
Interfering substance Interference level (mg L-1) Methanoate (HCOO-) 400 Acetate (CH3COO-) 250
Sulfite (SO32-) 30
Sulfide (S2-) 10
Nitrite (NO2-N) 3
Table 2. Substances which interfere with the TC determination
Interfering substance Interference level (mg L-1) Chloride (Cl-) 500
Calcium (Ca2+), magnesium (Mg2+) 200 Ammonium (NH4
+) 100
WASTE STREAM AND PROPER DISPOSAL Hach Lange local agencies accept used cuvettes to ensure their proper disposal in accordance
with local and national regulations. These used cuvettes should thus be stored and sent back to
Hach Lange. Do not screw the cuvette combinations apart when the analysis has been
completed (put the indicator cuvette upwards).

183
REFERENCES APHA, Awwa, WEF, 2005. Standard Methods for the Examination of Water and Wastewater, 21st ed. American Public Health Association, Washington DC. Van Den Hende S., 2014. Microalgal bacterial flocs for wastewater treatment: from concept to pilot scale. PhD thesis, Ghent University, Ghent, 324p. Beelen V., Van Den Hende S., 2014. Verbal communication. Ghent University, Campus Kortrijk. Hach Lange, 2014. Safety Data Sheet LCK 380. Available on (26/06/2014): http://www.camlab.co.uk/originalimages/sitefiles/msds/hach/hh_lck380.pdf. Sigma-Aldrich, 2014. Potassium chloride. Available on (26/06/2014): http://www.sigmaaldrich.com/catalog/product/sial/p9333?lang=fr®ion=FR. Sigma-Aldrich, 2014. Sodium hydroxide. Available on (26/06/2014): http://www.sigmaaldrich.com/catalog/product/fluka/38210?lang=fr®ion=FR. Sigma-Aldrich, 2014. Lithium hydroxide. Available on (26/06/2014): http://www.sigmaaldrich.com/catalog/product/sial/442410?lang=fr®ion=FR. Sigma-Aldrich, 2014. Sodium persulfate. Available on (26/06/2014): http://www.sigmaaldrich.com/catalog/product/sial/216232?lang=fr®ion=FR. Sigma-Aldrich, 2014. Boric acid. Available on (26/06/2014): http://www.sigmaaldrich.com/catalog/product/aldrich/202878?lang=fr®ion=FR. Hach, 2009. TOC wastewater analysis. Available on (26/06/2014): http://www.hach-lange.co.uk/medias/sys_master/8852615495710/EN_20033.pdf.

184
SOP: 2.8.e TIC, TC, TOC, DOC Analysis Anneliese Ernste
eHochschule für Technik und Wirtschaft des Saarlandes, Göbenstraße 40, 66117 Saarbrücken, Germany
PURPOSE The TOC/TN Analysator multi N/C 3100 (AnalytikJena, Germany) is an instrument to
determine IC, TC and TNb in aqueous samples. The instrument is used to examine
bicarbonate, TC and DOC in clear supernatants of algae suspensions and for elemental
analysis of cells (C,N).
PRINCIPLE For IC determination, samples are acidified with phosphoric acid. TC is determined after a
catalytic high-temperature combustion at 800°C. For both treatments the resulting CO2 is
detected by a NDIR detector. TOC is calculated as the difference between TC and IC.
REQUIREMENTS The TOC/TN Analysator multi N/C 3100 (AnalytikJena, Germany), autosampler, glass vessels
(30 mL), fitted to the tablet of the autosampler, adjustable pipettes for sample dilution
HAZARDS AND PRECAUTIONARY STATEMENTS The instrument contains an oven and is operated with pressurized oxygen. Read warnings
and instructions carefully
PROCEDURE Sample collection, preservation and storage
Supernatants collected routinely for nutrient analyses and stored at -20°C were used for
extracellular IC and TC analysis and DOC calculation. If necessary, turbidity was removed
from supernatants by syringe-filtration (0.2 µm).
For elemental analysis of cells (C,N) cell pellets were re-suspended in identical volume of
deionized water.
Measurement Initialize the instrument according to the instructions.

185
DOC determination: Dilute supernatants of saline samples at least 1:3 with deionized water, to
reduce salt load on the catalyst.
Place samples in rack of the autosampler between two standards: one as 1st sample and one
after the samples to be analysed. (Each analysis takes 45 min, so the samples remain at RT
for a considerable time)
Add a sample containing deionized water as last sample (to clean tubing) and as check of IC
contamination by dilution water.
Connect a suitable calibration table (see below) with a rack table containing the information of
the current experiment (e,g, sample name, sample dilution).
Start analysis
TOC of cells: dilute re-suspended cell pellets with deionized water to fit the calibration range of
ÆTN.
Place samples in the rack of the autosampler between two.
Connect a suitable calibration (see below) with the rack table containing the information of the
current experiment (e,g, sample name, sample dilution).
Start analysis
CALCULATION OF RESULTS If calibration and rack table has been programmed correctly, the instrument provides final
results. If IC in dilution water is a significant fraction of sample IC, correct sample IC
accordingly.
CALIBRATION AND QUALITY CONTROL Stock solutions were diluted to allow a calibration of IC TC between 0 and 100 mg L-1 C, TC
between 0 and 200 mg L-1 C and TN between 0 and 30 mg N L-1. As a precaution for possible
matrix effects standards for the analysis of supernatants were prepared in 1:3 diluted saline
solution.
Stock solutions of standards contained (in deionized water):
0.5. g L-1 C of bicarbonate and 0.5. g L-1 C of carbonate;
1 g L-1 C of saccharose;
1 g L-1 N of potassium nitrate;
For biomass analysis, a standard was prepared in freshly prepared deionized water
containing:
1 g L-1 N of isoleucine;

186
Optional: 0.5. g L-1 C of bicarbonate and 0.5. g L-1 C carbonate.
The stock solutions were combined to one standard containing all substances at the highest
concentration of the calibration (100%)..
Dilutions were prepared containing 0%, 10%, 25%, 40%, 55%, 70%, 85%, 100% of this mix of
standards.
Aliquots of stock solutions (1 to 2 mL) should be kept frozen for later use.
REFERENCES Manual multi N/C 3100 TOC/TNb-Analysator of AnalytikJena
OTHER POINTS The instrument has multiple options for automatic corrections (e.g. correction for traces of IC
and TN in the dilution water, a correction for decreasing catalyst function). These options
proved to be too confusing for successive users. Therefore all samples were declared
“samples” and corrections were performed manually if indicated by a > 5% effect.

187
SOP: 2.9.a Dissolved Oxygen – OxyGuard Handheld probe Craig Pooleya, Alla Silkinaa
aAlgal Research, Swansea University, Singleton Park, Swansea, SA28PP, UK PURPOSE This procedure is to analyse seawater and freshwater for dissolved oxygen.
PRINCIPLE This procedure is for the determination of dissolved oxygen (DO) using the OxyGaurd Handy
Polaris 2 handheld meter and is a measure of the amount of gaseous oxygen in a dissolved
aqueous state. Oxygen enters water by diffusion and photosynthetic activity, and is in
proportion to the atmospheric component. The probe has an electrode system where the
dissolved oxygen reacts at the cathode producing a measurable electrochemical effect (Omega,
n.d).
REQUIREMENTS Equipment and materials
� OxyGuard Handy Polaris 2 DO meter
� Deionised water
� Beakers (various)
� Tissue paper
Reagents
N/A
HAZARDS AND PRECAUTIONARY STATEMENTS N/A
PROCEDURE Preparation of stock solutions
N/A
Preparation of standards and samples

188
Collect samples in a beaker or a bottle. Measure as soon as possible after sampling.
Measurement of standards and samples
Turn on meter by holding the symbol for 3 seconds. Rinse the outside of the electrode with
deionised water and dry gently with a piece of tissue paper. Use the arrow buttons to navigate
between the parameters, the options are temperature, DO mg L-1 and DO %.
Immerse the probe in the solution and move the probe gently until the reading stabilises.
Record the reading. Rinse the probe with deionised water and gently pat dry. Turn the meter
off by holding the on/off button for 3 seconds. Store in the protective pouch.
To calibrate the probe turn the meter on and press the OK button to go the menu and select
Calibrate. Press OK. Progress of the calibration is shown on the screen. When calibration is
complete press OK. The probe should read 100.5% when in the air (OxyGuard, n.d.).
CALCULATION OF RESULTS Results can be expressed as mg L-1 or as percent %. QUALITY CONTROL No quality control solutions are used, however when in the air the probe should read 100.5%.
ERRORS AND INTERFERENCES Temperature has an effect on dissolved oxygen, however this is compensated for by the probe.
WASTE STREAM AND PROPER DISPOSAL Samples can be disposed of.
REFERENCES Omega (n.d.) Technical Dissolved Oxygen - The Fundamentals [online] Available at
http://www.omega.com/techref/ph-1.html
OxyGuard (n.d.) Handy Polaris 2 Instructions for Use

189
SOP: 2.9.b Analysis of dissolved oxygen (DO) with an optical sensor Sofie Van Den Hendeb
bDepartment of Industrial Biological Sciences (former Howest University College)(, Faculty of Bioscience
Engineering, Ghent University, Campus Kortrijk, Karel de Goedelaan 5, 8500 Kortrijk, Belgium PURPOSE This procedure is used to determine the dissolved oxygen (DO) concentration in a microalgae
reactor by means of an optical DO sensor.
PRINCIPLE Dissolved oxygen is measured by an optical DO sensor VisifermTM (Hamilton, Switzerland; Fig.
1.a) in which the luminophore is embedded in a robust sensor cap. In this sensor, no electrolyte
is needed.
Figure 1. Optical DO sensor VisifermTM (a) and symmetrical dual channel optics of this DO sensor (b) (Hamilton, 2011b) This DO sensor enables monitoring the status of the sensor’s blue LED using one of the
photodiodes (Figure 1.b). The photodiode with the red filter measures the oxygen-dependent
red light generated on the luminophore through luminescence (fluorescence) caused after
excitation by the blue light (Figure 2). Electrons are excited to a higher energy level, and return
to their original level after emission of red light (Figure 2a). When the luminophore comes into
contact with elemental oxygen, the O2 molecules absorb the energy, resulting in reduced
intensity of red light emission (Figure 2b). This difference in intensity is analyzed by the

190
instrument’s self-monitoring system to pinpoint photobleaching (bleaching of the luminophore).
High precision measurement of the optical phase shift between the blue and red light pulses
provides accurate indication of oxygen concentration. Normally, the luminophore’s excited
electrons remain in this state for some time. However, in the presence of oxygen they return to
their ground state more quickly. Between the pulsed excitation of the luminophore with blue light
and the emission of red light, there is an oxygen-dependent time shift which can be measured
as an angle of phase. Measurement, calculation, and output of the measured value occur
entirely inside the sensor.
Figure 2. Adsorption of blue light and light emission of the luminophore of VisifermTM: (a) without and (b) with the presence of oxygen (Hamilton, 2011b) REQUIREMENTS EQUIPMENT AND MATERIALS
CALIBRATION
- An optical DO sensor (VisifermTM, Hamilton, Switzerland) in a protection cap (JUMO,
Belgium) connected to a PLC and laptop
- Algal reactor liquor, e.g. MaB-floc pilot reactor
- ARC Sensor Configurator (Hamilton, Switzerland)
MEASUREMENT
- An optical DO sensor (VisifermTM, Hamilton, Switzerland) in a protection cap (JUMO,
Belgium) connected to a PLC and laptop
- Algal reactor liquor, e.g. MaB-floc pilot reactor
REAGENTS - N/A
HAZARDS AND PRECAUTIONARY STATEMENTS - No hazards or precautionary statements.
a b

191
PROCEDURE PREPARATION OF STOCK SOLUTIONS
- N/A
PREPARATION OF STANDARDS AND SAMPLES & CALIBRATION
- Take the DO sensor out of the microalgal reactor.
- Clean the DO sensor with demineralized water. Do not use a brush to clean the senor to
avoid damaging the sensor.
- Immerge the cleaned sensor in the microalgal reactor.
- Open the software for the EnAlgae pilot reactor operation. Click on the reactor drawing
of the first tab page ‘P&ID’. A new window will open in which the DO value is displayed
as mg DO L-1 (Fig. 3).
- The DO sensor can only be recalibrated by means of the ARC Sensor Configurator and
software installed on the PLC laptop. The calibration procedure is described in detail in
chapter 4.2. of the configuration manual of Hamilton (2011a).
- Make sure that after calibration, the ‘DO’ is turned on again on the tab page ‘Properties’
(laptop).
MEASUREMENT
- Take the DO sensor out of the microalgal reactor.
- Clean the DO sensor with demineralized water. Do not use a brush to clean the senor to
avoid damaging the sensor.
- Immerge the cleaned sensor in the microalgal reactor.
- Open the software for the EnAlgae pilot reactor operation. Click on the reactor drawing
of the first tab page ‘P&ID’. A new window will open in which the DO value is displayed
as mg DO L-1 (Fig. 3).
CALCULATION OF RESULTS - Wait until the DO value on the laptop screen stabilized. Read this value in mg DO L-1
(Figure 3).

192
Figure 3. Print screen showing the DO level in the MaB-floc pilot reactor measured by an optical DO sensor (software developed by CATAEL bvba for Ghent University in the framework of the EnAlgae project) QUALITY CONTROL - The accuracy of the sensor should be regularly checked. This can be done by putting
the DO sensor 1-2 cm above a water surface. The DO value should stabilize to a
saturated DO value. This saturated DO value depends on the water temperature, water
salinity and atmospheric pressure, and should be looked up in literature (Wilde, 2006). If
the measurement is not accurate any more, the DO sensor should be recalibrated by
means of the ARC Sensor Configurator as described in chapter 4.2. of the configuration
manual of Hamilton (2011a).
ERRORS AND INTERFERENCES - A contaminated sensor may lead to errors. Therefore the sensor should be regularly
cleaned with demineralized water. The use of a hard shrub should be avoided.
- The sensor should be stored submerged in water or reactor liquor.
WASTE STREAM AND PROPER DISPOSAL - Since no reagents are used, there is no chemical waste stream.
REFERENCES - Hamilton, 2011a. ARC Sensor Configurator V4.2.1. – User Manual. Hamilton Bonaduz
AB, Switzerland, 48 p.

193
- Hamilton, 2011b. VisifermTM DO - E/691068/02 03/2011. Hamilton Bonaduz AB,
Switzerland, 8 p.
- Wilde, F.D., ed., 2006. Field measurements: U.S. Geological Survey Techniques of
Water-Resources Investigations, book 9, chap. A6. Field Measurements. DO. Version
2.0. Accessed 2014/07/28: http://pubs.water.usgs.gov/twri9A6/.

194
SOP: 2.10.b Analysis of biochemical oxygen demand (BOD5) Alexandra Lefoulonb, Sofie Van Den Hendeb
bDepartment of Industrial Biological Sciences (former Howest University College)(, Faculty of Bioscience
Engineering, Ghent University, Campus Kortrijk, Karel de Goedelaan 5, 8500 Kortrijk, Belgium
PURPOSE This procedure is used to determine the biological oxygen demand after 5 days (BOD5) of a
water sample by means of BOD self-check measurements in OxiTop bottles with manometers.
This water sample can be wastewater.
PRINCIPLE The method consists of filling an airtight bottle with the sample and dilution water, and
incubating it at a specific temperature for five days. Measurement using OxiTop BOD5
instrumentation is based on a pressure measurement in a closed bottle: microorganisms in the
BOD5 bottle consume the oxygen and form CO2. This CO2 is absorbed by sodium hydroxide
(NaOH), creating sodium carbonate (Na2CO3).
In BOD self-checks bottles containing a manometer, the reduction in oxygen causes a definite
pressure difference which can be measured by a pressure sensor (manometer). The measured
pressure difference is converted into a BOD5 value in mg BOD5 L-1.
REQUIREMENTS EQUIPMENT AND MATERIALS
Needed for the preparation of blank - 1000 mL recipient
- pH meter and pH buffer solutions for calibration
- air pump
- micropipette of 100-1000 µL and tips of 1000 µL
- magnetic stirrer and magnetic agitator
Needed for the preparation of dilution water - 1000 mL recipient
- pH meter and pH buffer solutions for calibration
- air pump

195
- micropipette of 100-1000 µL and tips of 1000 µL
- magnetic stirrer and magnetic agitator
Needed for the preparation of the incubation bottle for two water samples and one blank - 3 WTW OxiTop manometers (Figure 1)
- 3 BOD5 incubation bottles (Figure 1)
- 3 quivers made of rubber (Figure 1)
- 500 mL cylinder
- 3 magnetic agitator
Figure 1: Oxitop bottle, manometer and quiver made of rubber
Needed for measuring BOD5 - 1 magnetic stirrer for each incubation bottle
- incubator or thermostatically controlled water bath
REAGENTS
Needed for the dilution water (here for a measuring range of 0-200) The needed volume of dilution water depends on the BOD5 concentration of the samples
according to Table 1.

196
Table 1: Needed volume of dilution water in function of the BOD5 concentration in the sample
BOD5 concentration (mg BOD5 L-1)
Sample volume Vtotal (mL)
Volume of each sample
(mL)
Volume of dilution water for the blank
(mL)
Volume of dilution water
for each sample (mL)
0-40 432.0 216.0 436.0 216.0 0-80 365.0 182.5 365.0 182.5
0-200 250.0 125.0 250.0 125.0 0-400 164.0 82.0 48.5 82.0 0-800 97.0 48.5 97.0 48.5 0-2000 43.5 21.75 43.5 21.75
As an example, the volume needed for a measuring range of 0-200 mg BOD5 L-1 is
explained in detail. In total, 500 mL of dilution water is needed for the analysis of 1 blank
and 2 samples. Therefore, 800 mL dilution water is made.
For the dilution water, the following reagents are needed:
- 800 µL of phosphate buffer solution/ 800 mL dilution water
- 800 µL of magnesium sulfate solution/ 800 mL dilution water
- 800 µL of ferric chloride solution/ 800 mL dilution water
- 800 µL of calcium chloride solution/ 800 mL dilution water
- 800 µL of wastewater
- 800 mL of tap water
- solution of hydrochloric acid (HCl) to decrease the pH if necessary
1.1.1. Needed for the preparation of the incubation bottles - 2 sodium hydroxide pellets for each sample (NaOH; Ghent University,
Campus Kortrijk, ref. 40230); 2 NaOH pellets for the blank
- 2 drops of nitrification inhibitor (5g L-1 C4H8N2S) for each sample and for
each blank
- 125 mL of each water sample (the amount depends on the BOD5
concentration as explained in Table 1)
- 125 mL of dilution water for each sample and 250 mL dilution water for
the blank
HAZARDS AND PRECAUTIONARY STATEMENTS x Rinse your hand with water if you touch the sodium hydroxide pellets.
x Always wear a laboratory coat and safety glasses. Neoprene or rubber gloves can be
used for handling sodium hydroxide pellets.

197
Reagent Hazard statements Precautionary statements
Sodium hydroxide
pellets (NaOH)
- May be corrosive to metals. - Causes severe skin burns and
eye damage.
- Wear protective gloves/ protective clothing/ eye protection/ face protection.
- If in eyes: rinse cautiously with water for several minutes. Remove contact lenses, if present and easy to do. Continue rinsing.
- Immediately call a Poison Center or doctor/ physician.
PROCEDURE
PREPARATION OF STOCK SOLUTIONS
The reagents can be prepared in advance.
- Phosphate buffer solution: dissolve 8.5g KH2PO4, 21.75 g K2HPO4, 33.4 g
Na2HPO4.7H2O, and 1.7 g NH4Cl in about 500 mL distilled water, stir until all is dissolved
and dilute to 1 L. The pH should be 7.2 without further adjustment.
- Magnesium sulfate solution: dissolve 22.5 g MgSO4.7H2O in distilled water, stir until all is
dissolved and dilute to 1 L.
- Calcium chloride solution: dissolve 27.5 g of CaCl2 in distilled water, stir until dissolved
and dilute to 1 L.
- Ferric chloride solution: dissolve 0.25 g FeCl3.6H2O in distilled water, stir until dissolved
and dilute to 1 L.
- Store all the above stock solutions in a labeled glass bottle at 4°C (fridge).
PREPARING OF STANDARDS AND SAMPLES
Preparation of dilution water To prepare 800 mL (as an example) dilution water, take a glass recipient of 1000 mL
and fill it with 800 mL of tap water.
a) Add in the glass recipient with a micropipette
- 800 µL of phosphate buffer solution
- 800 µL of magnesium sulfate solution
- 800 µL of ferric chloride solution
- 800 µL of calcium chloride solution
- 800 µL of wastewater (bacteria inoculum)
b) Aerate this solution for minimum 2 hours to saturate the water with oxygen by means of
the air pump and a magnetic stirrer.

198
c) After 2 hours, check the pH of the dilution water. Adjust the pH to 7.2 using a solution of
HCl or NaOH.
Preparation of the incubation bottles x Fill one incubation bottle for the blank with a volume of dilution water equal to the total
volume (Vblank = VTotal ) (Table 1).
x In another incubation bottle, put a volume of the sample equal of half of the total volume
(Vanalysis = ) , for example 125 mL.
x Fill the rest with dilution water (Table 1).
Figure 2: Incubation bottles for the blank and two samples (influent and effluent)
x Put in each incubation bottle 2-3 drop of nitrification inhibitor.
x Put in each incubation bottle one magnetic agitator.
x Put in each incubation bottle a rubber quiver.
x Put 2-3 sodium of hydroxide tablets in each the rubber quiver.
x Put an OxiTop manometer on the top of each bottle.
MEASUREMENT OF STANDARDS AND SAMPLES
When the OxiTop manometer is put on the top of each bottle, press S and M keys
simultaneously (Figure 3) until the display shows ‘00’. Stored values are then deleted.
Figure 3: S and M keys of the OxiTop manometer

199
The OxiTop will store automatically one value every 24h for 5 days.
Keep during these 5 days the incubation bottle on a magnetic stirrer at a constant temperature
(often 20 or 25°C; here 28°C due to lack of a 20°C incubator) in a dark place to avoid
photosynthetic oxygen production. Use the same temperature for all analyses of the same
experiment.
During these 5 days, the current value can be read by pressing the M key.
To read out of the stored value of each incubation bottle after the 5 days have passed (Figure 4)
press S until the measured value is displayed (1 sec). Scroll to the next day by repressing the S
key while the measured value is displayed (5 sec). Fast scrolling can be done by repeatedly
pressing the S key until number 5 is displayed. These obtained numbers are called ‘digits’
further in the text.
Figure 4: Read out of the stored values
CALCULATION OF RESULTS The volume sample and dilution water for each bottle depends on the BOD5
concentration of the sample (Table 2). In this protocol, the example of measuring range of 0-200
mg BOD5 L-1 is expected).

200
Table 2: Sample volume and factor according to the BOD5 measuring range
Sample volume Vtotal
(mL) Measuring range
(mg BOD5 L-1) Factor
432 0-40 1
365 0-80 2
250 0-200 5
164 0-400 10
97 0-800 20
43.5 0-2000 50
22.7 0-4000 100
Convert the displayed digits into the BOD5 values.
x For the blank:
𝐵𝑂𝐷 (𝑚𝑔 𝑂 𝐿 ) = 𝑀 ∗ 𝐹
Mblank: measured digit after 5 days for the blank
F: BOD5 factor according Table 2
x For the samples:
𝐵𝑂𝐷 (𝑚𝑔 𝑂 𝐿 ) = 𝑀 ∗ 𝐹 ∗ (𝑉 + 𝑉 )𝑉
− 𝐵𝑂𝐷
Msample: measured digit value after 5 days
Vsample: introduced volume of the analysis sample (L)
Vdilution water: introduced volume of the bacteria solution (L)
- QUALITY CONTROL x The blank needs to be near 0 mg O2 L
-1.
x The obtained BOD5 value should be as expected according to Table 1. If not, the
measurement should be repeated.
- ERRORS AND INTERFERENCES x WTW OxiTop has an AutoTemp function. If the sample temperature is too cold, the start
of measurement is automatically delayed by at least 1 hour until a constant temperature
has been reached.

201
x Exclude all light to prevent possibility of photosynthetic production of oxygen.
x With very high values (>2000 mg L-1) prediluting of the sample is recommended.
x The OxiTop manometer will show: , when values remain below the measuring range
(<0digits).
x Batteries should be changed every 3 months. The OxiTop will show when the
batteries are low.
x Measures cannot be used if the measured value of day 1 is missing; then is
displayed.
x If the OxiTop is not properly closed, do not use the result.
x If the values exceeds measuring range (>50digits) the OxiTop manometer will show:
.
x Samples for BOD5 analysis may degrade significantly during storage between collection
and analysis, resulting in low BOD5 values. If analysis is not started within 2 h of sample
collection, keep the sample at or below 4°C until maximum 3 days.
x Do not clean the incubation bottles with disinfectants. It will kill the required
microorganisms. Clean the bottle with deionized water and a brush.
x If the pH of the sample is not between 6.5 and 8.5, add sufficient alkali or acid to bring it
within that range. Determine the amount of acid and alkali to be added by neutralizing a
separate portion of the sample to about pH 7.0 with a 1 mol L-1 solution of acid or alkali,
using an appropriate indicator (e.g. bromothymol blue), or pH meter. Add a calculated
aliquot volume of acid or alkali to the sample for the BOD5 test.
x Some samples may be sterile, and will need seeding. The purpose of seeding is to
introduce into the sample a biological population capable of oxidizing the organic matter
in the wastewater. Where such micro-organisms are already present, as in domestic
sewage or unchlorinated effluents and surface waters, seeding is unnecessary and
should not be carried out.
x When there is reason to believe that the sample contains very few micro-organisms, for
example as a result of chlorination, high temperature, extreme pH or the specific
composition of some industrial wastes, the dilution water should be seeded.
x For seeding, to each litre of dilution water add 5 mL of a fresh sewage effluent of good
quality obtained from a settling tank following an aerobic biological process of
purification. If necessary, settle (not filter) the effluent in a glass cylinder for about 30
minutes.

202
x If such effluent is not available, use settled domestic sewage that has been stored at 20
°C for 24 hours; for seeding, add 1-2 mL of the supernatant to each litre of dilution water.
x The special difficulties in choosing a seed for industrial effluents that are toxic, or that
are not broken down by sewage bacteria, are dealt with in the following sub-section on
“Seeding samples of industrial effluents”. If the samples are analysed in different
laboratories, better agreement between test results will be achieved by using the same
type of seed or, preferably, the same seed.
x Some samples may be supersaturated with dissolved oxygen, especially waters
containing algae. If such samples are to be incubated without dilution, the dissolved
oxygen concentration should be lowered to saturation to prevent loss of oxygen during
incubation. The sample should be brought to about 20 °C in a partly filled bottle and well
shaken.
x A few sewage effluents and certain industrial effluents contain either residual chlorine or
the products of the action of chlorine on certain constituents. Such liquids cannot be
used directly for the determination of BOD5 because of the bactericidal effect of the
chlorine or of its products and also because chlorine would introduce an error into the
determination of dissolved oxygen. If the samples are allowed to stand for 1 to 2 hours,
the residual chlorine will often be dissipated. Dilutions for BOD5 can then be prepared
with properly seeded standard dilution water.
x Higher concentrations of chlorine, and of many compounds containing available chlorine,
may be removed by treating a portion of the sample with sodium bisulfite. The treated
portion is then used for the BOD5 test. This procedure will probably give reasonably
good results for domestic sewage effluents that have been chlorinated, since the
chlorine will be present chiefly as chloramines formed by combination of chlorine with
the ammonia present. However, in the case of other effluents consisting of, or
containing, industrial wastes, the chlorine may have combined with organic compounds
present to produce substances which, although giving no reaction for chlorine with the
starch-iodide test described below, are inhibitory to biochemical oxidation or are even
bactericidal. The BOD5, as determined in these circumstances, is generally lower than
would be expected for the organic content as measured by other tests.
x Should a value for BOD5 of chlorinated effluent be required, notwithstanding the
uncertainty of the interpretation of the test, the following procedure should be used:
a) If the sample is alkaline to phenolphthalein bring it to a pH of 5.0 by the addition
of dilute sulphuric acid. Add a crystal of potassium iodide to a convenient
measured volume of sample (e.g. 100 mL) and titrate it with approximately 0.0l25

203
mol L-1 or 0.025 mol L-1 sodium bisulphite (or sulphite) solution, using a few drops
of starch solution as an indicator.
b) To another portion of sample, sufficient to carry out the BOD test, add the
requisite amount of dilute sulphuric acid to adjust the pH to 5.0, followed by the
volume of sodium bisulphite solution determined by the previous titration. After
thorough mixing allow to stand for several minutes, then check the absence of
chlorine by testing a small portion of the treated sample with neutral starch-
iodide.
c) Confirm the absence or excess of bisulphite on another portion by means of
starch solution and a drop of 0.0125 mol L-1 iodine, which should develop a blue
color. Adjust the pH to about 7.3 before proceeding with the test.
d) Make up the dilution with seeded dilution water and proceed as for unchlorinated
samples.
WASTE STREAM AND PROPER DISPOSAL Dry sodium of hydroxide tablets on the rubber quivers can be disposed in the ‘general waste’.
REFERENCES
- WTW, 2014. Instruction manual. Manometric BOD Measuring Devices. Available on
(01/06/2014): http://www.globalw.com/downloads/WQ/oxitopis.pdf.
- WTW, 2014. Determination of Biochemical Oxygen Demand (BOD). Available on
(26/06/2014): http://old.omnilab.de/hpb/export/2/BSB_E.PDF.
- Beelen V, Van Den Hende S, 2014. Verbal communication. Ghent University, Campus
Kortrijk.
- APHA, Awwa, WEF, 2005. Standard Methods for the Examination of Water and
Wastewater, 21st ed. American Public Health Association, Washington DC.
- Sigma-Aldrich, 2014. Sodium hydroxide pellets. Available on (25/06/2014):
http://www.sigmaaldrich.com/catalog/product/sial/s8045?lang=fr®ion=FR.

204
SOP: 2.11.a Chemical Oxygen Demand – Hach Photometer Craig Pooleya, Alla Silkinaa
aAlgal Research, Swansea University, Singleton Park, Swansea, SA28PP, UK
PURPOSE This procedure is to analyse seawater and freshwater for chemical oxygen demand (COD).
PRINCIPLE The dichromate Chemical Oxygen Demand (COD) test measures the oxygen equivalent of the
organic matter content of a sample that is susceptible to oxidation by a strong chemical oxidant.
The sample is heated for two hours at 150°C with sulphuric acid and potassium dichromate,
which is a strong oxidizing agent. Oxidizable organic compounds react, reducing the dichromate
ion (Cr2O72–) to green chromic ion (Cr3+). The COD reagent also contains silver and mercury
ions. The silver compound is added as a catalyst to promote the oxidation of certain classes of
organics, and a mercuric compound is included to reduce interference from the oxidation of
chloride ions by the dichromate. End products are carbon dioxide, water, and various states of
the chromium ion (Hach, n.d.). After the oxidation step is completed, the amount of dichromate
consumed is determined colourimetrically. When the 0.7–40.0 or the 3–150 mg L-1 colourimetric
method is used, the amount of Cr6+ remaining is determined (Hach, 2014).
REQUIREMENTS Equipment and materials
� Hach photometer DR/2500
� Hach Digestor block DRB200
� Hach Test ‘N Tube COD vials (for appropriate range i.e. 0-40mg L-1, product code:
2415851/2125851/2125951)
� Deionised water
� Pipettes and tips (5 mL and 1 mL)
� Volumetric flasks (various)
� Plastic Pasteur pipettes (1 mL and 3 mL)
� Analytical balance and weigh boats
� Desiccator
� Tube racks

205
� Paper towel
� Dilution containers, 7 mL Bijou or 30 mL Universal
Reagents
All reagents are provided in the Test ‘N Tube vials available from Hach Lange.
HAZARDS AND PRECAUTIONARY STATEMENTS
The Test ‘N Tube vials contain mercuric sulphate, chromic acid, silver sulphate and sulphuric
acid. The contents are therefore corrosive, toxic, and dangerous to the environment and so
should be strictly contained, and all precautions should be applied when using. It may be
appropriate to prepare the solutions within a fume cupboard, however as the digestor block has
a shield this may remain on the open bench. If the procedures are carried out around
uninformed staff then a message or hazard symbols should be placed near the digestor. Store
the unused and used vials in a safe place. Care should also be taken around hot vials, after
mixing and during digestion.
PROCEDURE Preparation of stock solutions
Quality Control Stock Solution 1000 mg L-1 0.8500 g (+ 0.0001 g) Potassium hydrogen phthalate (dried at 105°C for 2
hours, cool in a desiccator)
Into 1000 mL deionised water (freshwater)
Or Artificial Seawater
35 g Sodium chloride
0.2 g Sodium hydrogen carbonate
Into 1000 mL deionised water
Preparation of standards and samples
For seawater samples a dilution will need to be made if the chloride concentration is expected
to be high. Dilute to the specifications provided below;

206
Table 1 Showing maximum and suggested chloride concentrations to minimise interference
(Hach, 2012)
Vial Range Maximum chloride concentration
Suggested Chloride concentration
Photometer program no.
Ultra low range 0.7 – 40.0 mg L-1 2000 1000 431
Low range 3 – 150 mg L-1 2000 1000 430
High range 20 – 1500 mg L-1 2000 1000 435
Dilute samples into deionised water using a pipette.
If the sample contains a large amount of suspended material then homogenise the sample first
for 30 seconds to 1 minute in a blender. This is unnecessary if there are no solids.
No standards are necessary as the photometer is pre-programmed. To prepare the analytical
quality control (AQC) sample pipette 1 ml of the 1000 mg L-1 stock solution into a 50 mL
volumetric flask. This will give an AQC value of 20 mg L-1, which can be increased if the range
is increased. The solution should be prepared in deionised water for freshwater analysis and
into artificial or low nutrient seawater for seawater analysis.
Measuement of standards and samples
1. Turn on the digestor block using the rocker switch at the back, select the program for COD
at 150°C and press start. The digestor will be begin to heat up while the samples are
prepared and will beep once the analysis temperature has been reached
2. Select the correct number of Test ‘N Tube vials for the appropriate range, including an
additional tube for the blank and one for the AQC sample. Put the tubes in a rack and label
the tops with references. Invert the tubes a few times to dissolve the material at the bottom
of the vial. Remove the top of the vial and hold at a 45° angle. Use a pipette to take 2 mL
of deionised water (rinse the pipette a couple of times first) and add to the vial. Cap the vial
tightly and wipe the outside of the tube with a damp paper towel. Hold the vial by the cap
and invert gently several times to mix. BEWARE the vial will become hot during mixing.
3. Repeat this procedure for all the samples and the AQC. Insert each tube into the digestor
block, invert once or twice before insertion. Close the protective lid and press the start
button to begin the timer countdown of 2 hours.
4. After the digestion has finished the digestor block will begin to cool down. Leave the vials
in the block until the temperature is 120°C or less. Remove the vials and invert several

207
times while still warm, then place them in a rack to cool to room temperature (this should
take 10-20 minutes). Turn off the digestor using the rocker switch at the back.
5. Turn on the photometer using the blue power button and select the program for the range,
see table 1. Clean the outside of the blank vial with a damp paper towel. Insert into the
photometer and close the top. Press ‘zero’ and wait until 0 mg L-1 COD is shown. Remove
the blank vial, wipe the sample vial and insert into the photometer, closing the top. Wait
until the reading stabilises before recording. Proceed to insert all of the samples and AQC.
When finished turn off the photometer.
6. The wavelength used depends on the test; Ultra low range is read at 350 nm, while low
range is read at 420 nm and high range is read at 620 nm.
CALCULATION OF RESULTS The results in mg L-1 COD are defined as the milligrams of O2 consumed per litre of sample
under the conditions of this procedure. The range can be 0.7 – 40 mg L-1, 3 – 150 mg L-1 or 20 –
1500 mg L-1, which should account for the required dilution to eliminate interference from
chloride ions in seawater. Correction for dilution should be applied if necessary.
QUALITY CONTROL AQC’s should be run at the mid range point of the calibration. They should be analysed 1 per
batch of samples digested (digestor block holds 9-11 vials). If any QC’s exceed + 10% and a
cause cannot be determined then a repeat analysis will be required.
ERRORS AND INTERFERENCES Samples should be defrosted in the fridge 12 hours before analysis if possible, and should only
remain frozen for as little time as possible before analysis.
Chloride is the primary interference when determining COD concentration. Each COD vial
contains mercuric sulphate that will eliminate chloride interference up to the maximum level
specified in Table 1 (Hach, 2014).
WASTE STREAM AND PROPER DISPOSAL All used vials should be stored for hazardous waste disposal as they contain mercury,
chromium and silver. The quality control solutions can be disposed of down the sink with
copious amounts of tap water.

208
REFERENCES Hach (n.d.) Chemical Oxygen Demand chemistry explained ‘Reactor digestion using potassium
dichromate method’ [online] Available at http://www.hach.com/codguide
Hach (2012) ‘Oxygen Demand, Chemical’ Reactor digestion method, Method 8000, edition 7
Hach (2014) ‘Oxygen Demand, Chemical’ Reactor digestion method, Method 8000, edition 9
[online] Available at http://www.google.co.uk/url?url=http://www.hach.com/asset-get.download-
en.jsa%3Fid%3D7639983816&rct=j&frm=1&q=&esrc=s&sa=U&ei=EBTOU9uwFemp0QWkwIHg
DA&ved=0CBQQFjAA&usg=AFQjCNEwPB5-KSIkU72iGketixRFnZI33g

209
SOP: 2.11.b Analysis of chemical oxygen demand in wastewater (COD) Alexandra Lefoulonb, Sofie Van Den Hendeb
bDepartment of Industrial Biological Sciences (former Howest University College)(, Faculty of Bioscience
Engineering, Ghent University, Campus Kortrijk, Karel de Goedelaan 5, 8500 Kortrijk, Belgium PURPOSE This procedure is used to determine the chemical oxygen demand (COD) of organic material in
wastewater.
PRINCIPLE Nearly all organic compounds can be fully oxidized with a strong oxidizing agent under acidic
conditions. The amount of oxygen required to do so is called the chemical oxygen demand
(COD) of a given sample. COD measures through chemical oxidation by dichromate, the
majority of the organic matter present in the sample. It involves the oxidation of organic
compounds in the presence of an acidic dichromate solution heated at 148°C for 2 hours. The
oxidizing agent used in this method is potassium dichromate (K2Cr2O7) in which orange Cr6+ is
reduced to green chromic ion Cr3+. By adding a known volume and thus amount of the agent in
excess to the sample, the amount of Cr3+ in the sample after oxidation can be measured by
absorption spectrophotometry at 605 nm and thus the chemical oxygen demand of the sample
is known. Silver sulphate is added as a catalyst and mercury is added to complex chloride
interferences.
REQUIREMENTS EQUIPMENT AND MATERIALS
Needed for the preparation of stock solutions - a fridge (4°C)
- an analytical balance
- 3 graduated flasks of 100 mL
- 3 glass recipients for powder chemicals: potassium dichromate (K2Cr2O7), silver
sulfate, (Ag2SO4 ) and potassium hydrogen phthalate (KHC8H4O4)
- 100 mL glass recipient for sulfuric acid (H2SO4)
- 3 Schott bottles of minimum 100 mL for storage of the 3 stock solutions

210
Needed for the preparation of standards and samples - a heating block (Hach DRB 200, 148°C)
- 2 COD tubes in glass: one for the blank and one for each sample
- 6 COD tubes in glass for standards in order to make a calibration curve
- a spectrophotometer (Hach Lange DR 2800, Belgium)
- a micropipette of 100-1000 µL and tips
- a micropipette of 1-5 mL and tips
- a lab spoon
- wastewater sample stored at 4°C (minimum 1 mL needed for one analysis)
- 5 plastic centrifuge tubes of 15 mL (VWR, Belgium) for standard dilutions
Needed for the measurement - a spectrophometer (605 nm; Hach Lange DR 2800, Belgium)
- bench surface protector
- chemical resistant gloves
REAGENTS
Needed for the preparation of the stock solutions x Stock solution 1: K2Cr2O7 solution
- 1.2257 g of K2Cr2O7 (Ghent University, Campus Kortrijk, ref. 30475) (for 100 mL of
0.25 N K2Cr2O7 solution)
- deionized water
x Stock solution 2: Ag2SO4 - H2S04 solution
- 1.0000 g of Ag2SO4 (Ghent University, Campus Kortrijk, ref. 40410) (for 100 mL of
Ag2SO4 – H2S04 solution)
- deionized water
- 96.5 mL of H2SO4 solution (Ghent University, Campus Kortrijk, ref. 40424) (for 100
mL of Ag2SO4 - H2S04 )
Needed for the preparation of standards and samples x Standard 1: KHC8H4O
- 500 µL of concentrated H2SO4 (Ghent University, Campus Kortrijk, ref. 40424) (for
100 mL of KHC8H4O solution)
- 0.0850 g of KHC8H4O4 (Ghent University, Campus Kortrijk, ref. 1885) (for 100 mL of
KHC8H4O solution with a COD concentration of 1000 mg COD L-1)
x Sample preparation

211
- 1 leveled spoon of mercury (II) sulfate (HgSO4) (Ghent University, Campus Kortrijk,
ref. 30540) per analyzed sample
- 1 mL of deionized and COD-free water (for the blank)
- 1 mL of wastewater sample
- 500 µL of 0.25 N K2Cr2O7 solution per analyzed sample
- 1.5 mL of H2SO4-Ag2SO4 solution per analyzed sample
HAZARDS AND PRECAUTIONARY STATEMENTS x Always operate in a ventilated fume hood.
x If available, use a bench surface protector to absorb possible spills.
x Always wear a laboratory coat, eye protection and laboratory gloves.
x Contact with very hot objects (heated glass tubes) is possible.
x Act carefully and take appropriate measure concerning the extremely hazardous
reagents.
Reagent Hazard statements Precautionary statements
Potassium dichromate (K2Cr2O7)
- May intensify fire; oxidizer. - Toxic if swallowed. - Harmful in contact with skin. - Causes severe skin burns and
eye damage. - May cause an allergic skin
reaction. - Fatal if inhaled. - May cause allergy or asthma
symptoms or breathing difficulties if inhaled.
- May cause genetic defects. - May cause cancer. - May damage fertility or the
unborn child. - Causes damage to organs
through prolonged or repeated exposure.
- Very toxic to aquatic life with long lasting effects.
- Obtain special instructions before use.
- Keep/Store away from clothing/ combustible materials.
- Avoid release to the environment.
- Wear protective gloves/ protective clothing/ eye protection/ face protection.
- Wear respiratory protection.

212
Silver sulphate (Ag2SO4)
- Causes serious eye damage. - Very toxic to aquatic life with
long lasting effects.
- Avoid release to the environment.
- Wear protective gloves/ eye protection/ face protection.
- If in eyes: rinse cautiously with water for several minutes. Remove contact lenses, if present and easy to do. Continue rinsing.
- Dispose of contents/ container to an approved waste disposal plant.
Sulphuric acid (H2SO4)
- Causes severe skin burns and
eye damage. - Harmful to aquatic life with long
lasting effects.
- Avoid release to the environment.
- Wear protective gloves/ protective clothing/ eye protection/ face protection.
- If in eyes: Rinse cautiously with water for several minutes. Remove contact lenses, if present and easy to do. Continue rinsing.
- Immediately call a Poison Center or doctor/physician.
Mercury (II) sulphate (HgSO4)
- Fatal if swallowed. - Fatal in contact with skin. - Fatal if inhaled. - May cause damage to organs
through prolonged or repeated exposure.
- Very toxic to aquatic life with long lasting effects.
- Do not breathe dust/ fume/ gas/ mist/ vapours/ sprays.
- Wash hands thoroughly after handling.
- Avoid release to the environment.
- Wear protective gloves/ protective clothing.
- Wear respiratory protection. - If swallowed: Immediately
call a Poison Center or doctor/ physician.
Potassium hydrogen phthalate
(KHC8H4O4)
Not a hazardous substance or mixture according to Regulation (EC) No. 1272/2008.
- May be harmful if inhaled. May cause respiratory tract irritation.
- May be harmful if swallowed.
- Use equipment for eye protection.
- Use gloves to handle the product.

213
- May be harmful if absorbed through skin. May cause skin irritation.
- May cause eye irritation.
PROCEDURE
PREPARATION OF STOCK SOLUTIONS
Preparation of stock solution 1: 0.25 N K2Cr2O7 (100 mL) - Dry minimum 2 g of K2Cr2O7 in a glass recipient for minimum an hour at 105°C.
- Weight precisely 1.2257 g of dried K2Cr2O7.
- Pour around 50 mL of deionized water in a graduated flask of 100 mL.
- Add the 1.2257 g K2Cr2O7 to it and stir until all is dissolved.
- Add deionized water until exactly 100 mL.
- Pour the solution into a Schott bottle and label the bottle with “EnAlgae; 0.25 N
K2Cr2O7 for COD; preparation date; until end date”.
Preparation of stock solution 2: H2SO4-Ag2SO4 (100 mL) - Weight precisely 1 g Ag2SO4.
- Pour around 3.5 ml deionized water in a graduated flask of 100 mL.
- Add the 1 g Ag2SO4 to it and stir until all is dissolved.
- Add concentrated H2SO4 until exactly 100 mL.
- This solution has to be made minimum 1 day in advance before usage.
PREPARATION OF STANDARDS AND SAMPLES
Preparation of the standards x Standard solution 1, KHC8H4O4 (1000 mg COD L-1; 100 mL)
- Dissolve 0.085 g KHC8H4O4 in about 50 mL deionized water.
- Add 0.5 mL concentrated H2S04.
- Dilute until 100 mL with deionized water.
- If this solution is not used the same day as it is made: pour the solution in a Schott
bottle of minimum 100 mL. Label the bottle with “EnAlgae; KHC8H4O4 for COD;
preparation date; until end date”. This solution can be used for 1 week after
preparing if kept in a closed recipient at 4°C.
x Standard dilutions
- Label 5 plastic centrifuge tubes of 15 mL with the standard names (Table 1).
- Make all dilutions from this standard solution in the labelled plastic tubes of 10 mL
(Table 1).

214
x Preparation and measurement of blank and standards
- Turn on the COD heat block to 148°C (Ghent University, Campus Kortrijk, Lab A103)
so it is heated by the time you finish preparing the standards.
- Label 6 COD tubes in glass with all names as in Table 1.
- Add 1 levelled spoon of HgSO4 to each glass tube.
- Add 1 mL of deionized water to the glass tube of the blank. Add 1 mL of standard 1
to the glass tube of standard 1. Add 1 mL of standard 2 to the glass tube of standard
2. Add 1 mL of standard 5 to the glass tube of standard 5.
- Add to each glass tubes 500 µL of 0.25 N K2Cr2O7 solution with a micropipette of 100
-1000 µL. Use gloves to protect your hands and use a bench surface protector to
absorb possible spills.
- Add slowly to each glass tube 1.5 mL H2SO4-Ag2SO4 solution with a micropipette of
1-5 mL. Use gloves to protect your hands and use a bench surface protector to
absorb possible spills.
- Close each glass tube and shake well. Be careful, the glass tube will heat up very
fast.
- Put all glass tubes in the COD heating block (Figure 1). Choose the ‘COD program’
and heat for exactly 2 hours at 148°C (Figure 2).
Figure 1: COD heating block (Hach DRB 200)
Figure 2: Selection of the COD program of the heating block
- After 2 hours of heating, take out all tubes.
- Invert each tube carefully.
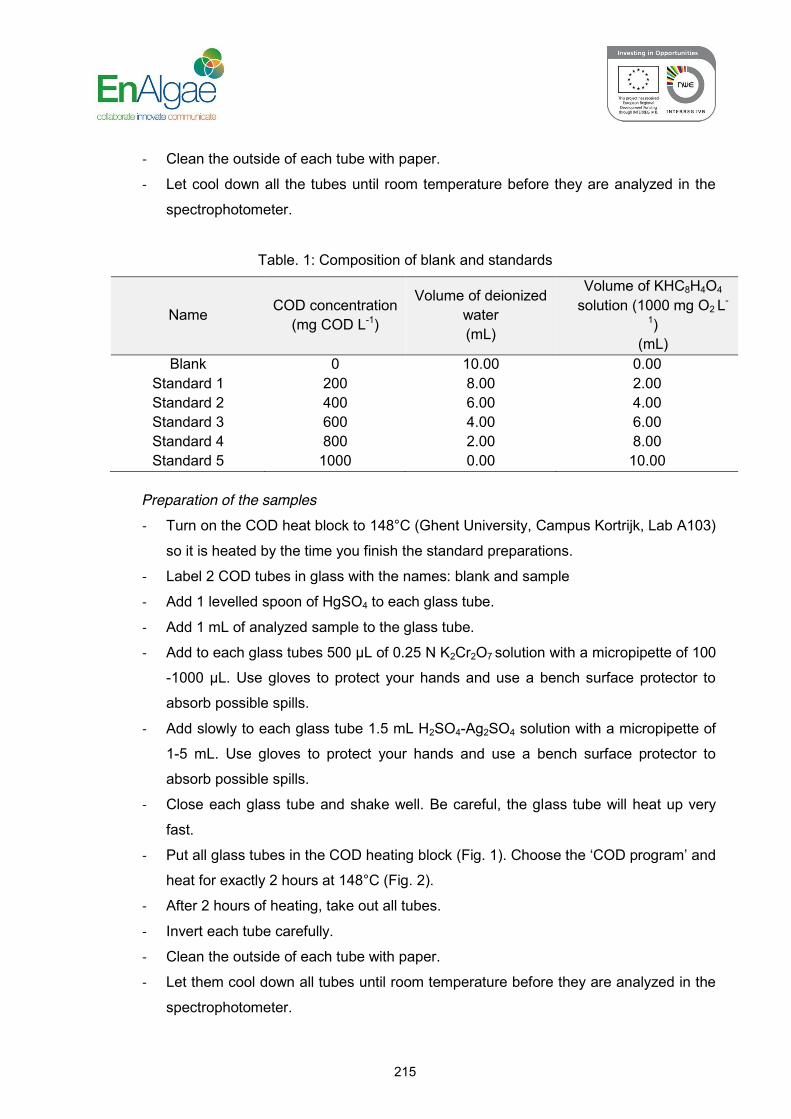
215
- Clean the outside of each tube with paper.
- Let cool down all the tubes until room temperature before they are analyzed in the
spectrophotometer.
Table. 1: Composition of blank and standards
Name COD concentration (mg COD L-1)
Volume of deionized water (mL)
Volume of KHC8H4O4 solution (1000 mg O2 L-
1) (mL)
Blank 0 10.00 0.00 Standard 1 200 8.00 2.00 Standard 2 400 6.00 4.00 Standard 3 600 4.00 6.00 Standard 4 800 2.00 8.00 Standard 5 1000 0.00 10.00
Preparation of the samples - Turn on the COD heat block to 148°C (Ghent University, Campus Kortrijk, Lab A103)
so it is heated by the time you finish the standard preparations.
- Label 2 COD tubes in glass with the names: blank and sample
- Add 1 levelled spoon of HgSO4 to each glass tube.
- Add 1 mL of analyzed sample to the glass tube.
- Add to each glass tubes 500 µL of 0.25 N K2Cr2O7 solution with a micropipette of 100
-1000 µL. Use gloves to protect your hands and use a bench surface protector to
absorb possible spills.
- Add slowly to each glass tube 1.5 mL H2SO4-Ag2SO4 solution with a micropipette of
1-5 mL. Use gloves to protect your hands and use a bench surface protector to
absorb possible spills.
- Close each glass tube and shake well. Be careful, the glass tube will heat up very
fast.
- Put all glass tubes in the COD heating block (Fig. 1). Choose the ‘COD program’ and
heat for exactly 2 hours at 148°C (Fig. 2).
- After 2 hours of heating, take out all tubes.
- Invert each tube carefully.
- Clean the outside of each tube with paper.
- Let them cool down all tubes until room temperature before they are analyzed in the
spectrophotometer.
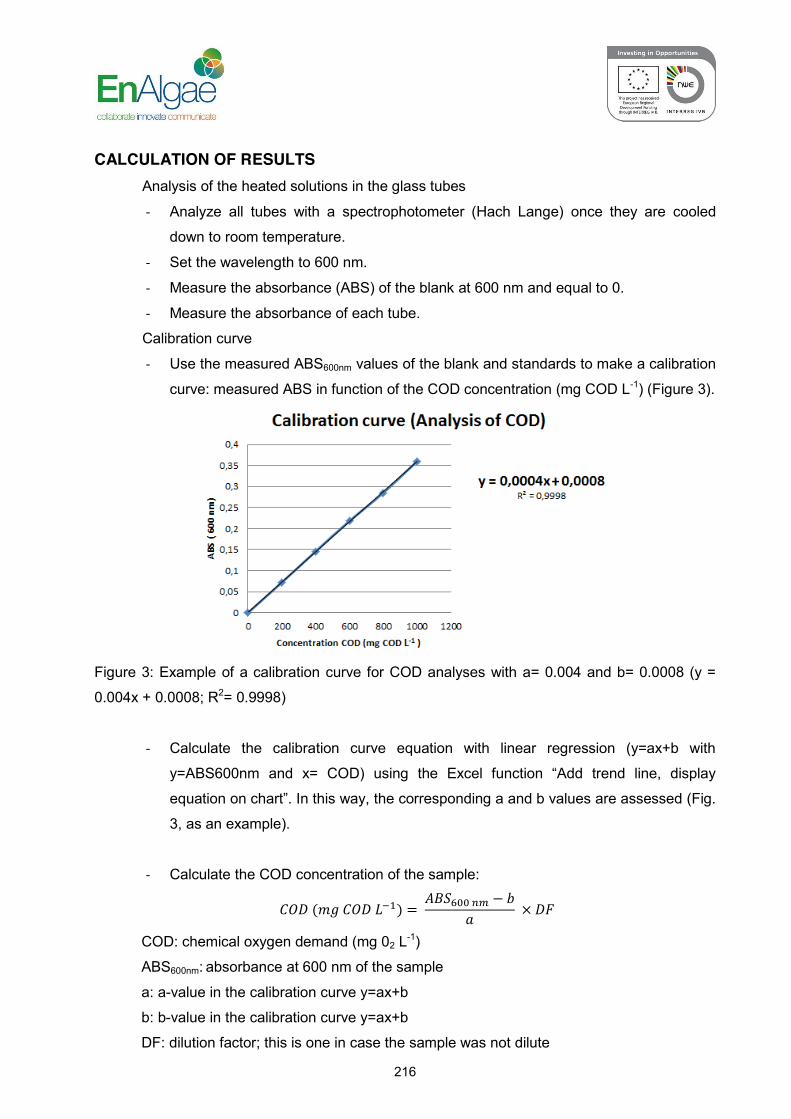
216
CALCULATION OF RESULTS Analysis of the heated solutions in the glass tubes
- Analyze all tubes with a spectrophotometer (Hach Lange) once they are cooled
down to room temperature.
- Set the wavelength to 600 nm.
- Measure the absorbance (ABS) of the blank at 600 nm and equal to 0.
- Measure the absorbance of each tube.
Calibration curve
- Use the measured ABS600nm values of the blank and standards to make a calibration
curve: measured ABS in function of the COD concentration (mg COD L-1) (Figure 3).
Figure 3: Example of a calibration curve for COD analyses with a= 0.004 and b= 0.0008 (y =
0.004x + 0.0008; R2= 0.9998)
- Calculate the calibration curve equation with linear regression (y=ax+b with
y=ABS600nm and x= COD) using the Excel function “Add trend line, display
equation on chart”. In this way, the corresponding a and b values are assessed (Fig.
3, as an example).
- Calculate the COD concentration of the sample:
𝐶𝑂𝐷 (𝑚𝑔 𝐶𝑂𝐷 𝐿 ) = 𝐴𝐵𝑆 − 𝑏𝑎 × 𝐷𝐹
COD: chemical oxygen demand (mg 02 L-1)
ABS600nm: absorbance at 600 nm of the sample
a: a-value in the calibration curve y=ax+b
b: b-value in the calibration curve y=ax+b
DF: dilution factor; this is one in case the sample was not dilute

217
QUALITY CONTROL - R2 of the calibration curve should be at least 0.999 to have precise results.
- If the obtained COD concentration is not in the calibration range, make another
calibration curve with a higher COD range; or dilute the sample and measure again.
- The obtained value should not be negative.
- The COD value of wastewaters is strongly depended on the wastewater type and can
be above 2000 mg L-1 (Van Den Hende, 2014).
- Test the protocol with solutions with a known COD concentration; or spike the
wastewater sample with a solution of a known COD concentration.

218
ERRORS AND INTERFERENCES - The method described here measures COD accurately between 0 and 1000 mg O2 L-1.
The accuracy is depending on the standards used for calibration. Samples in which
higher COD values are expected should be diluted in advance or a range of dilutions
could be made to screen for the ideal dilution to fit the accuracy range.
- All liquid products used in this protocol should be stored around 4°C in the dark.
- This method is only applicable on solutions with a chloride concentration lower than
1000 mg Cl- L-1. Samples with higher chloride concentrations should be diluted.
- Straight-chain aliphatic compounds, aromatic hydrocarbons and pyridine are not
oxidized to any appreciable extent, although this method gives more nearly complete
oxidation than a permanganate method. The straight-chain compounds are more
effectively oxidized when silver sulfate is added as a catalyst. However, silver sulfate
reacts with chlorides, bromides or iodides to produce precipitates that are only partially
oxidized. There is no advantage in using the catalyst in the oxidation of aromatic
hydrocarbons, but it is essential to the oxidation of straight-chain alcohols and acids.
- The oxidation and other difficulties caused by the presence of chlorides in the sample
may be overcome by adding mercuric sulfate before refluxing, in order to bind the
chloride ion as a soluble mercuric chloride complex, which greatly reduces its ability to
react further.
- Nitrite nitrogen exerts a COD of 1.14 mg mg-1 of nitrite nitrogen. To eliminate significant
interference due to nitrites, 10 mg of sulfamic acid for every 1 mg of nitrite nitrogen in
the refluxing flask may be added. If a series of samples containing nitrite is analyzed,
the sulfamic acid may be added to the standard dichromate solution, since it must be
included in the distilled water blank. Thus, 120 mg of sulfamic acid per litre of
dichromate solution will eliminate the interference of up to 6 mg of nitrite nitrogen per
litre in the sample if a 20 mL sample is used. An aliquot volume of the sample diluted to
20 mL should be used to eliminate the interference of higher concentrations of nitrite.
- Ferrous iron and hydrogen sulfide exert COD of 0.14 mg mg-1 Fe2+ and 0.47 mg mg-1
H2S respectively. Appropriate corrections can be calculated and subtracted from the
result or both interferences can be removed by bubbling air through the sample, if
easily volatile organic matter is not present.
- The procedure can be used to determine COD values of 50 mg L-1 with the standard
dichromate solution (0.0417 mol L-1). With the dilute dichromate, values are less
accurate, especially below 10 mg L-1, but may be used to indicate an order of
magnitude.

219
WASTE STREAM AND PROPER DISPOSAL - Empty all used vials in the correct liquid waste stream disposal barrel. The content of
the glass tubes containing heavy metals (Cr, Ag, Hg) should be disposed in the
disposal barrel labelled “Zware metalen – heavy metals”. Rinse the tubes two more
times with demineralized water and dispose the rinsing wastewater in the same way so
no deposits remain at bottom of the vials.
- Thoroughly clean the vials and caps with soap and rinse them with demineralized
water for about 10 times to make sure no products remain that can influence COD
readings the next time. Finally put the vials (without caps) in a muffle oven at 550°C for
about 30 minutes to make sure any remaining product gets oxidized and no COD
remain. Put the caps in a drying oven of 105°C to completely dry them.

220
REFERENCES - APHA, Awwa, WEF, 2005. Standard Methods for the Examination of Water and
Wastewater, 21st ed. American Public Health Association, Washington DC.
- Vito, 2002. Chemisch zuurstofverbruik (COD). Belgisch Staatsblad 27 September 2002.
Available on (02/05/2012): https:
//esites.vito.be/sites/reflabos/2002/Online%20documenten/CMA_2_I_D.5.pdf
- Beelen V., Van Den Hende S., 2014. Verbal communication. Ghent University, Campus
Kortrijk.
- Carré E., 2012.Microalgal bacterial flocs for treatment of manure and aquaculture effluent:
from lab to pilot scale. Annex 1: Description of analytical procedures. Internship report,
Ghent University, Campus Kortrijk, 70p.
- Laurent C., 2014. Biogaspotentieel van microalgen bacteriën vlokken bij verschillende
groeicondities en voorbehandelingen. Annex C: Analysis of COD. Master thesis, Ghent
University, Campus Kortrijk, 123p.
- Hach Lange, 2014. Digital Reactor Block 200 instrument manual (DRB 200). Available on
(20/06/2014):
http://www.google.be/url?sa=t&rct=j&q=&esrc=s&source=web&cd=2&ved=0CCkQFjAB&url
=http%3A%2F%2Fwww.hach.com%2Fasset-
get.download.jsa%3Fid%3D7639982862&ei=jp6lU_-EJ4_o7AbJ4YB4&usg=AFQjCNH_ay-
z1hMnle0ImvTTbBatxFlTIw&bvm=bv.69411363,d.ZGU.
- Sigma-Aldrich, 2014. Potassium dichromate. Available on (25/06/2014):
http://www.sigmaaldrich.com/catalog/product/sial/207802?lang=fr®ion=FR.
- Sigma-Aldrich, 2014. Silver sulfate. Available on (25/06/2014):
http://www.sigmaaldrich.com/catalog/product/sial/31494?lang=fr®ion=FR.
- Sigma-Aldrich, 2014. Sulphuric acid. Available on (25/06/2014):
http://www.sigmaaldrich.com/catalog/product/aldrich/339741?lang=fr®ion=FR.
- Sigma-Aldrich, 2014. Mercury (II) Sulphate. Available on (25/06/2014):
http://www.sigmaaldrich.com/catalog/product/fluka/31014?lang=fr®ion=FR.
- Sigma-Aldrich, 2014. Potassium hydrogen phthalate. Available on (25/06/2014):
http://www.sigmaaldrich.com/catalog/product/sial/p1088?lang=fr®ion=FR.

221
SOP: 2.12.e Iron (Fe), manual assay Anneliese Ernste
eHochschule für Technik und Wirtschaft des Saarlandes, Göbenstraße 40, 66117 Saarbrücken, Germany PURPOSE Monitoring nutrient concentration. Algae contain many proteins that use Fe (and Mn) as co-
factor in electron transport. In the RAS process turbidity is reduced by an ozone-fortified
flotation process (protein skimmer). Iron and manganese will be oxidized by ozone and particles
are removed by flotation. This mechanism makes process water low in iron and manganese.
PRINCIPLE FerroVer® Iron Reagent converts all soluble iron and most insoluble forms of iron in the sample
to soluble ferrous iron. The ferrous iron reacts with the 1-10 phenanthroline indicator in the
reagent to form an orange color in proportion to the iron concentration. The measurement
wavelength is 510 nm for spectrophotometers.
REQUIREMENTS Centrifuge, centrifuge tubes, spectrophotometer, timer, 10-mL sample cells (cuvettes), pipette
(10 mL), pipette tips, reagent (for example FerroVer® powder pillow of Hach-Lange for
concentration range of 0.02 to 3.00 mg L-1 Fe).
HAZARDS AND PRECAUTIONARY STATEMENTS Hazards are detailed in the Hach Lange Kit.
PROCEDURE Sample collection, preservation and storage (once for all nutrients)
Collect samples in glass or plastic bottles that have been cleaned with 3 N Hydrochloric acid
solution and rinsed with deionized water.
Remove cells of suspension by centrifugation and analyse as soon as possible after collection.
If necessary, preserve supernatants by freezing at -20°C.
Measurement
Fill a sample cell (cuvette) with 10 mL of sample.
222
Wipe cell and insert in spectrophotometer to zero the instrument at 510 nm.
Add the contents of one FerroVer® Iron Reagent Powder Pillow to the sample cell.
Swirl the sample cell to mix. Undissolved powder will not affect accuracy.
Start timer for 3 min reaction period.
Wipe cell again and insert in spectrophotometer and read the result.
CALCULATION OF RESULTS For calculation of results plot results of calibration inverse (i.e. extension on x-axis concentration
on y- axis) and calculate a linear trend line. Use the equation to calculate concentration in
sample cell.
CALIBRATION AND QUALITY CONTROL Prepare a stock solution of 1 g Fe L-1 in deionized water, dilute to 3 mg L-1 Fe and prepare
standards with final concentration of 0%, 10%, 25%, 40%, 55% 70%, 85% and 100% of the 3
mg L-1 Fe –solution.
Follow the steps and timing described above
Measure extinction at 510 nm. Plot results and add linear trend line.
Determine the reagent blank value against deionized water for each new lot of reagent compare
with that of the calibration and adjust if necessary.
ERRORS AND INTERFERENCES This method is suitable for water and wastewater. pH extremes or highly buffered samples my
exceed buffering capacity of the reagent (adjust the pH to 3–5.). Sulphide causes negative
interference.
REFERENCES Hach Company 2007, 2010, 2012. Printed in the U.S.A.

223
SOP: 3.1.a Dry Weight Determination Catherine Baylissa, Alla Silkinaa
aAlgal Research, Swansea University, Singleton Park, Swansea, SA28PP, UK
PURPOSE To explain the protocol for obtaining dry weight (DW) values of microalgal cultures.
PRINCIPLE A known volume of algae is filtered onto a pre-weighed and pre-combusted filter. This is
then washed with ammonium formate, dried and weighed until constant weight so that the
dry weight in terms of g L-1 can be determined (Zhu & Lee 1997). If the biovolume (BV) of
the culture is known, and multiple time-points throughout cultivation are taken, then a
regression line for BV against DW is obtained and can be used to determine DW from BV in
further investigations.
REQUIREMENTS Equipment, materials and reagents
i) Whatman GF/F filters, 0.7 µm nominal pore size
ii) Ammonium formate (0.5 M)
iii) Ultrapure H2O
iv) Drying oven (80°C temperature needed)
v) Vacuum desiccator / Desiccator
vi) Analytical balance, 4 decimal place.
HAZARDS AND PRECAUTIONARY STATEMENTS
x Wear a laboratory coat, eye protection and gloves (nitrile) as appropriate.
x All dispensing, pipetting, evaporation and disposal of solvents/acids should take place in a
fume cupboard with the splash shield as low as possible.

224
x Any waste solvents need to be disposed of in an appropriate container that clearly states
what is contained. Further processing depends on local protocols.
x For clean-up information or in cases of direct solvent contact please consult MS-DS
information. Some information is shown below.
x Ammonium formate – Causes skin irritation, causes serious eye irritation, may cause
respiratory irritation.
PROCEDURE
c) Preparation of solutions and materials Ammonium formate may need to be prepared from solid/powder form. If so, dissolve in
H2O to give 0.5M of the volume required (this depends on the number of samples for
DW analysis). As the molecular weight for ammonium formate is 63.06 g mol-1, 1L of
0.5M would require 31.53 g of ammonium formate in ultrapure H2O.
d) Preparation of standards and samples The filters need to be pre-combusted at 500°C for 12 hours before weighing and kept in
a desiccator before use.
e) Measurement of standards and samples 1. Weigh the number of filters required on a 4 decimal place balance and place into the
filtration tubes, ensuring that the tubes are numbered or marked to keep track of the
weighed filters. At least two, preferably three repeats are required per sample. Include
blanks through which no sample is placed, but that is rinsed through with ammonium
formate.
2. A known volume of algae (normally 10 mL to 50 mL depending on concentration) is
then placed into the filtration tubes to flow through the filter.
3. Once finished, they are then washed twice with 10 mL of the 0.5M ammonium formate
(20 mL total needed per filter). Ultrapure water can be substituted for ammonium
formate if required, using the same volumes.
4. Blanks can be included by weighing a filter and washing with ammonium formate
before drying. The weight before and after should be the same, or it will give an
indication of any weight changes during the washing and drying process.
5. Filters can be placed on clean, unused printer paper (dried filters stick to foil and lose
mass, causing errors) to dry, with the paper labelled for each filter. Alternatively, they
can be placed individually into clean, labelled eppendorfs, opening the lids when in the

225
oven and covering the top with foil to prevent anything falling in. The same problem
with dried filter sticking to the eppendorf occurs though.
6. The filters are then dried in an oven at 50°C for 24 hours.
7. The filters are left to cool to room temperature in a vacuum desiccator.
8. The sample and filter is then weighed on an analytical balance that goes to 4 decimal
places. A small amount of desiccant is placed in a beaker in the weighing chamber.
Samples are weighed repeatedly until the filters are of a constant weight.
9. From this and the pre-weighed value of the filter, the dry weight can be calculated.
Note: For correlation with biovolume, a number of samples taken throughout the growth of the
species (in lag, exponential and stationary phase) should be taken and dry weight determined. If
there is a linear relationship between BV and DW then the trend-line can be used in future for
the species to quantify DW directly from BV measurements.
CALCULATION OF RESULTS
𝐷𝑟𝑦 𝑤𝑒𝑖𝑔ℎ𝑡 = (𝑓𝑖𝑙𝑡𝑒𝑟 + 𝑑𝑟𝑦 𝑠𝑎𝑚𝑝𝑙𝑒 𝑤𝑡) − 𝑓𝑖𝑙𝑡𝑒𝑟 𝑤𝑡𝑉𝑜𝑙𝑢𝑚𝑒 𝑓𝑖𝑙𝑡𝑒𝑟𝑒𝑑
For biovolume correlation, plot BV (x-axis) against DW (y-axis). Use the linear relationship
trend-line in future to work out DW from BV for the species in question.
QUALITY CONTROL
The blanks included in the dry weight determination should ensure any problem with the
materials/reagents used is identified, as they should weigh the same before and after.
ERRORS AND INTEREFERENCES
Every sample should be duplicated, or triplicated where sample volume permits, to counter
and highlight any variation in readings.
WASTE STREAM AND PROPER DISPOSAL
All chemicals need to be disposed of according to local regulations and protocols. Place
waste chemicals into a waste chemical bottle for collection and proper disposal as
appropriate.

226
REFERENCES Zhu, C.J. & Lee, Y.K. (1997) Determination of biomass dry weight of marine microalgae.
Journal of Applied Phycology 9; 189-194.

227
SOP: 3.1.b Analysis of total suspended solids (TSS) and volatile suspended solids (VSS) Sofie Van Den Hendeb
bDepartment of Industrial Biological Sciences (former Howest University College)(, Faculty of Bioscience
Engineering, Ghent University, Campus Kortrijk, Karel de Goedelaan 5, 8500 Kortrijk, Belgium PURPOSE This procedure is used to determine the total suspended solids (TSS) and volatile suspended
solids (VSS) of samples containing microalgal bacterial flocs (MaB-flocs), similar to TSS and
VSS determination of activated sludge liquor originating from a wastewater treatment plant
(APHA et al., 2005).
PRINCIPLE Total Suspended Solids (TSS) identifies the suspended load of the reactor liquor. A known
volume of a well-mixed MaB-floc sample is filtered through a washed, pre-weighed, pre-dried
(103-105 °C), standard glass fiber filter (0.45 µm). The residue retained on the filter together
with the filter is dried to a constant weight at 103-105 °C. The weight of the suspended solids on
top of the dried filter for a volume of reactor liquor is the TSS for a volume of water (for example
in g per L).
In an additional combustion step, the organic residue on the filter is volatized in a crucible at
550°C and only ash remains in the crucible. The difference in mass between the TSS and the
ash is the volatile suspended solids (VSS) for a volume of water (for example in g per L).
The TSS and VSS analysis presented here is based on APHA et al. (2005), and adjusted for
MaB-floc TSS and VSS analysis at UGent, Campus Kortrijk. The TSS and VSS analysis is
performed in duplicate for each sample, to counter variations in readings.
REQUIREMENTS EQUIPMENT AND MATERIALS - for each sample: 2 crucibles of minimum 25 mL
- for each sample: 2 glass fiber filter, 0.45 µm pore size, 47 mm diameter, type CA
(Porafil, Macherey-Nagel, Germany)
- 1 vacuum pump and filtering apparatus
- 1 graduated cylinder of 100 mL

228
- 1 waterproof marker
- 1 analytical balance (0.0001 g)
- magnetic stirring bar, magnetic stirrer and beaker of 200 mL
- drying oven (103-105 °C)
- muffle furnace (550 °C)
metal grip for crucibles
brush to clean ovens and balance
REAGENTS minimum 200 mL of sample (stored at 4 °C for max. 1 day)
distilled water
HAZARDS AND AND PRECAUTIONARY STATEMENTS x Wear a lab coat as appropriate.
x Risk of burning of skin: avoid handling hot crucibles with your hands, always use a metal
grip and/or gloves to handle hot crucibles.
x Do not use the muffle furnace over the weekend, for safety and energy saving reasons.
x When MaB-flocs are grown on wastewater, the analysts are encouraged to protect
themselves from water-borne illnesses by wearing clean disposable gloves and lab
glasses, and by washing their hands frequently.
PROCEDURE PREPARATION OF CRUCIBLES AND FILTERS 1. Fill for each sample two crucibles with a washed glass fiber filter. Label the crucibles
with a permanent marker (project code, sample date, sample type). As these glass fiber
filters easily break, always prepare at least one extra filter. Label the crucible bottom with
a number by means of a metal spoon or sharp metal tool.
2. Put the crucibles and filters in an oven of 103-105 °C to dry them overnight until constant
weight.
3. Take the crucibles and the filters out of the oven and put them in a dessicator for 3
minutes. Measure the weight of each filter (mfilter after 100°C) and crucible (mcruc after 100°C) with
an analytical balance (0.0001 g accurate). Be quick and do not touch the filter or crucible
with your hands in order not to contaminate them with for example water. The crucibles
and filters can now be kept outside the dessicator on the bench until use.

229
4. Annotate the number of the crucible (on the bottom of the crucible), sample date, sample
type and the weights of crucible and filter in an ‘EnAlgae data sheet’. Do not write
crucible labeling numbers on the crucible with a pencil or pen, as these will be lost
during combustion at 550 °C.
5. Make a reservation on the LIWET research group equipment calendar for the use of the
muffle furnace. Muffle furnaces can be used in lab A103 and lab A205, but for both you
need to make a reservation in advance. Label your reservation as ‘EnAlgae: staff
member name – muffle furnace – amount of crucibles’.
ANALYSING SAMPLE AND MEASUREMENT 1. Put a filter on the vacuum apparatus and start the vacuum pump. Rinse the filter with
distilled water (min. 10 mL).
2. Pour by means of a graduated cylinder a known volume (100 mL or 50 mL) of the well-
mixed MaB-floc-containing reactor liquor in the vacuum apparatus (VMaB-floc liquor). Mixing
of the MaB-flocs can be done in a beaker of 200 mL with a stirring bar on a magnetic
stirrer. Rinse the graduated cylinder with distilled water and pour the rinsing water on the
filter.
3. Turn off the vacuum pump upon complete drainage of the filter.
4. Remove the filter of the vacuum apparatus and put it in the crucible.
5. Repeat for the second filter and crucible.
6. Dry the filters and crucibles at 103-105 °C until constant weight. Normally 14 h is
enough.
7. Put each crucible with its filter in a desiccator by means of a metal grip. In case of
multiple samples, measure maximum 2 crucibles at a time to avoid crucible and sample
contamination by air moist. Wait 3 minutes to cool down the crucibles. Meanwhile clean
the analytical balance with a brush and or paper tissue. Weight the mass of the filter and
TSS on top of it (m(filter+TSS) after 100°C).
8. Clean the muffle furnace with a brush.
9. Put all crucibles and filters in the muffle furnace and burn for minimum 3 hours at 550 °C
(about 30 minutes to heat to 550 °C, and 3 hours at 550 °C or longer if needed) until
constant weight of the remaining ash.
10. Take out the crucibles with a metal grip when cooled down and put them in the oven at
100 °C.
11. Take out max. 2 crucibles at a time and put them in a desiccator. Weight them on an
analytical balance after cooling down for 3 minutes (make sure that they are not over 40
°C, otherwise the balance might be damaged) (m(cruc+ash) after 550°C).

230
12. Pour out the ash as quickly as possible, and weight the crucible without ash (mcruc after
550°C). If the ash cannot be removed properly, than the crucible should be washed
properly, heated at 550 °C, cooled at weighed.
13. Clean the crucible and rinse with distilled water. Label with EnAlgae and put in the 100
°C oven to be used for future analyses.
CALCULATION OF RESULTS TSS and VSS are calculated as follows:
TSS = (m(filter+TSS) after 100°C - mfilter after 100°C) / VMaB-floc liquor
VSS = ( (m(filter+TSS) after 100°C - mfilter after 100°C) –( m(cruc+ ash) after 550 °C – m cruc after 550 °C) ) / VMaB-floc
liquor
With
TSS (g L-1) : total suspended solids
VSS (g L-1): volatile suspended solids
VMaB-floc liquor (L): volume of MaB-floc reactor liquor
mfilter after 100°C (g): mass of filter after drying at 100 °C
mcruc after 100°C (g): mass of crucible after drying at 100 °C
m(filter+TSS) after 100°C (g): mass of filter and total suspended solids on filter after drying at 100
°C
m(cruc+ash) after 550°C (g): mass of crucible and ash after combustion at 550 °C
mcruc after 550°C (g): mass of crucible after combustion at 550 °C
QUALITY CONTROL x The obtained TSS and VSS values of MaB-flocs in lab or pilot reactors are expected to
be below 3 g L-1 (Van Den Hende, 2014). The VSS:TSS ratio varies upon samples, but
should be lower minimum 0.3 (Van Den Hende, 2014)
x Quality control can be done with samples of a known TSS and VSS concentration, and
with a blank (i.e. a sample free of TSS, so for example milli-Q water).
x Adjust the amount of volume of filtered MaB-flocs in order to obtain enough solids on the
filter and enough ash in the crucible to be able to weight them accurately.
x The filtrate water of the vacuum pump should not be green.
x The two measurements of one sample should not differ more than 5 %.

231
ERRORS AND INTERFERENCES x Don’t put crucibles with a temperature over 40 °C directly on the analytical balance, as
this might damage this balance and might lead to errors in the mass values.
x Make sure the crucible is not contaminated with dirt or dust before weighting it.
x Always clean the analytical balance, the muffle oven, drying oven, table and dessicator
with a brush and/or paper tissue before and after their use.
x Always open and close the dessicator as fast as possible. Check if the silica crystals in
the dessicator are dark blue, if not dry them at 100 °C until dark blue before you use the
dessicator.
x Always transfer crucibles in a dessicator just before they need to be weighed. Never
directly from the oven to the lab bench or balances.
x It is recognized that TSS measurements may include both positive errors (for example,
waters of crystalization) and negative errors (for example, loss of solids that are smaller
than 0.45 µm)
x Make sure that the oven and muffle furnace are clean before you put the crucibles
inside. Don’t put the crucible close to the opening of the muffle oven to avoid that
crucibles will while closing the muffle furnace.
WASTE STREAM AND PROPER DISPOSAL x MaB-floc filtrate and ash need to be disposed appropriately. If they are not hazardous,
the filtrate and remaining sample can be discarded in the laboratory sink and the ash
can be discarded in the general trash bin.
x The flue gas of the muffle furnace needs to be removed from the lab – otherwise there
might be a fire alarm. Therefore, make sure the fume hood is turned on (and works)
when using the muffle furnace.
REFERENCES x APHA, Awwa, WEF, 2005. Standard Methods for the Examination of Water and
Wastewater, 21st ed. American Public Health Association, Washington DC.
x Van Den Hende, 2014. Microalgal bacterial flocs for wastewater treatment: from concept
to pilot scale. PhD dissertation, Ghent University, Ghent, Belgium, 324p.

232
SOP: 3.1.c Dry weight determination of fresh water algae Matthew P. Daveyc, Louiza Normanc, Alex Jamiesonc
cDepartment of Plant Sciences, University of Cambridge, Downing Street, Cambridge CB2 3EA, UK PURPOSE
To explain the protocol for obtaining dry weight (DW) values of microalgal cultures such as
Chlorella and Chlamydomonas grown in freshwater media such as 3N-BBM+V, Sueoka’s
HSM and TAP.
For marine species such as Phaeodactylum, Tetraselmis and Pavlova please refer to the
Marine Algae Species Dry Weight determination protocol.
PRINCIPLE A known volume of algae is pelleted and washed prior to being filtered onto a pre-weighed
filter. This is then dried and re-weighed until constant weight so that the dry weight in terms
of g L-1 can be determined (Stephenson et al. 2010).
REQUIREMENTS
Equipment, materials and reagents
i) Glass-fibre filter paper (Whatman GF/C 45µm)
ii) Glass or plastic funnel
iii) 100 mL glass flasks
iv) 50 mL plastic falcon tubes
v) Centrifuge to take 50 mL falcon tubes
vi) Ultrapure H2O
vii) Drying oven (80°C temperature needed)
Vacuum desiccator
viii) Analytical balance, 4 decimal place
HAZARDS AND PRECAUTIONARY STATEMENTS
x Wear a laboratory coat, eye protection and gloves (nitrile) as appropriate.

233
x Careful of using hot oven
PROCEDURE Preparation of solutions and materials
Prepare DI water by adding 500 mL DI into beaker
Place filter papers into oven at least two days prior to use
Preparation of standards and samples 1. Take 30 mL of each sample and pipette this into a 50 mL tube (without a skirt)
2. Label tube with sample name
3. Centrifuge for 10 minutes at 20 °C (or other experimental temperature) at 2,000 g
4. Make sure to balance the centrifuge
5. Ensure all tube lids are screwed on
6. Remove tubes from centrifuge and tip off supernatant into a waste conical flask (500 mL
conical flask which needs to be labelled waste)
7. Add 10 ml of DI water to each tube using the fast pipette and a 10 mL tip
8. Vortex for 10 seconds each tube
9. Centrifuge again for 10 min at 20 °C (or other experimental temperature) at 2,000 g
10. Tip off supernatant to waste
Measurement of standards and samples 1. Find round filter paper in the oven next to the balance and quickly write the sample
name twice onto the paper
2. Weigh the paper on the Sartorius balance (or equivalent balance) to 0.001g accuracy
3. Fold the paper in half and half again and place inside the funnel which is placed in the
100 mL flask
4. Add 5 mL of DI water to the wasted algal pellet
5. Vortex for 10 seconds each tube
6. Poor all 5 mL into the correctly labelled funnel for each sample
7. Add 5 mL DI water and shake the tube
8. Poor all 5 mL into the correctly labelled funnel for each sample
9. Let all the water drip into the funnel
10. The filters are then dried in an oven at 80 °C for 48 hours.
11. The sample and filter is then weighed on the same analytical balance that goes to 4
decimal places

234
12. From this and the pre-weighed value of the filter, the dry weight can be calculated.
CALCULATION OF RESULTS
𝐷𝑟𝑦 𝑤𝑒𝑖𝑔ℎ𝑡 = (𝑓𝑖𝑙𝑡𝑒𝑟 + 𝑑𝑟𝑦 𝑠𝑎𝑚𝑝𝑙𝑒 𝑤𝑡) − 𝑓𝑖𝑙𝑡𝑒𝑟 𝑤𝑡𝑉𝑜𝑙𝑢𝑚𝑒 𝑓𝑖𝑙𝑡𝑒𝑟𝑒𝑑
Typically, for Chlamydomonas reinhardtii, values are from 0.2 g and 2 g algal biomass per L
culture (Davey et al. 2014).
QUALITY CONTROL
Each sample point should have two technical repeats (ie, samples from the same flask) that
should concur.
ERRORS AND INTERFERENCES
Every sample should be duplicated, or triplicated where sample volume permits, to counter
variation in readings.
WASTE STREAM AND PROPER DISPOSAL
Autoclave all tubes, waste containers and filter papers prior to disposal.
REFERENCES
Davey MP, Duong GH, Tomsett E, Litvinenko ACP, Howe CJ, Horst I, Smith AG. (2014).
Triacylglyceride production and autophagous responses in Chlamydomonas reinhardtii depend on resource allocation and carbon source. Eukaryotic Cell. 13: 392-400
Stephenson A, Dennis J, Howe C, Scott S, Smith A. 2010. Influence of nitrogen-limitation
regime on the production by Chlorella vulgaris of lipids for biodiesel feedstocks.
Biofuels 1:47-58.

235
SOP: 3.1.e Biomass with Gravimetric Methods Anneliese Ernste
eHochschule für Technik und Wirtschaft des Saarlandes, Göbenstraße 40, 66117 Saarbrücken, Germany
PURPOSE
Biomass is determined by gravimetric methods. Algae are cultivated in aqueous media that
not only contain the particulate algal biomass but also variable amounts of extracellular
organic material, dissolved salts, and precipitates. The weight of a dried sample may contain
variable amounts of these extracellular components and particles, depending on the care
taken to remove them before the sample was dried to constant weight. The mass of the
dried sample is termed dry weight (DW) or total solid substances (TSS) depending on the
significance of extracellular materials included. If specifically the organic matter produced by
photosynthesis is of interest the mass of inorganic components, which remains as ash after
volatilisation or organic material by combustion at high temperatures is subtracted from the
TSS or DW. The resulting organic mass is termed volatile solid substances (VSS) or ash
free dry weight (AFDW).
PRINCIPLES Cells are collected by filtration or centrifugation and rinsed several times with distilled water
before they are dried on a pre-weighted support (filter or reagent tube) to constant weight.
Temperatures used for drying range between 60°C and 105°C. For industrial use drying of
biomass at 105°C is recommended.
If cells are susceptible to the osmotic shock during re-suspension in distilled water or if cells
block the filters so that rinsing with distilled water is not possible, the mass determined after
drying may include formerly dissolved salts and inorganic particles. To determine the mass
of this inorganic fraction samples are combusted at 500°C. This mass of inorganic
substances is then subtracted mathematically from the mass of the dried sample to yield
VSS or AFDW. As cells may contain cell walls of inorganic material (such as frustules made
of silica or calcium carbonate) and may contain salts and polyphosphates, AFDW of
biomass is minimally smaller than the DW (Zhu and Lee 1997).
REQUIREMENTS x Analytical microbalance or moisture analyzer (± 0.0001 g)

236
x automatic pipettes (10 mL, 1 mL);
x desiccator
x long forceps, stamp forceps
x drying oven (105°C)
x muffle furnace (500°C), heat resistant gloves
x sample holder depending on equipment and method used (crucibles, aluminium pans,
filters, microtubes)
x For concentrating and washing of suspended biomass and for biomass determination in
reaction tubes: centrifuge, rotor; table centrifuge
x For biomass determination on filters: filtration tower, aspiration pump or other source of
vacuum
x Gloves to avoid skin contact with samples and heat resistant gloves for safety.
HAZARDS AND PRECAUTIONARY STATEMENTS
Beware of the heat of the drying oven and the muffle furnace. Use heat resistant gloves and
long forceps when removing crucibles tubes or filter holders from oven.
PROCEDURE Sample preparation
1.1 For DW and AFDW reduce volume of cells by centrifugation
(A final concentration of approximately 10 g L-1 works well)
1.2 For DW, wash cells with demineralized/distilled water three times
DW in Reaction tubes
To avoid contamination work on clean surface and use forceps and gloves for handling
2.1 Label reaction tubes (RT)
2.2 Store labelled RT in a desiccator before weighing;
2.3 Weigh empty labelled RT
2.4 Pipette an appropriate volume (final weight of dry biomass approx. 20 times the
detection limits of microbalance or bigger) in the labelled and weighed RT
2.5 Spin cells in a table centrifuge and remove supernatant (wash pellet with
distilled water if not washed before)
2.6 Dry biomass at 105°C to constant weight (24 h or more, depending on size of
pellet).

237
2.7 Place dried RT immediately in a desiccator; move desiccator to with RT to
balance
2.8 Determine mass of RT with dry cells on microbalance
AFDW on filters
To avoid contamination work on clean surface and use forceps and gloves for handling
3.1 Label filter holder (crucible or aluminium pan) by scratching or press-marks
3.2 Place a filter in a labelled filter holder
3.3 Pre- combust empty filters and holders in a muffle furnace (550 °C, 1h)
3.4 Wash pre-combusted filter with distilled water twice using a vacuum (-0.6 bar)
3.5.a Dry filters in holders at 105°C, cool down and store samples in a desiccator
determine weight with microbalance
or 3.5.b Place humid filter in the holder in a moisture analyser microbalance, dry at
105°C and determine weight
3.6 Place filter on a vacuum and pipette an appropriate volume (final weight of dry
biomass approx. 20 times the detection limits of microbalance or bigger)
3.7 Remove supernatant by aspiration
3.8. Place filter back in labelled filter holder
3.9 a Dry biomass at 105°C until constant weight store in a desiccator, determine
weight
or 3.9.b place filter back in holder and determine weight in a moisture analyser after
drying to constant weight at 105°C
3.10 To determine weight of ash place filter holder with filter in a muffle furnace
3.11 Combust at 550°C for 2 h
3.12a Store combusted filter in holder in a desiccator until weighing on a
microbalance
or 3.12b Moisturize combusted filter by adding 50 µL distilled water and place in
moisture analyser to determine weight
CALCULATION OF RESULTS
AFDW/VSS: subtract weight of the combusted sample from weight measured after drying
of the sample.
The protocol contains (for weight determination in reagent tubes and on filters,
respectively:
1. Weights of empty tubes / pre-combusted and washed filters in filter holder;

238
2. Weights of tubes filled with dried cell material/ filter loaded with dried material in
filter holder
3. Weights of filter holder, filter loaded with ash of dried material
DW and TSS is calculated as the difference between 2 and 1
AFDW and VSS are calculated as difference between 3 and 2
If of interest, ash is determined as difference between 3 and 1
QUALITY CONTROL Carry and empty cell support (filters/reagent tubes) and an empty cell support rinsed
according to the protocol through the procedure and determine weights accordingly.
ERRORS AND INTERFERENCES Errors result from loss of material during handling, soiled tools and incomplete
combustion (black carbonized material remains on the filter. Using a preheated furnace
has proven to lead to better combustion than heating furnace and sample together.
WASTE STREAM AND PROPER DISPOSAL
Filters, reagent tubes and supports can be disposed in normal waste.
REFERENCES Zhu YK and CJ, Lee (1997) Determination of biomass dry weight of marine microalgae.
J. Appl. Phycol. 9: 189 – 194.

239
SOP: 3.1.f Analysis of dry weight algae biomass concentration Chris de Visserf, Wim van Dijkf fWageningen UR including Plant Research International (WUR), Lelystad, The Netherlands PURPOSE Estimation of the dry weight biomass content of algal cultures.
PRINCIPLE A known amount of algae culture is filtered. The biomass on the filter is dried at a moderate
temperature to remove all the water.
REQUIREMENTS x Glass petri dishes
x Glass fiber filters (Pall TCLP glass fiber filter 90 mm 0.7 µm)
x Drying oven (70°C)
x Analytical balance accuracy 0.1 mg or better
x Desiccator
x Vacuum filtration setup (filter funnel, rubber stopper, collection bottle tubing, vacuum
pump)
x Forceps
x Demineralized water
HAZARDS AND PRECAUTIONARY STATEMENTS Oven temperature may pose a hazard.
PROCEDURE 1. Pre-dry filters in numbered glass Petri dishes for at least 1 day in a drying oven (70°C).
Measure each sample in triple and take along 3 extra filters for a blank measurement.
2. Further drying in a desiccator for at least 2 days.
3. Weigh dried filter+petridish (Weight before) on an analytical microbalance and log data
in Excell form.
4. Using forceps move the filter onto the filtration setup.
5. Moisturize filter with a little demineralized water until fully wet.

240
6. Filter sample (volume dependent on density; approximately 50 mL for lab cultures and
200mL for pond cultures, sample should fully drain through filter). Write down the
volume of sample used. For the blank samples replace the sample by a similar volume
of demi water.
7. Rinse with the same volume of demi water (also for the blank filters)
8. Pick up the filter and place back into glass petri dish.
9. Dry filters for at least 1 day at 105°C.
10. Place petri dish + filter in a desiccator for at least 2 more days
11. Weigh dried filter + Petri dish (Weight after) on an analytical microbalance.
CALCULATION OF RESULTS The measured dry weight per volume unit is calculated from the dry weight of samples and
compensated for the weight loss of the filters using the Excell form.
First of all the weight loss of the blank samples is calculated and averaged:
Average filter + petri dish weight loss: ΔBlank = (weight after – weight before)/3
Then the sample dry weight and biomass concentration are calculated for each individual
sample:
Sample a (Weight before-Weight after) + ΔBlank = Dry weight sample a
Dry weight sampe a / volume sample a = Biomass concentration sample a
QUALITY CONTROL It is common for the blank control (filter + Petri dish) to lose some weight, the amount of lost
weight should be equal within the triple measurement (difference <1 mg). Differences in the
triple measurement of dry weight in samples tend to be larger. For a good measurement the dry
weight load per filter should be >5 mg of dry weight cell mass.
ERRORS AND INTERFERENCES In this protocol the drying periods have been fixed rather than choosing for repeated weighing of
dried samples. Based on previous experience the small amount of biomass on the filters is dried
out completely after 1 day in the desiccator.
WASTE STREAM AND PROPER DISPOSAL All materials can go into regular garbage disposal

241
SOP: 3.2.c Optical Density of Cultures Matthew P. Daveyc, Alex Jamiesonc
cDepartment of Plant Sciences, University of Cambridge, Downing Street, Cambridge CB2 3EA, UK
PURPOSE Spectrophotometric protocol for qualitatively assessing the growth rate of micro algal cultures
PRINCIPLE The sample culture is directly placed into a 1 mL quartz or plastic disposable cuvette, diluted if
needed, and read in a spectrophotometer at 600 or 750 nm as the amount of absorbed light.
REQUIREMENTS
Equipment, materials and reagents
x 1.0 mL spectrometer cuvettes
x 1 mL Gilson pipette
x Spectrophotometer capable of reading 600 and 750 at 1-4 nm range
x Lab RO or DI water
HAZARDS AND PRECAUTIONARY STATEMENTS
x Wear a laboratory coat, eye protection (goggles/safety glasses) and gloves (nitrile)
when handling biological material in the lab.
x For clean-up information or in cases of direct solvent contact please consult the
MSDS information or your local health and safety person.
PROCEDURE (Pictures taken by authors).

242
1. Turn on ThermoSpectronic uv1 spectrophotometer (or your lab specific machine)
2. Using bottom arrow keys highlight library then press ENTER
3. Scroll down to MATOD and press ENTER
4. The screen will now display a new window with MATOD.FXD press ENTER again to
load
5. Wait for spectrometer to finish processing, (instrument is busy message appears) when
there is no text in the bottom left corner, the machine is ready
6. Place 1 cuvette into slot 1 (make sure it is the correct way round)

243
7. Put 1 ml of DI water into the cuvette using a p1000 pipette set to 1 mL
8. Dispel tip into used tip jar
9. Press the button labelled ZERO BASE
10. Wait for the spectrophotometer to zero
11. Open lid and remove DI water filled cuvette
12. Make a table in the lab book as below:
Date Sample 600nm 750nm Dilution factor (if any)
13. Place 7 cuvettes into the spectrophotometer in the decided order from the sampling
stage
14. Mix each sample by using a pipette, passing the sample in and out until mixed, use a
new tip for each sample
15. close spectrophotometer lid
16. Press the purple button labelled RUN
17. Record results as they appear on screen into lab book
18. At the end of a run it is possible to use the arrow keys to scroll back through to check
results were recorded correctly
19. Repeat steps 13-18 until all cuvettes have been measured
20. Clean up:
a. empty contents of cuvettes into sink, rinse with D.I. water
b. Replace all lab equipment back to where it was found
CALCULATION OF RESULTS Values are read as absorbance units (AU) and should be between 0.0 and 1.0. If AU are above
1.0 then the sample needs to be diluted with RO or DI water (usually by ½ or ¼ or 1/5th). The

244
values are then multiplied by the dilution factor. An example of data for 750 nm can be seen in
Davey et al. (2014).
QUALITY CONTROL A blank of media or RO or DI water is used to zero the spectrophotometer. Each sample point
should have two technical repeats (ie, samples from the same flask) that should concur.
Depending on the experimental design at least three replicate flasks should be used per assay.
If problems occur with the spectrophotometer then the sample can be read again.
ERRORS AND INTERFERENCES Every sample should be duplicated, or triplicated where sample volume permits, to counter
variation in readings and possible human errors (e.g. in pipetting). Depending on the
experimental design at least three replicate flasks should be used per assay.
WASTE STREAM AND PROPER DISPOSAL
All chemicals need to be disposed of according to local regulations and protocols. Waste
chemicals generally need to be placed into a waste chemical bottle for collection and proper
disposal.
REFERENCES Davey MP, Duong GH, Tomsett E, Litvinenko ACP, Howe CJ, Horst I, Smith AG. (2014).
Triacylglyceride production and autophagous responses in Chlamydomonas reinhardtii depend
on resource allocation and carbon source. Eukaryotic Cell. 13: 392-400

245
SOP: 3.2.e Optical Methods for Biomass Anneliese Ernste
eHochschule für Technik und Wirtschaft des Saarlandes, Göbenstraße 40, 66117 Saarbrücken, Germany
PURPOSE Gravimetric methods often require handling of large volumes of cell suspensions, include
time consuming procedures such as filtration, centrifugation and drying. Furthermore
gravimetric methods are prone to experimental errors due to the multi-steps procedure.
Substitute methods such as the measurement of the optical density (OD) of a culture use a
parameter that scales with biomass but requires a small sample, and a single-step
procedures and is amenable to automation.
PRINCIPLE Optical density (OD) of a suspension can be measured with a spectrophotometer or with
submersed OD probes. The OD measurement is based on the extinction of light by light
scattering of particles. Scattering is a function of particle size, particle density, and geometry
that is described by the Mie theory. For simple geometric forms like spheres, cylinders and
ellipsoids Mie theory describes the relation between concentration of particles and scattered
light. However, this theory is too complex to be of practical use. In highly diluted
suspensions a quasi-linear relation is observed between extinction caused by light
scattering and the concentration of particles. This is phenomenologically similar to the
relation between light absorbance and the concentration by dissolved, coloured substances
described by the Lambert law. Although the Lambert law strictly spoken applies for clear
solutions only this quasi-linear relation can be used to determine the concentration of
particles in suspensions. The relation between OD and biomass has to be established
experimentally using a gravimetric method (for example 3.1.e). To avoid interference
between light scattering and light absorption by pigments, the OD of microalgae should be
determined using near infrared (NIR) light (commonly used wavelengths are 750 nm or 880
nm),
With increasing particle concentration the relation between extinction and particle
concentration becomes non-linear. This (non-linear) relation can be established by non-
linear fitting. The calibration of OD and biomass concentration, whether linear or non-linear,
must be established for each algal strain using a gravimetric method (for example 3.1.e).

246
They are not transferable and should be validated with pure cultures. It is not possible to
establish a calibration for inhomogeneous material such as MAB-flocs because of the
inherent variability of the MAB aggregates
REQUIREMENTS Manual determination of optical density
x Spectrophotometer
x cuvettes (1 cm light path)
x automatic pipettes (1 mL, 100 µL)
x Blanc and (isosmotic) solution to dilute samples
Automatic determination of optical density
x Submersible optical probes consisting of a light source and a detector (photodiode)
x Amplifier/transmitter
HAZARDS AND PRECAUTIONARY STATEMENTS Not applicable. PROCEDURE
Manual For manual method with spectrophotometer
1.1 dilute cells to a maximum extinction of 0.6 at 750 nm.
1.2 Measure extinction against a blank (water, culture medium or supernatant of
culture
Calibration of manual method
1.3 Prepare a dilution series of a cell suspension with the highest cell
concentration experienced in growth experiments
1.4 Measure OD in each sample after appropriate dilution using manual method
(see 1.1)
1.5 Determine biomass of the undiluted samples with a gravimetric method (see
above).
1.6. Establish (linear) relation between OD and biomass
Calibration of automatic OD probes

247
8 Prepare a dilution series in the OD range of cell concentrations encountered in
PBR
9 Measure OD of samples with the probe starting with a blanc
10 Determine biomass of samples with a gravimetric method
11 Establish the relation between signal of OD probe and biomass by non-linear fit
function
CALCULATION OF RESULTS Manual OD
1. Protocol shows volume of sample, total volume and extinction of sample.
2. Calculate dilution factor
3. Calculate extinction of undiluted suspension
Automatic OD
Automatically recorded data are converted into biomass concentrations using the non-linear
fit function established by the calibration of the method
ERRORS AND INTERFERENCES Manual measurements:
Reproducible results depend on a homogeneous distribution of the particles (cells) in the
suspension. Some algae settle quickly, so resuspension of cells before sampling is very
important and triplicate measurements are recommended. Filamentous cells often cannot be
re-suspended homogeneously. This results in a measuring deviation between 5 to
10%.among triplicates.
Automatic measurement:
Sensors that are submersed in in algal cultures are prone to biofilm formation. Regular
cleaning of the sensor is prerequisite to obtain reliable results.
WASTE STREAM AND PROPER DISPOSAL
Optical methods do not produce waste. Used samples are disposed the same way as
cultures.

248
SOP: 3.3.a Cell Counting using the Beckman Coulter’s Multisizer TM4
particle counter Craig L. Pooleya, Alla Silkinaa
aAlgal Research, Swansea University, Singleton Park, Swansea, SA28PP, UK PURPOSE This procedure uses a Beckman COULTER COUNTER to determine the cell number (the cell
density) in a specific volume of sample. The biovolume in µm3 per ml of the cells present within
that sample.
PRINCIPLE This method utilises a technology developed by Wallace H. Coulter for counting and sizing
particles ranging from 0.4µm to 1600µm using impedance measurements.
In a COULTER COUNTER instrument, a tube with a small aperture on the wall is immersed into
a beaker that contains particles suspended in a low concentration electrolyte. Two electrodes,
one inside the aperture tube and one outside the aperture tube but inside the beaker, are
placed and a current path is provided by the electrolyte when an electric field is applied (Figure
1). The impedance between the electrodes is then measured. The aperture creates what is
called a "sensing zone". Particles in low concentration, suspended in the electrolyte, can be
counted by passing them through the aperture. As a particle passes through the aperture, a
volume of electrolyte equivalent to the immersed volume of the particle is displaced from the
sensing zone. This causes a short-term change in the impedance across the aperture and this
change can be measured as a voltage pulse or a current pulse. The pulse height is proportional
to the volume of the sensed particle.
Using count and pulse height analyser circuits, the number of particles and volume of each
particle passing through the aperture can be measured. If the volume of liquid passing through
the aperture can be precisely controlled and measured, the concentration of the sample can
also be determined. In modern COULTER COUNTER instruments, such as Beckman Coulter’s
Multisizer™3 and Multisizer™4 particle counter and sizing instrument, pulses are digitized and
saved with several key parameters that describe each pulse such as pulse height, pulse width,
time stamp, pulse area, etc. These parameters enable the instrument to better discriminate

249
between noise and real pulses and between normal pulses and distorted pulses due to various
reasons when particles pass through the aperture.
A typical measurement using COULTER COUNTER instruments takes less than a minute, as
counting and sizing rates of up to 10,000 particles per second are possible. The accuracy of the
size measurements can be better than 1%. Aperture size typically ranges from 20 to 2000 µm
and each aperture can be used to measure particles within a size range of 2 to 80% of its
nominal diameter. The ability of the technology to analyse particles is limited to those particles
that can be suitably suspended in an electrolyte solution and the lower size limit is restricted by
the electronic noise generated mainly within the aperture itself. The selection of the most
suitable aperture size is therefore dependent upon the particles to be measured.
Figure 1. Schematic of a COULTER COUNTER.
REQUIREMENTS EQUIPMENT AND MATERIALS
Needed for the preparation of samples - 2x 100 mL volumetric flasks per sample. - 1000 uL pipette.

250
- Pipette tips. - Beckman Coulter Counter MultisizerTM4. - Deionized water. - Whatman GF/C filters (1.2µm and 47mm diameter). - Whatman GF/F filters (0.2µm and 47mm diameter). - Vacuum pump. - Vacuum flask and filter holder. - 500 mL beaker. - 200 mL Multisizer 4 Smart Technology Beaker (ST Beaker). - Suitable container (1-2 L) for waste water. - Suitable, clean bottles for storing electrolyte.
REAGENTS
Needed for the preparation of samples - Electrolyte (sea water) filtered through a 0.2µm filter.
- >10 mL of sample.
- Deionized water.
Needed for the cleaning of the Beckman Coulter Counter - 0.2 µm filtered sea water containing 1% Sodium Hypochlorite (13% Chlorine)
- Electrolyte.
- Deionized water.
- 98% Isopropyl alcohol.
HAZARDS AND PRECAUTIONARY STATEMENTS
- Always wear a laboratory coat, eye protection and gloves.
- Act carefully and take the appropriate measure concerning hazardous reagents.
Reagent Hazard Statement Precautionary statement Sodium Hypochlorite, NaClO
- Wear protective clothing/gloves/eye protection/face protection.
- Do not breathe dust/fume/gas/mist/ vapours or spray.
- Store in a well-ventilated place. Keep container tightly closed.
- If on SKIN: Immediately remove contaminated clothing and rinse skin with water.

251
- Corrosive to eyes, skin and mucous membranes
- Vapour will cause irritation to the eyes and respiratory system.
- May cause burns to mucous membranes, throat and stomach.
- Risk of perforation in the oesophagus and stomach.
- Corrosive to eyes. May cause damage even on short contact.
- Very toxic to aquatic life.
- If in EYES: Rinse cautiously with water for several minutes. Remove contact lenses, if easy to do and continue rinsing.
- If ingested immediately call a doctor/physician.
- Avoid release to the environment.
98% Isopropyl Alcohol
- Extremely flammable. - Inhalation and ingestion hazard.
Can be fatal if ingested in quantities >100ml.
- Severe eye irritant. - Irritant and mildly toxic in contact
with skin.
- Wear protective clothing/gloves/eye protection/face protection.
- Avoid inhaling mists and vapours.
- Use only with adequate ventilation.
- Bond and ground all containers.
- Wash eyes immediately with large amounts of water for at least 15 mins. If pain, blinking, tears or redness continue consult an opthamologist.
- Remove contaminated clothes and shoes immediately: Wash with large amounts of soap and water for at least 15 mins. Get medical attention immediately.
- Remove from exposure area to fresh air immediately. Get medical attention immediately.
- Aspiration hazard. Do not induce vomiting.
Seawater
- Corrosive when in contact with certain metals
- Non-hazardous but may cause irritation to eyes
- Wear protective clothing/gloves/eye protection/face protection.
- If in EYES: Rinse cautiously with water for several minutes. Remove contact lenses, if easy to

252
do and continue rinsing. PROCEDURE
PREPARATION OF STOCK SOLUTIONS
NOTE: All references to page numbers throughout this SOP refer to the MultisizerTM 4, User’s manual. Please see attached the PDF.
Preparation of Electrolyte
This can be done several days in advance providing it is kept in a sealed container in a fridge.
- Filter few litres of electrolyte (artificial or natural sea water) through a 1.2µm GF/C
filter to remove large particles.
- Filter the same water through a 0.2µm GF/F filter.
- Store in a clean, airtight bottle in a fridge until required.
PREPARATION OF SAMPLES
Please note that for freshwater species of algae, being immersed in electrolyte for prolonged
periods of time may affect the size of the cell. It is therefore advised that samples of freshwater
species of algae are to be analysed as soon after being prepared as possible.
- Add just over 100 mL of electrolyte to a 100 mL volumetric flask.
- Using a micro pipette, remove electrolyte until the level is aligned with the mark on
the flask.
- Now remove 1000 µL.
- Using the same pipette add 1000 µL of sample to the volumetric flask.
- Add cap and invert several times to ensure the sample is thoroughly mixed.
- Repeat process with the second volumetric flask.
MEASUREMENT OF STANDARDS AND SAMPLES
Starting the analyser. 1. Power ON the analyser. 2. Empty the waste jar. 3. Fill the Electrolyte Jar with electrolyte. 4. Open the Multisizer 4 software and connect to the Analyser. 5. On the Main Menu bar, select Run > Instrument Start-Up.
a. Select the checkboxes for each function you would like the Analyser to
perform on start-up.
b. Click START.

253
For more information on starting the analyser, see in User’s manual. MultisizerTM4. Particle Analyzer, Starting the Analyser, page 1-18.
NOTE: The Multisizer 4 performs best once it has reached a steady working temperature. This
usually takes 15 minutes from switching on the Analyser.
Measurement of Background noise. Before running the samples through the Coulter Counter the background noise of the electrolyte
needs to be measured. To access this feature you will need to use the Change Aperture Wizard feature, page (3-21). This provides step-by-step instructions to guide you through the
steps required when installing a new aperture tube. There are 11 steps in total and for just
measuring background noise some of these steps can be skipped i.e. Steps 1-3 which are
related to changing the aperture tube.
- Place 100 mL of electrolyte in the 200 mL ST Beaker and place on sample platform.
- Carefully raise the platform until it locks in position, ensure the aperture is situated
inside the beaker and is completely submerged.
- Select the Run > Change aperture wizard on the Run Menu Bar.
- Skip the first three steps by selecting Next. - Follow the steps required for filling the system, adjusting the metering pump, setting
current and gain and then measuring the Noise Level.
- Skip Verify calibration if this is done on a regular basis and select All done >
Done. - For more information see pages (3-22 to 3-33).
Creating an SOM (Standard Operating Method) and an SOP (Standard Operating Procedure). Before running samples through the Coulter Counter an SOM and an SOP need to be created.
An SOM is where you can specify sample analysis settings such as the control mode, file name,
pulse settings (current and gain), the number of size bins and sample concentration information.
For more information see Definitions: SOM, Preferences and SOP, page 4-1.
A Preferences file is then created to specify view and print setting, including graph, statistics,
trend, page setup and export settings.
For more information on setting Preferences, see Creating a Preferences file, page 5-1.

254
Finally an SOP is created by combining an SOM with a Preferences File into an overall settings
file for a particular type of analysis. Within this SOP, the SOM determines the sample run
settings while the Preferences File determines how this is then viewed and printed.
For more information on creating a Standard Operating Procedure, see Creating an SOP, page
4-26.
If you have saved your SOM and Preferences files then you can create several SOPs. This can
be particularly useful if several types of analysis are being carried out that require different
settings. This is particularly useful if the Coulter Counter is being used for a number of different
trials.
Running a sample. Samples are usually carried out in duplicate.
1. Lower sample platform and remove beaker containing electrolyte.
2. Place prepared 100 mL sample into the 200ml beaker and raise platform to
submerge the aperture and electrode, page (1-18).
3. Create or select an SOM and SOP, page (4-2).
4. Enter sample information, page (6-5).
5. Enter sample specifications, page (6-7).
6. Select Run > Preview on the Main Menu bar. Wait for the preview analysis to
complete its run.
7. NOTE. It is important to ensure that the sample concentration doesn’t exceed 10%.
If it does then adjust the sample concentration and preview the analysis again.
8. Select Run > Start.
Analysis of a sample. The running time for each sample will depend on the settings of the SOP. These can be edited
prior to each run by selecting the Edit SOP tab on the left hand-side of the screen.
1. Once the run has ended the display will show a graph with X number of size bins
along the X-axis. The number and size range depends on the type of sample and
are selected when the SOM and SOP are created.
2. On the Run Menu Bar select View > Graph, page (7-2).
3. The Graph drop-down menu gives you different options for X and Y axis values
based on the type of graph selected. In this way you can select density in cellsmL-1,
Biovolume in µm3mL-1.
255
4. Displayed in the top right hand corner of the graph are the statistics for the chosen
Y-axis values for the whole size range displayed on the graph. This includes the
size range, the total number for the chosen parameter, the mean and median particle
size, the standard deviation and the mode.
5. It is possible to isolate specific size ranges (often displayed as peaks) which can
help to distinguish between particles of varying sizes. This is very useful for
separating algal cells from debris, bacteria and especially useful if several species of
algae are present in a sample.
6. To select a “peak” position the cursor on the graph at the lowest end (the left hand-
side where the peak begins to rise). The first cursor appears and the selected size is
displayed below the X axis. Left-click on this cursor and drag across to the largest
end of the peak (right-hand side where it levels-off). The size range will be displayed
below the X axis.
7. The statistics box in the top right hand corner of the graph will now display values for
within the area you have selected. In this way you can determine the exact density
of a species of algae within the sample, the average cell size and the Biovolume.
CLEANING THE ANALYSER
The system must be cleaned thoroughly after use. An effective cleaning procedure includes
filling and draining the system several times and in multiple cycles, alternating between
deionized water, a 1% Sodium Hypochlorite solution and very occasionally with 98% Isopropyl
Alcohol (IPA). Once the cleaning process is complete the system is left containing a 1%
Sodium Hypochlorite solution. This will prevent the accumulation of biofilm within the system.
The system will therefore need to be drained and flushed with filtered electrolyte before use.
Drain the system. 1) On the Main Menu bar, select Run > Drain System. 2) Remove and empty the Electrolyte and Waste Jars. 3) Replace the Waste jar.
Clean the system with de-ionized water.
4) Rinse and fill the Electrolyte Jar with clean de-ionized water. 5) Replace the Electrolyte Jar. 6) On the Instrument Toolbar click Empty to empty the Waste Tank. 7) On the Main Menu bar:
a. Select Run > Fill System.

256
b. Once filled, select Run > Drain System. c. Fill and drain the system two more times.
8) Remove and empty the Electrolyte Jar. Clean the system with 1% Sodium Hypochlorite solution.
9) Fill the Electrolyte Jar with 1% Sodium Hypochlorite Solution. 10) Repeat steps 5 to 8 above. 11) Re-fill the system and shut down.
For more information on cleaning the analyser, see Cleaning the Analyser, page 1-16.
QUALITY CONTROL - The electrolyte must be passed through a 0.2µm filter, stored in a fridge and used
within a few days.
- The same pipette needs to be used for each sample for consistent sample volumes.
- During a run the sample flow rate must not drop to less than 9µL min-1.
- Sample concentration must not exceed 10%. If it does then it must be diluted.
CALCULATION OF RESULTS If any dilution has taken place results are multiplied by the relevant dilution factor. Results of
each duplicate for a sample are averaged to give a final average value for cell number and cell
Biovolume of that sample.
ERRORS AND INTERFERENCES - If freshwater samples are left in electrolyte for too long the cell size and cell
Biovolume can decrease due to osmosis.
- The quality of the sample can affect results. For example clumps of cells can affect
the ability to determine cell density, mean cell size and cell Biovolume.
WASTE STREAM AND PROPER DISPOSAL - Consult the local authority/water board for advice and authorisation before disposing
of used electrolyte down the sink.
REFERENCES

257
x Beckman Coulter. The Coulter Principle. Available on (04/11/14):
www.beckmancoulter.com/wsrportal/wsr/industrial/particle-technologies/coulter-
principle/index.htm
x User’s manual. MultisizerTM4. Particle Analyzer.

258
SOP: 3.3.c Algal Cell Counting Matthew P. Daveyc, Alex Jamiesonc
cDepartment of Plant Sciences, University of Cambridge, Downing Street, Cambridge CB2 3EA, UK
PURPOSE Counting the number of algal cells in a culture solution
PRINCIPLE The sample culture is directly placed into a 10 mL plastic sample cup, diluted, and analysed in a
Z2 Coulter Particle Count and Size Analyser
REQUIREMENTS Equipment, materials and reagents
x Fast pipette
x 1 mL Gilson pipette
x 10 mL pipette tip
x 3 x 1 litre beakers
x D.I. water
x Isoton (from Coulter)
x Samples from culture
x paper towel
x tip disposal jar
x lab book
HAZARDS AND PRECAUTIONARY STATEMENTS
x Wear a laboratory coat, eye protection (goggles/safety glasses) and gloves (nitrile) when
handling biological material in the lab.
x For clean-up information or in cases of direct solvent contact please consult the MSDS
information or your local health and safety person.
PROCEDURE (Pictures taken by authors).

259
1. Turn on cell counter with button on the front found at the top left of machine
2. Write a table in the lab book with the following headings:
Day Treatment Species replicate
dilution factor C1 C2
cells per mL
Mean size of
cell um
stdev size
3. Equipment needed:
a. Three 1 litre glass beakers (label with the following – waste, isoton and DI water)
b. Fast pipette
c. 10 mL tip (orange packaging)
d. Piece of paper towel for drying out the cups between samples
e. P1000 (1 mL) pipette and tips

260
4. Fill the beakers to about 500 mL with their labelled contents: the isoton beaker with
isoton and the DI water beaker with DI water
5. Set-up the cell counter by pressing the SET-UP button
6. Use the arrow keys to highlight ‘lower size Tl’ and ‘upper size Tu’ – set to the desired
size for the algae being measured
Species C1 C2
Pavlova 1.5 5
Phaeodactylum 2.1 7.5
Tetraselmis 6 16
7. Take out the accuvette of blue cleaning fluid from the coulter counter and place on the
side

261
8. Prepare the blank
a. Place the 10 mL tip into the fast pipette
b. Draw up 10 mL of isoton from the isoton filled 1 L beaker
c. Expel into the accuvette labelled blank
9. Place the blank acuvette into the machine
10. Press the START/STOP button to run
11. While the blank is running setup the sample for counting
12. Fill the accuvette which is labelled sample with a set amount of sample (varies
depending on how high the concentration count is, set initially to 0.5 mL, if concentration
count number is outside the range 15k -150k adjust the dilution factor)
13. Make up to 10 mL with isoton using the fast pipette
14. When counting has stopped take out the isoton blank
15. Place the sample made in step 12 and 13 into the machine
16. While the machine is counting watch the display window in the top right to check the
algae do not block the machine’s probe

262
a. If the machine blocks, press the UNBLOCK button
b. If it still does not clear: remove the sample, place the isoton blank into the
machine and clean the probe with the cleaning stick found beside the machine
(pink stick top of equipment image),
c. When cleared flush the machine and run the blank before continuing with the
sample
17. When the machine has finished counting press the OUTPUT button
18. Change the C1 and C2 to the correct values for the species being measured (if the
same as previous sample then no need to change but do check the values are correct)
Species C1 C2
Pavlova 2.035 4.494
Phaeodactylum 3.029 7.002
Tetraselmis 8.019 16.01
19. Press the down arrow key until the bottom line is highlighted, scroll across to see mean,
standard deviation and conc. cell count
20. Record mean, standard deviation and conc. cell count
21. Take out sample and place the isoton blank back into the machine
22. Empty sample into waste beaker
23. Run the blank (every 3 samples empty the blank into waste beaker and replace with
more isoton)
24. While the isoton blank is being run clean the sample container
25. Rinse with DI water 3 times then dry off with paper towel
26. Repeat steps 9 to 25 for each sample until all are complete, ensure a blank is run after
each sample is run (cycle of: blank sample blank sample blank etc.)
27. If a different species is being counted the setup needs to be changed therefore start the
process again from step 6
28. Clean up

263
a. Empty 1 L beakers into sink and wash down with DI water, then place in washing
up area
b. Replace the accuvette with blue cleaning fluid into the machine and flush 3 times
c. Turn off machine
d. Wipe down the surface around the cell counter
e. Place 10 mL pipette tip in the used pipette tips box
Replace fast pipette to its chargin
CALCULATION OF RESULTS Values are read as cell counts. The values are then multiplied by the dilution factor.
QUALITY CONTROL Always run blanks between samples and species. Each sample point should have two technical
repeats (ie, samples from the same flask) that should concur. Depending on the experimental
design at least three replicate flasks should be used per assay. If problems occur with the cell
counter then the sample can be read again.
ERRORS AND INTERFERENCES Every sample should be duplicated, or triplicated where sample volume permits, to counter
variation in readings and possible human errors (e.g. in pipetting). Depending on the
experimental design at least three replicate flasks should be used per assay.
WASTE STREAM AND PROPER DISPOSAL All chemicals need to be disposed of according to local regulations and protocols. Waste
chemicals generally need to be placed into a waste chemical bottle for collection and proper
disposal.
REFERENCES Davey MP, Duong GH, Tomsett E, Litvinenko ACP, Howe CJ, Horst I, Smith AG. (2014).
Triacylglyceride production and autophagous responses in Chlamydomonas reinhardtii depend
on resource allocation and carbon source. Eukaryotic Cell. 13: 392-400

264
SOP 3.3.e Biomass from Cells Counted in Thoma or Neubauer Chambers Anneliese Ernste
eHochschule für Technik und Wirtschaft des Saarlandes, Göbenstraße 40, 66117 Saarbrücken, Germany
PURPOSE
Biomass can be calculated from the cell concentration determined by counting cells in a
defined volume under a microscope. To deduce the biomass, a calibration describing the
relation between cell numbers and biomass must be established with a gravimetric method
(for example 3.1.e)
PRINCIPLE
Dedicated microscope slides called “Thoma” or “Neubauer” chambers provide a defined
volume in a grid engraved on the surface of the slide. The grid has a defined depth of 0.100
mm. When a cover slip is pressed correctly against the slide, cells are enclosed in a
“chamber” with a defined volume. The size of the area where horizontal and vertical lines
cross comprises 1 mm x 1mm (large square). Hence, the volume above the large square is
1 x 1 x 0.1 mm3 = 10-4 mL. Cells are normally counted in the smallest squares of the grid.
The size of these squares is indicated on the chamber (1/400 mm2 = 0.0025 mm2)
REQUIREMENTS
x Microscope (objectives with magnification 10x and 40x)
x “Thoma” or “Neubauer” chambers
x Cover slips
x Counter
x Pipette (10 µL)
HAZARDS AND PRECAUTIONARY STATEMENTS
Not Applicable
PROCEDURE

265
1 Little cell suspension (10 µL may be sufficient) is spotted on the clean and dry Thoma
(Neubauer) chamber at the position of the grid (crossing of horizontal and vertical lines).
The grid becomes visible when the slide is slightly tilted against a light source.
2 A dedicated clean and dry cover slip is layered on the drop without inclusion of air
bubbles
3 The coverslip is pressed against the chamber until it becomes sticky by adhesion and
Newton’s rings become visible
4 Under the microscope locate the grid with a magnification of 10X (objective). Then
rotate the revolver to magnification 20X or 40X for cell counting.
5 Cells are counted within the smallest squares and cells placed across two of the four
lines bordering the square to avoid (trick to avoid double counting!). Count at least 200
cells in 16 or more squares.
CALCULATION OF RESULTS
The protocol states the number of cells counted in each square (including cells placed
across two bordering lines).
Calculate the average cell number of all fields counted
Divide average number by 0.1/400 (volume of smallest square in µL) and multiply result by
1000 to obtain cell number per ml..
If cells were diluted before placing in the counting chamber, the dilution factor has to be
considered in the final result.
ERRORS AND INTERFERENCES
Algae in cell suspensions may settle quickly. The reproducibility of the method relies on
careful resuspension of cells before samples are taken for counting
WASTE STREAM AND PROPER DISPOSAL Dispose cultures as usual. The counting chamber and coverslips are cleaned and stored in
a dust-free container.

266
SOP: 3.4.a EnAlgae SOP sheet – PAM fluorescence Naomi Ginnevera, Alla Silkinaa
aAlgal Research, Swansea University, Singleton Park, Swansea, SA28PP, UK PURPOSE To detail the protocol for using a Walz PhytoPAM to obtain, quantum efficiency of photosystem
II (Fv/Fm1)5, maximum relative electron transport rate (rETRmax), Light saturation coefficient
(Ek) and the coefficient of light utilisation efficiency (α).
PRINCIPLE Variable chlorophyll fluorescence is a light emission which primarily comes from PSII which
contains chlorophyll a (Krause & Weis 1991, Govindjee 1995, Papageorgiou et al. 2007).
Energy absorbed by the light harvesting complexes in the PSII is utilised for photochemistry and
emitted by non-photochemical quenching (heat dissipation) or fluorescence. These different
processes are competitive (Krause & Weis, 1991, Kolber & Falkowski, 1993). Therefore an
increase in one of these factors results in a decrease in the other factors. This SOP is specific
to the Walz PhytoPAM, however the data processing aspects of this SOP are transferable to
other PAM fluorometers. REQUIREMENTS
Equipment, materials and reagents
x Walz PhytoPAM
x Quartz glass vials
x Disposable Pippettes
x Dark container or cupboard (sealed against light not just dimly lit)
HAZARDS AND PRECAUTIONARY STATEMENTS Care should be taken when handling quartz cuvettes as they may break if dropped. Wipe up
any spills and avoid spills within the measuring chamber as this may irreparably damage the
measuring chamber. Seawater culture spills may cause skin irritation.
PROCEDURE

267
In order to measure chlorophyll a fluorescence emissions from liquid samples a Walz Phyto-
PAM (Heinz Walz Gmbh, Effeltrich, Germany) with a Phyto-ED accessory was used. Phyto-
Win® software v.2.13 (Walz) recorded fluorescence emissions and automatically calculated the
(Fv/Fm15) and the rETR. 10 mm quartz glass cuvettes, which when filled contain 4mL of sample,
were placed inside a cupboard at room temperature and dark adapted for 15 minutes. Triplicate
rapid light curves (RLCs) were produced by exposing dark-adapted samples to 11 incremental
increasing light steps, ranging in intensity from 0 to 2350 μmol m-2 s-1 (PAR). Samples were
exposed to each light level for 30 sec before being exposed to a saturating pulse of 8,600 for
600 ms to ensure total saturation of the photosystems.
CALCULATION OF RESULTS As mentioned the PhytoPAM automatically calculates and records Fv/Fm15 and rETR. The initial
point of the Fv/Fm15 curve should be used. This point was recorded after dark adaptation and
before any light exposure during the curve and ensures a true Fv/Fm15 taken when the
photosystem is fully oxidised. The Fv/Fm is measured by first measuring the minimum
fluorescence yield in the absence of actinic (photosynthetic) light (F0) before exposing the
sample to a saturating actinic pulse of light yielding the maximum fluorescence (Fm). The
difference between Fm and F0 was termed the variable fluorescence (Fv), subsequently the
Fv/Fm = (Fm – F0) / Fm.
The rETR is used to calculate the rETRmax, Ek and α. These are calculated using an iterative
curve fitting solution by Eilers & Peeters (1988). This curve-fitting and regression analysis is
performed using Sigmaplot V11. Ek was calculated from the maximum relative ETR (rETRmax)
and light use coefficient (α);
Ek = rETRmax ⁄ α. Light.
In the Figure 1 is a PE curve illustrating the portions of the curve which the α, Ek (here denoted
as B*) and rETRmax (denoted as Pmax) represent.
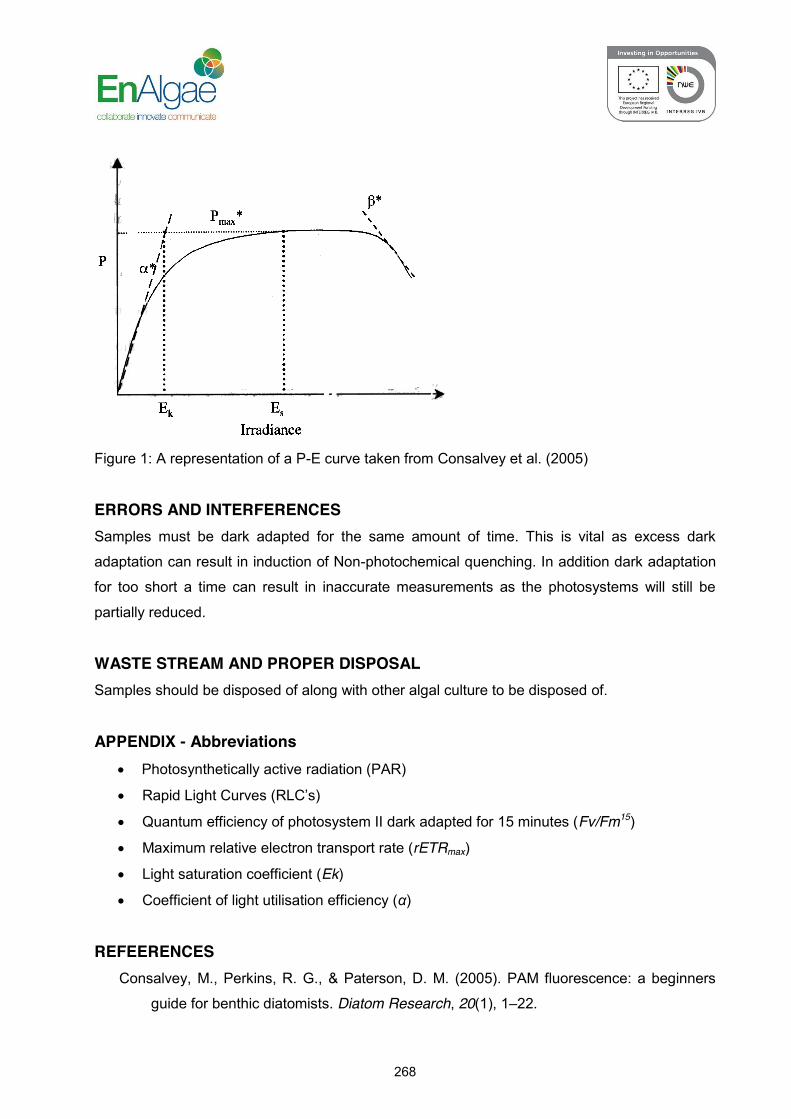
268
Figure 1: A representation of a P-E curve taken from Consalvey et al. (2005)
ERRORS AND INTERFERENCES Samples must be dark adapted for the same amount of time. This is vital as excess dark
adaptation can result in induction of Non-photochemical quenching. In addition dark adaptation
for too short a time can result in inaccurate measurements as the photosystems will still be
partially reduced.
WASTE STREAM AND PROPER DISPOSAL Samples should be disposed of along with other algal culture to be disposed of.
APPENDIX - Abbreviations
x Photosynthetically active radiation (PAR)
x Rapid Light Curves (RLC’s)
x Quantum efficiency of photosystem II dark adapted for 15 minutes (Fv/Fm15)
x Maximum relative electron transport rate (rETRmax)
x Light saturation coefficient (Ek)
x Coefficient of light utilisation efficiency (α)
REFEERENCES
Consalvey, M., Perkins, R. G., & Paterson, D. M. (2005). PAM fluorescence: a beginners
guide for benthic diatomists. Diatom Research, 20(1), 1–22.

269
Eilers, P. H. C., & Peeters, J. C. H. (1988). A model for the relationship between light
intensity and the rate of photosynthesis in phytoplankton. Ecological Modelling, 42,
199–215.
Govindjee. (1995). Sixty-three Years Since Kautsky: Chlorophyll a fluorescence. Australian Journal of Plant Physiology, 22, 131–160.
Kolber, Z. S., & Falkowski, P. G. (1993). Use of active fluorescence to estimate
phytoplankton photosynthesis in situ. Limnology, 38(8), 1646–1665.
Krause, G. H., & Weis, E. (1991). Chlorophyll fluorescence and photosynthesis: The basics.
Annual review of plant physiology and plant molecular biology, 42, 313–349.
Papageorgiou, G. C., Tsimilli-Michael, M., & Stamatakis, K. (2007). The fast and slow
kinetics of chlorophyll a fluorescence induction in plants, algae and cyanobacteria: a
viewpoint. Photosynthesis research, 94(2-3), 275–90. doi:10.1007/s11120-007-9193-x

270
SOP: 4.1.a Protein Analysis Catherine Baylissa, Alla Silkinaa
aAlgal Research, Swansea University, Singleton Park, Swansea, SA28PP, UK
PURPOSE To outline the procedure used to analyse protein content of a given sample, usually microalgae
biomass, through a hot acid extraction and modified Lowry assay for protein.
PRINCIPLE Protein within the microalgae is extracted using heat (95°C) and acid (TCA) (Slocombe et al. 2012). The released protein is then quantified through a modified Lowry assay using the
reaction between Lowry Reagent D and Folin-Ciocalteu phenol reagent. The absorbance
produced at 600nm is then read spectrophotometrically. Standards of known protein content,
BSA (Bovine Serum Albumin) are used to create a standard curve and quantify the protein
content in the samples. The time spent at 55°C varies with algal species (due to differences in
the speed of extraction), and calibration of this step is required for accurate protein
quantification of each species.
REQUIREMENTS
Equipment, materials and reagents
x Analytical balance to 4 decimal places
x Heater block
x Fume hood
x Spectrophotometer
x 1.5 mL micro-centrifuge vials and holding rack, preferably screw-capped or 1.5 mL
eppendorfs
x Centrifuge
x 96 well-plate
x Pipettes of 10-50 µL, 100 µL – 1mL and 1-5 mL with tips
x Lowry A - 2% w/v Na2CO3 (sodium carbonate) anhydrous in 0.1N NaOH (sodium
hydroxide)
x Lowry B - 1% w/v NaK Tartrate tetrahydrate (potassium sodium tartrate
tetrahydrate) in ultrapure H2O
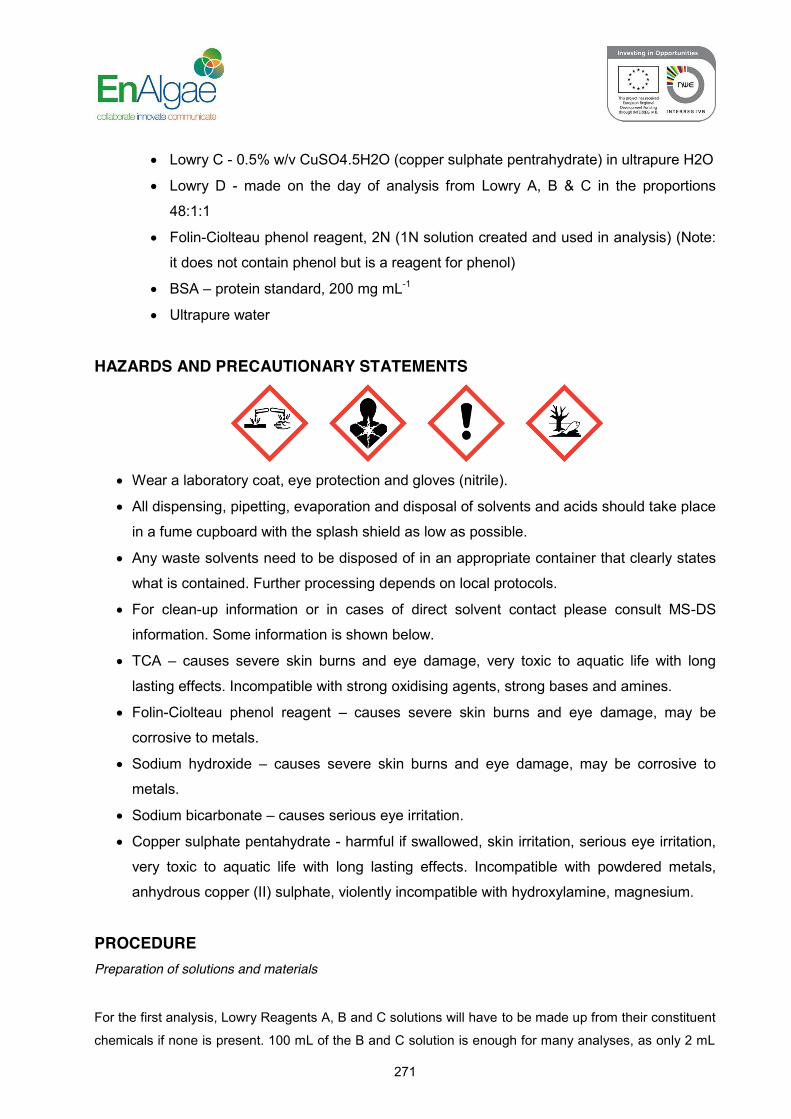
271
x Lowry C - 0.5% w/v CuSO4.5H2O (copper sulphate pentrahydrate) in ultrapure H2O
x Lowry D - made on the day of analysis from Lowry A, B & C in the proportions
48:1:1
x Folin-Ciolteau phenol reagent, 2N (1N solution created and used in analysis) (Note:
it does not contain phenol but is a reagent for phenol)
x BSA – protein standard, 200 mg mL-1
x Ultrapure water
HAZARDS AND PRECAUTIONARY STATEMENTS
x Wear a laboratory coat, eye protection and gloves (nitrile).
x All dispensing, pipetting, evaporation and disposal of solvents and acids should take place
in a fume cupboard with the splash shield as low as possible.
x Any waste solvents need to be disposed of in an appropriate container that clearly states
what is contained. Further processing depends on local protocols.
x For clean-up information or in cases of direct solvent contact please consult MS-DS
information. Some information is shown below.
x TCA – causes severe skin burns and eye damage, very toxic to aquatic life with long
lasting effects. Incompatible with strong oxidising agents, strong bases and amines.
x Folin-Ciolteau phenol reagent – causes severe skin burns and eye damage, may be
corrosive to metals.
x Sodium hydroxide – causes severe skin burns and eye damage, may be corrosive to
metals.
x Sodium bicarbonate – causes serious eye irritation.
x Copper sulphate pentahydrate - harmful if swallowed, skin irritation, serious eye irritation,
very toxic to aquatic life with long lasting effects. Incompatible with powdered metals,
anhydrous copper (II) sulphate, violently incompatible with hydroxylamine, magnesium.
PROCEDURE Preparation of solutions and materials
For the first analysis, Lowry Reagents A, B and C solutions will have to be made up from their constituent
chemicals if none is present. 100 mL of the B and C solution is enough for many analyses, as only 2 mL

272
of each is required for 100 mL of the final Lowry Reagent D used in the analysis. However a larger
volume of Lowry Reagent A (sodium carbonate in sodium hydroxide) is needed, as it is the main portion
of the final Lowry Reagent D. Solutions should be stored in a fridge once created and discarded if any
precipitates form. Solutions should be taken out of the fridge before use to allow them to come to room
temperature.
Lowry D needs to be made from the Lowry Reagents A, B and C solutions in the proportions of 48:1:1,
made freshly on the day of the analysis.
The Folin-Ciolcalteu phenol reagent normally comes as 2N, and needs to be diluted 1:1 with ultrapure
water on the day of the analysis.
Just before use both the BSA and Folin-Ciolteu phenol reagent need to be taken out of the fridge where
they are stored so they may come to room temperature.
Preparation of standards and samples
Before analysis samples of biomass are freeze dried and then ground to a powder using a
pestle and mortar or similar equipment. This then kept in a -80°C freezer. Before use samples
are removed from the freezer, allowed to warm to room temperature then placed in a desiccator
to remove excess moisture.
Measurement of standards and samples Protein Extraction
1. Weigh out 5 mg (±10%) of samples, in triplicate, into screw-capped micro-centrifuge tubes
(or micro-centrifuge tubes). Include two blank tubes with no sample to ensure no protein in
tubes and identify if problems have occurred.
2. Add 200 µL of 24% (w/v) TCA to each tube.
3. Heat samples and TCA in heater block at 95 °C for 15 min.
4. Allowed to cool to room temperature.
5. TCA diluted down to 6 % (w/v) by adding 600 µL ultra-pure water (ddI) per sample (total
volume 800µL)
6. Centrifuged at 15,000g for 20 min at 4 °C
7. Supernatant discarded
8. Pellet re-suspended in 0.5mL Lowry Reagent D (repeated pipetting or vortexing required).

273
9. Pellet in Lowry Reagent D left at 55 °C for 60 min (for Chaetoceros sp.). This step can be
optimised for each species by having multiple pairs of the same sample left for varying
times (e.g. two vials left for 30 minutes, 60 minutes, 2 hours, 4 hours, etc.)
10. Centrifuge at 15,000g at room temperature for 20 min.
11. Discard pellet and retain supernatant, then proceed with the Lowry assay.
Lowry Assay – include the standards from this point For Standards
From the initial BSA standard, make up stock solution of 10mg BSA/mL. Use this to then make
0, 1, 2, 3, 4, 5 mg / mL concentrations, and total volume 1mL with ddI (Table 1.). These can be
frozen for later use.
uL stock solution
(10mg BSA mL-1)
H2O (to make 1 mL)
(µL)
Final BSA mg/mL
(or µg µL-1)
0 1000 0
10 990 0.1
50 950 0.5
100 900 1
200 800 2
300 700 3
400 600 4
500 500 5
Table 1. BSA stock solution and final concentration of standards
12. 50 µL of sample supernatant/standard added to 1.5 mL microfuge tubes, 3 per sample
(triplicate).
13. Add 950 µL Lowry Reagent D and immediate inversion.
14. Samples incubated for 10 min at room temperature (RT).
15. 0.1 mL of diluted phenol reagent added to each tube, inverted immediately until mixed.
16. 30 min at RT then absorbance read at 600nm, 200 µL in each well or enough to read.
Note if this is changed.
17. Standard curve generated with BSA and linear line (Excel or similar). Protein extraction
only needs to be performed on samples and any blanks included to ensure the
apparatus is free from protein and to highlight any problems during analysis.

274
CALCULATION OF RESULTS The standard curve is generated by plotting absorbance on the x-axis, and BSA protein concentration on
the y-axis. This gives an equation of the form y = Ax + B. The R2 value should be more than 0.95.
Inputting the absorbance as x gives the protein in terms of BSA protein. As BSA protein is 16% Nitrogen,
protein value can be converted into nitrogen by multiplying by 0.16. The amount of nitrogen can then be
multiplied by the factor for converting N to protein in algae. It is species specific, but the general factor is
normally about 6.28 times of the nitrogen amount is algal protein.
QUALITY CONTROL
x Standards should produce a linear graph when plotted, with an R2 ideally above 0.95.
x Blanks included with the samples should give absorbance values at the background
level of the machine (i.e. the reading given when no sample or DI water is present in the
spectrophotometer).
x Each sample is read in the spectrophotometer three times to identify any variance of
readings, and the average absorbance value used where no great variance is found.
ERRORS AND INTERFERENCES Every sample should be duplicated, or triplicated where sample volume permits, to counter variation in
readings.
WASTE STREAM AND PROPER DISPOSAL All chemicals need to be disposed of according to local regulations and protocols. Placing waste
chemicals into a waste chemical bottle for collection and proper disposal.
REFERENCES Slocombe, S.P., Ross, M., Thomas, N., McNeill, S., & Stanley, M.S. (2012) A rapid and general
method for measurement of protein in micro-algal biomass. Bioresource Technology 129; 51-57.
Lowry, O.H., Rosenbrough, N.J., Farr, A.L. & Randall, R.J. (1951) Protein measurement with
the Folin Phenol Reagent. Journal of Biological Chemistry, 193; 265-275.
OTHER POINTS If samples are stored in a plastic container then they will become statically charged. This may cause
difficulties when biomass is removed from the tubes for weighing.

275
Small micro-centrifuge tubes need the correct heating blocks to prevent the lids falling below the level of
the heating block. When heated the pressure inside causes the caps to loosen. If the tubes are deep
within the wells and have to be prised or levered out the caps may pop open, with a possible leak of 95°C
TCA and biomass over the operator and/or heater. As well as loss of biomass this poses an unnecessary
health and safety risk.

276
SOP: 4.2.a Carbohydrate Analysis Catherine Baylissa, Alla Silkinaa
aAlgal Research, Swansea University, Singleton Park, Swansea, SA28PP, UK
PURPOSE This protocol is a modified version of the DuBois assay (DuBois et al. 1956) for the
quantification of total carbohydrate content of a sample.
PRINCIPLE Sulphuric acid hydrolyses carbohydrates in the sample to their monomeric subunits
(glucose/fructose/mannose etc.). The total carbohydrate monomer concentration is then
measured by using the colorimetric reaction between phenol and sulphuric acid in the presence
of carbohydrates. This is measured in a spectrophotometer at 485 nm.
REQUIREMENTS
Equipment, materials and reagents
x Heater block or water bath capable of 90°C
x Fume hood
x Glass centrifuge vials (13 mm diameter)
x Glucose (laboratory grade)
x Phenol (laboratory grade) (Highly Toxic)
x Sulphuric acid, concentrated (laboratory grade)
x Sulphuric acid, 1M (can be made from concentrated)
x Spectrophotometer (capable of reading at 485 nm).
x Acid resistant cuvette or acid resistant 96 well plate depending on spectrophotometer
type.
x Thick rubber gloves
x Ultrapure water

277
HAZARDS AND PRECAUTIONARY STATEMENTS
x Phenol is HIGHLY TOXIC and can be absorbed by the skin. Extra care must be taken
to prevent any contact with it, especially in its concentrated form when weighed out and
dissolving. It is CORROSIVE and causes chemical burns. It is a neurotoxin and has an
analgesic effect, so contact may not initially be felt. A large dose will affect the nervous
system and may be FATAL.
x Sulphuric acid is highly CORROSIVE and will cause severe chemical burns.
x Wear a laboratory coat, eye protection and gloves (nitrile). When handling
concentrated sulphuric acid or phenol double glove with nitrile gloves and use thick
rubber gloves on top. Any splashes must be immediately blotted with paper for small
amounts. If on nitrile gloves, the gloves should be removed and replaced immediately.
If splashed on thick rubber gloves they should be carefully rinsed with water and dried.
The thick rubber gloves also need to be rinsed and dried at the end use to remove any
un-noticed chemical drops on the surface.
x All dispensing, pipetting, evaporation and disposal of solvents and acids should take
place in a fume cupboard with the splash shield as low as possible. A fume hood
should also be used for any work with phenol.
x Any waste solvents need to be disposed of in an appropriate container that clearly
states what is contained. Further processing depends on local protocols. Care should
be taken when disposing of phenol and sulphuric acid waste.
x For clean-up information or in cases of direct solvent contact please consult MS-DS
information. Some information is shown below.
x Phenol – Acutely TOXIC if swallowed or in contact with skin or if inhaled, causes
severe skin burns and eye damage, suspected of causing genetic defects, causes
damage to target organs, toxic to aquatic life with long lasting harmful effects. Has an
analgesic effect as well as neurotoxic effect on central nervous system, so contact with
it may not initially be felt. x Sulphuric acid, concentrated – CORROSIVE, causes severe skin and eye burns.

278
PROCEDURE Preparation of solutions and materials
Phenol is dissolved in ultrapure water to make a 5 % aqueous solution (50 g L-1 ) solution. Take
care when weighing and dissolving phenol as it is HIGHLY TOXIC. It should be created and
stored in a screw-capped bottle. It is mixed thoroughly using a magnetic stirrer for at least 20
minutes. The stirrer remains in the phenol solution until it is depleted, and is thoroughly rinsed
and cleaned after use. The solution should be discarded when crystals/precipitate begins to
form.
A 1 mg mL-1 solution of glucose is prepared from the glucose standard (10mg per 100mL).
Discard when the solution becomes cloudy.
A 1M sulphuric acid solution is created if required from concentrated sulphuric acid. For 98%
pure H2SO4 this is 55.6 mL L-1. Ensure the water is added to the glass vessel before the
concentrated acid, not the reverse.
Glass vials and Teflon lined lids need to be soaked in Neutracon detergent (1%), then dried and
the glass vials cleaned in a furnace at 500°C.
Preparation of standards and samples Before analysis samples of biomass are freeze dried and then ground to a powder using a
pestle and mortar or similar equipment. Samples are then kept in a -80°C freezer. Before use,
samples are removed from the freezer, allowed to warm to room temperature then placed in a
desiccator to remove any water and prevent samples hydrating (which would affect sample
weight during weighing).
Measurement of standards and samples Standard Curve
x Six boiling tubes are required for the standard curve. A total of 0.1 mL of each glucose
standard is added to each tube, and the amount of stock glucose solution added to each
tube is shown below in Table 1. They are then made up to 100 µL with ultrapure water.
x 2.5 mL of 98% H2SO4 is added directly to the standards. 0.5ml of the 5% phenol solution
is quickly added directly into the sample! (Not down the side of the glass tube).
x TAKE CARE- this reaction is highly exothermic.

279
x This is left for 20 minutes to cool. The samples are carefully poured into acid resistant
cuvettes. This was read in the spectrophotometer at 485nm. These results were plotted
using Microsoft Excel and the equation and R2 value on the curve of the curve recorded.
Standard concentration
(mg mL-1)
Amount of glucose stock
per tube (µL)
10 100
8 80
6 60
4 40
2 20
0 0
Table 1. Glucose stock solution required for each standard.
Sample Analysis 1. 5mg (±10%) of sample is weighed into tubes suitable for containing 1M H2SO4 and that
can be centrifuged, usually glass tubes with screw-closed lids. The sample weights are
recorded.
2. 2 mL of 1 M H2SO4 is added to each tube containing sample. A blank can be added at
this stage to ensure no extra carbohydrates or interferences are present in the
analysis.
3. This is then heated for 1 hour at 90°C in a water bath or heater block.
4. The samples are centrifuged for 10 minutes at 5500 rpm to remove biomass from the
supernatant.
5. 0.1 mL of supernatant is pipetted into a boiling tube.
6. 2.5 mL of sulphuric acid is added to this boiling tube quickly followed by 0.5ml of
phenol (both should be added directly to the sample i.e. not down/touching glass
sides).
7. This is then left for 20 minutes to cool and carefully poured into acid resistant cuvettes
or into an acid resistant 96 well plate. The samples are then read at 485nm (30 mins
total after sulphuric acid and phenol addition). Samples are read at least twice per
sample to identify variation occurring within a sample. The carbohydrate content was
calculated using the equation from the standard curve and the average of the
absorbance values for each sample.

280
8. If a sample gives an absorbance value above 1 then the analysis needs to be repeated
from pipetting the supernatant (step 5), using a lower volume of the supernatant as
appropriate and diluting using ultrapure water to keep the sample volume at 100 µL. A
colour in the boiling tubes while cooling that is more intense than the standards is likely
to produce an absorbance value above 1.
CALCULATION OF RESULTS The standard curve is generated by plotting absorbance on the x-axis, and glucose
concentration on the y-axis. This gives an equation of the form y = Ax + B. The R2 value should
be more than 0.95, though above 0.99 is better. Inputting the absorbance as x gives the
carbohydrates as compared to glucose.
QUALITY CONTROL Standards should produce a linear graph when plotted, with an R2 ideally above 0.95.
Blanks included with the samples should give absorbance values at the background level of the
machine (i.e. the reading given when no sample or DI water is present in the
spectrophotometer).
Each sample is read in the spectrophotometer three times to identify any variance of readings,
and the average absorbance value used where no great variance is found.
ERRORS AND INTERFERENCES Every sample should be duplicated, or triplicated where sample volume permits, to counter
variation in readings.
WASTE STREAM AND PROPER DISPOSAL All chemicals need to be disposed of according to local regulations and protocols. Placing waste
chemicals into a waste chemical bottle for collection and proper disposal. Care should be taken
with any waste containing phenol.
REFERENCES DuBois, M., Gilles, K.A., Hamilton, J.K., Rebers, P.A. & Smith, F. (1956) Colorimetric method for
determination of sugars and related substances. Anlytical Chemistry, 28: 350-356

281
OTHER POINTS If freeze dried samples are stored in a plastic container then they will become statically charged.
This may cause difficulties when biomass is removed from the tubes for weighing.

282
SOP: 4.3.a Total Lipid Analysis Catherine Baylissa, Alla Silkinaa
aAlgal Research, Swansea University, Singleton Park, Swansea, SA28PP, UK
PURPOSE To detail the procedure used for total lipid extraction and quantification. The total lipid
quantification is the Bligh & Dyer (1959) method as modified by Folch et al. (1957).
PRINCIPLE Total lipid is determined gravimetrically after extraction from the biomass by a chloroform and
methanol mix and evaporation under nitrogen. FAME can later be determined from final lipid
extracts and is described in a separate protocol.
REQUIREMENTS
Equipment, materials and reagents x Teflon tubes (Oakridge, 11 mL)
x Glass Pasteur pipette tips
x Pasteur pipette ‘roller’
x Smalls glass vials and lids (8 mL)
x Sonication bath
x Fridge (spark-free if containing flammable solvents)
x Centrifuge with holder for Teflon tubes (2000 rpm needed)
x Heat block and nitrogen evaporator
x Analytical balance (to 5 decimal places)
x Chloroform (technical grade)
x Methanol (technical grade)
x 0.09% NaCl solution in ultra-pure H2O (from technical grade NaCl)
x Neutracon detergent (20% v/v)
x Distilled Water
x Ultrapure water (milliQ water)

283
HAZARDS AND PRECAUTIONARY STATEMENTS
x Chloroform and methanol are dangerous and toxic chemicals so caution should be taken
when handling them.
x Wear a laboratory coat, eye protection (goggles/safety glasses) and gloves (nitrile).
x All dispensing, pipetting, evaporation and disposal of solvents should take place in a fume
cupboard with the splash shield as low as possible.
x Any waste solvents need to be disposed of in an appropriate container that clearly states
it contains chlorinated waste solvents. Ask the relevant local person about further
processing. Swansea University – waste solvents go into a sealed container, and then into
the chemical cupboard. The hazardous waste collection is open periodically; see health
and safety forms for more information.
x For clean-up information or in cases of direct solvent contact please consult MS-DS
information or your local health and safety persons. Also see below for more information.
x Chloroform – Harmful if swallowed or inhaled, causes skin irritation, causes serious eye
irritation, may cause dizziness/drowsiness, suspected carcinogen, suspected teratogen,
prolonged/repeated exposure may cause damage to organs. Precautions – avoid
breathing vapours, use personal protective equipment (PPE). Incompatibilities - metals
(esp. lithium, sodium, magnesium), alkalis, strong oxidising agents, sodium oxides.
x Methanol – Highly flammable liquid and vapour, toxic if swallowed, in contact with skin or
if inhaled, causes damage to organs. Precautions – Keep away from
heat/sparks/flames/hot surfaces, do not breather fumes/mist/gas/vapours/spray, wear
PPE, if swallowed call a poison centre or doctor/physician. Incompatibilities - acid
chlorides, acid anhydrides, oxidising agents, alkali metals, reducing agents, acids.
x Compressed gas – Keep gas cylinder well maintained, regulator attached/altered only by
a trained person.
x Neutracon – Non-hazardous but as it is a strong detergent it should not be ingested,
inhaled or come into direct contact with skin or eyes.
PROCEDURE
Preparation of solutions and materials

284
The Teflon tubes are soaked in Neutracon detergent (10% v/v) [20%, 4 hrs]. They are then
rinsed with distilled de-ionised water, rinsed with methanol, left to dry, rinsed with chloroform
and dried again at 70 °C (±5 °C).
Glass vials need to be soaked in Neutracon detergent (1%), then dried, furnaced at 550°C and
placed in a desiccator with Teflon-coated caps.
NaCl, 0.09% (w/v) The salt water solution should be made up in a volumetric flask. In a 50 mL flask there would be
0.045g ACS grade NaCl made up to 5mL with ultra-pure water. This can be stored in a fridge
between uses but must be discarded if the solution becomes cloudy.
Chloroform / Methanol (2 :1) For a large number of samples it may be easier to pre-mix the chloroform/methanol solution.
Enough for the analysis should be created in a glass, labelled, sealed container, and stored
within a chemical cupboard for solvents/flammable hazards.
Preparation of standards and samples
Before analysis samples of biomass are freeze dried and then ground to a powder using a
pestle and mortar or similar equipment. This then kept in a -80°C freezer. Before use, samples
are removed from the freezer, allowed to warm to room temperature then placed in a desiccator
to remove any water and prevent samples hydrating (which would affect sample weight during
weighing).
If there is a pause between weighing and extraction samples should be stored with lids closed
and preferably in a dessicator to prevent excess water affecting the solvent extraction.
Measurement of standards and samples Samples and standards
1. 10 mg (±10%) of the biomass samples are weighed out into the Teflon vials. Sample
weights need to be recorded to obtain lipid percentage values. (If there is a pause between
weighing and extractions samples should be stored with lids closed and preferably in a
dessicator to prevent excess water affecting the solvent extraction). Include blank tube with
no biomass from this stage. Note: The use of more biomass where possible results in a

285
more accurate lipid estimation (e.g. 20mg ± 10%) but may require additional chloroform
addition to remove all lipids (step 13 repeated).
2. Add 6 mL of Chloroform/Methanol (2:1) to the pre-weighed biomass. A pre made solution
can be created or 4 mL chloroform then 2 mL methanol added to each sample.
3. Samples are mixed vigorously and placed in a sonicated bath for 45 minutes in ice, kept at
4°C. Keeping temperature low is important to avoid oxidation of the lipids.
4. Samples are then incubated in the tubes for at least 12 hours (overnight) at 4 °C protected
from light (wrapped in foil) to favour a complete extraction.
5. The samples are sonicated in ice again for 45 mins after the incubation period is complete.
6. Weigh glass vials with their caps on (Teflon-lined caps). The vials must have been
previously dried and stored in a desiccator and labelled before weighing.
7. 1 mL of 0.09% (w/v) NaCl is added to the tubes to aid solvent separation, and tubes shaken
to ensure complete mixing.
8. Samples are centrifuged at 2000 rpm, 4 °C for 10 minutes.
9. The lower chloroform layer should appear green, with the upper layer appearing clear or
milky. De-fatted and de-pigmented biomass forms a layer between the two solvents. If
layers have not separated, leave for 30 mins in the dark.
10. The bottom phase is removed by inserting a Pasteur pipette through the upper phase with
gentle positive pressure (gentle bubbling) so none of the upper phase enters the pipette tip.
! The glass pipette tips are sharp so take care not to touch the sides of the Teflon lined
tubes when inserting the pipettes or the lining will be scratched off. !
11. Carefully draw up the lower phase when the pipette is at the bottom of the tube, making
sure to avoid the interface of the two layers. This is transferred to the pre-weighed glass
vial, and may require two attempts to remove all of the solvent. [The cap is securely
attached to prevent loss of the sample]
12. Note- It is better to leave a small amount of chloroform at the bottom of the tube than take
up biomass or the methanol. More is recovered in the next step.
13. To ensure full lipid removal a further 2 mL of chloroform is added to the remaining methanol
and biomass in each tube. This is then shaken vigorously and centrifuged again at 2000
rpm, 4 °C for 10 minutes. Leave to settle for 30 minutes. The bottom layer is taken up in the
same way as previously described and combined with the first extract.
14. In a fume hood the chloroform/lipid phase in the glass vials is dried under nitrogen gas at
40 °C (takes approx. 30-45 mins). The samples are then stored under nitrogen and placed
in a desiccator while waiting for weighing to prevent hydration of the sample.
15. Samples containing the dried biomass are weighed.

286
16. Sample containing vials waiting for FAME analysis can be stored in a fridge for a short term
wait or in a -80°C freezer, but need to be wrapped in foil and protected from light.
CALCULATION OF RESULTS
Lipid weight = Lipid containing vials – pre-weighed value of vial
Lipid percentage = ( Lipid weight / Sample weight ) * 100
QUALITY CONTROL A control blank is added at the start of the analysis to identify any contamination present in the
vials or solvents.
Duplicates or preferably triplicates are used of samples to identify vials that weight greatly more
than expected, likely due to amounts of biomass or methanol being present in the vial.
ERRORS AND INTERFERENCES Every sample should be duplicated, or triplicated where sample volume permits, to counter
variation in readings and possible human errors (e.g. in pipetting).
WASTE STREAM AND PROPER DISPOSAL All chemicals need to be disposed of according to local regulations and protocols. Waste
chemicals generally need to be placed into a waste chemical bottle for collection and proper
disposal.
REFERENCES Bligh, E.G. and Dyer, W.J. 1959. A rapid method for total lipid extraction and purification. Can.
J. Biochem. Physiol. 37:911-917
Folch, J., Lees, M., Sloane-Stanley & G.H. (1957) A simple method for the isolation and
purification of total lipids from animal tissues. J. Biol. Chem. 226:497–509
OTHER POINTS If samples are stored in a plastic container then they will become statically charged. This may
cause difficulties when biomass is removed from the tubes for weighing.

287
SOP: 4.3.c Total Lipid Extraction Matthew P. Daveyc, Louiza Normanc, Alex Jamiesonc
cDepartment of Plant Sciences, University of Cambridge, Downing Street, Cambridge CB2 3EA, UK PURPOSE To detail the procedure used for total lipid extraction. Lipid extraction was based on a modified
Bligh and Dyer (1959) method as outlined in Horst et al. (2012) and Davey et al (2014).
PRINCIPLE Total lipid is extracted from the algal biomass by a chloroform, methanol and water mix and
evaporation under nitrogen, followed by re-suspension in a smaller solvent volume. Lipids (as
FAME, TAGs, Polar Lipids or Free Fatty Acids) can later be determined using GC-FID, GC-MS
or TLC from final lipid extracts and are described in separate protocols.
REQUIREMENTS
Equipment, materials and reagents (all solvents are technical grade)
1. Centrifuge to hold 15 mL, 50 mL plastic ‘falcon tubes’
2. 50 mL Falcon tubes
3. Ice and Ice Bucket
4. Chloroform: MeOH (2:1) (please note that Chloroform has an expiry date on the bottle, this assay will not work with out of date chloroform!)
5. 25 mL measuring cylinder
6. C15:0 free fatty acid (make up stock 1 mg in 1 mL heptane)
7. 50 ml Schott bottles with blue screw lid
8. Sonicator bath with ice
9. Screw capped (with Teflon seal) Kimble tubes (Kimbell HS 30 mL No. 45600-30)
10. Deionised water
11. Genevac solvent evaporator with N2 gas
12. Glass Pasteur pipettes
13. 30 mL test tubes (Schott-Duran, 30 ml, from VWR)
14. n-heptane
15. Glass micro-syringe
16. GC sample vials (glass) with inserts to hold 300 µL solvent

288
17. -80 °C freezer
HAZARDS AND PRECAUTIONARY STATEMENTS
x Chloroform, methanol and heptane are very dangerous and toxic chemicals so extreme
caution should be taken when handling them – please read and understand the MSDS
sheets for these solvents
x Wear a laboratory coat, eye protection (goggles/safety glasses) and gloves (nitrile).
x All dispensing, pipetting, evaporation and disposal of solvents must take place in a fume
cupboard with the splash shield as low as possible.
x Any waste solvents need to be disposed of in an appropriate container that clearly states
it contains chlorinated waste solvents. Ask the relevant local person about further
processing. Waste solvents go into a sealed container, and then into the chemical
cupboard.
x For clean-up information or in cases of direct solvent contact please consult MS-DS
information or your local health and safety persons. Also see below for more information.
x Chloroform – Harmful if swallowed or inhaled, causes skin irritation, causes serious eye
irritation, may cause dizziness/drowsiness, suspected carcinogen, suspected teratogen,
prolonged/repeated exposure may cause damage to organs. Precautions – avoid
breathing vapours, use personal protective equipment (PPE).
x Methanol – Highly flammable liquid and vapour, toxic if swallowed, in contact with skin or
if inhaled, causes damage to organs. Precautions – Keep away from
heat/sparks/flames/hot surfaces, do not breather fumes/mist/gas/vapours/spray, wear
PPE, if swallowed call a poison centre or doctor/physician.
x Compressed gas – Keep gas cylinder well maintained, regulator attached/altered by a
trained person.
PROCEDURE
Preparation of solutions and materials
The glassware tubes and caps are soaked in detergent overnight. They are then rinsed with de-
ionised water, dried at 80 °C.

289
Make up chloroform: MeOH (2:1) fresh on day (60 mL methanol and 120 mL chloroform) and
store in a cupboard suitable to hold chlorinated solvents
Preparation of standards and samples
Samples for lipid analysis are usually samples of a known volume (typically 5 mL of culture in a
15 mL plastic falcon tube) that have been centrifuged at experiment temperature (600 g), the
supernatant discarded and then frozen at -80°C until analysis (essentially a biomass pellet).
Fresh samples (5 mL) from cultures can be used if pigments are extracted within 60 minutes.
Extracting larger amounts of pellets from the below methods results in precipitation within the
solvents, which can be fixed by adding a NaCl solution, however, this is at the detriment of
losing polar lipids within the extract.
C15:0 free fatty acid spike (make up stock 1 mg in 1 mL heptane)
Measurement of standards and samples Samples and standards
1. Resuspend cells in the 15 mL falcon tube in 5 mL chloroform: MeOH (2:1) using a 20 mL
glass measuring cylinder. Spike sample with C15:0 free fatty acid (200 µL spike; 200 µL =
200 µg C15:0)
2. Pour carefully the resuspended cells containing C15:0 into 50 mL Schott bottle.
3. Repeat steps 1 and 2 but omit the spike and combine the two extracts so total is 10 mL
4. Sonicate cells for 30 min (add ice to sonicator bath), then leave in sonicator for 30 min.
5. Transfer content of Schott bottle to Kimble tube. Afterwards, wash Schott bottle with 5 mL
of chloroform:MeOH (2:1) and combine with 10 mL in the Kimble tube.
6. Add 5 mL deionised water, screw on the black cap with the inner Telfon liner, and shake
test tubes vigorously for 2 min. (sometimes solvent can leak if the cap is broken or not
screwed on properly, so do a careful shake first to check for leaks)
7. Centrifuge samples at 972 g for 3 min 4 °C (as you are centrifuging glass tubes, please
ensure you use a rubber liner in the centrifuge rotor – ask your laboratory manager if you
are unsure about this process).
8. Phase separation is achieved.
9. Turn on Genevac (or similar solvent evaporator) and press start on unit to prime unit

290
10. Carefully discard (using glass Pasteur pipettes) the top clear phase (consists mainly water
and methanol) into chloroform waste. Do not take too close to the green lower phase.
11. Transfer lower green phase (chloroform phase containing lipids) using glass Pasteur
pipette to 30 ml test tube (Duran, 30 ml, from VWR). Do not take too close to the upper
clear phase.
12. Evaporate solvent using GeneVac system saturated with N2 gas. Use program LowBP
mixture at 45 °C. Press pause when adding tubes otherwise you will have to wait for it to
prime again.
13. Evaporate for about 3 hours, then empty jug full of solvent into a chlorinated waste bottle
14. Carefully resuspend the residue in the Duran tube in 200 µL n-heptane (therefore spike =
200 µg equivalent) using glass micro-syringe
15. Quickly add to a clear glass GC/HPLC vial with 300 µL insert and close cap.
16. Store at -80 °C until GC analysis
CALCULATION OF RESULTS n/a
QUALITY CONTROL A control blank is added at the start of the analysis to identify any contamination present in the
vials or solvents.
Each sample point should have two technical repeats (ie, samples from the same flask) that
should concur.
ERRORS AND INTERFERENCES Every sample should be duplicated, or triplicated where sample volume permits, to counter
variation in readings and possible human errors (e.g. in pipetting).
WASTE STREAM AND PROPER DISPOSAL All chemicals need to be disposed of according to local regulations and protocols. Waste
chemicals generally need to be placed into a waste chemical bottle for collection and proper
disposal.
REFERENCES Bligh, E.G. and Dyer, W.J. 1959. A rapid method for total lipid extraction and purification. Can.
J. Biochem. Physiol. 37:911-917

291
Davey MP, Duong GH, Tomsett E, Litvinenko ACP, Howe CJ, Horst I, Smith AG. (2014).
Triacylglyceride production and autophagous responses in Chlamydomonas reinhardtii
depend on resource allocation and carbon source. Eukaryotic Cell. 13: 392-400
Horst I, Parker BM, Dennis JS, Howe CJ, Scott SA, Smith AG. 2012. Treatment of
Phaeodactylum tricornutum cells with papain facilitates lipid extraction. Journal of
Biotechnology 162:40-49.
OTHER POINTS Leave all glassware to evaporate solvent overnight in the flow hood then next day wash all
glassware by soaking in hot water and detergent, then rinse many times with RO water and dry
as above.
To reduce plastic contamination in the lipid analyses, use glass pipettes for protocol rather than
plastic Gilson pipettes. The solvent systems described above can be used in Falcon tubes
without problems.

292
SOP: 4.3.e Total Lipid Analysis Anneliese Ernste
eHochschule für Technik und Wirtschaft des Saarlandes, Göbenstraße 40, 66117 Saarbrücken, Germany
PURPOSE The energy requirement for the cultivation of microalgae in closed growth systems
(photobioreactors) is currently higher than the energy stored in the biomass. Besides
decreasing the energy required to produce the biomass a second option is to increase the
energetic yield of biomass by increasing the lipid content.
PRINCIPLE Total lipid was determined gravimetrically after a chloroform extraction.
EQUIPMENT AND MATERIALS See Equipment, materials and reagent described in the SOP of Swansea University (SOP Lipid,
SU).
HAZARD AND PRECAUTIONARY STATEMENTS See section in the SOP Lipid, SU
PROCEDURE Solutions were prepared according the SOP Lipid, SU.
Because no freeze-dryer was available, an appropriate amount of cells (approximately 50 mg
dry mass) was transferred into a 2 ml centrifuge tube and pelleted
The pellets were dried in a block heater at 98°C.
The solid pellets were ground to a powder with a mortar and pestle.
The procedure described in the SOP Lipid, SU, was followed thereafter.
CALCULATION OF RESULTS See section in the SOP Lipid, SU
QUALITY CONTROL See section in the SOP Lipid, SU

293
WASTE STREAM AND PROPER DISPOSAL See section in the SOP Lipid, SU
REFERENCES See section in the SOP Lipid, SU

294
SOP: 4.4.a, 4.5.a Pigment Analysis Catherine Baylissa, Alla Silkinaa
aAlgal Research, Swansea University, Singleton Park, Swansea, SA28PP, UK PURPOSE To describe the protocol used for analysing micro-algae pigments; Chlorophyll a, b and total
carotenoids (includes chlorophyll c).
PRINCIPLE The sample is either weighed out or centrifuged out into an Eppendorf tube. Hot (60°C) DMSO
is added to the tubes and heated at 60°C. After centrifuging the supernatant is removed, diluted
if needed, and read in a spectrophotometer at 480, 630, 649, 665 and 710 nm.
REQUIREMENTS
Equipment, materials and reagents
x 1.5 mL eppendorfs
x Water bath
x Spectrophotometer capable of reading 480, 630, 649, 665, and 710 nm.
x Eppendorf (micro-) centrifuge
x DMSO
x Ultrapure water (milliQ water)
HAZARDS AND PRECAUTIONARY STATEMENTS
x Wear a laboratory coat, eye protection (goggles/safety glasses) and gloves (nitrile)
(double glove when handling DMSO).
x All dispensing, pipetting, evaporation and disposal of reagents should take place in a
fume cupboard with the splash shield as low as possible.
x Any waste chemicals need to be disposed of in an appropriate container that clearly
states if it contains chlorinated waste solvents. Ask the relevant local person about further
processing. Swansea University – waste solvents go into a sealed container, and then into

295
the chemical cupboard. The hazardous waste collection is open periodically; see health
and safety forms for more information.
x For clean-up information or in cases of direct solvent contact please consult MS-DS
information or your local health and safety persons. Also see below for more information.
x DMSO – is readily absorbed through the skin, along with anything dissolved in it, directly
into the bloodstream. Double glove when handling this chemical and be aware of what is
dissolved in it when it is being handled as any contact will cause dissolved substances to
enter the bloodstream directly (within minutes of contact) and is not reversible.
PROCEDURE
a) Preparation of solutions and materials The DMSO should be heated to 60°C in a water bath just prior to analysis.
b) Preparation of standards and samples
Samples that are in a minus 80 freezer should be removed just prior to analysis.
Samples for pigment analysis are usually samples of a known volume that have been
centrifuged, the supernatant discarded and then frozen at -80°C until analysis
(essentially a small biomass pellet). Otherwise, 2 mg of freeze dried biomass can be
weighed into an Eppendorf and the analysis continues as normal with weights recorded
down for each sample.
c) Measurement of standards and samples 1. Of the pre-heated DMSO, 1mL is added to the sample containing eppendorfs
(weighed biomass or centrifuged biomass).
2. The vials are agitated using a vortex or shaker, and then sonicated at 60°C for 10
minutes.
3. Sonication may aid extraction, but trials should take place beforehand with the algal
species in question to determine if sonication during heating destroys the pigments
present and gives inaccurate readings.
4. The vials are centrifuged at 10,000 RPM for 5 minutes (depending on the size of
the biomass this may need to be increased to 10 minutes or more).
5. The supernatant is removed. If the pigment concentration is not known, a single
sample can be run to ensure the OD is below 1 for the set of samples. If it is above

296
1, then the samples need to be diluted with DMSO and the dilution written down
(usually diluted with 1mL DMSO).
6. The supernatant is then transferred to quartz cuvettes (or disposable cuvettes if
quartz are not available). Absorbance is read in a spectrophotometer at 480 nm,
630 nm, 649 nm, 665 nm and 710 nm after it has been blanked with DMSO.
CALCULATION OF RESULTS The absorbance at 710nm is subtracted from that at other wavelengths to account for any debris left in
the supernatant (Wellburn 1994).
To calculate the chlorophyll a, b and carotenoid amounts in the sample the following equations were used
(Wellburn 1994). The values produced are in µg/ml
𝐶ℎ𝑙 𝑎 = 12.19𝐴 − 3.45𝐴
𝐶ℎ𝑙 𝑏 = 21.99𝐴 − 5.32𝐴
𝐶ℎ𝑙 𝑥 + 𝑐 (𝑐𝑎𝑟𝑜𝑡𝑒𝑛𝑜𝑖𝑑𝑠) = 1000𝐴 − 2.14𝐶ℎ𝑙 𝑎 − 70.16𝐶ℎ𝑙 𝑏 220
Each of these values then needs to be multiplied by the dilution factor if the samples were
diluted.
QUALITY CONTROL A blank of DMSO is used to calibrate the spectrophotometer. Each sample point has repeats
that should concur, and if problems occur with the spectrophotometer then the sample can be
read again.
ERRORS AND INTERFERENCES Every sample should be duplicated, or triplicated where sample volume permits, to counter
variation in readings and possible human errors (e.g. in pipetting).
WASTE STREAM AND PROPER DISPOSAL All chemicals need to be disposed of according to local regulations and protocols. Waste
chemicals generally need to be placed into a waste chemical bottle for collection and proper
disposal.

297
REFERENCES Wellburn, A.R. (1994) The spectral determination of chlorophylls a and b, as well as total
carotenoids, using various solvents with spectrophotometers of different resolution.
Journal of Plant Physiology 144; 307-313
Strickland, J.D.H. & Parsons, T.R. (1972) A practical handbook of seawater analysis, (2nd Ed.) Ottowa. Fisheries Research Board of Canada.
OTHER POINTS If freeze dried samples are stored in a plastic container then they will become statically charged.
This may cause difficulties when biomass is removed from the tubes for weighing and analysis.

298
SOP: 4.4.b Analysis of chlorophyll a (Chl a) and pheophytin a (Phe a) using UV-VIS spectrophotometry Sofie Van Den Hendeb, Cedric Laurentb, Alexandra Lefoulonb
bDepartment of Industrial Biological Sciences (former Howest University College)(, Faculty of Bioscience
Engineering, Ghent University, Campus Kortrijk, Karel de Goedelaan 5, 8500 Kortrijk, Belgium PURPOSE
This procedure is used to determine the content of chlorophyll a and pheophytin a in a given
sample (for example microalgal bacterial flocs, microalgae or algae-containing digestate) using
a spectrophotometric method.
PRINCIPLE All photosynthetic microalgae contain chlorophyll a. By breaking cell walls of microalgae
through means of grinding and/or sonication the green pigment can be extracted using an
organic solvent. This solvent consists of 90 % (v/v) acetone and 10% (v/v) saturated
magnesium carbonate solution to prevent degradation of chlorophyll a to pheophytin a. This pheophytin a can interfere with the determination of chlorophyll a as it absorbs in the same
region of the spectrum. The extract is measured by means of aspectrophotometer ( for
absorbance at 664 nm (A664b) wavelength). The sample is then acidified so all chlorophyll a is
converted to pheophytin a by eliminating the magnesium ion from the tetrapyrrole complex. The
absorbance at 665 nm (A665a) of this acidified sample is measured. Before and after
acidification, the absorbance at 750 nm (A750b and A750a) is measured to correct A664b and
A665a for turbidity. These measurements allow to calculate the content of chlorophyll a and
pheophytin a in the sample.

299
REQUIREMENTS EQUIPMENT AND MATERIALS
x analytical balance
x tissue grinder: PTFE pestle and glass tube (Potter-Elvehjem)
x sonicator with sound protection box (dr. Hielscher, UP 400s, 24 kHz, 400 W)
x centrifuge with cooling
x glass centrifuge tubes (10 mL) with screw cap and rubber
x automatic pipets of 100-1000 µL and 1-5 mL with tips
x UV/VIS spectrophotometer (Shimadzu UV-1601)
x glass cuvettes (3 mL) (1 cm path length) and holding rack
REAGENTS
x saturated magnesium carbonate solution (MgCO3) (not oversaturated!) (UGent Campus
Kortrijk lab reference number: 02095) (add ±1 g / 100 mL demineralized water and let
settle for minimum 24 hours)
x acetone
x 0.1 N hydrochloric acid (HCl)
x demineralized water
HAZARDS AND PRECAUTIONARY STATEMENTS x Avoid excessive contact with acetone. Working with solvents such as acetone has a
health risk. Therefore all work should be carried out in well-ventilated conditions,
preferably under a hood.
x Always wear a laboratory coat, eye protection and laboratory gloves.
x Only sonicate making sure:
x The head of the sonicator is always submerged:
x Not making any direct contact with glass or other solid materials.
x Always submerged till the rubber edge.
x The door of the sound protection box is closed.
x While sonicating, close all doors and do not linger around longer than necessary to
protect your ears or wear protective ear plugs.
x Look up all Hazard and Precautionary Statements for the products handled.
http://www.msds-europe.com/id-486-and_statements_ghs_clp.html
x Most important notices are for the uses reagents are:

300
PROCEDURE SAMPLE PREPARATION AND MATERIALS
MgCO3-acetone extraction solution Mix precisely 90 volume parts of pure acetone with 10 volume parts of saturated magnesium
carbonate solution. Calculate the total amount needed in advance. Count a total of around 30
mL needed per sample for extraction and analysis. Labelling tubes and caps Mark each cap and tube with a reference number with a acetone-resistant paint pen.
EXTRACTION PROCEDURE
The extraction procedures involve various steps depending on the sample type. The needed
steps for each sample type are indicated with a letter: solid (s) or liquid (l) microalgae samples
and digestate samples (d). Preparing liquid samples (l) or (d)
x Take 10 mL (noted as V2 in mL) of homogenised algae sample and pour it into the glass
centrifuge tube. In case of digestate sample, take only 2 mL sample and add another 8
mL of demineralized water to dilute the sample and enable effective centrifugation.
x Equal the weights of the centrifuge tubes (including the caps) in pairs by approximately
0.1 g by demineralized water. firmly close these tubes with the labeled cap.
x Centrifuge (multiple pairs of tubes at once) at 3000 rpm for 15 to 30 minutes at 4 °C
(time depending on the TSS content).
x Carefully decant all supernatant (disposing from it) from the centrifuge tubes so only the
solid pellet on the bottom remains.
x Inject 1 or 2 mL of the MgCO3-acetone solution into the tube with a pipet trying to loosen
the pellet and transfer the entire contents into the tissue grinder (Potter tube). If the
pellet is not released, put the cap back on the tube and shake it or poke with the back of
the pestle and rinse everything to collect all biomass in the Potter tube.
Preparing solid samples (s)

301
x Weigh a small amount (between 100 and 150 mg) of sample directly into the tissue
grinder (Potter tube) using another beaker to hold it up right and note the exact used
mass. Be careful not to overload the analytical balance. Or weigh any amount that would
represent the concentration in a liquid sample solution.
Cell wall breaking by tissue grinding (m) (l) (d)
x Add MgCO3-acetone solution into the Potter tube until 2 to 4 mL is inside.
x Count the total volume of MgCO3-acetone solution used as no more than 10 mL in total
should be used during the entire process of extraction.
x Use the pestle to grind the algae solution in the Potter tube by moving it up and down
and turning it around applying fierce physical pressure to crush the cell walls. Do this for
a few minutes to make sure all material thoroughly grinded.
x Carefully pour the contents of the Potter tube back into the extraction tube rinsing it with
more MgCO3-acetone solution, however not using more than 10 mL in total. Suggested
is to work with pipet volume shots of 1 mL. Also rinse the pestle. It is important not to
lose any algae or chlorophyll-containing extraction slurry.
x Firmly close the centrifuge tube with the cap and shake it.
x When all algae are transferred back into the extraction tube clean the pestle and Potter
tube with more of MgCO3-acetone solution but dispose of the rinsing fluid. Then dry the
Potter tube with paper and dry pressured air so the Potter tube can be used for (possibly
the weighing and) the extraction of the next sample.
Further cell wall breaking by sonication (m) (l) x Put 4 to 6 centrifuge tubes together in a beaker of 250 mL and place the sonicator head
in it adding clean cooling water to the beaker till the rubber edge of the sonicator probe.
x Sonicate for a total of 20 minutes at 70% amplitude and 0.7 seconds cycle time. Pause
every 4 or 5 minutes to replace the cooling water with cold water as temperature
increases rapidly because of the sonication. Too high temperatures in the centrifuging
tubes would degrade chlorophyll a and other components. To replace the water a
flexible tube filled up with water could be used to drain and refill the beaker with
mechanism of communicating vessels.
Extraction (m) (l) (d) x Allow the sample to stand for at least 3 days in a fridge (4-7°C) for the extraction to take
place.

302
x After extraction, check if the pellet at the bottom became colorless.
x Equal the weights of the centrifuge tubes (including the caps) by pairs by approximately
0.1 g by adding MgCO3-acetone solution and firmly close again.
x Centrifuge (multiple pairs of tubes at once) at 3000 g for 10 minutes by 10 °C.
x After centrifuging, make sure the tubes are not stirred any more to have minimal
suspension coming from the pellet to have correct readings. Gently and slowly handle
them from this point on.
SPECTROPHOTOMETRIC DETERMINATIONS
Preparing the spectrophotometer x Turn on the Shimadzu UV-1601 UV/VIS-spectrophotometer with the power button on the
left side and wait for the boot sequence, lamp warm up and check to complete.
x Press “MODE” and choose option 1.Photometric.
x Set the wavelength as described in the next step by pressing “GOTO WL”, entering the
number on the keypad and confirming with “ENTER”.
x To calibrate at a specific wavelength, insert 2 clean cuvettes filled with 3 mL of
demineralized water, close the lid and press “AUTO ZERO” to set relative absorbance to
zero. Always repeat this step whenever changing the wavelength for reading
absorbance.
x Always clean the sides of the cuvettes dry with paper so no drops on the outside can
interfere with the light going through. Also check for any air bubbles in the cuvette and
remove them by stirring.
x When measuring samples, the cuvette socket in the back is the reference cuvette, which
is to be filled with 3 mL MgCO3-acetone solution with no algae. This cuvette can be
reused for each sample.
x The cuvette socket in the front of the spectrophotometer is the sample that is read.
x The computer connected to the spectrophotometer is not to be used.
Determination of samples with spectrophotometer x Since the next steps have to be repeated a number of times, sets of 1 to 4 samples can
be taken together for analysis to save time on recalibrating for each sample. However,
start by doing just one, and gradually increase the amount as you get more experienced
and can perform the actions faster. Mark or know very well which cuvette contains which
sample.

303
x When measuring with sample cuvettes inserted, the absorbance value is directly
displayed and should be between 0 and 1 for correct readings. If higher, a dilution of the
sample in MgCO3-acetone solution has to be made and reread.
x Calibrate for 750 nm (using demineralized water as described above).
x Transfer 3 mL of the clarified sample extract from the centrifuge tube into a glass sample
cuvette with an auto pipet without stirring any suspension upwards.
x Place the reference and sample cuvette in their respective sockets, close the lid and
note the absorbance value on the display at 750 nm for a set of samples (A750b).
x Repeat calibration and measurement for 664 nm on the same set of samples and note
the values (A664b).
x Repeat calibration at 665 nm.
x Acidify the sample extract in the cuvette with 0.1 mL of 0.1 N HCl and wait exactly 90
seconds before reading absorbance at 665 nm. Use an automatic pipet to insert the acid
in the sample cuvette and mix it.Respect the 90 seconds rule for measuring between
insertions of acid and reading absorbance by using a timer for example, as it is a crucial
part of the protocol, especially for highly concentrated samples. Do this for each sample
exactly on their own count of 90 seconds. Acidifying more than 4 samples in 90 seconds
is not advised as mistakes because of speeding are made easier. Note all values
(A665a).
x Repeat calibration and measurement at 750 nm on the same set of samples, however
not bound to any second counting no longer. Note all values (A750a).
x Determine the remaining volume (mL) of extract in the centrifuge tube by pouring it into
graduated cylinder (±0.1 mL). Mathematically add the amount of extraction sample
transferred to cuvette (3 mL) or in case used in any dilutions from it. This sum is the total
amount of extract and will be noted as V1 (mL).
x Repeat the determination procedure for the remainder of sample sets to process.
x When done, turn off the spectrophotometer with the main power button, so the lamp
doesn’t get overheated.
CALCULATION OF RESULTS CHLOROPHYLL A
𝐶ℎ𝑙 𝑎 (𝑚𝑔 𝐿⁄ ) = 26.7 ∙ [(𝐴664𝑏 − 𝐴750𝑏) − (𝐴665𝑎 − 𝐴750𝑎)] ∙ 𝑉1𝑉2 ∙ 1000
PHEOPHYTIN A

304
𝑃ℎ𝑒𝑜𝑝ℎ𝑦𝑡𝑖𝑛 𝑎 (𝑚𝑔 𝐿⁄ ) = 26.7 ∙ [1.7 ∙ (𝐴665𝑎 − 𝐴750𝑎) − (𝐴664𝑏 − 𝐴750𝑏)] ∙ 𝑉1𝑉2 ∙ 1000
The value 26.7 above in the equations is the absorbance correction and equal A × K where A is
the absorbance coefficient for chlorophyll a at 664 nm (11.0) and K is a ratio expressing the
correction for acidification (2.43) (APHA et al., 2005).
QUALITY CONTROL x If the pellet is still green after the first extraction, make another extract until all
chlorophyll is extracted from the pellet.
x Every sample should be duplicated to counter variation in readings. If the liquid samples
are not centrifuged immediately after collection they can be kept for a few hours in cold
and dark storage, in a refrigerator or an ice bath. The time between sampling and
filtering must be as short as possible and no longer than 24 hours.
ERRORS, CALIBRATION AND INTERFERENCES x For extraction of samples with a hard cell wall, pretreatment of the biomass, such as
freezing overnight, might be needed. Use clean and clear glass sample cuvette. To
proper clean the cuvette use acetone.
x As the pigments are both photo- and heat-sensitive, care to protect them from direct
sunlight and from warming must be taken at each step of the procedure. Conduct all
work with chlorophyll extract in subdued light to avoid degradation. Store all samples in a
dark fridge directly to stop photodegradation or strong acetone vaporisation.
x Pheophytin a is a degradation product of chlorophyll a that interferes with the
determination of chlorophyll a because it absorbs light and fluoresce in the same region
of the spectrum as does chlorophyll a. When present, significant errors in chlorophyll a
values can be measured. Also if chlorophyll b is present and gets acidified, the resulting
pheophytin b which has coincident fluorescence emissions with pheophytin a can lead to
underestimating chlorophyll a and overestimating pheophytin a.
x Interferences – chlorophyll degradation products can seriously interfere with
measurements of chlorophyll-a. If for example the algae are in a senescence stage then
the reading will not be accurate. Chlorophyllides, not spectroscopically distinct from
chlorophyll-a, lead to an overestimation of chlorophyll a.
x In the case of very low values expected, it is possible to filter 200 mL sample with a
glass fibre filter (diameter 0.45 µm), then add 5 mL MgCO3-acetone solution (the filter
should be dissolved), store in the fridge and analyse as described in the procedure. The

305
blank used for spectrophotometry is a clean filter dissolved in 5 mL MgCO3-acetone
solution.
WASTE STREAM AND PROPER DISPOSAL x Collect all contents from centrifuge tubes and cuvettes that contain acetone solutions
and dispose of it in the correct liquid waste stream disposal barrel. In this case it should
be disposed of in the barrel labelled “Niet gehalogeneerde organische solventen” for
non-halogenated organic solvents.
x Rinse all cuvettes, tubes and caps with demineralized water,and dry in an oven.
REFERENCES APHA, Awwa, WEF, 2005. Standard Methods for the Examination of Water and
Wastewater, 21st ed. American Public Health Association, Washington DC.

306
SOP: 4.4.c, 4.5.c Pigment Analysis Matthew P. Daveyc, Alex Jamiesonc
cDepartment of Plant Sciences, University of Cambridge, Downing Street, Cambridge CB2 3EA, UK
PURPOSE Spectrophotometric protocol for quantifying micro-algae pigments; Chlorophyll a, Chlorophyll b,
total chlorophyll and total carotenoids.
PRINCIPLE The sample is centrifuged out into an Eppendorf tube. Dimethylformamide (DMF) is added to
the tubes and vortexed. After centrifuging the supernatant is removed, diluted if needed, and
read in a spectrophotometer at 480, 647 and 664.5 nm.
REQUIREMENTS
Equipment, materials and reagents
x 1.5 mL eppendorfs
x Vortex
x Spectrophotometer capable of reading 480, 647 and 664.5 nm at 1-4 nm range.
x Dimethylformamide (DMF)
HAZARDS AND PRECAUTIONARY STATEMENTS
x Wear a laboratory coat, eye protection (goggles/safety glasses) and gloves (nitrile).
x DMF is very hazardous – please read and understand the MSDS for DMF
x All dispensing, pipetting, evaporation and disposal of reagents should take place in a
fume cupboard with the splash shield as low as possible.
x Any waste chemicals need to be disposed of in an appropriate container that clearly
states if it contains chlorinated waste solvents. Ask the relevant local person about further
processing. Cambridge University – waste solvents go into a sealed container, and then
into the chemical cupboard. The hazardous waste collection is open periodically.

307
x For clean-up information or in cases of direct solvent contact please consult the MSDS
information or your local health and safety person.
PROCEDURE f) Preparation of solutions and materials
The DMF can be used at room temperature.
g) Preparation of standards and samples
Samples that are in a minus 80 freezer should be removed just prior to analysis.
Samples for pigment analysis are usually samples of a known volume (typically 1 mL of
culture in a 1.5 mL or 2 mL chemical resistant capped Eppendorf vial) that have been
centrifuged, the supernatant discarded and then frozen at -80°C until analysis
(essentially a small biomass pellet). Fresh samples (1 mL) from cultures can be used if
pigments are extracted within 60 minutes.
h) Measurement of standards and samples 1. In a non-lit fume hood (away from direct sunlight if possible), 1 mL of DMF is added
to the sample pellet containing Eppendorfs.
2. The vials are agitated using a vortex or shaker at laboratory temperature (typically
20-25 °C) for 15 minutes.
3. The vials are centrifuged at 10,000 RPM on a standard benchtop centrifuge for 2
minutes. The remaining pellet should be white/clear and the solvent a light green
colour. If the pellet is still green in places vortex for a further 5-10 minutes and re-
centrifuge.
4. The supernatant is removed. If the pigment concentration is not known, a single
sample can be run to ensure the OD is below 1 for the set of samples. If it is above
1, then the samples need to be diluted with DMF and the dilution written down
(usually 2 to 5 fold dilutions are required).
5. The supernatant is then transferred to a DMF resistant cuvette (quartz or disposable
cuvettes such as BRAND UV-range cuvettes which are DMF resistant
http://www.brand.de/en/products/life-science-products/cuvettes-and-
accessories/technical-data/). Absorbance is read in a spectrophotometer (Thermo
Spectronic UV1, Thermo Scientific) at 480, 647 and 664.5 nm after it has been
blanked with DMF.

308
CALCULATION OF RESULTS To calculate the chlorophyll a, chlorophyll b and total chlorophyll amounts in the sample the
following equations were used from Inskeep and Bloom (1985) and for carotenoid amounts the
equations modified from Wellburn 1994 were used. The values produced are in µg pigment per
mL solvent.
𝐶ℎ𝑙 𝑎 = 12.70𝐴 . − 2.79𝐴
𝐶ℎ𝑙 𝑏 = 20.70𝐴 − 4.62𝐴 .
𝑇𝑜𝑡𝑎𝑙 𝐶ℎ𝑙 = 17.90𝐴 + 8.08𝐴 .
𝐶ℎ𝑙 𝑥 + 𝑐 (𝑐𝑎𝑟𝑜𝑡𝑒𝑛𝑜𝑖𝑑𝑠) = 1000𝐴 − 2.14𝐶ℎ𝑙 𝑎 − 70.16𝐶ℎ𝑙 𝑏 245
Each of these values then needs to be multiplied by the dilution factor if the samples were
diluted.
If a pellet from 1 mL of culture was extracted in 1 mL DMF without further dilution, then the
results directly equate to µg pigment per mL culture. If the cell number and/or dry weight per mL
is also known then the pigment content can be expressed on a per cell or unit dry weight basis.
To express as mg pigment per g of dry weight:
= pigment value as microgram per mL / microgram algae dry weight per mL culture x 1000
As a guide we typically found that total chlorophyll concentrations of Chlamydomonas reinhardtii are between 10-60 mg total chlorophyll per g dry cell weight (Davey et al 2014).
QUALITY CONTROL A blank of DMF is used to calibrate the spectrophotometer. Each sample point should have two
technical repeats (ie, samples from the same flask) that should concur. Depending on the
experimental design at least three replicate flasks should be used per assay. If problems occur
with the spectrophotometer then the sample can be read again.
ERRORS AND INTERFERENCES

309
Every sample should be duplicated, or triplicated where sample volume permits, to counter
variation in readings and possible human errors (e.g. in pipetting). Depending on the
experimental design at least three replicate flasks should be used per assay.
WASTE STREAM AND PROPER DISPOSAL All chemicals need to be disposed of according to local regulations and protocols. Waste
chemicals generally need to be placed into a waste chemical bottle for collection and proper
disposal.
REFERENCES
Davey MP, Duong GH, Tomsett E, Litvinenko ACP, Howe CJ, Horst I, Smith AG. (2014).
Triacylglyceride production and autophagous responses in Chlamydomonas reinhardtii depend
on resource allocation and carbon source. Eukaryotic Cell. 13: 392-400
Inskeep WP, Bloom PR. (1985). Extinction coefficients of chlorophyll-a and chlorophyll-b in n,n-
dimethylformamide and 80-percent acetone. Plant Physiology 77: 483-485.
Wellburn, A.R. (1994) The spectral determination of chlorophylls a and b, as well as total
carotenoids, using various solvents with spectrophotometers of different resolution. Journal of Plant Physiology 144; 307-313

310
SOP: 4.4.d Analysis of chlorophyll-a using UV-vis spectrophotometry Carole A. Llewellynd
dPlymouth Marine Laboratory, Prospect Place, The Hoe, Plymouth, PL13DH, UK PURPOSE This procedure is used to determine chlorophyll-a, b and c using a trichromatic
spectrophotometric method.
PRINCIPLE A small volume of algal culture (approx. 10-20 mL depending on the density of the culture) is
filtered onto a glass fibre filter pad (GF/F) and extracted into organic solvent. The extract is
measured for absorbance at wavelengths that absorb chlorophyll and a calculation is performed
to calculate the concentration of the different chlorophylls in the extract. This is used to calculate
chlorophyll concentrations in the culture media, or in dry weight or per cell. There are two basic
spectrophotometric methods, monochromatic and trichromatic. The monochromatic methods
have been developed to correct chlorophyll a for pheopigment-a useful for senescent cultures or
where cultures have been significantly affected by grazing. In the monchromatic method
acidification degrades all chlorophyll-like pigments into pheopigments by eliminating the
magnesium ion from the tetrapyrrole complex. The drop in absorbance allows both chlorophyll a
and pheopigment to be calculated. The trichromatic method is most suitable for algal cultures
where there the cultures are not senescent or degrading and provides estimates on chlorophyll-
a, b and c. Here we describe the trichromatic method.
REQUIREMENTS EQUIPMENT AND MATERIALS
x Vacuum system (3-4 psi)
x Glass Fibre (Whatman GF/F type) (25 mm or 47 mm in diameter)
x Filter forceps
x 15 mL graduated glass centrifuge tubes
x 250 mL filter flask with sidearm
x Nalgene Tubing
x 200 mL volumetric flask
x (5) 100 mL volumetric flask

311
x Aluminum Foil
x Parafilm
x Spectrophotometer with a 2nm spectral bandwidth.
x Disposable glass pipets
x High purity grade acetone (1 L)
x De-ionised water
REAGENTS
90% (v/v) acetone: 900 mL of acetone in 1 L volumetric flask
HAZARDS AND PRECAUTIONARY STATEMENTS Working with solvents such as acetone has a health risk. Therefore all work should be carried
out in well-ventilated conditions, preferably under a hood.
PROCEDURE Filtration
x Carry out filtration within one hour of collection of the sample. Place a glass-fibre filter
(Whatman GF/F type, 25 mm or 47 mm in diameter) on the filter holder, using forceps.
x Gently mix the algal culture sample.
x Vacuum filter at < 50mm Hg
x Gently suck the last part of the algal culture through the filter.
x Take off the filter from holder. The filter is then folded once with the algae inside, blotted
gently with absorbent paper to remove excess media, and placed in a properly labelled
clean container.
Precautionary notes x If the samples are not filtered immediately after collection they can be kept for a few
hours in cold and dark storage, in a refrigerator or an ice bath. The time between
sampling and filtering must be as short as possible, and no longer than 24 hours.
x Filtration should be carried out under subdued light.
x Magnesium carbonate should not be used as a filter aid.
x All handling of the filters should be done using forceps.
x The filtration time should be kept as short as possible. Clogging of the filters should be
avoided.
x Check that the filtration funnels are well seated on the base, and be sure that the filters
(Whatman GF/F) are in place. Improperly placed filters or loose funnels will result in loss

312
of sample. The chlorophyll samples are volumetric and should sample loss occur,
replace the filter with a new one and redraw the sample.
Pigment Extraction x Carry out extraction by grinding the filters in a few mls of 90 % acetone in a glass
homogenizer with a motor-driven Teflon pestle, for 1 minute, in an ice bath and under
subdued light.
x After grinding, carefully transfer the extract to a stoppered and graduated centrifuge tube
rinse the glass homogenizer and the pestle with 90 % acetone and add rinsing volumes
to the centrifuge tube.
x Make up the extract volume in the centrifuge tube to exactly 10 ml 90 % acetone (i.e. 10
ml + dead volume of filter) and stopper the tube.
Precautionary notes x Soaking of the filters overnight is not recommended unless the extraction efficiency of
this procedure is thoroughly checked against grinding for the actual working conditions.
x If the extracts are not measured immediately after grinding, for instance, if the
measurements are done in batches, they can be kept tightly stoppered in cold and dark
storage for up to one hour.
Working with solvents such as acetone has a health risk. Therefore all work should be
carried out in well-ventilated conditions, preferably under a hood.
Measurement. Use a spectrophotometer of 2 nm maximum bandwidth and stoppered matched glass or quartz
cuvettes with path-length of 1 cm. A path-length of up to 5 cm can be used for dilute cultures.
Switch on spectrophotometer and leave to warm up for 45 min before using
Transfer the sample extracts from the centrifuge tubes to the sample cuvette by careful
pipetting. Place in the sample cuvette holder. Pipette 90 % acetone (blank) into the reference
cuvette and place in the reference cuvette holder. Measure the absorbance of the sample
extract at 750, 664, 647, and 630 nm referenced against the blank. Rinse carefully and
thoroughly between samples.
Precautionary notes Use matched cuvettes and ensure the cuvettes are clean. Ensure correct cuvette holders fitted.

313
CALCULATION OF RESULTS Trichromatic method Calculate the concentration of chlorophyll a, b and c, according to the equations of Jeffrey and
Humphrey (1975):
Chlorophyll a = (11.85* (E664 − E750) − 1.54* (E647 − E750) − 0.08 (E630−E750))*Ve/L*Vf
Chlorophyll b = (−5.43* (E664 − E750) + 21.03* (E647 − E750) − 2.66 (E630−E750))*Ve/L*Vf
Chlorophyll c = (−1.67* (E664 − E750) − 7.60* (E647 − E750) + 24.52 (E630−E750))*Ve/L*Vf
Where:
L = Cuvette light-path in centimetre.
Ve = Extraction volume in millilitre.
Vf = Filtered volume in litre.
Concentrations are in unit mg m−3. (= µg L-1).
If dry weight and cell numbers are known this can then be converted to µg chlorophyll g-1 dry
weight or pg chlorophyll cell-1.
QUALITY CONTROL x If the samples are not filtered immediately after collection they can be kept for a few
hours in cold and dark storage, in a refrigerator or an ice bath. The time between
sampling and filtering must be as short as possible and no longer than 24 hours.
ERRORS, CALIBRATION AND INTERFERENCES
x As the pigments are both photo- and heat-sensitive, care to protect them from direct
sunlight and from warming must be taken at each step of the procedure.
x Interferences – chlorophyll degradation products can seriously interfere with
measurements of chlorophyll-a. If for example the algae are in a senescence stage then
the reading will not be accurate. Chlorophyllides, not spectroscopically distinct from
chlorophyll-a, lead to an overestimation of chlorophyll a.
x Storage of frozen filters at -18°c to -20°c is only acceptable for short periods (not
exceeding several weeks). Filters can be stored in liq N2 (-196°C) or at -80°C for up to
and over one year.
x Vacuum pressure: To avoid damaging cells during filtration, vacuum pressure should
be limited. While Jeffrey etal. (1997) mention keeping residual pressure under the filter
not lower than 0.5 bar, most users recommend that it be kept higher than 0.7 bar.

314
x Solvent choice. If acetone is used, it is strongly recommended to grind the filters
instead of sonicating or soaking overnight. In a glass homogeniser with a motor-driven
teflon pestle, complete disruption of the filter is obtained in about 1 minute. Extraction
time may be prolonged to 30–60 minutes after transfer into the centrifuge tubes kept
tightly closed and protected from heat and light (Lorenzen, 1967).
WASTE STREAM AND PROPER DISPOSAL Dispose of acetone on appropriate container – not down the sink.
HAZARDS AND PRECAUTIONARY STATEMENTS Working with solvents such as acetone has a health risk. Therefore all work should be carried
out in well-ventilated conditions, preferably under a hood.
REFERENCES and FURTHER READING Aminot A, Rey F 2002. Chlorophyll a: determination by spectroscopic methods. ICES Tech.
Mar. Environ. Sci.,
Mantoura RFC, Jeffrey SW, Llewellyn CA, Claustre H, Morales CE. Comparison between
spectrophotometric, fluorometric and HPLC methods for chlorophyll analysis. Pp 361-380.
In phytoplankton pigments in oceanography. Eds SW Jeffrey, RFC Mantoura and SW
Wright. UNESCO Publishing 1997.
Jeffery SW, Humphrey GF 1975 new spectrophotopmetric equations for determining
chlorophylls a, b, c1 and c2 in higher plants, algae and natural phytoplankton. Biochem
Physiol Pflanzen. 167:191-194.
Porra RJ . A proven simultaneous equation assay for chlorophyll a and b using aqueous
acetone and similar assays for recalcitrant algae. In: Phytoplankton Pigments. Eds. S Roy,
CA Llewellyn, ES Egeland and G Johnsen Cambridge University Press. 2011.

315
SOP: 4.4.e Chlorophyll a (Chl a) Anneliese Ernste
eHochschule für Technik und Wirtschaft des Saarlandes, Göbenstraße 40, 66117 Saarbrücken, Germany
PURPOSE Like cyanobacteria, Nannochloropsis (Eustigmataceae) contains chlorophyll a only This
procedure is used to determine the content of chlorophyll a using a spectrophotometer. It is a
very fast method and a good indicator of algal (green) biomass, which is not disturbed by the
presence of bacteria.
PRINCIPLE Chlorophylls are extracted from microalgae using hot methanol (65°C).
REQUIREMENTS EQUIPMENT AND MATERIALS
x Automatic pipets of 100-1000 µL with tips
x Eppendorf reagent tubes (1.5 mL) or similar tubes with screwcaps and O-rings
(better!)
x Disposable semi-micro cuvettes (1 mL, 1 cm path length) and holding rack
x Timer
x Vortex
x Eppendorf table centrifuge (minifuge)
x Block heater with block fitting reagent tubes and extra block to prevent opening of
lids during heat treatment
x UV/VIS spectrophotometer (Hach-Lange DR2800)
REAGENTS
Methanol p.A.
HAZARDS AND PRECAUTIONARY STATEMENTS Methanol (liquid and vapor) is flammable, toxic if swallowed, inhaled and by contact with skin.
PROCEDURE

316
Heat block heater to 65 °C. Control temperature with thermometer and adjust if necessary.
Collect algal suspension from PBR. Pipette 1 mL (or less if cell suspension exhibits more than 1
g L-1 dry weight) in a reagent tube.
Sediment cells in a minifuge (10 000 rpm, 3 min)
Carefully remove supernatant (Remove only 500 µL of the supernatant and spin again, if cells
pellet at the side of the tube. The volume of the remaining pellet should not exceed 20 µL.
Re-suspend cells by vigorously shaking on a Vortex. Complete re-suspension of pellet in the
aqueous liquid is essential for the success of this method!
Add 1 mL methanol (note dilution factor!)
Close lid carefully (screw cap tightly) and mix.
Place tubes in block heater at 65°C and place a weight on top of the tubes to prevent accidental
opening of lids (65°C is the evaporation temperature of methanol)
Extract cells for 5 min at 65°C
Remove block and tubes from heater . Take care that Eppendorf tubes do not open accidentally
(no problem with screw-cap tubes)
Spin tubes in minifuge ( 3 min at 10000 rpm)
Examine pellet: it should be white homogeneously (or slightly blue in case of cyanobacteria).
Transfer clear supernatant in cuvette, Use methanol as blank. Read extinction of chlorophyll a
at 665 nm
CALCULATION OF RESULTS Based on an extinction coefficient of 74.5 l/(gChl*cm) reported by MacKinney 1941, the
concentration of Chl a [mg L-1] was calculated by multiplying the extinction (OD665) with 13.42
and the dilution factor.
2. However, more recent work at OMLC
(http://omlc.ogi.edu/spectra/PhotochemCAD/abs_html/chlorophyll-a) has suggested that
Mackinney’s extinction coefficients are too low. Using a normalized absorbance spectrum
reported by Du et al 1989, a molar extinction per cm light path at 665.00nm of 29864 was
reported. Conversion of the molar expression to mass of chlorophyll (MWChl 893.49 g/mol), an
extinction coefficient of 76.94 l/(gChl*cm) was calculated. In this case the concentration of Chl
[mg L-1] is calculated by multiplying the extinction (OD665) with 13.00 and the dilution factor.
QUALITY CONTROL If the pellet contains still dark green particles, try again with better vortexing (the extracted pellet
cannot be re-suspended).

317
ERRORS, CALIBRATION AND INTERFERENCES As the pigments are both photo- and heat-sensitive, the procedure should be finished rapidly.
Do not expose chlorophyll to direct sun light to avoid degradation.
Interferences – chlorophyll degradation products (chlorophyllides, pheophytin) can seriously
interfere with measurements of chlorophyll-a. If for example the algae are in a senescence
stage then the reading will not be accurate.
WASTE STREAM AND PROPER DISPOSAL x Collect all contents from centrifuge tubes and cuvettes that contain methanol and dispose
of it in the correct liquid waste stream disposal barrel for non-halogenated organic solvents.
x Rinse all cuvettes, tubes and caps with demineralized water, and dry.
REFERENCES x Mackinney, G. 1941. Absorption of light by chlorophyll solutions. J. Biol. Chem. 140: 315-
322.
x H. Du, R. A. Fuh, J. Li, A.Corkan, J. S. Lindsey, 1998. PhotochemCAD: A computer-aided
design and research tool in photochemistry and photobiology, Photochem. Photobiol. 68,
141-142.
x J. M. Dixon, M. Taniguchi, and J. S. Lindsey (2005) PhotochemCAD. A Computer-Aided
Design and Research Tool in Photochemistry and Photobiology," Photochem. Photobiol.
81, 212–213.

318
SOP: 4.5.d Analysis of total carotenoids using UV-Vis spectrophotometry Carole A. Llewellynd
dPlymouth Marine Laboratory, Prospect Place, The Hoe, Plymouth, PL13DH, UK PURPOSE This procedure is used to determine an estimate on total carotenoids using spectrophotometry.
PRINCIPLE A small volume of algal culture (approx. 10-20 mL depending on the density of the culture) is
filtered onto a glass fibre filter pad (GF/F) and extracted into organic solvent. The extract is
measured for absorbance at a wavelength optimum for carotenoid absorbance and a calculation
is performed to estimate carotenoid concentration in the extract. This is used to calculate
chlorophyll concentrations in the culture media, or in dry weight or per cell.
REQUIREMENTS EQUIPMENT AND MATERIALS
x Vacuum system (3-4 psi)
x Glass Fibre (Whatman GF/F type) (25 mm or 47 mm in diameter)
x Filter forceps
x 15 mL graduated glass centrifuge tubes
x 250 mL filter flask with sidearm
x Nalgene Tubing
x 200 mL volumetric flask
x (5) 100 mL volumetric flask
x Aluminum Foil
x Parafilm
x Spectrophotometer with a 2nm spectral bandwidth.
x Disposable glass pipets
x High purity grade acetone (1 L)
x De-ionised water

319
REAGENTS
90% (v/v) acetone: 900 mL of acetone in 1 L volumetric flask
HAZARDS AND PRECAUTIONARY STATEMENTS Working with solvents such as acetone has a health risk. Therefore all work should be carried
out in well-ventilated conditions, preferably under a hood.
PROCEDURE Filtration
x Carry out filtration within one hour of collection of the sample. Place a glass-fibre filter
(Whatman GF/F type, 25 mm or 47 mm in diameter) on the filter holder, using forceps.
x Gently mix the algal culture sample.
x Vacuum filter at < 50mm Hg
x Gently suck the last part of the algal culture through the filter.
x Take off the filter from holder. The filter is then folded once with the algae inside, blotted
gently with absorbent paper to remove excess media, and placed in a properly labelled
clean container.
Precautionary notes x If the samples are not filtered immediately after collection they can be kept for a few
hours in cold and dark storage, in a refrigerator or an ice bath. The time between
sampling and filtering must be as short as possible, and no longer than 24 hours.
x Filtration should be carried out under subdued light.
x Magnesium carbonate should not be used as a filter aid.
x All handling of the filters should be done using forceps.
x The filtration time should be kept as short as possible. Clogging of the filters should be
avoided.
x Check that the filtration funnels are well seated on the base, and be sure that the filters
(Whatman GF/F) are in place. Improperly placed filters or loose funnels will result in loss
of sample. The chlorophyll samples are volumetric and should sample loss occur,
replace the filter with a new one and redraw the sample.

320
Pigment Extraction x Carry out extraction by grinding the filters in a few mL of 90 % acetone in a glass
homogenizer with a motor-driven Teflon pestle, for 1 minute, in an ice bath and under
subdued light.
x After grinding, carefully transfer the extract to a stoppered and graduated centrifuge tube
rinse the glass homogenizer and the pestle with 90 % acetone and add rinsing volumes
to the centrifuge tube.
x Make up the extract volume in the centrifuge tube to exactly 10 mL 90 % acetone (i.e. 10
mL + dead volume of filter) and stopper the tube.
Precautionary notes x Soaking of the filters overnight is not recommended unless the extraction efficiency of
this procedure is thoroughly checked against grinding for the actual working conditions.
x If the extracts are not measured immediately after grinding, for instance, if the
measurements are done in batches, they can be kept tightly stoppered in cold and dark
storage for up to one hour.
Working with solvents such as acetone has a health risk. Therefore all work should be
carried out in well-ventilated conditions, preferably under a hood.
Measurement. Use a spectrophotometer of 2 nm maximum bandwidth and stoppered matched glass or quartz
cuvettes with path-length of 1 cm. A path-length of up to 5 cm can be used for dilute cultures.
Switch on spectrophotometer and leave to warm up for 45 min before using.
Transfer the sample extracts from the centrifuge tubes to the sample cuvette by careful
pipetting. Place in the sample cuvette holder. Pipette 90 % acetone (blank) into the reference
cuvette and place in the reference cuvette holder. Measure the absorbance of the sample
extract at 750, 664, 647, and 630 nm referenced against the blank. Rinse carefully and
thoroughly between samples.
Precautionary notes Use matched cuvettes and ensure the cuvettes are clean. Ensure correct cuvette holders
fitted.

321
CALCULATION OF RESULTS Total carotenoid = 7.6 (E480-E750) – 1.49 (E510-E750)*Ve/L*Vf with regard to class.
Total carotenoid = 4.0 (E480-E750)*Ve/L*Vf if predominantly chlorophytes or cyanobacteria
Total carotenoid = 10.0 (E480-E750)*Ve/L*Vf if predominantly dinoflagellates or cryptomonads
Where:
L = Cuvette light-path in centimetre.
Ve = Extraction volume in millilitre.
Vf = Filtered volume in litre.
Concentrations are in unit mg m−3. (= µg L-1).
If dry weight and cell numbers are known this can then be converted to µg chlorophyll g-1 dry
weight or pg chlorophyll cell-1.
QUALITY CONTROL x If the samples are not filtered immediately after collection they can be kept for a few
hours in cold and dark storage, in a refrigerator or an ice bath. The time between
sampling and filtering must be as short as possible and no longer than 24 hours.
ERRORS, CALIBRATION AND INTERFERENCES x As the pigments are both photo- and heat-sensitive, care to protect them from direct
sunlight and from warming must be taken at each step of the procedure.
x Storage of frozen filters at -18°c to -20°c is only acceptable for short periods (not
exceeding several weeks). Filters can be stored in liq N2 (-196°C) or at -80°C for up to
and over one year.
x Vacuum pressure: To avoid damaging cells during filtration, vacuum pressure should
be limited. While Jeffrey etal. (1997) mention keeping residual pressure under the filter
not lower than 0.5 bar, most users recommend that it be kept higher than 0.7 bar.
x Solvent choice. If acetone is used, it is strongly recommended to grind the filters
instead of sonicating or soaking overnight. In a glass homogeniser with a motor-driven
teflon pestle, complete disruption of the filter is obtained in about 1 minute. Extraction
time may be prolonged to 30–60 minutes after transfer into the centrifuge tubes kept
tightly closed and protected from heat and light.

322
WASTE STREAM AND PROPER DISPOSAL Dispose of acetone on appropriate container – not down the sink.
REFERENCES and FURTHER READING - Strickland and Parsons. Spectrophotometric Determination of chlorophylls and total
carotenoids. Pp. 185-206. In: A Practical Handbook of Seawater Analysis. Fisheries
Research Board of Ottawa. 1968.
- Phytoplankton Pigments. Eds. S Roy, CA Llewellyn, ES Egeland and G Johnsen Cambridge
University Press. 2011.

323
SOP: 4.6.a Carbon-Nitrogen Analysis Catherine Baylissa, Ian Tewa, Alla Silkinaa
aAlgal Research, Swansea University, Singleton Park, Swansea, SA28PP, UK PURPOSE To detail the protocol for analysing elemental carbon and nitrogen (and, by proxy, protein)
concentrations present in micro-algal samples.
PRINCIPLE Cellular carbon and nitrogen are determined though using an elemental analyser and an isotope
ratio mass spectrometer. Protein is determined from the cellular nitrogen content, with the
nitrogen amount being converted to protein amount.
REQUIREMENTS Equipment, materials and reagents
x ANNCA GSL elemental analyser (SerCon Ltd., Crewe, UK)
x 20-20 Isotope Ratio Mass Spectrometer (IRMS; PDZ-Europa, UK)
x Laminar flow hood (sterile)
x Tin foil disks (16 mm, Exeter Analytical, UK)
x Tin crucibles (8mm x 10 mm)
x 96 well plate (for holding tin capsules for standards)
x Hamilton syringes (covering 5 µL to 100 µL range)
x Glass fibre filter disks (13 mm A/E, Pall Corporation, NY, USA)
x 1.5 mL Eppendorf tubes
x Isoleucine (GC Standard grade) (C6H13NO2; Sigma I-2735)
x Ultrapure water
x For combustion columns within the GC-MS machine;
x Silica reaction tube (Code C1040, Elemental Microanalysis Ltd, Okehampton, Devon, UK)
x Silica sleeve insert, 15mm x 180mm, Europa (Code C1050, Elemental Microanalysis Ltd,
Okehampton, Devon, UK)
x Silver wool, very fine (Code B1119, Elemental Microanalysis Ltd, Okehampton, Devon,
UK)

324
x Silica/Quartz wool, very fine (Code B1017, Elemental Microanalysis Ltd, Okehampton,
Devon, UK)
x Chromium oxide (Code B1004, Elemental Microanalysis Ltd, Okehampton, Devon, UK)
x Chromium oxide, granular (Code B1004, Elemental Microanalysis Ltd, Okehampton,
Devon, UK)
x Copper wire, fine, reduced, (Code B1015, Elemental Microanalysis Ltd, Okehampton,
Devon, UK)
x Helium, compressed gas bottle
x Oxygen, compressed gas bottle
HAZARDS AND PRECAUTIONARY STATEMENTS
NOTE- The MSDS information mostly relates to the chemicals before use in the mass
spectrometer. ! Used reaction columns contain hazardous chemicals including the highly toxic
Chormium trioxide (the exact composition depends on the samples analysed) !
x Wear a laboratory coat, eye protection and gloves.
x For clean-up information or in cases of direct solvent contact please consult MS-DS
information. Some information is shown below.
x Chromium trioxide (combusted chromium oxide, brown/red colour) – TOXIC if swallowed or in contact with skin, FATAL if inhaled, causes severe skin burns and eye damage,
may cause allergic skin reaction, may cause allergy/asthma symptoms or breathing
difficulty, may cause genetic defects, cancer and fertility damage, causes organ damage
with prolonged exposure, very toxic to aquatic life with long lasting effects, strong oxidiser
that may cause fire/explosion.
x Chromium oxide – Avoid contact with skin (use gloves). In used reaction columns this
becomes hazardous and toxic Chromium trioxide.
x For Silver wool, Silica/Quartz wool and Copper wire, take care not to produce fine
particles that may be inhaled.
PROCEDURE Note: it is important to prevent dust or other contaminants from entering the samples or
standards during this analysis as with the small concentrations involved this could greatly affect

325
results. Bacteria would add extra carbon and nitrogen, but pieces of dust, which contain a larger
amount of carbon are more likely to cause problems in this analysis.
Preparation of solutions and materials
Glass ware should be cleaned if not visibly dirty by spraying with ethanol and rinsing in DI
water, then dried and cleaned in a furnace at 500°C. They then should be rinsed with clean
acetone prior to use and allowed to dry in a fume cupboard, covered with foil to prevent dust
contamination. Neutracon can be used to clean glassware, but must be completely rinsed off
with DI water before furnacing. Once clean, the glass petri dishes used for folding can be
cleaned between samples by wiping with aluminium foil.
The glass fibre filters need to be precombusted at 550 °C for 20 minutes.
Column preparation
A sleeve insert is required every 150-200 samples analysed. A combustion column is required
to be changed once the chromium oxide has oxidised (turned black) to about half the length of
the column. Remember the black chromium is now chromium trioxide and HIGHLY TOXIC, only
handle in a fume cupboard. A reduction tube is also changed once the copper has oxidised to
about half the length of the tube. A metal rod is used to pack the column, and must not be
handled even with gloves, only wipe using aluminium foil.
Combustion tube
• The combustion tube (C1041) was stood in a clamp in the fume cupboard.
• Add 1cm of Quartz wool (B1017) pushed gently to the bottom with a rod (do not pack
columns too tightly.)
• On top of this was packed 2cm of Silver wool (B1010) (cut from the reel by making a 45
degree cut with a razor blade and then teasing off the bits.)
• Add then another 1cm of quartz wool, it is important that nothing trails upwards from these
wads making gaps in the layers above.
• Add 14cm (use the ruler to measure this) of Chromium Oxide (B1004) on top of the
packing, tapping the column at the same time to pack the material down.
• Add another 1cm of quartz wool.
Sleeve insert

326
• A sleeve insert (C1050) had 0.5cm of quartz wool packed into the bottom (i.e. the end
away from the holes.)
• Add 1cm of chromium oxide on top of this.
• Add another 0.5cm of quartz wool on top of this.
Reduction tube
• The reduction tube (C1040) was stood in a clamp in the fume cupboard.
• Add 1cm of Quartz wool (B1017) pushed gently to the bottom with a rod (do not pack
columns too tightly.)
• Add reduced copper wire (B1015) packed using a funnel and flexible tube whilst tapping
the column to bed the particles down. It takes 2 and a bit packs of wire to fill it almost to
the top. Allow room for the 1cm Quartz wool without overlapping holes on the end of the
tube.
• Add 1cm of Quartz wool (B1017) pushed gently using the metal rod.
Preparation of standards and samples
Samples are taken by filtering a known volume of culture with a known biovolume (and/or
known weight of algal cells) onto pre-combusted glass fibre disks, under gravity. If needed they
can be briefly placed under vacuum (< 100 mm Hg) but if filtrate is not clear then a second
filtration would be needed. They are then placed into 1.5mL Eppendorf tubes and stored at -
20°C or -80°C until analysed; if there is a second filter it can be stored in the same tube. Two
disks are collected per sample.
Measurement of standards and samples
Standard 1. The isoleucine standard is prepared by dissolving 0.937g in 100 mL of ultrapure water to
give a stock of 1 µg N µL-1. The stock is frozen when not in use.
2. Tin capsules are arranged in a 96 well plate.
3. Standard ranging from 5 µL to 100 µL is pipetted into the tin capsules using Hamilton
Syringes. Note down in a notebook the position of each set of standards. The number of
standards depends on the number of samples, as standards are spread throughout the
samples with one of each standard ranging from 5-100 µL in each standard section. Four of
each standard should be enough.
4. The capsules are dried at 50°C for 12 hours or until dry.

327
5. The capsules are then flattened and folded keeping standard within the capsule.
Samples 10. Samples need to be taken from the freezer and dried with the lids open at 50°C for 12
hours. A piece of foil loosely placed over the samples should prevent contamination while
still allowing drying.
11. In a clean laminar flow hood, using gloves to prevent sample contamination, the filters are
folded within tin disks. This can be done by using a clean glass petri dish and clean
tweezers. This creates parcels of about 4mm by 4mm that fit into the auto sampler tray. If
the tin foil breaks or white filter is still visible, another tin disk can be used to wrap the
sample further. When there are two disks present for one filtration (i.e. in same Eppendorf
tube) they are wrapped together. Wrapped samples are kept in sealed tubes until analysis.
Blank pre-combusted filters are used as control blanks, and are also wrapped in tin.
12. Alternatively, 1mg of biomass can be weighed into tin crucibles (8mm x 4mm) and the tin
crucibles are carefully closed using clean tweezers, and wrapped to form small (c.a. 4mm x
4mm) cubes, and stored in Eppendorf tubes.
GC-MS Analysis - Overview 13. The samples are analysed using an elemental analyser. The samples are placed into the
carousel in the machine in a known order with standards and air blanks between each 10-
12 samples. The Isoleucine standards are spaced throughout the samples to correct for
any drift which may occur during the sample run. Air blanks are also spaced amongst the
samples to correct for any drift. Precise instructions are found in the SOP next to the
machine.
14. The samples and standards are then purged with Helium and dropped into a combustion
chamber with a short pulse of oxygen. The samples are combusted at 1000°C and the
gases are analysed using a mass spectrometer. This provides the total Nitrogen and total
Carbon content of the samples.
CALCULATION OF RESULTS The results are correct for drift by using the air blanks as a check of drift. The difference
between two air blanks is divided by the number of samples between and then added to each
sample between those two air blanks.
The standards are plotted on a graph (in Excel or similar), the beam area (x-axis) against the
standards known amount of Nitrogen or carbon (y-axis). The equation of the trend-line for

328
carbon and nitrogen is used to correct for small variation in the readings. The cellular carbon
and nitrogen content of each sample is then known. If using filters this then needs to be divided
by the mL on each filter to get Carbon or Nitrogen per mL of culture.
In order to calculate the protein content the total Nitrogen is multiplied by 6.25 which is a
standard multiplication factor when calculating protein from Nitrogen content (Jones 1931). This
provides the protein content of the sample which can then be altered to provide an amount per
mg etc. However the standard value of 6.25 should be checked against literature as a more
exact multiplication factor for the species in question may have been identified.
QUALITY CONTROL Air blanks are added throughout the run to ensure that the drift of the machine can be analysed
and corrected for. Blanks are also used from empty filters to check that the filters and the
process is free of dust/contamination affecting results.
Every sample is duplicated to counter variation in readings and problems during the analysis.
Any dust present in the samples will severely alter the carbon results from the analysis, and
should be avoided at all steps in sample preparation and collection.
WASTE STREAM AND PROPER DISPOSAL All chemicals need to be disposed of according to local regulations and protocols. Place waste
chemicals into a waste chemical bottle for collection and proper disposal.
REFERENCES
Jones, D.B. (1931) Factors for converting percentages of nitrogen in foods and feeds into
percentages of protein. United States Department of Agriculture, Washington, 22nd Ed.,
p. 1-21
Tew, I. (2011) Analysis of filters for CN. Swansea University, Dept. Biology in-house protocol for GCMS use.
OTHER POINTS If samples are stored in a plastic container then they will become statically charged. This may
cause difficulties when biomass is removed from the tubes for weighing. This is a bigger
problem when weighing into small tin capsules for this analysis, and makes the filter method
more accurate.

329
SOP: 4.6.a Phosphorous Analysis Catherine Baylissa, Alla Silkinaa
aAlgal Research, Swansea University, Singleton Park, Swansea, SA28PP, UK
PURPOSE To determine the elemental phosphorous content of microalgal cells.
PRINCIPLE Pre-combusted glass filters containing a known volume of algal cells (at a known cell
concentration) are first digested using an acidic persulfate method. This converts organic
phosphorous to orthophosphate, which is then measured spectrophotmetrically using a
phospho-molybdate assay at 880 nm (Murphy and Riley 1962).
REQUIREMENTS
Equipment, materials and reagents
x Ammonium molybdate tartrate (ACS grade, Sigma Aldrich)
x Potassium persulfate (ACS grade, Sigma Aldrich)
x L-Ascorbic acid (ACS grade, Sigma Aldrich)
x Potassium antimonyl tartrate (ACS grade, Sigma Aldrich)
x Potassium dihydrogen phosphate (Potassium monobasic) (KH2PO4) (ACS grade,
Sigma Aldrich)
x Sulphuric acid, concentrated (laboratory/ACS grade, Sigma Aldrich)
x Glass fibre filter disks (13 mm A/E, Pall Corporation, NY, USA)
x Pre-scored glass ampoules, 5 mL (Sigma Aldrich Code Z184977)
x 1.5 mL Eppendorf tubes
x 96 well plate for spectrophotometric use
x Spectrophotometer (capable of reading at 880 nm).
x Acid resistant cuvette or acid resistant 96 well plate depending on
spectrophotometer type.
x Bunsen burner
x Tweezers – able to hold ampoule neck when softened
x Autoclave
x Centrifuge (Beckman Microfuge E, Cat No. 348720)

330
x Milli-Q water
HAZARDS AND PRECAUTIONARY STATEMENTS
x Wear a laboratory coat, eye protection and gloves (nitrile). When handling concentrated
sulphuric acid double glove with nitrile gloves and use thick rubber gloves on top.
x All dispensing, pipetting, evaporation and disposal of solvents and acids should take
place in a fume cupboard with the splash shield as low as possible.
x Any waste chemicals need to be disposed of in an appropriate container that clearly
states what is contained. Further processing depends on local protocols.
x For clean-up information or in cases of direct chemical contact please consult MS-DS
information. Some important information is shown below.
x Sulphuric acid, concentrated – Corrosive, causes severe skin and eye burns.
x Potassium persulfate – Harmful if swallowed, causes serious eye irritation, causes skin
irritation, may cause an allergic reaction, may cause allergy/asthma symptoms or
breathing difficulties if inhaled, may cause respiratory irritation, oxidiser-may intensify
fire.
x Potassium antimonyl tartrate – Harmful if swallowed, harmful if inhaled, toxic to aquatic
life with long lasting effects.
x Ammonium molybdate tartrate tetrahydrate – Mild eye irritant.
x Both the flame and heated glass pose a hazard, care should be taken when handling
either.
x When sealing the vials the glass may shatter, and it may be advisable when using this
protocol for it to take place in a fume cupboard with the splash shield down to contain
any glass shards that may be produced, and enable easier complete clean-up of glass
afterward.
x All chemicals are incompatible with strong oxidisers, as well as the following; Sulphuric
acid is incompatible with combustible material, bases, organic material, reducing agents,
peroxides and violently incompatible with powdered metals and nitroaryl amines.
Potassium antimony tartrate is incompatible with mineral acids, strong bases,
carbonates and silver & lead salts. Ammonium molybdate is incompatible with strong
acids. Potassium persulfate is incompatible with organic materials, acids, strong

331
reducing agents, powdered metals, strong bases, alcohols, phosphorous, anhydrides
and halogens.
PROCEDURE Preparation of solutions and materials
Persulfate digestion reagent
0.015M Potassium peroxodisulfate (K2S2O6) and 0.018M Sulphuric acid (H2SO4) solution.
Needs to be prepared daily.
4.0548 g L-1 potassium peroxodisulfate (1.0137 g in 250 mL)
0.98 mL sulphuric acid in 1 L (0.245 mL in 250mL)
Mixed molybdenum reagent
The following solutions need to be made using the purest water possible, preferably ultrapure
water if available.
1. Sulphuric acid, 140 mL concentrate L-1
Made on the day of analysis.
2. Ascorbic acid, 54 g L-1
Freeze in 100 mL portions. Thaw for use and refreeze immediately.
3. Potassium antimony tartrate, 1.36 g L-1
Stable for 3 months.
4. Ammonium molybdate, 30 g L-1
Can be stored in a brown polyethylene bottle, and is stable indefinitely until a precipitate begins
to form.
To make the final solution, the reagents are combined in the following order. 25 mL sulphuric
acid (solution 1), 10 mL ascorbic acid (solution 2), 5 mL potassium antimony tartrate (solution
3), 10 mL ammonium molybdate (solution 4). It should be created just before being used, and
should be a yellow colour. A smaller amount of reagent may be created by decreasing the
volumes used, but the relative proportions must remain the same (e.g. 2.5mL, 1mL, 0.5mL and
1mL respectively).

332
Cleaning
Glassware can be cleaned using a 5% sulphuric acid solution soak, rinsing with ultrapure water
and drying. Any soap residue will interfere with the phosphate analysis and should not be used.
Phosphate analysis glassware should only be used for this purpose, and kept with 5% sulphuric
acid solution when not in use. Glass ampoules should not need to be cleaned, and should be
free of phosphorous. They can be tested before the analysis to ensure this is the case (by
performing the assay with empty vials, steps 9-10 of sample analysis and 1 mL of ultrapure
water). If needed to be cleaned, they should be soaked in 5% sulphuric acid solution, then
rinsed and dried.
Preparation of standards and samples Samples
Samples are collected on pre-combusted glass filter disks. A known volume of culture
containing a known volume/number of cells is filtered onto the disks in a laminar flow hood. This
is often accompanied by collection of filter disk samples for elemental analysis. Two filters are
collected for phosphate analysis for each data point. Samples are frozen at -80°C if possible, or
at -20°C otherwise.
Samples are removed from the freezer and dried beforehand to remove moisture in the filters.
This can be done by placing them in a cool oven overnight, no higher than 50°C to prevent
changes in biochemical composition. Once dry they can be stored for up to one week, but
ideally would be analysed as soon as they are at room temperature after drying. Once dried
they can be placed into a sealable (ziplock) plastic bag and put back into the -80°C freezer.
When taken out they should be brought to room temperature before being removed from the
bag, so that any surface ice formation occurs on the bag, not on the sample eppendorfs.
Standards
A stock standard solution is made up from potassium dihydrogen phosphate (0.1361g L-1) in
ultrapure water, resulting in a 1000 µM solution. It should be stored at no higher than -4°C and
is stable for 3 months. Storage in 1mL portions allows easier thawing when required.
Measurement of standards and samples Standard Curve 1. From the stock solution a standard curve of the range 0-30 µM is created by diluting the
stock solution in ultrapure water (Table 1.). 100 mL volumetric flasks can be used for this,
and it must be prepared freshly weekly if kept in a fridge. Portions of slightly more than 1mL

333
can be frozen at -20°C, of each standard, and then removed thawed and used immediately
as required.
2.
µM P stock solution
mL Stock solution in 100 mL
0 0 1 0.1
2.5 0.25 5 0.5 10 1 15 1.5 20 2 30 3
Table 1. Stock solution for Phosphorous standards 3. Two replicates of 1mL of each standard are added to a 1.5 mL Eppendorf (separate
Eppendorf’s for each).
4. The same assay is then used as for the samples. 0.1 mL of the mixed reagent is added
each Eppendorf and shaken for 30 seconds. 300 µL of each sample is then transferred to a
96 well plate and read in a plate reader, or each sample is transferred to a quartz cuvette
and read in a spectrophotometer.
5. The absorbance values are then plotted against standard concentration to give the
standard curve (see calculation of results).
Sample Analysis 6. Samples (filters) are placed into pre-scored ampoules (5 mL).
7. 4 mL of the Persulfate digestion reagent is added to each ampoule. Blank filter disks are
also digested and used as blanks.
8. Ampoules are then heated at the neck and pulled to create a hermetically sealed vessel.
9. The ampoules are then autoclaved at 121°C for 75 minutes.
10. The ampoules are left to cool to room temperature.
11. The neck of each ampoule is carefully broken.
12. Two portions of 1 mL from each ampoule are transferred to a separate, clean Eppendorf
tube. This results in two eppendorfs with 1 mL in each from a single ampoule.
13. The Eppendorf tubes are then centrifuged for 10 minutes at 12,535g.
14. 100 µL of the mixed molybdenum reagent is added to each Eppendorf tube. They are then
shaken for 30 seconds.

334
15. 300 µL from each Eppendorf is transferred to a 96 well-plate and read in a
spectrophotometer at 880 nm. Alternatively, a quartz cuvette can be used in a
spectrophotometer as long as the volume of the cuvette is > 1mL.
CALCULATION OF RESULTS The reading of the blanks in the spectrophotometer is removed from all other readings to give a
blank-corrected reading. The results are averaged.
The standard curve is generated by plotting absorbance on the x-axis, and phosphorous
concentration on the y-axis. This gives an equation of the form y = Ax + B. The R2 value should
be more than 0.95, though above 0.99 is better. Inputting the absorbance as x gives the sample
phosphorous as compared to the standard curve.
QUALITY CONTROL Standards should produce a linear graph when plotted, with an R2 ideally above 0.95.
Each sample is read in the spectrophotometer three times to identify any variance of readings,
and the average absorbance value used where no great variance is found.
ERRORS AND INTERFERENCES Every sample should be duplicated, or triplicated where sample volume permits, to counter
variation in readings.
WASTE STREAM AND PROPER DISPOSAL All chemicals need to be disposed of according to local regulations and protocols. Placing waste
chemicals into a waste chemical bottle for collection and proper disposal. REFERENCES Murphy, J., Riley, J.P., 1962. A modified single solution method for the determination of
phosphate in natural waters. Anal. Chim. Acta 27: 31 – 36.
Strickland, J.D.H., Parsons, T.R., 1968. Determination of reactive phosphorus, in: Strickland,
J.D.H., Parsons, T.R. (Eds.), A Practical Handbook of Sewater Analysis. Fishers
Research Board Of Canada, Ottawa, pp. 49–56.

335
OTHER POINTS When pulling the glass, it is important to wait until the glass is red, and pull more than twist,
removing vial and not tweezers from the flame, or both removed from flame equally to get a
clean closure.
Chemicals used at Swansea University from Sigma Aldrich.

336
SOP: 4.6.d Carbon-Nitrogen Analysis Carole A. Llewellynd dPlymouth Marine Laboratory, Prospect Place, The Hoe, Plymouth, PL13DH, UK
PURPOSE To detail the protocol for analysing particulate carbon and nitrogen concentrations present in
microalgal samples.
PRINCIPLE Cellular carbon and nitrogen are determined though using an elemental analyser. REQUIREMENTS
Equipment, materials and reagents
x Thermo Finnegan Flash EA1112 elemental analyser
x Prepacked NCH/NC Reaction Tube (OEA LABORATORIES LTD)
x Vacuum Filtration equipment
x Microbalance (Cahn)
x Laminar flow hood (sterile)
x Tin Capsules, Pressed, Std Clean, 6 x 4mm (OEA LABORATORIES LTD)
x Tin Discs, Std Clean, 30mm diameter
x X 96 well plate (one for holding tin capsules for standards and other for samples and
standards)
x Glass fibre filter disks (25mm GF/F Whatman or equivalent)
x Acetinilide reference standard (OEA LABORATORIES LTD)
x Ultrapure water
x Eppendorf pipette (500µL)
HAZARDS AND PRECAUTIONARY STATEMENTS x Wear a laboratory coat, eye protection and gloves (nitrile).
x For clean-up information or in cases of direct solvent contact please consult MS-DS
information.
PROCEDURE

337
Note: it is important to prevent dust or other contaminants from entering the samples or
standards during this analysis as with the small concentrations involved this could greatly affect
results. Bacteria would add extra carbon and nitrogen, but pieces of dust, which contain a larger
amount of carbon are more likely to cause problems in this analysis.
i) Preparation of solutions and materials
Glassware should be cleaned if not visibly dirty by spraying with ethanol and rinsing in DI water,
then dried and cleaned in a furnace at 500°C if possible. Neutracon can be used to clean
glassware, but must be completely rinsed off with DI water. Once clean, the glass petri dishes
used for folding can be cleaned between samples by wiping with foil.
The glass fibre filters and aluminium foil needs to be precombusted (ashed) at 450 °C for 12
hours.
j) Preparation of standards and samples
Samples are taken by filtering a known volume of culture (typically 10-50ml) onto the
precombusted GF/F disks, using gentle vacuum filtration (< 50 mm Hg). Samples should be
rinsed after filtration with isotonic saline to remove traces of soluble carbon in the media.
Samples are then typically stored at -20°C until analysis until there are enough samples for at
least one run on the CHN analyser. Prior to analysis GF/F sample filters are dried (12h at 60°C)
and transferred to ashed aluminium discs (30mm) and crimped to produce pellets (2mm)
diameter. Three disks are collected per sample. Avoid contamination from dust and by contact
through touching with hands (preferably done in a laminar fume hood).
For POC samples are dried and then acidified with 400µl of sulphurous acid to remove
inorganic carbon (Verada et al 1990). Samples are again dried and crimped into pellets.
Sampels can be stored in a covered well plate kept in a desiccator. Blank pre-combusted filters
are used as control blanks, and are also wrapped in tin.
Alternatively, 1mg of dried biomass can be weighed into tin crucibles (8mm x 4mm) and the tin
crucibles are carefully closed using clean tweezers, and wrapped to form small (c.a. 4mm x
4mm) cubes, and stored in a covered well plate.
Standards Weigh out a series of four acetanilide standards containing approximately 35, 100, 150 and 200
µg-C. Run this series of standards at the beginning, middle and end of a run.

338
Elemental Analysis 1. The samples are placed into the carousel in the machine in a known order with
standards and air blanks between each 10-12 samples. The series of acetanilide
standards are spaced throughout the samples to correct for any drift which may occur
during the sample run. Air blanks are also spaced amongst the samples to correct for
any drift.
2. Put in new column LHS (grease bottom of column for a good seal) and make sure
scrubber is dry RHS, (blue) if not replace with new magnesium perchlorate and glass
wool.
3. Turn on instrument and gases, Helium CP size L at 2.5bar, Ultra pure Oxygen at 3 bar
4. Open up Day Folders and create new date, yearmonthday eg. 140612. Open last run
samples and copy over method, conditions and standby conditions
5. Open EA1112 #1, File, load method, send. Once the instrument has got to correct
temperatures (about 30 minutes) do a leak test. ( View elemental analysis, special
functions, leak-test.)
6. In the meantime fill out sample list. Standards first and then leave a gap then rest of
samples. In the sample table a gap in the lines gives time to check standards before
putting actual samples on. To check calibration go to view, calibration curve. You may
need to reintegrate areas. View, view chromatograms, load chromatogram. Place arrow
under peak, peak, eg. move peak start. Once happy with reintegration then show, peak
data and record area of peak. Save chromatogram.
7. Have sample tray on ‘0’ and put samples in the sample tray (1-31), when ready manually
turn sampler tray to number ‘1’ and press Green arrow( starts sequence of analysis),
set to standby after run.
8. Have a gap in sample table after standards and after 31 samples this will allow you to
make sure all have been analysed and then you can load up next 31 samples, when you
know it is the last run then press green arrow and set instrument to standby this will
keep column in a good condition and will allow it to be used again. Always check the
chromatography of sample running if not good then stop sequence and rescue the rest
of samples!
9. In sample table, type is Std or Unk for unknown. For Std the standard name is
Acetanilide and weight is mg weighed out eg. 234 to 1000. For Unk weight is ‘1’
10. The samples and standards are then purged with Helium and dropped into a combustion
chamber with a short pulse of oxygen. The samples are combusted at 1000°C and the

339
gases are analysed. This provides the peak areas for nitrogen and carbon content of the
standards and samples.
CALCULATION OF RESULTS The results are correct for drift by using the air blanks as a check of drift.
The standards are plotted on a graph (in Excel or similar). The equation of the trend-line for
carbon and nitrogen is used to correct for small variation in the readings.
The following equation can be used to compute the carbon content of samples:
ACOR = ATOT- ABL
Mc = (ACOR) X (S)
%C = (Mc + Ms) + 10,
Where:
ACOR is corrected area counts of sample,
ATOT is area counts of sample,
ABL is area counts of blank,
Mc is mass of carbon in µg, S is slope of the standard calibration curve,
Ms is mass of sample in mg and %C is weight percent organic carbon.
(Note that nitrogen analyses are similar but require no blank correction.)
Inorganic (carbonate) carbon can be derived from the difference between total carbon and
organic carbon. Percent calcium carbonate is then calculated as [8.33 x (TC - Corg)].
QUALITY CONTROL Air blanks are added throughout the run to ensure that the drift of the machine can be analysed
and corrected for. Blanks are also used from empty filters to check that the filters and the
process is free of dust and contamination.
ERRORS AND INTERFERENCES
1. The analyses are only as good as the sample preparations, all the samples should be
rinsed after filtration with isotonic saline to remove traces of soluble carbon in the
media.
2. All filters and packaging materials and presses for packaging need to be combusted
prior to use to remove all traces of impurities. If using dessicators for the acidification
step, these need to be cleaned as well prior to use.

340
3. Blanks should be prepared using filtered media of the same type as the samples.
4. From time to time an interlab calibration exercise is worthwhile.
WASTE STREAM AND PROPER DISPOSAL All chemicals need to be disposed of according to local regulations and protocols. Place waste
chemicals into a waste chemical bottle for collection and proper disposal.
Ensure columns are carefully handled as contain chromium dioxide and are put into a labelled
box in the chemical store.
REFERENCES Hilton, J., Lishman, J. P., Mackness, S., Heaney, S. I., 1986. An automated method for the
analysis of particulate carbon and nitrogen in natural waters. Hydrobiologica 141, 269 – 271.
Verardo, D. J., Froelich, P. N., McIntyre, A., 1990. Determination of organic carbon and
nitrogen in marine sediments using the Carlo Erba NA-1500 analyzer. Deep-Sea Research I
37, 157 – 165.
OTHER POINTS Standards and samples once prepared can be left in the 60°C oven until analysis.
For POC rather than using sulphurous acid, samples can be acidified in large container with a
petri dish of fuming hydrochloric acid and a beaker of dessicant, place lid on container to seal
and leave in fume hood overnight.
All consumables are bought from OEA laboratories limited, Unit B7, Florence road Business
Park, Kelly bray, Callington, Cornwall, PL17 8EX, Tel. 01579 384174, Fax 01759 384174,
email: [email protected] website: www.oealabs.com

341
SOP: 4.7.a Total FAME Analysis Catherine Baylissa, Alla Silkinaa
aAlgal Research, Swansea University, Singleton Park, Swansea, SA28PP, UK
PURPOSE To detail the protocol for trans-esterification of lipid extracts and quantification of resultant
FAMEs.
PRINCIPLE Trans-esterification of total lipid extracts to FAME and then extraction by hexane before it is
dried under nitrogen for gravimetrical determination of FAME. FAME extracts are then
characterised by gas chromatography analysis against a known internal standard.
REQUIREMENTS
Equipment, materials and reagents
x Glass vials (8mL) containing lipid extracts (samples)
x Glass vials (5 vials) (8mL), pre-combusted, for standards
x Glass vials (4mL) pre-combusted, for hexane extract of samples
x Heater block
x Glass Pasteur pipettes
x Pasteur Pipette roller
x Pre-combusted tin foil weighing boats
x GC autosampler vials (at Swansea University, Screw cap, PTFE/silicone/PTFE
septa, 5182-0723, Agilent, 2mL)
x GC-Flame Ionised Detector (FID) (at Swansea University, Agilent 6890N, HP-
INNOWAX column, 30 m length, 0.32 mm i.d., 0.25 μm film; 19091N-113; Agilent,
USA)
x Hexane (laboratory grade)
x Hexane (GC grade)
x Methyl heptadecanoate (C17) (GC grade)
x 5 even carbon FAMEs standard - FAME mix GLC-10 (Sigma #1891-1AMP)
x 5 odd carbon FAMEs standard - FAME mix GLC-90 (Sigma #1896-1AMP)
x Methanol (laboratory grade)

342
x HCl (laboratory grade)
x Butylated hydroxytoluene (laboratory grade)
HAZARDS AND PRECAUTIONARY STATEMENTS
x Wear a laboratory coat, eye protection and gloves (nitrile).
x All dispensing, pipetting, evaporation and disposal of solvents should take place in a fume
cupboard with the splash shield as low as possible.
x Any waste solvents need to be disposed of in an appropriate container that clearly states
it contains chlorinated waste solvents. Further processing
x For clean-up information or in cases of direct solvent contact please consult MS-DS
information. Main hazards are noted below.
x Hexane hazards – Highly flammable liquid and vapour, may be fatal is swallowed and
enters airways, causes skin irritation, may cause drowsiness or dizziness, causes damage
to organs through prolonged or repeat exposure, toxic to aquatic life with long lasting
effects.
x Methanol – Highly flammable liquid and vapour, toxic if swallowed, toxic in contact with
skin or if inhaled, causes damage to organs.
x HCl – Corrosive, irritant.
x Butylated hydroxutoluene – Very toxic to aquatic life with long lasting effects.
x Methyl hepdecanoate – no hazards listed.
x GLC-10 FAME mix, GLC-90 FAME mix – corrosive, causes serious eye damage.
x Compressed gas – Keep gas cylinder well maintained, regulator attached/altered by a
trained person.
x Neutrcon – As it is a strong detergent it should not be ingested, inhaled or come into direct
contact with skin or eyes.
PROCEDURE
Preparation of solutions and materials Trans-esterification mix
HCl 5% v/v in methanol, to which 1 % w/v butylated hydroxytoluene is added.
For 50 mL (c.a. 66 samples)
343
47.5 mL Methanol
2.5 mL HCl
0.05 g butylated hydroxytoluene
Glass vials need to be soaked in Neutracon detergent (1%), then dried and placed in a
furnace at 500°C. Then cooled to room temperature and placed in a desiccator with
Neutracon cleaned Teflon-coated caps.
Preparation of standards and samples
Internal Standard For approx. 50 samples. Prepare freshly before analysis.
25 mg methyl heptadecanoate (C17) dissolved in
50 mL methanol
Yields 500 µg mL-1 concentration. 0.5 mL is added to sample giving concentration of 250 ug mL-
1.
External standard (for GC quantification) Prepared from the 5 even FAMEs mix and 5 odd FAMEs mix.
Weigh out 4 mg of GLC-10 and 4 mg GLC-90 onto pre-combusted tin foil boats and
decant into a single pre-combusted 8 mL vial. Dissolve in 4 mL GC-grade hexane to make 4 mL
of 2 mg mL-1 standard (Std 1).
Perform a serial dilution of 0.5, i.e. transfer 2 mL of Std. 1 to another pre-combusted vial
and add a further 2 mL GC-grade hexane to make Std. 2 (1 mg mL-1). Repeat three more times
to generate standards of 0.5, 0.25 and 0.125 mg/mL. Approximately 0.5 mL of each standard is
needed, in triplicate so there should be enough standard for each GC vial.
Samples Samples are obtained after total lipid quantification has occurred, and are kept in glass vials (8
mL) in the fridge for a short wait or in a -80°C freezer, wrapped in foil to be protected from light.
These must then be brought to room temperature, and then placed in a desiccator before
analysis begins.
Before lipid analysis samples of biomass are freeze dried and then ground to a powder using a
pestle and mortar or similar equipment. This is then kept in a -80°C freezer. Before use,
samples are removed from the freezer, allowed to warm to room temperature then placed in a

344
desiccator to remove any water and prevent samples hydrating (which would affect sample
weight during weighing).
Measurement of standards and samples Samples and standards
1. Add 0.5 mL of internal standard to the sample. This gives 250 ug mL-1 concentration of
internal standard at this stage.
2. Add 1 mL of the trans-esterification mix to the vial.
3. Ensure vials are closed.
4. Heat to 90°C for 90 minutes. Then allow to cool to room temperature.
5. The glass vials are pre-weighed for the next step.
6. FAMEs are extracted by addition of 2 mL of hexane and then mixing.
7. The layers are then allowed to partition for one hour. The hexane (top layer) is then
pipetted into a pre-weighed glass vial.
8. An additional 2 mL of hexane is then added to repeat the extraction with both fractions
being combined in the glass vial
9. The hexane extracts containing FAMEs are then dried under nitrogen and weighed to
give a gravimetric measure of FAME (mg/mg).
10. Prior to GC analysis, GC grade hexane is used to re-suspend the FAME. 200µL of GC-
grade hexane is added to each vial (this is the size of the sample pots).
11. Samples are then transferred to a GC vial. The internal standard has already been
added at this point, and allows extraction efficiency to be measured and loss of FAME
during hexane extraction to be corrected for. All FAME concentrations can be
normalised against the internal standard.
12. A calibration curve is created using the external standard mix at 0.125, 0.25, 0.5, 1 and 2
mg mL-1. Individual FAME concentrations quantified by the GC software were
normalised against the internal standard of C-17 FAME (include dilution of sample when
working out concentration of internal standard, typically 0.25 so 125 ug mL-1 standard).
CALCULATION OF RESULTS The external FAME standard in the GC produces a graph of FAME concentration (mg mL-1)
against total peak area and produces an equation of y=RFx + c where y is mg/mL and x is
peak area. Total FAME (mg/mL) can then be converted to mg/mg by multiplying by dilution
factor and then dividing by the weight of the original sample (mg) to give % in mg/mg.
Contribution of each individual FAME to the total can then be calculated as a percentage of total
and converted to mg/mg.

345
mg mg-1 (%) = (FAME concentration (mg mL-1) / dilution factor) / weight of sample (mg)
QUALITY CONTROL Internal standard is there to provide a measure of extraction and trans-esterification efficiency
which can then be used to correct results from less than optimal extractions.
ERRORS AND INTERFERENCES Every sample should be duplicated, or triplicated where sample volume permits, to counter
variation in readings.
WASTE STREAM AND PROPER DISPOSAL All chemicals need to be disposed of according to local regulations and protocols. Waste
chemicals generally need to be placed into a waste chemical bottle for collection and proper
disposal.
REFERENCES Laurens, L.M.L, Quinn, M., Van Wychen, S., Templeton, D.W. & Wolfrum, E.J. (2012) Accurate
and reliable quantification of total microalgal fuel potential as fatty acid methyl esters by in situ transesterification. Anal. Bioanal. Chem, 403: 167-178.
Folch, J., Lees, M., Sloane-Stanley & G.H. (1957) A simple method for the isolation and
purification of total lipids from animal tissues. J. Biol. Chem. 226:497–509
OTHER POINTS If samples are stored in a plastic container then they will become statically charged. This may
cause difficulties when biomass is removed from the tubes for weighing.

346
SOP: 4.7.c Total FAME Analysis Matthew P. Daveyc, Louiza Normanc, Alex Jamiesonc
cDepartment of Plant Sciences, University of Cambridge, Downing Street, Cambridge CB2 3EA, UK PURPOSE
To detail the protocol for trans-esterification of lipid extracts and quantification of resultant
FAMEs.
Principle
Trans-esterification of total lipid extracts to FAME and then extraction by hexane before it is
dried under nitrogen and resuspended with heptane. FAME extracts are then characterised
by gas chromatography analysis against known standards.
Requirements
Equipment, materials and reagents
Screw capped (with Teflon seal) Kimble tubes (Kimbell HS 30 mL No. 45600-30) Centrifuge to hold kimble tubes with rubber outer sleeve Deionised water Hexane Heptane methanol with 2.5% (v/v) H2SO4 water bath heated to 60 °C Genevac solvent evaporator with N2 gas Glass Pasteur pipettes 30 ml test tubes (Schott-Duran, 30 ml, from VWR) Glass micro-syringe GC sample vials (glass) with inserts to hold 300 µL solvent -80 °C freezer Gas chromatography unit (Thermo Scientific Trace GC Ultra) with a Zebron ZB-Wax Capillary GC column (30 m x 0.25 mm, 0.25 µm film thickness, Phenomenex, UK) or FFAP column. Use FID or MS for detection.. FAME standard mix (Grain Fatty Acid Methyl Ester Mix, Sigma-Aldrich, cat no. 47801) and identified and quantified using standard curves from individual reference compounds C16:0, C18:0, C18:1, C18:2 and C18:3 methyl esters (Sigma chemicals)
Hazards and precautionary statements

347
Wear a laboratory coat, eye protection and gloves (nitrile).
All dispensing, pipetting, evaporation and disposal of solvents MUST take place in a fume
cupboard with the splash shield as low as possible. YOU ARE USING HEATED METHANOL
WITH SULPHURIC AClD IN IT – USE COMMON SENSE
Any waste solvents need to be disposed of in an appropriate container
For clean-up information or in cases of direct solvent contact please consult MS-DS information.
Main hazards are noted below.
Hexane hazards – Highly flammable liquid and vapour, may be fatal is swallowed and enters
airways, causes skin irritation, may cause drowsiness or dizziness, causes damage to organs
through prolonged or repeat exposure, toxic to aquatic life with long lasting effects.
Methanol – Highly flammable liquid and vapour, toxic if swallowed, toxic in contact with skin or if
inhaled, causes damage to organs.
H2SO4 – Corrosive, irritant.
FAME (mix and individual) – corrosive, causes serious eye damage.
Compressed gas – Keep gas cylinder well maintained, regulator attached/altered by a trained
person.
Procedure
Preparation of solutions and materials
Trans-esterification mix
H2SO4 2.5% v/v in methanol
For 1 L stock
975 mL Methanol
25 mL H2SO4
Preparation of standards and samples
Internal Standard You will have a C15:0 standard from your metabolite extraction, this will be converted to
C15:0 methyl ester, so you can use this as an internal standard.
External standard (for GC quantification) Weigh out 2 mg of C16:0 methyl ester (me), C16:1me, C18:0me, C18:1me,
C18:2me and C18:3me and dissolve in 1 mL GC-grade hexane to make 2
mg/mL standard (Std 1).

348
Perform a serial dilution, i.e. transfer 0.5 mL of Std. 1 to another vial and add a
further 0.5 mL GC-grade hexane to make Std. 2 (1 mg/mL). Repeat four more
times to generate standards of 0.5, 0.25, 0.125 and 0.0625 mg/mL.
Prepare the FAME mix by making a 1mg ml dilution from the bought standard
mix (Grain Fatty Acid Methyl Ester Mix, Sigma-Aldrich, cat no. 47801)
Samples Samples are obtained after total lipid extraction (see separate lipid extraction SOP) has occurred,
these will usually be stored in a -80°C freezer.
Measurement of standards and samples Samples and standards (all in a fume hood with lab coat, gloves and goggles)
Add 15 µL of sample to a 30 mL screw cap kimble tube (sample volume used depends on
sample, some people have to use 50 µL, 75 µL or 100 µL, is concentration of FAME is presumed
to be low).
Add 3 mL of the Methanol: H2SO4 trans-esterification mix to the kimble tube and carefully vortex.
Ensure kimble tubes are firmly closed.
Place in a pre-heated (60 °C) water bath and heat for four hours. Then allow to cool to room
temperature (about 5 minutes).
The reaction is quenched by adding 3 mL of deionised water followed by 3 mL of hexane,
followed by careful vortexing. Ensure the kimble tubes are firmly closed.
Phase separation is achieved by centrifugation at 2000 g (20 ºC) for 3 min. Kimble tubes should
be placed in a rubber sleeve before centrifugation to avoid breakage.
The upper hexane phase which contains FAMEs is transferred to a 30 mL test tube (Schott-Duran, 30 mL, from VWR) The lower phase is re-extracted with 3 mL of hexane, centrifuged and the upper hexane phase
combined with the previous hexane phase in the 30 mL test tubes.
Hexane is removed using a solvent evaporator (GeneVac EZ-2, SP Scientific, Ipswich, UK) and
the esters resuspended in 120µL n-heptane.
Samples are then transferred to a GC vial with 300 µL insert. The internal standard has already
been added at this point, and allows extraction efficiency to be measured and loss of FAME
during hexane extraction to be corrected for. All FAME concentrations can be normalised against
the C15:0 internal standard.
A calibration curve is created using the external standard mix at 0.125, 0.25, 0.5, 1 and 2 mg /
mL. Individual FAME concentrations were normalised against the internal standard of C-15 FAME
(include dilution of sample when working out concentration of internal standard, typically 0.25 so
125 ug / mL standard).

349
The FAMEs are separated and identified using gas chromatography (Thermo Scientific Trace GC
Ultra) with a Zebron ZB-Wax Capillary GC column (30 m x 0.25 mm, 0.25 µm film thickness,
Phenomenex, UK). The injection volume is 1 µL with a 35:1 split ratio with an injector temperature
was 230 °C using helium as a carrier gas at a constant flow of 1.2 mL min-1. The following
gradient is used: initial oven temperature 60 °C, 2 min; 150 °C at 15 °C min-1; 230 °C at 3.4 °C
min-1. Detector temperature was 250 °C. FAMEs are identified by co-elution with a FAME
standard mix (Grain Fatty Acid Methyl Ester Mix, Sigma-Aldrich, cat no. 47801) and identified and
quantified using standard curves from individual reference compounds C16:0, C16:1, C18:0,
C18:1, C18:2 and C18:3 methyl esters (Sigma chemicals).
If using GC-MS - the mass spectrometry conditions in the positive mode are: ion source, 250 ºC;
mass range 45-650 Da; scan rate of 1783 amu/s. Free fatty acids are identified by co-retention
with standards (Sigma) and mass spectral search libraries (National Institute of Standards and
Technology NIST v2.0).
Calculation of results
The external FAME standard in the GC produces a graph of FAME concentration (mg/ mL)
against total peak area and produces an equation of y=RFx + c where y is mg/mL and x is
peak area. Total FAME (mg/mL) can then be converted to mg/mg by multiplying by dilution
factor and then dividing by the volume of the original culture extracted (usually 5 mL) to give
% in mg/mL. Contribution of each individual FAME to the total can then be calculated as a
percentage of total FAME. If the dry weight per mL culture is known then FAME content per
dry cell weight as mg FAME/mg dry weight and % FAME per unit dry weight can also be
calculated.
Quality Control
The internal standard provides a measure of extraction and trans-esterification efficiency
which can then be used to correct results from less than optimal extractions.
Errors and interferences
Every sample should be duplicated or triplicated where sample volume permits, to counter
variation in readings.

350
WASTE STREAM AND PROPER DISPOSAL
All chemicals need to be disposed of according to local regulations and protocols. Waste
chemicals generally need to be placed into a waste chemical bottle for collection and proper
disposal.
REFERENCES Davey MP, Duong GH, Tomsett E, Litvinenko ACP, Howe CJ, Horst I, Smith AG. (2014). Triacylglyceride
production and autophagous responses in Chlamydomonas reinhardtii depend on resource allocation and
carbon source. Eukaryotic Cell. 13: 392-400
Folch, J., Lees, M., Sloane-Stanley & G.H. (1957) A simple method for the isolation and purification of
total lipids from animal tissues. J. Biol. Chem. 226:497–509

351
SOP: 4.8.b Analysis of heavy metals in biomass Alexandra Lefoulonb, Sofie Van Den Hendeb
bDepartment of Industrial Biological Sciences (former Howest University College)(, Faculty of Bioscience
Engineering, Ghent University, Campus Kortrijk, Karel de Goedelaan 5, 8500 Kortrijk, Belgium
PURPOSE This procedure is used to determine the content of the following heavy metals in biomass
(for example in tomato leaves): boron (B), copper (Cu), iron (Fe), manganese (Mn), zinc (Zn),
aluminum (Al), calcium (Ca), potassium (K) and magnesium (Mg).
PRINCIPLE A biomass sample (for example an amount of tomato leaves) is dried at 100°C and is
burned into ash at 550°C to destruct the biomass. An acid solution is added to the ash to
dissolve all the heavy metals present in the ash. The heavy metals in the solution are finally
determined with a ICP-OES (Inductively Coupled Plasma - Optical Emission Spectrometry).
ICP-OES uses the properties of electromagnetic emission from atoms ionized by plasma to
analyze aqueous solutions for multiple inorganic elements such as heavy metals.
The component elements of the acid-ash solution are excited when plasma energy is given to
the acid-ash solution. When the excited atoms return to low energy position, emissions rays are
released and the emission rays that correspond to the photon wavelength are measured. The
element type is determined based on the position of the photon rays. The content of each
element is determined based on the rays intensity (Figure 1).

352
Figure 1: Inductively coupled plasma (ICP)
REQUIREMENTS EQUIPMENT AND MATERIALS
Needed for the preparation of the standards and the sample - 1 graduated flasks for each sample (25 mL or more if strong dilution is needed)
- graduated flasks for the standard solutions depending on the needed dilution (e.g. 3
flasks of 100 mL, 3 flasks of 50 mL, and 2 flasks of 10 mL)
- 1 volumetric micropipette of 1-5 mL and tips
- 1 volumetric micropipette of 100-1000 µL and tips
- 1 crucible per sample
- 1 funnel per sample
- 1 filter per sample (particle retention 17-30 µm, size 130 mm; VWR, Belgium)
- an analytical balance
- a muffle oven (550°C)
- an oven (100°C)
- desiccators (to transport and protect crucibles from humidity)
- markers
Needed for the ICP analysis ICP-OES including water cooler, argon gas and pc
REAGENTS
Needed for the preparation of the standards and the sample - HNO3 solution at 65% (Ghent University Campus Kortrijk, ref. 40295)

353
- a biomass sample
- demineralized water
Needed for the ICP analysis - argon gas
HAZARDS AND PRECAUTIONARY STATEMENTS - Always wear a laboratory coat. Wear chemical safety glasses and neoprene or rubber
gloves.
- Act carefully with the addition of nitric acid to water solution, as this is an exothermic
reaction.
Reagent Hazard statements Precautionary statements
Nitric acid (HNO3)
- May intensify fire; oxidizer. - Causes severe skin burns and
eye damage.
- Keep/Store away from clothing/ combustible materials.
- Wear protective gloves/ protective clothing/ eye protection/ face protection.
- If in eyes: rinse cautiously with water for several minutes. Remove contact lenses, if present and easy to do. Continue rinsing.
- Immediately call a Poison Center or doctor/ physician.
PROCEDURE PREPARATION OF STOCK SOLUTIONS
Nitric acid solution of around 1% is needed (Figure 2):
x With a micropipette take the solution of HNO3 (65%).
x Add the solution in a graduated flask of the desired volume.
x Then fill carefully the graduated flask with demi-water.
This nitric acid solution (1%) can be kept at room temperature for the experiment. Cover it with
parafilm or keep in a bottle
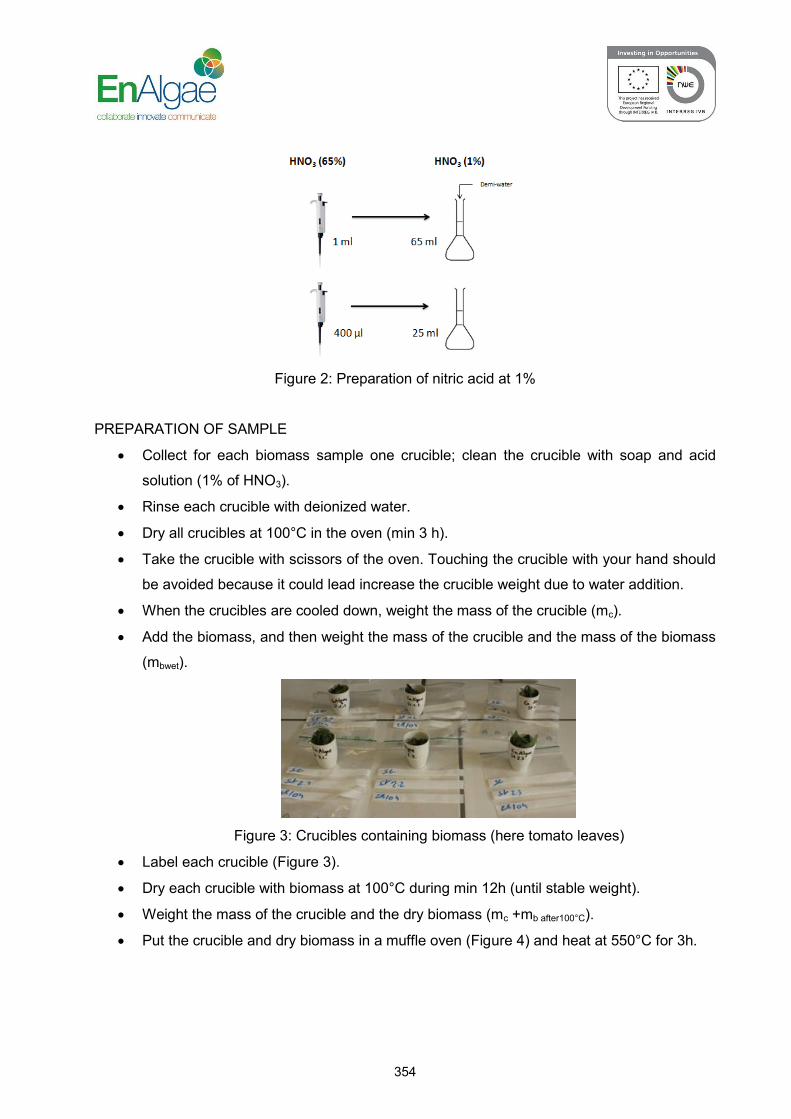
354
Figure 2: Preparation of nitric acid at 1%
PREPARATION OF SAMPLE
x Collect for each biomass sample one crucible; clean the crucible with soap and acid
solution (1% of HNO3).
x Rinse each crucible with deionized water.
x Dry all crucibles at 100°C in the oven (min 3 h).
x Take the crucible with scissors of the oven. Touching the crucible with your hand should
be avoided because it could lead increase the crucible weight due to water addition.
x When the crucibles are cooled down, weight the mass of the crucible (mc).
x Add the biomass, and then weight the mass of the crucible and the mass of the biomass
(mbwet).
Figure 3: Crucibles containing biomass (here tomato leaves)
x Label each crucible (Figure 3).
x Dry each crucible with biomass at 100°C during min 12h (until stable weight).
x Weight the mass of the crucible and the dry biomass (mc +mb after100°C).
x Put the crucible and dry biomass in a muffle oven (Figure 4) and heat at 550°C for 3h.

355
Figure 4: Muffle oven
x Cool down the crucible and then measure the mc after 500°C and the mass of ash (ma)
(Figure 5).
Figure 5: Crucible with ash
x Add carefully the HNO3 solution at 1% in the crucible to dissolve the ash.
x Pour the content of the crucible in a filter in a funnel above a graduated flask.
x Rinse the crucible twice with HNO3 solution at 1% and pour on the filter in the graduated
flask.
x Fill the rest of the graduated flask with HNO3 solution at 1% until 25 mL.
x Store the prepared heavy metal solution in the fridge.
PREPARATION OF CALIBRATION STANDARDS
x To determine the concentration of the following heavy metals: B, Cu, Fe, Mn, Zn; make
standards solutions of 0 mg L-1, 1 mg L-1, 10 mg L-1 and 20 mg L-1.
x To determine the concentration of the following heavy metals: Al, Ca, K, Mg; make
standards solutions of 0 mg L-1, 50 mg L-1, 100 mg L-1, and 150 mg L-1 according to
Table 1.

356
Table 1: Standards solutions Standard solution (mg L-1)
Vconcentrated heavy
metal solution (µL)
VHNO3 65%
(µL)
Vflask
(mL)
Vdemi-water
(mL) Rinsing water
0 0 1600 100 98.4
Blanco 0
0 1600 100 98.4
1 100 1600 100 98.3 10 500 800 50 48.7 20 1000 800 50 48.2 50 2500 800 50 46.7
100 1000 160 10 8.84 150 1500 160 10 8.34
MEASURING HEAVY METALS OF CALIBRATION STANDARDS AND SAMPLE
Preparing the ICP-OES x Turn on the argon gas.
x Turn on the fume hood.
x Put the water cooler on and check the water level. If the water level isn’t sufficient add
some demi-water.
x Check if the ICP-OES is still turned on (Figure 6).
Figure 6: The ICP-OES
Do not turn off the machine by pressing this button!

357
x Start the computer.
x Simultaneously press Ctrl+Alt+Delete.
x Enter the password “analyse”.
x Double click the icon “ICP Expert”.
x Click on the icon Worksheet on the screen and the Figure 7 should appear.
Figure 7: Screen 1
x Open a file and screen 2 will be shown (Figure 8).
Figure 8: Screen 2

358
x Fig. 7 shows the metals and their according ICP-OES wavelengths.
x To change the compound that needs to be analyzed or to add more compounds, click
‘method editor’. Then the screen 3 should appear to change the method (Figure 9).
Figure 9: Screen 3
2.1.1. Turning the ICP-OES on x Before starting the on the ICP-OES, reallocate the small tubes for input and output of the
samples (Figure 10).
Figure 10: Reallocation of the tubes of the ICP-OES peristaltic pump

359
x Make sure when the ICP-OES will run that the input tube is always in a “Blanco”
solution.
x Turn on the pump by clicking the icon .
x Check if the pump is working well by allowing to pump a very small amount of air and
follow the air bubble in the pumping tubes.
x Turn on the plasma by clicking on .
x This plasma needs to be turned on for 30 minutes before any standards and samples
are analyzed. Meanwhile the sample names can be entered in the program. It should be
frequently checked that the pump is always pumping 1% HNO3 solution. In this way, all
tubing is rinsed.
Sequence x Put the data and name of the sample to analyze in the table (Figure 11).
Figure 11: Screen 4

360
x The names selected in yellow represent the solutions that will be analyzed.
x Be aware that once the analysis starts no other solution can be added.
Analyses x Start the analysis by measuring the blank (around 30 minutes after starting the plasma
torch). The tube needs to be cleaned with paper before it is put into the blank solution.
x One measurement takes around 2-3 minutes. The software program will tell when to
present the second sample. Just before analyzing a standard or sample, it is
recommended to shake the standard or sample.
Turning off the ICP-OES x Once the analysis is done, turn off the plasma and rinse the pump during 5-10 min with
1% HNO3 solution.
x Take the tubes out of the peristaltic pump.
x Turn down the cooling machine and the fume hood.
x Close the argon gas bottle.
x Turn the computer off after the results have been saved.
CALCULATION OF RESULTS x For each element, different wavelengths have been selected in order to select the most
suitable wavelength (Figure 12).
Figure 12 : Different wavelengths for the analyses of the element B, as an example
x The right wavelength can be selected with the correlation coefficient. The higher the
correlation coefficient is the more suitable is the wavelength (Figure 13). The correlation
can be also checked by the calibration curve (Figure 13).
Figure 13: Correlation coefficient and calibration curve for analysis of B, as an example

361
x According to the selected wavelength, the result can be read from the output table
(Figure 14).
Figure 14: Output table with results for B analysis, as an example
x In the above example, the analyzed solution contained 1.65 mg B L-1.
x By taking in account the dilution, the mass of the ash and the volume of the graduated
flask, the amount of B in the biomass sample can be deduced:.
𝐴𝑚𝑜𝑢𝑛𝑡 𝑜𝑓 𝐵𝑜𝑟𝑜𝑛 𝑖𝑛 𝒈 𝑳 𝟏 × 𝑉 𝑖𝑛 𝑳 𝑀𝑎𝑠𝑠 𝑜𝑓 𝑏𝑖𝑜𝑚𝑎𝑠𝑠 𝑠𝑎𝑚𝑝𝑙𝑒 𝑖𝑛 𝒈
= 𝐴𝑚𝑜𝑢𝑛𝑡 𝑜𝑓 𝐵𝑜𝑟𝑜𝑛 𝑖𝑛 𝑡ℎ𝑒 𝑡𝑜𝑚𝑎𝑡𝑜 𝑙𝑒𝑎𝑓
QUALITY CONTROL x Analyzing samples with a known concentration of a certain element, spiking and
analyzing dilutions can be used as quality control.
x The elemental composition of a certain biomass depends on the biomass type. This
should be looked up in literature for each specific biomass.
ERRORS AND INTERFERENCES x If the correlation coefficient is lower than 0.99, another wavelength with a suitable
correlation coefficient should be selected.
x If the obtained element concentration of the acidified samples is out of range of the
standards, samples should be diluted and analyzed again.
WASTE STREAM AND PROPER DISPOSAL In case strong concentrations of toxic heavy metals are involved, these samples should be
disposed of in the waste vessel labelled “Zware metalen – Heavy metals”.

362
REFERENCES x APHA, Awwa, WEF, 2005. Standard Methods for the Examination of Water and
Wastewater, 21st ed. American Public Health Association, Washington DC.
x Van Den Hende S., 2014. Verbal communication. Ghent University, Campus Kortrijk.
x Sigma-Aldrich, 2014. Nitric acid. Available on (25/06/2014):
http://www.sigmaaldrich.com/catalog/product/sial/438073?lang=fr®ion=FR.

363
SOP: 5.1.b Biochemical methane potential (BMP) of MaB-flocs Sofie Van Den Hendeb
bDepartment of Industrial Biological Sciences (former Howest University College)(, Faculty of Bioscience
Engineering, Ghent University, Campus Kortrijk, Karel de Goedelaan 5, 8500 Kortrijk, Belgium PURPOSE This procedure describes how to determine the biochemical methane potential of microalgal
bacterial flocs (MaB-flocs) by means of mesophilic, anaerobic digestion (AD) in batch reactors
(BRs).
PRINCIPLE MaB-flocs are anaerobically digested in a gastight BR of 500 mL containing mesophilic
inoculum originating from an anaerobic digester (Figure 1.). The biogas produced during this
mesophilic (37 °C) anaerobic digestion is captured in a column filled with acidified water. The
volume of produced biogas is thus measured via a liquid replacement system (LRS). The
biogas composition is analysed to determine the volume of produced methane. This protocol is
based on the German standard procedure VDI 4630 for determination of BMP of biomass (VDI,
2006).
Biogas sampling and biogas analyses are described in two separate EnAlgae SOPs.
Figure 1. Batch set-up to determine the biochemical methane potential of MaB-flocs: liquid replacement system (left) and batch reactors in a warm water bath (right) (Laurent, 2014)

364
REQUIREMENTS EQUIPMENT AND MATERIALS
- AD BR set-up consisting of a reactor of 500 mL (Duran GLS80, Schott AG, Germany)
connected to a gas column and containing a gastight septum for sampling with a gas
syringe
- for each sample 4-5 set-ups, and for each control 4-5 set-ups are needed
- heating system (37 °C): warm water bath or oven
- spoon
- graduated cylinder of 500 mL
- analytical balance (4 digits)
- glass beaker of minimum 100 mL
REAGENTS
- inoculum: sieved (1mm) and degassed AD sludge of which the volatile solids (VS) and
total solids (TS) content and buffer capacity (BC) is known
- substrate: dewatered MaB-flocs of which the VS and TS content and chemical oxygen
demand (COD) is known
- acidified water containing methyl orange as pH indicator, to fill the gas columns
HAZARDS AND PRECAUTIONARY STATEMENTS - Wear a lab coat and safety glasses.
- When MaB-flocs are grown on wastewater and AD sludge from sewage treatment plants
are used, the analysts are encouraged to protect themselves from water-borne illnesses
by wearing clean disposable gloves and lab glasses, and by washing their hands
frequently.
PROCEDURE PREPARATION OF AD REACTORS
1. The AD BR set-up is checked if gastight and adjusted were needed. All reactors are
labeled with a number.
2. Gas columns are labeled and filled with acidified water.
3. The heating system is turned on 37 °C.
4. Inoculum and substrate are added to the AD BR according to a chosen inoculum:
substrate ratio (VS basis), allowing the volume of inoculum and substrate to be, for

365
example 350 mL or 350 g. Also reactors without substrate should be started up, to
determine the methane production of the inoculum.
5. Reactors are closed until gastight and put in the heating system.
DATA COLLECTION
1. Daily, the height of the gas in the gas column, the temperature of the acidified water in
the gas columns, the room temperature, the atmospheric pressure, and the height of the
water column (difference of level above water level inside the column and outside the
column) need to be read and annotated.
2. The first 2 weeks, a gas sample should be taken every 2 days. From the stationary
phase on, 2-3 gas samples per week are sufficient.
3. The reactors need to be stirred regularly (minimum once a day).
CALCULATION OF RESULTS Based on the methane content in the biogas and the produced volume of biogas (calculated to
standard conditions of temperature and pressure), the total volume of produced methane
(calculated to standard conditions of temperature and pressure) can be calculated for each
substrate BR (Vuncorrected, methane, substrate BR 1, time interval x) and blank BR (Vmethane, substrate BR 1, time interval x)
for each time interval x (Buck, 1981).
The volume of methane produced for the substrate BR 1 during a certain time interval x after
correction for the methane production by the inoculum is then (Vmethane, substrate BR 1, time interval x ; in
NL CH4) :
Vmethane substrate BR 1, time interval x = Vuncorrected, methane, substrate BR 1, time interval x – Vaverage, methane, blank BRs, time interval
x
with Vaverage, methane blank BRs, time interval x (in NL CH4) being the average of Vmethane, substrate BR 1, time interval x
(in NL CH4) of all blank reactors.
The final value for the methane produced per mass of volatile solids of a certain substrate
during for a certain time interval x (Vmethane, VS, substrate, time interval x; in NL CH4 / kg VS) is then :
Vmethane, VS, substrate, time interval x = Average (Vmethane, substrate BR 1, time interval x / mVS, BR1) BR 1- > BR5
with mVS, BR1 : the mass of VS of substrate added to BR1 (in kg).
Based on this data, cumulative methane production curves can be made. Cumulative methane
production curves can be fitted to a first-order kinetic model and first-order kinetic constants (k)
can be obtained, assuming hydrolysis to be the rate-limiting step:
Bt =B0 (1−exp(−k. t))

366
where Bt (in CH4 NL/kg VS) is the cumulative methane yield at time t, B0 (in NL CH4 / kg VS) is
the maximum value of biomethane production, k (d−1) is the first-order kinetic constant, and t is
the time (days) (Pham et al., 2013). In this equation, B0 is the BMP (in NL CH4/ kg VS) of the
tested substrate.
QUALITY CONTROL - The experimental BMP cannot be higher than the theoretical BMP based on the COD
content of a certain substrate.
ERRORS AND INTERFERENCES - Reactor set-ups which are not gastight will give errors in the BMP. Most errors occur
during gas leakage from reactors. For this reason, it is recommended to use 4-5 batch
reactors for each substrate.
WASTE STREAM AND PROPER DISPOSAL - Reactor content should be disposed of in the appropriate waste container and not in the
lab sink.
REFERENCES - Buck, A.L., 1981. New equations for computing vapor pressure and enhancement factor.
Journal of Applied Meteorology 20, 1527-1532.
- Laurent, C., 2014. Biogaspotentieel van microalgen bacteriën vlokken bij verschillende
groeicondities en voorbehandelingen. Master thesis, Ghent University, Campus Kortrijk,
Belgium.
- Pham, C.H., Triolo, J.M., Cu, T.T.T., Pedersen, L., Sommer, S.G., 2013. Validation and
Recommendation of Methods to Measure Biogas Production Potential of Animal
Manure. Asian-Australas J. Anim. Sci. Jun. 26, 864–873.
- VDI, 2006. Fermentation of organic materials – Characterisation of the substrate,
sampling, collection of material data, fermentation tests. VDI 4630:2006-04. Düsseldorf,
Germany.

367
SOP: 5.2.b Biogas analysis Cedric Laurentb, Alexandra Lefoulonb, Sofie Van Den Hendeb
bDepartment of Industrial Biological Sciences (former Howest University College)(, Faculty of Bioscience
Engineering, Ghent University, Campus Kortrijk, Karel de Goedelaan 5, 8500 Kortrijk, Belgium
PURPOSE This procedure is used to analyze the composition of a biogas sample, specifically the relative
quantity of methane and carbon dioxide.
PRINCIPLE Gas from either direct samples or gas sampling vials is injected into a gas chromatograph with
thermal conductivity detector (GC-TCD). This GC-TCD determines the relative quantity of CH4,
CO2 and the sum of H2 and N2 in function of the different retention times it takes for the sample
to migrate through a heated column. By integration of the resulting data, the relative quantity of
the main different components (CH4 and CO2) is determined.
REQUIREMENTS EQUIPMENT AND MATERIALS
x GC-TCD number 2 (on the right side of number 1) (in room A206) (Brand: Agilent; Type:
6890 Series (GC Systems) Plus +)
x HP GC Autosampler Controller (connection unit to computer)
x Computer with connection drivers and software for GC controlling and data analysis
x Agilent J&W Capillary GC column CP7354
x Hamilton Gastight Syringe (250 µL) (in the drawer right under the computer) (Brand:
Hamilton; Model: GasTight #1725)
REAGENTS
x A series of gas samples in sampling vials to be analyzed
x Acetone
x Calibration gas (5% N2, 5% H2, 80% CH4 and 10% CO2; stored in a small gas bottle next
to the GC)
PREPARATION OF MEASUREMENT

368
x Check if the right column is installed in the GC oven (Agilent J&W Capillary GC column
CP7354).
x Check if there is pressure of helium in the helium supply pipe (manometer behind GC
number 1). Helium is the carrier gas in this GC-analysis.
x Boot the computer if it was shut down. This computer is located between the
two GC’s. The computer should never be shut down after use.
x Turn on GC2 with the power switch located on the front lower left.
x Turn on the HP GC Autosampler Controller unit with the power switch located on the
front lower left.
x Run the “Bootp” shortcut on the desktop of the computer. This links the computer to the
controller unit to control the GC and acquisition data
HAZARDS AND PRECAUTIONARY STATEMENTS Mind the heat of the liner opening in which the gas sample is inserted into the GC.
PROCEDURE
Figure 1. GC-TCD (Agilent 6890 Series GC Systems Plus +).
x Run the “GCµTCD” shortcut on the desktop to start the software that will acquire data
and log it with a preconfigured method.
x Before measurement of samples the column and detector should be cleaned, running a
preconfigured method:
1. Load “CLEAN.M” from C:\MSDChem\2\METHODS.

369
Figure 2. Screenshot of step 1.
2. Click “Sample name” in the “Instrument control panel” to create a log file of the
cleaning. This saves the chromatogram of any method to the computer.
a. Locate the directory: C:\MSDChem\2\DATA\(in which 2 is the number of the GC-
unit)
b. Create a new directory and name it with the day of the GC-analysis (not the same
date!) in the format of “YYMMDD” in which Y is the number of the year, M for month
and D for day. For example: 4th July 2013 becomes 130704. Additionally your name
can be added like “130704 George”.
c. Within this directory label the log file “CLEAN#.D” in which # is the number of the
cleaning action on this day. For example CLEAN2.D.

370
Figure 3. Screenshot of step 2
3. Now click “START RUN” on the computer (do not just click “OK”).
4. Press the “PREP RUN” button at the GC2 panel as soon as “not ready” LED is
longer lit up.
5. Then press the “START” button on the GC2 panel as soon as the start and run for
about 4 minutes. Do not abort this action. After cleaning the GC column will have to
cool down before any measurement can be done.
x When cleaning is done, the measurement of samples can begin by loading the
method “BIOGAS.M” from C:\MSDChem\2\METHODS.
x After the last measurement of a series of samples that have to be compared,
method “CLEAN.M” should be run again as previously described.
SAMPLE MEASUREMENT
Preparing the computer The following steps should be followed before any other gas samples are taken:
Make sure the “BIOGAS.M” method is loaded in the software. This method will run the analysis
at a constant 60°C.

371
Figure 4. Screenshot of loaded software
Prepare saving of the log file to C:\MSDChem\2\DATA\”YYMMDD”\ with the correct sample
name that is to be analyzed next. For example “0703BIOREACTORSOFIE7.D”. Do this by
clicking “Sample name” in the “Instrument control panel” to create a data log file as done before
during cleaning.
Figure 5. Screenshot of saving log file.

372
Taking the gas sample
Prepare the Hamilton gas syringe (250 µL) by reassembling it in case it was taken apart.
Before taking any sample, align the valve of the glass Hamilton syringe with the cylinder axis so
it is opened. Then rinse the syringe by filling and completely ejecting it 2 or 3 times with air from
the room you are in making sure there is nothing but gas inside (no liquids). Finally eject all air
and close the valve again.
There are two options on how to take gas samples: gas samples can be either taken
from sampling gas vials or directly from the reactor.
1. Taking gas sample from a sampling vial
a. Turn the second sampling vial (the one with the most gas (± 2 mL))
upside down and pierce the inner ring of the butyl stopper with the gas
syringe and aim for the gas headspace. The first sampling vial with the
small gas bubbles (± 0.5 mL) are for backup in case something goes
wrong with the second one.
b. Open the valve of the syringe and rinse the volume of the syringe a
couple of times with the content of the gas headspace in the vial. Finally
take the gas sample of 250 µL and wait for a few seconds for gas
pressure to equalize.
c. Close the valve at the top of the syringe and pull out the syringe again in
a smooth movement. Place the sampling vial in the correct container
again.
2. Taking direct gas samples from a reactor
a. Shake the reactor so that the gas composition is representative for a
certain time.
b. Pierce the gas syringe all the way down through the septum of the
bioreactor (it shouldn’t hit the sludge level inside the reactor).
c. Open the valve and rinse a few times with gas in the reactor. Finally take
the gas sample of 250 µL and wait for a few seconds for pressure to
equalize.
d. Close the valve at the top of the syringe and take out the syringe again.
e. Without opening the valve, pressurize the gas volume from 250 µL to
200 µL while carrying the syringe with the gas to the GC inlet. This
makes sure no air tries to enter the syringe, as only gas could escape in
case of malfunction.

373
Injecting gas sample into GC a. When the correct data saving file name has been entered in the computer and
you have the sample ready in the syringe, click “START RUN”.
b. Press the “PREP RUN” button on the panel of GC2. Wait until the “not ready”
LED is no longer lit up. Carefully bring the gas syringe towards the inlet of the
liner of GC2. Hold the syringe downwards near the opening. Do mind the heat
of the metal ring on the outside of the liner as you can burn your fingers here.
c. Now, without opening the valve of the syringe yet, pressurize the gas in the
syringe by reducing the volume from 200 µL to exact 100 µL outside the GC.
d. Now quickly but carefully open the valve outside the inlet and then
immediately insert the syringe all the way down into the inlet of the liner of
GC2 and empty it with a fluent and short movement of the piston from 100 µL
to 0 µL. Immediately and simultaneously, press the “START” button on the
GC2’s panel and retract the needle from the inlet. This series of actions should
be fluent and identical in timing to the other times when performed and as
short as possible. The computer should now have started logging and
visualizing the chromatogram until the programmed time of 6 minutes runs
out. Do not abort this action. After this time the data is no longer logged,
however the GC keeps drawing a chromatogram on the PC screen until the
next action is started (for example the run on another sample).
e. Wait at least one minute before injecting the next sample as remains of other
compounds can still be migrating through the column which is better not
included in the next chromatogram as they would be part of the area when
integrating.
f. Retake all steps from part 4.2.2. (Preparing the computer) through 4.2.3. and
4.2.4. for the amount of samples to be analyzed.
Finalizing the measurement When all sample measurements are done, check if you see dirt or condensate in the gas
syringe. If so, it should be thoroughly cleaned with acetone, disassembled and stored to dry
disassembled so acetone can vaporize and escape well.
Do not shut down the computer after use; only close the programs you started.

374
PROCESSING DATA OF MEASUREMENTS
To gain time, this action can be performed on previously acquired data while the
next measurement is running, since it is done through a different program.
Alternatively, this can be done after all measurements at a later time.
1. Run the “GCµTCD Enhanced Data Analysis” shortcut on the desktop of the
computer to start the software that will enable you to interpret the data.
2. Select the data file (“… .D”) to be analyzed.
3. Choose “Chromatogram” in the menu and choose “Integrate”.
4. Check if the program is able to distinguish 3 peaks at the expected and known
succession of retention timings: a) the sum of N2 and H2 around 4.23 minutes; b)
CH4 around 4.43 minutes; c) CO2 around 4.84 minutes. They are cut off by blue
lines in the graph. Possibly a fourth peak can be found in front of or at the back of
the other peaks, but this can be ignored, as only the ratio of CH4 and CO2 is of
importance. However if the size of this unknown peak is very large compared to 3
being distinguished, the integration detection of the smallest peak may fail to
compute and produce an area of significance. In this case the initial threshold
setting should be lowered in steps of 1 unit, until after reintegration a representative
area can be computed. This setting can be found in the menu “Chromatogram >
Signal Integration Parameters…”. Once changed, choose “Integrate” again to
recompute using the changed parameters. Restore the initial threshold setting to the
original setting of 16.5 before loading the next sample data for integration.
Figure 6. Screenshot of integrating chromtogram.
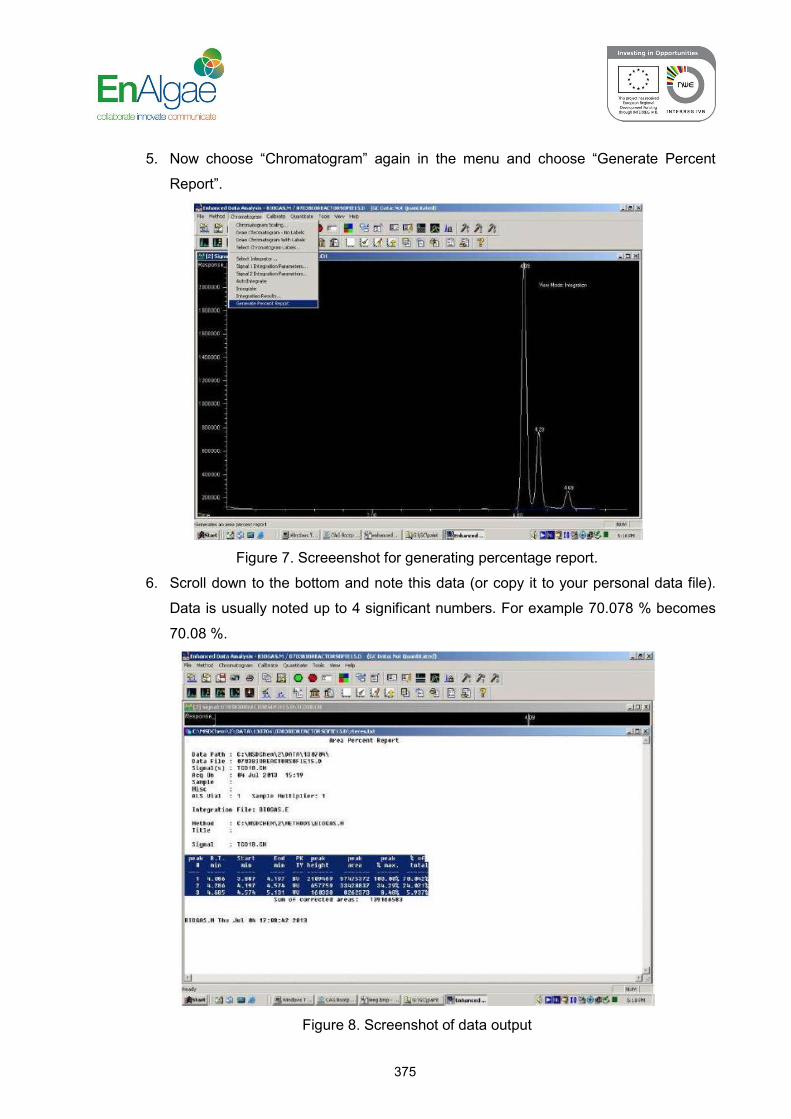
375
5. Now choose “Chromatogram” again in the menu and choose “Generate Percent
Report”.
Figure 7. Screeenshot for generating percentage report.
6. Scroll down to the bottom and note this data (or copy it to your personal data file).
Data is usually noted up to 4 significant numbers. For example 70.078 % becomes
70.08 %.
Figure 8. Screenshot of data output

376
o Note retention times of the peaks for CH4 and CO2 (R.T min column)
(this is the top of the retention peak, not the start or end of steep
slopes). Time is displayed in digits, so 5 minutes and 30 seconds is
written as 5.5.
o Note the relative percentage in the last column in this report (% of total):
- 2nd peak: CH4 (around 4.43 minutes)
- 3rd peak: CO2 (around 4.84 minutes)
There is no need to note the peak for N2 and H2.
o In case there is a fourth peak, make sure you read or copy the 2 correct
peaks using the retention timing as reference, as data from the fourth
peak is irrelevant.
7. Important remark: DO NOT try to open a sample data file with the GCµTCD
Enhanced Data Analysis tool or any other program when this file is still being written
to by the GCµTCD logging program that controls the GC. Doing so will result in a
corrupted “.D” data file and the sample will have to be measured all over again!
8. Do not shut down the computer after use, only close the programs you started.
CALCULATION OF RESULTS It is advised to use a spreadsheet for calculations. Use the calibration factors mentioned earlier
(or determine them again yourself using calibration gas of known contents) to multiply the
measured area percentage to the correct area percentage.
Then calculate the relative quantity of the two peaks (CH4 and CO2) with the following formulas
by dividing each one through the sum of the two to obtain the relative quantity in the gas sample
that is only supposed to consist of these gasses.
The final percentages acquired for CH4 or CO2 can be divided by the sum of percentages of
CH4 and CO2 to find the relative quantity of produced gas in this biogas sample.
Formulas:
[𝐶𝐻 ] = [𝐶𝐻 ] × 𝐶𝐹 × 100[𝐶𝐻 ] × 𝐶𝐹 + ([𝐶𝑂 ] × 𝐶𝐹 )
[𝐶𝑂 ] = [𝐶𝑂 ] × 𝐶𝐹 × 100[𝐶𝐻 ] × 𝐶𝐹 + ([𝐶𝑂 ] × 𝐶𝐹 )
With
[𝐶𝐻 ] : concentration of CH4 in the biogas sample (%v)
[𝐶𝑂 ] : concentration of CO2 in the biogas sample (%v)
[𝐶𝐻 ] : area peak percentage of CH4 (%)

377
[𝐶𝑂 ] : area peak percentage of CO2 (%)
𝐶𝐹 : calibration factor for CH4 (no unit)
𝐶𝐹 : calibration factor for CO2 (no unit)
QUALITY CONTROL A sample of calibration gas should be measured during each sampling run as a quality control.
Biogas samples originating from anaerobic digestion batch test should contain 50-90% CH4 and
10-50% CO2.
ERRORS, CALIBRATION AND INTERFERENCES This GC unit always measures a difference in composition compared to the actual composition
as was determined with a calibration gas (consisting of 5 % N2, 5% H2, 80% CH4 and 10% CO2).
The ratio of this measurement to the actual composition was turned into a calibration factor
which is applied to all samples to determine the actual composition of gas samples in analysis.
Multiply the obtained area percentage with the calibration factors in order to read the correct
area percentage of the samples. Table 1 shows an example of calibration factors which are to
be determined calibration gas.
Table 1: Example of calibration factors for methane and carbon dioxide
CH4 CO2
Calibration factor 1.031 0.652
WASTE STREAM AND PROPER DISPOSAL Dispose any captured spills or contents of vials in the correct liquid waste stream disposal barrel
in the lab (acids).
Clean all gas vials and remove their labeling with acetone.
REFERENCES APHA, Awwa, WEF, 2005. Standard Methods for the Examination of Water and Wastewater,
21st ed. American Public Health Association, Washington DC.
Laurent C., 2014. Biogaspotentieel van microalgen bacteriën vlokken bij verschillende
groeicondities en voorbehandelingen. Annex: Biogas sampling. Master thesis, Ghent
University, Campus Kortrijk, 123p.

378
SOP: 5.3.b Biogas sampling Cedric Laurentb, Alexandra Lefoulonb, Sofie Van Den Hendeb
bDepartment of Industrial Biological Sciences (former Howest University College)(, Faculty of Bioscience
Engineering, Ghent University, Campus Kortrijk, Karel de Goedelaan 5, 8500 Kortrijk, Belgium
PURPOSE This procedure describes how samples of active biogas reactors are taken for further gas
composition analysis. This analysis is representative to the gas composition that is collected in
eudiometers with the same liquid composition as used for the biogas samples.
PRINCIPLE A small volume of biogas sample is taken from the headspace of an anaerobic reactor through
a gastight septum, while not disturbing the gas composition during sampling. A vial completely
filled with acidified water is used to store and transport the gas samples. This water is acidified
with sulfuric acid to at least pH 2 to ensure a minimum transfer of carbon dioxide from gas
phase to the solution. The red color of adding methyl orange visually ensures the pH is always
below 3.1. The same acidified water is used in the gas collection columns that are connected
through tubes with the biogas reactors. They accumulate the produced gas and indicate the
volume through water displacement. Using the same acidified water ensures more or less the
same error of transfer of carbon dioxide from gas phase to solution so the biogas sample
composition is representative to the composition of biogas in the column, but not to the one in
the reactor head space.
REQUIREMENTS EQUIPMENT AND MATERIALS
Needed for the preparation of acid solution x pH meter
x magnetic agitator
x beaker of desired volume (e.g. 1 L)
x volumetric micropipette (e.g. 10-100 µL or up to 1000 µL)
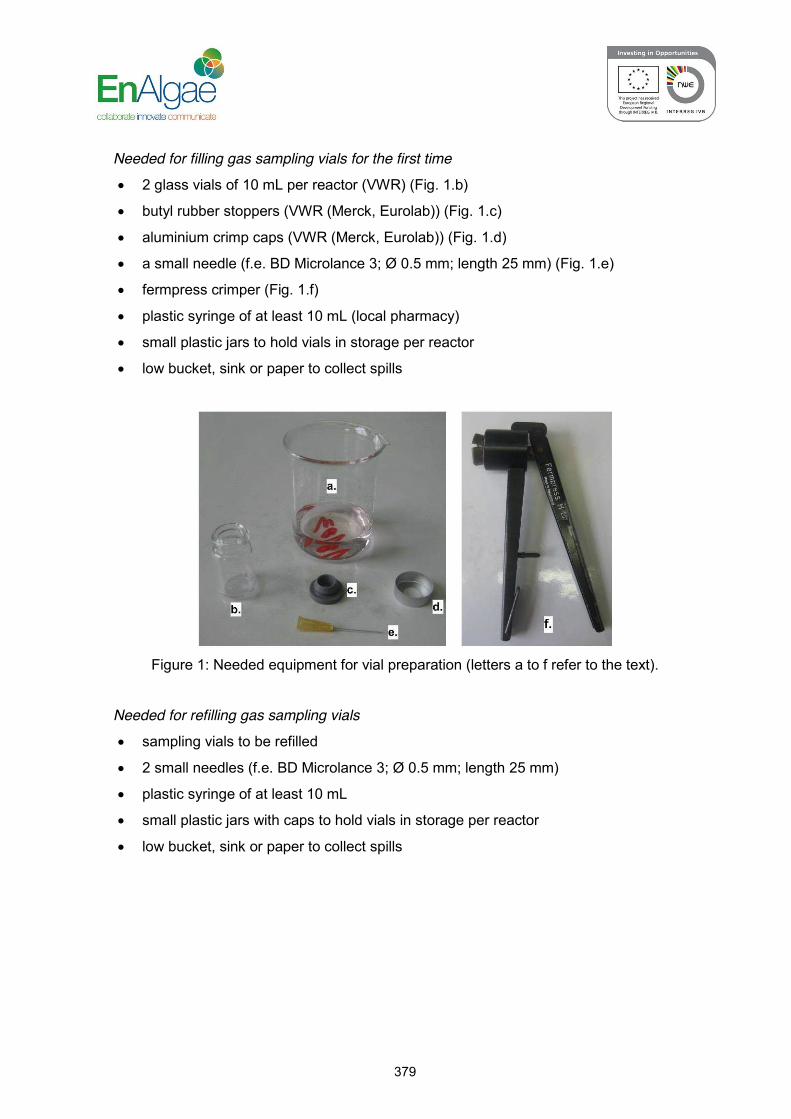
379
Needed for filling gas sampling vials for the first time x 2 glass vials of 10 mL per reactor (VWR) (Fig. 1.b)
x butyl rubber stoppers (VWR (Merck, Eurolab)) (Fig. 1.c)
x aluminium crimp caps (VWR (Merck, Eurolab)) (Fig. 1.d)
x a small needle (f.e. BD Microlance 3; Ø 0.5 mm; length 25 mm) (Fig. 1.e)
x fermpress crimper (Fig. 1.f)
x plastic syringe of at least 10 mL (local pharmacy)
x small plastic jars to hold vials in storage per reactor
x low bucket, sink or paper to collect spills
Figure 1: Needed equipment for vial preparation (letters a to f refer to the text).
Needed for refilling gas sampling vials
x sampling vials to be refilled
x 2 small needles (f.e. BD Microlance 3; Ø 0.5 mm; length 25 mm)
x plastic syringe of at least 10 mL
x small plastic jars with caps to hold vials in storage per reactor
x low bucket, sink or paper to collect spills

380
Needed for biogas sampling x prepared set of gas sampling vials
x Hamilton gastight syringe (2.5 mL) with needle in good condition (Hamilton 1002 SL 2.5
mL (22/51/2); Part No. 81456)
x a small syring needle (local pharmacy)
x low bucket, sink or paper to collect spills
REAGENTS
Needed for the preparation of the acid solution x sulphuric acid solution (95-97%)
x methyl orange
x demineralized water
Needed for filling gas sampling vials for the first time x prepared acid solution (Fig. 1.a)
Needed for refilling gas sampling vials x prepared acid solution (Fig. 1.a)
Needed for biogas sampling x acetone
HAZARDS AND PRECAUTIONARY STATEMENTS x Act carefully with sharp needles and expensive glass syringes.
x Always wear a laboratory coat, eye protection and laboratory gloves as acids are
handled!
x Act carefully with sulfuric acid solution (95-97%).
Reagent Hazard statements Precautionary statements
Sulphuric acid (H2SO4)
- Causes severe skin burns and
eye damage. - Harmful to aquatic life with long
lasting effects.
- Avoid release to the environment.
- Wear protective gloves/ protective clothing/ eye protection/ face protection.
- If in eyes: Rinse cautiously with water for several minutes. Remove contact lenses, if present and easy to do. Continue rinsing.
- Immediately call a Poison Center or doctor/physician.

381
PROCEDURE PREPARATION OF ACID SOLUTION
x Fill a beaker with demineralized water to the desired volume.
x Add an agitating magnet and place beaker on magnetic agitator.
x Add a few drops of methyl orange to the beaker.
x While measuring pH, gradually add pure sulphuric acid with a micropipette until at least
pH 2 is reached. Add approximately 200 µL of sulphuric acid per liter. Set the pH to the
same pH as measured in the biogas collection columns.
x This acid solution can be kept for weeks at room temperature. Cover it with parafilm or
keep in a bottle.

382
FILLING GAS SAMPLING VIALS FOR FIRST TIME
x Pour an estimation of the needed volume of acid solution in another beaker to not
contaminate the main solution.
x Fill a plastic syringe with acid solution and fill the vials almost completely, till about 4mm
from the edge.
x Slowly close the vial with new butyl stopper and put an aluminum crimp cap on it.
x Use the fermpress crimper to firmly crimp the cap on the vial. Push the vial all the way
down in the crimper and pinch really hard until a clicking sound is heard. When correctly
aligned nothing should break using this force.
x Check if the aluminum cap cannot move any more. If it still can, rotate the crimper a bit
and pinch a few times again. This should keep the butyl stopper in place.
x Turn the vial upside down and shake it so all gas bubbles rise to the glass bottom.
x Continue with the steps in part 3.1.2. and 3.2.2. as if refilling.
REFILLING GAS SAMPLING VIALS
x Pour an estimation of the needed volume of acid solution in a beaker to not contaminate
the main solution.
x Fill a plastic syringe with acid solution, preferably a syringe with a big volume so you
need to refill it less.
x Put a microlance needle on the filled syringe and force any air out by holding it upright
and ejecting some fluid (Fig. 2.a).
x Hold the vial to be refilled in one hand upside down so all gas is near the glass bottom.
x Pierce the inner ring (never outside the ring) of the butyl stopper with a second
microlance needle and point the tip to the upper side while tilting the vial so that it the tip
is in the gas and not the fluid. This needle will evacuate gas from the vial. Make sure the
needle is rotated so that the opening is clear and pointing to the gas and not blocked by
the glass side of the vial. Make sure to aim the back of the needle to a point where you
can collect any spills (Fig.2.b).
x Now insert the needle with the syringe with the refill fluid and point downwards (Fig. 2.c).
x Insert fluid from the syringe in the vial and keep aiming for the gas bubble with the other
needle by tilting the vial.
x Continue till all gas is evacuated and the vial is completely filled with fluid again. This is
achieved once fluid starts to drip or spray from the gas evacuation needle.
x Retract the evacuation needle while still putting under pressure on the injecting syringe.
Then retract the syringe while still under pressure. This way you make sure no gas tries
to enter again while doing so.

383
x Control if the refill was a success by shaking and checking for any missed gas bubbles.
Repeat the process if there is any gas bubble left in the sampling vial. A gas bubble
smaller than 0.5 mm diameter can be ignored, but preferably there is none.
x Store the vials upside down, so the gas bubble has no chance to stick to the rubber and
it is always clear whether if gas is inside the vial.
Figure 2: Refilling gas sampling vials

384
BIOGAS SAMPLING
x All sampling vials and holders should be marked in advance with the reactor reference,
so they do not get mixed up and to work in a regular order of succession. For each
reactor two vials are needed. Store them in pairs of two in the small plastic jars with
caps that are also marked with the same reactor reference. The first vial will be a
reserve to flush the syringe and reduce measuring error, while the second vial will
contain the actual sample that will be analyzed.
x Before taking the first sample, align the valve of the glass Hamilton syringe with the
cylinder axis so it is opened. Then fill and empty the syringe a few times with air from the
room you are in making sure there is nothing but gas inside (no liquids). Finally empty it
completely and close the valve on the top by turning it 90 degrees.
x Pick the correct jar for the reactor that has to be sampled and take out the storage vials.
x Now pierce the septum of the biogas reactor with the syringe in one smooth movement
(or other means) to access the gas in the headspace of the reactor, almost all the way
in. Make sure the valve is closed at this time. When piercing, be careful not to hit
anything inside the reactor with the needle tip which is invisible at that time, to not bend
the needle or block it with dirt of pieces of rubber.
x Now open the valve syringe, flush the entire volume of the syringe at least 2 times by
taking in biogas and ejecting again in the reactor. When flushed sufficiently, take the
final sample of 2.5 mL. Before closing the valve again, make sure the gas has had
enough time to enter through the small needle, therefore give it about an additional 10
seconds to fill up before closing the valve again.

385
x Pull the syringe out of the septum in the one smooth movement and pick up the first
storage vial holding it bottom up.
x Pierce the septum of the storage vial with the syringe, but do not yet open the valve.
x Insert a short microlance needle into the septum of the storage vial to release pressure
by draining liquid from the vial.
x Now open the valve of the syringe and insert 0.5 mL of gas, so 2.0 mL is left in the
syringe, making sure the tip of the syringe needle is always in the gas bubble and the tip
of the microlance needle is never reaching the gas bubble. As you do this, liquid will drip
from or spray through the back of the microlance needle. When done close the valve
again.
x Now pull out the microlance needle and afterwards pull the syringe, so no unwanted air
can get into the vial.
x Now repeat the process of injecting the gas sample into the second vial, but this time
empty the entire remaining volume of 2.0 mL in it (Figure 3).
x Put the pair of gas sampling vials upside down back in the storage jars (Figure 4).
x Proceed by repeating the gas sampling on another reactor by filling another pair of gas
sampling vials.
x Once all the gas sampling is done, rinse the syringe with acetone liquid, spraying it out
and pumping it with air. Finally disassemble the syringe by unscrewing the piston and
needle head so all parts can dry separately. Clean the piston head with paper if visible
dirt has accumulated. If necessary pull a metal cleaning wire through the needle cylinder
to unblock it by removing dirt.
Figure 3: Biogas sampling Figure 4: Sampling vials storage jar

386
CALCULATION OF RESULTS As this protocol is about sampling, calculation of results is not relevant.
QUALITY CONTROL Analyses of stored gas samples (see SOP ‘Biogas analyses’) can be compared with analyses of
gas samples taken directly from the reactor (‘direct reactor)). The CO2 content of the stored
samples should be lower compared to the ‘direct gas samples’.
During storage of the samples in the storage jar, no water should leak out of the gas vials into
the storage jar during storage, the acid solution should remain pink and no turbidity should be
present in the gas vials.
Tests can be performed by sampling gas from a batch reactor containing acid solution (pH 2)
and biogas with a known CO2 and CH4 concentration.
ERRORS AND INTERFERENCES Be aware that a considerable portion of carbon dioxide is transferred from the biogas to the
solution, although the low pH minimizes this effect. So the actual methane production in the
collection columns is overestimated and the carbon dioxide production is underestimated. To
know the correct composition of the produced biogas a direct sample from the headspace of the
biogas reactor should be taken to be analyzed, omitting the use of the sampling vials.
Pay attention when taking gas samples to depressurize vials with a needle to only evacuate
liquid from the vial and not gas by never letting the needle end near the gas in the vial. Always
holding the vial with the bottom up and using a short needle ensures this.
WASTE STREAM AND PROPER DISPOSAL Use the fermpress crimp to remove crimp caps and septa and dispose of them in a garbage bin,
as septa that have been pierced over 50 times are not considered gastight anymore.
Dispose of any captured spills or contents of vials in the correct liquid waste stream disposal
barrel. In this case in the one labelled “Anorganische zuren” for inorganic acids. Alternatively
neutralize the acid solution with NaOH to pH 7 and dispose of in a sink. Rinse all glass vials
with demineralized water and store for reuse.

387
REFERENCES x APHA, Awwa, WEF, 2005. Standard Methods for the Examination of Water and
Wastewater, 21st ed. American Public Health Association, Washington DC.
x Beelen V., Van Den Hende S., 2014. Verbal communication. Ghent University Campus
Kortrijk.
x Laurent C., 2014. Biogaspotentieel van microalgen bacteriën vlokken bij verschillende
groeicondities en voorbehandelingen. Annex: Biogas sampling. Master thesis, Ghent
University, Campus Kortrijk, 123p.
x Sigma-Aldrich, 2014. Sulphuric acid. Available on (25/06/2014):
http://www.sigmaaldrich.com/catalog/product/aldrich/339741?lang=fr®ion=FR.

EnAlgae is a four-year Strategic Initiative of the INTERREG IVB North West Europe programme. It brings together 19 partners and 14 observers across 7 EU Member States with the aim of developing sustainable technologies for algal biomass production.
www.enalgae.eu | [email protected]
This report has been produced by Swansea University, lead partner of the EnAlgae project.www.swansea.ac.uk