standard operating procedure for critical riffle … critical riffle analysis sop v3.pdf ·...
TRANSCRIPT

Standard Operating Procedure for Critical Riffle Analysis for Fish Passage in California
DFG-IFP-001
October 2012, updated February 2013
California Department of Fish and Game Instream Flow Program Sacramento, California

Standard Operating Procedure for Critical Riffle Analysis for Fish Passage in California
DFG-IFP-001
Approved by:
Robert Holmes, DFG Instream Flow Program Coordinator, October 19, 2012
Beverly van Buuren, Quality Assurance Program Manager, October 19, 2012
Prepared by:
Melinda E. Woodard, Quality Assurance Research Group, Moss Landing Marine Laboratories,
October 19, 2012
2

Table of Contents
Acknowledgements .................................................................................................................... 5 Suggested Citation ..................................................................................................................... 5 Abbreviations and Acronyms ...................................................................................................... 5 Introduction ................................................................................................................................ 6
Scope of Application .............................................................................................................. 6 What is Critical Riffle Analysis? .............................................................................................. 7 Method Overview ................................................................................................................... 7
Section 1: Considerations for Project Planning........................................................................... 9 1.1 Project Timing .................................................................................................................. 9 1.2 Site Selection: Locating the Critical Riffle ........................................................................10
Section 2: Field Procedures ......................................................................................................11 2.1 Equipment List ................................................................................................................11 2.2 Establishing the Transect ................................................................................................12 2.3 Data Collection ................................................................................................................12
Section 3: Data Entry and Analysis ...........................................................................................18 3.1 Data Entry .......................................................................................................................18 3.2 Criteria for Fish Passage .................................................................................................19 3.3 Example of Comparing Data Analysis Results to Fish Passage Criteria ..........................20 3.4 Consideration for Application of Passage Flow Rates .....................................................23
Glossary....................................................................................................................................25 References ...............................................................................................................................26
List of Figures
Figure 1. Example of a critical riffle transect that follows the shallowest course from bank to
bank. .........................................................................................................................................14
Figure 2. Example using stadia rod to measure depth along a critical riffle transect. .................16
Figure 3. Detail: Using the stadia rod to measure depth along a critical riffle transect. ..............17
Figure 4. An example of the relationship between river discharge (cfs) and percent contiguous
passable width required for adult steelhead passage. ...............................................................22
3
Figure 5. An example of the relationship between river discharge (cfs) and total passable width
required for adult steelhead passage. .......................................................................................23
List of Tables
Table 1: Minimum depth criteria for adult and juvenile salmonid passage to be used in the
critical riffle analysis. .................................................................................................................20
4

Acknowledgements This standard operating procedure (SOP) represents the protocols for critical riffle analysis
(CRA) of the California Department of Fish and Game (Department) Water Branch Instream
Flow Program (IFP). The process in this SOP draws from current methods used by the Oregon
Department of Fish and Wildlife (ODFW). Modifications are made to ODFW methods in both
procedural scope and in the application of regional information relevant to California. The overall
concept of the procedure in this SOP is based on information in “Determining Stream Flows for
Fish Life” presented by Ken Thompson at the Instream Flow Requirements Workshop on March
15-16, 1972 (Thompson 1972). This SOP was developed by Melinda Woodard with the Quality
Assurance Research Group at Moss Landing Marine Laboratories with Microsoft Excel®
spreadsheet technical assistance provided by Candice Heinz of the Department IFP. Technical
review of this document was provided by IFP staff, and members of the ODFW Water Quality
and Quantity Program. This document has been reviewed of the Department Office of the
General Counsel.
Suggested Citation CDFG, 2012, Critical Riffle Analysis for Fish Passage in California. California Department of
Fish and Game Instream Flow Program Standard Operating Procedure DFG-IFP-001, 24 p. Available at: http://www.dfg.ca.gov/water/instream_flow_docs.html.
Abbreviations and Acronyms
CRA Critical Riffle Analysis
Department California Department of Fish and Game
IFP Instream Flow Program
ODFW Oregon Department of Fish and Wildlife
SOP Standard Operating Procedure
USGS United States Geological Survey
5

Introduction This document serves as the standard operating procedure for critical riffle analysis
methodology and procedures for the California Department of Fish and Game Instream Flow
Program. This document may be used in conjunction with other IFP SOPs to support
procedures involved in CRA. Instructions are provided for:
• Project planning considerations:
o Project timing
o Site selection
o Fish passage criteria
• Field methods:
o Transect preparation
o Data collection
• Data analysis:
o Tabular data entry
o Fish passage criteria
o Graphing of results
o Comparison of results against fish passage criteria
Scope of Application This SOP provides procedural reference for Department staff conducting CRA, when site
conditions and research objectives indicate CRA is an appropriate methodology. It is also
intended as an informational resource for staff from other state and federal agencies,
nongovernmental organizations, private contractors, and other organizations throughout
California. Fish passage criteria cited in this document are specific to California and should not
be extrapolated beyond the state borders.
This SOP applies only to wadeable streams having low gradient riffles with less than 4%
gradient and substrates dominated by gravel and cobble. This SOP is not applicable to high
gradient riffles greater than 4% gradient and boulder dominated substrates (Flosi et al. 1998).
This SOP does not apply to river or stream channels that do not have riffles, such as those
dominated by silt and sand substrates with particle sizes less than 0.1 inches. This procedure is
also not applicable to culverts, weirs, bedrock ledges, or anticlines with associated drops.
6

Note: Safety should always be a primary concern when conducting CRA. Do not conduct
sampling when field conditions are unsafe.
What is Critical Riffle Analysis? The CRA methodology is used to identify the minimum stream flow rates (also known as
passage flows) necessary for the passage of salmon and trout through critical riffles. Riffles are
habitat units in streams and rivers with relatively shallow depth and swiftly flowing turbulent
water. They serve multiple functions in the ecological processes of coldwater streams and
rivers, and are an integral link in the life histories of salmon and trout. Many species of aquatic
macroinvertebrates develop and grow in riffles, which provide a food source for salmonids.
Riffles also provide salmonids with well mixed, oxygenated water, and escape shelter from
predators.
Critical riffles are shallow riffles which are particularly sensitive to changes in stream flow due to
diminished water depth. Changes in stream flow and associated water depth may limit the
hydrologic connectivity of river habitats and impede critical life history tactics of salmon and
trout. In such cases, the critical riffle may become a potential barrier to upstream and
downstream passage for salmon and trout, which in turn may prevent adults from moving to and
from spawning areas, prevent smolts from migrating downstream to staging areas in brackish
waters of lagoons and estuaries before the ocean, as well as prevent rearing juvenile salmonids
(e.g., steelhead) from being able to move between adequate summer freshwater rearing
habitats.
Method Overview Salmon and trout passage flows are determined by locating a critical riffle, identifying a transect
along the riffle’s shallowest course from bank to bank, and measuring water depth at multiple
locations across the transect. Adequate water depths of sufficient width are necessary to
identify passage flows and promote passage of adult and juvenile salmonids at critical riffle
sites. Field data are compared to species- and lifestage-specific water depth criteria meeting the
percent total and percent contiguous proportion (see Section 3 for more information) of the
critical riffle width available for fish passage. After a minimum of three to six field events have
been completed over a wide range of discharges, stream discharge rates and percent of
transect meeting the minimum depth criteria for the species and lifestages are plotted to
determine flow rates necessary for passable flows. Both the criteria (percent total and the
7
percent contiguous) must be met and then the higher flow rate among the two criteria that are
found to meet the minimum depth for the target species and lifestage may be used to identify
the passage flows for the target salmon and trout at the critical riffle site.
8
Section 1: Considerations for Project Planning Before collecting data for CRA, it is important to identify the appropriate timing of the sampling
series and choose the appropriate site. The timing of the sampling series may be linked to the
target species and its biology, so it is important to clearly identify the target species, life stages,
and when the target species occurs in the river.
CRA is conducted by collecting depth measurements across the critical riffle transect. This SOP
uses only depth criteria of target species passage to determine passability in critical riffles. In a
few special cases, the project manager may decide to collect stream velocity measurements
across the critical riffle and assess results in relation to a target species’ maximum velocity
tolerances. Please consult the Department IFP manager for more information about these
procedures before planning such a project.
Crew safety is of paramount importance; ensure that the river can be safely sampled by crews
during the highest flow point. Contact the Department IFP manager for project planning
assistance, as needed.
1.1 Project Timing Data for CRA are collected as a three to six-part field sampling series, typically collected on the
receding limb of the hydrograph. The three to six sampling events should be timed to capture
the full range of discharges necessary to adequately bracket and identify passage flows for the
target species and life stages. Ideally, the first data collection event would be at the highest
wadeable flow of the targeted flows, with subsequent collections taken as flow decreases.
Development of a flow exceedance probability chart based upon unimpaired flow conditions for
the period of record may be useful to identify target flows for sampling. The exceedance
probability chart will indicate the percentage of time that stream flow is likely to equal or exceed
a value of interest. A good project planning starting point is to identify the 20%, 50%, and 80%
exceedance flows for sampling. Additional sampling will also be needed to develop a robust
relationship between salmon and trout passable criteria and flows – most likely at flows between
the 20% to 80% exceedance probability range, depending on site specific conditions such as
channel morphology, substrate, and flow relationships.
9

It may be useful to create a lifestage periodicity table indicating when target species occur in the
river of interest. This table may be used to determine the timing of sampling so that sampling
occurs during the range of when the target species are dependent on bypass flows for passage.
It is important to consider the timing of target species life stages when determining the range of
sampling events. Contact the Department IFP manager for assistance developing a flow
exceedance probability chart or lifestage periodicity table, as needed. The Department IFP is
planning to prepare an SOP on how to develop flow exceedance probability charts, which
should be available in 2013.
1.2 Site Selection: Locating the Critical Riffle The identification of sampling sites for CRA should be made collaboratively by Department staff
familiar with the study area. In some cases, it may be difficult to identify or agree collaboratively
on the most critical riffle (e.g., most water depth sensitive riffle) in a stream reach by visual
observation alone. In these instances, it may be necessary to collect depth measurements at
multiple critical riffle sites in order to identify the most depth sensitive critical riffles and their
respective salmon and trout passage flows.
10

Section 2: Field Procedures Once a riffle has been identified for CRA, the transect is established, marked, and
photographed before collecting data. During the initial CRA sampling event, the critical riffle
transect is located and marked with a head pin, a tail pin, and flagged with site information. The
riffle is then photographed before depth is measured across the CRA transect. CRA also
requires a discharge measurement, which may be obtained either from a nearby USGS gage, or
by collecting discharge across a nearby transect as outlined in the IFP discharge SOP (DFG-
IFP SOP 002).
The field data sheet can be found online at the Department IFP Documents page:
http://www.dfg.ca.gov/water/instream_flow_docs.html.
2.1 Equipment List Before beginning the field day, crews should pack the following equipment:
• Stadia rod (engineering grade rod capable of measuring in 10th's and 100th's of a foot)
• Fiberglass measuring tape (100-300 ft)
• Staff gage
• 0.5 in x 2.5 - 4 ft rebar (2 - 10 pieces depending on site)
• GPS unit
• Field data sheets (available at http://www.dfg.ca.gov/water/instream_flow_docs.html)
• Pencils
• Flagging and permanent marker
• Camera
• Calculator
• Small carabiners or spring clamps (5-10)
Note: If discharge will be calculated on a nearby discharge transect, crews should also pack
equipment as listed in DFG IFP SOP 002.
11
2.2 Establishing the Transect Establish a transect running along the shallowest course of the riffle from bank to bank using a
measuring tape. This transect will rarely be linear, but should instead follow the contours of the
riffle along its shallowest course from bank to bank (Figure 1). The critical riffle transect is
established during the first sampling event, and is then used repeatedly for each subsequent
sampling event. Once the transect is identified, the headpin and tailpin are set during the initial
site visit before continuing with data collection. During higher flows, the course of the shallowest
contour may need to be estimated, as flow may obscure the contour of the riffle.
Step 1: Set the headpin for the transect on the left bank of the river looking upstream. The
headpin serves as the starting point for each critical riffle measurement, starting from zero feet.
Step 2: Attach a flag to the headpin. This flag is marked with project and site identification
information.
Step 3: Set the tailpin adjacent to the edge of the critical riffle on the right bank of the river when
facing upstream.
Step 4: Attach a wind-up, light weight measuring tape to the base of the headpin. The tape
should be of sufficient length for the site (e.g., 100 ft, 200 ft, 300 ft measuring tape).
Step 5: Work across the riffle, following the contour of shallowest course. Secure the measuring
tape in place with rebar and small carabiners or spring clamps to hold the tape in place along
the riffle contour as you work (Figure 1).
Step 6: Work across the riffle until the tailpin is reached. Attach the other end of the measuring
tape to the base of the tailpin.
2.3 Data Collection Once the transect has been set up, field data are collected. The CRA field data sheet may be
found online at http://www.dfg.ca.gov/water/instream_flow_docs.html.
12

Step 1: If not already in place, set up the measuring tape along the contour of the riffle’s
shallowest course, as described in Section 2.2.
Step 2: During each sampling event, document the transect with one or more photographs
taken while facing upstream. Record the photograph file name(s) on the field data sheet.
Step 3: Populate the CRA field data sheet with the following:
• Location (e.g., Candice River, Lower Reach)
• Site name (e.g., Unit 222)
• Riffle name (e.g., Riffle B)
• Site description (e.g., wide riffle near #34 diversion pump)
• GPS coordinates (e.g., N38.53.331, W121.17.092)
• CRA sample event number and targeted flow value (e.g., Sample event 1 - 10 cfs
targeted flow)
• Sampling date
• Staff initials (i.e., identify the staff conducting the CRA)
• Start time ( i.e., identify the times when sampling starts)
• Start staff gage stage height (i.e., identify the stage heights from a nearby staff
gage when sampling starts.) Staff gage may be a temporary gage that is installed
just for purposes of doing the CRA or it may be from a nearby permanent gage if
one exists. The staff gage stage height is used to assess whether fluctuations in
flow occurred during the sample event.
• Left Bank Wetted Edge (LBWE) (e.g., the distance on the tape measure where
the wetted edge exists on the left bank)
• Right Bank Wetted Edge (RBWE) (e.g., the distance on the tape measure where
the wetted edge exists on the right bank)
• Total length of the transect from headpin to tailpin (e.g., total length of the
transect following the shallowest course from bank to bank)
13
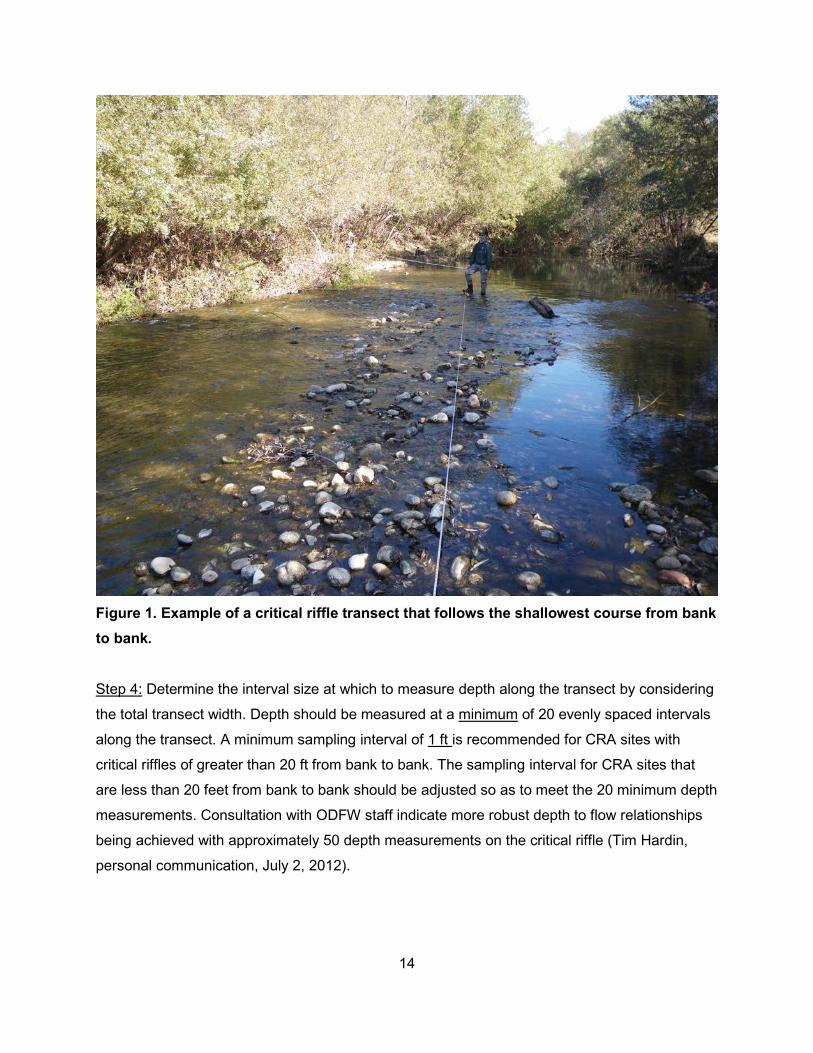
Figure 1. Example of a critical riffle transect that follows the shallowest course from bank to bank.
Step 4: Determine the interval size at which to measure depth along the transect by considering
the total transect width. Depth should be measured at a minimum of 20 evenly spaced intervals
along the transect. A minimum sampling interval of 1 ft is recommended for CRA sites with
critical riffles of greater than 20 ft from bank to bank. The sampling interval for CRA sites that
are less than 20 feet from bank to bank should be adjusted so as to meet the 20 minimum depth
measurements. Consultation with ODFW staff indicate more robust depth to flow relationships
being achieved with approximately 50 depth measurements on the critical riffle (Tim Hardin,
personal communication, July 2, 2012).
14

Step 5: Using a stadia rod (with scale to 100ths of a foot), measure depth along the transect in
interval distances as determined in Step 4 (Figures 2 and 3). Record distance and depths at
stations in feet on the CRA field data sheet.
Note: Careful attention should be taken to record water depths at individual locations as the fish
would encounter and use them. For example, the stadia rod should not be placed between two
rocks to measure depth unless it appears that a fish could swim between them freely. Using the
same example, if the stadia rod fits between two rocks (without being on top of the rocks), but
the upstream passage is blocked by other rocks immediately upstream or downstream within
the measurement cell of the longitudinal profile of the critical riffle, then the measurement should
be taken on top of, instead of between the rocks. In these cases the shallowest points (on top)
of the wetted substrate should be selected if the fish could not use the depths between rocks
due to passage obstructions either immediately upstream or downstream of the transect. Add
any such notes to the comments section on the CRA field data sheet.
Step 6: Populate closing data fields on the CRA field data sheet: end time and staff gage end
depth.
Step 7: Remove the measuring tape from headpin and tailpin, and clean up other equipment as
necessary.
Step 8: Obtain and record discharge data on the CRA field data sheet either from a nearby
United States Geological Survey (USGS) gage, or by conducting a site specific discharge
measurement on a nearby discharge transect suitable for such measurements as defined by
DFG-IF SOP 002.
Step 9: Ensure that all data fields have been populated on the CRA field data sheet before
leaving the site.
15
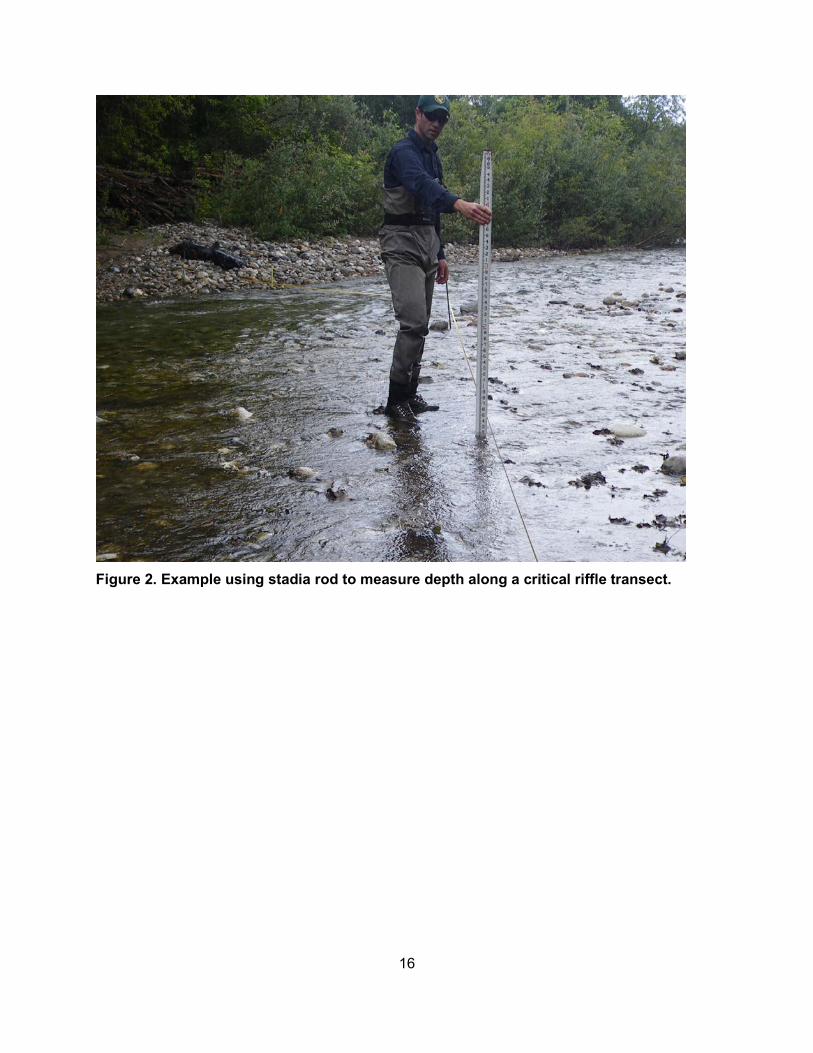
Figure 2. Example using stadia rod to measure depth along a critical riffle transect.
16
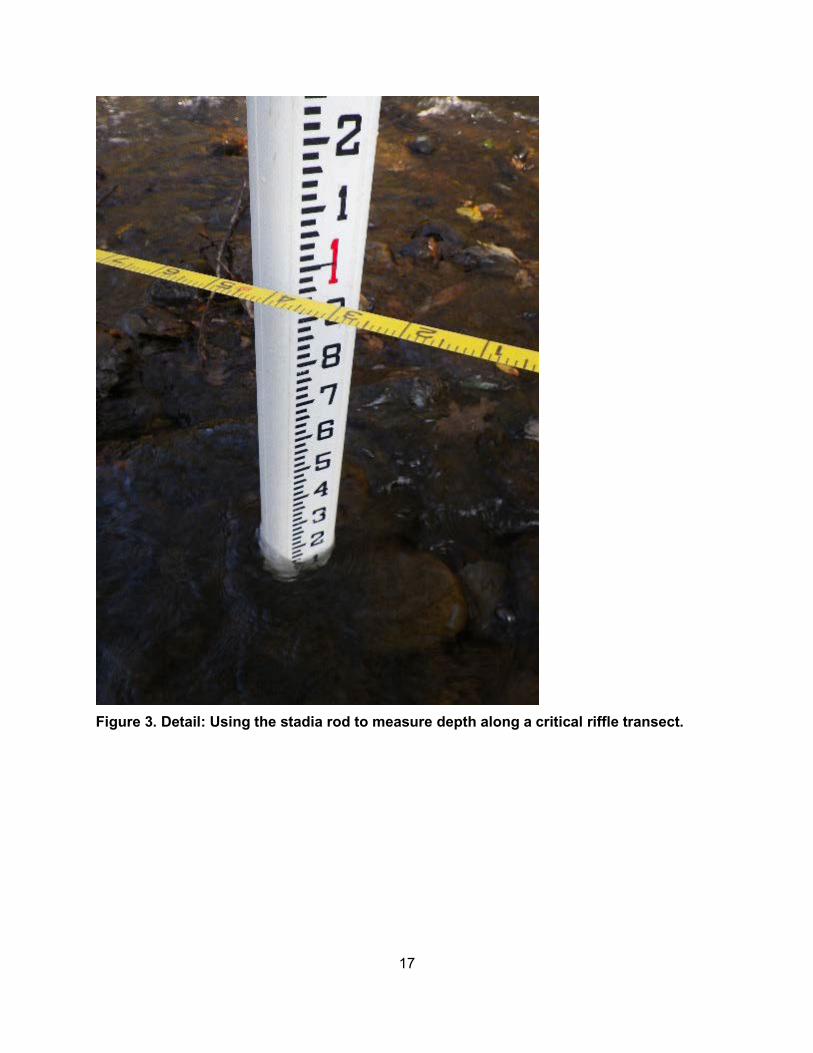
Figure 3. Detail: Using the stadia rod to measure depth along a critical riffle transect.
17

Section 3: Data Entry and Analysis After each sampling event, data are transferred from the CRA field sheet to the field event -
specific CRA Microsoft Excel® worksheet. After data have been collected from each sampling
event, data may be compared with the current criteria for fish passage, as established by IFP.
This section discusses the criteria for fish passage and how to assess if the critical riffle meets
these criteria.
3.1 Data Entry After each sampling event, transfer data from the field sheet to the corresponding CRA for Fish
Passage Microsoft Excel® worksheet (available online at the Department IFP documents page:
http://www.dfg.ca.gov/water/instream_flow.html). The CRA for Fish Passage sampling event
worksheet calculates the number of cells that meet the criteria for fish passage (as outlined in
Section 3.2) for each sampling event. See below for specific data entry instructions for entering
field data into the Microsoft Excel® spreadsheet.
There are six tabs in the online Microsoft Excel® spreadsheet (“DFG IFP CRA for Fish Passage
data online”) named for each of six sample events (e.g., “CRA 1-6” for sample event one of six;
“CRA 2-6” for sample event two of six; and so on). The online Microsoft Excel® spreadsheet
also contains: 1) the “Example Passage Form”, which is a filled out example data form; 2) the
“CRA Cumulative Calculations” tab which includes cumulative calculation data tables for the
percent contiguous passable widths and percent total passable widths data, which are used for
summarizing the results from each sample event and subsequent data analysis; and 3) a
“Passage Criteria and Codes” tab, which includes salmon and trout species codes and their
minimum depth criteria.
When filling out the Microsoft Excel® spreadsheet, be sure to enter all relevant information for
the sampling conducted. For example, fill out the location, site description, date, flow the sample
data were collected, etc. The next step is to identify the target species and lifestage for the CRA
and enter the respective criteria into the field data form. The target species and lifestage criteria
are selected from the “Passage Criteria and Codes” tab in the Microsoft Excel® spreadsheet.
For example, enter “St” in the species code and “0.7” ft depth in the target species depth criteria
of the field sheet if interested in assessing passable flows for adult steelhead.
18

Using the “CRA Passage Form” tab, enter the field data into the “Distance” and “Depth”
categories. The “Distance” entry is typically the position of the tape measure where the depth
data were recorded. The “Width” column will be populated by the spreadsheet based upon the
distance or locations of depth measurements taken. The spreadsheet will calculate the percent
contiguous passable flows and percent total passable flows for each sample event based upon
the site specific distance and depth field data, and the target species depth criteria. In order for
the “Percent Contiguous” calculation to be correctly summarized – the user will have to “Sum”
the longest range of contiguous cells meeting the depth criteria and enter this value in the
highlighted contiguous width cell on the bottom of the spreadsheet (highlighted in red).
It is also important to note that the maximum transect length must be entered in each of the
(three to six) sample event data sheets for the percent contiguous and percent total calculations
to be accurate. The maximum transect width should be the same value for each site, and for
each of the three to six flows sampled. Further, the maximum transect width will be the largest
length of the transect (shallowest course from bank to bank) of all the measured sample events
for the site. Maximum transect widths should not typically exceed beyond the toe of bank – the
point where the streambed and one bank join. The streambed is defined as that part of the
channel usually not occupied by perennial terrestrial plants, but including gravel bars, and lying
between the toe of each bank.
After all of the sampling events have been conducted, and data entered for all events in their
individual event tabs, select the “CRA Cumulative Calculations” tab. Manually enter the flows of
each sampling event along with the number of cells meeting passage criteria for the target
species as outlined above.
3.2 Criteria for Fish Passage The IFP has established two criteria for development of passage flows for salmon and trout:
1. At least 10% of the entire length of the transect must be contiguous for the
minimum depth established for the target fish; and
2. A total of at least 25% of the entire transect must be at least the minimum depth
established for passage of the target fish.
19

The minimum water depth needed for adequate adult and juvenile salmonid passage through a
critical riffle is established in Table 1. Depth passage criteria for adults (Table 1) are based upon
a literature review conducted by R2 Resources (2008) and are intended to provide protective
conditions of suitability for passage. Ideally, there should be sufficient clearance underneath the
fish so that contact with the streambed and abrasion are minimized, which R2 Resources (2008)
considered to be 0.1 ft. When selecting the appropriate criteria, use the minimum depth for the
adult fish if both adult and juvenile fish are known to be in the system at the same time. The
Department may update the minimum depths in Table 1 as new information is developed.
Table 1: Minimum depth criteria for adult and juvenile salmonid passage to be used in critical riffle analysis.
Species Minimum Depth (ft)
Steelhead (adult) 0.7
Coho Salmon (adult) 0.7
Chinook Salmon (adult) 0.9
Trout (adult , including 1-2+ juvenile steelhead) 0.4
Salmonid (young of year juvenile) 0.3
3.3 Example of Comparing Data Analysis Results to Fish Passage Criteria A riffle measuring 100 feet from bank to bank along its shallowest course is being analyzed for
passage of adult steelhead (minimum depth = 0.7 feet). To meet IFP criteria for successful
passage, this riffle would need to have:
• A contiguous portion of at least 10 feet in length measuring at least 0.7 feet deep; and
• A total of at least 25 feet in length with a depth of at least 0.7 feet.
After data are collected for all time series, two minimum discharge rates are calculated by
creating two graphs using the summary data entered on the “CRA Cumulative Calculations” tab
of the Microsoft Excel® spreadsheet : 1) river discharge rates versus percent contiguous
passable width, and 2) river discharge rates versus percent total passable width required for fish
20

passage. Working with one graph at a time, plot the relevant variables using Microsoft Excel®,
then generate a best fit line on the graph. To find the discharge required for target fish passage
through the critical riffle, find the point on the Y-axis that meets each criterion for the passage of
the target fish, and use Microsoft Excel® to find where this point hits the line of best fit and its
corresponding point on the X-axis. This point on the X-axis is the discharge required for fish
passage through this critical riffle.
Note: If there is more than one target species (as listed in Table 1) involved in the study,
generate one set of graphs per target species.
Below is an example of the results from the six sampling events at a critical riffle site for both the
percent contiguous passable width and percent total passable width. In this example, the flow
rate (75 cfs) associated with Criterion 1 (Percent Contiguous; Figure 3) is the same as Criterion
2 (Percent Total; Figure 4), and is therefore identified as the minimum flow rate required for the
passage flow at the critical riffle site. If the flow rates differ between the two criteria, the higher of
the two flow rates shall be identified as the minimum passage flow for the critical riffle.
21
Percent Contiguous Passable Width
R2 = 0.9013
0
5
10
15
20
25
30
0 10 20 30 40 50 60 70 80 90 100 110 120 130 140 150 160Discharge (cfs)
Perc
ent C
ontig
uous
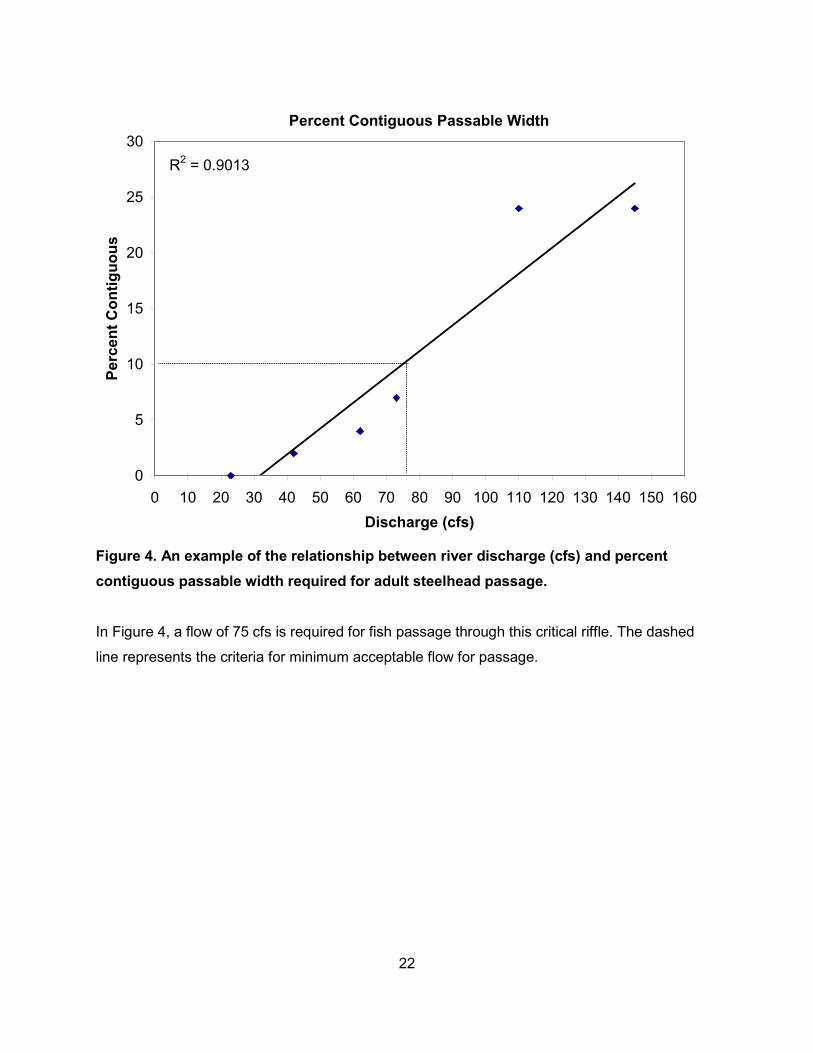
Figure 4. An example of the relationship between river discharge (cfs) and percent contiguous passable width required for adult steelhead passage.
In Figure 4, a flow of 75 cfs is required for fish passage through this critical riffle. The dashed
line represents the criteria for minimum acceptable flow for passage.
22
Percent Total Passable Width
R2 = 0.9708
05
101520253035404550556065
0 10 20 30 40 50 60 70 80 90 100 110 120 130 140 150 160
Discharge (cfs)
Perc
ent T
otal
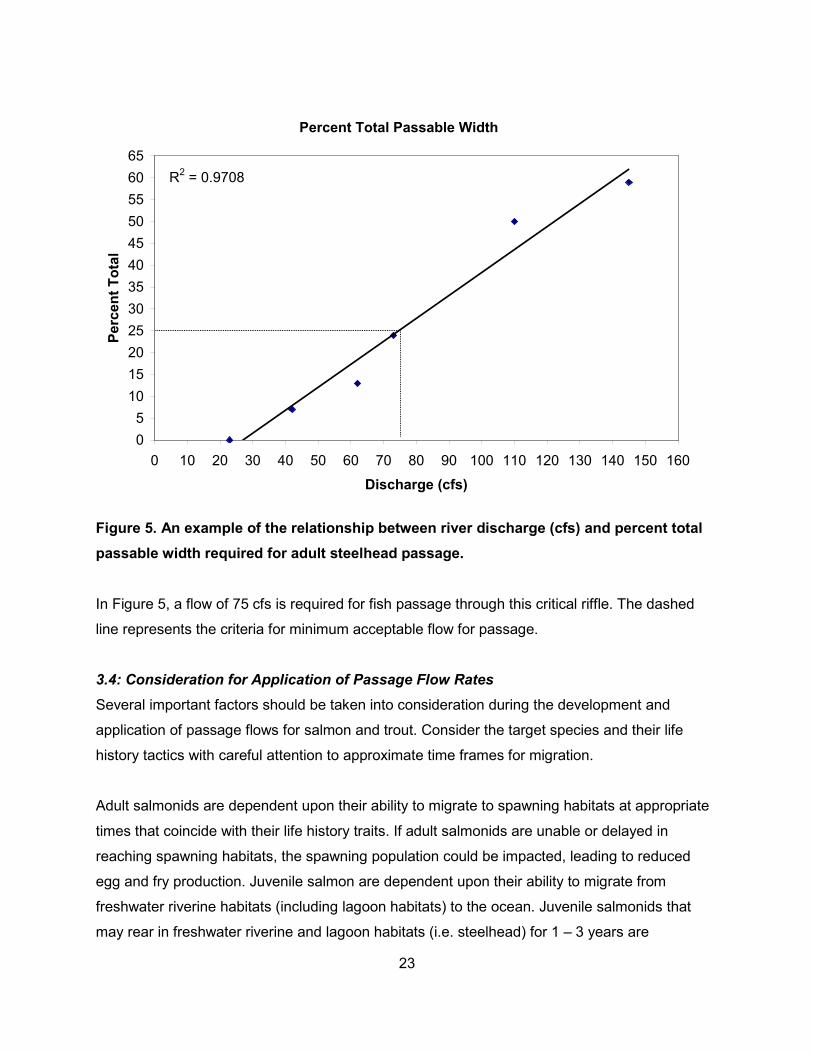
Figure 5. An example of the relationship between river discharge (cfs) and percent total passable width required for adult steelhead passage.
In Figure 5, a flow of 75 cfs is required for fish passage through this critical riffle. The dashed
line represents the criteria for minimum acceptable flow for passage.
3.4: Consideration for Application of Passage Flow Rates Several important factors should be taken into consideration during the development and
application of passage flows for salmon and trout. Consider the target species and their life
history tactics with careful attention to approximate time frames for migration.
Adult salmonids are dependent upon their ability to migrate to spawning habitats at appropriate
times that coincide with their life history traits. If adult salmonids are unable or delayed in
reaching spawning habitats, the spawning population could be impacted, leading to reduced
egg and fry production. Juvenile salmon are dependent upon their ability to migrate from
freshwater riverine habitats (including lagoon habitats) to the ocean. Juvenile salmonids that
may rear in freshwater riverine and lagoon habitats (i.e. steelhead) for 1 – 3 years are
23

dependent upon their ability to access successful rearing habitats in the low-flow summer
months. This rearing habitat must have adequate flow (depth and velocity), food, water quality
(temperature), and escape cover from predators.
24

Glossary
Critical Riffle
Critical riffles are those riffle habitats which may be particularly sensitive to changes in stream flow due to shallow water depth, and as such may prevent adult salmon and steelhead fish passage to and from spawning areas and/or may prevent movement of rearing juvenile salmonids between adequate summer rearing habitats.
Discharge
The volume rate of water flow transported through a given cross-sectional area. The units that are typically used to express discharge include m3/s (cubic meters per second), and ft3/s (cubic feet per second).
Exceedance Probability Exceedance probability is the probability that a certain flow value is going to be exceeded.
Passage Flow The amount of flow identified to be maintained in the river channel for support of salmon and trout passage.
25

References
Flosi, G., S. Downie, J. Hopelain, M. Bird, R. Coey, and B. Collins. 1998. California Salmonid
Stream Habitat Restoration Manual, 3rd ed. California Department of Fish and Game. Available
online at: http://www.dfg.ca.gov/nafwb/manual.html.
Hardin, T. 2012. Personal communication with Tim Hardin, Instream Flow Specialist, Oregon
Department of Fish and Wildlife. July 2, 2012.
R2 Resource Consultants, 2008. Appendix G: Approach for Assessing Effects of Policy Element
Alternatives on Upstream Passage and Spawning Habitat Availability. R2 Resource
Consultants, Inc. March 14, 2008 Administrative Draft prepared for the California State Water
Resources Control Board, Division of Water Rights as part of the North Coast Instream Flow
Policy: Scientific Basis and Development of Alternatives Protecting Anadromous Salmonids.
Accessed from: http://www.swrcb.ca.gov/waterrights/water_issues/programs/instream_flows.
Thompson, K.E. 1972. Determining streamflows for fish life. pp. 31-50 in Proceedings of the
Instream Flow Requirement Workshop. Pacific N.W. River Basins Commission. Portland, OR.
26