standard bank group annual report 2005 - the vault standard bank group annual report 2005 contact...
TRANSCRIPT

Annual report 2005
Stand
ard B
ank G
roup
ann
ual rep
ort 20
05
www.standardbank.co.za
STD bank cover 15mm 4/3/06 5:47 PM Page 1

Standard Bank Group annual report 2005
Contact details
Chief financial officer
Simon RidleyTel: +27 11 636 3756e-mail: [email protected]
Registered address
9th FloorStandard Bank Centre5 Simmonds StreetJohannesburg 2001
PO Box 7725Johannesburg 2000
Group secretary
Loren WulfsohnTel: +27 11 636 5119e-mail: [email protected]
Contact details
Tel: +27 11 636 9111
Fax: +27 11 636 4207
e-mail: shareholder queries:[email protected]
e-mail: customer queries: [email protected]
Director, investor relations
Kim HowardTel: +27 11 636 7811e-mail: [email protected]
Printed by Ince (Pty) Ltd
Standard Bank Group annual report 2005
Contents
01 Financial highlights
02 Chairman and chief executive’s review
06 Economic review
08 Group at a glance
10 Financial objectives
12 Our vision and values
14 Executive management
16 Sustainability reporting – highlights
18 Operational reviews
18 Personal & Business Banking
22 Corporate & Investment Banking
26 Investment Management & Life Insurance
28 Board of directors
30 Corporate governance
45 Risk management and control
67 Financial review
84 Seven-year review
90 Financial definitions
91 Annual financial statements
92 Report of the independent auditors
93 Directors’ responsibility for financial reporting
93 Group secretary’s certification
94 Directors’ report
100 Balance sheet
101 Income statement
102 Statement of changes in shareholders’ funds
104 Cash flow statement
105 Accounting policies
124 Notes to the annual financial statements
178 Standard Bank Group Limited – company annual financial
statements
182 Annexure A – implementation of IFRS
193 Annexure B – currency balance sheet
194 Annexure C – subsidiaries
198 Annexure D – associates and joint ventures
200 Annexure E – equity-linked transactions
203 Additional information
203 Abridged financial statements of principal banking
subsidiary
204 Standard Bank operations average balance sheet
206 International representation
209 Shareholders’ information
210 Chairman’s letter to shareholders
211 Notice to members
215 Proxy form
218 Directorate
219 Shareholders’ diary
220 Shareholder analysis
221 Share statistics
222 Instrument codes
223 Credit ratings
ibc Contact details
Our stakeholders are our business.
STD bank cover 15mm 4/3/06 5:49 PM Page 2

S t a n d a rd Bank Group annual report 2005 P • 01
Headline earnings per share
Dividends per share
Normalised
Headline earnings and dividendsper share (cents)
99 00 01 02 03 04N 05N0
100
200
300
400
500
600
700
Normalised headline earnings 20%
Dividends 26%
CAGR (1999 – 2005):
N
Financial highlights
• Normalised1 ROE increased from 24,2% to
25,2%.
• Normalised1 headline earnings grew by 20%to R9 013 million.
• Normalised1 headline earnings per ordinary
share of 666,0 cents, 19% higher.
• The credit loss ratio improved from 0,43% to
0,41%.
• Total dividends declared grew by 15% to267 cents per share, a dividend cover ratio
of 2,5 times.
1Results normalised to reflect substance of Black Economic
Empowerment Ownership initiative and group shares held for
the benefit of policyholders, refer to page 75 for explanation.

S t a n d a rd Bank Group annual report 2005 P • 02
Chairman and chief executive’s review
Overview
In 2005, financial activity in emerging markets continued to
increase. Higher commodity prices, improved macroeconomics
and strengthening local currencies, which reduced fo r e i g n
currency debt burdens and dampened inflation, served to boost
investment ratings in key developing countries. This, coupled with
a growing appetite for diversified country risk among large global
investors in search of yield, resulted in intensified interest – and
competition – in emerging markets.
South Africa benefited from this trend. Underpinned by
consistently prudent monetary and fiscal policy, the economy
continued its structural move to lower inflation and interest rate
levels. South Africa’s improved investment ratings and some high
profile foreign direct investment inflows enhanced its global
standing.
For financial services, conditions have been buoyant in South
Africa, the group’s largest market. Sustained growth in consumer
spending drove credit demand and strong growth was posted
across the full spectrum of retail banking. After a slow start,
corporate lending increased momentum towards the end of 2005.
Equity markets performed strongly with the local bourse, the JSE
Limited, recording a 43% increase in the All Share Index in 2005.
Performance
The Standard Bank Group was well positioned to capitalise on
these favourable macroeconomic conditions and exceeded its
principal financial objectives for 2005 – growing normalised
headline earnings per share by 19% and achieving a normalised
return on equity (ROE) of 25,2%.
In 2005, the re-alignment of executive focus areas and reporting
lines has been implemented to support the group’s growth
objectives and to provide more flexibility for the deployment of
capital, particularly against the backg round of the recent
dispensation announced by the Minister of Finance. T h i s
dispensation allows a portion of a bank’s assets to co m p r i s e
exposures in the rest of Africa and, to a lesser extent, internationally
without Exchange Control approval.
The re-alignment involves the de-emphasis of geogra p h i c a l
segmentation of businesses in favour of focusing on the three key
business segments of the group: Personal & Business Banking,
C o r p o rate & Investment Banking and Investment Management &
Life Insurance. This refocusing enables the leveraging of skills,
e conomies of scale and synergies, regardless of geogra p h y, and
facilitates enhanced customer focus. It is anticipated that the
financial results of the group will be presented on this basis fro m
2006 onwards. For 2005, however, the geographical segmentation
has been maintained.
On this new basis, Personal & Business Banking comprises 44% of
the group’s headline earnings, and grew these earnings in 2005
by 22%. Corporate & Investment Banking comprises 45% and
grew by 7%, and Investment Management & Life Insurance
comprises 7% and grew by 51%.
In South Africa, Personal & Business Banking enjoyed another
good year, with the benefits of strong asset growth more than
offsetting the effects of tighter margins and higher credit
provisioning. Overall, the division maintained a strong focus on
s e rvice levels and operational efficiencies, notwithstanding
increased business volumes and compliance requirements.
In the rest of Africa, earnings growth was somewhat lower than
that of recent years as management attention was somewhat
deflected by the need to focus on the alignment of products,
policies, procedures and systems with those of the South African
operations.
Corporate & Investment Banking in South Africa generated a
better than expected 15% earnings growth, off a high base, while
internationally, earnings contribution was 28% lower through the
combination of lower proprietary trading profits and significantly
increased competition in emerging markets.
Whereas the group’s growth has beenlargely organic for the last number ofyears, we are confident that it is wellpositioned to grow acquisitivelyoutside South Africa.
Jacko Maree
Chief executive officer
Derek Cooper
Chairman

S t a n d a rd Bank Group annual report 2005 P • 03
Liberty Life, the group’s life insurance arm, reported a substantial
increase in earnings despite a significant provision for potential
costs arising from the Statement of Intent relating to the Pension
Fund Adjudicator (PFA) rulings. Highlights of Liberty Life’s results
included improved investment returns and strong growth in new
business.
Strategy
Over the last number of years, the Standard Bank Group has
consolidated its position as a diversified business with a strong
capital position and proven track record in South Africa. We
believe we have a significant talent base and have structured the
group to deploy key skills across its operations. The functional
overlaps and redundancies that previously existed have been
steadily eliminated to achieve efficient operating structures. We
have also focused on implementing a custo m e r-centric and
service-driven model in all our businesses.
As part of the recent structural re-alignment of our businesses,
we have identified opportunities to leverage off our existing
infrastructure and specific country knowledge across emerging
markets.
Driving organic growth
A key growth challenge for Personal & Business Banking in South
Africa is to find ways to extend appropriate and affordable
financial services to the un-banked and under-banked market
segments. The division continued to attract customers through
various targeted products. Since it introduced the Standard Bank
Mzansi Blue Account in October 2004, over 300 000 Mzansi
clients have been acquired.
A related challenge is the increasing complexity of regulatory
frameworks to protect the consumer and the associated costs of
compliance, which had to be balanced against the need to simplify
products and pricing structures for mass market customers.
As a bank committed to providing access to financial services for
all South Africans, our guiding principles when structuring
our prices are to ensure affordable banking products across a
b road customer base, balanced against the sustainable
profitability of our business. This balance is reflected in the
average increase in our bank charges for personal transactional
accounts for 2006 falling below the inflation rate.
Standard Bank has continued to invest in initiatives to broaden its
distribution reach and deal with the threat of disintermediation. It
has entered into partnerships and alliances that allow it to grow
market share through new distribution mechanisms, such as
banking by mobile phone, or to acquire access to the established
customer bases of retailers to grow product categories such as
credit cards and consumer finance. Specific examples of these
initiatives are provided in the operational reviews.
The group’s African operations are continually improving, having
been integrated by business line into the group structure. A key
objective of this process has been to align the African operations
with our South African operating standards, and good progress has
been made in this regard. The optimisation of both Personal &
Business Banking and Corporate & Investment Banking in
different countries, relative to their operational maturity and
market opportunities, continues and areas of furt h e r
i m p rovement have been identified. The launch of personal
lending products in seven African countries is planned in 2006.
In South Africa, infrastructure and empowerment financing are
the main growth areas for Corporate & Investment Banking as the
socioeconomic development of South Africa and the continent
accelerates.
Escalating acquisitive growth
Whereas the group’s growth has been largely organic in recent
years, we are confident that we are now well positioned to grow
acquisitively outside South Africa. The experience and expertise in
the group, together with its presence on the ground across a
broad geographic footprint, enables us to adopt a bolder line in
our African and international strategy.
Our growing experience brings with it a better ability to identify
and pursue new growth opportunities. Having built a track record
in both Personal & Business and Corporate & Investment Banking,
we have a comprehensive range of competencies that are
transportable and exportable. We believe we understand the
complexities of operating in emerging markets, and the
challenges in building an internationally competitive group while
responding to the developmental needs in emerging economies
and societies.
Based on this, we have allocated the necessary senior resources
to evaluate countries, markets and companies to seek value
accretive acquisitions.
In December 2005, Standard Bank, with a consortium of local
i n v e s tors, entered into an agreement to buy BankBosto n
Argentina from Bank of America. This transaction remains subject
to fulfilling the p rovisions of the agreement and obtaining the
n e c e s s a ry regulato ry approvals in South Africa and A rgentina. T h e
acquisition is only expected to be concluded in the third quarter of
2006 and is not anticipated to materially affect the coming year’s
results. Although we are well aware of the potential challenges, this
acquisition provides us with a relatively low cost opportunity to
d e m o n s t rate our ability to grow in emerging markets.
Given the importance of Nigeria, we have invested approximately
USD185 million in our existing banking operation to meet the
new minimum capital requirement set by the Central Bank of
Nigeria. This enables us to continue to evaluate suitable
acquisition opportunities in this important market.

Chairman and chief exe c u t i v e ’s review co n t i n u e dc e m b e r 2 0 0 5
The integration of Capital Alliance Holdings Limited (CAHL) into
Liberty Life is on track and benefits are beginning to be extracted.
Capital and dividend cover
The group remains strongly capitalised despite healthy growth in
risk-weighted assets and a reduced dividend cover. In light of the
g ro wth experienced and our plans to expand the gro u p ’ s
international footprint, the current dividend cover of 2,5 times
calculated on normalised headline earnings per share is
considered appropriate.
Corporate governance and directorate
The group continues to maintain high standards of co r p o ra t e
governance and complies with the requirements of the Code of
C o r p o rate Practices and Conduct (King Code). This includes our
commitment to advancing the principles and practice of sustainable
development. The co r p o rate governance overv i e w, starting on page
30 of this report, provides a concise update on our governance
structures and undertakings. Further detail on co r p o ra t e
governance can be found in our 2005 Sustainability and Black
E conomic Empowerment Report (Sustainability Report).
It is worth commenting on the ownership structure of Libert y
Holdings which has given rise to some criticism about its implications
for co r p o rate governance. The issue has been properly addressed
with the Liberty Holdings and Liberty Life boards conducting their
own assessments. As the parent entity, Standard Bank paid a
premium for co n t rol of Liberty Life, which it wishes to maintain. A l l
the relevant boards have agreed that it is in the best interests of all
the shareholders concerned to maintain the current structure.
Conrad Strauss retires as director of the group at our forthcoming
annual general meeting. He has been with the group for over
43 years in influential leadership positions, culminating in his
appointment as chairman in 1992, a position he held for 10 years.
We thank him for his valued service and counsel. Trevor Evans has
resigned as a director of the group effective 8 March 2006 – we
thank him for his contribution at both board and board committee
level.
Sustainability
Fundamental to our ability to grow over the long term is our status
as a corporate citizen. We acknowledge our responsibility as a
major organisation to remain accountable to various stakeholders
for our financial and non-financial impacts in all the markets in
which we operate.
Moreover, we embrace our role as an active participant in
socioeconomic development in South Africa – from business
i m p e ratives like implementing the Financial Sector Chart e r
(charter), to broad-based corporate social investment.
Implementing the charter was a feature of the year for the sector.
Standard Bank has made sound progress in meeting its charter
commitments and looks forward to reporting against a finalised
scorecard.
We continued to implement our Black Economic Empowerment
Ownership (Tutuwa) initiative and completed the seco n d
allocation of shares to black managers in 2005. The third
allocation will be made in 2006. Since we announced this
initiative in July 2004, the Standard Bank share price has risen
substantially, creating considerable value for black employees
included in the initiative.
Considerable planning has gone into the last phase of the
initiative – the regional business and community allocation – to be
implemented in 2006. Half of this allocation is to be made to
a p p roximately 250 black small and medium enterprises, as
defined by the charter, who employ 10 or more people. We
believe that nurturing entrepreneurial activity is critical to address
the national priorities of job creation and sustainable economic
growth in South Africa. The other half will be allocated to social
development pro g rammes that are primarily directed at
developing and empowering previously disadvantaged
communities.
Standard Bank’s vision statement recognises that its people are its
most important competitive advantage, and ongoing focus is
given to building stronger and deeper teams of talented people.
We recognise that continual improvement is required in our
people management processes to ensure we attract and retain
talent. Among other initiatives, new management review
processes were implemented in 2005, which will provide a
yardstick for ongoing improvements.
We direct stakeholders to our Sustainability Report, which
incorporates a Financial Sector Charter Report, for comprehensive
information on the group’s non-financial performance.
Brand development
The Standard Bank brand, rated the most valuable brand in South
Africa's Most Valuable Brands survey conducted by Interbrand
Sampson, is being repositioned to make it more relevant to the
local and international markets in which we operate. As a unitary
brand, it is important to ensure a single, unified positioning and
consistent brand experience across our operations.
As part of the repositioning, we are replacing our advert i s i n g
payoff line “Simpler. Better. Fa s t e r.” with the more relevant
“Inspired. Motivated. Involved”. Although the previous payoff line
s e rved us well for many years, we operate in a highly co m p e t i t i v e
e n v i ronment and must stay abreast of constantly evolving
stakeholder needs. Following a comprehensive stakeholder
feedback process, the new payoff line was chosen to encapsulate
the essence of what we are trying to achieve – to make a real
S t a n d a rd Bank Group annual report 2005 P • 04

difference to the lives of our customers, shareholders, employees
and other stakeholders in all the markets we operate in.
Prospects
The Personal & Business Banking division is set to continue
benefiting from sustained positive economic fundamentals in
South Africa, as well as the increased economic development and
organic business growth anticipated across the African continent.
Corporate & Investment Banking should benefit from potential
g ro wth in South African infra s t r u c t u ral and empowerment
financing, and increasing corporate credit demand. As we improve
our regional infrastructure and trading teams across our emerging
markets footprint, the division should be well placed to take
advantage of opportunities in our chosen markets.
Investment Management & Life Insurance earnings may be lower
in 2006 due to the potential impact of a lower assumed equity
and bond market performance although real growth in embedded
value and dividends should be achieved.
Taking the above factors into account, we believe that the group’s
diversified business spread will underpin returns to shareholders
in 2006 that are in line with our principal financial objectives of
normalised ROE of 24,0% (revised upwards) and normalised
headline earnings per share growth of South African inflation
(CPIX) plus 10 percentage points.
Conclusion
In South Africa, Standard Bank is a strong competitor across the
financial services spectrum. But we know we must anticipate and
stay responsive to changing needs and expectations to maintain
our position in increasingly competitive markets. In Africa, we are
becoming a better and bigger contender as we leverage our
abilities to provide solutions across the banking spectrum. In other
emerging markets, we are positioned to pursue attractive organic
and acquisitive growth opportunities.
We believe we have the ability to move beyond the longer-term
constraints of being a major financial services group in a relatively
small economy. We are well aware that a bolder approach is
required outside South Africa to continue to deliver our financial
and strategic objectives.
It is important to note our firm intention to remain based in and
focused on South Africa. Standard Bank has played a central role
in the development of the southern African economy for more
than 140 years. It has done this by constantly aligning its
presence in the marketplace to the evolving needs of the
economy, and delivering relevant banking and financial services.
Standard Bank will continue to play this role and will stay listed on
the JSE Limited and headquartered in downtown Johannesburg.
The astute non-aligned positioning achieved by the Government
since 1994 facilitates our acceptability as an investor and
business partner in other developing countries. Furthermore, the
products and services developed for the South African market
tend to be suitable for developing countries both in Africa and
beyond.
As we grow, through organic expansion or acquisition, we will stay
true to our values. These values reflect the character of Standard
Bank built up over many years of operation, and were updated in
2005 to ensure relevance to both our people and markets. They
form the ethical backbone that makes Standard Bank what it is
across all operations in all territories. Within this framework, we
will continue to work hard to understand and internalise that
which is culturally appropriate in different countries.
Acknowledgements
Our sincere thanks go to our customers, staff and other
stakeholders for their continued support over the last year, which
has enabled us to deliver an excellent set of financial results and
substantive progress across our businesses. We look forward to
another year of creating value for all stakeholders and assure you
that we guard against the dangers of arrogance and complacency.
The guidance and support of our board gives us added confidence
in believing that we have the skills and resources to take Standard
Bank to the next level.
Derek Cooper
Chairman
Jacko Maree
Chief executive officer
S t a n d a rd Bank Group annual report 2005 P • 05

S t a n d a rd Bank Group annual report 2005 P • 06
Economic review
Resilient global economy in 2005
A fter expanding by 5,1% in 2004, the world economy is
estimated to have grown by 4,3% last year. In the face of record
high oil prices and despite mounting global imbalances, corporate
p rofitability remained firm, bond yields low and underlying
inflation muted. The global economy’s resilience in 2005 was
centrally tied to excess market liquidity brought about by the
major central banks’ monetary accommodation.
The United States led the positive economic performance, while
the Japanese and Euro-zone economies showed identifiable signs
of recovery. Of the East-Asian economies, China aggressively
leveraged its export prowess, while India benefited from external
cyclical stimuli. Relative to other emerging markets, by recent
historical contrast, Latin America and Africa recorded above-
average economic performance.
Sustained, firm growth for major economies
In 2006, the global economy is likely to closely match the growth
rate recorded in 2005, aided by the increasing thrust from
Germany and Japan.
Aggressive restructuring by firms in conjunction with moderate
wage increments should help Germany expand at twice the pace
it did in 2005 and, accordingly, act as Europe’s growth engine.
Japan’s economy should find relief from the combination of rising
personal incomes, company profitability and sustained
accommodative monetary policy. Japan’s investment cycle should
underpin future growth.
Meanwhile, the United States is expected to maintain its
established performance, despite the successive increments in
short-term interest rates since June 2004. Prospective economic
growth should be supported by healthy employment and income
growth, strengthening capital expenditure and a firm external
dynamic.
Favourable prospects for emerging economies
E m e rging economies have profited from the benign global
conditions in recent years. Investment inflows to these markets,
aided by global liquidity and enhanced investor risk appetite, have
buoyed economic growth. Also, strengthening local currencies
reduced foreign-currency debt burdens and dampened inflation.
C o n s e q u e n t l y, many emerging economies have experienced
structural changes.
The outlook for emerging economies in 2006 is reasonably
positive, given the excess global market liquidity. However, in
some markets, concerns will centre on overvalued local currencies
and prudent monetary management as foreign capital flows
inwards.
Among the key markets, the Chinese and Indian economies are
likely to expand by 8,5% and 6,5% respectively in 2006, both
modestly softer than in 2005. In China, exports are showing signs
of fatigue and the fixed investment cycle is straining due to
overcapacity and falling profits. In India, a likely rise in short-term
rates will weigh on the strong leveraged consumption growth,
although the economy should be cushioned by a pick-up in
corporate investment.
Russia’s economy is extremely energy-dependent and a buoyant
commodity cycle will sustain growth momentum. Strong export
income has raised Russia’s domestic demand and consumer
confidence is high. Latin America should be supported by positive
global conditions and should record above-trend growth. Africa
also appears to be establishing superior trend gro wt h ,
strengthened by a more productive political and macroeconomic
profile as well as lively commodity markets. Debt relief should
unlock financial resources for social and infrastructure investment.
South Africa’s internal growthdynamic, on the back of stronghousehold expenditure, was themainstay of its economic performancein 2005.
Goolam Ballim
Group economist

S t a n d a rd Bank Group annual report 2005 P • 07
Positive outlook for South Africa
A benign global environment bodes well for South A f r i c a .
Domestic export growth was reasonably healthy in 2005 because
of firm global aggregate demand and the strong commodity cycle,
despite a generally strong rand. The expected recovery in Europe
should be positive for the local economy as Europe absorbs more
than one-third of South Africa’s manufacturing output.
South Africa’s internal growth dynamic, on the back of strong
household expenditure, was the mainstay of its eco n o m i c
performance in 2005. In 2006, households’ real income growth
should slip, but only moderately. Household credit demand is
likely to move sideways. Households have also found relief in tax
and interest rate reductions. The fixed investment cycle is likely to
surge and therefore contribute more to total output this year,
especially as the private sector is more enthused and the public
sector has a renewed focus on meeting delivery targets. South
Africa’s economy is therefore expected to expand by 4,8% in
2006, about matching last year’s vigorous performance.
Households’ demand for credit has risen appreciably over the last
two years – the aggregate household debt to income ratio has
risen from 53,9% in the first quarter of 2004 to 65,6% in the last
three months of 2005. Notably, though, households’ debt finance
costs as a proportion of income rose far less sharply, from 6,3% to
7% over the period. Fundamentally, this reflects the favourable
impact of the structural decline in interest rates on debt
affordability, and the prospect that further credit deepening can
be absorbed by the economy.
In summary, the South African economy is underpinned by
responsive monetary and fiscal policies, as well as a developing
and constructive structural strategy. Other emerging economies
generally also demonstrate healthy internal growth dynamics, and
will benefit from a benign global economic climate. Africa is
leveraging the heightened demand for resources and, coupled
with an improving political and economic context, should grow
faster in 2006.
There are, however, a few notable assumptions underlying this
baseline scenario:
• the normalisation of excessive US consumption, alongside
increased internally generated demand and reduced savings
in Asia, will be orderly;
• any slackening in global residential property markets will not
be perceptible;
• China’s pending slowdown must not be marked;
• oil quotes must not experience renewed and sustained
surges; and
• the US dollar must not fall sharply.
Global economic growth could fall significantly should these
assumptions not materialise, and the world economy is perhaps
more fragile than it was in 2005.
-2
-1
0
1
2
3
4
5
South Africa GDPand expenditure contribution (%)
98 99 00 01 02 03 04 05E 06F
GDP growth
Household spending (contribution to growth)
Fixed investment (contribution to growth)
Estimate
Forecast
E
F
98
2
3
4
5
6
7
8
99 00 01 02 03 04 05E 06F
World
Emerging economies
Africa
Estimate
Forecast
Real GDP growth (%)
E
F
Source: World Economic Outlook – September 2005 IMF
Sources: SA Reserve Bank, Standard Bank

S t a n d a rd Bank Group annual report 2005 P • 08
Normalised headline earnings contributionby major product areas (%)
Personal & Business Banking 44% (2004: 44%)
Corporate & Investment Banking 45% (2004: 50%)
Investment Management & Life
Insurance 7% (2004: 5%)
Central and other 4% (2004: 1%)
Normalised headline earnings contributionby geographic business unit (%)
Personal & Business Banking SA 41% (2004: 40%)
Corporate & Investment Banking SA 36% (2004: 37%)
Rest of Africa 8% (2004: 8%)
Corporate & Investment Banking International 5% (2004: 9%)
Liberty Life 6% (2004: 5%)
Stanlib and other 4% (2004: 1%)
Group at a glance
Personal & BusinessBanking
Banking and other financial services to
individual customers and small to medium-
sized enterprises throughout South Africa
and in the rest of Africa.
C o m m e rcial and investment banking
s e rvices to larger co r p o rates, financial
institutions and international co u n t e r-
parties focused on emerging markets.
Life insurance and asset management
activities by group companies Liberty Life
and Stanlib.
Corporate & InvestmentBanking
Investment Management& Life Insurance
Personal & BusinessBanking SA
Corporate & Investment Banking SA
Corporate & Investment Banking International
Rest of Africa Stanlib
Liberty Life

S t a n d a rd Bank Group annual report 2005 P • 09
• Listed on JSE Limited, share code SBK.
• Market capitalisation R103 billion
(USD16 billion).
• Total assets R756 billion (USD119 billion).
• Operates in 17 African countries and
21 countries outside Africa.
• 40 245 employees, 32 632 in South Africa.
• 746 branches in South Africa, 238 in the
rest of Africa.
• 3 768 ATMs in South Africa, 383 in the
rest of Africa.
Our people are our greatest asset.

0
5
10
15
20
25
30
1999
Target – as disclosed in each annual report
Actual
Normalised
Return on equity (%)
2000 2001 2002 2003 2004N 2005N
N
0
5
10
15
20
25
30
1999
Headline earnings per share growth (%)
2000 2001 2002 2003 2004N 2005N
Target – assumed target of CPIX plus 10%
Actual
Normalised
Target – assumed target of CPIX plus 10%
Actual
NormalisedN
Financial objectives
S t a n d a rd Bank Group annual report 2005 P • 1 0
Performance against 2005 objectives1
2005 2005 2005
IFRS Normalised Objective
% % %
Return on equity 27,8 25,2 22,5
Headline earnings per share growth 23,1 19,3 13,92
Cost-to-income ratio 56,6 ≤55,5
Credit loss ratio 0,41 <0,75
1The group’s 2005 performance against objectives is discussed on page 70 in the financial review.
2Average CPIX for 2005 of 3,9% plus 10,0%.

S t a n d a rd Bank Group annual report 2005 P • 1 1
2006 objectives
• Normalised return on equity of 24,0%.
• Normalised headline earnings per share growth
to exceed domestic CPIX by 10 percentage
points.
• Credit loss ratio to be contained within 0,75% of
average advances.
• Cost-to-income ratio to be at or better than
55,5%.
Medium!term objectives
• Normalised return on equity of 22,5%.
• Normalised headline earnings per share growth
to exceed domestic CPIX by 10 percentage
points.
• Credit loss ratio to be contained within 1,00%
of average advances.
• Cost-to-income ratio to reflect a continuous
improvement over the medium term.
We are committed to providingappropriate long-term returns toour shareholders.
We understand that we earn the right to exist by providingappropriate long-term returns to our shareholders.

S t a n d a rd Bank Group annual report 2005 P • 1 2
Our vision and values
We are passionateabout serving ourcustomers.
Early in 2005 a launch of the group’s revised visions and values wascompleted. This entailed 15 presentations in South Africa, eight inthe rest of Africa, and two internationally to a total of 28 000employees by the chief executive, Jacko Maree.

S t a n d a rd Bank Group annual report 2005 P • 1 3
Our vision
Our values
• Serving our customers
We do everything in our power to ensure thatwe provide our customers with the products,services and solutions to suit their needs,provided that everything we do for them isbased on sound business principles.
• Growing our people
We enco u rage and help our people todevelop to their full potential, and measureour leaders on how well they grow andchallenge the people they lead.
• Delivering to our shareholders
We understand that we earn the right to existby providing appropriate long-term returns toour shareholders. We try extremely hard tomeet our various targets and deliver on ourcommitments.
• Being proactive
We strive to stay ahead by anticipating ratherthan reacting, but our actions are alwayscarefully considered.
• Working in teams
We, and all aspects of our work, arei n t e rdependent. We appreciate that, as teams,we can achieve much greater things than asindividuals. We value teams within and acro s sbusiness units, divisions and co u n t r i e s .
• Guarding against arrogance
We have confidence in our ability to achieveambitious goals and we celebrate success,but we must never allow ourselves to becomearrogant.
• Respecting each other
We have the highest regard for the dignity ofall people. We respect each other and whatStandard Bank stands for. We recognise thatthere are corresponding obligationsassociated with our individual rights.
• Upholding the highest levels of integrity
Our entire business model is based on trust andintegrity as perceived by our stakeholders,especially our custo m e r s .
• We are committed to making a real difference to
financial services in South Africa and other
e m e rging markets.
• We will ensure long-term sustainability by
harmonising the needs of our customers, our
people and our shareholders and by being relevant
to the societies in which we opera t e .
• We will only succeed if we are able to attract,
retain, develop and deploy teams of people with
energy, passion and skills.

S t a n d a rd Bank Group annual report 2005 P • 1 4
Executive management
Delivering good results through living the group’s vision and valuesremains the driving force for our executive management team.
Rob Leith (43)Chief executive – Corporate & InvestmentBanking International
BCom (Hons) (Cape Town), CA (SA)
Joined the group 1991, appointed to exco2003
Chris Lombard (59)Leadership Development and Training
BA (Hons) (Stellenbosch), PMD (Harv a rd )
Joined the group 1978, appointed to exco1995
Jacko Maree (50)Group chief executive
BCom (Stellenbosch), MA (Oxford),PMD (Harvard)
Joined the group 1980, appointed to exco1995
David Munro (35)Deputy chief executive – Corporate &Investment Banking SA
BCom (PGDA) (Cape Town), CA (SA),AMPC (Harvard)
Joined the group 1996, appointed to exco2004
Tina Eboka (46)Corporate Affairs
BS Applied Mathematics (New York),BS Textile Engineering (Philadelphia), MBA (Philadelphia), SEP (Harvard)
Joined the group 2005, appointed to exco2005
Arnold Gain (51)Credit
BCom (Hons) (Cape Town)
Joined the group 1994, appointed to exco2005
Ben Kruger (46)Chief executive – Corporate & InvestmentBanking
BCom (Hons) (Pretoria), CA (SA),AMP (Harvard)
Joined the group 1985, appointed to exco2000

S t a n d a rd Bank Group annual report 2005 P • 1 5
Sipho Ngidi (50)Human Resources
BAdmin (Zululand), BCom (Hons) (Natal)
Joined the group 2001, appointed to exco2001
Simon Ridley (50)Finance
BCom (Natal), CA (SA), AMP (Oxford)
Joined the group 1999, appointed to exco2002
Myles Ruck (50)Chief executive – Liberty Life
BBus Sc (Cape Town), PMD (Harvard)
Joined the group 1985, appointed to exco1996
Myles Ruck has decided to re t i re with effe c tf rom 31 May 2006. Bruce Hemphill has beenappointed as chief executive of Liberty Lifewith effect from 1 June 2006.
Paul Smith (51)Risk
BCom (Natal), CA (SA)
Joined the group 1997, appointed to exco1999
Sim Tshabalala (38)Deputy chief executive – Personal & BusinessBanking
BA LLB (Rhodes), LLM (University of NotreDame USA), H Dip Tax (Wits)
Joined the group 2000, appointed to exco2001
Peter Wharton!Hood (40)Chief executive – Personal & BusinessBanking
BCom (Hons) (Wits), CA (SA)
Joined the group 1997, appointed to exco1999

Sustainability reporting – highlights
S t a n d a rd Bank Group annual report 2005 P • 1 6
This summary sets out the group’s sustainability highlights in 2005 and what we aim to achieve looking ahead. A complete Sustainability
and Black Economic Empowerment Report has been included in electronic format with this report. It can also be accessed on our corporate
website www.standardbank.co.za. Printed copies of the report can be requested from the group secretary (see inside back cover for contact
details).
Highlights
Corporate governance
• The successful launch of the bank’s revised vision and values focused on aligning high standards of governance and ethics with daily
operational realities.
• The bank kept pace with the implementation of new regulatory frameworks, including Financial Intelligence Centre Act (FICA), Financial
Advisory and Intermediary Services Act (FAIS) and the Protection of Constitutional Democracy Against Terrorist and Related Activities
Act.
• The bank was included on the JSE SRI Index (JSE Limited Socially Responsible Investment Index) and the Dow Jones Sustainability
Index.
Economic performance and contribution
• Group financial performance was in line with stated targets.
• Wealth created by the group increased by 11% to R23 billion, with 43% allocated to employees; 14% to governments; 18% to
shareholders; and 25% retained to fund future growth.
• Good progress was made towards meeting charter targets. In 2005 we achieved an audited score of 80,73% and an A rating (still to
be confirmed by the governing body of the charter).
• The value attributable to staff participating in the Tutuwa initiative amounted to R1,5 billion at year end.
• The bank was involved in empowerment financing deals worth R8,6 billion in 2005.
• Standard Bank was rated South Africa’s most valuable brand (worth R10,2 billion) in South Africa’s Most Valuable Brands survey,
conducted by Interbrand Sampson.
• Five supplier summits that focused on improving supply chain management and supplier transformation were held across the country.
Social performance
• The bank extended its financial services reach in South Africa through various products including MTN Banking and the Mzansi Blue
Account.
• Employment equity targets in 2005 for gender and racial representation were reached. The percentage of black managers in South
Africa has increased from 19% in 2000 to 37% in 2005.
• A health risk management programme was adopted by the bank to assist in guiding employees toward a healthier lifestyle.
• The bank spent R60 million on social responsibility initiatives.
• Liberty Life spent R18 million on social responsibility initiatives.
Environmental performance
• The bank formalised an environmental policy and compiled an environmental legislation register.
• The bank was involved in the financing, development and successful inauguration of a Geothermal Power Project in Nicaragua.
• A new Occupational Health and Safety learning programme was developed.

S t a n d a rd Bank Group annual report 2005 P • 1 7
We will ensure long-termsustainability by harmonisingthe needs of our custo m e r s ,our people and ourshareholders and by beingrelevant to the societies inwhich we opera t e .
Looking ahead we will:
• Continue to embed sustainability thinking and practice across all operations.
• Continue the process of reaching our charter targets.
• Continue to improve people management to make Standard Bank an employer of choice.
• Encourage employees to live the values.
• Continue making our values a definitive part of the Standard Bank brand experience for all stakeholders.
• Finalise a revised code of ethics to align with our values.

Operational review: Personal & Business Banking
Overview
The group’s Personal & Business Banking franchise continues to
develop, a process facilitated by the economic tailwind in the
South African market. Over the past three years the division has
rebuilt its domestic market shares across most deposit and loan
categories in line with its branch representation, and its systems
and processes continue to be upgraded.
Steady improvements in its customer segmentation capabilities
and customer service focus has enabled the division to steadily
eliminate potential disconnects between customer needs and the
appropriate products and distribution channels, while continuing
to simplify and streamline value propositions and cost structures.
These achievements allowed the division to capitalise on the
excellent conditions for retail banking in South Africa in 2005,
with healthy consumer fundamentals underpinning stro n g
t ransactional and lending gro wth. The division was able to
maintain high customer service levels despite significantly
increased business volumes and compliance requirements.
Although the credit environment in South Africa remained benign,
the division has continued to improve its credit systems and
collections capabilities, in part through new technology. This has
positioned it well to support the growth in targeted product
categories, such as credit cards, as well as to deal with a more
challenging credit environment expected to materialise in due
course.
Given the increasing mismatch between retail asset growth and
retail deposits, necessitating the utilisation of more expensive
wholesale funding, the division has concentrated on improving its
deposit gathering capabilities to ease margin contraction. Market
share of deposits has increased to 27% from 24% in 2002.
A key focus area for the year was restructuring the branch
network and head office to eliminate functional overlaps and raise
employee productivity. Executive responsibilities were redefined
to clarify lines of accountability and authority, and ensure the
n e c e s s a ry strategic focus to continue driving gro wth in an
increasingly competitive South African market.
In the rest of Africa, sustained disinflation and positive GDP
growth trends were experienced although decreasing country
treasury bill rates resulted in margin contraction, which was
exacerbated by the low loan to deposit ratio characteristic of
banking in most African countries.
Management invested considerable time and focus integrating
co u n t ry operations into the group structure. Management
structures were streamlined and in-country finance and banking
skills strengthened, and good progress was made upgrading
systems and standardising processes.
The combination of better macro e conomic conditions and
operational improvements underpinned good growth in fee and
commission revenue.
Strategy
Growth opportunities through partnerships
Partnerships and alliances have become an important way to
advance market penetration and customer acquisition as well as
deal with disintermediation.
SA Home Loans, a residential mortgage-backed securitisation
company that is 43% owned by Standard Bank, was the first non-
bank mortgage lender in South Africa. Since inception in 1999, it
has securitised five tranches of its debtors’ book with a total value
of around R10 billion. It has recently introduced a fixed rate
20-year mortgage product, and continues to improve its
turnaround times and efficiencies.
In 2005, we partnered with Edcon, one of South Africa’s leading
retailers, to provide a pre-approved credit card to qualifying
customers. Edcon currently has in excess of 3,8 million store-card
customers, of which 68% do not have a bank credit card. This
venture has provided a means to lower barriers of entry in this
category and leverage popular brands to attract new customers.
The joint venture has performed well, achieving sales of 300 000
cards and debtor balances of R500 million in four months.
To increase its involvement in the consumer finance secto r, the
division acquired an interest in RCS Investment Holdings fro m
Foschini, another leading local retailer. RCS has a personal loans
business and offers credit cards to merchants outside the Fo s c h i n i
G roup. RCS has a five-year track reco rd and a customer base of
a round 160 000. The RCS business will combine the best practice in
the Foschini Group gained through many years of consumer lending
in the South African middle market with Standard Bank’s banking
e x p e rtise. This will enable this business to explore new co n s u m e r
lending possibilities and gain a bigger share of this important market.
Extending financial services reach
Extending the reach of financial services in South Africa is a key
challenge, compounded by increasingly complex and co s t l y
regulatory obligations. In this environment, ongoing development
is required to design and deliver simple, cost-effective products
and services wanted by the emerging customer which constitutes
an important component of our customer base.
Specific focus was given to growing our presence in un-banked and
u n d e r-banked market segments in 2005. Since the introduction of
the Standard Bank Mzansi Blue A ccount in October 2004, the bank
has acquired in excess of 300 000 Mzansi clients representing a
market share of 15% which, considering the Postbank’s larg e
presence in this product, is satisfacto ry.
S t a n d a rd Bank Group annual report 2005 P • 1 8

S t a n d a rd Bank Group annual report 2005 P • 1 9
During 2005, the bank announced a 1,3% price increase in fees
on the Mzansi account, as well as a 3,1% increase in our
transactional E Plan savings and investments accounts, which are
t a rgeted at low-income customers. Va l u e - fo r-money pricing
continues to be a priority.
In our constant drive to provide affordable products and services
to all our customers, opportunities to establish lower- co s t
distribution channels beyond the branch network are provided by
new technologies. Standard Bank’s joint venture with mobile
telephone operator MTN to offer MTN Banking was a first of its
kind mobile banking solution. Its SIM card embedded banking
functionality provides a new level of convenience, enabling
a ccounts to be opened and activated telephonically within
minutes. It is among the most widely accessible banking products
in South Africa. Although uptake has been slower than
anticipated, with appropriate education and marketing this
product should provide a viable option for previously un-banked
customers. With MTN’s vast reach into Africa, we expect this
partnership to create further opportunities for Standard Bank to
increase its market share across the continent.
Shift in international strategy
Providing an important basis for our growth strategy in Personal &
Business Banking are the banking commonalities that exist in
developing countries. These include emerging classes of
borrowers, under-serviced regions and a desire for reasonably
priced and reliable banking services. We believe that the
successes achieved – and lessons learned – in South African retail
banking can be replicated in other emerging markets. This can be
achieved on a modular basis, increasing the flexibility we have to
create and unlock value in other emerging markets.
As such, our strategic approaches to achieving retail growth across
the group’s emerging markets footprint can be described as
follows:
• “Optimise to gro w ” – applicable in markets defined by mature
i n f rastructure and operational stability, such as South Africa. In
these markets, our strategic focus is on retaining existing
c u s tomers, growing market share, building volume in pro f i t a b l e
segments, extracting efficiencies and optimising operations.
• “Invest to grow” – applicable in markets with potential upside
for economic growth, such as Angola. These markets tend to
be characterised by low Standard Bank penetration, non-
integrated systems, and customer service and satisfaction that
could be markedly improved. Alternatively, they are markets
where we would like to be represented but there are no
acquisition opportunities available. Here, it is necessary to
establish infrastructure and drive organic growth to build
market share.
• “A c q u i re to grow” – applicable in markets where Standard Bank
is under-represented relative to the co u n t ry’s economic potential
and where there are attractive acquisition opportunities, such as
Nigeria and A rgentina. These are strategic markets for long-term
g ro wth, where South African expertise can add value.
Executive focus and resources have been allocated to acc e l e ra t e
this international gro wth stra t e g y. The group’s existing geogra p h i c
footprint provides the basis for this gro wth plan, and gro wth in
Personal & Business Banking will be leveraged off our existing and
expanding Corporate & Investment Banking presence.
Financial performance
Personal & Business Banking generated 44% of the group’s
headline earnings, and grew earnings by 22% in 2005. The
division achieved an ROE of 30,9% and reduced its cost-to-
income ratio from 62,8% to 60,0% in 2005.
Operational performance
South Africa
Home loans
The division continued to benefit from the domestic housing
boom, with property prices up 21% in 2005 on 2004 and
substantial growth in industry-wide mortgage lending. Standard
Bank grew its mortgage book by 32%, with registra t i o n s
increasing 25%. Market share has declined marginally from
28,2% to 27,5%. This decline includes a R4,5 billion
securitisation of our home loan book, which if adjusted for would
increase market share to 28,2%. We are satisfied we have
managed to maintain market share considering the higher levels
of competition in this market both in terms of pricing and credit
granting.
The average size of a home loan written in 2005 was R395 000
(2004: R350 000), the average loan-to-value ratio of the home
loan book is 70% (2004: 69%) and the average instalment to
income ratio is approximately 22% (2004: 20%). Non-performing
loans as a percentage of book improved from 1,51% in 2004 to
1,21% in 2005 and the number of properties in possession
decreased by 49% in 2005 illustrating the low levels of defaults
experienced and improved credit control in this business.
Vehicle and asset finance
The vehicle and asset finance motor book grew by 29% against a
26% gro wth in industry sales of new vehicles. The non-motor book
g ro wth was 1% with market share decreasing from 36% to 33%.
This was mainly as a result of lost share in the other goods
c a t e g o ry, which includes unsecured personal loans that we acco u n t
for in other lending rather than in vehicle and asset finance.
We believe we can improve our performance in this category and
are investing in our sales force to drive this objective in the year

O p e rational review: Personal & Business Banking co n t i n u e dc e m b e r 2 0 0 5
ahead. Our sales team has been increased across all channels and
in certain cases the division has re-entered the dealer market.
These initiatives have begun to show good results. While
turnaround times of finance applications have improved markedly,
there is scope to reduce these further in 2006.
Card
The card business continued to perform well with significant
i m p rovements in earnings in this category. Cardholder spending
increased by 30% and the lending book by 55%. For stores with
S t a n d a rd Bank card terminals, credit card sales increased by 29%.
This gro wth came primarily from first-time credit card holders ra t h e r
than multiple cards being issued to existing holders. While bad debt
ratios have increased, this was a planned feature of our acc e l e ra t e d
g ro wth strategy in this category. These ratios remain well within our
internal targets and are better than international benchmarks.
Other lending
Balance growth of 21% in overdrafts, revolving credits and
medium-term loans was due to a 16% increase in new customers,
a higher demand for credit, continued focus on cross-selling loans
to our current account base and general process improvements.
Transaction and savings
The transactional business achieved strong year-on-year growth
of 15% in the number of personal and business current accounts.
Although the number of active E Plan accounts only grew by 5%,
the balances on these accounts grew by 24%. This is important as
it demonstrates a growing savings culture among low-income
earners. The number of Maestro users increased by 33% with
volumes increasing by 48%. Maestro is a simple card-based
payment system that allows customers to make electro n i c
payments directly from their accounts to retailers. The Standard
Bank cheque card achieved a 55% growth in the number of cards
and the number of transactions increased by 69%.
Together with the growth in savings and investment deposit
accounts, market share gains of approximately 2% were achieved
in retail deposits.
ATMs experienced a 12% increase in the volume of transactions.
Extending the reach of financial services in South Africa is a keychallenge, compounded by increasingly complex and costlyregulatory obligations, and pressing developmental issues.
Loans and deposits by product
Change 2005 2004% Rm Rm
Gross loans and advances 28 205 066 160 472
Instalment sale and finance leases 16 40 178 34 704Mortgage lending 31 124 137 94 490Card debtors 52 11 967 7 852Transactional products 23 28 784 23 426
Credit impairments for performing and non-performing loans 17 (2 264) (1 940)
Net loans and advances 28 202 802 158 532
Client deposit and current accounts 27 118 693 93 163
Current accounts 20 34 871 28 941Cash management deposits 46 3 788 2 595Call deposits 40 30 689 21 952Savings accounts 22 14 085 11 544Term deposits (8) 22 699 24 583Securitised funding 7 326 –Other funding and loans 48 5 235 3 548
Interdivisional funding 28 70 287 55 093
Total 27 188 980 148 256
S t a n d a rd Bank Group annual report 2005 P • 2 0

S t a n d a rd Bank Group annual report 2005 P • 2 1
Rest of Africa
The 16 countries throughout the rest of Africa in which we
operate have been ranked and prioritised according to the growth
opportunities they offer and the most relevant strategic approach
in each case has been determined. This has enabled the most
appropriate management teams and capital structures to be put in
place in each case.
The first phase of a comprehensive customer segmentation
e x e rcise has been completed, with further phases being
continued in 2006. Significant system upgrades were carried out
where necessary and systems across the continent are now more
standardised. It is now possible to launch products simultaneously
in all our African markets. The process of aligning our African
o p e rations to South African operating standards positively
impacted service levels, with the independent Custo m e r
Evaluation of Banks Survey showing a meaningful improvement
from 8,42 (out of a total of 10) in 2004 to 8,97 in 2005.
Although it is reasonable to expect a three- to fo u r- y e a r
timeframe before the full performance benefits of our strategic
initiatives in Africa begin to flow through, the groundwork is done.
It is pleasing that significant improvements in service levels have
already been achieved and our various in-co u n t ry pro d u c t
strategies have started to gain momentum.
Focus areas for 2006
Going forward, Personal & Business Banking aims to balance between managing a mature business in a domestic market where
growth in credit extension is expected to moderate, with potential growth opportunities outside South Africa.
In South Africa, specific focus areas will include:
•Reviewing, managing and reducing costs, closing revenue leakages and product gaps, and driving the profitability
of direct channels through volume increases.
•Improving people management, with leadership support and branch management training targeted at further improving service levels.
•Driving our customer acquisition strategies through new and existing partnerships and existing channels within the bank.
•Continuing to drive deposit gathering to limit further margin erosion.
In the rest of Africa, focus areas will include:
•Continuing to apply the South African model of getting the basics of service and sales right.
•Streamlining the business banking segment by transferring the larger corporate clients to Corporate & Investment Banking
and the small and medium corporate segment to Personal & Business Banking to improve service levels to these customers.
•Launching lending products (credit cards, home loans and vehicle and asset finance) into seven African countries.
Points of representation
2005 2004
ATMs 4 151 3 603
Total points of representation 984 975

Operational review: Corporate & Investment Banking
Overview
The group’s Corporate & Investment Banking franchise is
underpinned by two main centres in Johannesburg and London,
which work together to support its operations across a broad
international footprint.
The division posted a good performance in 2005, off a high base,
despite fewer trading opportunities domestically and
i n t e r n a t i o n a l l y. The performance of our international operation was
disappointing with lower revenue being generated across most
t rading areas. Low levels of credit impairment charges were
experienced during the year with recoveries of prior period credit
impairments and the reversal of surplus provisions resulting in an
o v e rall reco v e ry for the year.
After a period of strong organic growth in the South African
market, our focus has been on aligning our businesses in the rest
of Africa and internationally along the lines of the successfully
implemented customer-centric model established in South Africa
over the past five years.
Operational focus over the last year was on structuring executive
reporting lines, teams and systems to ensure competitive services
and structured products across all operations. We continued to
invest significantly in retaining and incentivising teams of talent.
Strategy
Besides the ongoing process of integration and alignment, the
year was one of reflection given the changes in global wholesale
banking markets. Emerging markets continued to gain in
p o p u l a r i t y, with developing countries improving their credit
ratings and a growing appetite for emerging markets risk among
i n v e s tors. In this environment, traditional emerging market
p a rticipants like ourselves are encountering increased
competition from the large established global banks in our chosen
markets.
In the face of these new challenges, we have had to reconsider
the best way to reposition the business for sustainable growth. We
identified that although we are in the appropriate markets, to
remain competitive we need to enhance our regional and in-
country capabilities with urgency. This has been set as a key
strategic imperative in the years ahead, and will require significant
further investment in people and infrastructure. The cost of this
investment will inevitably have an impact on returns in the short
term.
Corporate & Investment Banking has formulated a three-part
growth strategy.
Growing off a high base in South Africa
This will involve:
• positioning the bank to maximise exposure to Black Economic
Empowerment (BEE) activity, in terms of both empowerment
financing and advisory services;
• capitalising on the financing needs arising from the
infrastructure development activity planned in South Africa in
the short to medium term, and the rest of A f r i c a ’ s
development in the longer term; and
• increasing the proportion of net interest income to total
income due to the increased potential for corporate loan
growth.
Growing our business in the rest of Africa
This will involve:
• ensuring that we capture the banking business associated with
t rade flows intra -Africa and between Africa and other
emerging markets;
• maintaining focus on providing customer-centric solutions to
corporate customers, whilst leveraging off the group’s skills
and products; and
• focusing on banking the Government and International
Organisation (GIO) sector and donor flows on the continent.
Growing the regions outside of Africa
This will involve:
• building depth and scale in regional businesses in emerging
markets in Asia, the Americas, Europe and the Middle East;
• driving penetration of core competencies such as resource
banking and global markets capabilities into the regions;
• identifying specific regional product opportunities; and
• linking existing investment banking businesses in key markets
with the acquisition of commercial banks such as the pending
transaction in Argentina.
Financial performance
Corporate & Investment Banking comprises 45% of the group’s
earnings (2004: 50%). Headline earnings grew by 7% in 2005,
off a high base in the prior year. This headline earnings growth
was made up of an 8% decline in global markets, an 8% increase
in banking and trade finance and a 27% increase in the
investment banking category.
S t a n d a rd Bank Group annual report 2005 P • 2 2

S t a n d a rd Bank Group annual report 2005 P • 2 3
An ROE of 27,0% (2004: 27,2%) was achieved. The cost-to-
income ratio of 54,0%, compared to 51,5% in the prior year,
worsened due to reduced revenue in the international business.
Costs were well contained to a 7% increase.
Operational performance
Global markets
Global markets house the division’s financial markets and treasury
activities including the resource banking and money market funding
units.
Tough trading conditions were experienced particularly in
international emerging markets where low volatility, a tightening
of spreads from increased competition and high levels of global
liquidity significantly reduced trading opportunities.
Trading income in our international business was also adversely
impacted by a continued shift from a reliance on proprietary
trading, with lower value at risk utilisation, to becoming more
client focused. Our strategy to build and develop a structured
product capability in the international business started to yield
positive results towards the end of the year, with strong customer
demand for tailored solutions in capital markets and access to
local emerging markets.
The foreign exchange market continued its trend of low volatility
and spread tightening particularly in our core rand product. The
foreign exchange business achieved good results despite the
environment presenting limited opportunities.
The equities trading business performed well with increased
business confidence in South Africa boosting local equity markets
and strong business flows.
S t rong revenue flows were generated by the securitisation and
debt origination businesses. The securitisation team also
s u ccessfully concluded the group’s first asset-backed securitisation
t ransactions: R4,5 billion of mortgage loans and R3 billion of
vehicle and asset finance receivables.
The debt securities business experienced strong flows during the
year notwithstanding tough market conditions. The international
principal trading business generated increased revenues relative
to 2004, despite running a lower level of market risk.
In precious metals trading, strong physical related short-dated
trading flows were experienced from a well-diversified global
client base. However, a strict anti-hedging stance among precious
metal producers continued in 2005, resulting in a lack of long-
dated transactions which dampened revenues. Base metals
t rading reported good revenues against a backg round of
significant interest in the metals markets and 20-year price highs.
The growth of the Chinese economy coupled with increased
hedge fund activity, continued to drive the market. Although the
volatility in oil prices during the year augured well for the
commodity trading business, structural changes to the team
outside of Africa resulted in lower than expected revenues.
The mining finance and structured commodity finance businesses
continue to be regarded as leading arrangers and providers of
structured financing facilities for metal producers and the
development of mining projects. The buoyant metals markets
seen in 2005 resulted in increased competition from financial
institutions not previously as active in the mining and metals
sector. Consequently, the market also experienced downward
pressure on returns and loan terms.
The energy finance team had a strong year and benefited from an
expanded client base. This resulted in a well-diversified spread of
risk and transaction structures. Progress was made in expanding
the team’s transaction capability in the power and renewable
energy sectors.
The treasury funding unit in South Africa experienced continued
margin pressure as a result of the significant amounts of term
funding required to support the strong asset growth across the
South African business, together with increasing the average
long-term structure of the funding book in line with internal
prudential guidelines.
Major IT investment in 2005 and 2006 will see the implementation
of the latest global systems in interest rates and equities tra d i n g ,
credit trading and energy trading. This will enable us to introduce a
fuller product range, leading to an improved customer serv i c e
offering across the range of our global markets activities.
We have a strong and mature global markets team in South Africa
as evidenced by the following recently awarded accolades:
• In Risk Magazine’s South African market survey, Standard
Bank was rated first overall and ranked first in nine categories
across the interest rate and equity derivative businesses.
• Standard Bank was voted “Best Bond House” for 2005 by the
Bond Exchange of South Africa Spire Awards, and also won
awards in four other categories.
The challenge going forward is to export this model to the rest of
our operations by scaling up our regions, completing the IT
infrastructure implementation and hiring and up-skilling staff.

O p e rational review: Corpora te & Investment Banking co n t i n u e dc e m b e r 2 0 0 5
Banking and trade finance
The banking and trade finance business encompasses corporate
lending, transactional banking businesses, custodial services and
trade finance business.
Competition in the vanilla corporate lending market generally
remained fierce with margins coming under pressure. T h e
transactional banking business grew volumes, introduced new
products and won major new accounts.
The electronic banking business grew market share substantially
by focusing on enhancing customer service and impro v i n g
technology. The project to roll out corporate electronic banking
technology in the rest of Africa is progressing well.
The custody business also had a great year, achieving record
volumes and assets under management.
Specialised finance continued to broaden its business, with
innovative transactions closed in Turkey, Asia, the Middle East,
Russia and Mexico. Most notable was the joint underwriting of a
major acquisition of South-East Europe’s largest oil refinery. The
group also established its credentials in the rapidly expanding
Islamic finance market with two significant tra n s a c t i o n s
u n d e rwritten and subsequently oversubscribed in genera l
syndication.
Telecommunications finance posted strong growth. The scale of
transactions increased significantly, new risk distribution channels
were developed and the client base doubled. Major successes
included the largest project financing deal in the Ukraine and a
first mandate in Pakistan.
Trade finance had a good year – despite further tightening of
margins in key markets. Good volumes in the trade finance
business also contributed significantly to the gro wth in
profitability.
The distribution group had another successful year placing over
USD10 billion of syndicated loans, trade finance and forfaiting
p a p e r, and successfully arranging 45 syndicated financings,
primarily in Russia, the former Commonwealth of Independent
States (CIS), Eastern Europe and the Middle East. The business
retained its position as a market leader in the arranging and
placing of emerging market syndicated debt and was ranked by
Loanware as the top arranger and distributor of syndicated loans
for financial institutions in Russia, Ukraine and Kazakhstan.
Investment banking
Investment banking includes the equity investment and advisory
businesses, project finance, structured and pro p e rt y - r e l a t e d
lending as well as the off-shore asset management and wealth
management units.
S t a n d a rd Bank Group annual report 2005 P • 2 4
For Corporate & Investment Banking to remain competitiveinternationally, we need to enhance our regional and in-countrycapabilities with urgency.
Loans and advances by product
Change 2005 2004
% Rm Rm
Gross loans and advances 30 133 620 102 662
Overnight lending 35 27 477 20 365
Term lending 17 47 639 40 610
Loans granted under resale agreements 48 26 291 17 750
Commercial property finance 34 16 196 12 095
Other loans and advances 35 16 017 11 842
Credit impairments for performing and non-performing loans (4) (1 439) (1 494)
Net loans and advances 31 132 181 101 168

S t a n d a rd Bank Group annual report 2005 P • 2 5
The specialist corporate finance advisory team, the mining and
metals advisory group and the equity investments businesses
performed well during the year. In South Africa, BEE deals
continued to drive business growth. Major transactions concluded
during the year included introducing BEE partners into Medi-
Clinic, SA Eagle, Assore and Tiger Brands.
Other notable deals included a fair and reasonable opinion for the
Venfin board in respect of the Vodafone offer as well as a number
of transactions and assignments in Papua New Guinea,
Scandinavia, Central Europe and the Americas.
Standard Bank, as the global adviser for the Celtel International
B.V. Group, was mandated to raise medium-term financing for
Celtel Kenya Limited through a floating rate secured bond on the
Nairobi Stock Exchange. The deal is the largest corporate bond on
the Nairobi Stock Exchange and also in the East A f r i c a n
Community region. Furthermore, this is the first time that Kenyan
Shilling denominated debt has been placed outside of Kenya.
The low interest rate environment resulted in robust increases in
property prices in South Africa. This boosted performance in the
property finance and advisory services business with positive
mark-to-market profits being generated and sizeable realisations
in the listed pro p e rty investment port folio. There was also
significant gro wth in the pro p e rty lending book, which
contributed to increased profitability.
Structured finance encompasses longer-term structured lending
to corporates, primarily in the form of asset- or project-backed
financing. The structured finance division won a number of major
mandates in 2005 that should generate good returns in the
coming years. The project finance division is currently focused on
infrastructure investment in Africa and in particular the Gautrain
p roject which, in spite of a number of delays and some
controversy, appears to be moving towards finalisation. The
G a u t rain is a 77km high-speed rail link that will co n n e c t
Johannesburg and Pretoria.
Focus areas for 2006
Standard Bank’s Corporate & Investment Banking business is focused on becoming a strong emerging markets
contender and is pursuing new opportunities in market sectors that show strong growth potential.
Focus areas in the year ahead will include:
•A continued focus on building our customer base and offering better services.
•Retaining key staff and completing the programme of hiring and up-skilling staff in the
international businesses to enhance our regional and in-country capabilities.
•Driving people and infrastructure development aggressively and achieving greater economies
of scale in the international businesses.
•Acquisition opportunities in key markets focusing on product related businesses and commercial banking
opportunities in conjunction with Personal & Business Banking.

Operational review: Investment Management & Life Insurance
Overview
For the life insurance industry, 2005 could well be regarded as a
significant turning point. The unfavourable rulings against life
insurance companies, including Liberty Life, by the Pension Fund
Adjudicator (PFA) and the associated negative sentiment led to an
industry-wide rethink of business models. Encouragingly, in spite
of the negative perceptions, Liberty Life managed to deliver a
strong financial performance for the year.
In April 2005, Liberty Life concluded the acquisition of Capital
Alliance Holdings Limited (CAHL), and for the rest of the year a
major focus was to ensure the swift and smooth merging of the
businesses. CAHL employees were moved from their head office
into Liberty Centre with the process being managed carefully to
limit disruption and employee concerns. The integration provided
the opportunity to restructure Liberty Life’s business model to
position the company to serve both intermediaries and
policyholders more effectively and efficiently into the future.
We took the decision to consider the disposal of our offshore
asset manager, Liberty Ermitage, and the Australian life insurance
business, Prefsure, which was included in the acquisition of CAHL.
Liberty Life also disposed of Hightree, a small UK distribution
business, during the year.
Liberty Active was launched during the year, and subsequently
integrated with CAHL to offer a simple, streamlined range of
value-for-money risk products at the lower end of the market.
Another milestone for Liberty was that it became the first South
African life insurer to issue a listed corporate bond. Applications
for the bond outstripped initial expectations and R2,0 billion was
raised at a very competitive long-term rate of 8,93%. This will be
used primarily to fund working capital requirements.
Liberty Life won both categories of the South African Financial
S e rvices Intermediaries Association (SAFSIA) awards for life
insurers (individual and corporate). This is the first time that
SAFSIA, the largest intermediary body, has given both awards to
one company in the same year.
Stanlib had its best year since it was formed in 2002. Its
performance in equity markets continued to improve both in
absolute terms and relative to its peers. The Alexander Forbes
Global Manager Watch survey placed Stanlib third for 2005, with
its preferred asset portfolio returning 34,6% for the year. Costs
were well controlled.
New chief executive of Liberty Life
During February 2006 it was announced that Myles Ruck, chief
executive of Liberty Life, wished to retire as chief executive, for
personal reasons, after his service retention agreement expires on
31 May 2006. Bruce Hemphill, currently chief executive of
Stanlib, will succeed Myles with effect from 1 June 2006. Myles
has been invited to remain on the board of the Standard Bank
Group as a non-executive director.
Securing sustainability by committing to change
Whilst there were aspects of the PFA rulings that we disagreed
with, many of the issues dealt with and rulings made were valid.
However, for Liberty Life whether or not the rulings were legally
defendable was of seco n d a ry importance. We were more
concerned about the fairness of past practices in the industry,
particularly in light of the way circumstances have changed since
the products were first developed.
To bring about meaningful change, industry-wide consensus was
needed. Under the auspices of the Life Offices Association (LOA),
extensive discussions on reforming savings products took place
internally and externally with parties such as the National Treasury
and the Financial Services Board. The complex challenge was to
find solutions that took into account future business, existing in-
force books as well as business on the books that had already
been terminated prior to the maturity of the contracts. The multi-
lateral process culminated in a December meeting and signing of
a Statement of Intent between the five largest members of the
LOA and the Minister of Finance.
It is important to note that the issues raised in the settlement relate
to a small and specific part of a life insurer’s business. In general, it
has been shown that customers who take out and maintain a
retirement or endowment product to maturity will have invested
wisely and at reasonable cost to themselves – although the choice of
investment asset may impact that return. It has been primarily in
situations where policies have been prematurely or part i a l l y
terminated where the perceived high costs have been co n t e n t i o u s .
It is hoped that this has now been dealt with and we look fo rw a rd to
continuing to give our policyholders peace of mind in planning fo r
the future.
The strong growth enjoyed in the South African investment marketsduring the latter half of 2004 continued throughout 2005. LibertyLife and Stanlib were beneficiaries of this growth.
S t a n d a rd Bank Group annual report 2005 P • 2 6

S t a n d a rd Bank Group annual report 2005 P • 2 7
Strategy
Becoming the life insurer and investment manager ofchoice
Our strategy is simple – we intend to become the South African
life insurer and investment manager of choice for those who wish
to buy and to sell life insurance and investment products. To do
this we need to offer products that are relevant, easy to
understand and provide real value for money.
We are reassessing the relevance of all products provided by
Liberty Life and Stanlib, and will discontinue any we find to be no
longer suitable for the markets we operate in. Similarly, where we
find that inappropriate advice is being given or product sold – be
it through our tied agency force or independent brokers – we will
remove the party's contract to sell our products.
In addition, to be the life insurer and investment manager of choice
means that we provide service excellence and put the customer at
the fo r e f ront of everything we do.
The life insurance operations have made good progress but
understand that they still have a long way to go. The decision to move
the back office onto one delivery platform over the next few years will
go some way to w a rds helping us deliver on our service promise.
In the life insurance operations, we will also continue to focus on
extending our distribution reach. Specifically, in the coming year
we will ensure the efficient distribution of our Liberty Active
products. In keeping with our philosophy of providing the right
products for the right markets, we have discontinued selling
savings products into the lower end of the market, as we believe
they do not offer sufficient value for money when compared to
alternatives such as unit trusts or bank savings accounts.
To be competitive, profitable and provide value for money means
that we cannot be complacent when it comes to costs. We are
constantly evaluating our processes to streamline them and
extract value from cost efficiencies wherever possible.
Financial performance
Investment Management & Life Insurance comprises 7% of the
group’s headline earnings, and grew normalised headline earnings
in 2005 by 51%. The division achieved a ROE of 24,1%, grew
funds under management by 27% and grew normalised
embedded value by 16%.
Liberty Life had a very good year and increased normalised
headline earnings by 47%, notwithstanding a once-off
R321 million after tax provision for the Statement of Intent
relating to the PFA rulings. Significant gains on investments held
in the shareholders’ portfolio more than offset this provision.
These gains were previously accounted for directly in equity.
The strong growth enjoyed in the South African investment
markets during the latter half of 2004 continued throughout
2005. Liberty Life and Stanlib were beneficiaries of this growth in
a number of areas. Indexed new business grew by 12% over
2004, from R4,3 billion to R4,9 billion, albeit at a slightly lower
m a rgin compared with 2004. Investment management fees
earned grew by 14%.
Net cash inflows from insurance operations were up from
R3,2 billion in 2004 to R5,7 billion, and net inflows into Stanlib
amounted to a further R13 billion.
In the insurance operations, policy expense increases of a
recurring nature were in line with actuarial assumptions (4,25%
per annum) for the third year in a row although non-recurring
items were considerably higher than 2004, due mainly to the
restructuring and integration costs incurred with respect to the
restructuring into three main divisions and the integration of
CAHL. The capital adequacy requirement ratio remained strong at
2,0 times cover.
Stanlib’s profit before tax was R348 million and third-party
assets under management grew by 27% to R186 billion as at
31 December 2005.
Focus areas for 2006
Investment Management & Life Insurance earnings may be lower in 2006 due to the potential impact of a lower assumed equity and
bond market performance although real growth in embedded value should be achieved.
Specific focus areas in 2006 will include:
•Continuing to refine our new business model and implement our strategy to become the life insurer of choice.
•Driving the distribution of Liberty Active products.
•Bringing out the best in our people.
•Improving and expanding Stanlib’s equity business.

S t a n d a rd Bank Group annual report 2005 P • 2 8
Board of directors
Sir Paul Judge (56)1, 4
MA (Cambridge), MBA (Pennsylvania)Appointed: 2003
Directorships: Standard Bank Group, The StandardBank of South Africa, Schroder Income Growth Fund,Tempur-Pedic International
Thulani Gcabashe (48)1
BA (Botswana and Swaziland), Masters in Urban andRegional Planning (Ball State)Appointed: 2003
Directorships: Standard Bank Group, The StandardBank of South Africa, Eskom Enterprises (chairman),Eskom Holdings (chief executive)
Committee member: Group risk management
Buddy Hawton (68)1
FCIS (Natal)Appointed: 1995
Directorships: Standard Bank Group, The StandardBank of South Africa, International Resorts, LibertyGroup, Liberty Holdings, Nampak, Royale ResortsHoldings (chairman), Royale Holdings (Bermuda),Royale Resorts International, Stanlib, Sun Hotels, Sun International (chairman), Woolworths Holdings(chairman)
Committee member: Group remuneration(chairman), group risk management
Sam Jonah KBE (56)1, 5
ACSM, MSc, DIC, DSc (Exeter)Appointed: 2006
Directorships: Standard Bank Group, The StandardBank of South Africa, AngloGold Ashanti, Anglo Platinum Corporation, Bayport Holdings,Equator Exploration, Equinox Minerals, Mittal Steel,MotoGold Mines, Titanium Resources Group,Transnet, Uramin
Saki Macozoma (48)2
BA (Unisa), BA (Honours) (Boston)Appointed: 1998
Directorships: Standard Bank Group, The StandardBank of South Africa, Andisa Capital (chairman),Business Trust (co-chairman), Iliso Consulting(chairman), Liberty Group, Liberty Holdings, Murray and Roberts Holdings, Safika Holdings(deputy chairman), Stanlib (chairman), TutuwaStrategic Holdings 2, VW South Africa
Committee member: Allocation (chairman), directors’affairs, group audit, group credit, groupremuneration, group risk management, grouptransformation (chairman)
Jacko Maree (50)3
BCom (Stellenbosch), MA (Oxford), PMD (Harvard)Appointed: 1997
Directorships: Standard Bank Group (chiefexecutive), The Standard Bank of South Africa (chiefexecutive), Liberty Group, Liberty Holdings, StanbicAfrica Holdings, SBIC Investments SA, StandardInternational Holdings SA, Standard Bank Plc(chairman)
Committee member: Africa credit, allocation, blackownership initiative, group credit, grouptransformation
The directors address key issues, ensuring that debate on matters of policy, strategy and performance is critical, informed andconstructive.
Doug Band (61)2
BCom (Wits), CA (SA)Appointed: 1997
D i re c to r s h i p s : S t a n d a rd Bank Group, The StandardBank of South Africa, Electronic Media Network (M-Net), Gymnogene Investments, Mobile T e l e p h o n eNetworks Holdings, MTN Group, MTN International,Stanlib, The Bidvest Group, Tiger Bra n d s
Committee member: Africa credit, black ownershipinitiative, directors’ affairs, group audit, group credit,group remuneration
Elisabeth Bradley (67)1
BSc (Free State), MSc (London)Appointed: 1986
Directorships: Standard Bank Group, The StandardBank of South Africa, AngloGold Ashanti, MetairInvestments (chairman), Sasol, The Tongaat-HulettGroup, Toyota SA (chairman), Wesco Investments(chairman)
Committee member: Black ownership initiative,directors’ affairs, group audit
Derek Cooper (65)1
CA (SA)Appointed: 1993
Directorships: Standard Bank Group (chairman), TheStandard Bank of South Africa (chairman), LibertyGroup (chairman), Liberty Holdings (chairman),Standard Bank Plc, Business Leadership South Africa(president)
Committee member: Africa credit, black ownershipinitiative (chairman), directors’ affairs (chairman),group credit (chairman), group remuneration, grouprisk management, group transformation

S t a n d a rd Bank Group annual report 2005 P • 2 9
Rick Menell (50)1
MA (Cambridge), MSc (Stanford)Appointed: 1997
Directorships: Standard Bank Group, The StandardBank of South Africa, African Rainbow Minerals(deputy chairman), Anglovaal Holdings, Mutual &Federal, National Business Initiative, South AfricanTourism Board (chairman), Teal Exploration & MiningIncorporated (director, president and CEO), VillageMain Reef Gold Mining (chairman)
Committee member: Group remuneration, group riskmanagement
Kgomotso Moroka (51)1
BProc (University of the North), LLB (Wits)Appointed: 2003
Directorships: Standard Bank Group, The StandardBank of South Africa, Electronic Media Network (M-Net), Gobodo Forensic & InvestigativeAccounting (chairman), New Seasons InvestmentsHoldings, South African Breweries
Chris Nissen (47)1
BA Hons, MA Humanities (Cape Town), Diploma inTheologyAppointed: 2003
Directorships: Standard Bank Group, The StandardBank of South Africa, Boschendal (chairman),Randgold & Exploration Company, Sea HarvestCorporation (chairman), Tiger Brands, Umoya Fishing,Woolworths Holdings
Committee member: Group transformation
Cyril Ramaphosa (53)2
BProc (Unisa)Appointed: 2004
Directorships: Standard Bank Group, The StandardBank of South Africa, Alexander Forbes, MacsteelHoldings, Mondi South Africa, MTN Group(chairman), MTN International (chairman), SAB Miller, SASRIA, Shanduka Group (chairman), The Bidvest Group (chairman), Tutuwa StrategicHoldings 1
Mamphela Ramphele (58)1
BCom (Unisa), MBChB (Natal), PhD (Cape Town)Appointed: 2005
Directorships: Standard Bank Group, The StandardBank of South Africa, Circle Capital Ventures(chairman), Medi-Clinic Corporation, MellonFoundation, Nelson Mandela Foundation, RockefellerFoundation
Myles Ruck (50)3
BBus Sc (UCT), PMD (Harvard)Appointed: 2002
Directorships: Standard Bank Group, Capital AllianceHoldings, Liberty Group (chief executive), StandardBank Plc, Stanlib
Committee member: Africa credit (chairman), groupcredit
Martin Shaw (67)1
CA (SA)Appointed: 2004
Directorships: Standard Bank Group, The StandardBank of South Africa, Illovo Sugar, JD Group, LibertyGroup, Liberty Holdings, Murray & Roberts Holdings,Pretoria Portland Cement, Reunert
Committee member: Group audit (chairman), grouprisk management (chairman)
Sir Robert Smith (61)1, 4
CA and Fellow of the Institute of Bankers (inScotland), Honorary Degrees (Edinburgh, Glasgow,Paisley) Appointed: 2003
Directorships: Standard Bank Group, The StandardBank of South Africa, Aegon UK, Inchmarnock,Scottish and Southern Energy (chairman), The WeirGroup (chairman)
Conrad Strauss (70)1
BA, PhD (Rhodes), MS (Cornell), AMP (Harvard),FIBSA, DEcon (hc) (Rhodes), DSc (hc) (Pretoria)Appointed: 1984
Directorships: Standard Bank Group, The StandardBank of South Africa, African Oxygen, HansMerensky Holdings
1Independent non-executive director 2Non-executive director 3Executive director
4British 5Ghanaian

S t a n d a rd Bank Group annual report 2005 P • 3 0
Corporate governance
Standard Bank Group views the implementation of corporate
governance practices as integral to its operations. The group is
committed to the principles of the Code of Corporate Practices
and Conduct (King Code) and complied with the King Code during
the period under review.
The board of directors is committed to the ongoing
implementation of initiatives to improve corporate governance for
the benefit of all stakeholders. All group operations are subject to
an effective governance framework. This provides direction for
subsidiary entities, which structure their respective governance
frameworks according to group standards.
Furthermore, this framework enables our directors to balance
their responsibility to provide oversight with their role as providers
of strategic counsel, thereby achieving a proper balance between
conformance and performance.
The Standard Bank of South Africa Limited is a major subsidiary of
the group as defined in the JSE Limited Listings Requirements.
Liberty Group Limited (Liberty Life) is also a significant subsidiary
of the group, which complies with its own set of regulatory and
legislative requirements. Compliance is documented in its annual
report, which can be found at www.liberty.co.za. Stanlib has its
own governance framework coordinated by Liberty Life.
Codes and regulations
Compliance with applicable legislation, regulations, standards and
codes is an essential part of the group’s operations. The board
monitors regulatory compliance through management reporting.
The group applies the code of banking practice (the code) and
subscribes to the values underlying the code. There are systems
in place to ensure compliance with the principles and
recommendations set out in the code.
As part of educating and training staff on the code, material from
Bankseta was used and customised to make it Standard Bank
specific, and delivered using an e-learning channel.
Compliance with the code is audited by the group internal audit
function.
Board and directors
Board structure
The group is led by an effective board that is ultimately
responsible for corporate governance within the group. The board
consists of a strong contingent of independent non-executive
d i r e c tors, which includes the chairman. This ensures that
independent thought is brought to bear on board decisions.
There are no shadow directors on the board.
The board is also responsible for ensuring that the group has
effective management and adequate succession plans are in
place. The chief executive presents his succession plans to the
b o a rd annually. The executive committee is invited to attend all
b o a rd meetings. The full board (including executive directo r s )
meets without other management present during closed
s e s s i o n s .
Access to company information, resources required to carry out
responsibilities or access to external legal advice are readily
available at the group’s expense. Board committees assist the
board to fulfil the group’s stated objectives. All committees
operate according to agreed mandates that are reviewed annually
to keep pace with material developments.
The key terms of reference in the board's mandate, which forms
the basis for its responsibilities, are to:
• agree the group's objectives, strategies and plans fo r
achieving those objectives;
• annually review the corporate governance process and assess
achievement against objectives;
• review its mandate at least annually and approve reco m m e n d e d
c h a n g e s ;
• delegate to the chief executive or any director holding any
executive office or any senior executive any of the powers,
authorities and discretions vested in the board's directors,
including the power of sub-delegation. Delegate similarly such
powers, authorities and discretions to any committee and
subsidiary company boards as may exist or be created from
time to time;
• determine the terms of reference and procedures of all board
committees and subsidiary companies, and review their
reports and minutes;
• consider and evaluate reports submitted by members of the
executive management committee;
Independent non-executive directors 72% (13)
Non-executive directors 17% (3)
Executive directors 11% (2)
Independent non-executive directors 72% (13)
Non-executive directors 17% (3)
Executive directors 11% (2)
Unitary board (%)

• ensure that an effective risk management process exists and
is maintained throughout the group;
• review and monitor the performance of the chief executive
and the executive team;
• ensure consideration is given to succession planning for the
chief executive, and other executive directors and executive
management;
• establish and review annually, and approve major changes to,
relevant group policies;
• ap p rove the remuneration of non-executive directors on the
b o a rd and board committees, based on recommendations made
by the group remuneration committee, and recommend to
shareholders for appro v a l ;
• approve capital funding for the group, and the terms and
conditions of rights or other issues and any prospectus in
connection therewith;
• ensure an adequate budget and planning process exists, that
performance is measured against budgets and plans, and
approve annual budgets for the group;
• a p p rove significant acquisitions, mergers, take-overs,
divestments of operating companies, equity investments and
new strategic alliances by the group;
• consider and approve capital expenditure recommended by
the group executive committee;
• consider and approve any significant changes proposed in
a ccounting policy or practice, and consider the reco m m e n d a t i o n s
of the group audit co m m i t t e e ;
• consider and approve the annual financial statements, interim
statements, dividend announcements and notices to
shareholders, and consider and agree the basis for considering
the group to be a going concern as per the recommendation
of the group audit committee;
• assume ultimate responsibility for financial, operational and
internal systems of control, and ensure adequate reporting on
these by committees to which they are delegated;
• take ultimate responsibility for regulatory compliance and
ensure that reporting to the board is comprehensive;
• ensure a balanced and understandable assessment of the
group's position in reporting to stakeholders;
• review non-financial matters that have not been specifically
delegated to a committee; and
• specifically agree from time to time matters that are reserved
for its decision, retaining the right to delegate any of these
matters to any committee from time to time in accordance
with the articles of association.
Strategy
The board considers and approves the group’s strategy at an
annual meeting with executive management. On an annual basis,
the board agrees financial objectives and corporate governance
objectives for the year ahead. The board then monito r s
performance against financial objectives and detailed budgets
t h rough management’s quarterly reporting. Corpora t e
governance objectives are monitored by the directors’ affairs
committee and reviewed by the board annually.
Appointments
The board reviews the group’s nominations and appointments
policy annually.
All board appointments are made in line with the requirements of
the Companies Act, Banks Act, JSE Limited Listings Requirements
as well as the group’s policy in this regard.
The nominations and appointments policy defines the process to
be followed for the nomination and appointment of directors, by
setting out who makes recommendations and who authorises and
a p p roves appointments. The policy distinguishes between
executive and non-executive appointments as well as internal and
external entities. In terms of the policy, executive management
require permission to be appointed to external boards to reduce
the potential for conflicts of interest, and to ensure they can
dedicate sufficient time and resources to group business.
Delegation of authority
The ultimate responsibility for the group’s operations rests with
the board. The board retains effective control through a well-
developed governance structure of board committees. These
committees provide in-depth focus on specific areas of board
responsibility.
In addition, authority has been delegated to the chief executive
to manage the business and affairs of the group. The group
executive committee assists the chief executive to manage the
business of the group when the board is not in session, subject to
statutory limits and the board’s limits on the delegation of
authority to the chief executive.
Board-delegated authorities are regularly monitored by the group
secretary’s office.
Chairman and chief executive
The roles of chairman and chief executive are separate and distinct
and the chairman is an independent non-executive directo r.
Board meetings
The board meets once every quarter with an additional meeting
to discuss strategy. Ad hoc meetings are held when necessary.
S t a n d a rd Bank Group annual report 2005 P • 3 1

C o r p o ra te governance co n t i n u e dc e m b e r 2 0 0 5
Board effectiveness
The board, through the directors’ affairs committee (DAC ) ,
annually considers the performance of the board and its
committees against their respective mandates. External auditors
review these findings and a report is submitted to the DAC.
The DAC also considers methodologies for conducting evaluations
and makes recommendations to enable the board to determine
the adequacy and efficacy of its own performance. The aim of
these evaluations is to assist the board and committees to
constantly improve their effectiveness.
The board performs an annual assessment of co r p o ra t e
governance performance against its objectives, in compliance with
Regulation 38 of the Banks Act. In terms of the assessment for
the period under review, the board materially achieved its
corporate governance objectives.
Board evaluation
The board sets the criteria relating to its evaluation and
p e rformance and that of its committees. In 2005 the board agreed
to focus on evaluating its committees, with a full board evaluation
to be conducted every alternate year. A detailed questionnaire was
sent to each member of each committee. The co n s o l i d a t e d
feedback was provided to the board and it highlighted the need fo r
development in certain areas which resulted in a tra i n i n g
p ro g ramme being agreed to address this.
Induction and training
On appointment, each new director receives a governance manual
that includes all relevant information such as mandates, minutes,
management structures, significant reports and import a n t
legislation. In addition, one-on-one meetings are scheduled with
management to properly introduce new directors to the group, its
operations and key management.
D i r e c tors are kept abreast of all relevant legislation and
regulations as well as macro developments that could potentially
impact the group and its operations.
As part of their ongoing training, presentations on risk-specific
matters follow most of the board meetings. Topics covered
included such matters as liquidity risk and retail credit risk. Where
appropriate, external specialists are used to supply training.
S t a n d a rd Bank Group annual report 2005 P • 3 2
During 2005, five board meetings were held:
Board of directors Mar May Aug Oct Dec
DE Cooper (chairman)1 ✓ ✓ ✓ ✓ ✓
DDB Band2 ✓ ✓ ✓ ✓ ✓
E Bradley1 ✓ ✓ ✓ ✓ ✓
T Evans1, 6 ✓ ✓ ✓ ✓ ✓
TS Gcabashe1 ✓ ✓ A ✓ ✓
DA Hawton1 ✓ ✓ ✓ ✓ ✓
Sir Paul Judge1 ✓ ✓ ✓ ✓ ✓
SJ Macozoma2 ✓ ✓ ✓ ✓ ✓
JH Maree3 ✓ ✓ ✓ ✓ ✓
RP Menell1 ✓ ✓ ✓ A A
Adv KD Moroka1 ✓ ✓ A ✓ ✓
AC Nissen1 ✓ ✓ ✓ ✓ ✓
RA Plumbridge1, 5 ✓ ✓ – – –
MC Ramaphosa2 ✓ ✓ A ✓ ✓
Dr MA Ramphele1, 4 – A ✓ ✓ ✓
MJD Ruck3 ✓ ✓ ✓ ✓ ✓
MJ Shaw1 ✓ ✓ ✓ ✓ ✓
Sir Robert Smith1 ✓ ✓ ✓ ✓ ✓
Dr CL Stals1,5 ✓ ✓ – – –
Dr CB Strauss1 ✓ ✓ ✓ ✓ ✓
✓ = Attendance
A = Apology1Independent non-executive director.2Non-executive director.3Executive director.4Appointed on 17 March 2005.5Retired on 25 May 2005.6Resigned on 8 March 2006.

Board committees
Board committees operate in terms of agreed mandates reviewed and approved by the board on an annual basis. The mandates set out
their roles, responsibilities, scope of authority, composition, and procedures for reporting to the board.
Group audit committee
Member Feb Mar May Jun1 Aug Nov
MJ Shaw
(chairman)2 ✓ ✓ ✓ ✓ ✓ ✓
RA Plumbridge3 ✓ ✓ ✓ – – –
DDB Band A ✓ ✓ ✓ ✓ ✓
E Bradley ✓ ✓ ✓ ✓ ✓ A
SJ Macozoma ✓ ✓ ✓ ✓ ✓ ✓
✓ = Attendance
A = Apology1Trilateral meeting held with SARB.2Appointed as chairman on 25 May 2005.3Retired as chairman and member on 25 May 2005.
The role of the group audit committee is to review the group’s
financial position and make recommendations to the board on all
financial matters including assessing the integrity and
effectiveness of accounting, financial, compliance and other
co n t rol systems. The committee also ensures effective
communication between the internal auditors, external auditors,
the board, management and regulators. The committee’s key
terms of reference are divided into various categories and
responsibilities, and include the following:
• review the group audit plan with the joint auditors, with
specific reference to the proposed audit scope and approach
to group risk activities, and the audit fee;
S t a n d a rd Bank Group annual report 2005 P • 3 3
Group audit committee
Chairman: Martin Shaw
Six meetings held in 2005
Group credit committee
Chairman: Derek Cooper
Four meetings held in 2005
Black ownership initiativecommittee
Chairman: Derek Cooper
One meeting held in 2005
Group risk management committee
Chairman: Martin Shaw
Four meetings held in 2005
Group remuneration committee
Chairman: Buddy Hawton
Two meetings held in 2005
Group transformation committee
Chairman: Saki Macozoma
Four meetings held in 2005
Directors’ affairs committee
Chairman: Derek Cooper
Two meetings held in 2005
Board of directors

C o r p o ra te governance co n t i n u e dc e m b e r 2 0 0 5
• approve the guidelines for using the external auditors for non-
audit work, annually assess the work done to ensure the
independence of the external auditors is retained;
• meet with external auditors to discuss audit findings and co n s i d e r
detailed internal audit reports with the internal audito r s ;
• annually evaluate the role, independence and effectiveness of
the internal audit function in the overall context of the gro u p ’ s
risk management system;
• receive and review reports on the adequacy of capital, pro v i s i o n s
for bad debts and diminution in the value of other assets;
• review the accounting policies adopted by the group and all
proposed changes in accounting policies and practices;
• consider the adequacy of disclosures and the reasons for
fluctuations in ratios reported in published documentation;
• review the effectiveness of financial management and the
quality of internal accounting control systems and reports
produced by financial management;
• review significant differences of opinion between management
and the internal audit function;
• review the group compliance plan, with specific reference to the
p rocedures for identifying regulato ry risks and co n t rolling their
impact on the group, as well as ensuring that the group’s policy
complies with relevant regulato ry and legal requirements;
• monitor ethical conduct of the group, executives and other
senior officials; and
• review and make recommendations on any potential conflicts
of interest relating to situations of a material nature.
Group risk management committee
Member Feb May Aug Nov
MJ Shaw (chairman)1 A ✓ ✓ ✓
RA Plumbridge2 ✓ ✓ – –
DE Cooper ✓ ✓ ✓ A
TS Gcabashe4 – – – ✓
DA Hawton ✓ ✓ ✓ ✓
SJ Macozoma ✓ ✓ ✓ ✓
RP Menell ✓ ✓ A ✓
CL Stals3 ✓ ✓ – –
✓ = Attendance
A = Apology1Appointed as chairman on 25 May 2005.2Retired as chairman and member on 25 May 2005.3Retired on 25 May 2005.4Appointed on 23 November 2005.
The board has ultimate responsibility for risk management. The
main purpose of this committee is to provide independent and
objective oversight of risk management within the group. It
achieves this by reviewing and assessing the integrity of risk
control systems and ensuring that risk policies and strategies are
effectively managed and contribute to a climate of discipline and
control that will reduce the opportunity for fraud. A detailed risk
management section starts on page 45.
Group credit committee
Member Feb May Aug Nov
DE Cooper (chairman) ✓ ✓ ✓ ✓
DDB Band A ✓ ✓ ✓
AG Gain1 ✓ ✓ ✓ ✓
SJ Macozoma ✓ ✓ ✓ ✓
JH Maree ✓ ✓ ✓ ✓
T Moodley1 ✓ ✓ ✓ ✓
SP Ridley1 ✓ ✓ ✓ A
MJD Ruck ✓ ✓ ✓ ✓
PJ Smith1 ✓ ✓ ✓ ✓
✓ = Attendance
A = Apology1Co-opted executive members.
The role of this committee is to ensure that effective credit
governance is in place across the group. This involves ensuring
that the credit committees across the group operate within clearly
defined mandates and delegated authority as well as to provide
for the adequate management, measurement, monitoring and
control of credit risk, including country risk. In addition, the
committee sets the group’s credit policy, strategy and philosophy,
and ensures compliance therewith. The committee report s
quarterly to the group risk management committee and group
audit committee on the group credit portfolios, the adequacy of
provisions and status of non-performing loans.
In line with other changes being considered to align governance
frameworks with Basel II requirements, the credit risk governance
structure is in the process of being reviewed.
Directors’ affairs committee
Member May Nov
DE Cooper (chairman) ✓ ✓
DDB Band ✓ ✓
E Bradley ✓ A
SJ Macozoma ✓ ✓
✓ = Attendance
A = Apology
The committee assists the board in its determination and
evaluation of the adequacy, efficiency and appropriateness of the
corporate governance structures and practices in the group. The
role of the committee is also to identify, evaluate and recommend
nominees to the board and board committees to ensure that the
board is able to fulfil its mandated obligations.
S t a n d a rd Bank Group annual report 2005 P • 3 4
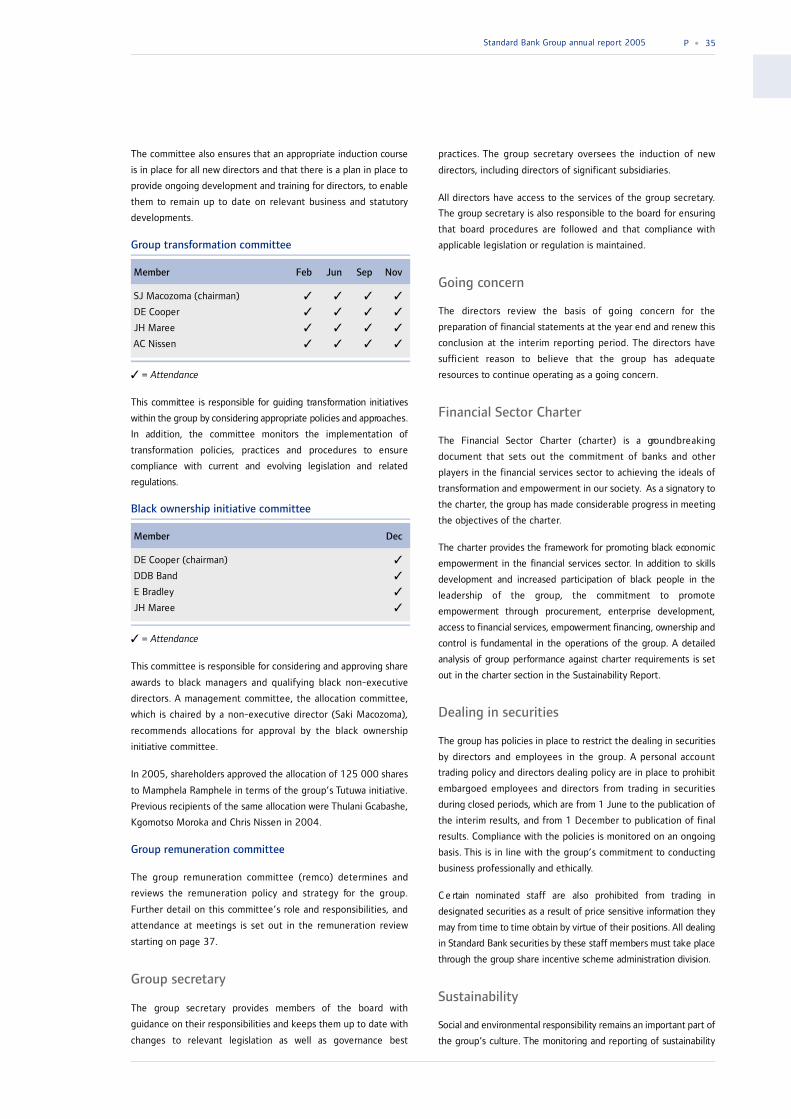
The committee also ensures that an appropriate induction course
is in place for all new directors and that there is a plan in place to
provide ongoing development and training for directors, to enable
them to remain up to date on relevant business and statutory
developments.
Group transformation committee
Member Feb Jun Sep Nov
SJ Macozoma (chairman) ✓ ✓ ✓ ✓
DE Cooper ✓ ✓ ✓ ✓
JH Maree ✓ ✓ ✓ ✓
AC Nissen ✓ ✓ ✓ ✓
✓ = Attendance
This committee is responsible for guiding tra n s formation initiatives
within the group by considering appropriate policies and appro a c h e s .
In addition, the committee monitors the implementation of
t ra n s formation policies, practices and procedures to ensure
compliance with current and evolving legislation and related
r e g u l a t i o n s .
Black ownership initiative committee
Member Dec
DE Cooper (chairman) ✓
DDB Band ✓
E Bradley ✓
JH Maree ✓
✓ = Attendance
This committee is responsible for considering and approving share
awards to black managers and qualifying black non-executive
directors. A management committee, the allocation committee,
which is chaired by a non-executive director (Saki Macozoma),
recommends allocations for approval by the black ownership
initiative committee.
In 2005, shareholders approved the allocation of 125 000 shares
to Mamphela Ramphele in terms of the group’s Tutuwa initiative.
Previous recipients of the same allocation were Thulani Gcabashe,
Kgomotso Moroka and Chris Nissen in 2004.
Group remuneration committee
The group remuneration committee (remco) determines and
reviews the remuneration policy and strategy for the group.
Further detail on this committee’s role and responsibilities, and
attendance at meetings is set out in the remuneration review
starting on page 37.
Group secretary
The group secretary provides members of the board with
guidance on their responsibilities and keeps them up to date with
changes to relevant legislation as well as governance best
practices. The group secretary oversees the induction of new
directors, including directors of significant subsidiaries.
All directors have access to the services of the group secretary.
The group secretary is also responsible to the board for ensuring
that board procedures are followed and that compliance with
applicable legislation or regulation is maintained.
Going concern
The directors review the basis of going concern for the
preparation of financial statements at the year end and renew this
conclusion at the interim reporting period. The directors have
sufficient reason to believe that the group has adequate
resources to continue operating as a going concern.
Financial Sector Charter
The Financial Sector Charter (charter) is a gro u n d b r e a k i n g
document that sets out the commitment of banks and other
players in the financial services sector to achieving the ideals of
transformation and empowerment in our society. As a signatory to
the charter, the group has made considerable progress in meeting
the objectives of the charter.
The charter provides the framework for promoting black eco n o m i c
empowerment in the financial services secto r. In addition to skills
development and increased participation of black people in the
leadership of the group, the commitment to pro m o t e
empowerment through procurement, enterprise development,
a ccess to financial services, empowerment financing, ownership and
co n t rol is fundamental in the operations of the group. A detailed
analysis of group performance against charter requirements is set
out in the charter section in the Sustainability Report .
Dealing in securities
The group has policies in place to restrict the dealing in securities
by directors and employees in the group. A personal account
trading policy and directors dealing policy are in place to prohibit
embargoed employees and directors from trading in securities
during closed periods, which are from 1 June to the publication of
the interim results, and from 1 December to publication of final
results. Compliance with the policies is monitored on an ongoing
basis. This is in line with the group’s commitment to conducting
business professionally and ethically.
C e rtain nominated staff are also prohibited from trading in
designated securities as a result of price sensitive information they
may from time to time obtain by virtue of their positions. All dealing
in Standard Bank securities by these staff members must take place
t h rough the group share incentive scheme administration division.
Sustainability
Social and environmental responsibility remains an important part of
the group’s culture. The monitoring and reporting of sustainability
S t a n d a rd Bank Group annual report 2005 P • 3 5

C o r p o ra te governance co n t i n u e dc e m b e r 2 0 0 5
issues is still an evolving discipline within our organisation. T h e
Sustainability Report aims to provide comprehensive co m m e n t a ry
and a technical overview of the group's progress in its sustainability
and tra n s formation effo rts, and includes key non-financial
p e rformance indicators. The report presents a balanced view, with
relevant and material information disclosed.
As part of the group’s operational commitment to sustainability, it
participated and was included in two key sustainability indices,
namely, the Dow Jones Sustainability Index and the JSE Socially
Responsible Investment Index.
A brief summary of the report can be found on page 16 and it has
been included in electronic format with this report. It can also be
accessed on the website: www.standardbank.co.za. Printed copies
of the report can be obtained from the group secretary.
Ethics and organisational integrity
The group is in the process of revising its code of ethics to bring
it into line with the group’s redefined vision and values. Revising
the vision and values involved a wide-ranging co n s u l t a t i v e
process. This included broad employee feedback, dedicated one-
on-one and group discussions, as well as board and group exco
deliberations. The process culminated in a facilitated debate held
at group exco level to finalise and adopt the vision and values.
These were then launched to the group through a series of road
shows attended by the chief executive, who discussed the
implications of the vision and values with employees at all levels.
The group’s code of ethics, and vision and values are readily
available to all staff through the intranet. The board, through the
group audit committee, assesses the ethical climate of the group
through work conducted by the forensic audit team. To ensure
that ethical conduct remains integral to the culture of the group,
there are guidelines, performance measurements and leadership
development initiatives in place.
Political contributions
In 2004, the group announced a departure from its policy of not
making political donations. In recognition of South Africa’s tenth
a n n i v e r s a ry of democra c y, R5 million was donated to w a rd s
funding the national election. Fifty percent was distributed to
political parties according to representation in Parliament prior to
South Africa’s 2004 general election. The remaining 50%
was distributed acco rding to the same formula based on
representation post the election.
The group believes that active and strong civil society fo r m a t i o n s
are critical in strengthening a multi-party democracy system. In
light of this, the group has again reviewed its political party funding
p o l i c y. An amount of R10 million has been approved to pro v i d e
funding to political parties over the next five years acco rding to
representation in Parliament.
Relationship with shareholders
The group views communication with shareholders as an
important part of its operations. Shareholders are invited by the
chairman to attend the annual general meeting (AGM). The
chairmen of the group’s audit committee and remuneration
committee are available at the meeting to respond to questions
from shareholders.
T h rough our investor relations team we interact with our
shareholders in various ways including meetings and presentations.
During the year the group ran a pro g ramme to assist shareholders
holding less than one hundred shares to dispose of their holdings in
a convenient manner. For more information on our relationship with
shareholders, please refer to our Sustainability Report .
Relationship with external auditors
The group has a formal policy on fees for non-audit services. The
purpose of this policy is to ensure that the independence of
auditors is not impaired.
In terms of the policy, all non-audit services assigned to the group
auditors that are individually greater than 20% of the audit fee of
the previous year of that business unit or subsidiary must be pre-
approved by the respective board audit committees of the
subsidiary entities on a project-by-project basis. Sensitive non-
audit assignments, even if below the threshold of 20% of audit
fees, must be pre-approved by the respective board audit
committees’ chairmen.
S t a n d a rd Bank Group annual report 2005 P • 3 6

Re m u n e ra t i o n
I n t ro d u c t i o n
The purpose of this section is to provide stakeholders with an
understanding of the remuneration philosophy and policy applied
a c ross the group for board members (executive and non-executive
d i r e c tors) and employees.
Highlights in 2005
Key developments during the year included:
• r e m co conducting a self-assessment of its activities; and
• the group adopting a new long-term incentive scheme to align
with recent developments including tax and accounting changes.
Re m u n e ration philosophy
The group is committed to a remuneration philosophy that
emphasises the value of its people and their fundamental role in
ensuring sustainable gro wth. This approach is imperative in an
e n v i ronment where skills remain scarce.
The board sets the principles for the group‘s remunera t i o n
philosophy in line with approved business strategy and objectives.
This philosophy, which is informed by remco’s deliberations, aims to
maintain an appropriate balance between employee and shareholder
interests.
Key success factors for the group are its ability to attract, retain and
motivate the talent it requires to achieve its strategic and opera t i o n a l
objectives. The group’s remuneration philosophy includes short- t e r m
and long-term incentives to support this ability.
S h o rt-term incentives, which are delivery specific, are viewed as
s t rong drivers of competitiveness and performance. A significant
p o rtion of top management’s reward is therefore variable, being
determined by profits achieved and personal contribution, to ensure
the commitment and focus required to achieve targets.
Long-term incentives are used to ensure that the objectives of
management and shareholders are closely aligned over longer time
p e r i o d s .
Re m u n e ration policy
R e m co assists the board in monitoring the implementation of the
g roup remuneration policy by ensuring:
• r e w a rd strategies and remuneration are competitive, and
facilitate the recruitment, motivation and retention of high
calibre staff at all levels;
• s a l a ry structures and policies, as well as cash and equity
compensation plans motivate sustained high performance and
are linked to co r p o rate perfo r m a n c e ;
• stakeholders are able to make a reasonable assessment of reward
p ractices and the governance process; and
• all applicable laws and codes are complied with.
Re m u n e ration governance
B o a rd re s p o n s i b i l i t y
The board remains ultimately responsible for the remunera t i o n
p o l i c y. Remco operates in terms of an agreed mandate appro v e d
annually by the board. On remco’s recommendation, the board will in
some instances refer matters to shareholders for approval, fo r
example, new share incentive schemes and board and co m m i t t e e
f e e s .
Subsidiaries and group opera t i o n s
C o r p o ra te & Investment Banking Inte r n a t i o n a l
S t a n d a rd Bank Plc operates in a regulato ry environment that requires
it to have its own remuneration committee. The board of Standard
Bank Plc approves this committee’s mandate, which acco rds with the
g roup remuneration philosophy. The committee is chaired by an
independent non-executive director of Standard Bank Plc, and
reviews remuneration practices in the group’s international
o p e rations based on best practice within specific jurisdictions.
C e rtain matters considered by the committee are subject to final
a p p roval by remco.
Rest of A f r i c a
The remuneration of board members in African countries outside of
South Africa is assessed in each co u n t ry and noted at remco. T h e
r e m u n e ration of executive management in these countries is
reviewed and approved by remco.
A project has been initiated to integrate and align reward policies and
p rocedures in the African operations with those of the group.
The specific guidelines in this regard, which will underpin
an integrated approach to the rest of Africa reward stra t e g y, are to :
• develop reward policies and procedures that support the
achievement of business goals;
• p rovide rewards that attract, retain and motivate staff and
develop a high performance culture;
• maintain competitive remuneration in line with the co u n t ry
specific markets and trends;
• r e w a rd people acco rding to their co n t r i b u t i o n ;
• allow a reasonable degree of flexibility in remuneration pro c e s s e s
and the choice of benefits by employees; and
• move to a cost to company (CTC) remuneration philosophy.
L i b e rty Life
The Liberty Life board determines the remuneration philosophy
and policy for Liberty Life. It has an established remuneration
committee that monitors the implementation of practices within
that group.
Re m co operation
Buddy Hawton, an independent non-executive directo r, chairs
r e m co. He also chairs the Liberty Life and Stanlib remunera t i o n
committees to ensure consistency across group operations. Remco
S t a n d a rd Bank Group annual report 2005 P • 3 7

C o r p o ra te governance co n t i n u e dc e m b e r 2 0 0 5
comprises a majority of independent non-executive directors. All its
members have the relevant skills and experience to perform their
d u t i e s .
The key terms of reference set out in remco’s mandate include:
• reviewing group remuneration philosophy and policy;
• determining the remuneration of executive directors, as well as
the chairman and non-executive directors, which are subject to
shareholder approval;
• considering the guaranteed remuneration, annual perfo r m a n c e
bonuses and pension incentives of the group’s highest- p a i d
executive managers, excluding Liberty Life and Stanlib
executives and directo r s ;
• considering the average percentage increases of the guara n t e e d
r e m u n e ration of executive management across the group, as well
as long-term and short-term incentives;
• agreeing incentive schemes and awards across the group;
• ensuring adequate retirement funding and healthcare benefits;
• agreeing the co m p u l s o ry employee benefits applicable to all
levels and categories of employees in the group, notably
retirement funding and healthcare benefits; and
• reviewing the performance measures and criteria to be used fo r
annual incentive payments for all employees.
R e m co held two meetings during the year, with attendance reco rd e d
b e l o w :
M e m b e r M a r A u g
DA Hawton (chairman)1 ✓ ✓
DDB Band2 ✓ ✓
DE Cooper1 ✓ ✓
T Evans1, 3 ✓ ✓
SJ Maco z o m a2 ✓ ✓
RP Menell1 ✓ ✓
✓ = A tt e n d a n ce1Independent non-executive dire c to r.2N o n - e xecutive dire c to r.3Resigned on 8 March 2006.
The chief executive attends meetings by invitation. Other members
of executive management are invited to attend when appro p r i a t e .
No individual, irrespective of position, is present when his or her
r e m u n e ration is discussed.
To determine the remuneration of executive and non-executive
d i r e c tors as well as senior executives, remco reviews market and
competitive data, and takes into account group performance using
i n d i c a tors such as headline earnings.
R e m co utilises the services of a number of suppliers and advisors to
assist it in tracking market trends relating to all levels of staff. In
2005 the following suppliers were used:
• Deloitte & To u c h e ;
• Ernst & Yo u n g ;
• Global Remuneration Solutions (GRS);
• Hay Renwick;
• Mclagans; and
• Monks Pa rt n e r s h i p .
Based on the input of these suppliers, remco makes its decisions on
m a r k e t-related guaranteed remuneration and total remuneration. It
also assesses market practice in relation to equity co m p e n s a t i o nplans and considers market-related information in its review of board
and committee fees. The board then reviews these proposals and,
where required, makes recommendations to shareholders fo r
a p p roval at the AG M .
A self-assessment of remco was conducted during the year. T h e
objectives of the review were to assess the committee’s perfo r m a n c e
on three levels:
• s t r u c t u r e ;
• p rocess; and
• e f f e c t i v e n e s s .
The findings were reviewed by the committee and reported to the
b o a rd.
Re m u n e ration structure
N o n ! e xecutive dire c to r s
Terms of serv i ce
All non-executive directors are provided with a letter of appointment
setting out the terms of their engagement.
In terms of the articles of association, non-executive directors are
required to retire at 70. Directors are appointed by the shareholders
at the AGM and interim board appointments are allowed between
AGMs. The interim appointees are required to retire at the next AG M
where they make themselves available for election by shareholders.In addition, one-third of the non-executive directors are required to
retire at each AGM and may offer themselves for re-election. If
r e commended by the directors’ affairs committee and supported by
the board, the board then proposes their re-election to the
shareholders. There is no limitation to the number of times a non-
executive director may stand for re-election.
Fe e s
Non-executive directors receive fixed fees for service on boards and
b o a rd committees. The group does not make provision fo r
compensation for loss of office. Non-executive directors do not
receive short-term incentives, nor do they participate in any long-
term incentive schemes.
S t a n d a rd Bank Group annual report 2005 P • 3 8
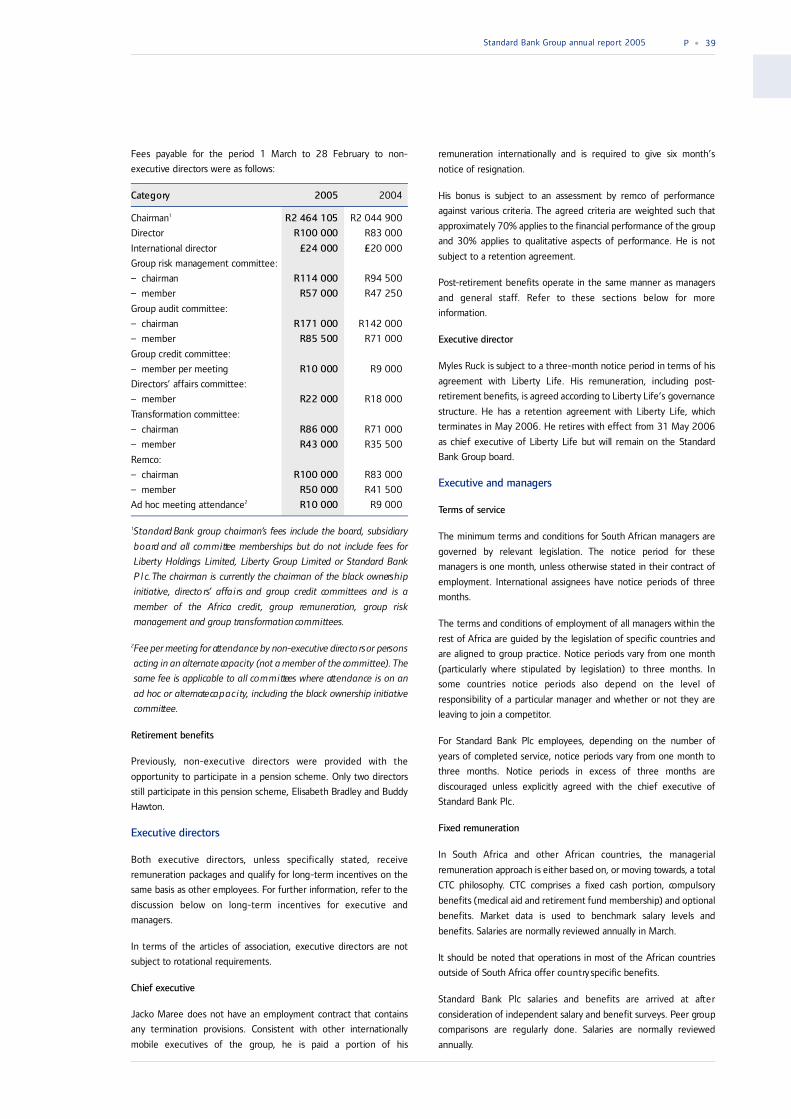
Fees payable for the period 1 March to 28 February to non-
executive directors were as fo l l o w s :
C a te g o ry 2 0 0 5 2 0 0 4
C h a i r m a n1 R2 464 105 R2 044 900
D i r e c to r R100 000 R83 000
International directo r £24 000 £20 000
G roup risk management co m m i t t e e :
– chairman R114 000 R94 500
– member R57 000 R47 250
G roup audit co m m i t t e e :
– chairman R171 000 R142 000
– member R85 500 R71 000
G roup credit co m m i t t e e :
– member per meeting R10 000 R9 000
D i r e c tors’ affairs co m m i t t e e :
– member R22 000 R18 000
Tra n s formation co m m i t t e e :
– chairman R86 000 R71 000
– member R43 000 R35 500
R e m co :
– chairman R100 000 R83 000
– member R50 000 R41 500
Ad hoc meeting attendance2 R10 000 R9 000
1S t a n d a rd Bank group chairman’s fees include the board, subsidiary
b o a rd and all co m m i ttee memberships but do not include fees fo r
L i b e rty Holdings Limited, Liberty Group Limited or Standard Bank
P l c. The chairman is currently the chairman of the black owners h i p
initiative, dire c to rs’ affa i rs and group credit co m m i ttees and is a
member of the A f r i ca credit, group re m u n e ration, group risk
management and group tra n s formation co m m i tt e e s .
2Fee per meeting for att e n d a n ce by non-executive dire c to rs or pers o n s
acting in an alternate ca p a c i ty (not a member of the co m m i ttee). T h e
same fee is applicable to all co m m i ttees where att e n d a n ce is on an
ad hoc or alternate ca p a c i ty, including the black ownership initiative
co m m i tt e e .
Re t i rement benefits
P r e v i o u s l y, non-executive directors were provided with the
o p p o rtunity to participate in a pension scheme. Only two directo r s
still participate in this pension scheme, Elisabeth Bradley and Buddy
H a wton.
E xecutive dire c to r s
Both executive directors, unless specifically stated, receive
r e m u n e ration packages and qualify for long-term incentives on the
same basis as other employees. For further information, refer to the
discussion below on long-term incentives for executive and
m a n a g e r s .
In terms of the articles of association, executive directors are not
subject to rotational requirements.
Chief exe c u t i v e
J a c ko Maree does not have an employment co n t ract that co n t a i n s
any termination provisions. Consistent with other internationally
mobile executives of the group, he is paid a portion of his
r e m u n e ration internationally and is required to give six month’s
notice of resignation.
His bonus is subject to an assessment by remco of perfo r m a n c e
against various criteria. The agreed criteria are weighted such that
a p p roximately 70% applies to the financial performance of the gro u p
and 30% applies to qualitative aspects of performance. He is not
subject to a retention agreement.
Po s t-retirement benefits operate in the same manner as managers
and general staff. Refer to these sections below for more
i n formation.
E xecutive dire c to r
Myles Ruck is subject to a three-month notice period in terms of his
agreement with Liberty Life. His remuneration, including post-
retirement benefits, is agreed acco rding to Liberty Life’s governance
structure. He has a retention agreement with Liberty Life, which
terminates in May 2006. He retires with effect from 31 May 2006
as chief executive of Liberty Life but will remain on the Standard
Bank Group board .
E xecutive and managers
Terms of serv i ce
The minimum terms and conditions for South African managers are
governed by relevant legislation. The notice period for these
managers is one month, unless otherwise stated in their co n t ract of
employment. International assignees have notice periods of three
m o n t h s .
The terms and conditions of employment of all managers within the
rest of Africa are guided by the legislation of specific countries and
are aligned to group practice. Notice periods vary from one month
( p a rticularly where stipulated by legislation) to three months. In
some countries notice periods also depend on the level of
responsibility of a particular manager and whether or not they are
leaving to join a co m p e t i to r.
For Standard Bank Plc employees, depending on the number of
years of completed service, notice periods vary from one month to
three months. Notice periods in excess of three months are
d i s co u raged unless explicitly agreed with the chief executive of
S t a n d a rd Bank Plc.
F i xed re m u n e ra t i o n
In South Africa and other African countries, the managerial
r e m u n e ration approach is either based on, or moving to w a rds, a to t a l
C TC philosophy. CTC comprises a fixed cash portion, co m p u l s o ry
benefits (medical aid and retirement fund membership) and optional
benefits. Market data is used to benchmark salary levels and
benefits. Salaries are normally reviewed annually in Marc h .
It should be noted that operations in most of the African co u n t r i e s
outside of South Africa offer co u n t ry specific benefits.
S t a n d a rd Bank Plc salaries and benefits are arrived at aft e r
co n s i d e ration of independent salary and benefit surveys. Peer gro u p
comparisons are regularly done. Salaries are normally reviewed
a n n u a l l y.
S t a n d a rd Bank Group annual report 2005 P • 3 9

C o r p o ra te governance co n t i n u e dc e m b e r 2 0 0 5
For all staff, performance related payments have formed an
increasing pro p o rtion of total remuneration over time. This is
premised on the need to sustain performance to achieve objectives,
and to reward individual co n t r i b u t i o n .
All employees (executives, managers and general staff) are ra n k e d .
During the first stage the employees are ranked by their line
managers based on their performance (following the outcome of
their appraisal discussion) and the consistent demonstration of
agreed behaviours. The individual is ranked in one of three gro u p s ,
the top 20%, next 70% and bottom 10%.
The second stage is a moderation stage. The combined ranking of
the division is then submitted to the divisional exco for final
m o d e ration. Ranking and the consequent pay decision is driven at an
individual basis. There is therefore a direct link between their ra n k i n g
and the reward process. It is in this manner that a link is established
between the employees’ performance and their reward .
S h o rt ! term ince n t i v e s
Executives and managers in South Africa and other African co u n t r i e s
p a rticipate in a bonus scheme. Individual awards are based on a
combination of business unit performance, job level and individual
p e rformance. In keeping with the remuneration philosophy, the
bonus scheme gives high-performing managers the opportunity to
earn in line with the philosophy to attract and retain talent.
All staff internationally may participate in the Standard Bank Plc
incentive plan. There are no grade or level restrictions. The level of
a w a rd received by each employee will be related to the fo l l o w i n g
f a c to r s :
• p rofit performance;
• divisional performance; and
• individual performance and contribution to the team and/o r
g ro u p .
As well as taking performance factors into account, the size of award
is assessed in terms of market related issues for each skill set (e.g.
s c a rcity of skills).
Lo n g ! term ince n t i v e s
It is essential for the group to retain key individuals over the longer
term. This is done particularly through equity compensation plans.
The purpose of these is to align the interests of the group, its
subsidiaries and their respective employees, as well as to attract and
retain skilled and competent people.
Group share incentive scheme (GSIS)
Share options are granted to qualifying employees (including
executive directors) in terms of the fo l l o w i n g :
• the specific grant is not subject to prior shareholder approval as
a p p roval for the scheme has already been obtained;
• no options are issued at a pricing discount nor can they be
repriced; and
• the directors have the discretion to vary the vesting period.
Equity growth scheme (EGS)
In line with recent developments, including changes in South A f r i c a n
tax legislation and international accounting practice, the board
r e considered the structure of the GSIS and proposed a revisedscheme to shareholders. The basis for participation, award and
vesting remains the same. The EGS was approved by shareholders at
the 2005 AGM.
The maximum award to an employee, in terms of the GSIS and EGS,is not more than 2,5% of the total number of shares reserved fo r
both schemes.
The table below sets out the general conditions of the variousoptions, or participation rights issued:
Vesting cate g o ry Ye a r % E x p i ry
A 3, 4, 5 50, 75, 100 10 years
B 5, 6, 7 50, 75, 100 10 years
C 2, 3, 4 50, 75, 100 10 years
Shadow share schemes
In addition to the GSIS and EGS, there are other schemes that
p rovide longer-term benefits targeted at a small number of specialistinvestment banking staff in South Africa, and internationally. T h e y
p rovide cash incentives to select managers based on the relevant
business unit’s performance and valuation.
L i b e rty Life has its own incentive schemes. For further info r m a t i o n ,please refer to Liberty Life’s annual report .
Re tention agre e m e n t s
As part of the group’s strategy to retain highly mobile and talented
employees, the group will selectively enter into agreements in terms
of which retention payments are made. This payment would have to
be repaid should the individual concerned leave within a stipulated
period.
Po s t ! re t i rement benefits
P e n s i o n
Retirement benefits are typically provided on the same basis for all
levels of employee. Traditionally the group adopted retirement
funding on a defined benefit basis but in line with market and legal
changes across the group’s operations, almost all defined benefit
funds have been co n v e rted to a defined contribution basis for new
members. New funds will be defined contribution funds. Death
benefit cover is provided in almost all countries, in most cases fro m
s e l f - i n s u rance within the pension fund, in other cases thro u g hexternal underw r i t i n g .
S t a n d a rd Bank Group annual report 2005 P • 4 0

Membership of the principal fund, the Standard Bank Gro u p
Retirement Fund (SBGRF) exceeds 95% of Standard Bank
o p e rations’ permanent staff in South Africa. Membership and benefit
criteria are as fo l l o w s :
• employees who were members of the fund on 31 December
1994 have guaranteed benefits available under the rules of the
defined section of the fund; and
• new members from 1 January 1995 participate only in the
benefits of the defined contribution section of the fund.
In addition, a defined contribution supplementary plan, the FlexibleExecutive Option (FEO) is available as an option for senior managers
and executives whose remuneration passes a threshold as defined by
r e m co. Under this arrangement, participation in the SBGRF
continues up to the defined threshold, and above it contributions are
placed in the FEO. The threshold is reviewed on an annual basis by
r e m co .
Employees in territories beyond South African jurisdiction are
members of either defined contribution or defined benefit plans
governed by legislation in their respective co u n t r i e s .
H e a l t h c a r e
In South Africa, post-retirement healthcare funding is made availablet h rough a fund (the Provider Fund) which was set up on
1 March 2000. Membership and benefit criteria are as fo l l o w s :
• staff in service on 29 February 2000, who received a medical aidsubsidy from the bank, became Provider Fund members on
1 March 2000, effective from the date of joining the bank. Staff
in service on 29 February 2000, who join the bank’s medical aid
at a later date, become members from the date of joining the
medical aid;
• members receive a benefit to assist them in meeting their post-
retirement medical aid costs. This benefit is a lump sum, based on
a defined rand target benefit adjusted annually in line with CPIX
plus 2%. The lump sum must be used to buy an annuity which is
expected to be applied to w a rds post-retirement healthcare co s t s .
The lump sum takes into account normal retirement age (NRA)
and years of service. Any shortfall in the medical aid co n t r i b u t i o nis the responsibility of the employee; and
• employees recruited from 1 March 2000 do not receive this
p o s t-retirement healthcare benefit.
In other African countries, a pension payout is the most co m m o n
p o s t-retirement benefit. In a limited number of countries, post-
retirement medical aid subsidies may continue from the employer,
usually for a limited period.
In addition to pension payouts in terms of a defined co n t r i b u t i o n
scheme, retired Standard Bank Plc employees are eligible to apply
for healthcare cover with the current provider at the employees’e x p e n s e .
L i b e rty Life has its own post-retirement benefits schemes. Fo r
f u rther details please refer to Liberty Life’s annual report .
Please refer to note 33 of the annual financial statements on page
173 for further detail on post-retirement benefits.
G e n e ral staff
Terms of serv i ce
The notice period for general staff in Africa is one month. Most of
the general staff in Africa are unionised. Their terms and co n d i t i o n s
of employment are therefore guided by the respective co l l e c t i v e
agreement(s) in particular countries.
F i xed re m u n e ra t i o n
R e m u n e ration of all general staff, both local and international, is
based on a basic salary plus benefits, which generally includes
medical aid, retirement fund membership, housing benefit and a
t ravel allowance for select levels.
G e n e ra l l y, salary increases are negotiated on an annual basis, usually
in March. Salary increases are based on similar factors as those
considered when reviewing managerial staff increases.
I n ce n t i v e s
All general staff in South Africa participate in the general staff bonus
scheme. The bonus is contingent on the group reaching its annual
financial and yearly specific targets (set in terms of goals based on
g roup strategy). For the past four years, these have included
c u s tomer service objectives. Similar remuneration philosophies are
applied in other African opera t i o n s .
S t a n d a rd Bank Plc general staff participate in the co m p a n y ’ s
incentive plan, outlined in the section on managers’ short- t e r m
incentives above.
Po s t ! re t i rement benefits
Po s t-retirement benefits for general staff are principally the same as
for the executive and managers. Refer to this section under
executive and managers for an outline of these benefits.
Re m u n e ration for 2006
Details on the proposed 2006 remuneration packages for non-
executive directors can be found in the notice to members on page
211. These are subject to shareholder approval at the AGM on
24 May 2006.
Challenges for 2006
The group will continue to ensure its remuneration policies and
p ractices remain competitive, incentivise performance and are
aligned across the group. Individual reviews of remunera t i o n
p a c kages will continue for all levels of staff in 2006.
S t a n d a rd Bank Group annual report 2005 P • 4 1

C o r p o ra te governance co n t i n u e dc e m b e r 2 0 0 5
S t a n d a rd Bank Group annual report 2005 P • 4 2
Directors’ emoluments 2005
Bonus and Otherwise in
Services pension connection
Services as incentives/ with the Total Fair
as director directors Cash performance Pension affairs of annual value of Value of
of Standard Committee of group portion of related Other contri! SBG and its remune! options total
Bank Group fees subsidiaries package payments5 benefits butions subsidiaries ration granted6 package
R’000 R’000 R’000 R’000 R’000 R’000 R’000 R’000 R’000 R’000 R’000
Executive directors
JH Maree 3 743 10 326 175 588 14 832 14 832
MJD Ruck 341 3 041 6 000 304 303 9 989 2 108 12 097
– – 341 6 784 16 326 479 891 – 24 821 2 108 26 929
Non!executive directors
DE Cooper (chairman) 2 394 1 526 28 3 948 3 948
DDB Band 97 193 281 7 286)1 7 857 7 857
E Bradley 68 114 97 279 279
T Evans2 97 49 97 243 243
TS Gcabashe 97 6 97 200 200
DA Hawton 68 153 462 683 683
Sir Paul Judge 275 275 550 550
SJ Macozoma 97 331 942 1 370 1 370
RP Menell 97 104 97 298 298
Adv KD Moroka 97 97 194 194
AC Nissen 97 42 97 236 236
MC Ramaphosa 97 97 194 194
Dr MA Ramphele3 83 83 166 166
MJ Shaw 97 225 387 709 709
Sir Robert Smith 275 275 550 550
Dr CB Strauss 97 97 194 194
4 133 1 217 5 007 – – – – 7 314 17 671 – 17 671
Former non!executive
directors
RA Plumbridge4 37 107 59 66 269 269
Dr CL Stals4 37 21 37 95 95
74 128 96 – – – – 66 364 – 364
Total 4 207 1 345 5 444 6 784 16 326 479 891 7 380 42 856 2 108 44 964
1This amount was payable to Doug Band by Gymnogene Investments, a company in which he is a 33% shareholder and which had a contractual relationship with the bank.
The payment arises from a share of the profit on disposal of private equity investments in a portfolio sourced and arranged by Gymnogene Investments on behalf of the bank.
Although the contract expired on 31 December 2004, payments of this nature are likely to recur if and when the three remaining investments in this portfolio are realised on
a profitable basis to the bank.
2Resigned on 8 March 2006.
3Appointed on 17 March 2005.
4Retired on 25 May 2005.
5In order to align incentive awards with the performance to which they relate, bonuses above reflect the amounts accrued in respect of each year and not the amount paid.6Calculated in terms of International Financial Reporting Standards (IFRS) on share-based payments (IFRS 2). This is considered to be the most appropriate quantification of
the benefit awarded in the year under review.

S t a n d a rd Bank Group annual report 2005 P • 4 3
Directors’ emoluments 2004
Bonus and Otherwise in
Services pension connection
Services as incentives/ with the Total Fair
as director directors Cash performance Pension affairs of annual value of Value of
of Standard Committee of group portion of related Other contri! SBG and its remune! options total
Bank Group fees subsidiaries package payments4 benefits butions subsidiaries ration granted5 package
R’000 R’000 R’000 R’000 R’000 R’000 R’000 R’000 R’000 R’000 R’000
Executive directors
JH Maree 3 540 9 065 168 566 13 339 3 700 17 039
MJD Ruck 348 3 047 5 040 306 303 9 044 3 690 12 734
– – 348 6 587 14 105 474 869 – 22 383 7 390 29 773
Non!executive directors
DE Cooper (chairman) 2 014 1 364 32 3 410 3 410
DDB Band 81 145 141 2 549 2 916 2 916
E Bradley1 56 105 81 242 242
T Evans 81 40 81 202 202
T S Gcabashe 81 81 162 162
DA Hawton 56 127 346 529 529
Sir Paul Judge 241 241 482 482
SJ Macozoma 81 86 1 401 1 568 1 568
RP Menell 81 86 81 248 248
Adv KD Moroka 81 81 162 162
AC Nissen 81 34 81 196 196
RA Plumbridge 81 230 127 84 522 522
MC Ramaphosa2 14 14 28 28
MJ Shaw3 37 53 267 357 357
Sir Robert Smith 241 241 482 482
Dr CL Stals 81 46 81 208 208
Dr CB Strauss 81 81 162 162
3 469 952 4 790 – – – – 2 665 11 876 – 11 876
Total 3 469 952 5 138 6 587 14 105 474 869 2 665 34 259 7 390 41 649
1Individual not recipient of fees paid for January and February 2004 – fees paid to company. From March 2004 fees paid directly to individual.
2Appointed on 1 November 2004.
3Appointed on 22 July 2004.
4In order to align incentive awards with the performance to which they relate, bonuses above reflect the amounts accrued in respect of each year and not the amount paid.
5Calculated in terms of IFRS 2. This is considered to be the most appropriate quantification of the benefit awarded in the year under review.

Share incentivesStandard Bank Group Limited
Balance Number Balanceof options Number of options of options
as at of options exercised as at Number1 Jan allocated in Issue during 31 Dec of Issue Issue Vesting Expiry
Director’s name 2005 2005 date the year 2005 options date price category date
JH Maree 1 750 000 – – 250 000 1 500 000 975 000 13/3/01 31,90 A 13/3/11
25 000 23/5/01 33,50 A 23/5/11
500 000 11/3/04 40,65 C 11/3/14
MJD Ruck 506 900 – – 258 500 248 400 60 000 13/3/01 31,90 A 13/3/11
180 000 13/3/02 27,80 A 13/3/12
5 000 14/4/99 17,15 B 14/4/09
2 5001 15/3/00 25,00 – 14/4/09
9001 27/11/00 26,40 – 14/4/09
Liberty Group
MJD Ruck 366 000 100 000 21/4/05 – 466 000 166 000 2/6/03 48,50 A 31/3/13
200 000 15/3/04 54,25 A 31/3/14
100 000 21/4/05 62,00 A 21/4/15
13 400 of MJD Ruck’s share options have further conditions attached to them in terms of the Standard Corporate and Merchant Bank (SCMB) Shadow Share Scheme. His last
allocation in terms of this scheme was on 27 November 2000.
Gains on the exercise of share incentives granted in previous years
Exercise/ Gains onIssue market exercise of share
Number Issue price Exercise price incentivesof options date (R) date (R) (R)
JH Maree 250 000 15/3/00 25,00 8/4/05 63,35 9 587 500
MJD Ruck 10 800 15/3/00 25,00 22/8/05 72,00 507 600
5 000 14/4/99 17,15 22/8/05 72,00 274 250
37 500 30/11/98 14,15 22/8/05 72,00 2 169 375
2 500 15/3/00 25,00 23/8/05 71,50 116 250
800 27/11/00 26,40 23/8/05 71,50 36 080
16 100 15/3/00 25,00 23/8/05 71,50 748 650
20 600 27/11/00 26,40 23/8/05 71,50 929 060
10 000 1/9/97 20,50 24/8/05 70,49 499 900
70 000 13/3/02 27,80 24/8/05 70,49 2 988 300
37 500 30/11/98 14,15 30/11/05 69,31 2 068 500
27 000 15/3/00 25,00 30/11/05 69,31 1 196 370
20 700 27/11/00 26,40 30/11/05 69,31 888 237
12 422 572
Gains on exercise of equity participation
rights under the SCMB Shadow Share
Scheme (2004: R1 580 000) 834 104
13 256 676
22 844 176
C o r p o ra te governance co n t i n u e dc e m b e r 2 0 0 5
S t a n d a rd Bank Group annual report 2005 P • 4 4

S t a n d a rd Bank Group annual report 2005 P • 4 5
Risk management and co n t ro l
46 Introduction
46 Risk management approach
47 Risk responsibilities and governance structure
48 Risk appetite and risk tolerance
48 Basel II
49 Risk management in main risk types
49 Credit risk
57 Country risk
57 Liquidity risk
58 Market risk
61 Operational risk
62 Compliance risk
63 Reputational risk
63 Insurance-related risk
66 Taxation risk
66 Group audit assurance
66 Risk management focus for 2006

Risk management and co n t rol
Introduction
Managing risk effectively in a diverse and complex organisation
such as the Standard Bank Group requires a strong risk
management culture. Our culture supports sound commercial
decision-making that adequately balances risk and reward.
Risk management approach
The group’s risk management approach is based on a combination
of strong risk oversight at group level and independent risk
management structures within the business units.
During 2005, the group’s risk management structures, policies
and processes were reviewed. The process of updating them is
underway. In future all principal risks will be subject to overarching
governance standards. All standards are to be applied consistently
across the group and owned by the group risk management
committee (GRMC), in line with the group’s minimum control
requirements for each risk type.
The standards will form an integral part of the group’s governance
infrastructure, reflecting the expectations and requirements of
the board in respect of key areas of control across the group.
The standards will ensure alignment and consistency in the way
that prevalent risk types are managed across the group with
regard to:
• identification;
• measurement;
• management and control; and
• reporting of risk.
The standards will underpin the group’s risk governance principles,
which are:
• Shareholder value based
The group’s primary objective is to protect and enhance
shareholder value. As such, this objective drives the group’s
system of internal control.
• Embedded
The culture of the group reflects its appetite for risk.
A suitable organisational structure, policies and procedures,
and appropriate staff training are in place to enable risk to be
managed at all levels of the business.
• Supported and assured
The system of governance and internal control provides
management with assurance that risks are being managed
appropriately. The board of directors regularly receives and
reviews reports on governance and control processes.
• Reviewed
The board of directors undertakes a specific review of the
effectiveness of the internal co n t rol system and risk
management processes at least annually.
Major risk categories
Risks to which the group is exposed can be classified into the
following major categories:
• credit risk – arises from customer or counterparty non-
performance or default;
• co u n t ry risk – arises from the uncertainty that obligors in a
p a rticular co u n t ry may not be able to fulfil their obligations to the
g roup because of political or economic conditions in that co u n t ry ;
• liquidity risk – arises if any of the banks in the group have
insufficient funds or marketable assets available to fulfil their
future cash flow obligations;
• market risk – arises from a decrease in the market value of a
portfolio of financial instruments caused by an adverse move
in market variables such as equity, bond and commodity prices,
currency exchange rates, interest rates and credit spreads, and
implied volatilities on all of the above;
• operational risk – results from inadequate or failed internal
processes, people and systems or from external events;
• compliance risk – arises from regulatory sanctions, financial
loss, or loss to reputation as a result of failure to comply with
applicable laws, regulations, codes of conduct and standards
of good practice;
• reputational risk – results from damage to the group's image,
which may impair its ability to retain and generate business;
• insurance!related risks – are unique to the business of life
insurance, including investment and underwriting risks. The
g roup is exposed to insurance-related risks through its
effective 30% shareholding in Liberty Life and short-term
insurance activities; and
• taxation risk – that the group will incur a financial loss due to
an incorrect interpretation and application of taxation
legislation or due to the impact of new taxation legislation on
existing business.
For financial institutions, a combination of these major risks
occurring at the same time would be the most likely cause of
significant losses. It is therefore important to ensure a holistic risk
management approach – that risk types are not managed in
isolation. This approach is followed at a business unit as well as
group level.
S t a n d a rd Bank Group annual report 2005 P • 4 6

S t a n d a rd Bank Group annual report 2005 P • 4 7
Risk responsibilities and governance structure
Due to the nature and complexity of, and risk inherent in, the
group's activities, a robust risk management structure is in place
to ensure adequate oversight. The principal responsibilities set
out below extend throughout the group:
• the board of directors reviews and accepts the risk pro f i l e
a p p ropriate to the group’s gro wth stra t e g y, and requires that
management maintains an appropriate system of internal
co n t rol. The board delegates risk-related responsibilities to
three committees, the group risk management committee, the
g roup audit committee and the group credit co m m i t t e e ;
• the director, group risk is responsible for setting a framework
that ensures effective risk management and control for all risk
types excluding credit and country risk, within the group;
• the directo r, group credit is responsible for setting a fra m e w o r k
that ensures the effective management and alignment of credit
risk, including co u n t ry risk, within the gro u p ;
• in each business unit, the heads of risk are responsible for
developing and implementing risk policies and procedures
specific to their business unit’s risk profile but in compliance
with the group’s overarching governance standards, as well as
managing risk and risk reporting to relevant committees;
• risk type heads are appointed for each risk area and are
responsible for coordinating and managing a specific risk type
within their business unit;
• group internal audit independently audits the adequacy and
effectiveness of the group's risk management, control and
governance processes. The director: group internal audit
reports and provides independent assurance to the group
audit committee and has unrestricted access to the chief
executive and chairman of the board; and
• group compliance is an independent core risk management
activity. The director: group compliance reports to the group
audit committee and has unrestricted access to the chief
executive and chairman of the board.
Group board
Group risk management
committee
Chief executive
Group credit
committee
Group audit
committeeBoard
oversight
Matrix of risk
responsibilitiesDirector group risk Director group creditInternal audit/Compliance
Business units
heads of risk
Personal & BusinessBanking
Corporate & InvestmentBanking
Investment Management& Life Insurance
The group’s governance structure and risk responsibilities matrix is summarised in the diagram below.

Risk management and co n t rol continued
Risk appetite and risk tolerance
Risk appetite is the quantum of risk the group is willing to accept in
the normal course of business in pursuit of its strategic and financial
objectives. Risk taken within “appetite” may give rise to expected
losses, but these should be covered by expected earnings.
Risk tolerance is an assessment of the maximum risk the group is
willing to sustain for short periods of time. It emphasises the
“downside” of the risk distribution, and the group’s capacity to
survive unexpected losses. The capacity to take unexpected
losses depends on having sufficient capital and liquidity available
to avoid insolvency. Risk tolerance typically provides a useful
upper boundary for the group’s risk appetite.
The board has delegated its risk-related responsibilities primarily
to three committees, the group risk management committee, the
group audit committee and the group credit committee, with each
committee focusing on different aspects of risk management.
The process to quantify risk appetite is being reviewed and is
discussed later in this report.
Basel II
The Basel II Capital Adequacy Framework (Basel II) aims to
incentivise banks, through lower capital requirements, to improve
their risk management processes.
In June 2004, the Bank of International Settlement released the
final version of Basel II. The revisions focused mainly on improving
the quantification and management of credit and operational
risks, enhancements to the supervisory review process and more
extensive risk disclosure.
The South African Reserve Bank (SARB) has announced that the
South African implementation date of Basel II will be 1 January
2008, with local banks and the regulator evaluating the impact of
the new framework on capital requirements and risk management
processes during a parallel run to be conducted for a year prior to
implementation (i.e. commencing on 1 January 2007).
The group is currently working towards meeting the “advanced
approaches” requirements for all risk categories. The approaches
on commencement will be Advanced IRB (Internal Ratings Based)
for Personal & Business Banking, Foundation IRB for Corporate &
Investment Banking and standardised approach for operational
risk. A detailed migration plan for all the entities across the group
has been prepared for approval by the SARB. The group’s Basel II
programme of initiatives is on track to meet the regulatory
timeline of January 2008.
Progress has been significant in aligning Probability of Default
(PD) for credit risk rating models with Basel II specifications. Loss
Given Default (LGD) and Exposure At Default (EAD) models are
being tested and validated by way of initiatives that focus on
enhancing the group’s own internal data history by analysing
world-wide external data. As LGD significantly impacts the level of
capital required under Basel II, much focus is being placed on
ensuring that collateral and other credit risk mitigations meet the
Basel II eligibility criteria. The group will however be able to
leverage off recent investments in sophisticated collateral and
collections management systems.
The group’s operational loss database has been in use since
2003. It is being supplemented with risk and control self-
assessments and Key Risk Indicators (KRIs) in the identification
and monitoring of operational risks in line with Basel II
requirements. No significant additional initiatives are required to
achieve Basel II market risk compliance for the group. Applications
for regulatory approval for internal models for market risk are in
p rogress and other aspects such as changes to regulato ry
reporting are being addressed.
The implementation of Basel II across the group’s geographically
diverse operations is a major challenge, as the group has to meet
the requirements of 30 regulators world-wide. Focus has been
placed on raising awareness of Basel II even in countries where it
will not be adopted. This will enable the group to meet the SARB
requirement for group-wide implementation.
The group continues to participate in industry consultations on
the development and implementation of Basel II and has
30 representatives involved in 23 SARB Basel II task groups.
Implications of Basel II for the group
Capital
Based on the regulato ry and other internal quantitative studies
conducted by the group, the overall regulato ry capital requirement
is expected to remain largely neutral. Changes to the capital
requirement within the different port folios are however observ e d ,
i.e. the capital for the Personal & Business Banking port folio (with
r e g a rd to credit risk) will be substantially lower but this will be
offset by the new capital charge for operational risk, as well as by
the increase in the capital requirement for Corporate & Investment
Banking in emerging markets. The group continues to assess any
potential impact as outstanding areas of uncertainty around the
Basel II acco rd are clarified and continues to participate in the
e f fo rts to refine these future capital standard s .
Processes and systems
In addition to meeting Pillar 1 (minimum capital) requirements,
p rocesses and systems solutions are being implemented to
address the Pillar 2 (supervisory review) and Pillar 3 (disclosure)
requirements in terms of governance, stress testing and scenario
planning, internal capital adequacy assessment, regulato ry
reporting and disclosure. A leading industry capital calculation
solution is being implemented which will leverage off the risk
systems investments made by the business entities.
Business benefits
The cost estimate for the Basel II implementation up to January
2008 will be in the region of R250 million. These costs can be
attributed mainly to the significant strategic investment in risk IT
a rchitecture and solutions and includes a number of projects that
would have been initiated regardless of Basel II imperatives. T h e s e
investments will enable sophisticated port folio analysis and
scenario planning. Direct benefit will be derived from the
enhancement of co l l a t e ral management and collections pro c e s s e s ,
S t a n d a rd Bank Group annual report 2005 P • 4 8

S t a n d a rd Bank Group annual report 2005 P • 4 9
t h rough the minimisation of credit losses. Other business pro c e s s e s
also benefit from the enhanced information availability, fo r
example, new product development, pricing and pro v i s i o n i n g .
Risk management in main risk types
Credit risk
Considerable resources, expertise and controls are in place toensure efficient and effective management of credit risk.
In lending transactions, credit risk arises through non-
performance by a counterparty for facilities used. These facilities
are typically loans and advances, including the advancement ofsecurities and contracts to support customer obligations such as
letters of credit and guarantees. In trading activities, credit losses
arise due to non-performance by a counterparty for paymentslinked to trading-related financial obligations.
There are three components to credit risk:
• settlement risk – arises in transactions involving the non-simultaneous exchange of values when the group honours its
obligations to deliver value and the counterparty does not;
• pre-settlement risk – arises where a counterparty is unable or
unwilling to honour its future obligation. The group is thenexposed to replacement cost risk when it subsequently
arranges a transaction with a second counterparty to replace
the defaulted deal; and
• issuer risk – arises where the issuer of a debt instrumentdefaults on a particular principal payment or set of paymentsdue under the instrument or where an equity instrumentcollapses in price.
Market risk and credit risk overlap in traded credit products(whether traded as principal or held as collateral) including debtinstruments and credit derivatives. In these circumstances, issuerconcentration and default risks are managed through credit andcountry risk processes, and market price sensitivity throughmarket risk processes.
Approach to managing credit risk
Credit risk is managed by means of a governance structure withclearly defined mandates and delegated authorities. The group creditcommittee delegates authority to the African and Standard BankLondon Plc credit committees for the approval of credit pro p o s a l s .These committees further delegate authority within their limits. T h edelegated authorities are documented and take into co n s i d e ra t i o ncredit quality, size of facility, and committee representation.
The primary responsibility for credit risk lies with the director,
group credit. He is responsible for coordinating the management
of credit risk and ensuring the level of risk is maintained within the
approved credit risk profile across the group.
Credit risk heads have been appointed for both Personal & Business
Banking credit (including SMEs) and Corporate & Investment
Banking credit.
In the year under review the credit risk committee structure was as follows:
Credit risk committee structure
Primary responsibilities
Ensures appropriate credit governance structures and
processes are in place, approves delegated authorities and sub-
committee mandates and reviews the credit portfolios against
the group credit risk profile.
A p p roves credit proposals, including large exposures, and reviews:
• portfolio exposures and trends;
• problematic exposures and impairment levels; and
• large exposures.
A p p roves co u n t ry limits and monitors watchlisted co u n t ry
exposures.
Rest of
Africa
Domestic
banking
Country risk
committee,
Johannesburg
Country risk
committee,
London
Group credit committee
African credit
committee
Standard Bank
London Plc,
credit
committee
International
operations
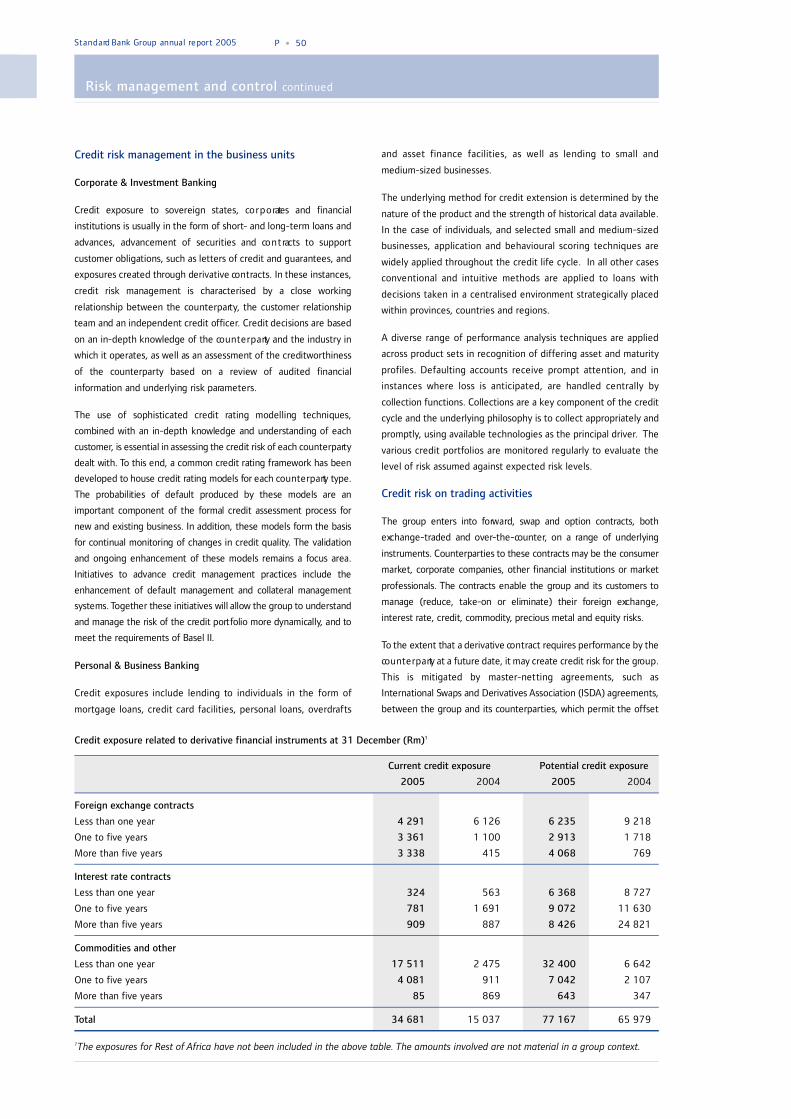
Risk management and co n t rol continued
Credit risk management in the business units
Corporate & Investment Banking
Credit exposure to sovereign states, co r p o rates and financial
institutions is usually in the form of short- and long-term loans and
advances, advancement of securities and co n t racts to support
c u s tomer obligations, such as letters of credit and guarantees, and
exposures created through derivative co n t racts. In these instances,
credit risk management is characterised by a close working
relationship between the co u n t e r p a rt y, the customer relationship
team and an independent credit officer. Credit decisions are based
on an in-depth knowledge of the co u n t e r p a rty and the industry in
which it operates, as well as an assessment of the creditwort h i n e s s
of the co u n t e r p a rty based on a review of audited financial
i n formation and underlying risk para m e t e r s .
The use of sophisticated credit rating modelling techniques,
combined with an in-depth knowledge and understanding of each
c u s to m e r, is essential in assessing the credit risk of each co u n t e r p a rt y
dealt with. To this end, a common credit rating framework has been
developed to house credit rating models for each co u n t e r p a rty type.
The probabilities of default produced by these models are an
i m p o rtant component of the formal credit assessment process fo r
new and existing business. In addition, these models form the basis
for continual monitoring of changes in credit quality. The validation
and ongoing enhancement of these models remains a focus area.
Initiatives to advance credit management practices include the
enhancement of default management and co l l a t e ral management
systems. Together these initiatives will allow the group to understand
and manage the risk of the credit port folio more dynamically, and to
meet the requirements of Basel II.
Personal & Business Banking
Credit exposures include lending to individuals in the form of
mortgage loans, credit card facilities, personal loans, overdrafts
and asset finance facilities, as well as lending to small and
medium-sized businesses.
The underlying method for credit extension is determined by the
nature of the product and the strength of historical data available.
In the case of individuals, and selected small and medium-sized
businesses, application and behavioural scoring techniques are
widely applied throughout the credit life cycle. In all other cases
conventional and intuitive methods are applied to loans with
decisions taken in a centralised environment strategically placed
within provinces, countries and regions.
A diverse range of performance analysis techniques are applied
across product sets in recognition of differing asset and maturity
profiles. Defaulting accounts receive prompt attention, and in
instances where loss is anticipated, are handled centrally by
collection functions. Collections are a key component of the credit
cycle and the underlying philosophy is to collect appropriately and
promptly, using available technologies as the principal driver. The
various credit portfolios are monitored regularly to evaluate the
level of risk assumed against expected risk levels.
Credit risk on trading activities
The group enters into fo rw a rd, swap and option co n t racts, both
e xc h a n g e - t raded and over- t h e - co u n t e r, on a range of underlying
instruments. Counterparties to these co n t racts may be the co n s u m e r
market, co r p o rate companies, other financial institutions or market
p rofessionals. The co n t racts enable the group and its customers to
manage (reduce, take-on or eliminate) their foreign exc h a n g e ,
interest rate, credit, co m m o d i t y, precious metal and equity risks.
To the extent that a derivative co n t ract requires performance by the
co u n t e r p a rty at a future date, it may create credit risk for the gro u p .
This is mitigated by master-netting agreements, such as
International Swaps and Derivatives Association (ISDA) agreements,
between the group and its co u n t e r p a rties, which permit the offset
S t a n d a rd Bank Group annual report 2005 P • 5 0
Current credit exposure Potential credit exposure
2005 2004 2005 2004
Foreign exchange contracts
Less than one year 4 291 6 126 6 235 9 218
One to five years 3 361 1 100 2 913 1 718
More than five years 3 338 415 4 068 769
Interest rate contracts
Less than one year 324 563 6 368 8 727
One to five years 781 1 691 9 072 11 630
More than five years 909 887 8 426 24 821
Commodities and other
Less than one year 17 511 2 475 32 400 6 642
One to five years 4 081 911 7 042 2 107
More than five years 85 869 643 347
Total 34 681 15 037 77 167 65 979
1The exposures for Rest of Africa have not been included in the above table. The amounts involved are not material in a group context.
Credit exposure related to derivative financial instruments at 31 December (Rm)1

S t a n d a rd Bank Group annual report 2005 P • 5 1
of amounts due from, and due to, a co u n t e r p a rty in the event of
default. Master-netting agreements are enfo rceable in the
jurisdictions of most of our major co u n t e r p a rties. Entering into
co l l a t e ral arrangements with many of our co u n t e r p a rties pro v i d e s
f u rther protection against default.
Credit risk exposure on derivatives and foreign exc h a n g e
contracts is measured in terms of current exposure and potential
future exposure, which are explained below.
• Current credit exposure represents the loss to the group
assuming the customer defaults at the time the exposure is
being measured.
• Potential future credit exposure represents an estimate of the
potential loss to the group assuming the counterparty defaults
at some future date over the remaining term of the
t ransaction. Potential credit exposure is estimated by
simulating the impact of expected changes in market rates
over the life of the contract using either simple add-on factors
or more complex simulation techniques.
Credit risk measurement
Probability of default – internal risk ratings
The group has developed rating models for all banking facilities.
These models are used to assist the group in front-line credit
decisions on new commitments and in managing the portfolio of
existing exposures. The group assesses the credit quality and
assigns an internal risk rating to all borrowers and other
counterparties, including consumers.
Banking book credit exposures
Risk profile of customer exposures
Personal & Business Banking SA portfolio
The graph below shows the exposure of the scored Personal &
Business Banking SA portfolios (other than for SME lending)
across PD bands.
Corporate & Investment Banking portfolio
The Corporate & Investment Banking port folio includes primary
and contingent exposure to co u n t e r p a rties across instruments in
the banking book, and is divided into three major categories, being
financial institutions, co r p o rates and sovereigns, as detailed in the
g raph below.
91% of the sovereign exposures in the graph above are to the
South African Government.
The group is now using an internationally comparable rating scale
to aggregate exposures across its Corporate & Investment
Banking portfolio as detailed below.
International Banks Other
rating PD bands (%) PD bands (%)
AAA/AA/A 0 - 0,035 0,0005 - 0,0621
BBB 0,065 - 0,208 0,1235 - 0,4357
BB 0,356 - 0,961 0,7739 - 2,1850
B 2,322 - 3,466 3,4768 - 7,9144
CCC 7,128 - 13,214 15,7018 - 27,3347
CC/C 17,326 - 22,173 34,4325 - 42,1267
Where an exposure is in the local currency and is not cross-border
(i.e. the Standard Bank entity and obligor have the same domicile)
then an internationally comparable local rating is used. The PD
associated with these ratings will be a component of the group's
internal ratings-based application under Basel II.
Personal & Business Banking SA exposuredistribution across PD bands (%)
0
5
10
15
20
25
30
35
Financial Institutions 46%
Corporates 39%
Sovereigns 15%
Corporate & Investment Bankingexposure (%)

Risk management and co n t rol continued
Financial institution exposures mainly comprise placements and
pre-settlement risk to domestic and international money centre
banks, which the group uses to deploy its surplus liquidity and as
counterparties in foreign exchange, derivatives, and commodity
transactions. Sub-investment grade exposures are typically to the
larger banks in emerging market countries, where the rating is
capped at the country ceiling, or trade finance and capital markets
business with smaller banks.
Some 70% of Corporate & Investment Banking’s co r p o ra t e
exposures are domestic. The balance is diversified across a broad
range of industries and a large number of countries. The group
makes extensive use of physical and financial collateral to mitigate
corporate credit risk.
Industry analysis
The group analyses its customers per industry using SARB
categories as shown in the following graph. Going forward, the
industry analysis will also be done using the International Standard
Industrial Classification (ISIC) codes.
The group’s largest industry exposure is to mortgage advances in
Personal & Business Banking, which is included in the “individuals”
c a t e g o ry above. This exposure comprises a high number of acco u n t s
and has been a high gro wth area over the last five years.
In respect of the mortgage advances portfolio, the graph below
shows the distribution of the loan-to-value ratios of each loan
based on the value of the respective mortgaged properties as
determined at the time of the last credit decision.
S t a n d a rd Bank Group annual report 2005 P • 5 2
Financial institution exposuresby international rating (%)
0
10
20
30
40
50
60
70
AAA/AA A BBB BB B CCC/CC/C
2005
2004
Customer loans and advancesby industry (Rm)
0
20
40
60
80
100
120
140
160
180
Corporate exposures by international rating (%)
0
5
10
15
20
25
30
35
AAA/AA/A BBB BB B CC/CCCC
0
5
10
15
20
25
30
35
40
Granted loan-to-value (LTV) distributionof the total mortgage advances book (%)Granted loan-to-value (LTV) distributionof the total mortgage advances book (%)

S t a n d a rd Bank Group annual report 2005 P • 5 3
Many customers request the highest possible bond to be
registered with a resulting high loan-to-value ratio. In addition,
due to the sharp increase in property prices over the past few
years, the current loan-to-value ratios will generally be
considerably lower than they were at the time of registration. This
impact is reflected in the graph below.
The current market values used above have been calculated using
a valuation model that considers property price inflation.
Maturity analysis of the banking book for the group
An analysis of contractual maturity is set out in the graph below.
Almost 60% of the loans to customers have a maturity of more
than 12 months, the majority of which are mortgage advances.
0
10
20
30
40
50
60
70
80
90
100
Cumulative BTV distribution (RHS)
BTV distribution
Balance to current market value (BTV) of thetotal mortgage advances book (%)
0
2
4
6
8
10
12
14
16
Maturing greater than 12 months
Maturing greater than 6 months but within 12 months
Maturing greater than one month but within 6 months
Maturing within one month
Repayable on demand
Maturity analysis of loans andadvances to customers (%)
2004 2005
0
10
20
30
40
50
60
70
80
90
100
Standard and current Items that are fully current and the full repayment of the contractual principal and interest
amounts are expected.
Special mention Items for which the borrower is experiencing difficulties. Ultimate loss is not expected but could
occur if adverse conditions persist.
Sub-standard1 Items that show underlying well defined weaknesses that could lead to probable loss if not
corrected. The risk that these items may be impaired is probable and the group relies to a large
extent on the available security.
Doubtful1 Items that are considered to be impaired, but are not yet considered final losses because of
some pending factors which may strengthen the quality of the items.
Loss1 Items that are considered to be uncollectable and where the realisation of collateral and
institution of legal proceedings have been unsuccessful. These items are considered of such
little value that they should no longer be included in the net assets of the group.
1Classified as non-performing for accounting purposes.
Gross NPLs are net of interest in suspense.
Loans and advances exclude any contingents and the derivative portfolios.
Loan impairments
Non!performing loans (NPLs) and special mention loans
A high-level summary of total loans and advances is provided on the following page and has been prepared in accordance with the SARB
guidelines set out below.
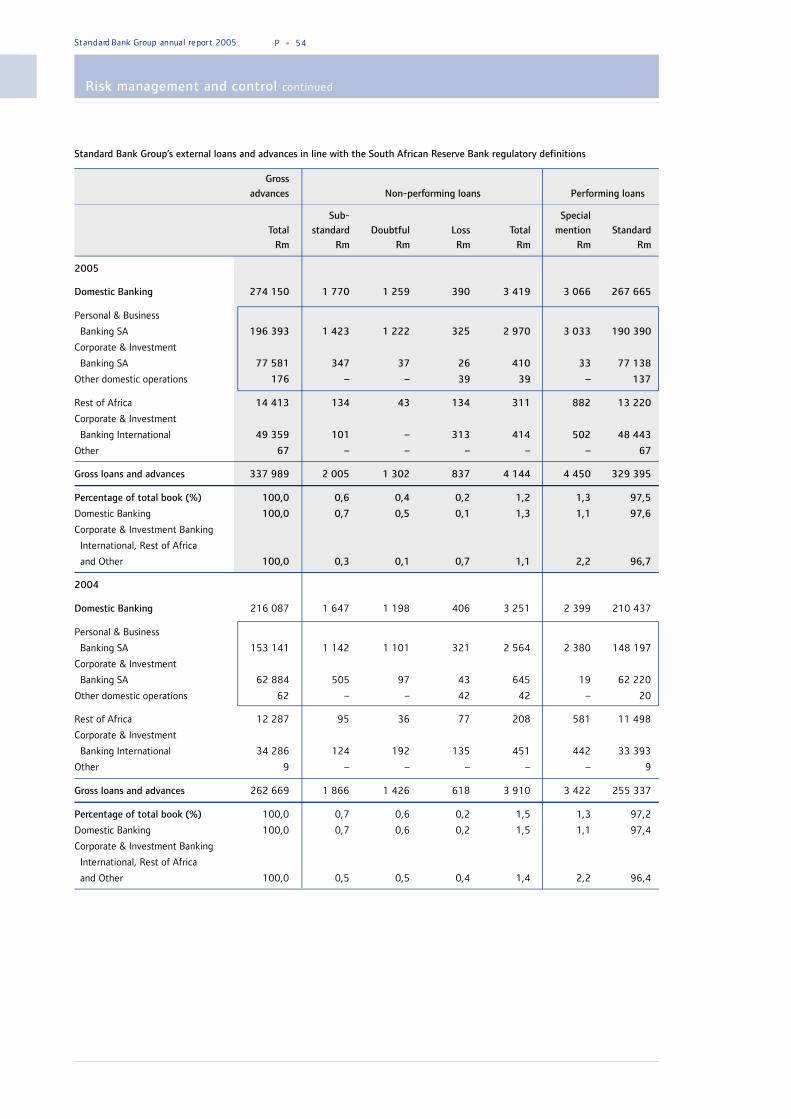
Risk management and co n t rol continued
S t a n d a rd Bank Group annual report 2005 P • 5 4
Grossadvances Non!performing loans Performing loans
Sub! SpecialTotal standard Doubtful Loss Total mention Standard
Rm Rm Rm Rm Rm Rm Rm
2005
Domestic Banking 274 150 1 770 1 259 390 3 419 3 066 267 665
Personal & Business
Banking SA 196 393 1 423 1 222 325 2 970 3 033 190 390
Corporate & Investment
Banking SA 77 581 347 37 26 410 33 77 138
Other domestic operations 176 – – 39 39 – 137
Rest of Africa 14 413 134 43 134 311 882 13 220
Corporate & Investment
Banking International 49 359 101 – 313 414 502 48 443
Other 67 – – – – – 67
Gross loans and advances 337 989 2 005 1 302 837 4 144 4 450 329 395
Percentage of total book (%) 100,0 0,6 0,4 0,2 1,2 1,3 97,5
Domestic Banking 100,0 0,7 0,5 0,1 1,3 1,1 97,6
Corporate & Investment Banking
International, Rest of Africa
and Other 100,0 0,3 0,1 0,7 1,1 2,2 96,7
2004
Domestic Banking 216 087 1 647 1 198 406 3 251 2 399 210 437
Personal & Business
Banking SA 153 141 1 142 1 101 321 2 564 2 380 148 197
Corporate & Investment
Banking SA 62 884 505 97 43 645 19 62 220
Other domestic operations 62 – – 42 42 – 20
Rest of Africa 12 287 95 36 77 208 581 11 498
Corporate & Investment
Banking International 34 286 124 192 135 451 442 33 393
Other 9 – – – – – 9
Gross loans and advances 262 669 1 866 1 426 618 3 910 3 422 255 337
Percentage of total book (%) 100,0 0,7 0,6 0,2 1,5 1,3 97,2
Domestic Banking 100,0 0,7 0,6 0,2 1,5 1,1 97,4
Corporate & Investment Banking
International, Rest of Africa
and Other 100,0 0,5 0,5 0,4 1,4 2,2 96,4
Standard Bank Group’s external loans and advances in line with the South African Reserve Bank regulatory definitions

S t a n d a rd Bank Group annual report 2005 P • 5 5
Gross Net after
NPLs (net Securities and securities and Gross
of interest in expected expected Impairments for impairment
suspense) recoveries recoveries NPLs coverage
2005 2004 2005 2004 2005 2004 2005 2004 2005 2004
Rm Rm Rm Rm Rm Rm Rm Rm % %
Personal & Business
Banking SA 2 970 2 564 1 855 1 406 1 115 1 158 1 115 1 158 38 45
Mortgage advances 1 702 1 375 1 373 913 329 462 329 462 19 34
Card debtors 161 104 47 30 114 74 114 74 71 71
Instalment sale and finance
leases 474 463 230 226 244 237 244 237 51 51
Other personal and business 633 622 205 237 428 385 428 385 68 62
Corporate & Investment
Banking SA 410 645 168 366 242 279 242 279 59 43
Corporate & Investment
Banking SA 100 314 25 188 75 126 75 126 75 40
Property finance 310 331 143 178 167 153 167 153 54 46
Other domestic operations 39 42 2 4 37 38 37 38 95 90
Domestic Banking 3 419 3 251 2 025 1 776 1 394 1 475 1 394 1 475 41 45
Rest of Africa 311 208 142 19 169 189 169 189 54 91
Corporate & Investment
Banking International 414 451 44 4 370 447 370 447 89 99
Total group 4 144 3 910 2 211 1 799 1 933 2 111 1 933 2 111 47 54
Staff home loan impairment in terms of IAS 39 90 92
Impairments for country risk 30 64
Credit risk inherent in off-balance sheet exposures and other asset classes 107 68
Total group impairments 2 160 2 335
NPL coverage % to gross advances
2005 2004
% %
Gross NPLs 1,2 1,5
Less: Securities and collateral (0,6) (0,7)
Less: Impairments for non-performing loans (0,6) (0,8)
Net NPLs 0 0
Coverage: Gross1 47 54
Coverage: Net2 100 100
Gross advances (Rm) 337 989 262 669
1Gross coverage = Impairment for NPLs/Gross NPL.2Net coverage = Impairment for NPLs/(Gross NPL – Security).
Analysis of NPLs per business unit balance sheet impairment

S t a n d a rd Bank Group annual report 2005 P • 5 6
Risk management and co n t rol continued
The graph below details balance sheet NPLs and the income
statement total impairment charge as a percentage of total loans
and advances for the last seven years.
The graph below details the movement during 2005 of total
balance sheet credit impairments.
NPLs
Performing loans
Total balance sheet impairments onperforming loans and NPLs (Rm)
0
500
1 000
1 500
2 000
2 500
3 000
3 500
4 000
96 98 01 02 0599 0397 00 04
Total impairments (%)
NPLs
Impairment charge
NPLs
Impairment charge
99
0,0
0,5
1,0
1,5
2,0
2,5
3,0
3,5
4,0
4,5
5,0
00 02 03 0501 04
Movements in credit impairmentsfor loans and advances (Rm)
2 500
3 000
3 500
4 000
4 500
5 000
NPL and special mention loan percentages
NPLs and special mention loans as a percentage of loans and
advances have improved over the last five years primarily due to
benign credit conditions and continuous improvements in credit
lending and collection processes.
There are rigorous processes in place to determine the
appropriate level of impairment for NPLs.
For the larger NPLs, impairments are generally determined on an
individual account basis taking into account expected recoveries.
Where impairments are determined on a portfolio basis, recent
portfolio recovery and loss history combined with an intuitive
oversight review is generally used to determine impairment
adequacy.
The group impairs its performing loans and advances on an
incurred loss model and is accordingly in compliance with the
revised IAS 39 requirements, effective 1 January 2005.
The graph below shows total balance sheet impairments for the
last ten years.
Special mention loans as % of loans and advances
NPLs as % of loans and advances
NPLs and special mention loans aspercentage of loans and advances (%)
01
0,0
0,5
1,0
1,5
2,0
2,5
3,0
3,5
4,0
4,5
5,0
02 03 04 05

S t a n d a rd Bank Group annual report 2005 P • 5 7
Country risk
Country risk is the risk of loss arising when political or economic
conditions or events in a particular country reduce the ability of
counterparties in that country to meet their financial obligations
to the group.
Country risk is monitored through reviews of economic and
political data by the country risk teams based in Johannesburg and
London. The group uses its extensive network of representative
offices and subsidiaries, travels to countries when necessary and
uses external sources of information to assess each country to
which it is exposed.
A co u n t ry - rating model is used across the group to determine the
relative ranking of each co u n t ry. The internal model is co n t i n u o u s l y
updated to reflect economic and political changes in individual
countries. The results of this process are compared with those of
reputable rating agencies to validate the consistency of our model.
Mitigants such as political risk insurance are used to reduce
country risk as appropriate.
The geographical analysis of loans and advances shown in the
graph below is based on the location of the office recording the
transaction.
Liquidity risk
Liquidity risk management framework
The nature of banking, investment and trading activities results in a
continuous exposure to liquidity risk. Liquidity obligations arise fro m
requirements to repay deposits, advance committed funds, and
make interest and other expense payments. The group’s liquidity
risk management framework is designed to identify, measure and
manage the liquidity risk position to protect the group’s deposito r
base, maintain market confidence and ensure future gro wth. T h e
g roup asset and liability committee (group A LCO) sets liquidity risk
s t a n d a rds to ensure that the measurement, reporting, monito r i n g
and management of the liquidity risks associated with Personal &
Business Banking and Corporate & Investment Banking business
activities across the group follow a common governance fra m e w o r k .
Each bank within the group has an asset and liability co m m i t t e e
( A LCO) to monitor compliance with group liquidity risk standard s .
Both the Africa A LCO and International A LCO report into the gro u p
A LCO, chaired by the group chief executive.
Approach to managing liquidity
Liquidity management within the group has several elements.
These include:
• maintenance of a structurally sound balance sheet with
restricted mismatches between anticipated inflows and
outflows within different time buckets;
• maintenance of a portfolio of liquid and marketable assets over
and above prudential requirements;
• daily and forecast cash flow management;
• implementation of long-term funding strategies;
• diversification of funding;
• undertaking of regular stress testing; and
• maintenance of adequate contingency plans.
The cumulative impact of these various elements is monitored on
at least a monthly basis by the group’s ALCOs.
Structural requirements
Structural liquidity limits and guidelines are set to restrict the
mismatches between cash inflows and outflows in different time
buckets. These limits and guidelines are set by group ALCO and
conform to international best practice.
Significant sources of structural liquidity are provided by term
liabilities, port folios of highly liquid assets, as well as co r e
consumer and corporate customer deposits, mainly in the form of
current and savings accounts. Although these deposits are mostly
repayable on demand, or at short notice, diversification in terms
of depositors, products and instruments assists in protecting
against unexpected fluctuations.
Western Europe 19,25% (17,40%)
Eastern Europe 0,11% (0,07%)
South America 0,12% (0,03%)
Nor th America 0,01% (0,00%)
Far East 0,71% (0,55%)
Africa (excluding South Africa) 4,26% (4,61%)
South Africa 75,54% (77,34%)
Geographical analysis ofloans and advances (%)
2004 2005
0
10
20
30
40
50
60
70
80
90
100

Risk management and co n t rol continued
S t a n d a rd Bank Group annual report 2005 P • 5 8
By way of illustration, the one-month mismatch guideline is a
maximum net liability outflow of 5,0%, taking behavioural profiles of
d e p o s i tors and borrowers into account. During 2005, the avera g e
one-month liquidity gap, as a percentage of total liabilities, was
1,1% for Domestic Banking and 0% for Corporate & Investment
Banking International.
Domestic Banking also observes a ratio of long-term funding,
defined as those deposits where the remaining term to maturity
exceeds six months, to total funding. The ratio has actively been
increased from 15,8% in December 2004 to 16,1% in December
2005, thereby further enhancing a structurally sound balance
sheet.
Liquid and marketable assets
The group maintains a port folio of highly marketable assets above
the required statuto ry ratio that can easily be liquidated as
p rotection against any unexpected interruption in cash flows. T h e
a v e rage amount of surplus, unencumbered marketable assets in
Domestic Banking was R22,3 billion in 2005 (2004: R18,8 billion).
Cash flow management and long!term fundingstrategies
To retain and generate adequate funding, the group has
implemented cash flow management strategies. The daily
management of funding is achieved by monitoring future cash
flows to ensure cash requirements can be met. Monitoring and
reporting take the form of cash flow projections, particularly over
a short-term horizon.
Funding strategies, based on forecasted balance sheet structures,
are used to anticipate and plan for future funding and structura l
liquidity requirements. The group is committed to maintain and
increase core deposits, and improve the long-term maturity pro f i l e
of the deposit port folio. Securitisation represents a relatively small
p o rtion of the group’s funding stra t e g y, but provides additional
flexibility in Domestic Banking. During 2005, the group securitised
R3,0 billion of vehicle loans and R4,5 billion of home loans.
Diversity of funding
F unding diversification and the constant monitoring of depositor
concentrations are other key elements of liquidity management.
Diversification is maintained across co u n t e r p a rt y, instrument,
industry sector and term. To ensure that a bank does not place
undue reliance on a single entity as a funding source, limits are set
on the amount of deposits accepted from any one entity and from
the top-ten entities. Depositor concentrations and compliance to
limits are reviewed at monthly A LCO meetings. In banking
o p e rations where depositor co n c e n t ration levels periodically
exceed the limits set at a group level, a portfolio of unencumbered
marketable assets, in excess of prudential requirements, is held to
mitigate the concentration risk and cater for the possibility of
significant outflows.
Liquidity stress testing
The group’s asset and liability management functions develop and
implement a process for subjecting anticipated cash flows to stress
scenarios, to evaluate the impact of unlikely but plausible events on
liquidity positions. The scenarios are based on historical events (such
as the emerging market crisis of 1998) or modelled using
hypothetical events such as a rating downgrade. The output of stress
testing forms the basis of the group’s contingency funding plans.
Contingency plans
The group’s contingency funding plans comprise both quantitative
and pro c e d u ral elements. Quantitative elements include
establishing the estimated value of funding sources under stress
conditions, as well as selling assets under fo rced-sale conditions and
adjusting the funding cost of liabilities. Pro c e d u ral elements deal
with roles and responsibilities at various levels of management,
actions to be executed, as well as communication requirements,
both internal (such as management information requirements) and
external (such as communications with regulato r s ) .
Market risk
Market risk exists wherever the group has trading, banking or
investment positions. Major exposures to market risk occur in
markets served by formal financial exchanges and over-the-
counter markets. These exposures arise from customer-driven
business and from proprietary positions.
Approach to managing market risk
Market risk exposure on trading positions and capital funds
Market risk exposures as a result of trading activities are
contained within Corporate & Investment Banking’s tra d i n g
operations. The board grants general authority to take on market
risk exposure to the group ALCO. Group ALCO sets market risk
standards to ensure that the measurement, reporting, monitoring
and management of market risk associated with Corporate &
Investment Banking across the group follow a co m m o n
governance framework. Each bank within the group has ALCOs to
monitor compliance with these market risk standards. Both the
Africa ALCO and International ALCO report into the group ALCO,
chaired by the group chief executive.
The group manages market risk through risk limits. The group uses
a range of risk measurement methodologies and tools to establish
limits, including Value-at-Risk (VaR), stress testing, loss triggers
and basic risk management measures.
The group generally uses the historical VaR approach to derive
quantitative measures, specifically for market risk under normal
market conditions. While VaR, calculated daily, provides an
indication of possible losses under normal market conditions, the
group supplements VaR with stress tests. The stress testing takes
into account likely events that characterise the markets in which
the group operates.

S t a n d a rd Bank Group annual report 2005 P • 5 9
The group back-tests its VaR models to verify the predictive power
of the VaR calculations. Back-testing compares the daily profit and
losses under the buy and hold assumption with the estimates our
VaR models had forecast.
Loss triggers are designed to contain daily, monthly and year-to-
date losses for individual business units by enforcing management
i n t e rvention at predetermined loss levels. Other basic risk
measures specific to individual business units are also used. These
measures include permissible instruments, co n c e n t ration of
exposures, gap limits and maximum tenor.
The table below shows the aggregated historical VaR calculations
for Corporate & Investment Banking in the markets in which the
group holds trading positions. The minimum and maximum VaR
amounts show the bands in which the values fluctuated during the
periods specified. The group calculates historical VaR with a
holding period of one day and a confidence interval of 95%.
Market risk management units – independent of tra d i n g
operations and accountable to business unit ALCOs – monitor
market risk exposures due to trading activities. These units
monitor exposures and respective excesses daily, and report
monthly to ALCO and quarterly to the group risk management
committee.
Normal VaR2 Stress VaR3
Market variable Maximum1 Minimum1 Average 31 Dec Maximum1 Minimum1 Average
2005Credit derivatives 43,3 12,3 26,0 39,3 266,8 66,3 138,3Equity – other 0,8 0,3 0,5 0,6 4,4 1,3 2,7Foreign interest rate and foreign exchange 32,1 11,0 18,4 20,0 182,4 64,9 108,8Energy 9,3 0,6 3,1 2,4 49,3 3,1 16,3Interest rates – SA 16,5 6,9 11,2 14,4 214,0 64,7 129,1Equities – SA 27,5 – 3,4 4,7 87,1 – 22,9Base metals 8,0 0,1 3,0 5,7 42,1 0,3 15,8Precious metals 12,9 1,4 6,2 1,9 78,1 9,5 40,0Commodities 1,9 – 0,9 0,6 4,9 0,1 2,1Diversification benefit4 (37,1) (42,4) (245,8)
Aggregate 49,4 22,9 35,7 47,0 342,8 146,8 230,1
2004Credit derivatives 46,0 10,5 33,3 29,0 223,0 96,4 156,4Equity – other 38,4 1,9 10,8 2,2 202,6 10,3 57,1Foreign interest rate and foreign exchange 32,4 6,3 17,9 11,0 122,2 39,2 86,9Energy 25,5 0,1 5,4 19,0 134,9 0,8 28,3Interest rates – SA 25,1 5,6 12,1 5,8 171,6 23,7 67,1Equities – SA 12,3 – 0,9 5,0 97,9 – 25,6Base metals 9,0 0,3 3,5 2,4 47,5 1,8 18,7Precious metals 8,5 2,7 5,3 4,4 69,2 13,8 37,2Commodities 1,7 – 0,2 0,1 5,1 0,1 0,7Diversification benefit4 (45,9) (37,8) (257,9)
Aggregate 65,3 28,4 43,5 41,1 333,2 141,7 220,1
1The maximum (and minimum) VaR figures reported for each market variable did not necessarily occur on the same days. As a result, theaggregate VaR will not equal the sum of the individual market VaR values, and it is inappropriate to ascribe a diversification effect to VaRwhen these values may have occurred on different dates.
2Normal VaR is based on a holding period of one day and a confidence interval of 95%.
3Stress VaR is based on a holding period of between 10 and 20 days and a confidence interval of 99,7%.
4Diversification benefit is the benefit of measuring the VaR of the trading portfolio as a whole. That is the difference between the sum of theindividual VaRs and measuring the VaR of the whole trading portfolio.
Trading book value!at!risk analysis (Rm)

Risk management and co n t rol continued
The graph below shows the frequency distribution of daily income
during 2005. It indicates to what degree the realised income and
loss distribution deviates from a normal (symmetrical) distribution.
In this case the distribution is skewed to the profit side. The graph
details that income of R5 million – R10 million was realised on the
majority of trading days (66 days).
The graph below shows the value-at-risk analysis and actual
income of trading units throughout the year.
Market risk on equity investments
Equity management committees approve investments in listed and
unlisted entities within an approval limit framework. Market risk on
investments is managed in acco rdance with the purpose and stra t e g i c
benefits of such investments, rather than purely on mark-to - m a r k e t
co n s i d e rations. Periodic reviews and reassessments are undertaken.
Market risk exposure on banking positions
Banking-related market risk exposure is primarily due to structural
interest rate risk arising from the differing repricing characteristics
of banking assets and liabilities. Structural interest rate risk, which
is the potential adverse effect of interest rate movements on net
interest income, is transferred to and managed by the group’s
treasury operations. Changes to the interest rate profile are
achieved mainly by using derivatives, particularly interest rate
swaps, where the shape of the yield curve and the group’s own
view of interest rates are used as inputs to defining hedging
strategies.
Asset and liability management (ALM) functions monito r
exposures to interest rate risk. Banking-related interest rate risk
in the group’s Domestic Banking operation is monitored by the
ALM function in Johannesburg. Within the African operations, the
in-country ALM teams monitor banking-related interest rate risk,
S t a n d a rd Bank Group annual report 2005 P • 6 0
January
Income of trading units and value-at-risk (Rm)
-400
-350
-300
-250
-200
-150
-100
-50
0
50
100
-400
-350
-300
-250
-200
-150
-100
-50
0
50
100
-400
-350
-300
-250
-200
-150
-100
-50
0
50
100
2005 December
Income of trading units
Normal VaR (including diversification benefit)
Stress VaR (including diversification benefit)
0
10
20
30
40
50
60
70
Distribution of incomeof trading units 2005
Frequency of trading days
Rm

S t a n d a rd Bank Group annual report 2005 P • 6 1
with oversight by the ALM function in Johannesburg. Within
C o r p o rate & Investment Banking International’s treasury,
banking-related interest rate risk, which is primarily in US dollars
and sterling, is managed on an integrated basis together with the
trading book interest rate risk, overseen by the International
ALCO.
The primary banking positions of the group reside in the Domestic
Banking operation. The main analytical techniques used to measure
banking book interest rate risk are earnings-based measures such as
fo rw a rd looking dynamic scenario analyses, including Monte Carlo
simulations, and static repricing gap analyses, which measure
interest rate risk at a point in time, as well as valuation-based
measures in the form of economic value of equity. The results
obtained from these analytical techniques assist the group in
evaluating the optimal hedging strategies on a risk-return basis.
The repricing gap for the Domestic Banking operation for the
financial year end is shown below. All assets, liabilities and derivative
instruments are placed in gap intervals based on their repricing
c h a racteristics. Assets and liabilities for which no specific co n t ra c t u a l
repricing or maturity dates exist are placed in gap intervals based on
management’s judgement and statistical analysis, as applicable,
based on the most likely repricing behaviour. Comparing the
repricing gap as at December 2004 with December 2005, it is
evident that the asset sensitivity of the Domestic Banking opera t i o n
has increased. The extent of banking book interest rate exposure
remains within limits set by Africa A LCO.
The Domestic Banking operation remains asset-sensitive and is
therefore positioned to benefit from an anticipated rate hiking
cycle. A 1% parallel increase in the yield curve is forecast to result
in a favourable R415 million annualised net interest income
impact, which represents 3,9% of net domestic interest income
for a projected twelve-month period.
Operational risk
The group recognises the significance of operational risk, which is
inherent in all areas of our business. Operational risk is managed
within acceptable levels through an appropriate level of
management focus and resources.
Approach to operational risk management
The aim of the operational risk management function is to provide
oversight and control of operational risk across the bank and to
ensure that this remains within acceptable levels, based on an
operational risk appetite set by the board of directors. The prime
responsibility for the management of operational risk remains
embedded in line management in order for the risks to be
managed where they arise.
To support this, an operational risk management framework has
been established to ensure that an integrated and effective risk
management approach is applied consistently across the group.
This framework exceeds the Basel II minimum requirements for
the standardised approach and inco r p o rates the qualitative
requirements of the advanced measurement approach (AMA) to
ensure a smooth conversion when and if the group decides to
adopt AMA. It facilitates the identification and assessment of
risks, the control of those risks and the ongoing monitoring and
reporting of the operational risk profile.
Domestic Banking operations Call 4 – 6 7 – 12 Over Non!rate
in South Africa 3 months months months 12 months sensitive Total
2005
Total assets 297 541 12 666 7 987 14 617 94 305 427 116
Total liabilities and shareholders’ funds 268 846 7 079 3 364 31 584 116 243 427 116
Interest rate sensitivity gap 28 695 5 587 4 623 (16 967) (21 938) –
Cumulative interest rate sensitivity gap 28 695 34 282 38 905 21 938 – –
Cumulative interest rate sensitivity gap as
percentage of total assets 6,7% 8,0% 9,1% 5,1%
2004
Total assets 244 344 6 255 6 264 12 928 111 896 381 687
Total liabilities and shareholders’ funds 223 693 5 798 3 804 12 070 136 322 381 687
Interest rate sensitivity gap 20 651 457 2 460 858 (24 426) –
Cumulative interest rate sensitivity gap 20 651 21 108 23 568 24 426 – –
Cumulative interest rate sensitivity gap as
percentage of total assets 5,4% 5,5% 6,2% 6,4%
Repricing analysis of assets, liabilities and shareholders’ funds as at 31 December 2005 (Rm)

Risk management and co n t rol continued
Independent operational risk functions perform co n t rol and
oversight, including the setting of appropriate policies,
governance standards and tools, which include:
• a centralised operational loss database providing management
reports used to identify improvements to processes and
controls;
• risk and control self-assessment through which existing and
potential future risks and their related controls are identified
and assessed; and
• key risk indicators which measure specific factors to provide an
early warning to proactively address potential exposures.
The group’s operational risk strategy provides for continuous
development to keep abreast of legislative and regulato ry
requirements. In addition, we continue to develop and enhance
our standards, policies, methodologies and systems in line with
leading practice.
The group maintains a comprehensive insurance programme to
cover losses from fraud, theft and damage to physical assets and
professional liability claims.
Whilst all elements of operational risk are managed diligently, key
areas requiring specific focus are discussed below.
Business continuity management
Business continuity ensures the availability of all key processes
required to support essential activities in the event of an
interruption to, or disruption of, business. Within the group,
business continuity management has been strengthened through
good governance, improved recovery plan quality and advanced
levels of testing.
A group-wide simulation was conducted during 2005 and
particular attention was given to testing and business continuity
management within Personal & Business Banking SA. T h i s
programme, together with the 2004 initiatives conducted by
C o r p o rate & Investment Banking, has significantly advanced
group-wide resilience. Going forward, focus will be placed on
longer-term sustainability of recovery, including hard-core testing
and the completion of contingency facilities, such as
geographically separated processing centres, to enable continued
business operations in the event of a disaster.
Information risk management
I n formation risk is the possibility of loss or damage arising from a
breach in the co n f i d e n t i a l i t y, integrity or availability of the gro u p ’ s
i n formation. The group’s information risk management pra c t i c e s
play a key role in protecting information from a wide range of
threats to ensure business co n t i n u i t y, minimise business damage
and to maximise return on investments and business opport u n i t i e s .
Fraud risk management
F raud risk management is applied throughout the group and is
s u p p o rted by the group’s forensic services function that opera t e s
under the group internal audit mandate set by the group audit
committee. The strategic approach focuses on fraud prevention,
detection, investigation and whistle blowing activities. The gro u p
maintains a zero - to l e rance approach to w a rds fraud and dishonesty.
Risks associated with outsourcing arrangements
The group ensures these risks are adequately managed. This
includes a structured approach to ensure:
• alignment of the outsourcing proposal with the gro u p ’ s
business objectives and operating imperatives;
• potential risks which could arise from an outsourc i n g
arrangement are identified and addressed;
• responsibilities for all outsourcing arrangements are clearly
understood;
• all outsourcing arrangements comply with regulato ry
requirements; and
• all the outsourcing objectives are achieved.
Compliance risk
The group is subject to extensive supervisory and regulatory
regimes in all countries in which it operates. While executive
management remains responsible for overseeing the
management of the bank’s compliance risk, group compliance
actively engages with management and compliance officers within
business units and subsidiaries to proactively support the
g e n e ration of legal, ethical and profitable business. This is
achieved via three service delivery streams: administration and
support services; regulatory services and analysis; and monitoring.
Specialist support units aid higher exposure compliance risk
requirements. The support and regulatory services ensure that
management and staff are kept informed of regulato ry
developments and trained as necessary. The monito r i n g
department uses a risk-based methodology, integrated with the
methodologies used by the group’s other risk assura n c e
functions, to review and report on the compliance risk exposures
and the efficacy of the compliance risk management system.
Business units are required to report to the group function on a
quarterly basis or more regularly if appropriate.
Group compliance is the prime interface between the South
African regulators and the group. Bank supervision and oversight
became increasingly rigorous in 2005. The Bank Supervision
Department of the SARB is our lead regulator while the Financial
Services Board (FSB) has jurisdiction over consumer protection
issues relating to bancassurance products. In addition, our
offshore operations are subject to the regulations imposed by
their respective host country regulators. Key challenges locally
during 2005 have continued to relate to Financial Intelligence
Centre Act (FICA) requirements for the re-identification and
verification of clients, and the FSB’s accreditation of financial
service providers.
Money laundering co n t rol and occupational health and safety
(including aspects of environmental risk management) are managed
S t a n d a rd Bank Group annual report 2005 P • 6 2

S t a n d a rd Bank Group annual report 2005 P • 6 3
within group compliance and there are increasingly onero u s
legislative requirements being imposed in both these areas.
Reputational risk
The group manages reputational risk through its evaluation and
control of the major risk types as set out above. In addition, there
is an open communication culture that allows for all issues to be
appropriately dealt with in a timely manner.
Insurance!related risk
The Liberty Group (Liberty) board of directors acknowledges its
responsibility for establishing and communicating appropriate risk
and control policies, and ensuring that adequate risk management
processes are in place. Liberty has a number of committees which
deal with the various policies for accepting insurance risks,
including selection and approval of risks to be insured, use of
limits and avoiding undue concentrations of risk, underwriting
s t rategies to ensure the appropriate risk classification and
premium levels, among others, as detailed below.
Responsibility for risk management
A Liberty group risk management committee, being a committee
of the Liberty board, is in place to assist the board in discharging
its risk management obligations.
The principal objectives of Liberty’s risk management committee
are to:
• review Liberty’s risk philosophy, stra t e g y, policies and
processes recommended by executive management;
• review compliance with risk policies and with the overall risk
profile of Liberty;
• review and assess the integrity of the processes and pro c e d u r e s
for identifying, assessing, reco rding and monitoring risk;
• review the adequacy and effectiveness of Liberty’s risk
management and its implementation by management;
• ensure that material corporate risks have been identified,
assessed and receive attention; and
• provide the board with an assessment of the state of risk
management within Liberty.
A significant part of Liberty’s business involves accepting and
managing risk. Primary responsibility for risk management at an
o p e rational level rests with the executive committee. Management
and various specialist committees are tasked with integrating the
management of risk with the day-to-day activities of Libert y.
These committees are outlined below.
• Audit and actuarial co m m i t te e – principal objectives
(pertaining to risk) are as follows:
– act as an effective communication channel between the
board on one hand and the external auditors and the head
of internal audit on the other;
– satisfy the board that adequate internal, financial and
operating controls are being identified, addressed and
monitored by management; and
– enhance the quality, effectiveness, relevance and
communication value of the published financial statements
and other public documentation of a financial nature issued
by Liberty.
• Capital management committee – is responsible for the
management and investment of Liberty’s capital.
• Asset/liability matching co m m i t te e – focuses on the matching
of assets and liabilities. It also oversees the high-level mix
p a rameters for various products and port folios, and is tasked with
agreeing benchmarks and mandates for performance of each
investment port folio in conjunction with the asset managers.
• P roduct approval co m m i t te e – assesses whether all new
p roducts co n form to Liberty’s predetermined requirements and
s t a n d a rds, such as meeting policyholder needs; appro p r i a t e
m a rgins; investment backing; legal, underwriting and taxation
co n s i d e rations; and, where appropriate, currency risks; as well as
L i b e rty’s administrative capabilities for managing these pro d u c t s .
• Underwriting committee – reviews underwriting standards
and claims experience as well as monitoring reinsurance
retention limits and stop loss limits.
Management of insura n ce and financial risk on co n t ra c t u a lobligations to policyholders
Liberty issues contracts that expose it to insurance risk or financial
risk, or in some cases, both of these. Set out below are Liberty’s
objectives in managing risks from insurance contracts and its
policies for mitigating those risks.
The Capital Adequacy Requirement (CAR) as part of the riskmanagement framework
CAR is intended to approximate a risk-based capital measure. It is
calculated based on a number of stress tests, specified in actuarial
guidance, PGN 104, which are intended to provide approximately
a 95% confidence level that the insurer will be able to meet all
obligations over time under a variety of scenarios.
L i b e rty is in the process of developing economic capital models to
better understand its capital requirements and the underlying risks,
in order to continually improve the management of these risks.
Market risk
L i b e rty is exposed to market risk through its financial assets,
financial liabilities (investment co n t racts and borrowings), and
i n s u rance liabilities. In part i c u l a r, the key financial risk is that the
p roceeds from its financial assets are not sufficient to fund the
obligations arising from its insurance and investment co n t racts. T h e
most important components of this financial risk are interest ra t e
risk, equity price risk and currency risk. These risks arise from open
positions in interest rate, currency and equity products, all of which
are exposed to general and specific market movements.

L i b e rty manages these positions within an asset liability
management (ALM) framework that aims to match assets to the
liabilities arising from insurance and investment contracts by
currency, nature and term. For each distinct category of liabilities
in terms of the ALM framework, a separate asset profile is
maintained. In some instances, segregated portfolios of assets are
held for books of business within these broad categories.
Interest rate and equity price risk
These risks have very different impacts on the various categories
of business used in Liberty’s ALM framework. Interest rate and
equity price risk are discussed together since they interact on
certain types of liabilities.
(a) Guaranteed maturity values
Embedded derivatives in the form of guaranteed maturity
values are attached to a significant portion of unit linked
business. Liabilities arising from these embedded derivatives
are valued in accordance with valuation techniques described
in actuarial guidance PGN 110, issued by the Actuarial Society
of South Africa. These liabilities are essentially put options on
the underlying unit linked liabilities and as such are sensitive
to movements in interest rates and equity prices. Liberty is
investigating ways in which this interest rate and equity risk
exposure could be more closely hedged than it is at present.
(b) Guaranteed annuity options
G u a ranteed annuity options (GAOs) give the policyholder the
option to co n v e rt the maturity proceeds of a retirement annuity
i n to an annuity at a pre-defined rate. GAOs are no longer sold
on new business. As in the case of guaranteed maturity values,
liabilities arising from these embedded derivatives are valued in
a cco rdance with valuation techniques described in PGN 110.
GAOs expose Liberty to significant interest rate risk. Liberty is
investigating ways in which interest rate and equity risk
exposure on GAOs could be more closely hedged. To some
extent the upside equity risk exposure on GAOs can be offset
against the downside equity price risk exposure on guaranteed
maturity values.
(c) Unit linked business
For unit linked co n t racts, Liberty holds the assets on which the
unit prices are based. As a result, there is no mismatch. Gro s s
unit liabilities are however reduced by the present value of
future expenses and risk claims less the present value of future
c h a rges for purposes of this matching exercise. Some interest
rate, equity price, credit and currency risk is co n s e q u e n t l y
retained on this business to the extent that present value of
future expenses and risk claims less the present value of future
c h a rges do not move in line with gross unit liabilities.
Within this category of business there are insurance contracts
with minimum guaranteed death benefits and universal life
type contracts in terms of which the sum at risk depends on
the fair value of the underlying investments. These contract
features mean that fluctuations in market prices affect
Liberty’s exposure to mortality risk.
(d) Non-participating annuities
Non-participating annuities have benefit payments that are
fixed and guaranteed at inception of the contract (although a
small proportion of the business provides inflation related
increases on annuities in payment). These liabilities are backed
largely by fixed income securities, with other assets held only
to support the longest dated cashflows arising from a portion
of these liabilities. Liberty’s primary financial risk on these
co n t racts is the risk that interest income and capital
redemptions from the financial assets backing the liabilities is
insufficient to fund the guaranteed benefits payable.
L i b e rty monitors interest rate risk in this business by
comparing the modified duration and convexity of the
investment portfolio and the liabilities issued.
(e) Long-term insurance contracts with discretionary participating
features (DPF)
L i b e rty has a number of books of long-term insura n c e
contracts with DPF, most of which have been acquired from
other insurers. Each book of business is backed by a distinct
asset profile, often as a result of conditions included in the
Scheme of Transfer in terms of which the business was
acquired. The assets backing these liabilities are generally
segregated from Liberty’s other assets to ensure that the
assets are used exclusively to provide benefits for the relevant
policyholders.
Liberty recognises the full value of the backing assets as a
liability. However, Liberty only bears interest rate risk in
relation to the guaranteed benefits under these contracts, and
not in respect of the DPF component of the liability.
Furthermore, Liberty is only exposed to equity price risk on
this business to the extent that equities are held to back the
guaranteed portion of the liability.
(f) Guaranteed capital bonds
Guaranteed capital bonds have benefit payments that are
fixed and guaranteed at inception of the contract. The ALM
framework dictates that assets are selected to provide a cash
flow match to these liabilities. There is consequently very little
interest rate risk on these products and no equity price risk.
On this business the risk of a change in tax laws is mitigated
through policy terms and conditions which enable this risk to
be passed back to the policyholder.
Currency risk
Offshore assets are held in policyholder assets to match the
corresponding liabilities. As a result, the group is exposed to
currency risk through maturity guarantees issued on contracts
invested in offshore portfolios. Maturity guarantees are no longer
offered on new business invested in offshore portfolios. The rand
denominated value of management fees derived from these
Risk management and co n t rol continued
S t a n d a rd Bank Group annual report 2005 P • 6 4

S t a n d a rd Bank Group annual report 2005 P • 6 5
contracts is also subject to currency risk. Strengthening of the
rand against the offshore currencies reduces the value of
management fees and increases the liability in respect of
embedded derivatives on this business.
Insurance risk
Insurance risk is the risk that future claims and expenses will
exceed the value placed on insurance liabilities. It occurs due to
the uncertainty of the timing and amount of future cash flows
arising under insurance co n t racts. The timing is specifically
influenced by future mortality, morbidity, and withdrawal rates
about which assumptions are made in order to place a value on
the liabilities. Deviations from assumptions will result in actual
cash flows differing from those projected in liability calculations.
As such, each assumption represents a source of uncertainty.
Policyholder behaviour risk
Policyholders have the option to discontinue or reduce
contributions or withdraw benefits prior to expiry of the contract
term. As a result, policyholder behaviour contributes to insurance
risk. The main risk posed by this behaviour is the risk that
expenses and commissions incurred early in the term of the
contract but priced to be recovered by means of ongoing charges
over a longer period are not recovered prior to the decision by the
policyholder to cease or reduce contributions.
On co n t racts where a withdrawal benefit is payable, this risk is
mitigated by conditions built into policy co n t racts which enable
L i b e rty to recoup these unrecovered expenses by means of a lump
sum charge. However, the Pension Funds A d j u d i c a tor has recently
challenged the practice of levying charges of this sort on retirement
annuity co n t racts, by issuing a number of determinations against life
insurers, including Libert y. This is symptomatic of growing co n s u m e r
dissatisfaction with this practice. Charges of this sort will therefo r e
be limited in terms of an industry agreement with National Tr e a s u ry.
This will increase Liberty’s exposure to the risks associated with
policyholder behaviour.
Mortality and morbidity risk
Procedures to control and manage the underwriting risks at a
Liberty level are in operation, of which the more significant are
discussed below.
The statutory actuary reports annually on the actuarial soundness
of the premium rates in use and the profitability of the business,
taking into consideration the reasonable benefit expectations of
policyholders. All new premium rates are approved and authorised
by the statuto ry actuary prior to being issued. Regular
investigations into mortality and morbidity experience are
conducted. Catastrophe insurance is in place for single event
disasters. Assumptions are made concerning the expected deaths
and disabilities (including disease claims) that will occur in each
future time period. The significant classes of business most
affected by mortality and morbidity risk are:
(a) Life annuity business
In terms of life annuity business, the life insurer undertakes
to pay a series of future payments contingent on the
policyholder’s survival. The most significant insurance risk on
these liabilities is continued medical advances and
improvements in social conditions that will lead to increases
in longevity. A proportion of both group and individual
disability income business is reinsured on a proportionate
quota share basis, so a proportion of all annuities arising from
disability income claims are reinsured. No additional
reinsurance is purchased in respect of this class of business.
(b) Group mortality and morbidity business
The risks for this class of business are very similar to those for
individual insurance business. The most important differences
result from the greater correlation between individual risks
on group schemes because lives assured work in the same
location, industry etc. For this reason, Liberty attempts to
ensure that a diversified portfolio of schemes is insured.
(c) Individual insurance business
Individual insurance contracts are those issued to individuals
where death or disability is the insured risk. The most
significant factors that could increase the frequency of
mortality claims are epidemics, such as AIDS and Asian bird
flu, or lifestyle changes such as eating, drinking and exercise
habits, resulting in earlier or more claims than expected. The
health condition and family medical history of applicants are
assessed at inception of new co n t racts as part of the
u n d e rwriting process with premiums and terms and
conditions being varied accordingly. Special risks, such as
hazardous pursuits and unusual medical conditions, are also
assessed at underwriting stage. The underwriting committee
determines underwriting guidelines concerning authority
limits and procedures to be followed.
Credit risk
Credit risk is the risk that a counterparty to a financial instrument
will fail to discharge an obligation and cause Liberty to incur a
financial loss.
Provisions of the Long Term Insurance Act 1998 have the effect
of limiting exposure to individual issuers due to the inadmissibility
of assets for regulatory purposes if specified limits are breached.
Credit ratings of reinsurers are taken into account in reinsurance
placement decisions. Credit exposure to reinsurers is also limited
t h rough the use of a number of reinsurers. Scrip lending
co u n t e r p a rties are restricted to appropriately acc r e d i t e d
institutions.
L i b e rty has no significant co n c e n t ration of credit risk in terms of
i n s u rance and other receivables due to the relative significance of
the total value and the wide spread of individual debtors. Derivative
co u n t e r p a rties and cash transactions are limited to high credit
quality financial institutions. Liberty has policies that limit the
amount of the credit exposure to any one financial institution.

L i b e rty is exposed to tenant default within its investment pro p e rt y
p o rt folio. This exposure risk is mainly attributable to policyholders
and the shareholder exposure is limited to management fees and
p rofit margins. The managed diversity of the pro p e rty port folio and
the existence of multi-tenanted buildings significantly reduces
exposure to this credit risk.
Liquidity risk
Net cash flows are closely monitored. Over the last few years
Liberty has experienced positive net cash flows. In addition,
Liberty has significant credit lines over and above the liquid assets
held to meet cash demands.
Liquidity requirements and cash resources are monitored on a
monthly basis by the capital management committee.
Embedded derivatives not valued at fair value
G u a ranteed maturity values, guaranteed annuity options and a return
of contributions on death are features of insurance co n t racts written
by Libert y. These are valued in acco rdance with PGN 110.
Taxation risk
Taxation risk is the risk that the group will incur a financial loss due to
an incorrect interpretation and application of taxation legislation or
due to the impact of new taxation legislation on existing business.
During the development stage of any new product and prior to
any corporate transactions the taxation resources of the group,
and if required external resources, identify and advise on any
potentially material taxation impact.
Proposed new taxation legislation is researched fully by the legal
and taxation resources to identify any potential impact to the
group and where appropriate representation is made to the
relevant government minister, including lobby groups, to assist in
ensuring the fairness of new taxation legislation.
Taxation risk is further mitigated through co n t ract and policy terms
and conditions which, in most instances, enable the risk to be
passed back to the custo m e r.
Group audit assurance
The group internal audit function operates under a mandate fro m
the group audit committee and has the authority to determine the
s cope and extent of work to be performed. Group internal audit’s
p r i m a ry objective is the provision of assurance to the group audit
committee. It assists the executive management team in meeting
their business objectives by examining the group’s activities,
assessing the risks involved, and evaluating the adequacy and
effectiveness of processes, systems and co n t rols to manage these
risks. A risk-based audit approach has been adopted. Material or
significant co n t rol weaknesses and planned management remedial
actions are reported to the group audit committee and to subsidiary
audit committees. These issues are tracked to ensure that agreed
remedial actions have been implemented. Overdue issues are
r e p o rted to the group audit committee on a quarterly basis.
Risk management and co n t rol continued
S t a n d a rd Bank Group annual report 2005 P • 6 6
Risk management focus for 2006
The group is currently in the process of quantifying itslevel of risk appetite and risk tolerance which will take intoaccount:
• the level of earnings volatility it is prepared to acceptaround its budgeted earnings; and
• the risk profile it is going to tolerate to generate theexpected earnings.
In this context, risk profile is the allocation of risk appetitea c ross the various risk categories (e.g. market risk, credit risk,o p e rational risk).
The process to determine both “risk appetite” and “risktolerance” takes external and internal inputs into account,including:
External
• shareholder expectations;
• rating considerations;
• regulatory constraints;
• securities market data;
• analyst views;
• providers of funding/liquidity; and
• economic environment.
Internal
• group and business area objectives and strategic plans;
• growth targets; and
• capital management.
The amount of risk the group is prepared to accept will belinked to its financial and strategic objectives as detailed inits overall business plan and budget. Specifically, thereneeds to be congruency between:
• budgeted earnings (which take account of maturationeffects and forecast changes in the eco n o m i cenvironment);
• earnings volatility around the budget;
• risk limits; and
• capital.

S t a n d a rd Bank Group annual report 2005 P • 6 7
Financial re v i e w
68 Overview of financial results
68 Key factors impacting the results
69 Business units
70 Performance against objectives
70 Banking operations
74 Liberty Life
74 Equity attributable to ordinary shareholders
74 Dividends
74 Accounting policies
75 Normalised results
77 Capital adequacy and allocation
83 Group finance focus for 2006

S t a n d a rd Bank Group annual report 2005 P • 6 8
Financial review continued
This review provides context to the financial performance of the
group’s banking and insurance operations as detailed in the
financial statements. The group’s performance over the past
seven years is detailed on pages 84 to 89 and the financial ratios
generally quoted are defined on page 90.
Overview of financial results
Standard Bank Group headline earnings per share for the year to
December 2005 increased by 23% to 702,3 cents per share and
a return on equity of 27,8% was achieved. These results are based
on International Financial Reporting Standards (IFRS). Certain of
the accounting conventions under IFRS distort the results from an
economic perspective. As discussed under the normalised results
section on page 75 of this review, the effect of these distortions
has been adjusted for in calculating normalised results. On a
normalised basis, headline earnings per share grew 19% and the
return on equity was 25,2% (2004: 24,2%).
Broadly, 2005 was positive for emerging market economies as
macroeconomic fundamentals and demand for exports from these
markets improved. Investment inflows to these markets, aided by
global liquidity and increased investor risk appetite, lift e d
economic activity but reduced profit margins of our corporate and
investment banking activities.
South Africa’s strong economic growth stemmed substantially
f rom strong local demand. High consumer spending was
underpinned by relatively low inflation and interest rates. Net job
creation, the positive effect of rising equity and house prices,
increased household disposable income and the growing middle
class resulted in improved consumer confidence and provided a
strong platform for consumer and business banking in South
Africa.
Financial highlights
2005 2004
Return on equity (%)1 25,2 24,2
Headline earnings (Rm)1 9 013 7 511
Headline earnings growth (%)1 20 20
Headline earnings per
share (cents)1 666,0 558,1
Headline earnings per share
g ro wth (%)1 19 19
Total dividends declared (cents) 267,0 231,5
Net interest margin (%) 2,93 3,07
Cost-to-income ratio (%) 56,6 58,0
Credit loss ratio (%) 0,41 0,43
1Normalised results.
Key factors impacting the results
• Increased consumer activity in South Africa
2005 saw continued strong growth in the residential property
market and record new vehicle sales. A further 50 basis points
reduction in the prime interest rate together with a
strengthening economy was conducive to sustained growth in
lending and transaction volumes.
• Rehabilitation of previously impaired loans
C o r p o rate & Investment Banking in South Africa and
internationally experienced credit recoveries during the year
as improved economic conditions in emerging markets led to
the recovery of previously distressed counterparties. This
helped reduce the group’s credit loss ratio to a historic low,
despite an increase in the credit loss ratio in Personal &
Business Banking SA.
• Increased funding requirements
Customer deposits continue to grow at a slower pace than
consumer lending, resulting in an increased reliance on more
expensive wholesale funding. In addition, the proportion of
term deposits has been increased to lengthen the structure of
the funding book in line with internal prudential liquidity
guidelines. Consequently, average long-term funding as a
percentage of total funding has increased from 15% to 18%.
During the year, the group successfully concluded its first
a s s e t-backed securitisation transactions: R4,5 billion of
mortgage loans and R3,0 billion of vehicle and asset finance
receivables.
• Strong equity markets
Investment Management & Life Insurance benefited from a
strong run in equity markets. Higher listed property fund
prices assisted Corporate & Investment Banking SA to achieve
sizeable gains on its property investment portfolio.
99 00 01 02 03 04 050
4 000
8 000
12 000
16 000
20 000
24 000
28 000
32 000
Headline earnings (Rm)
99 00 01 02 03 04N 05N0
1 000
2 000
3 000
4 000
5 000
6 000
7 000
8 000
9 000
Standard Bank operations
Liberty Life
Normalised
Standard Bank Group 21%Standard Bank operations 23%
CAGR (1999 - 2005) –
N

S t a n d a rd Bank Group annual report 2005 P • 6 9
• Intensified competition in emerging markets
E m e rging markets became increasingly popular with global
i n v e s tors as developing countries’ credit ratings continued to
i m p rove. In this environment, traditional emerging market players
like ourselves are encountering increased competition from the
l a rge established global banks in our chosen markets.
C o n s e q u e n t l y, trading margins have co n t racted. In addition, these
more stable environments have reduced trading opportunities fo r
the group’s international operations. These trends have led to the
international operations’ 2005 results being below expectation.
• Higher compliance costs
Increased regulations are becoming a feature in most of the
jurisdictions in which the group operates. Staff costs in South
Africa were significantly impacted by additional staff
requirements to comply with the Financial Intelligence Centre
Act (FICA) and other regulations. FICA requirements were also
the main driver behind increased communication costs.
• Adjustments for deemed treasury shares
The group’s results have been affected by required accounting
conventions that do not reflect the underlying economic
substance of transactions. Group shares purchased by
empowerment partners and group shares held for the benefit
of policyholders of Liberty Life are deemed to be treasury
shares in terms of IFRS. Consequently the number of shares
used for per share calculation purposes is materially lower than
the shares enjoying an economic interest in the gro u p ,
resulting in inflated per share ratios. In addition, fair value
adjustments relating to group shares held for the benefit of
policyholders and dividends received are eliminated from the
group’s income statement without a corresponding elimination
in policyholders’ liabilities, resulting in a mismatch in the
income statement.
The unaudited table below indicates the significant impact
that the deemed treasury shares have on the results.
Normalised IFRS
Headline earnings (Rm) 9 013 8 464
Headline earnings
growth (%) 20 12
Headline earnings per
share (cents) 666,0 702,3
Headline earnings per
share growth (%) 19 23
F u rther details of the accounting treatment and the calculation
of normalised results are discussed on page 75.
Business units
The refocusing of operations on key business lines, as described in
the chairman and chief executive review, as opposed to
geographic segmentation aims to encourage the leveraging of
skills, economies of scale and synergies. This basis will be followed
as the primary segmentation from 2006 onwards.
On this new basis, Personal & Business Banking comprises 44% of
the group’s headline earnings, and grew these earnings in 2005
by 22%. Corporate & Investment Banking comprises 45% and
grew by 7%, and Investment Management & Life Insurance
comprises 7% and grew by 51%.
On a geographical basis, South African banking increased headline
earnings by 21% with growth of 23% in Personal & Business
Banking SA. The favourable economic conditions benefited the
consumer market and underpinned transactional and lending
growth. The division maintained a strong focus on service levels
and operational efficiencies notwithstanding increased business
volumes and compliance requirements. The home loans business
concluded another successful year with a 25% growth in new
loans registered and low credit losses. Specific focus on the card
business resulted in substantial growth in both balances and
turnover.
Corporate & Investment Banking SA increased headline earnings
by 15%. The benefits of strong loan growth in commercial
property lending was partly offset by lower interest margins
resulting from more expensive and longer dated funding. Fees
and commissions benefited from increased corporate transaction
volumes and new electronic banking products. South African
trading income increased by 8%, dampened by low volatility in
foreign exchange markets. Other income increased following the
revaluation and realisation of listed property investments. A net
reversal of credit losses occurred for the third consecutive year
supported by an exceptionally favourable credit environment.
Operating cost growth was contained to 3% largely through lower
IT costs, savings on depreciation and premises costs.
Corporate & Investment Banking International’s headline earnings
were 28% lower following increased competition and tightening
spreads against a background of increased global liquidity across
most of its markets. Trading income was also adversely impacted
by a continued shift from a reliance on proprietary trading, with
lower value-at-risk utilisation, to becoming more client focused. A
net reversal of credit losses resulted from previously impaired
accounts now performing. Strategies to improve performance in
this operation are being implemented including an increase in the
talent pool, particularly in client facing areas, improved systems
and a change in emphasis from product to client focus. In addition,
the appointment of Ben Kruger as chief executive of Corporate &
Investment Banking across the group should quicken the pace of
implementing these strategies.
Following strong earnings growth in Rest of Africa over a number
of years, headline earnings growth of 17% was slightly below

S t a n d a rd Bank Group annual report 2005 P • 7 0
Financial review continued
expectation. Lower lending margins restricted income growth, off
a higher cost base. Management’s attention in 2005 was mostly
i n w a rdly focused on the alignment of products, policies,
p rocedures and systems across all African countries, and
integrating these with the South African operations. The focus for
2006 will be to increase transaction flows through the stronger
base that has now been established.
Liberty Life had a very good year and increased normalised
headline earnings by 47%, notwithstanding a once-off
R321 million after tax provision for the Statement of Intent
relating to the Pension Funds A d j u d i c a tor (PFA) rulings.
Significant gains on investments held in the shareholders’
portfolio, previously accounted for directly in equity, more than
offset this provision. Highlights of Liberty Life’s results were
improved investment returns and strong growth in new business.
The Capital Alliance Holdings Limited (CAHL) integration is on
track and benefits are beginning to be extracted.
The group will continue to invest in expanding its activities in
emerging markets outside of South Africa. In December 2005, a
consortium led by Standard Bank entered into an agreement to
buy BankBoston Argentina from Bank of America. This transaction
remains subject to fulfilment of provisions of the agreement and
obtaining the necessary regulatory approvals in both South Africa
and Argentina. The acquisition is only expected to be concluded in
the third quarter and is not anticipated to materially affect the
2006 results. Given our interest in Nigeria, we have invested
approximately USD185 million in our existing banking operation
to meet the new minimum capital requirement set by the Central
Bank of Nigeria. This enables us to comprehensively evaluate
suitable acquisition opportunities.
Performance against objectives
One of the group’s eight values is delivering to its shareholders.
The group sets medium-term objectives that are reviewed
annually in the context of expected economic conditions to ensure
this value is measured and lived. These medium-term objectives,
as well as the actual performance against these objectives for the
past seven years, are illustrated on page 10. The group achieved
three of its four stated objectives in 2005:
• Return on equity (RO E ): The group considers ROE as a
measure of quantifying its delivery to shareholders. T h e
g roup’s normalised achievement of 25,2%, co m p a r e s
f a v o u rably to its normalised objective of 22,5%.
• Growth in headline earnings per share: The group’s objective
is to grow normalised headline earnings per share in excess of
domestic inflation (CPIX) plus 10%. The group achieved this
objective by increasing headline earnings per share on a
normalised basis by 19% compared to the objective of 13,9%,
based on average CPIX of 3,9%.
• Cost!to!income ratio: Despite restricting cost growth to single
digits, this objective was not achieved in 2005. The ratio of
56,6% is above the set objective of 55,5%. The group has
improved on its performance of 58,0% in 2004 but lower than
expected income growth in its international operations limited
this improvement.
• Credit loss ratio: In 2004, the group separated its objective for
credit losses into a short-term and medium-term objective. The
short-term objective was set at a ratio of less than 0,75% of
gross loans and advances. The group achieved this challenging
objective comfortably with a credit loss ratio of 0,41% (2004:
0,43%). The low credit loss ratio came as a result of the
favourable credit climate domestically, sound internal risk
processes and recoveries in Corporate & Investment Banking
locally and internationally.
Following a review early in 2006, the revised published objectives
are:
2006 Medium!term
Normalised return on equity (%) 24,0 22,5Normalised headline earnings
per share growth >domestic CPIX >domestic CPIX+10 % +10 %
Credit loss ratio (%) <0,75 <1,00Cost-to-income ratio (%) ≤55,5 Continuous
improvement
Banking operations
Income statement analysis
Net interest income (NII)
2005 2004
% %
Growth in NII 13 0
Net interest margin – group 2,93 3,07
Net interest margin – Domestic
Banking 3,16 3,40
Despite lower margins, strong South African asset growth resulted
in increased group net interest income.
Overall, minimal erosion of lending yields was experienced despite
increased amortisation of mortgage origination costs. The group’s
domestic bank generally avoided market share gains at the
expense of low margins.
The lower interest earned on shareholders’ funds and
transactional deposits such as current accounts continued to
squeeze margins as the average prime rate reduced by 66 basis
points to 10,65% in 2005 following a further 50 basis points
reduction in the domestic prime rate.

Jan Dec8,0
8,5
9,0
9,5
10,0
10,5
11,0
11,5
12,0
Domestic prime interest rate (%)
Prime interest rate 2005
Prime interest rate 2004
S t a n d a rd Bank Group annual report 2005 P • 7 1
On the funding and liquidity management side, increased
utilisation of more expensive wholesale funding to fund asset
growth, the lengthening of the average long-term funding ratio
from 15% to 18%, and maintaining a prudent liquid assets surplus,
impacted margins.
Lending growth was the main contributor to higher net interest
income in Rest of Africa and internationally but falling interest
rates in key African markets and high levels of global liquidity
resulted in tighter margins, partly reducing this benefit.
Non!interest revenue (NIR)
2005 2004
% %
Growth in NIR 11 15
NIR as a % of total income 56,3 56,7
Growth in non-interest revenue resulted from a 14% increase in
fee and commission revenue and growth of 25% in other sources
of non-interest revenue. Net trading revenue was marginally
lower.
In South Africa, fees and commission benefited from a growing
customer base and higher transaction volumes, resulting in growth
of 16% despite below inflation price increases. These increased
volumes were particularly evident in card-based commissions,
point of representation fees and electronic banking where income
growth rates of 29%, 13% and 19%, respectively, were achieved.
Migration to electronic banking is continuing as the number of
Internet transactions increased by 85% and the number of new
Internet users increased by 27%. Increased deal flow benefited
the co r p o rate finance advisory business and co n t r i b u t e d
significantly to growth in knowledge-based fees. Rest of Africa
recorded fees and commissions growth of 15%, resulting mainly
from increased volumes and repricing of electronic banking and
point of representation fees. Stanlib benefited from increased
assets under management and grew fees by 14%. Internationally,
competitive pressures and lower fund management fees led to a
reduction of 9% in fee revenue.
Trading revenue grew by 8% in South Africa with improved deal
flow in client-based derivative trading. Foreign exchange trading
recorded a marginal increase, off a high base, with volumes and
market conditions to a large extent the same as in 2004. Buoyant
precious metal prices resulted in reduced hedging activity by
99 00 01 02 03 04 050,5
1,5
2,5
3,5
4,5
5,5
Net interest margin before impairment charges
Net interest margin after impairment charges
Net interest margin before impairment charges
Net interest margin after impairment charges
Group net interest margin (%)
99 00 01 02 03 04 050
4 000
8 000
12 000
16 000
20 000
24 000
28 000
32 000
Non-interest revenue
99 00 01 02 03 04 050
2 000
4 000
6 000
8 000
10 000
12 000
14 000
16 000
18 000
20 000
35
40
45
50
55
60
65
70
30
Rm %
Non-interest revenue
Non-interest revenue to total income
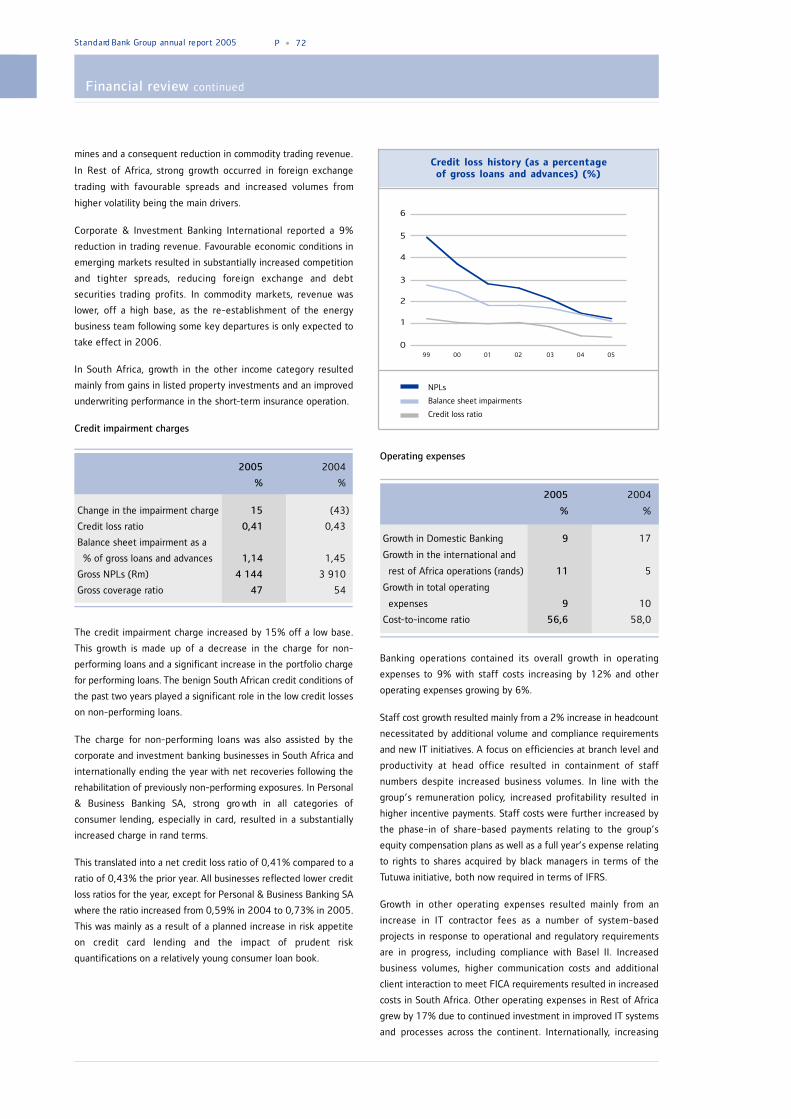
Financial review continued
mines and a consequent reduction in commodity trading revenue.
In Rest of Africa, strong growth occurred in foreign exchange
trading with favourable spreads and increased volumes from
higher volatility being the main drivers.
Corporate & Investment Banking International reported a 9%
reduction in trading revenue. Favourable economic conditions in
emerging markets resulted in substantially increased competition
and tighter spreads, reducing foreign exchange and debt
securities trading profits. In commodity markets, revenue was
lower, off a high base, as the re-establishment of the energy
business team following some key departures is only expected to
take effect in 2006.
In South Africa, growth in the other income category resulted
mainly from gains in listed property investments and an improved
underwriting performance in the short-term insurance operation.
Credit impairment charges
2005 2004
% %
Change in the impairment charge 15 (43)
Credit loss ratio 0,41 0,43
Balance sheet impairment as a
% of gross loans and advances 1,14 1,45
Gross NPLs (Rm) 4 144 3 910
Gross coverage ratio 47 54
The credit impairment charge increased by 15% off a low base.
This growth is made up of a decrease in the charge for non-
performing loans and a significant increase in the portfolio charge
for performing loans. The benign South African credit conditions of
the past two years played a significant role in the low credit losses
on non-performing loans.
The charge for non-performing loans was also assisted by the
corporate and investment banking businesses in South Africa and
internationally ending the year with net recoveries following the
rehabilitation of previously non-performing exposures. In Personal
& Business Banking SA, strong gro wth in all categories of
consumer lending, especially in card, resulted in a substantially
increased charge in rand terms.
This translated into a net credit loss ratio of 0,41% compared to a
ratio of 0,43% the prior year. All businesses reflected lower credit
loss ratios for the year, except for Personal & Business Banking SA
where the ratio increased from 0,59% in 2004 to 0,73% in 2005.
This was mainly as a result of a planned increase in risk appetite
on credit card lending and the impact of prudent risk
quantifications on a relatively young consumer loan book.
Operating expenses
2005 2004
% %
Growth in Domestic Banking 9 17
Growth in the international and
rest of Africa operations (rands) 11 5
Growth in total operating
expenses 9 10
Cost-to-income ratio 56,6 58,0
Banking operations contained its overall growth in operating
expenses to 9% with staff costs increasing by 12% and other
operating expenses growing by 6%.
Staff cost growth resulted mainly from a 2% increase in headcount
necessitated by additional volume and compliance requirements
and new IT initiatives. A focus on efficiencies at branch level and
productivity at head office resulted in containment of staff
numbers despite increased business volumes. In line with the
group’s remuneration policy, increased profitability resulted in
higher incentive payments. Staff costs were further increased by
the phase-in of share-based payments relating to the group’s
equity compensation plans as well as a full year’s expense relating
to rights to shares acquired by black managers in terms of the
Tutuwa initiative, both now required in terms of IFRS.
Growth in other operating expenses resulted mainly from an
increase in IT contractor fees as a number of system-based
projects in response to operational and regulatory requirements
are in progress, including compliance with Basel II. Increased
business volumes, higher communication costs and additional
client interaction to meet FICA requirements resulted in increased
costs in South Africa. Other operating expenses in Rest of Africa
grew by 17% due to continued investment in improved IT systems
and processes across the continent. Internationally, increasing
S t a n d a rd Bank Group annual report 2005 P • 7 2
99 00 01 02 03 04 050
1
2
3
4
5
6
Credit loss history (as a percentageof gross loans and advances) (%)
NPLs
Balance sheet impairments
Credit loss ratio

S t a n d a rd Bank Group annual report 2005 P • 7 3
investment in IT infrastructure and network capabilities coupled
with the expansion of regional offices resulted in 6% cost growth.
Across the group, additional compliance related costs amounted to
approximately R200 million in 2005.
Taxation
2005 2004
% %
Effective taxation rate 27,4 28,3
Direct taxation rate 22,6 24,5
Indirect taxation rate 4,8 3,8
The direct taxation rate reduced by 1,9% mainly as a result of a
1% reduction in the South African co r p o rate tax rate, re-
evaluation of past liabilities and a release of deferred taxation
following the cut in the South African corporate tax rate. This was
p a rtly offset by a significantly increased seco n d a ry tax on
companies cost following the higher dividend payout ratio.
Growth in indirect taxes resulted mainly from an increase in
expenses subject to VAT relative to net income before taxation.
Balance sheet analysis
Banking assets
2005 2004
% %
Growth in total banking assets 17 14
Growth in total banking assets
excluding derivative assets 29 12
Growth in loans and advances 29 17
Strong growth in banking assets excluding derivatives occurred
across the group with growth of 28% in Personal & Business
Banking SA, 35% in Corporate & Investment Banking SA, 18% in
Rest of Africa and 14% in Corporate & Investment Banking
International.
Most consumer lending categories in South Africa benefited from
lower interest rates:
• mortgage loans increased by 32% following an increase in the
volume and value of new registrations;
• instalment finance was up 15%, mainly as a result of volume
growth as average lending values remained largely unchanged.
Results reflect an above expectation performance in motor
vehicle business for consumers and a disappointing growth
rate in the non-motor book; and
• a strong focus was placed on growth in card debtors with a
resulting 55% growth in card balances. Growth resulted mainly
from new card openings through targeted campaigns and joint
ventures, higher levels of revolving credit facilities and
increased consumer spending.
The group’s market share in South Africa increased in credit card
d e b tors to 35,1% (2004: 32,8%) and decreased in both
mortgage lending, down marginally to 25,6% (2004: 25,8%) and
in instalment finance down to 20,3% (2004: 22,1%). Both
mortgage lending and instalment finance market share statistics
were impacted by securitisations, which reduced the ratios by
0,6% and 1,1% respectively.
Corporate & Investment Banking SA recorded growth in external
loans and advances of 24%, mainly from increased commercial
property lending, new term deals to corporate customers and
increased structured trade finance transactions. Internationally,
external loan growth of 45% resulted mainly from increased
structured and trade finance deals.
99 00 01 02 03 04 050
4 000
8 000
12 000
16 000
20 000
24 000
28 000
32 000
Cost and income growth
99 00 01 02 03 04 050
5
10
15
20
25
30
52
54
56
58
60
62
64
Growth % Ratio %
Total income growth
Total cost growth
Cost-to-income ratio
Mortgage advances
Instalment finance
Card debtors
Key market shares (%)
02 03 04 05
15
20
25
30
35
40

Financial review continued
Liberty Life
2005 was a good year for Liberty Life. Indexed new business
premiums increased by 12%. Net cash inflows from insura n c e
o p e rations amounted to R5,7 billion – the highest level to date. In
addition, Stanlib and Liberty Ermitage net cash inflows amounted to
R13,3 billion and R0,4 billion respectively. Normalised embedded
value per share was 15% higher than last year. During the course of
2005 Liberty Life initiated the disposal of its offshore asset
m a n a g e r, Liberty Ermitage, and the A u s t ralian life insura n c e
business, Prefsure, which was included in the acquisition of CAHL.
Liberty Life’s published earnings are adjusted to exclude the
results relating to Stanlib, this entity’s results being consolidated
into those of Standard Bank operations.
Equity attributable to ordinary shareholders
2005 2004
% %
Growth in ordinary shareholders’
funds 13 1
Net asset value per share
– normalised (cents) 2 830 2 464
Net asset value as defined by ord i n a ry shareholders’ equity grew by
13% to R33 billion. In 2004, the group reported a R4,2 billion
elimination against equity attributable to ord i n a ry shareholders fo r
shares acquired in terms of the Tutuwa initiative, deemed to be
t r e a s u ry shares. Following the adoption of IFRS, a further elimination
was required for group shares held for the benefit of Libert y
policyholders amounting to R1,1 billion, net of minority interest. On
a normalised basis (adding these eliminations back) net asset value
increased by 15% to R38 billion, representing mainly the retention
of earnings and a R0,4 billion net increase in the translation reserve.
Dividends
2005 2004
% %
Dividend cover (times) 2,5 2,5
Growth in dividends per share 15 53
Dividend yield 3,5 3,5
In March 2005, the group announced a revised dividend policy
using a consistent dividend cover ratio for both interim and year-
end dividends. This has resulted in a more even spread between
interim and final dividends. Due to the much higher number of
shares eliminated in terms of IFRS from 2005, dividend cover has
now been applied to normalised headline earnings per share for
the purpose of arriving at dividend declarations, slightly reducing
the reported dividend growth.
At December 2004 the cover ratio was 2,5 times, down from
3,1 times in 2003. The dividend cover for 2005 has remained
unchanged, resulting in total dividends declared of 267,0 cents,
15% higher than the total dividend declared in 2004. The total
dividend of 267,0 cents is made up of a final dividend of
145,0 cents (20% lower than 2004) and an interim dividend of
122,0 cents (142% higher than 2004).
The dividend policy is subject to annual review and may be
adjusted for business growth, acquisition activity, the impact of
Basel II or changes in reported earnings resulting from applying
fair value accounting principles.
Accounting policies
Basis of preparation
The consolidated financial statements are prepared in accordance
with, and comply with IFRS and the South African Companies Act
of 1973. The consolidated financial statements are prepared in
accordance with the going concern principle under the historical
cost basis as modified by the revaluation of financial instruments
classified as available-for-sale, financial assets and liabilities held
at fair value through profit or loss, investment properties and
derivative instruments.
Changes in accounting policies
The accounting policies are consistent with those adopted in the
previous year, except for changes made as a result of the adoption of
IFRS. The revised IFRS policies have been consistently applied to
both years presented with the exception of IAS 32 – Financial
Instruments: Disclosure and Presentation, IAS 39 – Financial
Instruments: Recognition and Measurement and IFRS 4 – Insura n c e
C o n t racts, where the group elected to apply IFRS with effect from
1 January 2005 as permitted by IFRS 1 – First time adoption of IFRS.
A detailed report summarising the impact of the IFRS co n v e r s i o n
was published during the 2005 interim results announcement and
is available on www. s t a n d a rd b a n k . co.za under financial results. T h e
final impact of conversion to IFRS is provided on page 182 and a
s u m m a ry is provided on the following page. With the exception of
reallocations in the income statement and balance sheet line items,
mainly in the life insurance operations, since the interim
publication, no adjustments have been made impacting profit and
equity attributable to ord i n a ry shareholders.
S t a n d a rd Bank Group annual report 2005 P • 7 4
99 00 01 02 03 04 050
40
80
120
160
200
240
280
Dividends per share (cents)

S t a n d a rd Bank Group annual report 2005 P • 7 5
Summary of IFRS adjustments
Profit
attributable to
ordinary
Total assets Equity shareholders
Rm Rm Rm
Reported at/for the year ended 31 December 20041 615 596 38 564 7 741
Share-based payment expense 4 (132) (116)
Deferred taxation adjustment on investment properties and present value
of in-force business 47 – –
Revaluation of residual values 46 46 12
Accounting for leases on a straight-line basis 266 (15) (5)
Spreading of deferred acquisition costs on instalment finance transactions – (3) 3
Consolidation of mutual funds 3 647 (1) –
Reversal of goodwill amortisation 112 112 98
Goodwill impairment (48) (48) (45)
Reclassification of financial instruments on adoption of IAS 39 10 12 (2)
Accounting for credit losses on an incurred loss basis (2) (2) (2)
Reclassification of reinsurance contracts to liabilities 495 – –
IFRS values at/for the year ended 31 December 2004 620 173 38 533 7 684
Revaluations resulting from the reclassification of insurance contracts
as investment contracts – (12)
Spreading of deferred acquisition costs in Liberty Life 99 41
Elimination of deemed treasury shares (3 703) (3 703)
Reclassification of financial instruments on adoption of IAS 39 (39) (39)
Deferral of profit on initial recognition of unlisted instruments (21) (21)
Accounting for credit losses on an incurred loss basis 115 77
IFRS values at 1 January 2005 616 624 34 876
1Total assets have been adjusted for additional goodwill on acquisition of Standard Bank Mozambique in terms of IFRS 3.
Normalised results (unaudited)
Headline earnings have been adjusted in calculating normalised
headline earnings for required accounting conventions that do not
reflect the underlying economic substance of transactions. A
common element in these transactions relates to shares in issue
deemed by accounting convention to be treasury shares.
Consequently the number of shares used for per share calculation
purposes are materially lower than the economic substance, resulting
in inflated per share ratios. With regard to segmental report i n g ,
normalised adjustments have been made within central funding and
L i b e rty Life with the results of the other business units unaffected.
Black Economic Empowerment Ownership initiative
The group concluded its Black Economic Empowerment
Ownership (Tutuwa) initiative in October 2004 when it sold an
effective 10% interest in its South African banking operations to
a broad-based grouping of black entities.
The group subscribed for 8,5% redeemable cumulative
preference shares issued by special purpose vehicles (SPVs)
controlled by Standard Bank Group (SBG). The initial repurchase
of SBG shares by the SPVs is treated as a reduction in the group’s
equity. Subsequent to the repurchase of the SBG shares, the SPVs
containing these shares were sold to the black participants. The
capital and dividends on the preference shares are repayable from
future ordinary dividends received on SBG shares. As a result of
SBG’s right to receive its own dividends back in the form of
preference dividends and capital on the preference shares, the
subsequent sale of the SPVs and consequent delivery of the SBG
shares to the black participants (although legally effected) is not
accounted for as a sale. The preference share investment in the
SPVs is also not accounted for as an asset. The preference share
asset is effectively eliminated against equity as a negative
empowerment reserve.
As a consequence of the above, the accounting treatment
followed until full redemption, or third party financing is:
• the 8,5% redeemable, cumulative preference shares issued by
the SPVs and subscribed for by SBG are not recognised as
financial assets, but eliminated against equity;
• the preference dividends received from the SPVs are
eliminated against the ordinary dividends paid on the SBG
shares held by the SPVs;
• for purposes of the calculation of earnings per share, the
weighted average number of shares in issue is reduced by the

Adjustments to normalised number of shares
2005 2004
Weighted Weighted
Issued average Issued average
number number number number
of shares of shares of shares of shares
Million Million Million Million
IFRS 1 207 1 205 1 253 1 322
Add back: SBG shares held by Tutuwa SPVs 99 99 99 24
Add back: SBG shares held in policyholder funds 46 49
Normalised 1 352 1 353 1 352 1 346
Financial review continued
S t a n d a rd Bank Group annual report 2005 P • 7 6
number of shares held by those SPVs that have been sold to
the black participants. The shares will be restored on full
redemption of the preference shares, or to the extent that the
preference share capital is financed by a third party; and
• perpetual preference shares issued by the group for the
purposes of facilitating the repurchase of SBG shares, are
classified as equity. Dividends paid are accounted on declara t i o n
and not on an accrual basis.
The “normalised” calculation:
• reverses the elimination of preference shares against equity;
• adjusts headline earnings for preference dividends receivable
not recognised in income;
• adds back the number of shares held by the Tu t u w a
participants to the weighted number of shares in issue, in
calculating normalised headline earnings per share; and
• adjusts dividends declared on perpetual preference shares to
an accrual basis.
Shares held for the benefit of policyholders
G roup companies’ shares held by Liberty Life are invested for the
risk and reward of its policyholders, not its shareholders, and
consequently the group’s shareholders are exposed to an
insignificant portion of the fair value changes on these shares. In
terms of IAS 32, Standard Bank and Liberty Holdings shares held by
L i b e rty Life on behalf of policyholders are deemed to be treasury
shares for accounting purposes, with effect from January 2005, and
eliminated. The corresponding movement in policyholders’ liabilities
is however not eliminated resulting in a mismatch in the overa l l
equity and income statement of the group.
The accounting consequences in the consolidated financial
statements are:
• the investment in group shares is set off against equity in the
group financial statements;
• within equity, the cost price of the group shares is eliminated
against ordinary shareholders’ funds and minority interests;
• the fair value movements are eliminated from the income
statement, reserves and minority interests;
• dividends received on group shares are eliminated against
dividends paid; and
• no adjustment is, however, made for policyholder liabilities.
Increases in the fair value of group shares and dividends
declared on these shares increases the liability to policyholders.
The increase in the liability to policyholders is accounted for in
the income statement. The increase in assets held to match the
liability position is however eliminated against equity. T h i s
results in a mismatch in the income statement.
The equity and profit impact is attributable to Standard Bank
ordinary shareholders to the extent of the effective holding in
Liberty Life (30%).
The weighted average number of shares in issue for earnings per
share is calculated by deducting the full number of group shares
held (100%) and not the effective 30% owned by the group, as
the accounting standard IAS 33 – Earnings per share does not
contemplate minority portions of treasury shares. This further
exaggerates the reduction in the number of shares for purposes
of calculating per share ratios.
For purposes of calculating the normalised results, the adjustments
described above are reversed and the group shares held on behalf of
policyholders are treated as issued to parties external to the gro u p .

S t a n d a rd Bank Group annual report 2005 P • 7 7
Capital adequacy and allocation
The group manages its capital base to achieve a balance between
maintaining prudent capital ratios to support business growth and
depositor confidence, and the objective to provide competitive
returns to shareholders.
Regulatory capital
The group is subject to regulation and supervision by a number of
South African and international regulators.
The 25 banks in the group are required to meet minimum capital
requirements of regulators in those countries in which they
o p e rate. Banking regulations are generally based on the
guidelines developed by the Basel Committee under the auspices
of the Bank for International Settlements. In addition to the
requirements of host country regulators, all banking operations
are also expected to comply with the capital adequacy
requirements in terms of South African banking regulations. As a
consequence, the group’s individual banking operations are
capitalised at the higher capital adequacy levels in terms of either
host country or South African requirements.
The capital adequacy ratio, which reflects the capital strength of
an entity compared to the minimum regulatory requirement, is
calculated by dividing capital by risk-weighted assets.
Capital is split into three tiers. Tier I (primary capital) represents
the permanent forms of capital such as share capital, share
premium and retained earnings. Perpetual, non-cumulative
preference shares also qualify as tier I capital. Tier II (secondary
capital) includes medium- to long-term subordinated debt,
revaluation reserves and general debt provisions. Tier III (tertiary
capital) represents short-dated subordinated debt instruments to
support a bank’s trading activities.
Risk-weighted assets are determined by applying prescribed risk
weightings to on- and off-balance sheet exposures acco rding to the
relative credit risk of the co u n t e r p a rt y. Included in overall risk-
weighted assets is a notional risk weighting for market risks,
co u n t e r p a rty risks and large exposure risks relating to trading activity.
The use of non-equity forms of regulatory capital plays an
important part in the group’s capital management process:
• Domestically, Standard Bank of South Africa (SBSA) redeemed
R2,7 billion of tier II capital bonds that were eligible for
redemption during June and December 2005. As part of a
refinancing programme and also to strengthen the bank’s
capital base in view of strong risk-weighted assets growth,
SBSA issued R3 billion 10 year tier II bonds at a spread of
10 basis points over the R157 bond in May 2005 following an
earlier issue of R2 billion tier II capital during November 2004.
• International operations raised USD250 million of tier II bonds
in October 2005 at a spread of 115 basis points over LIBOR.
This issue was part of a strategy to improve the gearing of the
r e g u l a to ry capital base of the group’s London based opera t i o n s
and to refinance the redemption of USD100 million of tier II
bonds that were eligible for redemption in November 2005.
The proceeds of the above issue were also used to repay, to the
pool of strategic capital, USD53 million of capital invested by
the group in its international opera t i o n s .
• Within Rest of Africa, Standard Bank Swaziland issued
E35 million tier II bonds, the first bank tier II issue in
Swaziland. The optimisation of capitalisation levels and
Adjustments to normalised results
Ordinary
shareholders’
Headline earnings equity
Standard Bank
operations Liberty Life Group Group
Rm Rm Rm Rm
IFRS values – 2004 7 187 351 7 538 29 064
Preference dividend accrual (114) (114) (114)
8,5% cumulative redeemable preference dividend and
shares recognised 83 4 87 4 360
Normalised values – 2004 7 156 355 7 511 33 310
IFRS values – 2005 8 145 319 8 464 32 931
Preference dividend accrual 3 3 (111)
8,5% cumulative redeemable preference dividend
and shares recognised 342 25 367 4 378
Fair value movements and dividends received on deemed
treasury shares 179 179 1 072
Normalised values – 2005 8 490 523 9 013 38 270

Financial review continued
structuring in the African operations will receive greater focus
during 2006.
The group’s life insurance operations based in South Africa are
regulated by the Financial Services Board. The capital
requirements are calculated by a statuto ry actuary in terms of the
guidance notes issued by the Actuarial Society of South A f r i c a .
Consistent with the group focus on optimising capital utilisation
and shareholder value, Liberty Life similarly has an ongoing
p rocess to review its capital structure, which led to a R2 billion
tier II bond issue during July 2005.
Capital adequacy ratios
The group's capital adequacy ratio reduced to 14,2% from 15,0%
at December 2004, still well above the weighted avera g e
regulatory requirement of 10,3% for the 25 banks across the
group. Tier I capital adequacy reduced from 11,0% to 10,5% due
to strong growth in risk-weighted assets marginally exceeding
retention of capital following the reduction in dividend cover. In
addition, the group utilised R677 million to buy back 10,2 million
shares thus counteracting the impact on earnings per share of
shares issued in relation to the group’s equity compensation
plans.
The group’s target level of capitalisation (excluding strategic
pools of surplus capital that might be held from time to time)
approximates 9% for tier I and 13% for total capital adequacy. A
broad mix is targeted of 60% ordinary shareholders‘ funds, 10%
other forms of tier I capital such as preference shares and 30%
tier II and tier III capital instruments. Capital management
activities take place against the backdrop of these guidelines and
the demands on capital arising from the group’s opera t i n g
requirements.
Liberty Group is well capitalised with a capital adequacy cover of
2,0 times (2004: 2,5 times) the minimum regulatory capital
requirement (CAR). Liberty Life’s long-term CAR ratio target is
1,7 times.
S t a n d a rd Bank Group annual report 2005 P • 7 8
Tier I capital
Tier II capital
Tier III capital
Required capital
Capital adequacy (%)
99 00 01 02 03 04 05
0
2
4
6
8
10
12
14
16
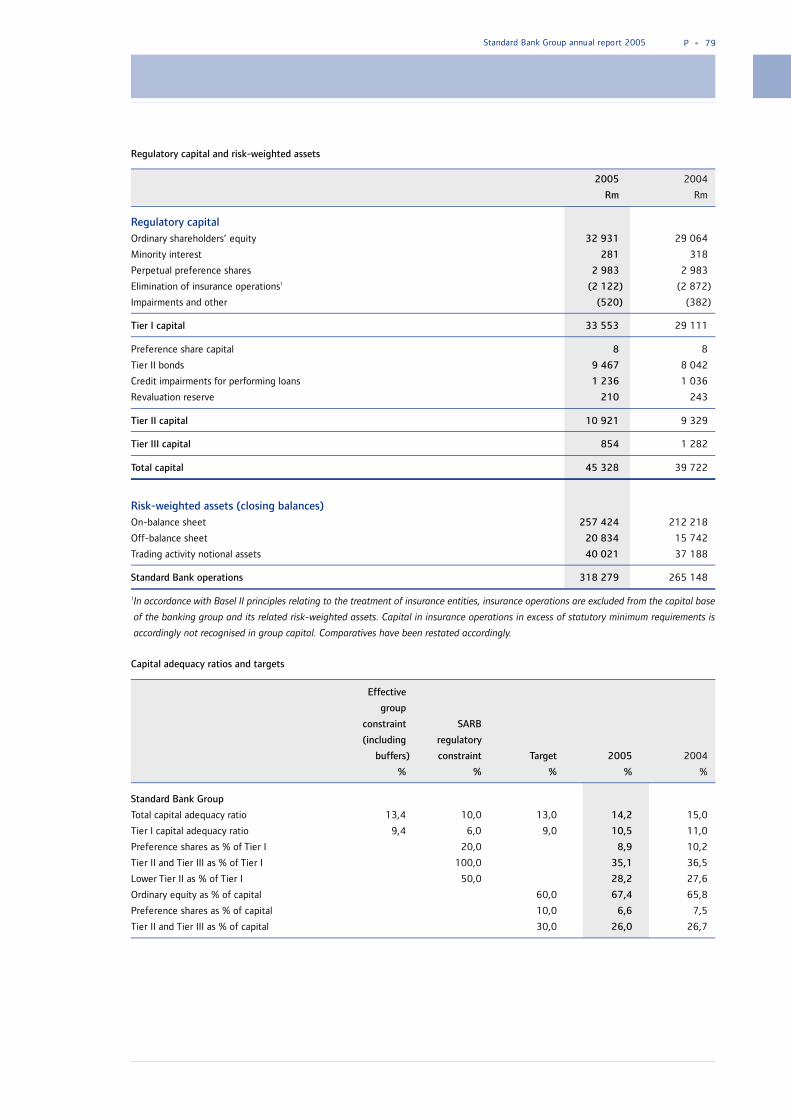
S t a n d a rd Bank Group annual report 2005 P • 7 9
2005 2004
Rm Rm
Regulatory capitalOrdinary shareholders’ equity 32 931 29 064
Minority interest 281 318
Perpetual preference shares 2 983 2 983
Elimination of insurance operations1 (2 122) (2 872)
Impairments and other (520) (382)
Tier I capital 33 553 29 111
Preference share capital 8 8
Tier II bonds 9 467 8 042
Credit impairments for performing loans 1 236 1 036
Revaluation reserve 210 243
Tier II capital 10 921 9 329
Tier III capital 854 1 282
Total capital 45 328 39 722
Risk!weighted assets (closing balances)On-balance sheet 257 424 212 218
Off-balance sheet 20 834 15 742
Trading activity notional assets 40 021 37 188
Standard Bank operations 318 279 265 148
1In accordance with Basel II principles relating to the treatment of insurance entities, insurance operations are excluded from the capital base
of the banking group and its related risk-weighted assets. Capital in insurance operations in excess of statutory minimum requirements is
accordingly not recognised in group capital. Comparatives have been restated accordingly.
Regulatory capital and risk!weighted assets
Effective
group
constraint SARB
(including regulatory
buffers) constraint Target 2005 2004
% % % % %
Standard Bank Group
Total capital adequacy ratio 13,4 10,0 13,0 14,2 15,0
Tier I capital adequacy ratio 9,4 6,0 9,0 10,5 11,0
Preference shares as % of Tier I 20,0 8,9 10,2
Tier II and Tier III as % of Tier I 100,0 35,1 36,5
Lower Tier II as % of Tier I 50,0 28,2 27,6
Ordinary equity as % of capital 60,0 67,4 65,8
Preference shares as % of capital 10,0 6,6 7,5
Tier II and Tier III as % of capital 30,0 26,0 26,7
Capital adequacy ratios and targets

Financial review continued
S t a n d a rd Bank Group annual report 2005 P • 8 0
Capital adequacy of banking subsidiaries
2005 2004 2005Host
Tier I Tier II Tier III Total Tier I Tier II Tier III Total regulatorycapital capital capital capital capital capital capital capital requirement
% % % % % % % % %
Standard Bank Group 10,5 3,4 0,3 14,2 11,0 3,5 0,5 15,0 –
The Standard Bank of South Africa 8,6 3,6 0,3 12,5 9,1 3,8 0,5 13,4 10
Rest of AfricaStanbic Bank Botswana 12,1 3,7 – 15,8 11,9 4,1 – 16,0 15Stanbic Bank Congo 11,0 – – 11,0 10,8 – – 10,8 10Stanbic Bank Ghana 18,0 0,3 – 18,3 16,8 – – 16,8 10Stanbic Bank Kenya 14,7 0,7 – 15,4 19,8 – – 19,8 12Stanbic Bank Malawi 15,0 4,2 – 19,2 14,8 4,9 – 19,7 10Standard Bank Mauritius 24,0 0,7 – 24,7 17,6 0,6 – 18,2 10Standard Bank Mozambique 13,5 – – 13,5 18,4 – – 18,4 10Stanbic Bank Nigeria1 307,0 – – 307,0 26,8 0,3 – 27,1 10Stanbic Bank Tanzania 9,2 0,9 – 10,1 8,8 0,8 – 9,6 10Stanbic Bank Uganda 14,6 1,1 – 15,7 17,3 0,5 – 17,8 12Stanbic Bank Zambia 21,5 0,1 – 21,6 18,6 0,1 – 18,7 10Stanbic Bank Zimbabwe 22,4 3,8 – 26,2 15,3 3,7 – 19,0 10Standard Bank Lesotho 17,2 0,4 – 17,6 10,0 0,5 – 10,5 8Lesotho Bank (1999) 16,1 0,7 – 16,8 21,9 0,7 – 22,6 8Standard Bank Namibia 9,7 3,5 – 13,2 9,0 3,8 – 12,8 10Standard Bank Swaziland 6,1 3,2 – 9,3 7,7 0,8 – 8,5 8
SIH, incorporating 8,1 5,7 0,5 14,3 8,2 6,1 0,8 15,1 10!12– Standard Bank London– Standard Bank Asia Limited– Standard Merchant Bank
Asia– Banco Standard de
Investimentos Anonima– ZAO Standard BankStandard Bank Jersey 9,1 2,3 – 11,4 9,5 2,5 – 12,0 10Standard Bank Isle of Man 5,9 5,2 – 11,1 7,1 4,4 – 11,5 10
Aggregate regulatory capital requirement 10,3 10,5
Liberty Life (calculated in terms of the Long-term Insurance Act) – CAR – times covered 2,0 2,5
1High levels of capital in Nigeria relative to risk-weighted assets were due to a further capitalisation of the bank to meet new local minimum capital requirements.

S t a n d a rd Bank Group annual report 2005 P • 8 1
2005 2005 2004 2004
Unweighted Risk!weighted Unweighted Risk-weighted
assets assets assets assets
Rm Rm Rm Rm
On!balance sheet assets
Domestic Banking 452 038 215 219 391 668 179 845
Rest of Africa 30 043 17 075 25 348 14 641
Corporate & Investment Banking International 122 660 23 861 107 128 15 207
Stanlib and central funding (including
group eliminations) (11 013) 1 269 (18 124) 2 525
593 728 257 424 506 020 212 218
Off!balance sheet assets
Domestic Banking 16 861 12 462
Rest of Africa 1 685 1 831
Corporate & Investment Banking International 2 288 1 449
20 834 15 742
Trading notional assets
Domestic Banking 11 623 14 264
Corporate & Investment Banking International 28 398 22 924
40 021 37 188
Standard Bank operations 593 728 318 279 506 020 265 148
Analysis of risk!weighted assets
Risk-weighted assets
Total assets
Standard Bank operations’ risk!weightedassets trend (closing balances) (Rm)
99 00 01 02 03 04 05
100 000
200 000
300 000
400 000
500 000
600 000
700 000

Financial review continued
S t a n d a rd Bank Group annual report 2005 P • 8 2
Economic capital
The group’s approach to the measurement and management of
economic risk capital is being aligned to be consistent with
Basel II requirements in relation to the internal capital adequacy
assessment process (ICAAP).
The allocation of economic capital to business units considers both
risk capital as well as regulato ry capital requirements in order to
ensure that the business units focus on generating adequate returns
for actual capital that needs to be held. Economic capital is therefo r e
set at the higher of risk or regulato ry capital requirements.
Return on equity based on economic capital allocations forms part
of a balanced set of business unit financial perfo r m a n c e
indicators, which are monitored regularly. Cost of equity and
weighted average cost of capital estimates are calculated for each
market in which the group operates to serve as objective
performance benchmarks and investment criteria.
Currency profile of group capital
A significant proportion of the group's activities are based outside
South Africa. The group’s plans for acquisitions also lie
predominantly outside South Africa. As a consequence, 39%
(2004: 35%) of the group's shareholders’ funds are foreign
currency denominated; 12% (2004: 8%) is deployed in African
o p e rations and 27% (2004: 27%) supports international
operations or is held as surplus capital for future expansion. The
increase in capital deployed in African operations results from the
further capitalisation of the group’s Nigerian subsidiary to be in
compliance with new minimum capital levels of Naira 25 billion
(approximately R1,2 billion).
Appropriate hedging strategies are implemented to create a more
balanced currency profile given an overweight position of the
US dollar in the group's foreign capital base in favour of a more
balanced spread of exposures to US dollar, sterling and euro.
Before accounting for currency hedging initiatives, 16% (2004:
16%) of the group’s shareholder funds was exposed to US dollar,
3% (2004: 5%) to sterling and 7% (2004: 6%) to euro. After
hedging, the main non-rand currency exposures of shareholder
funds are 11% (2004: 8%) US dollar, 10% (2004: 13%) sterling
and 5% (2004: 6%) euro.
The group remains averse to an overconcentration of its net asset
value in US dollars and has hedges in place to support this
strategy. The strengthening of the USD relative to GBP and euro
has accordingly given rise to losses on currency hedges on USD
invested in Corporate & Investment Banking International.
Given the group’s presence in many countries, its shareholder
funds will always be exposed to currency movements. Current
South African Reserve Bank exchange controls do not allow for
hedging of foreign currency risks on external capital into rand.
A cco rd i n g l y, the group’s currency hedging is limited to
movements within the basket of external currencies.Shareholders’ funds (average)
Tutuwa impairments
Policyholders’ treasury shares
Return on ordinary equity
99 00 01 02 03 04N 05N0
5 000
10 000
15 000
20 000
25 000
30 000
35 000
40 000
0
3
6
9
12
15
18
21
24
27
30
Rm %
N
ROE
Normalised
Economic returns generated by Standard Bank Group
Change 2005 2004
% Rm Rm
Average ordinary equity (normalised) 15 35 743 31 073
Headline earnings (normalised) 20 9 013 7 511
Cost of equity charge 3 (4 289) (4 164)
Economic profits on normalised headline earnings 41 4 724 3 347
Other changes in net asset value 514 (1 237)
Translation gains/(reversals) 397 (1 272)
Other reserve movements 117 35
Total economic return >100 5 238 2 110

S t a n d a rd Bank Group annual report 2005 P • 8 3
Total Rand Dollar Sterling Euro Other
ZAR
linked Various
Rm Rm Rm Rm Rm Rm Rm
Closing currency exposureDecember 2005 underlying
exposures 32 931 20 188 5 162 1 194 2 317 854 3 216
Currency profile changes
due to hedging strategies (1 601) 2 191 (526) (64)
December 2005 actual exposures 32 931 20 188 3 561 3 385 1 791 854 3 152
December 2004 exposures
excluding hedging activities 29 064 18 889 4 738 1 414 1 819 768 1 436
Currency profile changes
due to hedging strategies (2 402) 2 402
December 2004 actual exposures 29 064 18 889 2 336 3 816 1 819 768 1 436
% % % % % % %
Closing currency profile ofshareholders’ funds2005 before hedging 100 61 16 3 7 3 10
2005 after hedging 100 61 11 10 5 3 10
2004 before hedging 100 65 16 5 6 3 5
2004 after hedging 100 65 8 13 6 3 5
Closing shareholders’ funds exposure to currencies
Group finance focus for 2006
The group’s finance function strives to constantly enhance
decision making by providing information relevant to
management, regulators, investors and other parties. This is
done through a disciplined and comprehensive approach to
financial reporting.
As internal operational needs and external regulatory and
i n v e s tor requirements are constantly evolving, the
following matters will receive increased focus in 2006:
• further alignment of reporting segments, previously
largely geographically based, into business segments
based on main product groupings;
• embedding principles required for compliance with
Basel II in 2008;
• co o rdination of a group-wide economic capital
allocation process to ensure optimum allocation of
capital in line with quantified risk appetite; and
• further alignment of financial disclosure and timing of
reporting with international best practice.

Consolidated balance sheet1
2005 2005 2005 CAGR)2
US$m UK£m €m %
AssetsBanking assets 93 353 54 222 78 953 21
Cash and short-term negotiable securities 13 970 8 114 11 815 18
Trading assets 6 045 3 511 5 113 39
Investments 2 885 1 676 2 440 15
Loans and advances 52 536 30 514 44 432 19
Current and deferred tax assets 142 82 120
Derivative and other assets 17 029 9 892 14 403 37
Interest in associates and joint ventures 128 74 108 52
Goodwill and other intangible assets 96 56 81
Property and equipment 522 303 441 3
Insurance assets 25 464 14 790 21 536 15
Total assets 118 817 69 012 100 489 20
Equity and liabilities
Equity 6 284 3 650 5 314 11
Equity attributable to ordinary shareholders 5 178 3 008 4 378 15
Preference share capital and premium 470 273 398
Minority interest 636 369 538 (8)
Liabilities 112 533 65 362 95 175 21
Banking liabilities 87 931 51 072 74 367 22
Deposit and current accounts 64 853 37 668 54 849 17
Derivative, trading and other liabilities 20 786 12 073 17 580 48
Current and deferred tax liabilities 627 364 530 11
Subordinated bonds 1 665 967 1 408
Insurance liabilities 24 602 14 290 20 808 17
Total equity and liabilities 118 817 69 012 100 489 20
1The group implemented IFRS from 1 January 2005. As permitted by IFRS, 2004 results have not been restated for IAS 32, IAS 39
and IFRS 4. With the exception of the reallocation of accrued interest to the relevant line items, results prior to 2004 have not been
restated for the adoption of other IFRS statements.
2CAGR refers to compound annual growth rate based on rand amounts for the period 1999 to 2005.
Exchange rates utilised to convert the 31 December 2005 balance sheet: US$ – 6,36 (2004: 5,63)
UK£ – 10,95 (2004: 10,82)
Euro – 7,52 (2004: 7,66)
S t a n d a rd Bank Group annual report 2005 P • 8 4
Seven!year re v i e w

2005 2004 2003 2002 2001 2000 1999
Rm Rm Rm Rm Rm Rm Rm
593 728 506 020 444 371 307 592 306 196 209 337 185 087
88 848 52 787 44 521 48 583 43 908 31 648 32 452
38 446 32 438 33 722 26 781 23 548 9 484 5 414
18 347 20 068 20 421 18 964 23 804 7 818 7 959
334 128 258 873 222 100 180 418 178 094 139 089 119 863
902 1 093 803 460 1 322 – –
108 312 136 911 118 715 28 528 31 881 18 274 16 557
815 296 541 276 187 100 65
610 540 508 671 714 216 –
3 320 3 014 3 040 2 911 2 738 2 708 2 777
161 950 114 153 96 195 85 761 89 038 75 643 68 866
755 678 620 173 540 566 393 353 395 234 284 980 253 953
39 964 38 533 35 264 32 060 31 666 25 116 21 079
32 931 29 064 28 835 26 054 25 685 18 292 14 576
2 991 2 991 8 8 8 8 8
4 042 6 478 6 421 5 998 5 973 6 816 6 495
715 714 581 640 505 302 361 293 363 568 259 864 232 874
559 239 476 153 417 518 283 614 282 694 193 644 173 034
412 462 322 477 278 899 245 333 241 568 172 136 158 272
132 199 140 607 128 560 28 953 31 294 15 272 12 596
3 988 3 409 2 826 2 415 3 804 2 686 2 131
10 590 9 660 7 233 6 913 6 028 3 550 35
156 475 105 487 87 784 77 679 80 874 66 220 59 840
755 678 620 173 540 566 393 353 395 234 284 980 253 953
S t a n d a rd Bank Group annual report 2005 P • 8 5

Seven!year review continued
S t a n d a rd Bank Group annual report 2005 P • 8 6
Consolidated income statement1
2005 2005 2005 CAGR)2
US$m UK£m €m %
Banking operationsNet interest income 2 042 1 122 1 642 11
Non-interest revenue 2 629 1 445 2 114 16
Total income 4 671 2 567 3 756 14
Credit impairment charges 190 104 153 (4)
Income after credit impairment charges 4 481 2 463 3 603 16
Operating expenses 2 644 1 454 2 126 12
Net income before goodwill 1 837 1 009 1 477 22
Goodwill impairment 4 2 3
Net income from banking operations 1 833 1 007 1 474 22
Income from associates and joint ventures 31 17 25 65
Net income before indirect taxation 1 864 1 024 1 499 22
Indirect taxation 89 49 71 7
Profit before direct taxation 1 775 975 1 428 24
Direct taxation 421 231 339 26
Profit for the year 1 354 744 1 089 23
Attributable to minorities and preference shareholders 60 33 48 52
Banking profit attributable to ordinary shareholders 1 294 711 1 041 22
Insurance operationsNet income before goodwill 460 253 370 (1)
Goodwill impairment 62 34 50
Net income from insurance operations 398 219 320 (4)
Indirect taxation 33 18 27 6
Profit before direct taxation 365 201 293 (4)
Direct taxation 257 141 207 12
Profit for the year 108 60 86 (17)
Attributable to minorities 76 42 61 (17)
Insurance profit attributable to ordinary shareholders 32 18 25 (17)
Group profit attributable to ordinary shareholders 1 326 729 1 066 18
Headline earnings 1 331 732 1 070 20
Normalised headline earnings3 1 417 779 1 139 21
1The group implemented IFRS from 1 January 2005. As permitted by IFRS, 2004 results have not been restated for IAS 32, IAS 39
and IFRS 4. Excluding exceptional items, which have been reallocated and included in the relevant income or expense categories,
results prior to 2004 have not been restated for the adoption of other IFRS statements.
2CAGR refers to compound annual growth rate based on rand amounts for the period 1999 to 2005.
3Prepared on a normalised basis (refer page 75 for an explanation of normalised results).
Average exchange rates utilised to convert the 2005 income statement: US$ – 6,36 (2004: 6,44)
UK£ – 11,57 (2004: 11,80)
Euro – 7,91 (2004: 8,01)
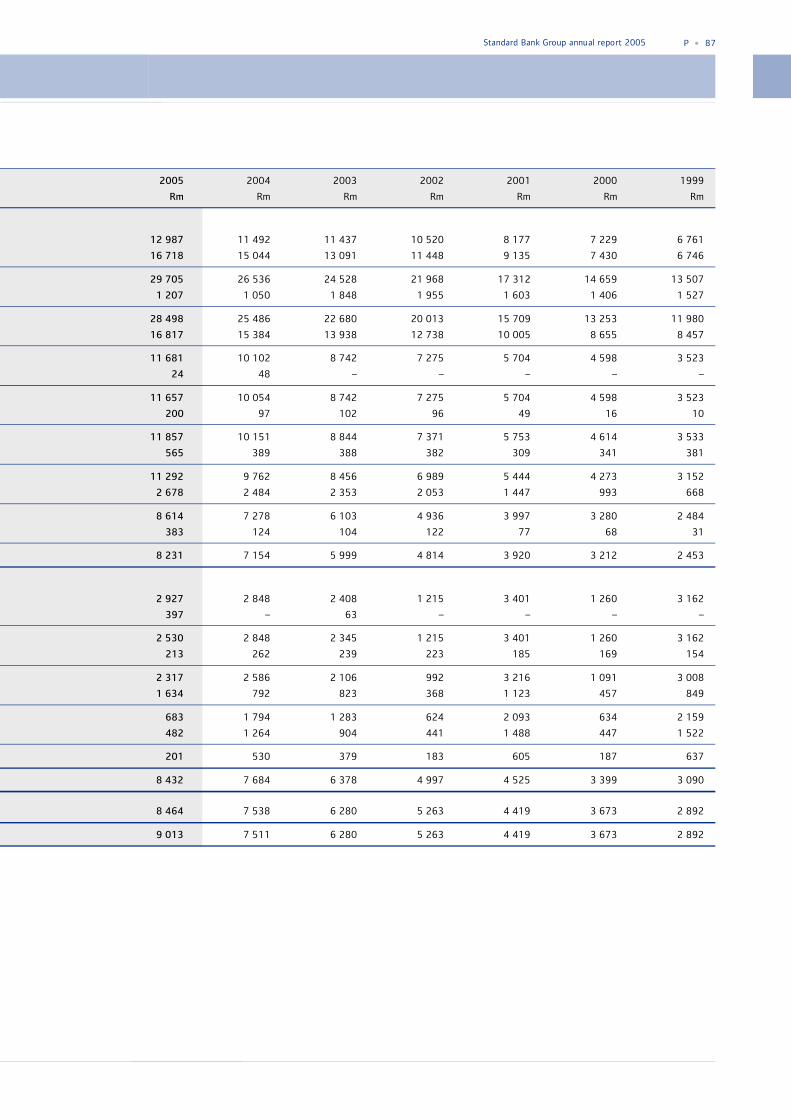
S t a n d a rd Bank Group annual report 2005 P • 8 7
2005 2004 2003 2002 2001 2000 1999
Rm Rm Rm Rm Rm Rm Rm
12 987 11 492 11 437 10 520 8 177 7 229 6 761
16 718 15 044 13 091 11 448 9 135 7 430 6 746
29 705 26 536 24 528 21 968 17 312 14 659 13 507
1 207 1 050 1 848 1 955 1 603 1 406 1 527
28 498 25 486 22 680 20 013 15 709 13 253 11 980
16 817 15 384 13 938 12 738 10 005 8 655 8 457
11 681 10 102 8 742 7 275 5 704 4 598 3 523
24 48 – – – – –
11 657 10 054 8 742 7 275 5 704 4 598 3 523
200 97 102 96 49 16 10
11 857 10 151 8 844 7 371 5 753 4 614 3 533
565 389 388 382 309 341 381
11 292 9 762 8 456 6 989 5 444 4 273 3 152
2 678 2 484 2 353 2 053 1 447 993 668
8 614 7 278 6 103 4 936 3 997 3 280 2 484
383 124 104 122 77 68 31
8 231 7 154 5 999 4 814 3 920 3 212 2 453
2 927 2 848 2 408 1 215 3 401 1 260 3 162
397 – 63 – – – –
2 530 2 848 2 345 1 215 3 401 1 260 3 162
213 262 239 223 185 169 154
2 317 2 586 2 106 992 3 216 1 091 3 008
1 634 792 823 368 1 123 457 849
683 1 794 1 283 624 2 093 634 2 159
482 1 264 904 441 1 488 447 1 522
201 530 379 183 605 187 637
8 432 7 684 6 378 4 997 4 525 3 399 3 090
8 464 7 538 6 280 5 263 4 419 3 673 2 892
9 013 7 511 6 280 5 263 4 419 3 673 2 892

Seven!year review continued
Statistics, returns and capital adequacy
CAGR)1
% 2005 2004 2003 2002 2001 2000 1999
Standard Bank GroupShare statisticsNumber of ordinary shares in
issue (thousands)
Listed on the JSE Limited
– weighted average 1 353 382 1 345 786 1 334 099 1 328 192 1 318 6964 1 295 8414 1 277 0184
– end of period 1 352 383 1 352 108 1 338 730 1 331 078 1 324 938 1 309 1794 1 279 3134
In terms of IFRS2
– weighted average 1 205 169 1 321 666 1 334 099 1 328 192 1 318 696 1 295 841 1 277 018
– end of period 1 206 704 1 252 918 1 338 730 1 331 078 1 324 938 1 309 179 1 279 313
Dividend cover (times) 2,53 2,5 3,1 3,2 3,3 3,3 3,3
Dividend yield (%) 3,5 3,5 3,9 4,1 3,3 2,8 2,7
Earnings yield (%) 9,3 8,7 12,0 13,1 10,7 9,3 8,9
Price earnings ratio (times) 10,8 11,5 8,3 7,6 9,3 10,8 11,3
Normalised price earnings ratio (times)3 11,4 11,8 8,3 7,6 9,3 10,8 11,3
Price-to-book (times) 3,1 3,1 1,8 1,5 1,6 2,2 2,2
Normalised price-to-book (times)3 2,7 2,7 1,8 1,5 1,6 2,2 2,2
Share price (cents) – high 7 875 6 750 3 960 3 810 3 605 3 120 2 650
Share price (cents) – low 5 750 3 686 2 650 2 595 2 600 2 000 1 590
Share price (cents) – closing 20 7 581 6 580 3 918 3 015 3 120 3 050 2 555
Number of shares traded (thousands) 841 835 892 633 908 179 673 703 511 549 434 756 401 884
Turnover in shares traded (%) 62,2 66,0 67,8 50,6 38,6 33,2 31,4
Market capitalisation (Rm) 21 102 524 88 969 52 451 40 132 41 338 39 930 32 686
Share statistics per ordinary share (cents)Earnings 19 699,7 581,4 478,1 376,2 343,1 262,3 242,0
Normalised earnings3 18 663,6 569,0 478,1 376,2 343,1 262,3 242,0
Headline earnings 21 702,3 570,3 470,7 396,3 335,1 283,4 226,5
Normalised headline earnings3 20 666,0 558,1 470,7 396,3 335,1 283,4 226,5
Dividends 26 267,0 231,5 151,0 124,0 102,0 85,0 68,0
Net asset value 16 2 729 2 320 2 154 1 957 1 939 1 397 1 139
Normalised net asset value3 16 2 830 2 464 2 154 1 957 1 939 1 397 1 139
Selected returns (%)Return on equity 27,8 26,0 22,9 20,3 20,1 22,4 20,9
Normalised return on equity3 25,2 24,2 22,9 20,3 20,1 22,4 20,9
1CAGR refers to compound annual growth rates for the period 1999 to 2005.
2Shares in issue reduced by shares issued in terms of the Tutuwa initiative and deemed treasury shares held for the benefit of Liberty Life policyholders.
3Prepared on a normalised basis (refer page 75 for an explanation of normalised results).
4The number of shares has been adjusted for treasury shares acquired and cancelled in 2001.
S t a n d a rd Bank Group annual report 2005 P • 8 8

S t a n d a rd Bank Group annual report 2005 P • 8 9
Statistics, returns and capital adequacy continued
CAGR)1
% 2005 2004 2003 2002 2001 2000 1999
Exchange rates at 31 DecemberUS$ 1 6,36 5,63 6,68 8,58 12,00 7,57 6,16
UK£ 2 10,95 10,82 11,95 13,82 17,45 11,30 9,92
Euro 3 7,52 7,66 8,42 9,01 10,68 7,10 6,17
Market indicators at 31 DecemberPrime overdraft rate (%) 10,50 11,00 11,50 17,00 13,00 14,50 15,50
JSE All Share Index – closing 14 18 097 12 657 10 387 9 277 10 457 8 164 8 357
JSE Banks Index – closing 15 29 234 22 975 14 153 12 035 12 812 13 697 12 482
Standard Bank operations2
Selected returns and ratiosHeadline earnings (Rm) 22 8 145 7 187 6 010 4 965 3 985 3 249 2 428
Normalised headline earnings (Rm)3 23 8 490 7 156 6 010 4 965 3 985 3 249 2 428
Return on equity (%) 28,2 27,2 24,0 21,2 19,9 22,1 20,7
Normalised return on equity (%)3 25,8 25,1 24,0 21,2 19,9 22,1 20,7
Price-to-book (times) 3,1 3,2 1,8 1,5 1,6 2,1 2,2
Normalised price-to-book (times)3 2,7 2,7 1,8 1,5 1,6 2,1 2,2
Normalised return on risk-weighted
assets (%)3 2,9 2,9 2,6 2,3 2,1 2,2 1,8
Net interest margin (%) 2,93 3,07 3,46 3,22 3,31 3,77 3,94
Non-interest income to total income (%) 56,3 56,7 53,4 52,1 52,8 50,7 49,9
Cost-to-income ratio (%) 56,6 58,0 56,8 58,0 57,8 59,0 62,6
Credit loss ratio (%) 0,41 0,43 0,90 1,07 0,99 1,06 1,27
Effective tax rate (%) 27,4 28,3 31,0 33,0 30,5 28,9 31,4
Normalised headline earnings
per employee (rand)3 21 231 449 199 777 171 548 143 876 120 444 107 175 74 394
Number of employees at year-end 2 36 682 35 820 35 034 34 509 33 086 30 315 32 637
Capital adequacy4
Risk-weighted assets (Rm) 14 318 279 265 148 236 346 225 995 219 773 158 451 142 498
Tier I capital (Rm) 16 33 553 29 111 25 289 23 277 22 637 16 954 13 680
Total capital (Rm) 19 45 328 39 722 33 797 31 187 29 669 22 500 16 245
Tier I capital to risk-weighted assets (%) 10,5 11,0 10,7 10,3 10,3 10,7 9,6
Total capital to risk-weighted assets (%) 14,2 15,0 14,3 13,8 13,5 14,2 11,4
1CAGR refers to compound annual growth rates for the period 1999 to 2005.
2Standard Bank Group excluding Liberty Life.
3Prepared on a normalised basis (refer page 75 for an explanation of normalised results).
4In accordance with Basel II principles relating to the treatment of insurance entities, insurance operations are excluded from the capital base of the banking
group and its related risk-weighted assets. Capital in insurance operations in excess of statutory minimum requirements is not recognised in group capital.
Comparatives have been restated accordingly.

Financial definitions
S t a n d a rd Bank Gro u p
C AGR (%) Compound annual gro wth ra t e .
Dividend cover (times) Normalised headline earnings per share divided by ord i n a ry dividends per share.
Dividends per share (ce n t s ) Total ord i n a ry dividends declared per share in respect of the year.
Dividend yield (%) Dividends per share as a percentage of the closing share price.
Earnings attributable to ord i n a ry P rofit for the year attributable to ord i n a ry shareholders, calculated as profit for the s h a reholders (Rm) year less dividends on non-redeemable, non-cumulative, non-participating preference
shares declared before year end, less minority interests.
Earnings per share (EPS) (ce n t s ) Earnings attributable to ord i n a ry shareholders divided by the weighted average numberof ord i n a ry shares in issue.
Earnings yield (%) Headline earnings per share as a percentage of the closing share price.
Headline earnings (Rm) Earnings attributable to ord i n a ry shareholders excluding goodwill impairment, capitalp rofits and losses, and recycled profits and losses on available-fo r-sale financiali n s t r u m e n t s .
Headline earnings per share (HEPS) (ce n t s ) Headline earnings divided by the weighted average number of ord i n a ry shares in issue.
Net asset value (Rm) Equity attributable to ord i n a ry shareholders.
Net asset value per share (ce n t s ) Net asset value divided by the number of ord i n a ry shares in issue at year end.
Normalised re s u l t s The financial results and ratios restated on an economic substance basis to adjusta ccounting anomalies on preference dividends receivable and payable, resulting from theTutuwa initiative, and to reinstate deemed treasury shares eliminated against equity, butheld for the benefit of policyholders.
P r i ce earnings ratio (times) Closing share price divided by headline earnings per share.
P r i ce ! to!book (times) Market capitalisation divided by net asset value.
P rofit for the year (Rm) Annual income statement profit attributable to ord i n a ry shareholders, minorities andpreference shareholders.
Return on equity (ROE) (%) Headline earnings as a percentage of monthly average ord i n a ry shareholders’ funds.
S h a res in issue (number) Number of ord i n a ry shares in issue at year end after deducting ord i n a ry shares issued interms of the Tutuwa transaction, of which dividends are retained to finance the purc h a s eco n s i d e ration and after deducting shares held for the benefit of policyholders deemed tobe treasury shares.
Tu t u w a Tutuwa is the group’s Black Economic Empowerment Ownership initiative entered into interms of the Financial Sector Chart e r.
We i g h ted average number of share s ( n u m b e r ) Weighted average number of ord i n a ry shares in issue after deducting ord i n a ry shares,issued in terms of the Tutuwa transaction, of which dividends are retained to settle thep u rchase co n s i d e ration and after deducting shares held for the benefit of policyholdersdeemed to be treasury shares.
S t a n d a rd Bank opera t i o n s
C o s t ! to ! i n come ratio (%) O p e rating expenses as a percentage of total inco m e .
C redit loss ratio (%) Total credit impairment charges per the income statement as a percentage of avera g edaily and monthly gross loans and advances.
E f fective taxation ra te (%) Direct and indirect taxation as a percentage of net income before taxation.
G ross co v e rage ratio (%) N o n - p e rforming loan impairments as a percentage of gross non-performing loans.
Impairment of non!performing loans (Rm) Impairment for specific identified credit losses, net of the present value of estimatedr e co v e r i e s .
Impairment of performing loans (Rm) Po rt folio based impairment for incurred credit losses inherent in the performing loanb o o k .
Net inte rest margin (%) Net interest income (NII) as a percentage of daily and monthly average total assets,e xcluding trading derivative assets.
N o n ! i n te rest revenue to total income (%) Non-interest revenue as a percentage of total inco m e .
Return on equity (ROE) (%) Headline earnings, excluding income from Liberty Life, as a percentage of monthlya v e rage ord i n a ry shareholders’ funds, after deducting capital relating to Liberty Life.
Return on risk!weighted assets (%) Headline earnings, excluding income from Liberty Life, as a percentage of daily andmonthly average risk-weighted assets of the banking opera t i o n s .
S t a n d a rd Bank Group annual report 2005 P • 9 0

Standard Bank Group annual report 2005 P • 91
Annual financial statements
92 Report of the independent auditors
93 Directors’ responsibility for financial reporting
93 Group secretary’s certification
94 Directors’ report
100 Balance sheet
101 Income statement
102 Statement of changes in shareholders’ funds
104 Cash flow statement
105 Accounting policies
124 Notes to the annual financial statements
Note
124 1 Segment reporting
129 2 Key management assumptions
133 3 Cash and balances with banks
133 4 Short-term negotiable securities
133 5 Derivative instruments
138 6 Trading assets
139 7 Investments
142 8 Loans and advances
145 9 Current and deferred taxation
145 10 Other assets
145 11 Interest in associates and joint ventures
146 12 Goodwill and other intangible assets
148 13 Property and equipment
149 14 Share capital
151 15 Trading liabilities
152 16 Deposit and current accounts
153 17 Current and deferred taxation
155 18 Other liabilities
155 19 Policyholders’ liabilities
156 20 Subordinated bonds
158 21 Empowerment reserve
159 22 Contingent liabilities and capital commitments
160 23 Supplementary income statement information
163 24 Emoluments of Standard Bank Group directors
163 25 Taxation
165 26 Dividends
166 27 Headline earnings
166 28 Earnings per share
167 29 Cash flow statement notes
169 30 Disposal groups held for sale
170 31 Third party funds under management
170 32 Related party transactions
173 33 Pensions and other post-retirement benefits
178 Standard Bank Group Limited – company annual
financial statements
182 Annexure A – implementation of IFRS
193 Annexure B – currency balance sheet
194 Annexure C – subsidiaries
198 Annexure D – associates and joint ventures
200 Annexure E – equity-linked transactions
Additional information
203 Abridged financial statements of principal banking
subsidiary
204 Standard Bank operations average balance sheet
206 International representation

Standard Bank Group annual report 2005 P • 92
Report of the independent auditors
To the members of Standard Bank GroupLimited
We have audited the annual financial statements and group
annual financial statements of Standard Bank Group Limited set
out on pages 94 to 202 for the year ended 31 December 2005.
These financial statements are the responsibility of the company’s
directors. Our responsibility is to express an opinion on these
financial statements based on our audit.
We conducted our audit in accordance with International
Standards on Auditing. Those standards require that we plan and
perform the audit to obtain reasonable assurance about whether
the financial statements are free of material misstatement.
KPMG Inc.
Registered Accountants and Auditors
An audit includes examining, on a test basis, evidence supporting
the amounts and disclosures in the financial statements. An audit
also includes assessing the accounting principles used and
significant estimates made by management, as well as evaluating
the overall financial statement presentation. We believe that our
audit provides a reasonable basis for our opinion.
In our opinion, the financial statements present fairly, in all
material respects, the financial position of the company and of the
group at 31 December 2005, and the results of their operations
and cash flows for the year then ended in accordance with
International Financial Reporting Standards and in the manner
required by the Companies Act of South Africa.
PricewaterhouseCoopers Inc.
Registered Accountants and Auditors
Johannesburg
8 March 2006

Standard Bank Group annual report 2005 P • 93
Directors’ responsibility for financial reporting
In accordance with Companies Act requirements, the directors are
responsible for the preparation of the annual financial statements
which conform with International Financial Reporting Standards
(IFRS) and which, in accordance with those statements, fairly
present the state of affairs of the company and the group as at
the end of the financial year, and the net income and cash flows
for that period.
It is the responsibility of the independent auditors to report on
the fair presentation of the financial statements.
The directors are ultimately responsible for the internal controls.
Management enables the directors to meet these responsibilities.
Standards and systems of internal control are designed and
implemented by management to provide reasonable assurance as
to the integrity and reliability of the financial statements in
accordance with IFRS and to adequately safeguard, verify and
maintain accountability for group assets. Accounting policies
supported by judgements, estimates and assumptions, which
comply with IFRS, are applied on a consistent and going concern
basis. Systems and controls include the proper delegation of
responsibilities within a clearly defined framework, effective
accounting procedures and adequate segregation of duties.
Derek Cooper
Chairman
Systems and controls are monitored throughout the group.
Greater detail of such, including the operation of the internal
audit function, is provided in the corporate governance and the
risk management sections of the report starting on pages 30 and
45 respectively.
Based on the information and explanations given by management
and the internal and external auditors, the directors are of the
opinion that the accounting controls are adequate and that the
financial records may be relied upon for preparing the financial
statements in accordance with IFRS and maintaining
accountability for the group’s assets and liabilities. Nothing has
come to the attention of the directors to indicate that any
breakdown in the functioning of these controls, resulting in
material loss to the group, has occurred during the year and up to
the date of this report. The directors have a reasonable
expectation that the company and the group have adequate
resources to continue in operational existence for the foreseeable
future. For this reason, they continue to adopt the going concern
basis in preparing the financial statements.
The financial statements, prepared in accordance with IFRS, which
appear on pages 94 to 202, were approved by the board of
directors on 8 March 2006 and signed on its behalf by:
Jacko Maree
Chief executive
Group secretary’s certification
Compliance with Companies Act 61 of 1973
In terms of the Companies Act 61 of 1973 (the Act), and for the
year ended 31 December 2005, I certify that Standard Bank
Group Limited has lodged all returns required by the Act with the
Registrar of Companies and that all such returns are true, correct
and up to date.
Loren Wulfsohn
Group secretary
8 March 2006

Directors’ report for the year ended 31 December 2005
Principal activities
Standard Bank Group Limited is the holding company for the interests of the Standard Bank Group.
Group results
A general review of the business and operations of major subsidiaries is given in the 2005 chairman and chief executive’s review and
operational reviews commencing on pages 2 and 18 respectively.
A financial review on the results of the Standard Bank Group for the year is given on pages 67 to 83.
Property and equipment
There was no change in the nature of the fixed assets of the group or in the policy regarding their use during the year.
Share capital
Ordinary shares
During the year, 10 439 067 ordinary shares (2004: 13 378 700 ordinary shares) were issued in terms of the equity compensation plans.
Surplus capital was utilised to repurchase 10 164 515 ordinary shares to counteract the impact of the shares issued under the equity
compensation plans.
Directors’ interest in shares
At the date of this report, the directors held, directly and indirectly, interests in the company’s ordinary issued share capital as reflected in
the tables that follow:
Ordinary shares
Direct beneficial1 Indirect beneficial1 Indirect non�beneficial1
Director 2005 2004 2005 2004 2005 2004
DDB Band 11 017 11 017 – – – –
E Bradley – – 274 494 262 258 351 962 391 467
DE Cooper – – – – 13 243 13 243
T Evans – – 6 773 4 273 – –
TS Gcabashe2 – – 125 000 125 000 – –
DA Hawton 11 977 11 977 – – – –
SE Jonah KBE – N/A – N/A – N/A
Sir Paul Judge – – – – – –
SJ Macozoma3 – – 4 826 582 4 826 582 – –
JH Maree 299 001 174 001 – – – –
RP Menell – – – – – –
Adv KD Moroka2 554 554 125 000 125 000 – –
AC Nissen2 – – 125 000 125 000 – –
MC Ramaphosa4 2 495 2 495 5 775 810 5 775 810 – –
Dr MA Ramphele2 – N/A 125 000 N/A – N/A
MJD Ruck 420 647 340 647 – – – –
MJ Shaw – – – – – –
Sir Robert Smith – – – – – –
Dr CB Strauss 1 567 1 567 112 150 112 150 – –
Total 747 258 542 258 11 495 809 11 356 073 365 205 404 710
1Defined as per requirements of the JSE Limited.
2Includes an allocation of 125 000 shares in terms of the Tutuwa Management Trust – special conditions apply for qualifying black non-
executive directors.
3SJ Macozoma has a 20% interest in Safika Holdings (Proprietary) Limited (Safika) which acquired 24 132 911 shares in terms of the Tutuwa
initiative.
4MC Ramaphosa has a 35,9% interest in Shanduka Group (Proprietary) Limited (Shanduka) which acquired 16 088 608 shares in terms of
the Tutuwa initiative.
N/A Not yet appointed.
P • 94Standard Bank Group annual report 2005

Standard Bank Group annual report 2005 P • 95
6,5% first cumulative preference shares
Indirect non�beneficial1
Director 2005 2004
E Bradley 47 000 47 000
Non�redeemable, non�cumulative, non�participating preference shares2
Direct beneficial1 Indirect beneficial1 Indirect non�beneficial1
Director 2005 2004 2005 2004 2005 2004
DDB Band – – 9 406 9 406 – –
E Bradley – – 1 559 1 559 30 000 30 000
DE Cooper – – – – 1 140 1 140
T Evans – 7 817 – – – –
TS Gcabashe 863 – – – – –
SJ Macozoma 1 140 1 140 – – – –
JH Maree 1 559 1 559 – – 1 279 1 279
Adv KD Moroka 1 000 1 000 – – – –
MJD Ruck 1 559 1 559 – – – –
Total 6 121 13 075 10 965 10 965 32 419 32 419
1Defined as per requirements of the JSE Limited.
2Second preference shares.
No directors, other than disclosed above, have preference share holdings.
No director owns, directly or indirectly more than 1% of the total issued share capital of the company. The company has not been informed
of any changes in these holdings at the date of this report.
Equity compensation plans
Information on options granted to executive directors under the equity compensation plans is given in the remuneration review on
page 44. Details of options granted to all employees under the equity compensation plans are given in Annexure E on page 200.
Directors’ emoluments
Directors’ emoluments are disclosed on page 163. Information relating to the determination of directors’ emoluments, share option
allocations and related matters are contained in the remuneration review commencing on page 37.
Shareholder analysis
The analysis of ordinary shareholders is given on page 220.
Shareholders at the close of the financial year, holding beneficial interests in excess of 5% of the issued share capital, determined from
the share register and investigations conducted on our behalf, were as follows:
% heldPublic Investment Corporation 12,95
Old Mutual Group 11,15
Distribution to ordinary shareholders
Interim
On 17 August 2005, an interim dividend of 122,0 cents per share (2004: 50,5 cents) was declared to shareholders recorded at the close
of business on 16 September 2005 and paid on 19 September 2005.
Final
On 8 March 2006, a final dividend of 145,0 cents per share (2004: 181,0 cents) was declared to shareholders recorded at the close of
business on 13 April 2006 and to be paid on 18 April 2006.

Standard Bank Group annual report 2005 P • 96
Directors’ report for the year 31 December 2005 continued
Distribution to preference shareholders
6,5% first cumulative preference shares
On 17 August 2005, a dividend of 3,25 cents per share (2004: 3,25 cents) was declared to shareholders recorded at the close of business
on 9 September 2005 and paid on 12 September 2005.
On 8 March 2006, a dividend of 3,25 cents per share (2004: 3,25 cents) was declared to shareholders recorded at the close of business
on 7 April 2006 and to be paid on 10 April 2006.
Non�redeemable, non�cumulative, non�participating preference shares
On 17 August 2005, a dividend of 374,74 cents per share was declared to shareholders recorded at the close of business on 9 September
2005 and paid on 12 September 2005.
On 8 March 2006, a dividend of 370,52 cents per share (2004: 379,34 cents) was declared to shareholders recorded at the close of
business on 7 April 2006 and to be paid on 10 April 2006.
Directorate
The directorate is listed on page 218.
The following changes in directorate have taken place since the last annual report:
Standard Bank Group LimitedAppointmentsDr MA Ramphele as director 17 March 2005
SE Jonah KBE as director 1 February 2006
RetirementsRA Plumbridge as director 25 May 2005
Dr CL Stals as director 25 May 2005
ResignationT Evans as director 8 March 2006
The Standard Bank of South Africa LimitedAppointmentsDr MA Ramphele as director 17 March 2005
SP Ridley as director 5 August 2005
SE Jonah KBE as director 1 February 2006
RetirementsRA Plumbridge as director 25 May 2005
Dr CL Stals as director 25 May 2005
ResignationsMJD Ruck as director 5 August 2005
T Evans as director 8 March 2006
Standard Bank Plc AppointmentsME Austen as director 4 November 2005
BJ Kruger1 as deputy chairman 10 November 2005
HE Staunton as director 1 December 20051Previously alternate to MJD Ruck.
ResignationsRM Mansell-Jones as director 5 May 2005
WS Dorson as director 1 June 2005
D Feld as director 1 June 2005
IG Gibson as director 1 June 2005
NJ Holden as director 1 June 2005
JMK Pearson as director 1 June 2005
MJ Wilde as director 1 June 2005

Standard Bank Group annual report 2005 P • 97
Liberty Holdings LimitedResignationsMJD Ruck as chief executive and director 12 December 2005
AWB Band as director 12 December 2005
Prof L Patel as director 12 December 2005
Dr SP Sibisi as director 12 December 2005
Liberty Group LimitedResignationMJD Ruck as chief executive and director with effect from 31 May 2006
Group secretary and registered office
The group secretary is Loren Wulfsohn. The address of the group secretary is that of the registered office, 9th floor, Standard Bank Centre,
5 Simmonds Street, Johannesburg, 2001.
Restructurings and acquisitions during the year
Capital Alliance Holdings Limited (CAHL)
On 1 December 2004, Liberty Group Limited (Liberty Life) announced its proposed acquisition of CAHL, a South African life insurance
group listed on the JSE Limited. In terms of the proposal, Liberty Life made an offer to acquire, for an amount of R3 billion, 98% of the
issued share capital of CAHL. This deal was completed in April 2005. On 30 January 2006, Liberty Life announced the sale of Prefsure
Holdings Limited (Prefsure), CAHL’s Australian life insurance business to Tower Limited for AUS$145 million. The decision to dispose of
Prefsure is in line with Liberty Life’s stated intention of focusing on the domestic life assurance market for the foreseeable future. The
agreement is subject to certain conditions precedent including, inter alia, regulatory approval from the South African Reserve Bank. Should
the conditions precedent be met, it is expected that the net amount to be received by Liberty Life will be approximately AUS$84 million.
Liberty Ermitage Jersey Limited
Liberty Life is currently under negotiations regarding the possible sale of Liberty Ermitage, Liberty Life’s offshore hedge fund asset
manager. Further details can be found in Liberty Life’s 2005 annual report.
Integrated Processing Solutions
Given the declining volume of cheques in the market, Standard Bank entered into a joint venture with ABSA during January 2005, in a bid
to capitalise on the benefits of economies of scale. Under the terms of the agreement, a new company, Integrated Processing Solutions
(Proprietary) Limited (IPS), was formed with the purpose of combining the cheque clearing facilities of both banks. In addition to purchasing
50% of the share capital of IPS, Standard Bank transferred certain assets and resources to the joint venture.
Andisa Capital
On 14 April 2005, Standard Bank announced its intention to acquire a majority interest in Andisa Capital (Proprietary) Limited (Andisa
Capital), from a consortium led by Andisa Capital’s former chief executive, Ronnie Ntuli. In terms of the transaction, Standard Bank and
Safika increased their respective shareholdings in Andisa Capital while Ntuli (through the Nduna Trust) and Simeka Investment Holdings
(Proprietary) Limited (Simeka) reduced their shareholdings in Andisa Capital. At the same time, control of the existing private equity
business of Andisa Capital was transferred to the Nduna Trust and Simeka with Standard Bank and Safika retaining a minority stake. Standard
Bank’s interest in Andisa Capital increased from 49% to 77%. This transaction was approved by the Competition Tribunal in October 2005.
Safika
On 20 June 2005, Standard Bank acquired a 20% shareholding in Safika, a prominent empowerment company. The acquisition of this
holding was strategic in nature. This transaction was approved by the Competition Tribunal on 16 May 2005. On 25 October 2005 Standard
Bank sold a 5% shareholding in Safika to Liberty Life.
Argentina
ING
On 22 July 2005 an agreement was signed with ING Bank N.V. to acquire the operating infrastructure of its branch in Argentina. To this
end, Standard Bank Argentina S.A., with capital of approximately USD25 million, is in the process of being established as a licensed bank,
and is expected to become operational in March 2006.
BankBoston
On 15 December 2005, an agreement was signed with Bank of America N.A. to acquire the activities of BankBoston N.A.’s Argentine
Branch. This transaction is consistent with the group’s strategy of increasing its emerging market operations, and is subject to fulfilment of
provisions of the agreement and obtaining the necessary regulatory approvals. Subject to these, the acquisition is expected to be
completed in the second half of 2006.

Directors’ report for the year 31 December 2005 continued
MTN Mobile Money Holdings
On 10 August 2005, Standard Bank announced its intention to create a joint venture with MTN Group, and MTN Mobile Money Holdings
(Proprietary) Limited (MMMH) was formed. The joint venture will leverage the convergence of cellular technology and banking products
and services to create accessible low-cost banking, especially to the historically disadvantaged. A cash injection was made by both Standard
Bank and MTN Group to the joint venture.
Barclaycard joint venture
Following completion of the acquisition of a majority stake in ABSA Group Limited by Barclays Bank Plc (Barclays), it became necessary to
terminate the credit card collaborative venture between Standard Bank and Barclays (acting through its division Barclaycard International),
which commenced in August 2003. The early termination was concluded on 18 August 2005, and it was agreed that, amongst other
provisions, Standard Bank will increase its participation in the net assets of the collaborative venture (approximately 375 000 credit cards
and R1,55 billion outstanding balances) from 50% to 100%, and the existing Barclaycard customers will be re-issued with a Standard Bank
branded card.
Edcon
On 23 August 2005, Standard Bank entered into an agreement with Edcon Group Limited (Edcon) to offer eligible Edcon customers an
Edgars or Jet branded MasterCard Credit Card. The Edcon Co-Brand Card Programme is run in the Bluebean division of Standard Bank. The
bank also manages the programme, with Edcon contributing qualifying customer details on an agreed basis. Eligible customers are those
current Edcon store card holders who have a proven history of managing their finances. The initial roll-out of these cards took place in
August 2005.
RCSIH
On 29 August 2005, Standard Bank acquired an initial 25% of RCS Investment Holdings (RCSIH) for R358 million with an option to acquire
a further 20%. RCSIH is the financial services division of the Foschini Group, a major fashion retailer.
Stanbic Bank Nigeria
The Central Bank of Nigeria implemented new minimum capital requirement regulations, effective 1 January 2006, of N25 billion
(USD189 million). In order to comply with the new regulations and maintain a presence in this important market, Standard Bank injected
approximately USD185 million capital into Stanbic Bank Nigeria during December 2005.
Management by third parties
None of the businesses of the company or its subsidiaries had, during the financial year, been managed by a third party or a company in
which a director had an interest. Up to 31 December 2004, a company in which Doug Band, a director of Standard Bank Group, has a
beneficial interest, provided consulting and certain management services to the capital investment division of Standard Bank. In terms of
the agreement, he will receive a performance related share of the profit on the sale of equity-related interests in future years. Further
details can be found in the directors’ emoluments disclosure on page 42.
Subsidiaries, associates and joint ventures
The interests in subsidiaries, and in associates and joint ventures, where considered material in the light of the group’s financial position
and results, are set out in Annexure C on page 194, and Annexure D on page 198 respectively.
Special resolutions during the year
Group companies passed the following special resolutions during the year for the purposes indicated:
Amendments to memorandum and articles of association:
Increase in the authorised share capital:
– Banco Standard de Investimentos S.A.;
– ZAO Standard Bank;
– Stanbic Africa Holdings Limited; and
– Stanbic Bank Nigeria Limited.
Name changes:
– Standard Bank London Limited to Standard Bank Plc;
– Standard Resources Limited to Standard Debt Finance Plc;
– SBIC International Limited to Standard Bank Group International Limited;
– Main Street 240 (Proprietary) Limited to MTN Mobile Money Holdings (Proprietary) Limited;
– Mogwele Trading 130 (Proprietary) Limited to Integrated Processing Solutions; and
– To change the Chinese name of Standard Bank Asia Limited.
Standard Bank Group annual report 2005 P • 98

Authorise the acquisition of shares by the company or a subsidiary:
– Standard Bank Group Limited;
– Liberty Group Limited;
– Liberty Holdings Limited; and
– Capital Alliance Investment Holdings (Proprietary) Limited.
Other:
– Standard Bank Plc:
Re-registered as a public company;
– Standard Bank Asia Limited:
Amendment to the articles of association to authorise the company to purchase its own shares (including any redeemable shares);
– Stanbic Africa Holdings Limited:
Amendment to the articles of association to authorise the creation of non-cumulative, redeemable preference shares and the issue of
shares to SML Limited;
– Standard Debt Finance Plc:
Amendments to the memorandum and articles of association to allow for the company to re-register as a public company;
– Stanbic Finance Zimbabwe Limited:
To wind up the company in terms of section 242(b) of the Act; and
– Stanbic Bank Nigeria Limited:
Approval of a rights issue.
Contracts
Saki Macozoma, a director of the group, has a shareholding of 20% in Safika, which is a member of three different consortia that were
party to the Andisa, Stanlib and Tutuwa transactions. Safika holds effective interests of 23,4% of Andisa Capital, 12,85% of Stanlib, 2,23%
of Liberty Group and 1,78% of Standard Bank Group. The group has an effective interest of 16,5% in Safika.
Cyril Ramaphosa, a director of the group, has a 35,9% shareholding in Shanduka, which is a member of the Tutuwa consortium. Shanduka
holds an effective interest of 1,48% of Liberty Group and 1,19% of Standard Bank Group. The group holds an effective interest of 15,3%
in Shanduka.
In January 2006, Standard Bank advanced a loan to Circle Capital Ventures (Proprietary) Limited (Circle Capital Ventures). A portion of the
loan is convertible into 15% of the issued share capital of Circle Capital Ventures. Mamphela Ramphele, chairman of this group, has a
37,45% shareholding in this company.
Insurance
The group protects itself against banker’s comprehensive crime and professional indemnity by maintaining a comprehensive insurance
programme.
Events subsequent to balance sheet date
There is no material fact or circumstance that has occurred between the balance sheet date and the date of this report.
Standard Bank Group annual report 2005 P • 99

Balance sheet at 31 December 2005
Standard Bank Group annual report 2005 P • 100
Group
2005 2004
Note Rm Rm
AssetsCash and balances with banks 3 70 852 37 842
Short-term negotiable securities 4 30 313 21 461
Derivative assets 5 100 188 124 236
Trading assets 6 38 446 32 438
Investments 7 153 404 118 677
Loans and advances 8 334 128 258 873
Current and deferred taxation 9 990 1 094
Other assets 10 13 003 17 223
Disposal groups held for sale 30 2 380 –
Interest in associates and joint ventures 11 4 985 3 250
Goodwill and other intangible assets 12 2 453 965
Property and equipment 13 4 536 4 114
Total assets 755 678 620 173
Equity and liabilities
Equity 39 964 38 533
Equity attributable to ordinary shareholders 32 931 29 064
Ordinary share capital 14 135 135
Ordinary share premium 14 2 107 2 541
Reserves 30 689 26 388
Preference share capital and premium 14 2 991 2 991
Minority interest 4 042 6 478
Liabilities 715 714 581 640
Derivative liabilities 5 98 826 116 214
Trading liabilities 15 21 462 14 410
Deposit and current accounts 16 412 462 322 477
Current and deferred taxation 17 6 926 4 812
Other liabilities 18 21 292 16 074
Disposal groups held for sale 30 1 267 –
Policyholders’ liabilities 19 140 835 97 993
Subordinated bonds 20 12 644 9 660
Total equity and liabilities 755 678 620 173

Income statement for the year ended 31 December 2005
Standard Bank Group annual report 2005 P • 101
Group
2005 2004
Note Rm Rm
Income from banking operations 29 705 26 536
Net interest income 12 987 11 492
Interest income 23.1 38 697 35 247
Interest expense 23.2 25 710 23 755
Non-interest revenue 23.3 16 718 15 044
Income from life insurance operations 51 127 32 311
Net insurance premiums 23.4 18 979 12 406
Investment income and gains 23.5 30 982 18 830
Management and service fee income 1 166 1 075
Total income 80 832 58 847
Credit impairment charges 23.6 1 207 1 050
Benefits due to policyholders 41 004 24 809
Net insurance benefits and claims 32 816 19 115
Fair value adjustment to policyholders’ liabilities under investment contracts 6 834 4 666
Fair value adjustment on third party fund interests 1 354 1 028
Income after credit impairment charges and policyholders’ benefits 38 621 32 988
Operating expenses in banking operations 16 817 15 384
Staff costs 23.7 9 613 8 610
Other operating expenses 23.8 7 204 6 774
Operating expenses in life insurance operations 7 222 4 684
Acquisition costs – insurance and investment contracts 3 594 1 920
Other operating expenses 23.8 3 628 2 764
Net income before goodwill 14 582 12 920
Goodwill impairment 23.9 421 48
Net income from banking and insurance 14 161 12 872
Income from associates and joint ventures 11 226 127
Net income before indirect taxation 14 387 12 999
Indirect taxation 25.1 778 651
Profit before direct taxation 13 609 12 348
Direct taxation 25.2 4 312 3 276
Profit for the year 9 297 9 072
Attributable to minorities 639 1 388
Attributable to preference shareholders 226 –
Attributable to ordinary shareholders 8 432 7 684
Earnings per share (cents) 28 699,7 581,4
Fully diluted earnings per share (cents) 28 668,4 571,3
Dividends per share (cents) 26 267,0 231,5

Statement of changes in shareholders’ funds for the year ended 31 December 2005
Ordinary
share Hedge Statutory
capital Empower� Trans� of net credit
and ment lation investment risk
premium reserve reserve reserve reserve
Note Rm Rm Rm Rm Rm
Balance at 1 January 2004 as previously reported 2 407 413 68 –
Adjustment on adoption of IFRS Annexure A 2
Restated balance at 1 January 2004 2 407 413 68 2
Currency translation movement and hedging (1 360) 88
Increase in statutory credit risk reserve 1
Fair value adjustments
Financial instrument reclassifications
Realised fair value adjustments recycled to the income statement
Impairment resulting from Tutuwa initiative 21 (4 360)
Unrecognised profit on sale of subsidiary shares 21 114
Increase in minorities resulting from acquisitions
Issue of share capital and share premium 269
Share issue and repurchase costs
Equity-settled share-based payment transactions
Other
Attributable earnings for the year
Net dividends paid
Balance at 31 December 2004 2 676 (4 246) (947) 156 3
Balance at 1 January 2005 2 676 (4 246) (947) 156 3
Adjustment on adoption of IFRS Annexure A
Restated balance at 1 January 2005 2 676 (4 246) (947) 156 3
Currency translation movement and hedging 626 (229)
Increase in statutory credit risk reserve 23
Fair value adjustments
Realised fair value adjustments recycled to the income statement
Net decrease in treasury shares
Change in shareholding of subsidiaries
Increase in minorities resulting from acquisitions
Issue of share capital and share premium 246
Share buy-backs (677)
Share issue and repurchase costs (3)
Equity-settled share-based payment transactions
Other
Attributable earnings for the year
Net dividends paid
Dividends paid to equity holders 26
Dividends received from Tutuwa initiative and policyholders’
deemed treasury shares
Balance at 31 December 2005 2 242 (4 246) (321) (73) 26
All balances are stated net of applicable tax.
Standard Bank Group annual report 2005 P • 102

Standard Bank Group annual report 2005 P • 103
Available� Preference
for� Re� Share� Ordinary share
Cash flow sale valuation based share� capital
hedging revaluation and other Treasury payment Retained holders’ and Minority Total
reserve reserve reserves shares reserve earnings funds premium interest equity
Rm Rm Rm Rm Rm Rm Rm Rm Rm Rm
44 484 224 25 195 28 835 8 6 421 35 264
93 23 (209) (91) (5) (96)
44 484 317 23 24 986 28 744 8 6 416 35 168
(1 272) (103) (1 375)
(1) – –
(5) 138 133 369 502
24 24 24
(123) (7) (130) (109) (239)
(4 360) (908) (5 268)
114 94 208
6 6
269 3 000 138 3 407
(57) (57) (17) (16) (90)
70 70 14 84
(5) (5) (14) (19)
7 684 7 684 1 388 9 072
(2 150) (2 150) (797) (2 947)
39 499 305 93 30 486 29 064 2 991 6 478 38 533
39 499 305 93 30 486 29 064 2 991 6 478 38 533
(399) (354) (148) (901) (2 756) (3 657)
39 100 305 (354) 93 30 338 28 163 2 991 3 722 34 876
397 (21) 376
(28) 5 – –
(140) 126 (14) (14)
18 (64) (46) (46)
(171) 180 9 197 206
(288) (288)
– 161 161
246 71 317
(677) (677)
(3) (3)
160 160 31 191
21 (10) 11 18 29
8 432 8 432 226 639 9 297
(3 747) (3 747) (226) (488) (4 461)
(4 107) (4 107) (226) (649) (4 982)
360 360 161 521
(83) 162 298 (525) 253 35 198 32 931 2 991 4 042 39 964

Cash flow statement for the year ended 31 December 2005
Standard Bank Group annual report 2005 P • 104
Group
2005 2004
Note Rm Rm
Operating activities
Cash receipts from customers 29.2 83 535 72 393
Cash paid to customers, employees and suppliers 29.3 (67 527) (58 330)
Dividends received 29.4 3 012 2 487
Net cash flows from operating activities 29.1 19 020 16 550
Changes in operating funds
Increase in income-earning assets 29.5 (58 829) (48 374)
Increase in deposits and other liabilities 29.6 89 143 51 784
Net cash flows from operating funds 30 314 3 410
Taxation paid 29.7 (2 419) (2 883)
Investing activities
Capital expenditure on – property (395) (147)
– equipment, furniture and vehicles (1 054) (1 094)
– intangible assets (203) (142)
Proceeds from sale of – property 124 130
– equipment, furniture and vehicles 187 194
Net (purchase)/sale of investment properties (709) 338
Proceeds from sale of shares in business operations – 26
Net increase in investments by insurance operations (682) (1 196)
Net disposal of reinsurance assets and other investments 73 654
Net cash (paid)/received on acquisition of subsidiaries 29.8 (1 771) 1 688
Increase of investments in existing subsidiaries (526) –
Investment in associates (421) –
Net cash flows (used in)/from investing activities (5 377) 451
Financing activities
Proceeds from issue of share capital to shareholders 245 3 252
Net proceeds from issue and repurchase of share capital to minorities 22 93
Repurchase of company shares (679) –
Repayment of convertible debentures – (1 541)
Net Tutuwa transaction payment – (4 885)
Tutuwa transaction payment – (5 341)
Proceeds received by Liberty Holdings – 456
Increase in subordinated bonds 2 966 2 627
Dividends paid 29.9 (4 461) (2 947)
Net cash flows used in financing activities (1 907) (3 401)
Effects of exchange rate changes on cash and cash equivalents 2 368 (4 402)
Net increase in cash and cash equivalents 41 999 9 725
Cash and cash equivalents at beginning of the year 59 303 49 578
Reclassified to disposal groups held for sale 30 (137) –
Cash and cash equivalents at end of the year 29.10 101 165 59 303

Accounting policies
Standard Bank Group annual report 2005 P • 105
The principal accounting policies applied in the presentation of the
financial statements are set out below.
1 Basis of presentation
These consolidated financial statements are prepared in
accordance with, and comply with International Financial
Reporting Standards (IFRS) and the South African
Companies Act of 1973. The consolidated financial
statements are prepared in accordance with the going
concern principle under the historical cost basis as modified
by the revaluation of financial instruments classified as
available-for-sale, financial assets and liabilities held at fair
value through profit or loss, derivative instruments and
investment properties.
The accounting policies are consistent with those adopted in
the previous year, except for changes made as a result of the
adoption of IFRS. The revised IFRS policies have been
consistently applied to both years presented with the
exception of policies where the group elected to apply IFRS
with effect from 1 January 2005 as described below.
The key principle of IFRS 1 – First-time Adoption of
International Financial Reporting Standards is full
retrospective application of IFRS but this statement provides
exemptions from retrospective application in certain
instances. The group’s transitional elections are set out below:
Elections applicable 1 January 2004
• Business combinations: The group elected not to
retrospectively apply the requirements of IFRS 3 for
business combinations that occurred prior to 1 January
2004. As a result, the carrying amount of goodwill is the
amortised amount on 31 December 2003, and previously
amortised goodwill and goodwill eliminated against
reserves were not reinstated.
• Property, equipment and intangible assets: A first-time
adopter may elect to use the fair value of individual
property, equipment and intangible assets at transition
date as the deemed cost. The group did not make use of
this transitional exemption and elected to measure
individual items of property, equipment and intangible
assets at depreciated cost determined in accordance with
IFRS.
• Employee benefits: The group elected not to apply the
exemption to account for all deferred actuarial gains or
losses, including a 10% tolerance limit for differences in
actuarial assumptions, in opening equity as at 1 January
2004. This exemption was not elected as the group’s
accounting policy for employee benefits under previous
South African Generally Accepted Accounting Practice
(SA GAAP) was already substantially in compliance with
IAS 19 – Employee Benefits. After consideration of
retrospective application of IAS 19 on adoption of IFRS,
no adjustments were required.
• Cumulative foreign currency translation adjustment: The
cumulative foreign currency translation reserve existing on
transition to IFRS has been retained and the option to reset
the reserve to zero was not elected as the group’s
accounting for translation adjustments under previous SA
GAAP was already substantially in compliance with IAS 21 –
The Effects of Changes in Foreign Exchange Rates. After
consideration of retrospective application of IAS 21, no
adjustments were required.
• Share-based payments: The group elected not to apply
the provisions of IFRS 2 – Share-based Payments to
equity-settled awards granted on or before 7 November
2002, or to awards granted after that date but which had
vested prior to 1 January 2005.
Elections applicable 1 January 2005
• Comparative numbers restated for financial instruments
and insurance contracts: The group elected the
exemption not to restate its comparatives for IAS 32 –
Financial Instruments: Disclosure and Presentation,
IAS 39 – Financial Instruments: Recognition and
Measurement and IFRS 4 – Insurance Contracts. The
group has therefore applied SA GAAP applicable as at
31 December 2004 to financial instruments and
insurance contracts in its 2004 numbers disclosed as
comparatives for the 2005 IFRS results.
• Designation of financial assets and financial liabilities in
terms of IAS 39: In terms of the transitional arrangements
the group elected the option to reclassify certain financial
assets and liabilities. These reclassifications were not
material.
There are no changes to estimates made under previous
SA GAAP for transition to IFRS. Where estimates have
previously been made under SA GAAP, consistent estimates
(after adjustments to reflect any difference in accounting
policies) have been made at the same date.
Primary differences between SA GAAP applicable at31 December 2004 and IFRS
The primary differences between SA GAAP and IFRS are set
out on the next page and the quantification of the
restatements and opening reserve adjustments, following the
adoption of IFRS, are set out in Annexure A.

Standard Bank Group annual report 2005 P • 106
Accounting policies continued
Accounting policies before adoption of IFRS Accounting policies adopted for IFRS
Elimination of treasury shares
Shares held in group companies for the benefit of
policyholders are now treated as treasury shares for
accounting purposes. The cost of treasury shares acquired is
eliminated against equity. The elimination of the cost of the shares
is split between shareholders’ equity and minorities based on the
effective interest of the group’s shareholding in the equity of the
subsidiary company where the shares are accounted for. No fair
value movements on treasury shares are recognised in the income
statement. The corresponding fair value movements on
policyholders’ liabilities relating to these shares are however
recognised in the income statement and not eliminated.
In calculating earnings per share the weighted number of shares
are reduced by the total number of treasury shares within the
group and not only the portion relating to ordinary shareholders.
This treatment is required in terms of IAS 33.
Impairment for credit losses
Impairment for credit losses on performing loans is now
based on an incurred loss model and estimated future
cash flows are discounted using the original effective
interest rate inherent in the loan, including the credit
premium.
Origination fees received on financial assets
All origination fees received on financial assets are now
accounted for as part of the carrying value of the
financial asset and recognised in income by adjusting
the effective interest rate over the term of the financial asset.
Equity-linked transactions
Equity-linked instruments issued after 7 November
2002 that have not vested by 31 December 2004 are now
accounted for at the fair value of the instruments granted
and expensed over the vesting period of the instruments.
Goodwill
Goodwill arising on acquisitions after 31 December 2003
and the carrying values of goodwill that existed at this date
are not amortised, but allocated to cash generating units
and tested annually for impairment.
Depreciation of buildings and equipment
The residual values of buildings and equipment are now
reassessed at each balance sheet date. Depreciation ceases
when the carrying value of the asset equals the residual value. The
carrying values that were previously fully depreciated have been
partially reinstated to reflect the residual value at the time when
the carrying value equalled the revalued residual value.
Shares held in group companies to cover obligations to
policyholders in the group’s insurance operation were disclosed
as part of investments. Fair value changes on these shares
were accounted for in the income statement.
Impairment for credit losses on performing loans was based on
an expected loss model. In terms of this model expected future
cash flows were discounted using the effective interest rate
excluding the credit premium inherent in the contract.
Some origination fees received, including documentation and
assessment fees, were previously accounted for as income
when the related origination services were performed. Where
origination fees were deferred it was generally brought to
income on a straight-line basis.
Equity-linked instruments issued in terms of the group’s equity
compensation plans and the Tutuwa initiative were accounted
for at the value of the cash consideration received, when the
cash was received.
Goodwill arising on the acquisition of subsidiaries, associates or
joint ventures occurring on or after 1 January 2000 was
capitalised and amortised over its estimated useful life.
Goodwill arising on acquisitions before 1 January 2000 was
accounted for in equity.
Depreciation of buildings and equipment
Buildings and equipment were previously depreciated on a
straight-line basis to their estimated residual values. These
residual values were fixed at the date of acquisition and not
reassessed annually.

Standard Bank Group annual report 2005 P • 107
Accounting policies before adoption of IFRS Accounting policies adopted for IFRS
Profit on initial recognition
Unquoted financial instruments are now recognised at fair
value on initial recognition. Any profit or loss on initial
recognition, calculated based on valuation models that include
unobservable market data, is deferred and recognised on a
straight-line basis over the life of the instrument. Any profit or loss
on initial recognition, based only on observable market data, is
recognised immediately.
Deferred acquisition costs (DAC) on investment contracts
Commissions paid and other acquisition costs are incurred when
new investment contracts are obtained or existing investment
contracts renewed. These costs, if attributable to a specific contract,
are deferred and amortised over the expected life of the contract. A
DAC balance is recognised for all applicable policies with the
amortisation being calculated on a portfolio basis.
An impairment test is conducted annually on the DAC balance to
ensure that the amount will be recovered from future revenue
from the applicable remaining investment contracts.
Deferred revenue liability on investment contracts
A deferred revenue liability is recognised when initial fees, which
are directly attributable to an investment contract, are charged for
securing the management service responsibility. The liability is
recognised as revenue over the expected duration of the services
to be provided.
Classification of insurance and investment contracts
The group issues contracts that transfer insurance risk or
financial risk or, in some cases, both. Insurance contracts are
those contracts that transfer significant insurance risk, which
can be defined as the possibility of having to pay benefits on the
occurrence of an insured event that are at least 10% more than
the benefits payable if the insured event did not occur.
All contracts that do not fall within the definition of an insurance
contract have been classified as investment contracts and
measured at fair value through profit or loss under IAS 39.
Consolidation of mutual funds
Mutual funds, in which the group has a greater than 50%
economic interest, have been consolidated. The consolidation
principles as contained in the existing basis of consolidation
accounting policy have been applied.
Straight-lining of leases
Lease payments with fixed escalation clauses are recognised on
a straight-line basis over the term of the lease.
Deferred tax on present value of in-force (PVIF) business and
investment properties
The PVIF is based on pre-tax cash flows with a corresponding
deferred tax liability recognised.
Deferred tax is now raised on a blended rate based on the
expected method of use and is accounted for as a reduction of
policyholders’ liabilities.
Unquoted financial instruments acquired were previously
recognised at cost and any profit or loss on remeasurement to
fair value based on valuation models was accounted for on the
date of remeasurement.
Commission expense was recognised upfront when it was paid.
Service fees were recognised upfront when received.
Policyholder contracts that do not transfer significant insurance
risk are classified in the financial statements at fair value, with
changes in fair value being accounted for in the income
statement.
Not consolidated under SA GAAP.
Lease income was previously recognised based on the amount
accrued in terms of the lease agreement. Lease income and
expenses were only spread for balloon payments.
The carrying value of PVIF was based on after-tax cash flows.
Deferred tax on investment properties was previously raised at
the capital gains tax rate, being the tax payable on sale of
investment properties.

Standard Bank Group annual report 2005 P • 108
Due to the specialised nature of banking and life insurance
businesses, the accounting policies appropriate to each
business, where required, are separately detailed below.
2 Basis of consolidation
The financial statements of subsidiaries are consolidated
from the date on which the group acquires effective control,
up to the date that such effective control ceases. For this
purpose, subsidiaries are companies over which the group,
directly or indirectly, has the power to govern the financial
and operating policies to obtain the benefits from its
activities. The existence and effect of potential voting rights
that are currently exercisable or convertible are considered
when assessing whether the group controls another entity.
Special purpose entities, including securitisation vehicles,
are consolidated when the substance of the relationship
between the group and the special purpose entity indicates
that the group effectively controls the entity.
Mutual funds in which the group has more than 50%
economic interest or control are consolidated.
The purchase method of accounting is used to account for
the acquisition of subsidiaries. The cost of an acquisition is
measured as the fair value of the assets given, equity
instruments issued and liabilities incurred or assumed at the
date of exchange, plus costs directly attributable to the
acquisition. Identifiable assets acquired and liabilities and
contingent liabilities assumed in a business combination are
measured initially at their fair values at the acquisition date,
irrespective of the extent of any minority interest. The
excess of the cost of an acquisition over the fair value of
identifiable net assets acquired is recorded as goodwill and
accounted for in terms of accounting policy 14. Negative
goodwill arising on acquisition is recognised directly in the
income statement.
Inter-company transactions, balances and unrealised gains
and losses within banking and insurance operations are
eliminated on consolidation. Equity instruments of group
entities held by subsidiaries are classified as treasury shares
and accounted for in terms of accounting policy 23.
Accounting policies of subsidiaries conform to the policies
adopted by the group for its banking and insurance
operations.
Investments in subsidiaries and associates are accounted for
at cost in the company accounts. The carrying amounts of
these investments are reviewed annually and written down
for impairment where considered necessary.
3 Foreign currency translations
Functional and presentation currency
Items included in the financial statements of each of the
group’s entities are measured using the currency of the
primary economic environment in which the entity operates
(functional currency). Standard Bank Group’s company and
consolidated functional and presentation currency is rands
and all amounts, unless otherwise indicated, are stated in
millions of rands (Rm).
Group companies
The results and financial position of all foreign operations
(excluding those in hyperinflationary economies) that have a
functional currency different from the group’s presentation
currency are translated into the presentation currency as
follows:
• assets and liabilities are translated at the closing rate on
the balance sheet date; and
• income and expenses are translated at average exchange
rates for the year, to the extent that such average rates
approximate actual rates.
On consolidation, exchange differences arising from the
translation of the net investment in foreign operations, and
of borrowings and other currency instruments designated as
hedges of such investments, are accounted for directly in a
separate component of equity. On disposal of foreign
operations, such exchange differences are recognised in the
income statement as part of the profit or loss on disposal.
Goodwill and fair value adjustments arising on the
acquisition of foreign operations are treated as assets and
liabilities of the foreign operation and translated at closing
rates at balance sheet date.
The revenues and expenses of foreign operations in
hyperinflationary economies are translated to rand at the
foreign exchange rates ruling at the balance sheet date.
Transactions and balances
Foreign currency transactions are translated into the
functional currency using the exchange rates prevailing at
the date of the transactions. Foreign exchange gains and
losses resulting from the settlement of such transactions and
from the translation at year-end exchange rates of monetary
assets and liabilities denominated in foreign currencies, are
recognised in the income statement except when deferred
in equity as qualifying cash flow hedges and qualifying net
investment hedges. Exchange differences on non-monetary
items are accounted for based on the classification of the
Accounting policies continued

Standard Bank Group annual report 2005 P • 109
underlying items. Foreign exchange gains and losses on
equities classified as available-for-sale financial assets are
included in the available-for-sale reserve in equity whereas
the exchange differences on equities held at fair value
through profit or loss are reported as part of the fair value
gain or loss.
4 Cash and cash equivalents
Cash and cash equivalents disclosed in the cash flow
statement consist of cash and balances with banks and short-
term negotiable securities. Cash flows arising from operating
funds are stated after excluding the impact of foreign
currency translation differences on asset and liability classes.
Cash and balances with banks comprise coins and bank notes
and balances with central and other banks. Short-term
negotiable securities are highly liquid investments that are
readily convertible to known amounts of cash and which are
subject to an insignificant risk of changes in value.
5 Short�term negotiable securities, tradingassets and investment securities
Recognition and measurement
Financial assets are held for liquidity, investment, trading or
hedging purposes. All financial assets are initially recognised
at fair value plus transaction costs, except those carried at
fair value through profit or loss. These financial assets
are recognised on the date the group commits to purchase
the assets (trade date) and are derecognised when the
rights to receive cash flows from the financial assets have
expired or where the group has transferred substantially
all the risks and rewards of ownership. Gains or losses
on disposal are determined using the average costing
method.
Classification
Management determines the appropriate classification of
financial assets on acquisition.
Held�to�maturity
Short-term negotiable securities and investment securities
with fixed maturity and fixed or determinable payments,
where management has both the intent and the ability to
hold the securities to maturity, are classified as held-to-
maturity. Were the group to sell more than an insignificant
amount of held-to-maturity assets, the entire category
would be tainted and reclassified as available-for-sale assets
and the difference between amortised cost and fair value
will be accounted for in equity. Financial assets classified as
held-to-maturity by the group are carried at amortised cost,
using the effective interest method, less any provisions for
impairment.
Financial assets at fair value through profit or loss
• Financial assets that the group holds for short-term profit
taking (trading assets) are classified as financial assets at
fair value through profit or loss. Subsequent to initial
recognition, these trading assets are measured at fair
value. All related realised and unrealised gains and losses
arising from the change in fair value are included in
trading revenue under non-interest revenue in the
income statement. Interest earned and dividends
received while holding trading assets at fair value
through profit or loss are included in trading revenue.
• Financial assets that the group designates at inception as
financial assets at fair value through profit or loss are
carried at fair value subsequent to initial recognition. All
income and realised and unrealised gains and losses
arising from the change in fair value of these financial
assets are included in interest income for all dated
financial assets and in other revenue within non-interest
revenue for all undated financial assets. Such
classification is not changed subsequent to initial
recognition.
Available�for�sale
Available-for-sale financial assets are held for an indefinite
period of time and may be sold in response to needs for
liquidity or changes in interest rates, exchange rates or
equity prices. Financial assets that are not classified as loans
and receivables, held-to-maturity or financial assets at fair
value through profit or loss, are classified as available-for-
sale assets and carried at fair value. Unrealised gains or
losses arising from the changes in the fair value of available-
for-sale assets are recognised in equity. On disposal of
available-for-sale assets, the fair value adjustments
accumulated in equity are recognised in the income
statement. Interest, calculated using the effective interest
method, and dividends received on available-for-sale
instruments are recognised directly in the income
statement.
Fair value
The best evidence of the fair value on initial recognition is
the transaction price, unless the fair value is evidenced by
comparison with other observable current market
transactions in the same instrument or based on discounted
cash flow models and option pricing valuation techniques
whose variables include only data from observable markets.

Standard Bank Group annual report 2005 P • 110
Accounting policies continued
When such valuation models, with only observable market
data as input, indicate that fair value differs from cost on
initial recognition, the resulting profit or loss is recognised
immediately. If non-observable market data is used as part
of the input to the valuation models, any resulting profit or
loss is deferred and recognised over the period of the
instrument.
Subsequent to initial recognition, the fair values of financial
assets are based on quoted bid prices, excluding transaction
costs. If the market for a financial asset is not active or the
instrument is an unlisted instrument, the fair value is
estimated using applicable valuation techniques. These
include the use of recent arm’s length transactions,
discounted cash flow analyses, pricing models and valuation
techniques commonly used by market participants.
Where discounted cash flow analyses are used, estimated
future cash flows are based on management’s best
estimates and the discount rate is a market-related rate at
the balance sheet date for a financial asset with similar terms
and conditions. Where pricing models are used, inputs are
based on observable market indicators at the balance sheet
date and profits or losses are only recognised to the extent
that they relate to changes in factors that market
participants will consider in setting a price.
6 Repurchase and resale agreements andlending of securities
Securities sold subject to linked repurchase agreements are
retained in the financial statements as trading or investment
securities and valued in terms of accounting policy 5. The
liability to the counterparty is included under deposit and
current accounts.
Securities purchased under agreements to resell are
recorded as loans granted under resale agreements and
included under loans and advances to other banks or clients
as appropriate.
The difference between the sale and repurchase price is
treated as interest and accrued over the life of the
repurchase agreement using the effective interest method.
Securities lent to counterparties are retained in the financial
statements and are classified and measured in accordance
with accounting policy 5. Securities borrowed are not
recognised in the financial statements unless these are sold
to third parties. In these cases, the obligation to return the
securities borrowed is recorded at fair value as a trading
liability.
Income and expenses arising from the securities borrowing
and lending business are recognised on an accrual basis over
the period of the transactions.
7 Derivative financial instruments
A derivative is a financial instrument whose value changes in
response to an underlying variable, that requires little or no
initial investment and that is settled at a future date. All
derivatives are accounted for as trading instruments unless
they meet the criteria for hedge accounting. Derivatives are
initially recognised at fair value on the date on which the
derivatives are entered into and subsequent to initial
recognition remeasured at fair value as described in
accounting policy 5.
All derivative instruments of the group are carried as assets
when the fair value is positive and as liabilities when the fair
value is negative, subject to offsetting principles as
described in accounting policy 22.
Embedded derivatives included in hybrid instruments are
treated and disclosed as derivatives when their risks and
characteristics are not closely related to those of the host
contract and the host contract is not carried at fair value with
fair value changes recognised in the income statement.
Where separated from the host contracts, embedded
derivatives are accounted for and measured at fair value with
any gains or losses from the change in fair value included in
the income statement. The host contracts are accounted for
and measured applying the rules of the relevant category of
that financial instrument.
8 Hedge accounting
On the date that a derivative contract is designated as a
hedging instrument, the group designates the derivative as
either:
• a hedge of the fair value of a recognised asset or liability
or a firm commitment (fair value hedge); or
• a hedge of a highly probable future cash flow
attributable to a recognised asset or liability or a forecast
transaction (cash flow hedge); or
• a hedge of a net investment in a foreign entity.
A hedging relationship exists where:
• at the inception of the hedge there is formal
documentation of the hedge;
• the hedge is expected to be highly effective;
• the effectiveness of the hedge can be reliably measured;
• the hedge is highly effective throughout the reporting
period; and
• for a hedge of a forecast transaction, the transaction is
highly probable and presents an exposure to variations in
cash flows that could ultimately affect net profit.

Standard Bank Group annual report 2005 P • 111
Hedge accounting requires that the hedging instrument be
measured at fair value. The fair value of a derivative hedging
instrument is calculated in the same manner as the fair value
of a trading instrument.
Fair value hedges
Where a hedge relationship is designated as a fair value
hedge, the hedged item is stated at fair value in respect of
the risk being hedged. Gains or losses on the
remeasurement of both the fair value hedge and the hedged
item are recognised in the income statement. Fair value
adjustments relating to the hedged instrument are allocated
to the same income statement category as the related
hedged item. If the hedge relationship is discontinued on a
hedged debt instrument carried at amortised cost, the fair
value adjustment to the carrying value of the hedged item is
amortised over the debt instrument’s remaining life using
the effective interest rate method.
Cash flow hedges
The effective portion of changes in the fair value of
derivatives that are cash flow hedges are recognised in
equity. The ineffective part of any gain or loss is recognised
in the income statement as trading revenue. Where a
forecast transaction results in the recognition of a non-
financial asset, non-financial liability, income or expense, the
cumulative gains or losses previously deferred in equity are
transferred from equity and included in the initial
measurement of the cost of the non-financial asset, liability,
income or expense. If the hedged transaction subsequently
results in the recognition of a financial asset or financial
liability, the associated gains and losses that were recognised
directly in equity are classified into the income statement in
the same period or periods during which the asset or liability
affects the income statement (i.e. when interest income and
expense is recognised) and into the same income statement
line item.
When a hedging instrument or hedge relationship is
terminated, but the hedged transaction is still expected to
occur, the cumulative gains or losses recognised in equity
remain in equity and are recognised in accordance with the
above policy. If the hedged transaction is no longer
expected to occur, the cumulative gains or losses recognised
in equity are immediately recognised in the income
statement and are classified as trading revenue.
Hedge of a net investment in a foreign entity
Where considered appropriate, the group hedges net
investments in foreign entities using derivative instruments.
For such hedges, the foreign exchange difference arising on
the hedging instrument and relating to the effective portion
of the hedge, is recognised directly in equity. Any ineffective
portion is immediately recognised in the income statement.
On the disposal of a foreign entity, the cumulative gains or
losses relating to the effective portion of the hedge are
recognised in the income statement as part of the profit or
loss on disposal.
9 Policyholder insurance and investmentcontracts
Insurance and investment contract classification
The group issues contracts that transfer insurance risk or
financial risk or both.
An insurance contract is a contract under which the group
(insurer) accepts significant insurance risk from the
policyholder by agreeing to compensate the policyholder if a
specified uncertain future event (the insured event)
adversely affects the policyholder. Such contracts may also
transfer financial risk. The group defines significant
insurance risk as the possibility of having to pay benefits on
the occurrence of an insured event that are significantly
more than the benefits payable if the insured event did not
occur.
Investment contracts are those contracts that transfer
financial risk with no significant insurance risk. Financial risk
is the risk of a possible future change in one or more of a
specified interest rate, financial instrument price,
commodity price, foreign exchange rate, index of prices or
rates, credit rating or credit index or other variable, provided
in the case of a non-financial variable that the variable is not
specific to a party to the contract.
Discretionary participation features (DPF)
A number of insurance and investment contracts contain a
discretionary participation feature (DPF). This feature
entitles the policyholder to receive, as a supplement to
guaranteed benefits, additional benefits or bonuses:
• that are likely to be a significant portion of the total
contractual benefits;
• whose amount or timing is contractually at the discretion
of the group; and
• that are contractually based on:
• the performance of a specified pool of contracts or a
specified type of contract; and/or
• realised and/or unrealised investment returns on a
specified pool of assets held by the group.
The terms and conditions or practice of these contracts set
out the bases for the determination of the amounts on which
the additional discretionary benefits are based (the DPF

Standard Bank Group annual report 2005 P • 112
Accounting policies continued
eligible surplus) and within which the group may exercise its
discretion as to the quantum and timing of their payment to
policyholders. Typically at least 90% of the eligible surplus
must be attributed to policyholders as a group (which can
include future policyholders), while the amount and timing
of the distribution to individual policyholders is at the
discretion of the group, subject to the advice of the
statutory actuary.
Insurance contracts
Measurement
These contracts are valued in terms of the Financial
Soundness Valuation (FSV) basis, on a gross premium
valuation methodology described in Practice Guidance Note
(PGN) 104 issued by the Actuarial Society of South Africa
and the liability is reflected as “Policyholders’ liabilities
under insurance contracts”. PGN 104 is available on the
website of the Actuarial Society of South Africa
(www.assa.org.za).
The liability is based on assumptions of the best estimate of
future experience, plus compulsory margins as required in
terms of PGN 104, plus additional discretionary margins.
Discretionary margins are added so that the shareholders’
participation in profits emerges in the year in which it is
earned. These discretionary margins include an allowance
for the shareholders’ participation in the reversionary and
terminal bonuses expected to be declared each year in
respect of with-profit business, an allowance for the
shareholders’ participation in the bonus expected to be
declared and a portion of the management fees levied under
certain classes of market related business. In addition to the
provision made in the basic reserves, discretionary margins
are held for further possible deviations in risk experience
and in respect of minimum investment guarantees.
Liabilities for individual market related policies where
benefits are dependent on the performance of underlying
investment portfolios (including business with stabilised
bonuses where bonuses were taken at full value) are taken
as the aggregate value of the policies’ investment in the
investment portfolio at the valuation date, reduced by the
excess of the present value of the expected future risk
benefits and expenses on a policy by policy cash flow basis.
Reversionary bonus and the major non-profit classes of
policies are valued by discounting the expected future cash
flows at a market related rate of interest reduced by an
allowance for investment expenses and the relevant
prescribed margins. Future bonuses have been allowed for at
the latest declared rates.
Annuities, other than term certain annuities, are valued by
discounting annuity instalments and expenses at the rate of
return yielded by the matching assets reduced by an
allowance for investment expenses and the relevant
compulsory margin.
Liabilities for group benefit policies (including policies where
bonuses are stabilised) are established as the value of the
policies’ investment in the respective investment portfolios,
including the face value of all bonuses (vested and
unvested) declared up to the balance sheet date.
In respect of insurance contracts with DPF where bonuses
are stabilised, bonus stabilisation reserves are held arising
from the difference between the after-tax investment
performance of the assets net of the relevant management
fees and the value of the bonuses declared.
A reserve for minimum investment return guarantees is
calculated on a stochastic basis in accordance with PGN 110
issued by the Actuarial Society of South Africa. PGN 110 is
available on the website of the Actuarial Society of South
Africa.
The liability calculation methodology and assumptions are
periodically reviewed, with any changes in estimates
reflected in the income statement as they occur.
Outstanding claims provisions
Provision is made in the policyholders’ liabilities under
insurance contracts for the estimated cost of claims
outstanding at the end of the year, including those incurred
but not reported at that date. Outstanding claims and
benefit payments are stated gross of reinsurance.
Embedded derivatives
The group does not separately measure any derivatives
embedded in insurance contracts as they are measured as
part of the insurance contracts.
Liability adequacy test
At each balance sheet date, liability adequacy tests are
performed to ensure the adequacy of the insurance contract
liabilities net of any related intangible PVIF assets. Since the
liability is calculated in terms of the FSV basis, and the FSV
basis meets the minimum requirement of the liability
adequacy test, it is not necessary to perform a liability
adequacy test on the liability component. However it is still
necessary to perform an impairment test on the intangible
PVIF asset. In performing this test the current PVIF in respect
of the acquired book is compared to the intangible PVIF asset.
Any deficiency is immediately charged to profit or loss initially
by writing off the intangible PVIF asset and by subsequently
establishing a provision for losses arising from the liability
adequacy tests (the unexpired risk provision).
Any intangible PVIF asset written off as a result of this test
cannot subsequently be reinstated.

Standard Bank Group annual report 2005 P • 113
Investment contracts
Investment contracts without DPF
The group issues investment contracts without fixed
benefits (unit linked and structured products) and
investment contracts with fixed and guaranteed benefits
(term certain annuity).
Investment contracts without fixed benefits are financial
liabilities whose fair value is dependent on the fair value of
the underlying financial assets, derivatives and/or
investment property (unit linked) and are designated at
inception as fair value through profit or loss.
The fair value at inception and each reporting date is
measured with reference to the designated matching
financial instruments.
The group’s valuation methodologies incorporate all factors
that market participants would consider and are based on
observable market data. The fair value of a unit linked
financial liability is determined using the current unit
price that reflects the fair values of the financial assets
contained within the group’s unitised investment funds
linked to the financial liability, multiplied by the number
of units attributed to the policyholder at the balance
sheet date.
If the investment contract is subject to a put or surrender
option, the fair value of the financial liability is never
less than the amount payable on the put or surrender
option.
For investment contracts with fixed and guaranteed terms,
future benefit payments and premium receipts are
discounted using the rates implied by the government
zero-coupon yield curve at the relevant balance sheet
date. Any adjustments are immediately recognised as
income or expense in the income statement.
Investment contracts with DPF
Within the group all monies invested in investment
smoothed bonus portfolios are classified as investment
contracts with DPF. The classification between investment
and investment contracts with DPF is not done at a contract
level, but at a portfolio level within each contract (i.e. a
contract can have investment without DPF and investment
with DPF component).
For the investment with DPF component, the unit linked
financial liability is taken as the value of units attributable to
the policyholders along with the bonus stabilisation reserve
at the balance sheet date. The bonus stabilisation reserve
represents the difference between the bonus declared and
what is earned on the underlying policyholder assets.
If the investment contract is subject to a put or surrender
option, the value of the financial liability is never less than
the amount payable on the put or surrender option.
Value of business acquired
On acquisition of a portfolio of contracts, either directly from
another insurer or through the acquisition of a subsidiary
undertaking, the group recognises an intangible asset
representing the PVIF. PVIF represents the present value of
future profits embedded in acquired insurance contracts.
The group amortises the cost of PVIF over the effective life
of the acquired contracts on a straight-line basis.
Reinsurance contracts held
Reinsurance contracts are contracts entered into by the
group with reinsurers under which the group is compensated
for the entire or a portion of losses arising on one or more of
the insurance contracts issued by the group.
The benefits to which the group is entitled under its
reinsurance contracts held are recognised as reinsurance
assets. These assets consist of short-term balances due from
reinsurers (classified within other assets) as well as longer-term
receivables (classified as reinsurance assets) that are
dependent on the present value of expected claims and
benefits arising net of expected premiums payable under the
related reinsurance contracts. Amounts recoverable from or
due to reinsurers are measured consistently with the amounts
associated with the reinsured insurance contracts and in
accordance with the terms of each reinsurance contract.
The group reinsurance assets are assessed for impairment. If
there is objective evidence that the reinsurance asset is
impaired, the group reduces the carrying amount of the
reinsurance asset to its recoverable amount and recognises
that impairment loss in the income statement.
Receivables and payables related to insurance
contracts and investment contracts
Receivables and payables are recognised when due. These
include amounts due to and from agents, brokers and
policyholders. If there is objective evidence that the
insurance receivable is impaired, the group reduces the
carrying amount of the insurance receivable accordingly and
recognises that impairment loss in the income statement.
10 Loans and advances
Loans and advances are classified on initial recognition as
loans and receivables or financial assets at fair value through
profit or loss. Loans and advances classified as financial
assets at fair value through profit or loss are accounted for in
terms of accounting policy 5.

Standard Bank Group annual report 2005 P • 114
Accounting policies continued
Loans and advances classified as loans and receivables are
financial assets with fixed or determinable payments that
are not quoted in an active market and include purchased
loans. Loans and receivables are accounted for at amortised
cost using the effective interest method. Origination
transaction costs and origination fees received are capitalised
to the value of the loan and amortised through interest income.
Where the group has elected to classify and account for any
loan as a financial asset at fair value through profit or loss,
the movement in the fair value is accounted for in the
income statement as interest income.
11 Impairment of financial assets
Financial assets are reviewed at each balance sheet date to
determine whether there is objective evidence of
impairment. A financial asset or group of financial assets is
impaired and impairment losses are incurred if there is
objective evidence of impairment, resulting from one or
more loss events that occurred after initial recognition but
before the balance sheet date, that indicates that it is
probable that the group will be unable to collect all
amounts due. The carrying amount of a financial asset
identified as impaired is reduced to its estimated
recoverable amount.
Available�for�sale financial assets
An available-for-sale equity financial instrument is generally
considered impaired if a significant or prolonged decline in
the fair value of the instrument below its cost has occurred.
An available-for-sale debt instrument is impaired if there is
objective evidence of impairment, resulting from one or
more loss events that occurred after initial recognition but
before the balance sheet date, that indicates that it is
probable that the group will be unable to collect all amounts
due. Where an available-for-sale asset, which has been
remeasured to fair value directly through equity, is impaired,
the impairment loss is recognised in the income statement.
If any loss on the financial asset was previously recognised
directly in equity as a reduction in fair value, the cumulative
net loss that had been recognised in equity is transferred to
the income statement and is recognised as part of the
impairment loss. The amount of the loss recognised in the
income statement is the difference between the acquisition
cost and the current fair value, less any previously
recognised impairment loss.
If, in a subsequent period, the amount relating to an
impairment loss decreases and the decrease can be linked
objectively to an event occurring after the write-down,
where the instrument is a debt instrument, the write-down
is reversed through the income statement. An impairment
loss in respect of an equity instrument classified as available-
for-sale is not reversed through the income statement but
accounted for directly in equity.
Loans and receivables
Non-performing loans are impaired for doubtful debts
identified during periodic evaluations of advances. The
impairment to non-performing loans takes account of past
loss experience adjusted for changes in economic conditions
and the nature and level of risk exposure since the recording
of the historic losses. The methodology and assumptions
used for estimating future cash flows are reviewed regularly
to reduce any differences between loss estimates and actual
loss experience.
Retail loans and advances are considered non-performing
when amounts are due and unpaid for three months.
Corporate loans are analysed on a case-by-case basis taking
into account breaches of key loan conditions.
When a loan carried at amortised cost has been identified as
impaired the carrying amount of the loan is reduced to an
amount equal to the present value of expected future cash
flows, including the recoverable amount of any collateral,
discounted at the instrument’s original effective interest
rate. The resulting loss is accounted for as a credit
impairment of a financial asset in the income statement.
Subsequent to impairment, the effects of discounting
unwind over time as interest income.
Impairment of performing loans can only be accounted for if
there is objective evidence that a loss event has occurred
after the initial recognition of the financial asset but before
the balance sheet date. In order to provide for latent losses
in a portfolio of loans that have not yet been individually
identified as impaired, a credit impairment for incurred but
not reported losses is created based on historic loss patterns
and estimated emergence periods. Loans are also impaired
when adverse economic conditions developed after initial
recognition which may impact future cash flows.
Increases in loan impairments and any subsequent reversals
thereof, or recoveries of amounts previously impaired, are
reflected in the income statement. Advances impaired are
written off once all reasonable attempts at collection have been
made and there is no realistic prospect of recovering
outstanding amounts. Any subsequent recoveries or reductions
in amounts previously impaired are accounted for as a reduction
in impairment for credit losses in the income statement.
12 Assets leased to clients and instalmentsale contracts – lessor accounting
Lease and instalment sale contracts are primarily financing
transactions in the banking operations, with rentals and
instalments receivable, less unearned finance charges, being
included in loans and advances on the balance sheet.
Finance charges earned are computed using the net
investment method which reflects a constant periodic return

Standard Bank Group annual report 2005 P • 115
on the investment in the finance lease. Initial direct costs
paid are capitalised to the value of the lease amount
receivable and accounted for over the lease term as an
adjustment to the effective rate of return. The benefits
arising from investment allowances on assets leased to
clients are accounted for in tax.
Leases of assets under which the lessor effectively retains all
the risks and benefits of ownership are classified as
operating leases. Receipts of operating leases from
properties held as investment properties in the group’s
insurance operations are accounted for as income on the
straight-line basis over the period of the lease. When an
operating lease is terminated, any payment required by the
lessee by way of penalty is recognised as income in the
period in which termination takes place.
13 Interest in associates and joint ventures
Associates and jointly controlled entities
An associate is an entity, not being a subsidiary, in which an
investment is held and over whose financial and operating
policies the group is able to exercise significant influence.
Investments in mutual funds in which the group has between
20% and 50% of the economic interest are deemed to be
associates.
A jointly controlled entity is a contractual arrangement that
establishes joint control over the economic activity of an entity.
Interests in associates and jointly controlled entities are
accounted for using the equity method and are carried in the
balance sheet at an amount that reflects the group’s share of
the net assets of the associate or jointly controlled entity and
includes goodwill. Equity accounting involves recognising the
investment initially at cost, including goodwill, and
subsequently adjusting the carrying value for the group’s
share of the associate’s profit or loss for the year, recognised
in the income statement, and other direct reserve
movements. Equity accounting of losses in associates or joint
ventures is restricted to the interests in these entities,
including unsecured receivables or other commitments.
Inter-company profits and losses are eliminated in
determining the group’s share of equity accounted profits.
This method is applied from the date on which the enterprise
becomes an associate, up to the date on which it ceases to be
an associate. Accounting policies of associates and joint
ventures have been changed where necessary to ensure
consistency with the policies of the group.
Where a mutual fund investment is acquired and held for the
purposes of investment activities within the insurance
operations, it is not accounted for under the equity method
but classified as held at fair value through profit or loss and
accounted for on the basis set out in accounting policy 5.
Investments in associates and joint ventures are accounted
for at cost in the investor’s separate financial statements.
Jointly controlled operations
Jointly controlled operations exist where two or more
venturers combine their operations, resources or expertise
to market or distribute jointly a particular product. Each
venturer recognises the assets it controls, the liabilities and
expenses that it incurs, and its share of the income in
respect of its interest in the joint venture.
14 Goodwill
Goodwill represents the excess of the cost of an acquisition
over the fair value of the group’s share of the net assets of
the acquired subsidiary, associate or joint venture at the
date of acquisition. Acquisition costs include any directly
attributable transaction costs.
Goodwill arising on the acquisition of subsidiaries, associates
or joint ventures occurring on or after 1 January 2000, is
reported in the balance sheet as an intangible asset.
Goodwill arising on acquisitions on or after 1 January 2000
but before or on 31 December 2003 has been amortised
using the straight-line method over its estimated useful life
and is carried at cost less any accumulated amortisation
recognised up to 31 December 2003.
Goodwill arising on acquisitions after 31 December 2003
and the carrying values of goodwill that existed on this date
are not amortised, but allocated to cash generating units and
is tested annually for impairment. Cash generating units are
the smallest identifiable groups of assets that generate cash
inflows that are largely independent of cash inflows from
other assets or groups of assets. An impairment loss is
recognised if the carrying amount of a cash generating unit
exceeds its recoverable amount. Negative goodwill is
recognised as income in the period in which it arises. Gains
or losses on the disposal of an entity include the carrying
amount of goodwill relating to the entity sold.
15 Other intangible assets
Computer software
Generally, costs associated with developing or maintaining
computer software programs and the acquisition of software
licences are recognised as an expense as incurred. However,
direct computer software development costs that are clearly
associated with an identifiable and unique system, which will
be controlled by the group and have a probable benefit
exceeding one year, are recognised as intangible assets.
Direct costs include software development employee costs
and an appropriate portion of relevant overheads.

Standard Bank Group annual report 2005 P • 116
Accounting policies continued
Direct computer software development costs recognised as
assets are amortised on the straight-line basis at rates
appropriate to the expected useful lives of the assets (two
to five years), and are carried at cost less any accumulated
amortisation and any accumulated impairment losses. The
carrying amount of capitalised computer software is
reviewed annually and is written down when the carrying
amount exceeds the recoverable amount.
Present value of acquired in�force life insurancebusiness
Where a portfolio of life contracts is acquired, the PVIF
business on the portfolio, being the net present value of
estimated future pre-tax cash flows of the existing contracts,
is recognised as an intangible asset and amortised on a
straight-line basis at rates appropriate to the expected life of
the purchased contracts (five to 15 years). The PVIF is
carried in the balance sheet at cost less any accumulated
amortisation and impairment losses.
16 Fixed assets
Equipment and owner�occupied properties
Equipment, furniture, vehicles and other tangible assets are
stated at historical cost less accumulated depreciation.
Historic cost includes expenditure that is directly
attributable to the acquisition of property and equipment.
Subsequent costs are included in the asset’s carrying
amount or are recognised as a separate asset, as
appropriate, only when it is probable that future economic
benefits will flow to the group and the cost of the item can
be measured reliably. Maintenance and repairs, which do not
meet these criteria, are charged against income as incurred.
Gains or losses on disposal of assets are included in the
income statement.
Owner-occupied properties are held for use in the supply of
services or for administrative purposes.
Property and equipment are depreciated on the straight-line
basis over the estimated useful lives of the assets to the
current values of their expected residual values. The assets’
residual values and useful lives are reviewed, and adjusted if
appropriate, at each balance sheet date and the
depreciation method is reviewed annually.
Freehold buildings, comprising mainly offices and branches,
are generally classified as owner-occupied properties and
accounted for in terms of the cost method. These buildings
are depreciated on the straight-line basis over their
estimated useful lives to the current value of their estimated
residual value. The freehold land portion is not depreciated.
Leasehold buildings are depreciated over the period of the
lease or over such lesser period as is considered appropriate.
The carrying value of assets is reviewed regularly to assess
whether there is any indication of impairment and where the
carrying amounts of assets are greater than their
recoverable amounts, the assets are written down to these
recoverable amounts. The recoverable amount is the greater
of the fair value of the asset less costs to sell or the value in
use. Depreciation and impairment losses are included in the
income statement.
The estimated useful lives of tangible assets are asfollows:
Property – 40 years
Computer equipment – 3 to 5 years
Motor vehicles – 5 years
Office equipment – 5 to 10 years
Furniture and fittings – 5 to 13 years
Capitalised leased assets – over the shorter of the lease
term or its useful life
There has been no change to useful lives from those applied
in the previous financial year.
Investment properties and properties under
development
Investment properties are held to earn rental income and for
capital appreciation.
Investment properties are reflected at valuation based on
open-market fair value at the balance sheet date. If this
information cannot be reliably determined, the group uses
alternative valuation methods such as discounted cash flow
projections or recent prices on active markets. The fair
values are the estimated amounts for which a property could
be exchanged on the date of valuation between a willing
buyer and a willing seller in an arm’s length transaction. The
open-market fair value is determined annually by
independent professional valuators.
Fair value adjustments on investment properties are
included in the income statement as investment returns in
the period in which these gains or losses arise and are
adjusted for any double counting arising from the
recognition of lease income on the straight-line basis
compared to the accrual basis normally assumed in the fair
value determination.
Properties under development are properties not yet
available to earn investment returns or for use. Properties
under development form part of the carrying value of
investment properties. Once development is complete, the
properties are transferred to investment properties or
owner-occupied properties as appropriate. Properties under
development are carried at cost less any required
impairment.

Standard Bank Group annual report 2005 P • 117
17 Financial liabilities
Financial liabilities are recognised initially at fair value,
generally being their issue proceeds net of transaction costs
incurred. Financial liabilities are subsequently stated at
amortised cost and interest is recognised over the period of
the borrowing using the effective interest method.
Preference shares, which carry a mandatory coupon, or are
redeemable on a specific date, at the option of the
shareholder or if dividend payments are not discretionary,
are classified as financial liabilities. All other preference
shares are classified as equity. Dividends on preference
shares classified as financial liabilities are recognised in the
income statement as interest expense on an amortised cost
basis using the effective interest methodology.
The group classifies certain liabilities at fair value through
profit or loss, mainly to match the accounting classification
of assets with similar risks. Such liabilities are accounted for
at fair value with changes in fair value recognised in the
income statement.
18 Lessee accounting
Leases, where the group assumes substantially all the
benefits and risks of ownership, are classified as finance
leases. Finance leases are capitalised at the lower of the fair
value of the leased asset and the present value of the
minimum lease payments. Lease payments are separated
using the interest rate implicit in the lease to identify the
finance cost, which is charged against income over the lease
period, and the capital repayment, which reduces the
liability to the lessor.
Leases of assets are classified as operating leases if the
lessor effectively retains all the risks and benefits. Payments
made under operating leases are charged to the income
statement on a straight-line basis over the period of the
lease, unless another systematic basis is more representative
of the time pattern in which the benefit is derived from the
leased asset.
19 Provision for leave pay
Employee benefits in the form of annual leave entitlements
are provided for when they accrue to employees with
reference to services rendered up to the balance sheet date.
20 Other provisions
Provisions are recognised when the group has a present
legal or constructive obligation as a result of past events, it
is probable that an outflow of resources embodying
economic benefits will be required to settle the obligation
and a reliable estimate of the amount of the obligation can
be made.
When the effect of discounting is material, provisions are
discounted using a pre-tax discount rate that reflects current
market assessments of the time value of money and, where
appropriate, the risks specific to the liability.
21 Tax
Normal tax
Income tax and capital gains tax on the profit or loss for the
year comprise current and deferred tax. Current tax
represents the expected tax payable on taxable income for
the year, using tax rates enacted at the balance sheet date,
and any adjustments to tax payable in respect of previous
years.
Deferred income tax and deferred capital gains tax are
provided for on the comprehensive basis, using the balance
sheet liability method, for all temporary differences arising
between the tax bases of assets and liabilities and their
carrying values for financial reporting purposes, using tax
rates enacted at the balance sheet date. Deferred tax is not
recognised on
• temporary differences relating to goodwill;
• the initial recognition of assets and liabilities which affect
neither accounting nor taxable profits or losses; and
• investments in subsidiaries and joint ventures (excluding
mutual funds) where the group controls the timing of the
reversal of temporary differences and it is probable that
these differences will not reverse in the foreseeable future.
Deferred tax assets are recognised to the extent that it is
probable that future taxable income will be available against
which the unused tax losses can be utilised. The amount of
deferred tax provided is based on the expected manner of
realisation or settlement of the carrying amount of the asset
or liability and is not discounted.
Deferred tax relating to items which are charged or credited
directly to equity, is also charged or credited directly to
equity and is subsequently recognised in the income
statement when the related deferred gain or loss is
recognised.
Secondary tax on companies (STC)
To the extent that it is probable that dividends will be
declared against which unused STC credits can be utilised, a
deferred tax asset is recognised for STC credits.
The STC effect of dividends paid on equity instruments is
recognised in the period in which the company declares the

Standard Bank Group annual report 2005 P • 118
Accounting policies continued
dividend. For financial instruments that are classified as
liabilities, the STC relating to any contractual payments is
accrued in the same period as the interest accrual.
Indirect tax
Indirect taxes, including non-recoverable value added tax
(VAT), regional service council (RSC) levies, skills
development levies and other duties for banking operations
are separately disclosed in the income statement.
22 Offsetting
Financial assets and liabilities are offset and the net amount
reported on the balance sheet when there is a legally
enforceable right to set-off the recognised amount and
there is an intention to settle on a net basis, or to realise the
asset and settle the liability simultaneously.
23 Equity
Re�acquired equity instruments
Where companies within the group purchase the reporting
entity’s equity instruments, the consideration paid is
deducted on consolidation from total shareholders’ equity as
treasury shares until they are sold. Fair value changes
recognised in the subsidiary’s financial statements on equity
investments in the holding entity’s shares, are reversed on
consolidation and dividends received are eliminated against
dividends paid. Where such shares are subsequently sold or
re-issued, any consideration received is included in
shareholders’ equity.
Share issue costs
Incremental external costs directly attributable to a
transaction that increases or decreases equity is deducted
from equity, net of related tax. All other share issue costs are
expensed immediately.
Dividends on ordinary shares
Dividends are recognised in the period in which they are
declared. Dividends declared after balance sheet date are
disclosed in the dividends note.
24 Equity�linked transactions
Equity compensation plans
The group operates equity-settled share-based compensation
plans. All share options issued after 7 November 2002 that
have not vested by 31 December 2004 are accounted for as
share-based payment transactions. The fair value of share
options is determined on the grant date and is accounted for
as an employee services expense over the vesting period of
the share options, with a corresponding increase in the
share-based payment reserve. Non-market vesting
conditions are not considered in the valuation but are
included in the estimate of the number of options expected
to vest. At each balance sheet date the estimate of the
number of options expected to vest is reassessed and
adjusted against income and equity over the vesting period.
On exercise of share options, proceeds received are credited
to share capital and premium. On vesting of share options,
amounts previously credited to the share-based payment
reserve are released to retained earnings through an equity
transfer.
Equity participation plans
Where participants use dividends on ordinary shares to repay
a purchase consideration for an acquisition of an entity’s
ordinary equity, the outstanding purchase consideration
receivable is not recognised as an asset but is recognised as
a reduction in equity as it represents cash flows generated
by the entity in the form of the return of ordinary dividends.
Equity will be reinstated in future to the extent that the
purchase consideration is not backed by the reporting
entity’s equity.
Consideration paid to acquire the reporting entity’s equity
instruments for purposes of the Tutuwa transaction
concluded in 2004 is therefore recognised as a reduction in
equity. The amount receivable from the black participants
resulting from the legal transfer of those equity instruments
is not recognised as an asset on the basis that it will be
recovered from ordinary dividend cash flows generated by
the group.
Equity participation rights issued in terms of the group’s
Tutuwa initiative to black managers have not vested by
31 December 2004 and are accounted for as equity-settled
share-based payment transactions as described under equity
compensation plans above.
25 Revenue and expenditure
Revenues described below represent the most appropriate
equivalent of turnover.
Banking operations
Revenue is derived substantially from the business of
banking and related activities and comprises net interest
income and non-interest revenue.
Net interest income
Interest income and expenses are recognised in the income
statement for all interest-bearing instruments on an accrual
basis using the effective interest method. In terms of the

Standard Bank Group annual report 2005 P • 119
effective interest method, interest is recognised at a rate
that exactly discounts estimated future cash payments or
receipts through the expected life of the financial
instrument to the carrying amount on the financial
statements. Direct incremental transaction costs incurred
and origination fees received as a result of bringing margin-
yielding assets on balance sheet, are capitalised to
the carrying amount of financial instruments (excluding
financial instruments at fair value through profit or loss) and
amortised as interest income over the life of the
asset.
Where financial assets have been impaired, interest income
continues to be recognised on the impaired value based on
the original effective interest rate. Net interest income
includes fair value adjustments on interest-bearing financial
instruments held at fair value, excluding financial
instruments held for trading. Dividends received on
preference share investments form part of the group’s
lending activities and are included in interest income.
Non�interest revenue
Non-interest revenue includes dividends from investments,
fees and commission from banking, insurance and related
transactions, net revenue from exchange and securities
trading and net gains on the realisation or revaluation of
investment banking assets.
Dividends are recognised in the period in which right to
receipt is established. Scrip dividends are recognised as
dividends received to the extent that they compare to cash
dividends in a similar entity. Fees and commission are
generally recognised on an incurred basis when the related
services are provided or on execution of a significant act.
Fees charged for servicing a loan are recognised as revenue
as the service is provided.
Loan syndication fees, where the group does not participate
in the syndication or participate at the same effective
interest rate for comparable risk as other participants, are
recognised as revenue when the syndication has been
completed. Syndication fees that do not meet these criteria
are capitalised as origination fees and amortised as interest
income.
Insurance contracts
Premium income on insurance contracts
Premiums and annuity considerations on insurance
contracts, other than in respect of the Lifestyle series of
policies and group schemes, are recognised when due.
Premiums receivable in respect of group schemes are
recognised when there is reasonable assurance of collection
in terms of the policy contract. Premiums in respect of the
Lifestyle series of policies are recognised on a cash receipt
basis as failure to pay a premium will result in either a lapse
of the policy or reduction of attributable fund value.
Premium income on insurance contracts is shown gross of
reinsurance. Premiums are shown before deduction of
commission.
Reinsurance premiums are recognised when due for
payment.
Claims and policyholders’ benefits
Claims on insurance contracts, which include death,
disability, maturity, surrender and annuity payments, are
charged to income as incurred based on the estimated
liability for compensation owed to policyholders. They
include claims that arise from events that have occurred up
to the balance sheet date even if they have not been
reported to the group. The group does not discount its
liabilities for unpaid claims other than for disability claims.
Liabilities for unpaid claims are estimated using the input
of assessors for individual cases reported to the group
and statistical analyses for the claims incurred but not
reported.
Reinsurance recoveries are accounted for in the same period
as the related claim.
Acquisition costs for insurance contracts
Acquisition costs for insurance contracts represent
commission and other costs (including bonuses payable and
company’s contribution to agents’ pension and medical aid
funds) that relate to the securing of new contracts and the
renewing of existing contracts.
The FSV method for valuing insurance contracts makes
implicit allowance for the deferral of acquisition costs and
hence no explicit deferred acquisition cost asset is
recognised in the balance sheet for insurance contracts.
Commission expense
Commissions, comprising commissions on new insurance and
investment policies along with renewal commissions, as well as
expenses related thereto including bonuses payable, and the
company’s contribution to agents’ pension and medical aid
funds, are shown gross of reinsurance commission received.
Commissions relating to unearned premiums are deferred in
liabilities on insurance policies and accounted for in the same
period in which those premiums are accounted for.
Investment contracts
Amounts received and claims incurred
Amounts received under investment contracts, such as
premiums and investment returns, are recorded as deposits
to investment contract liabilities whereas claims incurred are
recorded as deductions from investment contract liabilities.

Standard Bank Group annual report 2005 P • 120
Accounting policies continued
Service fees on investment contracts
Service fee income on investment contracts (including
contracts with DPF) is recognised on an accrual basis as and
when the services are rendered. Fees charged for
investment management service contracts in the asset
management segment are also recognised on this basis.
Deferred revenue liability (DRL) on investment contracts
A DRL is recognised in respect of fees, which are directly
attributable to a contract, that are charged for securing the
investment management service contract. The liability is
then recognised as revenue when the services are provided,
over the expected duration of the contract.
A DRL has been recognised for all applicable policies on
transition to IFRS as at 1 January 2005.
Deferred acquisition costs (DAC) on investment contracts
Commissions paid and other acquisition costs are incurred
when new investment contracts (including those contracts
with DPF) are renewed. These costs, if specifically
attributable to an investment contract with an investment
management service element, are deferred and amortised
over the expected life of the contract as they represent the
right to receive future management fees. A DAC asset is
recognised for all applicable policies with the amortisation
being calculated on a portfolio basis.
An impairment test is conducted annually on the DAC
balance to ensure that the amount will be recovered from
future revenue from the applicable remaining investment
contracts.
DAC have been recognised for all applicable policies on
transition to IFRS as at 1 January 2005.
Investment income
Investment income comprises income from financial services
activities, rental income from properties, interest and
dividends. Dividends are recognised when the right to
receive payment is established. Interest and other
investment income are accounted for on an accrual basis.
Net rental income comprises rental income net of property
expenses. Rental income in respect of group owner-
occupied properties is eliminated on consolidation.
26 Non�current assets and disposal groupsheld for sale
Non-current assets and disposal groups are classified as held
for sale if their carrying amount will be recovered through a
sale transaction rather than continuing use. This
classification is only met if the sale is highly probable and the
assets or disposal groups are available for immediate sale.
Non-current assets held as investments as part of the
group’s operating activities are not classified as held for sale
as ongoing investment management implies regular
purchases and sales in the ordinary course of business.
Immediately before classification as held for sale, the
measurement (carrying amount) of assets and liabilities in
relation to a disposal group is recognised based upon the
appropriate IFRS standards. On initial recognition as held for
sale, the non-current assets and liabilities are recognised at
the lower of the carrying amount and fair value less costs to
sell. Any impairment losses on initial classification as held for
sale are recognised in the income statement.
Non-current assets and disposal groups held for sale are
reclassified immediately when there is a change in intention
to sell. Subsequent measurement of the asset or disposal
group at that date, is the lower of:
• its carrying amount before the asset or disposal group
was classified as held for sale, adjusted for any
depreciation, amortisation or revaluations that would
have been recognised had the asset or disposal group
not been classified as held for sale; and
• its recoverable amount at the date of the subsequent
decision not to sell.
27 Post�retirement benefits
The group operates a number of defined contribution plans,
based on a percentage of pensionable earnings funded by
both employer companies and employees, the assets of
which are generally held in separate trustee-administered
funds. Contributions to these plans are charged to the
income statement in the period to which they relate.
The group also operates a number of defined benefit funds,
with membership generally limited to employees who were in
the employment of the various companies at specified dates.
These funds are governed by the Pension Funds Act 1956.
Employer companies contribute to the cost of benefits taking
account of the recommendations of the actuaries. Statutory
actuarial valuations are required every three years using the
projected unit credit method. Interim valuations are also
performed annually at the balance sheet date.
These obligations are measured at the present value of the
estimated future cash outflows using interest rates of
government bonds with maturity dates that approximate the
expected maturity of the obligations.
The group’s current service costs to the defined benefit
funds are recognised as expenses in the current year.
Past service costs, experience adjustments and the effect of
changes in actuarial assumptions are recognised as expenses
or income in the current year to the extent that they relate
to retired employees or past service. For active employees,
Standard Bank Group annual report 2005 P • 121
these items are recognised as expenses or income
systematically over a period not exceeding the expected
remaining service period of employees.
The group operates a number of unfunded post-retirement
medical aid schemes, with membership limited to employees
who were retired or in the employment of the various
companies at specified dates and complying with specific
criteria. For past service, the group recognises and provides
for the actuarially determined present value of post-
retirement medical aid employer contributions on an accrual
basis using the projected unit credit method. Independent
qualified actuaries carry out annual valuations of these
obligations. Unrecognised actuarial gains or losses are
accounted for over a period not exceeding the remaining
working life of active employees.
28 Segment reporting
A segment is a distinguishable component of the group
engaged in providing products or services within a particular
economic environment, which is subject to risks and rewards
that are different from those of other segments. The group’s
primary business segmentation is based on the group’s
internal reporting format to management. It represents the
classification of the group’s activities in segments that
reflect the risk and return of the group’s product offerings
in different geographical markets. The secondary format is a
product segmentation.
Segments with a majority of income earned from external
clients and whose total income, operating profit or total
assets are 10% or more of the group total, are reported
separately. Transactions between segments are priced at
market-related rates.
29 Fiduciary activities
The group commonly acts as trustees and in other fiduciary
capacities that result in the holding or placing of assets on
behalf of individuals, trusts, retirement benefit plans and
other institutions. These assets and the income arising
thereon are excluded from these financial statements, as
they are not assets of the group.
30 Comparative figures
Where necessary, comparative figures within notes have
been reclassified to conform to changes in presentation in
the current year and for changes relating to the
implementation of IFRS as described in Annexure A.

Standard Bank Group annual report 2005 P • 122
Accounting policies continued
Standards and interpretations not yet effective
Standard/interpretation
Exploration for and Evaluation of Mineral Resources
This statement is not applicable to the business of the group.
Financial Instruments: Disclosures (including amendments to IAS 1,
Presentation of Financial Statements: Capital Disclosures)
The statement deals mainly with the disclosure of financial instruments
and the related qualitative and quantitative risks. Most of these disclosure
requirements are currently provided in terms of IAS 30 and IAS 32. The
statement will therefore not impact the results of the group but will impact
the format of disclosure of financial instruments.
Employee Benefits (December 2004)
The statement permits an entity to recognise all actuarial gains and
losses in the period in which they occur, outside profit or loss, in a
statement of recognised income and expense. The group will consider
the appropriateness of this option.
Financial Instruments: Recognition and Measurement (April 2005) – Cash
flow hedge accounting of forecast intragroup transactions
The amendment to IAS 39 allows the designation, as a hedged item in consolidated
financial statements, of the foreign currency risk of a highly probable forecast
intragroup transaction under certain conditions. The group will consider the
amendment but the application is expected to be limited.
Financial Instruments: Recognition and Measurement (June 2005) – Fair value option
The revisions to IAS 39 restrict the extent which entities can designate a financial
asset or financial liability as fair value through profit or loss only to specific situations.
The statement is not expected to reduce the group’s current application
of the fair value option materially.
Financial Instruments: Recognition and Measurement (August 2005) and Insurance
Contracts – Financial Guarantee Contracts
Under the revised statements the issuer of a financial guarantee contract would
generally measure the contract:
• initially at fair value; and
• subsequently at the higher of the amount determined in accordance with IAS 37
and the amount initially recognised less, when appropriate, cumulative amortisation.
The group’s current policy is substantially in line with this approach and no significant
adjustment is expected.
Effective date1
Annual periods
commencing on or after
1 January 2006
Annual periods
commencing on or after
1 January 2007
Annual periods
commencing on or after
1 January 2006
Annual periods
commencing on or after
1 January 2006
Annual periods
commencing on or after
1 January 2006
Annual periods
commencing on or after
1 January 2006
Standard
IFRS 6
IFRS 7
IAS 19
amendment
IAS 39
amendment
IAS 39
amendment
IAS 39 and
IFRS 4
amendment
1The group will comply with the new standards and interpretations from the effective date.

Standard Bank Group annual report 2005 P • 123
Standards and interpretations not yet effective
Standard/interpretation
The Effects of Changes in a Foreign Operation (December 2005)
The amendment clarifies that a group entity that may have a monetary item
receivable from or payable to a foreign operation, which is classified in substance as
part of the net investment in a foreign operation, may be any subsidiary of the group
and not only the parent. The amendment further specifies that the exchange
differences arising from the translation of these monetary items will be classified in
equity in the consolidated financial statements. The amendment will not have a
significant impact on the group’s results.
Determining Whether an Arrangement Contains a Lease
This interpretation provides guidance on determining whether an arrangement that
does not take the legal form of a lease contains a lease and should be accounted for
in terms of IAS 17 Leases. An arrangement contains a lease if the fulfilment of the
arrangement is dependent on the use of a specific asset or assets, and the
arrangement conveys the right to use the asset. This interpretation is substantially in
line with the group’s current application of the standard.
Rights to Interests arising from Decommissioning, Restoration and Environmental
Rehabilitation Funds
This statement is not applicable to the business of the group.
Liabilities Arising from Participating in a Specific Market – Waste Electrical and
Electronic Equipment
This statement is not applicable to the business of the group.
Applying the Restatement Approach under IAS 29 Financial Reporting in
Hyperinflationary Economies
IAS 29 Financial Reporting in Hyperinflationary Economies requires that the financial
statements of an entity that reports in the currency of a hyperinflationary economy
should be stated in terms of the measuring unit current at the balance sheet date.
Comparative figures for prior periods should be restated into the same current
measuring unit. IFRIC 7 contains guidance on how an entity would restate its financial
statements in the first year it identifies the existence of hyperinflation in the
economy of its functional currency. The group’s adjustments relating to operations in
hyperinflationary economies are not material.
Scope of IFRS 2
The interpretation clarifies that IFRS 2 applies to transactions in which the entity
cannot specifically identify the goods or services received in return for a share-based
payment, but where other circumstances indicate that goods or services have been
received.
This interpretation is consistent with the group’s application of IFRS 2 for shares
issued in terms of its Tutuwa initiative.
Effective date
Annual periods
commencing on or after
1 January 2006
Annual periods
commencing on or after
1 January 2006
Annual periods
commencing on or after
1 January 2006
Annual periods
commencing on or after
1 December 2005
Annual periods
commencing on or after
1 March 2006
Annual periods
commencing on or after
1 May 2006
Standard
IAS 21
amendment
IFRIC 4
IFRIC 5
IFRIC 6
IFRIC 7
IFRIC 8

Notes to the annual financial statements for the year ended 31 December 2005
Standard Bank Group annual report 2005 P • 124
1 Segment reporting
Domestic BankingPersonal & Corporate & Other
Business Investment domesticBanking SA Banking SA operations Total
2005 Rm Rm Rm Rm
Income from banking operations 16 434 6 451 (99) 22 786
Net interest income 8 474 2 400 (191) 10 683
Interest income 19 899 19 541 (5 494) 33 946 Interest expense 11 425 17 141 (5 303) 23 263
Non�interest revenue 7 960 4 051 92 12 103
Fee and commission revenue 7 445 1 412 (27) 8 830 Trading revenue – 1 577 4 1 581 Other revenue 515 1 062 115 1 692
Income from life insurance operations – – – –
Net insurance premiumsInvestment income and gainsManagement and service fee income
Total income 16 434 6 451 (99) 22 786
Credit impairment charges 1 273 (2) (21) 1 250
Benefits due to policyholders – – – –
Net insurance benefits and claims – – – –Fair value adjustment to policyholders’ liabilities under
investment contracts – – – –Fair value adjustment on third party fund interests – – – –
Income after credit impairment charges and policyholders’ benefits 15 161 6 453 (78) 21 536
Operating expenses in banking operations 9 727 2 649 (319) 12 057
Staff costs 3 172 1 455 2 051 6 678 Other operating expenses 6 555 1 194 (2 370) 5 379
Operating expenses in life insurance operations – – – –
Acquisition costs – insurance and investment contracts – – – –Other operating expenses – – – –
Net income before goodwill 5 434 3 804 241 9 479 Goodwill impairment 13 – – 13
Net income from banking and insurance 5 421 3 804 241 9 466 Income from associates and joint ventures 141 58 – 199
Net income before indirect taxation 5 562 3 862 241 9 665 Indirect taxation 222 75 165 462
Profit before direct taxation 5 340 3 787 76 9 203 Direct taxation 1 686 528 (98) 2 116
Profit for the year 3 654 3 259 174 7 087
Attributable to minorities – 1 (1) –Attributable to preference shareholders – – – –Attributable to ordinary shareholders 3 654 3 258 175 7 087
Headline earnings 3 664 3 213 114 6 991Return on equity (%) 31,2 40,6 33,6Average ordinary shareholders’ equity 11 757 7 913 1 110 20 780Cost�to�income ratio (%) 59,2 41,1 52,9Net interest margin (%) 4,81 1,56 3,16Credit loss ratio (%) 0,73 (0,00) 0,50Total assets 197 897 246 674 7 467 452 038Average assets (excluding derivatives) 176 181 154 044 7 319 337 544Total liabilities 184 922 238 122 5 923 428 967Interest in associates and joint ventures 203 561 764Capital expenditure 435 154 488 1 077Depreciation and amortisation 328 130 206 664Impairment of non-financial assets 13 13 Number of employees 17 653 3 213 7 652 28 518

Standard Bank Group annual report 2005 P • 125
Corporate & EliminationInvestment of treasury
Banking Central Standard Bank shares and Standard BankRest of Africa International Stanlib funding operations Liberty Life Tutuwa Group
Rm Rm Rm Rm Rm Rm Rm Rm
2 955 3 130 762 72 29 705 – – 29 705
1 609 630 (28) 93 12 987 – – 12 987
2 499 3 111 72 (931) 38 697 38 697 890 2 481 100 (1 024) 25 710 25 710
1 346 2 500 790 (21) 16 718 – – 16 718
898 731 753 (40) 11 172 11 172 378 1 770 21 (8) 3 742 3 742
70 (1) 16 27 1 804 1 804
– – – – – 51 821 (694) 51 127
18 979 – 18 979 31 676 (694) 30 982
1 166 – 1 166
2 955 3 130 762 72 29 705 51 821 (694) 80 832
38 (100) – 19 1 207 1 207
– – – – – 41 004 – 41 004
– – – – – 32 816 – 32 816
– – – – – 6 834 – 6 834 – – – – – 1 354 – 1 354
2 917 3 230 762 53 28 498 10 817 (694) 38 621
1 854 2 525 414 (33) 16 817 – – 16 817
850 1 776 243 66 9 613 9 613 1 004 749 171 (99) 7 204 7 204
– – – – – 7 222 – 7 222
– – – – – 3 594 – 3 594 – – – – – 3 628 – 3 628
1 063 705 348 86 11 681 3 595 (694) 14 582 – 11 – – 24 397 – 421
1 063 694 348 86 11 657 3 198 (694) 14 161 1 – – – 200 26 – 226
1 064 694 348 86 11 857 3 224 (694) 14 387 52 36 3 12 565 213 – 778
1 012 658 345 74 11 292 3 011 (694) 13 609 241 204 142 (25) 2 678 1 634 – 4 312
771 454 203 99 8 614 1 377 (694) 9 297
49 – 106 2 157 997 (515) 639 – – – 226 226 – – 226
722 454 97 (129) 8 231 380 (179) 8 432
721 465 97 (129) 8 145 498 (179) 8 46427,4 8,2 57,7 28,2 17,8 27,8
2 630 5 667 168 (317) 28 928 2 791 (1 235) 30 48462,7 80,7 54,3 56,6 56,65,78 0,59 2,93 2,930,28 (0,22) (0,15) 0,41 0,41
30 043 122 660 787 (11 800) 593 728 161 950 755 67827 837 106 124 1 433 (29 649) 443 28926 155 117 924 528 (14 335) 559 239 156 475 715 714
2 3 46 815 4 170 4 985148 72 9 1 306 346 1 652130 38 25 1 858 327 1 185
11 24 397 4216 119 1 494 551 36 682 3 563 40 245

Notes to the annual financial statements for the year ended 31 December 2005 continued
1 Segment reporting continued
Domestic BankingPersonal & Corporate & Other
Business Investment domesticBanking SA Banking SA operations Total
2004 Rm Rm Rm Rm
Income from banking operations 13 734 6 188 (88) 19 834
Net interest income 7 144 2 374 (168) 9 350
Interest income 14 788 20 178 (3 733) 31 233 Interest expense 7 644 17 804 (3 565) 21 883
Non�interest revenue 6 590 3 814 80 10 484
Fee and commission revenue 6 250 1 265 100 7 615 Trading revenue – 1 516 (51) 1 465 Other revenue 340 1 033 31 1 404
Income from life insurance operations – – – –
Net insurance premiumsInvestment income and gainsManagement and service fee income
Total income 13 734 6 188 (88) 19 834
Credit impairment charges 786 31 (12) 805
Benefits due to policyholders – – – –
Net insurance benefits and claims – – – –Fair value adjustment to policyholders' liabilities under
investment contracts – – – –Fair value adjustment on third party fund interests – – – –
Income after credit impairment charges and policyholders' benefits 12 948 6 157 (76) 19 029
Operating expenses in banking operations 8 588 2 577 (83) 11 082
Staff costs 2 873 1 333 1 781 5 987 Other operating expenses 5 715 1 244 (1 864) 5 095
Operating expenses in life insurance operations – – – –
Acquisition costs – insurance and investment contracts – – – –Other operating expenses – – – –
Net income before goodwill 4 360 3 580 7 7 947 Goodwill impairment – – – –
Net income from banking and insurance 4 360 3 580 7 7 947 Income from associates and joint ventures 85 10 2 97
Net income before indirect taxation 4 445 3 590 9 8 044 Indirect taxation 171 50 99 320
Profit before direct taxation 4 274 3 540 (90) 7 724 Direct taxation 1 309 735 (105) 1 939
Profit for the year 2 965 2 805 15 5 785
Attributable to minorities – – – –Attributable to preference shareholders – – – –Attributable to ordinary shareholders 2 965 2 805 15 5 785
Headline earnings 2 985 2 805 5 790Return on equity (%) 34,7 37,8 32,0Average ordinary shareholders' equity 8 593 7 420 2 081 18 094Cost�to�income ratio (%) 62,5 41,6 55,9Net interest margin (%) 5,36 1,76 3,40Credit loss ratio (%) 0,59 0,05 0,41Total assets 154 205 229 407 8 056 391 668Average assets (excluding derivatives) 133 338 134 992 6 936 275 266Total liabilities 144 555 221 892 5 575 372 022Interest in associates and joint ventures 114 132 246Capital expenditure 397 134 256 787Depreciation and amortisation 297 84 341 722Impairment of non-financial assets 14 13 27Number of employees 17 587 3 029 7 492 28 108
Standard Bank Group annual report 2005 P • 126

Standard Bank Group annual report 2005 P • 127
Corporate & EliminationInvestment of treasury
Banking Central Standard Bank shares and Standard BankRest of Africa International Stanlib funding operations Liberty Life Tutuwa Group
Rm Rm Rm Rm Rm Rm Rm Rm
2 666 3 308 663 65 26 536 – – 26 536
1 520 562 (44) 104 11 492 – – 11 492
2 416 2 226 65 (693) 35 247 35 247 896 1 664 109 (797) 23 755 23 755
1 146 2 746 707 (39) 15 044 – – 15 044
779 805 662 (45) 9 816 9 816 296 1 941 38 48 3 788 3 788
71 – 7 (42) 1 440 1 440
– – – – – 32 311 – 32 311
12 406 – 12 406 18 830 – 18 830
1 075 – 1 075
2 666 3 308 663 65 26 536 32 311 – 58 847
45 146 – 54 1 050 1 050
– – – – – 24 809 – 24 809
– – – – – 19 115 – 19 115
– – – – – 4 666 – 4 666 – – – – – 1 028 – 1 028
2 621 3 162 663 11 25 486 7 502 – 32 988
1 611 2 318 449 (76) 15 384 – – 15 384
752 1 612 233 26 8 610 8 610 859 706 216 (102) 6 774 6 774
– – – – – 4 684 – 4 684
– – – – – 1 920 – 1 920 – – – – – 2 764 – 2 764
1 010 844 214 87 10 102 2 818 – 12 920 (2) 50 – – 48 – 48
1 012 794 214 87 10 054 2 818 – 12 872 – – – – 97 30 127
1 012 794 214 87 10 151 2 848 – 12 999 50 7 – 12 389 262 651
962 787 214 75 9 762 2 586 – 12 348 261 190 97 (3) 2 484 792 3 276
701 597 117 78 7 278 1 794 – 9 072
64 – 61 (1) 124 1 264 1 388 – – – – – – –
637 597 56 79 7 154 530 7 684
616 647 56 78 7 187 351 7 53829,1 12,1 35,0 27,2 13,5 26,0
2 116 5 335 160 750 26 455 2 609 (114) 28 95060,4 70,1 67,7 58,0 58,06,08 0,57 3,07 3,070,38 0,37 (1,42) 0,43 0,43
25 348 107 128 1 868 (19 992) 506 020 114 153 620 17324 996 97 940 1 381 (24 869) 374 71422 810 103 042 1 601 (23 322) 476 153 105 487 581 640
2 48 296 2 954 3 250263 60 16 1 126 257 1 383115 51 25 913 186 1 099
(2) 50 75 755 799 1 376 537 35 820 3 260 39 080
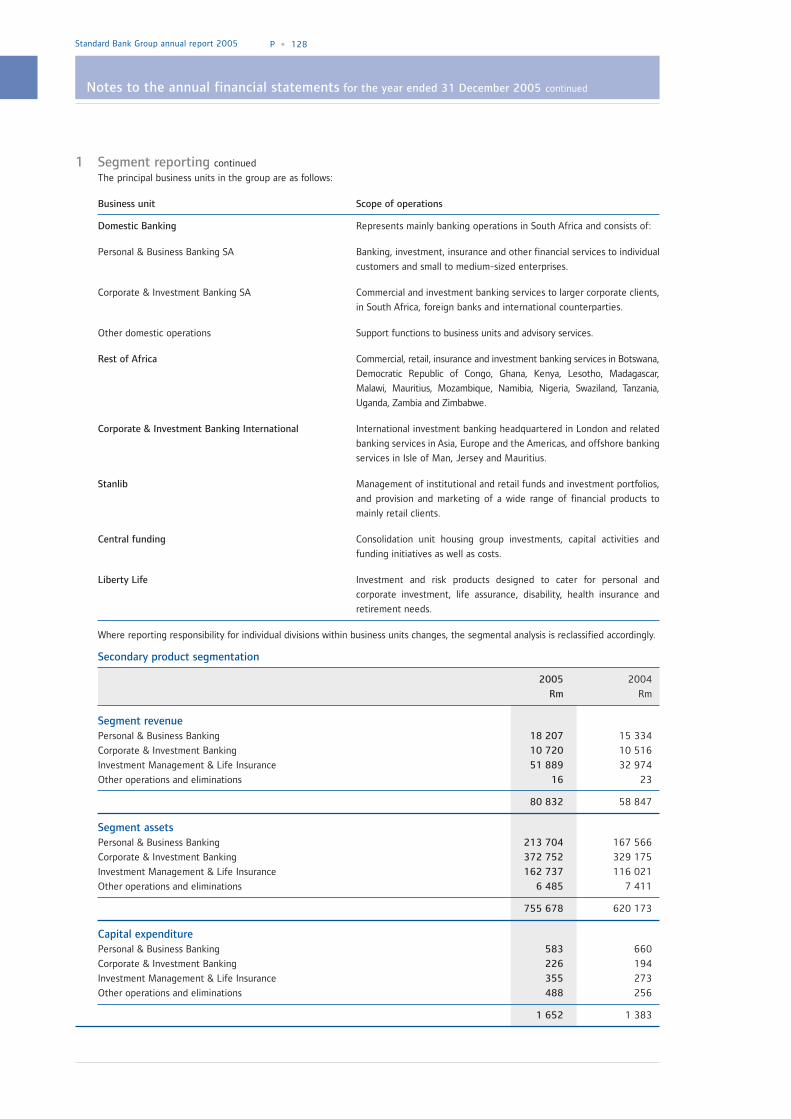
Notes to the annual financial statements for the year ended 31 December 2005 continued
1 Segment reporting continued
The principal business units in the group are as follows:
Business unit Scope of operations
Domestic Banking Represents mainly banking operations in South Africa and consists of:
Personal & Business Banking SA Banking, investment, insurance and other financial services to individual
customers and small to medium-sized enterprises.
Corporate & Investment Banking SA Commercial and investment banking services to larger corporate clients,
in South Africa, foreign banks and international counterparties.
Other domestic operations Support functions to business units and advisory services.
Rest of Africa Commercial, retail, insurance and investment banking services in Botswana,
Democratic Republic of Congo, Ghana, Kenya, Lesotho, Madagascar,
Malawi, Mauritius, Mozambique, Namibia, Nigeria, Swaziland, Tanzania,
Uganda, Zambia and Zimbabwe.
Corporate & Investment Banking International International investment banking headquartered in London and related
banking services in Asia, Europe and the Americas, and offshore banking
services in Isle of Man, Jersey and Mauritius.
Stanlib Management of institutional and retail funds and investment portfolios,
and provision and marketing of a wide range of financial products to
mainly retail clients.
Central funding Consolidation unit housing group investments, capital activities and
funding initiatives as well as costs.
Liberty Life Investment and risk products designed to cater for personal and
corporate investment, life assurance, disability, health insurance and
retirement needs.
Where reporting responsibility for individual divisions within business units changes, the segmental analysis is reclassified accordingly.
Secondary product segmentation
2005 2004
Rm Rm
Segment revenuePersonal & Business Banking 18 207 15 334
Corporate & Investment Banking 10 720 10 516
Investment Management & Life Insurance 51 889 32 974
Other operations and eliminations 16 23
80 832 58 847
Segment assetsPersonal & Business Banking 213 704 167 566
Corporate & Investment Banking 372 752 329 175
Investment Management & Life Insurance 162 737 116 021
Other operations and eliminations 6 485 7 411
755 678 620 173
Capital expenditurePersonal & Business Banking 583 660
Corporate & Investment Banking 226 194
Investment Management & Life Insurance 355 273
Other operations and eliminations 488 256
1 652 1 383
Standard Bank Group annual report 2005 P • 128

Standard Bank Group annual report 2005 P • 129
2 Key management assumptionsIn preparing the financial statements estimates and assumptions are made that could affect the reported amounts of assets and
liabilities within the next financial year. Estimates and judgements are continually evaluated and are based on factors such as historical
experience and current best estimates of uncertain future events.
2.1 Credit impairment losses on loans and advancesPerforming loansThe group assesses its loan portfolios for impairment at each balance sheet date. In determining whether an impairment loss
should be recorded in the income statement, the group makes judgements as to whether there is observable data indicating
a measurable decrease in the estimated future cash flows from a portfolio of loans before the decrease can be allocated to
an individual loan in that portfolio. Estimates are made of the duration between the occurrence of a loss event and the
identification of a loss on an individual basis. The impairment for performing loans is calculated on a portfolio basis, based on
historical loss ratios, adjusted for national and industry-specific economic conditions and other indicators present at the
reporting date that correlate with defaults on the portfolio. These include early arrears and other early indicators of potential
default. These annual loss ratios are applied to loan balances in the portfolio and scaled to the estimated loss emergence
period. At the year end, the group applied the following loss emergence periods:
Average lossemergence
period Sensitivity)1
2005 2005Months Rm
Personal & Business Banking SA 3�6 110Corporate & Investment Banking SA 15 27Rest of Africa 3�18 6Corporate & Investment Banking International 3 30
173
1Sensitivity is based on the effect of a change of one month in the emergence period on the value of the impairment.
Non�performing loansRetail loans are individually impaired if amounts are due and unpaid for three or more months. Corporate loans are analysed
on a case-by-case basis taking into account breaches of key loan conditions. Management’s estimates of future cash flows
on individually impaired loans are based on historical loss experience for assets with similar credit risk characteristics. The
methodology and assumptions used for estimating both the amount and timing of future cash flows are reviewed regularly
to reduce any differences between loss estimates and actual loss experience. Recoveries of individual loans as a percentage
of the outstanding balances are estimated as follows:
Recoveries as a percentage Impairment lossof impaired loans sensitivity1
2005 2004 2005 2004
% % Rm Rm
Personal & Business Banking SA 62 55 19 14
Corporate & Investment Banking SA 41 57 2 4
Rest of Africa 46 9 1 –
Corporate & Investment Banking International 11 1 – –
22 18
1Sensitivity is based on the effect of a change of one percentage in the value of the estimated recovery on the value of the
impairment.

Notes to the annual financial statements for the year ended 31 December 2005 continued
Standard Bank Group annual report 2005 P • 130
2 Key management assumptions continued
2.2 Fair value of derivativesThe fair value of financial instruments that are not quoted in active markets is determined by using valuation techniques.
Where valuation techniques (for example, models) are used to determine fair values, they are validated and periodically
reviewed by independent qualified senior personnel. All models are certified before they are used, and models are calibrated
and back tested to ensure that outputs reflect actual data and comparative market prices. To the extent practical, models use
only observable data, however areas such as credit risk (both own and counterparty), volatilities and correlations require
management to make estimates.
2.3 Impairment of available�for�sale equity investmentsThe group determines that available-for-sale equity investments are impaired and recognised as such in the income
statement, when there has been a significant or prolonged decline in the fair value below their cost. This determination of
what is significant or prolonged requires judgement. In making this judgement, the group evaluates among other factors, the
normal volatility in share prices. In addition, impairment may be appropriate when there is evidence of a deterioration in the
financial health of the investee, industry and sector performance, changes in technology, and operational and financing cash
flows.
Had the declines of financial instruments with fair values below cost been considered significant or prolonged, the group
would suffer an additional loss of R24 million (2004: R7 million) in its financial statements, being the transfer of the negative
revaluations within the available-for-sale reserve to the income statement.
2.4 Securitisations and special purpose entitiesThe group sponsors the formation of special purpose entities (SPEs) primarily for the purpose of allowing clients to hold
investments for asset securitisation transactions and for buying or selling credit protection. The group consolidates SPEs that
it controls in terms of IFRS. As it can sometimes be difficult to determine whether the group controls an SPE, it makes
judgements about its exposure to the risks and rewards, as well as its ability to make operational decisions for the SPE in
question. In many instances, elements are present that, considered in isolation, indicate control or lack of control over a SPE,
but when considered together make it difficult to reach a clear conclusion.
The group has consolidated SPEs with assets of R17 747 million (2004: R9 966 million) and profit of R10 million (2004:
Rnil). The group has not consolidated SPEs with assets of R250 million (2004: Rnil) and no profit (2004: Rnil) as these
entities were not considered to be controlled by the group.
2.5 Held�to�maturity investmentsThe group follows the guidance of IAS 39 on classifying certain non-derivative financial assets with fixed or determinable
payments and fixed maturity, as held-to-maturity. This classification requires judgement of the group’s ability to hold such
investments to maturity. If the group fails to keep these investments to maturity other than for specific defined
circumstances, it will be required to classify the entire class as available-for-sale. The investments would therefore be
measured at fair value and not amortised cost. If the entire class of held-to-maturity investments were tainted, the fair value
would increase by R67 million (2004: R357 million), with a corresponding entry in the available-for-sale reserve in
shareholders’ equity.
2.6 Income taxesThe group is subject to direct taxation in a number of jurisdictions. There may be transactions and calculations for which the
ultimate tax determination has an element of uncertainty during the ordinary course of business. The group recognises
liabilities based on estimates of the quantum of taxes that may be due. Where the final tax determination is different from
the amounts that were initially recorded, such differences will impact the income tax and deferred tax expense in the period
in which such determination is made.
2.7 Financial risk managementThe group’s risk management policies and procedures are disclosed in risk management and control starting on page 45 of
the annual report. The repricing analysis on page 61 forms part of the audited annual financial statements.
2.8 Long�term insurance contracts – process used to decide on assumptions, changes in assumptions andsensitivity analysisThe value of insurance liabilities is based on best estimate assumptions of future experience plus prescribed margins as
required in terms of PGN 104, plus additional discretionary second tier margins determined by the statutory actuary.
The process of deriving the best estimate assumptions relating to future mortality, morbidity, medical, withdrawals,
investment returns, maintenance expenses, expense inflation and tax are described below.

Standard Bank Group annual report 2005 P • 131
2 Key management assumptions continued
2.8 Long�term insurance contracts – process used to decide on assumptions, changes in assumptions andsensitivity analysis continuedMortalityAn appropriate base table of standard mortality is chosen depending on the type of contract and class of business. Industrystandard tables are used for smaller classes of business, while company specific tables are used for larger classes.
Investigations into mortality experience is performed annually. The period of investigation extends over the latest three fullyears for larger classes of business. Investigations relating to smaller classes usually extend over five years in order to gainsufficient credibility of the data.
The results of the investigation are used to set the valuation assumptions, which are taken as an adjustment to the respectivestandard table.
In setting the assumptions, provision is made for the expected increase in AIDS-related claims. In general, Actuarial Societyof South Africa (ASSA) models are used to allow for AIDS-related claims. The practice differs by class of business, howeverfor major classes of business, a basic allowance for AIDS-related deaths is included in the base mortality rates against whichannual mortality investigations are conducted. A further discretionary margin is then held using the ASSA2000lite model.
For contracts insuring survivorship, an allowance is made for future mortality improvements based on trends identified in thedata and in the continuous mortality investigations performed by independent actuarial bodies.
MorbidityThe incidence of disability claims is derived from industry experience studies, adjusted where appropriate for Liberty Life’sown experience. The same is true for the incidence of recovery from disability.
MedicalThe incidence of medical claims is derived from the risk premium rates determined from annual investigations. This isadjusted where appropriate to allow for future expected experience.
WithdrawalThe withdrawal assumptions are based on the most recent withdrawal investigations taking into account past as well asexpected future trends. The withdrawal rates are analysed by product type and policy duration. These withdrawal rates varyconsiderably by duration, policy term and company. Typically the rates are higher for risk type products versus investmenttype products, and are higher at early durations.
Investment returnFuture investment returns are set for the main asset classes as follows:
• Gilt rate – Effective 10 year rate at the balance sheet date off the yield curve rounded to nearest 0,25 percentage point(2005: 7,5%);
• Equity rate – Gilt rate plus 2 percentage points as an adjustment for risk (2005: 9,5%);
• Property rate – Gilt rate plus 1 percentage point as an adjustment for risk (2005: 8,5%); and
• Cash rate – Gilt rate less 1,5 percentage points (2005: 6,0%).
The overall investment return for a block of business is based on the investment return assumption allowing for the currentmix of assets supporting the liabilities.
The pre-taxation discount rate is set at the same rate. For the major classes of business the rate used is 9,0% per annum in2005 (2004: 9,7% per annum). Where appropriate the investment return assumption will be adjusted to make allowancefor investment expenses, taxation and the relevant prescribed margins as per PGN 104.
For annuity and guaranteed capital bond business, discount rates are set at the rate of return yielded by the assets matchingthe respective business, reduced by an allowance for investment expenses and the relevant prescribed margin.
ExpensesAn expense analysis is performed on the actual expenses incurred in the calendar year preceding the balance sheet date.The expenses are split between acquisition, maintenance and non-recurring expenses. The individual annual maintenancecost per policy, which forms the base for future projections, are as follows:
2005 2004Rands Rands
Liberty Life 258 248Liberty Active 139 154CAHL – complex 221 2171
CAHL– simple 98 801
The expenses derived from this analysis are adjusted accordingly by an expense inflation assumption to obtain an appropriateexpense base assumption to be used in the calculation of the insurance liabilities.
1These figures have been provided for comparative purposes only as Liberty acquired CAHL on 1 April 2005 and the numbersare applicable at 31 March 2005.

Notes to the annual financial statements for the year ended 31 December 2005 continued
Key management assumptions continued
2.8 Long�term insurance contracts – process used to decide on assumptions, changes in assumptions andsensitivity analysis continued
Expense inflationThe inflation rate is set at 3,5 percentage points lower than the gilt rate investment return assumption prevailing at the
balance sheet date, resulting in a best estimate expense inflation of 4,0% at 31 December 2005.
TaxationFuture taxation and taxation relief are allowed for at the rates and on the bases applicable to Section 29A of the Income Tax
Act at the balance sheet date. Each company's current tax position is taken into account, and the taxation rates, consistent
with that position and the likely future changes in that position are allowed for. In respect of capital gains taxation (CGT),
taxation is allowed for at the full CGT rate. Provision is made for CGT on unrealised gains/(losses), at the valuation date, at
the full undiscounted value.
CorrelationsNo correlations between assumptions are allowed for.
Contribution increasesIn the valuation of the liabilities, voluntary premium increases that give rise to expected profits are not allowed for. However,
compulsory increases and increases that give rise to expected losses are allowed for. This is consistent with requirements of
PGN 104.
Embedded investment derivative assumptionsThe assumptions used to value embedded investment derivatives, in respect of policyholder contracts, are set in accordance
with PGN 110. The expected investment return assumptions are set to be consistent with the Financial Soundness
Valuations, while also taking account of the yield curve at the valuation date. Both implied market volatility and historical
volatility are taken into account when setting volatility assumptions. Correlations between asset classes are set based on
historical evidence.
Changes in assumptionsModelling and other changes were made to the valuation to realign valuation assumptions with expected future experience.
These changes resulted in a net increase in policyholders’ liabilities of R14 million in 2005.
The primary items were:
• a reduction in the inflation gap from 4,0 percentage points to 3,5 percentage points, increasing the liability by
R131 million;
• setting up a liability in anticipation of the move from a real world model to a market consistent model for the calculation
of the liabilities in respect of minimum investment guarantees, increasing the liability by R340 million;
• an adjustment to policyholders’ liabilities in respect of prepaid commission, which was previously recognised as a current
asset. This resulted in a decrease of the policyholders’ liability in respect of insurance contracts of
R1 013 million (2004: R1 096 million). The basis change is offset by a reduction in the current asset;
• a change in the economic valuation assumptions to re-align the economic assumptions with expected future experience,
resulting in an increase of R653 million. It should be noted that the majority of this change is offset by a corresponding
change in the value of the relevant matching assets;
• the demographic experience assumptions were adjusted to reflect expected future experience, amounting to a decrease
in the liability of R37 million; and
• the balance of other modelling changes amounted to a decrease in liability of R60 million.
In addition, an allowance has been made for the adjustment to early termination values in terms of the Statement of Intent.
On 12 December 2005 a Statement of Intent was agreed between the Minister of Finance and the long-term insurance
industry. In terms of the statement, minimum standards will be implemented on early termination values of retirement
annuity contracts, as well as certain other contracts. Full provision has been made for the cost of these adjustments. The
following adjustments amounting to R359 million are included as a basis change in the liabilities under insurance contracts:
• an amount of R172 million in respect of the retrospective cost over the period 1 January 2001 to 31 December 2005.
• an amount of R187 million in respect of the prospective cost of the adjustment to termination values and rates on
in-force policies.
Standard Bank Group annual report 2005 P • 132

Standard Bank Group annual report 2005 P • 133
2 Key management assumptions continued
2.8 Long�term insurance contracts – process used to decide on assumptions, changes in assumptions andsensitivity analysis continued
Sensitivity analysisShown in the table below are the sensitivities of the value of insurance liabilities disclosed in this note to various changes in
assumptions used in the estimation of the insurance liabilities. Each value is shown with only the indicated assumption being
changed and holding all other assumptions constant. In practice, this is unlikely to occur, and changes in some of the
assumptions may be correlated.
It should be noted that the sensitivities ignore any changes in matched assets. This is particularly relevant to the sensitivity
changes in future investment returns.
Change in policyholders’ liabilitiesunder insurance contracts
2005Rm
VariableFuture investment returns reduce by a 15% relative reduction in the valuation rate,
with bonus rate changing commensurately 2 265Assurance mortality and morbidity increase by 10%, annuity mortality decrease by 10% 1 900Withdrawal rates increase by 10% 172Maintenance expenses (other than commission) increase by 10% 339Expense inflation rate increase by 1% 268
2005 2004
Rm Rm
3 Cash and balances with banksCoins and bank notes 6 112 4 055
Balances with central banks 6 669 7 325
Balances with other banks 58 071 26 462
70 852 37 842
Cash and balances with banks include R5 382 million (2004: R4 337 million)
that is not available for use by the group. These balances comprise
primarily reserving requirements held with central banks and cash held
on behalf of policyholders.
4 Short�term negotiable securitiesOriginated by the entity – 103
Held at fair value 29 867 20 937
Accrued interest 446 421
30 313 21 461
Fair value 30 313 21 461
5 Derivative instrumentsAll derivatives are classified as either derivatives held for trading or derivatives held for hedging.
5.1 Fair valuesThe fair value of a derivative financial instrument represents, for quoted instruments, the quoted market price and for
unquoted instruments, the present value of the positive or negative cash flows, which would have occurred if the rights and
obligations arising from that instrument were closed out in an orderly market place transaction at year end.
5.2 Notional amountThe gross notional amount is the sum of the absolute value of all bought and sold contracts. The amount cannot be used to
assess the market risk associated with the position and should be used only as a means of assessing the group's participation
in derivative contracts.

Notes to the annual financial statements for the year ended 31 December 2005 continued
Standard Bank Group annual report 2005 P • 134
5 Derivative instruments continued
5.3 Derivative assets and liabilities
2005
Maturity analysis of net fair value
1 – 5 Net fair
<1 year years >5 years value
Rm Rm Rm Rm
Derivatives held for trading
Foreign exchange derivatives 1 294 1 591 (2 104) 781
Forwards 1 069 274 151 1 494
Futures – – – –
Options 225 1 317 (2 255) (713)
Interest rate derivatives 1 864 (1 698) 300 466
Bonds and options (25) – (489) (514)
Caps and floors 1 42 (9) 34
Future options 14 15 – 29
Forwards (2) (18) – (20)
Swaps 1 856 (1 732) 798 922
Swaptions 20 (5) – 15
Commodity derivatives 112 313 131 556
Forwards 2 089 41 (5) 2 125
Futures – – – –
Options (1 977) 272 136 (1 569)
Credit derivatives (230) (404) 4 (630)
Credit default swaps 226 7 4 237
Total return swaps (456) (411) – (867)
Equity derivatives 182 (264) – (82)
Forwards 55 – – 55
Futures 7 9 – 16
Index options 207 (299) – (92)
Options (33) 5 – (28)
Swaps (9) 18 – 9
Other (45) 3 – (42)
Total derivative assets/(liabilities) held for trading 3 222 (462) (1 669) 1 091
Derivatives held for hedging
Derivatives designated as fair value hedges 379 794 (835) 338
Currency futures – – – –
Interest rate swaps 379 794 (835) 338
Cross currency interest rate swaps – – – –
Derivatives designated as cash flow hedges (18) (28) 7 (39)
Currency swaps (20) (25) – (45)
Interest rate swaps 2 (3) 7 6
Derivatives designated as fair value portfolio
hedges – interest rate swaps – – – –
Derivatives designated as hedge of net investment
in subsidiaries (4) (24) – (28)
Currency options 3 – – 3
Forward exchange contracts (7) (24) – (31)
Total derivative assets/(liabilities) held for hedging 357 742 (828) 271
Total derivative assets/(liabilities) 3 579 280 (2 497) 1 362

Standard Bank Group annual report 2005 P • 135
2005 2004
Contract/ Contract/
Fair value Fair value notional Net fair Fair value Fair value notional
of assets of liabilities amount value of assets of liabilities amount
Rm Rm Rm Rm Rm Rm Rm
15 598 (14 817) 901 358 2 190 24 131 (21 941) 366 580
8 999 (7 505) 799 584 2 405 17 418 (15 013) 255 647
1 (1) 17 558 ( 61) 384 (445) 11 860
6 598 (7 311) 84 216 (154) 6 329 (6 483) 99 073
49 757 (49 291) 2 212 444 5 912 74 767 (68 855) 2 639 374
1 459 (1 973) 120 743 (390) 1 386 (1 776) 115 010
124 (90) 41 458 72 177 (105) 38 686
60 (31) 143 876 70 112 (42) 60 202
230 (250) 298 355 118 998 (880) 540 557
47 700 (46 778) 1 595 328 6 034 72 028 (65 994) 1 880 426
184 (169) 12 684 8 66 (58) 4 493
28 071 (27 515) 444 676 437 18 731 (18 294) 351 411
18 589 (16 464) 289 419 406 14 362 (13 956) 251 038
1 (1) 217 1 1 – 100
9 481 (11 050) 155 040 30 4 368 (4 338) 100 273
646 (1 276) 41 037 428 580 (152) 16 262
595 (358) 39 157 125 276 (151) 15 067
51 (918) 1 880 303 304 (1) 1 195
3 499 (3 581) 119 617 (360) 1 608 (1 968) 117 605
367 (312) 3 172 41 44 (3) 239
129 (113) 83 978 6 19 (13) 79 907
2 850 (2 942) 29 440 (473) 1 079 (1 552) 31 224
76 (104) 267 42 427 (385) 4 803
38 (29) 2 628 22 37 (15) 1 426
39 (81) 132 2 2 – 6
97 571 (96 480) 3 719 132 8 607 119 817 (111 210) 3 491 232
2 589 (2 251) 54 914 (155) 3 550 (3 705) 54 394
– – – 4 4 – 603
2 589 (2 251) 54 914 (199) 3 506 (3 705) 53 132
– – – 40 40 – 659
25 (64) 5 213 (23) 96 (119) 821
3 (48) 1 632 (20) 49 (69) 21
22 (16) 3 581 (3) 47 (50) 800
– – – (419) 761 (1 180) 3 200
3 (31) 616 12 12 – 1 839
3 – 557 – – – –
– (31) 59 12 12 – 1 839
2 617 (2 346) 60 743 (585) 4 419 (5 004) 60 254
100 188 (98 826) 3 779 875 8 022 124 236 (116 214) 3 551 486
Notes to the annual financial statements for the year ended 31 December 2005 continued
5 Derivative instruments continued
5.4 Use and measurement of derivative instrumentsIn the normal course of business, the group enters into a variety of derivative transactions for both trading and hedging
purposes. Derivative financial instruments are entered into for trading purposes and for hedging foreign exchange and
interest rate exposures. Derivative instruments used by the group in both trading and hedging activities include swaps,
options, forwards, futures, and other similar types of instruments based on foreign exchange rates, interest rates, credit risk
and the prices of commodities and equities.
The risks associated with derivative instruments are monitored in the same manner as for the underlying instruments. Risks
are also measured across the product range in order to take into account possible correlations.
The fair value of all derivatives is recognised on the balance sheet and is only netted to the extent that a legal right of set-
off exists and there is an intention to settle on a net basis.
Swaps are transactions in which two parties exchange cash flows on a specified notional amount for a predetermined period.
The major types of swap transactions undertaken by the group are as follows:
• Interest rate swap contracts generally entail the contractual exchange of fixed and floating rate interest payments in a
single currency, based on a notional amount and an interest reference rate.
• Cross currency interest rate swaps involve the exchange of interest payments based on two different currency principal
balances and interest reference rates and generally also entail exchange of principal amounts at the start and/or end of
the contract.
• Credit default swaps are the most common form of credit derivative, under which the party buying protection makes one
or more payments to the party selling protection during the life of the swap in exchange for an undertaking by the seller
to make a payment to the buyer following a credit event, as defined in the contract, with respect to a third party.
• Total return swaps are contracts in which one party (the total return payer) transfers the economic risks and rewards
associated with an underlying asset to another counterparty (the total return receiver). The transfer of risk and reward
is effected by way of an exchange of cash flows that mirror changes in the value of the underlying asset and any income
derived therefrom.
Options are contractual agreements under which the seller (writer) grants the purchaser the right, but not the obligation,
either to buy (call option) or to sell (put option) by or at a set date, a specified amount of a financial instrument or commodity
at a predetermined price. The seller receives a premium from the purchaser for this right. Options may be traded over-the-
counter (OTC) or on a regulated exchange.
Forwards and futures are contractual obligations to buy or sell financial instruments or commodities on a future date at a
specified price. Forward contracts are tailor-made agreements that are transacted between counterparties in the OTC
market, whereas futures are standardised contracts transacted on regulated exchanges.
5.5 Derivatives held for tradingThe group trades derivative instruments on behalf of customers and for its own positions. The group transacts derivative
contracts to address customer demands both as a market maker in the wholesale markets and in structuring tailored
derivatives for customers. The group also takes proprietary positions for its own account. Trading derivative products include
the following derivative instruments:
5.5.1 Foreign exchange derivatives
Foreign exchange derivatives are used to hedge foreign currency risks on behalf of customers and for the group's
own positions. Foreign exchange derivatives primarily consist of forward exchange contracts, foreign exchange
futures, and foreign exchange options.
5.5.2 Interest rate derivatives
Interest rate derivatives are used to modify the volatility and interest rate characteristics of interest-earning assets
and interest-bearing liabilities on behalf of customers and for the group's own positions. Interest rate derivatives
primarily consist of forward rate agreements, caps and floors, swaps, swaptions, future options, and bond and options.
5.5.3 Commodity derivatives
Commodity derivatives are used to address customer commodity demands and to take proprietary positions for the
group’s own account. Commodity derivatives primarily consist of commodity forwards, commodity futures, and
commodity options.
Standard Bank Group annual report 2005 P • 136

Standard Bank Group annual report 2005 P • 137
5 Derivative instruments continued
5.5 Derivatives held for trading continued
5.5.4 Credit derivatives
Credit derivatives are used to hedge the credit risk from one counterparty to another and manage the credit
exposure to selected counterparties on behalf of customers and for the group’s own positions. Credit derivatives
primarily consist of credit default swaps, credit linked notes, and total return swaps.
5.5.5 Equity derivatives
Equity derivatives are used to address customer equity demands and to take proprietary positions for the group’s
own account. Equity derivatives primarily consist of options, index options, forwards, futures, swaps and other
equity related financial derivative instruments.
5.6 Derivatives held for hedgingThe group enters into derivative transactions, which are designated and qualify as either fair value, cash flow, or net
investment hedges for recognised assets or liabilities or forecasted transactions. Derivatives held for hedging consist of:
5.6.1 Derivatives designated as fair value hedges
The group’s fair value hedges principally consist of currency futures, interest rate swaps and cross currency interest
rate swaps that are used to protect against changes in market interest rates and movements in exchange rates.
5.6.2 Derivatives designated as cash flow hedges
The group uses currency swaps and exchange traded currency options to protect against changes in cash flows of
certain variable rate debt issues. The group applies hedge accounting for its non-trading interest rate risk in major
currencies by analysing expected cash flows on a group basis. The objective is to protect against changes in future
interest cash flows resulting from the impact of changes in market interest rates, and reinvestment or reborrowing
of current balances.
5.6.3 Derivatives designated as fair value portfolio hedges
The group uses interest rate swaps for portfolio hedging of interest rate risk.
5.6.4 Derivatives designated as hedges of net investments in subsidiaries
The objective of the hedge of net investments is to limit the risk of a decline in net asset value of the investment
in a foreign entity brought about by changes in exchange rates. To limit the risk, currency option contracts have
been purchased where considered appropriate.

Notes to the annual financial statements for the year ended 31 December 2005 continued
2005 2004
Rm Rm
6 Trading assetsListed 28 068 19 480
– Securities of, or guaranteed by, the South African Government 5 636 3 004
– Other 22 432 16 476
Unlisted 10 056 12 724
Accrued interest 322 234
38 446 32 438
Dated assets 33 830 27 970
Undated assets 4 294 4 234
Accrued interest 322 234
38 446 32 438
Maturity analysis
The maturities represent periods to contractual redemption of the trading assets recorded.
– Redeemable on demand 4 630 2 893
– Maturing within 1 month 2 492 2 296
– Maturing after 1 month but within 6 months 5 389 7 893
– Maturing after 6 months but within 12 months 4 105 3 773
– Maturing after 12 months 17 536 11 349
– Undated assets 4 294 4 234
38 446 32 438
Redemption value
Dated trading assets had a redemption value at 31 December 2005 of R37 701 million (2004: R31 455 million).
Directors’ valuation
The directors’ valuation of unlisted investments is equal to the carrying value. All unlisted investments were valued at 31 December 2005.
Standard Bank Group annual report 2005 P • 138

Standard Bank Group annual report 2005 P • 139
2005 2004
Rm Rm
7 InvestmentsInvestment securities held in banking operations (note 7.1) 18 347 20 068
Investments held by insurance operations (note 7.2) 135 057 98 609
153 404 118 677
7.1 Investment securities held in banking operationsListed 13 977 15 241
– Securities of, or guaranteed by, the South African Government 11 151 13 940
– Other 2 826 1 301
Unlisted 3 998 4 464
Accrued interest 372 363
18 347 20 068
Comprising:
Investment securities held at fair value through profit or loss 13 378 13 961
Investment securities available-for-sale 1 491 625
Investment securities held-to-maturity 3 106 5 119
Accrued interest 372 363
18 347 20 068
Dated securities 13 648 14 473
Undated securities 4 327 5 232
Accrued interest 372 363
18 347 20 068
Fair value 18 414 20 425
Maturity analysis
The maturities represent periods to contractual redemption of the investment
securities recorded.
– Redeemable on demand 3 947 1 219
– Maturing within 1 month 1 270 54
– Maturing after 1 month but within 6 months 4 397 3 124
– Maturing after 6 months but within 12 months 331 761
– Maturing after 12 months 4 075 9 678
– Undated securities 4 327 5 232
18 347 20 068
Redemption value
Dated investment securities had a redemption value at 31 December 2005 of R13 156 million (2004: R14 122 million).
Investment registers
Registers of investment securities are available for inspection by members, or their authorised agents, at the registered
offices of the company and its subsidiaries.
Directors’ valuation
The directors’ valuation of unlisted investments is equal to the carrying value. All unlisted investments were valued at
31 December 2005.

Notes to the annual financial statements for the year ended 31 December 2005 continued
2005 2004
Rm Rm
7 Investments continued
7.2 Investments held by insurance operationsFinancial instruments (note 7.3) 123 953 89 469
Investment properties (note 7.4) 11 104 9 140
135 057 98 609
7.3 Financial instrumentsGovernment, municipal and utility stocks 20 413 13 328
Debentures 9 911 6 280
Listed equities 59 744 48 799
Mutual funds 25 218 15 426
Unlisted equities 2 404 2 017
Loans and receivables1 2 028 663
Money market securities 3 356 2 118
Insurance policies 879 838
123 953 89 469
Comprising:
Held at fair value through profit or loss 121 925 85 254
Available-for-sale2 – 3 816
Loans and receivables 2 028 399
123 953 89 469
Maturity analysis
– Maturing within 1 year 3 668 2 579
– Maturing after 1 year but within 5 years 12 253 7 350
– Maturing after 5 years but within 10 years 4 739 3 377
– Maturing after 10 years 9 618 6 566
– Variable1 2 074 399
– Undated assets 91 601 69 198
123 953 89 469
1Instruments in this category comprise loans secured against policyholder contracts. The maturity profile is not determinable
as the holder has the option to settle at any time prior to the policy maturity date.
2As allowed on adoption of IFRS, assets have been reclassified as held at fair value through profit or loss with effect from
1 January 2005.
Standard Bank Group annual report 2005 P • 140

Standard Bank Group annual report 2005 P • 141
2005 2004
Rm Rm
7 Investments continued
7.4 Investment propertiesCompleted properties
Fair-market value at beginning of the year1 9 140 9 554
Restatement on the adoption of IFRS – (593)
Restated fair-market value at beginning of the year 9 140 8 961
Net revaluations 859 494
Gross revaluations 818 531
Net movements on straight-lining of operating leases in terms of IFRS 41 (37)
Additions – property acquired 865 –
Additions – capitalised subsequent expenditure 22 190
Additions through business acquisition 258 –
Disposals (134) (466)
Reclassifications from/(to) owner-occupied properties 56 (39)
Transfers to properties under development (8) –
Fair�market value at end of the year 11 058 9 140
Properties under development
Cost at beginning of the year – –
Additions – capitalised subsequent expenditure 38 –
Transfers from completed properties 8 –
Cost at end of the year 46 –
Total investment properties 11 104 9 140
Classified as follows:
Investment properties at fair value 11 104 9 140
Operating lease – accrued income 849 891
Operating lease – accrued expense (260) (261)
11 693 9 770
Comprising:
Office buildings 1 339 1 228
Shopping malls 8 710 7 099
Hotels 1 332 1 133
Other 312 310
11 693 9 770
Investment properties were independently valued as at 31 December 2005 by a professional valuer registered with the
South African Council for the Property Valuers Profession as well as a member of the Institute of Valuers of South Africa.
At 31 December 2005 the value of unlet investment properties amounted to R82 million (2004: R47 million).
The property rental income earned by the group from its investment property, leased out under operating leases, amounted
to R1 233 million (2004: R1 181 million). Direct operating expenses arising on the investment property amounted to
R242 million (2004: R209 million).
1At 1 January 2004, R170 million relating to the investment in The Cullinan Hotel (Proprietary) Limited has been reclassified
to interest in associates and joint ventures.

Notes to the annual financial statements for the year ended 31 December 2005 continued
2005 2004
Rm Rm
8 Loans and advancesThe group extends advances to the personal, commercial and corporate sectors as well
as to the public sector. Advances made to individuals are mostly in the form of mortgages,
instalment credit, overdrafts and credit card borrowings. A significant portion of the group’s
advances to commercial and corporate borrowers consists of advances made to
companies engaged in manufacturing, finance and service industries.
8.1 Loans and advances net of impairmentLoans and receivables 335 886 258 219
Loans and advances to banks
– Call loans 7 708 3 635
– Loans granted under resale agreements 17 431 10 329
Loans and advances to customers
– Overnight lending 32 743 25 965
– Card debtors 11 967 7 852
– Revolving credit accounts 6 461 5 772
– Term lending 57 480 47 882
– Loans granted under resale agreements 8 860 6 918
– Instalment sales and finance leases1 (note 8.2) 42 125 34 844
– Mortgage lending1, 2 125 942 95 172
– Commercial property finance 16 196 12 095
– Other loans and advances 8 973 7 755
Held�to�maturity
– Instalment sale and finance leases to customers3 – 689
Held at fair value through profit or loss 35 2 039
Loans and advances to banks
– Call loans 10 138
– Loans granted under resale agreements – 503
Loans and advances to customers
– Term lending 25 –
– Mortgage lending3 – 1 398
Accrued interest 2 068 1 722
337 989 262 669
Credit impairments for loans and advances (note 8.3) (3 861) (3 796)
334 128 258 873
Fair value 337 959 262 646
Loans and advances included net positive fair value adjustments of R1 077 million (2004: R1 242 million) relating to loans and receivables which were subject to specific hedging relationships and were therefore only fair valued for the risk subject to hedging.1Loans and advances securitised
Mortgage lending 4 258 –Instalment sale and finance leases 2 633 –
6 891 –
The group retained the credit risk in both securitisation vehicles which is considered to be substantially all of the risks relatingto these loans. The securitisation vehicles containing these loans have therefore been consolidated and the liability tonoteholders has been disclosed as part of deposits, refer note 16.
2Mortgage lending includes capitalised origination costs of R696 million (2004: R475 million).
3On adoption of IFRS, the held-to-maturity loans and certain of the loan books held at fair value were reclassified to loans andreceivables. The reclassification is only applicable from 1 January 2005.
Standard Bank Group annual report 2005 P • 142

Standard Bank Group annual report 2005 P • 143
2005 2004
Rm Rm
8 Loans and advances continued
8.1 Loans and advances net of impairment continued
Maturity analysis
The maturity analysis is based on the remaining periods to contractual
maturity from year end.
– Redeemable on demand 37 347 29 695
– Maturing within 1 month 48 416 32 138
– Maturing after 1 month but within 6 months 36 075 28 125
– Maturing after 6 months but within 12 months 21 639 17 903
– Maturing after 12 months 194 512 154 808
337 989 262 669
Segmental analysis – industry
Agriculture 7 869 7 373
Construction 2 529 3 938
Electricity 1 904 1 223
Finance, real estate and other business services 75 046 55 601
Individuals 168 677 125 640
Manufacturing 19 683 16 565
Mining 8 139 4 710
Other services 40 353 34 531
Transport 7 500 7 930
Wholesale 6 289 5 158
337 989 262 669
Segmental analysis – geographic area
The following table sets out the distribution of the group’s loans and advances by geographic area where the loans are
recorded. The geographic spread of loans and advances within the various regions of South Africa closely follows the
demographic and economic activities within the country.
2005 2005 2004 2004
% Rm % Rm
South Africa 76 255 333 77 203 138
Rest of Africa 4 14 412 5 12 109
Rest of world 20 68 244 18 47 422
100 337 989 100 262 669

Notes to the annual financial statements for the year ended 31 December 2005 continued
2005 2004
Rm Rm
8 Loans and advances continued
8.2 Instalment financeGross investment in instalment finance 50 026 41 811
Unearned finance charges deducted 7 901 6 967
Net investment in instalment finance 42 125 34 844
8.3 Credit impairments for loans and advancesBalance at beginning of the year 3 796 3 908
Adoption of IFRS (109)
Restated balance 3 687 3 908
Acquisition of subsidiaries – 32
Non-performing loans written off (1 097) (1 122)
Discount element recognised in interest income (note 23.1) (240) (258)
Net impairments raised (note 23.6) 1 491 1 427
Exchange and other movements 20 (191)
Balance at end of the year 3 861 3 796
Comprising:
Impairments for non-performing loans 2 160 2 335
Impairments for performing loans 1 701 1 461
3 861 3 796
Segmental analysis of impairments for non�performing loans – industry
Agriculture 61 51
Construction 47 39
Electricity 1 1
Finance, real estate and other business services 375 367
Individuals 744 848
Manufacturing 161 184
Mining 205 244
Other services 374 458
Transport 31 24
Wholesale 161 119
2 160 2 335
Segmental analysis of impairments for non�performing loans – geographic area
The following table sets out the distribution of the group’s impairments by geographic area where the loans are recorded.
2005 2005 2004 2004
% Rm % Rm
South Africa 69 1 480 65 1 527
Rest of Africa 10 221 12 278
Rest of world 21 459 23 530
100 2 160 100 2 335
Standard Bank Group annual report 2005 P • 144

Standard Bank Group annual report 2005 P • 145
2005 2004
Rm Rm
9 Current and deferred taxationCurrent taxation assets 422 537
Deferred taxation assets (note 17.1) 568 557
990 1 094
10 Other assetsTrading settlement assets 3 883 6 174
Items in the course of collection 750 639
Operating lease – accrued income 849 891
Insurance prepayments and reinsurance assets 2 962 2 690
Other debtors 4 559 6 829
13 003 17 223
11 Interest in associates and joint venturesAssociates and joint ventures accounted for under the equity method 1 048 496
Associates held at fair value1 3 937 2 754
4 985 3 250
Equity accounted associates and joint ventures
Carrying value at beginning of the year 496 711
Share of profit 226 127
Acquisition resulting in associate becoming a subsidiary – (231)
Net acquisitions/(disposals) 421 (31)
Distribution of profit (95) (80)
Carrying value at end of the year 1 048 496
Comprising:
Cost of investments 736 340
Share of reserves 396 240
Goodwill impairment (84) (84)
1 048 496
Directors’ valuation
The directors’ valuation of the investments in associates and joint ventures is
R5 257 million (2004: R3 347 million).
Equity accounted associates and joint ventures and the group’s interests therein are
listed in Annexure D on page 198.
1Key financial information of associates held at fair value
Investments 11 300 9 887
Current assets 233 669
Current liabilities (96) (43)
Total fair value 11 437 10 513
Associates held at fair value consist of units or shares in mutual funds held by Liberty Life. The units or shares are by their nature
demand deposits and are held at fair value. The net income or loss is capitalised to unit values within each fund and is equivalent to
the fair value adjustments.

Notes to the annual financial statements for the year ended 31 December 2005 continued
2005 2004
Rm Rm
12 Goodwill and other intangible assetsGoodwill (note 12.1) 639 473
Other intangible assets (note 12.2) 1 814 492
2 453 965
12.1 GoodwillGoodwill on subsidiariesCost at beginning of the year 625 449
Acquisitions 703 186
Negative goodwill recognised – 2
At acquisition fair value adjustment1 – 24
Disposals2 (237) (9)
Exchange movements 2 (27)
Cost at end of the year 1 093 625
Accumulated impairment at beginning of the year (152) (106)
Goodwill impairment charge (note 23.9) (421) (48)
Negative goodwill recognised – (2)
Disposals2 119 –
Exchange movements – 4
Accumulated impairment at end of the year (454) (152)
Net goodwill 639 473
1R19 million relates to a 2005 adjustment after initial recognition, which restated the prior year number.
2Disposals of R118 million relate to assets transferred to assets held for sale.
2005 2004
Gross Accumulated Net Net
goodwill impairment goodwill goodwill
Rm Rm Rm Rm
Goodwill comprises:Capital Alliance Holdings Limited 397 (397) – –
Liberty Ermitage Jersey Limited – – – 81
Liberty Group Limited 309 – 309 94
Liberty Holdings Limited 34 – 34 –
Melville Douglas Investment
Management (Proprietary) Limited 45 (18) 27 27
SBBL Limited 20 – 20 22
Stanbic Bank Limited (Malawi) 33 – 33 32
Stanbic Bank Uganda Limited 10 – 10 9
Stanbic Bank Nigeria Limited 4 – 4 –
Standard Bank Asia Limited 44 (15) 29 25
Standard Bank s.a.r.l Mozambique 98 – 98 98
Standard Yatirim Menkul Kiymetler A.S. 2 (1) 1 1
Stanlib Limited 56 – 56 56
Triskelion Trust Company Limited 41 (23) 18 28
1 093 (454) 639 473
Impairment testingFor the purposes of impairment testing, the goodwill is allocated to the smallest cash generating unit. The cash generating
units are defined as the corporate entities listed above. The goodwill is tested annually for impairment and in the majority of
cases the impairment is tested using the value in use as the recoverable amount.
The largest impairment incurred was that of Capital Alliance Holdings Limited (CAHL). The goodwill arose from the residual
cost of CAHL over its embedded value. All the cash flows from the entity’s cash generating units have been taken into account
in calculating the embedded value. As there are no further cash flows to attribute to the goodwill it is impaired in full.
Standard Bank Group annual report 2005 P • 146

Standard Bank Group annual report 2005 P • 147
2005 2004
Accu� Accu-
mulated Net book mulated Net book
Cost amortisation value Cost amortisation value
Rm Rm Rm Rm Rm Rm
12 Goodwill and other intangible assets continued
12.2 Other intangible assetsSummary
Computer software 904 531 373 758 422 336
Present value of acquired
in-force life insurance business 1 624 183 1 441 189 33 156
2 528 714 1 814 947 455 492
Movement
2004 2005
Carrying Exchange Carrying
value Additions)1 Disposals)2 Impairments Amortisation movements value
Rm Rm Rm Rm Rm Rm Rm
Computer software 336 147 – – (114) 4 373
Present value of
acquired in-force
life insurance
business 156 1 483 (44) – (154) – 1 441
492 1 630 (44) – (268) 4 1 814
2003 2004
Carrying Exchange Carrying
value)3 Additions)4 Disposals Impairments Amortisation movements value
Rm Rm Rm Rm Rm Rm Rm
Computer software 320 164 (1) (12) (132) (3) 336
Present value of
acquired in-force
life insurance
business 175 – – – (19) – 156
495 164 (1) (12) (151) (3) 492
1Includes additions arising from a business combination of R1 427 million.
2Disposals of R44 million relate to assets transferred to assets held for sale.
3The 2003 carrying value has been restated by R53 million on adoption of IFRS.
4Included in the additions of computer software is R22 million due to an acquisition resulting in an associate becoming a
subsidiary.

Notes to the annual financial statements for the year ended 31 December 2005 continued
2005 2004
Accu� Accu-
mulated Net book mulated Net book
Cost depreciation value Cost depreciation value
Rm Rm Rm Rm Rm Rm
13 Property and equipment13.1 Summary
Property
Freehold 1 962 283 1 679 1 680 276 1 404
Leasehold 265 103 162 195 82 113
2 227 386 1 841 1 875 358 1 517
Equipment
Computer equipment 3 386 1 989 1 397 3 312 1 942 1 370
Motor vehicles 673 295 378 696 308 388
Office equipment 366 184 182 386 207 179
Furniture and fittings 1 455 717 738 1 482 822 660
5 880 3 185 2 695 5 876 3 279 2 597
8 107 3 571 4 536 7 751 3 637 4 114
13.2 Movement
2004 2005
Carrying Exchange Carrying
value)1 Additions)2, 3 Disposals)4 Impairments Depreciation movements value
Rm Rm Rm Rm Rm Rm Rm
Property
Freehold 1 404 350 (59) – (16) – 1 679
Leasehold 113 64 (1) – (18) 4 162
1 517 414 (60) – (34) 4 1 841
Equipment
Computer equipment 1 370 598 (34) – (549) 12 1 397
Motor vehicles 388 197 (67) – (143) 3 378
Office equipment 179 50 (9) – (43) 5 182
Furniture and fittings 660 233 (16) – (148) 9 738
2 597 1 078 (126) – (883) 29 2 695
Total 4 114 1 492 (186) – (917) 33 4 536
1Opening balances have been restated for IFRS by R46 million (2004: R40 million).
2Includes additions arising from a business combination of R43 million.
3Includes transfer to investment properties of R56 million (2004: transfer from: R39 million).
4Included in disposals is R16 million relating to business disposals and assets transferred to assets held for sale.
Standard Bank Group annual report 2005 P • 148

Standard Bank Group annual report 2005 P • 149
2003 2004
Carrying Exchange Carrying
value Additions Disposals Impairments Depreciation movements value
Rm Rm Rm Rm Rm Rm Rm
13 Property and equipment continued
13.2 Movement continued
Property
Freehold 1 413 110 (70) (13) (15) (21) 1 404
Leasehold 117 37 (20) – (15) (6) 113
1 530 147 (90) (13) (30) (27) 1 517
Equipment
Computer equipment 1 498 595 (51) (2) (636) (34) 1 370
Motor vehicles 352 234 (79) – (114) (5) 388
Office equipment 189 65 (13) – (43) (19) 179
Furniture and fittings 599 237 (33) – (125) (18) 660
2 638 1 131 (176) (2) (918) (76) 2 597
Total 4 168 1 278 (266) (15) (948) (103) 4 114
13.3 ValuationThe fair-market value of freehold property, based on valuations undertaken during 2005 and 2004 by valuers registered
under the Valuers Act 1982, was estimated at R2 033 million (2004: R1 907 million). Registers of property are available
for inspection by members, or their authorised agents, at the registered offices of the company and its subsidiaries. Valuation
was generally in terms of the investment method whereby net income is capitalised having regard to tenancy, location and
the physical nature of the property.
2005 2004
Rm Rm
14 Share capital14.1 Authorised
1 750 000 000 (2004: 1 750 000 000) ordinary shares of 10 cents each 175 175
8 000 000 (2004: 8 000 000) 6,5% first cumulative preference shares
of R1 each 8 8
1 000 000 000 (2004: 1 000 000 000) non-redeemable, non-cumulative,
non-participating preference shares of R0,01 each 10 10
193 193

Notes to the annual financial statements for the year ended 31 December 2005 continued
2005 2004
Rm Rm
14 Share capital continued
14.2 Issued Ordinary share capital 135 135
1 352 382 919 (2004: 1 352 108 367) ordinary shares
of 10 cents each
Ordinary share premium 2 107 2 541
A premium of R245 million, net of R1 million costs,
(2004: R268 million) was raised on the allotment and issue
during the year of 10 439 067 ordinary shares (2004: 13 378 700).
A premium of R679 million, including R2 million costs, was utilised
on the buy-back of 10 164 515 ordinary shares.
Preference share capital and premium 2 991 2 991
8 000 000 (2004: 8 000 000) 6,5% first cumulative preference shares
of R1 each – first preference shares 8 8
30 000 000 (2004: 30 000 000) non-redeemable, non-cumulative,
non-participating preference shares of R0,01 each – second
preference shares – –
Preference share premium – non-redeemable, non-cumulative,
non-participating preference shares – second preference shares 2 983 2 983
The non-redeemable, non-cumulative, non-participating preference shares
are entitled to an annual dividend, if declared, payable in two semi-annual
instalments of not less than 70% of the prime rate multiplied by the
subscription price of R100 per share.
5 233 5 667
The number of options and appreciation rights available to be granted under the terms of the group's equity compensation
plans as at the end of the year was 65 983 431 (2004: 55 300 684).
The group’s equity compensation plans reconciliations are given in Annexure E on page 200.
Number of ordinary
shares
Reconciliation of shares issuedShares in issue at 1 January 2004 1 338 729 667
Shares issued during 2004 in terms of the group’s equity compensation plans 13 378 700
Shares in issue at 31 December 2004 1 352 108 367
Shares held in terms of the Tutuwa initiative (note 21) 99 190 197
Shares held by other shareholders 1 252 918 170
Shares issued during 2005 in terms of the group’s equity compensation plans 10 439 067
Shares repurchased and cancelled during the year (10 164 515)
Shares in issue at 31 December 2005 1 352 382 919
Shares held in terms of the Tutuwa initiative (note 21) 99 190 197
Treasury shares held by Liberty Life for the benefit of policyholders 46 488 554
Shares held by other shareholders 1 206 704 168
Standard Bank Group annual report 2005 P • 150

Standard Bank Group annual report 2005 P • 151
2005 2004
Rm Rm
14 Share capital continued
14.3 Unissued shares262 406 244 (2004: 262 680 796) ordinary shares of 10 cents each, of
which 67 605 418 (2004: 133 872 967) are under the general authority
of the directors which authority expires at the annual general meeting to be
held on 24 May 2006. 26 26
135 210 837 (2004: 135 210 837) ordinary shares of 10 cents each are
reserved to meet the requirements of the group’s equity compensation plans
in terms of the authority vested in the directors by members’ resolution
dated 25 May 2005. 14 14
970 000 000 (2004: 970 000 000) non-redeemable, non-cumulative,
non-participating preference shares of R0,01 each are under the general
authority of the directors which authority expires at the annual general
meeting to be held on 24 May 2006. 10 10
50 50
14.4 Interest of directors in service at 31 December 2005 in the capital of the companyThe directors’ interests are listed on pages 44, 94 and 95.
Number of shares as at 31 December
Beneficial ordinary shares 12 243 067 11 898 331
Beneficial non-redeemable, non-cumulative, non-participating preference shares 17 086 24 040
Options 1 748 400 2 256 900
15 Trading liabilitiesListed 17 680 8 734
Unlisted 3 782 5 676
21 462 14 410
Dated liabilities 11 812 11 137
Undated liabilities 9 650 3 273
21 462 14 410
Maturity analysis
The maturity analysis is based on the remaining periods to contractual
maturity from year end.
– Repayable on demand – 100
– Maturing within 1 month 174 254
– Maturing after 1 month but within 6 months 1 048 988
– Maturing after 6 months but within 12 months 1 333 773
– Maturing after 12 months 9 257 9 022
– Undated liabilities 9 650 3 273
21 462 14 410

Notes to the annual financial statements for the year ended 31 December 2005 continued
2005 2004
Rm Rm
16 Deposit and current accountsDeposit products include cheque accounts, savings accounts, call and
notice deposits, fixed deposits and negotiable certificates of deposit.
The repricing maturities analysis for banking operations in South Africa
for December 2005 is disclosed on page 61.
Held at amortised cost 384 441 308 596
Deposits and loans from banks
– Deposits from banks and central banks 8 187 15 758
– Deposits from banks under repurchase agreements 8 778 7 773
Deposits and loans from customers
– Current accounts 47 811 38 487
– Cash management deposits 55 003 44 667
– Card creditors 1 188 1 059
– Call deposits 66 512 43 397
– Savings accounts 15 478 11 566
– Term deposits 104 542 103 020
– Negotiable certificates of deposit 43 544 26 363
– Repurchase agreements 12 488 3 718
– Securitisation fundings 7 326 –
– Other funding and loans 13 584 12 788
Held at fair value through profit or loss 22 888 7 996
Deposits and loans from banks
– Deposits from banks and central banks 9 245 5 695
– Deposits from banks under repurchase agreements 60 6
Customer call deposits 13 583 2 295
Accrued interest 5 133 5 885
412 462 322 477
Deposit and current accounts were increased by fair value adjustments of R436 million
(2004: R575 million) relating to deposit and current accounts which were subject to
specific hedging relationships and were therefore only fair valued for the risk
subject to hedging.
Maturity analysis
The maturity analysis is based on the remaining periods to contractual maturity
from year end.
– Repayable on demand 207 089 175 207
– Maturing within 1 month 71 080 50 804
– Maturing after 1 month but within 6 months 75 068 51 395
– Maturing after 6 months but within 12 months 20 594 21 192
– Maturing after 12 months 38 631 23 879
412 462 322 477
Standard Bank Group annual report 2005 P • 152

Standard Bank Group annual report 2005 P • 153
2005 2005 2004 2004
% Rm % Rm
16 Deposit and current accounts continued
Segmental analysis – geographic area
The following table sets out the distribution of
the group's deposit and current accounts by
geographic area. The geographic spread of
deposit and current accounts within the various
regions of South Africa closely follows the
demographic and economic activities within
the country.
South Africa 79 324 678 80 255 496
Rest of Africa 5 22 981 6 20 884
Rest of world 16 64 803 14 46 097
100 412 462 100 322 477
2005 2004
Rm Rm
17 Current and deferred taxationCurrent taxation liability 2 145 1 014
Deferred taxation liability 4 781 3 798
6 926 4 812
17.1 Deferred tax analysisAccrued interest receivable 22 39
Assessed losses (69) (79)
Assets on lease 208 208
Capital gains tax 1 019 616
Credit impairment charges (559) (463)
Deferred acquisition costs 82 –
Deferred revenue liability (18) –
Depreciation 77 112
Derivatives 2 172 1 761
Fair value adjustments of financial instruments 84 96
Intangible asset – PVIF 421 47
Investment properties surplus 806 564
Net prepaid commission – 19
Policyholder change in valuation basis 416 –
Post-retirement benefits (378) (233)
Secondary tax on companies (66) (223)
Special transfer to life fund (361) –
Other differences 357 777
Deferred tax closing balance 4 213 3 241
Deferred tax liability 4 781 3 798
Deferred tax asset (note 9) (568) (557)

Notes to the annual financial statements for the year ended 31 December 2005 continued
2005 2004
Rm Rm
17 Current and deferred taxation continued
17.2 Deferred tax reconciliationDeferred tax at beginning of the year 3 241 2 104
Change in company tax rate (89) –
Adoption of IFRS 21 703
Restated balance 3 173 2 807
Various categories of originating/(reversing) temporary differences for the year: 1 040 434
Accrued interest receivable (15) 16
Assessed losses 7 –
Assets on lease 6 (199)
Capital gains tax 411 296
Credit impairment charges (141) 139
Deferred acquisition costs 82 –
Deferred revenue liability (18) –
Depreciation (32) 45
Derivatives 473 48
Fair value adjustments of financial instruments (11) 98
Intangible asset – PVIF 375 –
Investment properties surpluses 242 (121)
Net prepaid commission (19) 34
Policyholder change in valuation basis 416 –
Post-retirement benefits contributions (149) (61)
Secondary tax on companies 158 (47)
Special transfer to life fund (361) –
Other differences (384) 186
Deferred tax at end of the year 4 213 3 241
Temporary differences for the year comprise:
Recognised directly in equity 45 161
Recognised in the income statement 708 273
Acquisitions 287 –
1 040 434
Subsequent to year end a final ordinary dividend of 145,0 cents per share (2004: 181,0 cents per share) was declared. In
addition, the half yearly dividend on the non-redeemable, non-cumulative, non-participating shares of 370,52 cents per
share (2004: 379,34 cents per share) was declared. The declarations will result in a secondary tax on companies charge of
R259 million (2004: R320 million).
Standard Bank Group annual report 2005 P • 154

Standard Bank Group annual report 2005 P • 155
2005 2004
Rm Rm
18 Other liabilities 18.1 Summary
Trading settlement liabilities 2 028 1 644
Items in the course of transmission 496 974
Provision for post-retirement benefits (note 18.2) 1 086 937
Third party liabilities arising on consolidation of mutual funds 4 877 3 523
Operating lease – accrued expense 260 261
Cash-settled share-based payment liability 177 136
Insurance payables 3 765 2 058
Other liabilities 8 603 6 541
21 292 16 074
18.2 Provision for post�retirement benefitsBalance at beginning of the year 937 727
Net provision raised 149 210
Balance at end of the year 1 086 937
Details on post-retirement benefits are provided in note 33 on page 173.
19 Policyholders’ liabilitiesPolicyholders’ liabilities under insurance contracts (note 19.1) 103 979 65 972
Policyholders’ liabilities under investment contracts (note 19.2) 36 856 32 021
140 835 97 993
19.1 Policyholders’ liabilities under insurance contractsInsurance contract liabilities before deferred taxation adjustment
as previously reported 66 414 56 296
Total deferred taxation applicable to fair value adjustments on investment properties (442) (527)
Balance at beginning of the year as restated for IFRS 65 972 55 769
Reclassification of contracts on adoption of IFRS 4 611 –
Revaluation on adoption of IFRS (28) –
Balance at beginning of the year as restated for IFRS on 1 January 2005 70 555 55 769
Additions through business acquisition 15 211 –
Transfer to policyholders’ liabilities 18 958 9 710
Bases changes 373 –
Other 18 762 9 625
Movement in deferred taxation applicable to fair value adjustments
on investment properties (177) 85
Reclassification of reinsurance assets – 493
Disclosed as disposal groups held for sale (745) –
Balance at end of the year 103 979 65 972
Insurance contracts before deferred taxation adjustment 104 598 66 414
Total deferred taxation applicable to fair value adjustments on investment property (619) (442)

Notes to the annual financial statements for the year ended 31 December 2005 continued
2005 2004
Rm Rm
19 Policyholders’ liabilities continued
19.2 Policyholders’ liabilities under investment contractsInvestment contract liabilities before deferred taxation adjustment
as previously reported 32 128 27 544
Total deferred taxation applicable to fair value adjustments on investment properties (107) (128)
Balance at beginning of the year as restated for IFRS 32 021 27 416
Reclassification of contracts on adoption of IFRS (4 611) –
Revaluation on adoption of IFRS 41 –
Balance at beginning of the year as restated for IFRS on 1 January 2005 27 451 27 416
Additions through business acquisition 2 606 –
Fair value adjustment 6 834 4 666
Service fee income from investment contracts (720) (700)
Fund flows from investment contracts 767 639
Inflows 8 312 8 148
Payments (7 545) (7 509)
Disclosed as disposal groups held for sale (82) –
Balance at end of the year 36 856 32 021
Investment contracts before deferred taxation adjustment 37 006 32 128
Total deferred taxation applicable to fair value adjustments on investment property (150) (107)
Carrying Notional Carrying Notional
value)* value value)* value
2005 2005 2004 2004
Rm Rm Rm Rm
20 Subordinated bondsUnsecured, subordinated, redeemableQualifying as secondary capital in terms of
applicable banking legislation: 9 591 9 467 8 211 8 042
Redeemable in 2010 (SBK 1)1 1 219 1 200
Redeemable in 2010 (SBK 2)2 1 500 1 500
Redeemable in 20103 563 563
Redeemable in 20114 150 150 150 150
Redeemable in 20135 58 58 66 66
Redeemable in 2013 (SBK 3)6 2 050 2 000 2 066 2 000
Redeemable in 20147 635 635 563 563
Redeemable in 20158 1 589 1 589Redeemable in 20159 35 35Redeemable in 2016 (SBK 5)10 2 067 2 000 2 084 2 000
Redeemable in 2020 (SBK 7)11 3 007 3 000
Qualifying as tertiary capital in terms of
applicable banking legislation: 854 854 1 282 1 282
Redeemable in 2005 (SBK 4)12 1 000 1 000
Redeemable in 200513 282 282
Redeemable in 2007 (SBK 6)14 600 600Redeemable in 200715 254 254
Qualifying as secondary capital for the
insurance operations16 2 000 2 000Accrued interest 199 167
12 644 12 321 9 660 9 324
Fair value 13 402 9 878
Standard Bank Group annual report 2005 P • 156

Standard Bank Group annual report 2005 P • 157
20 Subordinated bonds continued
The group did not default on principal or interest and no other breaches with respect to these liabilities occurred during the year.
*The difference of R124 million (2004: R169 million), after excluding accrued interest, between the carrying and notional valuerepresents subordinated bonds fair valued for interest rate risk as the hedged items in interest rate hedging relationships. Certainhedge relationships expired in prior years and the fair value adjustments are now amortised over the remaining lives of the bonds.
115,5% bonds issued in rands and paid a fixed semi-annual coupon. The bonds carried an option to be called at their nominal value on1 June 2005 or on any interest payment date thereafter. The option was exercised on 1 June 2005 and the bonds were redeemed atthe nominal value.
213,75% bonds issued in rands and paid a fixed semi-annual coupon. The bonds carried an option to be called at their nominal valueon 2 December 2005 or on any interest payment date thereafter. The option was exercised on 2 December 2005 and the bonds wereredeemed at the nominal value.
3Bonds issued in US dollars (US$100 million) and paid interest at a floating rate equal to the aggregate of 3% per annum and theoffered rate for three-month US dollar deposits in the London interbank market. The bonds carried an option to be called at theirnominal value on 25 November 2005 or on any interest payment date thereafter. The option was exercised on 25 November 2005and the bonds were redeemed at the nominal value.
412% bonds issued in Namibian dollars (N$150 million) and paying a fixed semi-annual coupon. The bonds carry an option to be calledat their nominal value on 20 November 2006 or on any interest payment date thereafter. After this option date, the coupon switchesto the bid yield rate for the Republic of Namibia GC10 12% Bond plus 280 basis points, until maturity on 20 November 2011.
5Bonds issued in Botswana pula (BP50 million) and paying interest at a floating rate equal to 125 basis points over three-monthBotswana Certificates. The bonds convert into preference shares in the event that Stanbic Bank Botswana eliminates its net worth. After12 December 2008, the coupon switches to 200 basis points over three-month Botswana Certificates, until maturity on 12 December 2013.
611,25% bonds issued in rands and paying a fixed semi-annual coupon. The bonds carry an option to be called at their nominal valueon 31 October 2008 or on any interest payment date thereafter. After this option date, the coupon switches to floating at the averagemid-market yield rate per annum for three-month ZAR deposits plus 209 basis points, until maturity on 31 October 2013.
7Bonds issued in US dollars (US$100 million) bearing interest from issue date 14 July 2004 to 15 July 2009 at a floating rate equalto the aggregate of 2,5% per annum and the offered rate for three-month U.S. dollar deposits in the London interbank market. Thebonds carry an option to be redeemed in full at their nominal amount on or after 15 July 2009. After this option date, the couponswitches to a rate per annum equal to the aggregate of 3% per annum and the offered rate for three-month US dollar deposits in theLondon interbank market, until maturity on 14 July 2014.
8Bonds issued in US dollars (US$250 million) bearing interest from issue date 7 October 2005 to 8 October 2010 at a floating rateequal to the aggregate of 1,15% per annum and the offered rate for three-month US dollar deposits in the London interbank market.From 8 October 2010 to 7 October 2015, the date of their redemption, these bonds bear interest at a rate per annum equal to theaggregate of 1,65% per annum and the offered rate for three-month US dollar deposits in the London interbank market. The issuermay, on 8 October 2010 or on any subsequent interest payment date, redeem in full, the notes at their nominal value.
9Bonds issued in Emalangeni (E35 million) bearing interest from issue date 15 September 2005 to 15 September 2010 at a fixed rateof 9,73% per annum. From 15 September 2010 to 15 September 2015, the date of their redemption, they bear interest at a floatingrate per annum determined by the calculation agent. The issuer may, on 15 September 2010 or on any subsequent interest paymentdate, redeem in full the notes at their nominal value.
109,5% bonds issued in rands and paying a fixed annual coupon. The bonds carry an option to be called at their nominal value on 17 November 2011 or on any interest payment date thereafter. After this option date, the coupon rate switches to a three-monthfloating Johannesburg interbank agreed rate plus 162 basis points, until maturity on 17 November 2016.
119,63% bonds issued in rands and paying a fixed semi-annual coupon. The bonds carry an option to be called at their nominal valueon 24 May 2015 or on any interest payment date thereafter. After this option date, the coupon rate switches to a three-monthfloating Johannesburg interbank agreed rate plus 197 basis points, until maturity on 24 May 2020.
1212,5% bonds issued in rands and paid a fixed semi-annual coupon. The bonds were redeemed on 15 February 2005. 13Bonds issued in US dollars (US$50 million) and paid interest at a floating rate equal to the aggregate of 2,75% per annum and the
offered rate for three-month US dollar deposits in the London interbank market. The bonds were redeemed on 22 February 2005 atthe nominal value.
147,7% bonds issued in rands and paying a fixed semi-annual coupon. SBSA is entitled to defer the due date for payment of any principalor interest in respect of the bonds if so required by the Registrar of Banks. Such deferment would be subject to conditions prescribedby the Registrar of Banks. The bonds are redeemable on 1 March 2007.
15Bonds issued in US dollars (US$40 million) at a floating rate equal to the aggregate of 1,5% per annum and the offered rate for US dollar deposits in the London interbank market. The bonds are redeemable on 15 April 2007.
168,93% bonds issued in rands and paying a fixed semi-annual coupon. The bonds carry an option to be called at their nominal amounton 12 September 2012 by Liberty. After this option date, the coupon switches to a three-month floating Johannesburg interbankagreed rate plus 186 basis points payable quarterly, until maturity on 12 September 2017.

Notes to the annual financial statements for the year ended 31 December 2005 continued
2005 2004
Rm Rm
21 Empowerment reserveStandard Bank Group and Liberty Life entered into a series of transactions during 2004
whereby investments totalling R4 017 million and R1 251 million respectively, were made
in cumulative redeemable preference shares.
Number of Issue priceBeneficiary preference shares per share (R)Shanduka – Tutuwa Strategic Holdings 1
(Proprietary) Limited1 651 589 1 000 652 652
Safika – Tutuwa Strategic Holdings 2
(Proprietary) Limited1 977 383 1 000 977 977
Black Managers’ Trust – Staff Holdings 1–3
(Proprietary) Limited1 1 573 746 1 000 1 574 1 574
The Community Trust – Community Holdings
(Proprietary) Limited1 814 486 1 000 814 814
Standard Bank operations investment 4 017 4 017
Liberty Life investment 1 251 1 251
Total investment 5 268 5 268
Attributable to minorities of Liberty Life (908) (908)
Empowerment reserve 4 360 4 360
Unrecognised profit on sale attributable to Standard Bank Group (114) (114)
Liberty Holdings – unrecognised profit on sale of shares in subsidiary (208) (208)
Unrecognised profit on sale attributable to minorities 94 94
Standard Bank Group empowerment reserve 4 246 4 246
The cumulative redeemable preference shares owned by Standard Bank attract dividends at 8,5% per annum, whilst those of Liberty
Life accrue dividends at 66% of the Standard Bank prime lending rate. The dividend obligation of the preference shares compound
on each date the issuing company receives a dividend from Standard Bank or Liberty Life respectively. The legal accrual of the
preference dividend does not result in an accounting entry but rather lengthens the repayment period. At year end the accumulated
obligation, including accrued dividends, was R4 143 million (2004: R4 100 million) for Standard Bank and R1 279 million
(2004: R1 264 million) for Liberty Life.
The preference shares do not meet the definition of a financial asset in terms of IFRS and therefore the preference shares are treated
as a reduction of equity and are stated in the analysis of equity as a debit empowerment reserve. This will apply until third party financing
or full redemption of the preference shares. The transaction is accounted for as a derivative equity-linked instrument. On receipt,
preference share dividends are credited directly to reserves. The profit realised by Liberty Holdings as a result of the buy-back of shares
by Liberty Group was not recognised as the sale of special purpose vehicles to the black participants was not accounted for. As the
preference share capital is repaid by the black participants, Liberty Holdings will recognise the profit over the repayment term.
For the purposes of the earnings per share calculation the weighted average number of company shares in issue is reduced by the number
of shares held by the empowerment companies bought with the proceeds received from the preference shares (note 28).
The group adopted IFRS 2 – Share-based Payments, from 1 January 2005. IFRIC 8 – Scope of IFRS 2, was recently issued which
concluded that IFRS 2 is applicable to transactions in which an entity cannot identify specifically some or all of the goods or services
received. As a result of this interpretation the group has early adopted IFRIC 8 and applied IFRS 2 to the Tutuwa transaction.
The instrument was valued using a number of valuation techniques that included the Black-Scholes and discounted cash flow methods.
Due to the uniqueness of the instrument, the mid-point of the range of valuations was used arriving at a value of
R8,50 per Standard Bank Group instrument at 4 October 2004. IFRS 2 is only applicable to instruments that had not vested by
31 December 2004. As the group elected not to apply the provisions of IFRS 2 to equity-settled awards granted which had vested prior
to 1 January 2005, the instruments relating to Shanduka, Safika and the Community Trust vested on 4 October 2004 and are therefore
not subject to IFRS 2. The instruments relating to the Standard Bank operations Black Managers’ Trusts are accounted for over the vesting
period ending 31 December 2010 resulting in an annual expense, until 2010, of approximately R66 million (2004: R16 million). Liberty
Life has applied similar principles and has accounted for an expense of R25 million (2004: R4 million).
1The above SPVs owned 99 190 197 ordinary shares of Standard Bank Group on 31 December 2005 and 31 December 2004.
Standard Bank Group annual report 2005 P • 158

Standard Bank Group annual report 2005 P • 159
2005 2004
Rm Rm
22 Contingent liabilities and capital commitments22.1 Contingent liabilities
Letters of credit 5 398 4 827
Guarantees 16 309 17 520
Irrevocable unutilised facilities 26 417 18 497
48 124 40 844
No material losses are anticipated as a result of these transactions.
22.2 Capital commitmentsCapital Alliance Holdings Limited acquisition – 3 094
Contracted capital expenditure 552 664
Capital expenditure authorised but not yet contracted 876 768
1 428 4 526
The expenditure will be funded from the group’s internal resources.
22.3 Financial assets pledgedAssets are pledged as collateral under repurchase agreements with other banks and for security deposits relating to local
futures, options and stock exchange memberships.
Asset Related liability
2005 2004 2005 2004
Rm Rm Rm Rm
Trading assets subject to repurchase
commitments 16 253 7 397 19 294 6 585
Trading assets pledged as security 1 003 – 1 007 –
Investment securities subject to
repurchase commitments 1 602 2 148 1 302 1 931
18 858 9 545 21 603 8 516
Financial assets of securitisation and other special purpose vehicles amounting to R17 747 million (2004: R9 966 million)
have been pledged (note 2.4).
22.4 Operating lease commitmentsThe future minimum payments under non–cancellable operating leases are as follows:
2005 2004
Rm Rm
Properties
Within 1 year 477 231
After 1 year but within 5 years 1 116 949
After 5 years 560 1 249
2 153 2 429
Equipment
Within 1 year 43 13
After 1 year but within 5 years 57 5
After 5 years – 3
100 21

Notes to the annual financial statements for the year ended 31 December 2005 continued
2005 2004
Rm Rm
23 Supplementary income statement information 23.1 Interest income
Interest on loans and advances and short-term funds 35 636 29 838
Interest on investment securities 1 989 4 508
Discount element recognised from credit impairments for
loans and advances (note 8.3) 240 258
Fair value adjustments on dated financial instruments 163 51
Dividends on dated, unlisted investment securities 669 592
38 697 35 247
23.2 Interest expenseCurrent accounts 350 386
Savings and deposit accounts 3 587 3 235
Market bid accounts 4 057 3 162
Foreign finance creditors 344 249
Subordinated bonds 1 229 916
Other interest-bearing liabilities 16 143 15 807
25 710 23 755
23.3 Non–interest revenueFee and commission revenue 11 172 9 816
Point of representation fees 4 887 4 371
Card-based commission 1 845 1 437
Knowledge-based fees and commission 1 335 1 255
Electronic banking fees 879 706
Insurance: fees and commission 503 422
Foreign currency service fees 549 472
Documentation and administration fees 282 239
Other 892 914
Trading revenue 3 742 3 788
Foreign exchange 1 681 1 725
Debt securities 1 019 1 216
Commodities 721 779
Equities 326 38
Other (5) 30
Other revenue 1 804 1 440
Banking and other 388 409
Property related revenue 782 612
Insurance: underwriting and bancassurance profit 570 419
Profit on realisation of available-for-sale financial assets 64 –
16 718 15 044
Interest and dividend income included in trading income:
Interest income 727 528
Dividend income 324 231
1 051 759
Standard Bank Group annual report 2005 P • 160

Standard Bank Group annual report 2005 P • 161
2005 2004
Rm Rm
23 Supplementary income statement information continued
23.4 Net insurance premiumsInsurance premium revenue 19 229 12 631
Reinsurance premiums (250) (225)
18 979 12 406
23.5 Investment income and gainsInvestment income 6 957 5 542
Investment gains 24 025 13 288
30 982 18 830
Comprising:
Investment income 6 957 5 542
Interest income 3 784 2 777
Interest income excluding mutual funds 3 038 2 234
Mutual funds 746 543
Dividends received 1 924 1 582
Listed shares 1 728 1 331
Unlisted shares 139 194
Mutual funds 57 57
Rental income1 1 233 1 181
Scrip lending fees 2 1
Sundry income 14 1
Sundry income excluding mutual funds 13 –
Mutual funds 1 1
Investment gains 24 025 13 288
Investment properties 908 535
Financial instruments 20 842 13 043
Foreign exchange differences 852 (1 252)
Mutual funds 1 423 962
30 982 18 830
1Notional rent relating to owner-occupied properties of R113 million
(2004: R110 million) has been eliminated.
23.6 Credit impairment chargesNet credit impairments raised and released for loans and advances (note 8.3) 1 491 1 427
Recoveries on loans and advances previously written off (284) (377)
1 207 1 050
Comprising:
Credit impairment charges for non-performing loans 1 006 1 041
Credit impairment charges for performing loans 201 9
1 207 1 050

Notes to the annual financial statements for the year ended 31 December 2005 continued
2005 2004
Rm Rm
23 Supplementary income statement information continued
23.7 Staff costs (banking operations)Salaries and allowances 8 692 7 805
Equity-linked transactions 171 111
Group equity compensation plans 105 95
Group equity participation plans (note 21) 66 16
Retirement benefit costs 750 694
9 613 8 610
23.8 Other operating expensesBanking operations 7 204 6 774
Insurance operations 3 628 2 764
10 832 9 538
The following items, amongst others, are included in other operating expenses:
Amortisation – intangible assets 268 151
Auditors’ remuneration 107 83
Audit fees
– Current year 81 54
– Prior year 2 1
Fees for other services 24 28
Depreciation (note 13.2) 917 948
Property
– Freehold 16 15
– Leasehold 18 15
Equipment
– Computer equipment 549 636
– Motor vehicles 143 114
– Office equipment 43 43
– Furniture and fittings 148 125
Impairment – property and equipment (note 13.2) – 15
Impairment of intangibles (note 12.2) – 12
Loss on sale of businesses and divisions 2 5
Operating lease charges 792 706
Properties 741 618
Equipment 51 88
Professional fees 870 771
Managerial 289 239
Technical and other 581 532
Profit on sale of property and equipment (64) (40)
Recoveries on motor vehicle disposals (79) (18)
Restructuring costs 184 –
Retrenchment and other staff related costs 80 –
Infrastructure and office costs 70 –
Systems and processes 32 –
Consolidation of marketing and distribution 2 –
Standard Bank Group annual report 2005 P • 162

Standard Bank Group annual report 2005 P • 163
2005 2004
Rm Rm
23 Supplementary income statement information continued
23.9 Goodwill impairmentGoodwill impairment charge for subsidiaries (note 12.1) 421 48
421 48
24 Emoluments of Standard Bank Group directors Executive directors
Emoluments of directors in respect of services rendered:1
While directors of Standard Bank Group
– as directors of subsidiary companies 25 22
– otherwise in connection with the affairs of
Standard Bank Group or its subsidiaries2 23 41
Non–executive directors
Emoluments of directors in respect of services rendered:
As directors of Standard Bank Group 6 4
While directors of Standard Bank Group
– as directors of subsidiary companies 5 5
– otherwise in connection with the affairs of
Standard Bank Group or its subsidiaries 7 3
Pensions of past directors 1 1
67 76
1In order to align emoluments with the performance to which they relate,
emoluments reflect the amounts accrued in respect of each year and not
the amounts paid.
2Including gains on exercise of options and other related payments.
Details of directors’ emoluments are given on pages 42 to 44.
25 TaxationIndirect taxation (note 25.1) 778 651
Direct taxation (note 25.2) 4 357 3 437
5 135 4 088
25.1 Indirect taxationRegional services council levies 124 110
Value added tax 583 515
Duties 6 (5)
Financial services levy 8 5
Skills development levy 57 26
778 651

Notes to the annual financial statements for the year ended 31 December 2005 continued
2005 2004
Rm Rm
25 Taxation continued
25.2 Direct taxationCurrent year 4 370 3 426
– South African normal tax 2 744 2 515
– South African deferred tax 40 (20)
– Normal secondary tax on companies 166 74
– Deferred secondary tax on companies 158 (47)
– Foreign normal and withholding tax 604 241
– Foreign deferred tax (98) 221
– Retirement fund tax 147 101
– Capital gains tax current 266 69
– Capital gains tax deferred 432 272
– Attributable to decrease in tax rate (89) –
Prior years (13) 11
– South African normal tax (164) (15)
– South African deferred tax 162 8
– Foreign normal and withholding tax (70) 18
– Foreign deferred tax 59 –
4 357 3 437
Charged directly to equity (45) (161)
Direct taxation per the income statement 4 312 3 276
In 2005, the South African government decreased the corporate tax rate
from 30% to 29%.
Future tax reliefThe group has estimated tax losses of R238 million (2004: R261 million)
which are available for set-off against future taxable income. These amounts
were utilised to reduce the deferred tax balance.
Rate reconciliation including indirect and direct taxation (%) The total tax charge for the year as a percentage of net income
before indirect taxation: 35 30
Regional services council levies and stamp duties (1) (1)
Value added tax (4) (4)
Duties and skills development levy (1) –
Secondary tax on companies (2) –
Capital gains tax (1) –
Tax on policyholder funds
– Normal tax (3) –
– Retirement fund tax (1) (1)
– Capital gains tax (4) (2)
Tax relating to prior years – –
Net tax charge 18 22
The charge for the year has been reduced as a consequence of:
– Dividends received 4 3
– Other non-taxable income 5 5
– Other permanent differences 1 –
– Change in the company tax rate 1 –
Standard rate of South African tax 29 30
Standard Bank Group annual report 2005 P • 164

Standard Bank Group annual report 2005 P • 165
2005 2004
Rm Rm
25 Taxation continued
25.2 Direct taxation continued
Rate reconciliation of direct taxation (%)
The direct taxation charge for the year as a percentage of profit
before direct taxation: 32 27
Secondary tax on companies (2) –
Capital gains tax (1) –
Tax on policyholder funds
– Normal tax (3) –
– Retirement fund tax (1) (1)
– Capital gains tax (4) (2)
Tax relating to prior years – –
Net tax charge 21 24
The charge for the year has been reduced/(increased) as a consequence of:
– Dividends received 3 3
– Other non-taxable income 5 5
– Other permanent differences (1) (2)
– Change in the company tax rate 1 –
Standard rate of South African tax 29 30
26 DividendsOrdinary shares1
2004 final No. 71 of 181,0 cents per share (2003: 109,5 cents per share), paid on
18 April 2005 to shareholders registered on 15 April 2005. 2 453 1 469
Interim No. 72 of 122,0 cents per share (2004: 50,5 cents per share), paid on
19 September 2005 to shareholders registered on 16 September 2005. 1 654 681
4 107 2 150
A final dividend No. 73 of 145,0 cents per share, payable on 18 April 2006 was declared
to shareholders, registered on 13 April 2006, bringing the total dividends declared in
respect of 2005 to 267,0 cents per share (2004: 231,5 cents).
Preference shares
6,5% first cumulative preference shares:
Dividend No. 71 of 3,25 cents per share (2003: 3,25 cents per share) paid on
11 April 2005 to shareholders registered on 8 April 2005.
Dividend No. 72 of 3,25 cents per share (2004: 3,25 cents per share) paid on
12 September 2005 to shareholders registered on 9 September 2005.
Non-redeemable, non-cumulative, non-participating preference shares:
Dividend No. 1 of 379,34 cents per share (2003: nil cents per share), paid
on 11 April 2005 to shareholders registered on 8 April 2005. 114 –
Dividend No. 2 of 374,74 cents per share (2004: nil cents per share), paid
on 12 September 2005 to shareholders registered on 9 September 2005. 112 –
226 –
6,5% first cumulative preference shares dividend No. 73 of 3,25 cents per share (2004: 3,25 cents per share) payable on 10 April
2006 was declared to shareholders registered on 7 April 2006.
Non-redeemable, non-cumulative, non-participating preference shares dividend No. 3 of 370,52 cents per share (2004: 379,34 cents)
payable on 10 April 2006 was declared to shareholders registered on 7 April 2006.
1Dividends paid on ordinary shares are stated before the deduction of dividends received on treasury shares, R360 million, net of
minorities.

Notes to the annual financial statements for the year ended 31 December 2005 continued
2005 2004
Rm Rm
27 Headline earnings Group profit for the year 9 297 9 072
Attributable to minorities (639) (1 388)
Attributable to preference shareholders (226) –
Attributable to ordinary shareholders 8 432 7 684
Headline earnings adjustable items added back or reversed 293 (563)
Goodwill impairment 421 48
Profit on sale of properties and equipment (64) (44)
Impairment of properties and equipment – 15
Impairment of intangibles – 12
Recycled investment gains on available-for-sale assets (64) (599)
Other capital losses – 5
Taxation on headline earnings adjustable items 20 8
Minority share of headline earnings adjustable items (281) 409
Headline earnings 8 464 7 538
28 Earnings per share The calculations of basic earnings and headline earnings per share and diluted
earnings and diluted headline earnings per share are as follows:
Earnings based on weighted average shares in issue
Headline earnings (Rm) 8 464 7 538
Earnings attributable to ordinary shareholders (Rm) 8 432 7 684
Weighted average number of ordinary shares in issue (number of shares)
Weighted average number of ordinary shares in issue before adjustment 1 353 381 571 1 345 785 610
Adjusted for shares issued in terms of the Tutuwa initiative (99 190 197) (24 120 021)
Adjusted for deemed treasury shares held on behalf of policyholders (49 022 454) –
1 205 168 920 1 321 665 589
Headline earnings per share (cents) 702,3 570,3
Earnings per share (cents) 699,7 581,4
Fully diluted earnings
Weighted average number of ordinary shares in issue (number of shares) 1 205 168 920 1 321 665 589
Adjusted for the following potential dilution:
Standard Bank Group Share Incentive Scheme 23 010 133 17 714 035
Standard Bank Equity Growth Scheme 693 164 –
Tutuwa 32 654 765 5 612 305
– Tutuwa consortium and Community Trust 22 716 931 5 612 305
– Black Managers’ Trust 9 937 834 –
Fully diluted weighted average number of ordinary shares
in issue (number of shares) 1 261 526 982 1 344 991 929
Fully diluted headline earnings per share (cents) 670,9 560,4
Fully diluted earnings per share (cents) 668,4 571,3
Standard Bank Group annual report 2005 P • 166

Standard Bank Group annual report 2005 P • 167
2005 2004
Rm Rm
29 Cash flow statement notes29.1 Reconciliation of net income before goodwill to cash flows
from operating activities
Net income before goodwill 14 582 12 920
Adjusted for:
Amortisation of intangible assets 268 151
Bond hedging relationships (45) 43
Credit impairment charges on loans and advances 1 207 1 050
Depreciation – property and equipment 917 948
Discount element recognised from credit impairments for loans and advances (240) (258)
Dividends from associates 95 80
Equity-settled share-based payments 191 84
Fair value adjustments on dated financial instruments (163) (51)
Impairment losses – 27
Indirect taxation (778) (651)
Investment gains (24 547) (13 286)
Investment gains attributable to third party liabilities 1 354 1 028
Investment gains on treasury shares 522 –
Loss on sale of businesses and divisions 2 5
Net fund flows after service fees on policyholder investment contracts 47 (61)
Policyholders’ liability transfers 25 630 14 376
Profit on sale of property and equipment (64) (40)
Provision for post-retirement benefits 149 210
Recoveries on motor vehicles (79) (18)
Other (28) (7)
Net cash flows from operating activities 19 020 16 550
29.2 Cash receipts from customersInterest income 41 512 37 119
Fee and commission revenue 11 172 9 816
Trading and other income 30 851 25 458
83 535 72 393
29.3 Cash paid to customers, employees and suppliersInterest expense (25 791) (23 841)
Total operating expenses (including indirect taxation expense) (41 736) (34 489)
(67 527) (58 330)
29.4 Dividends receivedDividends from investment securities and preference shares 2 917 2 407
Dividends from associates 95 80
3 012 2 487
29.5 Increase in income�earning assetsNet derivative assets 6 365 (1 850)
Trading assets (2 738) (2 988)
Investment securities 1 929 145
Loans and advances (70 880) (45 132)
Other assets 6 495 1 451
(58 829) (48 374)

Notes to the annual financial statements for the year ended 31 December 2005 continued
2005 2004
Rm Rm
29 Cash flow statement notes continued
29.6 Increase in deposits and other liabilitiesDeposit and current accounts 80 920 55 556
Trading liabilities 5 858 (2 113)
Other liabilities 2 365 (1 659)
89 143 51 784
29.7 Taxation paidTaxation payable and deferred taxation at beginning of the year (3 718) (3 164)
Addition through business combination (303) –
Direct taxation attributable to group (4 357) (3 437)
Charged directly to equity (45) (161)
Charged to income statement (4 312) (3 276)
Taxation payable and deferred taxation at end of the year 5 936 3 718
Reclassified as disposal groups held for sale 23 –
(2 419) (2 883)
29.8 Investment resulting in acquisition of subsidiariesNet cash cost of acquisition of subsidiaries (1 771) 1 606
Effects of exchange rate changes – 82
(1 771) 1 688
Comprising:Cash and balances with banks (1 445) (1 606)
Investments (16 629) (21)
Loans and advances – (303)
Current and deferred taxation (263) –
Other assets (2 720) (23)
Interest in associates and joint ventures (129) –
Goodwill and other intangible assets (1 467) (22)
Property and equipment (43) (37)
Total assets acquired (22 696) (2 012)
Deposit and current accounts – 1 797
Current and deferred taxation 566 –
Other liabilities and provisions 1 333 56
Policyholders’ liabilities 17 817 –
Net asset value (2 980) (159)
Minority interests 161 6
Net assets acquired (2 819) (153)
Goodwill (397) (78)
Carrying amount previously accounted for as an associate – 231
Cash consideration1 (3 216) –
Less: cash and cash equivalents acquired 1 445 1 606
Net cash purchase price (1 771) 1 606
Effects of exchange rate changes – 82
(1 771) 1 688
1The subsidiaries acquired consisted of Capital Alliance Holdings Limited (CAHL) R3 047 million and Wedeline Investments 1
(Proprietary) Limited (Wedeline) R169 million. The only asset of Wedeline was an investment property of R169 million.
The remaining assets and liabilities listed above relate to the acquisition of CAHL.
Standard Bank Group annual report 2005 P • 168

Standard Bank Group annual report 2005 P • 169
2005 2004
Rm Rm
29 Cash flow statement notes continued
29.9 Dividends paidAmounts unpaid at beginning of the year – –
Dividends to ordinary shareholders (4 107) (2 150)
Dividends to preference shareholders (226) –
Dividends received in terms of the Tutuwa initiative 373 –
Dividends received on deemed treasury shares 148 –
Dividends to minority shareholders in subsidiaries (649) (797)
Amounts unpaid at end of the year – –
(4 461) (2 947)
29.10 Cash and cash equivalentsCash and balances with banks 70 852 37 842
Short-term negotiable securities 30 313 21 461
101 165 59 303
30 Disposal groups held for saleAs notified to Liberty Life shareholders on 21 November 2005, the group is currently in negotiations to dispose of its interests in
Liberty Ermitage Jersey Limited (Ermitage) and Prefsure Holdings Limited (Prefsure). An agreement for the disposal of Prefsure
(including minority interests) for AUS$145 million was entered into on 30 January 2006. The effective date of disposal will be 1 April
2006.
The sale is subject to the various regulatory approvals in South Africa and Australia. Ermitage is incorporated in Jersey, Channel Islands
and Prefsure is incorporated in Australia. Both are group subsidiaries and are included in the consolidated financial statements of
Liberty Life.
Based on the requirements of IFRS 5 – Non-current Assets Held for Sale and Discontinued Operations, the assets and liabilities
attributable to Ermitage and Prefsure have been disclosed as a disposal group, and separately disclosed on the balance sheet.
The major classes of assets and liabilities comprising the disposal groups classified as held for sale are as follows:
2005Rm
Total assets classified as held for sale 2 380
Equipment 16Intangible assets 162Reinsurance assets 501Financial instruments 1 152Prepayments, insurance and other receivables 412Cash and cash equivalents 137
Total liabilities classified as held for sale (1 267)
Policyholders’ liabilities – insurance contracts (745)Policyholders’ liabilities – investment contracts (82)Provisions (11)Insurance and other payables (406)Current and deferred taxation (23)
Net assets of disposal groups 1 113
In accordance with requirements of IFRS 5, no comparative information has been disclosed. The potential sale is not a discontinued
operation as defined and therefore, the income statement has not been restated to separately disclose the results of the disposal
groups.
The proceeds of the disposal are expected by the directors to exceed the net carrying amount of the relevant assets and liabilities
and therefore, no impairment is considered necessary. The anticipated profit on disposal of Prefsure per the sale agreement is subject
to the Australian dollar exchange rate, but is expected to be in the region of R20 million.

Notes to the annual financial statements for the year ended 31 December 2005 continued
2005 2004
Rm Rm
31 Third party funds under managementMembers of the group provide discretionary and non-discretionary investment
management services to institutional and private investors. Commissions and fees
earned in respect of trust and management activities performed are included in the
income statement. Assets managed on behalf of third parties include:
Asset management 97 444 81 927
Fund management 216 407 196 018
313 851 277 945
Geographical area
Africa (including Stanlib) 212 461 176 266
International 101 390 101 679
313 851 277 945
32 Related party transactions32.1 Group entities and related parties
32.1.1 Parent
Standard Bank Group Limited is the ultimate holding company for the Standard Bank Group of companies.
32.1.2 Subsidiaries
Details of effective interest, investments and loans to subsidiaries are disclosed in Annexure C.
32.1.3 Associates and joint ventures
Details of effective interest, investments and loans to associates and joint ventures are disclosed in Annexure D.
Standard Bank paid South African Home Loans (Proprietary) Limited R88 million (2004: R69 million) with regards
to origination fees.
32.1.4 Key management personnel
Key management personnel has been defined as: Standard Bank Group Limited board of directors and Standard
Bank Group Limited executive committee. The definition of key management includes the close members of family
of key management personnel and any entity over which key management exercise control. Close members of
family are those family members who may be expected to influence, or be influenced by that individual in their
dealings with Standard Bank Group. They may include the individual's domestic partner and children, the children
of the individual's domestic partner, and dependents of the individual or the individual’s domestic partner.
2005 2004
Rand Rand
Key management compensation
Salaries and other short-term benefits 98 911 917 87 192 427
Post-employment benefits 3 337 297 3 113 063
Other long-term benefits 22 255 325 30 729 564
IFRS 2 value of share options and rights expensed 8 580 597 5 489 205
133 085 136 126 524 259
Mortgage loans
Loans outstanding at beginning of the year 5 764 440 4 328 379
Loans granted during the year 8 081 394 5 011 985
Loan repayments during the year (6 363 624) (4 092 951)
Interest earned 601 945 517 027
Loans outstanding at end of the year 8 084 155 5 764 440
Average effective interest rate earned for the year 8,69% 10,25%
No credit impairments have been recognised in respect of loans granted to key management (2004: nil). Mortgage
loans are repayable monthly over 20 years. These loans are collaterised by properties with a total fair value of
R31 238 293.
Standard Bank Group annual report 2005 P • 170

Standard Bank Group annual report 2005 P • 171
2005 2004
Rand Rand
32 Related party transactions continued
32.1 Group entities and related parties continued
32.1.4 Key management personnel continued
Other loans
Loans outstanding at beginning of the year – 2 200 000
Net repayments – (2 200 000)
Loans outstanding at end of the year – –
The interest rate on other loans was 14,5%.
Vehicle and asset finance
Loans outstanding at beginning of the year 3 982 250 405 015
Net new loans granted 2 597 203 3 927 076
Net repayments (1 630 595) (487 393)
Net interest earned 409 466 137 552
Loans outstanding at end of the year 5 358 324 3 982 250
Average effective interest rate earned for the year 8,77% 6,27%
Credit card accounts
Balance outstanding at beginning of the year 737 856 555 089
Annual spend 8 747 960 7 666 595
Annual fees 12 024 4 380
Net interest earned 16 180 12 859
Repayments (8 693 991) (7 501 067)
Balance outstanding at end of the year 820 029 737 856
Average effective interest rate earned for the year 2,08% 1,99%
No credit impairments have been recognised in respect of credit cards,
and vehicle and asset finance lending to key management (2004: nil).
Credit card loans are unsecured. The effective interest rates disclosed
are calculated on a simple average. The effective interest rate for credit
card accounts is low as interest is only charged on amounts not settled
in the month following the card transactions. Interest rates charged on
card and vehicle and asset lending are in line with rates available to staff.
Cheque and current accounts
Credit balance at beginning of the year 35 432 835 43 183 128
Interest paid 726 872 776 536
Interest earned (474 593) (517 140)
Net deposits and withdrawals 565 977 (5 256 884)
Net service fees and bank charges (76 616) (138 347)
Exchange difference (126 624) (2 614 458)
Credit balance at end of the year 36 047 851 35 432 835
Average effective interest rate paid for the year 2,03% 1,98%

Notes to the annual financial statements for the year ended 31 December 2005 continued
2005 2004
Rand Rand
32 Related party transactions continued
32.1 Group entities and related parties continued
32.1.4 Key management personnel continued
Savings accounts
Credit balance at beginning of the year 18 199 541 13 571 847
Interest paid 1 018 103 1 088 896
Net new investments 816 566 3 538 798
Credit balance at end of the year 20 034 210 18 199 541
Average effective interest rate paid for the year 5,33% 6,85%
Insurance and investment contracts
Details of key management personnel’s investment transactions
and balances with Standard Bank Group.
Insurance:
Life and disability insurance
Aggregate insured cover 9 887 000 4 138 000
Premiums received 99 997 71 284
Claims paid 10 218 8 000
Surrender value 187 000 138 000
Other insurance
Premiums received 351 134 336 543
Claims paid 26 266 –
Investment products
Fund value balance at beginning of the year 168 822 525 91 679 921
Deposits 13 196 587 36 810 304
Net investment return credited 48 690 787 41 154 403
Commission and other transaction fees (991 956) (822 103)
Fund value balance at end of the year 229 717 943 168 822 525
Other fees
Financial consulting fees and commissions received 11 474 28 957
Shares and share options and rights held
Aggregate details of Standard Bank Group Limited shares,
share options and rights held by key management personnel.
Shares beneficially owned1 2 010 775 1 425 273
Share options held 7 301 082 8 062 482
32.1.5 Post�employment benefit plans
Details of transactions between Standard Bank Group Limited
and the group's post-employment benefit plans are listed below:
Asset management fee income 39 366 000 46 892 000
Deposits held with the bank 324 132 000 237 110 000
Deposits held in bonds and money market 281 642 000 269 093 000
Interest paid 54 588 000 48 380 000
Value of assets under management 14 258 526 000 12 132 464 000
Number of Standard Bank Group shares held 8 479 770 9 519 817
On 1 July 2005 Liberty Life purchased Main Street 9 (Proprietary) Limited, a property holding company, from
Standard Bank Group Retirement Fund for R709 million.
1The beneficial ownership of shares held by Saki Macozoma and Cyril Ramaphosa are excluded from these shares
as it is discussed in note 32.1.6.
Standard Bank Group annual report 2005 P • 172

Standard Bank Group annual report 2005 P • 173
32 Related party transactions continued
32.1 Group entities and related parties continued
32.1.6 Other contractsSaki Macozoma, a director of the group, has a shareholding of 20% in Safika, which is a member of three different
consortia that were party to the Andisa, Stanlib and Tutuwa empowerment transactions in the prior years. Safika
holds effective interests of 23,4% in Andisa Capital, 12,85% in Stanlib, 2,23% in Liberty Group and 1,78% in
Standard Bank Group. The group holds an effective interest of 16,5% in Safika.
Cyril Ramaphosa, a director of the group, has a 35,9% shareholding in Shanduka, which is a member of the Tutuwa
consortium. Shanduka holds an effective interest of 1,48% in Liberty Group and 1,19% in Standard Bank Group.
The group holds an effective interest of 15,3% in Shanduka.
Doug Band, a director of the group, has a shareholding of 33% in Gymnogene Investments. This company had a
contractual relationship with the bank. Payments arise from a share of the profit on disposal of private equity
investments in a portfolio sourced and arranged by Gymnogene Investments on behalf of the bank. Although the
contract expired on 31 December 2004, payments relating to this contract are likely to occur if and when the three
remaining investments in the private equity portfolio are realised on a profitable basis to the bank.
After year end, Standard Bank advanced a loan to Circle Capital Ventures. A portion of the loan is convertible into
15% of the issued share capital of Circle Capital Ventures. Mamphela Ramphele, a director of the group, has a
37,45% shareholding in this company.
2005 2004
Rm Rm
33 Pensions and other post�retirement benefitsAmounts recognised in the balance sheet (note 18.2)
Standard Bank operationsRetirement funds (note 33.1) 414 354
Post-retirement healthcare benefits (note 33.2) 453 423
– Provider fund 13 21
– Other funds 440 402
Liberty Life 219 160
Post-retirement healthcare benefits (note 33.3) 196 160
Retirement funds (note 33.4) 23 –
1 086 937
The total amount recognised as an expense for the defined contribution plans operated by the group amounted to R648 million
(2004: R569 million).
33.1 Standard Bank retirement fundsMembership of the principal fund, the Standard Bank Group Retirement Fund (SBGRF), exceeds 95% of Standard Bank
operations’ permanent staff in South Africa. The fund, one of the largest in South Africa, is a trustee-administered defined
contribution fund governed by the Pension Funds Act, 1956. Member-elected trustees represent 50% of the trustee board.
The assets of the fund are held independently of the group’s assets.
The fund is subject to statutory financial review by actuaries at an interval of not more than three years. As a result of delays
in relevant regulations and pension fund guidelines being published in late 2004, the Financial Services Board (FSB)
approved an extension in submitting the 31 December 2001 valuation, which has since been submitted.
Employees who were members of the fund on 31 December 1994 have guaranteed benefits available under the rules of
the defined benefit fund. A specific liability has been recognised within the fund to provide for the guaranteed benefits which
may arise under the rules of the scheme. New members from 1 January 1995 participate only in the benefits of the defined
contribution fund.
As previously reported, an employer surplus account was created on approval from the FSB. This surplus has now been
utilised (2004: R122 million). At 31 December 2005, the valuation of the fund, the determination of its financial position
and the determination of any shortfall or surplus position has been finalised but has not yet been approved by the Registrar
of Pension Funds in terms of the Pension Fund Second Amendment Act, 39 of 2001. Consequently no account has been
taken of any potential shortfall or surplus.
The majority of employees in South Africa who are not members of the SBGRF are members of two other funds designed for
their occupational groups. Employees in territories beyond South African jurisdiction are members of either defined
contribution or defined benefit plans governed by legislation in their respective countries.

Notes to the annual financial statements for the year ended 31 December 2005 continued
2005 2004
Rm Rm
33 Pensions and other post�retirement benefits continued
33.1 Standard Bank retirement funds continued
The amounts recognised in the balance sheet in respect of the retirement
funds are determined as follows:
Present value of unfunded obligations 17 199 13 146
Fair value of plan assets (17 159) (13 232)
Unfunded obligation/(surplus) 40 (86)
Unrecognised actuarial gains 374 440
Included in other liabilities and provisions in the balance sheet 414 354
Unrecognised actuarial gains or losses are deferred and recognised in
the income statement over a period not exceeding the estimated
service lives of the employees.
Movement in the liability recognised in the balance sheet
Balance at beginning of the year 354 180
Income statement charge 165 181
Contributions paid (105) (7)
Balance at end of the year 414 354
The amounts recognised in the income statement are determined as follows:
Current service cost 258 270
Interest cost 1 214 1 025
Expected return on plan assets (1 265) (1 087)
Net actuarial gain recognised in the year (42) (27)
Included in staff costs 165 181
33.2 Standard Bank post�retirement healthcare benefitsThe bank provides the following post-retirement healthcare benefits to its employees:
Provider fund
A post-retirement healthcare benefit fund provides eligible employees, who were employed in South Africa on 1 March 2000
with a lump sum benefit on retirement enabling them to purchase an annuity to be applied towards their post-retirement
healthcare costs. This benefit is pre-funded in a provident fund. Any shortfall in the payment to be made by these employees
towards their healthcare costs subsequent to retirement is not the responsibility of the bank. The last actuarial valuation was
performed on 1 March 2001 and reflected an excess in the fund.
In the prior year, the group received approval from the FSB to transfer the excess in this fund to an employer reserve.
Other
The largest portion of this liability represents a South African post-retirement healthcare benefit scheme that covers all
employees who went on retirement before 1 March 2000. The liability is unfunded and is valued every year using the
projected unit credit method. The latest full actuarial valuation was performed on 31 December 2004.
Standard Bank Group annual report 2005 P • 174

Standard Bank Group annual report 2005 P • 175
2005 2004
Rm Rm
33 Pensions and other post�retirement benefits continued
33.2 Standard Bank post�retirement healthcare benefits continued
The amounts recognised in the balance sheet in respect of post�retirement
healthcare benefits are determined as follows:
Present value of unfunded obligations 1 399 1 155
Fair value of plan assets (1 051) (846)
Unfunded obligation 348 309
Unrecognised actuarial gains 105 114
Included in other liabilities and provisions in the balance sheet 453 423
Movement in the liability recognised in the balance sheet
Balance at beginning of the year 423 392
Income statement charge 75 71
Contributions paid (45) (40)
Balance at end of the year 453 423
The amounts recognised in the income statement are determined as follows:
Current service cost 45 55
Interest cost 103 89
Expected return on plan assets (76) (70)
Net actuarial loss/(gain) recognised in the year 3 (3)
Included in staff costs 75 71
33.3 Liberty Life post�retirement healthcare benefitsLiberty operates an unfunded post-retirement medical aid benefit for
employees who joined before 1 July 1998. For past service of employees,
Liberty recognises and provides for the actuarially determined present value
of post-retirement medical aid employer contributions on an accrual basis
using the projected unit credit method.
Movement in the liability recognised in the balance sheet
Balance at beginning of the year 160 155
Income statement charge 36 5
Balance at end of the year 196 160
The amounts recognised in the income statement are determined as follows:
Current service cost 6 6
Interest cost 23 20
Net actuarial loss/(gain) recognised in the year 7 (21)
Included in staff costs 36 5
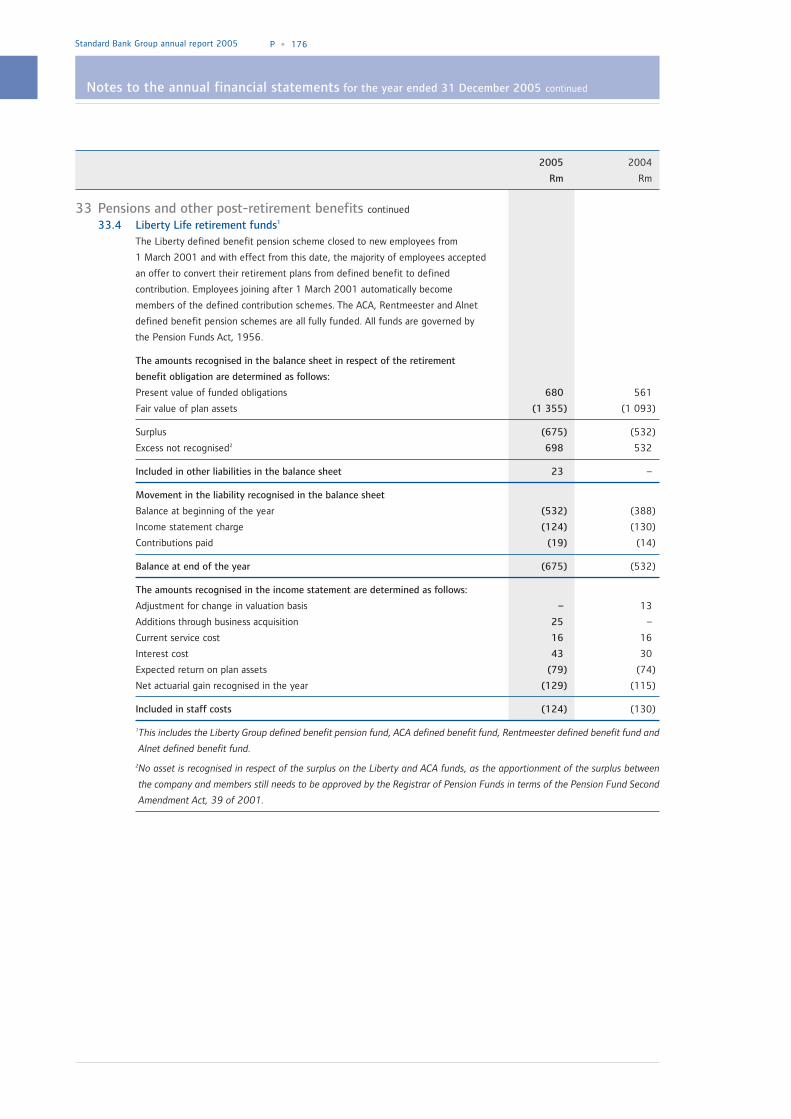
Notes to the annual financial statements for the year ended 31 December 2005 continued
2005 2004
Rm Rm
33 Pensions and other post�retirement benefits continued
33.4 Liberty Life retirement funds1
The Liberty defined benefit pension scheme closed to new employees from
1 March 2001 and with effect from this date, the majority of employees accepted
an offer to convert their retirement plans from defined benefit to defined
contribution. Employees joining after 1 March 2001 automatically become
members of the defined contribution schemes. The ACA, Rentmeester and Alnet
defined benefit pension schemes are all fully funded. All funds are governed by
the Pension Funds Act, 1956.
The amounts recognised in the balance sheet in respect of the retirement
benefit obligation are determined as follows:
Present value of funded obligations 680 561
Fair value of plan assets (1 355) (1 093)
Surplus (675) (532)
Excess not recognised2 698 532
Included in other liabilities in the balance sheet 23 –
Movement in the liability recognised in the balance sheet
Balance at beginning of the year (532) (388)
Income statement charge (124) (130)
Contributions paid (19) (14)
Balance at end of the year (675) (532)
The amounts recognised in the income statement are determined as follows:
Adjustment for change in valuation basis – 13
Additions through business acquisition 25 –
Current service cost 16 16
Interest cost 43 30
Expected return on plan assets (79) (74)
Net actuarial gain recognised in the year (129) (115)
Included in staff costs (124) (130)
1This includes the Liberty Group defined benefit pension fund, ACA defined benefit fund, Rentmeester defined benefit fund and
Alnet defined benefit fund.
2No asset is recognised in respect of the surplus on the Liberty and ACA funds, as the apportionment of the surplus between
the company and members still needs to be approved by the Registrar of Pension Funds in terms of the Pension Fund Second
Amendment Act, 39 of 2001.
Standard Bank Group annual report 2005 P • 176

Standard Bank Group annual report 2005 P • 177
Liberty
Post�
Retirement Provider Other Pension retirement
fund fund funds fund medical aid
% % % % %
33 Pensions and other post�retirement benefits continued
The principal actuarial assumptions used
for accounting purposes were:
Discount rate 8,5 8,5 8,5 7,0 7,0
Return on investments 10,0 9,0 7,0 7,0
Salary/benefit inflation 5,0 7,0 5,0
CPI inflation 4,0 5,0 5,0
Medical inflation 7,0 6,0
Remaining service life of employees (years) 15,0 19,0

Standard Bank Group Limited – company annual financial statements
Standard Bank Group annual report 2005 P • 178
Company
2005 2004
Note Rm Rm
Balance sheet at 31 December 2005
AssetsInvestment securities 8 8
Current and deferred taxation 34 131 285
Other assets 13 14
Interest in subsidiaries 35 20 326 16 713
Interest in associate 36 131 131
Total assets 20 609 17 151
Equity and liabilitiesEquity 19 695 17 117
Ordinary and preference share capital and premium 14 5 233 5 667
Reserves 14 462 11 450
Liabilities 914 34
Loans from other banks 37 900 –
Other liabilities 14 34
Total equity and liabilities 20 609 17 151
Income statement for the year ended 31 December 2005
Dividends from subsidiaries 7 251 6 524
Interest income 5 54
Total income 7 256 6 578
Operating expenses 11 51
Income before indirect taxation 7 245 6 527
Indirect taxation 38.1 13 11
Profit before direct taxation 7 232 6 516
Direct taxation 38.2 188 2
Profit for the year 7 044 6 514
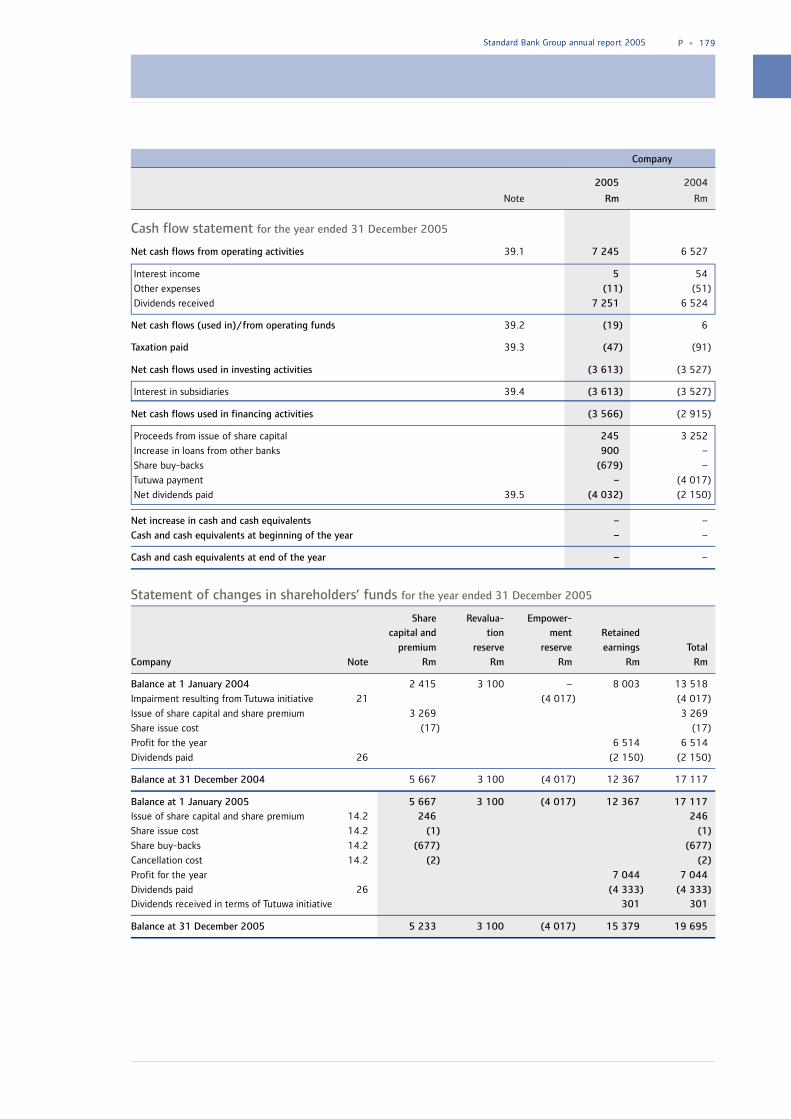
S t a n d a rd Bank Group annual report 2005 P • 1 7 9
Company
2005 2004
Note Rm Rm
Cash flow statement for the year ended 31 December 2005
Net cash flows from operating activities 39.1 7 245 6 527
Interest income 5 54Other expenses (11) (51)Dividends received 7 251 6 524
Net cash flows (used in)/from operating funds 39.2 (19) 6
Taxation paid 39.3 (47) (91)
Net cash flows used in investing activities (3 613) (3 527)
Interest in subsidiaries 39.4 (3 613) (3 527)
Net cash flows used in financing activities (3 566) (2 915)
Proceeds from issue of share capital 245 3 252Increase in loans from other banks 900 –Share buy-backs (679) –Tutuwa payment – (4 017)Net dividends paid 39.5 (4 032) (2 150)
Net increase in cash and cash equivalents – –Cash and cash equivalents at beginning of the year – –
Cash and cash equivalents at end of the year – –
Statement of changes in shareholders’ funds for the year ended 31 December 2005
Share Revalua! Empower!capital and tion ment Retained
premium reserve reserve earnings TotalCompany Note Rm Rm Rm Rm Rm
Balance at 1 January 2004 2 415 3 100 – 8 003 13 518Impairment resulting from Tutuwa initiative 21 (4 017) (4 017)Issue of share capital and share premium 3 269 3 269Share issue cost (17) (17)Profit for the year 6 514 6 514Dividends paid 26 (2 150) (2 150)
Balance at 31 December 2004 5 667 3 100 (4 017) 12 367 17 117
Balance at 1 January 2005 5 667 3 100 (4 017) 12 367 17 117Issue of share capital and share premium 14.2 246 246Share issue cost 14.2 (1) (1)Share buy-backs 14.2 (677) (677)Cancellation cost 14.2 (2) (2)Profit for the year 7 044 7 044Dividends paid 26 (4 333) (4 333)Dividends received in terms of Tutuwa initiative 301 301
Balance at 31 December 2005 5 233 3 100 (4 017) 15 379 19 695
STD FIN Sec 2 Proof 10 4/11/06 11:02 AM Page 179

S t a n d a rd Bank Group Limited – company annual financial statements continued
S t a n d a rd Bank Group annual report 2005 P • 1 8 0
2005 2004
Rm Rm
34 Current and deferred taxationCurrent taxation 112 112
Deferred taxation 19 173
131 285
34.1 Deferred tax analysisDeferred tax at the beginning of the year 173 114
(Reversing)/originating temporary difference for the year
Secondary tax on companies (154) 59
Deferred tax at end of the year1 19 173
1Deferred tax at the end of the year is attributable to secondary tax on companies.
35 Interest in subsidiariesShares at cost 21 107 17 257
Indebtedness to the company 408 531
21 515 17 788
Indebtedness by the company (1 189) (1 075)
20 326 16 713
Subsidiaries and investments and loans therein are listed in Annexure C on page 194.
36 Interest in associateCost at beginning and end of the year 131 131
Directors’ valuation
The directors’ valuation of the investment in the associate is R131 million
(2004: R131 million).
The associate comprises an investment in South African Home Loans (Proprietary)
Limited, refer Annexure D on page 198.
37 Loans from other banksLoans from other banks 900 –
An amount of R500 million is repayable on 19 June 2006 and bears interest
of 7,4% per annum payable on 16 March 2006 and 19 June 2006.
The remaining amount is repayable on 19 June 2006 and bears interest of 7,6% per annum
payable on 16 March 2006 and 19 June 2006.
38 TaxationIndirect taxation (note 38.1) 13 11
Direct taxation (note 38.2) 188 2
Total taxation 201 13
38.1 Indirect taxationRegional services council levies 11 9
Value added tax 2 2
Indirect taxation 13 11
STD FIN Sec 2 Proof 10 4/11/06 11:02 AM Page 180

S t a n d a rd Bank Group annual report 2005 P • 1 8 1
2005 2004
Rm Rm
38 Taxation continued
38.2 Direct taxationCurrent yearSouth African normal tax 1 17Foreign and withholding taxes 43 44Secondary tax on companies 173 (59)
Prior yearsSouth African normal tax (29) –
Direct taxation 188 2
Rate reconciliation of direct taxation (%)The direct taxation charge for the year as a percentage of profit
before direct taxation: 3 –Foreign and witholding taxes (1) (1)Secondary tax on companies (2) 1Tax relating to prior years – –
Net tax charge – –
The charge for the year has been reduced as a consequence of:– Dividends received 29 30
Standard rate of South African tax 29 30
In 2005, the South African government decreased the corporate tax rate from 30% to 29%.
39 Cash flow statement39.1 Reconciliation of income before indirect taxation to
cash flows from operating activitiesIncome before tax 7 245 6 527
Net cash flows from operating activities 7 245 6 527
39.2 Net cash flows (used in)/from operating fundsOther liabilities (20) 6Decrease in other assets 1 –
(19) 6
39.3 Taxation paidTaxation receivable and deferred taxation at beginning of the year 285 207Income statement charge (201) (13)Taxation receivable and deferred taxation at end of the year (131) (285)
(47) (91)
39.4 Interest in subsidiariesCost of acquisition of subsidiaries net of disposal (3 850) (3 685)Movement in net indebtedness 237 158
(3 613) (3 527)
39.5 Dividends paidAmounts unpaid at beginning of the year – –Dividends to ordinary shareholders (4 107) (2 150)Dividends to preference shareholders (226) –Dividends received in terms of Tutuwa initiative 301 –Amounts unpaid at end of the year – –
(4 032) (2 150)
STD FIN Sec 2 Proof 10 4/11/06 11:02 AM Page 181

S t a n d a rd Bank Group annual report 2005 P • 1 8 2
ANNEXURE A Implementation of IFRS
Introduction
For the year ended 31 December 2004, the group (SBG)
prepared financial statements in accordance with SA GAAP. In line
with the listing requirements of the JSE Limited, the group has
adopted International Financial Reporting Standards (IFRS) with
effect from 1 January 2005. As the group publishes comparative
information for one year in its financial statements, the date of
transition to IFRS is effectively 1 January 2004, which represents
the start of the earliest period of co m p a rative info r m a t i o n
presented. The opening balance sheets at 1 January 2004 and
1 January 2005 have been restated accordingly.
Comparative information for 2004 is restated to take into account
the requirements of all the standards except for IAS 32 – Financial
Instruments: Disclosure and Presentation, IAS 39 – Financial
Instruments: Recognition and Measurement and IFRS 4 –
Insurance Contracts. These three standards are implemented with
effect from 1 January 2005 and the opening balance sheet at this
date is adjusted accordingly. Balance sheets prior to this date have
been prepared in accordance with SA GAAP.
South African accounting standards have seen a number of
significant changes over the past couple of years as they were
being aligned with IFRS. The most notable change was the
adoption of the South African version of IAS 39 (AC 133 –
Financial Instruments: Recognition and Measurement) in the
group’s 2003 results. The final move to full IFRS compliance is
therefore less significant than what is currently being experienced
in Europe and the United Kingdom.
The most significant IFRS change for the group originated from
the implementation of IFRS 4 – Insurance Contracts which results
in Standard Bank Group and Liberty Holdings’ shares held by
Liberty Life for the benefit of policyholders being deemed
t r e a s u ry shares for accounting purposes and eliminated on
consolidation. It is however important to note that although this
treasury share adjustment potentially results in greater volatility in
reported earnings, there is no impact on the underlying business
fundamentals, cash flows, risks, growth strategies or the group’s
capital management policies.
Apart from the reclassification of cash and cash equivalents held
by Liberty Life policyholders, there have been no material
adjustments to the cash flow statement in respect of cash utilised
by operating activities before tax, cash flows from investment
activities and cash flows from financing activities as a result of the
adoption of IFRS.
In light of the potential for increased earnings volatility, the group
will ensure that comparable underlying business performance and
trends are clearly identified on an ongoing basis. With the
exception of the above-mentioned change, the implementation
of IFRS has a relatively immaterial impact on the group’s financial
position and earnings.
Transitional arrangements
The key principle of IFRS 1 – First-time Adoption of International
Financial Reporting Standards is full retrospective application of
IFRS. However, in addition to exempting companies from the
requirement to restate comparatives under IAS 32, IAS 39 and
IFRS 4, this statement provides exemptions from retrospective
application in certain instances due to cost and pra c t i c a l
considerations. The group’s transitional elections in this regard are
set out below:
Elections applicable 1 January 2004
• Business combinations: The group elected not to
retrospectively apply the requirements of IFRS 3 for business
combinations that occurred prior to 1 January 2004. As a
result, the carrying amount of goodwill is the amortised
amount on 31 December 2003 and previously amortised
goodwill and goodwill eliminated against reserves were not
re-instated.
• Property and equipment: A first-time adopter may elect to use
the fair value of individual pro p e rty and equipment at
transition date as the deemed cost. The group did not make
use of this transitional exemption and elected to measure
individual items of property and equipment at depreciated
cost determined in accordance with IFRS.
• Employee benefits: The group elected not to apply the
exemption to account for all deferred actuarial gains or losses,
including a 10% tolerance limit for differences in actuarial
assumptions, in opening equity as at 1 January 2004. This
exemption was not elected as the group’s accounting for
employee benefits under previous SA GAAP was already
substantially in compliance with IAS 19 – Employee Benefits.
• Cumulative foreign currency translation adjustment: T h e
cumulative foreign currency translation reserve existing on
transition to IFRS has been retained and the option to reset
the reserve to zero was not elected as the group’s accounting
for translation adjustments under previous SA GAAP was
already substantially in compliance with IAS 21 – The Effects
of Changes in Foreign Exchange Rates.
• Share-based payments: The group elected not to apply the
provisions of IFRS 2 – Share-based Payments to equity-settled
awards granted on or before 7 November 2002, or to
awards granted after that date but which had vested prior to
1 January 2005.
Elections applicable 1 January 2005
• Comparative numbers restated for financial instruments and
insurance contracts: The group elected the exemption not to
restate its comparatives for IAS 32 – Financial Instruments:
Disclosure and Presentation, IAS 39 – Financial Instruments:
R e cognition and Measurement and IFRS 4 – Insura n c e
C o n t racts. The group has therefore applied SA GAAP
applicable as at 31 December 2004 to financial instruments
and insurance contracts in its 2004 numbers disclosed as
comparatives for the 2005 IFRS results. It is considered
impractical to retrospectively adjust for changes resulting from
revised impairment and insurance contract requirements.
STD FIN Sec 2 Proof 10 4/11/06 11:02 AM Page 182

• Designation of financial assets and financial liabilities in terms
of IAS 39: In terms of the transitional arrangements the group
elected the option to reclassify certain financial assets and
liabilities. These reclassifications were not material.
There are no changes to estimates made under previous SA GAAP
for transition to IFRS (for example expected default or actuarial
assumptions). Where estimates have previously been made
under SA GAAP, consistent estimates (after adjustments to reflect
any difference in accounting policies) have been made at the
same date.
Adjustments as a result of the adoption of IFRS
The impact of changing from SA GAAP to IFRS is summarised below.
The quantification of the IFRS adjustments is shown in the tables fo r
r e conciliation of assets, liabilities and equity, reconciliation of the
2004 closing balance sheet, reconciliation of changes in equity and
r e conciliation of the income statement.
Adjustments implemented with effect from 1 January 2004
Note 1: IAS 18 – Revenue recognition and deferred acquisition
costs (excluding insurance contracts accounted for in terms of
IFRS 4)
The previous South African version of IAS 39 (AC 133 – Financial
Instruments: Recognition and Measurement) required that fees
which form an integral part of the effective interest rate, including
t ransaction costs, be taken into account in calculating the original
effective yield. Initial fees that relate to the origination of loans are
t h e r e fore deferred and amortised as an adjustment to the effective
interest rate. The same accounting principle was carried fo rw a rd in
the revised IAS 18 with fees relating to the future provision of
s e rvices deferred and amortised over the anticipated period in which
the services will be provided. A small adjustment was required to
align the previous deferral methodologies with the revised IAS 18,
primarily for instalment finance on moveable assets.
Note 2: IAS 36/IFRS 3 – Goodwill
Previously, the group recognised acquired goodwill at cost and
amortised it on a straight-line basis over its expected useful life.
Goodwill was subject to regular review for indications of
impairment and any impairment charges were recognised in the
income statement. In terms of IFRS 3 – Business Combinations,
goodwill is not amortised but is subject to impairment reviews,
both annually and where there are indications that the carrying
value may not be recoverable. The 2004 goodwill amortisation
previously recognised in the income statement has been reversed,
resulting in a corresponding increase in equity. All goodwill has
accordingly been tested for impairment at 1 January 2004 and
31 December 2004. One instance of a goodwill impairment for
2004 arose following the application of the new accounting rules
and this relates to the group’s international operations.
Note 3: IFRS 2 – Share!based Payments
The group grants share options to employees under equity
compensation plans. Other than costs incurred in administering
the schemes, which were expensed as incurred, the schemes did
not result in any expense in the income statement, but rather a
dilution in earnings per share when the shares were issued. In
accordance with the requirements of IFRS 2, the group now
r e cognises an expense in the income statement, with a
corresponding credit to equity, representing the fair value of
employee share options granted, recognised on a straight-line
basis over the vesting period of the options.
The group also applied IFRS 2 to the Tutuwa initiative. The
s t a n d a rd is applicable to awards that have not vested by
31 December 2004 and, as a result, the ownership of shares
allocated to black managers that vest over a period ending on
31 December 2010 is accounted for in terms of this standard. The
shares owned by the community trust and strategic partners have
vested before 31 December 2004 and, as a result of the election
not to apply IFRS 2 retrospectively, no expense is therefore
required.
Note 4: IAS 16 – Revaluation of residual values in property and
equipment
In calculating its depreciation charge, an entity reduces the
depreciable amount of an asset by its residual value. Previously
under SA GAAP, the estimated residual value was fixed on
recognition of the asset and was not subject to reassessment.
IAS 16 revised requires that the residual value of the assets
should be reassessed at each balance sheet date. A n n u a l
increases in asset values result in annual upward adjustments of
residual values. The continuous reassessment of residual values
typically leads to a reduction in depreciation charges and
depreciation charges cease when the carrying value of an asset
equals the residual value.
Buildings’ carrying values that were previously fully depreciated
are now partially re-instated to reflect the applicable residual
value. Where buildings are not fully depreciated, there has
generally been a reduction in depreciation as residual values are
reassessed. The depreciation previously recognised in the income
statement has accordingly been reversed or reduced, resulting in
a corresponding increase in equity.
Note 5: IAS 16 – Reclassification of property revaluations
This adjustment is to account for property revaluation surpluses
directly in equity. This has no impact on total equity.
Note 6: IAS 27 – Consolidation of mutual funds
IFRS requires the consolidation of certain mutual funds where
Liberty Life and Corporate & Investment Banking International are
considered to have control of such funds through the size of their
investment, voting control and related management contracts.
The consolidation of these mutual funds has an immaterial
effect on net equity. Similarly where Liberty Life has a holding
of between 20% and 50% in a mutual fund this is now treated
as an associate. In terms of the allowance in IFRS for equity
investments in mutual funds the group has elected to fair value
these associates.
The consolidation of such funds is still subject to international
industry debate, and progress in this regard will be monitored.
S t a n d a rd Bank Group annual report 2005 P • 1 8 3
STD FIN Sec 2 Proof 10 4/11/06 11:02 AM Page 183

S t a n d a rd Bank Group annual report 2005 P • 1 8 4
Implementation of IFRS co n t i n u e d
Note 7: IAS 17 – Leases
IAS 17 requires operating lease costs and income to be accounted
for on a straight-line basis. Future lease increases in terms of the
lease contract are estimated and the average lease expense is
then recognised in equal amounts over the lease period. In
general, this leads to earlier recognition of lease income and lease
expense compared with the pattern of recognition in terms of
previous industry practice in South Africa where income and
expenses were recognised at a constant real rate of return on the
net cash investment in the lease. This would, in most cases, result
in higher lease costs for previously reported periods with a
reduction in the 2004 opening equity and an increase in the
2004 lease costs.
I AS 40 – Investment Pro p e rty states that the fair value of investment
p ro p e rty should exclude prepaid or accrued operating lease inco m e
if this would otherwise result in double counting. Liberty Life has
t h e r e fore offset the resulting adjustment against the fair value
adjustment on investment pro p e rties. This has no impact on net
i n come, as there is a corresponding increase in lease income. At
1 January 2004 an amount of R850 million has been accrued in
other assets with a decrease in investment pro p e rties of
R593 million and an increase in deferred tax of R257 million. T h e
movement for the year ended 31 December 2004 was an additional
reclassification from investment pro p e rties of R37 million.
Note 8: IAS 12/IAS 40 – Deferred tax applicable to fair value
adjustments on investment properties
IAS 12 – Income Taxes defines the difference between the
carrying amount of a revalued depreciable asset and its tax base
as a temporary difference and therefore gives rise to a deferred
tax liability or asset. The carrying amount of a portion of
investment property portfolios is considered to be recovered
through future net rental income with the remaining portion
recovered through disposals. In terms of IAS 12, deferred tax
has to be provided on fair value adjustments on the future net
rental portion at the use tax rate (income tax rate). Liberty Life
already provides for deferred tax on fair value adjustments in
investment properties at the applicable capital gains tax rate
(CGT rate).
The resulting additional deferred tax charge has been debited to
policyholders’ liabilities to the extent that the applicable
investment property return impacts the determination of the
policyholder liability.
It is believed that the fair (open market) value already discounts
the average tax consequences of market participants in respect of
rental income. IAS 12 is being revised by the IASB and we will
continue to engage with them to ensure this issue is addressed in
the revisions.
This has resulted in a restatement decreasing policyholders’
liabilities by R655 million with a corresponding increase in
the deferred tax liability at 1 January 2004. The net movement at
31 December 2004 is a decrease of R106 million to R549 million.
Under IFRS 3 – Business Combinations and IAS 12 – Income
Taxes, the relevant deferred taxation liability on the intangible
asset, present value of in-force (PVIF) should be separately
recognised. In Liberty Life, this has resulted in the carrying value
of PVIF relating to the Investec Employee Benefits book
increasing as at 1 January 2004, with the corresponding credit to
deferred taxation. This results in an additional amortisation charge
and a tax credit of the same amount and consequently, there is no
impact on earnings.
An adjustment of R53 million was processed increasing the PVIF
with a corresponding increase to deferred tax. The movement for
the year ended 31 December 2004 is a decrease of R6 million to
R47 million.
Adjustments implemented with effect from 1 January 2005
Note 9: IAS 39 – Credit impairments
Previously the group raised an impairment for credit losses on
performing loans as the shortfall between the carrying value of a
loan and the present value of expected future cash flows
discounted at the original effective interest rate of loans, taking
changes in expected cash flows and the average maturity of loans
i n to account. Under IFRS an impairment loss can only be
accounted for if there is objective evidence that a loss event has
occurred after the initial recognition of the financial asset but
before the balance sheet date. IFRS also allows for the creation of
a credit impairment for incurred but not reported losses in order
to provide for latent losses in a portfolio of loans that have not yet
been individually identified as impaired. This change results in a
net release of credit impairments and a consequent increase in
the opening 2005 equity.
For certain African entities, already reporting under IFRS, the
impairment for credit losses is lower than the level required by their
respective regulato ry authorities. As a result, a portion of their
impairment for credit losses is released to equity on a retro s p e c t i v e
basis. It has been agreed with these regulato ry authorities that any
s h o rtfall on impairment for credit losses will be set aside in a
s t a t u to ry credit risk reserve within total equity.
Note 10: IAS 32 – Elimination of treasury shares
Shares in group companies held for the benefit of policyholders in
the insurance operation were previously not classified as treasury
shares in terms of industry practice. Significantly all of the risks and
r e w a rds arising from these shares are for the benefit of the
policyholders. As a result of the issue of IFRS 4 – Insura n c e
C o n t racts, the SA GAAP statement dealing with the insura n c e
i n d u s t ry (AC 121: Disclosure in the financial statements of long-
term insurers) was revoked. Assets are now subject to IAS 39 –
Financial Instruments: Recognition and Measurement and IAS 32 –
Financial Instruments: Disclosure and Presentation. As a result,
shares held by policyholders in group companies are accounted fo r
as equity instruments. In terms of IAS 32 the cost price of any SBG
and Liberty Holdings’ shares held by policyholders within Libert y
Life is now eliminated against equity and any current period
changes in fair value are eliminated from the income statement. In
terms of actuarial principles, the insurance operation maintains a
matching position to ensure the risk profile of liabilities to
policyholders is matched by the underlying shares. The classification
STD FIN Sec 2 Proof 10 4/11/06 11:02 AM Page 184

of policyholders’ investments in group company shares as treasury
shares for accounting purposes does not consider the relationship
between the policyholders’ liabilities and shares held to meet these
liabilities and consequently the corresponding policyholder liability
is not similarly adjusted. This introduces a mismatch between assets
and liabilities which is charged against equity.
Application of IAS 32 to these shares reduces equity and
investments by R3 703 million in the opening 2005 balance
sheet. As the effective interest held by the group in Liberty Life
is approximately 30%, R951 million of the equity reduction is
allocated to ordinary shareholders, with the remaining 70%
allocated against minority interests.
The statement on earnings per share, IAS 33, requires that the
weighted number of shares should be calculated after deducting
the total number of deemed treasury shares. It does not
contemplate minority portions of treasury shares and
consequently 100% of the number of shares is eliminated.
The result of the above is that 30% of the value of these treasury
shares is eliminated against ordinary shareholders’ equity, 30% of
the fair value adjustments is eliminated against earnings
attributable to ordinary shareholders with the remaining 70%
eliminated against earnings attributable to minorities. In contrast,
100% of the weighted number of treasury shares is eliminated for
purposes of per share calculations.
Note 11: IAS 39 – Financial instrument reclassifications
The group has elected the exemption not to restate its
comparatives for IAS 32 – Financial Instruments: Disclosure and
Presentation and IAS 39 – Financial Instruments: Recognition and
Measurement. SBG has therefore applied SA GAAP applicable at
31 December 2004 to financial instruments in its 2004 numbers
disclosed as comparatives for the 2005 results.
For entities that were already complying with International
Accounting Standards, the transitional provisions in IFRS 1 do not
apply. Therefore, as a result of the IAS 39 transitional provisions,
certain African entities retrospectively reclassified financial assets
and liabilities from 1 January 2004.
As at 1 January 2005 Liberty Life has reclassified certain
shareholder-designated financial instruments from available-for-
sale to fair value through profit or loss. This resulted in a
reclassification from an available-for-sale reserve to retained
surplus at 1 January 2005. There is no impact on total equity. In
the future, all unrealised fair value adjustments on these assets
will be included directly in the income statement.
Note 12: IAS 39 – Fair value adjustments for day one profits
Unquoted financial instruments acquired were previously
recognised at cost and any profit or loss on remeasurement to fair
value based on valuation models was accounted for on the date of
such remeasurement (day two).
The IAS 39 revision to Financial Instruments: Recognition and
Measurement, issued in February 2005, provided further criteria
on the recognition of gains or losses on initial recognition of
financial instruments. Where pricing models use inputs that are
based on observable market indicators only, all profits or losses
are recognised on initial recognition. Any gain or loss on initial
recognition, based on unobservable market indicators, is deferred
and recognised over the life of the instrument on a straight-line
basis.
As a result of the IAS 39 revision a net decrease to trading assets
is reflected in the 2005 opening balance sheet with a
corresponding decrease in equity.
Note 13: IFRS 4 – Insurance classifications
L i b e rty Life has re-examined the classification of all their
contracts between investment and insurance under the IFRS 4
definition criteria. This resulted in a net reclassification from
investment policyholders’ liabilities to insurance policyholders’
liabilities at 1 January 2005.
For the majority of the reclassifications, where investment co n t ra c t s
are reclassified as insurance co n t racts, this reclassification has no
effect as co n t racts were previously valued on a fair value basis
consistent with IAS 39 and the FSV methodology. Where an
i n s u rance co n t ract is reclassified to an investment co n t ra c t ,
negative rand reserves that were previously allowed under FSV
techniques in terms of SA GAAP are now reversed, leading to a
decrease in equity.
Disclosure reclassifications
Note 14: Reclassification of insurance
Balance sheet
At 31 December 2004 Liberty Life has separated the fair value of
the reinsurance portion of insurance contracts from policyholders'
liabilities under insurance contracts and disclosed it as an asset.
Derivative financial liabilities were previously netted off against
derivative financial assets. These have been reclassified as
derivative financial instruments within liabilities.
Balance sheet items for the life insurance operations were
previously separately disclosed. These items have been
reclassified to the corresponding banking operations’ line items
where appropriate.
Income statement
Net income before goodwill relating to insurance operations has
been reclassified for the year ended 31 December 2004 to
appropriate new line items.
Note 15: IAS 1 – Reclassification of exceptional items
Within banking operations, exceptional items previously disclosed
separately have been re-allocated to appropriate line items in the
income statement for the year ended 31 December 2004.
S t a n d a rd Bank Group annual report 2005 P • 1 8 5
STD FIN Sec 2 Proof 10 4/11/06 11:02 AM Page 185

S t a n d a rd Bank Group annual report 2005 P • 1 8 6
IFRS reconciliation of assets, liabilities and equity
1 Jan 31 Dec 1 Jan2005 2004 2004
Note1 Rm Rm Rm
AssetsRestated/as previously reported 620 173 615 596 540 566 IFRS adjustments: (3 549) 4 577 2 945
IFRS 2 – Share-based payments 3 4 3IFRS 4 – Insurance contracts 13IAS 12/IAS 40 – Investment properties and PVIF 8 – 47 53IAS 16 – Revaluation of residual values in property and equipment 4 46 40 IAS 17 – Leases 7 266 261 IAS 18 – Revenue recognition 1 99 – –IAS 27 – Consolidation of mutual funds 6 3 647 2 586 IAS 32 – Elimination of treasury shares 10 (3 703)IAS 36 – Goodwill amortisation 2 112 IAS 36 – Goodwill impairment 2 (48)IAS 39 – Financial instrument reclassifications 11 (39) 10 (3)IAS 39 – Fair value adjustments 12 (21)IAS 39 – Credit impairments 9 115 (2) 5Reclassification of insurance 14 495
Restated under IFRS 616 624 620 173 543 511
LiabilitiesRestated/as previously reported 581 640 577 032 505 302 IFRS adjustments: 108 4 608 3 041
IFRS 2 – Share-based payments 3 136 117 IFRS 4 – Insurance contracts 13 12IAS 12/IAS 40 – Investment properties and PVIF 8 – 47 53IAS 16 – Revaluation of residual values in property and equipment 4IAS 17 – Leases 7 281 272 IAS 18 – Revenue recognition 1 58 3 11 IAS 27 – Consolidation of mutual funds 6 – 3 648 2 586 IAS 32 – Elimination of treasury shares 10IAS 36 – Goodwill amortisation 2IAS 36 – Goodwill impairment 2IAS 39 – Financial instrument reclassifications 11 – (2) –IAS 39 – Fair value adjustments 12 – – –IAS 39 – Credit impairments 9 38 – 2Reclassification of insurance 14 495
Restated under IFRS 581 748 581 640 508 343
EquityRestated/as previously reported 38 533 38 564 35 264 IFRS adjustments (net of taxation): (3 657) (31) (96)
IFRS 2 – Share-based payments 3 (132) (114)IFRS 4 – Insurance contracts 13 (12)IAS 12/IAS 40 – Investment properties and PVIF 8 – – –IAS 16 – Revaluation of residual values in property and equipment 4 46 40 IAS 17 – Leases 7 (15) (11)IAS 18 – Revenue recognition 1 41 (3) (11)IAS 27 – Consolidation of mutual funds 6 – (1) –IAS 32 – Elimination of treasury shares 10 (3 703)IAS 36 – Goodwill amortisation 2 112 IAS 36 – Goodwill impairment 2 (48)IAS 39 – Financial instrument reclassifications 11 (39) 12 (3)IAS 39 – Fair value adjustments 12 (21) – –IAS 39 – Credit impairments 9 77 (2) 3Reclassification of insurance 14 –
Restated under IFRS 34 876 38 533 35 168
1Refer to page 183 for details relating to notes.
Implementation of IFRS co n t i n u e d
STD FIN Sec 2 Proof 10 4/11/06 11:02 AM Page 186

IFRS reconciliation of balance sheet at 31 December 2004
2004 Reclassifi! Reclassifi!
as previously cation of cation of 2004
reported IFRS insurance accrued restated
SA GAAP adjustments)1 balances)2 interest IFRS
Rm Rm Rm Rm Rm
AssetsStandard Bank operations Cash and balances with banks 31 384 (58) 6 516 – 37 842
Short-term negotiable securities 21 040 – – 421 21 461
Derivative assets 124 235 1 – – 124 236
Trading assets 32 130 74 – 234 32 438
Investment securities held in banking operations 19 640 65 – 363 20 068
Investments held by insurance operations – – 98 609 – 98 609
Loans and advances 257 154 (3) – 1 722 258 873
Current and deferred taxation 1 084 9 1 – 1 094
Other assets 15 410 5 4 548 (2 740) 17 223
Interest in associates and joint ventures 286 10 2 954 – 3 250
Goodwill and other intangible assets 498 42 425 – 965
Property and equipment 2 968 46 1 100 – 4 114
Liberty LifeOther assets 4 616 891 (5 507) – –
Investments 104 442 2 941 (107 383) – –
Goodwill and other intangible assets 366 59 (425) – –
Equipment and furniture 343 – (343) – –
Total assets 615 596 4 082 495 – 620 173
Equity and liabilitiesEquity 38 564 (31) – – 38 533
Equity attributable to ordinary shareholders 29 087 (33) 10 – 29 064
Ordinary share capital and premium 2 676 – – – 2 676
Reserves 26 411 (33) 10 – 26 388
Preference share capital and premium 2 991 – – – 2 991
Minority interest 6 486 2 (10) – 6 478
Liabilities 577 032 4 113 495 – 581 640
Standard Bank operations
Derivative liabilities 116 214 (2) 2 – 116 214
Trading liabilities 14 410 – – – 14 410
Deposit and current accounts 316 516 76 – 5 885 322 477
Current and deferred taxation 3 407 2 1 403 – 4 812
Other liabilities 15 879 158 6 089 (6 052) 16 074
Policyholders' liabilities – insurance contracts – – 65 972 – 65 972
Policyholders' liabilities – investment contracts – – 32 021 – 32 021
Subordinated bonds 9 493 – – 167 9 660
Liberty LifeOther liabilities and provisions 3 064 4 428 (7 492) – –
Convertible bonds – – – – –
Policyholders’ liabilities 98 049 (549) (97 500) – –
Total equity and liabilities 615 596 4 082 495 – 620 173
1Adjustments resulting from adoption of IFRS as discussed on page 183.
2Reclassification of balances by insurance operations and the line by line consolidation of Liberty Life into banking operations.
S t a n d a rd Bank Group annual report 2005 P • 1 8 7
STD FIN Sec 2 Proof 10 4/11/06 11:02 AM Page 187

S t a n d a rd Bank Group annual report 2005 P • 1 8 8
Implementation of IFRS co n t i n u e d
IFRS equity impact
Ordinary
share Hedge Statutory
capital Empower! Trans! of net credit
and ment lation investment risk
premium reserve reserve reserve reserve
Note1 Rm Rm Rm Rm Rm
Balance at 1 January 2004 as previously reported 2 407 – 413 68 –
Adjustment on adoption of IFRS 2
IFRS 2 – Share-based payments 3
IAS 16 – Revaluation of residual values in property and equipment 4
IAS 16 – Reclassification of property revaluations 5
IAS 17 – Leases 7
IAS 18 – Revenue recognition 1
IAS 39 – Financial instrument reclassifications 11
IAS 39 – Credit impairments 9 2
Taxation impact
Restated balance at 1 January 2004 2 407 – 413 68 2
Adjustments for the year ended 31 December 2004 36 1
Income statement adjustments (refer income statement
impact for detailed reconciliation)
Equity adjustments 36 1
IFRS 2 – Share-based payments 3
IAS 16 – Reclassification of property revaluations 5
IAS 39 – Financial instrument reclassifications 11
IAS 39 – Credit impairments 9 1
Impact of IFRS restatements on translation reserve 36
Changes in shareholders' funds as previously reported per SA GAAP 269 (4 246) (1 396) 88
Balance at 1 January 2005 2 676 (4 246) (947) 156 3
Adjustment on adoption of IFRS
IFRS 4 – Insurance contracts 13
IAS 18 – Revenue recognition 1
IAS 32 – Elimination of treasury shares 10
IAS 39 – Financial instrument reclassifications 11
IAS 39 – Fair value adjustments 12
IAS 39 – Credit impairments 9
Taxation impact
Restated balance at 1 January 2005 2 676 (4 246) (947) 156 3
1Refer to page 183 for details relating to notes.
STD FIN Sec 2 Proof 10 4/11/06 11:02 AM Page 188

Preference
Available! Re! Share! Ordinary share
Cash flow for!sale valuation based share! capital
hedging revaluation and other Treasury payment Retained holders’ and Minority Total
reserve reserve reserves shares reserve earnings funds premium interest equity
Rm Rm Rm Rm Rm Rm Rm Rm Rm Rm
44 484 224 – – 25 195 28 835 8 6 421 35 264
93 23 (209) (91) (5) (96)
23 (140) (117) (117)
40 40 40
93 (93) – –
(7) (7) (5) (12)
(11) (11) (11)
(3) (3) (3)
3 5 5
2 2 2
44 484 317 – 23 24 986 28 744 8 6 416 35 168
(5) 70 (34) 68 (3) 65
(57) (57) 4 (53)
(5) 70 23 125 (7) 118
70 70 12 82
(5) (5) (8) (13)
24 24 1 25
(1) – –
36 (12) 24
(5) 15 (7) 5 534 252 2 983 65 3 300
39 499 305 – 93 30 486 29 064 2 991 6 478 38 533
(399) (354) (148) (901) (2 756) (3 657)
(4) (4) (9) (13)
11 11 30 41
(354) (597) (951) (2 752) (3 703)
(399) 381 (18) (25) (43)
(29) (29) (29)
109 109 109
(19) (19) (19)
39 100 305 (354) 93 30 338 28 163 2 991 3 722 34 876
S t a n d a rd Bank Group annual report 2005 P • 1 8 9
STD FIN Sec 2 Proof 10 4/11/06 11:02 AM Page 189

S t a n d a rd Bank Group annual report 2005 P • 1 9 0
Implementation of IFRS co n t i n u e d
IFRS income statement impact
2004 as previously reported
Line by line
consolidation
Standard Standard IFRS IAS 1 and reclassifi!
Bank Liberty Bank adjust! reclassi! cation of
operations Life Group ment fication insurance
Rm Rm Rm Rm Rm Rm
Note1 15 14
Income from banking operations 26 499 26 499 37
Net interest income 11 451 11 451 41
Interest income 35 206 35 206 41
Interest expense 23 755 23 755 –
Non-interest revenue 15 048 15 048 (4) 44
Income from life insurance operations 32 311
Net insurance premiums 12 406 12 406
Investment income and gains 18 830 17 619
Management and service fee income 1 075 1 075
Total income 26 499 26 499 32 348
Credit impairment charges 1 048 1 048 2
Benefits due to policyholders 24 809
Net insurance benefits and claims 19 115 19 030
Fair value adjustment to policyholders'
liabilities under investment contracts 4 666 4 645
Fair value adjustment on third party fund interests 1 028
Income after credit impairment charges
and policyholders' benefits 25 451 25 451 7 537
Operating expenses in banking operations 15 242 15 242 142
Staff costs 8 499 8 499 111
Other operating expenses 6 743 6 743 31 32
Operating expenses in life insurance operations 4 684
Acquisition costs – insurance and investment contracts 1 920 1 920
Other operating expenses 2 764 2 578
Liberty Life – net income before goodwill 2 695 2 695 (2 695) (2 695)
Net income before goodwill 10 209 2 695 12 904 16
Goodwill amortisation and exceptional items 86 – 86 (86) 12
Goodwill impairment – 12 12 36
Net income from banking and insurance 10 123 2 683 12 806 66
Income from associates and joint ventures 97 – 97 30 30
Net income before indirect taxation 10 220 2 683 12 903 96
Indirect taxation 389 – 389 262 262
Profit before direct taxation 9 831 2 683 12 514 (166)
Direct taxation 2 489 900 3 389 (113)
Profit for the year 7 342 1 783 9 125 (53) – –
Attributable to minorities 127 1 257 1 384 4 – –
Attributable to ordinary shareholders 7 215 526 7 741 (57) – –
1Refer to page 183 for details relating to notes.
STD FIN Sec 2 Proof 10 4/11/06 11:02 AM Page 190

Relevant accounting standards
IAS 27
Consoli!
dation IAS 39
IAS 12/ of mutual IAS 39 reclassi! 2004
IFRS 2 IAS 40 IAS 16 IAS 17 IAS 18 funds IAS 36 impairment fication restated
Rm Rm Rm Rm Rm Rm Rm Rm Rm Rm
3 8 4 &5 7 1 6 2 9 11
26 536
11 492
41 35 247
23 755
(46) (2) 15 044
32 311
12 406
18 49 1 144 18 830
1 075
58 847
2 1 050
24 809
85 19 115
21 4 666
1 028 1 028
32 988
15 384
111 8 610
(6) 5 6 774
4 684
1 920
15 6 49 116 2 764
–
12 920
(98) –
36 48
12 872
127
12 999
651
12 348
(112) 4 (5) 3 276
(126) – 20 (5) – – 62 (2) (2) 9 072
(10) – 8 – (3) – 9 – – 1 388
(116) – 12 (5) 3 – 53 (2) (2) 7 684
S t a n d a rd Bank Group annual report 2005 P • 1 9 1
STD FIN Sec 2 Proof 10 4/11/06 11:02 AM Page 191

S t a n d a rd Bank Group annual report 2005 P • 1 9 2
Implementation of IFRS co n t i n u e d
IFRS balance sheet impact
1 Jan 2005 31 Dec 2004 31 Dec 2004 1 Jan 2004 1 Jan 2004
IFRS
restated IFRS SA GAAP IFRS SA GAAP
Rm Rm Rm Rm Rm
Assets Standard Bank operations
Cash and balances with banks 37 842 37 842 31 384 25 960 22 081
Short-term negotiable securities 21 461 21 461 21 040 22 396 22 018
Derivative assets 124 227 124 236 124 235 104 723 104 723
Trading assets 32 438 32 438 32 130 33 939 33 488
Investment securities held in banking operations 20 068 20 068 19 640 20 459 20 057
Investments held by insurance operations 94 873 98 609 89 918
Loans and advances 258 982 258 873 257 154 221 980 220 375
Current and deferred taxation 1 111 1 094 1 084 585 803
Other assets 17 293 17 223 15 410 17 834 16 737
Interest in associates and joint ventures 3 250 3 250 286 711 541
Goodwill and other intangible assets 965 965 498 838 508
Property and equipment 4 114 4 114 2 968 4 168 3 040
Liberty Life
Other assets 4 616 3 687
Investments 104 442 91 868
Goodwill and other intangible assets 366 277
Equipment and furniture 343 363
Total assets 616 624 620 173 615 596 543 511 540 566
Equity and liabilitiesEquity 34 876 38 533 38 564 35 168 35 264
Equity attributable to ordinary shareholders 28 163 29 064 29 087 28 744 28 835
Ordinary share capital and premium 2 676 2 676 2 676 2 407 2 407
Reserves 25 487 26 388 26 411 26 337 26 428
Preference share capital and premium 2 991 2 991 2 991 8 8
Minority interest 3 722 6 478 6 486 6 416 6 421
Liabilities 581 748 581 640 577 032 508 343 505 302
Standard Bank operations
Derivative liabilities 116 214 116 214 116 214 98 634 98 634
Trading liabilities 14 410 14 410 14 410 18 162 18 162
Deposit and current accounts 322 477 322 477 316 516 278 991 272 677
Current and deferred taxation 4 849 4 812 3 407 3 972 2 827
Other liabilities 16 132 16 074 15 879 16 666 18 162
Policyholders’ liabilities - insurance contracts 70 555 65 972 55 769
Policyholders’ liabilities - investment contracts 27 451 32 021 27 416
Subordinated bonds 9 660 9 660 9 493 8 733 7 056
Liberty Life
Other liabilities and provisions 3 064 2 444
Convertible bonds 1 500
Policyholders’ liabilities 98 049 83 840
Total equity and liabilities 616 624 620 173 615 596 543 511 540 566
STD FIN Sec 2 Proof 10 4/11/06 11:02 AM Page 192

ANNEXURE B C u r rency balance sheet
S t a n d a rd Bank Group annual report 2005 P • 1 9 3
2005
Rand UK£ US$ Euro Other Total
Rm Rm Rm Rm Rm Rm
On!balance sheet assets
Cash and balances with banks 25 638 2 828 36 778 2 006 3 602 70 852
Short-term negotiable securities 27 783 5 21 – 2 504 30 313
Derivative assets 71 053 331 28 519 285 – 100 188
Trading assets 12 496 244 13 836 5 354 6 516 38 446
Investments 150 343 7 108 – 2 946 153 404
Loans and advances 268 399 2 097 49 930 7 945 5 757 334 128
Current and deferred taxation 751 94 94 – 51 990
Other assets 9 319 119 2 370 371 824 13 003
Disposal groups held for sale – 1 802 539 39 – 2 380
Interest in associates and joint ventures 4 854 – – – 131 4 985
Goodwill and other intangible assets 2 213 156 30 – 54 2 453
Property and equipment 3 918 25 41 – 552 4 536
Total assets 576 767 7 708 132 266 16 000 22 937 755 678
On!balance sheet liabilities
Derivative liabilities 70 495 256 25 497 419 2 159 98 826
Trading liabilities 10 149 7 8 780 821 1 705 21 462
Deposit and current accounts 335 305 9 400 50 835 4 056 12 866 412 462
Current and deferred taxation 6 519 80 214 – 113 6 926
Other liabilities 18 235 310 1 204 266 1 277 21 292
Disposal groups held for sale – 899 343 25 – 1 267
Policyholders’ liabilities 140 835 – – – – 140 835
Subordinated bonds 9 958 – 2 478 – 208 12 644
Total liabilities 591 496 10 952 89 351 5 587 18 328 715 714
Net assets including minority interest (14 729) (3 244) 42 915 10 413 4 609 39 964
Net off!balance sheet currency position 28 453 8 109 (30 238) (5 646) (690) (12)
Net open foreign!currency position 13 724 4 865 12 677 4 767 3 919 39 952
2004
Rand UK£ US$ Euro Other Total
Rm Rm Rm Rm Rm Rm
Net open foreign!currency position 32 761 1 806 8 091 (2 908) (1 186) 38 564
STD FIN Sec 2 Proof 10 4/11/06 11:02 AM Page 193

S t a n d a rd Bank Group annual report 2005 P • 1 9 4
ANNEXURE C S u b s i d i a r i e s
Standard Bank Group
Liberty Holdings(56,0%)1
The Standard Bank of South Africa
Diners Club (SA)
Blue Bond Investments
Standard Bank InsuranceBrokers
Melville DouglasInvestment Management
Standard Insurance
Standard Executors andTrustees
Stanvest
Lesotho Bank (1999)(70%)
Standard Bank Lesotho
Standard Bank Namibia
Standard Bank Swaziland(65%)
Stanbic Bank Botswana
Stanbic Bank Congo
Stanbic Bank Ghana(96,5%)
Stanbic Bank Kenya (96%)
Stanbic Bank Limited,Malawi (60%)
Stanbic Bank Nigeria
Stanbic Bank Tanzania
Stanbic Bank Uganda(90%)
Stanbic Bank Zambia
Stanbic Bank Zimbabwe
Standard Bank MauritiusOffshore Banking Unit
Standard Bank s.a.r.l.Mozambique (96%)
UKStandard Bank London
AsiaStandard Bank Asia
Standard Merchant Bank(Asia)
Standard London (Asia) SB
USAStandard Americas
Standard New York
Standard New YorkSecurities
BrazilBanco Standard deInvestimentos
Czech RepublicStandard Aval
ChinaStandard Resources
TurkeyStandard Yatirim
RussiaZAO Standard Bank
Liberty Active
Liberty Ermitage Jersey
Liberty Group Properties
Capital Alliance Holdings
Stanbic AfricaHoldings
S t a n d a rd Inte r n a t i o n a lH o l d i n g s
Isle of ManStanbic InternationalInsurance
Standard Finance (IOM)
SBIC Finance
SML
JerseyStandard Bank Jersey
Standard Bank FundAdministration Jersey
Standard Bank FinancialManagers Jersey
Standard Bank OffshoreTrust Company Jersey
Isle of ManStandard Bank Isle of Man
MauritiusStandard Bank TrustCompany (Mauritius)
British Virgin IslandsMelville DouglasInternational
Standard Bank GroupInternational
S t a n d a rd Bank OffshoreG ro u p
Liberty Group(52,2%)1
Stanlib CollectiveInvestments
Stanlib Multi-manager
Stanlib WealthManagement
Stanlib Asset Management
(37,4%) STANLIB(37,4%)
Effective 48,33%
This diagram depicts principal subsidiaries only.
The holding in subsidiaries is 100% unless otherwise indicated.1Representative of legal effective holding.
STD FIN Sec 2 Proof 10 4/11/06 11:02 AM Page 194

S t a n d a rd Bank Group annual report 2005 P • 1 9 5
Nominal Effective Book value Netshare capital holding of shares indebtedness
Nature of issued 2005 2004 2005 2004 2005 2004operation Rm % % Rm Rm Rm Rm
Standard Bank Group will ensure that, except in the case of political risk, its banking subsidiaries, and its principal non-banking subsidiaries denoted by #, are able to meet their contractual liabilities.
Banking subsidiariesBanco Standard de Investimentos Investment bank ** 100 100S.A. (Brazil)1
Lesotho Bank (1999) Commercial bank 35 70 70Limited (Lesotho)1
Stanbic Bank Limited Commercial bank 13 60 60(Malawi)1
Stanbic Bank Botswana Commercial bank 31 100 100Limited (Botswana)1
Stanbic Bank Congo s.a.r.l Commercial bank ** 100 100(D R Congo)1
Stanbic Bank Ghana Commercial bank 78 97 97Limited (Ghana)1
Stanbic Bank Kenya Commercial bank 149 96 96Limited (Kenya)1
Stanbic Bank Nigeria Commercial bank 89 100 93Limited (Nigeria)1
Stanbic Bank Tanzania Commercial bank 13 100 100Limited (Tanzania)1
Stanbic Bank Uganda Commercial bank 21 90 90Limited (Uganda)1
Stanbic Bank Zambia Commercial bank 21 100 100Limited (Zambia)1
Stanbic Zimbabwe Commercial bank 55 100 100Limited (Zimbabwe)1
Standard Bank Asia Merchant bank 587 100 100Limited (UK)1
Standard Bank Isle of Man Merchant bank 25 100 100Limited (Isle of Man)1
Standard Bank Jersey Merchant bank 25 100 100Limited (Jersey)1
Standard Bank Lesotho Commercial bank 17 100 100 13 13 46Limited (Lesotho)
Standard Bank Plc Merchant bank 1 160 100 100 929 929(United Kingdom)2
Standard Bank Mauritius Commercial bank 226 100 100(Mauritius)1
Standard Bank Namibia Commercial bank 2 100 100 444 444Limited (Namibia)
Standard Bank s.a.r.l. Commercial bank ** 96 96Mozambique1
Standard Bank Swaziland Commercial bank 9 65 65 33 56 29 20Limited (Swaziland)
Standard Merchant Bank Merchant bank ** 100 100(Asia) Limited (Singapore)1
The Standard Bank of Commercial bank 60 100 100 10 614 8 014 (472) (202)South Africa Limited
ZAO Standard Bank (Russia)1 Investment bank ** 100 100
STD FIN Sec 2 Proof 10 4/11/06 11:02 AM Page 195

S t a n d a rd Bank Group annual report 2005 P • 1 9 6
Subsidiaries co n t i n u e d
Nominal Effective Book value Netshare capital holding of shares indebtedness
Nature of issued 2005 2004 2005 2004 2005 2004operation Rm % % Rm Rm Rm Rm
Non!banking subsidiariesAccelerator Fund 1 (Pty) Limited3 Securitisation vehicle
Allisier Investments (Pty) Limited1 Investment holding company ** 100 100
Andisa Securities (Pty) Limited1 Stockbrokers ** 100 100
Andisa Capital (Pty) Limited1, 5 Treasury ** 77
Blue Bond Investments Participation mortgage ** 100 100Limited1 bond finance
Blue Banner3 Mortgage financing
Blue Titanium Conduit3 Asset backed commercial **paper conduit
Blue Granite Investments No. 1 Securitisation vehicle(Pty) Limited3
Diners Club (S.A.) (Pty) Travel and ** 100 100Limited1 # entertainment card
Erf 224 Endenburg (Pty) Property owning ** 100 100Limited1 and investing company
Gleneagles Retail Centre Property owning ** 100 100(Pty) Limited1 and investing company
Grand Central Shopping Property owning ** 100 100Centre (Pty) Limited1 company
Liberty Group Limited1, 4 Insurance company 28 29 27
Liberty Holdings Limited4 Insurance holding 14 56 55 2 393 2 304company
Melville Douglas International Portfolio ** 100 100(British Virgin Islands)1 # management
Melville Douglas Investment Portfolio ** 100 100 53 53Management (Pty) Limited # management
SBIC Finance Limited Project finance ** 100 100(Isle of Man)1
Standard Bank Group Investment holding ** 100 100 5 220 4 038International Limited company(Isle of Man)
SBIC Investments S.A Investment holding 287 100 100(Luxembourg)1 # company
SML Limited (Isle of Man)1 Investment holding ** 100 100company
SMT Limited (Isle of Man)1 Investment holding ** 100 100company
Stanbic Africa Holdings Investment holding 158 100 100 500 500Limited (United Kingdom)2 company
Standard Bank Financial Fund administration ** 100 100Managers Jersey Limited1 #
Standard Bank Insurance Insurance ** 100 100Brokers Namibia (Pty) Limited1 company
Standard Insurance Limited # Short-term insurance 15 100 100 30 30
Stanbic International Insurance 1 100 100Insurance Limited company(Isle of Man)1
Standard Americas Inc Trading company ** 100 100(USA)1 #
Standard Aval s.r.o. Trade and ** 100 100(Czech Republic)1 other finance
Standard Bank Insurance Insurance broking ** 100 100Brokers (Pty) Limited1 #
Standard Bank London Investment holding 672 100 100Holdings Plc (United Kingdom)1 company
Standard Bank Manx Investment holding 1 100 100Holdings Limited company(Isle of Man)1
STD FIN Sec 2 Proof 10 4/11/06 11:02 AM Page 196

S t a n d a rd Bank Group annual report 2005 P • 1 9 7
Nominal Effective Book value Netshare capital holding of shares indebtedness
Nature of issued 2005 2004 2005 2004 2005 2004operation Rm % % Rm Rm Rm Rm
Standard Bank Offshore Investment 17 100 100 49 49Group Limited (Jersey) 2 holding company
Standard Bank Offshore Trust Trust company 2 100 100Company (Jersey) Limited (Jersey)1 #
Standard Bank Trust Trust company 1 100 100Company (Isle of Man)Limited (Isle of Man)1 #
Standard Bank Trust Trust company ** 100 100Company (Mauritius)Limited (Mauritius)1 #
Standard Commodities (Asia) Commodities ** 100 100Limited (Hong Kong)1 trading
Standard Executors and Trust company ** 100 100Trustees Limited1 #
Standard Finance Finance company ** 100 100(Isle of Man) Limited(Isle of Man)1 #
Standard International Investment 72 100 100 99 99Holdings S.A. (Luxembourg)2 # holding company
Standard London (Asia) Investment 78 100 100Limited (Hong Kong)1 company
Standard London (Asia) Introducing broker 1 100 100Sendirian Berhad (Malaysia)1
Standard New York Securities ** 100 100Securities, Inc (USA)1 # broker/dealer
Standard New York, Investment ** 100 100Inc (USA)1 # holding company
Standard Resources (China) Limited1 Trading company 1 100 100
Standard Yatirim Menkul Securities 41 100 100Kiymetler A.S. (Turkey)1 # broker/dealer
Stanlib Limited2 Wealth and ** 48 48 687 687 27 28asset management
Stanvest (Pty) Limited2 Investment 1 100 100holding company
Triskelion Trust Company Trust company 3 100 100Limited1
Miscellaneous Finance companies 100 100 43 41 (411) (390)
21 107 17 257 (781) (544)
The nominal share capital issued of foreign subsidiaries has been stated in the above table at their rand equivalents at the rates of exchange ruling on the dates of provision ofcapital. Detailed information is not given in respect of subsidiaries which are not material to the financial position of the group, including those acquired through realisation ofsecurities held by banking companies.1Held indirectly.2Effective holding comprises direct and indirect holdings.3Special purpose entity, no shareholding.4Listed on the JSE.5Accounted for as an associate in 2004.
** Issued share capital less than R1 million.
STD FIN Sec 2 Proof 10 4/11/06 11:02 AM Page 197

S t a n d a rd Bank Group annual report 2005 P • 1 9 8
Edu!Loan Mathomo Group South African Home Loans
(Proprietary) Limited Limited (Proprietary) Limited
Ownership structure Associate Associate Associate
Nature of business Student loans Retailer Finance
Year end December September February
Date to which equity accounted 31 December 2005 31 December 2005 31 December 2005
2005 2004 2005 2004 2005 2004
Effective holding 45% 45% 26% 26% 43% 43%
Rm Rm Rm Rm Rm Rm
Carrying value 35 31 – 29 80 57
Goodwill 2 2 – – 47 47
Balance sheetNon-current assets 18 26 16 19 14 411 9 525
Current assets 187 164 106 98 339 492
Non-current liabilities (43) (54) (27) (23) (14 100) (8 876)
Current liabilities (93) (73) (917) (82) (636) (978)
Loans to entity – – – 128 2 493
Income statementAttributable income 6 5 (9) (1) 23 10
JR163 Investments Andisa Capital RCS Investment Holdings
(Proprietary) Limited (Proprietary) Limited1 (Proprietary) Limited
Ownership structure Associate Associate Associate
Nature of business Photographic equipment Securities trading Finance
Year end April December March
Date to which equity accounted 31 December 2005 1 October 2005 31 December 2005
2005 2004 2005 2004 2005 2004
Effective holding 38% 30% 49% 25%
Rm Rm Rm Rm Rm
Carrying value 19 66 (31) 388
Goodwill – – – –
Balance sheetNon-current assets 56 293 309 31
Current assets 67 138 120 1 213
Non-current liabilities (11) (23) (328) (784)
Current liabilities – (73) (166) (119)
Loans to entity – – 55 131
Income statementAttributable income (15) 8 6 (14) 30
1Acquired a further 28% during the year and is now accounted for as a subsidiary.
ANNEXURE D A s s o c i a tes and joint venture s
STD FIN Sec 2 Proof 10 4/11/06 11:02 AM Page 198

S t a n d a rd Bank Group annual report 2005 P • 1 9 9
Defy The Standard Bank The Cullinan Hotel
(Proprietary) Limited African Bank partnership (Proprietary) Limited
Ownership structure Joint venture Joint venture Joint venture
Nature of business Manufacturing Banking Leisure
Year end March September March
Date to which equity accounted 31 December 2005 31 December 2005 31 December 2005
2005 2004 2005 2004 2005 2004
Effective holding 50% 60% 60% 50% 50%
Rm Rm Rm Rm Rm
Carrying value 47 136 69 209 200
Goodwill – – – – –
Balance sheetNon-current assets 413 – 568 82 94
Current assets 720 775 32 14 17
Non-current liabilities (675) – (445) (53) (60)
Current liabilities (361) (24) (18) (9) (17)
Loans to entity 172 237 209 33 33
Income statementAttributable income 46 119 68 15 30
Other Other joint Total associates and
associates ventures joint ventures
Ownership structure Associates Joint ventures
Nature of business Various Various
Year end Various Various
Date to which equity accounted 31 December 2005 31 December 2005
2005 2004 2005 2004 2005 2004
Effective holding Various Various Various Various
Rm Rm Rm Rm Rm Rm
Carrying value 126 68 8 7 1 048 496
Goodwill – – – – 49 49
Balance sheetNon-current assets 173 135 – 1 15 200 10 970
Current assets 4 445 453 36 41 7 902 1 555
Non-current liabilities (1 746) (117) – – (17 439) (9 926)
Current liabilities (748) (286) (26) (29) (2 933) (1 722)
Loans to entity 43 – – – 744 2 790
Income statementAttributable income 5 17 – 4 226 127
STD FIN Sec 2 Proof 10 4/11/06 11:02 AM Page 199

S t a n d a rd Bank Group annual report 2005 P • 2 0 0
Equity compensation plans
Equity!settled share!based payments
Standard Bank's share incentive schemes enable key management personnel and senior employees to benefit from the performance of
Standard Bank Group Limited and Liberty Life Limited shares.
Standard Bank Group has two equity-settled schemes, namely the Group Share Incentive Scheme and the Standard Bank Equity Growth
Scheme. The Group Share Incentive Scheme confers rights to employees to acquire ordinary shares at the value of the Standard Bank Group
(SBG) share at the date the option is granted; this scheme is being phased out. The Equity Growth Scheme was implemented in 2005 and
represents appreciation rights allocated to employees. From a group perspective, the eventual value of the rights are effectively settled
by the issue of shares equivalent in value to the value of the rights.
The two schemes have three different sub-types of vesting categories as illustrated by the table below:
Vesting category Year % vesting Expiry
Type A 3, 4, 5 50, 75, 100 10 years
Type B 5, 6, 7 50, 75, 100 10 years
Type C 2, 3, 4 50, 75, 100 10 years
Refer the Corporate Governance report, page 44 for a detailed schedule of movements in share options issued to executive directors
during the year. A reconciliation of the movement of all share options and appreciation rights is detailed below.
Option price range Number
(rands) of options
Group Share Incentive Scheme 2005 2005 2004
Reconciliation
Options outstanding at beginning of the year 57 879 500 61 051 100
Granted 59,90 ! 65,60 874 100 11 669 300
Exercised 12,50 ! 65,60 (10 438 961) (12 323 700)
Lapsed 12,50 ! 65,60 (1 760 200) (2 517 200)
Options outstanding at end of the year 46 554 439 57 879 500
Share options were exercised regularly throughout the year. The weighted average share price for the year was R66,98.
The following options granted to employees, including executive directors, had not been exercised at 31 December 2005:
Number of Option Weighted
ordinary price range average price
shares (rands) (rands) Option expiry period
541 800 17,10 – 31,90 18,00 Year to 31 December 2006
1 231 100 18,30 – 32,00 20,74 Year to 31 December 2007
2 778 100 13,50 – 32,69 18,94 Year to 31 December 2008
2 617 800 17,15 – 26,40 18,26 Year to 31 December 2009
3 656 300 25,00 – 29,50 25,36 Year to 31 December 2010
6 913 539 27,70 – 35,90 31,84 Year to 31 December 2011
6 133 200 27,25 – 35,70 28,03 Year to 31 December 2012
11 154 800 27,70 – 34,85 27,97 Year to 31 December 2013
10 659 900 39,70 – 62,00 40,99 Year to 31 December 2014
867 900 59,90 – 65,60 65,02 Year to 31 December 2015
46 554 439
The share options granted during the year were valued, at grant date, using a Black-Scholes option pricing model. Each grant was valued
separately. The weighted fair value of the options granted per vesting type and the weighted assumptions utilised is illustrated on the next
page.
ANNEXURE E E q u i t y ! l i n ked tra n s a c t i o n s
STD FIN Sec 2 Proof 10 4/11/06 11:02 AM Page 200

S t a n d a rd Bank Group annual report 2005 P • 2 0 1
Type A Type B Type C
2005 2004 2005 2004 2005 2004
Number of options granted 430 800 10 272 500 443 300 746 800 – 650 000
Weighted average fair value
at grant date (rands) 20,43 12,15 21,93 13,33 – 7,70
The principal inputs are as follows:
Weighted average share price (rands) 64,43 40,90 65,60 42,02 40,66
Weighted average exercise price (rands) 64,43 40,90 65,60 42,02 40,66
Expected life (years) 6,1 6,1 7,0 7,0 4,0
Expected volatility (%) 30,0 31,9 30,0 31,7 32,0
Risk-free interest rate (%) 8,3 10,3 8,4 10,2 10,3
Dividend yield (%) 3,5 3,9 3,5 3,9 3,9
The options granted during the year which are expected to vest, have an estimated fair value of R14 million (2004: R112 million).
Average price Number
range (rands) of rights
Standard Bank Equity Growth Scheme 2005 2005
Reconciliation
Rights outstanding at beginning of the year – –
Granted 60,35 – 75,01 7 761 900
Exercised1 65,60 (4 200)
Lapsed 65,60 (276 600)
Rights outstanding at end of the year2 7 481 100
1During the year 106 SBG shares were issued to settle the appreciated rights value, at a weighted average share price of R67,30, in terms
of severance packages.
2At the end of the year the group would need to issue 1 020 399 SBG shares to settle the outstanding appreciated rights value.
The following rights granted to employees, including executive directors, had not been exercised at 31 December 2005:
Weighted
Number of Price range average price
rights (rands) (rands) Expiry period
7 481 100 60,35 – 75,01 65,47 Year to 31 December 2015
The share appreciation rights granted during the year were valued using a Black-Scholes option pricing model. Each grant was valued
separately. The weighted fair value of the options granted per vesting type and the weighted assumptions utilised is illustrated below:
Type A Type B
2005 2005
Number of appreciation rights granted 3 092 800 4 669 100
Weighted average fair value at grant date (rands) 20,88 21,88
The principal inputs are as follows:
Weighted average share price (rands) 65,50 65,43
Weighted average exercise price (rands) 65,50 65,43
Expected life (years) 6,1 7,0
Expected volatility (%) 30,0 30,0
Risk-free interest rate (%) 8,4 8,4
Dividend yield (%) 3,5 3,5
The appreciation rights granted during the year which are expected to vest have a fair value of R121 million.
STD FIN Sec 2 Proof 10 4/11/06 11:02 AM Page 201

S t a n d a rd Bank Group annual report 2005 P • 2 0 2
Cash!settled share!based payments
Corporate & Investment Banking International has a long-term incentive scheme (SIH Shadow Scheme) whereby certain employees are
granted 'shadow' share options on the notional value of the shares in Standard International Holdings S.A. (SIH). The scheme, which was
set up in 1998, provides for eligible employees to be rewarded in cash by reference to the growth in value of notional shares in SIH.
The SIH Shadow Scheme up until March 2004 had SBG share options underpinning the liability. From a group perspective the underpinning
options do not affect the liability but are merely reserved for future allocation. From March 2005 SIH Shadow share options have been
issued without any SBG underpinning options. At year end 21 652 568 (2004: 21 890 653) SBG options were allocated as underpins.
Option price
range (US$ cents) Number
SIH Shadow Scheme 2005 2005 2004
Reconciliation
Options outstanding at beginning of the year 22 633 263 20 547 552
Granted 0 – 283 9 576 179 4 380 853
Exercised – (1 785 533)
Lapsed 159 – 283 (1 992 901) (509 609)
Options outstanding at end of the year 30 216 541 22 633 263
The following options granted to employees had not been exercised at 31 December 2005:
Option Weighted
Number of price range average price
ordinary shares (US$ cents) (US$ cents) Option expiry period
3 666 510 0 – 115 100 Year to 31 December 2008
2 303 311 221 221 Year to 31 December 2010
2 846 664 279 279 Year to 31 December 2011
3 948 132 238 238 Year to 31 December 2012
4 514 954 159 159 Year to 31 December 2013
3 898 064 283 283 Year to 31 December 2014
9 038 906 0 – 220 131 Year to 31 December 2015
30 216 541
The SIH Shadow share options are valued using actual profit and balance sheet projections. The cost of the scheme is calculated using these
option values with an allowance made for expected lapses and is spread over the vesting period of the options.
Equity participation plansTutuwa initiative
The group entered into a black economic empowerment transaction during 2004, which also resulted in the recognition of a share-based
payment expense. The instrument was valued using a number of valuation techniques including the Black-Scholes and discounted
cash flow methods. Due to the uniqueness of the instrument, the mid-point of the range of valuations was used arriving at a value
of R8,50 per Standard Bank Group instrument granted to black managers. This value is expensed over the vesting period ending
31 December 2010.
Total expense recognisedStandard Bank has recognised a total expense of R146 million (2004: R68 million) relating to equity-settled share-based payments,
comprising R80 million (2004: R52 million) for share options and appreciation rights, and R66 million (2004: R16 million) relating to the
Tutuwa transaction.
Liberty Life has similar share-based payment transactions and has recognised a total expense of R45 million (2004: R16 million) relating
to equity-settled share-based payments, comprising R20 million (2004: R12 million) for share options and appreciation rights, and
R25 million (2004: R4 million) relating to the Tutuwa expense.
SIH has recognised a total expense of USD4 million (2004: USD6 million) relating to the cash-settled share-based payments. The year end
provision in respect of liabilities under the SIH Shadow Scheme amounted to USD28 million (2004: USD23 million).
E q u i t y ! l i n ked transactions co n t i n u e d
STD FIN Sec 2 Proof 10 4/11/06 11:02 AM Page 202

Abridged financial state m e n t s of principal banking subsidiary
S t a n d a rd Bank Group annual report 2005 P • 2 0 3
The Standard Bank ofSouth Africa Limited
31 December
2005 2004Rm Rm
Balance sheetAssetsCash and balances with banks 41 005 8 750Short-term negotiable securities 19 642 16 306Derivative assets 68 979 97 619Trading assets 11 295 6 545Investments 13 429 16 451Loans and advances 250 939 202 229Current and deferred taxation 355 332Other assets 4 376 4 890Interest in group companies, associates and joint ventures 22 870 29 450Intangible assets 196 205Property and equipment 2 421 2 099
Total assets 435 507 384 876
Equity and liabilitiesEquityEquity attributable to ordinary shareholders 20 376 18 163
Ordinary share capital 60 60Ordinary share premium 10 730 8 137Reserves 9 586 9 966
Liabilities 415 131 366 713
Derivative liabilities 65 084 92 349Trading liabilities 3 324 1 860Deposit and current accounts 314 703 249 237Current and deferred taxation 3 271 2 787Other liabilities 6 037 5 388Subordinated bonds 7 832 8 014Liabilities to group companies 14 880 7 078
Total equity and liabilities 435 507 384 876
Income statementNet interest income 10 605 9 605
Interest income 33 289 30 735Interest expense 22 684 21 130
Non-interest revenue 10 709 9 370
Total income 21 314 18 975Credit impairment charges 1 248 851
Income after credit impairment charges 20 066 18 124Operating expenses 12 061 10 718
Staff costs 6 933 5 893Other operating expenses 5 128 4 825
Income before indirect taxation 8 005 7 406Indirect taxation 458 316
Profit before direct taxation 7 547 7 090Direct taxation 1 491 1 708
Profit attributable to ordinary shareholders 6 056 5 382
STD FIN Sec 2 Proof 10 4/11/06 11:02 AM Page 203

S t a n d a rd Bank Group annual report 2005 P • 2 0 4
S t a n d a rd Bank operations average balance sheet at 31 December 2005
2005
Non! Total
interest Interest average
earning)1 earning balance
Rm Rm Rm
Assets
Cash and balances with banks 10 585 41 716 52 301Short-term negotiable securities 39 29 368 29 407Trading assets 33 870 – 33 870
Investments 2 362 12 897 15 259Loans and advances 14 062 274 476 288 538
– Overnight lending – 23 058 23 058– Card debtors – 9 795 9 795
– Term lending 14 229 69 188 83 417– Instalment sales and finance leases – 39 217 39 217– Mortgage lending – 109 667 109 667
– Commercial property finance – 13 902 13 902– Foreign currency lending 22 7 566 7 588– Other loans and advances3 371 5 262 5 633
– Credit impairments for non-performing loans (560) (3 179) (3 739)
Other assets 20 802 – 20 802Interest in associates and joint ventures 268 – 268Goodwill and other intangible assets 258 – 258
Property and equipment 2 586 – 2 586
Total average assets and interest excluding trading derivative assets 84 832 358 457 443 289
Trading derivative assets 119 498 – 119 498
Total average assets and interest 204 330 358 457 562 787
Equity and liabilitiesEquity 13 732 18 487 32 219
Liabilities 56 613 356 678 413 291
Trading liabilities 21 056 – 21 056Deposit and current accounts 21 040 345 700 366 740
– Overnight deposits 542 135 729 136 271– Term deposits 19 786 184 189 203 975
– Foreign currency funding 47 13 098 13 145– Other funding and loans 665 12 684 13 349
Other liabilities 13 856 – 13 856Subordinated bonds 661 10 978 11 639
Total average equity, liabilities and interest excluding trading derivative liabilities 70 345 375 165 445 510
Trading derivative liabilities 117 277 – 117 277
Total average equity, liabilities and interest 187 622 375 165 562 787
Margin on total average assets excluding trading derivatives
Margin on total average loans and advances
Margin on average interest earning assets
1Non-interest earning assets and liabilities include all trading book assets and liabilities.
2Interest received and paid on trading derivative financial instruments has been netted with interest received on derivative instruments used for
hedging purposes allocated to the instrument being hedged.
3The average rate is distorted due to applying set-off to the average balance with no corresponding interest adjustment.
STD FIN Sec 2 Proof 10 4/11/06 11:02 AM Page 204

2004
Non- Total
Average interest Interest average Average
Interest2 rate earning)1 earning balance Interest)2 rate
Rm % Rm Rm Rm Rm %
2 152 4,11 7 686 26 874 34 560 1 250 3,62
2 018 6,86 362 24 339 24 701 1 664 6,74
– – 34 174 – 34 174 – –
1 205 7,90 1 835 13 462 15 297 1 269 8,30
26 291 9,11 21 926 213 093 235 019 22 805 9,70
2 817 12,22 – 21 212 21 212 2 809 13,24
1 267 12,94 – 6 627 6 627 861 12,99
4 794 5,75 19 597 53 932 73 529 4 999 6,80
4 384 11,18 – 33 326 33 326 3 979 11,94
10 152 9,26 – 79 781 79 781 7 839 9,83
1 476 10,62 – 10 516 10 516 1 190 11,32
320 4,22 28 7 577 7 605 272 3,58
1 081 19,19 2 767 3 509 6 276 856 13,64
(466) (3 387) (3 853)
126 0,61 27 835 – 27 835 – –
– – 286 – 286 – –
– – 181 – 181 – –
– – 2 661 – 2 661 – –
31 792 7,17 96 946 277 768 374 714 26 988 7,20
– – 91 399 – 91 399 – –
31 792 5,65 188 345 277 768 466 113 26 988 5,79
– – 13 446 16 273 29 719 – –
18 805 4,55 65 907 279 905 345 812 15 496 4,48
– – 13 841 – 13 841 – –
17 798 4,85 33 826 271 997 305 823 14 582 4,77
6 253 4,59 1 055 110 336 111 391 5 567 5,00
10 913 5,35 28 713 135 310 164 023 8 423 5,14
419 3,19 – 12 825 12 825 267 2,08
213 1,60 4 058 13 526 17 584 325 1,85
– – 17 255 – 17 255 – –
1 007 8,65 985 7 908 8 893 914 10,28
18 805 4,22 79 353 296 178 375 531 15 496 4,13
– – 90 582 – 90 582 – –
18 805 3,34 169 935 296 178 466 113 15 496 3,32
12 987 2,93 11 492 3,07
12 987 4,50 11 492 4,89
13 478 3,76 11 944 4,30
S t a n d a rd Bank Group annual report 2005 P • 2 0 5
STD FIN Sec 2 Proof 10 4/11/06 11:02 AM Page 205

S t a n d a rd Bank Group annual report 2005 P • 2 0 6
I n ternational re p re s e n t a t i o n
Standard Bank GroupLimitedReg No. 1969/017128/06
Registered Office9th FloorStandard Bank Centre5 Simmonds StreetJohannesburg 2001
PO Box 7725Johannesburg 2000
Telephone: (2711) 636-9111Facsimile: (2711) 636-4207e-mail: [email protected]: http://www.standardbank.co.za
ArgentinaStandard Bank Argentina S.A.Torre Bouchard 577/599Buenos Aires C1106 ABGArgentina
F CanzaniDirector
Standard Bank Plc – representativeofficeTorre Bouchard 577/599Buenos Aires C1106 ABGArgentina
F CanzaniRepresentative
AustraliaStandard Bank Plc – representativeofficeLevel 42Gateway1 Macquarie PlaceSydney NSW 2000Australia
K RussellRepresentative
BotswanaStanbic Bank Botswana Limited1st Floor Stanbic HouseOff Machel DriveFairgroundGaboroneBotswana
DW KennedyManaging director
BrazilBanco Standard de InvestimentosS.A.Edificio Plaza IguatemiAv. Brigadeiro Faria Lima2277, 120 andar – J Paulistano01452-000 São PauloBrazil
F SolferiniDirector
Standard Bank Plc – representativeofficeEdificio Plaza IguatemiAv. Brigadeiro Faria Lima2277, 120 andar – J Paulistano01452-000 São PauloBrazil
F SolferiniRepresentative
ChinaStandard Resources (China)LimitedLevel 23, Citigroup Tower33 Hua Yin Shi Qiao RoadPudong New AreaShanghai 200120The People’s Republic of China
V YuContact
Standard Bank Plc – representativeoffice15th Floor, HSBC Tower101 Yin Cheng East RoadPudong New AreaShanghai 200120The People’s Republic of China
J YangRepresentative
Czech RepublicStandard Aval s.r.o.Americká 16120 00, Praha 2Czech Republic
P MosnaDirector
Democratic Republicof CongoStanbic Bank Congo s.a.r.lAvenue de la Mongala No 12BP 16297, Kinshasa 1Democratic Republic of Congo
L NalletManaging director
GhanaStanbic Bank Ghana LimitedValco Trust HouseCastle Road, RidgeAccraGhana
J MabonManaging director
Hong KongStandard Bank Asia Limited36th FloorTwo Pacific Place88 QueenswayHong Kong
MJ WildeChief executive
IranStandard Bank Plc – representativeofficeSayeh Tower8th floor, Unit 21409 Vali-e-Asr AveTehran 19677Iran
H AnoushahpourRepresentative
ItalyStandard Bank Plc – representativeofficeLargo Treves, 520121 MilanItaly
U ForasassiRepresentative
KenyaStanbic Bank Kenya LimitedKenyatta AvenueNairobiKenya
M du ToitManaging director
v
STD FIN Sec 2 Proof 10 4/11/06 11:02 AM Page 206

LesothoStandard Bank Lesotho Limited1st FloorBank BuildingKingswayTown CentreMaseruLesotho
CG AddisManaging director
Lesotho Bank (1999) LimitedCentral ServicesLesotho Bank Building, 1st floorKingswayMaseruLesotho
CG AddisManaging director
MadagascarUnion Commercial Bank S.A.Rue Solombavambahoaka Frantsay 77Antsahavola (101)AntananarivoMadagascar
H FleurotChief executive
MalawiStanbic Bank LimitedC n r. V i c toria Avenue and Glyn Jones Ro a d sB l a n t y r eM a l a w i
PS OderaManaging director
Malaysia Standard London (Asia) Sdn BhdLevel 32, Suite B, Menara MaxisKuala Lumpur City Centre50088 Kuala LumpurMalaysia
WL ChayDirector
MauritiusStandard Bank (Mauritius) LimitedSuite 5055th floor, Barkly WharfCaudan WaterfrontPort LouisMauritius
MJJR ReyManaging director
MexicoStandard Bank Plc – representativeofficeCampos Eliseos 345Edificio OmegaCol. Chapultepec Polanco11560 Mexico City, DFMexico
F Hernandez LozanoRepresentative
MoçambiqueStandard Bank s.a.r.l MozambiquePraça 25 de Junho No 1MaputoMoçambique
A CoutinhoManaging director
NamibiaStandard Bank Namibia Limited5th floor, Standard Bank CentreCnr Post Street Mall & Werner List StreetWindhoekNamibia
T MberiruaManaging director
NigeriaStanbic Bank Nigeria LimitedPlot 688 Amodu Tijani StreetVictoria IslandLagosNigeria
MA WeeksManaging director
PeruStandard Bank Plc – representativeofficeEdificio FundaciónOficina 702Av. José Pardo 513Lima 18Peru
L SaenzRepresentative
Russian FederationZAO Standard BankBusiness Centre ‘Mokhovaya’4/7, Vozdvizhenka St., Bldg. 2Moscow 125009Russian Federation
P HurleyChief executive
SingaporeStandard Merchant Bank (Asia)Limited80 Raffles PlaceNo. 55-02 UOB Plaza 1Singapore 048624
JH SawManaging director
The Standard Bank of South AfricaLimited – representative office80 Raffles PlaceNo. 55-02 UOB Plaza 1Singapore 048624
JH SawRepresentative
SwazilandStandard Bank Swaziland LimitedStandard HouseSwazi PlazaMbabaneSwaziland
T MawochaManaging director
TaiwanThe Standard Bank of South AfricaLimited – Taipei branch134th Floor, No 218Section 2Dunhua South RoadTaipei City 106TaiwanThe People’s Republic of China
M SwoGeneral manager
TanzaniaStanbic Bank Tanzania LimitedStanbic CentreCorner Kinondoni and Ali Hassan MwiniyiRoadsDar es SalaamTanzania
B AwaleManaging director
S t a n d a rd Bank Group annual report 2005 P • 2 0 7
STD FIN Sec 2 Proof 10 4/11/06 11:02 AM Page 207

S t a n d a rd Bank Group annual report 2005 P • 2 0 8
I n ternational re p resentation co n t i n u e d
TurkeyStandard Yatirim Menkul KiymetlerA.S.Baltalimani Cad. No:4Ressam Sevket Dag Yalisi34450 RumelihisariSariyerIstanbulTurkey
M Talayhan Director
Standard Bank Plc – representativeofficeBaltalimani Cad. No:4Ressam Sevket Dag Yalisi34450 RumelihisariSariyerIstanbulTurkey
M TalayhanRepresentative
UgandaStanbic Bank Uganda LimitedPlot 17 Hannington RoadKampalaUganda
K MbathiManaging director
United Arab EmiratesStandard Bank Plc – Dubai branchEmirates Towers16th FloorDubaiUnited Arab Emirates
S AustenChief executive
United KingdomStandard Bank Plc5th FloorCannon Bridge House25 Dowgate HillLondonEC4R 2SBEnglandUnited Kingdom
JH MareeChairman
RAG LeithChief executive
The Standard Bank of South AfricaLimited – representative office5th FloorCannon Bridge House25 Dowgate HillLondonEC4R 2SBEnglandUnited Kingdom
K ThompsonRepresentative
United States of AmericaStandard New York, Inc.Standard Americas, Inc.Standard New York Securities, Inc.19th Floor320 Park AvenueNew YorkN.Y. 10022USA
W S DorsonManaging director
Standard New York Securities, Inc.– Miami branchStandard Americas, Inc. – Miamibranch32nd Floor1001 Brickell Bay DriveMiamiFlorida 33131USA
P WallinHead of office
The Standard Bank of South AfricaLimited – representative office19th Floor320 Park AvenueNew YorkN.Y. 10022USA
A StruttRepresentative
ZambiaStanbic Bank Zambia Limited6th FloorWoodgate HouseCairo RoadLusakaZambia
L KalalaManaging director
ZimbabweStanbic Bank Zimbabwe LimitedStanbic Centre59 Samora Machel AvenueHarareZimbabwe
P NyandoroManaging director
Standard Bank OffshoreGroup LimitedIG GibsonChief executive
JerseyStandard Bank Jersey LimitedStandard Bank House47-49 La Motte StreetSt HelierJerseyJE4 8XRChannel Islands
IG GibsonChief executive
Isle of ManStandard Bank Isle of Man LimitedStandard Bank HouseOne Circular RoadDouglasIsle of ManIM1 1SB
K Foden Director
MauritiusStandard Bank Trust Company(Mauritius) LimitedLes Jamalacs BuildingVieux Conseil StreetPort LouisMauritius
R NathooDirector
,v
,v
STD FIN Sec 2 Proof 10 4/11/06 11:02 AM Page 208

Standard Bank Group annual report 2005 P • 209
Shareholders’ information
210 Chairman’s letter to shareholders
211 Notice to members
215 Proxy form
218 Directorate
219 Shareholders’ diary
220 Shareholder analysis
221 Share statistics
222 Instrument codes
223 Credit ratings
ibc Contact details
STD SHAREHOLDERS Proof 9 4/3/06 5:56 PM Page 209
Standard Bank Group annual report 2005 P • 210
Chairman’s letter to shareholders
Dear shareholder
The annual general meeting (AGM) of the Standard Bank Group
Limited will be held in the HP de Villiers Auditorium, Standard
Bank Centre, 6 Simmonds Street, Johannesburg on Wednesday,
24 May 2006 at 09h30. This letter explains the business to be
conducted at the meeting.
The annual report for the year ended 31 December 2005 will also
be available on the website at www.standardbank.co.za.
Explanatory note on resolutions
Resolution 1
Receive and adopt the annual financial statements for the
financial year ended 31 December 2005. This is ordinary business
and there are no special items to bring to the attention of the
shareholders.
Resolution 2
Approve the non-executive directors’ fees for 2006. In
resolutions 2.1 to 2.11, in line with the Code of Corporate
Practices and Conduct (King II), you are asked to approve the fees
for non-executive directors for 2006. The fees are considered by
the remuneration committee to be in line with market trends and
have been approved by the board.
Resolutions 3.1 to 3.6
Elect directors – reappoint those directors who retire by rotation
and those directors who were appointed for the first time during
2006 and offer themselves for re-election. Abridged curriculum
vitae are included in the notice.
Resolution 4.1
Standard Bank Equity Growth Scheme – control of shares. This
resolution provides the directors with the ability to allot and issue
shares for the practical functioning of the Standard Bank Equity
Growth Scheme.
Resolution 4.2
Group Share Incentive Scheme – control of shares. This resolution
provides the directors with the ability to allot and issue shares for
the practical functioning of the Group Share Incentive Scheme.
Resolution 4.3
Control of unissued ordinary shares – this resolution provides the
directors with the ability to allot and issue ordinary shares, other
than those required for the Standard Bank Equity Growth Scheme
and the Group Share Incentive Scheme, during the course of the
year, up to a maximum of 5% of the ordinary shares in issue at
31 December 2005.
Resolution 4.4
Control of unissued preference shares – this resolution provides
the directors with the ability to allot and issue non-redeemable,
non-cumulative, non-participating preference shares.
Resolution 4.5
General authority to make payments to shareholders – this
resolution permits the directors to make payments to
shareholders in terms of the Companies Act and paragraph
5.85(b) of the Listings Requirements of the JSE Limited, subject
to compliance with the Companies Act, the Listings Requirements
of the JSE Limited and provided such payment(s) in any one
financial year do not exceed 10% of the company’s issued share
capital. Any such payments would be made on a pro rata basis to
all shareholders. The articles of association permit such payment.
Special resolution
This is a renewal of the authority given by shareholders at the
previous AGM and will allow the repurchase of the company’s
securities by the company or any subsidiary during the course of
the year provided such purchases in any one financial year do not
exceed 10% of the company’s issued share capital.
Attendance at the annual general meeting
I encourage you to attend and vote your shares at the AGM. If you
hold certificated shares or if you have dematerialised your shares
and have elected “own-name” registration through a CSDP or
broker, and you are not able to attend, I would urge you to
complete the proxy form in accordance with the instructions and
return it to the address indicated.
If you have dematerialised your shares on STRATE, and you have
not elected “own-name” registration, you must submit your
voting instructions to your CSDP or broker. You will need to
contact them regarding their particular cut-off time for votes to
be lodged with us. If you wish to attend the meeting, you will have
to approach your CSDP or broker to provide you with the
necessary authority in terms of the agreement that you have
entered into with them.
I look forward to welcoming you at the AGM.
Derek Cooper
Chairman
8 March 2006
STD SHAREHOLDERS Proof 9 4/3/06 5:56 PM Page 210

Standard Bank Group annual report 2005 P • 211
Notice to members
Notice is hereby given that the 37th annual general meeting of
Standard Bank Group Limited (“Standard Bank Group” or “the
Company”) will be held in the HP de Villiers Auditorium, Standard
Bank Centre, 6 Simmonds Street, Johannesburg on Wednesday,
24 May 2006 at 09h30, for the following business:
Ordinary resolutions
1 To receive and adopt the annual financial statements for the
year ended 31 December 2005, including the reports of the
directors and auditors.
2 To approve the proposed fees payable to the non-executive
directors for 20061:
2.1 Chairman of Standard Bank Group – R2 587 310 per
annum2.
2.2 Director of Standard Bank Group – R105 000 per annum.
2.3 International director of Standard Bank Group –
£25 200 per annum.
2.4 Group credit committee:
Member – R12 000 per meeting.
2.5 Africa credit committee:
Member – R12 000 per meeting.
2.6 Directors’ affairs committee:
Member – R23 100 per annum.
2.7 Group risk management committee:
Chairman – R136 800 per annum;
Member – R68 400 per annum.
2.8 Group remuneration committee:
Chairman – R105 000 per annum;
Member – R52 500 per annum.
2.9 Transformation committee:
Chairman – R90 300 per annum;
Member – R45 150 per annum.
2.10 Group audit committee:
Chairman – R188 100 per annum;
Member – R94 050 per annum.
2.11 Ad hoc meeting attendance3 – R10 500 per meeting.
3 To elect directors in place of those retiring in accordance with
the provisions of the Company’s articles of association.
Messrs DDB Band, DA Hawton and AC Nissen, Sir Paul Judge and
Adv KD Moroka retire by rotation while SE Jonah KBE is required
to retire at the annual general meeting following his
appointment. All being eligible offer themselves for re-election.
Dr CB Strauss retires at the conclusion of this meeting.
All the abovementioned non-executive directors, with the
exception of DDB Band, are independent. Details of these
directors are as follows:
3.1 Doug Band
Age: 61
Appointed: 1997
Educational qualifications: BCom (Wits), CA (SA)
Directorships and memberships: Standard Bank Group,
The Standard Bank of South Africa, Electronic Media
Network (M-Net), Gymnogene Investments, Mobile
Telephone Networks Holdings, MTN Group, MTN
International, Stanlib, The Bidvest Group, Tiger Brands
Committee member: Africa credit, black ownership
initiative, directors’ affairs, group audit, group credit,
group remuneration
3.2 Buddy Hawton
Age: 68
Appointed: 1995
Educational qualifications: FCIS (Natal)
Directorships: Standard Bank Group, The Standard Bank
of South Africa, International Resorts, Liberty Group,
Liberty Holdings, Nampak, Royale Resorts Holdings
(chairman), Royale Holdings (Bermuda), Royale Resorts
International, Stanlib, Sun Hotels, Sun International
(chairman), Woolworths Holdings (chairman)
Committee member: Group remuneration (chairman),
group risk management
3.3 Sam Jonah KBE
Age: 56
Appointed: 2006
Educational qualifications: ACSM, MSc, DIC,
DSc (Exeter)
Directorships: Standard Bank Group, The Standard Bank
of South Africa, AngloGold Ashanti, Anglo Platinum
Corporation, Bayport Holdings, Equator Exploration,
Equinox Minerals, Mittal Steel, MotoGold Mines,
Titanium Resources Group, Transnet, Uramin
11 March 2006 to 28 February 2007.
2Standard Bank Group chairman’s fees include the board, subsidiary board and all committee memberships but do not include fees for Liberty
Holdings Limited, Liberty Group Limited or Standard Bank Plc. A company motor vehicle, against which fringe benefit tax is levied, is made
available for use by the chairman. The chairman is currently the chairman of the black ownership initiative, directors’ affairs and group credit
committees and is a member of the Africa credit, group remuneration, group risk management and group transformation committees.
3Fee per meeting for attendance by non-executive director or person acting in an alternate capacity (not a member of the committee). This
same fee is applicable to all committees where attendance is on an ad hoc or alternate capacity.
STD SHAREHOLDERS Proof 9 4/3/06 5:56 PM Page 211

Standard Bank Group annual report 2005 P • 212
Notice to members continued
3.4 Sir Paul Judge
Age: 56
Appointed: 2003
Educational qualifications: MA (Cambridge), MBA
(Pennsylvania)
Directorships: Standard Bank Group, The Standard Bank
of South Africa, Schroder Income Growth Fund, Tempur-
Pedic International
3.5 Adv Kgomotso Moroka
Age: 51
Appointed: 2003
Educational qualifications: BProc (University of the
North), LLB (Wits)
Directorships: Standard Bank Group, The Standard Bank
of South Africa, Electronic Media Network (M-Net),
Gobodo Forensic & Investigative Accounting (chairman),
New Seasons Investments Holdings, South African
Breweries
3.6 Chris Nissen
Age: 47
Appointed: 2003
Educational qualifications: BA Hons, MA Humanities
(Cape Town), Diploma in Theology
Directorships: Standard Bank Group, The Standard Bank of
South Africa, Boschendal (chairman), Randgold &
Exploration Company, Sea Harvest Corporation (chairman),
Tiger Brands, Umoya Fishing, Woolworths Holdings
Committee member: Group transformation
4 To consider and if deemed fit to pass, with or without
modification, the following resolutions as ordinary resolutions:
4.1 “Resolved that all the ordinary shares required for the
purpose of carrying out the terms of the Standard Bank
Equity Growth Scheme (“the Equity Growth Scheme”),
other than those which have specifically been
appropriated for the Equity Growth Scheme in terms of
ordinary resolutions duly passed at previous annual
general meetings of the Company, be and are hereby
specifically placed under the control of the directors,
who be and are hereby authorised to allot and issue
those shares in terms of the Equity Growth Scheme.”
4.2 “Resolved that all the ordinary shares required for the
purpose of carrying out the terms of the Standard Bank
Group Share Incentive Scheme (“the Scheme”), other
than those which have specifically been appropriated for
the Scheme in terms of ordinary resolutions duly passed
at previous annual general meetings of the Company, be
and are hereby specifically placed under the control of
the directors, who be and are hereby authorised to allot
and issue those shares in terms of the Scheme.”
4.3 “Resolved as an ordinary resolution that the unissued
ordinary shares in the authorised share capital of the
Company (other than those specifically identified in
ordinary resolutions number 4.1 and 4.2), be and are
hereby placed under the control of the directors of the
Company who are authorised to allot and issue the
ordinary shares at their discretion until the next annual
general meeting of the Company, subject to the
provisions of the Companies Act, 61 of 1973, as
amended, the Banks Act, 94 of 1990, as amended and
the Listings Requirements of the JSE Limited and
subject to the aggregate number of ordinary shares able
to be allotted and issued in terms of this resolution
being limited to five percent of the number of ordinary
shares in issue at 31 December 2005.”
4.4 “Resolved as an ordinary resolution that the unissued
non-redeemable, non-cumulative, non-participating
preference shares (“the Preference Shares”) in the
authorised share capital of the Company, be and are
hereby placed under the control of the directors of the
Company who are authorised to allot and issue the
Preference Shares at their discretion until the next
annual general meeting of the Company, subject to the
provisions of the Companies Act, 61 of 1973, as
amended, the Banks Act, 94 of 1990, as amended and
the Listings Requirements of the JSE Limited.”
4.5 “Resolved that the directors of the Company be and are
hereby authorised and given a renewable general
authority to make payments to shareholders in terms of
section 5.85(b) of the Listings Requirements of the JSE
Limited (“the Listings Requirements”), subject to the
provisions of the Companies Act 61 of 1973, as
amended (“the Companies Act”), the Banks Act 94 of
1990, as amended, and the Listings Requirements,
including, amongst others, the following requirements:
(a) payments to shareholders in terms of this resolution
shall be made in terms of section 90 of the Companies
Act and be made pro rata to all shareholders;
(b) in any one financial year, payments to shareholders in
terms of this resolution shall not exceed a maximum
of 10% of the Company’s issued share capital,
including reserves but excluding minority interests,
and revaluations of assets and intangible assets that
are not supported by a valuation by an independent
professional expert acceptable to the JSE Limited
prepared within the last six months, measured as at
the beginning of such financial year; and
(c) this general authority to make payments to
shareholders shall be valid until the next annual
general meeting of the Company or for 15 months
from the date of this resolution, whichever period is
the shorter.”
The directors of the Company are of the opinion that,
taking into consideration the effect of the maximum
payment in terms of this authority:
STD SHAREHOLDERS Proof 9 4/3/06 5:56 PM Page 212
Standard Bank Group annual report 2005 P • 213
– the Company and the group would be in a position
to repay its debts in the ordinary course of business
for a period of 12 months after the date of the
notice of this annual general meeting (“the Next
Year”);
– the assets of the Company and group, fairly valued
in accordance with Generally Accepted Accounting
Practice, would be in excess of the liabilities of the
Company and the group for the Next Year; and
– the share capital and reserves of the Company and
the group for the Next Year will be adequate.
The purpose of this general authority is to authorise the
Company’s directors to return excess cash resources to
shareholders on a pro rata basis.
Special resolution
5 To consider and if deemed fit, to pass, with or without
modification, the following resolution as a special resolution:
The directors of the Company intend, if the circumstances are
appropriate, to implement a repurchase of the Company’s
ordinary shares as permitted in terms of the Companies Act 61
of 1973, as amended (“the Companies Act”) and the Listings
Requirements of the JSE Limited (“the Listings
Requirements”) either by the Company or one of its
subsidiaries.
The reason for and effect of this special resolution is to
generally approve, in terms of section 85(2) of the Companies
Act and, in terms of section 89 of the Companies Act, the
acquisition by the Company and/or a subsidiary of the
Company, of ordinary shares issued by it subject to the Listings
Requirements.
The directors of the Company are of the opinion that, taking
into consideration the maximum number of ordinary shares
that could be repurchased:
– the Company and the group would be in a position to repay
its debts in the ordinary course of business for a period of
12 months after the date of the notice of this annual
general meeting (“the Next Year”);
– the assets of the Company and group, fairly valued in
accordance with Generally Accepted Accounting Practice,
would be in excess of the liabilities of the Company and
the group for the Next Year; and
– the share capital and reserves of the Company and the
group for the Next Year will be adequate.
“Resolved as a special resolution that the Company approves,
with effect from the date of this annual general meeting, as a
general approval in terms of section 85(2) of the Companies
Act 61 of 1973, as amended (“the Companies Act”), the
acquisition by the Company and, in terms of section 89 of the
Companies Act, the acquisition by any subsidiary of the
Company from time to time, of such number of ordinary shares
issued by the Company and at such price and on such other
terms and conditions as the directors may from time to time
determine, subject to the requirements of the Companies Act
and the Listings Requirements of the JSE Limited (“the
Listings Requirements”), which include, amongst others, the
following:
– the authority shall be valid only until the next annual
general meeting of the Company or 15 months from the
date on which this resolution is passed, whichever is the
earlier;
– any such acquisition will be implemented through the
order book operated by the trading system of the JSE
Limited and done without any prior understanding or
arrangement between the Company and the counterparty
(reported trades being prohibited);
– the acquisition must be authorised by the Company’s
articles of association;
– the authority is limited to the purchase of a maximum of
10% of the Company’s issued ordinary share capital in any
one financial year;
– acquisition must not be made at a price more than 10%
above the weighted average of the market value for the
ordinary shares of the Company for the five business days
immediately preceding the date of acquisition;
– at any point in time, the Company may only appoint one
agent to effect any repurchase(s) on the Company’s
behalf;
– the Company may only acquire its ordinary shares if, after
such acquisition, it still complies with the shareholder
spread requirements as set out in the Listings
Requirements;
– the acquisition may not take place during a prohibited
period (as defined in the Listings Requirements);
– in the case of an acquisition by a subsidiary of the
Company, the authority shall be valid only if:
– the subsidiary is authorised by its articles of association;
– the shareholders of the subsidiary have passed a special
resolution authorising the acquisition; and
– the number of shares to be acquired, is not more than
10% in the aggregate of the number of issued shares
of the Company.”
STD SHAREHOLDERS Proof 9 4/3/06 5:56 PM Page 213
Notice to members continued
Notes in regard to other ListingsRequirements applying to ordinary resolutions4.1 to 4.5 and to the special resolution
1 Details of directors
Directors’ details as required by the Listings Requirements of
the JSE Limited (“the Listings Requirements”) are set out on
pages 28 and 29 of the annual report that accompanies this
notice of annual general meeting (“the Annual Report”).
2 Directors’ responsibility statement
The directors, whose names are given on pages 28 and 29 of
the Annual Report, collectively and individually accept full
responsibility for the accuracy of the information given in
these notes 1-7 and certify that to the best of their
knowledge and belief there are no facts that have been
omitted which would make any statement in these notes 1-7
false or misleading, and that all reasonable enquiries to
ascertain such facts have been made and that the notice
contains all information required by law and the Listings
Requirements.
3 Interests of directors
The interest of the directors in the share capital of the
Company are set out on pages 94 and 95 of the Annual
Report.
4 Major shareholders
Details of major shareholders of the Company are set out on
page 220 of the Annual Report.
5 Share capital of the Company
Details of the share capital of the Company are set out on
page 149 of the Annual Report.
6 Material change
There has been no material change in the financial or trading
position of the Company and its subsidiaries since the date of
publication of the Company’s annual results on 9 March 2006.
7 Litigation
The Company and its subsidiaries are not, and have not in the
12 months preceding the date of this notice of annual general
meeting been involved in any legal or arbitration proceedings
which may have or have had a material effect on the financial
position of the Company and its subsidiaries, nor is the
Company aware of any such proceedings that are pending or
threatened.
Standard Bank Group shareholders holding certificated shares and
shareholders of the Company who have dematerialised their
shares and have elected own name registration in the sub-register
maintained by the CSDP, may attend, speak and vote at the
annual general meeting or may appoint one or more proxies (who
need not be shareholders of the Company) to attend, speak and
vote at the annual general meeting on behalf of such shareholder.
A proxy form is attached to this notice of annual general meeting.
Duly completed proxy forms must be returned to the transfer
secretaries of Standard Bank Group or the registered office of the
Company to the addresses set out below, to be received by not
later than 09h30 on Tuesday, 23 May 2006.
Standard Bank Group shareholders who have dematerialised their
shares through a CSDP or broker and who have not elected own
name registration in the sub-register maintained by a CSDP and
who wish to attend the annual general meeting, should instruct
their CSDP or broker to issue them with the necessary authority
to attend, or if they do not wish to attend the annual general
meeting, they may provide their CSDP or broker with their voting
instructions in terms of the custody agreement entered into
between such shareholders and their CSDP or broker.
On behalf of the board
L Wulfsohn
Group secretary
8 March 2006
Registered office
9th floor
Standard Bank Centre
5 Simmonds Street
Johannesburg, 2001
(PO Box 7725, Johannesburg, 2000)
Fax No. +27 11 636 4207
Transfer secretaries in South Africa
Computershare Investor Services 2004 (Proprietary) Limited
Ground Floor
70 Marshall Street
Johannesburg, 2001
(PO Box 61051, Marshalltown, 2107)
Fax No. +27 11 688 5238
Transfer secretaries in Namibia
Transfer Secretaries (Proprietary) Limited
Shop 8, Kaiserkrone Centre
Post Street Mall
Windhoek
(PO Box 2401, Windhoek)
Fax No. +264 61 248 531
Standard Bank Group annual report 2005 P • 214
STD SHAREHOLDERS Proof 9 4/3/06 5:56 PM Page 214

Proxy form
Standard Bank Group Limited
(Registration number 1969/017128/06)
(“the Company”)
JSE share code : SBK
NSX share code : SNB
ISIN : ZAE000057378
To be completed by certificated shareholders and dematerialised shareholders with “own name” registrations only.
A shareholder entitled to attend and vote at the annual general meeting is entitled to appoint one or more proxies to attend, speak and
vote in his/her stead. A proxy need not be a member of the Company.
I/We (Name in block letters)
of (Address in block letters)
being a shareholder(s) and the holder(s) of ordinary shares of 10 cents each and entitled to vote hereby appoint (see note 1)
1 or, failing him/her
2 or, failing him/her
the Chairman of the annual general meeting,
as my/our proxy to vote for me/us and on my/our behalf at the annual general meeting of shareholders to be held at 09h30 on
Wednesday, 24 May 2006, in the HP de Villiers Auditorium, Standard Bank Centre, 6 Simmonds Street, Johannesburg, and at any
adjournment thereof as follows:
Number of votes
For* Against* Abstain*
Ordinary resolution to:
1 Adopt annual financial statements
2 Remuneration:
Approve non-executive directors’ fees (2006):
2.1 Standard Bank Group chairman
2.2 Standard Bank Group director
2.3 Standard Bank Group international director
2.4 Group credit committee
2.5 Africa credit committee
2.6 Directors’ affairs committee
2.7 Group risk management committee
2.8 Group remuneration committee
2.9 Transformation committee
2.10 Group audit committee
2.11 Ad hoc meeting attendance
*Insert a cross or tick or number of votes. If no options are marked, the proxy can vote as he/she deems fit.
Standard Bank Group annual report 2005 P • 215
STD SHAREHOLDERS Proof 9 4/3/06 5:56 PM Page 215

Proxy form continued
Number of votes
For* Against* Abstain*
3 To elect directors:
3.1 Doug Band
3.2 Buddy Hawton
3.3 Sam Jonah KBE
3.4 Sir Paul Judge
3.5 Adv Kgomotso Moroka
3.6 Chris Nissen
4 Ordinary resolution to:
4.1 place shares for the Standard Bank Equity Growth Scheme
under control of directors
4.2 place shares for the Group Share Incentive Scheme
under control of directors
4.3 place unissued ordinary shares under control of directors
subject to the 5% limitation referred to under the
proposed resolution
4.4 place unissued preference shares under control of directors
4.5 give directors general authority to make payments
to shareholders
5 Special resolution to:
give general authority until the next annual general
meeting for the Company or subsidiaries to repurchase
the Company’s shares
*Insert a cross or tick or number of votes. If no options are marked, the proxy can vote as he/she deems fit.
Signed at on 2006
Signature
Assisted by (where applicable) (State capacity and full name)
Please provide contact details: Tel: ( )
Fax: ( )
e-mail:
Please read the notes on the opposite page.
Standard Bank Group annual report 2005 P • 216
STD SHAREHOLDERS Proof 9 4/3/06 5:56 PM Page 216

Notes to the proxy form
Notes
1. A shareholder may insert the name of a proxy or the names of two alternative proxies of his/her choice in the space provided. The
person whose name stands first on the proxy form and who is present at the annual general meeting will be entitled to act as proxy to
the exclusion of those whose names follow.
2. To be effective, completed proxy forms must be lodged by no later than 09h30 on Tuesday, 23 May 2006 with either transfer
secretaries or the registered office.
Transfer secretaries:
South Africa Namibia
Computershare Investor Services 2004 (Pty) Limited Transfer Secretaries (Pty) Limited
Ground Floor, 70 Marshall Street Shop 8, Kaiserkrone Centre
Johannesburg Post Street Mall, Windhoek
PO Box 61051, Marshalltown, 2107 PO Box 2401, Windhoek
Fax number +27 11 688 5238 Fax number +264 61 248 531
Registered office:
9th Floor, Standard Bank Centre
5 Simmonds Street, Johannesburg
PO Box 7725, Johannesburg, 2000
Fax number +27 11 636 4207
3. The completion and lodging of this form of proxy will not prevent the relevant ordinary shareholder from attending the annual general
meeting and speaking and voting in person at the annual general meeting instead of the proxy.
4. The chairman of the annual general meeting may accept or reject any proxy form which is completed and/or received other than in
compliance with these notes.
5. The signatories must initial any alteration to this proxy form, other than the deletion of alternatives.
6. Documentary evidence establishing the authority of a person signing the proxy form in a representative capacity must be attached to
this proxy form unless previously recorded by the Company.
7. Where there are joint holders of ordinary shares:
(a) any one holder may sign the proxy form; and
(b) the vote of the senior ordinary shareholder (for that purpose seniority will be determined by the order in which the names of the
ordinary shareholders who tender a vote (whether in person or by proxy) appear in the Company’s register) will be accepted as to
the exclusion of the vote(s) of the other joint shareholders.
8. All beneficial shareholders of ordinary shares who have dematerialised their shares through a CSDP or broker, other than those
shareholders who have elected to dematerialise their shares in “own-name” registrations, must provide their CSDP or broker with their
voting instructions. Voting instructions must reach the CSDP or broker in sufficient time to allow the CSDP or broker to advise the
Company or its transfer secretaries of this instruction by no later than 09h30 on Tuesday, 23 May 2006. We recommend that you
contact your CSDP or broker to ascertain their deadline for submission.
If you have dematerialised your shares and wish to attend the meeting in person, you may do so by requesting your CSDP or broker to
issue you with a letter of representation in terms of the custody agreement entered into with your CSDP or broker. Letters of
representation must be lodged with the Company’s transfer secretaries or at the registered office of the Company by no later than
09h30 on Tuesday, 23 May 2006. We recommend that you contact your CSDP or broker to ascertain their deadline for submission.
Shareholders who hold certificated shares and shareholders who have dematerialised their shares in “own-name” registrations, must
lodge their completed proxy forms with the Company’s transfer secretaries or at the registered office of the Company by not later than
09h30 on Tuesday, 23 May 2006.
Standard Bank Group annual report 2005 P • 217
STD SHAREHOLDERS Proof 9 4/3/06 5:56 PM Page 217

Directorate
Standard Bank Group The Standard Bank ofLimited South Africa Limited
DE Cooper DE Cooper
Chairman Chairman
JH Maree1 JH Maree1
Chief executive Chief executive
DDB Band DDB Band
E Bradley E Bradley
TS Gcabashe TS Gcabashe
DA Hawton DA Hawton
SE Jonah KBE3 SE Jonah KBE3
Sir Paul Judge2 Sir Paul Judge2
SJ Macozoma SJ Macozoma
RP Menell RP Menell
Adv KD Moroka Adv KD Moroka
AC Nissen AC Nissen
MC Ramaphosa MC Ramaphosa
Dr MA Ramphele Dr MA Ramphele
MJD Ruck1 SP Ridley1
MJ Shaw MJ Shaw
Sir Robert Smith2 Sir Robert Smith2
Dr CB Strauss Dr CB Strauss
1Executive director
2British
3Ghanaian
Standard Bank Group annual report 2005 P • 218
Liberty Group Limited
DE Cooper
Chairman
MJD Ruck1
Chief executive
HI Appelbaum1
AWB Band
DA Hawton
SJ Macozoma
JH Maree
Prof L Patel
A Romanis2
MJ Shaw
Dr SP Sibisi
Liberty HoldingsLimited
DE Cooper
Chairman
DA Hawton
SJ Macozoma
JH Maree
A Romanis2
MJ Shaw
Standard Bank Plc
JH Maree
Chairman
BJ Kruger1
Deputy chairman
RAG Leith1, 2
Chief executive
ME Austen
MJ Botha1, 2
DPH Burgess2
DE Cooper
MJD Ruck
CJ Sheridan2
TR Smeeton2
HE Staunton
BA Ursell2
TG Wheeler1, 2
STD SHAREHOLDERS Proof 9 4/3/06 5:56 PM Page 218

Shareholders’ diary
2005 financial year
Annual general meeting 24 May 2006
2006 financial year
Financial year-end 31 December
Reports
Interim report and declaration of interim dividend August 2006
Summarised annual financial statements and declaration of final dividend March 2007
Publication of annual report April 2007
Dividend payments
Ordinary shares
Interim September 2006
Final April 2007
6,5% first cumulative preference shares
Six months ending 30 June 2006 September 2006
Six months ending 31 December 2006 April 2007
Non�redeemable, non�cumulative, non�participating preference shares
Six months ending 30 June 2006 September 2006
Six months ending 31 December 2006 April 2007
Annual general meeting May 2007
Standard Bank Group annual report 2005 P • 219
STD SHAREHOLDERS Proof 9 4/3/06 5:56 PM Page 219

Shareholder analysis
Standard Bank Group annual report 2005 P • 220
Ten major shareholders1
2005 2004
Number Number
of shares % of shares %
(million) holding (million) holding
Public Investment Corporation 175,2 13,0 156,7 11,6
Old Mutual Group 150,8 11,1 165,6 12,2
Tutuwa participants 102,3 7,6 102,3 7,6
Staff 42,0 3,1 42,0 3,1
Strategic partners 40,2 3,0 40,2 3,0
Communities and regional businesses 20,1 1,5 20,1 1,5
Liberty Group2 46,5 3,4 49,3 3,7
Investment Solutions 41,3 3,1 38,9 2,9
Sanlam Group 37,7 2,8 48,0 3,5
Metlife 14,4 1,1 14,8 1,1
Transnet Pension Fund 13,1 1,0 15,3 1,1
581,3 43,1 590,9 43,7
Spread of ordinary shareholders
Public3 913,1 67,5 915,5 67,7
Non-public 439,3 32,5 436,6 32,3
Directors of Standard Bank Group, its subsidiaries,
and embargoed employees4 2,1 0,2 1,9 0,1
Old Mutual Group 150,8 11,1 165,6 12,2
Public Investment Corporation 175,2 13,0 156,7 11,6
Standard Bank Group and Liberty Group retirement funds 8,5 0,6 9,5 0,7
Tutuwa participants5 102,3 7,6 102,3 7,6
Associates of directors 0,4 0,0 0,6 0,1
1 352,4 100,0 1 352,1 100,0
Spread of 6,5% first preference shareholders
Public3 7 953 000 99,4 7 953 000 99,4
Non-public 47 000 0,6 47 000 0,6
Directors of Standard Bank, its subsidiaries,
and embargoed employees 47 000 0,6 47 000 0,6
8 000 000 100,0 8 000 000 100,0
Spread of non�redeemable, non�cumulative, non�participating preference shareholders
Public3 29 890 952 99,6 29 904 842 99,7
Non-public 109 048 0,4 95 158 0,3
Directors of Standard Bank, its subsidiaries,
and embargoed employees 71 371 0,3 58 481 0,2
Associates of directors 37 677 0,1 36 677 0,1
30 000 000 100,0 30 000 000 100,0
International shareholders held 21,8% (2004: 20,9%) of the SBG shares.
1Beneficial holdings determined from the share register and investigations conducted on our behalf in terms of S140A of the Companies Act.2Policyholders’ funds.3As per S4.25 of the JSE Listings Requirements.4Excludes indirect holdings of strategic partners which are included in the Tutuwa participants.5Includes Tutuwa Strategic Holdings 1 and 2, Tutuwa Staff Holdings 1, 2 and 3, Tutuwa Community and General Staff Share Trust.
STD SHAREHOLDERS Proof 9 4/3/06 5:56 PM Page 220

Standard Bank Group annual report 2005 P • 221
Share statistics
JSE Limited – ordinary share statistics
2005 2004
Share prices (cents)
– High for the year 7 875 6 750
– Low for the year 5 750 3 686
– 31 December 7 581 6 580
Shares traded
– Number of shares (000) 841 835 892 633
– Value of shares (Rm) 56 387 40 688
– Turnover in shares traded (%) 62,2 66,0
Number of shares in issue (million)
– End of period 1 352 1 352
– Weighted average 1 353 1 346
STD SHAREHOLDERS Proof 9 4/3/06 5:56 PM Page 221

Instrument codes
Standard Bank Group annual report 2005 P • 222
JSE Limited Namibian Stock Exchange (NSX) Bond Exchange of South Africa
Ordinary shares Ordinary shares Subordinated debt
Share code: SBK Share code: SNB SBK 3: ZAG000018086
ISIN code: ZAE000057378 ISIN code: ZAE000057378 SBK 5: ZAG000023078
6,5% first cumulative preference shares SBK 6: ZAG000024043
Share code: SBKP SBK 7: ZAG000024894
ISIN code: ZAE000038881 Senior bonds
Non�redeemable, non�cumulative SBS1: ZAG000023235preference shares
SBS2: ZAG000024522
Share code: SBPP
ISIN code: ZAE000056339
Deposit notes
Share code: SBR001
ISIN code: ZAE000077780
STD SHAREHOLDERS Proof 9 4/3/06 5:56 PM Page 222

Credit ratings
Standard Bank Group annual report 2005 P • 223
The latest credit ratings for entities within the Standard Bank Group are detailed below:
Short�term Long�term Outlook
The Standard Bank of South Africa Limited (SBSA)
Fitch Ratings (August 2005)
Foreign currency F2 BBB+ Stable
Local currency A- Positive
National F1+(zaf) AA+(zaf) Stable
Standard & Poor’s (November 2005) public information rating
Local currency BBBpi
Moody’s Investors Services (January 2005) public information rating
Bank deposit rating P-2 Baa1 Stable
Standard International Holdings Limited
Fitch Ratings (August 2005)
Foreign currency F2 BBB+ Stable
Moody’s Investors Services (July 2005)
Issuer rating Baa2 Stable
Standard Bank Plc
Fitch Ratings (August 2005)
Foreign currency F2 BBB+ Stable
Moody’s Investors Services (July 2005)
Issuer rating P-2 Baa1 Stable
Liberty Life
Fitch Ratings (July 2005)
National AA-(zaf) Stable
RSA Sovereign ratings: Foreign currency
Fitch Ratings BBB+
Standard & Poor’s BBB+
Moody’s Investors Services Baa1
RSA Sovereign ratings: Local currency
Fitch Ratings A-
Standard & Poor’s A+
Moody’s Investors Services A2
STD SHAREHOLDERS Proof 9 4/3/06 5:56 PM Page 223

Notes
Standard Bank Group annual report 2005 P • 224
STD SHAREHOLDERS Proof 9 4/3/06 5:56 PM Page 224

Standard Bank Group annual report 2005
Contact details
Chief financial officer
Simon RidleyTel: +27 11 636 3756e-mail: [email protected]
Registered address
9th FloorStandard Bank Centre5 Simmonds StreetJohannesburg 2001
PO Box 7725Johannesburg 2000
Group secretary
Loren WulfsohnTel: +27 11 636 5119e-mail: [email protected]
Contact details
Tel: +27 11 636 9111
Fax: +27 11 636 4207
e-mail: shareholder queries:[email protected]
e-mail: customer queries: [email protected]
Director, investor relations
Kim HowardTel: +27 11 636 7811e-mail: [email protected]
Printed by Ince (Pty) Ltd
Standard Bank Group annual report 2005
Contents
01 Financial highlights
02 Chairman and chief executive’s review
06 Economic review
08 Group at a glance
10 Financial objectives
12 Our vision and values
14 Executive management
16 Sustainability reporting – highlights
18 Operational reviews
18 Personal & Business Banking
22 Corporate & Investment Banking
26 Investment Management & Life Insurance
28 Board of directors
30 Corporate governance
45 Risk management and control
67 Financial review
84 Seven-year review
90 Financial definitions
91 Annual financial statements
92 Report of the independent auditors
93 Directors’ responsibility for financial reporting
93 Group secretary’s certification
94 Directors’ report
100 Balance sheet
101 Income statement
102 Statement of changes in shareholders’ funds
104 Cash flow statement
105 Accounting policies
124 Notes to the annual financial statements
178 Standard Bank Group Limited – company annual financial
statements
182 Annexure A – implementation of IFRS
193 Annexure B – currency balance sheet
194 Annexure C – subsidiaries
198 Annexure D – associates and joint ventures
200 Annexure E – equity-linked transactions
203 Additional information
203 Abridged financial statements of principal banking
subsidiary
204 Standard Bank operations average balance sheet
206 International representation
209 Shareholders’ information
210 Chairman’s letter to shareholders
211 Notice to members
215 Proxy form
218 Directorate
219 Shareholders’ diary
220 Shareholder analysis
221 Share statistics
222 Instrument codes
223 Credit ratings
ibc Contact details
Our stakeholders are our business.
STD bank cover 15mm 4/3/06 5:49 PM Page 2

Annual report 2005
Stand
ard B
ank G
roup
ann
ual rep
ort 20
05
www.standardbank.co.za
STD bank cover 15mm 4/3/06 5:47 PM Page 1