standard 6-2 the student will demonstrate through...
TRANSCRIPT
Numbers and Operations Sixth grade
1
Standard 6-2 The student will demonstrate through mathematical processes an understanding of the concepts of whole-number percentages, integers, and ratio and rate; the addition and subtraction of fractions; accurate, efficient, and generalizable methods of multiplying and dividing fractions and decimals; and the use of exponential notation to represent whole numbers.
Indicator 6-2.1
Understand whole-number percentages through 100.
Continuum of Knowledge:
The sixth grade is the first time students are introduced to the concept of percents.
In sixth grade, students understand whole number percentages through 100(6-2.1).
In seventh grade, students understand fractional percentages and percentages greater than one hundred (7-2.1).
Taxonomy Level
Cognitive Dimension: Understand Knowledge Dimension: Conceptual
Key Concepts
• Denominator
Vocabulary
• Percent (per hundred) • Fraction • decimal
Instructional Guidelines
For this indicator, it is essential
• Understand that percentage mean out of 100 or part of a whole divided into 100 parts
for students to:
• Connect the concept of percentages to fractions and decimals • Connect percentages with familiar fractional equivalents • Convert between fractions/decimals/percents

Numbers and Operations Sixth grade
2
For this indicator, it is not essential
• Work with percentages with decimals for example 33.3 %
for students to:
Student Misconceptions/Errors
• When there is only one number behind the decimal, students commonly forget that the tenths place is also referred to 10-hundredths. Thus, you may see them represent .5 as 5% instead of 50%.
• Also, many times they leave the decimal when writing the percent. Ex: .45
may be written as .45%
Instructional Resources and Strategies
• Decimal squares may be used to help build understand of percentages. Students are connecting the graphical representation of percentages to the symbolic (number only) form
• Starting with a review benchmark fractions will give students a review of fractions and decimals in a familiar setting. This will help them as them as they transfer their understanding to other less familiar percents, decimals and fractions.
Websites
Assessment Guidelines
The objective of this indicator is to understand which is in the “understand conceptual” knowledge cell of the Revised Bloom’s Taxonomy. To understand is to construct meaning. Conceptual knowledge is not bound by specific examples; therefore, the student’s conceptual knowledge should include a variety of examples. The learning progression to understand requires students to recall the meaning of fractions and decimals. Students use the definition of percent to generate examples of percentages by generalizing connections (6-1.7) to real world situations where percentages are needed. They analyze these situations and explore how the percentages can be represented as fraction and decimals. As students analyze these situations, they use inductive and/or deductive reasoning to formulate mathematical arguments (6-1.3) about the relationship between fractions, decimals and percents. Students understand equivalent symbolic expressions as distinct symbolic forms (percent, fraction, decimal) that represent the same relationship (6-1.4).

Numbers and Operations Sixth grade
3
Standard 6-2 The student will demonstrate through mathematical processes an understanding of the concepts of whole-number percentages, integers, and ratio and rate; the addition and subtraction of fractions; accurate, efficient, and generalizable methods of multiplying and dividing fractions and decimals; and the use of exponential notation to represent whole numbers.
Indicator 6-2.2
Understand integers
Continuum of Knowledge:
The sixth grade is the first time students are introduced to the concept of integers.
In the sixth grade, students understand integers (6-2.2).
In the seventh grade, students will generate strategies to add, subtract, multiply, and divide integers (7-2.8).
Taxonomy Level
Cognitive Dimension: Understand Knowledge Dimension: Conceptual
Key Concepts
• Integer
Vocabulary
• Whole number • Positive • negative
Instructional Guidelines
For this indicator, it is essential
• Have a strong number sense with respect to whole numbers, fractions, and decimals.
for students to:
• Recall the definition of integer • Understand the relationship between integers and other types of numbers • Identify real world situations that involve integers

Numbers and Operations Sixth grade
4
For this indicator, it is not essential
• Perform operations of integers
for students to:
Student Misconceptions/Errors
None noted
Instructional Resources and Strategies
• The focus of the indicator goes beyond students reciting that integers are positive number, negative numbers and zero. Students build conceptual understanding of integers in order to apply that understanding to topic in later grades such as solving equations, graphing linear functions, operations with integers, etc…
• Have students do a number sort by giving them different types of numbers and letting them sort them into categories based on characteristic they observed.
• Representing integers on a number line including rational numbers(fractions and decimals) helps student gain a understanding of how integers relate to other numbers.
• Use two color counters to represent integers • Realistic percent problems are the best way to assess a student’s
understanding of percent. You might take a realistic percent problem and substitute fractions for percents or decimals.
• Use real world examples such as temperature(reading a thermometer), checkbook(deposits/withdrawals), distance, altitude(above/below sea level), and sports events(football-gains and loss of yards)
Assessment Guidelines
The objective of this indicator is to understand, which is in the “conceptual knowledge” of the Revised Taxonomy. Conceptual knowledge is not bound by specific examples and shows the interrelationship of among integers, whole numbers, fractions and decimals (rational numbers). The learning progression to understand requires students to recall the characteristics of whole numbers, fractions, and decimals. Students generate examples by generalizing connections (6-1.7) of real world situations where positive and negative numbers are needed. Then students should use correct and clearly written or spoken words (6-1.6) to create a definition of integers. In order to understand integers, students also examine non-examples of integers. They generalize connections (6-1.7) by representing integers (whole numbers), fractions, and decimals on the number line.

Numbers and Operations Sixth grade
5
Using this understanding, students evaluate
their definition of integers by posing questions to prove or disprove their conjecture (6-1.2).

Numbers and Operations Sixth grade
6
Standard 6-2 The student will demonstrate through mathematical processes an understanding of the concepts of whole-number percentages, integers, and ratio and rate; the addition and subtraction of fractions; accurate, efficient, and generalizable methods of multiplying and dividing fractions and decimals; and the use of exponential notation to represent whole numbers.
Indicator 6-2.3
Compare rational numbers and whole number percentages through 100 by using the symbols <, >, <, >, and =.
Continuum of Knowledge:
In the fourth grade, students compare decimals through hundredths by using the terms is less than, is greater than, and is equal to and the symbols <, >, and =(4-2.7). In the fifth grade, students compare whole numbers, decimals, and fractions by using <, >, and = (5-2.4).
In the sixth grade, students will compare rational numbers and whole number percentages through 100 by using the symbols <, >, <, >, and = (6-2.3). This is the first time students compare rational numbers and percentages.
In the seventh grade, students will compare rational numbers, percentages, and square roots of perfect squares by using the symbols <, >, <, >, and = (7-2.3).
Taxonomy Level
Cognitive Dimension: Understand Knowledge Dimension: Conceptual
Key Concepts
• Rational numbers
Vocabulary:
• Percent • ratio
<, >, <, >, =, and %
Symbols:
Instructional Guidelines
For this indicator, it is essential
• Understand the meaning of rational numbers
for students to:
• Understand the difference between ≤ and ≥

Numbers and Operations Sixth grade
7
• Translate numbers to same form before comparing numbers, where appropriate
• Translate between the fraction and percents
For this indicator, it is not essential
• Work with repeating decimals; use numbers with terminating decimals
for students to:
Student Misconceptions/Errors
Students may still perceive the equals sign as meaning doing something. Although this concept has been addressed in prior grades, students may still struggle with the concept of equivalency.
Instructional Resources and Strategies
• Have the students make a human number line. Call out inequalities and have the students step forward if it applies to their number. For instance: P is a number that is greater than 4, or D is a number that is less than or equal to 0. Show the students how to represent the inequalities that you are calling out. For instance, P>4 and D≤ 0.
• This is the first time, students using < and >.
Assessment Guidelines
Having students explore real world situation that model these concepts may help to solidify their understanding.
The objective of this indicator is to compare which is in the “understand conceptual” knowledge cell of the Revised Taxonomy. To understand is to construct meaning therefore, students should not just learn procedural strategies for comparing but they should build number sense around these types of numbers. The learning progression to compare requires students to recognize and understand rational numbers and whole number percentages through 100. Students understand the magnitude of rational number and whole numbers. Students use their conceptual understanding to compare without dependent on a traditional algorithm and use concrete models to support understanding where appropriate. Students recognize mathematical symbols <, >, >, < and = and their meanings. As students analyze (5-1.1) the relationships to compare percentages and rational numbers, they construct arguments and explain and justify their answer to classmates and their teacher (5-1.3). Students should use
correct, complete and clearly written and oral mathematical language to communicate their reasoning (5-1.5).

Numbers and Operations Sixth grade
8
Standard 6-2 The student will demonstrate through mathematical processes an understanding of the concepts of whole-number percentages, integers, and ratio and rate; the addition and subtraction of fractions; accurate, efficient, and generalizable methods of multiplying and dividing fractions and decimals; and the use of exponential notation to represent whole numbers.
Indicator 6-2.4
Apply an algorithm to add and subtract fractions.
Continuum of Knowledge:
In the fourth grade, students apply strategies and procedures to find equivalent forms of fractions (4-2.8) and represent improper fractions, mixed numbers, and decimals (4-2.11). In the fifth grade, students generated strategies to add and subtract fractions with like and unlike denominators (5-2.8)
In the sixth grade, this is the first time students are required to perform addition and subtraction of fractions symbolically (6-2.4). Students also generate strategies to multiply and divide fractions and decimals (6-2.5).
In the seventh grade, students will apply an algorithm to multiply and divide fractions and decimals (7-2.9).
Taxonomy Level
Cognitive Dimension: Apply Knowledge Dimension: Procedural
Key Concepts
• Equivalent fraction
Vocabulary:
• Algorithm • Least common denominator • Numerator • Denominator • Least common denominator
Instructional Guidelines
For this indicator, it is essential for students to:

Numbers and Operations Sixth grade
9
• Work with fractions in all forms including mixed numbers, proper and improper fractions.
• Subtracting with regrouping • Add and subtract fractions in word problems • Use estimation strategies to determine the reasonableness of their answers.
For this indicator, it is not essential
• Perform operations involving more than four fractions with compatible denominators.
for students to:
• Perform operations involving more than three fractions with non-compatible denominators.
Student Misconceptions/Errors
• For students, a common error is adding both numerators and denominators. Use models to show ½ + 1/3 ≠ 2/5. Ask students what is wrong and allow them to find the error.
• Students may struggle with finding a least common denominator. The last time students encountered this concept was in fifth grade (5-2.7).
Instructional Resources and Strategies
• The parameters in the non-essentials keep the task from becoming tedious and unmanageable for students.
• Teachers commonly tell students that in order to add or subtract fractions, you must first get a common denominator. While this is true for the traditional algorithm, it may not be true for other strategies. Therefore, a correct statement may be, “In order to use the standard algorithm for adding and subtracting fractions, you must first find a common denominator” because the algorithm is designed to only work with common denominators.
• Students need experiences that will enable them to make the link between concrete and pictorial models used in the fifth grade and the new symbolic operations. Students can work in pairs to examine how the model and algorithm are related. One student creates the models, the other student applies the algorithm then they discuss how the processes are similar. Having student create pictorial models is an essential step. Since student will not have access to concrete models on state assessment, it is beneficial for students to be able to draw representations of problem in order to access their understanding of the procedure.

Numbers and Operations Sixth grade
10
• In sixth grade the emphasis is on applying an algorithm. As a result, by the end of sixth grade students should exhibit fluency when solving a wide range of addition and subtraction problems involving fractions.
• Encourage students to use estimation strategies and the benchmark fractions(0, ½, and 1) to determine the reasonableness of their answers. For example, given 3/5 + 1/3, the student’s conceptual understanding of the relationship between these fractions and the benchmark fractions would lead them to conclude that 3/5 is more than ½ because the numerator is greater than 2.5 and 1/3 is less than ½ because the numerator is less than 1.5; therefore, their sum must be less than one.
Assessment Guidelines
The objective of this indicator is apply, which is in the “apply procedural” of the Revised Taxonomy. Procedural knowledge is knowledge of specific steps or strategies that can be used to solve a problem or problem situation. Although the focus is to gain computational fluency with addition and subtraction of fractions, the learning progression should integrate strategies to enhance both conceptual and procedural knowledge. The learning progression to apply requires students to understand fractional forms such as mixed numbers, proper fractions, and improper fractions. Students should apply their conceptual knowledge of fractions to transfer their understanding of concrete and/or pictorial representations to symbolic representations (numbers only) by generalizing connections among a variety of representational forms and real world situations (6-1.7). Students use these procedures in context as opposed to only rote computational exercises and use correct and clearly written or spoken words to communicate about these significant mathematical tasks (6-1.6). Students engage in repeated practice using pictorial models, if needed, to support learning. Lastly, students should evaluate
the reasonableness of their answers using appropriate estimation strategies.

Numbers and Operations Sixth grade
11
Standard 6-2 The student will demonstrate through mathematical processes an understanding of the concepts of whole-number percentages, integers, and ratio and rate; the addition and subtraction of fractions; accurate, efficient, and generalizable methods of multiplying and dividing fractions and decimals; and the use of exponential notation to represent whole numbers.
Indicator 6-2.5
Generate strategies to multiply and divide fractions and decimals.
Continuum of Knowledge:
The sixth grade is the first time students are introduced to the concept of multiplying and dividing fractions and decimals with the emphasis on generating strategies (6-2.5).
In seventh grade, students will apply an algorithm to multiply and divide fractions and decimals (7-2.9).
Taxonomy Level
Cognitive Dimension: Create Knowledge Dimension: Conceptual
Key Concepts
• Denominator
Vocabulary
• numerator • Quotient • Product
Instructional Guidelines
For this indicator, it is essential
• Understand the meaning and concept of fractions and decimals
for students to:
• Explore and discover various methods • Develop an understanding of the concepts of multiplication and division of
fractions and decimals by sharing their generated strategies. • Understand that multiplication does not always result in a larger answer and
division does not result in a smaller answer

Numbers and Operations Sixth grade
12
For this indicator, it is not essential
• Multiply or divide fractions and decimals symbolically.
for students to:
Student Misconceptions/Errors
Multiplication does not always result in a larger product and division does not always result in a smaller quotient. Multiplication and division of fractions may result in a smaller number.
Instructional Resources and Strategies
Students need opportunities to investigate contextual problems without first being shown an algorithm. That means a problem situation should be introduced and students should explore possible solution strategies. Students should then share their strategies with the whole class as the teacher facilitates. The students’ understanding of computation increases when they develop their own methods and discuss those methods with others.
Estimation should play a significant role in developing an algorithm for multiplication. The best way to estimate a division problem comes from thinking about multiplication rather than division.
Assessment Guidelines
The objective of this indicator is to generate which is in the “conceptual knowledge” of the Revised Taxonomy. To create is to put together elements to form a new, coherent whole or to make an original product. Conceptual knowledge is not bound by specific examples. The learning progression to generate requires students to recall concepts of multiplying, dividing, and relate parts to a whole. Students explore problem situations (story problems) and explore various strategies to solve those problems by applying their conceptual knowledge of fractions. Students translate their understanding of concrete and/or pictorial representations by generalizing connections between their models and real world situations (6-1.7). Students should use these procedures in context as opposed to

Numbers and Operations Sixth grade
13
only rote computational exercises and use correct and clearly written or spoken words to communicate about these significant mathematical tasks (6-1.6). Students formulate questions to prove or disprove their methods (6-1.2) and generate mathematical statement (6-1.6) about these operations. They should evaluate
the reasonableness of their answers using appropriate estimation strategies.

Numbers and Operations Sixth grade
14
Standard 6-2 The student will demonstrate through mathematical processes and understanding of the concepts of whole-number percentages, integers, and ratio and rate; the addition and subtraction of fractions; accurate, efficient, and generalizable methods of multiplying and dividing fractions and decimals; and the use of exponential notation to represent whole numbers.
Indicator 6-2.6
Understand the relationship between ratio/rate and multiplication /division.
Continuum of Knowledge:
The sixth grade is the first time students are introduced to the concept of ratio and rate (6-2.6).
In seventh grade, students will apply ratios, rates, and proportions to discounts, taxes, tips, interest, unit costs, and similar shapes (7-2.5)
Taxonomy Level
Cognitive Dimension: Understand Knowledge Dimension: Conceptual
Key Concepts
• ratio
Vocabulary
• rate • multiplication • division
Instructional Guidelines
For this indicator, it is essential
• Understand that a ratio is a comparison of two quantities by division
for students to:
• Understand that a rate is a ratio comparing two quantities with different kinds of unit.
• Write rates and ratios • Connect ratio and rate to multiplication and division • Develop proportional reasoning using this relationship. For example,
Students use simple reasoning about multiplication and division to solve ratio and rate problems such as “If 5 items cost $3.75 and all items are the same price, then I can find the cost of 12 items by first dividing $3.75 by 5 to find out how much one item costs and then multiplying the cost of a single item

Numbers and Operations Sixth grade
15
by 12” (NCTM Focal Points 6th
grade)
For this indicator, it is not essential
• Gain fluency in solving problems involving using ratios and rate. These problems are being used to help student build a conceptual understanding of the relationship between rate/ratio and multiplication/division
for students to:
Student Misconceptions/Errors Students may believe that all ratios are fractions. This is not true because the difference is that fractions always represent part-to-whole relationships. On the other hand, ratios can represent part-to-whole OR part-to-part relationships. For example, if there are 20 students in the class and 14 are males, the ratio of males to the class is 14/20 (relationship of part to whole, thus a fraction or a ratio). The ratio of males to females is 14/6 (relationship of part to part and thus not a fraction). In the cases just cited, the ratio compared two measures of the same type of thing. However, a ratio can also be a rate (as in a unit rate) or a comparison of the measures of two different things or quantities – the measuring unit is different for each value (miles per gallon, for example). Instructional Resources and Strategies
• The focus of the indicator is on proportional reasoning. See NCTM Focal Points 6th
• It is important to relate ratios to equivalent fractions. grade.
• Students take turns selecting a card and finding another card on which the ratio of the two types of objects is the same. The students then determine a method to record the ratio depicted by the cards and share their reasoning with the class. Students can tape their pairs of cards to the chart paper and write an explanation of why they think the pair belongs together. This task moves students to a numeric approach rather than a visual one and introduces the notion of ratios as rates. This activity also introduces the concept of unit rate.
Assessment Guidelines
The objective of this indicator is to understand, which is in the “understand conceptual” of the Revised Taxonomy. To understand is to construct meaning about the interrelationship among multiplication/division and ratio/rate. The learning progression to understand requires students to understand and represent ratio and rate using appropriate forms. Students generalize connection among rate and ratio and real world problems. As students analyze these problems, their use inductive and deductive reasoning to generalize mathematical statements (6-1.5)

Numbers and Operations Sixth grade
16
summarizing how multiplication and division are used to solve problems involving ratios and rates.

Numbers and Operations Sixth grade
17
Standard 6-2 The student will demonstrate through mathematical processes and understanding of the concepts of whole-number percentages, integers, and ratio and rate; the addition and subtraction of fractions; accurate, efficient, and generalizable methods of multiplying and dividing fractions and decimals; and the use of exponential notation to represent whole numbers.
Indicator 6-2.7
Apply strategies and procedures to determine values of powers of 10, up to 106
Continuum of Knowledge:
.
In third grade, students use basic number combinations to compute related multiplication problems that involve multiples of 10(3-2.10).
Sixth grade is the first time students will be introduced to the concept of applying strategies and procedures to determine values of powers of 10, up to 106
In seventh grade, students will translate between standard form and exponential form (7-2.6) and translate between standard form and scientific notation (7-2.7).
(6-2.7).
Taxonomy Level
Cognitive Dimension: Apply Knowledge Dimension: Procedure
Key Concepts
• Base • Exponent • Powers • Squared • Cubed • Factor • Multiples • Product
Instructional Guidelines
For this indicator, it is essential
• The number of zeroes in each set of factors is equal to the number of zeroes in the product
for students to:
• Understand factors and multiples • Understand the meaning of base and exponent • Represent multiples of ten in exponential form

Numbers and Operations Sixth grade
18
For this indicator, it is not essential
• Use negative exponents
for students to:
Student Misconceptions/Errors
• Students need to understand that a power of 10 is a movement of a decimal not just a certain number of zeroes.
• The most common error students make when solving for exponents is multiplying the exponent by the base number or even attempting to add the two numbers.
• Another common error to watch for would be students who write the exponent the same size and position as the base number.
Instructional Resources and Strategies
• Students discovery the rules for powers of 10 through inquiry. Students create a table with columns labeled exponent form, expanded form and numerical value. Students use a calculator to compute the exponent form and expanded form. They should recognize that the values are the same. Prompt students to think about how they could find the answer by skipping the expanded column and without the use of a calculator.
• Have students complete a chart with the powers of 10. Have them discover the answers.
Assessment Guidelines
The objective of this indicator is apply, which is in the “apply procedural” of the Revised Taxonomy. Procedural knowledge is knowledge of specific steps or strategies that can be used to solve a problem or problem situation. Although the focus is to gain computational fluency in computing powers of 10, the learning
Numbers and Operations Sixth grade
19
progression should integrate strategies to enhance both conceptual and procedural knowledge. The learning progression to apply requires students to understand the structure of exponent form (base and exponent). Students explore powers of 10 by analyze the relationship between the exponent form, expanded form and numerical value. Students generalize mathematical statements (6-1.5) about these relationship based on inductive and deductive reasoning (6-1.3). They understand that each is an equivalent symbolic expression that conveys the same meaning but in different forms. Students then develop
strategies that can be used to compute powers of 10 fluently.

Numbers and Operations Sixth grade
20
Standard 6-2 The student will demonstrate through mathematical processes and understanding of the concepts of whole-number percentages, integers, and ratio and rate; the addition and subtraction of fractions; accurate, efficient, and generalizable methods of multiplying and dividing fractions and decimals; and the use of exponential notation to represent whole numbers.
Indicator 6-2.8
Represent the prime factorization of numbers by using exponents. Continuum of Knowledge:
In fifth grade, students classified numbers as prime, composite, or neither (5-2.6) and generated strategies to find the greatest common factor and the least common multiple of two whole numbers (5-2.7).
In the sixth grade, represent the prime factorization of numbers by using exponents
Taxonomy Level
Cognitive Dimension: Understand Knowledge Dimension: Procedural
Key Concepts
• Prime
Vocabulary
• Composite • Prime factorization
Instructional Guidelines
For this indicator, it is essential
• Write a composite number as the product of prime numbers
for students to:
• Write repeated factors using exponents • Given the prime factorization of a number, students should be able to tell
what the composite number • Explore prime factorization in the context of problem situations
For this indicator, it is not essential
• Find the prime factorization of negative numbers
for students to:

Numbers and Operations Sixth grade
21
Student Misconceptions/Errors
Students may think that factors need to be multiplied and not added together to get the answer.
Instructional Resources and Strategies
• Review the concept of prime and composite. Make sure students know the difference between the two.
• Give the students different numbers. Have them make factor trees. They need to circle all the prime numbers. Show them how to write all the factors using exponents.
Assessment Guidelines
The objective of this indicator is represent which is in the “understand procedural” knowledge of the Revised Taxonomy. To understand a procedural implies not only knowing the steps of the procedural but also understanding the purpose and value of using it. The learning progression to represent requires students to recall the concept of prime and composite numbers by making connections to prior knowledge. Students explore problems situation where using the process of prime factorization is using. They analyze these situations and use inductive reasoning (6-1.3) to generalize a mathematical statement (6-1.5) about prime factorization. Students understand that the prime factorization is an equivalent symbolic expression that represents the same the number but in a different form (6-1.4). Students then rehearse strategies to find the prime factorization of a number and explain and justify
their answers to their classmates and teacher.

Numbers and Operations Sixth grade
22
Standard 6-2 The student will demonstrate through mathematical processes and understanding of the concepts of whole-number percentages, integers, and ratio and rate; the addition and subtraction of fractions; accurate, efficient, and generalizable methods of multiplying and dividing fractions and decimals; and the use of exponential notation to represent whole numbers.
Indicator 6-2.9
Represent whole numbers in exponential form
Continuum of Knowledge:
In fifth grade, students classified numbers as prime, composite, or neither (5-2.6) and generated strategies to find the greatest common factor and the least common multiple of two whole numbers (5-2.7).
In the sixth grade, represent the prime factorization of numbers by using exponents
Taxonomy Level
Cognitive Dimension: Understand Knowledge Dimension: Procedural
Key Concepts
• Exponential form
Vocabulary
• Base • Exponent
Instructional Guidelines
For this indicator, it is essential
• Understand exponential form
for students to:
• Translate from whole number to exponential form • Translate from exponential form to whole number
For this indicator, it is not essential
None noted
for students to:

Numbers and Operations Sixth grade
23
Student Misconceptions/Errors
Students may mistakenly multiply the base time the exponent.
Students may believe that there is only one exponential form for every number. Explore numbers like 64 that have multiple exponential forms such as 26, 43, and 82
Instructional Resources and Strategies
.
None noted
Assessment Guidelines
The objective of this indicator is represent which is in the “understand procedural” knowledge of the Revised Taxonomy. To understand a procedural implies not only knowing the steps of the procedural but also understanding the purpose and value of using it. The learning progression to represent requires students to recall the structure of exponential form. Students explore a variety of problems. They analyze these situations and use inductive reasoning (6-1.3) to generalize a mathematical statements (6-1.5) about the relationship between exponential and whole number form. Students understand that the exponential form is an equivalent symbolic expression that represents the same the number but in a different form (6-1.4). Students engage in meaningful practice to support retention.

Algebra Sixth Grade
1
Standard: 6-3 The student will demonstrate through the mathematical processes an understanding of writing, interpreting, and using mathematical expressions, equations, and inequalities. Indicator 6-3.1 Analyze numeric and algebraic patterns and pattern relationships Continuum of Knowledge: The study of patterns is extensive throughout elementary school. Students begin the process of transitioning from the concrete to the abstract and symbolic in the 5th
grade, and learn to represent patterns in words, symbols, and algebraic expressions/equations for the first time (5-3.2).
In 6th
grade, students analyze numeric and algebraic patterns and pattern relationships (6-3.1) and represent algebraic relationships with variables in expressions, simple equations, and simple inequalities (6-3.3).
This will lay the foundation for the study of slope in the 7th
grade (7-3.2).
Taxonomy Level Cognitive Dimension: Analyze Knowledge Dimension: Conceptual Key Concepts
• Expressions • Equations • Inequalities • Function • Rule • Patterns • Linear function
Instructional Guidelines For this indicator, it is essential
for students to:
• Solve arithmetic (adding/subtracting) and geometric (multiplying by common ratio) sequences
• Represent patterns using tables, graphs, and equations. • Write mathematical rules for patterns from numeric and pictorial patterns • Determine which representation makes it easier to describe, extend, and or

Algebra Sixth Grade
2
make predictions using the patterns For this indicator, it is not essential
• Perform multiplication/division with fractions or decimals for geometric patterns
for students to:
• To solve pattern problem involving shapes (actually drawing pictures to complete the pattern)
Student Misconceptions/Errors Geometric patterns are sequences that involve multiplying by a common ratio not based on shapes. Instructional Resources and Strategies
• Students will need an in-depth experience discussing real world patterns and patterns which provide concrete examples before they can begin to represent them symbolically. Teachers will need to model many examples that involve moving from the concrete to the symbolic.
• This pattern may be represented using concrete models. Which of the
following numeric patterns best represents the geometric pattern below? Explain your reasoning.
a. 1, 3, 9, 12 b. 1, 2, 4, 8
c. 1, 3, 6, 9 d. 1, 3, 6, 10
• Students should explain their observations of a pattern in their own words.
This verbalization will enable students to begin to write a mathematical rule for a pattern later.
Assessment Guidelines The objective of this indicator is to analyze, which is in the “understand conceptual” knowledge cell of the Revised Taxonomy. Conceptual knowledge is not bound by specific examples; therefore, the student’s conceptual knowledge of these patterns relationships (words, table and graph) should be explored using a variety of

Algebra Sixth Grade
3
examples. The learning progression to analyze requires students to recall the structure of a function table and a graph. Students generalize connections (6-1.7) among the multiple representations and generate descriptions and mathematical statements about pattern relationships using correct and clearly written and spolen words (6-1.6). Students prove or disprove
their answer (6-1.2) and place an emphasis on the similar meaning that is conveyed by each representation.
Algebra Sixth Grade
4
Standard: 6-3 The student will demonstrate through the mathematical processes an understanding of writing, interpreting, and using mathematical expressions, equations, and inequalities. Indicator 6-3.2 Apply order of operations to simplify whole-number expression Continuum of Knowledge: Sixth grade is the first time students are introduced to using order of operations to evaluate a numerical expression (6-3.2). In 7th
grade, students will use inverse operations to solve two-step equations and two-step inequalities. (7-3.4)
Taxonomy Level Cognitive Dimension: Apply Knowledge Dimension: Procedural Key Concepts
Order of operations Vocabulary
Exponents
All grouping symbols { [ ( ) ] } Symbols
Instructional Guidelines For this indicator, it is essential
for students to:
• Solve problems that involve all operations with whole numbers • Work with whole numbers expressions only • Understand the reasoning behind order of operations
For this indicator, it is not essential
for students to:
• Include negatives, fractions or decimals. Student Misconceptions/Errors Many students are simply introduced to the concept with the phrase “Please Excuse

Algebra Sixth Grade
5
My Dear Aunt Sally”, often referred to as PEMDAS. While this is a helpful mnemonic devise, it can easily lead to some common misconceptions. Many students come to believe that multplication is always done before division and that addition is always done before subtraction. By being taught this mnemonic device, students do not fully understand that the operations of multiplication and division (or addition and subtraction) are performed in the order that they appear, from left to right. Instructional Resources and Strategies
• However, students did not evaluate expressions. "Evaluating an expression", “Solve the expression” and “Find the solution to the expression” each with the same meaning will be new and important phrases for students to understand.
• Solving problems in context are useful to help students better understand the
concept. For example, Jay shot 4 arrows at the target. His total score was 45. Which of these scores is not a possible result of Jay’s 4 shots? How do you know?
a. 25 + (2 x 5) + 10 b. 15 + (3 x 10) c. (2 x 15) + 10 + 5 d. 25 + 5 + (2 x 10)
• After students have been given opportunites to discover why an agreement
for the order of operations is necessary, it is sugggested that order of operations be introduced using a table format with students being taught that the higher in the table an operation is, the more important it is and must be done first.
Level 1
{ [ ( ) ] } All Grouping Symbols
Level 2
Exponents
Level 3
Multiplication and Division
Proceeding from Left to Right
Addition and Subtraction

Algebra Sixth Grade
6
Assessment Guidelines The objective of this indicator is apply, which is in the “apply procedural” of the Revised Taxonomy. Procedural knowledge is knowledge of specific steps or strategies that can be used to solve a problem or problem situation. Although the focus is to gain computational fluency with order of operations, the learning progression should integrate strategies to enhance both conceptual and procedural knowledge. The learning progression to apply requires student to be fluently in all whole number operations. Given an expression, students explore various ways to simplify the expression. Students explain and justify their process of simplifying to their classmates and their teacher. They use inductive reasoning to generalize connections among strategies with an emphasis on the need for a common process to simplify. Students analyze the order of operations and gain of understanding of the structure and purpose of each level. They use
this understanding to generate and solve more complex problems (6-1.1).
Level 4 Proceeding from Left to Right

Algebra Sixth Grade
7
Standard: 6-3 The student will demonstrate through the mathematical processes an understanding of writing, interpreting, and using mathematical expressions, equations, and inequalities. Indicator 6-3.3 Represent algebraic relationships with variables in expressions, simple equations, and simple inequalities Continuum of Knowledge: In fourth grade, students translated among, letter, symbols and words to represent quantities in simple mathematical expression or equations (4-3.4). In fifth grade, students represented numeric, algebraic and geometric pattern in words, symbols, algebraic expression and algebraic equations (5-3.1). In sixth grade, students represent algebraic relationships with variables in expressions, simple equations, and simple inequalities (6-3.3). In seventh grade, students represent proportional relationships with graphs, tables, and equations (7-3.6) and represent algebraic relationships with equations and inequalities (8-3.2). Taxonomy Level Cognitive Dimension: Understand Knowledge Dimension: Conceptual Key Concepts
Expression Vocabulary
Equations Inequality Variable Equivalency Algebraic relationships
<, >, = ≤, ≥ Symbols
Instructional Guidelines For this indicator, it is essential
for students to:
• Write an equation or inequality from a picture

Algebra Sixth Grade
8
• Write an equation or inequality from a word problem • Understand inequality symbols • Understand the concept of equivalency • Understand that algebraic relationships can be in the form of words, tables or
graphs
For this indicator, it is not essential
for students to:
• Solve or graph equations or inequalities Student Misconceptions/Errors Many students have a common misconception that different variables represent different numbers. Students also misunderstand the concept of equivalence. They must establish that the equal sign plays different roles based on the situation. In this instance, it does not mean do something. It means that there is a relationship of equivalence on either side of the equal sign. Instructional Resources and Strategies
• Please note that a more in depth understanding of the concept of inequality is crucial in the 6th grade. Students have been using the inequality symbols > and < since the 2nd
• Students are translating from one to another; therefore, their understanding of the multiple representations is essential. For example,
grade in grade appropriate applications. It is imperative at this level that students' think of an inequality as much more than "the alligator eats the biggest piece". Students must be encouraged to view inequalities as a way to describe and represent a relationship between/among quantities. In sixth grade, students are introduced to the symbols ≤ and ≥.
o Which of these problems could be solved by using the open sentence?
A – 5 = ?
a) Janis is 5 years older than Seth. If A is Seth’s age, how old is Janis? b) Todd is 5 years younger than Amelia. If A is Amelia’s age in years,
how old is Todd? c) Isaac is 5 times as old as Bert. If A is Bert’s age in yars, how old is
Isaac? d) Nathan is one-fifth as old as Leslie. If A is Nathan’s age, how old is Leslie?

Algebra Sixth Grade
9
o The two number sentences shown below are true.
− = 6 + = 2
If both equations shown above are true, which of the following equations must also be true? Circle your choice and explain why. (Students should circle the first equation)
X =
X 2 =
+ = 12
+ =
Assessment Guidelines The objective of this indicator is to represent which is in the “understand conceptual” knowledge cell of the Revised Taxonomy. To understand means to construct meaning; therefore, the students’ focus is on building conceptual knowledge of the relationships between the forms. The learning progression to represent requires students to understand the concepts of equivalency and inequalities. Students analyze algebraic relationships (words, tables and graphs) to determine known and unknown values and the operations involved. They generate descriptions of the observed relationship and generalize the connection (6-1.7) between their description and structure of expression, equations or inequalities. Students explain and justify their ideas with their classmates and teachers using correct and clearly written or spoken words, variables and notation to communicate their ideas (6-1.6). Students then compare
the relationships (words, tables and graphs) to their equation, inequality or expression to verify that each form conveys the same meaning.

Algebra Sixth Grade
10
Standard: 6-3 The student will demonstrate through the mathematical processes an understanding of writing, interpreting, and using mathematical expressions, equations, and inequalities. Indicator 6-3.4 Use the commutative, associative, and distributive properties to show that two expressions are equivalent. Continuum of Knowledge: In fifth grade, students will identify applications of commutative, associative, and distributive properties with whole numbers (5-3.4). In sixth grade, students use the commutative, associative, and distributive properties to show that two expressions are equivalent (6-3.4). In eighth grade, students use commutative, associative, and distributive properties to examine the equivalence of a variety of algebraic expressions (8-3.3). Taxonomy Level Cognitive Dimension: Apply Knowledge Dimension: Procedural Key Concepts
Commutative property Vocabulary
Associative property Distributive property Instructional Guidelines For this indicator, it is essential
for students to:
• Gain a conceptual understanding each rule (what it can and can’t do) • Verbalize each rule using appropriate terminology • Perform whole number computations
For this indicator, it is not essential
for students to:
• Use properties in situations that involve multiplication/division of fractions and decimals
• Create a formal rule for each property using variables. For example, a + b = b + a

Algebra Sixth Grade
11
Student Misconceptions/Errors Students might have difficulty naming the property that they use. The most important point here is that they understand what the different properties allow them to do and not do. Instructional Resources and Strategies
• The focus is for students to understand how these properties can be used to create equivalent expressions. Students should verbalize their understanding of these properties using correct and clear mathematical language but it is not necessary for them to recite or write formal rules. Students should demonstrate a clear understanding of the concepts of equivalence by using the commutative, associative, and distributive properties. These properties should be used in situations that involve all operations with whole numbers, addition and subtraction of fractions and decimals, and powers of 10 through 106
• Using problem situations to explore these concepts will support retention. .
Streamline video:
• o The Commutative Properties of Addition and Multiplication (02:21)
Power of Algebra, The Basic Properties
o The Associative Properties of Addition and Multiplication (00:46) o The Distributive Properties of Multiplication over Addition (01:26)
Assessment Guidelines The objective of this indicator is to use which is in the “apply procedural” knowledge cell of the Revised Taxonomy. Although the focus of the indicator is to use which is a knowledge of specific steps and details, learning experiences should integrate both memorization and concept building strategies to support retention. The learning progression to use requires student to explore a variety of examples of these number properties using a various types of numbers. They analyze these examples and generalize connections (6-1.7) about what they observe using correct and clearly written or spoken language (6-1.6) to communicate their understanding. Students do not generalize these connections using formal rules involving variables. Students connect these statements to the terms commutative, associative and distributive. Students then develop
meaningful and personal strategies that enable them to recall these relationships.

Algebra Sixth Grade
12
Standard: 6-3 The student will demonstrate through the mathematical processes an understanding of writing, interpreting, and using mathematical expressions, equations, and inequalities. Indicator 6-3.5 Use inverse operations to solve one-step equations that have whole-number solutions and variables with whole-number coefficients. Continuum of Knowledge: In fourth grade, students apply procedures to find the value of an unknown letter or symbol in whole number equations (4-3.5). In sixth grade, students use inverse operations to solve one-step equations that have whole-number solutions and variables with whole-number coefficients (6-3.5). In seventh grade, students will solve two-step equations and two-step inequalities. (7-3.4) Taxonomy Level Cognitive Dimension: Apply Knowledge Dimension: Procedural Key Concepts
• Inverse operation Vocabulary
• Coefficient • Evaluate • Solve • Solution • Additive inverse • Multiplicative inverse
Instructional Guidelines For this indicator, it is essential
for students to:
• Add, subtract, multiply, and divide whole numbers • Understand the concept of a variable and how to solve for it • Understand additive inverse (the sum of a number and its opposite is 0) • Use manipulatives to model equations and the process of solving one-step
equation

Algebra Sixth Grade
13
• Solving equations using inverse operations • Check their solutions
For this indicator, it is not essential
• Include negatives, fractions, or decimals for students to:
Student Misconceptions/Errors Students think that an equal sign means provide an answer rather than seeing it as an indicator of equality. Students often solve equation and do not understand why they are doing it. A common question is “is my answer right?” Students who ask this lack a conceptual understanding of the concept of equivalency and the purpose of the procedure of solving. Instructional Resources and Strategies
• To solve an equation means to find value (s) for the variable that make the equation true. Pan balance may be used to develop skills in solving equations with one variable. “The balance makes it reasonably clear to students that if you add or subtract a value from one side, you must add or subtract a like value from the other side to keep the scales balanced” (p. 280). Show a balance with variable expressions in each side. Use only one variable. Make the tasks such that a solution by trial and error is not reasonable. For example, the solution to 3x + 2 = 11 – x is not a whole number. (Use whole numbers only!) Suggest that adjustments be made to the quantities in each pan as long as the balance is maintained. Begin with simple equations, such as 12 + n = 27 in order to help students develop skills and explain their rationale. Students should also be challenged to devise a method of proving that their solutions are correct. (Solutions can be tested by substitution in the original equation.)
Assessment Guidelines The objective of this indicator is use which is in the “apply procedural” of the Revised Taxonomy. Procedural knowledge is knowledge of specific steps or strategies that can be used to solve a problem or problem situation. Although the focus is to gain computational fluency with solving one step equations, the learning

Algebra Sixth Grade
14
progression should integrate strategies to enhance both conceptual and procedural knowledge. The learning progression to use requires students to explore the concepts of equivalency and variables using concrete models such as balance scales. Student use this understanding of balance to analyze a variety of examples of simple one step equations. Students use inductive reasoning (6-1.3) to generalize connections (6-1.7) among types of equations (addition, subtraction, multiplication and division) and generate mathematical statements (6-1.5) related to how these equations can be solved. Students engage in repeated practice to support retention and check
their answers.

Geometry Sixth Grade
1
Indicator 6-4.1
Represent with ordered pairs of integers the location of points in a coordinate grid.
Continuum of Knowledge
In the fourth grade, students represented with ordered pairs of whole numbers the location of points in the first quadrant of a coordinate grid (4-4.7).
In the 6th
Taxonomy Level
grade, students represent, with ordered pairs of integers, the location of points in a coordinate grid (6-4.1).
Cognitive Dimension: Understand Knowledge Dimension: Procedural Key Concepts
• Ordered Pair Vocabulary
• Coordinate Grid • X- Axis • Y- Axis • Quadrants • Origin • Integers
Instructional Guidelines For this indicator, it is essential
for students to:
• Understanding the meaning and concept of integers. • Understand that a coordinate grid/plane is made up of one horizontal line
and one vertical line with the number lines intersecting where both are zero. • Label the terms important to the coordinate plane; origin, x-and y- axis, and
Quadrants counterclockwise. • Plot points in a coordinate grid. • Write the coordinates of the ordered pairs as x coordinate first, then y
coordinate second. • Write the coordinate given the graph
Standard 6-4: The student will demonstrate through the mathematical processes an understanding of shape, location, and movement within a coordinate system; similarity, complementary, and supplementary angles; and the relationship between line and rotational symmetry.

Geometry Sixth Grade
2
For this indicator, it is not essential
for students to:
• Find the coordinates of a missing vertex of a square, rectangle, or right triangle when given the coordinates of the polygon’s other vertices.
Student Misconceptions/Errors
• Students get confused with the order of the quadrants and that they are
labeled counterclockwise. • Students may think that all quadrants have the same coordinates. • It is important for students to start at the origin because this helps them will
direction Instructional Resources
• A review of plotting points in the first quadrant will be helpful. Then extend the horizontal axis and discuss how the other quadrants are a result of this extension. Then do the same thing for the y axis.
• Another strategy is to have students build a coordinate grid by creating two number lines (-10 to 10) and placing one horizontally and one vertically with the number lines intersecting where both are zero. This allows students to see that the coordinate plane is made up of something they are already familiar with, a number line.
• When finding the coordinates of a point in a coordinate grid a strategy that would assist students in finding and writing the coordinate pair correctly would be to allow students to use a ruler. The students would line up the point with the x –axis to determine the x coordinate and then line up the point with the y-axis to determine the y coordinate. The student would then write the coordinates as an ordered pair with the x coordinate first, then the y coordinate second.
• The students will need practical and fun practice in plotting points. • Navigating Through Geometry (NCTM) Grades 3-5
•
“Xs and Os” pp. 40 – 43 *Objectives are to: locate points on a rectangular coordinate plane using ordered pairs; use the point of origin (0,0) as a point of reference; and understand and use positive and negative integers to identify points in four quadrants. Navigating Through Geometry (NCTM) Grades 6-8
“Constructing Geometric Figures in Coordinate Space” p. 36 *Objectives are to: reinforce or develop graphing skills and explore properties of shapes in a coordinate system. (Practice for plotting points.)

Geometry Sixth Grade
3
Assessment Guidelines The objective of this indicator is to represent which is in the “understand conceptual” knowledge cell of the Revised Taxonomy. To represent means to change from one form to another; therefore, students gain an understanding of coordinates by translating them from numerical form (coordinate) to graphical form (grid). The learning progression to represent requires students to understand the meaning of integers. They recall and understand the structure of the coordinate plane (grid). Students use correct and clearly written or spoken words to communicate the meaning 6-1.6) of a coordinate by identify the values of x and y. They use a strategy to plot points and explain their strategy to their classmates and teachers. Students also analyze a graph to determine the coordinates. They use their understanding of quadrants to justify why a coordinate as certain signs. They evaluate
their explanations and pose follow-up questions to prove or disprove their answers (6-1.2). Students then engage in repeated practice to support retention.

Geometry Sixth Grade
4
Indicator 6-4.2
Apply strategies and procedures to find the coordinates of the missing vertex of a square, rectangle, or right triangle when given the coordinates of the polygon’s other vertices.
Continuum of Knowledge
In fourth grade, students analyzed the quadrilaterals squares, rectangles, trapezoids, rhombuses and parallelograms according to their properties (4-4.1). In fifth grade, students applied the relationship of quadrilaterals to make logical arguments about their properties (5-4.1).
In sixth grade, students apply strategies and procedures to find the coordinates of the missing vertex of a square, rectangle, or right triangle when given the coordinates of the polygon’s other vertices (6-4.2).
Taxonomy Level
Cognitive Dimension: Apply Knowledge Dimension: Procedural Key Concepts
Vocabulary
• Ordered Pair • Coordinate Grid • X- Axis • Y- Axis • Quadrants • Origin • Vertex/ Vertices • Coordinates • Polygons
Instructional Guidelines For this indicator, it is essential
for students to:
Standard 6-4: The student will demonstrate through the mathematical processes an understanding of shape, location, and movement within a coordinate system; similarity, complementary, and supplementary angles; and the relationship between line and rotational symmetry.

Geometry Sixth Grade
5
• Understand integers. • Have an understanding of the signs common to numbers in each quadrant. • Use ordered pairs containing integers. • Use polygons that have been orientated horizontally. • Locate points in a coordinate plane. • Plot points in a coordinate plane. • Find the coordinates of a missing vertex when a polygon has vertices in more
than one quadrant. • Find the coordinates of a missing vertex then the other coordinates are
giving in word form (list) or on a graph • Understand the characteristics of the square, rectangle and the right triangle.
For this indicator, it is not essential
for students to:
• Find coordinates that contain fractional points. • Predict the result of transformations.
Student Misconceptions/Errors
• Students may think that coordinate points in different quadrants have the same integer value.
Instructional Resources
• Make a class set of blank coordinate grids and paper clip a blank transparency to each one. Each student will also need a wet or dry erase marker to use to write on the transparency. You will also need to make a transparency of a coordinate graph for the overhead projector. Introduce the coordinate graph by discussing the vertices of different polygons (square, rectangle, or right triangle) on the coordinate graph. Then give students the coordinates for all the vertices except one and ask the students to identify the missing vertex. You can extend the activity by asking students to plot the vertices of a congruent polygon that you have already plotted. Ask students to describe how they can prove that the new shape is congruent. (Use simple shapes like rectangles and squares.) Have students plot the points for similar polygons.

Geometry Sixth Grade
6
Assessment Guidelines The objective of this indicator is to apply, which is in the “apply procedural” knowledge cell of the Revised Taxonomy table. Procedural knowledge is knowledge of specific steps or strategies that can be used to solve a problem or problem situation. Although the focus of the indicator is to apply, the learning progressions should include strategies that integrate conceptual and procedural knowledge. The learning progression to apply requires students to understand integers and the properties of the squares, rectangles and the right triangles. Students generalize mathematical statements related to the relationship between and among coordinates (6-1.5) such as the x values for two coordinates on the same vertical side are the same but the y values are different. As students explore a variety of examples, they use inductive and deductive reasoning to formulate conjectures (6-1.3) and evaluate these conjectures by posing follow-up questions to prove or disprove their them (6-1.2). Students use their understanding of these relationships to generate and solve complex problems. They use
correct and clearly written or spoken notation to communicate their answers.

Geometry Sixth Grade
7
Indicator 6-4.3 Generalize the relationship between line symmetry and rotational symmetry for two dimensional shapes Continuum of Knowledge In fifth grade, students analyzed shapes to determine line symmetry and/or rotational symmetry (5-4.6). In sixth grade, students generalize the relationship between line symmetry and rotational symmetry for two dimensional shapes (6-4.3) and they construct two-dimensional shapes with line or rotational symmetry (6-4.4). Taxonomy Level Cognitive Dimension: Understand Knowledge Dimension: Conceptual Key Concepts
• line symmetry • rotational symmetry • clockwise • counterclockwise • center of rotation
Instructional Guidelines For this indicator, it is essential
• Identify shapes that have line symmetry.
for students to:
• Identify shapes that have rotational symmetry. • Identify counter-examples (shapes with no line of symmetry) • Understand that all regular polygons have rotational symmetry. • A shape that rotates onto itself before turning 360o
• Identify shapes that have both types of symmetry has rotational symmetry.
For this indicator, it is not essential
None noted
for students to:
Standard 6-4: The student will demonstrate through the mathematical processes an understanding of shape, location, and movement within a coordinate system; similarity, complementary, and supplementary angles; and the relationship between line and rotational symmetry.

Geometry Sixth Grade
8
Students Misconceptions/Errors
Students often create figures with rotational symmetry, but often have difficulty describing the regularity they see. They should be using language about turns and angles to describe these figures." (Principles and Standards for School Mathematics, 167-168)
Instructional Resources and Strategies
If a shape can be folded on a line so that the two halves match, then it is said to have line symmetry. Notice that the fold line is actually a line of reflection—the portion of the shape on one side of the line is reflected onto the other side. That is the connection between line symmetry and transformations.
A strategy to review line symmetry is to use mirrors. When you place a mirror on a picture or design so that the mirror is perpendicular to the table, you see a shape with symmetry when you look in the mirror. Another strategy can be done with Geoboards. First, stretch a band down the center or from corner to corner. Make a design on one side of the line and its mirror image on the other. Check with a mirror.
Assessment Guidelines
The objective of this indicator is to generalize which is in the “understand conceptual” knowledge cell of the Revised Taxonomy. Conceptual knowledge is not bound by specific examples; therefore, the student’s conceptual knowledge of rotational and line symmetry should be explored using a variety of examples. The learning progression to generalize requires students to recall and understand the meaning of line symmetry and rotational symmetry. Students experiment with rotating concrete models and generate descriptions and mathematical statements about their observations. Students use inductive and deductive reasoning to formulate mathematical arguments about the relationship between the two types of symmetry. They explain and justify
their answers using correct and clearly written or spoken words to communicate their understanding of this relationship (6-1.6).

Geometry Sixth Grade
9
Indicator 6-4.4
Construct two-dimensional shapes with line or rotational symmetry.
Continuum of Knowledge
In fifth grade, students analyzed shapes to determine line symmetry and/or rotational symmetry (5-4.6). In sixth grade, students generalize the relationship between line symmetry and rotational symmetry for two dimensional shapes (6-4.3) and they construct two-dimensional shapes with line or rotational symmetry (6-6.4).
Taxonomy Level
Cognitive Dimension: Create Knowledge Dimension: Conceptual Key Concepts Vocabulary
• Rotational symmetry • Line of symmetry • Line Symmetry • Angle of Rotation • Translation • Rotation • Reflection • Transformation
Instructional Guidelines For this indicator, it is essential
for students to:
• Understand line symmetry. • Understand rotational symmetry. • Understand the properties of regular polygons. • Be able to explain the relationships they may find among two-dimensional
shapes that have both line and rotational symmetry.
Standard 6-4: The student will demonstrate through the mathematical processes an understanding of shape, location, and movement within a coordinate system; similarity, complementary, and supplementary angles; and the relationship between line and rotational symmetry.

Geometry Sixth Grade
10
• Construct shapes with both types of symmetry For this indicator, it is not essential
for students to:
• Identify the type of transformation used to create the shape. Student Misconceptions/Errors
• Students sometimes use the “eyeball” method to determine symmetry. Although this is a valid strategy for making predictions, they need experiences with materials they can touch, fold, and rotate to check for line symmetry and rotational symmetry.
Instructional Resources
• The focus of the indicator is support conceptual understanding of line and rotational symmetry. To create requires different cognitive processes than identifying or analyzing.
• A strategy for reviewing symmetry is to have students identify all the lines of symmetry that regular polygons contain. Students can prove the lines of symmetry by folding the figure and making two congruent parts. A good activity to refer to for more ideas is “Explorations with Lines of Symmetry” in the
• Using Geoboards have students construct two-dimensional shapes that have line symmetry, rotational symmetry, or both. Also, have students fold a piece of paper in ½ and cut out a shape. This shape will at least have one line of symmetry. Have them identify any others in their shape and determine whether or not their shape has rotational symmetry as well. Ask students what relationships they may find among two-dimensional shapes that have both line and rotational symmetry.
Navigating through Geometry in Grades 6-8.
• Navigating Through Geometry in Grades 6-8 (NCTM)
•
“Drawing Figures with Symmetry” pp. 56 – 58. Objectives are to: apply concepts of symmetry and recognize symmetry as an identifying property. Navigating Through Geometry in Grades 3-5 (NCTM) “Symmetry Detectives – Learn the Secret Code!” pp. 52 – 54. (This lesson relates to the introductory lesson above.) Objectives are to: explore lines of symmetry in simple figures and geometric shapes; identify the lines of symmetry in letters of the alphabet; and identify objects in the real world that have line symmetry.

Geometry Sixth Grade
11
• Teaching Student-Centered Mathematics Volume 3 Grades 5-8
, Van de Walle, pp. 210 -211
Assessment Guidelines The objective of this indicator is to construct, which is in the “create conceptual” knowledge cell of the Revised Taxonomy table. To construct means to put elements together to form a coherent or functional whole; therefore, students show their conceptual knowledge of line and rotational symmetry by creating shapes. The learning progression to construct requires students to recall and understand characteristics of two dimensional shapes. Students analyze two-dimensional shapes to identify pattern relationships between shapes that have line or rotational symmetry. They use inductive and deductive reasoning to formulate mathematical arguments explaining the similarities and differences between two- dimensional shapes with line or rotational symmetry (6-1.3). They use this understanding to construct shapes and use
correct and clearly written or spoken words and notations to explain how they constructed their shapes (6-1.6).

Geometry Sixth Grade
12
Standard 6-4: The student will demonstrate through the mathematical processes an understanding of shape, location, and movement within a coordinate system; similarity, complementary, and supplementary angles; and the relationship between line and rotational symmetry
Indicator 6-4.5
Identify the transformation(s) used to move a polygon from one location to another in the coordinate plane.
Continuum of Knowledge:
In fifth grade students predicted the results of multiple transformations on a geometric shape when combinations of translation, reflection and rotation are used (5-4.5).
In sixth grade students will identify the transformation used to move a polygon from one location to another in the coordinate system (6-4.5). Students explain how a transformation affects the location of the original polygon in the coordinate system (6-4.6).
In seventh grade, students create tessellations using transformations (6-4.9).
Taxonomy Level
Cognitive Dimension: Remember Knowledge Dimension: Factual
Key Concepts
• translation
Vocabulary
• rotation • reflection
Instructional Guidelines
For this indicator, it is essential
• Recall the meaning of reflection, rotation and translation
for students to:
• Visualize what a reflection, rotation and translation look like • Understand that the polygon should remain the same size and shapes after
the transformation

Geometry Sixth Grade
13
For this indicator, it is not essential
• Rename the vertices of the polygon.
for students to:
• Rename the coordinates based on the ordered pair without a given picture.
Student Misconceptions/Errors
• Students often use the terms translation and transformation interchangeably. • Students may think that the point of rotation has to be on the figure but it
doesn’t have to be.
Instructional Resources and Strategies
When students describe the rotation of a figure, they give the direction, the angle of rotation, and the center of rotation. It is important for 6th grade students to use correct terminology (translation, reflection, rotation) to describe the change made to the figure or polygon.
Activity
• Die-cut letters or copies of printed letters
: Materials Needed
• Coordinate graphs • Copies of several regular polygons • Miras (a piece of Plexiglas that stands perpendicular to the paper and
functions like a see through mirror allowing you to trace a reflection.) • Patty Paper (squares of paper with wax on one side that are normally put
between uncooked hamburger patties.)
Using the die-cut letters or copies, have students move the letters from one place to another using reflection, translation, or rotation and describe the movement. You may need to review these as flip, slide, turn. Miras can be used to draw reflections. Patty paper can be used to help students explore the change a figure makes when rotated. Students can trace the figure, rotate the paper, and compare the original figure with the rotated figure. When students trace the figure and rotate it, they will be able to see the original figure through the paper in order to describe the effects of the rotation. Patty paper can also be used to explore the effects of reflection and translation.
For transformations, have students place the polygons in the first quadrant and record the points of each vertex. Then, have students move the polygons from one place to another in the first quadrant using reflection, translation, or rotation and describe the new location of the polygon. Students need to explain how transformations affect the location of the original polygon.

Geometry Sixth Grade
14
• Navigating Through Geometry in Grades 6-8 (NCTM)
•
“Translations, Reflections, and Rotations” pp. 46 – 47. Objectives are to: explore relationships between the preimage and the image in rigid motions; develop appropriate language to describe rigid motions; and perform three rigid transformations: reflections, translations, and rotations. Connect to NCTM Standards 2000
•
Grade 5 “Understanding Transformations” pp. 76 – 81 Navigating Through Geometry in Grades 3-5 (NCTM)
“Motion Commotion” pp. 64 – 67. Objectives are to: manipulate a figure using the following basic transformations: translations (slides), reflections (flips), and rotations (turns); and predict the new orientation of a figure after a specific transformation.
Assessment Guidelines
The objective of this indicator is to identify which is in the “remember factual” knowledge cell of the Revised Taxonomy. To identify is to locate knowledge in long term memory. Although the focus of the indicator is to remember, hands-on activities build conceptual knowledge and support retention. The learning progression to identify requires students to recall the meaning of transformation, translation, rotation and reflection. They explore these transformations using concrete models, pictorial models and real world examples to generalize mathematical statements (6-1.5) about the relationships between transformed shapes. Students use these relationships to identify transformations when given two polygons. They explain and justify their answers using
correct and clearly written or spoken words (6-1.6).

Geometry Sixth Grade
15
Standard 6-4: The student will demonstrate through the mathematical processes an understanding of shape, location, and movement within a coordinate system; similarity, complementary, and supplementary angles; and the relationship between line and rotational symmetry
Indicator 6-4.6
Explain how transformations affect the location of the original polygon in the coordinate plane.
Continuum of Knowledge:
In fifth grade students predicted the results of multiple transformations on a geometric shape when combinations of translation, reflection and rotation are used (5-4.5).
In sixth grade students will identify the transformation used to move a polygon from one location to another in the coordinate system (6-4.5). Students explain how a transformation affects the location of the original polygon in the coordinate system (6-4.6).
In seventh grade, students create tessellations using transformations (6-4.9).
Taxonomy Level
Cognitive Dimension: Understand Knowledge Dimension: Conceptual
Key Concepts
• Transformation
Vocabulary
• Rotation • Translation • Reflection • X-axis • Y-axis • Ordered pair • X-coordinate • Y- coordinate • Coordinate plane/ coordinate grid • Quadrant (I, II, III, IV) • Ordered pair • Coordinates

Geometry Sixth Grade
16
• Origin
Instructional Guidelines
For this indicator, it is essential
• To name the new coordinates that result from a translation. Examples: know that a movement to the right or left affects the x-coordinate and a movement up or down affects the y-coordinate. Right adds to the x-coordinate, left subtracts from the x-coordinate. Up adds to the y-coordinate and down subtracts from the y-coordinate.
for students to:
• To name the new coordinates that result from a reflection. A reflection over the x-axis results in the y-coordinates becoming the opposite while the x-coordinate remains the same. A reflection over the y-axis results in the x-coordinate becoming the opposite while the y-coordinate remains the same.
• To identify the amount of degrees (900, 1800, 2700, and 3600
• Name the new coordinates for a reflection and a translation of the vertices of a polygon when given the ordered pairs or from a picture.
) a polygon rotated around a central point. Students should know that the angle is formed by the line segments that are connected to the point of rotation.
• Use appropriate terminology when explain the effects
For this indicator, it is not essential
• To name the new coordinates of a rotation from only ordered pairs
for students to:
Student Misconceptions/Errors
Students find it hard to figure out the degree of rotation and often cannot identify the point of rotation.
Instructional Resources and Strategies
Navigating Through Geometry (NCTM) Grades 3-5 “Xs and Os” pp. 40 – 43 *Objectives are to: locate points on a rectangular coordinate plane using ordered pairs; use the point of origin (0,0) as a point of reference; and understand and use positive and negative integers to identify points in four quadrants. Navigating Through Geometry (NCTM) Grades 6-8 “Constructing Geometric Figures in Coordinate Space” p. 36 *Objectives are to: reinforce or develop graphing skills and explore properties of shapes in a coordinate system. (Practice for plotting points.)

Geometry Sixth Grade
17
Assessment Guidelines
The objective of this indicator is explain which is in the “understand conceptual” knowledge cell of the Revised Taxonomy. To explain is to construct a caluse and effect models; therefore, as students explain they use the structure “the transformation ______ because _____.” The learning progression to explain requires students to recall and understand the meaning of transformation. They recognize the relationships among rotations, reflections, and translations. Students explore and generate examples of transformation and generalize connections (6-1.7) of real world situations where transformations are needed. Using their understanding, students evaluate
their explanations of the effect of transformation by posing questions to prove or disprove their reasoning (6-1.2). They use correct and clearly written or spoken words and notation to communicate their reasoning (6-1.6).

Geometry Sixth Grade
18
Standard 6-4: The student will demonstrate through the mathematical processes an understanding of shape, location, and movement within a coordinate system; similarity, complementary, and supplementary angles; and the relationship between line and rotational symmetry
Indicator 6-4.7
Compare the angles, side lengths, and perimeters of similar shapes.
Continuum of Knowledge:
In fifth grade the students compare angles, side lengths, and perimeters of congruent figures (5-4.2)
In sixth grade the students compare the angles, side lengths, and perimeters of similar shapes (6-4.7). The students also learn to classify shapes as similar (6-4.8). This is the first time they explore similarity.
In seventh grade, students compare the areas of similar and congruent shapes (7-4.6) and apply their knowledge of proportional relationships to find missing attributes of similar shapes (7-4.8)
Taxonomy Level
Cognitive Dimension: Understand Knowledge Dimension: Conceptual
Key Concepts
• proportions
Vocabulary
• corresponding sides • corresponding angles • similar shape • perimeter
Instructional Guidelines
For this indicator, it is essential
• Identify a shape as either similar or congruent.
for students to:
• Identify the corresponding sides and angles of similar shapes. • Know how increasing the side length affects the perimeter.
Geometry Sixth Grade
19
• compare the corresponding side lengths using proportions. • compare the perimeters of similar shapes using proportions. • discover that the corresponding angle measures will be equal whereas the
corresponding side lengths and perimeters are proportional.
For this indicator, it is not essential
• Identify missing attributes of similar shapes.
for students to:
Student Misconceptions/Errors
One of the most common mistakes students make is comparing sides or angles that are not corresponding. Therefore, it is important that students understand the concept of correspondence.
Instructional Resources and Strategies
While on the surface comparison of angles, side lengths, and perimeters of similar shapes may appear to be a simple concept, the indicator requires a more in-depth level of mathematical understanding. Below is an activity
o Give each child different sizes of rectangles (some congruent and some similar). Ask the students to group them based on common characteristics. When the students have decided on their groupings, stop and discuss the reasons for grouping them as they did. If no one demonstrates placing the rectangles on top of each other to see how they fit, show them. Tell them that they are similar shapes. Have them generate a definition of similar.
that may be used to explore similarity.
o Using the similar shapes created or found in the previous lesson, students find and record the corresponding angle measurements, side lengths and perimeters. Ask them what they notice (similarities and differences). If no one mentions the equal proportions, point that out in one of the similar shapes and ask if they think it will hold true for all.
o Give students five identical triangles from pattern blocks and have them measure and prove that the triangles are congruent. Ask students to arrange four of the five triangles to form a larger triangle that is the same shape as one of the small triangles. When the large triangle is constructed, have students investigate and analyze the angles and sides of the two triangles, comparing the measurement with the one triangle that was not used from the original five. Students

Geometry Sixth Grade
20
should also be asked to investigate and analyze the area and perimeter of the triangles. Have students discuss their conclusions.
Another strategy for exploring similar shapes is to ask students to find pictures in magazines or on the Internet that include congruent and similar figures. (Example: Bridges, building, etc.). Make sure the students understand HOW to match the corresponding sides and HOW this relates to corresponding angles.
Assessment Guidelines
The objective of this indicator is to compare which is in the “understand conceptual” knowledge cell of the Revised Taxonomy. To compare is to detect correspondences between ideas; therefore, student construct an understanding of similarity by exploring a variety of examples. The learning progression to compare requires students to recall the characteristics of congruent shapes. Students investigate and analyze a variety of shapes based on characteristics and generalize connections among these them (6-1.7). They use these generalizations to generate mathematical statements (6-1.5) about the relationships among similar shapes, perimeter, corresponding sides and angles. Students use these relationships to identify and generate examples of similar shapes. They evaluate their using by posing questions to prove or disprove their conjecture (6-1.2). Students explain and justify their answers using correct and clearly written and spoken words and notation (6-1.6). As students compare, they write statements that summarize
the relationship between specific angles, sides and perimeters.

Geometry Sixth Grade
21
Standard 6-4: The student will demonstrate through the mathematical processes an understanding of shape, location, and movement within a coordinate system; similarity, complementary, and supplementary angles; and the relationship between line and rotational symmetry
Indicator 6-4.8
Classify shapes as similar.
Continuum of Knowledge:
In fifth grade the students compare angles, side lengths, and perimeters of congruent figures (5-4.2)
In sixth grade the students compare the angles, side lengths, and perimeters of similar shapes (6-4.7). The students also learn to classify shapes as similar (6-4.8). This is the first time they explore similarity.
In seventh grade, students compare the areas of similar and congruent shapes (7-4.6) and apply their knowledge of proportional relationships to find missing attributes of similar shapes (7-4.8)
Taxonomy Level
Cognitive Dimension: Understand Knowledge Dimension: Conceptual
Key Concepts
• corresponding sides and angles
Vocabulary
• proportional relationships • similar shapes • congruent shapes • ratio
Instructional Guidelines
For this indicator, it is essential
• Understand the characteristics of similar shapes
for students to:
• Know the difference between similar and congruent shapes. • Identify a shape as similar using proportional reasoning

Geometry Sixth Grade
22
For this indicator, it is not essential
• Find the measure of missing attributes i.e. setting up a proportion to find a missing side, etc…
for students to:
Student Misconceptions/Errors
Students often think all shapes that are the same are also always similar. Students will identify all rectangles as similar and forgot to verifry the corresponding sides.
Instructional Resources and Strategies
• Sixth grade is the first time students are formally introduced to the concept of similarity. Therefore, experiences should actively engage and enable students to discover that similar figures have the same shape, equal corresponding angle measures, and proportional corresponding side lengths. This can be accomplished through the use of similar geometric manipulatives and similar shapes formed on Geoboards or dot paper to compare angles, side lengths and perimeters.
• The exploration of similarity provides the opportunity to review and apply measurement skills as students measure side lengths and angles to determine if two shapes are similar. Make sure the students can identify the corresponding angles, they should also know that corresponding sides are connected by corresponding angles.
Assessment Guidelines
The objective of this indicator is classify which is in the “understand conceptual” knowledge cell of the Revise Taxonomy. To classify is to determine if something belongs to a category; therefore, students build a conceptual understanding of similarity by placing shapes in appropriate categories. The learning progression to classify requires students to recall the characteristics of congruent and similar shapes. Students use inductive and deductive reasoning to analyze problems (6-1.3). They recognize these characteristics when given examples and explain and justify
their classifications using correct and clearly written or spoken words and notations (6-1.6).

Geometry Sixth Grade
23
Standard 6-4: The student will demonstrate through the mathematical processes an understanding of shape, location, and movement within a coordinate system; similarity, complementary, and supplementary angles; and the relationship between line and rotational symmetry
Indicator 6-4.9
Classify pairs of angles as either complementary or supplementary.
Continuum of Knowledge:
In third grade students learn to identify angles as right, acute, or obtuse (3-4.4)
In sixth grade, students classify pairs of angles either complementary or supplementary (6-4.9) .
Taxonomy Level
Cognitive Dimension: Understand Knowledge Dimension: Factual
Key Concepts
• complementary angle- complement
Vocabulary
• supplementary angle- supplement • right angle • acute angle • obtuse angle • sum • straight angle • degree symbol
Instructional Guidelines
For this indicator, it is essential
• understand the complementary angles add up to 90 degree
for students to:
• understand that supplementary angles add up to 180 degree • Understand the complementary angles form a right angle • Understand the supplementary angles form a straight angle • Classify a pair of angles as either complementary or supplementary angles. • Identify the missing angle measure when given one angle in a
complementary or supplementary pair.

Geometry Sixth Grade
24
For this indicator, it is not essential
• Name angle relationships that involve parallel lines and transversals.
for students to:
Student Misconceptions/Errors
None noted
Instructional Resources and Strategies
• Students should have the opportunity to use geometric manipulative shapes or to cut out angle measures on paper to create angle pairs of 90 degrees and 180 degrees as they learn and explore these concepts. A strong understanding of how to use a protractor is essential in drawing angles. This allows students to create mental models of the concept. The teacher can then move to the more abstract by giving students drawings with angle measurements and asking them to determine if the angles are complementary or supplementary.
• Students should also relate this to the inverse relations, i.e. if the students are given one angle measure they should know the difference between either 180 degrees or 90 degrees will give the missing angle of a complementary or supplementary relationship. Questions like: If this angle measures 30o, what is the complement? If this angle measures 30o
• Here’s an example of hands-on activity: Use strips of paper to make rays and brads to connect them to make angles. Have the students construct two angles that when put together make a right angle. Then have them find the measures of each. They should note that they add up to 90 degrees. Have them do this several times for right angles. Explain that these are complementary angles. Then do the same thing for supplementary angles.
, what is the supplement?
Assessment Guidelines
The objective of this indicator is classify which is in the “understand conceptual” knowledge cell of the Revised Taxonomy. To classify is to determine if something belongs to a category; therefore, students build a conceptual understanding of supplementary and complementary angles by placing pairs of angles in appropriate categories. The learning progression to classify requires students to recall the definition of complementary and supplementary angles. Students construct numerical (numbers only), concrete and pictorial representations of pairs of angles that are complementary and supplementary. Students analyze these constructions to generalize connections (6-1.7) between complementary angles and a right angle and the connection between supplementary angles and a straight angle. They use their understanding of these relationships to classify angles as supplementary or

Geometry Sixth Grade
25
complementary when given the numerical representation (numbers only) and the pictorial representation. They explain and justify their answers using correct and clearly written or spoken word and notations (6-1.6).

Measurement Sixth Grade
1
Standard 6-5: The student will demonstrate through the mathematical processes an understanding of surface area; the perimeter and area of irregular shapes; the relationships among the circumference, diameter, and radius of a circle; the use of proportions to determine unit rates; and the use of scale to determine distance. Indicator 6-5.1 Explain the relationships among the circumference, diameter, and radius of a circle. Continuum of Knowledge In third grade students learned the attributes of a circle, including: center, radius, circumference, and diameter (3-4.1). In sixth grade, students explain the relationships among the circumference, diameter, and radius of a circle (6-5.1). They also apply strategies and
formulas with an approximation of pi ( 3.14, 722
) to find the circumference and
area of a circle (6-5.2). Taxonomy Level Cognitive Dimension: Understand Knowledge Dimension: Conceptual Key Concepts
• Circumference Vocabulary (need to review):
• Diameter • Radius • Pi
• Circumference (C) Symbols
• Diameter (d) • Radius (r) • Pi (∏)
Instructional Guidelines For this indicator, it is essential
• Recall the meaning of circumference, diameter and radius for students to be able to:

Measurement Sixth Grade
2
• Understand the relationship between the diameter and the radius • Recall the formula for circumference
• Understand that pi is the relationship ofd
eCirmferenc.
• Understand that the diameter of a circle will fit around the circumference of the circle about three and a little more (3.14)
For this indicator, it is not essential
for students to:
• Calculations involving circles (circumference and area) Student Misconceptions/Errors Students often confuse radius and diameter. Students may not realize that when they use non-standard ways to measure (string, jar lids, etc.) circumference, that their measurements will be inaccurate. Instructional Resources and Strategies To build conceptual understanding of these relationships, the following activity may be used. Have groups of students carefully measure the diameter of many different circles (jar lids, tubes, cans, and wastebaskets) using string. Then have the students figure out how many times the diameter will fit around the circumference of the circle. It should fit three times with a little bit left over. So what’s the little bit? To get more a more accurate answer, have student measure the length of the diameter using a ruler. To measure circumference, wrap string once around the object and then measure that length of string. Collect measures of circumference and diameter from all groups and enter them in a table. Use the relationship that the diameter fits into (or divides into) the circumference about three and a little bit more based on their estimates. Now they will see what the answer is if they divide the measurements. It should be also be three and a little bit more but in decimal form. Students discover that ∏ = C/D, the circumference divided by the diameter. From this, the students should be able to come up with the circumference = ∏ D. Half the diameter is the radius (r), so the same equation can be written C = 2∏r. So what does C = 2∏r mean? Let student explore the relationship between the radius and circumference using string to estimate. The radius fits around the circumference six and a little bit more because 2∏ ≈ 6.28.

Measurement Sixth Grade
3
Also measure large circles marked on gym floors and playgrounds. Use a trundle wheel or rope to measure the circumference. Ratios of the circumference to the diameter should also be computed for each circle.
• Sir Cumference and Dragon of Pi by Cindy Neuschwander Connections to Literature:
• Sir Cumference and the First Round Table Assessment Guidelines The objective of this indicator is to explain which is in the “understand conceptual” knowledge cell of the Revised Taxonomy. To explain is to construct a cause and effect model; therefore, students demonstrate their understand of these relationships by using statements such as “the circumference is ∏ times D because the diameter will fit around etc..” Because conceptual knowledge is not bound by specific examples, students should build understanding by exploring a variety of examples. The learning progression to explain requires students to recall parts of a circle (radius, diameter and circumference). Students investigate relationships using standard and nonstandard representational forms (6-1.8) that allow them to construct an understanding of the number pi by using inductive reasoning (details to generalization). They formulate an argument regarding the relationship among pi, circumference and diameter (6-1.3) and pose follow questions to prove or disprove their argument (6-1.2). Students explain
the relationship among pi, circumference, diameter, and area using correct and clear written or spoken words, variable, and notations (6-1.6).

Measurement Sixth Grade
4
Standard 6-5: The student will demonstrate through the mathematical processes an understanding of surface area; the perimeter and area of irregular shapes; the relationships among the circumference, diameter, and radius of a circle; the use of proportions to determine unit rates; and the use of scale to determine distance. Indicator 6-5.2
Apply strategies and formulas with an approximation of pi (3.14, 722 ) to find
the circumference and area of a circle. Continuum of Knowledge In third grade, students identified the attributes of circles: center, radius, circumference and diameter (3-4.1). In sixth grade, students apply strategies and formulas with an approximation
of pi (3.14, 722 ) to find the circumference and area of a circle (6-5.2). They
also explain the relationships among pi, circumference, diameter, and radius (6-5.1). In eighth grade, students apply formulas to determine the exact (pi) circumference and area of a circle (8-5.4) Taxonomy Level Cognitive Dimension: Apply Knowledge Dimension: Procedural Key Concepts
• Pi (∏) Vocabulary:
• Circumference • Area • Diameter • Radius
Instructional Guidelines For this indicator, it is essential
for students to be able to:
• Distinguish between radius and diameter • Understand the concept of pi and different forms of approximations • Given real-world situation, determine when to use which formula

Measurement Sixth Grade
5
• Understand that area is square units and circumference is linear units • Substitute values into the formulas without simplifying • Set up the formulas when given a picture, a story problem or the
values (numbers with units) • Develop fluency in setting up formulas
For this indicator, it is not-essential
for students to be able to:
• Compute the value of the circumference and area without a calculator because students are not fluent in multiplication of decimals and fractions.
• Find the diameter or radius given the circumference or area • Calculate using irrational numbers
Student Misconceptions/Errors
• Students often confuse the concepts of diameter and radius. • Students often confuse when to use square units and linear units.
Instructional Resources
• Since sixth graders are only generating strategies to multiply and divide fractions and decimals, they do not have to compute the value of the circumference or area without a calculator. The emphasis is on students understanding how to set up the formulas.
• Students will need to review the concepts of pi, diameter, radius, and circumference learned in 6th
• Students should explore investigations to review conceptual knowledge of the formulas for circumference and area of circles.
grade.
• Students should set up formulas when given real world examples. Assessment Guidelines The objective of this indicator is apply, which is in the “apply procedural” cell of the Revised Taxonomy. Procedural knowledge is knowledge of specific steps or strategies that can be used to solve a problem or problem situation. Although the focus is to gain fluency with setting up circumference and area formulas, the learning progression should integrate strategies to enhance both conceptual and procedural knowledge. The learning progression to apply requires students to recall and understand the concepts of pi, diameter, radius, and circumference. Students explore a variety of situations that involve both computational and application problems. Students analyze these situations to determine which formula is appropriate based on the given information. They explain and justify their answers using correct and clearly written or spoken words (6-1.6) and check
the reasonableness of their solutions.

Measurement Sixth Grade
6
Standard 6-5: The student will demonstrate through the mathematical processes an understanding of surface area; the perimeter and area of irregular shapes; the relationships among the circumference, diameter, and radius of a circle; the use of proportions to determine unit rates; and the use of scale to determine distance. Indicator 6-5.3 Generate strategies to determine the surface area of a rectangular prism and a cylinder Continuum of Knowledge In fourth grade, students analyzed the relationship between three-dimensional geometric shapes in the form of cubes, rectangular prisms, and cylinders, and their two-dimensional nets (4-4.2) In sixth grade, students will generate strategies to determine the surface area of a rectangular prism and a cylinder (6-5.3). This is the first time students are exposed to the concept of surface area. In seventh grade, students apply formulas to determine the surface area and volume of prisms, pyramids and cylinders (7-5.2). Taxonomy Level Cognitive Dimension: Create Knowledge Dimension: Conceptual Key Concepts
• Surface Area Vocabulary:
• Rectangular Prism • Cylinder
Instructional Guidelines For this indicator, it is essential
for students to be able to:
• Recall area of rectangles, squares and circles • Recall and understand the concept of nets • Fluent computation with whole numbers (only)
For this indicator, it is not essential
for students to be able to:

Measurement Sixth Grade
7
• Gain computational fluency with calculate the surface area • Use side lengths other than whole numbers
Student Misconceptions/Errors
• Students usually confuse area and perimeter, as well as, the units for these calculations.
• When given picture models of rectangular prisms, student find it
difficult to match up dimensions for the areas of each side. Instructional Resources Exploring the concepts of surface area is easier when students have concrete models but it is important for them to transfer that understanding to pictorial models. When given a concrete model, have student label corresponding sides as A’s, B’s and C’s. They know that they are always two A sides, two B sides and two C sides. When given the pictorial model have them label sides in the same manner. The big difference is that they can see the other sides but know they exist. Assessment Guidelines The objective of this indicator is to generate, which is in the “create conceptual” knowledge cell of the Revised Taxonomy. To create is to reorganize elements (areas of square, circles and rectangles) into a new pattern or structure (surface area). The learning progression to generate requires the students to recall the formulas for area of squares, rectangles and circles. They understand that the surface area is the sum of the areas of all faces. As students explore the concept of surface area, they should generate conjectures (6-1.2) and exchange mathematical ideas with classmates. They evaluate those conjectures and pose questions for further understanding (6-1.2). Students use correct and clearly written or spoken words to explain their reasoning for their answers (6-1.6). By using deductive reasoning (specific to general), students generalize
mathematical statements (6-1.5) about surface area and how to find it.

Measurement Sixth Grade
8
Standard: The student will demonstrate through the mathematical processes an understanding of surface area; the perimeter and area of irregular shapes; the relationships among the circumference, diameter, and radius of a circle; the use of proportions to determine unit rates; and the use of scale to determine distance. Indicator 6-5.4 Apply strategies and procedures to estimate the perimeters and areas of irregular shapes Continuum of Knowledge In fifth grade, students applied formulas to determine the perimeters and areas of triangles, rectangles, and parallelograms (5-5.4). In sixth grade, students apply strategies and procedures to find perimeters and areas of irregular shapes (6-5.5). Seventh grade students will generate strategies to determine the perimeters and areas of trapezoids (7-5.3). Taxonomy Level Cognitive Dimension: Apply Knowledge Dimension: Procedural Key Concepts
• Irregular Shapes Instructional Guidelines For this indicator, it is essential for students to
:
• Students need to recall formulas for area of squares, rectangles, triangles, and parallelograms.
• Know to subdivide using familiar shapes • Know how to calculate perimeter • Record final answer using correct units • Estimate perimeter and area using terms like at least, a little more,
about etc..

Measurement Sixth Grade
9
For this indicator, it is not essential
for students to:
• Irregular shapes should not include trapezoid and circles/semi-circles as a sub-divided piece.
• Calculate area with side lengths measured in rational numbers (fractions, decimals)
Student Misconceptions/Errors Students often confuse the correct form of the units on perimeter and area problems. For example, students place square units (cm2
) on perimeter answers and vice versa.
Instructional Resources The focus of the indicator is for students to use their knowledge of areas and perimeter of known shapes such as squares, rectangles, triangles, etc… to estimate the area of irregular shapes. These include combinations of polygons puddles, shoeprints, etc… For example, given the following irregular shapes, students would develop strategies and procedures for estimating the areas. Some students may overlay centimeter grid paper on top of the shape and then count squares. Others may draw squares, rectangles, and triangles within their shape and calculate the area of each polygon. Still others may compare their shape with other objects for which they know the exact dimensions and area. The key is for them to come up with the strategies.
Students can use the same idea with a shapes made up of polygons. The focus is on the estimation. Students will use formulas to compute the exact area and perimeter in Indicator 6-5.5. Assessment Guidelines The objective of this indicator is apply which is in the “apply procedural” cell of the Revised Taxonomy. Although the focus of the indicator is to apply, the learning progression should include opportunities for students to generate strategies for estimating the area and then apply it other shapes. The learning progression to apply requires students to recall and understand

Measurement Sixth Grade
10
formulas for the areas and perimeter of squares, rectangles, triangles, circles, etc.. Given an irregular shape, students generate ideas related to how they could estimate the area using their prior knowledge. They explore these strategies using a variety of examples. They explain and justify their strategy using correct and clearly written or spoken words (6-1.6). Students should generalize
mathematical statements (6-1.5) summarizing strategies used to estimate the area and perimeter of irregular shapes.

Measurement Sixth Grade
11
Standard 6-5: The student will demonstrate through the mathematical processes an understanding of surface area; the perimeter and area of irregular shapes; the relationships among the circumference, diameter, and radius of a circle; the use of proportions to determine unit rates; and the use of scale to determine distance. Indicator 6-5.5 Apply strategies and procedures of combining and subdividing to find the perimeters and areas of irregular shapes Continuum of Knowledge In fifth grade, students applied formulas to determine the perimeters and areas of triangles, rectangles, and parallelograms (5-5.4). In sixth grade, students apply strategies and procedures to find perimeters and areas of irregular shapes (6-5.5). Seventh grade students will generate strategies to determine the perimeters and areas of trapezoids (7-5.3). Taxonomy Level Cognitive Dimension: Apply Knowledge Dimension: Procedural Key Concepts
• Irregular Shapes (combining of polygons and other geometric shapes including circles)
Instructional Guidelines For this indicator, it is essential
for students to:
• Recall formulas for area of squares, rectangles, triangles, and parallelograms.
• Know how to subdivide a shape using familiar shapes • Know how to calculate perimeter • Record final answer using correct units • Calculate perimeter using whole and rational numbers.

Measurement Sixth Grade
12
For this indicator, it is not essential
for students to:
• Irregular shapes should not include trapezoid and circles/semi-circles as a sub-divided piece.
• Calculate area with side lengths measured in rational numbers (fractions, decimals)
Student Misconceptions/Errors Students often confuse the correct form of the units on perimeter and area problems. For example, students place square units (cm2
) on perimeter answers and vice versa.
Manipulatives may be useful as students try to visualize how the shapes are subdivided and combined.
Instructional Resources The focus of this indicator is to find the exact area (not estimated) of irregular shapes. Students should explore real world examples as well such as pools, gardens, fences, etc…. These examples do not include puddle, shoeprints, etc.. Assessment Guidelines The objective of this indicator is apply which is in the “apply procedural” cell of the Revised Taxonomy. The focus of the indicator is to apply; therefore, students should gain computational fluency with finding perimeter and area of irregular shapes. The learning progression to apply requires students to recall and understand formulas for the areas and perimeter of squares, rectangles, triangles, circles, etc.. Given an irregular shape, students explore how the shapes can be divided or combined using manipulatives, where appropriate. They develop strategies for computing the area and perimeter. They explain and justify their strategy and their answers using correct and clearly written or spoken words (6-1.6). Students engage
in repeated practice to support retention and understanding of their strategy.
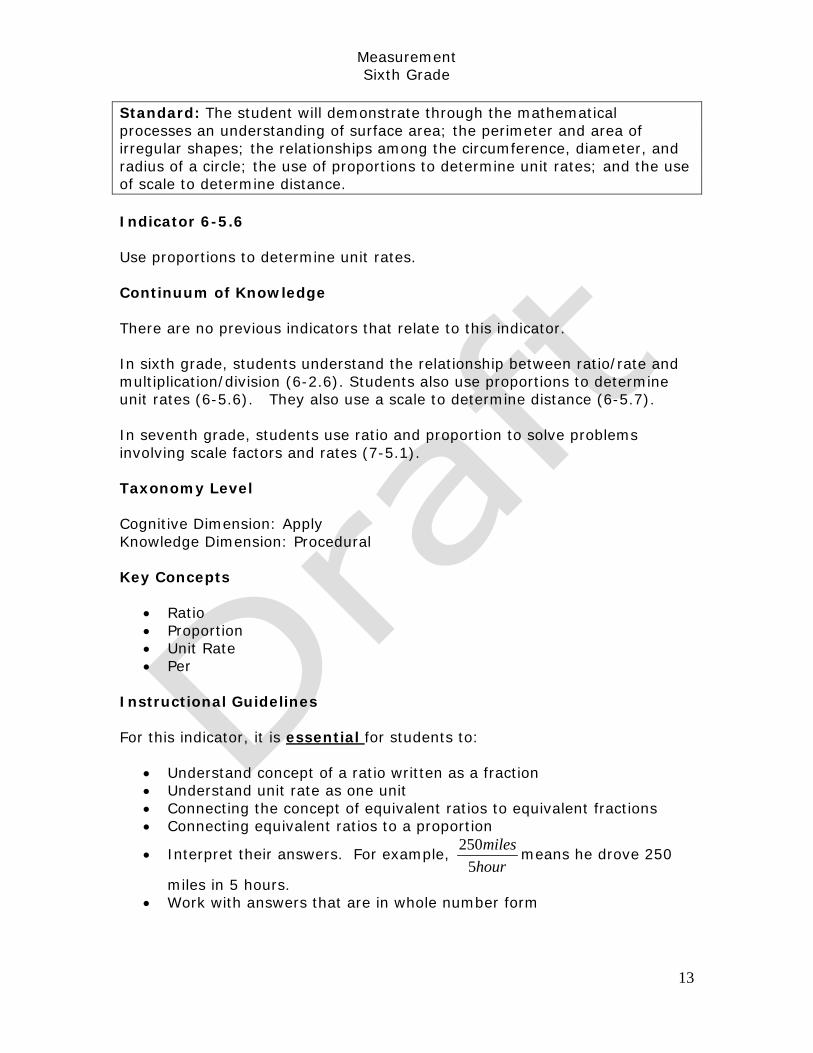
Measurement Sixth Grade
13
Standard: The student will demonstrate through the mathematical processes an understanding of surface area; the perimeter and area of irregular shapes; the relationships among the circumference, diameter, and radius of a circle; the use of proportions to determine unit rates; and the use of scale to determine distance. Indicator 6-5.6 Use proportions to determine unit rates. Continuum of Knowledge There are no previous indicators that relate to this indicator. In sixth grade, students understand the relationship between ratio/rate and multiplication/division (6-2.6). Students also use proportions to determine unit rates (6-5.6). They also use a scale to determine distance (6-5.7). In seventh grade, students use ratio and proportion to solve problems involving scale factors and rates (7-5.1). Taxonomy Level Cognitive Dimension: Apply Knowledge Dimension: Procedural Key Concepts
• Ratio • Proportion • Unit Rate • Per
Instructional Guidelines For this indicator, it is essential
for students to:
• Understand concept of a ratio written as a fraction • Understand unit rate as one unit • Connecting the concept of equivalent ratios to equivalent fractions • Connecting equivalent ratios to a proportion
• Interpret their answers. For example, hourmiles
5250 means he drove 250
miles in 5 hours. • Work with answers that are in whole number form

Measurement Sixth Grade
14
For this indicator, it is not essential for students to:
• Use the Cross-Products Property to solve proportions. • Work with answers that are in decimal or fractional form
Student Misconceptions/Errors Students may invert the units when setting up their ratio Instructional Resources and Strategies
• Use real world examples, such as: miles per hour, beats per minute, miles per gallon, cost/lb., etc. Use grocery store ads to comparison shop (Who has the best deal?).
• Teaching Student-Centered Mathematics Volume 3 Grades 5-8
, Van de Walle, pp. 169 – 176
• When using proportions to determine unit rates, students should determine the rate for one
unit. For example, if it takes George 2 hours to drive 230 miles, how far can he drive in 1 hour?
Assessment Guidelines The objective of this indicator is use, which is in the “apply procedural” cell of the Revised Bloom’s Taxonomy. Procedural knowledge is knowledge of specific steps or strategies that can be used to solve a problem or problem situation. Although the focus is to gain computational fluency with problems involving the use of proportions to solve problems with and rates, the learning progression should integrate strategies to enhance both conceptual and procedural knowledge. The learning progression to use requires students recall the definition of ratio and proportion and how to use proportions (equivalent ratios) to solve simple problems involving unit rates. Students should be given a variety of situations that involve rates and be able to generalize connections among real-world situations (6-1.7). Then students use correct and clearly written or spoken words (6-1.6) to explain
their reasoning.

Measurement Sixth Grade
15
Standard 6-5: The student will demonstrate through the mathematical processes an understanding of surface area; the perimeter and area of irregular shapes; the relationships among the circumference, diameter, and radius of a circle; the use of proportions to determine unit rates; and the use of scale to determine distance. Indicator 6-5.7 Use a scale to determine distance Continuum of Knowledge There are no previous indicators that relate to this indicator. In sixth grade, students understand the relationship between ratio/rate and multiplication/division (6-2.6). Students also use proportions to determine unit rates (6-5.6). They also use a scale to determine distance (6-5.7). In seventh grade, students use ratio and proportion to solve problems involving scale factors and rates (7-5.1). Taxonomy Level Cognitive Dimension: Apply Knowledge Dimension: Procedural Instructional Guidelines For this indicator, it is essential
for students to:
• Understand the meaning of ratio • Understanding the meaning of proportion • Set up a ratio • Set up a proportion • Read a scale on a map • Understand the meaning of the scale • Work with answers that are in whole number form • Use an appropriate strategy to solve the proportion
For this indicator, it is not essential
for students to:
None noted Student Misconceptions/Errors Students may invert the units when setting up their ratio.

Measurement Sixth Grade
16
Instructional Resources and Strategies None noted Assessment Guidelines The objective of this indicator is use, which is in the “apply procedural” cell of the Revised Bloom’s Taxonomy. Procedural knowledge is knowledge of specific steps or strategies that can be used to solve a problem or problem situation. Although the focus is to gain computational fluency with problems involving the use of proportions to solve problems with and rates, the learning progression should integrate strategies to enhance both conceptual and procedural knowledge. The learning progression to use requires students recall the definition of ratio and proportion and how to use proportions (equivalent ratios) to solve simple problems involving unit rates. Students should be given a variety of situations that involve scale factors and rates and be able to generalize connections among real-world situations (6-1.7). Then students should use correct and clearly written or spoken words (6-1.6) to explain
their reasoning.

Data Analysis and Probability Sixth Grade
1
Standard 6-6: The student will demonstrate through the mathematical processes an understanding of the relationships within one population or sample.
Indicator 6-6.1
Predict the characteristics of one population based on the analysis of sample data.
Continuum of Knowledge
In third grade students analyzed dot plots and bar graphs to make predictions about populations (3-6.4).
In sixth grade, students predict the characteristics of one population based on the analysis of sample data (6-6.1). In seventh grade, students predict the characteristics of two populations based on the analysis of sample data (7-6.1).
Taxonomy Level
Cognitive Dimension: Understand Knowledge Dimension: Conceptual Key Concepts
• Predict Vocabulary
• Population • Data • Sample • Graphic Organizer • Outliers
Instructional Guidelines For this indicator, it is essential
for students to:
• Make predictions from data from varying formats. • Translate data to a graph or a picture • Understand that the prediction from the sample data is an estimation for the
population • Make predictions based on the shape of the data (central tendency, spread
of the data and outliers) • Observe trends in the data • Justify their predictions using mathematical reasoning

Data Analysis and Probability Sixth Grade
2
• Use terms like most, between, at least etc… to describe characteristics. For this indicator, it is not essential
for students to:
• Analyze data by comparing two data sets to each other. Student Misconceptions/Errors
• Students may assume that they are finding exact predictions when they are actually guessing.
Instructional Resources and Strategies
• Having students analyze real world data that is relevant to their lives, it is an excellent strategy to build conceptual understanding and engage students. For example, you or your students can collect data about what students eat for lunch and predict what that data may or may not mean for the entire 6th
grade population.
Assessment Guidelines The objective of this indicator is to predict, which is in the “understand conceptual” knowledge cell of the Revised Taxonomy. To predict means to draw logical conclusion from presented information. The learning progression to predict requires students analyze a set of data and generate conjectures about the population. They understand that it is sometimes difficult to do so from just analyzing the numbers. They translate their data to another form (graph or picture). They understand that each is a distinct symbolic form that represent the same relationship (6-1.4) and generalize connections (6-1.7) among these representational forms. They make observations about the shapes and proximity of the data in order to make reasonable predictions based on those observations. They use inductive and deductive reasoning (6-1.3). Students explore a variety of real world situations (6-1.7) and summarize
their predictions using correct and clearly written or spoken words to communicate their understanding (6-1.6).

Data Analysis and Probability Sixth Grade
3
Standard 6-6: The student will demonstrate through the mathematical processes an understanding of the relationships within one population or sample.
Indicator 6-6.2
Organize data in frequency tables, histograms, or stem-and-leaf plots as appropriate.
Continuum of Knowledge
In third grade, students organize data in tables, bar graphs, and dot plots (3-6.2). In fourth grade, students interpreted data in tables, line graph, bar graph an double bar graphs whose scale increment are greater than or equal to 1 (4-6.2).
In sixth grade, students should learn to organize data in frequency tables, histograms, and stem-and-leaf plots (6-6.2).
In seventh grade students will organize data in box plots and circle graphs (7-6.2).
Taxonomy Level
Cognitive Dimension: Analyze Knowledge Dimension: Conceptual Key Concepts
Vocabulary:
• Frequency table • Histogram • Stem-and-leaf plot • Data • Data analysis
Instructional Guidelines
For this indicator, it is essential
• Understand the advantages and disadvantages of each type of graph
for students to:
• Understand the most appropriate representation is based the questions that the data is supposed to answer
• Understand how to structure each type of graph • Organize data in order from least to greatest. • Determine equal intervals

Data Analysis and Probability Sixth Grade
4
For this indicator, it is not essential
• Analyze or make conclusions regarding the data given.
for students to:
• Do calculations of central tendency.
Student Misconceptions/Errors
• Students use histograms as bar graphs in general. In fact they are special bar graphs where bars are used to display numerical data that have been organized into equal intervals. The entire range is covered in the interval with no overlapping. This is why a student is told not to put spaces between the bars unless the data represents zero.
• Some students may question the width of their bars when they make the histogram. Students need to understand that the width needs to be the same for all bars since the bars represent the same interval length.
• Some students have trouble with the height of the bars and the vertical scale for the bars. It is a good point for students to look at the data that they have grouped together prior to graphing to see what would be the largest value overall. They could then use this to set their scale prior to actually graphing the bars.
• Technology may be used to help students focus on the graph and its message. Graphing calculators produce histograms without much difficulty. They allows for the size of the interval to be specified and easily changed.
• Students may forgot to put the data in numerical order when creating a stem and leaf plot.
Instructional Resources and Strategies
• This is the first time students are introduced to those forms of data representation. As a result, students will need sufficient experiences so that they are able to make a determination as to which form of representation is appropriate for different purposes.
• Connect data analysis with content outside mathematics – science and social studies guide students to the understanding that data analysis is a process that helps make sense of a situation. Opportunities will naturally arise in all subject areas. Use these opportunities to allow students to collect data related to what they are studying and represent the data in appropriate graphs.

Data Analysis and Probability Sixth Grade
5
Assessment Guidelines
The objective of this indicator is to organize which is in the “analyze conceptual” knowledge cell of the Revised Bloom’s Taxonomy. Conceptual knowledge is knowledge of interrelationships among basic elements (frequency tables, histograms and stem-and-leaf plots) within a larger structure (data analysis) that enable them to function together. The learning progression to organize requires students to understand the structure and purpose for each type of graph. Students compare each type of graph and discuss the data based on the advantages and disadvantages of each. To deepen conceptual understanding, students may generate questions that could be answered by the data display in each type of graph. They explain and justify
their answers using correct and clearly written or spoken words (6-1.6)

Data Analysis and Probability Sixth Grade
6
Standard 6-6: The student will demonstrate through the mathematical processes an understanding of the relationships within one population or sample.
Indicator 6-6.3
Analyze which measure of central tendency (mean, median, or mode) is the most appropriate for a given purpose.
Continuum of Knowledge
In fifth grade, students first applied procedures to calculate the measures of central tendency of mean, median, and mode (5-6.3).
In sixth grade, students analyze which measure of central tendency (mean, median, or mode) is the most appropriate for a given purpose (6-6.3).
In seventh grade, students apply procedures to calculate the interquartile range (7-6.3) and interpret the interquartile range for data (7-6.4). In eighth grade, students interpret graphic and tabular data representations by using range and the measures of central tendency (8-6.8).
Taxonomy Level
Cognitive Dimension: Analyze Knowledge Dimension: Procedural Key Concepts
• Data Vocabulary
• Sample • Population • Central tendency (mean, median, mode)
Instructional Guidelines For this indicator, it is essential
for students to:
• Compute each central tendency • Compare the central tendencies (advantages and disadvantages) • Determine how each measure of central tendency may influence conclusions • Understand that for sets of data with no very low or very high numbers,
mean works well.

Data Analysis and Probability Sixth Grade
7
• Understand that for sets of data with a couple of points much higher or lower than most of the others, median may be a good choice.
• Understand that for sets of data with many identical data points, mode may be a better description.
For this indicator, it is not essential
for students to:
• Determine range. Student Misconceptions/Errors
• It is a misconception that average is a single number which represents the idea of a typical
value when the average might be the value of the mean, median, or mode. Typically, students will choose mean as the average.
Instructional Resources and Strategies
• When to Use Mean, Median, or Mode Scale of Measurement Measure of Central Tendency
Nominal (categorical such as sex or race)
Mode
Ordinal (such as salary categories)
Median (sometimes mode)
Interval Symmetrical Data – mean
Skewed Data – median Ratio Symmetrical Data – mean
Skewed Data – median

Data Analysis and Probability Sixth Grade
8
Assessment Guidelines The objective of this indicator is to analyze, which is in the “analyze procedural” knowledge cell of the Revised Taxonomy. Analyze requires student to break material into its constituent parts and to determine how the parts relate to one another and to an overall structure or purpose. Procedural knowledge is tied to knowledge of criteria for determining when to use appropriate procedures or steps. The learning progression to analyze requires students to understand the differences between the mean, median and mode and how they compare to each other. Students should differentiate between varying situations where mean, median, or mode is the preferred measure of central tendency to use when describing data. Students determine which measure best represents the data with respect to the context in which it is presented. Although, student work with central tendency will be limited to relationships within one population or sample, they are exposed to problem situations with deconstructing (determining point of view) where bias or values influences the choice of central tendency in a sample or population. Students apply reasoning skills to evaluate their conjectures and pose questions to prove or disprove their conjectures (6 – 1.2) using correct and clearly written or spoken words (6–1.6) Students also use deductive reasoning to reach a conclusion from known facts (6-1.5)
.

Data Analysis and Probability Sixth Grade
9
Standard 6-6: The student will demonstrate through the mathematical processes an understanding of the relationships within one population or sample.
Indicator 6-6.4
Use theoretical probability to determine the sample space and probability for one- and two-stage events such as tree diagrams, models, lists, charts, and pictures.
Continuum of Knowledge
In grade five students were formally introduced to representing the probability of a single-stage event in words and fractions (5-6.5).
In sixth grade, students use theoretical probability to determine the sample space and probability for one- and two-stage events such as tree diagrams, models, lists, charts, and pictures (6-6.4). It should be noted that sixth grade is the first time students have been introduced to two-stage events.
In seventh grade, students apply procedures to calculate (7-6.5) and interpret (7-6.6) the probability for mutually exclusive simple and compound events. In eighth grade, they apply procedures to calculate (8-6.5) and interpret (8-6.6) probability for two dependent events.
Taxonomy Level
Cognitive Dimension: Apply Knowledge Dimension: Procedural Key Concepts
• Probability • Sample Space • Theoretical probability • Outcome • Combinations • Event • Compound event
Instructional Guidelines
For this indicator, it is essential
• Understand the concept of theoretical probability
for students to:
• Multiply fractions for the probabilities of two-stage events. • Construct tree diagrams, lists, models, charts and picture as appropriate

Data Analysis and Probability Sixth Grade
10
• Interpret probability notation. For example: P(blue,green) • Understand which representation will be the most effective way to create the
sample space For this indicator, it is not essential
• Find the probability of events that are not depicted as tree diagrams, models, lists, charts, or pictures.
for students to:
Student Misconceptions/Errors
Students sometimes misinterpret the term sample space. It is a list of all
Many students have misconceptions about the outcomes of real events in life, basing predictions on what they
possible outcomes. An event is one of these outcomes.
believe should happen, rather than on real data
Students may struggle with words like “at least, or, and, etc…” For example, getting at least two head from a toss of four coins.
. Studying probability will help students develop critical thinking skills and interpret the probability of events that happen in their lives.
Instructional Resources and Strategies
• The intent of the indicator is for students to use tree diagrams, models, lists, charts, and pictures to determine the sample spacer and theoretical probability for one and two stage events.
• Provide compound events involving spinners, number cubes, coins, and sacks of color tiles or centimeter cubes with 2 to 5 single events in the compound event. Have students model and find the possible outcomes of the compound event.
• Have student pairs use color tiles or centimeter cubes to model and find combinations involving real-world situations, such as combinations of hats, gloves, and coats, or various menu items. Name items so that students can determine the number of choices, such as red, blue, and brown hats, or wool, fleece, and leather gloves.
• Theoretical probability is the ratio of the number of favorable outcomes to the total number of possible outcomes. For example, the theoretical probability of a coin landing on tails is
P(heads) = number of sides with tails number of sides 2
= 1.

Data Analysis and Probability Sixth Grade
11
Below is an activity that could be used to introduce a two stage event:
Introduce this problem: ”How many possible outcomes are there if Ted tosses two coins and draws a cube from a bag that contains 1 blue, 1 green and 1 red centimeter cube? Distribute two-color counters, centimeter cubes and bags. Explain that an event is the result or outcome of an experiment, such as tails on a coin toss, and that a compound event is two or more events combined.
• Ask: How many outcomes are possible when you toss a coin? Guide the students to see that there are two possible outcomes since a coin has two different sides. Have the students record the number.
• Ask: How many outcomes are possible for drawing a cube from the bag? Guide students to see that there are three possible outcomes since there are three different cubes. Have students record the number.
• Have students build a tree diagram to show the possible outcomes for the compound event. Students model the possible outcomes of the first coin toss: red and yellow. For each of these, students model the possible outcomes of the second coin toss. Students complete the tree by modeling the possible outcomes of drawing a cube from the bag: blue, green, and red.
• Guide students to find the number of possible outcomes of the compound event by multiplying the numbers for the simple events: 2 x 2 3. Using the tree, have students verify their answer by counting the number of possible paths from left to right. Each path represents an outcome. Ask: How many paths did you find? What is the probability of each event happening?
Assessment Guidelines
The objective of this indicator is to use which is in the “apply procedural” knowledge cell of the Revised Taxonomy. Although the focus of the indicator is to use, the learning progression should integrate experience that build the student’s conceptual understanding of theoretical probability as well computational fluency with constructing representation of sample space. The learning progression to use requires students to understand the meaning of sample space and an event. Given an event, students make and justify a prediction of the probability of the event. Students evaluate their conjectures (6-1.2) by creating the sample space (the set of all possible outcomes) for one-and two- stage events and making decisions about what form of representation is best for the situation. Students develop probability-based thinking by performing actual experiments, recording and discussing the results and using the results as evidence for drawing conclusions. They use
correct and clearly written or spoken words to communicate their understanding (6-1.6).

Data Analysis and Probability Sixth Grade
12
Standard 6-6: The student will demonstrate through the mathematical processes an understanding of the relationships within one population or sample.
Indicator 6-6.5
Apply procedures to calculate the probability of complementary events.
Continuum of Knowledge
In fifth grade, students represented the probability of a single stage event as a fraction and in words (5-6.5) and concluded why the probabilities of the outcomes of an experiment must equal one. (5-6.6)
In sixth grade, student apply procedures to calculate the probability of complementary events (6-6.5). This is the first time that students are introduced to the concept of complementary events.
In seventh grade, students apply procedures to calculate (7-6.5) and interpret (7-6.6) the probability of mutually exclusive events as well as compound events. In eighth grade students will apply procedures to calculate (8-6.5) and interpret (8-6.6) the probability of dependent events.
Taxonomy Level
Cognitive Dimension: Apply Knowledge Dimension: Procedural Key Concepts
• Probability Vocabulary
• Complementary Events • Complement • Population • Sample • Sample space • Possible outcomes
Instructional Guidelines For this indicator, it is essential
for students to:
• Understanding the meaning of complementary events

Data Analysis and Probability Sixth Grade
13
• Generate the complementary event when given a simple event. For example, if the simple event is rolling an even number, students should state that the complementary event is rolling an odd number.
• Find the probabilities of a simple event and its complement • Find the probability of the complement given the probability of the simple
event. For example, if the probability that a child speaks Spanish is 7/20 then what is the probability that a child does not speak Spanish. 1 -
• Interpret probability notation. Ex. P(head or tails) when tossing a coin. • Understand that the word “or” in probability notation indicates addition. • Add and subtract fractions with like denominators when determining
probability of the complements of events. • Understand that the sum of the probabilities of all the outcomes in a sample
space is 1; therefore, the sum of the complementary events is 1. For this indicator, it is not essential
for students to:
• Use the word “mutually exclusive.” (7th
grade)
Student Misconceptions/Errors
• Students may tend to misinterpret problem situations involving the use of the word “NOT” when determining the probability of the complement of an event.
Instructional Resources and Strategies
• Students should relate the terminology “sample space” to “possible outcomes”.
• Modeling with manipulatives should to be utilized in order for students to develop a mental picture of the reasoning behind the use of addition or subtraction when encountering the use of the word “or” as applied to calculating the probability of complementary events.
• Students should develop probability-based thinking by performing actual experiments, recording and discussing the results and using the results as evidence for drawing conclusions and making decisions. Such activities help students understand relationships among the available data and enable students to make decisions about what form of representation is best for the situation.
• Modeling with concrete objects such as spinners, cards, or marbles in a bag needs to be done in order for the students to develop a mental picture of the probabilities of complementary events.

Data Analysis and Probability Sixth Grade
14
Assessment Guidelines The objective of this indicator is to apply which is in the “apply procedural” knowledge cell of the Revised Taxonomy. To apply is means to carry out a procedure on a familiar task or use a procedural with an unfamiliar task; therefore, student’s experiences should extend beyond familiar tasks such as cards, dice and coins. The learning progression to apply requires students to understand the meaning of complementary events and sample space. Students generate examples of complementary events to demonstrate understanding of the concept. They use their understanding of the relationship between complementary events to find the probability of one of the simple events. They explain and justify
their answers using correct and clearly spoken words and notation (6-1.6).