stanbic uganda holdings limited 2021 half year results
TRANSCRIPT

@stanbicug
WHAT INTERVENTIONS HAS STANBIC EXTENDED TO SUPPORT ECONOMIC RECOVERY AND COMMUNITIES?
During the period under review, we extended a number of interventions including:
Enterprise Economic Restart fund (EERF): As a measure to also support the worst hit sectors which include; urban trading, tourism, transport, export-oriented agriculture, SME’s as well as Savings and Credit Cooperative Organizations (SACCOs) and Village Savings and Loans Associations (VSLAs), Stanbic created the EERF to raise UGX 350 billion ($100 million) to provide low-cost financing that will enable their recovery from the impact of the Covid-19 pandemic.
Provision of affordable financing: Stanbic also launched a new value proposition aimed at revitalizing the operations for SACCO’s and VSLA’s across Uganda. The bank has so far provided UGX 5.1 billion in financing that is reaching over 261,497 members.
Corporate Social investments: Stanbic has invested over UGX 2.1 billion into CSI community initiatives. We made tangible
remained resilient managing to post a good performance in this first half while implementing a robust strategy to support economic recovery.
Customer deposits increased by 9.5% from UGX 5.2 trillion in June 2020 to UGX 5.7 trillion in June 2021. We saw significant growth in our Small and Medium Sized Enterprises (SME) segment as we continue to support small business through this challenging period. We also continued to finance the private sector through the pandemic which saw loans and advances growing by 9.8% to UGX 3.8 trillion from UGX 3.4 trillion in June 2020.
The consolidated profit after tax during the period was UGX 154.9 billion, representing a 21.5% growth above a similar period in 2020.
This increase was supported by growth in our trading revenue recorded at UGX 37.5 billion compared to a similar period in 2020; better management of our impairment charge for credit losses, which reduced by UGX 11.7billion as compared to 2020.
We continued to provide credit relief solutions to support our clients to withstand the COVID-19 tough economic environment. Overall, the Bank remains well capitalized to continue supporting clients’ needs and revive economic activity.
ANDREW MASHANDA CHIEF EXECUTIVE, STANBIC
UGANDA HOLDINGS LIMITED
contributions to education through the National Schools Championship programme reaching over 60,000 students; promoted better access to Health Care through the Maternal Health drive; and Joined the fight against COVID 19 with a donation of over UGX 200 million to the Ministry of Health.
Caring for our people: We continued to provide necessary support to protect our staff and their wellbeing. Our people are the heart of our organisation, and our aim is to ensure that during this period they are provided the required health care support and counsel.
LOOKING AHEAD, WHAT SHOULD CUSTOMERS AND THE STAKEHOLDERS EXPECT OVER THE NEXT 6 MONTHS?
Our priority for the next half is to focus on investing in technology and digital solutions to enhance our service offerings and customer experience. We shall also focus on continuously managing our risks across all areas of operations to ensure business continuity and implement the Social, Economic and Environmental (SEE) priorities as a true testament to our purpose, Uganda is our Home and we drive her growth.
UGX 5.7 trillion
CUSTOMER
DEPOSITS
9.5%
UGX 154.9billion
NET PROFITS
21.5%14.4%
UGX8.8trillion
TOTALASSETS
UGX3.8 trillion
CUSTOMER LOAN BOOK
9.8% 5.6%
UGX 2.1 billion
CSI INVESTMENT
STANBIC UGANDA HOLDINGS LIMITED
2021 HALF YEAR RESULTS
The first six months of 2021 have been quite challenging for us as a nation with the second wave of Covid 19. Businesses and individuals have felt the impact of the pandemic and as an institution we have done everything we can to support our customers, our staff and communities through this challenging period. We continue to appreciate the great efforts and sacrifices being made by the frontline workers, who have continued to put themselves forward to save and preserve lives.
Despite the attendant challenges, Stanbic waded through and posted a resilient
HOW HAS STANBIC PERFORMED DURING THIS PERIOD CONSIDERING THE CHALLENGING ECONOMIC ENVIRONMENT?
The first half of 2021 was rather challenging given the tough macro-economic environment especially as the nation continues to battle the impact of the COVID-19 pandemic. Despite that, Stanbic
ANNE JUUKOCHIEF EXECUTIVE, STANBIC
BANK UGANDA LIMITED
performance with good growth across all key perfomance indicators. Our Return On Equity stood at 23.2% up 1.6% year on year. This strong performance was led by our anchor and largest subsidiary Stanbic Bank Uganda limited (SBUL). The detailed commentary on the performance and the drivers will be shared by Ms. Anne Juuko, CE of SBUL.
During the same period, we also celebrated the first anniversary of some of our new subsidiaries – Stanbic Properties Limited and Stanbic Business Incubator Limited.
The younger subsidiaries, FlyHUB and SBG securities were also opened, and continued to operate whilst putting in place the appropriate structure to enable them to begin delivering on their mandate. I am happy to report that despite the challenging operating environment, some of these new subsidiaries have started delivering profits in their first year of existence.
As we continue to evolve and strengthen our position, I believe we will deliver on our promise of enhancing the value of offerings to all our stakeholders.
The 2021 financial results presented in this publication detail the performance of Stanbic Uganda Holdings Limited (SUHL) to which Stanbic Bank Uganda Limited (SBU) is a subsidiary.
9.1%

UGX 5.1 BILLION IN AFFORDABLE FINANCE PROVIDED TO SACCO’S.Stanbic launched a new value proposition aimed at revitalizing the operations for Savings and Credit Cooperative Organizations (SACCOs) and Village Savings and Loans Associations (VSLAs) across Uganda. Farmers can access affordable finance at subsidised rates. UGX 5.1bn has so far been provided, reaching over 261,497 members.
REINVENTING EDUCATION THROUGH STANBIC NATIONAL SCHOOLS.The National Schools programme in underway with 100 schools, 400 teachers and 60,000 students reached. The programmes promotes education through creativity and business innovation. Over 1000 + business ideas generated.
PICTURE: Students from Busoga High School showcase their organic “Feed the Earth” pesticide during the regional business plan presentations.
SUPPORTING UGANDA’S ECONOMIC RECOVERY AND TRANSFORMING LIVES.
STANBIC DONATED UGX 200 MILLION TOWARDS EFFORTS TO THE FIGHT COVID-19. The donation comprised of PPE items that were provided to the Ministry of Health and oxygen cylinders that were distributed to hospitals around the country
PICTURE: Permanent Secretary MOH Dr. Diana Atwiine, Stanbic Bank ED Emma Mugisha and CSI Manager Barbara Kasekende.
This section highlights our key initiatives in the first half of 2021:
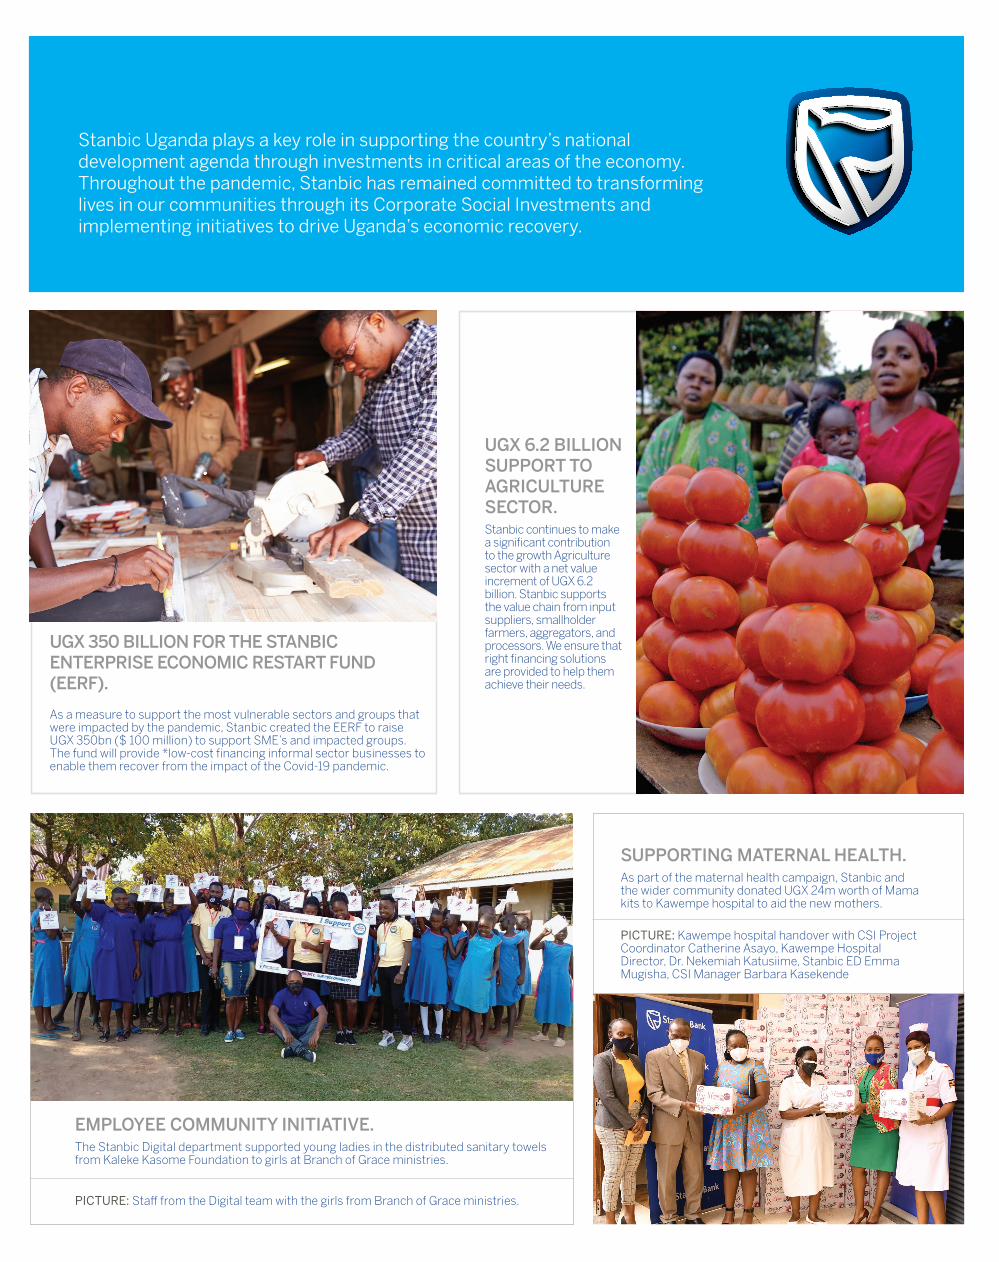
UGX 350 BILLION FOR THE STANBIC ENTERPRISE ECONOMIC RESTART FUND (EERF).
As a measure to support the most vulnerable sectors and groups that were impacted by the pandemic, Stanbic created the EERF to raise UGX 350bn ($ 100 million) to support SME’s and impacted groups. The fund will provide *low-cost financing informal sector businesses to enable them recover from the impact of the Covid-19 pandemic.
Stanbic Uganda plays a key role in supporting the country’s national development agenda through investments in critical areas of the economy. Throughout the pandemic, Stanbic has remained committed to transforming lives in our communities through its Corporate Social Investments and implementing initiatives to drive Uganda’s economic recovery.
UGX 6.2 BILLION SUPPORT TO AGRICULTURE SECTOR. Stanbic continues to make a significant contribution to the growth Agriculture sector with a net value increment of UGX 6.2 billion. Stanbic supports the value chain from input suppliers, smallholder farmers, aggregators, and processors. We ensure that right financing solutions are provided to help them achieve their needs.
SUPPORTING MATERNAL HEALTH. As part of the maternal health campaign, Stanbic and the wider community donated UGX 24m worth of Mama kits to Kawempe hospital to aid the new mothers.
PICTURE: Kawempe hospital handover with CSI Project Coordinator Catherine Asayo, Kawempe Hospital Director, Dr. Nekemiah Katusiime, Stanbic ED Emma Mugisha, CSI Manager Barbara Kasekende
EMPLOYEE COMMUNITY INITIATIVE. The Stanbic Digital department supported young ladies in the distributed sanitary towels from Kaleke Kasome Foundation to girls at Branch of Grace ministries.
PICTURE: Staff from the Digital team with the girls from Branch of Grace ministries.

3. SUMMARY STATEMENT OF FINANCIAL POSITION
Unaudited six months as at 30 June 2021
Unaudited six months as at
30 June 2020 Audited as at 31 Dec 2020
Shs’ 000 Shs’ 000 Shs’ 000
Assets
Cash & balances with Bank of Uganda 748,266,906 848,762,269 1,155,333,607
Derivative assets 110,746,432 152,849,924 160,917,126
Trading assets 1,777,876,889 933,245,647 1,101,949,038
Pledged assets 3,104,889 - 460,527,242
Financial investments 790,574,925 884,364,707 721,772,782
Current income tax recoverable - 16,327,106 5,066,711
Loans and advances to banks 1,093,383,418 774,330,271 683,929,488
Amounts due from group companies 35,405,642 223,614,700 354,851,856
Loans and advances to customers 3,755,053,247 3,419,447,301 3,618,353,321
Other assets 241,702,009 202,227,200 96,788,730
Property, equipment & right of use assets 69,764,651 90,540,512 81,417,930
Goodwill and other intangible assets 86,254,536 90,942,856 93,447,576
Deferred tax asset 48,255,872 23,121,945 44,542,719
Total assets 8,760,389,416 7,659,774,438 8,578,898,126
Shareholders' equity and liabilities
Shareholder's equity
Ordinary share capital 51,188,670 51,188,670 51,188,670
Fair value through OCI reserve 22,261,191 4,294,302 (2,513,543)
Retained earnings 1,254,616,109 1,080,523,120 1,099,764,261
Proposed dividend 95,000,000 110,000,000 95,000,000
Total shareholders equity 1,423,065,970 1,246,006,092 1,243,439,388
Liabilities
Derivative liabilities 229,223,438 25,998,367 229,733,411
Deposits from customers 5,702,858,371 5,207,225,721 5,493,479,534
Deposits from Banks 455,694,287 93,290,277 785,477,443
Amounts due to group companies 278,915,751 493,652,343 351,607,479
Borrowed funds 55,349,483 29,843,056 43,346,567
Subordinated bonds/debt 71,193,018 74,595,837 73,022,525
Other liabilities 536,720,431 489,162,745 358,791,779
Current tax liabilities 7,368,667 - -
Total liabilities 7,337,323,446 6,413,768,346 7,335,458,738
Total equity and liabilities 8,760,389,416 7,659,774,438 8,578,898,126
4. SUMMARY STATEMENT OF CHANGES IN EQUITY
Year ended 31 December 2020
Share capital Fair value through OCI
reserve
Statutory credit risk reserve
Proposed dividends
Retained earnings
Total
Shs’ 000 Shs’ 000 Shs’ 000 Shs’ 000 Shs’ 000 Shs’ 000
Balance as at 1 January 2020 51,188,670
2,599,829 8,466,533 110,000,000 944,611,403
1,116,866,435 Profit for the year - - - 241,686,325 241,686,325 Other comprehensive (loss)/income after tax for the year - (5,113,372) - - - (5,113,372)Transactions with owners recorded directly in equity Dividends paid - - - (110,000,000) - (110,000,000)Statutory credit risk reserve - (8,466,533) - 8,466,533 - Proposed dividends - - - 95,000,000 (95,000,000) - Balance at 31 December 2020 51,188,670 (2,513,543) - 95,000,000 1,099,764,261 1,243,439,388
Unaudited six months to 30 June 2021
Unaudited six months to 30 June 2020
Audited year ended
31 Dec 2020
Shs’ 000 Shs’ 000 Shs’ 000
Interest and similar income 269,489,776 269,542,028 536,233,586
Interest expense and similar charges (23,436,142) (20,238,584) (45,441,437)
Net interest income 246,053,634 249,303,444 490,792,149
Fee and commission income 87,434,955 78,266,780 165,731,160
Fee and commission expenses (4,658,686) (4,197,774) (8,449,791)
Net Fees and commission income 82,776,269 74,069,006 157,281,369
Net trading income 131,610,333 94,155,392 177,344,278
Other gains and losses on financial instruments 504,237 (143,995) (132,234)
Other operating income 4,046,335 4,600,429 6,104,594
Total operating income 464,990,808 421,984,276 831,390,156
Impairment charge for credit losses (27,344,854) (39,081,640) (91,734,105)
Total income after credit impairment charge 437,645,954 382,902,636 739,656,051
Employee benefit expenses (87,338,366) (85,711,178) (169,512,134)
Depreciation and amortisation (24,282,966) (24,197,303) (48,424,389)
Other operating expenses (122,871,416) (103,807,919) (203,106,739)
Profit before income tax 203,153,206 169,186,236 318,612,789
Income tax expense (48,301,360) (41,741,052) (76,926,464)
Profit after tax 154,851,846 127,445,184 241,686,325
Earnings per share Basic & diluted** 6.05 4.97 4.72
1. SUMMARY INCOME STATEMENT
*Half year position has been annualised
2. SUMMARY STATEMENT OF COMPREHENSIVE INCOME
Unaudited six months to 30 June 2021
Unaudited six months to 30 June 2020
Audited year ended
31 Dec 2020
Shs' 000 Shs' 000 Shs' 000
Profit for the period: 154,851,846 127,445,184 241,686,325
Other comprehensive income for the year after tax:
Items that may be suseqclassified to profit and loss
Net change in debt financial assets measured at fair value through other comprehensive income (OCI) - IFRS
24,774,734 1,694,473 (5,113,372)
Total comprehensive income for the period 179,626,580 129,139,657 236,572,953
The Interim financial statements were approved by the Board of Directors on 4 August 2021. A copy of the summarised unaudited Financial statements can be obtained on our web site www.stanbic.co.ug
Andrew MashandaChief Executive
Samuel ZimbeDirector
Ritah KabatunziCompany Secretary
STANBIC UGANDA HOLDINGS LIMITEDSUMMARISED UNAUDITED FINANCIAL STATEMENTSFOR THE PERIOD ENDED 30 JUNE 2021
Japheth KattoChairman

5. SUMMARY STATEMENT OF CASHFLOWS
Unaudited six months to 30 June 2021
Unaudited six months to 30 June 2020
Audited year ended
31 Dec 2020 Shs' 000 Shs' 000 Shs' 000
Cash flows from operating activities
Interest received 282,933,745 275,169,474 514,409,124 Interest paid (23,360,286) (20,663,749) (46,511,654)Net fees and commissions received 81,056,676 78,296,889 162,228,254 Net trading and other Income/recoveries 140,940,888 103,249,252 192,349,594 Cash payment to employees & suppliers (205,765,853) (199,362,004) (389,839,999)Cash flows from operating activities before changes in operating assets and liabilities 275,805,170 236,689,862 432,635,319
Changes in operating assets and liabilities
Income tax paid (50,199,642) (48,991,319) (91,394,617)Decrease/(increase) in derivative assets 50,170,694 (83,571,695) (78,419,817)Decrease/(increase) in financial investments 73,116,536 (108,891,817) 277,021,578 Increase in trading assets (218,505,498) (320,694,541) (841,973,214)Decrease/(increase ) in cash reserve requirement 15,470,000 (53,040,000) (81,630,000)Increase in loans and advances to customers (182,535,047) (614,898,648) (842,235,712)Increase in other assets (143,193,686) (153,814,731) (49,095,263)Increase in customer deposits 209,302,981 485,447,316 772,346,181 (Decrease) /increase in deposits and balances due to other banks (329,783,156) (108,409,521) 583,777,645 (Decrease)/increase in deposits from group companies (72,691,728) 359,925,914 319,687,129 (Decrease)/increase in derivative liabilities (509,973) 1,828,314 103,757,279 Increase in other liabilities 173,738,311 129,840,405 5,933,466
Net cash outflows from operating activities (199,815,038) (278,580,461) 510,409,974
Cash flows from investing activities Purchase of property & equipment (4,749,251) (20,722,189) (17,761,017)Purchase of computer software - (1,457,693) (11,081,968)Proceeds from sale of property & equipment 45,890 26,331 376,858
Net cash used in investing activities (4,703,361) (22,153,551) (28,466,127)
Cash flows from financing activities Principle lease payments (687,417) - (11,391,314)Dividends paid to shareholders - - (110,000,000)(Decrease)/increase in borrowed funds (1,829,507) 1,315,371 32,264,784 Increase in subordinated debt 12,002,916 18,761,273 (257,941)
Net cash flows used in financing activities 9,485,992 20,076,644 (89,384,471)
(Decrease)/increase in cash and cash equivalents during the year (195,032,407) (280,657,368) 392,559,376Cash and cash equivalents at beginning of the year 2,450,544,793 2,071,204,497 2,057,985,417
Cash and cash equivalents at the period ended 2,255,512,386 1,790,547,129 2,450,544,793
Share capital
Fair value through OCI
reserve Statutory credit
risk reserve Proposed dividends
Retained earnings Total
Six months ended 30 June 2020 Shs’ 000 Shs’ 000 Shs’ 000 Shs’ 000 Shs’ 000 Shs’ 000
At 1 January 2020 51,188,670 2,599,829 8,466,533 110,000,000 944,611,403 1,116,866,435
Net change in other comprehensive income - 1,694,473 - - - 1,694,473
Profit for the year - - - - 127,445,184 127,445,184
Transactions with owners recorded directly in equity -
Dividends paid - - - - - -
Statutory credit risk reserve - - (8,466,533) 8,466,533 -
Balance at 30 June 2020 51,188,670 4,294,302 - 110,000,000 1,080,523,120 1,246,006,092
Six months ended 30 June 2021
At 1 January 2021 51,188,670 (2,513,543) - 95,000,000 1,099,764,261 1,243,439,388
Net change in other comprehensive income 24,774,734 - - 24,774,734
Profit for the year - - - - 154,851,846 154,851,846
Transactions with owners recorded directly in equity - - - - - -
Dividends paid - - - - - -
Statutory credit risk reserve - - - - - - Balance at 30 June 2021 51,188,670 22,261,191 - 95,000,000 1,254,616,107 1,423,065,968
STANBIC UGANDA HOLDINGS LIMITEDSUMMARISED UNAUDITED FINANCIAL STATEMENTSFOR THE PERIOD ENDED 30 JUNE 2021
4. SUMMARY STATEMENT OF CHANGES IN EQUITY CONT’D

CAGR: Compounded Annual Growth Rate
KEY RATIOS H12021 H12020 H12019 H12018 H12017
PROFITABILITY 1
Return on Average Equity (ROE) a 23.2% 21.6% 27.6% 22.9% 27.7%
Return on Average Assets (ROA) b 3.6% 3.6% 4.7% 3.9% 4.1%
EFFICIENCY 2
Cost To Income (CTI) 50.4% 50.6% 50.5% 55.2% 54.5%
LIQUIDITY 3
Loan to Deposit Ratio (LDR) 65.8% 65.7% 69.4% 60.5% 62.1%
ASSET QUALITY 4
Credit Loss Ratio (CLR) - Customer a 1.5% 2.2% 1.0% 0.9% 1.4%
Non-Performing Loans (NPL) b 3.6% 4.4% 4.9% 5.9% 4.9%
CAPITAL 5
Capital Adequacy Ratio (C.A.R)
Core (Tier I) a 19.4% 18.5% 16.8% 15.4% 18.8%
Total (Tier I + Tier II) b 21.5% 20.9% 19.4% 18.2% 22.8%
1. NET LOANS AND ADVANCESLoans and advances grew by 9.8% to UGX 3.8 trillion from UGX 3.4 trillion in June 2020. The CAGR over the last 5 years is 17.0%.
2. DEPOSITS FROM CUSTOMERS Customer deposits increased by 9.5% from UGX 5.2 trillion in June 2020 to UGX 5.7 trillion in June 2021. The CAGR over the last 5 years is 15.3%.
3. TOTAL ASSETSTotal assets grew by 14.4% from UGX 7.7 trillion to UGX 8.8 trillion. The CAGR over the last 5 years is 16.4%.
4. SHARE HOLDERS EQUITY The Shareholder’s equity increased by 14.2% from UGX 1.2 trillion as at June 2020 to UGX 1.4 trillion as at June 2021. the CAGR over the past 5 years is 16.9%.
5. TOTAL INCOME (NIR/NII) Total income increased by UGX 43 billion, representing a 10.2% increase over the same period in 2020. Net Interest Income (NII) registered growth off the back of larger interest earning investments, while Non Interest Revenue (NIR) dropped due to business disruptions occasioned by the Covid-19 pandemic.
6. PROFIT AFTER TAX (PAT) Profits were up by 21.5% to close at UGX 154.9 billion largely driven by growth in revenues, efficient cost control and credit risk. The CAGR over the last 5 years is 12.9%.
7. OFF BALANCE SHEET Off Balance Sheet (Letters of Credit, Guarantees and Bonds) grew by 9.2% to UGX 1.92 trillion from UGX 1.76 trillion in June 2020. The CAGR over the last 5 years is 13.6%.
8. COSTSCosts rose by 9.7% from UGX 214 billion to UGX 234 billion.
STANBIC UGANDA HOLDINGS LIMITEDSUMMARISED UNAUDITED FINANCIAL STATEMENTSFOR THE PERIOD ENDED 30 JUNE 2021
KEY PERFOMANCE INDICATORS
180
160
140
120
100
80
60
40
20
02017 2018 2019 2020 2021
6 Months Profit After Tax
Ush
s's
bill
ion
s
95.4 96.1
134.0 127.4
154.9
CAGR12.9%
21.5%
1800
1600
1400
1200
1000
800
600
400
200
0
2017 2018 2019 2020 2021
Share holders equity
Ush
s's
bill
ion
s
761
837
999
1,246
1423
CAGR16.9%
14.2%
10000
8000
6000
4000
2000
02017 2018 2019 2020 2021
Total Assets
Ush
s's
bill
ion
s
4777 5130
6053
7,660
8760
CAGR16.4%
14.4%
6000
5000
4000
3000
2000
1000
02017 2018 2019 2020 2021
Customer Deposits
Ush
s's
bill
ion
s
3227
37504,114
5,207
5703
CAGR15.3%
9.5%
4000
3500
3000
2500
2000
1500
1000
500
02017 2018 2019 2020 2021
Net Loans and Advances
Ush
s's
bill
ion
s
2004
22682758
3419
3755
CAGR17.0%
9.8%
250
200
150
100
50
02017 2018 2019 2020 2021
Total costs
Ush
s's
bill
ion
s
171177
201214
234
CAGR8.2%
9.7%
2500
2000
1500
1000
500
02017 2018 2019 2020 2021
Off Balance sheet
Ush
s's
bill
ion
s
1150
1757
1906
1757
1918
CAGR13.6%
9.2%
2017 2018 2019 2020 2021
Total Income
Ush
s's
bill
ion
s
117 117
152
173
219
500
450
400
350
300
250
200
150
100
50
0
176
215169 249 246

UGX 2.1bnCSI
Investment
We continue to transform lives in communities through various interventions
promoting access to quality education, health care, environmental conservation and SME
capacity through the business incubator.
CSI
3,275Total number
of agents
As part out drive for greater financial inclusion, Stanbic has
signed on 3,275 authorised agents to o er banking services
to customers country wide.
AGENTS
22,494ShareHolders
Our participation as a listed company on the Uganda Stock Exchange is
critical as it creates the opportunity for Ugandans to own and be a part of
Stanbic and Uganda’s growth journey.
SHAREHOLDERS
UGX 490bnSupport to Agriculture
Sector
Stanbic continues to make a significant contribution to the
growth Agriculture sector.
AGRICULTURE
UGX 3.9tnTotal Loans
16mnTransactions
Executed
Total loans to clients spurring economic growth and activity across various
sectors.
LOANSThe bank handles a total volume
of 16 million transactions to facilitate economic activity
across the country.
TRANSACTIONS
UGX 350bnFunding to be lent
through the Stanbic Enterprise Economic Restart Fund (EERF)
As a measure to support the most vulnerable sectors and groups that were
impacted by the pandemic, Stanbic created the EERF that aims to create
funding of up to UGX 350 billion ($100 million) to SME’s and impacted sectors.
SME’s
89Companies
trained
89 Companies trained by the Stanbic Business Incubator to
promote capacity development of SMEs in Uganda.
STANBIC INCUBATOR
UGX 114bnTaxes paid by Stanbic
Total taxes paid by Stanbic and its employees placing
us among the top taxpayers in Uganda.
TAX PAID
1,682Employees
Stanbic is committed to creating employment opportunities for Ugandans and is currently the second largest employer in the
banking sector.
EMPLOYEES
UGX 5.1bnProvided to
SACCO’s and VSLA’s
Stanbic launched a new value proposition aimed at revitalizing the operations for Savings and Credit Cooperative Organizations (SACCOs) and Village Savings and Loans Associations (VSLAs) across Uganda. UGX 5.1 billion has so far been provided reaching and supporting over 261,497 members.
SACCO’s & VSLA’s
STANBIC UGANDA HOLDINGS LIMITED
OUR PASSION FOR THE NATION2021 SOCIAL ECONOMIC IMPACT
Stanbic plays a key role in supporting the country’s national development agenda and through its sustainability strategy contributes to the realization of key Sustainable Development Goals (SDG’s) in critical areas of the economy including; creation of employment opportunities for Ugandans, supporting development in key sectors, community investments, payments in taxes, URA collections, participation on the Uganda Stock Exchange and facilitating financial inclusion through our range of services to meet the needs and aspirations for all Ugandans.