stamp duties in indian states a case for reform · stamp duties in indian states a case for reform...
TRANSCRIPT

Stamp Duties in Indian States A Case for Reform
James Alm, Patricia Annez, and Arbind Modi
World Bank Policy Research Working Paper 3413, September 2004 The Policy Research Working Paper Series disseminates the findings of work in progress to encourage the exchange of ideas about development issues. An objective of the series is to get the findings out quickly, even if the presentations are less than fully polished. The papers carry the names of the authors and should be cited accordingly. The findings, interpretations, and conclusions expressed in this paper are entirely those of the authors. They do not necessarily represent the view of the World Bank, its Executive Directors, or the countries they represent. Policy Research Working Papers are available online at http://econ.worldbank.org.

i
Table of Contents
Foreword........................................................................................................................................ ii
Abstract......................................................................................................................................... iv
I. Introduction................................................................................................................... 1
II. The Administration of Stamp Duties in India............................................................ 2 A. The Basic Features of Stamp Duties............................................................................... 2 B. Administrative Problems with Stamp Duties.................................................................. 6 C. Stamp Duty Rates: Some International Practices ......................................................... 10
III. The Distributional Effects of Stamp Duties.............................................................. 11
IV. The Effects of Stamp Duties on Resource Allocation .............................................. 13
V. The Revenue Performance of Stamp Duties............................................................. 17 A. Stamp Duty Collections and Trends ............................................................................. 17 B. Stamp Duty Revenue Losses from Undervaluation...................................................... 21 C. Links to Other Taxes..................................................................................................... 22 D. The “Black Economy” Effect ....................................................................................... 26 E. Stamp Duty Rates and Revenue Performance: Evidence for a Link Between
Undervaluation and Stamp Duty Rates......................................................................... 29 F. The Impacts of Tax Reform.......................................................................................... 31
VI. Conclusions: The Case for Stamp Duty Rate Reform............................................. 32
Annex I: Stamp Duties and Property Transfer Taxes for Selected Countries...................... 35
Annex IIA: Stamp Duty Rates for States and Union Territories FY81-FY2003 .................. 66
Annex IIB: Stamp Duty Rates for States and Union Territories FY81-FY2003 .................. 67
Annex IIC: Stamp Duty Rates for States and Union Territories FY81-FY2003 .................. 68
Annex IID: Stamp Duty Rates for States and Union Territories FY81-FY2003 .................. 69
Annex III: Time Series Analysis of Stamp Duty Revenues in West Bengal .......................... 70
Annex IV. Actual vs. Predicted Growth of Stamp Tax Revenues .......................................... 71
Annex V: Stamp Tax Revenue Data Across States.................................................................. 72

ii
Foreword Over the next 25 years the number of people living in Indian cities will increase by about 230 million, almost doubling in size. Thus, over roughly the next generation, India will need to expand its infrastructure services to an incremental population that is about as large as the current urban population of the United States. Besides these new demands for infrastructure in Indian cities, there is a substantial backlog of demand for services to meet today’s needs—the needs of one of the most extensive systems of cities in the world, with an existing urban population of about 300 million, 32 agglomerations with a million or more residents, and three of the world’s 10 largest cities, Mumbai, Kolkata, and Delhi, all with populations in excess of 12 million.1 Over 20 percent of people in Indian cities live in slums, and there is no major city in India that provides safe water on a continuous basis. If the demands implied by this demographic transition were not enough, recently an influential study indicates that urbanization plays an important role in generating higher rates of economic growth. A McKinsey Company study2 identifies urban real estate markets as perhaps the single most important constraint on India’s ability to sustain the increased growth in the years since the country’s liberalization program took hold. In response to this significant urban challenge, the Government of India (GOI) has initiated a centrally driven urban real estate reform process. GOI has moved to empower and encourage local reform initiatives by creating an Urban Reform Initiative Fund (URIF) that rewards States pursuing market-friendly real estate reforms. In addition, the Tenth Plan underscores a growing recognition of the need to dismantle the extensive controls on urban real estate markets, many of which were established during the Emergency of 1975-77, and which have deprived cities of the tools to effectively ensure an adequate market-driven supply response to growing urban demand for land and services. As this reform proceeds, land and housing markets can rely more fully on prices to allocate resources, rather than bureaucratic mandates and the corruption that tends to accompany excessive regulation. One of the reforms supported under the URIF program is a progressive reduction in the stamp duty on immovable property transfers. Stamp tax reform is a key to this process because high stamp duty rates (most of the rates in Indian states are well above those documented internationally) strongly discourage real estate transactions and thus impede the development of efficient and flexible urban real estate markets. An appropriately designed reform also has the potential of unlocking the real estate wealth in cities, which has typically been a foundation of municipal finance. Nonetheless, since stamp duties amount to a significant source of revenues for most State governments, often the third or fourth most important source of own tax revenues, finding alternative sources of State revenue is crucial to moving the reform process forward. This paper examines both the distortionary impacts of stamp duties and possibilities for alternative revenue sources. A key finding from the paper is that evasion of stamp taxes through underdeclaration of property values in transactions has an impact on a number of other revenue sources, including the federal capital gains tax. In addition, the linkage of underdeclaration and black money further saps the fisc of tax revenues across the board. Simulations indicate that 1The data cited here are from the United Nations’ World Urbanization Prospects: The 2001 Revision, March 2002. 2 McKinsey Company Report: The Indian Growth Imperative. 9/10/01

iii
reform may well lead to better tax system performance overall, although intergovernmental transfers may be necessary to ensure that state revenues do not suffer in the short term. Recognizing these linkages offers a promising avenue for reform that will improve both the efficiency of the tax system and the functioning of urban real estate markets.

iv
Abstract This paper reviews the options for reform of stamp duties on immovable property transfers collected by Indian state governments. After briefly reviewing some of the many administrative difficulties experienced with the tax, the paper turns to an examination of its economic impacts. A review of stamp duties internationally indicates that Indian rates are exceptionally high, at rates often above 10 percent. Most countries’ rates are less than 5 percent, including a number of low and middle-income developing countries. With these high rates, we find that while the tax has become the third-largest revenue source for many Indian states, it imposes high compliance costs on taxpayers, has been subject to a good deal of evasion and fraud, and the distortionary impacts appear to be large, reducing the responsiveness of real estate markets in Indian cities by discouraging transactions essential to the efficient growth of cities. The paper studies the revenue implications of lowering stamp duty rates, which need to be understood if reform is to be viable. Evidence indicates that the current high duty rates, coupled with weak tax administration, lead to widespread evasion of the tax through underdeclaration. This underdeclaration of property values directly affects collection of other taxes, among them, property taxes and capital gains tax. Moreover, it indirectly affects the collection of all taxes through the impact of underdeclaration on the circulation of black money. Simulations indicate that revenues lost due to a lowering of stamp duty rates closer to international levels are quite likely to be recovered in higher collections of other taxes. However, these taxes would at least in part be collected by other levels of government. Thus, reform could be made a more viable option through appropriately designed intergovernmental transfers.

1
Stamp Duties In Indian States: A Case for Reform James Alm, Patricia Annez, and Arbind Modi3
I. Introduction
The State governments in India impose a variety of stamp duties and registration fees on different kinds of transactions and instruments. In total, according to some estimates, over 65 different kinds of such charges are imposed by the States.4 These charges effectively amount to a tax on the value of a transaction, most commonly on the transfer of movable and immovable properties and of instruments used in commercial and business transactions. In their entirety, stamp duties and registration fees amount to a significant source of revenues for most of the State governments, often the third or fourth most important source of own tax revenues. For example, according to 2002-2003 budget estimates from the Reserve Bank of India (2003), stamp duties and registration fees are estimated to generate for all States Rs. 132,588 million in revenues, or 6.2 percent of total tax revenue of all States, behind only State sales taxes (43.3 percent) and State excise duties (9.4 percent) in relative importance.5 Because of their size, stamp duties and registration fees are also likely to have a number of effects on the ways in which the States’ economies function, some positive but many negative. Stamp duties have become the subject of particular policy interest since the Urban Reform Incentive Fund (URIF) identified the reduction of stamp duties as a major element in the reform program to be undertaken by States, because of their distorting effects on real estate transactions.
This paper considers some of the economic and fiscal questions for policy makers considering reforms in stamp duties, especially stamp tax reductions.6 In particular, we examine stamp duties and registration fees, referred to for simplicity as “stamp duties”. The administration of the stamp duties will be briefly examined, but our main focus will be on two other issues. First, how distorting are the stamp duties in their effects on resource allocation? Second, what would be the effects, especially the revenue effects, of previously suggested reforms in stamp duties that lead generally to lower tax rates? In this analysis, the ways in which
3. Department of Economics, Andrew Young School of Policy Studies, Georgia State University; World Bank; and Ministry of Finance and Company Affairs, Government of India, respectively. The authors are grateful to a number of individuals with whom they met for many helpful discussions and much useful information: Mr. Govinda Rao, Mr. Om Prakash Mathur, and Mr. Tapas Sen, the National Institute of Public Finance and Policy; Mr. P.S.S. Thomas, Planning Commission; Mr. Vinor Tewari, the National Institute of Urban Affairs; Ms. Renuka Viswanathan, Tariff Commission; Dr. Vijay Kelkar, Advisor to the Ministry of Finance and Company Affairs; Mr. N. John Kurian Planning Commission; Mr. G.C. Srivastava, Finance Commission. Ms. Kathryn Owens and Mr. Jerry Kalarickal at the World Bank provided valuable research assistance for this paper. The authors are grateful to Mr. K. G. Krishnamurthy of the Housing Development Finance Corporation for providing data on market values of real estate in selected Indian cities. 4 See the National Institute of Public Finance and Policy (1995), Economic Reforms and the Stamp Act (New Delhi, India). 5 See Reserve Bank of India (2003), State Finances – A Study of Budgets 2002-03 (New Delhi, India). 6 A number of states have already taken action to lower stamp duties or have maintained them at the levels envisaged under URIF, among them Delhi, Gujarat, Karnataka, Maharashtra, Punjab, and West Bengal.
2
stamp duties are “linked” to other taxes in the Indian public finance system are especially important. The next section discusses the basic features of stamp duties, including some problems that arise in the administration of the stamp duties and some comparisons with international practice. This discussion is necessarily brief given the extensive coverage of administrative issues elsewhere. The economic effects of stamp duties are then examined in the next sections. Here the focus is on the distortions generated by the existing level of stamp duties and the likely effects on collections of various stamp duty reforms. The final section summarizes our conclusions and relates them to international experience in the imposition of taxes on similar types of transactions, especially to recent reforms around the world. It should be emphasized at the start that any analysis of stamp duties is made challenging by the lack of much quantitative information on such important aspects as the components of stamp duty revenues, the types of individuals and transactions who pay the duties, even the ways in which the stamp duty tax rates have changed over time. As a result, much of the analysis should be taken as qualitative and suggestive of the general direction of the effects of the duties.
II. The Administration of Stamp Duties in India7
A. The Basic Features of Stamp Duties
Stamp duties are imposed under the Indian Stamp Act, 1899, as amended several times over the years at the central government level. Under these central acts, each State has the authority to enact its own stamp duties, so that the specific features of the stamp duties, while broadly similar across the States, also take on State specific characteristics.
There are two basic types of charges, stamp duties and registration fees. A “stamp duty”
is a tax on the value of instruments used in various business transactions. Within this broad definition of stamp duties, there are two sub-classifications: “judicial stamp duties” and “non-judicial stamp duties”. Judicial stamp duties are fees collected from litigants in courts, and are best viewed as court fees. For most States, judicial stamp duties are relatively small in magnitude, although there are some exceptions. Non-judicial stamp duties are typically a one-time charge on the transfer of immovable property; because the charge is a one-time payment whose tax base is the value of the transaction, it can appropriately be seen as a tax on the transaction. The focus of this paper is on these non-judicial stamp duties, which will be referred to for convenience as “stamp duties”. In contrast, a “registration fee” is a payment made for a specific service provided by government in recording contracts and deeds, and so is more closely related to a user charge. The government maintains a registry of deeds in return for a fee. However, the payment of the registration fee does not entitle the payee to a guaranteed legal
7 For especially detailed discussions of the administration of stamp duties and registration fees, see the National Institute of Public Finance and Policy (1995), Economic Reforms and the Stamp Act (New Delhi, India); Tapas K. Sen (1999), “Reform of Stamp Duty Administration in Orissa”, National Institute of Public Finance and Policy (New Delhi, India); and Arindam Das-Gupta (2002), “The Stamps and Registration Department in Karnataka: A Review of Institutions and Administration”, Indira Gandhi Institute of Development and Research (Mumbai, India).

3
title.8 For the most part, government agents (called “sub-registrars”) are not concerned with the legal validity of the document but only with the correct payment of the fee. Table 1 shows the composition of these three forms of charges for various States. Table 1. Composition of Stamp Duties and Registration Fees, Selected States, 1992-1993 (as percent of total) State Non-judicial Stamp Duties Judicial Stamp Duties Registration Fees Andhra Pradesh 82.3 7.6 10.1 Assam 45.1 26.2 28.7 Bihar 15.1 60.3 24.6 Gujarat 85.2 2.6 12.1 Haryana 88.9 6.2 4.9 Karnataka 71.1 9.2 19.8 Kerala 81.6 5.7 12.7 Madhya Pradesh 63.3 7.9 28.8 Maharashtra 85.8 4.3 9.9 Orissa 74.5 9.6 15.9 Punjab 83.7 5.2 11.1 Rajasthan 76.5 4.7 18.8 Tamil Nadu 84.2 4.8 11.0 Uttar Pradesh 44.3 35.2 20.5 West Bengal 58.4 18.6 23.0 Source: National Institute of Public Finance and Policy (1995), Economic Reforms and the Stamp Act (New Delhi, India).
Under the Indian Constitution, stamp duties and registration fees are divided into those imposed under the Union List (or those set by the central government) and those imposed under the State List (or those determined by the individual States). Under Entry 91 of the coming together List (I), the central government sets the rates of stamp duties on bills of exchange, bills of lading, cheques, promissory notes, letters of credit, insurance policies, share transfers, debentures, proxies, and receipts-in-brief. The rates are uniform across all States. The collection of the duties is the responsibility of the State government in which the transaction occurs, and the State government retains all revenues collected by the State, although the States sometimes allocate a portion of the duties to the local government in which the collection occurs.
Under Entry 63 of the State List (II), State governments have the exclusive power to fix
the stamp duties for other instruments listed on the State List. The specific items taxed vary by
8 The stamp duty and registration fee department of Maharashtra is experimenting with a pilot program in which the payment of the registration fee provides legal protection of ownership and property rights, a system similar to the Torrens system used in various countries around the world (e.g., Australia, Thailand, the United Kingdom). The Torrens system is a system of registration of titles to land introduced into South Australia by the Real Property Act (Act 15 of 1857-58), drafted by Sir Robert Torrens, whose essential feature is the guarantee by the government of property-registered titles. The system has been generally adopted in Australia and British Columbia, and in its original or modified form in some other countries, including some states in the United States. For a discussion of this system, especially its current use, see Lynden Griggs (2001), “Torrens Title in a Digital World”, ELaw - Murdoch University Electronic Journal of Law, 8 (3).

4
State. For example, Karnataka imposes stamp duties on 55 separate items;9 Andhra Pradesh, on 56 separate items; Kerala, on 58 items; and Assam, Bihar, Himachal Pradesh, and Nagaland, on 65 items.10 The stamp duties are imposed on instruments that generally fall into five main categories:
• Instruments that relate to conveyance and property transfer;
• Instruments that are connected with loans and advances;
• Instruments that related to capital market transactions;
• Instruments that are used in daily business and commercial transactions; and
• Instruments that are executed under other statutes for record-keeping purposes.
For most States, the bulk of stamp duty revenues comes from the tax on a “conveyance” (or a deed of sale).11 Duties collected on conveyances typically account for 70 to 90 percent of total (non-judicial stamp duty) revenues in the States.12 The stamp duties can be imposed an ad valorem rate, a specific rate, or a mix of ad valorem and specific rates. In all cases, it is the buyer who is legally liable for the stamp duties.
As an example, the stamp duty rates on conveyances in Orissa for the year 1999 are given in Table 2. For all types of jurisdictions, the basic duty rate is 4.2 percent; additional charges differentially increase the total duty rate for different jurisdictions, sometimes up to 17.7 percent. Table 3 shows the maximum stamp duty rate on conveyances for selected States. As shown in Table 3, the basic stamp duty rates are quite high and variable; additional charges are often
9 See Government of Karnataka, Finance Department (2001), 1st Report of the Tax Reforms Commission (Karnataka, India). 10 According to the National Institute of Public Finance and Policy (1995), the instruments include: acknowledgement, administration bond, adoption deed, affidavit, memorandum of agreement, agreement relation to deposit of title, appointment in execution of power, appraisement of valuations, apprenticeship deed, article of association of a company, article of clerkship, award, bill of exchange, bill of lading, bond, bottomry bond, cancellation, certificate of sale, certificate or other document, charter party, composition deed, conveyance, copy of extract, counterpart or duplicate, customs duty, debenture, delivery order in receipt of goods, divorce, entry as an advocate, exchange of property, further charge, gift, indemnity bond, lease, letter of allotment of shares, letter of licence, memorandum of association, mortgage deed, mortgage of a crop, notarial act, note or memorandum, note of protest by the master of a ship, partition, partnership, policy of insurance, power of attorney, promissory note, protest of bill, proxy, receipt, reconveyance of mortgaged property, release, respondentia bond, settlement, share warrants, shipping order, surrender of lease, transfer, transfer of lease by way of assignment, trust, and warrant for goods. See National Institute of Public Finance and Policy (1995), Economic Reforms and the Stamp Act (New Delhi, India). 11 Under the Bombay Stamp Act, 1958, a conveyance is an instrument by which an owner of a property transfers his or her interest to another individual. More precisely, “…a conveyance includes a conveyance on sale, every instrument, every decree or final order of any Civil court, every order made by the High Court under section of 394 of the Companies Act, 1956 (I of 1956) in respect of amalgamation of companies, sale of air rights, by which property, whether movable or immovable or any estate or interest in any property is transferred to, or vested in, any other person, intervivos…” 12 See National Institute of Public Finance and Policy (1995), Economic Reforms and the Stamp Act (New Delhi, India).

5
imposed on different types of conveyances, which serve to increase the tax rates and their variation across the States.
Table 2. Stamp Duty Rates on Conveyances in Orissa (as percentage tax rate on value of transaction) Value of Transaction
Rural Areas
Urban Areas under Town Planning and Improvement Trust Act
Urban Areas under Development Authorities Act
Rs. 0-2000 6.2 9.2 10.2 Rs. 2001-5000 7.7 11.2 12.2 Rs. 5001-10,000 8.7 13.2 14.2 Rs. 10,000-25,000 9.7 14.7 15.7 Above Rs. 25,000 10.7 16.7 17.7 Source: Tapas K. Sen (1999), “Reform of Stamp Duty Administration in Orissa”, National Institute of Public Finance and Policy (New Delhi, India). Note: In all cases the total stamp duty rate equals the basic rate of 4.2 percent plus an additional charge.
Table 3. Maximum Stamp Duty Rates on Conveyances, Selected States State Maximum Basic Rate Maximum Additional Charges Andhra Pradesh 5.0 -- Assam 10.0 -- Bihar 7.0 -- Bombay 10.0 -- Daman 6.0 -- Gujarat 8.0 -- Himachal Pradesh 12.0 -- Karnataka 10.0 4.5 Kerala 8.0 -- Madhya Pradesh 7.5 -- Maharashtra 10.0 -- Mizoram 9.0 -- Nagaland 5.0 -- Orissa 4.2 13.5 Pondicherry 9.5 -- Punjab 6.25 -- Tamil Nadu 8.0 -- Uttar Pradesh 12.5 -- West Bengal 5.0 2.0 Sources: National Institute of Public Finance and Policy (1995), Economic Reforms and the Stamp Act (New Delhi, India); Tapas K. Sen (1999), “Reform of Stamp Duty Administration in Orissa”, National Institute of Public Finance and Policy (New Delhi, India); Government of Karnataka, Finance Department (2001), 1st Report of the Tax Reforms Commission (Karnataka, India), and various documents provided by the National Institute of Public Finance and Policy.
It is important to note that the stamp duties are directly or indirectly related to a number of other taxes. For example, the value of the transaction affects the individual income tax via the inclusion of short- and long-term capital gains in the income tax. Similarly, valuation affects an individual’s tax liability in the gift tax, as well as in the wealth tax. The property tax in most urban areas is based on the annual rental value of a property. Nevertheless, the annual rental

6
value of a property is, or should be, closely related to its capital value, as revealed in the market sale of the property. Indeed, many urban local bodies use estimates of market values as “guidance values” in establishing annual rental values for different types of properties in different locations within the jurisdiction, and some are also experimenting with the move to a property tax based on capital value. In all of these cases, the declared value of the transaction as used to calculate stamp duties has direct relevance to the tax base used to calculate these other taxes. Of course, the information conveyed in the stamp duty transaction must be connected in some way to the collection of these other taxes if administration of stamp duties is to affect collections of other taxes, and at present it appears that these connections are seldom if ever made. In part, this failure to link the various taxes may occur because the taxes are the responsibilities of different levels of government: State governments of stamp duties, the central government for the individual income tax, the gift tax, and the wealth tax, and local governments for the property tax. As discussed in more detail below, it is also possible that State sales and central excise taxes are affected in more indirect ways by the declared value of the market transaction.
B. Administrative Problems with Stamp Duties
There are many serious administrative issues that arise with the stamp duties. Various reforms that address these administrative problems have also been suggested by these studies.13
Valuation. There is widespread agreement that the values declared for stamp duty
transactions are grossly understated, due largely to the extremely high duty rate on conveyances. For example, in Maharashtra it is estimated that 70 percent of stamp duty documents are undervalued by 20 percent or more. Other observers claim that undervaluation may approach 50 percent for many kinds of transactions.
Avoidance. Because of the high stamp duty burdens, individuals have found a variety of
ways to avoid legally the tax burden. For example, the use of general power of attorney under which a sale deed is replaced with a sale agreement without possession allows an individual to transfer effective ownership to another without becoming liable for stamp duties. The use of transfers with cooperative housing has a similar effect. Other common avoidance methods include:
• The use of an instrument of lease for the long term payment of rent;
• The use of a declaratory suit filed in court under which property is transferred under the court decree;
• The use of an instrument of dissolution of a partnership in which property is taken as
payment for the ending of a partnership;
13 See National Institute of Public Finance and Policy (1995), Economic Reforms and the Stamp Act (New Delhi, India); Tapas K. Sen (1999), “Reform of Stamp Duty Administration in Orissa”, National Institute of Public Finance and Policy (New Delhi, India); and the Government of Karnataka, Finance Department (2001), 1st Report of the Tax Reforms Commission (Karnataka, India).

7
• The use of an instrument of release in which a co-owner releases his or her share to
another co-owner in exchange for some consideration;
• The exchange of properties of much different values; the splitting of one property into smaller properties to avoid higher stamp duty rates; and
• The registration of properties in neighboring, lower-tax States.14
Evasion. The high stamp duty rates have also created a strong incentive for individuals to
evade illegally the tax burden. The most obvious way for evasion is via undervaluation of the transaction. Individuals may also evade the legal liability by failing to register the transaction. Because registration creates a large stamp duty liability but does not confer legally accepted property rights, there are strong incentives for non-registration.
Tax Administration – Collection Costs. Although precise information on collection costs
is not typically available, the administrative costs of collecting stamp duties are often believed to be very high relative to the revenues generated. In some cases this occurs because some forms of instruments are unproductive sources and generate little revenues. Few States have tried computerization or the use of modern methods associated with “e-government” to achieve collection cost savings.
Tax Administration – Corruption. Tax collection officials are widely seen as “unfriendly,
unhelpful, and corrupt”.15 There are few attempts to make collection offices very “user friendly”.
Tax Administration – Fraud. Fraudulent production and use of stamp paper has been recognized as a significant problem in the administration of stamp taxes and duties. It recently took on national significance with the eruption in late 2003 of one of the largest financial scandals to hit the country. The Telgi scam refers to the alleged activities, largely undetected for several years, of Abdul Karim Telgi, the head of a highly effective organization that had been printing and circulating duplicate stamps and stamp paper throughout India. The States of Maharashtra and Karnataka were apparently the hardest hit, which is not surprising given the buoyant conditions experienced in their property markets for at least part of that time. Those States have special teams probing the case. It is unclear just how much the fraud cost the States involved, but it has been reported to be as high as Rs. 780,000 million over the last ten years, or about US$17 billion16. The political ramifications of this news have been substantial because a number of politicians and top police officials were among the more than 50 people arrested for suspected association with this fraud. Revelations as to the depth of penetration in government and the scope of fraudulent activities have figured prominently in news reports in the sensitive period leading up to national and state elections.
14 See Tapas K. Sen (1999), “Reform of Stamp Duty Administration in Orissa”, National Institute of Public Finance and Policy (New Delhi, India). 15 See Government of Karnataka (2001), Finance Department, 1st Report of the Tax Reforms Commission (Karnataka, India). 16 S. Arvind “Stamping out Stamp Scams” Hindu Business Line, January 2, 2004

8
Those involved in the production and sale of fraudulent tax paper had apparently
discovered the opportunity because the government administrative and supply systems were easy to penetrate and exploit. The high stamp duty rates raised substantially the rewards of engaging in the fraud. The breadth of this scam as well as the apparent complicity of officials in various layers of government and the bureaucracy in the scam hints at the perverse incentives embodied in high stamp tax rates coupled with weak controls.
This episode indicates the urgent need for administrative reform, along the lines of the
reforms being introduced in Karnataka. It also highlights the potential for abuse when tax rates are very high. Note that the use of fraudulent tax paper is not the same as evasion because individuals who buy the paper may well do so believing that the stamp duty papers are legitimate. However, for both evasion of the duties and the use of fraudulent papers the state governments lose tax revenues.
Individual Compliance Costs. Because of the numerous steps required to pay stamp
duties, the burden imposed on individuals from the presence of the stamp duties is quite significant. To illustrate, consider the specific case in Orissa in which an individual seller is attempting to complete the sale of a piece of urban land.17 The necessary steps for the payment of stamp duties (and the registration of the sale deed) to complete the transaction include the following:
1. The seller has to purchase stamp paper of the required value from a licensed stamp
vendor for his sale instrument, provided the value of stamps does not exceed Rs. 50,000. If it does, required stamp paper must be obtained from the Treasury or Sub-treasury of the Government of Orissa.
2. After purchasing stamp paper, the seller must get the instrument written on the stamp
paper by a licensed deed-writer, by an advocate, or by himself. The instrument written by any other person is chargeable with extra fees.
3. After the instrument is written and executed by the seller (or his authorized attorney
under a power of attorney), a copy of the instrument must be made and filed along with the original instrument.
4. The instrument and its copy must be presented to the Registering Officer (RO) for
registration.
5. The RO must check the adequacy of the stamp duty paid and also the admissibility of the instrument under the Registration Act. If the instrument is presented after four months from the date of execution, the RO only registers the document with the approval of the District Registrar on payment of the prescribed fines. If the District Registrar does not approve late filing, then the RO refuses registration of the instrument.
17 See Tapas K. Sen (1999), “Reform of Stamp Duty Administration in Orissa”, National Institute of Public Finance and Policy (New Delhi, India).

9
6. On presentation of the instrument, if the RO finds that the instrument is inadequately stamped, only the admission of execution is recorded, and the instrument is impounded without registration and sent to the District Registrar who has been appointed as Collector for the purpose.
7. The RO must also verify that the value of the property stated in the instrument is
correctly set forth. If the stated value is the same or above the guideline market value, the instrument is registered and returned to the party. If the stated value is below the guideline value, the seller must pay the difference between the payable stamp duty as per the guideline value and the actual amount paid. If the deficit amount is paid, the instrument is registered; if it is not and there is disagreement regarding the amount of stamp duty payable, then the RO refers the instrument to the District Sub-Registrar for further review. If disagreement persists even after this review, the District Sub-Registrar refers the case to the Deputy Inspector General of Registration or the Joint Inspector General of Registration for disposal.
8. The RO must also ensure that applicable certificates have been furnished before
registering a document. These may include one or more of the following:
a. a no-objection certificate under the Income Tax Act;
b. permission of the tahsildar under the Orissa Land Revenue Act or permission under from the Sub-Collector;
c. permission of the Endowment Commissioner under the Hindu Religious
Endowment Act;
d. permission of the Government of Orissa or permission of the Collector in the case of government leasehold land; and
e. permission of the Consolidation Officer for land under consolidation operation.
9. After the RO verifies that all the conditions required for admission of the instrument have
been met, the document is registered on payment of the prescribed fees. Any refusal to register a document is governed by various sections of Orissa acts, and may be appealed to the District Register at the first instance.
10. The individual must receive permission for the transaction under the Urban Land Ceiling
Act and also obtain a clearance certificate from the Income Tax Department.
In the case of the sale of a piece of land in a rural area of Orissa, the same general procedures must be followed, with the exception that it is not necessary to comply with the Urban Land Ceiling Act or the Income Tax Department. Complications are also introduced by the many rates in the stamp duty rate structures, as well as by the many different types of stamps that may be required and that may not be available. Similar procedures must be followed in most other States. These procedures are clearly complex, cumbersome, and burdensome on

10
individuals, and contribute to the problems of valuation, avoidance, evasion, corruption, and fraud.
Summary. The existence of these administrative problems is well known and widely recognized. Overall, there is at least anecdotal evidence that the amount of revenues lost due to the variety of fraud, evasion, and avoidance mechanisms is enormous. In fact, some officials estimate that the amount of revenues lost due to these measures is roughly equal to the amount of revenues actually collected. There is little evidence that enforcement measures are used with any frequency.
These administrative problems also give rise to a range of economic issues. Who bears
the burden of the stamp duties? Do the high and variable stamp duty rates distort economic transactions, especially those in urban land markets? What would be the effects on stamp duty revenues of reforms that lower duty rates? These issues are discussed in the next sections.
C. Stamp Duty Rates: Some International Practices
Stamp duties and taxes on real estate transactions in India are quite high in comparison with the practice in a number of other countries, as shown in Table 4.18 Few jurisdictions in this group impose stamp duties exceeding 5 percent, and even in those cases the higher rates are reserved for exceptional cases such as very high value personal property. Lower stamp duty rates are not limited to industrial countries; countries such as Vietnam and the Philippines have stamp duty rates in the range of 1 to 2 percent. As noted earlier, the high stamp duty rates in Indian states have likely been counterproductive in that they have provided powerful incentives for corruption and fraud in systems with weak tax administration. This evidence shows that a wide range of countries on the income scale have opted for a tax rate structure that may be both less distortionary and less difficult to administer.
18 Table 4 summarizes more detailed information provided in Annex I.

11
Table 4: Stamp Taxes on Immovable Property: International Comparisons
Country Tax (percent of value of transaction or market price)
Exemptions (US$) Lower Boundary of Highest Rate (US$)
Exchange Rate (US$/LOC as of 1/7/04)
Australia (New South Wales) 1 to 5.5 sliding $385,000 0.77
The Bahamas 2 to 10 sliding First time home buyers with value up to $250,000 $250,000 1
China 0.05
Property donated to the government, or social housing for widowed, aged, injured, or schools
Hong Kong* 3.75
Indonesia 5 Amount of exemption is local government decision
Ireland (commercial) 1 to 9 sliding Properties less than $12,700 $190,500 1.27 Ireland (residential) 0 to 9 sliding Houses less than $161,000 $806,451 1.27 Japan No specified amount Malaysia 1 to 4 sliding $390,000 0.26 Mexico 2 to 3 New Zealand Abolished in 1999 Pakistan (Punjab) 6 Pakistan (Sindh) 3 to 6 Pakistan (Islamabad) 6 Philippines 1 to 1.5 $18 0.018 Singapore 1 to 3 sliding $313,200 0.58 South Korea** .015 to .2 $80,000 0.0008 Taiwan (Taipei) 0.1 Thailand No specified amount US (Florida) 0.7 Vietnam 2 * Tax rate is only for Real Estate Investment & Trusts ** The sliding rate scale largely declines with value whereas for all other sliding scales above, the rates increase with value. Source: Tax Notes International, various issues.
III. The Distributional Effects of Stamp Duties By law, stamp duties are nominally paid by the buyer involved in the transaction. However, this does not necessarily mean that it is the buyer who ultimately pays, or bears the true economic burden, of the duties. Just as an excise tax may be borne by the buyer of the good or by the seller or by both, the true incidence of the stamp duties may bear no relation to the statutory incidence.
The division of the duties between buyers and sellers depends upon the elasticities of demand and of supply. The elasticity of demand is defined as the percentage change in quantity demanded divided by the percentage change in price; the elasticity of supply is similarly defined.

12
If buyers are willing and able to pay the price inclusive of the stamp duties without significantly decreasing their purchases – that is, if demand is “inelastic” – then they are likely to bear most of the burden. On the other hand, if sellers offer for sale the same quantity without much regard to the price they receive (or an inelastic supply), then it is the sellers who will pay the stamp duties. With buyers and sellers both responsive to the price of the transaction, as seems likely with most transactions covered by stamp duties, then the division of the duties is more difficult to determine. In general, those with the less responsive actions will bear the bulk of the burden.19
There are two main issues in determining the distributional effects of stamp duties. First,
what is the incidence of stamp duties or, equivalently, who bears the burden of stamp duties, buyers or sellers? In the analysis of this question, the statutory (or legal) incidence of the duties is largely irrelevant. Second, given the incidence of the duties, how do they affect the distribution of income?
The absence of much detailed information on the characteristics of markets in which stamp duties are imposed, especially urban land markets, makes quantitative analysis of stamp duty incidence impossible, so that it is not possible to determine precisely whether it is the buyer or the seller who pays the stamp duties.
However, in some respects the division of the burden between buyers and sellers is unimportant. Because the duties are borne by either the buyer or the seller of the property, and because either party seems likely to be among the higher income classes, it is hard to escape the conclusion that, on the issue of vertical equity, stamp duties fall more heavily on the rich than on the poor.
It is also likely that the stamp duties are borne in part by those owners who do not even trade their properties. Consider stamp duties on the sale of immovable property, like land. To the extent that the price of land net of the stamp duties falls (e.g., sellers bear some of the burden), then all owners of land bear some of the duties, even those who do not sell their land, because all land is worth less. This “capitalization” implies that all owners of property subject to stamp duties pay part of the tax.20 Because ownership of such property is concentrated in higher income groups, the burden of the stamp duties again falls more heavily on the wealthy.
19 It is straightforward to show that impact of a unit tax T on the price P paid by consumers in a competitive market equals ∆P/∆T = [ES /(ES – ED)], where ES is the elasticity of supply and ED is the elasticity of demand (defined as non-positive. For example, if ED is zero, or if ES is infinite, then in either case the price will rise by the full amount of the tax, and buyers will bear the full burden. 20 To illustrate, consider a market for immovable property in which there are three types of participants. Agents 1 and 2 buy and sell property, respectively; agent 3 owns property but neither buys nor sells additional property. The total quantity of property Q0 is assumed to be fixed, and the initial quantity owned by agent type i is denoted Qi, where Σi Qi = Q0. In the absence of any stamp duties on the purchase or sale of property, the demand for property of each agent type is assumed to take a simple linear form, or QD
1 = a1 – b1 P

13
However, in terms of horizontal equity issues, individuals are likely to be treated very
differently because all transfers are not treated equally under the stamp duties. As noted earlier, many transactions are grossly undervalued, and many individuals are also able to avoid or evade the duties. As a result, there are likely to be many instances in which uniform treatment of individuals and of transactions is violated.
There should no question that stamp duties fall short of many criteria for an “equitable”
tax. They are not tailored to the individual circumstances of the taxpayer. They may be evaded by those who are dishonest and avoided by those who find legal means to circumvent the duties, both of which affect the horizontal and vertical equity of the duties. Nevertheless, their overall impact is likely to be similar to that of a modestly progressive tax. In this regard, evidence from a similar type of tax, the immovable property transfer tax in Bangladesh suggests that transfer taxes are a moderately progressive tax.21 IV. The Effects of Stamp Duties on Resource Allocation
Because stamp duties are a tax on the value of a transaction, they are essentially a tax on differences of opinion about the desirability of holding property.22 In the absence of the stamp duties, a transfer will occur if the buyer believes the property to be worth more than the seller; with the duties, the buyer must believe the property to be worth more than the seller by at least the amount of the tax. If opinions differ widely, as may be the case when the economy is growing and markets are active, or if the duty rates are low, the stamp duties may have little effect on transactions. At other times, however, stamp duties may be a significant deterrent to the exchange of properties, especially when duty rates are high. In this latter case, the stamp
QD
2 = a2 – b2 P QD
3 = a3 = Q3 , where P is the price of the property. Agents 1 and 2 have demands that respond to price; agent 3 demands the same fixed amount regardless of price. Equilibrium in this market requires that the sum of the individual stock demands equals the total stock of property; equivalently, equilibrium requires that the sum of excess demands for property (or the flow of property transfers) equals zero. In either case, the equilibrium price P of land can be shown to equal P = [a1 + a2 + a3 – Q0]/[b1 + b2]. Now introduce stamp duties at rate t, imposed only on property that is bought or sold, where P denotes the gross-of-tax price and PN≡P(1-t) is the net-of-tax price. The demand for transferred property depends upon the gross-of-tax price, while the supply depends on the net-of-tax price. Assuming without loss of generality that agent 1 is the net demander of property and agent 2 is the net supplier, then the equilibrium net-of-tax price PN equals PN = (1-t) [a1 + a2 + a3 – Q0]/[b1 + (1-t)b2]. This net-of-tax price of property is the price of all property, whether transferred or not. As can be seen in the solution for PN, an increase in the stamp duty rate reduces the net-of-tax price (as long as b1≠0). 21 See James Alm (1989), “The Immovable Property Transfer Tax”, in Larry Schroeder, ed., Financing Governmental Decentralization: The Case of Bangladesh (Boulder, CO: Westview Press, Inc.), 89-114. 22 See Carl S. Shoup (1969), Public Finance (Chicago, IL: Aldine Press).

14
duties are likely to have particularly harmful effects. By reducing the volume of transactions, the duties may hinder the transfer of properties (especially immovable properties) to more productive uses. In addition, methods used to avoid or to evade the tax, as discussed earlier, may be wasteful. The timing of development may also be delayed if the presence of the stamp duties lead the owner to delay the sale of the property to developers until he or she can accumulate the funds to develop the property himself or herself, something referred to as the “lock-in effect”.23
A smoothly functioning market in property serves a useful economic purpose by
encouraging the transfer of resources to more productive uses. Of course, transfers are not always productive (e.g., property bought and sold for purely speculative reasons). However, an individual will generally purchase property only if he or she expects a positive return from the transaction. As noted long ago by Ricardo, stamp duties and other similar kinds of transfer taxes “…prevent the national capital from being distributed in the way most beneficial to the community”.24 Because the stamp duties are imposed at such high rates, it is likely that they discourage productive transfers and diminish the efficiency of resource allocation, especially in urban land markets.
The main efficiency concern with the stamp duties is their possible impact on the
efficient exchange of properties, especially in urban land markets. As with the incidence of the stamp duties, the absence of detailed information on such markets makes it difficult to assess this issue very precisely. Nevertheless, some suggestive evidence on the allocative effects of stamp duties can be obtained from a simple analytical framework, based on the measurement of the “excess burden” of a tax and, especially, of the “marginal excess burden” of a tax.
The excess burden EB of a tax is a measure of the loss of efficiency due to its imposition. In a single competitive market, the excess burden can be calculated as EB = - ½ t2 P Q [ES ED /(ES – ED)], where t is the stamp duty rate, P is the transaction price, Q is the quantity exchanged, and (ES, ED) are the elasticities of supply or of demand, defined as in the earlier incidence discussion.
Of more interest is the marginal excess burden MEB of a tax, or the increase in the excess burden of a tax per one rupee of additional tax revenue generated. Using the same notation as for the EB, the MEB can be calculated as MEB = - t [ES ED /(ES – ED)]. The MEB of taxation is especially useful to government in deciding how to generate additional revenues. On efficiency grounds, a government should raise an additional rupee of tax revenues with the instrument that has the lowest MEB.
23 See Roger S. Smith (1979), “The Effects of Land Taxes on Development Timing and Rates of Change in Land Prices”, in Roy W. Bahl, ed., The Taxation of Urban Property in Less Developed Countries (Madison, WI: The University of Wisconsin Press), 137-162. 24 The quotation is from Carl S. Shoup (1960), Ricardo on Taxation (New York, NY: Columbia University Press), 57.

15
Calculation of either the EB or the MEB of stamp duties requires information on the
relevant elasticities and on the stamp duty rates, and there are no estimates of these elasticities. Nevertheless, it is possible to calculate the MEB for different combinations of tax rates and elasticities, in order to illustrate the possible magnitude of the MEB of stamp duties.
Suppose, for example, that the stamp duty rate is 10 percent, the elasticity of demand is -
1, and the elasticity of supply is 1. Then the MEB of the stamp duty is 0.05, so that raising 1 additional rupee in tax revenues generates a misallocation valued at Rs. 0.05. The MEB increases with an increase in the stamp duty rate or with increases in the (absolute value) of the elasticities. If the stamp duty rate is 15 percent, the elasticity of demand is -2.5, and the elasticity of supply is 2.5, then the MEB of the stamp duty is 0.1875. The MEB for various combinations of the parameters is given in Table 5.
Table 5. Marginal Excess Burden of Stamp Duties: Partial Equilibrium Model Elasticity of Demand, Elasticity of Supply
Stamp Duty Rate -0.5, 0.5 -1, 1 -2.5, 2.5 -5, 5 -10, 10 0.05 0.0125 0.025 0.0625 0.125 0.25 0.10 0.025 0.05 0.125 0.25 0.5 0.15 0.0375 0.075 0.1875 0.375 0.75 0.20 0.05 0.1 0.25 0.5 1 0.25 0.0625 0.125 0.3125 0.625 --
In order to put these numbers in some perspective, it is useful to compare these magnitudes with those of other taxes in other countries. For example, Ballard, Shoven, and Whalley (1985) calculate the MEB of different U.S. taxes.25 For labor taxes, they estimate MEBs that vary from 0.121 to 0.230, depending on the relevant elasticities; for sales taxes, the MEB varies from 0.256 to 0.388; and for excises, it varies from 0.035 to 0.115. While illustrative, however, these largely mechanical calculations are likely to grossly underestimate the true efficiency cost of stamp duties because they fail to capture some dimensions of behavior that stamp duties are likely to distort. First, the MEB framework assumes that there is a single “partial equilibrium” market in which a distortion exists. The recognition that land markets are only one market among many will substantially increase the distortions from stamp duties. For example, suppose that the market in which stamp duties are imposed is one of only two markets. In this more “general equilibrium” framework, it is straightforward to demonstrate that the elasticity of supply of the taxed commodity can be much larger than assumed in the calculations in Table 5, which implies a significant increase in the MEB of stamp duties.
25 See Charles L. Ballard, John B. Shoven, and John Whalley (1985), “General Equilibrium Computations of the Marginal Welfare Costs of Taxes in the United States”, The American Economic Review, 75 (1), 128-138.

16
To be more precise, assume that there are two markets (or commodities), one of which is subject to a tax and each of which has production with a constant returns to scale production technology that uses capital and labor. In general, the implied elasticity of supply of the taxed commodity depends upon a variety of parameters, such as the factor shares of capital and labor and the elasticity of substitution between capital and labor in the two production functions. Nevertheless, the elasticity of supply of the taxed good increases significantly as the relative share of the taxed good in overall production declines. For example, even for “low” elasticities of substitution in production (e.g., 0.5), the elasticity of supply of the taxed good can easily exceed 100, as long as the share of the taxed good in overall production does not exceed 20 percent. With an elasticity of supply of 100, the MEBs for various combinations of stamp duty rates and elasticities of demand can be enormous, as shown in Table 6. These computations suggest that if the elasticity of demand is greater than one, the efficiency loss of the tax absorbs a substantial share of the revenues generated. Table 6. Marginal Excess Burden of Stamp Duties: Two Market Model
Elasticity of Demand, Elasticity of Supply Stamp Duty Rate -0.5,100 -1,100 -2.5,100 -5,100 -10,100 0.10 0.0498 0.0990 0.2439 0.4762 0.9091 0.15 0.0746 0.1485 0.3659 0.7143 -- 0.20 0.0995 0.1980 0.4878 0.9524 -- Second, the MEB framework ignores the presence of stamp duty evasion and avoidance. Evasion and avoidance will increase, and increase substantially, the magnitude of the MEB. Recall that the MEB is defined as the increase in the excess burden of a tax per one rupee of additional tax revenue generated. Because evasion and avoidance reduce the positive impact of an increase in stamp duty rates on revenues, they reduce the denominator of the MEB, thereby increasing the MEB. For example, consider the case in which the stamp duty tax rate is 10 percent and the elasticities of demand and of supply are (-2.5, 2.5). Suppose that an increase in stamp duties leads to a reduction in revenues by, say, 20 percent, relative to the scenarios assumed in the calculations in Table 5; that is, the increase in the duty rate increases revenues by Rs. 1 less 10 percent of Rs. 1, due to erosion of the stamp duty base from evasion and/or avoidance of the stamp duties. Then the MEB of the stamp duties is correspondingly increased from 0.125 to [0.125/(1-0.20)], or to 0.15625. Indeed, in the extreme case in which an increase in the duty rate does not increase stamp duty revenues at all, the MEB of the stamp duty is infinite. Third, the MEB framework ignores several distortions that affect the efficiency of land markets. Stamp duties may induce individuals to change how they use the asset, and/or to change how they say they are using the asset. For example, suppose owners of rental housing rent the apartment rather than sell the apartment, in order to avoid paying the stamp duties. Consequently, the presence of renters may slow the rate at which properties are turned into different uses, thereby slowing development.

17
Fourth, and most importantly, there is emerging evidence that urban land markets are a crucial element in the economic development of cities. Policies that hinder industrial, commercial, and residential development of urban land can prevent such economic development. At the present time, the supply of land for urban development is largely controlled by the public sector, and it seems unlikely that the public sector channels can provide land in sufficient amounts to support the growing demand for urban land. In this setting, it is essential that private sector be encouraged to acquire agricultural, vacant, or underutilized land, and to use this land for economic development. However, private sector acquisition is stalled by a wide range of public policies, including the Urban Land Ceiling Act, rent control, planning requirements, zoning regulations, property taxes, and stamp duties. The combined effect of such policies is high land prices, sluggish market responses, and high levels of informality in urban land markets.26 However, it is virtually impossible to capture these types of distortions in any “simple” model of urban land markets. When one considers the full range of all distortions, it is hard to avoid the conclusion that stamp duties are an especially distorting tax whose use on efficiency grounds should be discouraged. On this basis, the estimates presented in Tables 5 and 6 should be considered lower bounds – and very much lower bounds – on the true distorting effects of stamp duties. V. The Revenue Performance of Stamp Duties
Stamp duties and registration fees amount to a significant source of revenues for most of the Indian State governments. According to 2002-2003 budget estimates from the Reserve Bank of India (2003), stamp duties and registration fees generate for all States Rs. 132,588 million in revenues, or 6.2 percent of total tax revenue of the States, behind only State sales taxes (43.3 percent) and State excise duties (9.4 percent) in relative importance.27 This section examines the revenue performance of stamp duties. This performance has several dimensions. First, what are the levels of stamp duty collections in the States, and how have stamp duty revenues varied over time for the various States? Second, what are the estimated revenue losses due to the widespread undervaluation of transactions? Third, how are stamp duties linked to other taxes in the Indian public finance system? In particular, how does undervaluation in stamp duties affect revenues from other taxes that are linked either directly or indirectly to the duties? Fourth, how are stamp duty revenues, as well as revenues of the other linked taxes, likely to be affected by a change in stamp duty rates? A. Stamp Duty Collections and Trends Table 7 gives revenues from non-judicial stamp duties for selected States for 2000-2001, and also shows the total revenues from stamp duties and registration fees for all States for the same year.28 Tables 8 and 9 give some additional information on the tax structures of selected
26 For a detailed discussion of these distortions, with a special focus on Tamil Nadu, see David Dowall (2003), “Tamil Nadu Urban Land Management and Urban Planning Assessment”. 27 See Reserve Bank of India (2003), State Finances – A Study of Budgets 2002-03 (New Delhi, India). 28 These data come from different sources, and so are not strictly comparable. Researchers at the National Institute of Public Finance and Policy collected the information on non-judicial stamp duties; the information on stamp duties

18
States. As shown in Tables 7, 8, and 9, stamp duties are typically among the third or fourth most important source of own-source revenues, with some exceptions.
Table 7. Revenues from Stamp Duties and Registration Fees, 2000-2001 (in Rs. millions) State Non-judicial Stamp Duties Stamp Duties and Registration Fees Andhra Pradesh 7663.0 6709.3 Arunachal Pradesh --- 2.5 Assam 268.2 386.4 Bihar 1366.9 3434.8 Chattisgarh --- 623.7 Delhi --- 1916.8 Goa 155.5 219.1 Gujarat 4778.3 5374.2 Haryana 3791.2 4192.4 Himachal Pradesh --- 292.2 Jammu and Kashmir --- 210.6 Jharkhand --- 0 Karnataka 7078.1 6381.2 Kerala 3323.6 3411.0 Madhya Pradesh 4094.2 4770.8 Maharashtra 19,018.6 22,009.2 Manipur --- 18.0 Meghalaya --- 30.1 Mizoram --- 0.6 Nagaland --- 42.9 Orissa 860.6 1085.2 Punjab 3498.2 4240.6 Rajasthan 2701.2 4367.3 Sikkim --- 5.0 Tamil Nadu 9969.7 9102.6 Tripura --- 59.4 Uttar Pradesh 9261.1 12,697.6 Uttaranchal --- 424.0 West Bengal 3346.8 4740.1 Total, All States 100,782.3 96,747.0 Sources: For non-judicial stamp duties, data collected by the National Institute of Public Finance and Policy from State budgets; for stamp duties and registration fees, data collected from the Reserve Bank of India.
and registration fees was gathered from Reserve Bank of India sources. I am grateful to Tapas Sen of the National Institute of Public Finance and Policy for providing this information.

19
Table 8. Average (1996-1997 to 2000-2001) Own Revenue Shares of Revenue Components, Selected Indian States (shares expressed in percentages) Revenue Source
Bihar
Haryana
Madhya Pradesh
Rajasthan
Uttar Pradesh
All States
States Own Revenue 100 100 100 100 100 100 States Own Tax Revenue 71.87 66.03 70.98 73.06 84.12 77.70 Agricultural Income Tax 0.00 0.00 0.00 0.00 0.02 0.15 Professions Tax 0.00 0.00 1.51 0.00 0.07a 1.01 Land Revenue 0.81 0.50 0.40 0.70 0.82 1.06 Stamps and Registration Fees 7.33 4.92 5.64 6.41 11.34 6.68 Urban Immovable Property Fax 0.00 0.00 0.00 0.49 0.01 0.06 Sales Taxb 47.18 30.84 31.76 38.29 46.45 46.90 State Excise Taxes 7.44 14.60 13.26 17.30 17.85 10.92 Taxes on Vehicles, Goods, and Passengers 6.63 10.68 10.75 6.90 5.04 6.39 Entertainment Tax 0.60 1.22 0.28 0.42 1.28 0.57 States Own Non-tax Revenue 28.13 33.97 29.02 26.94 15.88 22.30 Interest Receipts 4.05 9.72 3.55 11.96 4.72 6.98 Dividends and Profits 0.34 0.06 0.02 0.12 0.06 0.14 Social and Economic Services 20.63 18.87 23.62 10.55 8.65 10.12 Memo Items States Own Revenue (as percent of Total Revenue) 39.9% 79.1% 60.2% 62.1% 50.2% 63.0% Revenue (as percent of GSDP) 15.3% 13.9% 13.1% 13.3% 11.8% 11.9% Own Revenue (as percent of GSDP) 6.1% 11.7% 7.9% 8.3% 5.9% 7.5% Per capita GSDP (in Rs.) Rs6905 Rs22,680 Rs11,905 Rs13,329 Rs10,192 Rs.17,658 a Professions tax collection in Uttar Pradesh consists of recovery of arrears. b This includes Central Sales Tax, Sales Tax on Motor Spirits, and Entry Taxes. Source: Calculated from Table 1 in Uttar Pradesh Policy Notes (2002), “UP's Own Revenue System: Assessment and Reform Suggestions”.
Table 9. Revenue and Revenue Components per Capita, 2000-2001, Selected Indian States (in Rs.) State
Per Capita GSDP in 2000-01
Own Revenues
Own Tax Revenues
Own Non-tax Revenues
Own Non-Tax Revenues less Interest Receipts
Sales Taxa
State Excisea
Motor Vehicles, Goods and Passenger Taxesa
Stamp Duties and Registration Feesa
Bihar 7867 569 387 182 149 252 (65.1) 45 (11.6) 33 (8.5) 40 (10.3)
Orissa 10,099 881 644 237 230 366 (56.8) 61 (9.5) 102 (15.8) 39 (6.1)
Uttar Pradesh 11,705 776 665 111 86 369 (55.5) 145 (21.8) 42 (6.3) 85 (12.8)
Madhya Pradesh 13,738 1069 804 266 114 372 (46.3) 151 (18.8) 118 (14.7) 66 (8.2)
Rajasthan 15,483 1441 1077 364 207 587 (54.5) 229 (21.3) 104 (9.7) 94 (8.7)
West Bengal 18,106 959 857 102 87 540 (63.0) 64 (7.5) 28 (3.3) 64 (7.5)
Andhra Pradesh 19,505 1807 1415 392 186 948 (67.0) 184 (13.0) 132 (9.3) 86 (6.1)
Karnataka 20,764 2051 1746 305 176 1032 (59.1) 267 (15.3) 190 (10.9) 150 (8.6)
Tamil Nadu 22,128 2249 2015 234 180 1292 (64.1) 347 (17.2) 147 (7.3) 153 (7.6)
Kerala 23,018 2243 1986 256 231 1393 (70.1) 248 (12.5) 142 (7.2) 145 (7.3)
Gujarat 23,087 2783 2148 635 291 1294 (60.2) 6 (0.3) 251 (11.7) 123 (5.7)
Haryana 23,279 2756 2081 675 546 1102 (53.0) 517 (24.8) 222 (10.7) 203 (9.8)
Maharashtra 26,893 2519 2114 406 374 1313 (62.1) 196 (9.3) 121 (5.7) 229 (10.8)
Punjab 28,177 2755 1637 1118 929 918 (56.1) 424 (25.9) 107 (6.5) 138 (8.4)
Average 19,643 b 1776 1398 377 270 841 (60.2) 206 (14.7) 124 (8.9) 115 (8.2) a The number in parentheses is the percent of the specified tax in total Own Tax Revenues. b Average per capita GDP for all States is measured at factor cost for the year 2000-01. Source: Calculated from Table 7 in Uttar Pradesh Policy Notes (2002), “UP's Own Revenue System: Assessment and Reform Suggestions”.

20
These revenues have grown fairly steadily over time. Table 10 presents estimates of the “buoyancy” of specific revenue sources for selected States, where the “buoyancy” is defined as the percentage change in revenues divided by the percentage change in gross State product (without controlling for any structural changes in the revenue sources) and is estimated using simple regression methods. With some exceptions, many of these buoyancy estimates approximate unity. The highest average buoyancy (or 1.15) is for stamp duties and registration fees.
Table 10. Estimated Buoyancies of Own Revenues and its Components, 1980-1981 to 2000-2001 State
Own Revenues
Own Tax Revenues
Own Non-tax Revenues
Own Non-Tax Revenues less Interest Receipts
Sales Tax
State Excise
Motor Vehicles, Goods, and Passenger Taxes
Stamp Duties and Registration Fees
Bihar 0.98 1.04 0.83 0.24a 1.02 1.17 1.15 1.33 Orissa 1.05 1.13 0.90 1.02 1.20 1.12 1.23 1.07 Uttar Pradesh 0.99 1.04 0.79 0.82 1.11 1.23 0.76 1.12 Madhya Pradesh 0.92 0.99 0.78 0.67 0.92 1.11 1.00 1.16 Rajasthan 0.96 1.01 0.86 0.79 0.96 1.34 0.88 1.26 West Bengal 0.90 0.94 0.64 0.75 0.98 0.89 0.38 1.09 Andhra Pradesh 0.91 0.92 0.87 0.81 1.06 0.62 0.96 1.04 Karnataka 0.97 1.03 0.77 0.82 1.08 0.92 1.00 1.25 Tamil Nadu 0.96 0.99 0.79 0.79 0.99 0.97 0.92 1.05 Kerala 0.96 1.02 0.65 0.82 1.08 0.87 1.07 1.06 Gujarat 1.02 1.02 1.01 0.90 1.04 0.81 0.88 1.13 Haryana 1.06 0.98 1.11 1.24 1.08 0.80 0.86 1.09 Maharashtra 0.91 0.96 0.77 0.61 0.97 1.05 0.86 1.47 Punjab 1.07 0.95 1.35 1.55 0.99 1.03 0.78 0.90 Average 0.98 1.00 0.86 0.89 1.03 1.00 0.91 1.15 a This estimated buoyancy is statistically significant at the 78 percent level only. All other estimates are statistically significant at the 98 percent level or higher. Source: From Table 6 in Uttar Pradesh Policy Notes (2002), “UP's Own Revenue System: Assessment and Reform Suggestions”.
Figures 1 to 11 show the trends in real per capita revenues for selected States since 1980-1981, where real revenues are deflated by the GDP deflator. Over this period of time, real non-judicial stamp duties grew on average by 24.0 percent per year. States with above-average annual growth in real revenues include Maharashtra (63.4 percent), Karnataka (30.4 percent), Haryana (26.1 percent), Uttar Pradesh (25.5 percent), Rajasthan (24.2 percent), and Madhya Pradesh (24.1 percent). In no State was the average annual growth in real revenues less than 12.0 percent. In this regard, the National Institute of Public Finance and Policy (1995) estimates that the overall buoyancy and elasticity coefficients for selected States over the decade of the 1980s were well in excess of 1 (or 1.23 and 1.12, respectively).29
As illustrated in Figures 1 to 11, revenues grew steadily in nearly all States over the
entire period. Simple linear trend lines fit for each State indicate a clear upward trend, for each State and for each measure of revenues, even for real per capita revenues. Discussions with government officials indicate that several States, such as West Bengal and Maharashtra, have
29 See National Institute of Public Finance and Policy (1995), Economic Reforms and the Stamp Act (New Delhi, India).

21
reduced stamp duty rates in recent years. As can be seen from the trends in collections in these States, there is a strong positive trend over time, suggesting that revenues may in fact increase with rate reductions. In addition, the stamp duty rate in Rajasthan was lowered from 12 percent to 7 percent in 1996-1997, and the World Bank (2000) documents that revenues increased by 36 percent between 1996-1997 and 1998-1999.30 Further evidence that a reduction in stamp duty rates may actually lead to an increase in revenues is found by Das-Gupta (2002), who calculates for Karnataka a negative correlation between the growth rates of the effective tax rate and the average transaction value per document; that is, he finds that a 1 percent increase in the growth rate of the effective tax rate is associated with a -0.6 percent decrease in the average transaction value.31 Although any conclusions must remain tentative at this time, it is certainly possible that stamp duties are so restrictive that States may not have much revenues to lose – and may in fact have much to gain – from a significant reduction in stamp duty rates. This issue is examined in more detail later. B. Stamp Duty Revenue Losses from Undervaluation
As discussed earlier, it is widely believed that the high rates of stamp duties lead to significant undervaluations of the transactions. Such undervaluations lead directly to stamp duty revenue losses. To illustrate the magnitudes of these losses, consider a “representative” transaction, in which a property with true value of Rs. 1 million is exchanged. Suppose also that the individual understates the true value by various percentages: 10 percent, 25 percent, and 50 percent. The stamp duty revenue loss then depends upon the duty rate. The simple calculations in Table 11 indicate the magnitude of the revenue loss for different duty rates.
Table 11. Stamp Duty Revenue Loss for “Representative” Rs. 1 Million Transaction (in Rs.)
Percent Undervaluation Duty Rate 10% 25% 50% 5% 5000 12,500 25,000 10% 10,000 25,000 50,000 15% 15,000 37,500 75,000 20% 20,000 50,000 100,000 25% 25,000 62,500 125,000
The potential impact on stamp duties in selected States can also be calculated. Assume that undervaluation is, say, 25 percent for all transactions. Table 12 shows the stamp duty
30 See the World Bank (2000), "Rajasthan: Averting Fiscal Crisis and Accelerating Growth", Draft Report, Poverty Reduction and Economic Management Unit, South Asia Region (Washington, D.C.). 31 See Arindam Das-Gupta (2002), “The Stamps and Registration Department in Karnataka: A Review of Institutions and Administration”, Indira Gandhi Institute of Development Research (Mumbai, India).
22
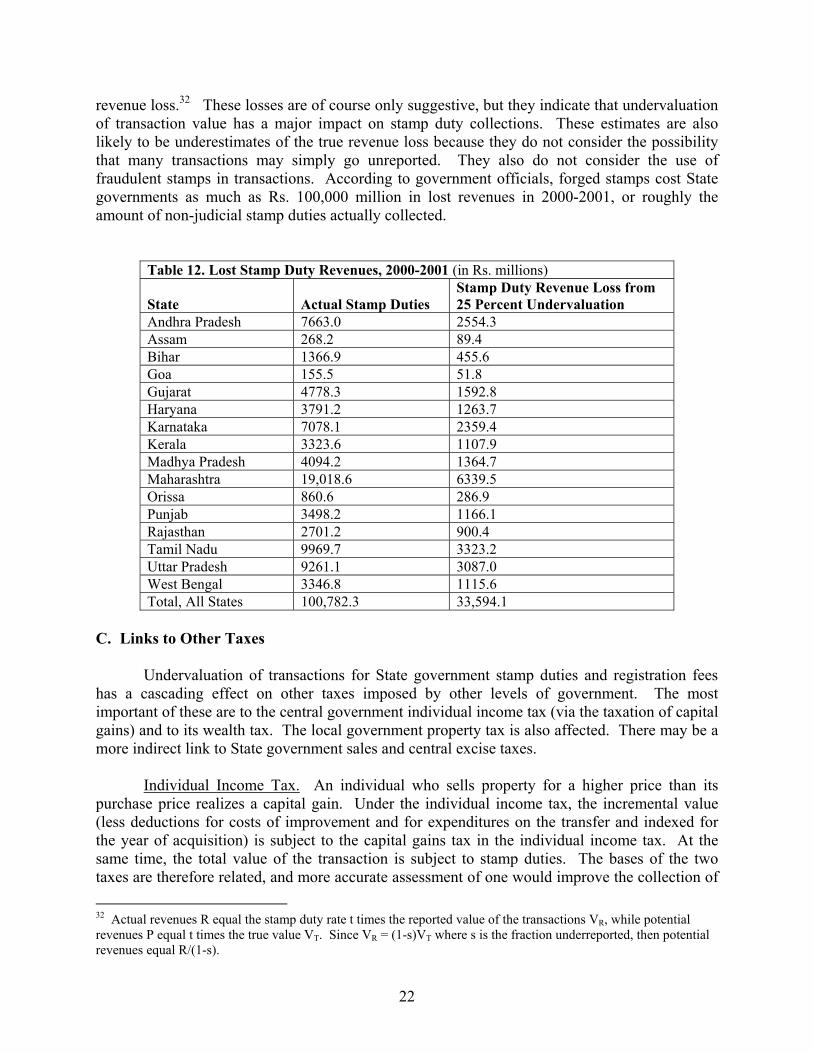
revenue loss.32 These losses are of course only suggestive, but they indicate that undervaluation of transaction value has a major impact on stamp duty collections. These estimates are also likely to be underestimates of the true revenue loss because they do not consider the possibility that many transactions may simply go unreported. They also do not consider the use of fraudulent stamps in transactions. According to government officials, forged stamps cost State governments as much as Rs. 100,000 million in lost revenues in 2000-2001, or roughly the amount of non-judicial stamp duties actually collected.
Table 12. Lost Stamp Duty Revenues, 2000-2001 (in Rs. millions) State
Actual Stamp Duties
Stamp Duty Revenue Loss from 25 Percent Undervaluation
Andhra Pradesh 7663.0 2554.3 Assam 268.2 89.4 Bihar 1366.9 455.6 Goa 155.5 51.8 Gujarat 4778.3 1592.8 Haryana 3791.2 1263.7 Karnataka 7078.1 2359.4 Kerala 3323.6 1107.9 Madhya Pradesh 4094.2 1364.7 Maharashtra 19,018.6 6339.5 Orissa 860.6 286.9 Punjab 3498.2 1166.1 Rajasthan 2701.2 900.4 Tamil Nadu 9969.7 3323.2 Uttar Pradesh 9261.1 3087.0 West Bengal 3346.8 1115.6 Total, All States 100,782.3 33,594.1
C. Links to Other Taxes Undervaluation of transactions for State government stamp duties and registration fees has a cascading effect on other taxes imposed by other levels of government. The most important of these are to the central government individual income tax (via the taxation of capital gains) and to its wealth tax. The local government property tax is also affected. There may be a more indirect link to State government sales and central excise taxes. Individual Income Tax. An individual who sells property for a higher price than its purchase price realizes a capital gain. Under the individual income tax, the incremental value (less deductions for costs of improvement and for expenditures on the transfer and indexed for the year of acquisition) is subject to the capital gains tax in the individual income tax. At the same time, the total value of the transaction is subject to stamp duties. The bases of the two taxes are therefore related, and more accurate assessment of one would improve the collection of 32 Actual revenues R equal the stamp duty rate t times the reported value of the transactions VR, while potential revenues P equal t times the true value VT. Since VR = (1-s)VT where s is the fraction underreported, then potential revenues equal R/(1-s).

23
the other. Unfortunately, the administrative links between the two taxes are virtually non-existent, so that the widespread undervaluation of transactions subject to stamp duties is likely to have significant effects on capital gains revenues. There is little information on the magnitude of capital gains collections or the individuals who pay the tax. Nevertheless, it is possible to make some approximate estimates of the capital gains revenue loss due to undervaluation of stamp duty transactions, using the same basic approach as earlier. Consider again a “representative” transaction, in which a property with true value of Rs. 1 million is exchanged. Suppose that the property has been held longer than 3 years, so that it is subject to the long-term capital gains tax rate in the individual income tax of 20 percent. Suppose also that the individual understates the true value by various percentages: 10 percent, 25 percent, and 50 percent. The stamp duty revenue loss is indicated in Table 11; the capital gains revenue loss can be similarly estimated because, other things equal, it is only the extent of undervaluation of the final transaction that affects the capital gains collections. The simple calculations in Table 13 indicate the magnitude of the capital gains revenue loss for this representative transaction.
Table 13. Capital Gains Revenue Loss for “Representative” Rs. 1 Million Transaction 10% Undervaluation 25% Undervaluation 50% Undervaluation Rs. 20,000 Rs. 50,000 Rs. 100,000
The potential impact on total capital gains collections can also be calculated under
various assumptions. Recall that for all States (non-judicial) stamp duties collections in 2000-2001 totaled Rs. 100,782.3 million. Assume that the average tax rate applied to these transactions in the different States was 15 percent, so that the total declared value is Rs. 671,882.0 million. Assume also that the fraction of these transactions subject to the capital gains tax ranges from 25 percent to 100 percent. Then, under different assumptions about the extent of undervaluation, the lost capital gains revenues can be calculated. These losses are shown in Table 14.33 As before, these losses are only suggestive, but they indicate that undervaluation of transaction value has a major impact that cascades beyond its effect on stamp duty collections. They are also likely to considerably underestimate the true revenue loss. An implicit assumption in the calculations is that capital gains taxes are paid on the reported value of the transaction; however, it is unlikely that these transactions are actually declared for capital gains taxation. If these transactions are not in fact reported for capital gains taxes, then the revenue loss is even greater.
Table 14. Foregone Capital Gains Revenues, 2000-01 (in Rs. millions) Percent of Base Subject to Capital Gains Tax Percent
Undervaluation 25% 50% 75% 100% 10% 3732.7 7465.4 11,198.0 14930.7 25% 11,198.0 22,396.1 33,594.1 44,792.1 50% 33594.1 67,188.2 100,782.3 134,376.4
33 Recall that the reported value of the transactions VR and the true value VT are related by VR = (1-s)VT or VT = VR/(1-s), where s is the fraction underreported. Capital gains revenues equal the tax rate (20 percent) times the amount of this base subject to the tax.

24
Remember that it is the central government that would reap the benefits of improved valuation of transactions in the stamp duties, while it is the State governments that would be responsible for any such improved valuations. The gift and wealth taxes are also central government taxes whose revenues would increase if valuation of transactions subject to stamp duties improved. At present these taxes are a very minor source of central government revenues. Property Tax. Local governments throughout India levy a property tax whose importance in local revenues varies considerably, typically generating between 10 and 20 percent of own-source local revenues but sometimes reaching as much as 1/2 of own-source revenues. Like most countries that have followed the British tradition of taxing property, the tax base is defined as the “annual rateable value” (ARV), or the annual rent that land and buildings might reasonably be expected to receive in an open market. The existence of rent control and other local regulations considerably complicate the calculation of the ARV. In part because of these complications, many local governments are now experimenting with a tax base based on the capital value of the property. With a property tax based on the annual rental value of a property, there is no immediate link between values declared in stamp duty transactions and the base of the property tax. However, the annual rental value of a property should be closely related to its capital value, as revealed in the market sale of the property. Some urban local bodies attempt to take advantage of this link by the use of market values in setting of “guidance values” for establishing annual rental values of different types of properties; as noted above, some local bodies are also exploring a change to a capital value property tax. A major problem in property tax administration is undervaluation of properties. Such undervaluation is clearly linked, at least in principle, to undervaluation of transactions in the stamp duties. Undervaluation leads directly to lower revenues, and also over time to lower buoyancy of revenues. As with the link between stamp duties and the capital gains tax, any improvement in valuation for stamp duties would likely lead over time to an increase in collections of the property tax, and would also improve the ability of the property tax to capture increases in property valuations over time. . Indeed, the linkage between improvements in stamp duties and subsequent improvements in the property tax is likely to be quite strong. Moreover, in many jurisdictions, a reassessment for property tax purposes is only triggered by a sale transaction. Thus, there is a strong disincentive either to avoid transactions or undervalue them to avoid property tax as well as stamp duties, and a reform aimed at reducing tax avoidance must take into account the joint impact of these taxes on real estate transactions.
It is possible to make some approximate estimates of the property tax revenue loss due to undervaluation of stamp duty transactions, using the same basic approach as earlier. Aggregate State stamp duties collections in 2000-01totaled Rs. 100,782.3 million, and, assuming that the average tax rate applied to these transactions in the different States was 15 percent, the total declared value is Rs. 671,882.0 million. Now suppose that the fraction of these transactions that represent immovable property subject to the property tax ranges from 25 percent to 100 percent. Importantly, suppose that these transactions are subject to different amounts of stamp duty

25
undervaluation that also leads to property tax undervaluation. With an average tax rate on capital value of 2 percent, the aggregate amount of lost property taxes can be calculated. These losses are shown in Table 1534. These estimates are meant only as broadly suggestive of the aggregate revenue losses that might be present. They again indicate that undervaluation of transaction value has a major impact that cascades beyond its effect on stamp duty collections.
Table 15. Foregone Property Tax Collections, 2000-2001 (in Rs. Millions) Percent of Base Subject to Property Tax Percent
Undervaluation 25% 50% 75% 100% 10% 373.3 746.5 1119.8 1493.1 25% 1119.8 2239.6 3359.4 4479.2 50% 3359.4 6718.8 10,078.2 13,437.6
As with the capital gains tax, State government attempts to improve valuation for stamp duties generates benefits for a different level of government, in this case, urban governments that impose the property tax. State Sales and Central Excise Taxes. A less direct link may be between stamp duties and State sales and central excise taxes. Suppose that the existence of high stamp duties lead companies operating in the real estate sector, especially builders, to undervalue properties. Such undervaluation saves the company tax payments, thereby increasing company revenues. However, these increased revenues are illegally generated, sometimes referred to as “black money”. In order to avoid revealing the existence of this black money, the company must utilize it in ways that maintain secrecy; that is, the company cannot use it to pay, say, sales taxes on inputs or excise taxes because these transactions must stay off official company records. As a result, there emerges a cascading effect through the entire production process, as activities must remain hidden. Put differently, the underreporting incentive in stamp duties feeds the “black economy” by driving money and resources into the sector.35 In many scenarios, the revenue effects of this resource movement can be quite significant.
To illustrate, consider a stylized economy that is divided into two sectors: a taxed sector and a “black economy” sector that is legally subject to taxation but that escapes taxation because activities there are hard-to-tax. In response to a tax imposed on the taxed sector (e.g., stamp duties), resources move from the taxed sector to the black economy sector. Under various assumptions about demand for each output (e.g., elasticities of product demand), about production conditions for each output (e.g., factor proportions, elasticities of substitution), and about sectoral size, it is possible to simulate the impact of a change in taxation on tax collections. In this stylized model, it is easy to generate settings in which the movement of resources from the taxed sector to the black economy sector reach as much as 25 to 50 percent of the initial
34 Recall that the reported value of the transactions VR and the true value VT are related by VR = (1-s)VT or VT = VR/(1-s), where s is the fraction underreported. Capital gains revenues equal the tax rate (20 percent) times the amount of this base subject to the tax. 35 The authors are grateful to Dr. Vijay Kelkar of the Ministry of Finance and Company Affairs for helpful discussions on this issue.

26
taxed sector size, with an implied revenue loss of corresponding amounts.36 The next subsection explores the implications of the “black economy” in more detail. D. The “Black Economy” Effect
Having looked at the pathways by which underdeclaration of property values for the purpose of stamp duty evasion may affect individual taxes such as capital gains, in this subsection we discuss a broader impact of stamp tax evasion through its effect on the circulation of black money. It is widely believed that, given the high levels of stamp duty rates, many immovable property sales transactions are deferred, others are not recorded, and even those transactions that do pass through the formalities of the registration of the change of title are recorded at values less than the full consideration paid for the property. As this underdeclaration occurs, individuals involved in the transaction must pay a part of the consideration in “black money”; that is, they must pay in cash and in such a way that the consideration paid is not recorded as part of the transaction, be it for the buyer or for the seller.
The underdeclared value of the property must be paid in cash, and the seller is in possession of black money that is unlikely to be whitened as long as continued operations in the black economy are possible and desirable. Indeed, the most frequent recipient of these funds would be property developers who have strong incentives to continue to circulate this black money in the black economy. As this money continues to circulate, a whole host of other transactions take place in the black economy and continue to escape the tax net. Payments to materials suppliers could be made in cash, thus evading sales and excise taxes. Builders paid in black money would not declare the associated profits for income tax purposes. Moreover, these recipients of the black money would then have the wherewithal and the incentive to make their purchases of goods and services in the black economy, thereby continuing the circular flow of transactions that escape the tax net. As a result, not only are stamp duty revenues eroded by underdeclaration, all tax yields are eroded as the process feeds black money in circulation and provides outlets for black money, whatever its source, thereby increasing opportunities for tax evasion of all kinds. Central government as well as state government revenues suffer.
Table 16 shows the distribution of all tax revenues by level of government, and suggests
the possible incidence of the secondary impacts of underdeclaration of real estate values as black money works its way through the economy. These indications are only a rough approximation because it is certain taxes may be more affected by evasion than others, but such an analysis is beyond the scope of this paper. Nonetheless, it is important to note that, insofar as high stamp duty rates encourage underdeclaration of property values, tax revenues from multiple sources suffer, from stamp duties to federal excises to local body property taxes and business income. These numbers indicate that the central government stands to lose about 62 percent of every one rupee of these additional tax leakages, of which about 17 percent would be shared with the States.
36 For examples of such calculations, see James Alm (1985), “The Welfare Cost of the Underground Economy”, Economic Inquiry, 24 (2), 243-263; and James Alm and Robert Buckley (1998), “Are Government Revenues from Financial Repression Worth the Costs?” Public Finance Review, (26 (3), 187-213.

27
Table 16. Distribution of Center and State Tax Revenues FY 2000/2001 FY 2001/2002 Percent of Total Revenues Center Own 45% 46% Center Devolved 17% 16% State Own 39% 38% Total 100% 100%
Total Revenues as Percent of GDP 16% 17%
Source: Economic Review 2002-2003, Tables 2.10-2.11.
We can consider a rough order of magnitude estimate of the impacts of underdeclaration of property values using the following simple model normalized for one rupee of actual real estate transaction. Define λU as the percent of underdeclaration of real estate values and t as the stamp duty rate. Then the amount of stamp duty collected per rupee of actual real estate transactions equals (1- λU ) t. Also, define λU as the amount of money that is circulated in the black economy. In principle, we can trace the impact of this injection of money into the black economy through a money demand equation, or
MBVB = PBYB where
MB = the supply of black money
VB = the velocity of black money
PB = the price level
YB = the real income added to the black economy. Normalizing PB to 1 and substituting for λU, we get YB= λU*VB. Now let γT equal the ratio of total tax collections to GDP. Then the total tax revenue lost on this additional black income equals (γT * λU * VB). It is possible to calculate the total tax revenue lost under different assumptions about the values of these parameters.
Table 17 provides us with the most recent values for γT. For this illustrative calculation, we use the historical average round number of 15. Estimates of the velocity of black money are difficult to come by for the obvious reason that market participants make every effort to avoid disclosure of these values to official sources. Establishing a robust empirical relationship between the two is even more daunting. However, for the sake of discussion, the velocity of currency in circulation may be used as a proxy initial value. Over the last thirty years, this value
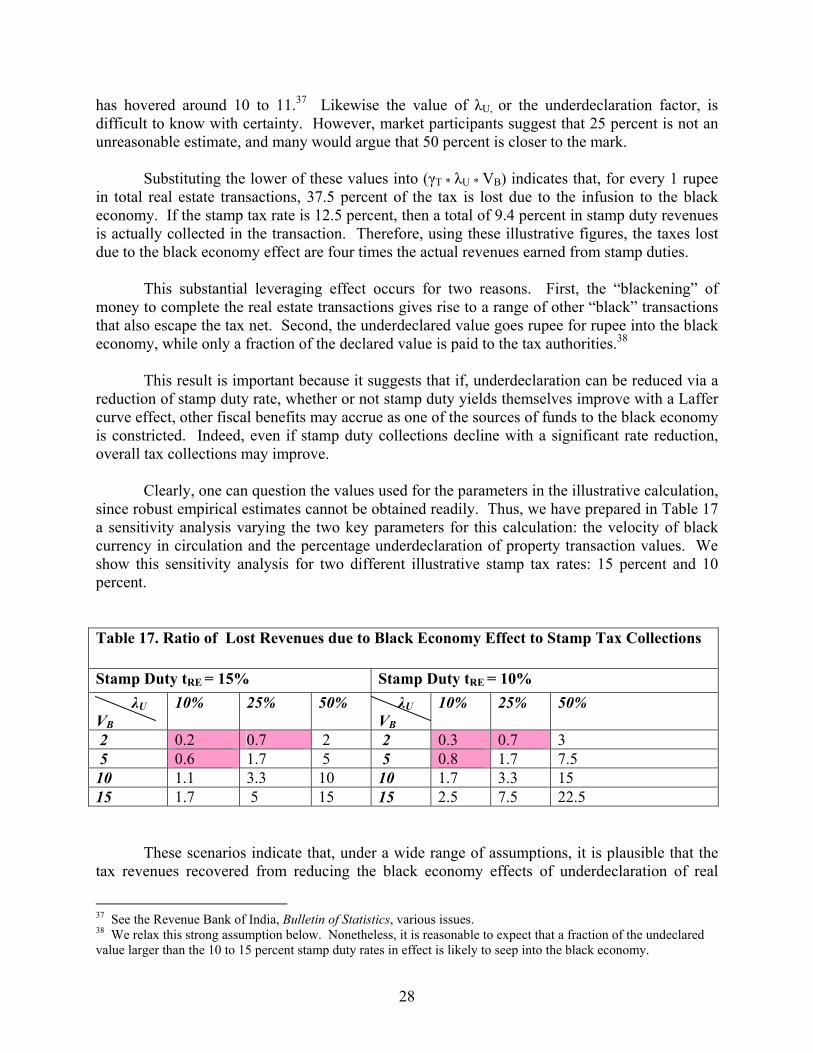
28
has hovered around 10 to 11.37 Likewise the value of λU, or the underdeclaration factor, is difficult to know with certainty. However, market participants suggest that 25 percent is not an unreasonable estimate, and many would argue that 50 percent is closer to the mark.
Substituting the lower of these values into (γT * λU * VB) indicates that, for every 1 rupee in total real estate transactions, 37.5 percent of the tax is lost due to the infusion to the black economy. If the stamp tax rate is 12.5 percent, then a total of 9.4 percent in stamp duty revenues is actually collected in the transaction. Therefore, using these illustrative figures, the taxes lost due to the black economy effect are four times the actual revenues earned from stamp duties.
This substantial leveraging effect occurs for two reasons. First, the “blackening” of money to complete the real estate transactions gives rise to a range of other “black” transactions that also escape the tax net. Second, the underdeclared value goes rupee for rupee into the black economy, while only a fraction of the declared value is paid to the tax authorities.38
This result is important because it suggests that if, underdeclaration can be reduced via a reduction of stamp duty rate, whether or not stamp duty yields themselves improve with a Laffer curve effect, other fiscal benefits may accrue as one of the sources of funds to the black economy is constricted. Indeed, even if stamp duty collections decline with a significant rate reduction, overall tax collections may improve.
Clearly, one can question the values used for the parameters in the illustrative calculation, since robust empirical estimates cannot be obtained readily. Thus, we have prepared in Table 17 a sensitivity analysis varying the two key parameters for this calculation: the velocity of black currency in circulation and the percentage underdeclaration of property transaction values. We show this sensitivity analysis for two different illustrative stamp tax rates: 15 percent and 10 percent. Table 17. Ratio of Lost Revenues due to Black Economy Effect to Stamp Tax Collections
Stamp Duty tRE = 15% Stamp Duty tRE = 10% λU VB
10% 25% 50% λU VB
10% 25% 50%
2 0.2 0.7 2 2 0.3 0.7 3 5 0.6 1.7 5 5 0.8 1.7 7.5 10 1.1 3.3 10 10 1.7 3.3 15 15 1.7 5 15 15 2.5 7.5 22.5
These scenarios indicate that, under a wide range of assumptions, it is plausible that the tax revenues recovered from reducing the black economy effects of underdeclaration of real
37 See the Revenue Bank of India, Bulletin of Statistics, various issues. 38 We relax this strong assumption below. Nonetheless, it is reasonable to expect that a fraction of the undeclared value larger than the 10 to 15 percent stamp duty rates in effect is likely to seep into the black economy.

29
estate values could more than compensate for the loss of stamp duties due to a substantial reduction in rates. Only in those scenarios that are shaded would the black economy tax effect be less than total stamp tax collections.
Within this broad range of scenarios, it is possible to assess which parameter values are the more plausible by relating these computations to other estimates of the percentage of GDP in the “black” economy. One can work backward through the basic equations to compute the total value of black GDP driven by underdeclaration in real estate. The share of stamp duties in GDP is roughly 0.5 percent.39 If the velocity of black money is 5, underdeclaration is 40 percent, and the stamp tax rate is 10 percent40, then the implied black economy share of GDP from real estate is about 17 percent. Recent estimates show about 23 percent of GDP is in the black economy in India.41 Earlier work by Acharya et al. (1986) on the black economy suggests a figure of about 18 to 21 percent for 1980-1981.42 Together these figures strongly suggest that the parameter values we have chosen are not outside the bounds of plausibility. E. Stamp Duty Rates and Revenue Performance: Evidence for a Link Between Undervaluation and Stamp Duty Rates
A critical assumption underlying the above scenarios is that underdeclaration of property values is sensitive to the stamp duty rate; that is, if duty rates are lowered, then there will be less tendency to underdeclare property transaction values to evade high stamp duties, and accordingly the flow of money into the black economy will decline. This is commonly thought to be the case in India.
We sought further empirical support for this intuitively plausible assumption by analyzing the behavior of stamp duty revenues in response to changes in tax rates.43 This indirect method was chosen because it is difficult to observe underdeclaration directly given that this is an illegal activity. If property undervaluation is common and sensitive to tax rates, we would expect it to affect the relationship between changes in tax rates and revenues over time. It should be emphasized that we are not testing the hypothesis that there is a Laffer curve effect for stamp duties collections: if a Laffer curve effect were in evidence for stamp duties, then underdeclaration would decline sufficiently to generate increased revenues from stamp duties themselves. Here we are only looking for evidence that underdeclaration declines when stamp duty rates decline from the levels currently in place in India. As the simulations above show, plausible parameter values suggest that, even if there is a reduction in stamp duty revenues when rates decline, additional revenues from other taxes may be generated by staunching the flow of money to the black economy.
39 See Indian Public Finance Statistics 2001-2002, Table 1.2 40 The weighted average stamp tax rate for the sixteen major states is 9.7 percent as of 2001. 41 See Friedrich Schneider (2002), “Size and Measurement of the Informal Economy in 110 Countries Around the World”, paper presented at the Workshop of the Australian Tax Centre, ANU, Canberra, Australia, July 17, 2002. 42 See Shankar Acharya et al. (1986), Aspects of the Black Economy in India, National Institute of Public Finance and Policy (New Delhi, India). 43 For this purpose, we used a time series of non-judicial stamp tax revenues in selected States kindly provided by Mr. Tapas Sen of the NIPFP.

30
If underdeclaration does not respond at all to changes in tax rates, then revenues would rise or fall based entirely on the change in the tax rate; that is, a given percent change in the tax rate would give rise to a proportional change in stamp duty revenues. We examined historical data to test whether this hypothesis holds. Annex II provides a time series of historical stamp tax rates covering FY1980-1981 to FY2003-2004, collated for the purpose of this paper. Ideally, regression analysis could be used to test such a hypothesis. However, as perusal of Annex II shows, stamp duty rates, with the exception of West Bengal, have not changed often enough to get reliable estimates of regression coefficients for individual States.44 Our analysis compared changes in stamp duty rates to revenue changes over the period in eleven major Indian States where duty rates have changed, as shown in Figures 1 to 11. Recall that Figures 1 to 11 show the trend analysis on a State by State basis. The pattern that emerges is quite clear: reductions in rates rarely result in a proportional decline in revenues. Indeed in several cases, revenues actually increase in response to a rate change. Likewise, rate increases (except in Kerala) tend to result in less than proportional revenue improvement, again indicating that underdeclaration tends to rise with rate increases. Figure 12 assembles all the instances of rate changes and associated revenue changes. All other factors held equal, if underdeclaration does not respond to tax rate changes, then we would expect these observations to be close to a 45-degree line, as a given percentage change in the tax rate feeds into a similar increase in taxes. However, the fitted line shows a slightly negative relationship between rate changes and revenue changes, although clearly there is a good deal of variability that is not explained by the rate changes alone. In statistical terms, the slope of the line is not significantly different from zero (the confidence level is about 65 percent). (See Annex III for the regression results and Annex IV for the analysis of a single state, West Bengal.) This result suggests strongly that other factors such as shifts in underdeclaration of property values are at play.45
In Figures 13 to 16, we examine the impact of tax rates changes for a few States for which we have more data. Stamp tax revenues are a function of rates, property values transacted, and the number of transactions, or R = t * PRE * N, where R is stamp duty revenues, t is the stamp duty rate, PRE is the average price of real estate transacted in the period, and N is the number of transactions in a given period. Differentiating this expression gives:
∧∧∧∧
++= NPt RER , where ^ indicates a proportional change. Using this relationship, we can create a predicted value of revenue changes in a given period based on changes in the determinants of revenues. Note that this is not a behavioral equation against which hypotheses would be tested, but rather it is an identity.
Now if we were could observe all of these variables directly, then we could simply
substitute the right hand side variables to get a predicted ∧
R . We do have information on some, 44 For West Bengal, a time series analysis from 1992-93-2000-2001 provides a significant and negative coefficient for the quadratic term on the tax rate, demonstrating a Laffer curve effect, in spite of very low degrees of freedom due to data limitations. Annex III shows the results of this analysis. 45 These findings are consistent with those of Das Gupta (2002) on Karnataka. He found that a 1 percent increase in the effective tax rate led to a 0.6 percent decrease in revenues for the period 1980-1981 to 1997-1998.

31
but not all, of these variables. Revenues are non-judicial stamp tax revenues as before, and the tax rate changes are computed from the information in Annex II. We do not have detailed State by State data for the number of immovable property transactions recorded in the Registrar’s office and hence subject to stamp tax. Instead of actual declared values for the immovable property transactions, we use real estate price changes based on data provided by the Housing Development Finance Corporation (HDFC) for commercial and residential real estate prices in Mumbai, Calcutta, Bangalore, and Chennai. These price data are based on the sales price of new developments checked against a buildup of developer costs, and are not based on values declared to the registrar for payment of stamp duty. As such, we would not expect them to be directly affected by underdeclaration. From the price data per square foot for a variety of different properties, we create an average index price and observed percentage changes in the index for each city. There are no data recording the number of real estate transactions and subsequent registrations, and there are no state level data on GDP in the construction sector. We use real GDP growth as a very rough proxy, in order to capture changes in transaction levels.
Figures 13 to 16 suggest that run ups in property values drive stamp tax revenues, just as
expected. Analyzing those time periods in which tax rates decline, we also note that predicted revenues tend to decline much more than actual revenues, even when property values shifts are taken into account. Likewise, in the case of duty rate increases, we find that the predicted growth in revenues is consistently higher than the actual. While the available data are not detailed enough to provide conclusive hypothesis testing, the evidence is broadly consistent with the commonly held view that underdeclaration responds to shifts in the stamp duty rate. This pattern reinforces our earlier finding on the relationship between shifts in tax rates and the resulting growth in revenues. Together this evidence strongly suggests that underdeclaration responds to duty rates. F. The Impacts of Tax Reform
A likely reform scenario is one in which the stamp tax is lowered to a level closer to international practice. The evidence that we have indicates that this would reduce underdeclaration and hence black economy effects. Depending on the rate selected, actual stamp tax revenues could also increase; even if revenues declined, this analysis shows that overall tax revenues are likely to go up by more than the stamp duty revenues lost. For example, if reducing the stamp duty rate from 10 percent to 5 percent were to lead to a decline in underdeclaration from 25 percent of value to 10 percent of value, then total tax take would increase by over 60 percent, assuming a black money velocity of 5. This occurs even though there is a 37 percent reduction in the stamp tax revenues. These results could only be expected to improve as tax reform expands the ratio of tax to GDP, thereby enhancing the rewards of reducing leakage into the black economy, and as better tax administration reduces the scope for underdeclaration. Consequently, the main message arising from these results is that overall tax collections are quite likely to improve if stamp duty rates decline. State governments may or may not lose some revenues from stamp taxes, but government as a whole is likely to gain from collection of other taxes.

32
VI. Conclusions: The Case for Stamp Duty Rate Reform
By most criteria, stamp duties and registration fees are a “bad” tax. They are very complicated, they are poorly administered, they highly distort economic decisions, especially those in urban land markets, they raise some but relatively little revenues, and the failure to value transactions accurately for purposes of stamp duties has a clear negative impact on a wide range of related taxes. Recall that in the aggregate the amount of stamp duties and registration fees collected in Indian States totals Rs. 132,588 million in revenues. According to officials, the failure to value properties accurately for purposes of stamp duties together with use of fraudulent tax paper costs State governments an amount of revenues that approximates the amount actually collected. Further, the failure to value properties accurately costs different levels of government tax revenues from income taxes, gift and wealth taxes, property taxes, and sales and excise taxes. In the aggregate, the amount of foregone revenues from these linked taxes is almost certain to far exceed the amount of stamp duties and registration fees actually collected, according to a number of estimates here.
A major concern of the State governments is the impact of stamp duty rate reductions on
collections. There is a widespread fear that any reform of stamp duties that reduced duty rates would lead to a significant loss of revenues for State governments. Such fear acts as a major deterrent to any attempt to reduce overall duty rates. The empirical analysis above suggests that these fears are not always well founded. Some rate reductions have been accompanied by improved revenue performance. Taking into account the impacts on other taxes, rate reductions are likely to improve overall revenue performance. Addressing the specific revenue concerns of the States may then become an issue of providing an appropriate intergovernmental transfer, if needed to compensate stamp duty losses. It is also important for State governments to bear in mind that maintaining high stamp tax rates may be counterproductive, even for their own revenues. Our estimates of the black economy effect suggest that State level revenues from other taxes may go up if high stamp duties – and the incentive for black transactions – are reduced.
In this regard, it should be noted that stamp duties are commonly found throughout the
world. However, the level of these taxes is in most instances much lower than in India; typically, transfer tax rates are around 1 percent of the value of the transaction. Further, the broad reform trends in other countries, with such diverse characteristics as the United Kingdom, Australia, New South Wales, Mauritius, Switzerland, Germany, China, Singapore, Malaysia, and Colombia, are generally similar. Basic reforms in many countries have focused on:
• Exempting taxes on financial transactions
• Reducing, and sometimes eliminating, the tax rate
• Utilizing modern technology in the payment and collection of taxes
• Linking the payment of taxes to specific sectoral expenditures.

33
Similar kinds of reforms are needed in India.46 In particular, some obvious reforms include the following:
• Administration of collection offices needs to be improved.
• Duty rates should be significantly lowered and the rate structure simplified.
• The number of items subject to taxation needs to be reduced, especially financial transactions.
• Valuation needs to be improved, and simple measures taken to detect fraud more
effectively.
• Enforcement needs to be improved, to reduce evasion and avoidance.
• The process needs to be simplified for taxpayers.
• The process needs to be modernized via attempts to introduce “e-Government”.
Indeed, there is some indication that reform of the stamp duties along these lines is already underway, at least in some states. For example, the stamp duty rate on property sales has been brought down in some states (including Rajasthan, Karnataka and Uttar Pradesh)47. Some states (Andhra Pradesh, Karnataka, Maharashtra, Uttar Pradesh) have also completed or are in the process of strengthening their official valuation machinery. Maharashtra and Karnataka are streamlining document registration procedures through automation or outsourcing, and Karnataka in 2003 was to abolish the use of stamp paper.
In pursuing these reforms, there are obstacles that must be addressed. First, stamp duties are a significant source of revenue for most State governments, and it is sometimes feared that a reduction in tax rates may cost the States revenues. Our analysis suggests that this fear is likely overstated. Even so, this consideration suggests that any rate reductions be phased in over time. Alternative revenue sources for the States should also be explored, such as increased motor vehicle taxes, increased excise taxes, increased user charges, or a State piggyback on existing central government taxes. Second, if rate reductions lead to valuation increases, the benefits would be realized mainly by local governments via increased property taxes and by the central government via increased capital gains (and, possibly, wealth and gift taxes), while much of the cost would be felt by State governments. As a result, there may be a need to adjust grant formulae, as well as to examine more fully linkages across different taxes and levels of government. Third, improvements in valuation, administration, enforcement, and modernization are costly. State governments should seek central government or donor support in making any
46 Some reforms are embedded in the “model” stamp act. See National Institute of Urban Affairs (1999), Indian Stamp Act – Model Legislation (New Delhi, India). 47 Kerala, Madhya Pradesh, Maharashtra, Tripura, Orissa and the union territories of Andaman and Nicobar Islands and Chandigarh plan to reduce their stamp duty rates to at most 5 percent by the end of the Tenth Plan. Similar commitments have been sought by the Centre from other states and union territories. See “Rationalization of Stamp Duty In States”, Press Information Bureau, Government of India, Press Release, December 15, 2003.

34
improvements, and should also fully explore e-Government options that make use of modern technology.
This modernization and updating of the stamp tax should propel a number of other
benefits. Reducing stamp duties on real property transfer will help develop the mortgage market, ease labor mobility, facilitate the development of a secondary housing market, and thus increase the value of all homeowners’ property. Lower stamp duty rates would make housing more affordable to young and low income households. Considering that mortgages are often available for up to 85 percent of the value of a home, stamp duties currently account for nearly half of the cash requirement to purchase a home. Reducing the rate closer to international levels would bring millions of potential homeowners closer to their goal. Indeed some of these beneficial impacts of stamp duty reductions merit further study and research to understand the potential benefits of stamp duty reform.

35
Annex I: Stamp Duties and Property Transfer Taxes for Selected Countries Countries (States)
Current System or Tax Rate Tax reform or other stamp tax changes/proposed, old system
Public opinion or cases Sources
Australia (New South Wales)
Stamp Duty on Transfer of Real Property (Land) For contracts dated after 11 July 2002, New tax rate: Does not exceed $12,000 $1.00 for every $100 or part of $100 Exceeds $12,000 but not $30,000 $120 plus $2.00 for every $100 or part of $100 over $12,000 Exceeds $30,000 but not $50,000 $480 plus $3.00 for every $100 or part of $100 over $30,000 Exceeds $50,000 but not $100,000 $1,080 plus $3.50 for every $100 or part of $100 over $50,000 Exceeds $100,000 but not $200,000 $2,830 plus $4.00 for every $100 or part of $100 over $100,000 Exceeds $200,000 but not $250,000 $6,830 plus $4.25 for every $100 or part of $100 over $200,000 Exceeds $250,000 but not $300,000 $8,955 plus $4.75 for every $100 or part of $100 over $250,000 Exceeds $300,000 but not $500,000 $11,330 plus $5.00 for every $100 or part of $100 over $300,000 Exceeds $500,000 $21,330 plus $5.50 for every $100 or part of $100 over $500,000 5)
Motor Vehicle Stamp Duty: Rate is 3% of MV first $45,000, 5% of MV above $45,000 6)
5 November 2003 The NSW government has proposed a price cap of $350,000 on some state-built homes and cuts to stamp duty as part of a scheme to make Sydney housing more affordable.2)
Stamp Duty on Transfer of Real Property (Land) For contracts dated prior 11 July 2002, Old tax rate: Does not exceed $12,000 $1.00 for every $100 or part of $100 Exceeds $12,000 but not $30,000 $120 plus $2.00 for every $100 or part of $100 over $12,000 Exceeds $30,000 but not $50,000 $480 plus $3.00 for every $100 or part of $100 over $30,000 Exceeds $50,000 but not $100,000 $1,080 plus $3.50 for every $100 or part of $100 over $50,000 Exceeds $100,000 but not $500,000 $2,830 plus $4.00 for every $100 or part of $100 over $100,000 Exceeds $500,000 but not $1,000,000 $18,830 plus $4.50 for every $100 or part of $100 over $500,000 Exceeds $1,000,000 $41,330 plus $5.00 for every $100 or part of $100 over $1,000,000 5)
Opinion on Current System 29 October 2003 Bombala Shire mayor Faye Campbell has echoed concerns about the impact of stamp duty on the regional property market. Deputy Prime Minister John Anderson says the state tax is causing a crisis in the regional market where house prices are rising faster than in Sydney. Councilor Campbell says she is concerned that, if properties continue to rise, young people will not be able to afford to buy in the shire. "It makes it very difficult for young people who want to come in and buy their first home," she said. "You know they've got that extra cost on the price of the home and everything else that goes with it and I think it'd be very difficult for them to start off." 1) The NSW Opposition would introduce into state parliament this week a bill to reduce stamp duty by 10 per cent, Opposition Leader John Brogden said today. As well as the bill, the opposition today launched a website for calculating the stamp duty on a house and a roving billboard showing the tax take in different suburbs. Speaking in NSW Premier Bob Carr's electorate of Maroubra, Mr. Brogden told reporters soaring property prices would result in stamp duty revenue of $3.5 billion this year, and people were getting nothing in return.3) 29 October 2003
1)http://www.abc.net.au/southeastnsw/news/200310/s977524.htm 2)http://www.theage.com.au/articles/2003/11/05/1067708243257.html 3)http://www.news.com.au/common/story_page/0,4057,7674619%255E1702,00.html 4)http://www.nzherald.co.nz/business/businessstorydisplay.cfm?storyID=3531265&thesection=business&thesubsection=commproperty&thesecondsubsection=general&thetickercode= 5)http://www.revenuesa.sa.gov.au/stamps/sdreal.html 6)http://216.239.37.104/search?q=cache:0sbgqt15r9UJ:www.aaa.asn.au/pub/issuessheet/costs98.pdf+%22south+australia+stamp+duty%22&hl=en&ie=UTF-8

36
Schofield outlined why Macquarie was investing in New Zealand, citing a limited supply of investment properties in Australia, the need to diversify its portfolio out of Australia, and the attraction of buying with less costs such as stamp duty, capital gains tax or land tax, which are payable in Australia but not in New Zealand. These made investing in New Zealand even more attractive because the tenants were familiar with how Macquarie worked and Macquarie knew what the tenants needed. Macquarie was looking for further properties in Auckland to fit its investment criteria of buying into warehouse and distribution centers, industrial estates and business and office parks.4)
Australia (South Australia)
Motor Vehicle Stamp Duty: In South Australia stamp duty is paid on the value of a new vehicle and the market value or purchase price (whichever is higher) of a used vehicle. For a vehicle valued over $3,000, stamp duty is $60plus $4 for every $100 over $3,000
10 November 2003 A spokesman for Treasurer Kevin Foley said any serious proposal to review the stamp duty system would be "looked at".1)
Adelaide. Lord Mayor Michael Harbison has called for an overhaul of the contentious property sale stamp duty system, claiming developers were using loopholes to build townhouses rather than apartments. He said the State Government tax was harming the development and progress of the city. He said buyers and developers were taking the "easy option" and getting around paying their duties through "massive loopholes".1) Property Council of Australia president Steven Connor said the stamp duty system hindered development. "A review of the state tax would be appropriate. It certainly is a hindrance to buyers," he said.
1)http://www.theadvertiser.news.com.au/common/story_page/0,5936,7819960%255E2682,00.html
Australia (Tasmania)
Motor vehicle stamp duty: Rate is 3% of MV to $35,000, 4% of MV above $35,000 2)
22 October 2003 It was revealed last week that eight Tasmanian families had
1)http://www.examiner.com.au/story.asp?id=201004 2)http://216.239.37.104/search?q=ca

37
accessed the grants through loopholes in the legislation allowing them to apply in the names of their children - all aged between four and 12. 1)
che:0sbgqt15r9UJ:www.aaa.asn.au/pub/issuessheet/costs98.pdf+%22south+australia+stamp+duty%22&hl=en&ie=UTF-8
Bahama The Bahamian government charges a stamp tax on all real estate sales or transfers. Under the Stamp Tax Act, this tax is split between the buyer and the seller unless otherwise specified or agreed to by both parties. Rates: Up to and including $20,000 – 2% From $20,000.01 to $50,000 – 4% From $50,000.01 to $100,000 – 6% From $100,000.01 to $250,000 – 8% From $250,000.01 and over – 10% There is no Government Stamp Tax to be paid on a sale to a first time home buyer purchasing a home valued up to $250,000. 1) In addition to duties, The Bahamas charges a 7 percent “stamp tax” on most imports. Higher stamp taxes are charged on some duty free goods, including tourist items such as china, crystal, wristwatches, clocks, jewelry, table linens, leather goods, perfume, wine and liquor. On average, The Bahamas charges an export stamp tax of 4 percent on most exports from the country.2)
1)http://www.damianos.com/Sellers/CommissionAndStampTax.asp 2)http://www.usatrade.gov/website/ccg.nsf/CCGurl/CCG-BAHAMAS2002-CH-6:-00683220
Belgium Stamp duty is imposed at 0.5% for contributions to a Belgian holding company. A contribution is a legal transaction involving a transfer of money or assets (tangible or intangible) to a company in return for equity instruments issued by that company. At least some contribution is required to incorporate a company. No stamp duty arises, however, if debt instruments are issued, except in the case of some real property transactions. Some forms of contribution (usually in connection with a corporate reorganization or a share-for-share acquisition) are exempt from the 0.5% stamp duty if fulfill some requirements.
Hinnekens, P., et al., Belgium’s Holding Company Regime -The Dividends-Received Deduction and Capital Gains Exemption for Shares, IBFD, August 2001.
China Since the taxation reform in 1994, China has practiced a financial system based on separate tax system; and according to the principle of unifying the right of finance and work, it has divided rationally the financial revenue of the central and local administrations. The central government, through the system of tax rebate and transfer payment regulates the financial revenue of various districts.
1. Saturday, 30 September 2000 The Chinese State Council has decided to raise the central government's share in stamp tax on securities trading, starting from October 1. The share of the central government
For proposal in 2003: Experts have been calling for further reduction as there is still more room for a downward movement compared to international standards. Tax revenue from the Shenzhen and Shanghai stock exchanges
1)http://www.qis.net/chinalaw/prclaw98.htm 2)http://fpeng.peopledaily.com.cn/200009/29/eng20000929_51563.html 3)http://www.southcn.com/english/news/money/200302270516.htm 4)http://www.ccpit.org/vhosts/english/Taxation.htm

38
At the same time, two sets of taxation institutions have been set up to carry out separate management. A taxation system with a value-added tax as the main element had been established. At present, China’s taxation system consists of 25 kinds of tax which is divided into eight kinds according to their nature and role. Stamp tax is grouped into “Act tax.” 4)
Promulgated by the State Council on August 6, 1988, effective October 1, 1988: Article 1. All units and individuals who execute or receive documents in the categories specified in these Regulations within the People's Republic of China shall be taxpayers subject to stamp tax (hereinafter referred to as "taxpayers") and shall pay stamp tax in accordance with the provisions of these Regulations. Article 2. Taxable documents include : (1) contracts or documents in the nature of a contract with regard to: purchases and sales, the undertaking of processing, contracting for construction projects, property leasing, commodity transport, warehousing loans, property insurance, technology contracts; (2) documents transferring property rights; (3) business account books; (4) certificates evidencing right or licenses; and (5) other documents which the Ministry of Finance determines to be taxable. Article 3. According to the nature of the taxable document, taxpayers shall calculate the amount of tax due on the basis of a percentage tax rate or a fixed amount per document. …). Article 4. Exempted documents: (1) duplicates or copies of documents on which stamp tax has already been paid; (2) documents executed when property is donated to the government, social welfare units or schools; (3) other documents approved by the Ministry of Finance for exemption from stamp tax. Stamp Tax Schedule of Tax Items and Tax Rates: Purchase and Supplier Contracts: 0.03% of the value of the purchases or sale. Processing Contract: 0.05% of processing fee or contracted receipts. Survey and Design Contracts for Engineering and Construction Projects:
will be raised from the current 88 percent to 97 percent in three years, reducing that for local governments to three percent. The adjustment will be done in three steps, raising the central government's share to 91 percent by October 1, 94 percent by 2001 and 97 percent by 2002. The nation's expanding stock market has led to steady growth in the government's stamp tax revenue in the last few years. The State Council said the adjustment is aimed at strengthening the central government's capacity to adjust the macro-economy. 2)
2. 27 February 2003 China cut the tax rate from 0.4 per cent to the present 0.2 per cent in November 2001. In 2003, China is likely to cut the stamp tax for stock trading soon to revitalize trading on the bourses. Several ways have been suggested to reduce stamp tax but the government will most likely stop the levy on stock buyers, insiders said. 3)
declined by about two-thirds last year from 2001, according to the China Securities Regulatory Commission (CSRC). A reduction of the tax can help boost trading in the bourses and re-activate market sentiment, said Dong, who co-authored a report to the Shanghai Stock Exchange last November, which advocated the stamp tax cut. Though the tax cut would mean lower income for the government, it would have a positive impact on the stock market in the long term because of improved market liquidity, the report said. Many developed countries have stopped levying stamp tax in the stock market and most emerging markets tax sellers an average of only 0.1 per cent. China needs to further lower trading costs for investors and improve the market liquidity, said Yang Dali, an analyst with Shenyin and Wanguo Securities Co. The stamp tax has an obvious impact on turnover in the bourses, so a lower level can often activate trading and increase market efficiency, said Yang, adding that the most feasible plan is to stop charging tax on buyers to encourage turnover.

39
0.05% of receipts Construction, Installation, and Engineering Contracts: 0.03% of contracted amount Property Leasing Contracts: 0.1% of lease amount; amounts less than 1 Yuan to be stamped as 1 Yuan. Commodity Shipping Contract: 0.05% of transport fees. Warehousing Contracts: 0.01% of warehousing & storage fee. Loan Contracts: 0.005% of loan amount Property insurance contracts 0.003% of amount insured Technology Contracts: 0.03% of indicated amount Property Transfer Documents 0.05% of indicated amount Business Accounting Documents: 0.05% of recorded capital Permits and Licenses: 5 Yuan 1)
All securities trading: 0.4% stamp tax on both sides for central and local. Change to 0.2% in 2001 2)
Major Exemptions: Tax exemptions may be granted on duplicates or copies of documents on which Stamp Tax has already been paid; documents executed when property is donated to the government, social welfare units supporting the widowed, the aged, the injured and the handicapped, or schools; non-interest bearing or discounting loan contracts; preferential loan contracts concluded between foreign governments or international financial institutions and the Chinese government or State financial institutions; and insurance contracts for agriculture and forestry products, and animals in animal husbandry
Hong Kong Rate of Stamp Duty on Property Transfer: 3.75% of purchase consideration for the properties which transferred into Real Estate Investment & Trust (REITs). Rate of Stamp Duty on Transfer of Share: 0.2% where the Special Purpose Companies (SPVs) whose shares are transferred is incorporated in
http://www.freshfields.com/places/asia/publications/newsletters/asia_sfinance/6306.pdf

40
Hong Kong. 0% where it is incorporated outside Hong Kong and maintains its share register outside Hong Kong
Indonesia Stamp Duty Rate (effective 1 May 2000): 1. Contract and other documents for legal purpose, common letter for court purpose, deeds and their copies = Rp 6,000. 2. Documents that contain amount of money, promissory notes, and acceptance letters:
Less than Rp 250,000=0 Rp 250,000-Rp 1,000,000=Rp3,000 More than Rp 1,000,000=Rp6,000
3. Cash check and uncashed check=Rp 3,000 4. Securities either individual or collective:
Face value less than Rp 1,000,000 = Rp3,000 More than Rp 1,000,000 = Rp6,000 1)
Property Transfer Tax on Land and Buildings (effective 1 January 2001):
Based on transaction value or market price= 5%. 7) The amount of exemptions is authority of local government. It varies from Rp 10 million to 60 million.
Old Rate: Stamp duty rate (effective 21 April 1995 until 30 April 2000): 1. Contract and other documents for legal purpose, common letter for court purpose, deeds and their copies = Rp 2,000. 2. Documents that contain amount of money, promissory notes, and acceptance letters:
Less than Rp 250,000=0 Rp 250,000-Rp 1,000,000=Rp1,000 More than Rp 1,000,000=Rp2,000
3. Cash check an uncashed check= Rp1,000 4. Securities:
Face value less than Rp 1,000,000 = Rp 0 More than Rp 1,000,000 = Rp2,000 2)
Property Transfer Tax on Land and Buildings (effective 1 January 1998 until 31 December 2000): Based on transaction value or market price. Less than Rp 30 million = 0% More than Rp 30 million = 5%.5)
This tax will be shared to lower level government after decentralization 20% for central govt. 80% for local governments 6)
Stock issuers changed their paper stocks to electronic stocks to avoid stamp duty from new regulation.3) Stamp duty increased significantly in three recent years, from Rp0.6 trillion (0.05 % of GDP) in fiscal year 1999/2000 to Rp0.9 trillion (0.09 % GDP) in 2000, and estimated to Rp1.9 trillion(0.1% of GDP) in 2001.4) Many people in Kecamatan Serdang might not get their land certificate since they were not able to pay the high property transfer tax8).
1)http://kambing.vlsm.org/bebas/v01/RI/pp/2000/pp-2000-024.txt 2)http://www.theceli.com/dokumen/produk/pp/1995/7-1995.htm 3)http://www.ksei.co.id/Fokuss/Edisi%207/BEA%20MATERAI%20YANG%20MEMBEBANKAN%20ITU.htm 4)http://www.fiskal.depkeu.go.id/nk2002.asp?kd=43 5)http://www.theceli.com/dokumen/produk/1997/uu21-1997.htm 6)http://www.theceli.com/dokumen/produk/pp/1997/33-1997.htm 7)http://www.suaramerdeka.com/harian/0308/19/eko11.htm 8)http://www.kompas.com/kompas-cetak/0309/18/metro/569305.htm
Ireland There are no sub-national taxes in Ireland. Stamp duty imposed on: • Transfer (including gift) of shares and securities
at 1%. • Transfer of most other Irish assets (where
ownership passes by legal instrument) at rates
Change in Territorial Scope of Capital Acquisitions Tax or CAT (include Stamp Duty) Former regime (before 1 December 1999): • Gift received from an
Implications of New Regime: The territorial scope of CAT has been significantly expanded to the extent that gifts, inheritances and benefits from trust received by individuals who are resident
1) Ward, John, “Fiscal Politics for the Economic Enterprise in Ireland” IBFD February 2000. 2) http://www.philiporeilly.com/taxcentre/StampDuty.htm#residential

41
up to 6%. (on transactions exceeding IEP 60,000). A different rate table applies to certain residential property: in this case, the highest rate is 9% (on transactions exceeding IEP 500,000).
• The rate of duty is generally halved for interfamily transfers other than share transfers; all transfers between spouses are exempt.
• Capital duty is imposed at rate of 1% on share issues and other capital contributions to limited liability entities.1)
New stamp duty rates effective from the 27th February, 2002 are as set out below. Stamp Duty for Used Houses
1st Time (Second-
€ Rate of Rate of Stamp €0 to €127,000 Exempt Exempt €127,001 - 190,500 Exempt 3% €190,501 - 254,000 3% 4% €254,001 - 317,000 3.75% 5% €317,501 - 381,000 4.50% 6% €381,001 - 635,000 7.50% 7.50% €635,001 and over 9% 9% Stamp Duty for New Homes: The following are the rates applicable to new houses/apartments greater than 125 sq. meters (taking into account the restricted consideration):
individual who was domiciled in Ireland on the date the gift was made.
• Inheritances received from an individual who was domiciled in Ireland on the date of his death.
• All other gifts and inheritances of Irish-situs property.
New Regime (Started at 1 December 1999): • Gift received on or after
December 1st 1999 from an individual who was resident or ordinarily resident in Ireland in the tax year in which the gift was made.
• Inheritances received on or after December 1st, 1999 from an individual who was resident or ordinarily resident in Ireland in the tax year in which he died.
• Gift received on or after December 1st 1999 by an individual who was resident or ordinarily resident in Ireland in the tax year in which the gift was received.
• Inheritances received on or after December 1st, 1999 by an individual who was resident or ordinarily resident in Ireland in the tax year in which the inheritance was received.
• All other gifts and inheritances comprising Irish-situs property, but only to extent they comprise such property. 1)
or ordinarily resident in Ireland may now be caught, unless the recipient can use the exceptions for non-domiciled individuals set out above. In old regime, the residence or domicile status of the recipient of a benefit was not relevant from a territory perspective. The weaknesses of new regime are: • The territorial scope of CAT
has been potentially reduced to a significant extent in relation to gifts, inheritances and benefit from trust received from an Irish domiciled donor (or settler) where that individual is neither resident nor ordinarily resident in Ireland.
• New regime will make an individual may often wish to make transfers to Irish-based beneficiaries.1)

42
€190,501 - 254,000 3% 4% €254,001 - 317,500 3.75% 5% €317,501 - 381,000 4.50% 6% €381,001 - 635,000 7.50% 7.50% €635,000 or more 9% 9%
Commercial Stamp Duty Rates: The rates of stamp duty applicable to commercial property are different than those applied to residential property and the current rates are as set out below:
Aggregate Consideration Rate of Duty
Up to €10,000 Exempt €10,001 - €20,000 1%€20,001 - €30,000 2%€30,001 - €40,000 3%€40,001 - €70,000 4%€70,001 - €80,000 5%€80,001 - €100,000 6%€100,001 - €120,000 7%€120,001 - €150,000 8%Over €150,000 9%(Source : 2)
Israel Stamp Tax Rates: Document Type: A. When the value is stipulated in the
documents: • Insurance contracts for ships or airplanes= 0.1% • Contract, memorandum, promissory note, lien
and any non-transferable guarantee or obligation= 0.4%
• Issuing of nominee shares, nominee bonds and deeds of trust = 1%
• Insurance policies = 1.5% • Transferable guarantees or obligations = 2% • Sea freight insurance = 3% B. Where the value is not stipulated in the
document = $1.20
Ehud Menirav (2000): It is difficult to collect the stamp tax and most individuals do not pay it at all. Furthermore, the collection pf the tax is carried out inefficiently without a computerized database and with a low level of service to the taxpayer. The distortions to the economy include the increased cost of issuing securities on the stock exchange and the reduction of alternatives for saving and borrowing.
Ehud Menirav, Stamp Tax in Israel, Institute for Advanced Strategic and Political Studies, Policy Studies No. 44, January 2000.

43
Japan Stamp tax is levied on certain documents such as contracts, bills and share certificates. As a rule, the tax is levied by affixing revenue stamps covering the amount equal to the stamp tax to those documents. However, in certain cases, such as when many taxable documents are processed repeatedly, taxpayers may, for convenience, choose self-assessment or payment in cash. Tax rates vary from 200 yen to 600,000 yen per document. Revenue stamps are also used for payment of registration license tax levied when registering the establishment or transfer of property rights and for payment of national examination fees.
http://www.nta.go.jp/category/outline/english/1832/text/02/04_7.htm
Kenya 23 October 2003 Lands Minister Amos Kimunya blew the whistle on a syndicate involving his officers, land agents and bankers. Kimunya revealed that the syndicate has been diverting millions of shillings received as stamp duty to their pockets. Half of all stamp duty paid to the Government ends up in people's pockets. He said the syndicate operates mainly in Nairobi and Mombasa but was slowly spreading to other areas. 1)
1)http://www.eastandard.net/headlines/news231003004.htm
Malaysia
Rate of Stamp Duty on Transfer of Share: In Malaysia, stamp duty is payable on a transfer of shares at 0.3 percent of the consideration paid, or the market value, whichever is higher. The Stamp Office uses as the market value the higher of the pro-rata net tangibles asset value or a price-earnings multiple of 11. 1)
Rate of Stamp Duty on Property Transfer: 1 percent on the first MYR 100,000, 2 percent on the next MYR 400,000, 3 percent for the next MYR 1,500,000, and 4 percent on the balance of the value of the property or the consideration given for it, whichever is higher. 1) Stamp Duty on Charges A charge on property is an instrument created by statue, namely the NLC. It affords the Chargee a security for loan granted to the Chargor over the property charged. Stamp duty is calculated at the rate of about 0.5% of the loan amount.2)
1)http://www.taxanalysts.com/www/readingsintaxpolicy.nsf/0/1D537D4C206E166685256B820080661F?OpenDocument 2)http://www.propertylookout.com/stamp.htm

44
Stamp Duty on Leases and Tenancy Agreements First, calculate the total rent for one year. Then, take away RM 2,400 from that total rent, because the first RM 2,400 is free from stamp duty. For every RM 250: Not exceeding1 year = RM 1 1 – 3 years = RM 2 Exceeding 3 years = RM 4.2)
Mexico Real property transfer tax is imposed locally in range from 2% to 3% of the purchase price.
Fonseca, Marcela, et al., Tax Aspects of Structuring and Disposing of Investments in Mexico, IBFD, November, 2001
New Zealand
Stamp Duty Abolition (21 May 21 1999): Repealed two types of stamp duty: Conveyance duty and lease duty, but still retain cheque duty. 1) So abolish the old stamp duty as follows: Payable on commercial land and buildings at the rate of: • 1 % on the first $50,000 • 1.5% on the second $50,000 • 2% on the balance 2)
Comment on Stamp Duty Abolition: The business community will welcome the abolition. With the removal in the last decade of stamp duty on share transfer, many businesses have retained cumbersome corporate structures in order to retain commercial buildings within special purpose companies. Corporate reconstructions have often forced large corporate groups into complex tax planning initiative in order to avoid fiscal cost simply moving a property between two wholly owned companies. Removal of stamp duty will facilitate a further round of corporate simplification and amalgamations, and reduce compliance costs.1)
1)Sawyer, Adrian J., A “Minority Government Budget Mixing Election Year Sweetners With Restraint?”, IBFD, August/September 1999 2)http://www.bkrlewbarr.com/taxfacts/nz.htm
Pakistan 25 September 2001 Sindh government collects stamp duty on a variety of business activities, property transactions and financial documents. There is a stamp duty schedule and rates are announced in the yearly provincial budgets.
25 September 2001 The individual businessmen and the business concerns either do not recognize Sindh government's fiscal jurisdiction, or if they do so, they circumvent the payment in collusion with the banks in case of financial documents. Mostly, the officers of the revenue department help the businessmen and companies to evade stamp duties.
http://dawn.com/2001/09/26/ebr8.htm
Papua New A rate of stamp duty of 5% is imposed on http://www.bkrlewbarr.com/taxfacts/p

45
Guinea documents that constitute a deed of gift. Further duty is payable on other documents.
ng.htm
Philippines Subject of Stamp Tax: SEC. 173. Stamp Taxes Upon Documents, Loan Agreements, Instruments and Papers. That whenever one party to the taxable document enjoys exemption from the tax herein imposed, the other party who is not exempt shall be the one directly liable for the tax. SEC. 174. Stamp Tax on Debentures and Certificates of Indebtedness. Rate is one peso and fifty centavos (P1.50) on each Two hundred pesos (P200), or fractional part thereof, of the face value of such documents. SEC. 175. Stamp Tax on Original Issue of Shares of Stock. – Tax rate is two pesos (P2.00) on each Two hundred pesos (P200), or fractional part thereof, of the par value, of such shares of stock: Provided, That in the case of the original issue of shares of stock without par value the amount of the documentary stamp tax herein prescribed shall be based upon the actual consideration for the issuance of such shares of stock: provided, further, That in the case of stock dividends, on the actual value represented by each share. SEC. 176. Stamp Tax on Sales, Agreements to Sell, Memoranda of Sales, Deliveries or Transfer of Due-bills, Certificates of Obligation, or Shares of Certificates of Stock. Tax rate is one peso and fifty centavos (P1.50) on each Two hundred pesos (P200) or fractional part thereof, of the par value of such due-bill, certificate of obligation or stock; Provided, That only one tax shall be collected on each sale or transfer of stock or securities from one person to another, regardless of whether or not a certificate of stock or obligation is issued, indorsed, or delivered in pursuance of such sale or transfer: and Provided, further, That in the case of stock without par value the amount of documentary stamp tax herein prescribed shall be equivalent to twenty-five percent (25%) of the documentary stamp tax paid upon the original issue of said stock. SEC. 177. Stamp Tax on Bonds, Debentures, Certificate of Stock or Indebtedness Issued in Foreign Countries. SEC. 178. Stamp Tax on Certificates of Profits or Interest in Property or Accumulations. Tax rate is
19 March 2003 Lawmaker calls for documentary stamp tax reforms. The clamor of the Philippine Stock Exchange (PSE) to rationalize the imposition of documentary stamp tax on the issuance of shares and stock certificates has obtained popular support from Sen. Ralph G. Recto. Recto has sponsored Senate Bill 2518, otherwise known as The Documentary Stamp Tax Bill, which he said “aims to break investment barriers, remove distortions from the domestic capital market, develop it, mobilize savings, and hopefully alleviate poverty.” 2)
1)http://www.bir.gov.ph/nirc/nir_tl07_ch00.html 2)http://www.manilatimes.net/national/2003/mar/19/business/20030319bus13.html

46
fifty centavos (P0.50) on each Two hundred pesos (P200), or fractional part thereof, of the face value of such certificate or memorandum. SEC. 179. Stamp Tax on Bank Checks, Drafts, Certificates of Deposit not Bearing Interest, and Other Instruments. Tax rate is one peso and fifty centavos (P1.50). SEC. 180. Stamp Tax on All Bonds, Loan Agreements, promissory Notes, Bills of Exchange, Drafts, Instruments and Securities Issued by the Government or Any of its Instrumentalities, Deposit Substitute Debt Instruments, Certificates of Deposits Bearing Interest and Others Not Payable on Sight or Demand. Tax rate is thirty centavos (P0.30) on each Two hundred pesos (P200), or fractional part thereof, of the face value of any such agreement, bill of exchange, draft, certificate of deposit, or note: Provided, That only one documentary stamp tax shall be imposed on either loan agreement, or promissory notes issued to secure such loan, whichever will yield a higher tax: Provided, however, That loan agreements or promissory notes the aggregate of which does not exceed Two hundred fifty thousand pesos (P250,000) executed by an individual for his purchase on installment for his personal use or that of his family and not for business, resale, barter or hire of a house, lot, motor vehicle, appliance or furniture shall be exempt from the payment of the documentary stamp tax provided under this Section. SEC. 181. Stamp Tax Upon Acceptance of Bills of Exchange and Others. Tax rate is Thirty centavos (P0.30) on each Two hundred pesos (P200), or fractional part thereof, of the face value of any such bill of exchange, or order, or the Philippine equivalent to such value, if expressed in foreign currency. SEC. 182. Stamp Tax on Foreign Bills of Exchange and Letters of Credit. - On all foreign bills of exchange and letters of credit (including orders, by telegraph or otherwise, for the payment of money issued by express or steamship companies or by any person or persons) drawn in but payable out of the Philippines in a set of three (3) or more according to the custom of merchants and bankers, there shall be collected a documentary stamp tax of Thirty centavos (P0.30) on each Two hundred pesos

47
(P200), or fractional part thereof, of the face value of any such bill of exchange or letter of credit, or the Philippine equivalent of such face value, if expressed in foreign currency. SEC. 183. Stamp Tax on Life Insurance Policies. Tax rate is fifty centavos (P0.50) on each Two hundred pesos (P200), or fractional part thereof, of the amount insured by any such policy. SEC. 184. Stamp Tax on Policies of Insurance Upon Property. Tax rate is fifty centavos (P0.50) on each Four pesos (P4.00), or fractional part thereof, of the amount of premium charged. Provided, however, that no documentary stamp tax shall be collected on reinsurance contracts or on any instrument by which cession or acceptance of insurance risks under any reinsurance agreement is effected or recorded. SEC. 185. Stamp Tax on Fidelity Bonds and Other Insurance Policies. Tax rate is fifty centavos (P0.50) on each four pesos (P4.00), or fractional part thereof, of the premium charged. SEC. 186. Stamp Tax on Policies of Annuities and Pre-Need Plans. Tax rates are one peso and fifty centavos (P1.50) on each two hundred pesos (P200) or fractional part thereof, of the capital of the annuity, or should this be unknown, then on each two hundred (P200) pesos, or fractional part thereof, of thirty-three and one-third (33 1/3) times the annual income. On pre-need plans, the documentary stamp tax shall be fifty centavos (P0.50) on each five hundred pesos (P500), or fractional part thereof, of the value or amount of the plan. SEC. 187. Stamp Tax on Indemnity Bonds. Tax rate is thirty centavos (P0.30) on each four pesos (P4.00), or fractional part thereof, of the premium charged. SEC. 188. Stamp Tax on Certificates. On each certificate of damages or otherwise, and on every certificate or document issued by any customs officer, marine surveyor, or other person acting as such, and on each certificate issued by a notary public, and on each certificate of any description required by law or by rules or regulations of a public office, or which is issued for the purpose of giving information, or establishing proof of a fact, and not otherwise specified herein, there shall be collected a documentary stamp tax of fifteen pesos (P15.00).

48
SEC. 189. Stamp Tax on Warehouse Receipts. Tax rate is fifteen pesos (P15.00). Provided: That no tax shall be collected on each warehouse receipt issued to any one person in any one calendar month covering property the value of which does not exceed two hundred pesos (P200). SEC. 190. Stamp Tax on Jai-Alai, Horse Racing Tickets, lotto or Other Authorized Numbers Games. – Tax rates are ten centavos (P0.10). Provided: That if the cost of the ticket exceeds One peso (P1.00), an additional tax of ten centavos (P0.10) on every one peso (P1.00), or fractional part thereof, shall be collected. SEC. 191. Stamp Tax on Bills of Lading or Receipts. Tax rate is one peso (P1.00), if the value of such goods exceeds one hundred pesos (P100) and does not exceed one thousand pesos (P1,000); ten pesos (P10), if the value exceeds one thousand pesos (P1,000). Provided, however, that freight tickets covering goods, merchandise or effects carried as accompanied baggage of passengers on land and water carriers primarily engaged in the transportation of passengers are hereby exempt. SEC. 192. Stamp Tax on Proxies. On each proxy for voting at any election for officers of any company or association, or for any other purpose, except proxies issued affecting the affairs of associations or corporations organized for religious, charitable or literary purposes, there shall be collected a documentary stamp tax of fifteen pesos (P15.00). SEC. 193. Stamp Tax on Powers of Attorney. Tax rate is five pesos (P5.00). SEC. 194. Stamp tax on Leases and Other Hiring Agreements. Tax rates are three pesos (P3.00) for the first two thousand pesos (P2,000), or fractional part thereof, and an additional one peso (P1.00) for every one thousand pesos (P1,000) or fractional part thereof, in excess of the first two thousand pesos (P2,000) for each year of the term of said contract or agreement. SEC. 195. Stamp Tax on Mortgages, Pledges and Deeds of Trust. Tax rates are: (a) When the amount secured does not exceed five thousand pesos (P5,000), twenty pesos (P20.00). (b) On each five thousand pesos (P5,000), or fractional part thereof in excess of five thousand pesos (P5,000), an additional tax of ten pesos

49
(P10.00). SEC. 196. Stamp tax on Deeds of Sale and Conveyances of Real Property. A documentary stamp tax, at the rates herein below prescribed, based on the consideration contracted to be paid for such realty or on its fair market value determined in accordance with Section 6(E) of this Code, whichever is higher. Provided, that when one of the contracting parties is the Government the tax herein imposed shall be based on the actual consideration. (a) When the consideration, or value received or contracted to be paid for such realty after making proper allowance of any encumbrance, does not exceed one thousand pesos (P1,000) fifteen pesos (P15.00). (b) For each additional one thousand pesos (P1,000), or fractional part thereof in excess of one thousand pesos (P1,000) of such consideration or value, fifteen pesos (P15.00). SEC. 197. Stamp Tax on Charter Parties and Similar Instruments. A documentary stamp tax at the following rates: (a) If the registered gross tonnage of the ship, vessel or steamer does not exceed one thousand (1,000) tons, and the duration of the charter or contract does not exceed six (6) months, five hundred pesos (P500); and for each month or fraction of a month in excess of six (6) months, an additional tax of fifty pesos (P50.00) shall be paid. (b) If the registered gross tonnage exceeds one thousand (1,000) tons and does not exceed ten thousand (10,000) tons, and the duration of the charter or contract does not exceed six (6) months, one thousand pesos (P1,000); and for each month or fraction of a month in excess of six (6) months, an additional tax of one hundred pesos (P100) shall be paid. (c) If the registered gross tonnage exceeds ten thousand (10,000) tons and the duration of the charter or contract does not exceed six (6) months, one thousand five hundred pesos (P1,500); and for each month or fraction of a month in excess of six (6) months, an additional tax of one hundred fifty pesos (P150) shall be paid. SEC. 198. Stamp Tax on Assignments and Renewals of Certain Instruments. A documentary stamp tax, at the same rate as that imposed on the

50
original instrument. SEC. 199. Documents and Papers Not Subject to Stamp Tax. The provisions of Section 173 to the contrary notwithstanding, the following instruments, documents and papers shall be exempt from the documentary stamp tax: (a) Policies of insurance or annuities made or granted by a fraternal or beneficiary society, order, association or cooperative company, operated on the lodge system or local cooperation plan and organized and conducted solely by the members thereof for the exclusive benefit of each member and not for profit. (b) Certificates of oaths administered to any government official in his official capacity or of acknowledgment by any government official in the performance of his official duties, written appearance in any court by any government official, in his official capacity; certificates of the administration of oaths to any person as to the authenticity of any paper required to be filed in court by any person or party thereto, whether the proceedings be civil or criminal; papers and documents filed in courts by or for the national, provincial, city or municipal governments; affidavits of poor persons for the purpose of proving poverty; statements and other compulsory information required of persons or corporations by the rules and regulations of the national, provincial, city or municipal governments exclusively for statistical purposes and which are wholly for the use of the bureau or office in which they are filed, and not at the instance or for the use or benefit of the person filing them; certified copies and other certificates placed upon documents, instruments and papers for the national, provincial, city, or municipal governments, made at the instance and for the sole use of some other branch of the national, provincial, city or municipal governments; and certificates of the assessed value of lands, not exceeding Two hundred pesos (P200) in value assessed, furnished by the provincial, city or municipal Treasurer to applicants for registration of title to land. SEC. 200. Payment of Documentary Stamp Tax. (A) In General. - The provisions of Presidential Decree No. 1045 notwithstanding, any person liable to pay documentary stamp tax upon any document
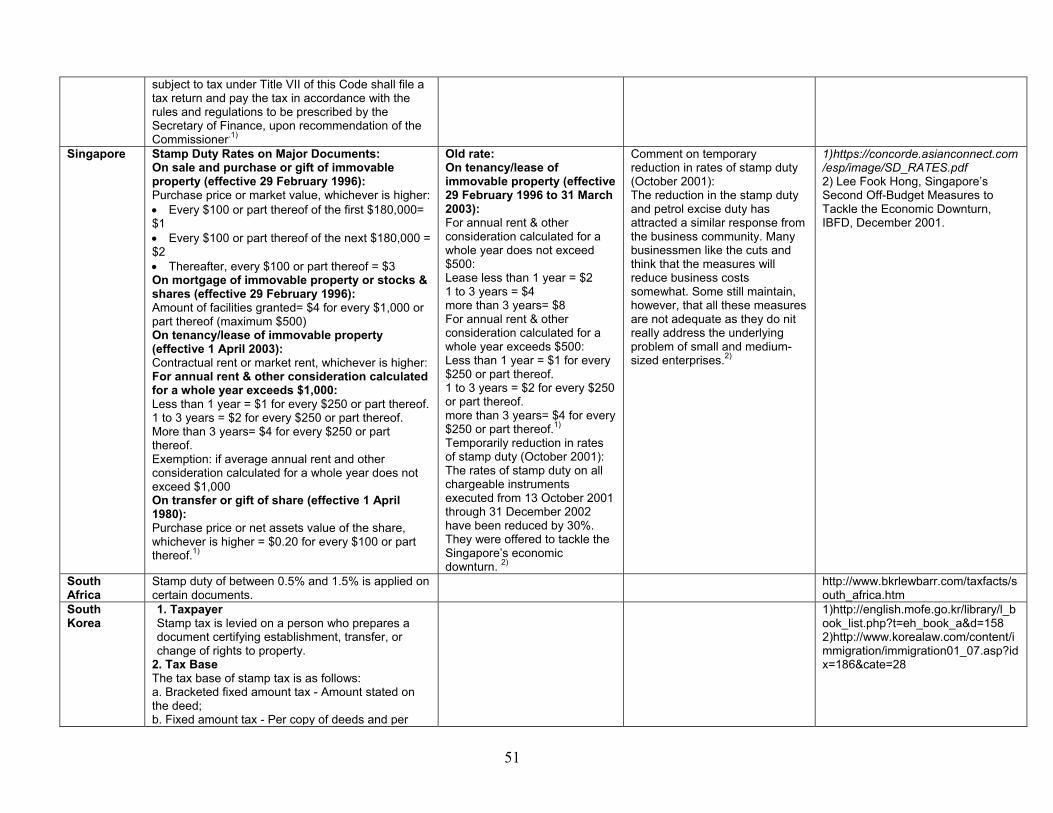
51
subject to tax under Title VII of this Code shall file a tax return and pay the tax in accordance with the rules and regulations to be prescribed by the Secretary of Finance, upon recommendation of the Commissioner.1)
Singapore Stamp Duty Rates on Major Documents: On sale and purchase or gift of immovable property (effective 29 February 1996): Purchase price or market value, whichever is higher: • Every $100 or part thereof of the first $180,000= $1 • Every $100 or part thereof of the next $180,000 = $2 • Thereafter, every $100 or part thereof = $3 On mortgage of immovable property or stocks & shares (effective 29 February 1996): Amount of facilities granted= $4 for every $1,000 or part thereof (maximum $500) On tenancy/lease of immovable property (effective 1 April 2003): Contractual rent or market rent, whichever is higher: For annual rent & other consideration calculated for a whole year exceeds $1,000: Less than 1 year = $1 for every $250 or part thereof. 1 to 3 years = $2 for every $250 or part thereof. More than 3 years= $4 for every $250 or part thereof. Exemption: if average annual rent and other consideration calculated for a whole year does not exceed $1,000 On transfer or gift of share (effective 1 April 1980): Purchase price or net assets value of the share, whichever is higher = $0.20 for every $100 or part thereof.1)
Old rate: On tenancy/lease of immovable property (effective 29 February 1996 to 31 March 2003): For annual rent & other consideration calculated for a whole year does not exceed $500: Lease less than 1 year = $2 1 to 3 years = $4 more than 3 years= $8 For annual rent & other consideration calculated for a whole year exceeds $500: Less than 1 year = $1 for every $250 or part thereof. 1 to 3 years = $2 for every $250 or part thereof. more than 3 years= $4 for every $250 or part thereof.1) Temporarily reduction in rates of stamp duty (October 2001): The rates of stamp duty on all chargeable instruments executed from 13 October 2001 through 31 December 2002 have been reduced by 30%. They were offered to tackle the Singapore’s economic downturn. 2)
Comment on temporary reduction in rates of stamp duty (October 2001): The reduction in the stamp duty and petrol excise duty has attracted a similar response from the business community. Many businessmen like the cuts and think that the measures will reduce business costs somewhat. Some still maintain, however, that all these measures are not adequate as they do nit really address the underlying problem of small and medium-sized enterprises.2)
1)https://concorde.asianconnect.com/esp/image/SD_RATES.pdf 2) Lee Fook Hong, Singapore’s Second Off-Budget Measures to Tackle the Economic Downturn, IBFD, December 2001.
South Africa
Stamp duty of between 0.5% and 1.5% is applied on certain documents.
http://www.bkrlewbarr.com/taxfacts/south_africa.htm
South Korea
1. Taxpayer Stamp tax is levied on a person who prepares a document certifying establishment, transfer, or change of rights to property.
2. Tax Base The tax base of stamp tax is as follows: a. Bracketed fixed amount tax - Amount stated on the deed; b. Fixed amount tax - Per copy of deeds and per
1)http://english.mofe.go.kr/library/l_book_list.php?t=eh_book_a&d=158 2)http://www.korealaw.com/content/immigration/immigration01_07.asp?idx=186&cate=28

52
volume of books. 3. Tax Rate a. Deed of contract concerning transfer of real estate, vessel, aircraft, or business, deed of contract concerning loans for consumption, deed of contract concerning contract for work. 10 million Won> C > 30 million won = 20,000 won. 30 million Won >= C < 50 million won = 40,000 won. 50 million Won <= C < 100 million Won = 70,000 won. 100 million Won <= C < 1 billion Won = 150,000 won more than 1 billion Won = 350,000 b. Deed concerning transfer of registered movable property (car, heavy machinery, vessel) 3,000 Won c. Deed concerning land use rights or easements 3,000 Won d. Deed concerning transfer of mining rights, intangible property, fishing rights, copyright, or firm name rights 3,000 Won e. Deed concerning rights of usable facilities (golf and condominium membership cards) 10,000 Won f. Deed concerning continued and repeated transactions = 1,000 Won g. Merchandise coupon, share certificate, bond, investment certificate, beneficial certificate = 400 won h. Insurance policy, deposit or savings certificate, deposit or savings passbook, trust certificate or passbook = 100 won
i. Deed of contract concerning lease or deferred payment sale = 10,000 won
j. Deed concerning guarantee of obligation: Deed published by a bank = 10,000 won
Deed published by Credit Guarantee Fund = 1,000 won Deed published by an insurer = 200 won
4. Payment In preparing documents, the stamp tax is payable
by passing stamp on the documents. The head of tax office receives stamp tax on cash. 5. Exemption a. Documents prepared by the government or local
autonomous bodies

53
b. Documents prepared with respect to the treatment of treasury funds
c. Documents submitted to government agencies with respect to a donation for public works
d. Documents prepared by charity or relief organizations with respect to their businesses
e. Deed of contract concerning lease or deposit of residential house
f. Merchandise coupon with the face value below 10,000 Won
g. Certificates of acceptance or guarantee of bills h. Copies or transcripts of negotiable securities i. Deed of contract concerning the ownership of
residential house valued at below 1 billion j. Deed of contract concerning loans for
consumption at below 20 million k. Bonds issued by the Bank of Korea or other
international finance bodies 1)
6. Cost of Filing Lawsuit Claim Amount (in Won) Stamp Tax 1 ~ 10,000,000 Won 0.50% of the Claim Amount 10,000,001 ~ 100,000,000 Won 0.45% + 5000 Won 100,000,001 ~ 1,000,000,000 Won 0.40% + 55,000
Won 1,000,000,001 and greater 0.35% + 555,000 Won
The above fees need to be paid at the time of filing the claim. Appellants must also pay an additional, increased stamp tax when filing an appeal as follows: Initial appeals filed with appeals courts are subject to the corresponding stamp tax above plus a surcharge of 50% of the stamp tax amount. Appeals to the Supreme Court of Korea are subject to the corresponding stamp tax above plus a surcharge of 100% of the stamp tax amount. 2)
Switzerland Issuance Stamp Tax A 1% issuance stamp tax is charged on the issuance of all share capital of a company in excess of the first CHF 250,000. All forms of contributions to the equity of a Swiss-domiciled corporation, including deemed contributions, are subject to the stamp tax. However, newly issued shares in the course of reorganizations, mergers, spin-offs and similar transactions are exempt from the tax. Transaction Stamp Tax The federal government imposes a transaction
http://www.geneva.ch/genevaguidestamptax.htm

54
stamp tax as much as 0.15% of the sales price for securities issued by a resident of Switzerland and 0.3% for securities issued by a resident of a foreign country, on the sale or exchange of securities through entities considered to be securities dealers, such as the following : Banks and other financial institutions subject to federal banking legislation, including the Swiss National Bank, business entities (including permanent establishments of foreign entities) as well as individuals whose principal activity is the purchase and sale of securities for their own account or for third parties (traders) or portfolio management, manager of investment funds, and corporations, limited partnerships or cooperatives which own taxable securities with a book value of more than CHF 10 million, taxable securities include shares, bonds, debentures, promissory notes, bills of exchange and long-term certifi-cates of deposit.
Taiwan (Hsiu Chu City)
A. About Stamp Tax The Stamp Tax Law was amended in January 1986. After the amendment, only four items remained taxable. The revenue generated from stamp taxation amounted to only 0.6% of the total tax revenue in 1997. This trend shows that the stamp tax will be phased out in the not too distant future. B. Stamp Tax Rates Monetary receipts: affix tax stamps at 0.4% of the amount received, with the exception of 0.1% for money deposited by bidders. Contracting agreements: affix tax stamps at 0.1% of the contract price. Contracts of deeds for sale, gratuitous transfer, exchange or partition of the contract price or value of the real estate. Contracts for sale of movables: affix tax stamps at NT$12 per piece. 1)
1.http://www.hcct.gov.tw/Eng/page_b08.htm
Taiwan (Taipei)
Types of Document Tax Rate: Monetary receipts – Affix tax stamp at 0.4% of the amount received, with the exception of 0.1% for money deposited by bidders. Dees for sale of movable – Affix tax stamps at NT$12 per piece. Contracting agreements – Affix tax stamps at 0.1% of the contract price.
http://www.tpctax.gov.tw/english/gndstax_stamp.htm

55
Real estate sale, partition and transfer deed – Affix tax stamps at 0.1% of the contract price or value of the real estate. Affixation of Tax Stamps: Tax stamps are available in eight denominations of $1, $3, $5, $10, $12, $20, $50, and $100 Exemptions: • Marketable securities. • Entitlement certificates and licenses, such as land ownership deeds, building ownership deeds, marriage certificates, individual identifications(Personal ID), vehicle registrations, drivers license, building license, operation license, diplomas, etc., which are outside of stamp tax scope, are exempt from stamp tax.
• Rental contract itself is not within the scope of stamp tax. However, if the content of the information serve as a consigned process is subject to a 0.4% of the rental monetary receipt for stamp tax.
• Sales of real estate, other written contracts on real estate property transaction by two concerned parties, (private contracts) where no such contract will report to tax authorities for filing the land value increment tax or land value tax, which fall outside of stamp tax scope, are exempt from stamp tax.
• Contracts or deeds executed by all levels of government agencies.
• Monetary receipts executed by public or private school or colleges.
• Deeds or documents executed by government-owned or private enterprises internally and not involved in rights or obligations with third parties
• Debit notes sent out for claim of payments or audit purposes.
• Copies or abstracts in which case a tax stamp is annexed to the original, with the exception that when such copy or abstract is presented in place of its original, payment of the stamp tax becomes payable.
• Bus tickets, train tickets, boat tickets, and air fair tickets and other tickets for carriage of passengers or cargoes.
• The receipts for sales of self-cultivated agricultural products (farmers in the agriculture, forestry, fishery and livestock) issued by farmers or wholesalers at the first wholesale level on behalf of
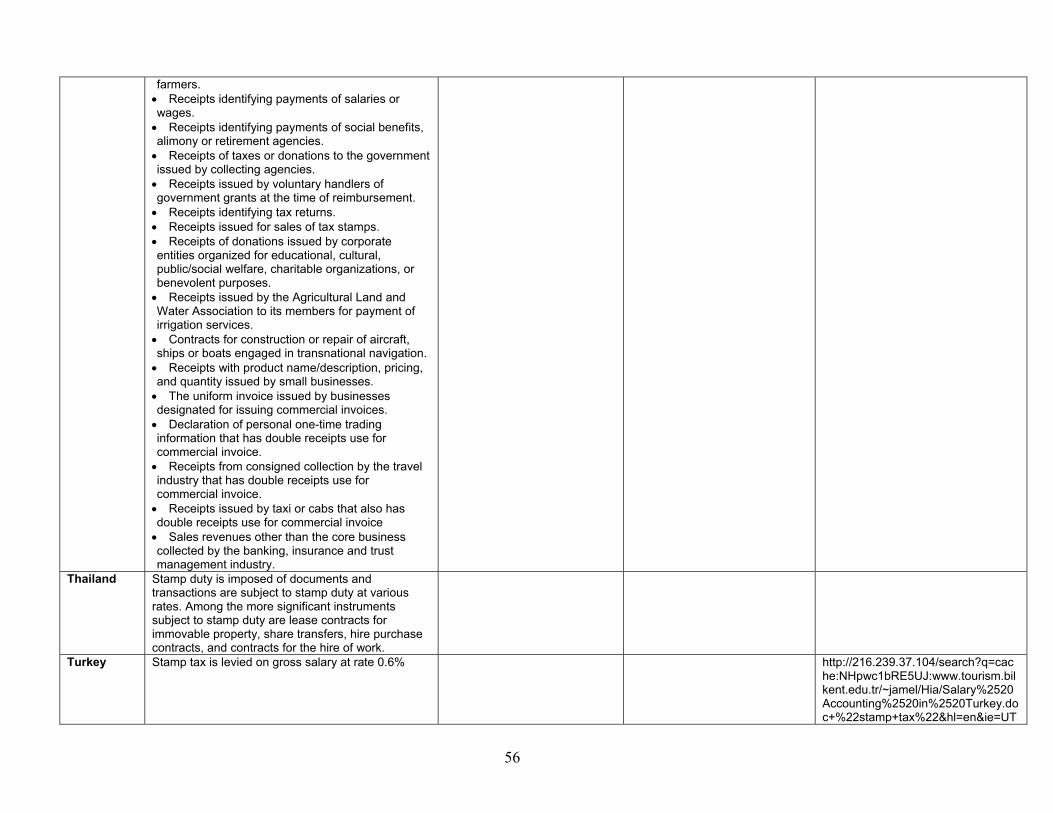
56
farmers. • Receipts identifying payments of salaries or wages.
• Receipts identifying payments of social benefits, alimony or retirement agencies.
• Receipts of taxes or donations to the government issued by collecting agencies.
• Receipts issued by voluntary handlers of government grants at the time of reimbursement.
• Receipts identifying tax returns. • Receipts issued for sales of tax stamps. • Receipts of donations issued by corporate entities organized for educational, cultural, public/social welfare, charitable organizations, or benevolent purposes.
• Receipts issued by the Agricultural Land and Water Association to its members for payment of irrigation services.
• Contracts for construction or repair of aircraft, ships or boats engaged in transnational navigation.
• Receipts with product name/description, pricing, and quantity issued by small businesses.
• The uniform invoice issued by businesses designated for issuing commercial invoices.
• Declaration of personal one-time trading information that has double receipts use for commercial invoice.
• Receipts from consigned collection by the travel industry that has double receipts use for commercial invoice.
• Receipts issued by taxi or cabs that also has double receipts use for commercial invoice
• Sales revenues other than the core business collected by the banking, insurance and trust management industry.
Thailand Stamp duty is imposed of documents and transactions are subject to stamp duty at various rates. Among the more significant instruments subject to stamp duty are lease contracts for immovable property, share transfers, hire purchase contracts, and contracts for the hire of work.
Turkey Stamp tax is levied on gross salary at rate 0.6% http://216.239.37.104/search?q=cache:NHpwc1bRE5UJ:www.tourism.bilkent.edu.tr/~jamel/Hia/Salary%2520Accounting%2520in%2520Turkey.doc+%22stamp+tax%22&hl=en&ie=UT

57
F-8 United Kingdom
Stamp Duty on Shareholders: UK stamp duty or, as the case may be, stamp duty reserve tax(SDRT) will, subject to certain exemptions, be payable on the purchase of Ordinary Shares at a rate of 0.5 per cent of the purchase price. There is a minimum charge of £5 where a stamp duty liability arises.
5 November 2003 Budget and the Finance Bill 2003 contain provisions for a new stamp tax to be called Stamp Duty Land Tax ("SDLT"). This will take effect on 1 December 2003, but there will be important transitional. The proposal for SDLT is a complete rewriting of stamp duty law and procedure in relation to UK land and interests in UK land, but this bulletin will focus on: mainstream transactions on which SDLT will fall more heavily than stamp duty did; and the transitional provisions e.g. for agreements before 1 December 2003. Stamp duty is a tax on documents. SDLT is to be a tax on "transactions" and so liability may arise whether or not there is a document and whether any document is held in the UK or elsewhere. Subject to limited exemptions, SDLT will apply to the acquisition by transfer or creation of the following chargeable interests: an estate, interest (legal or equitable), right or power in or over land in the UK; and the benefit of an obligation, restriction or condition affecting the value of any such estate, interest, right or power. So SDLT will apply to more than just freehold and leasehold transfers and the creation and surrender of leases. The timing of SDLT’s commencement is of particular importance for transactions which may be subject to SDLT but were not subject to stamp duty, or where the SDLT payable may be more
12 November 2003 Joe Churcher and Lesley Richardson, Political Staff, PA News: Changes to stamp duty which will see some retail firms’ bills rise by up to eight times should be scrapped, the Government was told today. Opposition spokesman Mark Prisk said business had united against the proposals, which would hit the pub and leisure industry particularly hard. Mr Prisk said the supposed aim of making stamp duty on leases fairer had been abandoned in favor of “the one overwhelming and desperate need of this Government to collect the maximum tax revenue to fill the black hole in its finances”. “The regulations before us represent not as the Government said ‘another step forward in modernizing stamp duty’. It represents instead two steps back for business. “First, it is a fourfold tax hike unfair for businesses and sectors alike. Second, it is a bad tax. The Government’s consultation had been a “shambles” because everyone consulted was against what was now proposed. Liberal Democrat spokesman David Laws said that because the measures, first unveiled in April’s Budget, would increase duty most on longer leases it would unfairly hit certain sectors such as shops, pubs and restaurants. “There must be a concern about the unfairness.” Introducing the changes, Treasury Financial Secretary Ruth Kelly said ministers had listened to
1)http://www.news.scotsman.com/latest.cfm?id=2169829 2)http://www.thepublican.com/cgi-bin/item.cgi?id=10259&d=32&h=42&f=23&dateformat=%25o%20%25B%20%25Y 3)http://www.mondaq.com/i_article.asp_Q_articleid_E_23211 4)http://www.thepublican.com/cgi-bin/item.cgi?id=9054&d= 32&h=42&f=23&dateformat=%25o%20%25B%20%25Y 5)http://www.money.telegraph.co.uk/money/main.jhtml?xml=/money/2003/10/20/cnruth20.xml&menuId=242&sSheet=/money/2003/10/20/ixfrontcity.html 6)http://icbirmingham.icnetwork.co.uk/0150business/0200news/content_objectid=13617181_method=full_siteid=50002_headline=-Expand-your-home-as-market-contracts-name_page.html 7) Horsman, E. G., The Avoidance of Estate Duty by Gifts Inter Vivos: Some Quantitative Evidence”, The Economic Journal, September 1975)

58
than would have been payable as stamp duty: for example: granting of leases - because the proposal is for new leases to attract SDLT on the premium at a rate of up to 4% as before, but also on the "net present value" of the aggregate of the rents over the lease term at a rate of 1%. This will result in a substantial increase in the tax payable under SDLT for new leases and may encourage shorter lease terms and, given the obligatory nature of SDLT (there is intended to be no vestige of the partially "voluntary" nature of stamp duty) greater focus on whether a landlord can grant a licence instead of a lease in particular cases; exchanges of land – under the proposals SDLT would be payable on both of the properties being exchanged, whereas under previous practice (if structured correctly) stamp duty was payable only on the more expensive property.3) High stamp duty rate rose from 6 to 9 per cent in December 2003.4)
Classical research about stamp duty: The introduction of the capital transfer tax, which brings within the tax net not only wealth transferred at death but also, for the first time in Britain, lifetime gifts whenever they may be made, has served as a fresh reminder of the well-known fact that for many years the estate duty has been avoided on large scale. The value of gifts made
business on the issue. The new regulations would remove 60% of all commercial transactions from the charge completely. And the “vast majority” of residential leases would be removed from the charge entirely. Further reliefs, outlined today, would reduce the amount of extra tax raised by the measures by £20 million to £170 million in the first year. The Government had listened to businesses and introduced measures requested by the industry to “reduce the compliance burden”, she added. 1)
1 July 2003 Counter on introducing “the stamp duty land tax”: The Association of Licensed Multiple Retailers (ALMR) has criticized government plans to reform stamp duty and has pledged support for an amendment to delay implementation of the changes. In a survey of its members, the ALMR discovered that under the new system, the average charge would be £10,000, more than a tenfold increase compared to the current set-up. Nick Bish, chief executive of the ALMR (pictured), said: “The government’s proposals are wrong in principle, flawed in practice and will have a devastating effect on thousands of small businesses. 2)
19 March 2003 The British Retail Consortium (BRC) has slammed the government over its plans to reform stamp duty claiming it will
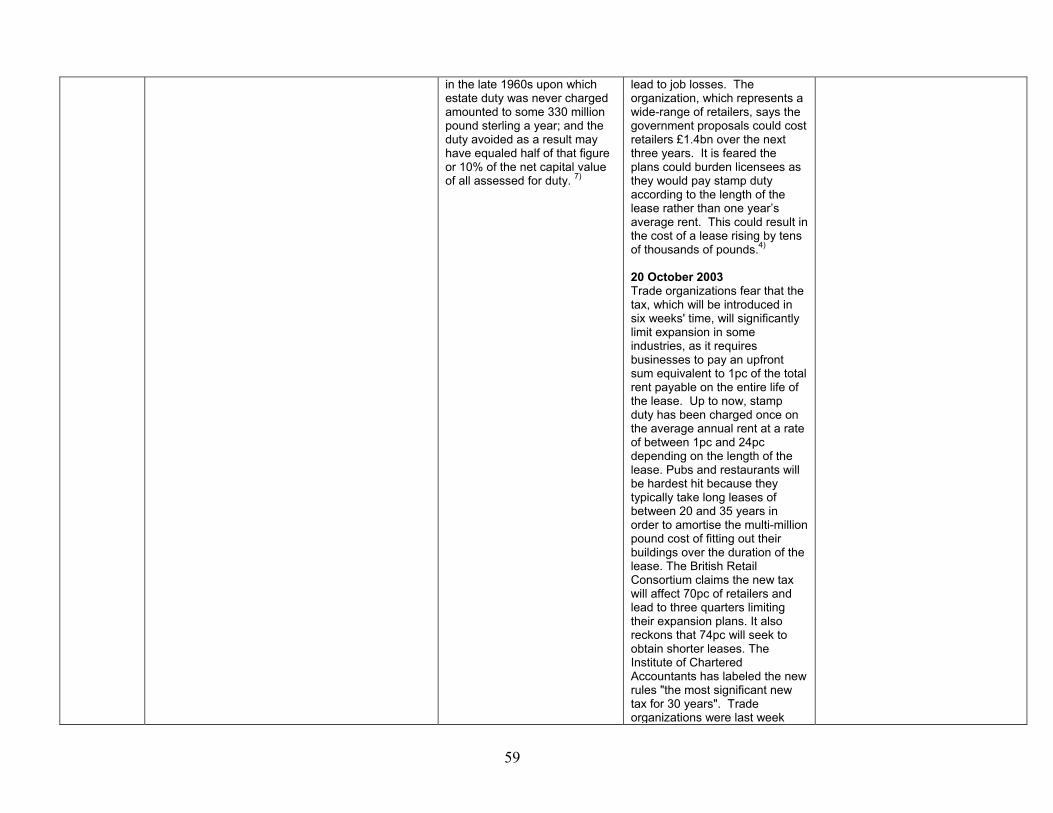
59
in the late 1960s upon which estate duty was never charged amounted to some 330 million pound sterling a year; and the duty avoided as a result may have equaled half of that figure or 10% of the net capital value of all assessed for duty. 7)
lead to job losses. The organization, which represents a wide-range of retailers, says the government proposals could cost retailers £1.4bn over the next three years. It is feared the plans could burden licensees as they would pay stamp duty according to the length of the lease rather than one year’s average rent. This could result in the cost of a lease rising by tens of thousands of pounds.4)
20 October 2003 Trade organizations fear that the tax, which will be introduced in six weeks' time, will significantly limit expansion in some industries, as it requires businesses to pay an upfront sum equivalent to 1pc of the total rent payable on the entire life of the lease. Up to now, stamp duty has been charged once on the average annual rent at a rate of between 1pc and 24pc depending on the length of the lease. Pubs and restaurants will be hardest hit because they typically take long leases of between 20 and 35 years in order to amortise the multi-million pound cost of fitting out their buildings over the duration of the lease. The British Retail Consortium claims the new tax will affect 70pc of retailers and lead to three quarters limiting their expansion plans. It also reckons that 74pc will seek to obtain shorter leases. The Institute of Chartered Accountants has labeled the new rules "the most significant new tax for 30 years". Trade organizations were last week

60
preparing to lambast the Government for its limited consultation before implementing the change. Mark Prisk, the shadow finance secretary to the Treasury, said: "It is ill considered and half-baked." The increase is partly to help compensate the Government for the tax revenue lost under its policy to abolish stamp duty in disadvantaged areas. It estimates that by raising the amount of stamp duty payable on new commercial property leases by as much as 10 times, it can raise revenues from £190m in 2004-05 to £210m by 2005-06. The proposal will raise the levy on individual lease transactions by at least 600pc, although the Government has said that commercial leases with a current value of less than £150,000 will be exempt, a move it says will excuse 60pc of commercial leases from the charge. 5)
In response to rumous that the Chancellor Gordon Brown is planning a new tax grab on home-owners, Savills calculates that tax raised from residential assets in 2002/3 totaled a staggering £4.5 billion, and it fears further taxation "could have negative economic consequences". Since 1997/8, says Savills, a combination of higher stamp duty and rising house prices has produced "a great windfall for the Inland Revenue", with receipts from stamp duty rising four-fold. Sales from £60,000 to £250,000 currently generate the most revenue - £1.4billion - while less
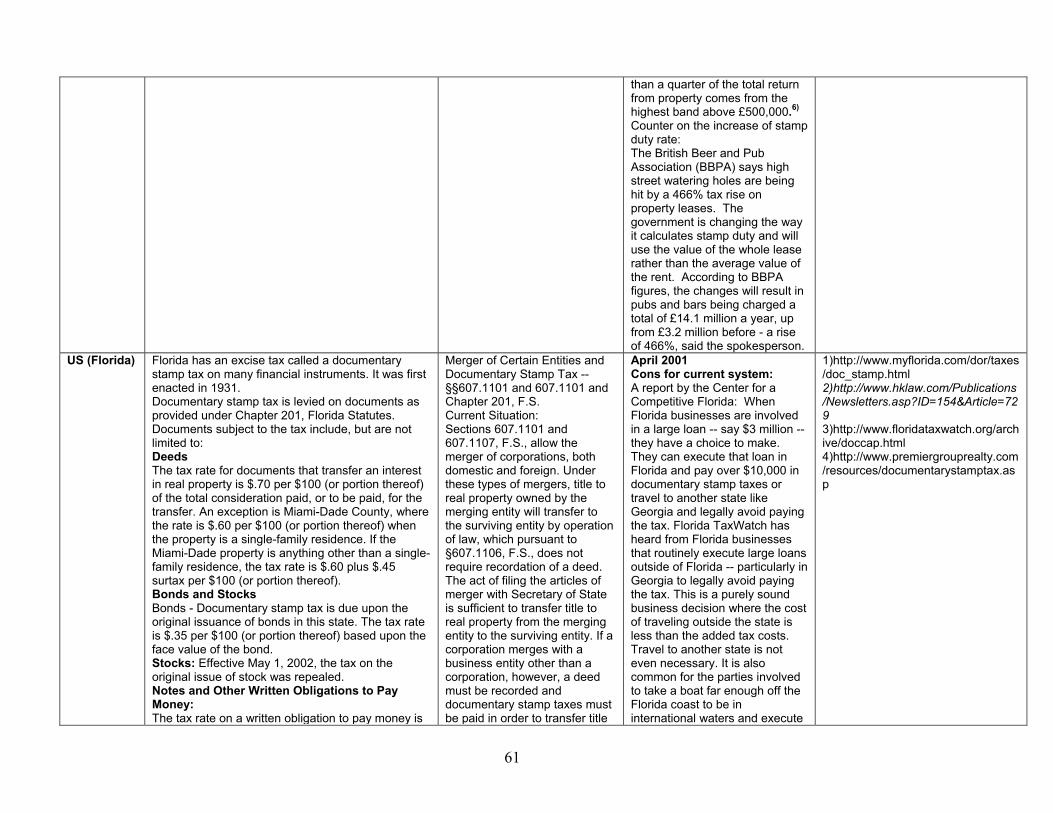
61
than a quarter of the total return from property comes from the highest band above £500,000.6)
Counter on the increase of stamp duty rate: The British Beer and Pub Association (BBPA) says high street watering holes are being hit by a 466% tax rise on property leases. The government is changing the way it calculates stamp duty and will use the value of the whole lease rather than the average value of the rent. According to BBPA figures, the changes will result in pubs and bars being charged a total of £14.1 million a year, up from £3.2 million before - a rise of 466%, said the spokesperson.
US (Florida) Florida has an excise tax called a documentary stamp tax on many financial instruments. It was first enacted in 1931. Documentary stamp tax is levied on documents as provided under Chapter 201, Florida Statutes. Documents subject to the tax include, but are not limited to: Deeds The tax rate for documents that transfer an interest in real property is $.70 per $100 (or portion thereof) of the total consideration paid, or to be paid, for the transfer. An exception is Miami-Dade County, where the rate is $.60 per $100 (or portion thereof) when the property is a single-family residence. If the Miami-Dade property is anything other than a single-family residence, the tax rate is $.60 plus $.45 surtax per $100 (or portion thereof). Bonds and Stocks Bonds - Documentary stamp tax is due upon the original issuance of bonds in this state. The tax rate is $.35 per $100 (or portion thereof) based upon the face value of the bond. Stocks: Effective May 1, 2002, the tax on the original issue of stock was repealed. Notes and Other Written Obligations to Pay Money: The tax rate on a written obligation to pay money is
Merger of Certain Entities and Documentary Stamp Tax -- §§607.1101 and 607.1101 and Chapter 201, F.S. Current Situation: Sections 607.1101 and 607.1107, F.S., allow the merger of corporations, both domestic and foreign. Under these types of mergers, title to real property owned by the merging entity will transfer to the surviving entity by operation of law, which pursuant to §607.1106, F.S., does not require recordation of a deed. The act of filing the articles of merger with Secretary of State is sufficient to transfer title to real property from the merging entity to the surviving entity. If a corporation merges with a business entity other than a corporation, however, a deed must be recorded and documentary stamp taxes must be paid in order to transfer title
April 2001 Cons for current system: A report by the Center for a Competitive Florida: When Florida businesses are involved in a large loan -- say $3 million -- they have a choice to make. They can execute that loan in Florida and pay over $10,000 in documentary stamp taxes or travel to another state like Georgia and legally avoid paying the tax. Florida TaxWatch has heard from Florida businesses that routinely execute large loans outside of Florida -- particularly in Georgia to legally avoid paying the tax. This is a purely sound business decision where the cost of traveling outside the state is less than the added tax costs. Travel to another state is not even necessary. It is also common for the parties involved to take a boat far enough off the Florida coast to be in international waters and execute
1)http://www.myflorida.com/dor/taxes/doc_stamp.html 2)http://www.hklaw.com/Publications/Newsletters.asp?ID=154&Article=729 3)http://www.floridataxwatch.org/archive/doccap.html 4)http://www.premiergrouprealty.com/resources/documentarystamptax.asp

62
$.35 for each $100 (or portion thereof) of the obligation evidenced by the document. Tax is due on a document that contains a promise to pay a specific amount of money and is signed, executed, or delivered in Florida. Effective May 1, 2002, the maximum amount of documentary stamp tax due on unsecured notes or other written obligations is $2,450. Exemptions: Documentary stamp tax is generally payable by any of the parties to a taxable transaction. If one party is exempt, the tax is required of the nonexempt party. United States government agencies; Florida government agencies; and Florida's counties, municipalities, and political subdivisions are exempt from documentary stamp tax. 1)
Penalty and Interest: Any document that, upon audit or when recorded, does not contain evidence of the proper amount of the tax paid is assessed a penalty of 10 percent of the amount of taxed owed per month, not to exceed 50 percent of the tax not paid. A minimum penalty is assessed on late returns, even if no tax is due.4)
to real property pursuant to the merger. In addition, if a limited liability company or a limited partnerships merge with any other business entity recordation of deeds and the payment of documentary stamp taxes are necessary in order to transfer title to real property pursuant to the mergers. See §§607.11101, 608.4383(2), and 620.204(1)(b), F.S. Legislative Change: Senate Bill 2190 (SB 2190), prefiled 3/7/00, amends the above provisions by eliminating the requirement that title to real property held by corporations, limited liability companies, and limited partnerships merging with other business entities be conveyed by recordation of a deed. Thus, title to real property owned by the merging entity would, upon filing of articles of merger with the Secretary of State, pass by operation of law to the surviving entity without the requirement of recording a deed and paying the applicable documentary stamp tax required when recording a deed. In addition, the Bill also amended §608.406, F.S., by adding a provision that limited liability companies that register fictitious names are exempt from the provisions of 608.406(1)(a), F.S., relating to the use of “limited liability company,” “limited company,” or the abbreviations “LLC,” “LC,” or “Ltd.” in companies' name.
the loan there. This too makes the transaction free from the Florida documentary stamp tax. The result is that Florida seldom receives any tax revenue from these loans and businesses have the added cost of travel and extra record-keeping. Legislation before the 2001 Florida Legislature would help change this situation. House Bill 1009 and Senate 2140 would place a cap on documentary stamp taxes on certain obligations, removing an incentive for individuals and businesses to take their financial transactions out of Florida. Florida tax law should not create further incentives for Floridians to take business elsewhere.3)
US (Iowa) 2 June 2003 Iowa enacted its drug tax in 1990, the state has collected nearly $4 million total in penalties and tax revenues.1)
3 June 2003 Iowa added some new twists and are raking in the dough. The state issues stamps, which
In 2002, Iowa took in $1.3 million in drug stamp tax penalties and revenues. Protestors of the tax sound a familiar refrain: "No
)
1)http://www.cannabisnews.com/news/thread16503.shtml 2)http://www.talkleft.com/archives/003324.html
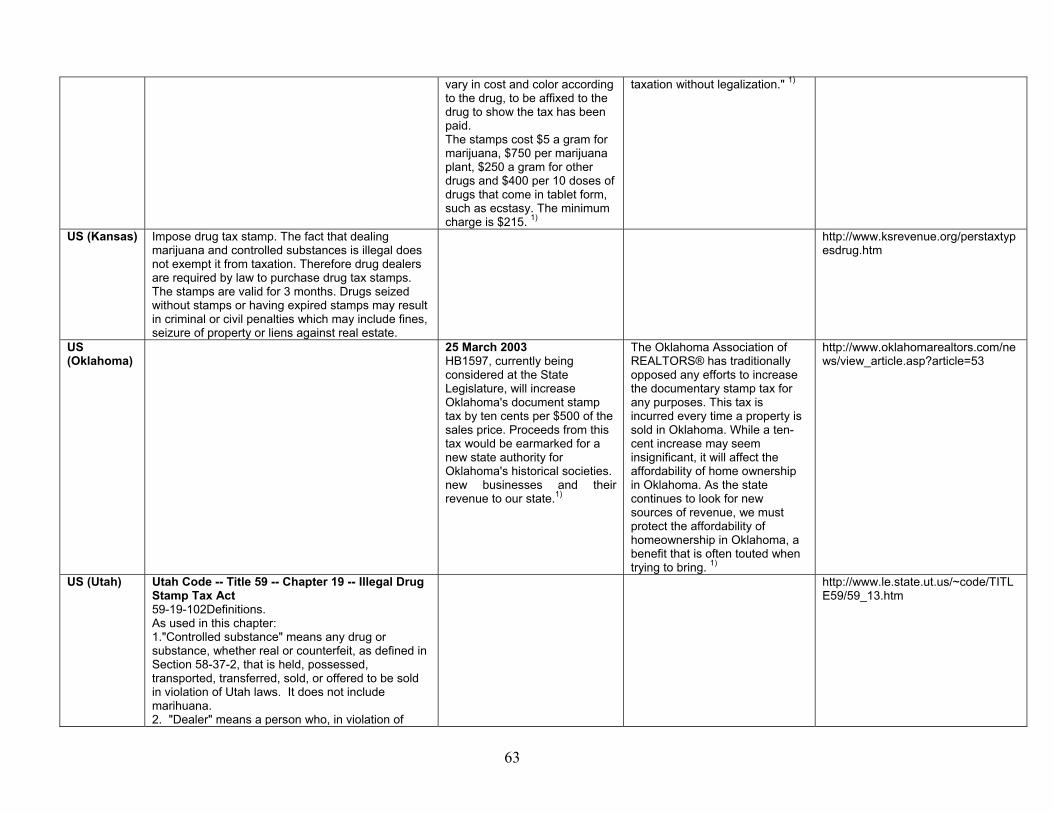
63
vary in cost and color according to the drug, to be affixed to the drug to show the tax has been paid. The stamps cost $5 a gram for marijuana, $750 per marijuana plant, $250 a gram for other drugs and $400 per 10 doses of drugs that come in tablet form, such as ecstasy. The minimum charge is $215. 1)
taxation without legalization." 1)
US (Kansas) Impose drug tax stamp. The fact that dealing marijuana and controlled substances is illegal does not exempt it from taxation. Therefore drug dealers are required by law to purchase drug tax stamps. The stamps are valid for 3 months. Drugs seized without stamps or having expired stamps may result in criminal or civil penalties which may include fines, seizure of property or liens against real estate.
http://www.ksrevenue.org/perstaxtypesdrug.htm
US (Oklahoma)
25 March 2003 HB1597, currently being considered at the State Legislature, will increase Oklahoma's document stamp tax by ten cents per $500 of the sales price. Proceeds from this tax would be earmarked for a new state authority for Oklahoma's historical societies. new businesses and their revenue to our state.1)
The Oklahoma Association of REALTORS® has traditionally opposed any efforts to increase the documentary stamp tax for any purposes. This tax is incurred every time a property is sold in Oklahoma. While a ten-cent increase may seem insignificant, it will affect the affordability of home ownership in Oklahoma. As the state continues to look for new sources of revenue, we must protect the affordability of homeownership in Oklahoma, a benefit that is often touted when trying to bring. 1)
http://www.oklahomarealtors.com/news/view_article.asp?article=53
US (Utah) Utah Code -- Title 59 -- Chapter 19 -- Illegal Drug Stamp Tax Act 59-19-102Definitions. As used in this chapter: 1."Controlled substance" means any drug or substance, whether real or counterfeit, as defined in Section 58-37-2, that is held, possessed, transported, transferred, sold, or offered to be sold in violation of Utah laws. It does not include marihuana. 2. "Dealer" means a person who, in violation of
http://www.le.state.ut.us/~code/TITLE59/59_13.htm

64
Utah law, manufactures, produces, ships, transports, or imports into Utah or in any manner acquires or possesses more than 42-1/2 grams of marihuana, or seven or more grams of any controlled substance, or ten or more dosage units of any controlled substance which is not sold by weight. 3. "Marihuana" means any marihuana, whether real or counterfeit, as defined in Section 58-37-2, that is held, possessed, transported, transferred, sold, or offered to be sold in violation of Utah laws. 59-19-103Tax imposed on marihuana and controlled substances. 1. A tax is imposed on marihuana and controlled substances as defined under this chapter at the following rates: (a) on each gram of marihuana, or each portion of a gram, $3.50; (b) on each gram of controlled substance, or each portion of a gram, $200; and (c) on each 50 dosage units of a controlled substance that is not sold by weight, or portion thereof, $2,000. 2. For the purpose of calculating the tax under this chapter, a quantity of marihuana or other controlled substance is measured by the weight of the substance, whether pure or impure or dilute, or by dosage units when the substance is not sold by weight, in the dealer's possession. A quantity of a controlled substance is dilute if it consists of a detectable quantity of pure controlled substance and any excipients or fillers. 59-19-104Stamps evidencing tax paid to be provided and sold by the commission. 1. The commission shall adopt a uniform system of providing, affixing, and displaying official stamps, official labels, or other official indicia for marihuana and controlled substances on which a tax is imposed. 2. A dealer may not possess any marihuana or controlled substance upon which a tax is imposed by this chapter, unless the tax has been paid on the marihuana or other controlled substance as evidenced by a stamp or other official indicia. 3. Official stamps, labels, or other indicia to be affixed to all marihuana or controlled substances shall be purchased from the commission. The

65
purchaser shall pay 100% of face value for each stamp, label, or other indicia at the time of the purchase.
Vietnam Transfer Taxes Vietnamese law provides that it is mandatory to register the ownership of certain types of property. Registry fees, known in Vietnamese as "le phi truoc ba," are imposed on the purchaser of such property when it registers the ownership of the property. This fee is applicable only to transfers in ownership of certain types of property, including buildings and houses, vehicles, vessels, and guns. Registry fees equal to 2% of the property value must be paid on land, buildings, and vessels. The rate is 4% on vehicles and guns. However, in no case will the registry fees for one asset exceed VND 500 million, which is approximately equal to US $35,714. 1)
1)http://www.taxanalysts.com/www/readingsintaxpolicy.nsf/0/1D537D4C206E166685256B820080661F?OpenDocument
Yemen Revenue stamp is levied on the following documents and deeds in the following manner: a. Contracts as of the time they are signed b. Registers as of the time of their being utilized c. Correspondence and papers as of the time of their being utilized d. Proceedings and transactions immediately upon being realized The revenue stamp tax is of two types: a. A proportional revenue stamp tax. b. A qualitative revenue stamp tax. The price of the qualitative revenue stamp ranges between YR 2 and 50 for certificates, extract copies, applications, contracts, commercial shipping documents, minutes of the meetings of the Boards of companies and internal transactions of banks with their clients. The price of the proportional revenue stamp tax ranges between 0.1% and 5% on insurance, banking and commercial documents, amounts disbursed by the government and the corporations, advertisements and notices. A qualitative revenue stamp tax is levied on each company upon its founding ranging between YR1,000 and YR3,000. A qualitative revenue stamp is levied at the rate of YR 3-500 on transport and mail services, permits, licenses, subscription to telephones, weight certificates, entry in registers and auditors' reports.
http://www.bisnetworld.net/bisnet/countries/yemen11.htm

66
Annex IIA: Stamp Duty Rates for States and Union Territories FY81-FY2003
Basic SC1 Total Basic SC2 Total Basic SC3 Addl. SC4 Total Basic SC Total Basic SC5 Total Basic SC Total
1980-81 4.5 5 9.5 0 8 0 8 4 1 5 12.5 0 12.5
1981-82 4.5 5 9.5 0 3.5 2.8 0.35 6.65 8 0 8 4 1 5 12.5 0 12.5
1982-83 4.5 5 9.5 0 3.5 2.8 0.35 6.65 8 0 8 4 1 5 12.5 0 12.5
1983-84 4.5 5 9.5 0 3.5 2.8 0.35 6.65 8 0 8 4 1 5 12.5 0 12.5
1984-85 4.5 5 9.5 8.25 8.25 3.5 2.8 0.35 6.65 8 0 8 4 1 5 12.5 0 12.5
1985-86 4.5 5 9.5 8.25 8.25 3.5 2.8 0.35 6.65 8 0 8 4 1 5 12.5 0 12.5
1986-87 5 5 10 8.25 8.25 3.5 2.8 0.35 6.65 8 0 8 4 1 5 12.5 0 12.5
1987-88 5 5 10 8.25 8.25 3.5 2.8 0.35 6.65 8 0 8 4 1 5 12.5 0 12.5
1988-89 5 5 10 8.25 8.25 3.5 2.8 0.35 6.65 8 0 8 4 1 5 12.5 0 12.5
1989-90 5 5 10 8.25 8.25 3.5 2.8 0.35 6.65 8 0 8 4 1 5 12.5 0 12.5
1990-91 5 5 10 8.25 8.25 3.5 2.8 0.35 6.65 8 0 8 4 1 5 12.5 0 12.5
1991-92 5 5 10 8.25 8.25 7 2.8 0.35 10.15 8 0 8 4 1 5 12.5 0 12.5
1992-93 5 5 10 8.25 8.25 7 2.8 0.35 10.15 8 0 8 6 1.5 7.5 12.5 0 12.5
1993-94 5 5 10 8.25 8.25 7 2.8 0.35 10.15 8 0 8 6 1.5 7.5 12.5 0 12.5
1994-95 5 5 10 8.25 8.25 7 2.8 0.35 10.15 8 0 8 6 1.5 7.5 12.5 0 12.5
1995-96 5 5 10 8.25 8.25 7 2.8 0.35 10.15 8 0 8 6 1.5 7.5 12.5 0 12.5
1996-97 5 5 10 8.25 8.25 7 2.8 0.35 10.15 8 0 8 6 1.5 7.5 12.5 0 12.5
1997-98 5 5 10 8.25 8.25 7 2.8 0.35 10.15 8 0 8 6 1.5 7.5 12.5 0 12.5
1998-99 5 5 10 8.25 8.25 7 2.8 0.35 10.15 8 0 8 6 1.5 7.5 12.5 0 12.5
1999-2000 5 5 10 8.25 8.25 7 2.8 0.35 10.15 8 0 8 6 1.5 7.5 12.5 0 12.5
2000-01 5 5 10 8.25 8.25 7 2.8 0.35 10.15 8 0 8 8 2 10 12.5 0 12.5
2001-02 5 5 10 8.25 8.25 7 2.8 0.35 10.15 8 0 8 8 2 10 12.5 0 12.5
2002-03 5 5 10 8.25 8.25 7 2.8 0.35 10.15 8 0 8 8 2 10 12.5 0 12.5
2003-04 5 5 10 8.25 8.25 7 2.8 0.35 10.15 8 0 8 8 2 10 12.5 0 12.5
Year Gujarat HaryanaAndhra Pradesh Assam Bihar & Jharkhand Goa, Daman & Diu
2. For surcharge See Section 301 (1) of Assam Muncipal Act, 1958 and 1. The surcharge levied on theamount or value of the consideration for the sale or market value of the property, whichever is higher.
3. The rate of surcharge is 85 paise per Re. 1 of stamp duty since 19.1.1972.4. The rate of additional surcharge is 10% of the amount of stamp duties since 1.12.1977.
5. Additional stamp duty is leviable under Section 3-A of the Bombay Stamp Act (Gujarat), 1958, @ 25% of stamp duty.

67
Annex IIB: Stamp Duty Rates for States and Union Territories FY81-FY2003
Basic SC Total Basic SC Total Basic SC6 Total Basic SC Total Basic SC Total Basic SC Total
1980-81 8 0 8 2 2 7.5 5 12.5 2 2 0
1981-82 8 0 8 2 2 7.5 5 12.5 2 2 0
1982-83 8 0 8 2 2 7.5 5 12.5 2 2 0
1983-84 8 0 8 2 2 7.5 5 12.5 2 2 0
1984-85 8 0 8 2 2 7.5 5 12.5 2 2 0
1985-86 8 0 8 2 2 7.5 5 12.5 2 2 0
1986-87 8 0 8 2 2 7.5 5 12.5 2 2 0
1987-88 8 0 8 10 2 12 7.5 5 12.5 2 2 0
1988-89 8 0 8 10 2 12 7.5 5 12.5 2 2 10 0 10
1989-90 8 0 8 10 2 12 7.5 5 12.5 7.5 4 11.5 10 0 10 7 0 7
1990-91 8 0 8 10 2 12 7.5 5 12.5 7.5 4 11.5 10 0 10 7 0 7
1991-92 8 0 8 10 2 12 8.5 5 13.5 7.5 4 11.5 10 0 10 7 0 7
1992-93 8 0 8 10 2 12 8.5 5 13.5 7.5 4 11.5 10 0 10 7 0 7
1993-94 8 0 8 10 2 12 8.5 5 13.5 7.5 4 11.5 10 0 10 7 0 7
1994-95 8 0 8 6 2 8 8.5 5 13.5 7.5 4 11.5 10 0 10 7 0 7
1995-96 8 0 8 6 2 8 8.5 5 13.5 7.5 4 11.5 8 0 8 7 0 7
1996-97 8 0 8 6 2 8 8.5 5 13.5 7.5 4 11.5 8 0 8 7 0 7
1997-98 8 0 8 8 2 10 8.5 5 13.5 7.5 4 11.5 8 0 8 7 0 7
1998-99 8 0 8 8 2 10 8.5 5 13.5 7.5 4 11.5 8 0 8 7 0 7
1999-2000 8 0 8 8 2 10 8.5 5 13.5 7.5 4 11.5 8 0 8 7 0 7
2000-01 8 0 8 8 2 10 8.5 5 13.5 7.5 4 11.5 8 0 8 7 0 7
2001-02 8 0 8 8 2 10 8.5 5 13.5 7.5 4 11.5 8 0 8 7 0 7
2002-03 8 0 8 8 2 10 8.5 5 13.5 7.5 4 11.5 8 0 8 7 0 7
2003-04 8 0 8 8 2 10 8.5 5 13.5 7.5 4 11.5 8 0 8 7 0 7
Year Kerala Madhya Pradesh and Chattisgarh Maharashtra ManipurHimachal Pradesh Karnataka
6. The surcharge of 4% in muncipal area and 5% in corporation of the consideration is levied separately.

68
Annex IIC: Stamp Duty Rates for States and Union Territories FY81-FY2003
Basic SC Total Basic SC Total Basic SC7 Total Basic SC Total Basic SC Total Basic SC Total
1980-81 9 9 10 0 10 17 0 17 6 5 11
1981-82 6.6 0 6.6 9 9 12.5 0 12.5 17 0 17 6 5 11
1982-83 6.6 0 6.6 9 9 12.5 0 12.5 17 0 17 6 5 11
1983-84 6.6 0 6.6 9 9 12.5 0 12.5 17 0 17 6 5 11
1984-85 6.6 0 6.6 9 9 12.5 0 12.5 17 0 17 6 5 11
1985-86 6.6 0 6.6 10.5 10.5 12.5 0 12.5 17 0 17 6 5 11
1986-87 6.6 0 6.6 10.5 10.5 12.5 0 12.5 17 0 17 6 5 11
1987-88 6.6 0 6.6 4.2 10.5 14.7 12.5 0 12.5 17 0 17 6 5 11
1988-89 6.6 0 6.6 4.2 10.5 14.7 12.5 0 12.5 17 0 17 6 5 11
1989-90 6.6 0 6.6 4.2 10.5 14.7 12.5 0 12.5 0 0 6 5 11
1990-91 6.6 0 6.6 4.2 10.5 14.7 12.5 0 12.5 0 0 6 5 11
1991-92 6.6 0 6.6 4.2 10.5 14.7 12.5 0 12.5 0 0 6 5 11
1992-93 6.6 0 6.6 4.2 10.5 14.7 12.5 0 12.5 10 0 10 6 5 11
1993-94 9.9 0 9.9 4.2 10.5 14.7 12.5 0 12.5 10 0 10 6 5 11
1994-95 9.9 0 9.9 4.2 10.5 14.7 12.6 0 12.6 10 0 10 6 5 11
1995-96 9.9 0 9.9 4.2 10.5 14.7 6 0 6 10 0 10 6 5 11
1996-97 9.9 0 9.9 4.2 10.5 14.7 6 0 6 10 0 10 6 5 11
1997-98 9.9 0 9.9 4.2 10.5 14.7 6 0 6 10 0 10 6 5 11
1998-99 9.9 0 9.9 4.2 10.5 14.7 6 0 6 10 0 10 6 5 11
1999-2000 9.9 0 9.9 4.2 10.5 14.7 6 0 6 10 0 10 6 5 11
2000-01 9.9 0 9.9 4.2 10.5 14.7 6 0 6 10 0 10 8 5 13
2001-02 9.9 0 9.9 4.2 10.5 14.7 6 0 6 11 0 11 8 5 13
2002-03 9.9 0 9.9 4.2 10.5 14.7 6 0 6 11 0 11 8 5 13
2003-04 9.9 0 9.9 4.2 10.5 14.7 6 0 6 11 0 11 8 5 13
NagalandMeghalayaYear TamilnaduRajasthanPunjabOrissa
7. These rates of additional stamp duty are for property situated in urban areas. The rates of additional stamp duty situated in rural areas was 6.5% till 1984-85 and 6% thereafter.

69
Annex IID: Stamp Duty Rates for States and Union Territories FY81-FY2003
Basic SC Total Basic SC Total Basic SC Addl. SC Total Basic SC Total
1980-81 5 0 5 2 2 0 2 2 3 5 8
1981-82 5 0 5 2 2 0 2 2 3 5 8
1982-83 5 0 5 2 2 0 2 2 3 5 8
1983-84 5 0 5 2 2 0 2 2 3 5 8
1984-85 5 0 5 2 2 0 2 2 3 5 8
1985-86 5 0 5 2 2 0 2 2 3 5 8
1986-87 5 0 5 2 2 0 2 2 3 5 8
1987-88 5 0 5 2 2 0 2 2 3 5 8
1988-89 5 0 5 12.5 2 14.5 16 3.2 2 21.2 3 5 8
1989-90 5 0 5 12.5 2 14.5 16 3.2 2 21.2 3 5 8
1990-91 5 0 5 12.5 2 14.5 16 3.2 2 21.2 3 5 8
1991-92 5 0 5 12.5 2 14.5 16 3.2 2 21.2 3 5 8
1992-93 5 0 5 12.5 2 14.5 16 3.2 2 21.2 3 5 8
1993-94 5 0 5 12.5 2 14.5 16 3.2 2 21.2 3 5 8
1994-95 5 0 5 12.5 2 14.5 10 2 2 14 3 5 8
1995-96 5 0 5 12.5 2 14.5 10 2 2 14 3 5 8
1996-97 5 0 5 12.5 2 14.5 5 1 2 8 3 5 8
1997-98 5 0 5 12.5 2 14.5 5 1 2 8 3 5 8
1998-99 5 0 5 8 2 10 5 1 2 8 3 5 8
1999-2000 5 0 5 8 2 10 5 1 2 8 3 5 8
2000-01 5 0 5 8 2 10 5 1 2 8 3 5 8
2001-02 5 0 5 8 2 10 5 1 2 8 8 5 13
2002-03 5 0 5 8 2 10 5 1 2 8 8 5 13
2003-04 5 0 5 8 2 10 5 1 2 8 5 3 8
Year Union Territory of DelhiWest BengalUttar PradeshTripura

70
Annex III: Time Series Analysis of Stamp Duty Revenues in West Bengal
SUMMARY OUTPUT
Regression StatisticsMultiple R 0.9964515R Square 0.9929156 West Bengal Adjusted R Square 0.9872481 Data 2Standard Error 991.67537Observations 10
ANOVAdf SS MS F Significance F
Regression 4 689156219.9 1.72E+08 175.1938 1.471E-05Residual 5 4917100.241 983420Total 9 694073320.1
Coefficients Standard Error t Stat P-value Lower 95% Upper 95% Lower 95.0% Upper 95.0%Intercept -8285.0999 8777.323293 -0.943921 0.388551 -30847.891 14277.69103 -30847.891 14277.691Property Index Res -19.976976 17.08005021 -1.169609 0.294874 -63.882571 23.92861916 -63.882571 23.9286192Total Tax Rate 1543.8517 618.6364365 2.495572 0.054786 -46.401261 3134.104715 -46.401261 3134.10472Total Tax Rate ^2 -76.856187 20.25882888 -3.793713 0.01271 -128.93308 -24.779295 -128.93308 -24.779295Real State GDP/Capita 45.973996 5.980697228 7.687063 0.000594 30.6001491 61.34784221 30.6001491 61.3478422
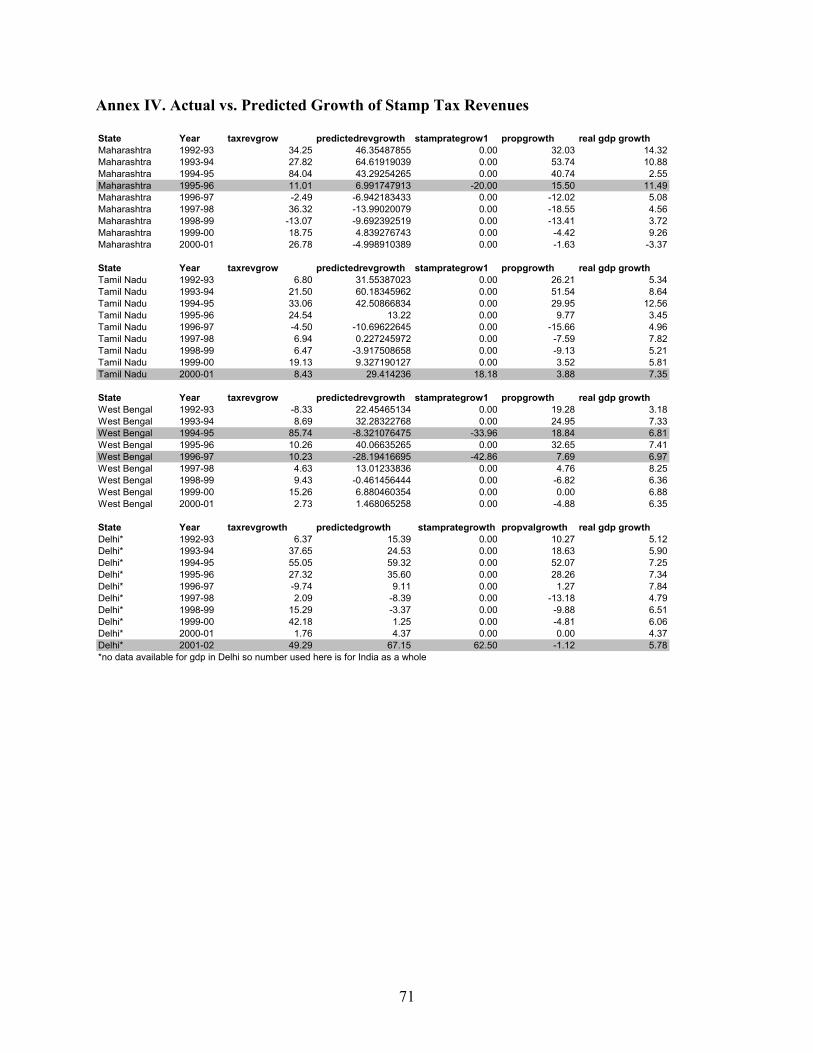
71
Annex IV. Actual vs. Predicted Growth of Stamp Tax Revenues
State Year taxrevgrow predictedrevgrowth stamprategrow1 propgrowth real gdp growthMaharashtra 1992-93 34.25 46.35487855 0.00 32.03 14.32Maharashtra 1993-94 27.82 64.61919039 0.00 53.74 10.88Maharashtra 1994-95 84.04 43.29254265 0.00 40.74 2.55Maharashtra 1995-96 11.01 6.991747913 -20.00 15.50 11.49Maharashtra 1996-97 -2.49 -6.942183433 0.00 -12.02 5.08Maharashtra 1997-98 36.32 -13.99020079 0.00 -18.55 4.56Maharashtra 1998-99 -13.07 -9.692392519 0.00 -13.41 3.72Maharashtra 1999-00 18.75 4.839276743 0.00 -4.42 9.26Maharashtra 2000-01 26.78 -4.998910389 0.00 -1.63 -3.37
State Year taxrevgrow predictedrevgrowth stamprategrow1 propgrowth real gdp growthTamil Nadu 1992-93 6.80 31.55387023 0.00 26.21 5.34Tamil Nadu 1993-94 21.50 60.18345962 0.00 51.54 8.64Tamil Nadu 1994-95 33.06 42.50866834 0.00 29.95 12.56Tamil Nadu 1995-96 24.54 13.22 0.00 9.77 3.45Tamil Nadu 1996-97 -4.50 -10.69622645 0.00 -15.66 4.96Tamil Nadu 1997-98 6.94 0.227245972 0.00 -7.59 7.82Tamil Nadu 1998-99 6.47 -3.917508658 0.00 -9.13 5.21Tamil Nadu 1999-00 19.13 9.327190127 0.00 3.52 5.81Tamil Nadu 2000-01 8.43 29.414236 18.18 3.88 7.35
State Year taxrevgrow predictedrevgrowth stamprategrow1 propgrowth real gdp growthWest Bengal 1992-93 -8.33 22.45465134 0.00 19.28 3.18West Bengal 1993-94 8.69 32.28322768 0.00 24.95 7.33West Bengal 1994-95 85.74 -8.321076475 -33.96 18.84 6.81West Bengal 1995-96 10.26 40.06635265 0.00 32.65 7.41West Bengal 1996-97 10.23 -28.19416695 -42.86 7.69 6.97West Bengal 1997-98 4.63 13.01233836 0.00 4.76 8.25West Bengal 1998-99 9.43 -0.461456444 0.00 -6.82 6.36West Bengal 1999-00 15.26 6.880460354 0.00 0.00 6.88West Bengal 2000-01 2.73 1.468065258 0.00 -4.88 6.35
State Year taxrevgrowth predictedgrowth stamprategrowth propvalgrowth real gdp growthDelhi* 1992-93 6.37 15.39 0.00 10.27 5.12Delhi* 1993-94 37.65 24.53 0.00 18.63 5.90Delhi* 1994-95 55.05 59.32 0.00 52.07 7.25Delhi* 1995-96 27.32 35.60 0.00 28.26 7.34Delhi* 1996-97 -9.74 9.11 0.00 1.27 7.84Delhi* 1997-98 2.09 -8.39 0.00 -13.18 4.79Delhi* 1998-99 15.29 -3.37 0.00 -9.88 6.51Delhi* 1999-00 42.18 1.25 0.00 -4.81 6.06Delhi* 2000-01 1.76 4.37 0.00 0.00 4.37Delhi* 2001-02 49.29 67.15 62.50 -1.12 5.78*no data available for gdp in Delhi so number used here is for India as a whole

72
Annex V: Stamp Tax Revenue Data Across States
Figure 2a: Annual Percentage Change in Stamp Duty Revenues and Rates
Figure 2b: Stamp Duty Revenues and Rates
Delhi
Delhi
-60-40-20
020406080
100
1980-811985-86
1990-911995-96
2000-01
Year
Ann
ual %
Cha
nge
Tax Rev Stamp Rate
Delhi
05000
1000015000
200002500030000350004000045000
Year
Rs.
Lak
hs
0.0%
2.0%
4.0%
6.0%
8.0%
10.0%
12.0%
14.0%
Rat
e (%
)
Tax Revenue Stamp Rate
Andhra Pradesh
05
1015202530354045
1980-811985-86
1990-911995-96
2000-01
Year
% c
hang
e an
nual
ly
Tax Revenue Stamp Tax Rate
Andhra Pradesh Figure 1b: Stamp Duty Revenues
and Rates Figure 1a: Annual Percentage Change
in Stamp Duty Revenues and Rates
Andhra Pradesh
0
1000020000
3000040000
5000060000
7000080000
90000
36047199
1578637587
76630
YearR
s. L
akhs
9.2%
9.3%9.4%
9.5%9.6%
9.7%9.8%
9.9%10.0%
10.1%
Rat
e (%
)
Tax Revenue Stamp Rate
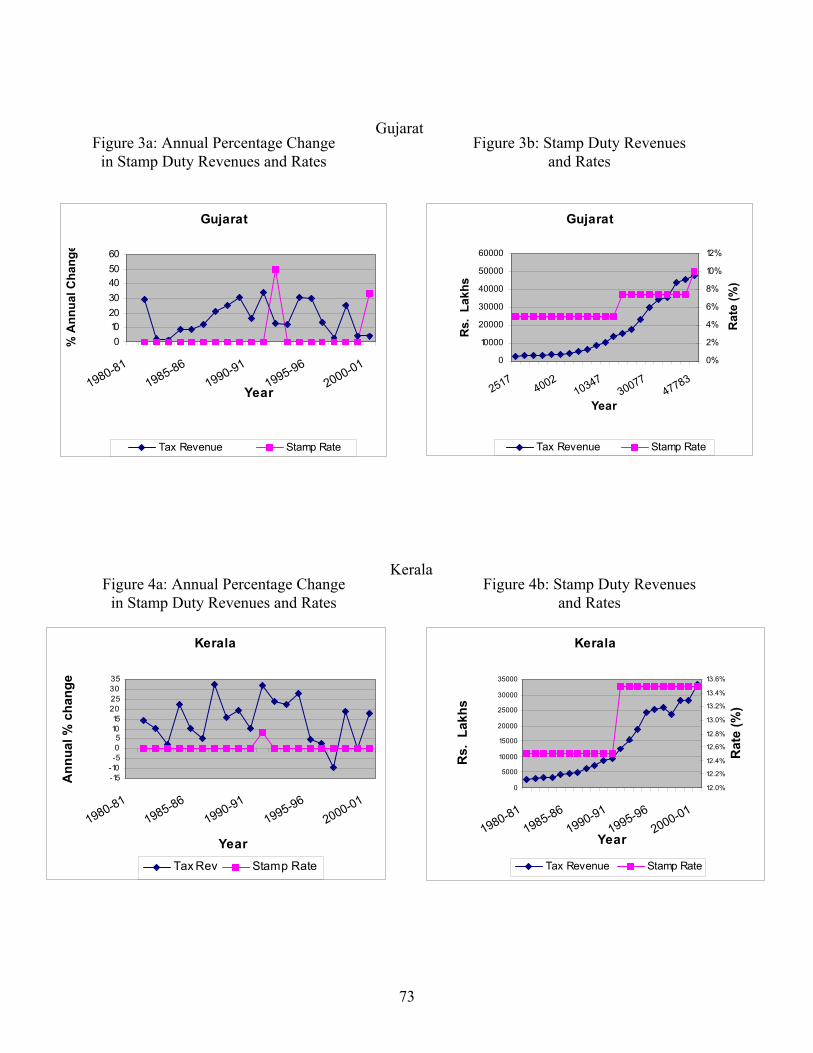
73
Figure 3a: Annual Percentage Change in Stamp Duty Revenues and Rates
Figure 3b: Stamp Duty Revenues and Rates
Gujarat
Gujarat
0102030405060
1980-811985-86
1990-911995-96
2000-01
Year
% A
nnua
l Cha
nge
Tax Revenue Stamp Rate
Gujarat
0
10000
20000
30000
40000
50000
60000
25174002
1034730077
47783
Year
Rs.
Lak
hs
0%
2%
4%
6%
8%
10%
12%
Rat
e (%
)
Tax Revenue Stamp Rate
Kerala
0
5000
10000
15000
20000
25000
30000
35000
1980-811985-86
1990-911995-96
2000-01
Year
Rs.
Lak
hs
12.0%
12.2%
12.4%
12.6%
12.8%
13.0%
13.2%
13.4%
13.6%
Rat
e (%
)
Tax Revenue Stamp Rate
Kerala
-15-10-505
1015
20253035
1980-811985-86
1990-911995-96
2000-01
Year
Ann
ual %
cha
nge
Tax Rev Stamp Rate
Figure 4a: Annual Percentage Change in Stamp Duty Revenues and Rates
Figure 4b: Stamp Duty Revenues and Rates
Kerala

74
Figure 6a: Annual Percentage Change in Stamp Duty Revenues and Rates
Figure 6b: Stamp Duty Revenues and Rates
Maharashtra
Maharashtra
-40-20
020406080
100
1980-811985-86
1990-911995-96
2000-01
Year
Ann
ual %
Cha
nge
Tax Revenue Stamp Rate
Maharashtra
0
50000
100000
150000
200000
1980-811985-86
1990-911995-96
2000-01
Year
Rs.
Lak
hs
0.0%2.0%4.0%6.0%8.0%10.0%12.0%
Rat
e (%
)
Tax Revenue Stamp Rate
Figure 5a: Annual Percentage Change in Stamp Duty Revenues and Rates
Figure 5b: Stamp Duty Revenues and Rates
Madhya Pradesh
Madhya Pradesh
05000
1000015000
200002500030000350004000045000
1980-811985-86
1990-911995-96
2000-01
Year
Rs.
Lak
hs
0.0%
2.0%
4.0%
6.0%
8.0%
10.0%
12.0%
14.0%
Rat
e (%
)
Tax Revenue Stamp Rate
Madhya Pradesh
-1000
100200300400500
1980-811985-86
1990-911995-96
2000-01
Year
Ann
ual %
Cha
nge
Tax Rev Stamp Rate

75
Figure 7a: Annual Percentage Change in Stamp Duty Revenues and Rates
Figure 7b: Stamp Duty Revenues and Rates
Orissa
Orissa
-20
-10
0
10
20
30
40
50
1980-811985-86
1990-911995-96
2000-01
Year
Ann
ual %
Cha
nge
Tax Revenue Stamp Rate
Orissa
0
10002000
3000
4000
50006000
7000
80009000
10000
1980-811985-86
1990-911995-96
2000-01
YearR
s. L
akhs
0.0%
2.0%
4.0%
6.0%
8.0%
10.0%
12.0%
14.0%
16.0%
Rat
e (%
)
Tax Revenue Stamp Rate
Figure 8a: Annual Percentage Change in Stamp Duty Revenues and Rates
Figure 8b: Stamp Duty Revenues and Rates
Punjab
Punjab
0
5000
10000
15000
20000
25000
30000
35000
40000
1980-811985-86
1990-911995-96
2000-01
Year
Rs.
Lak
hs
0.00%
2.00%
4.00%
6.00%
8.00%
10.00%
12.00%
14.00%R
ate
(%)
Tax Revenue Stamp Rate
Punjab
-60-40-20
0204060
1980-811985-86
1990-911995-96
2000-01
Year
Ann
ual %
Cha
nge
Tax Revenue Stamp Rate

76
Figure 10a: Annual Percentage Change in Stamp Duty Revenues and Rates
Figure 10b: Stamp Duty Revenues and Rates
Uttar Pradesh
Uttar Pradesh
020000400006000080000
100000120000
1980-811985-86
1990-911995-96
2000-01
Year
Rs.
Lak
hs
0.0%2.0%4.0%6.0%8.0%10.0%12.0%14.0%16.0%
Rat
e (%
)
Tax Revenue Stamp Rate
Uttar Pradesh
-1000
100200300400500600700
1980-811985-86
1990-911995-96
2000-01
Year
Ann
ual %
Cha
nge
Tax Revenue Stamp Rate
Tamil Nadu
0200004000060000
80000100000120000
1980-811985-86
1990-911995-96
2000-01
YearR
s. L
akhs
10.0%10.5%11.0%11.5%12.0%12.5%13.0%13.5%
Rat
e (%
)
Tax Revenue Stamp Rate
Tamil Nadu
-10
0
10
20
30
40
1980-811985-86
1990-911995-96
2000-01
Year
Ann
ual %
Cha
nge
Tax Revenue Stamp Rate
Figure 9b: Stamp Duty Revenues and Rates
Figure 9a: Annual Percentage Change in Stamp Duty Revenues and Rates
Tamil Nadu

77
Figure 11a: Annual Percentage Change In Stamp Duty Revenues and Rates
Figure 11b: Stamp Duty Revenues and Rates
West Bengal
West Bengal
05000
10000150002000025000300003500040000
1980-811985-86
1990-911995-96
2000-01
Year
Rs.
Lak
hs
0.0%5.0%10.0%15.0%20.0%25.0%
Rat
e (%
)
Tax Revenue Stamp Rate
West Bengal
-2000
200400600800
10001200
1980-811985-86
1990-911995-96
2000-01
Year
Ann
ual %
Cha
nge
Tax Revenue Stamp Rate

78
Figure 12: Pooled Instances of Rate Changes against Revenue Change (All Above States)
All State Pooled
-60
-40-20
0
20
4060
80
100
-200 0 200 400 600 800 1000 1200
stamp rate growth
tax
reve
nue
grow
th
Regression StatisticsMultiple R 0.256082R Square 0.065578Adjusted R 0.003283Standard E 24.24569Observatio 17
ANOVAdf SS MS F ignificance F
Regression 1 618.8332 618.8332 1.0527 0.321148Residual 15 8817.801 587.8534Total 16 9436.634
Coefficientstandard Erro t Stat P-value Lower 95%Upper 95%Lower 95.0%Upper 95.0%Intercept 18.88986 6.429734 2.937892 0.010181 5.185201 32.59453 5.185201 32.59453X Variable -0.021837 0.021284 -1.026012 0.321148 -0.067202 0.023528 -0.067202 0.023528

79
Figure 14a: Maharashtra
Figure 14b:
MaharashtraPredicted Revenue Growth
vs. Actual Revenue Growth and Stamp Tax
-40
-20
0
20
40
60
80
100
1992-931994-95
1996-971998-99
2000-01
Gro
wth
(%)
taxrevgrowstamprategrow1predictedrevgrowth
MaharashtraAll growth except Predicted Revenues
-40
-20
0
20
40
60
80
100
1992-931994-95
1996-971998-99
2000-01
Gro
wth
(%)
prop val grow th
real gdp grow th
Figure 13a: Figure 13b:
DelhiPredicted Revenue Growth
vs. Actual Revenue Growth and Stamp Tax
-20.000.00
20.0040.0060.0080.00
100.00
1992-931994-95
1996-971998-99
2000-01
taxrevgrowstamprategrow1predictedrevgrowth
Delhi Revenue Drivers
-60.00-40.00-20.00
0.0020.0040.0060.0080.00
100.00
1992-931994-95
1996-971998-99
2000-01
prop val grow th
real gdp grow th
Delhi

80
Figure 15a: Figure 15b: Tamil Nadu
Tamil NaduPredicted Revenue Growth
vs. Actual Revenue Growth and Stamp Tax
-30
-10
10
30
50
70
1992-931994-95
1996-971998-99
2000-01
taxrevgrowstamprategrow1predictedrevgrowth
Tamil Nadu All growth except Predicted Revenues
-30
-10
10
30
50
70
1992-931994-95
1996-971998-99
2000-01
prop val grow th
real gdp grow th
Figure 16a: West Bengal
Figure 16b:
West BengalPredicted Revenue Growth vs.
Actual Revenue Growth and Stamp Tax
-60-40-20
020406080
100
1992-931994-95
1996-971998-99
2000-01
taxrevgrowstamprategrow1predictedrevgrowth
West BengalAll growth except Predicted Revenues
-60-40-20
020406080
100
1992-931994-95
1996-971998-99
2000-01
prop val grow th
real gdp grow th