stamford raffles lecture 2013
TRANSCRIPT

ZSL Science and Conservation Events Tuesday 18 June 2013
Stamford Raffles Lecture A very dangerous experiment with our planet
Professor Sir Brian Hoskins CBE FRS
Director of Grantham Institute for Climate Change Imperial College London

A very dangerous experiment with our planet
Brian Hoskins
Director, Grantham Institute for Climate Change, Imperial College London Professor of Meteorology, University of Reading

Carbon Dioxide Measurements over the past year
Mauna Loa, Hawaii
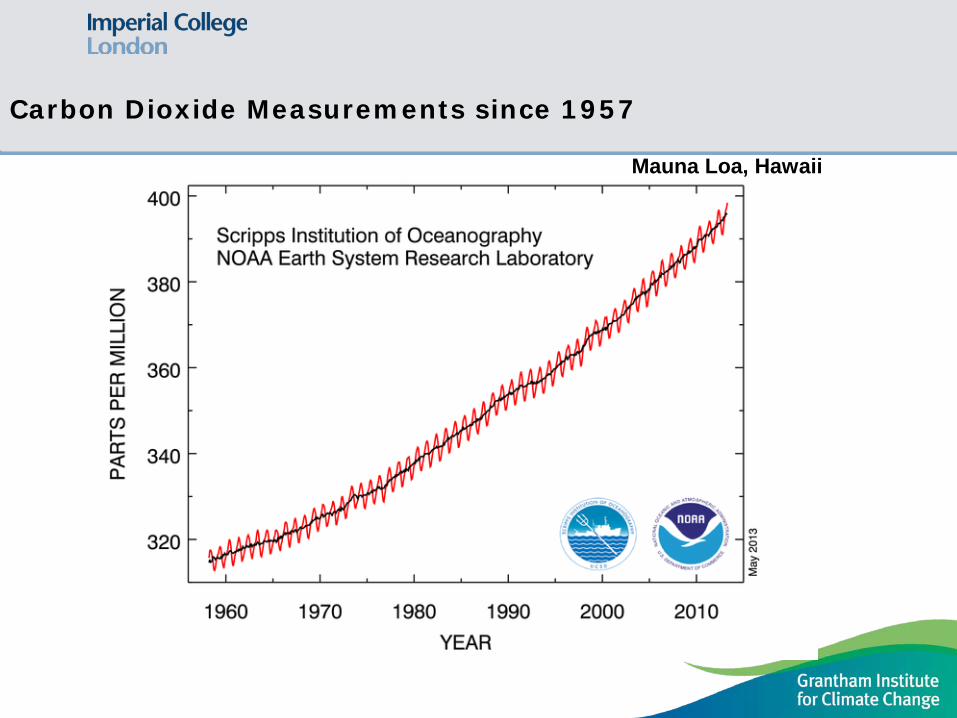
Carbon Dioxide Measurements since 1957
Mauna Loa, Hawaii
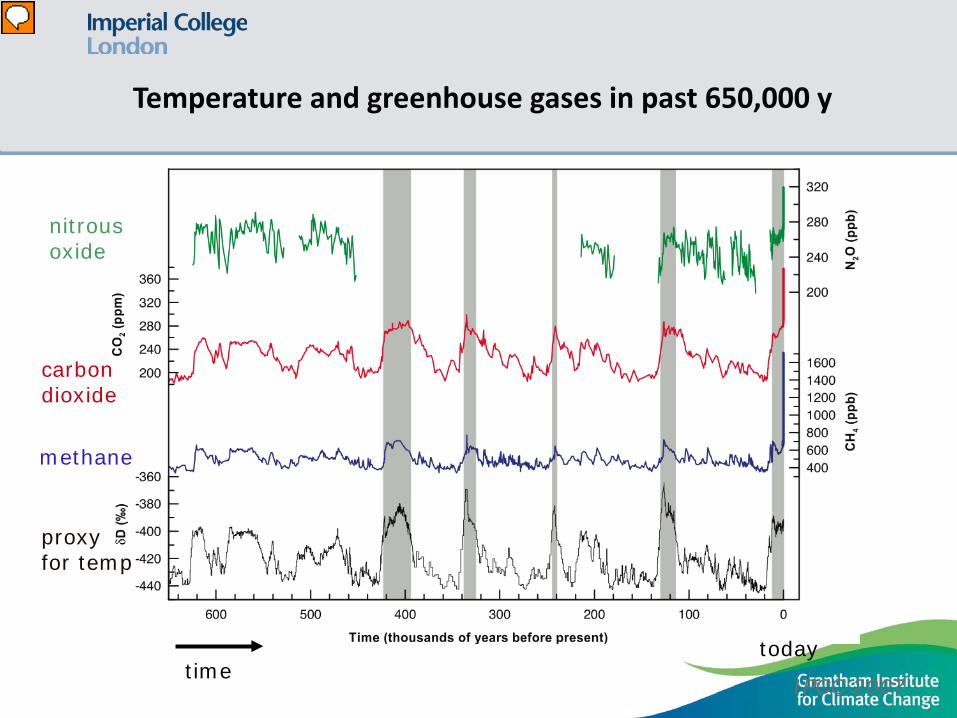
Temperature and greenhouse gases in past 650,000 y
proxy for temp
methane
carbon dioxide
nitrous oxide
today time
IPCC 2007

The Energy Budget of the Earth
341 Wm-2
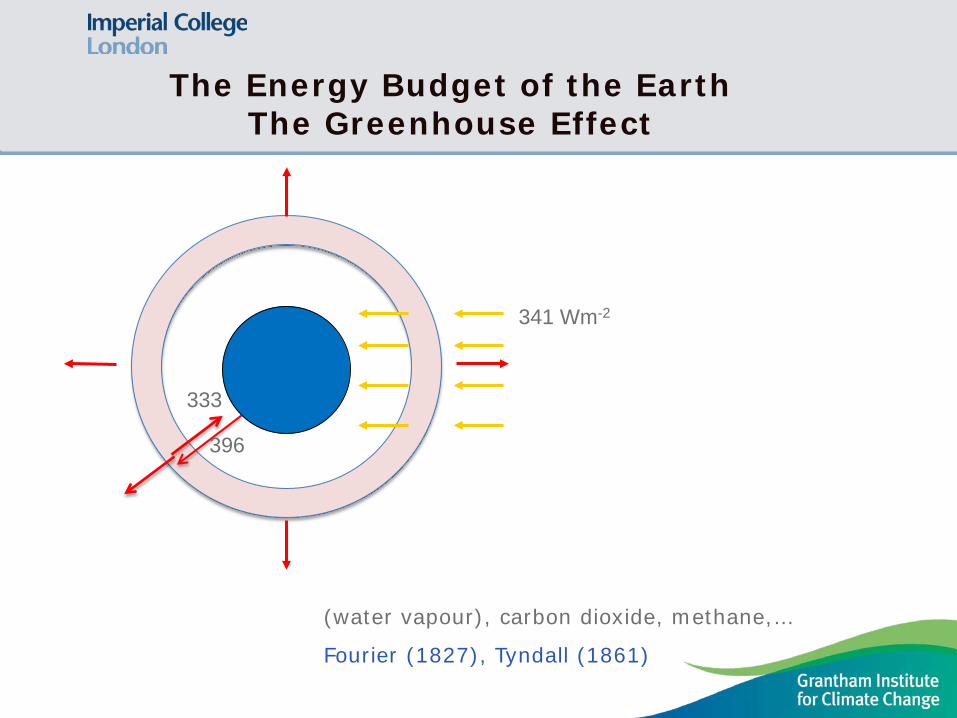
(water vapour), carbon dioxide, methane,…
Fourier (1827), Tyndall (1861)
The Energy Budget of the Earth The Greenhouse Effect
341 Wm-2
396
333

Carbon Dioxide in the Atmosphere
We can be very confident that this rise in carbon dioxide in the
atmosphere is due to the activities of humans
land use change
emissions of greenhouse gases,
principally by burning coal, oil & gas
If 100t of carbon dioxide is added to the atmosphere
atmospheric content will be 40t greater after 20 years
35t greater after 100 years
25t greater after 1000 years

Estimated causes of the current imbalance in the energy budget of Planet Earth
IPCC 2007
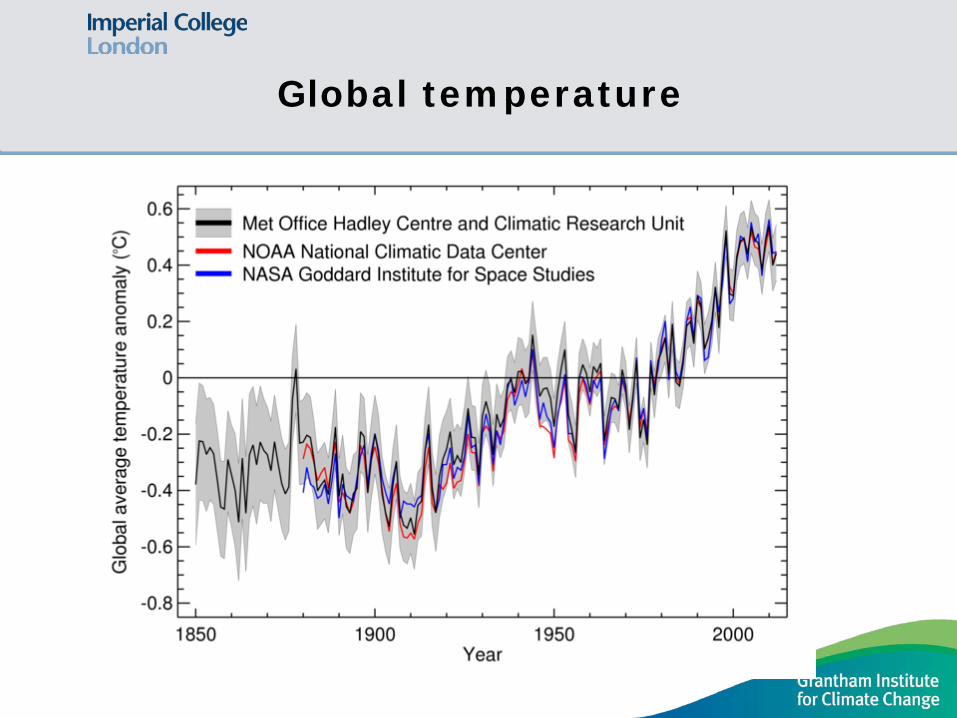
Global temperature

Global temperatures and 20 year running average
20-year Running average
°C
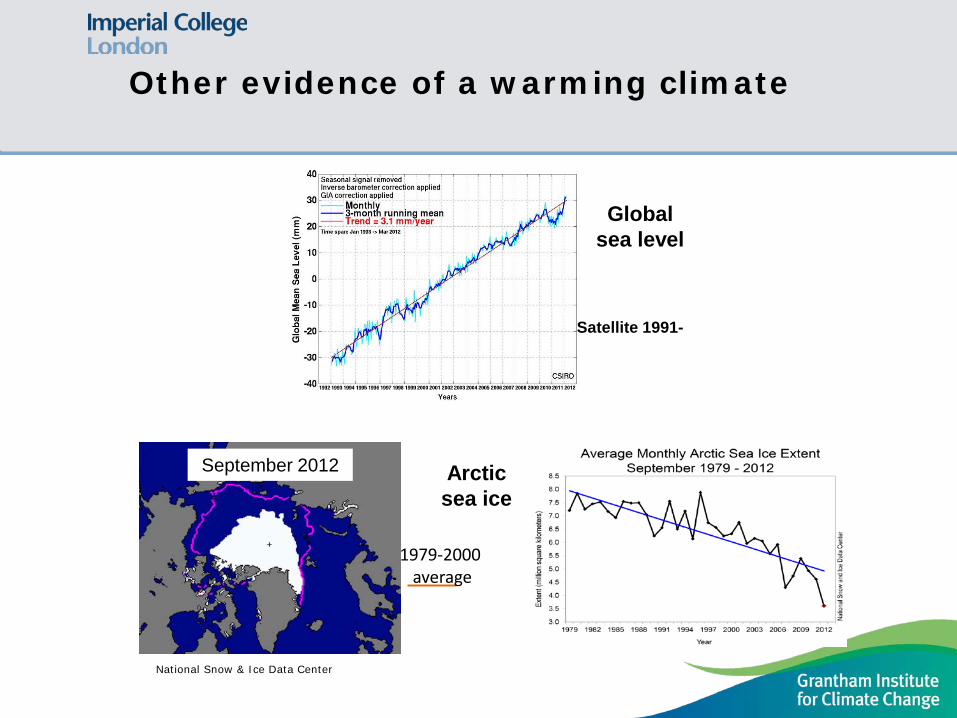
Other evidence of a warming climate
Global sea level
Satellite 1991-
National Snow & Ice Data Center
1979-2000 average
September 2012 Arctic sea ice
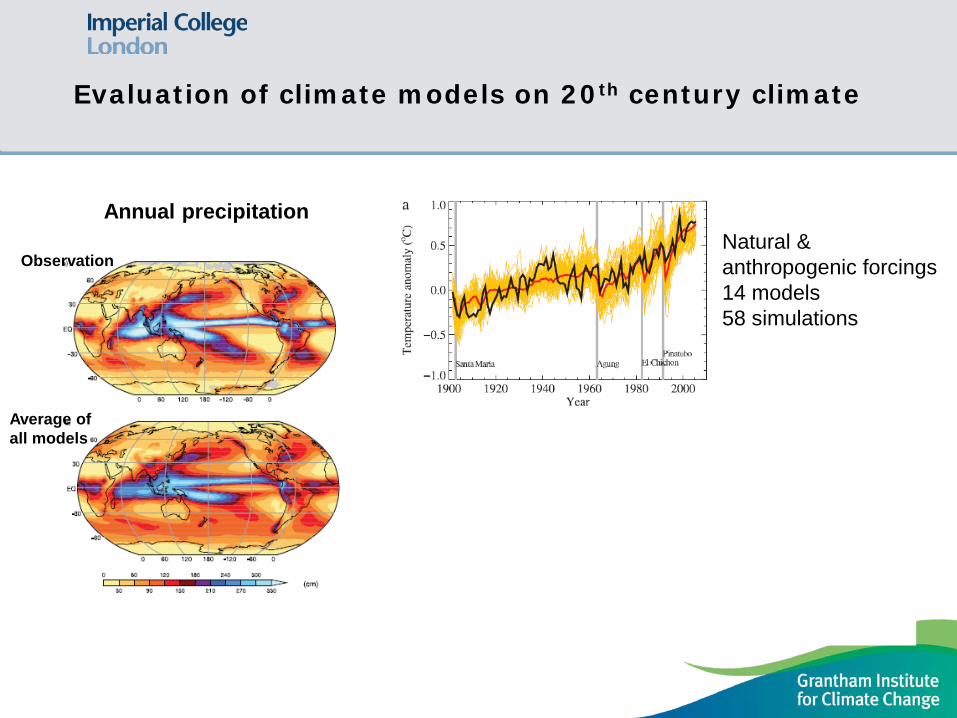
Natural & anthropogenic forcings 14 models 58 simulations
Natural forcings only 5 models 19 simulations
Evaluation of climate models on 20th century climate
Annual precipitation
Observation
Average of all models

Increase in solar flux
Increase in long-lived GHGs
Mean Temperature changes in models for changed conditions
height
latitude
IPCC AR4 WGp1 Ch8

Projections: globally averaged surface Temperature IPCC 2007

Projected changes for end of century – unconstrained emissions
Dec –Feb Temperature Dec –Feb precipitation

Decadal Temperature trends at end of 21st century (A1B)
Ed Hawkins

Swiss Temperature Series 1864-2003 (mean of 4 stations) Schär et al. 2004, Nature, 427, 332-336
2010 Russian Heat Wave Barriopedro 2011
Frequency of occurrence of local T anomalies/local standard deviation of T Hansen et al 2012
Extreme Summer Heat in the Past Decade
2012 US summer
Temperature ºF
Rain %

Cold winter extremes of the past few years
Winter 2009/10 Eurasian cold
16 Nov- 25 Dec 2010
Dec 2010 Record cold in UK
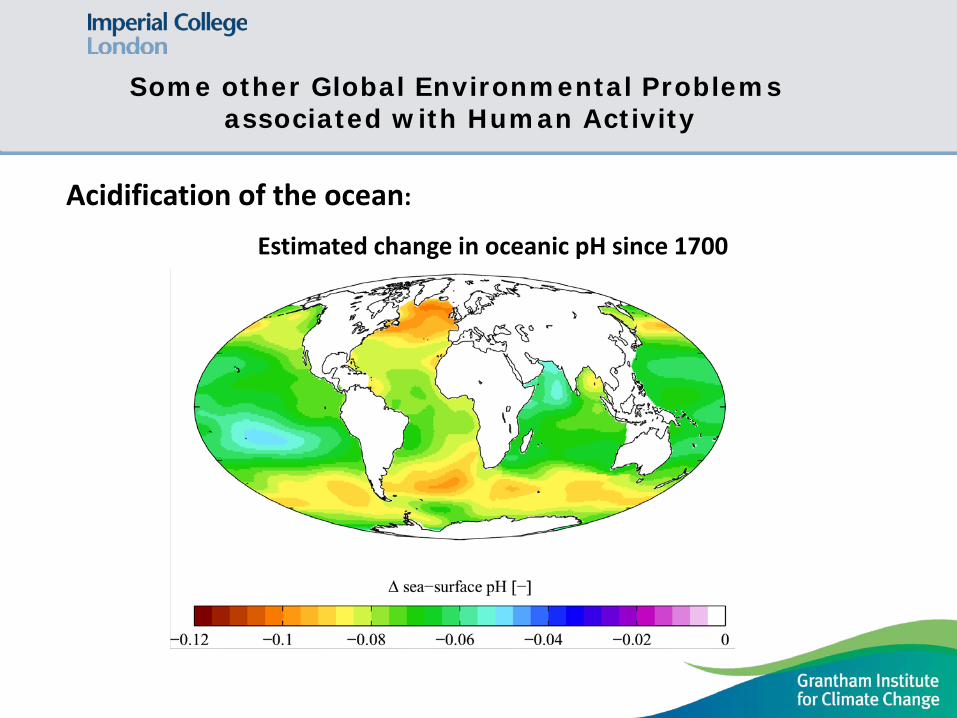
Acidification of the ocean:
Estimated change in oceanic pH since 1700
Some other Global Environmental Problems associated with Human Activity

/
Stratospheric Ozone Depletion
BAS Column ozone measurements 1956-2007 Satellite views of ozone hole 1996-2012

Future low-level Ozone concentration – 2090s
60-80 ppb 100-120
Vitousek (1994)
Sulphur deposition risen by 2-3
Aerosols: the Asian Brown Cloud

Drivers of Change in Biodiversity & Ecosystems Millennium Ecosystem Assessment

The anthropogenic climate change problem
The impacts derived from climate models are what are likely to occur if we are lucky -
increasing chance of crossing thresholds in the climate &/or natural or social systems
Context: growing world population need for development changing diet increased demand for food, water & energy other global environmental changes Impacts: water supply flooding ecosystems agriculture coastal erosion & flooding health ecosystems
“Climate Disruption” rather than “Global Warming”
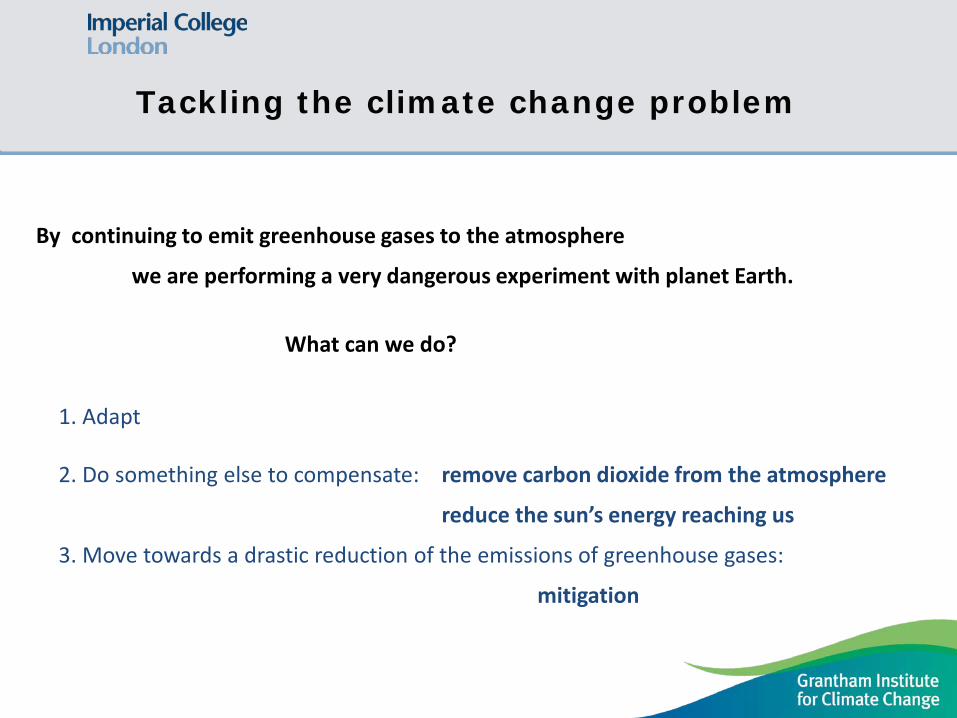
Tackling the climate change problem
By continuing to emit greenhouse gases to the atmosphere
we are performing a very dangerous experiment with planet Earth.
1. Adapt
2. Do something else to compensate: remove carbon dioxide from the atmosphere
reduce the sun’s energy reaching us
3. Move towards a drastic reduction of the emissions of greenhouse gases:
mitigation
What can we do?

Mitigation
UK Climate Change Bill (Nov 2008)
• Commitment for at least 80% reduction in carbon dioxide emissions by 2050 • Established system of legally binding 5-year “carbon budgets” • Established the Climate Change Committee (CCC) to advise, monitor & report
International UN Framework Convention on Climate Change Kyoto Protocol, Conference of the Parties, …Copenhagen, Cancun, Durban, Doha…. Pledged: make 2015 agreement to start in 2020
EU 20% emissions reduction from 1990 levels by 2020, 30/40% by 2030? 2050 objective 80-95%
Many state or national targets e.g. China
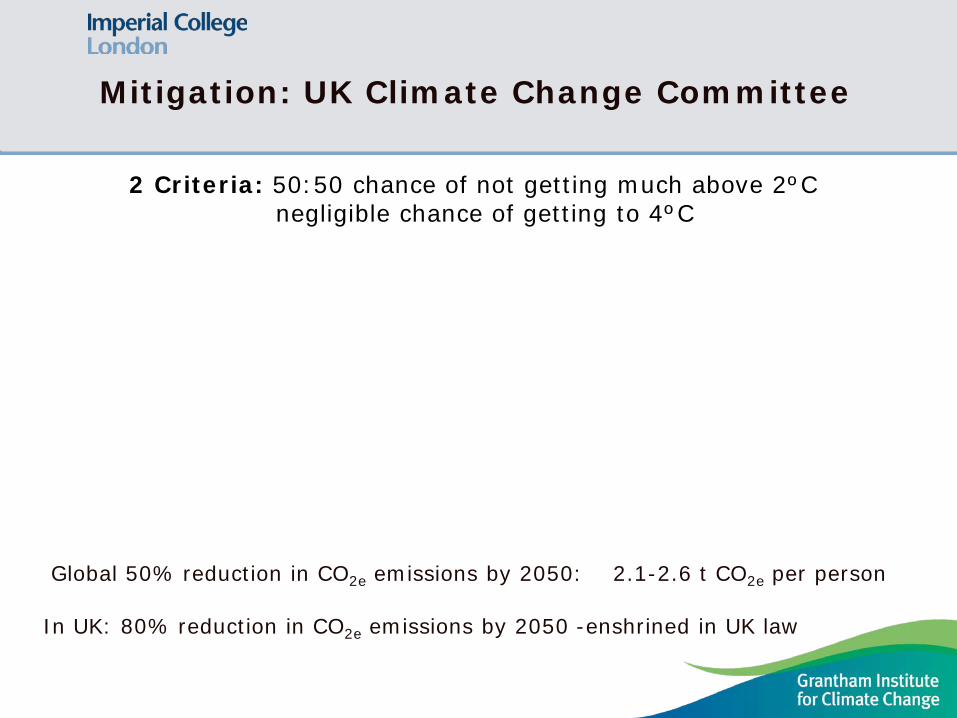
Mitigation: UK Climate Change Committee
01020304050607080
2000 2050 2100 2150 2200
GtC
O2e
Year
2016:4%
2016:3%low
2016:3%high
2016:1.5%
A1B
00.5
11.5
22.5
33.5
4
2000 2050 2100 2150 2200°C
abo
ve p
re-in
dust
rial
Year
2016:4%low
90th percentile
central modelestimate
10th pecentile
2 Criteria: 50:50 chance of not getting much above 2ºC negligible chance of getting to 4ºC
Global 50% reduction in CO2e emissions by 2050: 2.1-2.6 t CO2e per person
In UK: 80% reduction in CO2e emissions by 2050 -enshrined in UK law

The UK 80% Reduction Challenge

Concluding Comments
A dangerous experiment: By adding greenhouse gases to the atmosphere we are taking a large risk that climate change may make life very difficult for our species & others Uncertainties in likely changes in local and regional climate change & in how the natural world will cope with a changing climate lead to many questions for those concerned with the future of the natural world. Mitigation of climate change to levels that significantly reduce the risk are possible and are likely to be beneficial in many other respects.
A very dangerous experiment with our planet
Brian Hoskins
Director, Grantham Institute for Climate Change, Imperial College London Professor of Meteorology, University of Reading
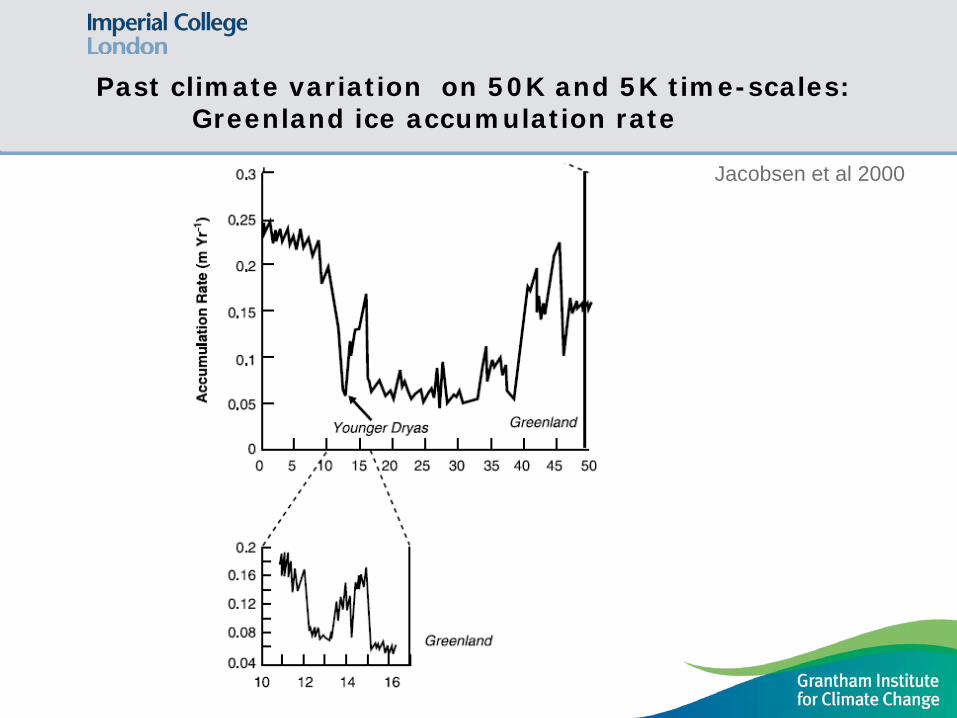
Past climate variation on 50K and 5K time-scales: Greenland ice accumulation rate
Jacobsen et al 2000

B1
A1B
A2
2011-30 2046-65 2080-99
Surface T projections for different periods and scenarios
IPCC 2003

“Geo-engineering” suggestions
Solar Radiation
Top ofAtmosphere
Surface
AerosolScattering
Cloud Albedo
Solar Interceptor
Grassland, Urbanization and Desert Albedo
Level 1 –Space
Level 2 –Stratosphere
Level 3 –Troposphere
Level 4 -Surface
2. Solar Radiation Management: reduce solar energy at surface
1. Carbon Dioxide Removal: remove from the atmosphere fertilise the ocean artificial trees, land surface treatment
Actual climate impact; other impacts; feasibility?
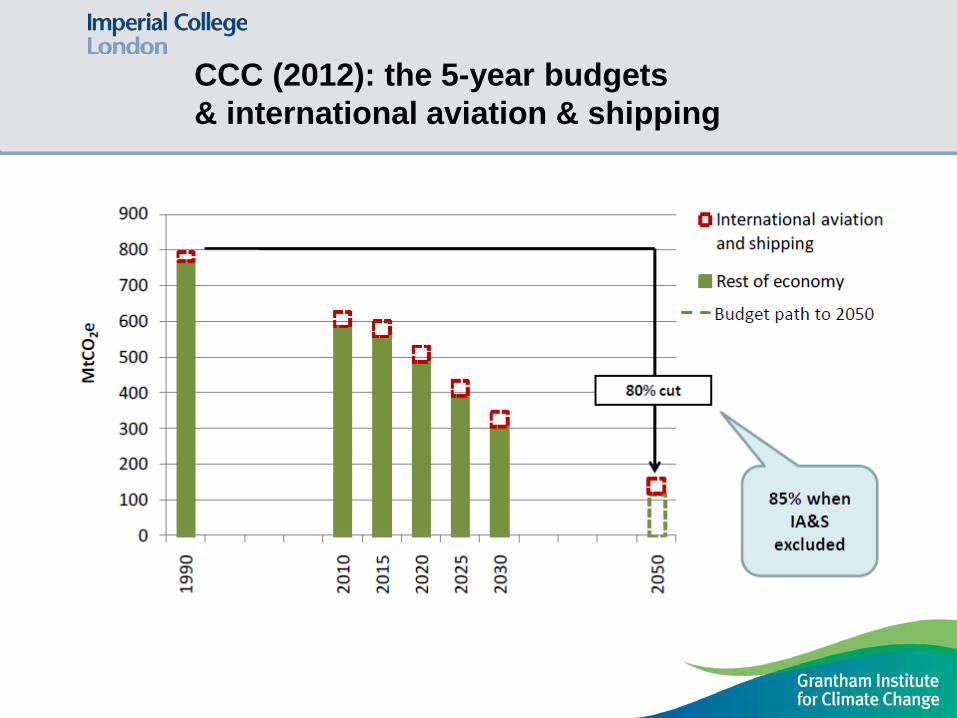
CCC (2012): the 5-year budgets & international aviation & shipping
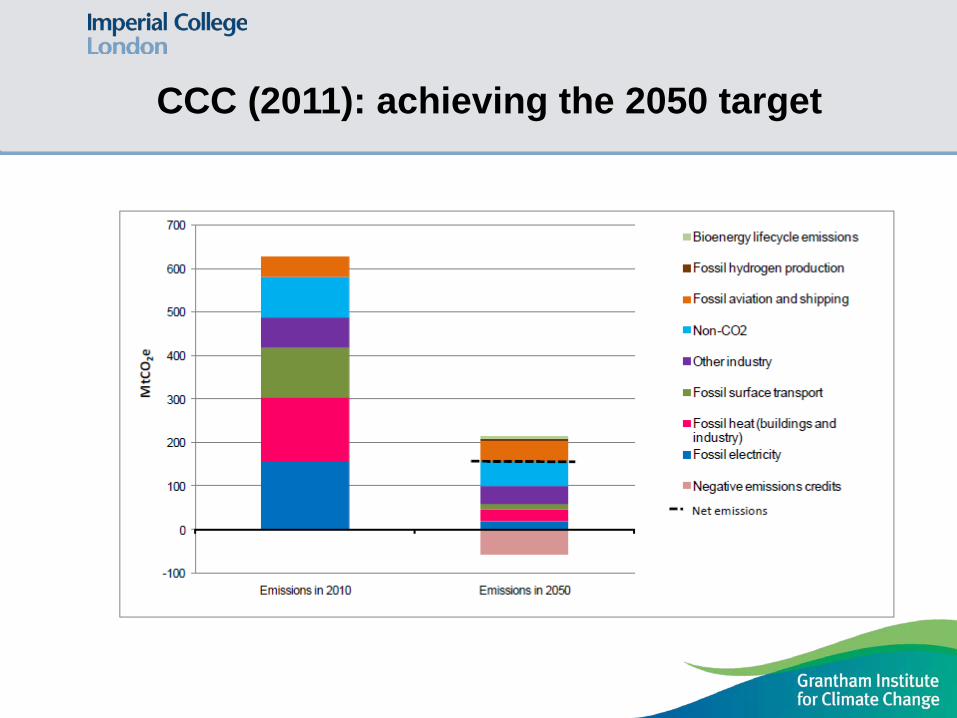
CCC (2011): achieving the 2050 target


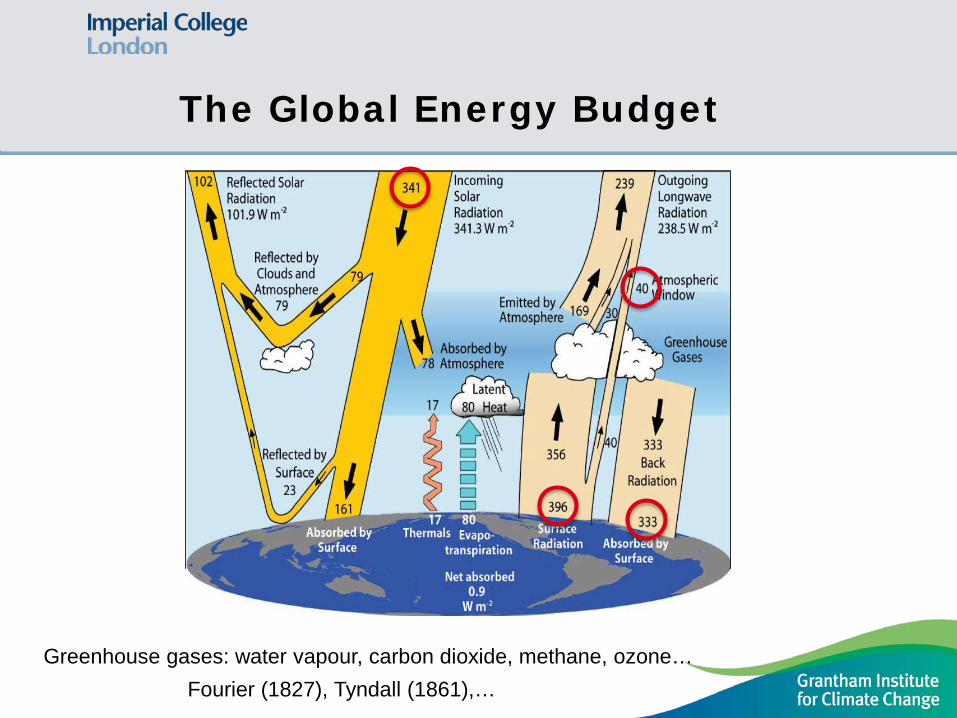
The Global Energy Budget
Greenhouse gases: water vapour, carbon dioxide, methane, ozone… Fourier (1827), Tyndall (1861),…

Global temperature


Some Feedbacks in the Climate System
Heat loss To space Water
vapour
Snow & ice
High cloud
Low cloud
Carbon flux
The atmosphere and oceans are fluids that move and interact

Projections: globally averaged surface warming
IPCC 2007 Different scenarios

Projected temperature in 80 years time

2060-99 (SRESA1B) – 1960-99 (20C3M)
Winter 850hPa zonal wind change T. Woollings 2010


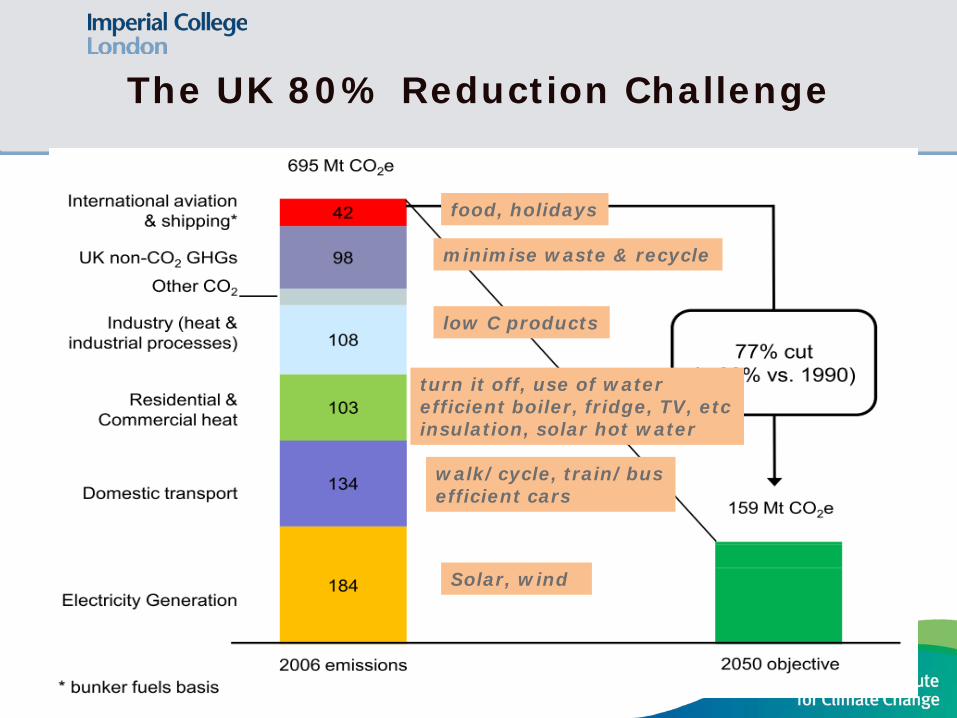
The UK 80% Reduction Challenge
food, holidays
low C products
Solar, wind
walk/cycle, train/bus efficient cars
turn it off, use of water efficient boiler, fridge, TV, etc insulation, solar hot water
minimise waste & recycle

UK Climate Change Committee
• 50:50 chance of global temperature not rising much more than 2°C • Very small chance of rising 4°C
Global 50% reduction in carbon dioxide emissions by 2050: just over 2t per person per year
In UK: 80% reduction in carbon dioxide emissions by 2050
Used 2 criteria for global greenhouse gas emissions


Achieving targets: sensitivity to parameters


Warmest day
UKCP09: Change in summer temperatures in 2080s
Mean
10% 50% 90%
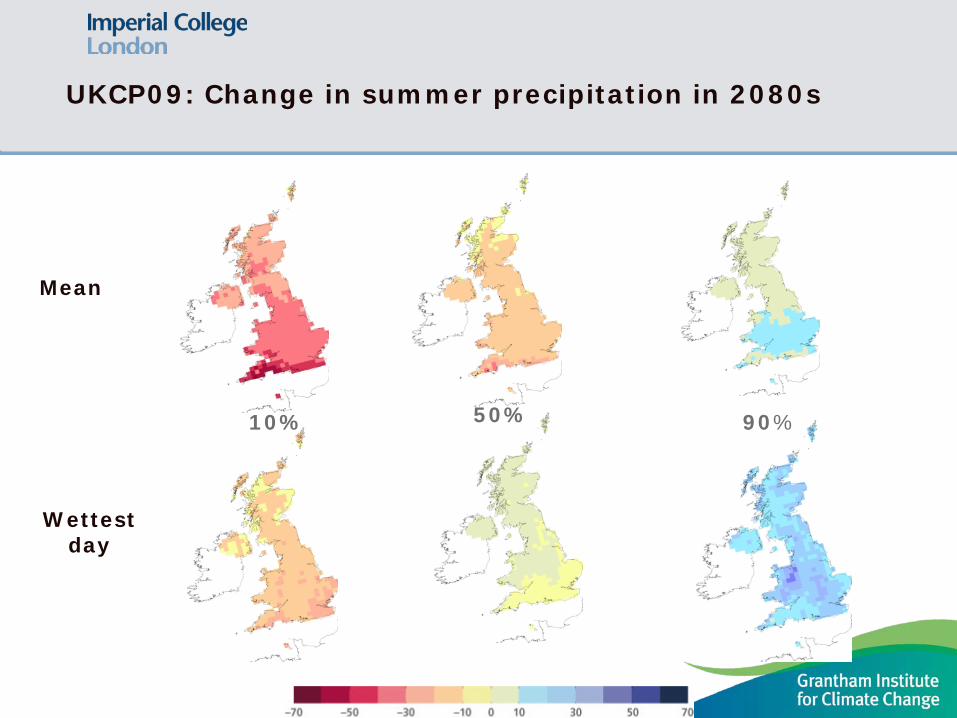
UKCP09: Change in summer precipitation in 2080s
Mean
Wettest day
10% 50% 90%

ZSL Science and Conservation Events Tuesday 18 June 2013
Stamford Raffles Lecture A very dangerous experiment with our planet
Professor Sir Brian Hoskins CBE FRS
Director of Grantham Institute for Climate Change Imperial College London