stalin’s terror and the long-term political effects of...
TRANSCRIPT

Stalin’s terror and the long-term politicaleffects of mass repression
Yuri M Zhukov and Roya TalibovaDepartment of Political Science
University of Michigan
Forthcoming in Journal of Peace Research.
This version: December 7, 2017
Abstract
Repression has a long-term negative effect on political participation. Using millions of arrestrecords from archival documents, and polling-station level election results, we examine howexposure to Stalin-era repression affects voter turnout in Putin’s Russia. To estimate the effectof repression on voting, we exploit exogenous variation in repression due to the structure ofmid-century Soviet railroads, and travel distances to prison camps. We find that communitiesmore heavily repressed under Stalin are less likely to vote today. The electoral legacy ofStalin’s terror – decades after the Soviet collapse, and across multiple election cycles (2003-2012) – is systematically lower turnout. To show that our result is not unique to the Putinregime, we replicate our analysis in Ukraine (2004-2014), and find similar patterns. Theseresults highlight the negative consequences of repression for political behavior, and challengethe emerging view that exposure to violence increases political engagement. While pastresearch has emphasized the short-term effects of repression over several months or years, weshow that these effects may be durable over generations and even changes of political regime.Our findings also demonstrate that repression need not be collective or indiscriminate to havecommunity-level effects.
Keywords: repression, voting, political participation, Stalin, Russia, archival data
Corresponding author: [email protected]
1

Reflecting on his years in correctional labor camps, Soviet writer and dissi-dent Varlam Shalamov said, “He who has been there will never forget”(Hosking, 1991). During Josef Stalin’s three decades in office, the So-viet Union convicted 3.8 million people for “counter-revolutionary” crimes(GARF, 1954). The Gulag – an acronym for “Main Directorate of Cor-rective Labor Camps and Labor Settlements” – was among the defininginstitutions of the USSR. Millions experienced the camps first hand, butmany more felt their impact indirectly – through disappearances of friends,neighbors, and the transformation of their communities. What is the long-term legacy of Stalin’s terror? Has exposure to political repression in thepast made these communities less or more politically active today?
In this article, we empirically examine the effect of Stalin’s terror on po-litical participation in contemporary Russia. Using archival arrest recordscollected by the human rights organization Memorial, we estimate eachRussian locality’s exposure to repression during the Stalin era, and theeffect of this repression on local voting patterns between 2003 and 2012.We find that communities more heavily repressed under Stalin are signifi-cantly less likely to vote in Russia’s national elections, compared to nearbycommunities less exposed to Soviet terror.
By itself, a negative correlation does not demonstrate that the terror effectis causal. It is possible that Soviet authorities repressed heavily in areas thatalready stood in opposition to the federal government, and these initiallyrestive communities continue to be wary of Moscow today. To address thisconcern, we use an instrumental variable design, exploiting the structureof mid-century Soviet railroads and travel distance to Gulag camps. TheSoviet repressive apparatus depended heavily on railroads, which trans-ported prisoners and connected populated areas to Gulags. However, thehistorical structure of the rail network – most of which predated Stalin’sterror – has little direct impact on contemporary voting, apart from itsinfluence on Soviet repression. To the extent that railroads also facilitatedmigration and economic development, we show that these alternative path-
1

ways should bias against finding a significant repression effect. Our resultsconfirm that exposure to repression had a long-term negative effect on par-ticipation, equivalent to an 8.5 percent drop in local turnout in 2012. Weconsider the role of electoral fraud in this process, and show – with ananalysis of data on Ukraine – that the effect is not unique to Putin’s Russia.
We attribute this local decline in turnout to a deterrence of political activ-ity. By punishing individuals for “counter-revolutionary” crimes – real orimagined – and in some cases extending this punishment to family mem-bers, the Soviet state raised the expected costs of even seemingly benignpolitical participation. Citizens who lived in communities with a similarlevel of secret police vigilance developed converging expectations of howlikely dissent will be detected (or invented), and how severely it will bepunished. Where these costs have historically been high, local norms havecome to favor an avoidance of political participation.
These findings make several novel contributions to research on politi-cal violence (Kalyvas, 2006; Lyall, 2009), repression (Mason & Krane, 1989;Davenport, 2007), and voting (Colton & Hale, 2009; Treisman, 2011). First,our results reinforce recent findings on the negative consequences of re-pression for political behavior (Balcells, 2012), and challenge the emergingview that exposure to violence increases participation (Bellows & Miguel,2009; Blattman, 2009). Second, while past research has emphasized theshort-term effects of repression over several months or years (Almeida,2003; Gurr & Moore, 1997), we show that these effects may be durable overgenerations and even changes of political regime. Third, unlike recent re-search on the legacy of Soviet mass deportations (Lupu & Peisakhin, 2017;Rozenas et al., 2017), we show that repression need not be collective orindiscriminate to have community-level effects.
2

Repression and political participation
The question of ‘who participates’ in politics matters greatly for public pol-icy and democratic development, because it shapes the set of preferencesand opinions to which the government responds.1 Even in non-democraticstates, regimes often look to elections as a source of legitimacy and correc-tive feedback (Brownlee, 2007; Magaloni, 2006). To the extent that repres-sion might shape the makeup of an electorate – determining who votesand who abstains – the electoral legacy of violence is of great importancefor the theory and practice of government.2
The political effect of repression has been a matter of debate. Sev-eral studies find that exposure to violence increases political engagement(Bellows & Miguel, 2009; Grosjean, 2014; García-Ponce & Pasquale, 2015).Explanations for this effect include backlash mobilization, where com-munities react to violence by aligning with the perpetrator’s opponent(Francisco, 2004), and substitution effects, where victims adopt non-violentforms of resistance (Lichbach, 1987). Other studies emphasize ‘post-traumaticgrowth,’ where exposure to violence yields psychological effects that in-crease social cohesion, altruism and collective coping (Bauer et al., 2016;Blattman, 2009; Gilligan et al., 2014), and ‘expressive participation,’ wherevoting becomes a means of empowerment (Schuessler, 2000; Bateson, 2012).
An important shortcoming of this literature is its empirical focus onwartime violence by non-state actors and weak states – who are gener-ally unable to conduct violence on a massive scale, and sustain it for long
1 We define participation as “actions aimed at influencing the selection of governmentpersonnel and/or the actions they take” (Verba & Nie, 1972, 2). While this definitionpotentially includes protest activity and insurrection, we focus more narrowly on activities“within the system,” like participation in the electoral process and voting in particular.
2 We define repression as the use of “physical sanctions against an individual or organi-zation, within the territorial jurisdiction of the state, for the purpose of imposing a cost onthe target as well as deterring specific activities and/or beliefs perceived to be challengingto government personnel, practices or institutions” (Davenport, 2007).
3

periods of time.3 The few studies that examine legacies of repression inthe Soviet Union (Rozenas et al., 2017; Lupu & Peisakhin, 2017) have fo-cused on one relatively idiosyncratic form of violence: mass deportationof geographically-concentrated minorities. Both of these contexts are likelyto amplify the ‘backlash effect’ – either due to the perceived weakness ofthe perpetrator, or the indiscriminate nature of the violence. It remains un-clear if community-level effects exist where repression is more sustained,selective and diffuse, targeting individuals across a country rather thancollectively punishing members of a cohesive group.
Another body of research argues that exposure to violence reduces par-ticipation in politics (Lyall, 2009; García, 2010). The most common ex-planation here is preference falsification (Kuran, 1997), where individu-als hide their true political preferences due to fears of renewed violence,and instead publicly express preferences at odds with their own. Othermechanisms have included a loss of social and political trust (Nunn &Wantchekon, 2011), and apathy (Wood, 2006).
Past research in the second category, with some exceptions, has consid-ered mainly the short-term impact of repression – in the years and monthsbefore threats of resumed violence subside, and before shared community-level experiences have a chance to coalesce. Because these conditions arelikely to suppress political participation in the short run, we do not yetknow how durable these negative effects are.
Theoretical expectations
We expect state repression to reduce long-term participation in politics.While almost all repression aims to deter future political dissent by raisingits expected costs, there are several reasons why achieving this deterrenteffect can be difficult. Repression is most likely to deter if it is antici-
3 A recent exception is Bauer et al. (2016), who find evidence of cooperative behaviorfollowing a wide range of community-level violent experiences. However, their meta-analysis is limited to war-related violence, mostly in Africa.
4

pated and avoidable (Schelling, 2008, 2): if individuals expect that the statewill detect and punish dissent, but that one can also avoid this punish-ment by abstaining from dissent. These conditions require that the stateis strong enough to carry out its coercive threats, and that it does so ina sufficiently selective and predictable manner. Repression is unlikely todeter if its agents are relatively weak political actors with a limited capac-ity for sustained violence (because ‘bad’ behavior will go unpunished), orif a strong actor indiscriminately punishes an entire community or ethnicgroup (because ‘good’ behavior does not prevent punishment).
In practice, repression is rarely 100 percent anticipated and avoidable.Yet some forms of violence come closer to this ideal than others. Individ-ual arrests, for instance, are more likely to “seem avoidable” than massdeportation, since an individual’s alleged political actions – rather thangroup affiliation or place of residence – is the official basis for repression.Even if this basis is false, bystanders can learn from the arrest, and try toavoid actions that they expect authorities to misperceive as dissent.
The type of political behavior that falls into this category varies fromplace to place, depending on the vigilance of local authorities, and howbroadly they are willing to interpret and apply a given statute. Throughrepeated exposure to local repressive institutions over time, members of acommunity will converge in their expectations of how costly dissent – oreven benign political action – is likely to be. Where these costs have beenhistorically high, local norms of political participation will favor “keepingone’s head down” and staying out of politics.
Non-participation is distinct from preference falsification, in that onecannot express one’s preferences if one does not participate. Yet if express-ing ostensibly “loyal” political preferences does not prevent punishment(e.g. due to targeting error, denunciation, or lack of ideological purity),then communities will perceive the punishable activity as “participation”rather than “disloyalty.” In such cases, repression will encourage people tostay out of politics altogether, rather than participate as insincere loyalists.
5

Besides deterring political activity, repression can more generally erodetrust – toward state institutions, and between community members them-selves (Nunn & Wantchekon, 2011). Yet mistrust does not always reducepolitical participation. In some circumstances, exposure to violence canboth decrease trust and increase political engagement (Grosjean, 2014).Such deterrence failures are particularly likely in the context of civil wars,where backlash mobilization might improve one’s chances of survival (e.g.by obtaining protection from rebels, ala Kalyvas 2006). In the context ofsustained, one-sided repression by a powerful state – where no rival factioncan credibly promise protection – non-participation is the safer response.
We evaluate the empirical validity of this claim by examining the effectof Stalin-era repression on contemporary voting in Russia. While Stalin’srepression took many forms, we focus on a subset that most closely alignswith the scope of our argument: the imprisonment of individuals underArticle 58 of the Soviet penal code (“counter-revolutionary activity”).
History of Soviet repression
What made Soviet state terror distinctive was its scale. Based just on thesize of its population, the Soviet Gulag system – comprising regular andspecial prisons, filtration camps, POW camps, corrective labor colonies,special settlements, and scientific prisons – was up to fifty times largerthan its counterpart in Nazi Germany.4 This population included bothpolitical and criminal inmates. The former typically received convictionsunder Article 58 of the Soviet penal code.
In force between 1927 and 1961, Article 58 established a broad class of“counter-revolutionary” crimes, including treason, insurrection, terrorism,espionage, contacts with foreign states, propaganda, agitation, and a fail-ure to report any of the above. Most of these crimes carried mandatory
4 In 1938, Soviet concentration camps held over a million inmates; German concentra-tion camps held 20,000 German citizens at the time (Snyder, 2012).
6

minimum sentences, from six months to ten years. Some offenses, likeespionage and treason, were potentially punishable by death.
The range of activities that fell under Article 58 was so wide that evenseemingly innocuous political statements could become cause for arrest –or concern among others that they could be arrested for failing to report.By creating strong incentives to inform, Soviet authorities drew local com-munities directly into the repression process. As citizens sought to avoidaccusations by neighbors, co-workers and family members, the space forpublic and even private political expression gradually shrank.
Between 1921 and 1953, Soviet authorities convicted 3.8 million peopleunder Article 58 (GARF, 1954). A typical case began with a person’s deten-tion, interrogation and (forced) confession, followed by an expedited trialand conviction by a “special troika” – comprising an NKVD officer, partysecretary and prosecutor – and transfer to a labor camp. According to onereport, of 1.5 million individuals the NKVD arrested in 1937-1938, troikasconvicted 85.4 percent (Getty et al., 1993).
Beyond their punitive function, Gulags served an economic purpose, assources of cheap labor that the state regularly mobilized for large construc-tion works, gold, metal and coal mining, logging and other engineeringprojects. At its peak, the Gulag accounted for two percent of all laborers inthe Soviet Union (Gregory & Lazarev, 2013). Mortality in the camps washigh, due to 12-14 hour daily heavy labor shifts, harsh climate and malnu-trition. In 1937-1938, average life expectancy in the Gulag was 2-5 years,despite an average length of sentence of 10-25 years (Brunet, 1993).
Those fortunate enough to survive the Gulag returned to a life of per-manent political disenfranchisement and social alienation. Some of theselong-term costs also extended to family members, especially if the latterdid not originally report the crime. The wives, children and siblings ofthose convicted as ‘traitors of the Motherland’ were subject to prosecutionand imprisonment under Article 58. Children of the repressed lost votingrights, paid higher taxes, and had difficulty obtaining university education
7

and professional advancement in most industries.For the disenfranchised, rehabilitation was a long and uncertain process.
It involved multiple redemptive steps, including engaging in “socially use-ful labor” and demonstrating loyalty to the regime. Even then, rehabili-tation was neither automatic nor irreversible. Some were disenfranchisedand reinstated multiple times, and even those wrongly deprived of rightshad to formally appeal. Some forms of collective punishment of kin (e.g.exile of Kulaks’ families) concluded in the late 1930s. Other policies, likeinternment of children in special settlements, continued until 1954.
In some cases, prisoners received amnesty, in the form of a commutedsentence and partial restoration of rights. Amnesty initially extended toonly special categories of prisoners, like women with children, and thoseconvicted of more minor offenses. Later, the practice extended to otherpolitical prisoners, like those convicted of collaboration with occupyingtroops during World War II. By 1960, amnesty commissions rehabilitatedover 715,120 victims, many of whom were no longer alive (Dobson, 2009).
After Stalin’s death in 1953, Nikita Khrushchev condemned his prede-cessor’s “cult of personality,” dismantled the Gulag camp system, and re-named cities and landmarks bearing Stalin’s name. While repression laterre-emerged in a more limited form under Leonid Brezhnev, this new wavegenerally favored milder sentences or exile as punishment for dissent.
The political legacy of Stalin’s repression in contemporary Russia is am-biguous. The post-Soviet period witnessed some coming to terms withthe terror. In the early 1990s, the KGB partially opened its archives, andRussia’s Supreme Soviet established a Presidential Commission for the Re-habilitation of Victims of Political Repression. Monuments to political pris-oners appeared across Russia, with state support.
Since Vladimir Putin’s ascent to power in 1999, Russia has seen a grad-ual restoration of Soviet symbols. In 2001, the Duma voted to restore theSoviet national anthem, with new lyrics. In 2007 and 2008, a new teach-ers’ manual called Stalin an “effective manager,” and an updated school
8

history textbook depicted the Great Terror as a rational economic neces-sity. In June 2015, the Moscow City Legislature voted to restore a statueof Feliks Dzerzhinsky, founding director of the Soviet secret police, to itsformer location in Lubyanka Square. Similar initiatives have proliferatedat the local level, with regional and municipal officials eager to signal theirpatriotism through Soviet nostalgia.
Social science research on the political effects of Soviet repression is lim-ited. Several macro-level studies have found that communist rule – thoughnot repression specifically – can have lasting effects on political prefer-ences (Pacek et al., 2009; Pop-Eleches & Tucker, 2011). A handful of papershave more directly studied the impact of repression on support for com-munism, finding mixed results (Kapelko, 2010; Levkin, 2014; Adler, 2010).Two recent studies on Ukraine have found reduced support for pro-Russianparties among families and communities exposed to deportation (Lupu &Peisakhin, 2017; Rozenas et al., 2017). Despite this preliminary evidenceof long-term political backlash, the community-level effect of Stalin-era ar-rests on political participation remains largely unknown.
Data
To investigate the relationship between Stalin’s terror and political partici-pation in contemporary Russia, we draw on several types of data, includ-ing declassified archival materials, administrative documents, and pollingstation-level statistics on voter turnout. Our data on the local intensity ofrepression draw on Memorial (2014)’s ‘Victims of Political Terror’ archive,the most comprehensive open source of information currently available onvictims of Stalin-era repression. Memorial’s archive includes 2.65 millionrecords of individuals the secret police arrested and convicted for politicalcrimes in 1921-1959.
The original sources of these records – which we enumerate in On-line appendix A.1 – are Interior Ministry documents, declassified and re-
9

leased by federal, ministerial and regional archives, prosecutor’s offices,and the Commission for the Rehabilitation of Victims of Political Repres-sion. Other sources include newspapers, regional human-rights NGOs,“Memory Books,” and materials from survivors’ families.
Although it is the largest existing database of its kind, Memorial’s archiveaccounts for only a fraction of Soviet repression victims.5 Because thesedata comprise mainly individual arrests under Article 58, they exclude mil-lions of victims of Soviet famine and mass deportation, individuals killedduring and after the Russian Civil War, or during Soviet counterinsur-gency operations, and political dissidents from the post-Stalin period. Alsounder-represented are former Soviet republics other than Russia.6 Our em-pirical scope is therefore limited to a particular form of repression: thepersecution of individuals for alleged political dissent.
We found approximate geographic coordinates for 2.3 million records(87 percent), using victims’ pre-arrest residential addresses, or birthplaces.7
For each record, we also recorded basic biographical information (e.g. ed-ucation, nationality, profession), and arrest details (e.g. charge, sentence).
We combined these data with polling-station level voting results fromRussia’s Central Election Commission, including vote shares and turnoutstatistics for the 2003, 2007 and 2011 Duma (parliament) elections, andthe 2004, 2008 and 2012 presidential elections. The challenge of matchingarrest locations to polling stations is that Russia’s contemporary adminis-trative boundaries do not always align with earlier, Soviet ones, and manylocations have changed jurisdiction. We addressed this issue in two ways.First, we created synthetic geographic units, based on a uniform 25×25
5 Memorial (2014) includes about 70 percent of the 3.8 million convicted under Article58 – which excludes victims of famine, civil war and other government-caused deaths.
6 90 percent of Memorial (2014)’s cases occurred in present-day Russia, the remain-der in Kazakhstan (100,000), Belarus (80,000), Ukraine (40,000), Kyrgyzstan (12,000) andUzbekistan (8,000).
7 We geocoded street- and municipal-level addresses using Application ProgrammingInterfaces (APIs) from Google Maps and Yandex.
10

km2 grid.8 Second, we replicated all analyses with units based on contem-porary Russian district (rayon) borders.9
For each geographic unit, we calculated the total number of individualsSoviet authorities arrested and sent to the Gulag (normalized by area ofterritory). We also tallied the proportion of local eligible voters who cast aballot in the six national elections, and vote shares received by each candi-date and party. Figure 1 shows the geographic distribution of (a) Stalin-eraarrests and (b) voter turnout in 2012.
To measure the logistical costs of repression, we use data on the to-pography of mid-century Soviet railroads, the locations of 618 major rail-road junctions, travel distances between them (Military-Topographical Di-rectorate of the General Staff of the Red Army, 1945; Afonina, 1995), andthe locations of Gulag camps (Smirnov, 1998). We also collected local dataon other factors affecting voting, including pre-repression population, ur-banization and ethnicity (from the 1926 Soviet Census and other sources),terrain, and contemporary economic performance. Table I reports sum-mary statistics for these variables.
Before we proceed, there are several potential sources of error to con-sider. The first stems from our use of birthplaces for geocoding, wherepre-arrest residential addresses were missing. Birth locations are not nec-essarily same as arrest sites and, given the vast Soviet landscape, distancesbetween them can be great. Although a problem for geocoding accuracy,these more tenuous links between birth and arrest locations should biasour results toward zero – since repression’s impact on birth communitiesshould in theory be more indirect.
A second source of error is Memorial’s occasionally imprecise and in-consistent recording of place names. While, in general, the archive listsaddresses at the village, district, and province levels, in some cases, oneor two of these may be missing. In addition, the territorial-administrative
8 The advantage of grid cells is that unit boundaries are exogenous and time-invariant.9 These results, omitted here for space, were substantively the same.
11
division of the Russian Federation has changed from that of its Soviet pre-decessor, as have the names of many municipalities. To identify and cor-rect systematic geocoding errors, we iteratively drew random subsets ofarrests, manually compared geocoded locations to original records, andcross-checked them against Soviet administrative directories (Presidium ofSupreme Soviet of USSR, Information-Statistical Division, 1954).
A third complicating factor is migration. Many decades separate con-temporary voting from Stalin-era repression, and the people who now livein these communities are not necessarily descendants of those repressedunder Stalin. While there is little we can do to empirically address it, mi-gration is not as critical a barrier to inference as one may initially assume.Population movements in Russia have historically been heavily regulated,particularly after internal passports and residency permits (propiski) tiedSoviet citizens to “permanent places of residence” in 1932.10 To the ex-tent that significant migration did occur, the direction of this bias is likelytoward zero. The intuition is straightforward: if the people currently re-siding in these communities have fewer personal or family connections tothose who witnessed Soviet repression first hand, repression’s effect onlocal political participation should be weaker.
We now take a closer look at these potential biases, and develop an em-pirical strategy to estimate the long-term effect of Stalin’s terror.
Estimation strategy
Empirically identifying the effect of repression on voting is challenging.It is possible that Soviet authorities were more likely to repress in areasalready opposed to the state, and these areas remain wary of the Krem-lin today. To obtain an unbiased and consistent estimate of the effect of
10 Soviet law proscribed individuals from seeking housing, employment and educationwhere they had no propiska, under penalty of a fine and up to two years in prison. Thepropiska system remains in force in Russia’s large cities.
12

mass terror, we follow past studies (Rozenas et al., 2017) and exploit ex-ogenous variation in repression due to railroads and travel distances toGulags. As we argue below, Soviet repression depended heavily on rail-roads, but Stalin-era railroads have little direct influence on contemporaryvoting, apart from how they shaped the geography of terror.
Railroads and the logistics of repression
Figure 2 shows the structure of the Soviet railroad network in 1945, alongwith arrest locations (points), rail stations (squares), and Gulag camps (tri-angles). From these data, we constructed three instrumental variables forrepression: travel distance from each locality to (1) the nearest rail station,(2) the nearest point on the railway line, and (3) the nearest Gulag camp.11
These instruments have several attractive properties: railroads are stronglypredictive of, but causally prior to repression, and there are few pathways,other than repression, by which they can suppress turnout 70 years later.
Repression on an industrial scale is not possible without the means totransport prisoners. The average arrest in our dataset occurred 437 kmfrom the nearest Gulag. Railroads were the primary means by which theNKVD moved people to these camps (Kokurin & Petrov 2000, 525, Con-quest 2008, 311, Snyder 2012, 137). By reducing the costs of transportingprisoners over long distances, railroads gave some localities a compara-tive advantage as providers of forced labor. They also eliminated the needto locally incarcerate dissidents, increasing the number of cases that lo-cal organs could process without straining correctional resources. In rail-accessible localities, the NKVD could repress more people, at lower cost.
The data indeed suggest that rail-accessible localities produced signifi-cantly more Gulag inmates than localities of similar size positioned further
11 Since most arrest sites and Gulags were not directly adjacent to the railroad, wecalculated distances to Gulags as the sum of the Euclidean distance from arrest site to thenearest rail line, the railroad travel distance from there to the point on the network closestto the Gulag, and Euclidean distance from this second point to the Gulag.
13

away. Holding constant urbanization, population size and other poten-tial confounders, a lack of rail access decreased the local supply of Gulaginmates by .7 standard deviations (95% confidence interval: -.87,-.52), onaverage.12 In addition to increasing local capacity for arrests, railroadsaffected the sentences some people received (Online Appendix B.1). Allelse equal, the proportion of political arrestees sentenced to the Gulag –as opposed to execution – was .07 standard deviations higher (95% CI: -.12,-.02) in rail-accessible areas. Unless the incidence of capital crimes liketreason was genuinely higher in logistically isolated areas, the data sug-gest that, where transporting prisoners was relatively inexpensive, thosepolitical prisoners were more likely to serve time in the Gulag.
An underlying assumption behind our first two instrumental variablesis that the proximity of railroads influenced the local supply of Gulag pris-oners, but the supply of prisoners did not influence railroad access. On ahistorical level, this assumption is not unreasonable: 77 percent of the Rus-sian railroad system was in service before the Soviets came to power, andtransporting political prisoners was never one of its primary purposes.13
Rail construction continued in Soviet times, but our data suggest that thelocations of Gulags – existing, new, or planned – had no discernible impacton network expansion (Online Appendix B.2).
Another assumption, which motivates our use of distance to Gulags asan instrumental variable, is that prisoners’ destination locations influencedtheir locations of origin, but not the other way around. If Soviet authoritiespurposefully built the camps in close proximity to population centers, theinstrumental variable would not be valid. This scenario, however, is atodds with historical data. Between 1924 and 1953, the Soviets tended to
12 This estimate is a standardized regression coefficient, from a first-stage instrumentalvariable regression of logged repression on railroad proximity (Model 2, Table II).
13 Of the 74,325 kilometers of track in place by Stalin’s death in 1953, 57,007 (or 77percent) predated the Russian Revolution of 1917 (Afonina, 1995). Tsarist authorities sawrailroad construction primarily as a means to facilitate military mobilization, transportbulk commodities (e.g. grain to markets, coal to factories), and facilitate eastward migra-tion. These priorities remained largely consistent in Soviet times.
14

build Gulags mostly in rural areas, separated from the nearest major cityby hundreds of kilometers (Online Appendix B.3). Rather than dispersethem across the country, Soviet authorities built camps in clusters – withnew facilities typically appearing close to existing ones, where requisiteinfrastructure was already in place. Railroads were an essential piece ofthis infrastructure – all else equal, a standard deviation increase in distancefrom the railroad reduced the probability of new Gulag construction by 80percent (95% CI: -97,-64).
A potentially important concern is that railroads have many effects on acountry’s political economic development, beyond facilitating repression.The reduced form relationship between our instruments and turnout is rel-atively weak: absolute Pearson coefficients range between .05 and .09. Yetif alternative channels exist between Soviet transportation infrastructureand voting today, the exclusion restriction may not be valid. Although itis difficult to imagine that railroads did not affect voting in other ways,there are at least three reasons why – in the current case – these alternativepathways are more likely to attenuate the terror effect than to inflate it.
First, Soviet-era railroads are unlikely to have suppressed post-Sovietturnout by shaping local economic performance. Railroads were arteriesof economic development in the USSR, and towns strategically positionedwere among the beneficiaries of Soviet industrialization. Empirical studiesof post-Soviet elections in Russia have shown economic prosperity to bea reliable predictor of participation and regime support (Colton & Hale,2009; Treisman, 2011). If rail-accessible areas saw disproportionate declineafter the Soviet collapse – when many factory towns lost state subsidies –then turnout there may be low not due to repression, but economics.
Our data suggest the opposite: the local economic benefits of railroadscarried over to the post-Soviet period. All else equal, localities with rail-road access in the 1940’s have continued to see lower unemployment andhigher economic performance in 2000-2012, compared to the remote coun-tryside (Online Appendix B.4). If railroad towns are indeed more prosper-
15

ous today, the effect of railroads on economic development is unlikely tobe the reason for lower turnout there.
Second, railroads are unlikely to have affected elections by facilitatinginternal migration. The Soviet state heavily regulated migration, but, onthe margins, railroads at least made it less costly to leave. It is possiblethat lower turnout in these areas simply reflects the displacement of morepolitically-active citizens to less-heavily repressed localities. Such a dy-namic is not inconsistent with our expectation of lower participation afterrepression, but it would nevertheless be problematic for inference.
Migration data from the 1989 Soviet census tell a different story. All elseequal, Soviet-era migration tended to flow from countryside to cities, andfrom localities with railroad access to ones that were more remote (On-line Appendix B.5). Due to these opportunities for population movement,the same logistical convenience that exposed some communities to repres-sion should also have made these communities less likely to remain intact– making long-term community effects harder to detect. Voter turnoutin migrant-receiving communities also tends to be lower, suggesting thathigher political activism among those who moved away is unlikely to ex-plain lower turnout in repressed areas.
Third, even if there are potential alternative pathways linking railroadaccess to contemporary politics, there are very few pathways other thanrepression linking voting to the proximity of Gulags. Gulags were gen-erally not located in densely populated urban areas, and Soviet citizensrarely traveled on these paths, except while heading to or from prison.
Model specification
Our first- and second-stage model specifications, respectively, are
ln(Repressioni) = Ziζ + Xiδ + Riη + ui (1)
Turnouti = ln(Repressioni)θ + Xiβ + Riγ + εi (2)
16

where the second-stage dependent variable, Turnouti, is the proportion ofregistered voters in locality i who voted in national elections. The mainexplanatory variable, ln(Repressioni), is the natural log of individuals ar-rested and resettled from locality i to Gulag camps. Our primary quantityof interest is θ, the 2SLS coefficient on repression.
The instrumental variable, Zi, can be either (1) Euclidean distance fromi to the nearest rail station, or (2) to the nearest rail line, and (3) rail traveldistance from i to the nearest Gulag camp. We estimate the model sepa-rately for each of these measures.
Also on the right hand side are a vector of dummy variables, Ri, thatindicate the administrative unit (oblast) to which locality i belongs, andrepresent fixed regional differences in voter turnout.14 Xi is a vector oflocal covariates, including ruggedness of terrain,15 which we expect to in-crease the logistical costs of repression, and pre-treatment urbanization(1926 census),16 which we include because targets for repression were moreplentiful and turnout is typically lower in cities. In separate models (On-line Appendix C.1), we include exposure to World War II-era violence asa post-treatment adjustment, measured as as distance to German-occupiedterritories, where wartime displacement and postwar repression were high.
More repression, less turnout
Our results confirm that exposure to Stalin-era repression depresses voterturnout. Figure 3 reports standardized instrumental variable estimates ofthis effect. Table II reports parameter estimates and model diagnostics forthe 2012 presidential elections.
First stage coefficients for all instruments are negative, suggesting that
14 These fixed effects also account for unobserved sources of oblast-level variation inMemorial (2014)’s reporting of repression, such as differences in regional archival policies.
15 We measure rugged terrain as standard deviation of elevation.16 We measure urbanization as percent of local population residing in urban areas.
17

the scale of repression was decreasing in distance to both railroads andGulags. The weak instrument test statistic is large and highly significant,suggesting that instruments are strongly correlated with repression. TheWu-Hausman test, which compares our specification to OLS, further sug-gests that instrumental variable estimates are consistent and OLS are not.
The second-stage estimates of the repression effect on voting are all neg-ative and highly significant. In areas where logistics drove variation in stateterror, a standard deviation increase in repression produced a .73 standarddeviation decline in turnout – a reduction equivalent to 8.5 percent of thelocal electorate. As Figure 3 shows, this negative effect has appeared inevery national election between 2003 and 2012.
While the relationship appears negative, it is possible that some unob-served or latent characteristic shared by neighboring localities is drivingour result. Indeed, Figure 1 clearly shows that neighboring localities tendto vote in similar ways. The Moran’s I statistics of residual spatial autocor-relation, reported at the bottom of Table II, are large and highly significantfor Models 1-3, confirming that locations with high voter turnout tend tocluster around each other, and that our models overlook this fact.
To account for spatial dependence, we re-estimated Models 1-3, addingMoran Eigenvectors as synthetic covariates capturing residual autocorrela-tion (Dray et al., 2006) (Online Appendix C.2). Models 4-6 in Table II reportthe results for 2012 elections, while Online Appendix C.2 also includes areplication of Figure 3, with Moran eigenvectors. As before, political partic-ipation is consistently lower where Stalin-era repression was more intense.
Of course, Stalin’s terror is neither the sole nor principal driver of voterturnout in contemporary Russia. In Online Appendix D, we consider sev-eral alternative explanations, including urban-rural differences, ethnic dif-ferences and economic performance. As we show, the repression effectremains strongly negative after accounting for these confounders.
18

Electoral fraud and inflated turnout
An important caveat to our analysis is that vote tallies from Russia’s Cen-tral Election Commission are, by any standard, deeply flawed measures ofpolitical participation. Electoral fraud is widespread in Russia, and localofficials often inflate turnout figures to signal loyalty to the Kremlin. InChechnya, for instance, authorities reported 99.59 percent turnout in 2012,with 99.82 percent backing Putin. In one precinct (#451), Putin received1,482 votes from 1,389 registered voters, placing official turnout at 107 per-cent. The extent of fraud varies at the local level, and this variation maybias our results in one of two ways. If inflated turnout is more commonin historically-repressed areas – where authorities are wary of a less-than-stellar result – then the bias should be toward zero, since Stalin’s terrorwould appear to increase turnout. If, instead, fraud is more common inless-repressed areas, it may actually inflate the repression effect.
To see how local electoral fraud affects our estimates, we took a closerlook at the 2012 presidential elections. For each polling station in 2012, weexamined two electoral forensics measures: the probability of “incremen-tal” and “extreme” fraud, estimated with Mebane (2016)’s finite mixturemodel.17 We aggregated these probabilities to the same spatial units asbefore (25km grid cells), and ran two sets of analyses.
First, to establish the direction of bias, we looked at the relationshipbetween Stalin-era repression and contemporary electoral fraud. To thisend, we fit a quasi-binomial model, in which the probability of each typeof fraud in 2012 depends on Stalin-era repression, a set of local covariates(e.g. pre-treatment urbanization, geographic terrain), and oblast-level fixedeffects. The results (Online Appendix E) suggest that Stalin-era repressionhad no impact on incremental fraud, but is negatively correlated with theprobability of extreme fraud. This type of fraud is also more common in
17 Extreme fraud indicates near-100 percent turnout and near-total reallocation of votesto winner; incremental fraud indicates substantial reallocation of votes (Mebane, 2016, 2).
19

rural localities, and in areas – like Chechnya – with rough terrain. Thisresult is potentially concerning, since the repression-fraud relationship isin the same direction as that between repression and raw turnout.
In our second set of analyses, we asked whether – given this bias – theeffect of repression on turnout disappears if we restrict our sample to onlythose localities where fraud is highly unlikely. To this end, we replicatedModels 1-3 in Table II on subsets of Russian localities, in which the prob-ability of fraud did not exceed some threshold p ∈ [0, 1]. We report theresults of this sensitivity analysis in Figure 4. While the probability ofincremental fraud does not influence our estimates, extreme fraud proba-bilities do. As we would expect, the negative effect on turnout is smallerwhere extreme fraud was highly unlikely. However, the negative effectnever fully goes away, even as p approaches zero. Although fraud makesit more difficult to identify the effect of Stalin-era repression, the estimateremains negative and significant even after we drop locations where evi-dence of ballot-box stuffing exists.
Generalizability
What does turnout actually represent in Putin’s Russia? Since there islittle uncertainty about the outcome of national elections, a decision to stayhome may signify not only political disengagement, but latent oppositionto Putin. The data seem to support this interpretation. As we report inOnline Appendix F, opposition support is higher – and Putin’s is lower –in historically repressed areas, across all elections. One may then wonder ifthe negative effect of repression on turnout is unique to Russia’s domesticpolitical environment – where Putin has consolidated power to the pointwhere participation and regime support are synonymous. To address thisconcern, we replicate our analysis with data from Ukraine – a country witha similar legacy of repression, but very different post-Soviet politics.
20

Evidence from Ukrainian elections, 2004-2014
To show that the negative effect on participation still holds where Putin isnot the incumbent – we replicated our analysis with electoral data fromUkraine. Under Stalin, Ukrainian NKVD agents reported up the samechain of command as their Russian counterparts, relied on the same rail-road network and sent prisoners to the same camps (Rozenas et al., 2017).After independence, the two countries’ political paths diverged. As Rus-sian politics took a decidedly authoritarian turn in the 2000’s, Ukraine’selectoral landscape remained divided, with power alternating between ri-val ‘pro-Western’ and ‘pro-Russian’ coalitions.18 The relative competitive-ness of Ukraine’s elections – coupled with its shared Soviet past – offers anattractive opportunity to test the generalizability of our results.
To ensure that results are maximally comparable, we used the same datasources on Soviet-era repression, logistics and demographics, and matchedthem to polling-station level turnout figures from Ukraine’s Central Elec-tion Commission. We aggregated these data to the same units of analysis(25km grid cells), and adopted the same identification strategy and modelspecification as in Eq. 1-2. We then replicated Models 1-3 from Table II forevery national Ukrainian election between December 2004 and May 2014.
The results, shown in Figure 5, are consistent with those in Russia:turnout is lower in Ukrainian localities more heavily-exposed to repres-sion.19 The direction of the relationship, across all elections, is negative.Whether the incumbent is a ‘pro-Western’ president like Viktor Yushchenko(2005-2010) or ‘pro-Russian’ like Viktor Yanukovych (2010-2014), localitieswhere Stalin-era repression was high see less participation today.
The similarity of the repression-turnout relationship in Ukraine is strik-
18 Ukrainian parties with a generally ‘pro-Western’ foreign and trade policy orientationinclude Our Ukraine, Yulia Tymoshenko Bloc, Batkivshchina, and Petro Poroshenko Bloc.‘Pro-Russian’ parties include Party of Regions, Communist Party, and Opposition Bloc.
19 Estimates are more uncertain than before for the Gulag distance instrument, whichis not surprising, since Ukraine is a smaller territory with less variation on that variable.
21

ing for several reasons. First, elections in Ukraine – while flawed in manyrespects (Myagkov et al., 2009) – are far more competitive than in Russia.Since power regularly changes hands across elections, it is more difficultto interpret political participation as tacit approval of the regime. Sec-ond, Ukrainian elections show that the emergence of a Putin-style ex-KGBstrongman is not necessary to “activate” the repression effect. In Ukraine,this effect held even during the presidency of Viktor Yushchenko – whosought EU and NATO membership and attempted to rehabilitate veter-ans of the anti-Soviet Ukrainian Insurgent Army. The consistently lowerturnout in Ukrainian elections hints at a more general decline in politicalparticipation among historically-repressed communities.
Discussion
Stalin-era repression strongly affects political behavior in contemporaryRussia. Localities exposed to higher levels of state terror are significantlyless likely to vote today, even after accounting for several important contex-tual factors and econometric concerns. What is less clear is why repressionhas this effect, and why our negative finding is at odds with recent evi-dence that violence increases political participation (Blattman, 2009; Bate-son, 2012). Although a direct examination of mechanisms lies outside thescope of our article, we briefly consider one such possibility: repressiondeterred participation by increasing the expected costs of political activity.
The deterrence effect rests on several distinctive features of Soviet repres-sion. First, because the USSR was a strong autocratic regime, which heldon to power for 70 years before loosening its repressive grip, a potentialresumption of violence was a persistent feature of everyday life. This factdistinguishes the USSR from empirical contexts in which previous scholarsdetected a positive violence-participation link – principally non-state actorsand security forces in weak or developing states.
Second, by creating incentives for citizens to inform on one another,
22

Stalin’s secret police ensured that potential dissidents would be hesitantto reveal their political preferences not only to government officials, butalso to neighbors, co-workers and family members.
Third, by extending some punishments for political crimes to familymembers, the state ensured that these lessons would be passed on to fu-ture generations. By applying the principle of “guilt by association” to therest of the household, even after a prisoner had served his or her term,Soviet authorities ensured that Stalin’s terror would have an intergenera-tional effect on political participation. For other community members notdirectly victimized, but who potentially witnessed their repressed neigh-bors’ plight, the message was clear: political participation is dangerous;expressing the “wrong” political preferences can ruin your life; if you op-pose the regime, it is better to keep quiet.
The Soviet state collapsed in 1991, so why does the deterrence effectpersist? One explanation is that, because Russia is becoming politically lessfree, historically repressed communities extrapolate Soviet-era lessons tothe current regime.20 This possibility, however, does not explain the similareffects we found in Ukraine. Another explanation is that turnout is lowdue to a more general wariness of state security services, many of whichhave not fully come to terms with their violent past. While laws on therehabilitation of repression victims exist in both countries, not all classesof political prisoners have been subject to rehabilitation. A posthumousrestoration of rights, moreover, does not negate decades of suspicion andfear that some communities experienced.
One alternative explanation is that turnout is low because repressioncaused a long-term erosion of social and political trust. It would be strangeif repression did not have such an effect, but trust alone is insufficient toexplain low turnout. While some may abstain from voting because theymistrust the state, mistrust by itself does not preclude higher political en-gagement, local collective action, or membership in associations and politi-
20 Freedom House currently classifies Russia as ‘Not Free’ (score of 6.0).
23

cal parties (Grosjean, 2014). One does not need to to mistrust the state. Yetif such fear has not imbued political norms over time, depressed turnoutbecomes harder to explain.
To investigate the plausibility of the deterrence mechanism, we brieflyexamine the impact of an earlier intervention: Soviet-era amnesty. Wecompare the political consequences of repression to cases where individ-uals were arrested, convicted, and sentenced, but subsequently releasedand partially rehabilitated under an order of amnesty. Because amnestyreduced the lifetime costs of repression, a positive link between amnestyand turnout would be consistent with deterrence.
Figure 6 reports the results of regressions of voter turnout on the pro-portion of local arrestees who either served their term in the Gulag (red) orreceived amnesty (blue). Consistent with the deterrence story, turnout ishigher where a greater proportion of repression victims received amnesty,and lower where amnesty was rare.
Of course, Soviet authorities did not grant amnesty at random: they didso mainly for lesser crimes (i.e. not treason or espionage), and may haveonly done so in cases where they had reason to expect political loyalty.This selection bias prevents us from interpreting the estimates in Figure 6as anything other than a correlation. Our preliminary analysis, however,opens the possibility that amnesty not only dampens the negative deter-rence effect, but may even reverse it.
Conclusion
Using data on contemporary voting in Russia and Ukraine, and archivalrecords on Stalin-era repression, we found a robust negative relationshipbetween the number of people sent to Gulag camps and future politicalparticipation. To address the potential endogeneity of repression, we ex-ploited exogenous variation in arrests due to the accessibility of railroadsand the proximity of Gulags. Our results confirm that – where logistics
24

drove repression – the effect of repression on turnout is consistently neg-ative. We also considered a host of alternative explanations for the terroreffect, and argued that these additional sources of error either bias ourresults toward zero, or do not significantly affect our estimates.
That said, our analysis has several important limitations, which we arenot able to address. First is the problem of ecological inference. Due to thetechnical impossibility of directly matching arrest records to votes, we useda geographic grid to make inferences about community-level behavior. Fu-ture efforts should confront information loss from aggregation, and correctpotential biases it may cause. Second, data limitations prevent us fromexamining the intermediate effects of repression on social structures andinteractions within affected communities, and how these changes translateinto political behavior. Uncovering these and other mechanisms linkingrepression and voting should be a priority for future research.
Our findings are consistent with anecdotal accounts about the lastingpolitical trauma of state repression. Even where repression is “effective” inthe narrow sense of keeping a regime in power, such actions also encouragelong-term avoidance of political participation, at the community level. Thisnegative effect, our data suggest, has outlived both Stalin and the SovietUnion, and remains a political challenge in contemporary times.
Data Replication
The dataset, codebook, and R-files for the empirical analysis in this articlecan be found at http://www.prio.org/jpr/datasets.
Acknowledgments
The authors are grateful to Laia Balcells, Charles Crabtree, Christian Dav-enport, Yana Gorokhovskaia, Mark Kramer, Chris Sullivan, workshop par-
25

ticipants at the University of Michigan, Santa Fe Institute, Uppsala Univer-sity, and three anonymous reviewers for helpful comments, and to MarkDovich for excellent research assistance.
References
Adler, Nanci (2010) Enduring repression: Narratives of loyalty to the Partybefore, during and after the Gulag. Europe-Asia Studies, 62(2): 211–234.
Afonina, G M, editor (1995) Kratskie svedeniya o razvitii otechestvennykhzheleznykh dorog s 1838 po 1990 g. [Summary of domestic railroad develop-ment from 1838 to 1990]. Moscow: Ministry of Railways of the RussianFederation.
Almeida, Paul D (2003) Opportunity organizations and threat - inducedcontention: Protest waves in authoritarian settings. American Journal ofSociology, 109(2): 345–400.
Balcells, Laia (2012) The consequences of victimization on political identi-ties: Evidence from Spain. Politics & Society, 40(3): 311–347.
Bateson, Regina (2012) Crime victimization and political participation.American Political Science Review, 106(03): 570–587.
Bauer, Michal; Christopher Blattman, Julie Chytilová, Joseph Henrich, Ed-ward Miguel & Tamar Mitts (2016) Can war foster cooperation? TheJournal of Economic Perspectives, 30(3): 249–274.
Bellows, John & Edward Miguel (2009) War and local collective action inSierra Leone. Journal of Public Economics, 93(11): 1144–1157.
Blattman, Christopher (2009) From violence to voting: War and politicalparticipation in Uganda. American Political Science Review, 103(02): 231–247.
26
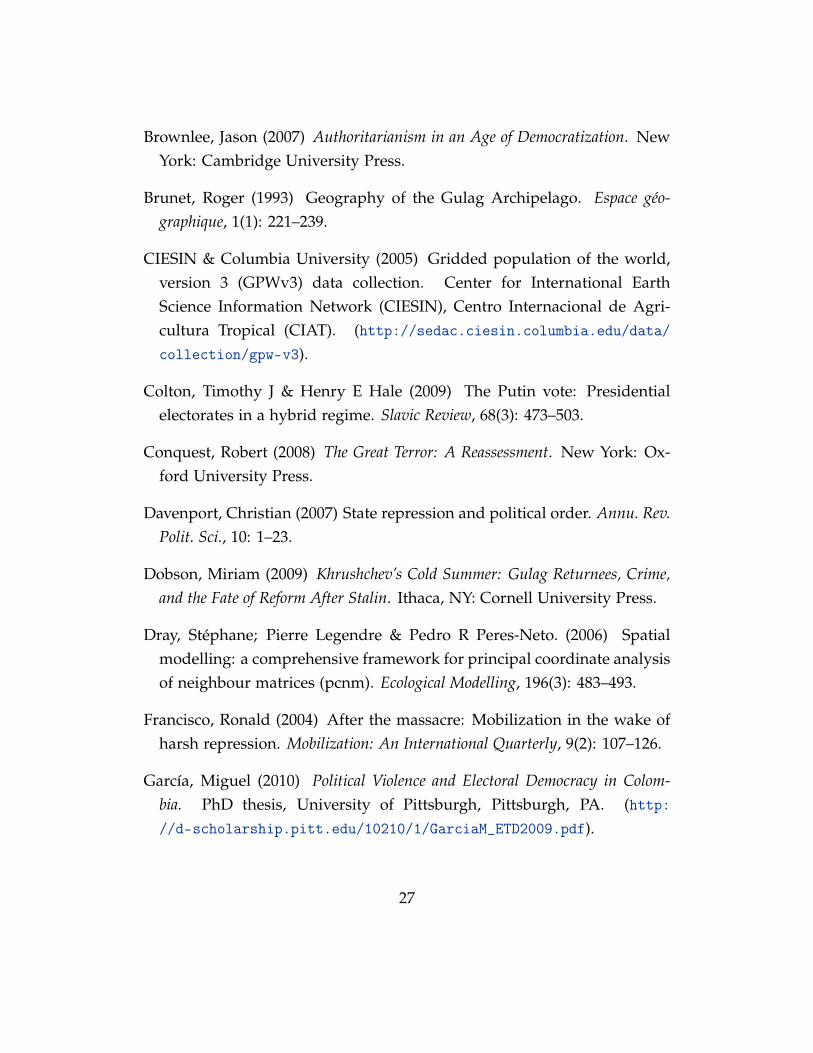
Brownlee, Jason (2007) Authoritarianism in an Age of Democratization. NewYork: Cambridge University Press.
Brunet, Roger (1993) Geography of the Gulag Archipelago. Espace géo-graphique, 1(1): 221–239.
CIESIN & Columbia University (2005) Gridded population of the world,version 3 (GPWv3) data collection. Center for International EarthScience Information Network (CIESIN), Centro Internacional de Agri-cultura Tropical (CIAT). (http://sedac.ciesin.columbia.edu/data/collection/gpw-v3).
Colton, Timothy J & Henry E Hale (2009) The Putin vote: Presidentialelectorates in a hybrid regime. Slavic Review, 68(3): 473–503.
Conquest, Robert (2008) The Great Terror: A Reassessment. New York: Ox-ford University Press.
Davenport, Christian (2007) State repression and political order. Annu. Rev.Polit. Sci., 10: 1–23.
Dobson, Miriam (2009) Khrushchev’s Cold Summer: Gulag Returnees, Crime,and the Fate of Reform After Stalin. Ithaca, NY: Cornell University Press.
Dray, Stéphane; Pierre Legendre & Pedro R Peres-Neto. (2006) Spatialmodelling: a comprehensive framework for principal coordinate analysisof neighbour matrices (pcnm). Ecological Modelling, 196(3): 483–493.
Francisco, Ronald (2004) After the massacre: Mobilization in the wake ofharsh repression. Mobilization: An International Quarterly, 9(2): 107–126.
García, Miguel (2010) Political Violence and Electoral Democracy in Colom-bia. PhD thesis, University of Pittsburgh, Pittsburgh, PA. (http://d-scholarship.pitt.edu/10210/1/GarciaM_ETD2009.pdf).
27

García-Ponce, Omar & Benjamin Pasquale (2015) How political re-pression shapes attitudes toward the state: Evidence from Zim-babwe. (http://omargarciaponce.com/wp-content/uploads/2013/07/GarciaPonce_and_Pasquale_2014.pdf).
GARF (1954) State Archive of Russian Federation. Collection 9401, series2, case 450, pp. 30-37.
Getty, J Arch; Gabor T Rittersporn & Viktor N Zemskov (1993) Victimsof the Soviet penal system in the pre-war years. The American HistoricalReview, 98(4): 1017–1049.
Gilligan, Michael J; Benjamin J Pasquale & Cyrus Samii (2014) Civil warand social cohesion: Lab-in-the-field evidence from Nepal. AmericanJournal of Political Science, 58(3): 604–619.
Gregory, Paul R & Valery Lazarev (2013) The economics of forced labor: TheSoviet Gulag. Stanford, CA: Hoover Institution Press.
Grosjean, Pauline (2014) Conflict and social and political preferences: Ev-idence from World War II and civil conflict in 35 European countries.Comparative Economic Studies, 56(3): 424–451.
Gurr, Ted Robert & Will H Moore (1997) Ethnopolitical rebellion: A cross-sectional analysis of the 1980s with risk assessments for the 1990s. Amer-ican Journal of Political Science, 41(4): 1079–1103.
Hosking, Geoffrey A (1991) The awakening of the Soviet Union. Cambridge,MA: Harvard University Press.
Kalyvas, Stathis N. (2006) The Logic of Violence in Civil War. New York:Cambridge University Press.
Kapelko, Natalia (2010) The long-run effect of political repressions: Stalin’sGULAG and elections in modern Russia. Master’s thesis, New Economic
28

School, Moscow. (https://www.nes.ru/dataupload/files/programs/econ/preprints/2010/MT%20Natalia%20Kapelko.pdf).
Kokurin, Aleksandr & Nikolai V Petrov. (2000) GULAG: Glavnoe upravlenielagerey, 1917-1960 [GULAG: Main directorate of camps, 1917-1960]. Moscow:Mezhdunarodnyy fond Demokratiya.
Kuran, Timur (1997) Private truths, public lies: The social consequences ofpreference falsification. Cambridge, MA: Harvard University Press.
Levkin, Roman (2014) The effect of Stalin’s deportations on distrust incentral authority. (https://dx.doi.org/10.2139/ssrn.2484925).
Lichbach, Mark Irving (1987) Deterrence or escalation? the puzzle of ag-gregate studies of repression and dissent. Journal of Conflict Resolution,31(2): 266–297.
Lupu, Noam & Leonid Peisakhin (2017) The legacy of political violenceacross generations. American Journal of Political Science, 61(4): 836–851.
Lyall, Jason (2009) Does indiscriminate violence incite insurgent attacks?Evidence from Chechnya. Journal of Conflict Resolution, 53(2): 331–362.
Magaloni, Beatriz (2006) Voting for autocracy: Hegemonic party survival andits demise in Mexico. New York: Cambridge University Press.
Main Military Communications Directorate of the Red Army (1943) Skhemyzheleznykh dorog i vodnykh putey soobshcheniya SSSR [Railroad and waterwaylayout of the USSR]. Moscow: Voennoe izdatel’stvo Narodnogo Komis-sariata oborony SSSR.
Mason, T. David & Dale A Krane (1989) The political economy of deathsquads. International Studies Quarterly, 33(2): 175–198.
Mebane, Walter R, Jr. (2016) Election forensics: Frauds tests andobservation-level frauds probabilities. Prepared for presentation at
29

the 2016 Annual Meeting of the Midwest Political Science Association,Chicago, IL, April 7–10.
Memorial (2014) Zhertvy politicheskogo terrora v SSSR [victims of politicalterror in the USSR]. (http://lists.memo.ru/).
Military-Topographical Directorate of the General Staff of the Red Army(1945) Skhemy avtomobil’nykh dorog SSSR [Automobile road layout of theUSSR]. Moscow: Voennoe izdatel’stvo Narodnogo Komissariata oboronySSSR.
Myagkov, Mikhail; Peter C Ordeshook & Dimitri Shakin (2009) The forensicsof election fraud: Russia and Ukraine. New York: Cambridge UniversityPress.
Nunn, Nathan & Leonard Wantchekon (2011) The slave trade and theorigins of mistrust in Africa. The American Economic Review, 101(7): 3221–3252.
Pacek, Alexander C; Grigore Pop-Eleches & Joshua A Tucker (2009) Disen-chanted or discerning: Voter turnout in post-communist countries. TheJournal of Politics, 71(2): 473–491.
Pop-Eleches, Grigore & Joshua A Tucker (2011) Communism’s shadow:postcommunist legacies, values, and behavior. Comparative Politics, 43(4):379–408.
Presidium of Supreme Soviet of USSR, Information-Statistical Division,editor (1941/1946/1954) SSSR: Administrativno-territorial’noye deleniesoyuznykh respublik [USSR: Administrative division of Union Republics].Moscow: Izdatel’stvo ‘Izvestiya Sovetov Deputatov TrudyashchikhsyaSSSR’.
Rosstat (2004-2012) Russia in Figures: Statistical Handbook. Moscow: FederalState Statistics Service.
30

Rozenas, Arturas; Sebastian Schutte & Yuri M Zhukov (2017) The polit-ical legacy of violence: The long-term impact of Stalin’s repression inUkraine. Journal of Politics, 79(4): 1147–1161.
Schelling, Thomas C (2008) Arms and Influence: With a New Preface andAfterword. New Haven, CT: Yale University Press.
Schuessler, Alexander A (2000) A logic of expressive choice. Princeton, NJ:Princeton University Press.
Smirnov, Mikhail B., editor (1998) Sistema ispravitel’no-trudovykh lagereyv SSSR [Correctional labor camp system in the USSR]. Moscow: Zvenya.(http://old.memo.ru/history/nkvd/gulag/).
Snyder, Timothy (2012) Bloodlands: Europe between Hitler and Stalin. NewYork: Basic Books.
Treisman, Daniel (2011) Presidential popularity in a hybrid regime: Russiaunder Yeltsin and Putin. American Journal of Political Science, 55(3): 590–609.
U.S. Geological Survey (1996) Global 30-Arc-Second Elevation Data Set.(https://webmap.ornl.gov/wcsdown/dataset.jsp?ds_id=10003).
Verba, Sidney & Norman H Nie (1972) Participation in America. New York:Harper & Row.
Weidmann, Nils B; Jan Ketil Rød & Lars-Erik Cederman (2010) Represent-ing ethnic groups in space: A new dataset. Journal of Peace Research, 47(4):491–499.
Wood, Elisabeth J. (2006) Variation in sexual violence during war. Politicsand Society, 34(3): 307–342.
31

YURI M ZHUKOV, b. 1980, PhD in Government (Harvard University,2014); Assistant Professor of Political Science, University of Michigan(2014– ); research interests: international security, civil conflict.
ROYA TALIBOVA, b. 1986, M.P.A. (Harvard Kennedy School, 2014);PhD Candidate in Political Science and Statistics, University of Michi-gan; research interests: political violence, repression.
32

Table I. Summary statistics (25×25 km2 grid)
Name Mean Median Std. dev. Range N Source
Stalin-era repressionRepression (per cell) 4.00 34.16 235.41 [0, 13630] 8,336 MemorialNearest station (km) 436.63 765.08 790.64 [0, 3533.37] 29,279 GSRANearest railroad (km) 432.10 753.52 799.98 [0, 3533.37] 29,279 GSRADistance to Gulag (km) 245.95 387.60 836.32 [4.87, 22562.83] 8,336 GSRA &
MemorialContemporary votingTurnout (2003) 58.55 60.73 13.02 [6.67, 100] 7,416 CEC RFTurnout (2004) 69.34 70.56 13.07 [33.45, 100] 7,418 CEC RFTurnout (2007) 67.54 69.44 13.48 [31.03, 100] 7,984 CEC RFTurnout (2008) 75.15 74.95 12.40 [34.8, 100] 7,447 CEC RFTurnout (2011) 60.78 63.68 14.75 [20.89, 100] 8,054 CEC RFTurnout (2012) 68.04 69.85 12.59 [30.12, 100] 8,076 CEC RFCovariatesUrbanization (1926) 0.25 0.25 0.17 [0, 1] 23,925 USSR1926Dist. to WWII front (km) 1716.28 1587.49 911.58 [0, 3239.11] 29,279 DPE1985Std.Dev. elevation (m) 25.40 48.75 67.63 [0, 1212.81] 29,279 ETOPO30Num. ethnic groups (1964) 1.00 1.28 0.61 [0, 7] 29,279 GREGProportion Russian (1964) 0.00 0.38 0.43 [0, 1] 28,382 GREGPop. density (2000) 0.36 8.42 78.49 [0.01, 6147.65] 29,191 GPWUnemployed (2003) 9.45 9.61 2.89 [1.29, 55.75] 25,796 RosstatGRP (2003) 114.90 139.53 133.03 [3.8, 960] 29,222 RosstatUnemployed (2004) 8.82 8.80 2.92 [1.64, 43.55] 25,796 RosstatGRP (2004) 133.10 169.73 168.04 [4.8, 1194.1] 29,222 RosstatUnemployed (2007) 7.60 7.21 2.99 [0.83, 52.55] 25,836 RosstatGRP (2007) 205.80 322.12 370.94 [8.6, 5145.9] 29,279 RosstatUnemployed (2008) 7.35 7.70 2.48 [0.93, 53.34] 25,836 RosstatGRP (2008) 246.50 392.17 412.08 [14.8, 6731.2] 28,660 RosstatUnemployed (2011) 6.89 7.44 2.34 [1.44, 48.15] 25,836 RosstatGRP (2011) 384.70 531.98 500.72 [21.5, 8401.9] 28,660 RosstatUnemployed (2012) 6.23 6.56 2.23 [0.81, 47.68] 25,836 RosstatGRP (2012) 483.00 635.38 603.81 [26.1, 10021.5] 28,660 RosstatMemorial: Memorial (2014); Smirnov (1998); GSRA: Main Military Communications Directorate ofthe Red Army (1943); Military-Topographical Directorate of the General Staff of the Red Army (1945);CEC RF: Central Election Commission of the Russian Federation; GTOPO30: U.S. Geological Survey(1996); GREG: Weidmann et al. (2010); GPW: CIESIN & Columbia University (2005); USSR1926: 1926All-Union Census; Rosstat: Rosstat (2012).
33

Figure 1. Maps of Soviet repression and political participation.
(a) Scale of Soviet repression.
(b) Voter turnout.
34

Figure 2. Soviet railroad network and Gulag system.
Table II. Effect of Soviet repression on voter turnout. Quantities reportedare standardized 2SLS coefficients and 95% confidence intervals.
Second stage results Dependent variable:Turnout (2012)
(1) (2) (3) (4) (5) (6)log(Repression) −0.72∗∗∗ −0.64∗∗∗ −0.57∗∗ −0.34∗∗∗ −0.33∗∗∗ −0.24∗∗
(−0.99, −0.45) (−0.91, −0.36) (−0.97, −0.17) (−0.50, −0.17) (−0.50, −0.16) (−0.41, −0.08)
First stage results Dependent variable:log(Repression)
Distance to station −0.73∗∗∗ −0.65∗∗∗(−0.91, −0.56) (−0.84, −0.45)
Distance to railroad −0.69∗∗∗ −0.64∗∗∗(−0.87, −0.52) (−0.83, −0.44)
Distance to Gulag −0.12∗∗∗ −0.11∗(−0.17, −0.08) (−0.20, −0.01)
Oblast FE Y Y Y Y Y YMoran eigenvectors N N N Y Y Y
Observations 7,026 7,026 7,026 391 391 391Grid size 25km 25km 25km 200km 200km 200kmR2 0.24 0.31 0.35 0.70 0.70 0.70Adjusted R2 0.23 0.30 0.34 0.62 0.62 0.63Residual Std. Error 0.82 (df = 6942) 0.79 (df = 6942) 0.76 (df = 6942) 0.59 (df = 312) 0.58 (df = 312) 0.58 (df = 312)Weak instruments 67.51*** 60.79*** 26.18*** 13.57*** 13.06*** 9.47***Wu-Hausman 42.1*** 29.15*** 9.99** 4.74* 4.14* 0.46Moran’s I (resid) 32.27*** 32.78*** 33.18*** -3.19 -3.2 -3.25
†p<0.1; ∗p<0.05; ∗∗p<0.01; ∗∗∗p<0.001
35

Figure 3. Effect of Soviet repression on voter turnout in Russia. Quantitiesare standardized coefficient estimates of θ̂ from equation 2. Blue bars are95% confidence intervals.
36

Figure 4. Effect of electoral fraud on the repression effect. Quantities rep-resent standardized coefficient estimates of θ̂ from equation 2, for datasubsets in which the probability of electoral fraud is at most p.
37

Figure 5. Effect of Soviet repression on voter turnout in Ukraine. Quantitiesare standardized coefficient estimates of θ̂ from equation 2.
Figure 6. Effect of amnesty on turnout. Standardized coefficient estimatesfrom regressions of voter turnout on the proportion of local arrestees whodid (blue) or did not receive amnesty (red).
38