stainless steel analysis using tribology & 3d...
TRANSCRIPT
6 Morgan, Ste156, Irvine CA 92618 · P: 949.461.9292 · F: 949.461.9232 · nanovea.comToday's standard for tomorrow's materials. © 2010 NANOVEA
Stainless Steel Analysis UsingTribology & 3D Metrology
Prepared byPierre Leroux
2
INTRO:
Tribology is a vital field of study spanning across virtually all industries. It is the science andengineering of interacting surfaces in relative motion, including the study of friction,lubrication and wear. Literally any application in motion and contact with another application,and or the same, face the consequence of wear, which costs money for replacement andcauses downtime on machinery equipment. The ongoing challenge of engineers is to source,and or design, materials that are the most wear resistant, in order to extend the life of theapplication or part to reduce the frequency of replacement. The study of Tribology is mostcommonly applied in machinery and automotive design but extends into almost all otheraspects of modern technology, including medical, cosmetics, electronics and many others.
IMPORTANCE OF TRIBOLOGY INSPECTION FOR QUALITY CONTROL
Tribology is crucial to the development of new and improved cost-saving applications, inwhich are in constant battle with the forces of friction and wear. The purpose of Tribologyresearch is ultimately the minimization and elimination of losses resulting from wear andfriction at all levels of technology where the rubbing of surfaces is involved. Tribology researchis vital to greater production efficiency, application performance, controlled replacementbreakdowns, and most importantly to the cost savings to allow industrial growth.
MEASUREMENT OBJECTIVE
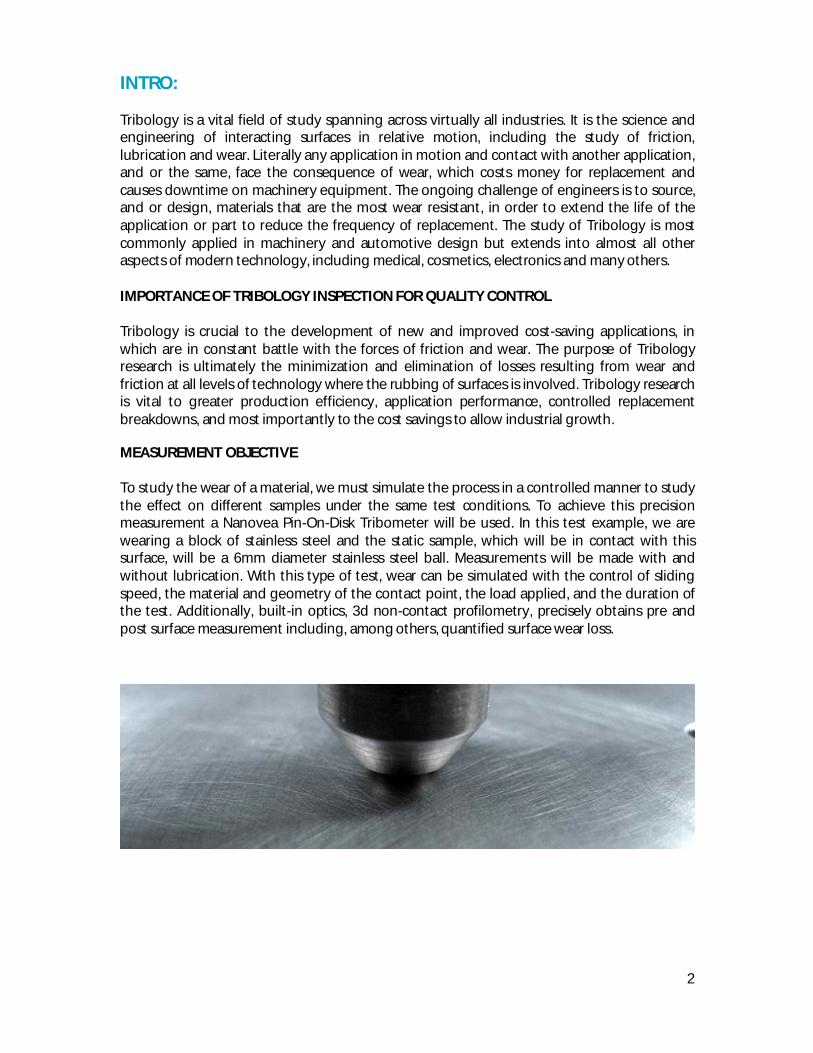
To study the wear of a material, we must simulate the process in a controlled manner to studythe effect on different samples under the same test conditions. To achieve this precisionmeasurement a Nanovea Pin-On-Disk Tribometer will be used. In this test example, we arewearing a block of stainless steel and the static sample, which will be in contact with thissurface, will be a 6mm diameter stainless steel ball. Measurements will be made with andwithout lubrication. With this type of test, wear can be simulated with the control of slidingspeed, the material and geometry of the contact point, the load applied, and the duration ofthe test. Additionally, built-in optics, 3d non-contact profilometry, precisely obtains pre andpost surface measurement including, among others, quantified surface wear loss.
3
PIN-ON-DISK TEST METHOD:
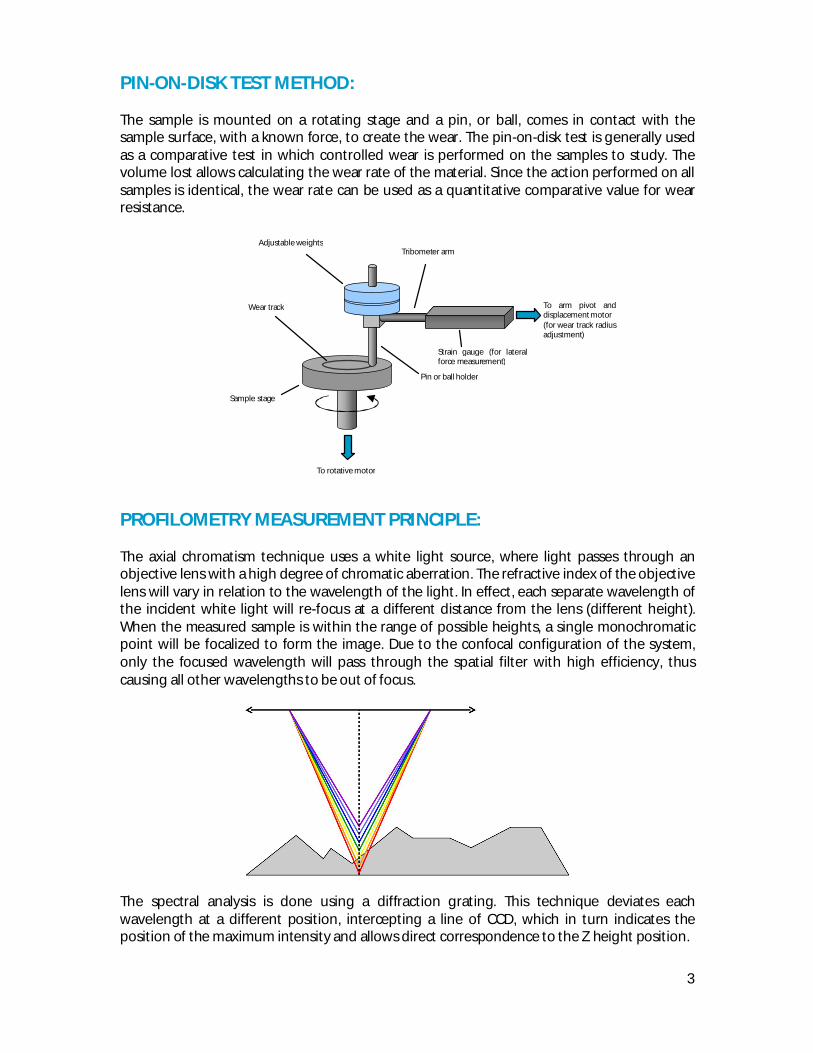
The sample is mounted on a rotating stage and a pin, or ball, comes in contact with thesample surface, with a known force, to create the wear. The pin-on-disk test is generally usedas a comparative test in which controlled wear is performed on the samples to study. Thevolume lost allows calculating the wear rate of the material. Since the action performed on allsamples is identical, the wear rate can be used as a quantitative comparative value for wearresistance.
PROFILOMETRY MEASUREMENT PRINCIPLE:
The axial chromatism technique uses a white light source, where light passes through anobjective lens with a high degree of chromatic aberration. The refractive index of the objectivelens will vary in relation to the wavelength of the light. In effect, each separate wavelength ofthe incident white light will re-focus at a different distance from the lens (different height).When the measured sample is within the range of possible heights, a single monochromaticpoint will be focalized to form the image. Due to the confocal configuration of the system,only the focused wavelength will pass through the spatial filter with high efficiency, thuscausing all other wavelengths to be out of focus.
The spectral analysis is done using a diffraction grating. This technique deviates eachwavelength at a different position, intercepting a line of CCD, which in turn indicates theposition of the maximum intensity and allows direct correspondence to the Z height position.
Adjustable weights
Sample stage
Pin or ball holder
Wear track
Tribometer arm
Strain gauge (for lateralforce measurement)
To arm pivot anddisplacement motor(for wear track radiusadjustment)
To rotative motor
4
PIN-ON-DISK TEST RESULTS:
For the pin-on-disk test, the following parameters are used:
Force applied 20.0 NSpeed of rotation 200.0 RPMRadius of wear track 3.00mmDuration of test 3.0 minutesTotal disk rotations 602.0Distance traveled 11.35 mLubrication (Super Lube) Synthetic Lightweight Oil
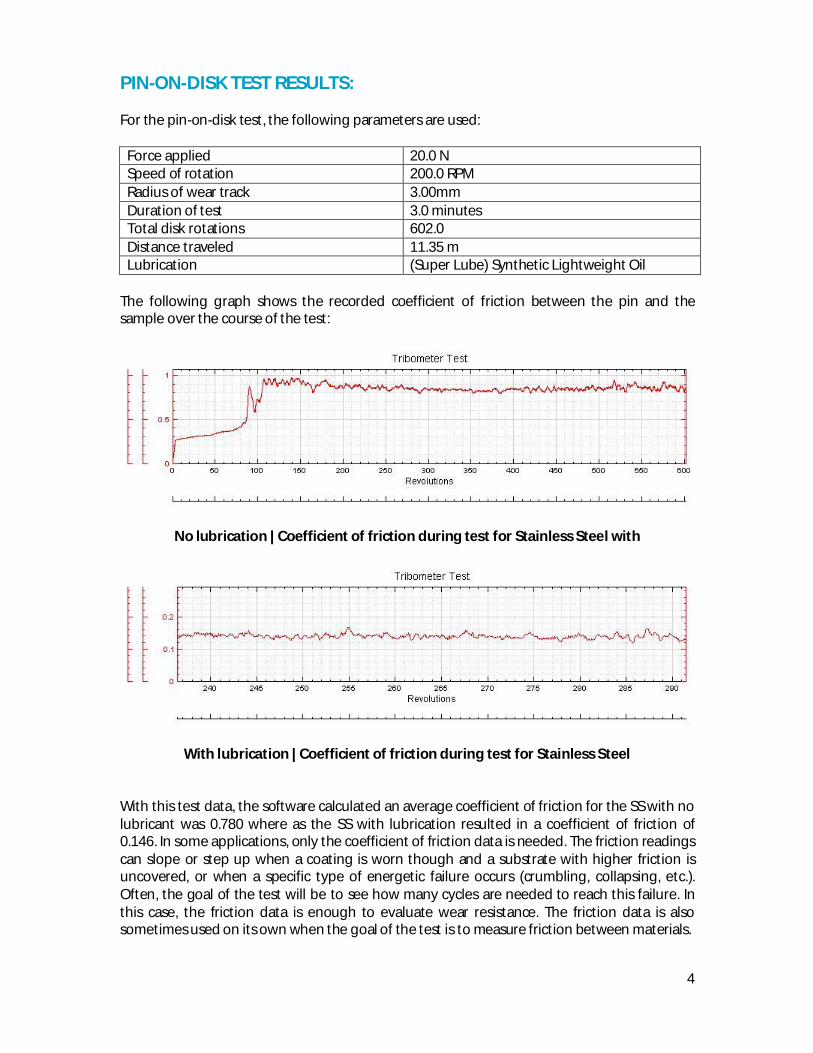
The following graph shows the recorded coefficient of friction between the pin and thesample over the course of the test:
No lubrication | Coefficient of friction during test for Stainless Steel with
With lubrication | Coefficient of friction during test for Stainless Steel
With this test data, the software calculated an average coefficient of friction for the SS with nolubricant was 0.780 where as the SS with lubrication resulted in a coefficient of friction of0.146. In some applications, only the coefficient of friction data is needed. The friction readingscan slope or step up when a coating is worn though and a substrate with higher friction isuncovered, or when a specific type of energetic failure occurs (crumbling, collapsing, etc.).Often, the goal of the test will be to see how many cycles are needed to reach this failure. Inthis case, the friction data is enough to evaluate wear resistance. The friction data is alsosometimes used on its own when the goal of the test is to measure friction between materials.
5
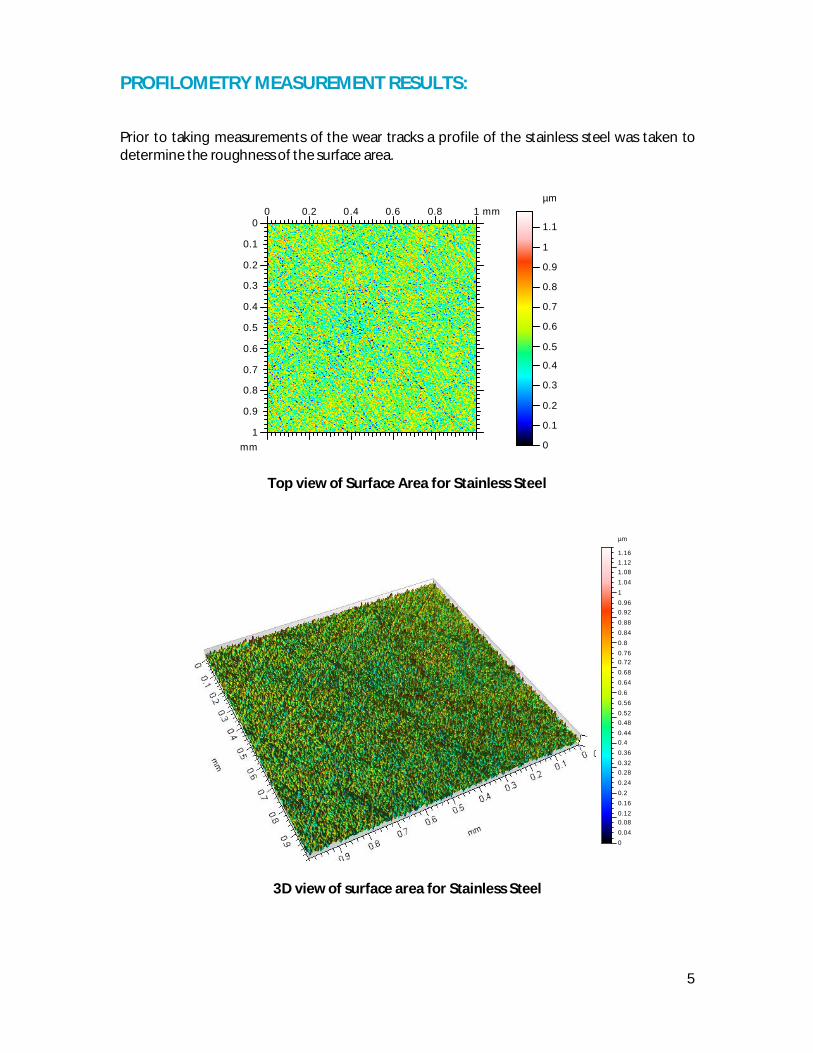
PROFILOMETRY MEASUREMENT RESULTS:
Prior to taking measurements of the wear tracks a profile of the stainless steel was taken todetermine the roughness of the surface area.
µm
0
0.1
0.2
0.3
0.4
0.5
0.6
0.7
0.8
0.9
1
1.10 0.2 0.4 0.6 0.8 1 mm
mm
0
0.1
0.2
0.3
0.4
0.5
0.6
0.7
0.8
0.9
1
Top view of Surface Area for Stainless Steel
µm
00.040.080.120.160.20.240.280.320.360.40.440.480.520.560.60.640.680.720.760.80.840.880.920.9611.041.081.121.16
3D view of surface area for Stainless Steel

6
Roughness Parameters
ST501328
Sa 0.121 m Arithmetical Mean HeightSq 0.152 m Root Mean Square HeightSp 0.645 m Maximum Peak HeightSv 0.536 m Maximum Pit HeightSz 1.182 m Maximum Height
Ssk -0.01576 SkewnessSku 3.038 Kurtosis
µm
0
0.5
1
1.5
2
2.5
3
3.5
4
4.5
5
5.5
6
NM
0 2 4 6 8 mm
mm
0
1
2
3
4
5
6
7
8
No lubrication| False color surface height representation of Stainless Steel
µm
0
0.25
0.5
0.75
1
1.25
1.5
1.75
2
2.25
2.5
2.75
3
3.250 2 4 6 8 mm
mm
0
1
2
3
4
5
6
7
8
With lubrication | False color surface height representation of Stainless Steel
7
0 0.05 0.1 0.15 0.2 0.25 0.3 0.35 0.4 0.45 0.5 0.55 0.6 0.65 0.7 0.75 0.8 0.85 0.9 0.95 mm
µm
-2
-1.5
-1
-0.5
0
0.5
1
1.5
2
2.5
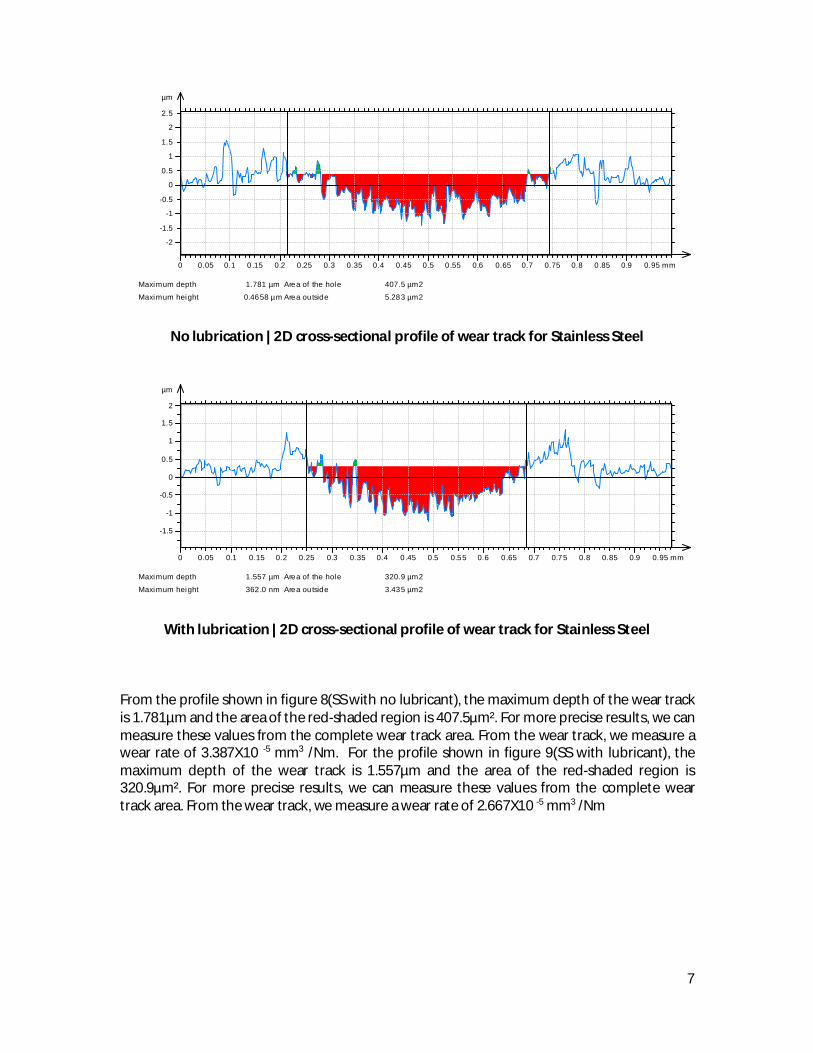
Maximum depth 1.781 µm Area of the hole 407.5 µm2
Maximum height 0.4658 µm Area outside 5.283 µm2
No lubrication | 2D cross-sectional profile of wear track for Stainless Steel
0 0.05 0.1 0.15 0.2 0.25 0.3 0.35 0.4 0.45 0.5 0.55 0.6 0.65 0.7 0.75 0.8 0.85 0.9 0.95 mm
µm
-1.5
-1
-0.5
0
0.5
1
1.5
2
Maximum depth 1.557 µm Area of the hole 320.9 µm2
Maximum height 362.0 nm Area outside 3.435 µm2
With lubrication | 2D cross-sectional profile of wear track for Stainless Steel
From the profile shown in figure 8(SS with no lubricant), the maximum depth of the wear trackis 1.781µm and the area of the red-shaded region is 407.5 m². For more precise results, we canmeasure these values from the complete wear track area. From the wear track, we measure awear rate of 3.387X10 -5 mm3 /Nm. For the profile shown in figure 9(SS with lubricant), themaximum depth of the wear track is 1.557µm and the area of the red-shaded region is320.9 m². For more precise results, we can measure these values from the complete weartrack area. From the wear track, we measure a wear rate of 2.667X10 -5 mm3 /Nm
8
µm
0
0.5
1
1.5
2
2.5
3
3.5
4
4.5
5
5.5
6
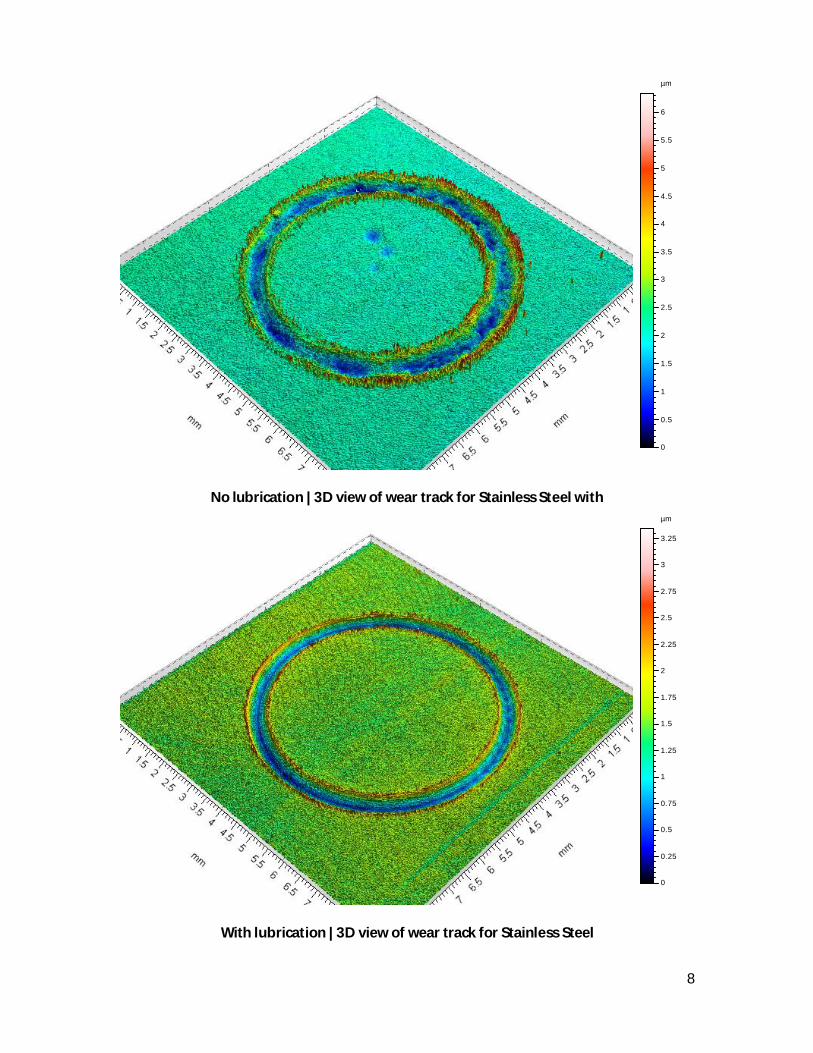
No lubrication | 3D view of wear track for Stainless Steel withµm
0
0.25
0.5
0.75
1
1.25
1.5
1.75
2
2.25
2.5
2.75
3
3.25
With lubrication | 3D view of wear track for Stainless Steel
9
CONCLUSION:
Using the Nanovea Tribometer, with optical integration, we have shown the precisecalculation of wear rate to a chosen material. The Tribometer allowed performing wearcalculations through a pin-on-disk method in a controlled and repeatable fashion, which willallow testing and comparing of several samples under identical conditions. The integratedoptics measured the topography of the sample surface to accurately calculate roughness andthe volume of wear loss. The test parameters can be adjusted and modules can be added tobetter simulate particular wear applications. Different materials and geometries can be usedas static samples: different size pins, balls, or other custom shapes and sizes. The tribometercan perform wear in a circular or linear motion. The test can be performed at elevatedtemperatures or under lubrication. The applied load can go up to 60N, and rotation speeds upto 500rpm (custom instruments with higher loads and speeds also possible). In conclusion, theNanovea Tribometer with optical integration is an ideal instrument with unmatched optionsto evaluate and conduct Tribology studies in research or industrial environments.