stages of learning motivation: development and validation ... et al. 2004... · stages of learning...
TRANSCRIPT
1421
Journal of Applied Social Psychology, 2004, 34, 7, pp. 1421-1456.Copyright © 2004 by V. H. Winston & Son, Inc. All rights reserved.
Stages of Learning Motivation:Development and Validation of a Measure1
MICHAEL S. COLE2
Institute for Leadership and Human Resource ManagementUniversity of St. Gallen
STANLEY G. HARRIS AND HUBERT S. FEILDDepartment of Management
Auburn University
Prochaska and colleagues’ (e.g., Prochaska, DiClemente, & Norcross, 1992) stages-of-change theory was employed in the current study to reconceptualize the assessment ofmotivation to learn. We used the stages-of-change framework to develop and test a multi-dimensional measure of learning motivation using 3 independent samples. The pattern ofrelationships among the learning stages and learning criteria provided strong support forthe appropriateness of using a stage-based perspective to frame learning motivation. Inaddition, hierarchical regression analysis showed that the Stages of Learning MotivationInventory (SOLMI) explained variance in the criteria (e.g., exam average, class satisfac-tion) beyond controls and a commonly used measure of learning motivation. Implicationsfor practice and future research are discussed.
The past decade has seen a burgeoning interest in how personal characteris-tics are related to training effectiveness, as well as why, when, and for whomtraining is most effective (Tannenbaum & Yukl, 1992). A better understanding ofthe attributes—including ability, motivation, and work environment (e.g.,Goldstein, 1993; Noe & Schmitt, 1986)—that influence individuals’ trainabilitycould provide important insight into the ultimate effectiveness of training andlearning endeavors (Campbell, 1989; Noe, 1986). Although most of the earlytrainability literature focused on trainees’ ability, research on motivation to learnhas been increasing (Colquitt, LePine, & Noe, 2000). Motivation to learn influ-ences decision-making processes regarding the direction, focus, and level ofeffort applied to a learning activity (Noe, Wilk, Mullen, & Wanek, 1997).
1The authors thank Jason A. Colquitt and two anonymous reviewers for their helpful commentson earlier drafts of this manuscript.
2Correspondence concerning this article should be addressed to Michael S. Cole, University ofSt. Gallen, Institute for Leadership and Human Resource Management, Dufourstrasse 40a, CH-9000St. Gallen, Switzerland. E-mail: [email protected]

1422 COLE ET AL.
In general, the training literature has acknowledged that learning motivationcan be affected by individual and situational characteristics (e.g., Baldwin,Magjuka, & Loher, 1991; Goldstein, 1993; Mathieu & Martineau, 1997;Mathieu, Tannenbaum, & Salas, 1992). For example, researchers have examinedthe relevance of individuals’ personality and cognitive ability, as well as anorganization’s climate in predicting learning motivation and transfer (e.g.,Colquitt et al., 2000). In turn, learning motivation is reported to exhibit a positiverelationship with learning outcomes (Colquitt & Simmering, 1998; Mathieuet al., 1992; Quinones, 1995).
Despite the demonstrated positive relationships between motivation to learnand important criteria, those relationships are often weak. For example, threerecent studies reported that pre-training motivation explained only 2% of theincremental variance in participants’ post-training learning (Baldwin et al., 1991;Colquitt & Simmering, 1998; Mathieu et al., 1992). What might account forthe relatively weak predictive ability of learning motivation with key learningcriteria? We believe that using current conceptualizations and measures ofmotivation to learn to assess motivation in training environments has limitedresearch in at least two ways. First, they have emphasized a static rather than adynamic view of motivation. Second, they may underestimate the role ofmotivation because they are largely unidimensional and do not fully capturemotives and behaviors that are associated with qualitatively different motiva-tional states.
Current conceptualizations and measurement typically emphasize a staticrather than a dynamic view of learning (typically pre-training) motivation. Mostrecent research depicts pre-training motivation as an exogenous variable,assessed at one point in time, and linked to learning processes or other learningcriteria (e.g., performance). The dominant theoretical perspectives on learningmotivation (and its measurement) build off of expectancy theory and focus onself-efficacy or valence–instrumentality–expectancy composites (Mathieu &Martineau, 1997). While these theories accommodate the idea that expectancies,motives, and valences can change over time, they do not emphasize such dyna-mism. In our view, such an approach biases research against considering thepossibility that learning motivation may change over time and that individualsmight progress (or regress) through various motivational states.
A second possible bias in current conceptualizations and measures ofmotivation to learn is related to the first. Specifically, the static view of learningmotivation engenders a unidimensional approach to motivation built off ofexpectancy theory. The prevailing assumption presumes that learning motivationis not comprised of different dimensions, only varying degrees. When measuringmotivation to learn, some researchers adopt the scale developed by Noe andSchmitt (1986), while others have added items to Noe and Schmitt’s scale, andstill others have developed entirely new measures (e.g., Baldwin et al., 1991;
STAGES OF LEARNING MOTIVATION 1423
Mathieu et al., 1992; Noe & Wilk, 1993; Quinones, 1995). In each case, however,the measure focuses on unidimensional degrees of desire and learning behavior.For example, all of these measures share an underlying assumption that the indi-vidual is already aware of a learning opportunity.
But if a person is truly in a state of being unaware of a learning opportunity, isit reasonable to assume that they can accurately express the expectancy, instru-mentality, and valence of such learning? What about a person who is forced orcoerced into a learning opportunity, who feels it is unnecessary, and who is moti-vated only to learn enough to satisfy some requirement? Such a ticket-punchapproach to learning may in fact interfere with long-term knowledge acquisitionand retention. Unfortunately, current approaches to learning motivation makecapturing such reluctant, short-term motivation difficult. Furthermore, currentmeasures do not allow a distinction to be drawn between mental motivation andreadiness, and readiness to become actively involved. In sum, we were unable tolocate any measures or research that explored the proposition that individuals’motivation to learn is multidimensional and dynamic.
In response to these concerns, we offer a multidimensional, dynamicapproach to understanding motivation to learn drawn from the transtheoreticalmodel (also known as the stage model), a leading approach to health behavioralchange, originally formulated by Prochaska (1979). We feel this stage-basedapproach to learning motivation has the benefit of capturing the dynamic move-ment between multiple and qualitatively unique motivational states that are pres-ently obscured by current approaches to learning motivation. Applying insightsfrom the transtheoretical model to learning motivation adds to the traditional uni-dimensional theoretical underpinnings of the concept by acknowledging that oneis not always conscious of a learning opportunity or need, and then emphasizingthe progression and thought processes that take an individual from awareness tocontemplating action to activated learning behaviors. Guided by the transtheoret-ical model, we then describe the development and initial validation of a multi-dimensional, stage-based measure of individuals’ motivation to learn within auniversity classroom setting.
A Stage-Based Perspective on Motivation to Learn
Developed as an integrative model of intentional behavioral change,Prochaska (1979) emphasized the roles of need awareness, readiness, and level ofmotivation to change when he conceptualized the transtheoretical model (TTM)of behavioral change. Incorporating motivational, cognitive, social learning, andrelapse prevention theories, the TTM has received an extensive amount of sup-porting empirical evidence with regard to positive behavioral change in psycho-therapy and therapeutic contexts (e.g., smoking cessation, weight control,reducing adolescent delinquent behaviors). For instance, DiClemente and
1424 COLE ET AL.
Prochaska (1982), in one of the early TTM studies, found strong evidence forindividuals’ progression through distinct stages of change characterized bydifferent levels of awareness, motivations, concerns, and intervention require-ments. This study was the foundation for a series of studies (e.g., Prochaska &DiClemente, 1982, 1983b) providing the framework for categorizing stages-of-change motivation and, ultimately, interventions appropriate to support progressat each stage.3
Stages of Change
The principal construct of the TTM, stages of change, describes five stages inthe change process, each characterized by different motivations (Levesque et al.,2001). As described by Prochaska et al. (1992), in the first stage, precontempla-tion, individuals are either unaware of the need for change or feel coerced intochanging and have no intention of changing. In the second stage, contemplation,individuals are aware of a need to change and are actively deciding if they areable or motivated to make the change. In the third stage, preparation, individualshave decided to change and are making plans to do so in the near future or are inthe early stages of initiating those changes. During the fourth stage, action, indi-viduals are taking the actual steps necessary for change and may seek help to fur-ther accomplish change. In the fifth and final stage, maintenance, individualsfocus on the prevention of relapsing to pre-change behaviors. Consistent with thetraining motivation literature, self-efficacy is an important component in the stagemodel, with self-efficacy levels increasing as individuals advance through thestages of change (Prochaska, DiClemente, Velicer, Ginpil, & Norcross, 1985).
A major benefit of the stages-of-change approach to understanding motiva-tion to undertake change, including learning, is that it identifies processes that areused in each stage to facilitate stage advancement (Prochaska et al., 1992).Research has shown that matching outside interventions to the stage of the indi-vidual can more than double the likelihood that individuals will take action(Prochaska, DiClemente, Velicer, & Rossi, 1993). Based on an assessment ofrespondents’ change stage, Prochaska et al. (1994) were able to predict the deci-sional processes and techniques that facilitated individuals to make progressacross 12 different personal changes. In general, consciousness raising, self-evaluation, education, and reflection are the interventions most appropriate tomotivate change action for those in the precontemplation and contemplationstages. More behavioral, skill-based, reinforcement-based, action-oriented inter-ventions seem best suited for continuing the change actions of those already inthe action and maintenance stages.
3For a detailed review of the TTM, see Prochaska, DiClemente, and Norcross (1992), or visitProchaska’s website at http://www.uri.edu/research/cprc/Faculty/JProchaska.htm
STAGES OF LEARNING MOTIVATION 1425
Prochaska’s findings have far-reaching implications for the one-size-fits-allapproach frequently employed by trainers during education and trainingprograms. For example, an appropriate intervention for someone in the pre-contemplation learning motivation stage should emphasize the need for andadvantages of learning the material. Such intervention for someone in the actionstage would be wasteful. Contemplators need encouragement and matched inter-ventions designed to increase valence and feelings of efficacy regarding thepotential learning activity. Those in the preparation stage require interventionsfocused on encouragement and support with early learning efforts. Individualsalready taking action need interventions that facilitate meeting their learningneeds (e.g., access to information and competent instruction).
Although the stages of change have received attention in therapeutic contexts,researchers have only recently begun to apply Prochaska’s theory in organiza-tional settings (e.g., Levesque, Prochaska, & Prochaska, 1999; Levesque et al.,2001; Prochaska, 2000). Our search yielded only one application in the domainof learning: Harris and Cole (1999) applied Prochaska’s model and measurementapproach to assess managers’ readiness and motivation to participate in a leader-ship development program. Their results were consistent with the motivationalframework underlying Prochaska’s theory. For example, they found relationshipsbetween participants’ stages-of-change sentiments and their perceived desire tolearn about certain topics, as well as their evaluation of both course content andinstructors. While Harris and Cole’s work demonstrated the advantages of usingthe model in an organizational learning environment, they also noted the need forimproving the measurement of the model’s stages in such a context.
Research Goals and Hypotheses
The goals of the research reported here are to design, refine, and examine thevalidity of a stages of learning motivation inventory (SOLMI) modeled after thestages-of-change measures employed by Prochaska and others. Therefore, wewanted to create an instrument that would assess the degree to which respon-dents’ attitudes, motivations, and behaviors were consistent with each stage ofchange. While the resulting SOLMI provides a template for use in different edu-cational settings, in the present study it was designed to assess student motivationto learn in a university course.
Classroom-based learning is an important form of personal change and, basedon Prochaska’s model, motivation for such learning should be manifested in dif-ferent stages. Learning class material often requires students to change not onlytheir attitudes regarding the class, but also their behavior. Therefore, in an edu-cational context, each stage of change can be considered a stage of learningmotivation. For example, individuals in the precontemplation learning motiva-tion stage either do not realize they have a need to learn something or may feel

1426 COLE ET AL.
coerced into learning something that they do not value (e.g., students enrolled ina required class that they do not want to take and see no need in taking).
Given our research context (short, quarter-long university course), wedecided that it was not appropriate to expect or try to measure the maintenancestage. Therefore, the SOLMI was designed to assess only the first four stages ofchange (precontemplation, contemplation, preparation, and action) by providinga scale score for each. Our validity examinations of the resulting inventory arebuilt around four hypotheses.
First, it is important to show that the SOLMI operates in a manner consistentwith the stages-of-change theory. Because each of the SOLMI scales denotes adistinct stage of learning motivation, we expect individuals’ scale scores willexhibit a peaked profile. That is, the stage theory of learning motivation impliesthat persons are primarily in one stage at a time. Based on this discussion, weformed the following hypothesis:
Hypothesis 1. Students will score higher on one stage of changethan on others.
Since the action stage involves actual behavioral engagement in the learningprocess, the earlier students achieve this stage, the more time and energy theyhave to engage in positive learning behaviors (e.g., class attendance) and activelearning (as may be reflected in performance on exams). In addition, it is morelikely that they will appreciate the learning opportunity provided to them. Stu-dents in earlier stages will spend more time and energy resisting learning orbecoming aware of the need to learn, and their classroom behavior, performance,and attitudes should suffer by comparison. We, therefore, formed the followinghypothesis:
Hypothesis 2. Students who occupy the action stage earlier duringthe academic term will have higher attendance, exam scores, andclass satisfaction than those occupying other stages.
Next, we examine how students’ learning motivation stage interacts at twopoints in time to explain learning behaviors, performance, and class attitudes.Because it is a stage model, we would expect some students to progress, others toregress, and others to remain unchanged with regard to their stage of motivation.Movement between stages makes interpretation of the relationships between thestages and criteria difficult. To account for this potential movement, we usestudents’ learning motivation stages at the beginning and end of the academicterm to evaluate more fully the relationships between the criterion variables andthe stages of learning motivation. For example, being in the action stage atboth administrations should result in the highest classroom performance, asreflected in exam scores. Also positive progression into the action stage should

STAGES OF LEARNING MOTIVATION 1427
be associated with better performance than remaining static in a lower stage orregressing to a lower stage. Therefore, we hypothesize the following:
Hypothesis 3. Students’ occupied stages at the beginning and endof the academic term will interact and explain students’ classroomperformance. Students static in the action phase will perform best,those progressing to the action stage will perform next best, andstudents regressing in stage or remaining static in a stage belowaction will perform relatively worse.
Finally, if the multidimensional approach to understanding and assessingindividuals’ learning motivation offered by the stages-of-change model extendscurrent unidimensional assessments of learning motivation, then its assessmentby the SOLMI should account for variation in relevant learning criteria beyondthat explained by traditional measures. Conceptually, traditional treatments oflearning motivation focus on the desire to learn and the effort expended to learnwhile taking the awareness of the learning opportunity for granted. Comparedwith the stage-based approach to learning motivation, effort and desire overlapmost with the sentiments reflected in the action and preparation stages, while themotivational states of precontemplation and contemplation are relativelyneglected. Therefore, within the SOLMI, we expect the precontemplation andcontemplation attitudes to explain the most unique variance beyond thatexplained by traditional learning motivation measures:
Hypothesis 4. The SOLMI will explain incremental variance inlearning criteria (students’ exam average, class attendance, classsatisfaction, and help-seeking behaviors) beyond that accountedfor by traditional measures employed to assess learning motivationsentiments. In addition, the motivational states of precontempla-tion and contemplation of the SOLMI will account for most of thisunique variance.
SOLMI Development
The instruments used by Prochaska and his colleagues (e.g., McConnaughy,DiClemente, Prochaska, & Velicer, 1989) and Harris and Cole (1999) werereviewed and their items modified to develop an initial pool of items to assess thefour stages of learning motivation. No previous items existed to capture the prep-aration stage. Prochaska et al. (1992) argued that high scores on contemplationand action depict the preparation stage and, thus, did not develop items to tappreparation explicitly. To avoid the problem of mixing item specificity (e.g.,motivation for general learning versus motivation for learning content in a

1428 COLE ET AL.
particular class), all items were written to refer to the learning environment repre-sented in the specific introductory management class being surveyed (three dif-ferent classes ultimately were surveyed).
A small focus group consisting of two management professors and three doc-toral candidates was assembled to review and comment on the items. Following adiscussion of Prochaska’s (Prochaska et al., 1992) TTM theory and its applicabil-ity in an educational setting, the group judged each item’s applicability to thefour learning motivation constructs. As a result of these efforts, 20 items wereidentified for inclusion in the initial Stages of Learning Motivation Inventory.Precontemplation (e.g., “It doesn’t make sense for me to attend all of thiscourse’s lectures”) and contemplation (e.g., “I am hoping this course will help meto better understand management principles”) scales consisted of 5 items each.Six items (e.g., “I have started working to improve my learning in this course, butwould like help”) were developed to measure the preparation stage. Finally, 4items (e.g., “I am really working hard to improve my knowledge of this course’sinformation”) were designed to assess the action stage. All items were assessedon a 6-point Likert scale ranging from 1 (strongly disagree) to 6 (strongly agree).
When developing and validating new items, DeVellis (1991) suggested usingindependent samples to increase the generalizability of a measure’s dimensional-ity. Therefore, to adequately develop and refine the SOLMI instrument, theinstrument was administered in a large Principles of Management class in thebusiness school of a southeastern university (Sample 1), then refined and admin-istered several months later in a large Management Information Systems class inthe same university (Sample 2). A mixture of exploratory and confirmatoryfactor analyses was used to guide refinement efforts.
Initial SOLMI Administration
Participants and procedure. Sample 1 participants were 285 undergraduatestudents enrolled in a large Principles of Management course. The participantswere primarily male (59%) and White (91%). Their average age was 22 years(SD = 2.7), with 98% classified as either a junior or senior. The class met fourtimes per week (50 min each session) over the course of an academic quarter.Three sessions each week consisted of a lecture in a large auditorium. For thefourth session, the class was broken into smaller discussion/lab sections, and alab instructor directed the activities. Lab instructors administered the SOLMIinstrument during Week 3 of the course.
Analyses and results. Exploratory factor analysis of students’ responses to theSOLMI was used to examine the inventory’s dimensionality. Because the stages-of-change theory suggests that adjacent stages may be more correlated thannon-adjacent stages (McConnaughy et al., 1989), oblique (direct oblimin)rotation was employed. Thompson and Daniel (1996) recommended the use of
STAGES OF LEARNING MOTIVATION 1429
parallel analysis when making exploratory factor extraction decisions, and Zwickand Velicer (1986) reported research indicating that this technique is the mostconsistent and accurate method for determining an underlying factor structure.Conceptually, parallel analysis is a statistical procedure that compares observedeigenvalues with eigenvalues derived from random data (Coovert & McNelis,1988). Data matrices (i.e., real and random) are factor analyzed and factors areextracted from the real data for any real eigenvalues that are larger than the asso-ciated eigenvalues from the random data.
Based on these suggestions, a parallel analysis was conducted to help in thedetermination of the most appropriate underlying factor structure. For the currentanalysis, a 20 × 285 random data matrix was computed. The real and randomdata were factor analyzed, and their associated eigenvalues were compared. Asexpected, the four-factor model was the most valid and accounted for 64% of thecommon variance. By and large, three of the four factors corresponded with ourpreconceived four stages of learning motivation. Five of the six observed factorcorrelations between the four stages were significant (p < .01). Only the correla-tion between the preparation and action scales was nonsignificant. Although ourresults suggested that the SOLMI basically captured the underlying four stages oflearning motivation, item cross-loadings suggested that more instrument refine-ment was needed.
Based on Nunnally’s (1978) suggestions, SOLMI items that exhibited cross-factor loadings or low correlations with their scale scores were either deleted orrevised. In addition, four new items were written to better assess preparationsentiments. The revised SOLMI consisted of 24 items developed to reflect thefollowing learning stages: precontemplation (6 items), contemplation (5 items),preparation (8 items), and action (5 items).
Confirmatory Factor Analysis of Revised SOLMI
Participants and procedure. Sample 2 consisted of 173 students enrolled in alarge introductory Management Information Systems (MIS) course. Like thePrinciples of Management course in Sample 1, this introductory MIS course useda large auditorium-based lecture format to cover the foundation content areas of amanagement discipline. Following the timing employed with Sample 1, therevised SOLMI was administered during Week 3 of the academic quarter. Nodemographic information was available for Sample 2 participants.
Analyses. Confirmatory factor analyses (CFAs) were used to assess the struc-ture of the revised SOLMI items. Three models were tested and compared toeach other with regard to their goodness of fit. First, a null single-factor modelwas examined. Second, a three-factor model was tested where preparation itemswere forced to load with action items. The preparation construct is characterizedby recognizing the benefits of change (i.e., contemplation), as well as exhibiting
1430 COLE ET AL.
small behavioral changes (i.e., action), but the individual has not yet reached fullaction sentiments (Prochaska et al., 1992). Because the new preparation itemsadded to the SOLMI reflected small behavioral changes, the three-factor modelforced the items to load on the action factor. Finally, the four-factor model match-ing the design of the SOLMI was tested.
As advocated by Medsker, Williams, and Holahan (1994), multiple goodness-of-fit measures are reported because of the debate over confirmatory fit indexes(e.g., Mulaik et al., 1989). Although the chi-square-to-degree-of-freedom ratiostatistic must be interpreted cautiously because of its sensitivity to sample size,Carmines and McIver (1981) noted that exceeding a threshold of 2 indicates anunacceptable model fit. The root mean square estimate of approximation(RMSEA) is a population-based index (averaged standardized residual perdegree of freedom) relatively insensitive to sample size. RMSEAs of less than.05 indicate a close fit, values of less than .08 suggest a relatively good fit of themodel, while values less than .10 are considered fair (Browne & Cudeck, 1993).Browne and Cudeck’s Expected Cross-Validation Index (ECVI) standard isgeared toward identifying a model that fits well, is simple, and stands a betterchance of fitting in a new sample than models that are not simple. Although thereare no apparent statistical guidelines for the ECVI, smaller values indicate that amodel is expected to cross-validate on a new sample (Loehlin, 1998). Finally,common practice suggests that the Comparative Fit Index (CFI) should exceed.90 in order for a model to not be rejected.
CFA results. In reviewing the results of the CFA, modification index values(Long, 1983) indicated that the models could be improved by dropping threeitems. Further examination of the items showed that all involved an aspect of per-formance (i.e., “I would rather live with my Management Information Systemperformance than try to improve upon it”). Because these three items exhibitedwording that was inconsistent with the 21 remaining items, they were deletedfrom all CFA analyses. As a result, we used CFAs to examine the fit of threemodels using only the remaining 21 items.
Consistent with our expectations, the CFAs indicated that our four-factormodel fit the data better than the competing three-factor and null models. Inassessing model fit, we computed a ratio of the final four-factor model’s chisquare to degrees of freedom (336.03/187 = 1.80) that was below the 2 thresholdsuggested by Carmines and McIver (1981) and better than the three-factor(521.10/186 = 2.80) and the null model (2288.76/210 = 10.90). Furthermore, thefour-factor model’s fit indexes indicated that the model fit the data better thaneither competing model, as evidenced by the smaller RMSEA (.07 versus .10 and.24 for the three- and one-factor models, respectively), smaller ECVI values(2.50 versus 3.62 and 13.79 for the three- and one-factor models, respectively),and a CFI of .93 (compared to .84 for the three-factor solution and .00 for thenull model). In sum, the results indicated that although the three-factor model
STAGES OF LEARNING MOTIVATION 1431
exhibited a better fit than the null model (p < .01), the four-factor model dis-played a superior fit (p < .01) over the three-factor and null models.
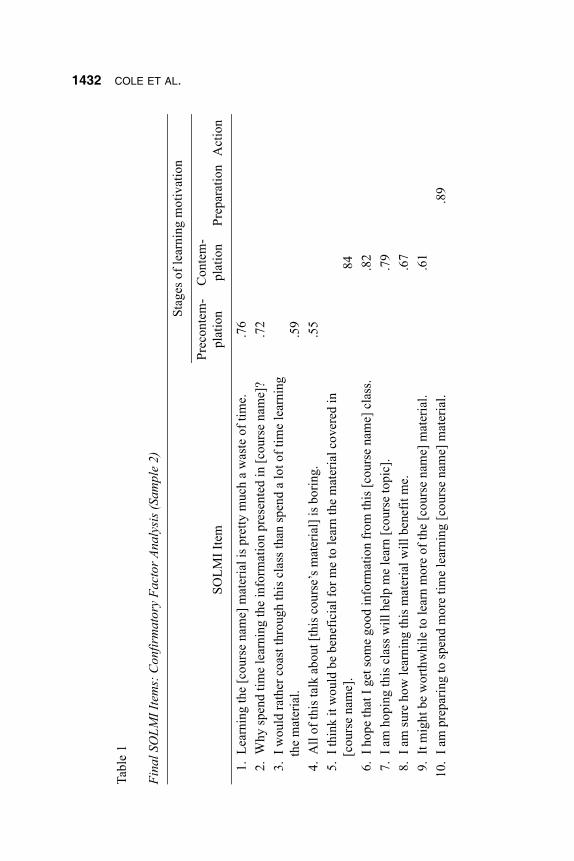
Table 1 reports the final set of 21 items and their structure coefficients, all ofwhich were greater than .54 (p < .001). Coefficient alphas for the resultingSOLMI scales in Sample 2 were as follows: precontemplation (α = .77), contem-plation (α = .77), preparation (α = .92), and action (α = .88). As the stage theoryimposes, the factors were allowed to correlate in the CFA. Observed correlationsranged from -.76 to .69 (p < .01).
Primary Study
Overview of Data Collection
A third and primary sample (Sample 3) was used to test our hypothesesregarding the reliability and validity of the final SOLMI instrument. Data col-lection in Sample 3 occurred the following semester after data collection inSample 1, and consisted of 476 undergraduates enrolled in an introductoryPrinciples of Management course. Following the approach used in Sample 1,these 476 participants completed the SOLMI in their discussion/lab section atWeek 3 of a 10-week academic term. This initial administration was labeled Time1. Participants also completed the SOLMI a second time (Time 2) at 1-week (n =73), 3-week (n = 70), or 7-week (n = 165) intervals.
In addition to the two SOLMI administrations, 348 students in the samplealso agreed to complete a second questionnaire consisting of all other self-reportmeasures (e.g., control variables, dispositional criteria). This questionnaire wasadministered 7 weeks after the initial administration of the SOLMI. Furthermore,non-self-report performance criteria, including course performance measures(e.g., exam grades) and lab instructor assessments of student help-seekingbehavior, were available for all participants. However, data were deleted from100 participants because one of the lab instructors assisting with data collectiondeviated from standardized data-collection procedures. In addition, 14 studentsultimately dropped the course. Therefore, the usable sample size was reduced to362 (76%). Of these participants, 214 (59%) male, 329 (91%) White, and roughly351 (97%) junior standing. Average age of the sample was 21.3 years (SD = 1.5).
Only participants with complete matching data records (2 SOLMI administra-tions, dispositional questionnaire, and non-self-report performance measures)were included in the analyses. This resulted in a complete data set of 207 partici-pants. Of these 207 participants, 61 (70%) had Time 2 SOLMI collections at the1-week interval, 53 (76%) at 3 weeks, and 93 (56%) at 7 weeks. Results of a one-way MANOVA indicate that there were no significant differences between thedeleted and retained participant groups for all control and criterion variables. Allremaining analyses were computed using the 207 participants.
1432 COLE ET AL.
Tabl
e 1
Fina
l SO
LMI I
tem
s: C
onfir
mat
ory
Fact
or A
naly
sis (
Sam
ple
2)
SOLM
I Ite
m
Stag
es o
f lea
rnin
g m
otiv
atio
n
Prec
onte
m-
plat
ion
Con
tem
-pl
atio
nPr
epar
atio
nA
ctio
n
1.Le
arni
ng th
e [c
ours
e na
me]
mat
eria
l is p
retty
muc
h a
was
te o
f tim
e..7
62.
Why
spen
d tim
e le
arni
ng th
e in
form
atio
n pr
esen
ted
in [c
ours
e na
me]
?.7
23.
I wou
ld ra
ther
coa
st th
roug
h th
is c
lass
than
spen
d a
lot o
f tim
e le
arni
ng
the
mat
eria
l..5
94.
All
of th
is ta
lk a
bout
[thi
s cou
rse’
s mat
eria
l] is
bor
ing.
.55
5.I t
hink
it w
ould
be
bene
ficia
l for
me
to le
arn
the
mat
eria
l cov
ered
in
[cou
rse
nam
e].
846.
I hop
e th
at I
get s
ome
good
info
rmat
ion
from
this
[cou
rse
nam
e] c
lass
..8
27.
I am
hop
ing
this
cla
ss w
ill h
elp
me
lear
n [c
ours
e to
pic]
..7
98.
I am
sure
how
lear
ning
this
mat
eria
l will
ben
efit
me.
.67
9.It
mig
ht b
e w
orth
whi
le to
lear
n m
ore
of th
e [c
ours
e na
me]
mat
eria
l..6
110
.I a
m p
repa
ring
to sp
end
mor
e tim
e le
arni
ng [c
ours
e na
me]
mat
eria
l..8
9

STAGES OF LEARNING MOTIVATION 1433
11.
I int
end
to d
o so
met
hing
that
will
hel
p m
e le
arn
mor
e of t
he [c
ours
e nam
e]
mat
eria
l..8
612
.It
is ti
me
to st
art s
pend
ing
mor
e tim
e le
arni
ng [c
ours
e na
me]
mat
eria
l..8
413
.I a
m p
lann
ing
chan
ges t
hat w
ill h
elp
me
lear
n m
ore
of th
e m
ater
ial
cove
red
in [c
ours
e na
me]
..7
914
.I e
xpec
t to
star
t spe
ndin
g m
ore
time
lear
ning
the
mat
eria
l cov
ered
in
[cou
rse
nam
e].
.74
15.
I hav
e st
arte
d w
orki
ng to
impr
ove
my
lear
ning
in [c
ours
e na
me]
, but
I w
ould
like
hel
p..7
116
.I a
m fi
nally
doi
ng so
me
wor
k to
incr
ease
my
lear
ning
of t
he [c
ours
e na
me]
mat
eria
l..6
017
.I a
m a
ctiv
ely
wor
king
to le
arn
the
mat
eria
l cov
ered
in [c
ours
e na
me]
..8
218
.I a
m re
ally
wor
king
har
d to
impr
ove
my
know
ledg
e of
[cou
rse
nam
e]
info
rmat
ion.
.81
19.
I am
act
ually
doi
ng so
met
hing
to h
elp
me
lear
n th
e m
ater
ial c
over
ed in
[c
ours
e na
me]
..7
920
.I h
ave
been
wor
king
har
d to
lear
n th
e in
form
atio
n co
vere
d in
[cou
rse
nam
e].
.68
21.
I am
pro
babl
y w
orki
ng h
arde
r tha
n m
ost o
n le
arni
ng th
e [c
ours
e na
me]
m
ater
ial.
.67
Not
e. S
OLM
I = st
ages
of l
earn
ing
mot
ivat
ion
inve
ntor
y. N
= 1
73.
1434 COLE ET AL.
Measures
Predictors. The final 21-item version of the SOLMI, which includes scalesfor each of the four stages of learning motivation, was the primary predictor.Responses were made on a 6-point Likert scale ranging from 1 (strongly dis-agree) to 6 (strongly agree). Coefficient alphas for the four stage scales at Time 1were as follows: precontemplation, α = .81; contemplation, α = .89; preparation,α = .85; and action, α = .78.
To explore the ability of the SOLMI to predict variance not accounted for bytraditional measures of learning motivation, a version (four adapted items) ofNoe and Schmitt’s (1986) motivation to learn measure was used (α = .77). Asample item is “I am learning as much as I can of this material.” Items werescored on a 6-point scale ranging from 1 (strongly disagree) to 6 (stronglyagree).
Because general cognitive ability is an important determinant of training suc-cess (Ackerman, 1992; Hunter & Hunter, 1984; Reilly & Warech, 1994), it isimportant for any study attempting to determine if individual characteristicsexplain incremental variance in learning to include general cognitive ability(Colquitt et al., 2000). Students’ grade point average (GPA) is often used as aproxy for general cognitive ability (e.g., Caldwell & Burger, 1998). Cable andJudge (1997) found that students reported nearly identical GPAs as found in theirfiles in the career office (M difference = 0.01, r = .95, p < .01). Consequently,GPA information was self-reported by participating students and ranged from 2.1to 4.0, with 35% of the students reporting a “B” average (3.0) or better.
Criteria measures. We hypothesized that students’ learning motivation wouldrelate to class performance, behavior, and attitude criteria. We assessed students’learning of the course material through their performance on eight exams admin-istered during the academic term. A typical exam consisted of 30 to 35 multiple-choice questions germane to the material covered in 4 days of lecture. Examaverages ranged from 61.1% to 94.4% (M = 82.21, SD = 6.29).
At the conclusion of the class, each graduate teaching assistant (GTA) wasgiven a list of their lab students who were participating in the research. The GTAsgave a help-seeking rating of how often each student sought their help in person(e.g., during office hours, after a lab) in learning the class material. The ratingwas made on a 5-point Likert scale ranging from 0 (never) to 5 (five or moretimes; M = 1.15, SD = 2.22).
We assessed class attendance with a single self-report item: “How often didyou attend Principles of Management lectures?” (1 = never to 5 = always; M =4.10, SD = 1.13). We acknowledge that use of an objective measure of attendancewould eliminate common method variance concerns. However, the size (two sec-tions each, with close to 400 students) and policy (attendance was not required ortaken) made this impractical.

STAGES OF LEARNING MOTIVATION 1435
Three items were modified from the job satisfaction scale of Cammann,Fichman, Jenkins, and Klesh’s (1983) Michigan Organizational Assessment Ques-tionnaire (MOAQ) to assess class satisfaction. A sample item is “All in all, I amsatisfied with this class.” Responses were made on a 6-point scale ranging from1 (strongly disagree) to 6 (strongly agree). Coefficient alpha for the scale was .87.
Demographic control variables. Because of concerns that the nonrandomassignment of students to class sections, lab instructor, and lab time might contam-inate the learning motivation and performance measures, each was included as acontrol variable in all analyses. In addition, demographics including student classi-fication (e.g., junior, senior), age, race, and gender were controlled in all analyses.
Attitudinal control variables. Since two of the criteria (class attendance andsatisfaction) were self-reported, inflation in the relationships as a result of same-source bias among variables cannot be ruled out. We took several steps to addressthis problem. In addition to incorporating a 7-week time lag between collectionof the initial SOLMI data and the criterion measures, positive affectivity (PA)and negative affectivity (NA; Watson, Clark, & Tellegen, 1988) scales wereincluded to help control for any dispositionally based response tendencies(Spector & Brannick, 1995). For each of 20 emotions, students indicated theextent to which they had felt (over the past 2 weeks) a certain way using a 5-pointscale ranging from 1 (very slightly or not at all) to 5 (extremely). Alphas for eachof the 10-item PA (e.g., interested, excited) and NA (e.g., distressed, upset) scaleswere .87 and .81, respectively. Finally, seven items from the self-deception sub-scale (α = .71) of the Balanced Inventory of Desirable Responding (BIDR;Paulhus, 1991) were employed as a final control. A sample item is “I alwaysknow why I like things.” Responses were made on a 6-point scale ranging from1 (strongly disagree) to 6 (strongly agree).
Results
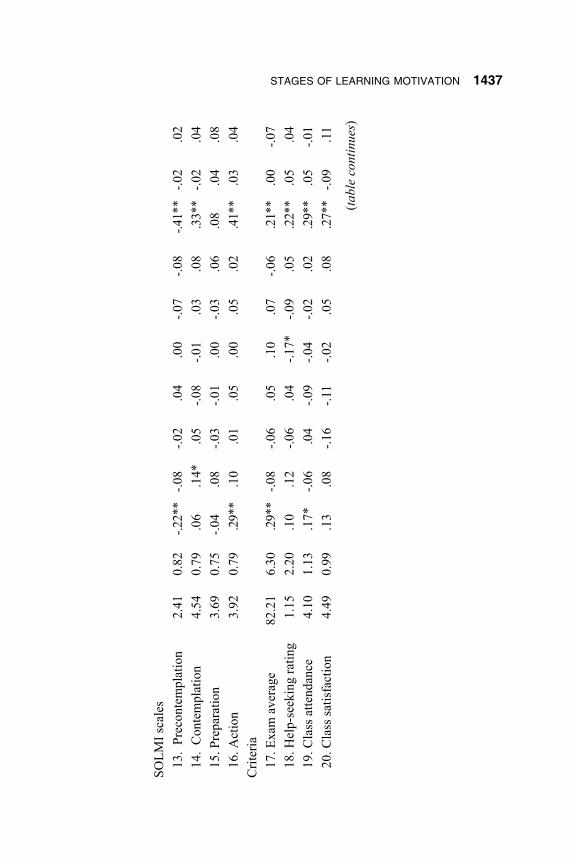
Descriptive statistics and intercorrelations among the variables collected inthe primary sample (Sample 3) and used in the hypothesis tests are reported inTable 2. As one might expect, the traditional measure of learning motivation wasrelated negatively with precontemplation and positively with the remaining threeSOLMI scales scores and each of the criteria. No SOLMI scales were related toour surrogate of general cognitive ability, GPA. Students’ precontemplationscores were related negatively with the four criteria, and preparation was relatednegatively to students’ exam average. Finally, 9 of the remaining 11 correlationsbetween the SOLMI scale scores and criteria exhibited positive relationships.
Classifying Respondents Into Stages
Hypotheses for the study were designed to examine the construct validity ofthe stage-based learning motivation inventory (SOLMI). Stage theory suggests

1436 COLE ET AL.
Tabl
e 2
Des
crip
tive
Stat
istic
s and
Cor
rela
tions
Varia
ble
MSD
12
34
56
78
910
Con
trols
1.G
ende
r (1
= m
ale)
1.43
0.50
—2.
Age
21.2
31.
40-.2
4**—
3.R
ace
2.04
0.50
.08
-.09
—4.
Stud
ent c
lass
ifica
tion
3.35
0.57
.12
.52*
*-.1
2—
5.La
b in
stru
ctor
3.34
1.40
.01
-.15*
.03
-.18*
—6.
Cla
ss se
ctio
ns1.
440.
50.0
0-.2
2**
-.02
-.14*
-.12
—7.
Lab
time
2.01
0.83
.05
.05
-.02
-.02
-.06
.03
—D
ispo
sitio
nal v
aria
bles
8.Po
sitiv
e af
fect
ivity
3.39
0.74
.06
.07
-.02
.07
-.09
.00
-.01
(.87)
9.N
egat
ive
affe
ctiv
ity2.
110.
70.0
5.1
5*.0
5.2
4**
-.06
-.10
.02
.02
(.81)
10.
Self-
dece
ptio
n3.
440.
71-.1
3.0
2-.0
2-.1
1-.0
2.0
3-.0
7.1
6*-.3
0**
(.71)
Lear
ning
var
iabl
es11
.M
otiv
atio
n to
lear
n4.
190.
90.3
0**
.08
-.02
-.03
-.03
.05
.09
.42*
*-.0
6.1
012
.G
PAa
6.17
1.00
.20*
*-.2
2**
.04
-.03
.10
-.11
-.10
.05
.02
-.06
STAGES OF LEARNING MOTIVATION 1437
SOLM
I sca
les
13.
Prec
onte
mpl
atio
n2.
410.
82-.2
2**
-.08
-.02
.04
.00
-.07
-.08
-.41*
*-.0
2.0
214
.C
onte
mpl
atio
n4.
540.
79.0
6.1
4*.0
5-.0
8-.0
1.0
3.0
8.3
3**
-.02
.04
15. P
repa
ratio
n3.
690.
75-.0
4.0
8-.0
3-.0
1.0
0-.0
3.0
6.0
8.0
4.0
816
. Act
ion
3.92
0.79
.29*
*.1
0.0
1.0
5.0
0.0
5.0
2.4
1**
.03
.04
Crit
eria
17. E
xam
ave
rage
82.2
16.
30.2
9**
-.08
-.06
.05
.10
.07
-.06
.21*
*.0
0-.0
718
. Hel
p-se
ekin
g ra
ting
1.15
2.20
.10
.12
-.06
.04
-.17*
-.09
.05
.22*
*.0
5.0
419
. Cla
ss a
ttend
ance
4.10
1.13
.17*
-.06
.04
-.09
-.04
-.02
.02
.29*
*.0
5-.0
120
. Cla
ss sa
tisfa
ctio
n4.
490.
99.1
3.0
8-.1
6-.1
1-.0
2.0
5.0
8.2
7**
-.09
.11
(tabl
e co
ntin
ues)

1438 COLE ET AL.
Tabl
e 2
(Con
tinue
d)Va
riabl
e11
1213
1415
1617
1819
20
Con
trols
1.G
ende
r2.
Age
3.R
ace
4.St
uden
t cla
ssifi
catio
n5.
Lab
inst
ruct
or6.
Cla
ss se
ctio
ns7.
Lab
time
Dis
posi
tiona
l var
iabl
es8.
Posi
tive
affe
ctiv
ity9.
Neg
ativ
e af
fect
ivity
10.
Self-
dece
ptio
nLe
arni
ng v
aria
bles
11.
Mot
ivat
ion
to le
arn
(.77)
12.
GPA
a-.0
1—

STAGES OF LEARNING MOTIVATION 1439
SOLM
I sca
les
13.
Prec
onte
mpl
atio
n-.6
0**
-.03
(.81)
14.
Con
tem
plat
ion
.58*
*-.1
2-.6
8**
(.89)
15.
Prep
arat
ion
.28*
*-.1
3-.2
6**
.39*
*(.8
5)16
.A
ctio
n.8
0**
.03
-.53*
*.4
7**
.22*
*(.7
8)C
riter
ia17
.Ex
am a
vera
ge.2
5**
.52*
*-.2
0**
.04
-.27*
*.3
1**
—18
.H
elp-
seek
ing
ratin
g.3
0**
-.06
-.24*
*.2
7**
.30*
*.2
8**
-.04
—19
.C
lass
atte
ndan
ce.3
6**
.00
-.40*
*.3
7**
.22*
*.3
5**
.15*
.16*
—20
.C
lass
satis
fact
ion
.47*
*-.0
6-.4
6**
.44*
*.0
3.3
7**
.25*
*.0
9.2
7**
(.87)
Not
e. S
OLM
I = s
tage
s of
lear
ning
mot
ivat
ion
inve
ntor
y. N
= 2
04 to
207
. Coe
ffici
ent a
lpha
s ar
e sh
own
on th
e di
agon
al fo
r all
mul
ti-ite
msc
ales
.a G
PA =
gra
de p
oint
ave
rage
, ass
esse
d us
ing
an 8
-poi
nt L
iker
t sca
le.
*p <
.05.
**p
< .0
1.
1440 COLE ET AL.
that people primarily occupy one stage at a time or are in the process of movingfrom one stage to another (Prochaska et al., 1992). Therefore, prior to testingHypotheses 1 and 2, it was necessary to classify respondents according to theprimary stage that they occupied at each SOLMI administration. Followingpreviously validated staging classification algorithms for use with the stages-of-change model (DiClemente et al., 1991; Levesque et al., 1999, 2001), respon-dents were classified into stages. Specifically, students were classified into thestage for which they scored highest. If students’ highest scale score was forprecontemplation, they were coded as being in the precontemplation stage. Ifstudents’ highest scale score was for contemplation, they were coded as occupy-ing the contemplation stage, and so on, until all students were coded into one ofthe four stages. In only 32 out of 414 classifications (207 students × 2 SOLMIadministrations), were a student’s scale scores equally high for more than onestage. Following Prochaska et al., we interpreted these ties as demonstratingmovement from one stage to another, and coded the student as being in the moreadvanced learning motivation stage.
The stage theory of learning motivation argues that persons progress (orregress) through stages over time. For most people, the change process is spiral,not linear (Prochaska & DiClemente, 1983a; Prochaska et al., 1992). Thus, someindividuals often relapse to earlier stages before they achieve lasting behavioralchange. To examine students’ movement among the learning motivation stages,we performed two sets of analyses.
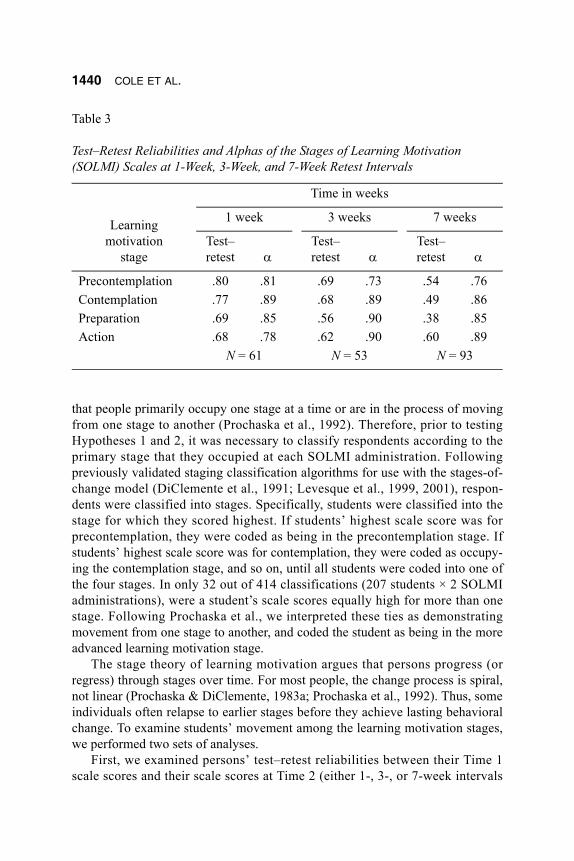
First, we examined persons’ test–retest reliabilities between their Time 1scale scores and their scale scores at Time 2 (either 1-, 3-, or 7-week intervals
Table 3
Test–Retest Reliabilities and Alphas of the Stages of Learning Motivation (SOLMI) Scales at 1-Week, 3-Week, and 7-Week Retest Intervals
Learning motivation
stage
Time in weeks
1 week 3 weeks 7 weeks
Test–retest α
Test–retest α
Test–retest α
Precontemplation .80 .81 .69 .73 .54 .76Contemplation .77 .89 .68 .89 .49 .86Preparation .69 .85 .56 .90 .38 .85Action .68 .78 .62 .90 .60 .89
N = 61 N = 53 N = 93
STAGES OF LEARNING MOTIVATION 1441
after Time 1). Consistent with the stage theory, the four scales for each time inter-val exhibited increasingly smaller test–retest reliabilities as the interval betweenTime 1 and Time 2 was increased. As reported in Table 3, the test–retest reliabil-ities for precontemplation decreased from .80 at the 1-week interval, to .69 at 3weeks, and .54 at 7 weeks. The progression for contemplation was .77 to .68 to.49. For preparation it was .69 to .56 to .38. Finally, the test–retest reliabilities forthe 1-week, 3-week, and 7-week intervals for action progressed from .68 to .62 to.60, respectively.
To confirm that these results were not a result of internal inconsistencies ofthe scales, coefficient alphas were computed for the scales at Time 1 and each ofthe three Time 2 intervals. The alphas at the Time 2 intervals were consistentwith those at Time 1. This, coupled with the progressively decreasing test–retestreliabilities, suggests that there was scale movement over time.
To investigate the nature of stage movement in the primary sample, students’occupied stage at Time 1 was compared to their stage at their Time 2 retestadministration. Persons were coded as regressing (-1 = moving backward to anearlier stage), no change (0 = residing in the same stage), or progressing (1 =moving forward to a latter stage) at each of the three test–retest administrations.At the 1-week interval, 69% remained in the same stage that they occupied aweek earlier, 16% regressed, and 15% progressed. At the 3-week interval, 62%remained in the same stage, 17% regressed, and 21% progressed. Finally, forthose respondents who completed the Time 2 SOLMI at the 7-week interval,63% exhibited no change, 20% regressed, and 16% progressed. Consistentwith the stage model, the pattern of results suggest the SOLMI can be used toestablish the learning stage occupied by an individual and track movementbetween stages.
Hypothesis Testing
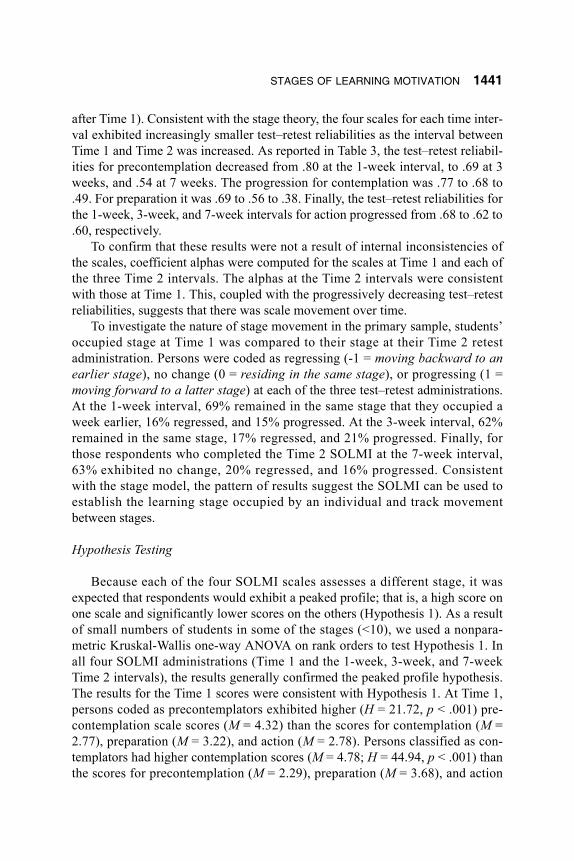
Because each of the four SOLMI scales assesses a different stage, it wasexpected that respondents would exhibit a peaked profile; that is, a high score onone scale and significantly lower scores on the others (Hypothesis 1). As a resultof small numbers of students in some of the stages (<10), we used a nonpara-metric Kruskal-Wallis one-way ANOVA on rank orders to test Hypothesis 1. Inall four SOLMI administrations (Time 1 and the 1-week, 3-week, and 7-weekTime 2 intervals), the results generally confirmed the peaked profile hypothesis.The results for the Time 1 scores were consistent with Hypothesis 1. At Time 1,persons coded as precontemplators exhibited higher (H = 21.72, p < .001) pre-contemplation scale scores (M = 4.32) than the scores for contemplation (M =2.77), preparation (M = 3.22), and action (M = 2.78). Persons classified as con-templators had higher contemplation scores (M = 4.78; H = 44.94, p < .001) thanthe scores for precontemplation (M = 2.29), preparation (M = 3.68), and action
1442 COLE ET AL.
(M = 3.84). A similar pattern was found for those in the preparation stage(H = 31.10, p < .001) and those in the action stage (H = 50.36, p < .001). In all,this pattern of results supporting Hypothesis 1 held for 13 of the 16 profiles (4stages × 4 SOLMI administrations).
The three nonsupporting profiles from the Time 2 intervals were as follows.Although respondents for the 1-week interval SOLMI administration exhibited apeaked profile for contemplation and action, those in the precontemplation orpreparation stages did not have respective scale means significantly higher thanthe other scale means. At the 7-week interval administration, students catego-rized in the preparation stage did not score significantly higher on preparationthan they did on the other stage scales.
Hypothesis 2 predicted that persons classified in the action stage at the initialSOLMI assessment would perform better and have more proactive behaviors andpositive class attitudes than students classified in the other three stages. BecauseLilliefors and Shapiro-Wilks’s (for sample sizes under 50) test for normalityindicated help-seeking rating, class attendance, and class satisfaction were notnormally distributed, one-way Kruskal-Wallis ANOVAs for rank orders wereperformed.
As predicted, students in the action stage at Time 1 performed better on classexams (H = 22.27, p < .001). Action stage students at the initial SOLMI admini-stration performed better across course exams (M = 86.23) than did those in theprecontemplation (M = 77.06), contemplation (M = 81.66), and preparation (M =80.55) stages. Also consistent with Hypothesis 2, students initially classified inthe action stage were more satisfied with the course at the end of the term thanwere those occupying other learning motivation stages (H = 13.73, p < .01).Students initially classified in the action stage reported being more satisfied withthe class (M = 4.67) than did students in precontemplation (M = 2.86). Studentsin the contemplation and preparation stages were also more satisfied with theclass than were precontemplation students (Ms = 4.60 and 4.10, respectively), butno less satisfied than those in the action stage. Results for class attendance weremoderately significant (H = 6.43, p < .10). The results for help-seeking behaviorsas reported by GTAs were not significant.
Hypothesis 3 predicted that students’ occupied stages at the beginning andend of the academic term would interact and explain students’ classroom perfor-mance (reflected in exam average). Theoretically, the action stage is the solelearning motivation stage where students are vigorously attempting to increasetheir knowledge and learning of the class material. The three earlier stagesinvolve either being unaware of or resisting the idea of motivated learning(precontemplation), thinking about the benefits of increased learning efforts(contemplation), or at best preparing to spend additional time in learning thematerial (preparation). Moreover, the stage theory implies that the action stage isthe optimal stage of motivated learning. Therefore, students who were in the
STAGES OF LEARNING MOTIVATION 1443
action stage at both Time 1 and 2 were expected to perform the best, thoseprogressing into the action stage expected to perform next best, and studentsregressing in stage or remaining static in a stage below action were expected todo relatively worse.
To test this hypothesis, we examined the Time 1 and Time 2 SOLMIresponses for those 93 students who completed the Time 2 SOLMI at the maxi-mal 7-week interval. For the reasons stated earlier, students occupying theprecontemplation, contemplation, and preparation stages at Time 1 were codedinto a single, nonaction group. Students occupying the action stage were classi-fied into an action group. These same coding rules were applied to the 7-weekinterval SOLMI data. This classification scheme resulted in 74 nonaction and 19action persons at Time 1, and 72 nonaction and 21 action persons at 7 weeks. Ofthese 93 persons, about one quarter shifted into or out of Stage 4 during this 7-week period.
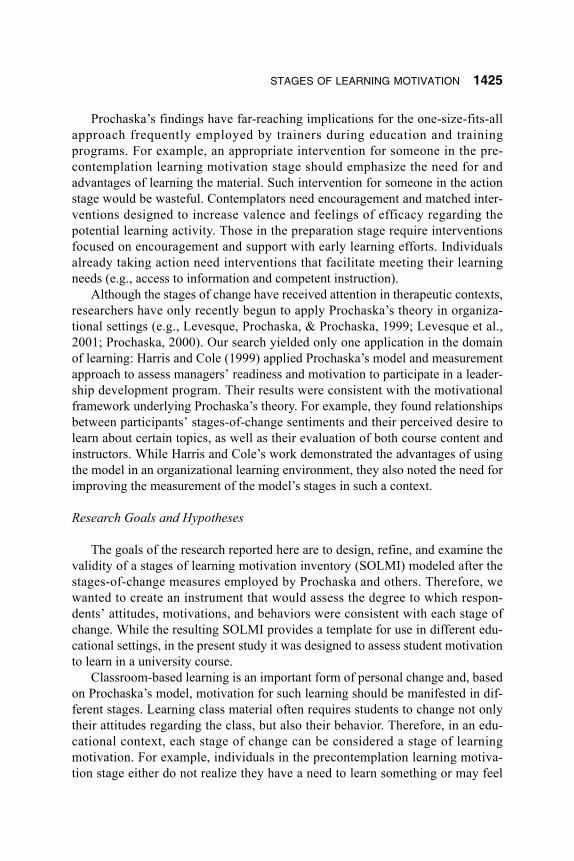
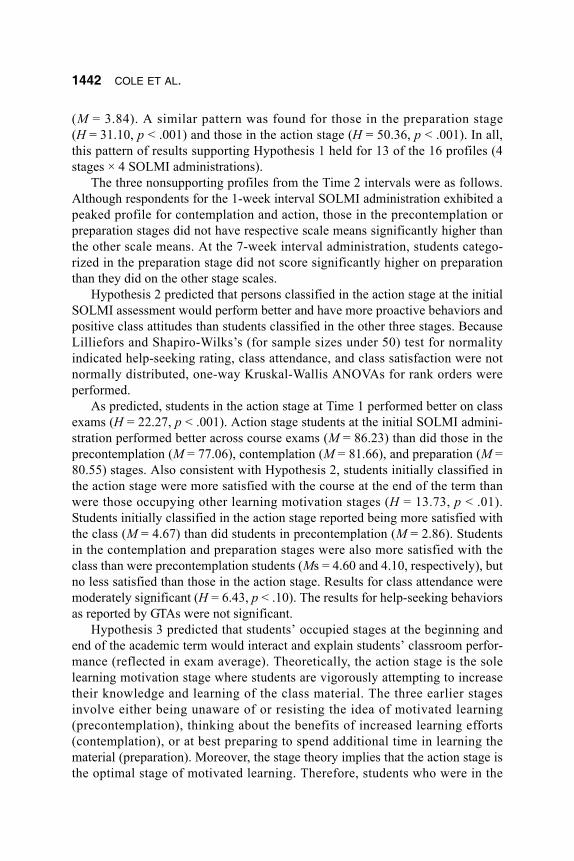
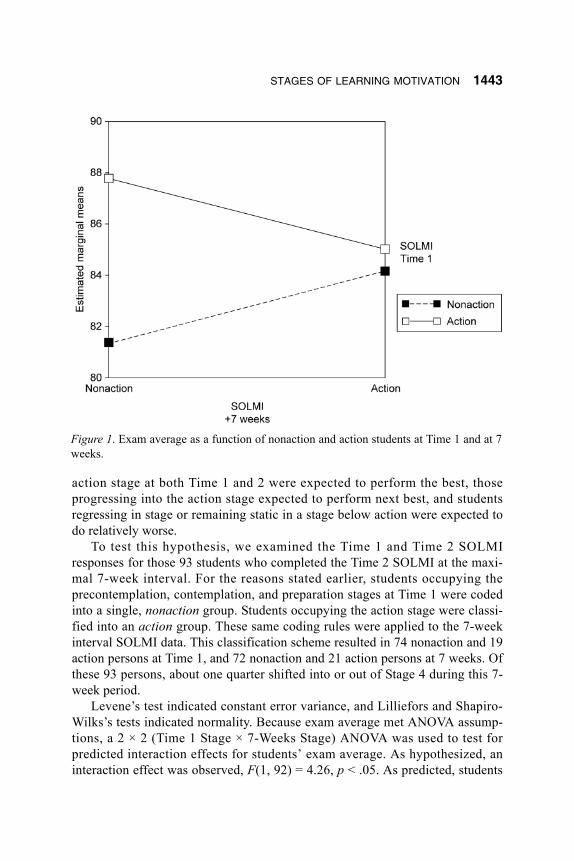
Levene’s test indicated constant error variance, and Lilliefors and Shapiro-Wilks’s tests indicated normality. Because exam average met ANOVA assump-tions, a 2 × 2 (Time 1 Stage × 7-Weeks Stage) ANOVA was used to test forpredicted interaction effects for students’ exam average. As hypothesized, aninteraction effect was observed, F(1, 92) = 4.26, p < .05. As predicted, students
Figure 1. Exam average as a function of nonaction and action students at Time 1 and at 7weeks.

1444 COLE ET AL.
who remained in a nonaction stage at both Time 1 and at 7 weeks had lower examaverages (M = 81.36) than did all other students who had occupied the actionstage during at least one SOLMI administration (Ms ranged from 84.16 to 87.79).However, as shown in Figure 1, the results concerning students who regressedout of the action stage were not as expected. Specifically, students who were inthe action stage at Time 1 but had regressed to a nonaction stage by 7 weeksexhibited higher exam averages (M = 87.79) than did students classified as beingin the action stage at Time 1 and at 7 weeks (M = 85.02).
Although the results for Hypotheses 1, 2, and 3 generally support our con-tention that the SOLMI adheres to the assumptions of a stage theory, they do nottest the overall predictive validity of the SOLMI. Therefore, Hypothesis 4 pre-dicted that the SOLMI would explain incremental variance in the importantlearning-related criteria beyond that accounted for by the controls and otherpredictors (i.e., motivation to learn and GPA). The correlations shown in Table 2demonstrate that all four SOLMI scales were correlated with motivation to learnbut were uncorrelated with GPA. In Tables 4 and 5, we present the results ofhierarchical regressions of the SOLMI (collected at Time 1) with and without thetraditional measures of motivation to learn and general cognitive ability used topredict the learning criteria. This aids in exploring the predictive adequacy of theSOLMI when used alone, and the incremental contribution over existing mea-sures.
As shown in Table 4, when entered at Step 2, the Time 1 SOLMI scalesaccounted for significant incremental explained variance (ranging from ∆R2 =.15, p < .001, to ∆R2 = .22, p < .001) across all four learning criteria (examaverage, help seeking, class attendance, and class satisfaction) beyond thataccounted for by the seven demographic controls. The SOLMI standardizedbetas after controlling only for demographics reveal an interesting pattern. Spe-cifically, the action scale was the only one that was significant (all positive)across all four criteria. Precontemplation had a negative relationship with classattendance and satisfaction. The standardized betas for contemplation onlyreached significance for help seeking. Finally, the standardized betas for prepara-tion were somewhat surprising. Time 1 preparation was positively related to helpseeking, but negatively related to exam average and class satisfaction.
As shown in Table 5, when entered at Step 4, the Time 1 SOLMI scalesaccounted for incremental explained variance (ranging from ∆R2 = .05, p < .05,to ∆R2 = .08, p < .001) for each of the four learning-related criteria beyond thataccounted for by the seven demographic controls (Step 1), three attitudinal con-trols (Step 2), and two learning variables of motivation to learn and GPA (Step 3).This pattern of results is consistent with our argument that the stage approach toassessing motivation to learn represented by the SOLMI adds insight into classbehaviors and performance beyond the traditional measures of motivation tolearn.

STAGES OF LEARNING MOTIVATION 1445
Tabl
e 4
Hie
rarc
hica
l Reg
ress
ion
of L
earn
ing
Cri
teri
a on
the
SOLM
I Sca
les W
ithou
t Lea
rnin
g Va
riab
les
Exam
ave
rage
Hel
p-se
ekin
g ra
ting
Cla
ss a
ttend
ance
Cla
ss sa
tisfa
ctio
n
∆R2
β∆
R2β
∆R2
β∆
R2β
Step
1: D
emog
raph
ic c
ontro
lsa
.12*
**.0
6.0
5.1
3***
Step
2: S
OLM
IPr
econ
tem
plat
ion
-.15
.01
-.23*
-.24*
*C
onte
mpl
atio
n-.0
5.0
9.1
2.2
5**
Prep
arat
ion
-.33*
**.2
2**
.10
-.17*
Act
ion
.28*
*.2
3**
.16*
.14*
∆R2
afte
r Ste
p 2
.16*
**.1
5***
.19*
**.2
2***
Ove
rall
F6.
77**
*4.
77**
*5.
46**
*9.
13**
*O
vera
ll R2
.28
.22
.24
.34
Ove
rall
adju
sted
R2
.24
.17
.20
.31
Not
e. O
nly
final
mod
el re
sults
are
repo
rted.
N =
203
; 4 c
ases
did
not
repo
rt de
mog
raph
ic in
form
atio
n.a I
nclu
des g
ende
r, ag
e, ra
ce, s
tude
nt c
lass
ifica
tion,
lab
inst
ruct
or, c
lass
sect
ion,
and
lab
time.
*p <
.05.
**p
< .0
1. *
**p
< .0
01. A
ll te
sts a
re tw
o-ta
iled.

1446 COLE ET AL.Ta
ble
5
Hie
rarc
hica
l Reg
ress
ion
of L
earn
ing
Cri
teri
a on
the
SOLM
I Sca
les W
ith L
earn
ing
Vari
able
s
Exam
ave
rage
Hel
p-se
ekin
g ra
ting
Cla
ss a
ttend
ance
Cla
ss sa
tisfa
ctio
n
∆R2
β∆
R2β
∆R2
β∆
R2β
Step
1: D
emog
raph
ic c
ontro
lsa
.12*
**.0
6.0
4.1
3***
Step
2: A
ttitu
dina
l con
trols
b.0
5*.0
6**
.08*
**.0
7**
Step
3: L
earn
ing
varia
bles
Mot
ivat
ion
to le
arn
.07
.11
.01
.24*
GPA
.47*
**-.0
8-.0
5-.0
6∆
R2 af
ter S
tep
3.2
4***
.07*
**.0
6***
.10*
**St
ep 4
: SO
LMI
Prec
onte
mpl
atio
n-.0
4.0
5-.2
0*-.2
2*C
onte
mpl
atio
n.0
3.0
5.1
0.1
9*Pr
epar
atio
n-.2
9***
.22*
*.1
1-.1
8**
Act
ion
.20*
.13
.12
-.02
∆R2
afte
r Ste
p 4
.08*
**.0
5*.0
7**
.08*
**
Ove
rall
F10
.96*
**3.
64**
*3.
93**
*6.
89**
*O
vera
ll R2
.49
.24
.25
.37
Ove
rall
adju
sted
R2
.44
.17
.19
.32
Not
e. O
nly
final
mod
el re
sults
are
repo
rted.
N =
203
; 4 c
ases
did
not
repo
rt de
mog
raph
ic in
form
atio
n.a I
nclu
des g
ende
r, ag
e, ra
ce, s
tude
nt c
lass
ifica
tion,
lab
inst
ruct
or, c
lass
sect
ion,
and
lab
time.
bIn
clud
es p
ositi
ve a
ffect
ivity
, neg
ativ
e af
fec-
tivity
, and
self-
dece
ptio
n.*p
< .0
5. *
*p <
.01.
***
p <
.001
. All
test
s are
two-
taile
d.

STAGES OF LEARNING MOTIVATION 1447
The pattern of standardized betas for the SOLMI for the two sets of equations(controlling and not controlling for the learning variables) was consistent withour predictions. Specifically, whereas it was significant for all four criteria whennot controlling for motivation to learn and GPA, action was significant for onlyone when controlling for these learning variables. In contrast, the pattern of sig-nificance was the same for the other three stages across the two sets of equations.These results suggest that the action stage is most associated with more tradi-tional treatments of motivation to learn and suggests that perhaps the SOLMImajor contribution is the addition of an assessment of the stages of motivationprior to action.
Discussion
In this study, we responded to recent calls for more research on the focal con-struct of motivation to learn (e.g., Colquitt & Simmering, 1998). Specifically, weapplied a theoretical framework to develop a stage-based measure of learningmotivation (the SOLMI) and provided preliminary tests of its ability to advanceour understanding of the dynamics of motivation to learn. The primary purposeof our research was to develop a theory-based, construct-valid measure of indi-viduals’ stage-based learning motivations. Although typically conceptualized asa static, unidimensional construct, the results support our contention that thereare advantages to operationalize learning motivation as a multidimensional,stage-based concept. Moreover, the results provide supporting evidence of thereliability and construct validity of the SOLMI as an assessment of the stages oflearning motivation within a learning context and, as such, can serve as the basisfor future research, instrument refinement, and application.
Our results suggest that the SOLMI was reliable in both internal consistencyand ability to track change. In terms of internal reliability, the coefficient alphasfor the SOLMI scales were stable across samples and administrations. Our stage-based approach also predicts movement between stages over time (e.g.,Prochaska, 1979). Consistent with this expectation, SOLMI scale test–retestcoefficients tended to decrease over time. In addition, we found that 35% of Sam-ple 3 respondents either advanced or regressed to a different stage between theinitial SOLMI assessment and their respective retest.
Construct Validity of the SOLMI
Consistent with Hypothesis 1 and stage theory, students’ SOLMI scalescores exhibited a peaked profile (scores on one scale higher than scores onothers). And for 13 of the 16 possible scale score comparisons (4 scales × 4administrations), the differences between the peak scale scores and the scores onthe other three scales were significant. Of the three instances where the differ-ences among the stage scores were not significant, one involved precontemplation
1448 COLE ET AL.
at the 1-week administration, and two involved preparation from the 1-week and7-week administrations. In the first instance involving precontemplation, thesample size (n = 1) prohibited any type of inferences (even nonparametric) to bedrawn.
The results for the preparation scale may be the result of the more transition-ary nature of preparation sentiments. While preparation is treated as a distinctstage in Prochaska’s theory (Prochaska et al., 1992), there are no items to assesspreparation sentiments in Prochaska’s work. Instead, Prochaska argued thatpersons residing in the preparation stage are characterized by high scores oncontemplation and action. Thus, there is reason to expect persons occupying thepreparation stage to hold either high contemplation sentiments (if the person isjust moving into preparation) or high action sentiments (if the person is begin-ning to move into action). From this perspective, the absence of a peaked profilefor preparation is easily understood. Future modifications of the SOLMI’spreparation scale may help to differentiate more reliably individuals’ preparationsentiments from those of contemplation or action.
Hypothesis 2 proposed that students occupying the action stage would out-perform students residing in less motivated stages. The results indicate thatstudents initially occupying precontemplation did not attend class as often andreported being less satisfied with the class than did all students in all other stages.These findings have important implications for all involved in the developmentof education and training programs. In the current study, students occupying theaction stage (particularly early in the term) excelled in knowledge acquisition andalso reported higher attendance and satisfaction levels.
What are the implications for an organizational training program where themajority of the employees involved reside in precontemplation or contemplation?The current results suggest such stage profiles would lead to higher than normalabsenteeism and many trainees failing to learn essential, job-related skills. Thus,it is essential for trainers to conduct pre-training needs assessments and to matchinterventions to trainees’ stages to expedite movement to the action stage.
In regard to Hypothesis 3, the interaction between students’ initial SOLMIstage and their occupied stage, assessed 7 weeks later, was significant for examaverage. As the stage theory of learning motivation predicts, persons crystallizedwithin a nonaction stage of learning motivation had the lowest exam averages.Students progressing from nonaction to action received exam averages similar tostudents who reported being in action at both SOLMI administrations. Interest-ingly, students moving backward from action to the nonaction classificationreceived the highest exam averages.
Why would students regressing from the action stage do better on exams? Wethink that it may involve a realization by some students that they can be success-ful without putting forth the level of effort implied in the action stage. A studentin the action stage early in the term is likely to put more effort into learning and

STAGES OF LEARNING MOTIVATION 1449
studying. If that student meets with moderate success, he or she is likely to con-tinue to pursue that level of motivation (i.e., maintain the action stage). But whatabout students who find the material very easy and have great success early in theclass? Will they maintain the same level of motivation? We think not. Therefore,we believe that it is possible that students who regressed from the action stagemay have done so because the students realized they did not need to actively putin effort. Once this group recognized that they could turn their cognitive energiesto things more intrinsically interesting or more demanding (e.g., another class orproject), many would be expected to regress to a nonaction stage while maintain-ing a high exam average.
Our data provided us with a way to examine the possibility of this explana-tion. One would expect, for example, that students performing well with littleeffort would have higher mental abilities than others. Using GPA as a surrogateof mental ability, we examined whether or not the GPAs of those regressing outof the action stage were higher than the GPAs of those students remaining in theaction stage. At the 3-week stage, students who regressed reported significantlyhigher GPAs than did students progressing to a latter stage. At 1 and 7 weeks,regressing students’ GPAs were higher but did not reach statistical significance.
It would be interesting to examine how regressing students would perform inclass activities, such as team projects due at the end of the academic term. Doestheir regression to a nonaction stage hinder their participation and performance inthe group project, or does the challenge of the upcoming project motivate them tostay in the action stage or motivate them to progress back into it? It is impossiblefor us to test these questions with the present data and therefore suggest them asareas for future research.
Finally, as predicted in Hypothesis 4, the SOLMI explained incremental vari-ance in four learning criteria after controlling for demographic characteristics,affect and response distortion variables, and traditional measures of motivation tolearn and general cognitive ability. The SOLMI explained an average of 7%additional variance beyond that of these 12 control variables. The fact thatHypothesis 4 was supported despite the statistical significance of the control vari-ables and inclusion of traditional measures of motivation to learn and cognitiveability (GPA) illustrates the advantages of treating learning motivation from amultidimensional, stage-based perspective as assessed by the SOLMI.
SOLMI Stages
The pattern of results (correlations and standardized betas) shown in Tables 2and 4 provide useful insight into the four stages of learning motivation. All ofthem were related significantly to the traditional motivation to learn measure(the correlation was negative for precontemplation), but were not correlatedwith GPA. This suggests that the learning motivation stages are independent of
1450 COLE ET AL.
cognitive ability. Beyond these similarities, the results are often different acrossthe four stages.
Precontemplation was negatively related to generally accepted positive learn-ing behaviors, attitudes, and outcomes. From a needs-assessment perspective,precontemplation sentiments are expected to play a critical role. For example,precontemplative persons are important to identify because they are unlikely todisplay initiative, and, therefore, it is doubtful these persons will sign up forlearning opportunities within organizational settings. Moreover, the data pre-sented support this line of reasoning. When included in a regression equationwith the other stage scales, precontemplation emerges as an independent negativepredictor of class attendance and satisfaction (even after controlling for demo-graphics, attitudes, motivation to learn, and GPA).
Contemplation was correlated positively with all the criteria examined in ourstudy. However, when considered with all the stages, the regression resultsindicate that other stage scores were better predictors than was contemplation.Contemplation emerged as a predictor only for students’ class satisfaction, andnot for the more behavior-oriented help seeking and attendance or the outcome-oriented exam average. Consistent with the stages-of-change model, these resultssuggest that contemplation captures an attitudinal or cognitive dimension moreso than a behavioral or action dimension of learning motivation.
The results for the preparation stage are the most inconsistent with ourexpectations and the most difficult to explain. As noted earlier, preparation tradi-tionally has been treated as a transition stage and operationalized as scoring highon contemplation and action. We expected that preparation would be associatedpositively with our learning criteria. Unexpectedly, however, preparation wascorrelated negatively with exam average and unrelated to class satisfaction. Inter-estingly, preparation stands out when included with all other predictors in termsof predicting help seeking.
Implications for Practice
What might account for these results? More research is required, but wespeculate that when treated as a distinct stage rather than a transition point, prep-aration may be a kind of limbo where there are preliminary positive behaviors. Inthis sense, preparation might be viewed as a protracted, almost procrastinatingmove from contemplation to action where positive behaviors and attempts toactively learn are experimented with rather than energetically embraced. In con-trast to this explanation, it may be that people are in the preparation stage becausethey are unclear as to how to move to action. This is consistent with our findingthat preparation is a consistent and unique predictor of help seeking. Obviously,more research on the nature of the preparation stage is needed to help understandits role in learning motivation.
STAGES OF LEARNING MOTIVATION 1451
The results for the action stage are clear and straightforward. The actionlearning stage is associated with positive learning activities, attitudes, and out-comes. It is also clear that the action stage has the greatest overlap with tradi-tional learning motivation.
The SOLMI can be used as a brief, self-report diagnostic instrument fordevelopment purposes in a wide variety of contexts. Past research has indicatedthat the stages of change are systematically related with different motivations,concerns, and intervention requirements (DiClemente & Prochaska, 1982;Prochaska et al., 1992). It has also been shown empirically that the stages-of-change model provides a framework for categorizing stages-of-changemotivations, as well as the interventions appropriate to support positive progressat each stage (Prochaska et al., 1994). Thus, the transtheoretical model of stagesof change is facilitative not coercive; it assimilates the when, how, and why ofbehavioral change (Prochaska, 2000).
In a university setting, an educator who knows a priori where the majority ofstudents’ learning sentiments lie could successively tailor their teaching plan toengage students and enhance their motivation to learn. For example, it is ourexperience that many undergraduates enrolled in statistics courses generally areanxious, do not want to be in the class, or do not see the instrumentality of theclass (i.e., precontemplation orientation). Yet, some educators proceed in theirlesson plans by having students learn theorems and derive complex equations(i.e., action interventions). Such incongruities between motivations and interven-tions fail to address students’ need to perceive a desired benefit, and move pastthe precontemplative stage. In this scenario, one might hypothesize that both theeducator and students would benefit by first making the students aware of thebenefits of statistics (i.e., moving them from precontemplation to contemplation)and, finally, having students actively engaged in more complex statistical calcu-lations (i.e., action).
Study Limitations
As with most research, the current study has its limitations. The major limita-tion of the present study is the small sample sizes in some of the stage classifica-tions. When appropriate, the use of nonparametric tests for our hypothesis testshelped to overcome this limitation. As argued by Siegel (1956), nonparametrictests are particularly suited for dealing with small samples not assumed to bedrawn from a normal population. Despite being more conservative, the nonpara-metric tests supported many of the hypothesized relationships. Nonetheless,future research should replicate our results with a much larger and more diversegroup of participants.
Some may consider the use of undergraduate college students a second limita-tion. Compared to more traditional designs, our choice of a university setting
1452 COLE ET AL.
allowed us the opportunity to study a learning environment that rewards thosewho pursue learning opportunities. Consequently, the current findings portraylearners as active participants, progressing and regressing through varied stages oflearning motivation, each with a different learning experience. Because of itsconstrained nature (e.g., training exercises that proceed from simple to complex),we are unsure if we would have found similar results in a traditional training envi-ronment. However, we look forward to future researchers testing the SOLMI insuch organizational contexts. Finally, the length of the current measure may limitits practicality in organizational settings where survey length and data access arerestricted so invariably. Because the current study was the initial attempt to usethe SOLMI, we chose to report the results using the 21 items. Future researcherscan use our CFA results to develop a factorially pure, shorter version.
Future Research
Regarding future research, applications of the SOLMI should examine itsapplicability to other important learning criteria (e.g., knowledge transfer to thejob), as well as contexts where the consequences for not learning are moresevere. Future studies should incorporate experimental designs using quantitativeor qualitative data to discern what events or processes provide the impetus forlearning sentiments to shift between the motivational stages. Furthermore, withthe development of artificial neural networks (e.g., Skapura, 1996), researchersare provided a rigorous classification methodology that could be used to catego-rize students into learning motivation profiles, and differences among theseprofiles could be interpreted. In addition, the SOLMI and appropriate context-specific modifications of it could prove to be a useful tool in individual- andorganizational-level research. From an individual level of analysis, behaviors thatconcern change and learning activities, particularly training and development,appear fruitful.
Finally, the multidimensional, stage-based approach to learning motivation,of which the SOLMI is one example, needs to be further examined, refined, andembedded in learning theory and application. We believe the results of our studyshow that such a line of inquiry has merit and the potential to improve our under-standing of training motivation and training success.
References
Ackerman, P. L. (1992). Predicting individual differences in complex skill acqui-sition: Dynamics of ability determinants. Journal of Applied Psychology, 77,598-614.
Baldwin, T. T., Magjuka, R. J., & Loher, B. T. (1991). The perils of participation:Effects of choice of training on trainee motivation and learning. PersonnelPsychology, 44, 51-65.

STAGES OF LEARNING MOTIVATION 1453
Browne, M. W., & Cudeck, R. (1993). Alternative ways of assessing model fit.In K. A. Bollen & J. S. Long (Eds.), Testing structural equation models(pp. 136-162). Newbury Park, CA: Sage.
Cable, D. M., & Judge, T. A. (1997). Interviewers’ perceptions of person–organization fit and organizational selection decisions. Journal of AppliedPsychology, 82, 546-561.
Caldwell, D. F., & Burger, J. M. (1998). Personality characteristics of job appli-cants and success in screening interviews. Personnel Psychology, 51,119-125.
Cammann, C., Fichman, M., Jenkins, G. D., & Klesh, J. R. (1983). Assessing theattitudes and perceptions of organizational members. In S. E. Seashore, E. E.Lawler, P. H. Mirvis, & C. C. Cammann (Eds.), Assessing organizationalchange. (pp. 71-138). New York, NY: John Wiley and Sons.
Campbell, J. P. (1989). An agenda for theory and research. In I. L. Goldstein(Ed.), Training and development in organizations (pp. 469-486). SanFrancisco, CA: Jossey-Bass.
Carmines, E. G., & McIver, J. P. (1981). Analyzing models with unobservedvariables: Analysis of covariance structures. In G. W. Bornstedt & E. F.Borgatta (Eds.), Social measurement, current issues (pp. 65-115). BeverlyHills, CA: Sage.
Colquitt, J. A., LePine, J. A., & Noe, R. A. (2000). Toward an integrative theoryof training motivation: A meta-analytic path analysis of 20 years of research.Journal of Applied Psychology, 85, 678-707.
Colquitt, J. A., & Simmering, M. J. (1998). Conscientiousness, goal orientation,and motivation to learn during the learning process: A longitudinal study.Journal of Applied Psychology, 83, 654-665.
Coovert, M. D., & McNelis, K. (1988). Determining the number of common fac-tors in factor analysis: A review and program. Educational and PsychologicalMeasurement, 48, 687-692.
DeVellis, R. S. (1991). Scale development: Theory and application. NewburyPark, CA: Sage.
DiClemente, C. C., & Prochaska, J. O. (1982). Self-change and therapy change ofsmoking behavior: A comparison of processes of change in cessation andmaintenance. Addictive Behavior, 7, 133-142.
DiClemente, C. C., Prochaska, J. O., Fairhurst, S. K., Velicer, W. F., Velasquez,M. M., & Rossi, J. S. (1991). The process of smoking cessation: An analysisof precontemplation, contemplation, and preparation stages of change. Jour-nal of Consulting and Clinical Psychology, 59, 295-304.
Goldstein, L. L. (1993). Training in organizations: Needs assessment, develop-ment, and evaluation (3rd ed.). Monterey, CA: Brooks/Cole.
Harris, S. G., & Cole, M. S. (1999, August). A stages of change perspectiveon motivation to learn in a leadership development context: An empirical

1454 COLE ET AL.
examination. Paper presented at the annual Academy of Management Meet-ing, Chicago, IL.
Hunter, J. E., & Hunter, R. F. (1984). Validity and utility of alternative predictorsof job performance. Psychological Bulletin, 96, 72-98.
Levesque, D. A., Prochaska, J. M., & Prochaska, J. O. (1999). Stages of changeand integrated service delivery. Consulting Psychology Journal: Practice andResearch, 51, 226-241.
Levesque, D. A., Prochaska, J. M., Prochaska, J. O., Dewart, S. R., Hamby, L. S.,& Weeks, W. B. (2001). Organizational stages and processes of changefor continuous quality improvement in health care. Consulting PsychologyJournal: Practice and Research, 53, 139-153.
Loehlin, J. C. (1998). Latent variable models: An introduction to factor, path,and structural analysis (3rd ed.). Mahwah, NJ: Lawrence Erlbaum.
Long, J. S. (1983). Confirmatory factor analysis. Beverly Hills, CA: Sage.Mathieu, J. E., & Martineau, J. W. (1997). Individual and situational influences
in training motivation. In J. K. Ford, S. W. J. Kozlowski, K. Kraiger, E. Salas,& M. S. Teachout (Eds.), Improving training effectiveness in work organiza-tions (pp. 193-222). Hillsdale, NJ: Lawrence Erlbaum.
Mathieu, J. E., Tannenbaum, S. I., & Salas, E. (1992). Influences of individualand situational characteristics on measures of training effectiveness. Academyof Management Journal, 35, 828-847.
McConnaughy, E. A., DiClemente, C. C., Prochaska, J. O., & Velicer, W. F.(1989). Stages of change in psychotherapy: A follow-up report. Psychother-apy, 26, 494-503.
Medsker, G. J., Williams, L. J., & Holahan, P. J. (1994). A review of current prac-tices for evaluating causal models in organizational behavior and humanresources management research. Journal of Management, 20, 439-464.
Mulaik, S. A., James, L. R., Van Alstine, J., Bennett, N., Lind, S., & Stilwell,C. D. (1989). Evaluation of goodness-of-fit indices for structural equationmodels. Psychological Bulletin, 105, 430-445.
Noe, R. A. (1986). Trainees’ attributes and attitudes: Neglected influences ontraining effectiveness. Academy of Management Review, 11, 736-749.
Noe, R. A., & Schmitt, N. (1986). The influence of trainee attitudes on trainingeffectiveness: Test of a model. Personnel Psychology, 39, 497-523.
Noe, R. A., & Wilk, S. L. (1993). Investigation of the factors that influenceemployees’ participation in development activities. Journal of Applied Psy-chology, 78, 291-302.
Noe, R. A., Wilk, S. L., Mullen, E. J., & Wanek, J. E. (1997). Employee develop-ment: Construct validation issues. In J. K. Ford (Eds.), Improving trainingeffectiveness in work organizations (pp. 153-189). Mahwah, NJ: LawrenceErlbaum.
Nunnally, J. C. (1978). Psychometric theory. New York, NY: McGraw-Hill.

STAGES OF LEARNING MOTIVATION 1455
Paulhus, D. L. (1991). Measurement and control of response bias. In J. P.Robinson, P. R. Shaver, & L. S. Wrightsman (Eds.), Measures of personalityand social psychological attitudes (pp. 17-59). San Diego, CA: AcademicPress.
Prochaska, J. O. (1979). Systems of psychotherapy: A transtheoretical analysis.Homewood, IL: Dorsey.
Prochaska, J. M. (2000). A transtheoretical model for assessing organizationalchange: A study of family service agencies’ movement to time-limited therapy.Families in Society: The Journal of Contemporary Human Services, 81, 76-84.
Prochaska, J. O., & DiClemente, C. C. (1982). Transtheoretical therapy: Towarda more integrative model of change. Psychotherapy: Theory, Research, andPractice, 19, 276-289.
Prochaska, J. O., & DiClemente, C. C. (1983a). Stages and processes of self-change of smoking: Toward an integrative model of change. Journal of Con-sulting and Clinical Psychology, 51, 390-395.
Prochaska, J. O., & DiClemente, C. C. (1983b). Transtheoretical therapy: Towarda more integrative model of change. Psychotherapy: Theory, Research, andPractice, 20, 161-173.
Prochaska, J. O., DiClemente, C. C., & Norcross, J. C. (1992). In search of howpeople change: Applications to addictive behaviors. American Psychologist,47, 1102-1114.
Prochaska, J. O., DiClemente, C. C., Velicer, W. F., Ginpil, S., & Norcross, J.(1985). Predicting change in smoking status for self-changers. AddictiveBehavior, 10, 395-406.
Prochaska, J. O., DiClemente, C. C., Velicer, W. F., & Rossi, J. S. (1993).Standardized, individualized, interactive, and personalized self-help pro-grams for smoking cessation. Health Psychology, 12, 399-405.
Prochaska, J. O., Velicer, W. F., Rossi, J. S., Goldstein, M. G., Marcus, B. H.,Rakowski, W., Fiore, C., Harlow, L. L., Redding, C. A., Rosenbloom, D., &Rossi, S. R. (1994). Stages of change and decisional balance for 12 problembehaviors. Health Psychology, 13, 39-46.
Quinones, M. A. (1995). Pretraining context effects: Training assignment asfeedback. Journal of Applied Psychology, 80, 226-238.
Reilly, R. R., & Warech, M. A. (1993). The validity and fairness of alternatives tocognitive tests. In L. C. Wing & B. R. Gifford (Eds.), Policy issues in employ-ment testing (pp. 131-224). Norwell, MA: Kluwer Academic.
Siegel, S. (1956). Nonparametric statistics for the behavioral sciences. NewYork, NY: McGraw-Hill.
Skapura, D. M. (1996). Building heural networks. New York, NY: Addison-Wesley.Spector P. E., & Brannick, M. T. (1995). The nature and effects of method vari-
ance in organizational research. International Review of Industrial and Orga-nizational Psychology, 10, 249-274.
1456 COLE ET AL.
Tannenbaum, S. I., & Yukl, G. (1992). Training and development in work organi-zations. Annual Review of Psychology, 43, 399-441.
Thompson, B., & Daniel, L. G. (1996). Factor analytic evidence for the constructvalidity of scores: A historical overview and some guidelines. Educationaland Psychological Measurement, 56, 197-208.
Watson, D., Clark, L. A., & Tellegen, A. (1988). Development and validation ofbrief measures of positive and negative affect: The PANAS scales. Journal ofApplied Psychology, 54, 1063-1070.
Zwick, W. R., & Velicer, W. F. (1986). Comparison of five rules for determiningthe number of components to retain. Psychological Bulletin, 99, 432-442.