staff report: 1997-06-00 perchloroethylene needs ... · assessment for automotive consumer products...
TRANSCRIPT

Perchloroethylene NeedsAssessment for Automotive
Consumer Products
Status Report
Stationary Source DivisionEmission Assessment Branch
June 1997
California Environmental Protection AgencyAir Resources Board

State of CaliforniaCalifornia Environmental Protection Agency
Air Resources BoardStationary Source Division
P.O. Box 2815Sacramento, California 95812
STATUS REPORTPERCHLOROETHYLENE NEEDS ASSESSMENT FOR
AUTOMOTIVE CONSUMER PRODUCTS
June 1997
Primary Authors
Mark WilliamsTina Najjar
Richard A. Boyd IIGregory Harris
Contributors
Victor A. DouglasWinston PottsTony ServinCarolyn Suer
Reviewed and Approved By
Peter D. Venturini, Chief, Stationary Source DivisionDonald J. Ames, Assistant Chief, Stationary Source Division
Robert D. Fletcher, Chief, Emissions Assessment BranchTodd S. Wong, Manager, Emissions Evaluation Section
This status report has been reviewed by the staff of the Air Resources Board and approved forrelease. Approval does not signify that the contents necessarily reflect the views and policies ofthe Air Resources Board; nor does mention of trade names or commercial products constituteendorsement or recommendation for use.
ACKNOWLEDGMENTS
This report was developed with the assistance of the consumer products manufacturing industryand its associations, the brake service industry, district and state agency staff, and others. Wethank the brake service facility representatives for showing us their operations and providingproduct information, and the following people who have taken the time to participate in meetingsand respond to our requests for information:
3M Company Richard A. McKelveyAerosol Maintenance Products Denise BoydAervoe Pacific Company Mike TraquinaAmrep International Inc. Sean KnappBalkamp Inc. Mike McHoneBerkebile Oil Company Inc. Catherine PoorbaughBerryman Products, Inc. Roger CotmanCH2MHill Jay WitherspoonClaire Manufacturing Company Flip MillerCRC Industries Inc Adam SeliskerCSMA Doug FratzCSSARA Dennis DeCotaCurtis Industries Debbie TrompCyclo Industries LLC Carole MurphyDel Rey Chemical Company Ray Del ReyDiversified Brands Doug Raymond/Kimberly SmithDrummond American Corp Gary OlsonEIS Brake Parts Standard Frank VolageFirst Brands Corporation Marty LewisGlenn County APCD Rick StewardHalogenated Solvents Industry Association Stephen RisottoHydrosol Alan HowarthImperial Inc David RobishawInstitute for Research and Technical Assistance Katy WolfJustice Brothers Inc. Bryan McConnellL.A. County Sanitation District Paul MartinLawson Products Inc. Juan SanchezLivingston and Mattesich Jim MattesichLoctite Corporation Judy MichaelsLPS Laboratories Inc. John RoudebushMEMA Paul Haluza/John CarneyMOC Products, Inc. Yulin GuMojave Desert AQMD Richard WalesMonterey Bay Unified APCD David CraftNational Chemsearch Carolyn SerokaNorthern Sonoma County APCD Barbara LeeOffice of Environmental Health Hazard Assessment Dr. Melanie Marty

Osborn Manufacturing William GreenawayPenray Companies Paul ZoubekPremier (Farnell) Autoware Co. Ken ManchenRadiator Specialty Company James Wells/Robert GeerRawn Company Inc Roger HansonSacramento Metropolitan AQMD Karen KelleySan Diego County APCD Tom WeeksSan Joaquin Valley Unified APCD Rick McVeighSan Luis Obispo County APCD Tom RoemerSanta Barbara County APCD Richard StedmanSeymour of Sycamore Inc. Robert MartinSnap Products Rich LehmanSouth Coast AQMD Ben ShawSpray Products Corporation Andrew OrrTechnical Chemical Company Larry EasterlinValvoline Tracy SmithVentura County APCD Terri ThomasWarren Distribution Tom SnuttjerWinzer Corporation Russell ReevesWynn Oil Company Lori CatherasooYolo-Solano AQMD Annette Carruthers

i
TABLE OF CONTENTS
Contents Page
I. INTRODUCTION
1. Why are we reviewing Perc use in automotive consumer products? . . . . . . . 12. What authority does the ARB have to reduce Perc in the air and
what actions have been taken? . . . . . . . . . . . . . . . . . . . . . . . . . . . . . . . . . . . . 1
II. PUBLIC OUTREACH AND REPORT PREPARATION
1. What outreach efforts have the staff made to involve interested parties? . . . . 32. How have the brake service facility operators and consumer product
manufacturers participated in the development of the status report? . . . . . . . 43. Who else has been involved in the process? . . . . . . . . . . . . . . . . . . . . . . . . . . 44. What methods were used to collect information for the status report? . . . . . . 4
III. FINDINGS
1. What do we know about Perc usage in brake cleaning products in California? . 52. How are brake jobs performed? . . . . . . . . . . . . . . . . . . . . . . . . . . . . . . . . . . . 63. How much Perc is emitted from the use of brake cleaning products? . . . . . . 7
IV. POTENTIAL HEALTH EFFECTS AND HEALTH RISKS
1. What are the potential health effects associated with exposure to Perc? . . . . 82. What tools and information are used to estimate a facility’s potential
health impacts? . . . . . . . . . . . . . . . . . . . . . . . . . . . . . . . . . . . . . . . . . . . . . . . . 93. What are the potential health impacts to individuals from exposure to a
brake service facility using Perc-containing cleaners? . . . . . . . . . . . . . . . . . 104. What factors at the facility affect the outcome of the risk assessment? . . . . 14
V. RECOMMENDATIONS . . . . . . . . . . . . . . . . . . . . . . . . . . . . . . . . . . . . . . . . . . . . 16
REFERENCES . . . . . . . . . . . . . . . . . . . . . . . . . . . . . . . . . . . . . . . . . . . . . . . . . . . . . . . . . . 18
ii
Contents Page
APPENDICES
Appendix A - Brake Cleaner and Perc-Containing Automotive Products Survey . . . . . . A-1
Appendix B - Brake/Automotive Repair Shop Survey . . . . . . . . . . . . . . . . . . . . . . . . . . B-1
Appendix C - Summary of the Different Types of Brake Service Facilities . . . . . . . . . . C-1
Appendix D - Health Effects and Example Risk Assessment Calculations . . . . . . . . . . . D-1
Appendix E - Glossary . . . . . . . . . . . . . . . . . . . . . . . . . . . . . . . . . . . . . . . . . . . . . . . . . . . E-1
LIST OF TABLES
Table III-1. Summary of Survey Information . . . . . . . . . . . . . . . . . . . . . . . . . . . . . . . . . . 6
Table III-2. Emission Estimates from Site Visits . . . . . . . . . . . . . . . . . . . . . . . . . . . . . . . . 8
Table IV-1. Summary of Near-Source Potential Health Impacts . . . . . . . . . . . . . . . . . . . 12
Table IV-2. Summary of Potential Health Impacts at the Maximum Exposed Individual Resident (MEIR) . . . . . . . . . . . . . . . . . . . . . 13
Table IV-3. Summary of Potential Health Impacts at the Maximum Exposed Individual (Off-site) Worker (MEIW) . . . . . . . . . . . . . 15

1
STATUS REPORTPERCHLOROETHYLENE NEEDS ASSESSMENT FOR
AUTOMOTIVE CONSUMER PRODUCTS
In this status report, the Air Resources Board (ARB/Board) staff presents its findings onperchloroethylene (Perc) use in automotive consumer products, particularly brake cleaningproducts. We conclude with our recommendations to the Board on future activities related to thecontrol of Perc in automotive consumer products.
I. INTRODUCTION
1. Why are we reviewing Perc use in automotive consumer products?
At the November 21, 1996, hearing, the Board adopted amendments to exempt Perc fromthe volatile organic compound (VOC) definition in California’s Regulation for Reducing VOCEmissions from Consumer Products (Consumer Products Regulation). This action would allowmanufacturers to reformulate consumer products with Perc to meet the VOC limits of theConsumer Products Regulation.
During the hearing, the Board expressed concerns about the potential increase in Perc usein consumer products, and the possible health impacts that might result. Therefore, the Boarddirected the ARB staff to conduct an assessment under the State toxic air contaminant programof the need for control of Perc used in consumer products, and to report on the status of thisassessment to the Board no later than June 1997. At the hearing, automotive consumer products,and specifically brake cleaners, were identified as the consumer products most likely to contain,or be reformulated to contain, Perc. Consequently, this status report presents the Perc NeedsAssessment for Automotive Consumer Products (Perc Needs Assessment) with an emphasis onbrake cleaners.
This status report summarizes the findings of the ARB staff, including the survey ofautomotive consumer products manufacturers, site visits to automotive brake service facilities,Perc emissions and potential risk, and recommendations for future action.
2. What authority does the ARB have to reduce Perc in the air and what actions have been taken?
The authority to control air toxics was established by Assembly Bill 1807 (1983). Thislaw mandates the identification and control of air toxics in California and complements thecriteria air pollutant program. The identification phase of the program allows the ARB, with theparticipation of other state agencies, to evaluate the health impacts and exposure of substances

2
and identify those which pose the greatest health threat as toxic air contaminants. The Boardidentified Perc as a toxic air contaminant (TAC) at its October 1991 hearing.
Following the identification of a substance as a TAC, Health and Safety Codesection 39665 requires the ARB, with participation of the air pollution control and air qualitymanagement districts (districts), and in consultation with affected sources and interested parties,to prepare a report on the need and appropriate degree of regulation for that substance. Theneeds assessment for Perc was conducted as part of the ARB’s development of an airborne toxiccontrol measure (ATCM) for dry cleaning operations. During this assessment, the ARB staffdetermined that dry cleaning operations and solvent degreasing operations accounted for about80 percent of the Perc use in California. Therefore, staff focussed their attention on these twouses of Perc first.
In September 1993, the Board adopted the ATCM for Emissions of Perchloroethylenefrom Dry Cleaning Operations (Dry Cleaning ATCM) (Title 17, California Code of Regulations,Sections 93109 and 93110). When fully implemented in 1998, this ATCM will result in a 78 percent reduction in statewide Perc emissions from Perc dry cleaning operations.
In 1990, the United States Environmental Protection Agency (U.S. EPA) identified Percas a hazardous air pollutant (HAP). In December 1994, U.S. EPA promulgated the NationalEmission Standard for Hazardous Air Pollutants: Halogenated Solvent Cleaning (the DegreasingNESHAP) to address halogenated solvents emissions, including Perc, from degreasingoperations. In California, the Degreasing NESHAP is the State ATCM for degreasingoperations; therefore, it must be implemented and enforced by the districts, unless the districtsseek and receive approval from U.S. EPA to implement an alternative control measure. Sourcessubject to the Degreasing NESHAP have to comply with this regulation beginning onDecember 2, 1997.
In addition, the ARB staff is finalizing the Risk Reduction Audits and Plans Guidelinesfor Halogenated Solvents Degreasing Operations to assist facilities who have been identified bythe districts as significant risk facilities under the Assembly Bill (AB) 2588 “Hot Spots" Programand Senate Bill 1731 (Health and Safety Code sections 44390 to 44394). This guidelinedocument contains a self-conducted audit and checklist which will help a facility operatordetermine possible options to reduce a facility’s risk from degreasing operations.
In reviewing the criteria for facilities subject to the AB 2588 “Hot Spots” program, brakeservice facilities are not required to complete emissions inventory plans and submit these plansto the districts. Although retail gasoline service stations are currently subject to the “Hot Spots”program, the districts typically require the reporting of only the toxic emissions from gasolinedispensing, even if other operations such as brake cleaning operations are occurring. In general,the districts can bring any individual facility into the “Hot Spots” program if they determine thatthe facility poses a significant risk to the public.

3
The ARB has the authority to control consumer products as established in Health andSafety Code section 41712. Pursuant to this authority, the Board adopted the aerosol coatingsregulation which essentially prohibits “new or increased uses” of Perc. The aerosol coatingsregulation allows Perc-containing aerosol coatings to be sold or used in California if they weresold in the State in 1992 and complied with the standards of the aerosol coatings regulation. Italso allows Perc-containing aerosol coatings to be sold or used in California if they were sold inthe State in 1992 and could be reformulated to comply with the standards of the aerosol coatings regulation without increasing the Perc content. Perc-containing aerosol coatings that were notsold or used in California in 1992, or those that were which could not be reformulated to complywith the standards of the aerosol coatings regulation without increasing the Perc content, are notallowed.
II. PUBLIC OUTREACH AND REPORT PREPARATION
Outreach and public participation have always been important components in our reportpreparation process. For the Perc Needs Assessment, we developed an outreach program toinvolve consumer products manufacturers and their associations, brake service facilities, state andlocal regulatory agencies, and other interested parties in the assessment process, including thedevelopment and review of the necessary surveys and draft reports. Our goal is to work withindustry and the interested parties to obtain information on the use and emissions ofPerc-containing automotive consumer products and to provide all parties a forum to address theirconcerns.
1. What outreach efforts have the staff made to involve interested parties?
We have made extensive personal contacts with industry and facility representatives aswell as other affected parties through meetings and telephone calls. To date, we have:
formed a Perc Needs Assessment workgroup and conducted three conference calls withthem to discuss our activities;mailed or faxed workgroup agendas and minutes, and workshop notices to over 80 people;mailed or faxed the Brake Cleaner and Perc-Containing Automotive Products Survey to60 people comprised of manufacturers, associations, and interested parties(see section II.4 for additional details);released a draft status report of the Perc Needs Assessment for review and comment priorto the workshop;held a public workshop; andvisited 37 brake service facilities to gather information on the process and amount of brakecleaning products used, building dimensions, and receptor locations (see section II.4). Staffwill be conducting more site visits prior to the June Board meeting.

4
2. How have the brake service facility operators and consumer products manufacturers participated in the development of the status report?
The automotive consumer products manufacturers and brake service industryrepresentatives have been participants in the assessment process. Individual manufacturers andbrake service facility operators have provided both technical information and comments on oursurvey and preliminary findings. Industry involvement in the process has included:
more than 250 telephone conversations with the ARB staff;input on the development of the manufacturer’s survey; 22 surveys returned by manufacturers; andparticipation of 18 workgroup representatives to review the survey and risk assessmentresults.
3. Who else has been involved in the process?
To promote statewide consistency and provide a multi-media perspective, other local,state, and federal agencies that are interested in potential emissions or soil/groundwatercontamination by Perc have been involved in the assessment process. These agencies include:the air districts, sanitation districts, the California Department of Industrial Relations/Division ofOccupational Safety and Health (Cal/OSHA), Cal/EPA’s Office of Environmental Health HazardAssessment (OEHHA), and the U.S. EPA.
We have worked with the districts through the California Air Pollution Control OfficersAssociation’s (CAPCOA) Toxics Committee to apprise them of our activities. We have alsorequested information that they may have on the brake cleaning process and how districts regulatethe brake service industry. This work has included telephone calls to the districts andpresentations to the CAPCOA Toxics Committee.
Additionally, we have had several conversations with a representative of the Institute forResearch and Technical Assistance (IRTA), a non-profit organization that assists small businesseswith chemical and process substitutions to decrease the use of halogenated solvents. We also hadconversations with representatives of TriTac, a technical advisory committee sponsored by theLeague of California Cities, the California Association of Sanitation Agencies, and the CaliforniaWater Environment Association.
4. What methods were used to collect information for the status report?
ARB staff developed two surveys to gather Perc usage and emissions data for use in thisstatus report: the Brake Cleaner and Perc-Containing Automotive Products Survey (BrakeCleaner Survey), and the Brake/Automotive Repair Facility Survey for site visits (Site VisitSurvey). The Brake Cleaner Survey (see Appendix A) was developed to gather current sales andformulation data for both chlorinated and non-chlorinated brake cleaning products. It also

5
requested information on future formulation trends that could increase the Perc content of brakecleaning products and other automotive consumer products. The Site Visit Survey (see Appendix B) was developed to gather brake service facility process information and sourcecharacteristic information. Process information includes items such as the number of brake jobsperformed per day and the amount and types of solvent used in the process. Process informationwas used to estimate facility emissions. Source characteristic information includes buildingdimensions and the location of the nearest receptor, and is used, in conjunction with facilityemissions and an air dispersion model, to assess risk from a given facility.
III. FINDINGS
1. What do we know about Perc usage in brake cleaning products in California?
The U.S. EPA was required under section 183(e) of the 1990 Clean Air Act Amendmentsto conduct a study of VOC emissions from consumer products; therefore, the U.S. EPA surveyed consumer products manufacturers, retailers, distributors, and packagers forinformation on 1990 U.S. sales data, product formulations, product size, product form, and otherinformation for each product surveyed. Automotive consumer products, including brake cleaningproducts, were contained in this survey. This information is reflected in the 1990 U.S. EPAConsumer and Commercial Products Database (U.S. EPA 1990 Database).
The U.S. EPA 1990 Database indicated that brake cleaning products use the largest totalpercentage of Perc of the products surveyed. It was estimated from the U.S. EPA survey that theuse of brake cleaners in California accounted for about 470,000 pounds per year (lbs/yr) of Perc,or about 45 percent of consumer products Perc usage. Other users of Perc in consumer productsinclude dry cleaning fluids, spot removers, and carburetor choke cleaners. Due to its substantialuse, we are focusing on brake cleaning products in this status report.
As of May 23, 1997, 22 of the 37 surveys sent to manufacturers in March 1997 have beenreturned. From the returned surveys, we received information on 89 different brake cleaningproducts, 33 of which contain Perc. Based on reported sales of over 2,000,000 units ranging insize from 10 ounces to 55 gallons and Perc content from about 22 to 98 percent, staff calculated aPerc usage of approximately 3,900,000 pounds per year (lbs/yr) or 290,000 gallons per year(gal/yr) from Perc-containing brake cleaning products. We estimate that Perc usage for theremaining 15 manufacturers accounts for less than ten percent of the total, based on a 1990 ARBsurvey.
The amount of Perc from the Brake Cleaner Survey is more than the estimated Perc usefrom brake cleaning products in the U.S. EPA 1990 Database (3,900,000 lbs/yr versus470,000 lbs/yr.). It is important to note that the estimate from the U.S. EPA 1990 Database maynot be representative of California usage since it was based on a nationwide survey. However,some of the increase may be attributed to the reformulation of brake cleaning products that
6
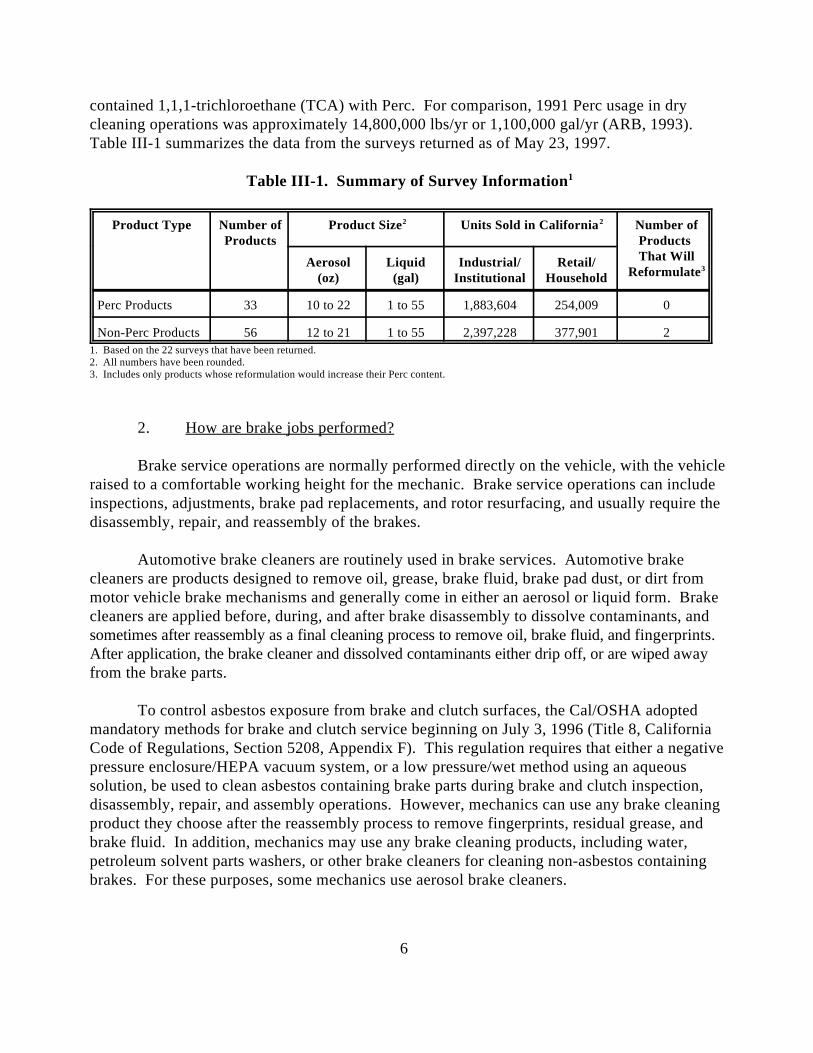
contained 1,1,1-trichloroethane (TCA) with Perc. For comparison, 1991 Perc usage in drycleaning operations was approximately 14,800,000 lbs/yr or 1,100,000 gal/yr (ARB, 1993). Table III-1 summarizes the data from the surveys returned as of May 23, 1997.
Table III-1. Summary of Survey Information1
Product Type Number of Product Size Units Sold in California Number ofProducts Products
2 2
That WillReformulate3Aerosol Liquid Industrial/ Retail/
(oz) (gal) Institutional Household
Perc Products 33 10 to 22 1 to 55 1,883,604 254,009 0
Non-Perc Products 56 12 to 21 1 to 55 2,397,228 377,901 21. Based on the 22 surveys that have been returned.2. All numbers have been rounded.3. Includes only products whose reformulation would increase their Perc content.
2. How are brake jobs performed?
Brake service operations are normally performed directly on the vehicle, with the vehicleraised to a comfortable working height for the mechanic. Brake service operations can includeinspections, adjustments, brake pad replacements, and rotor resurfacing, and usually require thedisassembly, repair, and reassembly of the brakes.
Automotive brake cleaners are routinely used in brake services. Automotive brakecleaners are products designed to remove oil, grease, brake fluid, brake pad dust, or dirt frommotor vehicle brake mechanisms and generally come in either an aerosol or liquid form. Brakecleaners are applied before, during, and after brake disassembly to dissolve contaminants, andsometimes after reassembly as a final cleaning process to remove oil, brake fluid, and fingerprints. After application, the brake cleaner and dissolved contaminants either drip off, or are wiped awayfrom the brake parts.
To control asbestos exposure from brake and clutch surfaces, the Cal/OSHA adoptedmandatory methods for brake and clutch service beginning on July 3, 1996 (Title 8, CaliforniaCode of Regulations, Section 5208, Appendix F). This regulation requires that either a negativepressure enclosure/HEPA vacuum system, or a low pressure/wet method using an aqueoussolution, be used to clean asbestos containing brake parts during brake and clutch inspection,disassembly, repair, and assembly operations. However, mechanics can use any brake cleaningproduct they choose after the reassembly process to remove fingerprints, residual grease, andbrake fluid. In addition, mechanics may use any brake cleaning products, including water,petroleum solvent parts washers, or other brake cleaners for cleaning non-asbestos containingbrakes. For these purposes, some mechanics use aerosol brake cleaners.

7
Aerosol brake cleaners are available in either chlorinated or non-chlorinated formulations. Chlorinated aerosol brake cleaners can contain Perc, in addition to methylene chloride andpetroleum distillates in varying concentrations. Non-chlorinated aerosol brake cleaners maycontain petroleum distillates, toluene, xylenes, methanol, acetone, or other organic solvents. Both types of aerosol brake cleaners dry quickly and clean without leaving a residue. However,both types also have disadvantages in that the chlorinated aerosol may have warning labels due tothe potential toxicity of the compounds used, and the non-chlorinated aerosols may be flammable. It is the mechanic’s preference on which type of aerosol product is used.
3. How much Perc is emitted from the use of brake cleaning products?
In quantifying Perc emissions from brake cleaning products, ARB staff looked at variousstudies, including those by the ARB, U.S. EPA, and John Norton of George Mason University(Norton, 1993), and could not find information representative of California brake servicefacilities. To estimate Perc emissions from individual brake service facilities, staff collectedinformation from 37 site visits to brake service facilities in several areas throughout the State. Asmentioned previously, the type of information gathered included: the number of brake jobsperformed per day, the amount and types of solvent used in the process, and source characteristicinformation such as building dimensions and the location of the nearest receptor. Of the 37 sitevisits, only 16 facilities used Perc-containing products in their brake servicing process.
The staff also collected information from the California Board of Equalization, the California Department of Consumer Affairs’ Bureau of Automotive Repair, and the United StatesEconomic Census to estimate that there are about 31,000 to 34,000 automotive service and repairfacilities in California (BOE, 1997a; BOE, 1997b; BAR, 1997; U.S. Economic Census, 1992). Using the standard industrial classification (SIC) breakdown within the United States EconomicCensus, we estimated that approximately 21,000 of these facilities may perform brake services inCalifornia. These facilities can be grouped into five categories: service stations, fleets, new andused car dealerships, brake shops, and general automotive repair facilities. A description of eachfacility category is given in Appendix C.
The site visit information indicated that the quantity of Perc that is emitted per each brake job varies with several factors. These factors include the mechanic who is servicing the vehicle, the Perc content in a particular brand of brake cleaner, and the manner in which the product is used. Emissions are also impacted by the size and operating schedule of the facility. Thisvariability has made it difficult to accurately express emissions as a function of product usage perbrake job in a generic fashion.
The shops that were visited did not have pre-established guidelines outlining how muchproduct was to be used, but relied upon what the mechanic felt was an appropriate amount tocomplete the task. Furthermore, the aerosol spray cans that contain the products come in severalsizes with the Perc content ranging from 1 percent to 100 percent according to manufacturers’material safety data sheets. This makes it difficult to extract a representative average for Perc

8
concentration in the products. Some facilities also reported using brake cleaning products for small parts cleaning and degreasing on a limited basis. As a result, the emission estimatessummarized in Table III-2 for three service stations, three fleet operations, two car dealerships, two brake shops, and six general automotive repair facilities reflect the variability in the use of brake cleaning products and limited small parts cleaning activities. These emission estimates areused in the risk assessment modeling. Based on observations during site visits, ARB staffconcluded that 100 percent of the Perc contained in aerosol brake cleaners is emitted to the air when used.
Table III-2. Emission Estimates from Site Visits
Facility Category Number of Range of Annual Range of Annual Facilities Perc Emissions Perc Emissions Visited [gallons/year] [pounds/year] 1 1,2
Service Stations 3 1.5 to 6.7 20 to 90
Fleets 3 1.4 to 97 19 to 1307
New and Used Car 2 3 to 24 41 to 325 Dealerships
Brake Shops 2 4.3 to 11 58 to 152
General Automotive 6 0.3 to 51 4.3 to 697 Repair
1. All numbers have been rounded. 2. Perc density: 13.47 pounds per gallon at 25 degrees Celsius.
IV. POTENTIAL HEALTH EFFECTS AND HEALTH RISKS
1. What are the potential health effects associated with exposure to Perc?
Exposure to Perc may result in both cancer and non-cancer health effects. The OEHHA staff has performed an extensive assessment of the potential health effects of Perc, reviewingavailable carcinogenicity data. OEHHA concluded that Perc is a possible human carcinogen withno identifiable threshold below which no carcinogenic effects are likely to occur. As mentionedpreviously, the Board formally identified Perc as a toxic air contaminant (TAC) in October 1991. The U.S. EPA has also listed Perc as a hazardous air pollutant (HAP) pursuant to section 7412 ofTitle 42 of the United States Code (ARB, 1996).
Short-term (acute) and long-term (chronic) exposure to Perc may result in non-cancer health effects. Acute toxic health effects resulting from short term exposure to high levels of Percmay include headaches, dizziness, rapid heartbeat, and irritation or burns on the skin, eyes, orrespiratory tract. Massive acute doses can induce central nervous system depression resulting in
9
respiratory failure. Chronic exposure to lower Perc concentration levels may result in dizziness,impaired judgement and perception, and damage to the liver and kidneys (ARB, 1996).
2. What tools and information are used to estimate a facility’s potential health impacts?
The tools and information that are used to estimate the potential health impacts from a facilityinclude an air dispersion model and pollutant-specific health effects values. Information required for the air dispersion model includes emission estimates and physical descriptions of the source andemission release parameters. Combining the output from the air dispersion model and the pollutant-specific health values provides an estimate of the off-site potential cancer and non-cancerhealth impacts from the emissions of a toxic air contaminant. For this assessment, we are estimating the potential health impacts from Perc emitted during brake service operations. A brief descriptionof the air dispersion modeling and pollutant-specific health effects values is provided in this section. A more detailed discussion, including an example calculation, is presented in Appendix D.
a. Air Dispersion Modeling
Air dispersion models are used to estimate the downwind, ground-level concentrations of apollutant emitted from a facility. The downwind concentration is estimated by evaluating thequantity of emissions, release parameters at the source, and appropriate meteorological conditions. The SCREEN3 air dispersion model, version 96043, is used to estimate potential ground-levelconcentrations due to Perc emissions from brake service facilities. The U.S. EPA recommends the SCREEN3 model for air dispersion modeling and it is currently used by the ARB, districts, and other states (U.S. EPA, 1995).
b. Pollutant-Specific Health Effects Values
Dose-response or pollutant-specific health effects values are developed to characterize therelationship between a person's exposure to a pollutant and the incidence or occurrence of anadverse health effect. A unit risk factor (URF) or cancer potency factor is used when estimatingpotential cancer risks and reference exposure levels (REL) are used to assess potential non-cancerhealth impacts.
As stated above, exposure to Perc may result in both cancer and non-cancer health effects. The inhalation URF is 5.9 x 10 (microgram per cubic meter) or ( g/m ) (CAPCOA, 1993). -6 -1 3 -1
The URF is defined as the estimated upper-confidence limit (usually 95%) probability of a personcontracting cancer as a result of constant exposure to a concentration of 1 g/m over a 70-year3
lifetime. In other words, the potential excess cancer risk for a person continuously exposed over a70-year lifetime to 1 g/m of Perc is estimated to be no greater than 5.9 chances in 1 million. 3
Non-cancer acute and chronic RELs have been developed for Perc. The acute non-cancer REL is 6.8 x 10 g/m (CAPCOA, 1993). The toxicological endpoint considered for acute toxicity is 3 3
10
the central nervous system. The chronic REL is 35 g/m (CAPCOA, 1993). The toxicological3
endpoints considered for chronic toxicity are the kidney, liver, and gastrointestinal system.
3. What are the potential health impacts to individuals from exposure to a brake service facility using Perc-containing brake cleaners?
The ARB staff conducted a screening risk assessment for 16 of the facilities that staff visited and found to be using Perc-containing brake cleaners. These 16 facilities are a subset of the 37 brake service facilities where ARB staff has conducted site visits. The other 21 facilitieswere not assessed because they did not use Perc-containing products.
Table IV-1 summarizes the maximum potential cancer and non-cancer health impacts. The maximum potential health impacts are estimated to occur at near-source locations. For these 16 facilities, we selected a minimum receptor distance of 20 to 30 meters from the center of thevolume source or building to define a near-source location. The purpose of estimating the potential health impacts at a near-source location is to illustrate what the potential health impactscan be if a receptor was located close to the facilities which were assessed, rather than having anincreased “buffer” distance between the receptor and the edge of the building.
Tables IV-2 and IV-3 summarize the potential cancer and non-cancer health impacts at themaximum exposed individual resident (MEIR) and at the maximum exposed individual (off-site)worker (MEIW), respectively. Definitions of MEIR and MEIW can be found in the glossary(Appendix E). An example calculation is presented in Appendix D illustrating how a facility’spotential risk was assessed. This example shows emission calculations, steps through the airdispersion modeling, and concludes with a calculation of potential health impacts.
a. Summary of Carcinogenic Impacts
From a carcinogenic standpoint, the near-source risk assessment results for the 16 facilitiesrange from approximately 0.3 to 51 chances in a million. The individual results are presented inTable IV-1. Eight of the facilities are estimated to have near-source potential cancer risks that aregreater than 10 chances per million. At fleet facility I, the potential near-source cancer risk rangesfrom approximately 33 to 47 chances per million at 20 meters from the center of the volume source (building). At dealership M, the potential near-source cancer risk is approximately19 chances per million. At the general automotive repair facilities O, Q, R, T, and U, the potentialnear-source cancer risk ranges from approximately 11 to 51 chances per million. At brake shop P,the near-source potential cancer risk ranges from approximately 8.8 to 13 chances per million. The near-source potential cancer risks for the remaining 8 facilities are all below 10 chances permillion.
For comparison purposes, the 1996 ambient statewide Perc concentration of 0.92 µg/m3
(0.135 parts per billion or ppb) is determined from the ARB ambient air monitoring network. Theambient air monitoring network is designed to obtain ambient background, non-source-influenced,

11
concentration levels of air toxics, such as Perc, from 21 ambient air toxics monitoring stationslocated statewide. Using the ambient statewide Perc concentration, and assuming that a person iscontinuously exposed to this concentration for a 70-year lifetime, the potential risk from themeasured 1996 Perc concentrations may increase the risk of cancer by approximately 5 chances per million. While this is only a rough estimate, this comparison puts into perspective thecontribution to risk from the Perc-using facilities staff visited and the potential risk from the ambient concentration.
From 1991 to 1996, the ambient statewide Perc concentration has decreased byapproximately 50 percent, from 0.271 to 0.135 ppb. The ARB staff estimated the 1991 annual Perc usage to be approximately 25 million pounds from all source categories surveyed during thedevelopment of the Dry Cleaning ATCM. Of this 25 million pounds, approximately 2.5 millionpounds were estimated to result from the miscellaneous category. This miscellaneous categoryincludes brake cleaning products as well as other aerosols, textiles, pharmaceuticals, and inks (ARB, 1993). There is insufficient data to quantify how the ambient reductions in Perc correspond to reductions in commercial and industrial Perc use. However, since 1991, contributions to the reduction of ambient levels and Perc use could be attributed to regulations orprograms such as the Dry Cleaning ATCM and voluntary modifications to work practices fromsources using Perc due to the AB 2588 Air Toxics “Hot Spots” Program (see section I.2).
Currently, we do not have an updated breakdown of Perc usage by source category. However, Brake Cleaner Survey results indicate that approximately 4 million pounds of Perc areused in brake cleaners alone. These preliminary results show that the 1996 Perc contribution frombrake cleaners is larger than 1991 levels for this miscellaneous source category. Therefore, theseresults indicate that brake service facilities may constitute a larger fraction of the ambient risk. Further study would be required to fully quantify these results.

12
Table IV-1. Summary of Near-Source Potential Health Impacts1,2
Facility Individual Acute Chronic Type Cancer Risk Hazard Index Hazard Index (n=16) (per million)
Service Stn. D 7.5 <0.1 <0.1
Service Stn. E 2.0 to 2.9 <0.2 <0.1 3
Service Stn. L 4.7 to 6.8 <0.4 <0.1 3
Fleet G 9.1 <0.1 <0.1
Fleet H 0.3 to 0.4 <0.1 <0.13
Fleet I 33 to 47 <0.3 <0.33
Dealership M 19 <0.1 <0.1
Dealership N 3.7 <0.1 <0.14
Gen. Auto O 11 to 16 <0.5 <0.13
Gen. Auto Q 27 to 39 <0.6 <0.23
Gen. Auto R 35 to 50 <0.2 <0.33
Gen. Auto T 51 <0.2 <0.3
Gen. Auto U 22 to 32 <0.2 <0.23
Gen. Auto V 0.5 <0.1 <0.1
Brake Shop P 8.8 to 12.7 <0.1 <0.13
Brake Shop S 5.0 <0.1 <0.1 1. Near-source is defined as the modeled minimum receptor distance of 20 to 30 meters from the building center, or ranging from 2 to16 meters away from the outside edge of the building. 2. All numbers have been rounded. 3. These facilities use a Perc-containing brake cleaner which shows a Perc content range from 65% to 94%
by weight on the Material Safety Data Sheet (MSDS); therefore, a range is presented for the potential cancer risk.
4. This facility used a brake cleaner with a Perc content range of 1% to 100% by weight according tothe MSDS. The potential cancer risk was estimated at Perc content of 100% by weight.
The risk assessment results for the MEIR are presented in Table IV-2. At four of these
facilities, the potential cancer risk at the MEIR is greater than 10 chances per million. At dealership M, where the MEIR is located approximately 15 meters away from the outside edge ofthe building, the potential cancer risk is approximately 17 chances per million. At the general auto facilities Q, R, and T, the potential MEIR risk ranges from approximately 8 to 30 chances permillion for receptors ranging from 30 to 75 meters away from the outside edge of the building. Atthe other 12 facilities, the potential risk range from 0.01 to 10 chances per million. A contributing

13
factor to this decrease in risk at the MEIR is the increased “buffer” distance created by the facilityfence line or the location of the nearest resident. The distance to the MEIR at these facilities wasestimated to range from 25 to 800 meters.
Table IV-2. Summary of Potential Health Impacts at the Maximum Exposed Individual Resident (MEIR) 1
Facility Receptor Individual Acute Chronic Type Dist. Cancer Risk Hazard Index Hazard Index (n=16) (meters) (per million)
2
Service Stn. D 150 0.7 <0.01 <0.01
Service Stn. E 800 0.01 to 0.02 <0.01 <0.01 3
Service Stn. L 230 0.2 to 0.3 <0.02 <0.01 3
Fleet G 400 0.5 <0.01 <0.01
Fleet H 800 0.01 <0.01 <0.013
Fleet I 300 2.2 to 3.2 <0.02 <0.023
Dealership M 15 17 <0.07 <0.09
Dealership N 400 0.07 <0.01 <0.014
Gen. Auto O 90 2.4 to 3.4 <0.1 <0.023
Gen. Auto Q 75 7.7 to 11 <0.2 <0.063
Gen. Auto R 45 15 to 22 <0.06 <0.23
Gen. Auto T 30 30 <0.07 <0.2
Gen. Auto U 90 4.1 to 6.0 <0.03 <0.033
Gen Auto V 6 >0.5 >0.02 >0.15
Brake Shop P 25 6.7 to 9.7 <0.04 <0.043
Brake Shop S 460 0.08 <0.01 <0.01 1. All numbers have been rounded. 2. The distance listed here is the estimated distance away from the outside edge of the building to the MEIR. 3. These facilities use a Perc-containing brake cleaner which shows a Perc content range from 65% to 94%
by weight on the Material Safety Data Sheet (MSDS); therefore, a range is presented for the potentialcancer risk.
4. This facility used a brake cleaner with a Perc content range of 1% to 100% by weight according to theMSDS. The potential cancer risk was estimated using 100% by weight Perc.
5. The MEIR is located closer than 20 meters to the center of the volume source, which is the minimum distance modeled; therefore, the potential health impacts are likely to be greater than those listed here. However, we do not anticipate that the potential health impacts will be significant. The impacts shownhere are at the near-source location of 20 meters.

14
The potential risk at the MEIW for the 16 brake service facilities is presented in Table IV-3. At two of these facilities, the potential cancer risk at the MEIW is greater than10 chances per million. At facility T (general automotive repair), the MEIW potential risk could be in excess of 22 chances per million because of the MEIW’s close proximity to facility T. At the general automotive repair facility R, the potential risk at the MEIW ranges from 10 to 15chances per million. The potential risk at the MEIW for other 14 facilities was estimated to be less than approximately 9 chances per million. The distance to the MEIW at these facilities wasestimated to range from 20 to 300 meters. Using guidance from OEHHA, the exposure period of an off-site worker was adjusted to allow for a shorter working lifetime and a shorter operatingschedule. This first adjustment is made to allow for a shorter working lifetime, 46 years, rather than a 70-year exposure lifetime which is assumed for residential exposure. The second adjustment is appropriate only when the operating schedule of the off-site facility does not coincide with, or is shorter than, that of the facility being assessed (OEHHA, 1997).
b. Summary of Non-cancer Impacts
From the site visits, the modeling results and hazard index estimates show that it is unlikely for significant acute or chronic non-cancer health effects to result from the emissions ofPerc from these facilities. For receptor distances greater than 20 to 30 meters from the center of the volume source (building), both the chronic and acute hazard indices are less than 0.6 at near-source, MEIR, and MEIW locations (see Tables IV-1, IV-2 and IV-3). Generally, hazardindices less than 1.0 are not considered to be a concern to public health.
4. What factors at the facility affect the outcome of the risk assessment?
Factors that affect the outcome of potential health impacts at a facility are:1) the consumption, including use and professional practices, of Perc-containing brake cleaners; 2) the Perc content of the brake cleaner (ranges from 1% to 100%); 3) the facility operatingschedule; and 4) the size and release characteristics of the facility. The combination of these factors will ultimately determine the potential impact. Due to the variability of these factors, thepotential health impact may either increase or decrease. However, if only the Perc content were toincrease, and all other factors were held constant, the resulting potential health impacts would alsoincrease.

15
Table IV-3. Summary of Potential Health Impacts at the Maximum Exposed Individual (Off-site) Worker (MEIW) 1
Facility Receptor Individual Acute Chronic Type Dist. Cancer Risk Hazard Index Hazard Index (n=16) (meters) (per million)
2
3
Service Stn. D 30 1.6 <0.04 <0.02
Service Stn. E 35 0.4 to 0.6 <0.09 <0.01 4
Service Stn. L 25 1.4 to 2.0 <0.3 <0.03 4
Fleet G 30 3.7 <0.02 <0.04
Fleet H 300 0.02 to 0.03 <0.01 <0.014
Fleet I 300 0.6 to 0.8 <0.02 <0.024
Dealership M 20 8.4 <0.06 <0.08
Dealership N 110 0.30 <0.01 <0.015
Gen. Auto O 20 5.0 to 7.3 <0.4 <0.074
Gen. Auto Q 60 5.3 to 7.7 <0.2 <0.074
Gen. Auto R 30 10 to 15 <0.08 <0.24
Gen. Auto T 5 >22 >0.2 >0.46
Gen. Auto U 65 2.5 to 3.6 <0.04 <0.054
Gen Auto V 20 0.23 <0.02 <0.01
Brake Shop P 30 2.3 to 3.3 <0.03 <0.044
Brake Shop S 40 1.2 <0.01 <0.02 1. All numbers have been rounded. 2. The distance listed here is the estimated distance from the outside edge of the building to the MEIW. 3. Where appropriate, the potential risk estimates are adjusted for a working lifetime of 46 years and to
allow for an operating schedule at an offsite facility that does not coincide with, or is shorter than, thatof the facility being assessed.
4. These facilities use a Perc-containing brake cleaner which shows a Perc content range from 65% to 94% by weight on the Material Safety Data Sheet (MSDS); therefore, a range is presented for the potential cancer risk.
5. This facility used a brake cleaner with a Perc content range of 1% to 100% by weight according to theMSDS. The potential cancer risk was estimated at a Perc content of 100% by weight.
6. The MEIW is located closer than 20 meters to the center of the volume source, which is the minimumdistance modeled; therefore, the potential health impacts are likely to be greater than those listed here. However, we do not anticipate the potential cancer risk will be greater than 51 chances per million dueto worker adjustments discussed in note 3, nor do we anticipate significant non-cancer hazard indices.The impacts shown here are at the near-source location of 20 meters.

16
V. RECOMMENDATIONS
Our findings to date indicate that about one third of the automotive brake cleaning products sold in California each year contain Perc. The Perc-containing products account for about four million pounds of Perc used in California. This represents a substantial increase overprevious studies and is significant relative to the total amount of Perc used in California. While itdoes not appear as if there has been a substantial increase in Perc use since November 1996, somemanufacturers have indicated to us that they do plan to reformulate some of their products to contain Perc; however, we do not have sufficient data to allow us to quantify this increase.
We found, based on screening level risk assessments, that some facilities using brakecleaning products that contain Perc may pose a significant carcinogenic health risk to the public. This is based on a significant risk level of 10 chances in a million that the districts use to requirefacilities to notify the public pursuant to the requirements of the AB 2588 “Hot Spots” program. The screening level risk assessments also indicated that it is unlikely for significant acute or chronic non-cancer health effects to result from the emissions of Perc from these facilities. However, these health risk assessments were based on visits to a limited number of facilities andmay not be representative of all brake cleaning operations. Note also that there are many facilitiesthat do not use Perc-containing brake cleaning products and therefore will not pose a risk to thepublic.
Based on these findings, we recommend that the Board direct us to continue ourinvestigation into the use of Perc in automotive brake cleaning products. The investigation willinclude the following actions:
1. Complete the “Brake Cleaner and Perc-Containing Automotive Products Survey.” As noted, we received only 22 of the 37 surveys sent to brake cleaning product
manufacturers. Consequently, we will continue our efforts to collect data from all of the manufacturers to ensure that we have as complete a database as possible.
2. Conduct a comprehensive survey of brake cleaning facilities in California. The survey will identify: 1) the number of automotive repair facilities that perform brake service operations; 2) the number of facilities currently using Perc-containing brake cleaning products; and 3) the amount of Perc used at individual brake service facilities. Additionally, the survey will identify source characteristics and other information necessary to determine both localized impacts and impact on statewide risk.
3. Assess the potential for increased Perc use due to product reformulation. We proposegathering additional information from the brake cleaner manufacturers and brake servicefacility operators regarding the number of products that are being reformulated because theproducts contain TCA or do not comply with the 50 percent VOC limit set by the Consumer Products Regulation. Note that the manufacturers will be submitting annual reports on Perc usage pursuant to the Consumer Products Regulation.

17
4. Investigate the cost and efficacy of potential alternatives to Perc-containing brakecleaning products. We propose working with the manufacturers, the brake service industry, and others to investigate the cost and efficacy of potential alternatives to brakecleaning products containing Perc. This would be a critical component of any proposedcontrol action.
5. Identify the most effective control options to address potential risk. Based on thefindings to date and the data collected as part of this investigation, there are likely to befacilities that may pose a significant health risk to the public. Consequently, it is important to begin assessing the most effective ways to reduce this risk. Initial options include developing an airborne toxic control measure to limit the amount of Perc in the products, or addressing individual facility risk through the AB 2588 “Hot Spots” program.
6. Develop appropriate educational materials for brake service facility operators toreduce potential risk. We propose to work with affected parties to develop and distribute to brake service facility operators an advisory on the use of Perc-containing brake cleaning products. The advisory will contain information about the potential health effects from the use of these products, the alternatives or substitute solvents that are available to reduce adverse health impacts, the cost impact to the facility operators, and other environmental benefits that can result from the use of alternatives or substitute solvents.
7. Continue the outreach program to ensure that there is adequate opportunity for public input into the investigation. We propose to continue an aggressive outreach
program to seek public input and ensure that we are obtaining the best data on which to base our recommendations and addressing significant concerns and issues.
The information that has been collected suggests that the development of an ATCM may be appropriate. Many of the actions listed above will allow staff to obtain the information needed if we develop an ATCM for Perc-containing brake cleaning products. However, we do not believe that we have sufficient information on available solvent alternatives, substitutes, andpotential health impacts. We expect to complete our investigation by early Spring 1998, and willhave sufficient information to determine if a statewide ATCM is warranted for Perc-containingbrake cleaning products. We will report back to the Board on our findings and recommendations at that time.

18
REFERENCES
ARB, 1991. Initial Statement of Reasons for Rulemaking - Staff Report/ExecutiveSummary, Proposed Identification of Perchloroethylene as a Toxic Air Contaminant,California Air Resources Board, August 1991.
ARB, 1993. Technical Support Document: Proposed Airborne Toxic Control MeasureAnd Proposed Environmental Training Program for Perchloroethylene Dry CleaningOperations, California Air Resources Board, August 1993.
ARB, 1996. Curriculum for the Environmental Training Program for PerchloroethyleneDry Cleaning Operations, California Air Resources Board, August 1996.
BAR, 1997. Telephone conversation with Rob Oglesby, California Department ofConsumer Affairs, Bureau of Automotive Repair, and Tina Najjar on March 13, 1997.
BOE, 1997a. Fax received March 5, 1997 from the Board of Equalization office inSacramento.
BOE, 1997b. Telephone conversation with Wun-Chi Wang, Board of Equalization, andMark Williams on March 5, 1997.
CAPCOA, 1993. CAPCOA Air Toxics “Hot Spots” Program - Revised 1992 RiskAssessment Guidelines, Toxics Committee of the California Air Pollution Control OfficerAssociation (CAPCOA), October 1993.
Norton, 1993. “Usage of Chemical Brake Cleaners in Automotive Repair Facilities”, John Norton, School of Business Administration, George Mason University, Fairfax, VA,November 8, 1993.
OEHHA, 1997. Telephone conversation with Melanie Marty, Manager, Air Risk Assessment Unit, Office of Environmental Health Hazard Assessment, and Greg Harris on May 1, 1997.
U.S. Economic Census, 1992. Government Information Sharing Project, InformationServices, Oregon State University, Internet Site: http://govinfo.kerr.orst.edu/, March 5, 1997.
U.S. EPA 1990 Database. United States Environmental Protection Agency (U.S. EPA)1990 Consumer and Commercial Products Database, collected pursuant to the 1990 Amendmentsto the Federal Clean Air Act.

19
U.S. EPA, 1995. SCREEN3 Model User’s Guide, EPA-454/B-95-004, United StatesEnvironmental Protection Agency (U.S. EPA), Research Triangle Park, North Carolina,September 1995.

Appendix A
Brake Cleaner and Perc-Containing Automotive Products Survey
A-1
INSTRUCTIONS FOR COMPLETING THEBRAKE CLEANER AND PERC-CONTAINING AUTOMOTIVE PRODUCTS SURVEY
GENERAL INSTRUCTIONS
Please type or print legibly in ink when filling out the survey form.Please review the instructions and the survey form prior to filling out the form.We suggest that you make extra copies of the form.If you have any questions on the survey or the information we have requested, pleasecontact Mark Williams of the Air Resources Board (ARB) staff at (916) 327-5633.In order to get accurate data from this survey, we would appreciate it if you would consult your actual sales records for determining California sales.In filling out the survey form if you encounter any questions which do not apply in yoursituation, please enter “N/A” in the appropriate blanks. If you wish to clarify the information supplied by your company or would like to makeadditional comments, please use Section V to enter your comments. In clarifying theinformation your company has supplied, please refer to the appropriate table, column, androw or product name.
SECTION I. COMPANY INFORMATION
Company Name: Enter the entire company name.
Division Name: If the respondent to the survey is representing a division of the company please enter the division name. If the respondent to the survey is representing several divisions being reported under onecompany, please enter the additional division names in Section IV:Other Information at the end of the survey.
Contact Person: Enter the name of the person to be contacted by the ARB if clarifications are needed.
Address: Enter the mailing address of the company or division responsible forcompleting the survey.
Manufacturer/Distributor:
Check the corresponding box to indicate whether you are amanufacturer or a distributor or both.
Phone/Fax Number: Enter the phone and fax numbers of the contact person.
ConfidentialInformation:
If you would like us to treat this information and data in a confidentialmanner, please check the box at the bottom of Section I.
E-mail Address: Enter the E-mail address of the contact person, if available.
A-2
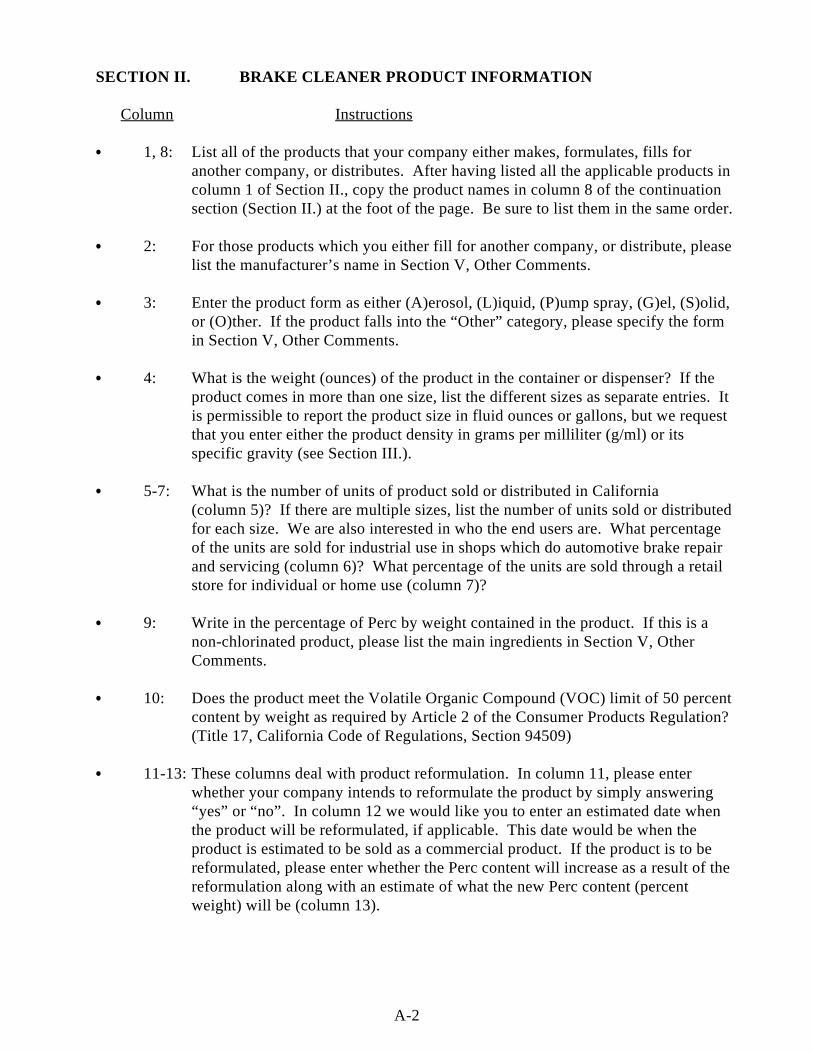
SECTION II. BRAKE CLEANER PRODUCT INFORMATION
Column Instructions
1, 8: List all of the products that your company either makes, formulates, fills foranother company, or distributes. After having listed all the applicable products incolumn 1 of Section II., copy the product names in column 8 of the continuationsection (Section II.) at the foot of the page. Be sure to list them in the same order.
2: For those products which you either fill for another company, or distribute, pleaselist the manufacturer’s name in Section V, Other Comments.
3: Enter the product form as either (A)erosol, (L)iquid, (P)ump spray, (G)el, (S)olid,or (O)ther. If the product falls into the “Other” category, please specify the formin Section V, Other Comments.
4: What is the weight (ounces) of the product in the container or dispenser? If theproduct comes in more than one size, list the different sizes as separate entries. Itis permissible to report the product size in fluid ounces or gallons, but we requestthat you enter either the product density in grams per milliliter (g/ml) or its specific gravity (see Section III.).
5-7: What is the number of units of product sold or distributed in California (column 5)? If there are multiple sizes, list the number of units sold or distributed for each size. We are also interested in who the end users are. What percentage of the units are sold for industrial use in shops which do automotive brake repair and servicing (column 6)? What percentage of the units are sold through a retail store for individual or home use (column 7)?
9: Write in the percentage of Perc by weight contained in the product. If this is anon-chlorinated product, please list the main ingredients in Section V, OtherComments.
10: Does the product meet the Volatile Organic Compound (VOC) limit of 50 percentcontent by weight as required by Article 2 of the Consumer Products Regulation?(Title 17, California Code of Regulations, Section 94509)
11-13: These columns deal with product reformulation. In column 11, please enterwhether your company intends to reformulate the product by simply answering“yes” or “no”. In column 12 we would like you to enter an estimated date whenthe product will be reformulated, if applicable. This date would be when theproduct is estimated to be sold as a commercial product. If the product is to bereformulated, please enter whether the Perc content will increase as a result of thereformulation along with an estimate of what the new Perc content (percentweight) will be (column 13).

A-3
SECTION III. LIQUID BRAKE CLEANERS
Column Instructions
1: Enter any products from Section II. which come in liquid form. These productswould be those where “L” is entered in column 3 of Section II.
2: What is the volume (fluid ounces or gallons) of the product in the container ordispenser? If the product comes in more than one size, list the different sizes asseparate entries. Please note that we are asking for the amount of productmeasured by volume, and not by weight as was requested in column 4 of Section II.
3: Please enter either the product density in grams per milliliter (g/ml) or its specificgravity.
4: After product purchase for industrial or home use, does the product need to bediluted prior to its use or application?
5,6: If the producted is diluted, what is the recommended amount of product (column 5) for the given amount of diluent (column 6) per the container instructions? Please specify whether the amounts are given in terms of volume or weight and the units.
7: If the product is diluted, what is the recommended diluent per the instructions?
SECTION IV. OTHER AUTOMOTIVE PRODUCTS CONTAINING PERC
Column Instructions
1: This column lists other products which could contain Perc.
2: Please answer “Yes” or “No” in the blank by each product category whether yourcompany manufactures, formulates, fills, or distributes that type of product. Forthose products which you either fill for another company, or distribute, please listthe manufacturer’s name in Section V, Other Comments.
3: If you answered yes in column 2 to any of the product categories, please answerwhether the product(s) contain Perc?
4-6: These columns deal with product reformulation. In column 4, please enter whether your company intends to reformulate the product by simply answering “yes” or “no”. In column 5 we would like you to enter an estimated date when the product will be reformulated, if applicable. This date would be when the product is estimated to be sold as a commercial product. If the product is to be
reformulated, please enter whether the Perc content will increase as a result of the reformulation along with an estimate of what the new Perc content (percent
weight) will be (column 6).

A-4
SECTION V. OTHER COMMENTS
If you wish to clarify the information you have supplied or make additional miscellaneous comments on the survey, please enter the comments in this box. In clarifying theinformation your company has supplied, please refer to the appropriate table, column and row orproduct name.

A-5Revised March 26, 1997 SSD/EAB/MDW
BRAKE CLEANER AND PERC-CONTAINING AUTOMOTIVE PRODUCTS SURVEY(Please use extra sheets if necessary)
SECTION I. COMPANY INFORMATION
COMPANY NAME ADDRESS
DIVISION NAME
CONTACT PERSON CITY STATE ZIP
MANUFACTURER? DISTRIBUTOR? PHONE ( ) FAX ( )
CHECK THE BOX IF THIS INFORMATION IS CONFIDENTIAL? E-MAIL ADDRESS
SECTION II. BRAKE CLEANER PRODUCT INFORMATION (Please see attached instructions)
COLUMN 1 2 3 4 5 6 7
PRODUCT NAME OWN FORM NET SIZE UNITS SOLD IN INSTITUTIONAL/ RETAIL/ PRODUCT (Weight in CALIFORNIA INDUSTRIAL HOUSEHOLD LINE? ounces) SALES (%) SALES (%)
SECTION II. BRAKE CLEANER PRODUCT INFORMATION (Continued)
COLUMN 8 9 10 11 12 13
PRODUCT NAME PERC MEETS WILL PRODUCT ESTIMATED WILL PERC CONTENT 50% VOC BE REFORMULATION CONTENT INCREASE (Weight LIMIT? REFORMULATED DATE WITH percent) REFORMULATION?

A-6Revised March 26, 1997 SSD/EAB/MDW
SECTION III. BRAKE CLEANER PRODUCT INFORMATION (For liquids only)
COLUMN 1 2 3 4 5 6 7
PRODUCT NAME NET SIZE DENSITY(g/ml)/ I S THE PRODUCT AMOUNT OF AMOUNT OF TYPE OF (Fluid oz. SPECIFIC DILUTED? PRODUCT DILUENT DILUENT or gallons) GRAVITY
SECTION IV. OTHER AUTOMOTIVE PRODUCTS CONTAINING PERC
COLUMN 1 2 3 4 5 6
PRODUCT DO YOU DOES IT CONTAIN WILL THE ESTIMATED WILL PERC CATEGORY MANUFACTURE A PERC? PRODUCT BE REFORMULATION CONTENT
PRODUCT IN THIS REFORMULATED? DATE INCREASE WITH CATEGORY? REFORMULATION?
Brake Anti-squeal compounds
Bug and tar removers
Carburetor and choke cleaners
Engine Degreasers
Lubricants (excluding engine oil)
Penetrants
Undercoatings
Upholstery fabric cleaners
SECTION V. OTHER COMMENTS
A-7Revised March 26, 1997 SSD/EAB/MDW
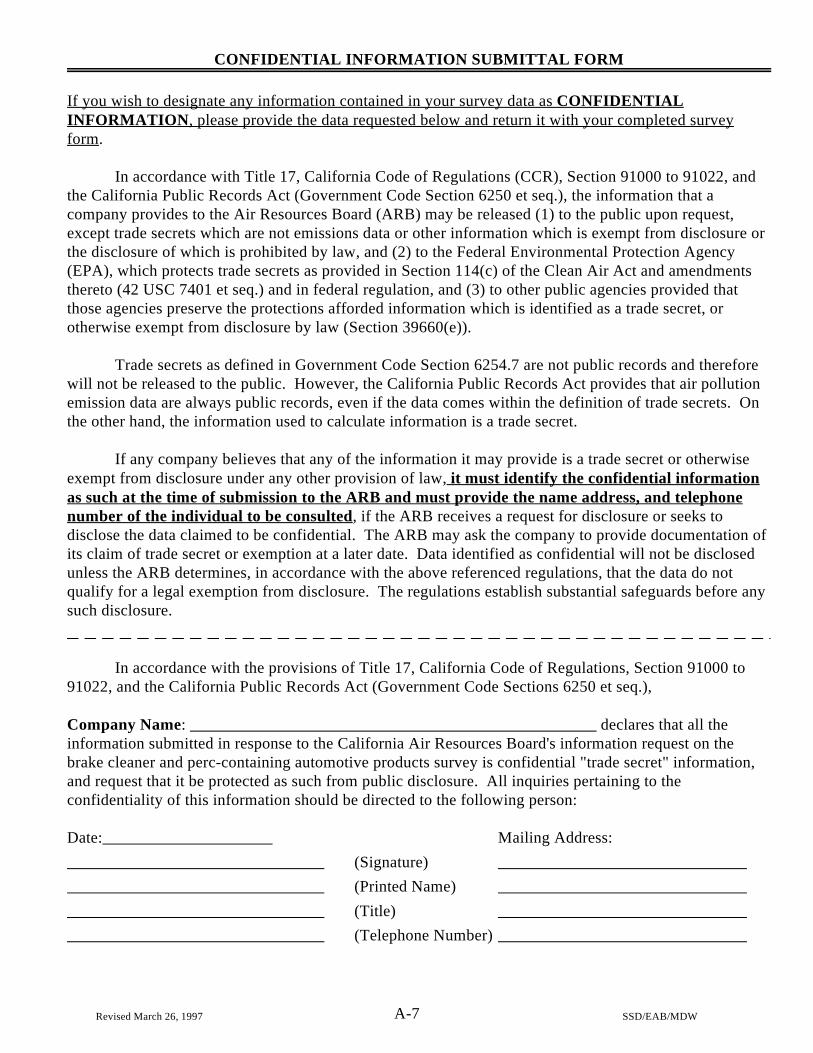
CONFIDENTIAL INFORMATION SUBMITTAL FORM
If you wish to designate any information contained in your survey data as CONFIDENTIALINFORMATION, please provide the data requested below and return it with your completed surveyform.
In accordance with Title 17, California Code of Regulations (CCR), Section 91000 to 91022, andthe California Public Records Act (Government Code Section 6250 et seq.), the information that acompany provides to the Air Resources Board (ARB) may be released (1) to the public upon request,except trade secrets which are not emissions data or other information which is exempt from disclosure orthe disclosure of which is prohibited by law, and (2) to the Federal Environmental Protection Agency(EPA), which protects trade secrets as provided in Section 114(c) of the Clean Air Act and amendmentsthereto (42 USC 7401 et seq.) and in federal regulation, and (3) to other public agencies provided thatthose agencies preserve the protections afforded information which is identified as a trade secret, orotherwise exempt from disclosure by law (Section 39660(e)).
Trade secrets as defined in Government Code Section 6254.7 are not public records and thereforewill not be released to the public. However, the California Public Records Act provides that air pollutionemission data are always public records, even if the data comes within the definition of trade secrets. Onthe other hand, the information used to calculate information is a trade secret.
If any company believes that any of the information it may provide is a trade secret or otherwiseexempt from disclosure under any other provision of law, it must identify the confidential informationas such at the time of submission to the ARB and must provide the name address, and telephonenumber of the individual to be consulted, if the ARB receives a request for disclosure or seeks todisclose the data claimed to be confidential. The ARB may ask the company to provide documentation ofits claim of trade secret or exemption at a later date. Data identified as confidential will not be disclosedunless the ARB determines, in accordance with the above referenced regulations, that the data do notqualify for a legal exemption from disclosure. The regulations establish substantial safeguards before anysuch disclosure.
In accordance with the provisions of Title 17, California Code of Regulations, Section 91000 to91022, and the California Public Records Act (Government Code Sections 6250 et seq.),
Company Name: declares that all theinformation submitted in response to the California Air Resources Board's information request on thebrake cleaner and perc-containing automotive products survey is confidential "trade secret" information,and request that it be protected as such from public disclosure. All inquiries pertaining to theconfidentiality of this information should be directed to the following person:
Date: Mailing Address: (Signature) (Printed Name) (Title) (Telephone Number)

Appendix B
Brake/Automotive Repair Shop Survey

B-1
BRAKE/AUTOMOTIVE REPAIR SHOP SURVEY
Date:
Facility:
Address:
Contact: Title:
Phone #: Regional Manager Phone #
SHOP DESCRIPTION
The approximate dimensions of the entire shop area, include units (m. or ft.). Interior dimensionsinclude storage and other areas not partitioned off as separate rooms. Exterior dimensions includeall connecting structures. (If attached to a strip mall or similar, include a sketch): Interior Height , Width , Length
Exterior Height , Width , Length
Type(s) of ventilation used:
Wall fan Ceiling or exhaust fan open doors other
Nominal Dimensions (include units)
Number and ave. size of servicing bays: L W
Number of normally open doors: H W
Number of normally open windows: H W
Number of normally open servicing bay doors: H W
Nearest offsite receptor distance (incl. units):Business Residential
Normal business operating schedule (e.g. M-F 7am-7pm, Sat-Sun 10am-4pm):
How many bays are used for brake services?

B-2
SHOP DESCRIPTION (continued)
Are ventilation practices different between mild and inclement weather? Explain:
OPERATION DESCRIPTION
Number of employees:
Average number of employees in service area each day:
Number of people performing brake services each day:
Number of automotive services performed per week:
Number of automobiles requiring brake work per week:
Number of axles serviced per week:
Types of brake services performed:
Comments:
PRODUCT INFORMATION
Number of different brake cleaning product(s) used:
Has the shop used any other type of brake cleaner? If so, what type of product was used? Whatwas the outcome? Is there a preference of the type of product used?
If an aqueous type product is used, please list shop’s reasons for using product (i.e. productcheaper, etc.) If an aqueous product is used, has drying time been a concern in the brake repairs? (Explain) Where are the brake parts cleaned?On the vehicle Off the vehicle On and off the vehicle
When the brake parts are cleaned with an aerosol, are the parts at:Floor level Eye level Bench level
If used, what is the approximate fate of all Perc usage (e.g. 50% air, 40% reclaimed for properdisposal, 9% sewer, 1% storm drain)

B-3
1.
PRODUCT INFORMATION (continued)
Ask for a unit of the product(s) used to inspect the label; copy the following information:
Product name:
Manufacturer:
Address: Phone #:
e-mail:
size: (fl oz., wt oz, gal.) Code date:
Product form: Aerosol Liquid Pump Spray Other
Active ingredients:
% Perc:
Usage (application) information:
Does the product require dilution (Y / N)
Dilute of product into of (amount product) (units) (amount diluent) (units)
Apply with (diluent used) (application equipment used, wipe, spray bottle, etc.)
Number of product units used per week by facility
Volume of diluted product used in a week
Is the product used for any other application other than brakes? If so what other applications is it
used for (i.e. general degreasing, etc.):
How often and how much of the product used for other purposes:
(give time frame and amount used)
Did you see a demonstration of the product in use?

B-4
2.
PRODUCT INFORMATION (continued)
Ask for a unit of the product(s) used to inspect the label; copy the following information:
Product name:
Manufacturer:
Address: Phone #:
e-mail:
size: (fl oz., wt oz, gal.) Code date:
Product form: Aerosol Liquid Pump Spray Other
Active ingredients:
% Perc:
Usage (application) information:
Does the product require dilution (Y / N)
Dilute of product into of (amount product) (units) (amount diluent) (units)
Apply with (diluent used) (application equipment used, wipe, spray bottle, etc.)
Number of product units used per week by facility
Volume of diluted product used in a week
Is the product used for any other application other than brakes? If so what other applications is it
used for (i.e. general degreasing, etc.):
How often and how much of the product used for other purposes:
(give time frame and amount used)
Did you see a demonstration of the product in use?
B-5
3.
PRODUCT INFORMATION (continued)
Ask for a unit of the product(s) used to inspect the label; copy the following information:
Product name:
Manufacturer:
Address: Phone #:
e-mail:
size: (fl oz., wt oz, gal.) Code date:
Product form: Aerosol Liquid Pump Spray Other
Active ingredients:
% Perc:
Usage (application) information:
Does the product require dilution (Y / N)
Dilute of product into of (amount product) (units) (amount diluent) (units)
Apply with (diluent used) (application equipment used, wipe, spray bottle, etc.)
Number of product units used per week by facility
Volume of diluted product used in a week
Is the product used for any other application other than brakes? If so what other applications is it
used for (i.e. general degreasing, etc.):
How often and how much of the product used for other purposes:
(give time frame and amount used)
Did you see a demonstration of the product in use?

B-6
General comments/observations:
Appendix C
Summary of the Different Types of Brake Service Facilities

C-1
Appendix C. Summary of the Different Types of Brake Service Facilities
Based on information from the California Board of Equalization, the California Department of Consumer Affairs’ Bureau of Automotive Repair, and the United States EconomicCensus, we have grouped brake service facilities into five general categories: service stations,fleets, car dealerships, brake shops, and general automotive repair facilities. Table C-1 lists thefive facility categories and summarizes the average number of vehicles serviced per week and theaverage number of brake services performed per week for each category based on the site visitdata.
Table C-1. Summary of Brake Service Facility Categories
Facility Category Description Average Number of Average Number of Vehicles Serviced Brake Services Per Week Per Week1 1
Service Stations Offer automotive repair services 57 3 where gasoline and other fuels can be purchased. These facilities repair mainly passenger and light- duty vehicles and operate service areas 40 to 60 hours per week.
Fleets Governmental agencies and 117 23 private companies operate fleets of vehicles ranging from passenger cars to heavy-duty trucks and buses. Fleet centers encompass a large area which limit how close offsite receptors can be located. These facilities operate 40 to 50 hours per week and may include shift schedules.
New and Used Car Many new and used car 334 40 Dealerships dealerships offer a complete range
of brake repair services in addition to other automotive repair services. Their services are not limited to customers who purchased a vehicle from them.
Brake shops Some shops limit their services to 120 20 brake service activities although additional repair services are often available.
General Automotive Includes independently-owned 79 10 Repair shops, franchises, chain shops, tire
replacement and repair shops, and passenger car and truck rental and leasing.
1. Numbers are based on survey data collected from ARB site visits and do not represent a generic facility.

Appendix D
Health Effects and Example Risk Assessment Calculations

D-1
Appendix D. Health Effects and Example Risk Assessment Calculations
This appendix is divided into four sections and covers the following topics:
a summary of the air dispersion modeling and potential health impacts at thefacilities that were modeled; an example calculation of a facility’s potential health impacts; a discussion of the SCREEN3 model; and tables presenting the modeling input parameters, modeling results, and potentialhealth impacts for each facility modeled.
The information presented is for the 16 facilities that staff visited and found usingPerc-containing brake cleaners. These 16 facilities are a subset of the 37 brake service facilitieswhere ARB staff has conducted site visits. The other 21 facilities were not assessed because theydid not use Perc-containing products. The ARB staff plan to visit additional facilities to obtain alarger sampling of facility source characteristics and usage practices.
A. Summary of the Air Dispersion Modeling and Potential Health Impacts
1. Air Dispersion Modeling
The ARB staff used the SCREEN3 air dispersion model, version 96043, to estimatepotential ground-level concentrations due to Perc emissions from the brake service facilities. The U.S. EPA recommends the SCREEN3 model for air dispersion modeling and it is currentlyused by the ARB, districts, and other states ( U.S. EPA, 1995). Each of the 16 facilities weremodeled as a volume source in simple urban terrain, using the operating schedule reported by thefacility operator.
The Perc emission releases from brake service operations are intermittent and quasi-puff-like when they leave the facility. The SCREEN3 model assumes a continuous release source onan hourly basis. Distributing the emissions over the operating schedule will provide similarresults to a puff-like air dispersion model. These results will be similar because the acuteconcentration averaging time is much longer than the release time (an hour as opposed toseconds) and the maximum concentration occurs in the near field (within hundreds of meters). The SCREEN3 model also has the advantage of being much easier to use. See section C of thisappendix for more information on the selection of the SCREEN3 model.
Default meteorological data, which is included in SCREEN3, was utilized to give aestimated maximum 1-hour concentration for determining potential acute non-cancer healthimpacts. SCREEN3 was also run a second time to provide an annualized maximum one hourconcentration which is used when determining potential chronic non-cancer impacts and cancerrisk. Default meteorological data are intended to represent worst-case meteorological conditions
D-2
and are commonly used in a screening level air dispersion analysis. A factor of 0.08 was used toconvert from an annualized maximum 1-hour concentration to an annual average concentration(U.S. EPA, 1992). In addition to the U.S. EPA conversion factor, the maximum annual averageconcentration is discounted by the operating schedule to allow for the hours the facility does notemit (see section B of this appendix).
Due to limitations in Gaussian-based models such as the SCREEN3 model, we selected aminimum receptor distance of 20 to 30 meters from the center of the volume source, which weassumed to be the center of the building. For the 16 facilities modeled, 20 to 30 meters from thecenter of the building corresponds to an approximate distance of 2 to 16 meters away from theoutside edge of the building.
The 16 facilities modeled include three fleet facilities, three service stations, two cardealerships, six general automotive facilities, and two brake shops. In summary, the Percconcentrations at two of the facilities may be in excess of the near-source concentrations becausethere are receptors at these facilities that are closer than the minimum modeled distance of 20 meters. However, we do not anticipate that the resulting potential health impacts will besignificantly different than they are at 20 meters. The Perc concentrations from the other 14 facilities are lower at the maximum exposed individual resident (MEIR) and the maximumexposed individual worker (MEIW) than near-source locations. A contributing factor to thisdecrease in concentrations is the increased distance between the edge of the building and thefacility fence line or actual residential or off-site worker locations. The modeling results indicatethat estimated concentrations can range from less than 2 meters to approximately 170 timeshigher near the edge of the building which is the location of maximum concentration (see Tables D-1, D-2, and D-3).
2. Potential Health Impacts
Table D-1 summarizes the maximum potential cancer and non-cancer health impacts. The maximum potential health impacts are estimated to occur at near-source locations. For these16 facilities, we selected a minimum receptor distance of 20 to 30 meters from the center of thevolume source or building to define a near-source location. The purpose of estimating thepotential health impacts at a near-source location is to illustrate what the potential health impactscan be if a receptor was located close to the facilities which were assessed, rather than having anincreased “buffer” distance between the receptor and the edge of the building. Tables D-2 andD-3 summarize the potential cancer and non-cancer health impacts at the MEIR and MEIW,respectively.
a. Summary of Carcinogenic Impacts at a Near-source Location
From a carcinogenic standpoint, the near-source risk assessment results for the 16 facilities range from approximately 0.3 to 51 chances in a million. The individual results arepresented in Table D-1. Eight of the facilities assessed have near-source potential cancer risks

D-3
that are greater than 10 chances per million. At fleet facility I, the potential near-source cancerrisk ranges from approximately 33 to 47 chances per million at 20 meters from the center of thevolume source (building). At dealership M, the potential near-source cancer risk isapproximately 19 chances per million. At the general automotive facilities O, Q, R, T, and U, the potential near-source cancer risk ranges from approximately 11 to 51 chances per million. Atbrake shop P, the near-source potential cancer risk ranges from approximately 8.8 to 13 chancesper million. At these facilities, the distances from the edge of the building to the near-sourcelocation range from approximately 9 to 15 meters (see Table D-1).
At the other eight facilities, the near-source potential cancer risks are all below 10 chances per million. Of these eight, the two remaining fleet facilities’ potential cancer riskranges from approximately 0.3 to 9 chances per million and the three service stations’ potentialcancer risk ranges from approximately 2 to 8 chances per million. Brake Shop S had a potentialcancer risk of approximately five chances per million. Dealership N had a potential cancer risk ofapproximately 4 chances per million and General Automotive Facility V had a potential cancer riskof less than one chance per million (see Table D-1). For these eight facilities, the potentialnear-source cancer risk impacts were estimated at 20 to 30 meters from the center of the volumesource.
b. Summary of Carcinogenic Impacts at the MEIR
The risk assessment results for the MEIR are presented in Table D-2. At four of thesefacilities, the potential cancer risk at the MEIR is greater than 10 chances per million. Atdealership M, where the MEIR is located approximately 15 meters away from the outside edge ofthe building, the potential cancer risk is approximately 17 chances per million. At the generalautomotive facilities Q, R, and T, the potential MEIR risk ranges from approximately 8 to 30 chances per million for receptors ranging from 30 to 75 meters away from the outside edge ofthe building.
At the other 12 facilities, the potential risk at the MEIR ranges from approximately 0.01 to 10 chances per million (see Table D-2). A contributing factor to this decrease in risk atthe MEIR is the increased “buffer” distance created by the facility fence line or the location of the nearest resident. The distance to the MEIR at these facilities was estimated to range from25 to 800 meters.
c. Summary of Carcinogenic Impacts at the MEIW
The potential risk at the MEIW for the 16 brake service facilities is presented inTable D-3. At two of these facilities, the potential cancer risk at the MEIW is greater than 10 chances per million. At facility T (general automotive), the MEIW potential risk could be inexcess of 22 chances per million because of the MEIW’s close proximity to the facility. At thegeneral automotive facility R, the potential risk at the MEIW ranges from 10 to 15 chances permillion. The potential risk at the MEIW for other 14 facilities was estimated to be less than

D-4
approximately 9 chances per million. The distance to the MEIW at these facilities was estimatedto range from 20 to 300 meters. Using guidance from OEHHA, the exposure period of an off-site worker was adjusted to allow for a shorter working lifetime and a shorter operatingschedule. This first adjustment is made to allow for a shorter working lifetime, 46 years, ratherthan a 70-year exposure lifetime which is assumed for residential exposure. The secondadjustment is appropriate only when the operating schedule of the off-site facility does notcoincide with, or is shorter than, that of the facility being assessed (OEHHA, 1997).
d. Summary of Non-cancer Impacts
From the site visits, the modeling results and hazard index estimates show that it isunlikely for significant acute or chronic non-cancer health effects to result from the emissions ofPerc from these facilities. For receptor distances greater than 20 to 30 meters from the center ofthe volume source (building), or greater than 2 to 16 meters away from the outside edge of thebuilding, both the chronic and acute hazard indices are less than 0.6 at the near-source, MEIR,and MEIW locations (see Tables D-1, D-2 and D-3). Generally, hazard indices less than 1.0 arenot considered to be a concern to public health.
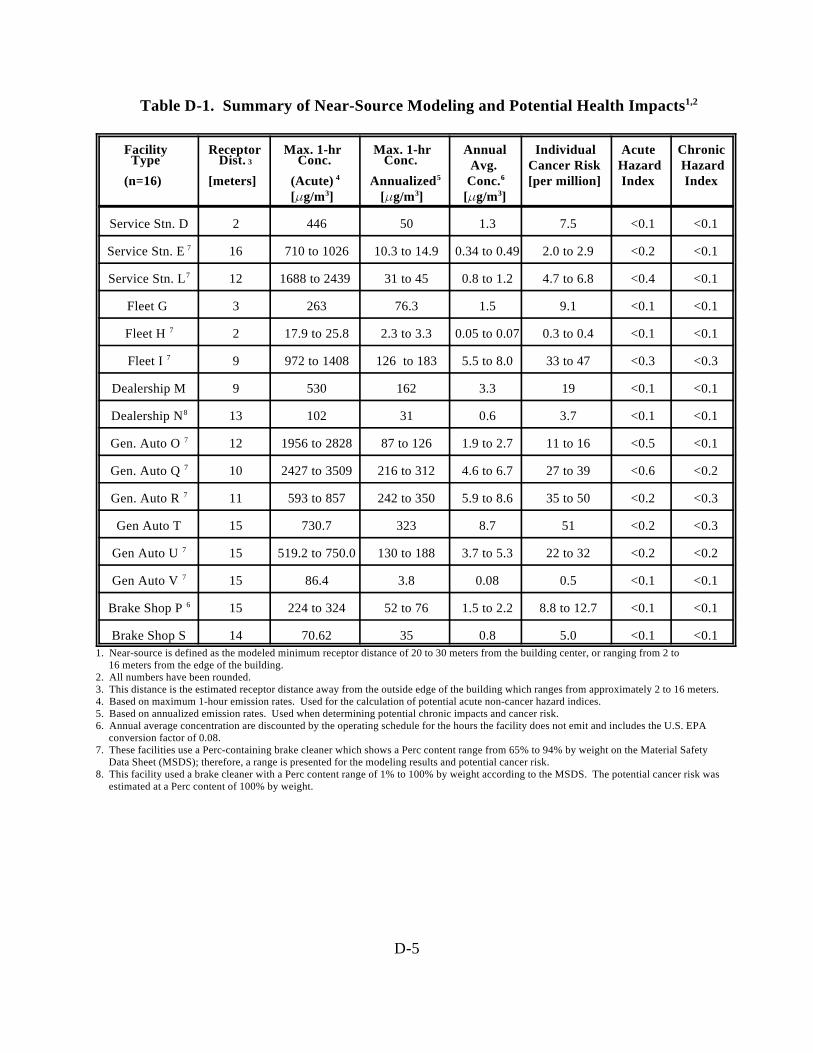
D-5
Table D-1. Summary of Near-Source Modeling and Potential Health Impacts1,2
Facility Receptor Max. 1-hr Max. 1-hr Annual Individual Acute Chronic Avg. Cancer Risk Hazard Hazard
(n=16) [meters] (Acute) Annualized Conc. [per million] Index Index
3
4
[ g/m ] [ g/m ] [ g/m ]3
5
3
Type Dist. Conc. Conc.6
3
Service Stn. D 2 446 50 1.3 7.5 <0.1 <0.1
Service Stn. E 16 710 to 1026 10.3 to 14.9 0.34 to 0.49 2.0 to 2.9 <0.2 <0.1 7
Service Stn. L 12 1688 to 2439 31 to 45 0.8 to 1.2 4.7 to 6.8 <0.4 <0.17
Fleet G 3 263 76.3 1.5 9.1 <0.1 <0.1
Fleet H 2 17.9 to 25.8 2.3 to 3.3 0.05 to 0.07 0.3 to 0.4 <0.1 <0.17
Fleet I 9 972 to 1408 126 to 183 5.5 to 8.0 33 to 47 <0.3 <0.37
Dealership M 9 530 162 3.3 19 <0.1 <0.1
Dealership N 13 102 31 0.6 3.7 <0.1 <0.18
Gen. Auto O 12 1956 to 2828 87 to 126 1.9 to 2.7 11 to 16 <0.5 <0.17
Gen. Auto Q 10 2427 to 3509 216 to 312 4.6 to 6.7 27 to 39 <0.6 <0.27
Gen. Auto R 11 593 to 857 242 to 350 5.9 to 8.6 35 to 50 <0.2 <0.37
Gen Auto T 15 730.7 323 8.7 51 <0.2 <0.3
Gen Auto U 15 519.2 to 750.0 130 to 188 3.7 to 5.3 22 to 32 <0.2 <0.27
Gen Auto V 15 86.4 3.8 0.08 0.5 <0.1 <0.17
Brake Shop P 15 224 to 324 52 to 76 1.5 to 2.2 8.8 to 12.7 <0.1 <0.16
Brake Shop S 14 70.62 35 0.8 5.0 <0.1 <0.11. Near-source is defined as the modeled minimum receptor distance of 20 to 30 meters from the building center, or ranging from 2 to 16 meters from the edge of the building.2. All numbers have been rounded.3. This distance is the estimated receptor distance away from the outside edge of the building which ranges from approximately 2 to 16 meters.4. Based on maximum 1-hour emission rates. Used for the calculation of potential acute non-cancer hazard indices.5. Based on annualized emission rates. Used when determining potential chronic impacts and cancer risk.6. Annual average concentration are discounted by the operating schedule for the hours the facility does not emit and includes the U.S. EPA conversion factor of 0.08.7. These facilities use a Perc-containing brake cleaner which shows a Perc content range from 65% to 94% by weight on the Material Safety Data Sheet (MSDS); therefore, a range is presented for the modeling results and potential cancer risk.8. This facility used a brake cleaner with a Perc content range of 1% to 100% by weight according to the MSDS. The potential cancer risk was estimated at a Perc content of 100% by weight.

D-6
Table D-2. Summary of Modeling and Potential Health Impacts at the Maximum Exposed Individual Resident (MEIR) 1
Facility Receptor Max. 1-hr Max. 1-hr Annual Individual Acute Chronic Avg. Cancer Risk Hazard Hazard
(n=16) [meters] (Acute) Annualized Conc. [per million] Index Index
2
3
[ g/m ] [ g/m ] [ g/m ]3
4
3
Type Dist. Conc. Conc.5
3
Service Stn. D 150 40.4 4.5 0.12 0.7 <0.01 <0.01
Service Stn. E 800 4.44 to 6.41 0.06 to 0.09 0.002 to 0.01 to 0.02 <0.01 <0.016
0.003
Service Stn. L 230 82.9 to 120 1.5 to 2.2 0.04 to 0.06 0.2 to 0.3 <0.02 <0.016
Fleet G 400 4.8 4.1 0.08 0.5 <0.01 <0.01
Fleet H 800 0.58 to 0.83 0.07 to 0.1 0.0016 to 0.01 <0.01 <0.016
0.002
Fleet I 300 65.3 to 94.6 8.5 to 12 0.37 to 0.54 2.2 to 3.2 <0.02 <0.026
Dealership M 15 457 140 2.8 16.6 <0.07 <0.09
Dealership N 400 2.01 0.6 0.01 0.07 <0.01 <0.017
Gen. Auto O 90 424 to 614 19 to 27 0.40 to 0.58 2.4 to 3.4 <0.1 <0.026
Gen. Auto Q 75 702 to 1015 62 to 90 1.3 to 1.9 7.9 to 11.4 <0.2 <0.066
Gen. Auto R 45 256 to 370 104 to 151 2.6 to 3.7 15 to 22 <0.06 <0.26
Gen Auto T 30 424 187 5.0 30 <0.07 <0.2
Gen Auto U 90 98.2 to 142 24 to 35 0.7 to 1.0 4.1 to 6.0 <0.08 <0.036
Gen Auto V 6 >86 >3.8 >0.08 >0.5 >0.02 >0.18
Brake Shop P 25 171 to 247 40 to 58 1.1 to 1.6 6.7 to 9.7 <0.04 <0.056
Brake Shop S 460 1.20 0.6 0.014 0.08 <0.01 <0.011. All numbers have been rounded.2. The distance listed here is the estimated distance away from the outside edge of the building to the MEIR.3. Based on maximum 1-hour emission rates. Used for the calculation of potential acute non-cancer hazard indices.4. Based on annualized emission rates. Used when determining potential chronic impacts and cancer risk.5. Annual average concentration are discounted by the operating schedule for the hours the facility does not emit and includes the U.S. EPA conversion factor of 0.08.6. These facilities use a Perc-containing brake cleaner which shows a Perc content range from 65% to 94% by weight on the Material Safety Data Sheet (MSDS); therefore, a range is presented for the modeling results and potential cancer risk.7. This facility used a brake cleaner with a Perc content range of 1% to 100% by weight according to the MSDS. The potential cancer risk was estimated at a Perc content of 100% by weight.8. The MEIR is located closer than 20 meters to the center of the volume source, which is the minimum distance modeled; therefore, the potential health impacts are likely to be greater than those listed here. However, we do not anticipate that the potential health impacts will be significant. The impacts shown here are at the near-source location of 20 meters.
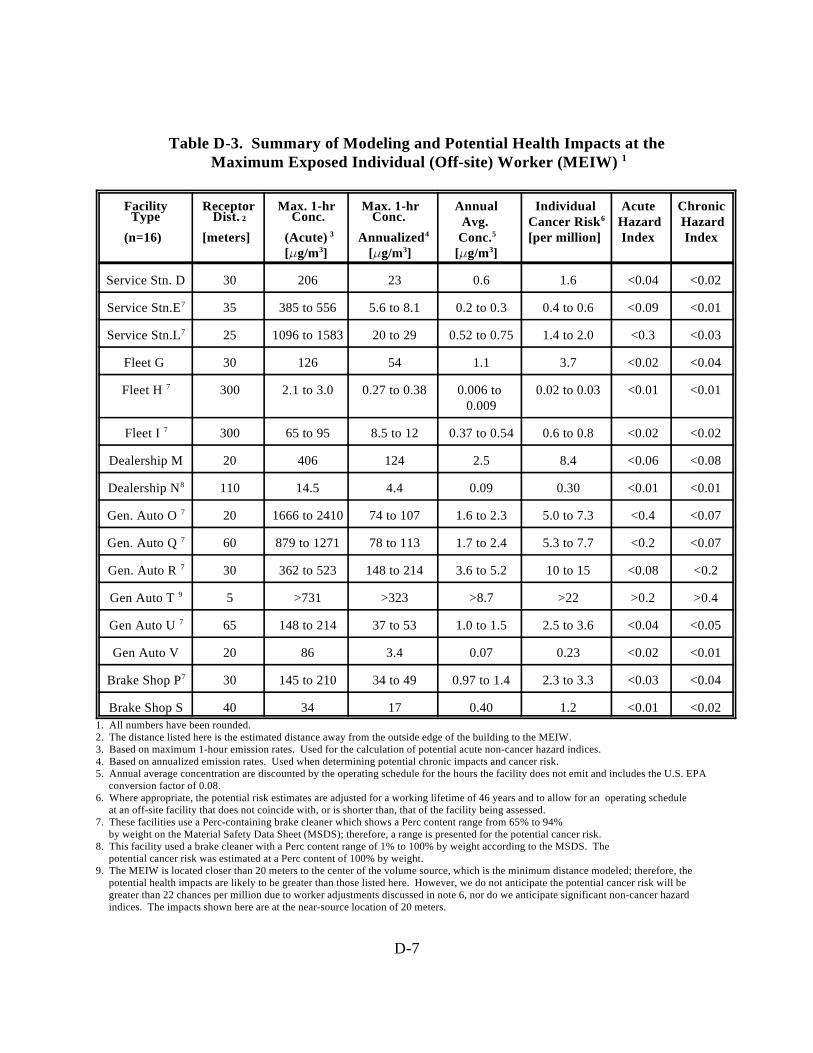
D-7
Table D-3. Summary of Modeling and Potential Health Impacts at the Maximum Exposed Individual (Off-site) Worker (MEIW) 1
Facility Receptor Max. 1-hr Max. 1-hr Annual Individual Acute Chronic Avg. Cancer Risk Hazard Hazard
(n=16) [meters] (Acute) Annualized Conc. [per million] Index Index
2
3
[ g/m ] [ g/m ] [ g/m ]3
4
3
Type Dist. Conc. Conc.5
3
6
Service Stn. D 30 206 23 0.6 1.6 <0.04 <0.02
Service Stn.E 35 385 to 556 5.6 to 8.1 0.2 to 0.3 0.4 to 0.6 <0.09 <0.017
Service Stn.L 25 1096 to 1583 20 to 29 0.52 to 0.75 1.4 to 2.0 <0.3 <0.037
Fleet G 30 126 54 1.1 3.7 <0.02 <0.04
Fleet H 300 2.1 to 3.0 0.27 to 0.38 0.006 to 0.02 to 0.03 <0.01 <0.017
0.009
Fleet I 300 65 to 95 8.5 to 12 0.37 to 0.54 0.6 to 0.8 <0.02 <0.027
Dealership M 20 406 124 2.5 8.4 <0.06 <0.08
Dealership N 110 14.5 4.4 0.09 0.30 <0.01 <0.018
Gen. Auto O 20 1666 to 2410 74 to 107 1.6 to 2.3 5.0 to 7.3 <0.4 <0.077
Gen. Auto Q 60 879 to 1271 78 to 113 1.7 to 2.4 5.3 to 7.7 <0.2 <0.077
Gen. Auto R 30 362 to 523 148 to 214 3.6 to 5.2 10 to 15 <0.08 <0.27
Gen Auto T 5 >731 >323 >8.7 >22 >0.2 >0.49
Gen Auto U 65 148 to 214 37 to 53 1.0 to 1.5 2.5 to 3.6 <0.04 <0.057
Gen Auto V 20 86 3.4 0.07 0.23 <0.02 <0.01
Brake Shop P 30 145 to 210 34 to 49 0.97 to 1.4 2.3 to 3.3 <0.03 <0.047
Brake Shop S 40 34 17 0.40 1.2 <0.01 <0.021. All numbers have been rounded.2. The distance listed here is the estimated distance away from the outside edge of the building to the MEIW.3. Based on maximum 1-hour emission rates. Used for the calculation of potential acute non-cancer hazard indices.4. Based on annualized emission rates. Used when determining potential chronic impacts and cancer risk. 5. Annual average concentration are discounted by the operating schedule for the hours the facility does not emit and includes the U.S. EPA conversion factor of 0.08.6. Where appropriate, the potential risk estimates are adjusted for a working lifetime of 46 years and to allow for an operating schedule at an off-site facility that does not coincide with, or is shorter than, that of the facility being assessed.7. These facilities use a Perc-containing brake cleaner which shows a Perc content range from 65% to 94% by weight on the Material Safety Data Sheet (MSDS); therefore, a range is presented for the potential cancer risk.8. This facility used a brake cleaner with a Perc content range of 1% to 100% by weight according to the MSDS. The potential cancer risk was estimated at a Perc content of 100% by weight.9. The MEIW is located closer than 20 meters to the center of the volume source, which is the minimum distance modeled; therefore, the potential health impacts are likely to be greater than those listed here. However, we do not anticipate the potential cancer risk will be greater than 22 chances per million due to worker adjustments discussed in note 6, nor do we anticipate significant non-cancer hazard indices. The impacts shown here are at the near-source location of 20 meters.

20ounces of
product percan
312 cansyear
28.35 gramsounce
25% PercContent 44,226 grams/year
D-8
B. Methodology for Estimating the Potential Health Impacts from Brake Service Facilities
1. Introduction
This section steps through an example calculation to illustrate the procedures that the ARB staff used to estimate the potential health impacts from Perc brake cleaning productemissions associated with brake service facilities. In order to estimate the impacts, staff collected product usage information, physical descriptions of the source, and emission releaseparameters from site visits. This information is used to estimate the facility’s Perc emission rateand to model the facility’s emission using the SCREEN3 air dispersion model. The modelingresults are then used to determine the potential health impacts.
ARB staff used the survey form in Appendix B to help collect information necessary tomodel each facility’s potential health risk. The more pertinent information collected includes thefacility’s building dimensions, distance to the nearest residential and business receptors, theoperating schedule of the service area, and information about the products and their use in brakecleaning. This example calculation uses data collected from one of the site visits to betterillustrate the methodology.
2. The Calculation
The calculation begins with the determination of the facility’s Perc usage and Percemission rate, steps through the modeling inputs, and concludes with the calculation of potentialhealth impacts. For our example, we have selected a minimum receptor distance of 25 metersfrom the center of the volume source (the building) to define a near-source location. For ease ofillustration, we assume that both the maximum exposed individual resident (MEIR) and themaximum exposed individual worker (MEIW) occur at this location.
a. Determining a Facility’s Perc Usage
In order to determine a facility’s Perc usage, the following information is needed: theweight percent of Perc in the brake cleaning product, the approximate number of product unitsused per week, and the weight of the product unit itself. Our example facility was using20 ounce cans of aerosol product with a 25 percent Perc content by weight and they reportedusing an average of 312 cans of product each year. The weight percent is obtained either directlyfrom the product label or from the material safety data sheet (MSDS) for the product. The Percusage in terms of grams per year is given by Equation 1.
(1)

Emission Rate(Acute)
44,226 gramsyear
year312 jobs
1 jobhour
1 hour3600 secs
0.0394 grams/sec
Emission Rate(Annualized)
44,226 gramsyear
year2808 hours
1 hour3600 secs
0.0044 grams/sec
D-9
b. Determining the Perc Emission Rate
With the Perc usage calculated, we now estimate the acute and annualized emission ratesin terms of grams per second. These conversions are necessary because they are required inputparameters for the SCREEN3 model. The acute emission rate is determined by calculating theemissions from the number of brake jobs that are performed each hour by the facility. Based oninformation collected from the site visits, the facilities visited did not perform more than onebrake service (job) in any given hour (usually limited by available manpower, tools, andequipment). Our example facility reported that they performed approximately 312 brake servicesper year (6 services per week). Using this information, Equation 2 calculates the acute emissionrate.
(2)
The annualized Perc emission rate is determined by dividing the Perc usage calculated byEquation 1 by the facility’s reported operating schedule. Our example facility reported that theirservice area operated 2808 hours per year. Using this information, Equation 3 gives theannualized emission rate uniformly distributed over the operating schedule.
(3)
c. Running the SCREEN3 air dispersion model
Now that we know the facility’s acute and annualized Perc emission rates, physicaldescriptions of the source, and emission release parameters, we can run the SCREEN3 airdispersion model. Table D-4 summarizes the modeling input parameters for this example. Forthe brake service facilities, we assumed that the single-story source release height is one-half ofthe building height. The initial lateral dimension of volume is assumed to be the shortest side ofthe building exterior divided by the factor 4.3 and the initial vertical dimension of volume isassumed to be the exterior building height divided by the factor 2.15 (U.S. EPA, 1995). Theseparticular dimension assumptions were selected to represent a modeling scenario that can begenerally applied to various sized (e.g. rectangular) brake service facilities. Our example facilityis located in an urban area (as well as all of the facilities visited) and is approximately 23 metersfrom the center to the edge of the building.

Max Ann. Avg.Concentration
Maximum 1 hrConcentration(annualized)
OperatingSchedule
[hours/year]
year8760 hours
0.08
D-10
Table D-4. Modeling Input Parameters for Example Facility
Perc Emission Rate (acute) [grams/s] 0.0394
Perc Emission Rate (annualized) [grams/s] 0.0044
Receptor Height [meters] 01
Source Release Height [meters] 2.2862
Initial Lateral Dimension of Volume (σ ) [meters]yo3 3.246
Initial Vertical Dimension of Volume (σ ) [meters]zo4 2.127
Meteorology Option Full
Land Type [Urban or Rural] Urban
Receptor Distance (from center of source) 25
Operating Schedule [hrs/yr] 28081. Selected by convention as a ground-level receptor.2. One-half of building height (15 feet, 4.57 meters)3. Exterior building width (45.8 feet, 13.96 meters) divided by factor 4.3 per SCREEN3 User’s Guide4. Exterior building height (15 feet, 4.57 meters) divided by factor 2.15 per SCREEN3 User’s Guide
The SCREEN3 model uses these inputs to estimate the downwind, ground-level,maximum 1-hour concentrations for designated distances from the center of the volume source. The estimated acute maximum 1-hour concentration at 25 meters from the center of the facility is 446.1 µg/m and the estimated annualized (chronic) 1-hour concentration is 49.84 µg/m . It3 3
should be noted that the SCREEN3 model must be run twice; once using the acute emission rateand once using the annualized emission rate. A summary of the output from the SCREEN3model is shown in Section D of this Appendix (Facility Modeling Results). For more information on the SCREEN3 model, please refer to the SCREEN3 model user’s guide(U.S. EPA, 1995).
Since potential cancer risks and non-cancer chronic health impacts require an assessmentof the annual average concentration of Perc, the U.S. EPA conversion factor of 0.08(U.S. EPA, 1992) is used to estimate the maximum annual average concentration from theannualized maximum 1-hour concentration. In addition, the maximum annual averageconcentration is discounted by the operating schedule for the hours the facility does not emit. The maximum annual average concentration is calculated by using Equation 4.
(4)

Max Ann. Avg.Concentration 49.84 µg
m 32808 hours
year1 year
8760 hours0.08 1.278 µg/m 3
Cancer Risk(Resident)
Max. Ann. Avg.Concentration URF 106
million
Cancer Risk(Resident) 1.278 µg
m 35.9 x 10 6 m 3
µg106
million7.5 chances per million
D-11
Substituting in the example data, Equation 5 is used to give the maximum annual averageconcentration of 1.278 µg/m .3
(5)
d. Calculation of Potential Cancer Risk and Non-Cancer Acute and Chronic Hazard Indices
With the modeling complete, we can combine the modeling output with the unit riskfactor (cancer effects) or the reference exposure level (non-cancer effects) to determine thepotential cancer risk and corresponding acute and chronic hazard indices. The risk assessmentsare conducted using guidance from the California Air Pollution Control Officers Association(CAPCOA) Revised 1992 Air Toxic "Hot Spots" Program Risk Assessment Guidelines(CAPCOA, 1993). For this example, we calculated the potential cancer and non-cancer healthimpacts at a near-source location of 25 meters from the center of the volume source (two metersaway from the edge of the building). We also assumed that a MEIR (resident) and a MEIW(worker) are exposed to the same concentration. The inhalation unit risk factor (URF) for Perc is5.9 x 10 ( g/m ) ; the acute non-cancer reference exposure level (REL) is 6.8 x 10 g/m and-6 3 -1 3 3
the chronic REL is 35 g/m (CAPCOA, 1993). Equation 6 shows the basic algorithm for3
determining the potential cancer risk, in chances per million, for a residential location (MEIR).
(6)
The factor 10 /million is used to convert the result into the standard reporting unit, chances per6
million. Substituting in the maximum annual average concentration from Equation 5 and thePerc URF, Equation 7 gives us the potential cancer risk for a residential receptor 25 meters awayfrom the center of the building.
(7)
Equation 8 gives the formula for calculating the potential risk for an off-site worker. Usingguidance from OEHHA, the exposure period of an off-site worker is adjusted to allow for ashorter working lifetime and a shorter operating schedule. This first adjustment is made to allowfor a shorter working lifetime, 46 years, rather than a 70-year exposure lifetime which is assumedfor residential exposure. The second adjustment is appropriate only when the offsite worksite

Cancer Risk(Worker)
Max Ann. Avg.Concentration URF
Offsite Worker CoincidentOperating Schedule [hr/yr]
Facility OperatingSchedule [hr/yr]
46 yearWorking Lifetime
70 yearResidential Lifetime
106
million
Cancer Risk(Worker) 1.278 µg
m 35.9x10 6 m 3
µg1920 hrs/yr2808 hrs/yr
4670
yearsyears
106
million3.4 chances
per million
AcuteHazardIndex
Maximum 1 hr.Concentration
(Acute)AcuteREL
ChronicHazardIndex
Max. Ann. Avg.Concentration
ChronicREL
AcuteHazardIndex
446.1 µgm 3
6800 µgm 3
0.066ChronicHazardIndex
1.278 µgm 3
35 µgm 3
0.037
D-12
(11)
(13)
schedule does not coincide with or is shorter than that of the facility being assessed(OEHHA, 1997). It is assumed that a nearby worker would be exposed 8 hours a day, 240 days ayear (1920 hours/year) for 46 years (CAPCOA, 1993).
(8)
Substituting in the maximum annual average concentration from Equation 5, the URF, and theoperating schedule (2808 hours per year, for this example), Equation 9 gives the risk for anoffsite worker.
(9)
Equations 10 and 11 give the formulas for calculating the non-cancer acute and chronic hazardindices, respectively. The acute hazard index is determined by taking the acute maximum 1-hourconcentration (acute exposure) and dividing by the acute REL of 6800 µg/m . Similarly, the 3
(10)
chronic hazard index is determined by taking the maximum annual average concentration(chronic exposure) and dividing by the chronic REL of 35 µg/m . Finally, Equations 12 and 133
solve for the acute and chronic hazard indices, respectively.
(12)

D-13
Table D-5 summarizes the results that have been calculated in this example. A summary ofresults from the modeling performed on each of the facilities visited is presented in Section D ofthis appendix.
Table D-5. Summary of Results from Example Calculation
Parameter Result Reference
Perc Emission Rate (acute), [grams/s] 0.0394 Equation 2
Perc Emission Rate (annualized) [grams/s] 0.0044 Equation 3
Maximum 1-hr Concentration (acute), [ g/m ] 446.1 SCREEN3 Model Output3
Maximum 1-hr Concentration (annualized), [ g/m ] 49.84 SCREEN3 Model Output3
Maximum Annual Average Concentration, [ g/m ] 1.278 Equation 53
Cancer Risk (Resident) [chances per million] 7.5 Equation 7
Cancer Risk (Worker) [chances per million] 3.5 Equation 9
Non-Cancer Acute Hazard Index 0.066 Equation 12
Non-Cancer Chronic Hazard Index 0.037 Equation 13
C. Selection of the SCREEN3 Model
A sensitivity study is conducted to show that the emissions from the brake service facility may be modeled by two different methods to estimate the acute and chronic hazardindices and the cancer risk. The first method assumes the emissions are uniformly distributedover the operating schedule and the SCREEN3 air dispersion model is used. The second method assumes the emissions are released as intermittent puffs and the EPA-INPUFF (INPUFF) model is used. The sensitivity study shows that both modeling approaches result insimilar concentrations. The SCREEN3 air dispersion model is selected for further work because it is easiest to use. Table D-6 summarizes the source characteristics.

533 gramscar
23 carsweek
week5 workdays
workday18.5 hrs
hr3600 sec
0.0368 grams/sec
D-14
Table D-6. Source Characteristics for SCREEN3-INPUFF Comparison
Parameter Value
Building Height 9.45 m ( = 4.395 m)zo
Building Width 22.35 m ( = 5.196 m)yo
Source Release Height 4.72 m
Meteorology Option Full
Land Type [Urban or Rural] Urban
Operating Schedule M-F 6:30 am to 1 am (18.5 hours per day)
Number of Brake Services 23 cars per week (4.6 cars per day)
Product Usage Per Brake Service 1 20-oz can of product per brake service (533 grams Perc per brake service at 94% Perc)
Application Information 1 minute of spraying per wheel (2.22 grams/sec for 60 seconds at each wheel)
It is assumed that brake cleaning is uniformly distributed over 20 minutes. That is, every 5 minutes the brakes from one wheel are cleaned for one minute. In addition, no more thanone brake job is completed per hour.
It is also assumed the emissions can be characterized as a volume source due to the nature of the mechanical mixing within the garage and the downwash and cavity effects thatoccur on the lee side of the building. For the SCREEN3 input data, a volume source is assumed with the above dimensions. The maximum 1-hour emission rate (needed for the acutehazard index) is the emission from one brake job, 0.148 grams/sec (533 grams/3600 sec). For the annual average analysis, Equation 14 gives the annualized emission rate of 0.0368 grams/sec.
(14)
For the INPUFF input, the source characteristics are the same as those for SCREEN3. However the emission rate for INPUFF is higher for shorter durations, 2.22 grams/sec for60 seconds. The INPUFF model can disperse the downwind emissions via a distance dependent dispersion curve or a time dependent dispersion curve. The INPUFF modelrecommends the time dependent dispersion curves for near field receptors, as is the case for the maximum receptor concentration at brake facilities. For this sensitivity analysis, bothdispersion options are used.

720 µgm 3
0.0368 g/sec0.148 g/sec
18.5 hrs/workday24 hrs/day
260 days/workyr365 days/yr
0.08 7.9 µgm 3
D-15
The SCREEN3 dispersion model determined that the maximum short term ground levelconcentration from this facility is for a wind speed of 1 meter per second and a Pasquill Gifford Stability Class of 5. As such, this is the input for the INPUFF model too.
To determine the maximum annual average concentration from SCREEN3, the maximum 1-hour concentration is multiplied by the EPA scaling factor of 0.08 and then prorated for the hours the facility does not emit, since the EPA scaling factor assumes constantsteady state emissions. A similar procedure is used for the INPUFF results. INPUFF calculates both the 1-minute average concentration as well as the 1-hour average concentration. The table below summarizes the results of this analysis at receptor distances of 25, 100, and 200 meters.
Table D-7. Maximum Perchloroethylene Above Ambient Air Concentration at Various Receptor Distances, Averaging Times, and Modeling Approaches
Receptor 25 m 100 m 200 m Distance
Avg Time 1-Min 1-Hr Ann 1-Min 1-Hr Ann 1-Min 1-Hr Ann
Max. Max. Max. Max. Max. Max. Max. Max. Max. Conc. Conc. Conc. Conc. Conc. Conc. Conc. Conc. Conc.
[µg/m ] [µg/m ] [µg/m ] [µg/m ] [µg/m ] [µg/m ] [µg/m ] [µg/m ] [µg/m ]3 3 3 3 3 3 3 3 3
SCREEN3 N/E 720 7.9 N/E 240 2.6 N/E 100 1.11 1 1
INPUFF 8000 920 10 4300 490 5.4 2400 270 3.0 Distance
INPUFF 3600 450 4.9 1400 170 1.9 750 92 1.0 Time1. N/E: not estimated
Equation 15 shows how the annual average concentration is determined from themaximum 1-hour concentration at 25 meters from the SCREEN3 output.
(15)

450 µgm 3
4.6 hrs/workday24 hrs/day
260 days/workyr365 days/yr
0.08 4.9 µgm 3
D-16
Equation 16 shows how the annual average concentration is determined from themaximum 1-hour concentration at 25 meters from the INPUFF model output.
(16)
The results shown in the above table show that the results from the SCREEN3 modeling analysis is greater than the INPUFF results using the recommended time dependentdispersion curve for near field receptors and is less than the INPUFF results using the distancedependent dispersion curve. Based on this sensitivity analysis, the results from SCREEN3 arecomparable to results from INPUFF for near field receptors to estimate 1-hour and long termimpacts. Therefore, SCREEN3 is a simplified and viable alternative to evaluate the near fieldimpacts from emissions from the brake service facilities.

D-17
D. Facility Modeling Results
This section of Appendix D summarizes the results from our modeling of the 16 facilitiesthat used Perc-containing brake cleaning products. Tables D-8 thru D-10 present the modelinginput parameters for each modeled facility and tables D-11 thru D-13 summarize the modelingresults.
Table D-8. Modeling Input Parameters for Facilities D, E G, H, and I
Parameter Value
Facility D Facility E Facility G Facility H Facility I1
Source Type Volume Volume Volume Volume Volume
Facility Type Service Station Service Station Fleet Fleet Fleet
Perc Emission Rate [grams/s] 0.0044 0.0071 to 0.01853 0.00095 to 0.0236 to 0.00102 0.00137 0.03422 2 2
Receptor Height [m] 0 0 0 0 0
Source Release Height [m] 2.286 2.896 1.829 3.658 4.572 4.724
Initial Lateral Dimension of 3.246 1.949 2.761 10.071 12.995 5.196 Volume [m]
Initial Vertical Dimension of 2.127 2.694 1.701 2.127 4.253 4.395 Volume [m]
Meteorology Option Full Full Full Full Full
Land Type (Urban or Rural) Urban Urban Urban Urban Urban
Operating Schedule [hrs/wk] 54 69 42.5 47.5 92.51. Due to the relationship between the exterior building dimensions to the location of the actual service area, two SCREEN3 runs were completed. The data in the left-hand column is used to calculate the non-cancer acute hazard index and the data in the right-hand column is used to calculate overall cancer risk and chronic non-cancer hazard index.2. These facilities use a Perc-containing brake cleaning product which shows a Perc content range from 65% to 94% by weight on the Material Safety Data Sheet; therefore a range is presented for the Perc emission rate.

D-18
Table D-9. Modeling Input Parameters for Facilities L, M, N, O, and P
Parameter Value
Facility L Facility M Facility N Facility O Facility P
Source Type Volume Volume Volume Volume Volume
Facility Type Service Station Car Dealership Car Dealership Gen Auto Brake Shops
Emission Rate [grams/s] 0.0025 to 0.0185 0.00231 0.00865 to 0.00425 to 0.0036 0.01251 0.006141 1 1
Receptor Height [m] 0 0 0 0 0
Source Release Height [m] 2.286 2.591 2.286 3.048 3.048
Initial Lateral Dimension of 3.573 5.316 3.190 3.544 2.481 Volume [m]
Initial Vertical Dimension of 2.127 2.410 2.127 2.835 2.835 Volume [m]
Meteorology Option Full Full Full Full Full
Land Type (Urban or Rural) Urban Urban Urban Urban Urban
Operating Schedule [hrs/wk] 54 42.5 42.5 45 601. These facilities use a Perc-containing brake cleaning product which shows a Perc content range from 65% to 94% by weight on the Material Safety Data Sheet; therefore a range is presented for the Perc emission rate.

D-19
Table D-10. Modeling Input Parameters for Facilities Q, R, S, T, U and V
Parameter Value
Facility Q Facility R Facility S Facility T Facility U Facility V
Source Type Volume Volume Volume Volume Volume Volume
Facility Type Gen Auto Gen Auto Brake Shops Gen Auto Gen Auto Brake Shops
Emission Rate [grams/s] 0.0260 to 0.0227 to 0.0028 0.0166 0.0097 to 0.000230.0375 0.0328 0.01411 1 1
Receptor Height [m] 0 0 0 0 0 0
Source Release Height [m] 3.048 2.438 2.743 1.829 3.048 2.286
Initial Lateral Dimension of 4.749 4.253 2.835 2.127 2.127 2.127 Volume [m]
Initial Vertical Dimension of 2.835 2.268 2.552 1.701 2.835 2.127 Volume [m]
Meteorology Option Full Full Full Full Full Full
Land Type (Urban or Rural) Urban Urban Urban Urban Urban Urban
Operating Schedule [hrs/wk] 45 51.5 50 56.5 60 451. These facilities use a Perc-containing brake cleaning product which shows a Perc content range from 65% to 94% by weight on the Material Safety Data Sheet; therefore a range is presented for the Perc emission rate.

D-20
Table D-11. Summary of Modeling Results for Facilities D, E, G, H, and I
FACILITY RECEPTOR Receptor Distance Maximum Maximum Maximum Potential Cancer Risk Hazard IndexTYPE [meters] 1-hour Conc. 1-hour Conc. Annual Avg. [chances per million]
(acute) (annualized) Conc.[µµg/m ] [µµg/m ] [µµg/m ]3 3 3Center Env. Resident Worker Acute Chronic1 2
D Near-Source 25 2 446.1 49.84 1.2781 7.54 3.39 0.0656 0.0365
MEIW 55 32 206.2 23.04 0.5908 3.49 1.57 0.0303 0.0169
MEIR 175 152 40.36 4.509 0.1156 0.68 0.31 0.0059 0.0033
E3 Near-Source 20 16 710.0 to 1026 10.29 to 14.87 0.3372 to 0.4872 1.99 to 2.87 0.70 to 1.01 0.1044 to 0.1509 0.0096 to 0.0139
MEIW 40 36 384.9 to 556.2 5.578 to 8.061 0.1828 to 0.2641 1.08 to 1.56 0.38 to 0.55 0.0566 to 0.0818 0.0052 to 0.0075
MEIR 805 801 4.44 to 6.41 0.0642 to 0.0929 0.0021 to 0.0030 0.01 to 0.02 0.00 to 0.01 0.0007 to 0.0009 0.0001 to 0.0001
G Near-Source 25 3 263 76.32 1.54 9.09 5.19 0.0387 0.0440
MEIW 50 28 125.6 54.16 1.09 6.45 3.68 0.0185 0.0312
MEIR 420 398 4.76 4.109 0.08 0.49 0.28 0.0007 0.0024
H3 Near-Source 30 2 17.89 to 25.81 2.265 to 3.267 0.0511 to 0.0737 0.30 to 0.43 0.15 to 0.22 0.0026 to 0.0038 0.0015 to 0.0021
MEIW 330 302 2.10 to 3.02 0.2652 to 0.3825 0.0060 to 0.0086 0.04 to 0.05 0.02 to 0.03 0.0003 to 0.0004 0.0002 to 0.0002
MEIR 830 802 0.58 to 0.83 0.0728 to 0.105 0.0016 to 0.0024 0.01 to 0.01 0.00 to 0.01 0.0001 to 0.0001 0.0000 to 0.0001
I3 Near-Source 20 9 971.7 to 1408 126.2 to 182.8 5.5436 to 8.0298 32.71 to 47.38 8.58 to 12.43 0.1429 to 0.2070 0.1584 to 0.2294
MEIW 310 299 65.30 to 94.63 8.481 to 12.29 0.3725 to 0.5399 2.20 to 3.19 0.58 to 0.84 0.0096 to 0.0139 0.0106 to 0.0154
MEIR 310 299 65.30 to 94.63 8.481 to 12.29 0.3725 to 0.5399 2.20 to 3.19 0.58 to 0.84 0.0096 to 0.0139 0.0106 to 0.01541. Distance to receptor measured from the center of the volume source.2. Distance to receptor measured from the building exterior (envelope).3. These facilities use a Perc-containing brake cleaner which shows a Perc content range from 65% to 94% by weight on the Material Safety Data Sheet; therefore, a range is presented for the results.

D-21
Table D-12. Summary of Modeling Results for Facilities L, M, N, O, and P
FACILITY RECEPTOR Receptor Distance Maximum Maximum Maximum Potential Cancer Risk Hazard IndexTYPE [meters] 1-hour Conc. 1-hour Conc. Annual Avg. [chances per million]
(acute) (annualized) Concentration[µµg/m ] [µµg/m ] [µµg/m ]3 3 3Center Env. Resident Worker Acute Chronic1 2
L3 Near-Source 20 12 1689 to 2439 31.27 to 45.16 0.8019 to 1.1581 4.73 to 6.83 2.13 to 3.07 0.2483 to 0.3586 0.0229 to 0.0331
MEIW 35 27 1096 to 1583 20.3 to 29.31 0.5206 to 0.7516 3.07 to 4.43 1.38 to 1.99 0.1612 to 0.2328 0.0149 to 0.0215
MEIR 240 232 82.89 to 119.7 1.535 to 2.216 0.0394 to 0.0568 0.23 to 0.34 0.10 to 0.15 0.0122 to 0.0176 0.0011 to 0.0016
M Near-Source 20 9 529.7 162 3.2696 19.29 11.01 0.0779 0.0934
MEIW 31 20 406.1 124.2 2.5067 14.79 8.44 0.0597 0.0716
MEIR 26 15 457.2 139.8 2.8215 16.65 9.50 0.0672 0.0806
N Near-Source 20 13 101.8 30.95 0.6247 3.69 2.10 0.0150 0.0178
MEIW 117 110 14.46 4.394 0.0887 0.52 0.30 0.0021 0.0025
MEIR 407 400 2.01 0.6123 0.0124 0.07 0.04 0.0003 0.0004
O3 Near-Source 20 12 1956 to 2828 86.95 to 125.7 1.8581 to 2.6862 10.96 to 15.85 5.91 to 8.55 0.2877 to 0.4159 0.0531 to 0.0767
MEIW 26 18 1666 to 2410 74.05 to 107.1 1.5824 to 2.2887 9.34 to 13.50 5.03 to 7.28 0.2450 to 0.3544 0.0452 to 0.0654
MEIR 99 91 424.6 to 614.0 18.87 to 27.29 0.4032 to 0.5832 2.38 to 3.44 1.28 to 1.86 0.0624 to 0.0903 0.0115 to 0.0167
P3 Near-Source 20 15 224.3 to 324.04 52.4 to 75.71 1.4930 to 2.1572 8.81 to 12.73 3.56 to 5.15 0.0330 to 0.0477 0.0427 to 0.0616
MEIW 35 30 145.3 to 209.9 33.95 to 49.04 0.9673 to 1.3973 5.71 to 8.24 2.31 to 3.33 0.0214 to 0.0309 0.0276 to 0.0399
MEIR 29 24 171.2 to 247.3 39.99 to 57.77 1.1394 to 1.646 6.72 to 9.71 2.72 to 3.93 0.0252 to 0.0364 0.0326 to 0.04701. Distance to receptor measured from the center of the volume source.2. Distance to receptor measured from the building exterior (envelope).3. These facilities use a Perc-containing brake cleaner which shows a Perc content range from 65% to 94% by weight on the Material Safety Data Sheet; therefore, a range is presented for the results.

D-22
Table D-13. Summary of Modeling Results for Facilities Q, R, S, T, U, and V
FACILITY RECEPTOR Receptor Distance Maximum Maximum Maximum Potential Cancer Risk Hazard IndexTYPE [meters] 1-hour Conc. 1-hour Conc. Annual Avg. [chances per million]
(acute) (annualized) Concentration[µµg/m ] [µµg/m ] [µµg/m ]3 3 3Center Env. Resident Worker Acute Chronic1 2
Q3 Near-Source 20 10 2427 to 3509 215.7 to 311.9 4.6095 to 6.6653 27.20 to 39.33 14.66 to 21.20 0.3569 to 0.5160 0.1317 to 0.1904
MEIW 71 61 879.3 to 1271 78.16 to 113 1.6703 to 2.4148 9.85 to 14.25 5.31 to 7.68 0.1293 to 0.1869 0.0477 to 0.0690
MEIR 86 76 701.7 to 1015 62.37 to 90.21 1.3328 to 1.9278 7.86 to 11.37 4.24 to 6.13 0.1032 to 0.1492 0.0381 to 0.0551
R3 Near-Source 20 11 592.9 to 857.0 242 to 349.8 5.9185 to 8.5549 34.92 to 50.47 16.45 to 23.78 0.0872 to 0.1260 0.1691 to 0.2444
MEIW 39 30 361.9 to 523.3 147.7 to 213.6 3.6122 to 5.2239 21.31 to 30.82 10.04 to 14.52 0.0532 to 0.0770 0.1032 to 0.1493
MEIR 55 46 255.8 to 369.7 104.4 to 150.9 2.5533 to 3.6905 15.06 to 21.77 7.10 to 10.26 0.0376 to 0.0544 0.0730 to 0.1054
S Near-Source 20 14 70.62 35.31 0.8384 4.95 2.40 0.0104 0.0240
MEIW 47 41 34.10 17.05 0.4048 2.39 1.16 0.0050 0.0116
MEIR 466 460 1.20 0.6011 0.0143 0.08 0.04 0.0002 0.0004
T Near-Source 20 15 730.7 323.3 8.6745 51.18 21.98 0.1074 0.2478
MEIW 11 6 >730.7 >323.3 >8.6745 >51.18 >21.98 >0.1074 >0.24784
MEIR 35 30 423.5 187.4 5.0281 29.67 12.74 0.0623 0.1437
U3 Near-Source 20 15 519.2 to 750.0 129.8 to 187.5 3.6984 to 5.3425 21.82 to 31.52 8.82 to 12.75 0.0764 to 0.1103 0.1057 to 0.1526
MEIW 71 66 147.8 to 213.6 36.96 to 53.4 1.0531 to 1.5215 6.21 to 8.98 2.51 to 3.63 0.0217 to 0.0314 0.0301 to 0.0435
MEIR 96 91 98.16 to 141.9 24.54 to 35.47 0.6992 to 1.0107 4.13 to 5.96 1.67 to 2.41 0.0144 to 0.0209 0.0200 to 0.0289
V Near-Source 20 15 86.41 3.837 0.0820 0.48 0.26 0.0127 0.0023
MEIW 23 18 77.38 3.436 0.0734 0.43 0.23 0.0114 0.0021
MEIR 11 6 >86.41 >3.837 >0.0820 >0.48 >0.26 >0.0127 >0.00235
1. Distance to receptor measured from the center of the volume source.2. Distance to receptor measured from the building exterior (envelope).3. These facilities use a Perc-containing brake cleaner which shows a Perc content range from 65% to 94% by weight on the Material Safety Data Sheet; therefore, a range is presented for the results.4. The MEIW is located closer than 20 meters to the center of the volume source, which is the minimum distance modeled; therefore, the potential health impacts are likely to be greater than those listed here. However, we do not anticipate the potential cancer risk will be greater than 22 chances per million due to worker adjustments, nor do we anticipate significant non-cancer hazard indices. The impacts shown here are at the near-source location of 20 meters. 5. The MEIR is located closer than 20 meters to the center of the volume source, which is the minimum distance modeled; therefore, the potential health impacts are likely to be greater than those listed here. However, we do not anticipate that the potential health impacts will be significant. The impacts shown here are at the near-source location of 20 meters.

D-23
REFERENCES FOR APPENDIX D
CAPCOA, 1993. CAPCOA Air Toxics “Hot Spots” Program - Revised 1992 RiskAssessment Guidelines, Toxics Committee of the California Air Pollution Control OfficerAssociation (CAPCOA), October 1993.
OEHHA, 1997. Telephone conversation with Melanie Marty, Manager, Air Risk Assessment Unit, Office of Environmental Health Hazard Assessment, and Greg Harris, on May 19, 1997.
U.S. EPA, 1995. SCREEN3 Model User’s Guide, EPA-454/B-95-004, United StatesEnvironmental Protection Agency (U.S. EPA), Research Triangle Park, North Carolina,September 1995.
U.S. EPA, 1992. Screening Procedures for Estimating the Air Quality Impact of Stationary Sources, Revised, United States Environmental Protection Agency (U.S. EPA), October 1992.

Appendix E
Glossary

E-1
GLOSSARY
Acute Exposure: One or a series of short-term exposures generally lasting less than 24 hours.
Air Dispersion A mathematical model or computer simulation used to estimate theModel: concentration of toxic air pollutants at specific locations as a result of
mixing in the atmosphere.
Cancer Risk: The theoretical probability of contracting cancer when exposed for a lifetime to a given concentration of a substance usually calculated as anupper confidence limit. The maximum estimated risk may be presented asthe number of chances in a million of contracting cancer.
Chronic Exposure: Long-term exposure usually lasting from one year to a lifetime.
Hazard Index: The ratio of the concentration of a toxic pollutant with non-cancer healtheffects and the reference exposure level for that pollutant.
Health Risk A comprehensive analysis of the dispersion of hazardous substances in theAssessment (HRA): environment, their potential for human exposure, and a quantitative
assessment of both individual and population-wide health risks associated with those levels exposed.
MEIR: Maximum exposed individual resident. The residential receptor location that receives the estimated maximum exposure from a facility’s emissionsrelative to other residential locations.
MEIW: Maximum exposed individual worker. The off-site industrial or commercial location that receives the estimated maximum exposure from afacility’s emissions relative to other industrial or commercial locations.
Non-cancer Risk: Refers to non-cancer health effects due to acute and/or chronic exposure. This may be illustrated as an estimate of the hazard index or total hazardindex (by endpoint) resulting from exposure to toxic air pollutants.
Reference Exposure These are used as indicators of potential non-cancer adverse health effects. Level (REL): An REL is a concentration level at or below which no adverse health
effects are anticipated. RELs are designed to protect most sensitive individuals in the population by including safety factors in their development.

E-2
Risk: The possibility of injury or disease, which may result from exposure to toxic air pollutants.
Total Hazard Index: The sum of hazard indices for pollutants with non-cancer health effects thathave the same or similar adverse health effects (endpoints).
Unit Risk Factor The estimated upper-confidence limit (usually 95%) probability of a (URF): person contracting cancer as a result of a constant exposure to 1 g/m of a3
substance over a 70-year lifetime.