staff appraisal report eritrea ports rehabilitation...
TRANSCRIPT
Document of
The World Bank
Report No. 15547 ER
STAFF APPRAISAL REPORT
ERITREA
PORTS REHABILITATION PROJECT
October 20, 1997
Transport 1Eastern and Southern Africa
Pub
lic D
iscl
osur
e A
utho
rized
Pub
lic D
iscl
osur
e A
utho
rized
Pub
lic D
iscl
osur
e A
utho
rized
Pub
lic D
iscl
osur
e A
utho
rized

CURRENCY EQUIVALENTS
Currency unit = BirrUS$ 1.00 = Birr 6.30 (As of June 1996)Birr I.00 US$ 0.16
WEIGHT AND MEASURES
Metric System
GOVERNMENT FISCAL YEAR
January 1 - December 3 1
GLOSSARY OF ABBREVIATIONS
APA Assab Port AdministrationASYCUDA Automated System for Customs DataDMT Department of Maritime TransportEA Envirorunmental Impact AssessmentEPA Eritrea Ports AuthoritvEPDP Eritrea-Gernan Port Development ProjectEPLF Eritrean Peoples' Liberation FrontERSTAS Eritrean Shipping Transit Agencies ServicesEU European UnionGOE Govermnent of EntreaGRT Gross Register TonsGTZ Deutsche Gesellschaft fiir Technisclie ZusammnenarbeitICB International Competitive BiddingICR Implementation Completion ReportIDA International Development AssociationIFC International Finance CorporationIMF International Monetary FundIMO International Maritime OrganizationMTC Ministry of Transport amd CommunicationMPA Massawva Port AdministrationNCB National Competitive BiddingPCU Project Coordination UnitPIP Project Implementation PlanPPF Project Preparation FacilityRo/Ro Roll on -Roll offRRPE Recovery and Rehabilitation Project for EritreaSDR Special Drawings RightsSOE Statement of ExpensesTEU Twenty Foot Equivalent Unit (containers)UNCTAD United Nations Conference on Trade and DevelopmentWFP World Food Program
This report is based on the findings of 13ank's pre-appraisal, appraisal and post-appraisal missions in January 1996, April1996, and April 1997 respectively. Thc mission members included: Mr. Sturc Karlsson (Task Manager -Sr. Port rngincer);Mr. Simon Thomas (Sr. Transport Economist); Mr. Takuya Kaniata (Sr. Financial Analyst); Ms. Charlotte Jones (OperationsAnalyst); Mr. RolfBolin (Port Management and Operations Expert- Consultant); Mr. Norbert Zimmert (luman ResourcesDevelopment Expert -Consultant); and Dr. Klaus Beplat (Port Operations and Management Specialist -Consultant). Leadadvisor for the project was Mr. Ismail Mobarek (Principal Port Engineer), and peer reviewers werc Mr. Kek Chung (Sr. PortOperations Specialist), Mr. Joris Van der Ven (Sr. Transport Economist) and Mr. Carl G. I.undin (Environmental Specialist).Secretarial support and report production was done by Ms. Marie Claire Li Tin Yue, Task Assistant. Mr. Yusupha Crookesand Ms. Oey Astra Meesook are the Sector Manager and Country Director, rcspectively, for the operation.

ERITREA
PORTS REHABILITATION PROJECT
TABLE OF CONTENTSPage No.
CREDIT AND PROJECT SUMMARY ........................................................... ;1. TRANSPORT SECTOR ........................................................... I
A. BACKGROIJND ........................................................... IB. THE ERITREAN TRANSPORT SYSTEM ........................................................... 2C. ROLE OF TRANSPORT IN THE ECONOMY ............................................................ .3D. CRITICAL TRANSPORT ISSUES IN ERITREA ........................................................... 3E. BANK STRATEGY ............................................................. 4F. PREVIOUIS BANK GROUP INVOLVEMENT IN THE ERITREA PORT SECTOR ..................... 5G. RATIONALE FOR IDA INVOLVEMENT ........................................................... 5
2. THE PORT SUB-SECTOR ........................................................... 6A. ORGANIZATI(N ........................................................... 6B. PORT OF MASSAWA ........................................................... 7C. PORT OF ASSAB ............................................................ 10D. STRATEGY FOR THE PORT SECTOR ............................ ............................... 12
3. THE PROJECT ........................................................... 13A. IDENTIFICATION AND PREPARATION ....... ................................... 13B. OBJECTIVES ........................................................... 13C. PROJECT DESCRIPTION ........................................................... 13
Project Components ........................................................... 13D. COST ESTIMAT'ES ........................................................... 15E. FINANCING ............................................................ 16
4. PROJECT IMPLEMENTATION ........................................................... 17A. INSTITUTiONAL RESPONSIBLITIES ........................................................... 17B. PROCUREMEN1 ........................................................... 18C. DISBURSEMENT ............................................................ 2 1D. REPORTING AND A ITING ........................................................... 22E. MONITORING AND SIJPERVISION ........................................................... 22
5. ECONOMIC ANALYSIS ........................................................... 24A. BACKGROUND ........................................................... 24B. MASSAWA PORTI INVESSTMENT ................. .......................................... 25
The Demand for Port Services ........................................................... 24Operational Impact of Proposed Investments .................................................... 26Economic Impact of Investments ........................................................... 27Sensitivity Analysis ........................................................... 29
C. ASSAB PORT INVESTMENT ........................................................... 30The Demand for Port Services ........................................................... 30Operational Impact of Proposed Investment ....................................................... 31Economic Impact of Investment ........................................................... 33Sensitivity Analysis for Container Handling ...................................................... 36
D. OVERALL PROJECT ECONOMIC RETURNS ........... ............................ 376. FINANCIAL ANALYSIS ........................................................... 39
A. SECTOR FINANCiAL uISSUES ............................................................. 39
B. PORT OF MASSAWA ............................................................ 40Financial Performnance of the Massawa Port Administrationduring 1992-1996 ............ : 40
Projections of Financial Performance of MPA ................................................... 41C. PORT OF ASSAB ........................................................... 41
Financial Performance of Assab Port Administration (APA)during 1991 -1996 ........................................................ 42Projections of Financial Performance of APA .................................................... 43
7. ENVIRONMENTAL IMPACT, PROJECT SUSTAINABILITY AND RISK ........................ 45A. ENVIRONMENTAL IMPACT .......................................................... 45
Environmental Impacts During Construction ...................................................... 45Treatment of Hazardous and Noxious Cargo ...................................................... 46Handling of Ship's Wastes ........................................................ 46National Oil Spill Contingency Plan ........................................ ................ 46Maritime Safety ........................................................ 47
B. PROJECT SUSTAINABILITY .......................................................... 47C. PROJECT RISK ........................................................ 47
8. AGREEMENTS AND RECOMMENDATION ........................................... 49A. AGREEMENTS REACHED DURING NEGOTATIONS ....................................................... 49B. RECOMMENDATION ........................................................ 49
ANNEXESAnnex 1 Port of MassawaAnnex 2 Port of AssabAnnex 3 TOR Development StudyAnnex 4 Letter of Port Sector PolicyAnnex 5 Supervision Strategy and Staff InputAnnex 6 Key Performance IndicatorsAnnex 7 Project Implementation Plan (PIP)Annex 8 Estimated Schedule of DisbursementAnnex 9 Project Implementation ScheduleAnnex 10 Summary of Environmental Impact AssessmentAnnex 11 Financial Performance, Massawa Port, 1992 - 1996Annex 12 Financial Projections, Massawa Port, 1997 - 2005Annex 13 Financial Performance, Assab Port, 1991 - 1996Annex 14 Financial Projections, Assab Port, 1997 - 2003Annex 15 Risk AnalysisAnnex 16 Organizational Charts - Massawa & AssabAnnex 17 Documents in Project File
MAP IBRD Nos. 27961 and 27962
ERITREA
PORTS REHABILITATION PROJECT
CREDIT AND PROJECT SUMMARY
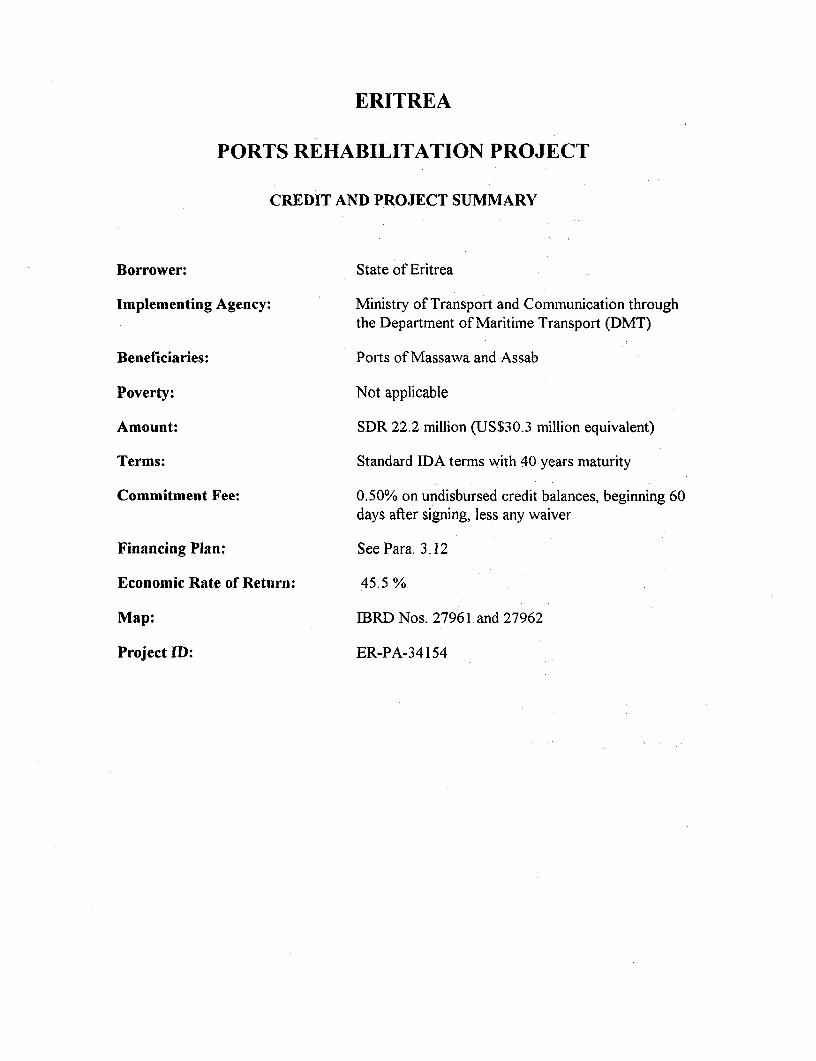
Borrower: State of Eritrea
Implementing Agency: Ministry of Transport and Communication throughthe Department of Maritime Transport (DMT)
Beneficiaries: Ports of Massawa and Assab
Poverty: Not applicable
Amount: SDR 22.2 million (US$30.3 million equivalent)
Terms: Standard IDA terms with 40 years maturity
Commitment Fee: 0.50% on undisbursed credit balances, beginning 60days after signing, less any waiver
Financing Plan: See Para. 3.12
Economic Rate of Return: 45.5 %
Map: IBRD Nos. 27961 and 27962
Project ID: ER-PA-34154

I

1. TRANSPORT SECTOR
A. BACKGROUND
1.1 Eritrea's struggle for independence began in earnest in 1961 following theannexation of Eritrea by Ethiopia, and further intensified following the military coup inEthiopia in 1974. The Eritrean Peoples Liberation Front (EPLF), which had begun tocontrol parts of the country since the mid- 1970s, finally managed to fully liberate Eritreain May 1991. This coincided with the Ethiopian People's Revolutionary DemocraticFront's victory over the military regime in Ethiopia. Following an internationallysupervised referendum, Eritrea formally gained its independence on May 24, 1993.Ethiopia was among the first nations to recognize Eritrea' s independence, and the twocountries have established a close relationship. Eritrea became the 178th member ofIBRD and the 157th member of IDA on July 6, 1994. In October 1995, it became amember of IFC.
1.2 Eritrea is strategically located in the northeast of Africa, with a 1000 km coastlineon the Red Sea. It is a land of varied topography, climate and rainfall, and it lies in theSahelian rainfall zone. There is good potential to extract petroleum from the Red Sea.The country's coastal waters are also believed to be among the most potentiallyproductive fishing grounds in the Red Sea. Eritrea's population is estimated to be in therange of 3-3.5 million, including nearly 500,000 Eritrean refugees in Sudan.
1.3 The Eritrean economy has a relatively diverse productive base. In comparison toother African countries, agriculture accounts for a lower share of the GDP - 15 to 25percent depending on the rainfall. Industry accounts for 20 percent of GDP and itscontribution varies less. Services accounts for the bulk of national output at 50 to 60percent of GDP. The rehabilitation and expansion of these sectors will increase growth inthe medium term. In the long-run, growth will be boosted by the fruits of the on-goingprivate investments in mining, fishery and tourism sectors. These sectors have madeprogress in attracting direct foreign investment.
1.4 The return to peace, the recovery and the rehabilitation efforts, institutionalreforms, and policy developments, have contributed to reviving a run-down economy.After contracting by more than one percent per annum during the period 1985 to 1993,real GDP grew by almost 8 percent per annum on average during 1994 and 1996.Industrial production as well as service activities have continued to expand in the recentpast due primarily to a growing private micro-enterprise sector, the partial rehabilitation ofa few large-scale industrial enterprises, a strong pick-up of construction activity, and agood harvest. Sustaining such high growth rates will require maintaining the momentumtowards improving macroeconomic policies and further strengthening sectoral policies toencourage investment, as well as substantial external assistance.

-2-
1.5 One of the initial successes of the Government's reform and recovery program hasbeen the growth and some diversification in foreign trade. Exports have recoveredsignificantly, starting from an extremely low base, and have increased by almost 50 percentper annum in US dollar terms in the last two years. Preliminary data show that exports tothe non-Birr area have risen from US$1 million in 1992 to US$29 million in 1994 whilethose to the Birr area (Ethiopia) rose from US$14 million to US$26 million. Merchandiseimports also increased substantially and it is estimated that in 1994, they amounted toUS$41 million from the Birr area and US$348 million from the non-Birr area. Salt iscurrently the most important export item, follow by beverages and tobacco. Broaderefforts are required to put Eritrea's export sector on a sustainable path of growth with theassistance of private investment, improvement in the macroeconomic framework, andstrengthening of the enabling environment at the micro-level.
B. THE ERITREAN TRANSPORT SYSTEM
1.6 More than thirty years of war have left Eritrea's transport infrastructure in aseverely dilapidated state. The road network and port facilities require extensiverehabilitation. Failure to rectify these deficiencies will impede the flow of goods andservices, hamper the development of export-oriented agriculture and industry, increasetransport costs and ultimately retard economic growth.
1.7 The road network in Eritrea is small, under 6000 km of main and rural roads, ofwhich less than 1000 km can be considered all-weather. At one time, they represented awell developed road system. A complete absence of even routine maintenance, due mainlyto the prolonged war situation, has led to severe deterioration of the system Someimportant improvements are under way, particularly the rehabilitation and widening of theAsmara - Massawa road, and the detailed design of the Nefasit - Tera Imni road isexpected to start in the near.future.
1.8 The land transport previously included railways which ran between Bisria andMassawa via Asmara - Keren - Agordat, and a shorter line which ran between MersaFatma and Colluli in the Eastern part of the country. Eritrea was also the site of theteleferrica, the longest overhead tramway in the world which carried freight betweenMassawa and Asmara. The railways had ceased operations by the early years of theDergue regime while the teleferrica was dismantled at the end of the British trusteeship in1952.
1.9 The commercial trucking fleet is currently underutilized, although there is someindication that some rural areas are not well served because drivers refuse to take theirtrucks over the existing poor roads and, as a result, farmers find it difficult to marketcrops. In contrast to the trucking fleet, there is shortage of commercial passengervehicles, which has led the Government to regulate the sector to prevent a concentrationof services around Asmara. Currently, the sector is performing reasonably well in terms ofcost recovery.
1.10 Eritrea has two outlets to the sea located at Massawa and Assab. The port ofMassawa developed its present facilities between 1885 and 1940. The port of Assab wasconstructed in 1959 and serves as the major gateway for Ethiopia, and is also important inthat the refinery is located there. As with the road infrastructure, both ports suffered fromdamage and lack of maintenance during the Liberation War.
1.11 Civil aviation is presently focused on the international airport of Asmara and to alesser extent the commercially important airport of Assab. There are currently a numberof regional air services operated by Egypt, Yemenia and Ethiopian Airlines. Ethiopianalso operates Asmara-Assab-Addis services twice a week, and daily regional andEuropean services are provided by Ethiopian as well as Lufthansa. The passenger andfreight terminals at Asmara International Airport have recently undergone a majorrehabilitation and expansion program, although it still would require substantial investmentin navigational aids and communications in order to meet ICAO standards. Nonetheless,operations are currently carried out on a 24-hour basis.
C. ROLE OF TRANSPORT IN THE ECONOMY
1.12 The transport system is essential for the domestic economy and is also one of themost important sources of foreign exchange earnings. The once well developedinfrastructure of Eritrea has been severely damaged by the war. This is currently a majorconstraint on growth, especially by limiting access of producers to the markets. Ports androads in particular are constraints in need of immediate attention.
D. CRITICAL TRANSPORT ISSUES IN ERITREA
1.13 Transport conditions are major constraints to economic and social development inEritrea. Under the emergency RRPE, some initial and urgent support has been providedby the IDA and other donors for the purpose of essential equipment and material to repairand rehabilitate the most important roads (particularly the Asmara - Massawa road) andsome bridges.
1.14 A coherent transport strategy for Eritrea is under development with EU funding.A consultant was appointed in January 1996 to assist the Government to carry out a studywith the following objectives:
* carry out a base-line survey of the transport sector identifying its maincharacteristics, main problems and opportunities in all areas including policy,strategy, infrastructure, institutions, and management capability,
* to set out and assess options for the development of the transport sectorcovering reforms, investments, and donor mobilization; and

-4-
* to make recommendations and a plan of action for developing the transportsector to the benefit of Eritrea covering policy reforms, investments, anddonor mobilization; and including the ranking and prioritization of bothreforms and investments within the transport sector as a whole and betweensub-sectors.
1.15 The draft findings and recommendations of the study, which has been looking intothe sub-sectors of roads, ports and shipping, aviation and railways, are presently underdiscussion within the Government.
1.16 Without a significant increase in effective port capacity in the country, Massawaand Assab would not be able to handle the base traffic forecasts, which are predicted togrow at a relative modest rate but with a significant shift to containers and general cargo.
E. BANK STRATEGY
1.17 Country Assistance Strategy: The long-term goal of Eritrea, once recovery andreconstruction tasks have been completed, is to build a modern, technologically advanced,export-oriented economy, which will capitalize on its strategic position and naturalresources, and based on self-reliance, technology transfer, and private investment. Privateinvestment has been identified as the engine of growth and development, although Eritreahas not inherited a working private sector. The strategy seeks to accomplish this objectiveby:
* creating an environment in which the private sector will develop and flourish,in partnership with foreign investors;
* reducing infrastructure constraints; and* investing in human resources.
1.18 In order to build a strong partnership with Eritrea, the Bank Group's assistancestrategy will continue to be governed by the principle of maintaining clear governmentownership of the programs.
1.19 The once well developed infrastructure of Eritrea has been severely damaged bythe war. This is currently a major constraint on growth, especially limiting access ofproducers to the markets. Ports, roads, energy, and telecoms are constraints in need ofimmediate attention.
1.20 Critical issues now facing the port industry are being addressed through theproposed project (see Sections 2 and 3), and in the preparatory works for Phase II and IIIof the development of the sector.
F. PREVIOUS BANK GROUP INVOLVEMENT IN THE ERITREA PORT SECTOR
1.21 This will be the first IDA operation in Eritrea's port sector involving substantialrehabilitation. However, the expansion of facilities at Assab Port to provide the port withthe capacity and ability to handle containerized traffic was a component of the EthiopiaTransport Project, Credit 2002-ET. The construction of two new container berths hadjust started in 1991/92, when control of the port changed and the project was terminated.
G. RATIONALE FOR IDA INVOLVEMENT
1.22 The rationale for IDA involvement is based on: (i) the importance of the portsector to a successful economic recovery program; (ii) IDA's previous involvement in theport sector in Ethiopia (Assab); and (iii) the contribution IDA can make to the reformprocess based on its experience in taking the lead role in formulating port modernizationprograms in neighboring countries along the east coast of Africa.
-6-
2. THE PORT SUB-SECTOR
A. ORGANIZATION
2.1 With the end of the war in May 1991, the Provisional Government of Eritreaestablished the Department of Ports and Maritime Transport (DPMT) by proclamationNo. 23/92, Art. 7 No. 1.17. The department was established to develop, improve,maintain, operate and regulate the port and shipping industry in Eritrea. The DPMT,under the President's Office, was legally responsible for: (i) all port activities in Massawaand Assab; (ii) a ship repair yard in Massawa; and (iii) Eritrea Shipping Transit AgenciesServices (ERSTAS - the sole ship's agent, and major freight forwarding agent), and theEritrea Shipping Lines'. In May, 1993 the DPMT was re-established as the Ports &Maritime Authority (PMTA), and in early 1994 when the headquarters was relocated toMassawa, the PMTA was re-established as the Eritrea Ports Authority (EPA), stillreporting to the President's Office. In 1995 the Government decided to organize the portswithin a Department of Maritime Transport (DMT) under the Ministry of Transport andCommunication, and the two ports were established as autonomous commercial entitiesunder the supervision of a sector board chaired by the Minister of Transport andCommunication.
2.2 The port of Massawa serves as the major port for import/export of Eritrean cargo,and for an increasing volume of traffic for northern Ethiopia (Tigray), while Assab isprimarily a transit port for Ethiopian trade, accounting for about 85 percent of Ethiopia'stotal external trade. Over 95 percent of the dry cargo passing through port of Assab isEthiopian trade.
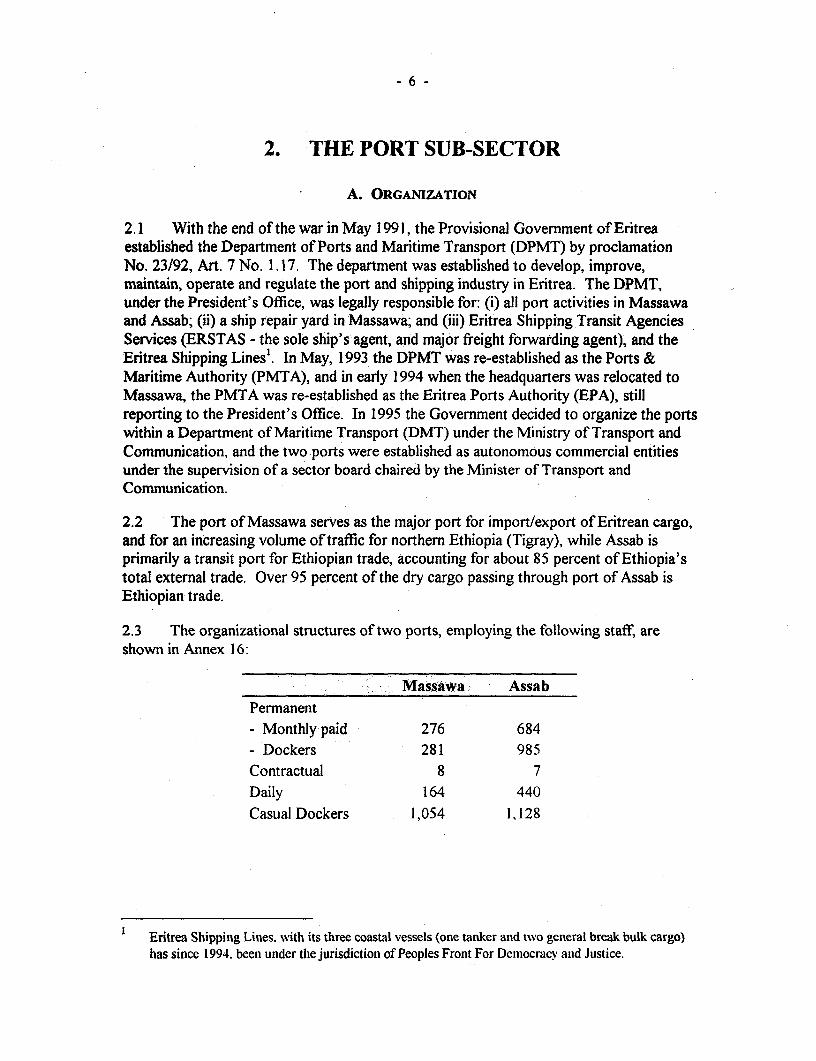
2.3 The organizational structures of two ports, employing the following staff, areshown in Annex 16:
Massawa AssabPermanent- Monthly paid 276 684
- Dockers 281 985
Contractual 8 7
Daily 164 440
Casual Dockers 1,054 1,128
Eritrea Shipping Lines. with its three coastal vessels (one tanker and two general break bulk cargo)has since 1994. been under the jurisdiction of Peoples Front For Democracy and Justice.
-7-
2.4 Lack of maintenance and damages by the war have left the infrastructure of thetwo ports in a dilapidated shape, and it has been with great difficulty that the ports havemanaged to handle the increasing traffic. The two ports suffer from slow cargo handlingrates (especially for containers) and shortage of suitable equipment.
2.5 Problems and weaknesses in the Customs Administration include outdated andinefficient operational systems and procedures, and lack of skilled staff. Specificweaknesses include an antiquated import declaration system, characterized by inefficientand superfluous formalities and procedural steps, and lack of selectivity in checking thegoods. This results sometimes in cumbersome and slow goods clearance process, whichin turn increases the cargo dwell time in the ports. The Government has started to addressthe shortcomings and to simplify documentation and procedures, and has also decided toinstall the customs computerized system ASYCUDA at the two ports and the airport.This component, originally planned to be part of the project, will be implementedsimultaneously with the project under Italian funding. Included in the project, however, isthe construction of a customs building in Massawa.
2.6 In order to transform the two ports into modern, efficient, commercially-orientedand profit-generating enterprises, higher and middle management staff will need to betrained in leadership, personnel management planning and decision-making techniques,information and communication, economics and financial management, and safety andenvironmental aspects. The port management staff in Eritrea is highly motivated anddetermined to succeed. The ports are already enjoying technical assistance from theFederal Republic of Germany within the scope of bilateral technical cooperation. ThisEritrean-German Port Development Project (EPDP) started in early July 1995 andcomprises a total of 48 man-months (mm) of technical assistance including 12 mm in thefield of training with a clear emphasis on train-the-trainer programs. Additional training,particularly in the fields of port operations and equipment maintenance, will be providedunder the project (para. 3.8).
B. PORT OF MASSAWA
2.7 Massawa port was founded in 1665 by the Turks and took its present shape duringthe Italian rule (1885-194 1). The port is situated on the northern shore of MassawaIsland, and consists of six general purpose berths with a port area inside a customs wallwith sheds, warehouses and open storage facilities. The exact timing of developments andthe order of berth construction are not known as there are no reliable records available. Itis believed that the most recent construction was that of Berths 5 (half) and Berth 6around 1940, and that all the present berths were constructed in the period 1926 to 1940.
2.8 The enclosed harbor is given additional protection by short breakwater armsextending south from Abd-el-Kader Peninsula and north from Massawa Island. Bothbreakwaters were constructed in 1926 and are rubble mound constructions protected byarmor stones or concrete capping. The breakwaters are both in relatively good condition.
-8-
2.9 The commercial port consists of six general purpose berths, aprons, warehouses,open sheds and open storage areas. Other facilities at Massawa are:
* Bulk salt loading jetties located on the south shore of Gherar Peninsula;* Ship repair facilities administered by the DMT and located west of the salt
jetties;* An oil termninal and a jetty at Taulud Bay. The terminal is operated by Total
and Mobil Oil;* Another oil terminal at Hargigo Bay, towards the south operated by Agip Oil;
and* A naval base at the southern part of the Abd-el-Kader Peninsula.
2.10 The approaches to Massawa port are without major difficulties. The port iscovered by Admiralty Chart No. 460. The channels used are north and south. Theentrance to the commercial port is navigational 24 hours a day, and is lighted with greenand red lights. There are two leading marks with red lights to assist maneuvering day andnight. The Massawa port is in charge of eight lighthouses in the Red Sea, of which onlyone, Mdote, vAth a light range of 13 nautical miles, is functional. The main MassawaLight House (Risi Midri), with a light range of 16 miles, is also run by Massawa port.
2.11 There are no significant currents inside the harbor, and the tidal range of springtides is 1.5 meters at the maximum. The port provides pilotage from dawn to dusk, andthe pilotage is compulsory for all ships over 100 GRT. Calling ships should give sevendays notice of arrival. Tug and pilot boats are available.
2.12 The port is served by five rail mounted quay cranes. The cranes cover berths 3, 4and 5. A sixth quay crane is not working. The cranes, built in 1975, are in a poorcondition due to lack of maintenance. The lifting capacity is 5 tons at 20 meters and 6tons at 16 meters. The cranes can be mounted with grabs for discharging bulk cargo.
2.13 The port fleet of lifting equipment also includes seven mobile cranes. Most ofthese are in a bad condition. A 50-ton crane lacks spare parts and has thus not been inoperation since November 1994. A 100-ton crane is the only one in a good condition.The mobile cranes are used for discharging and loading general cargo onto vessels, andare also often used for loading and unloading cargo onto trucks in the storage areas.
2.14 In April 1997 the port acquired cargo handling equipment worth US$2.0 millionunder a Japanese Grant, including a reach stacker for handling of 40 foot containers, 10fork lift trucks, and 4 tugmasters with trailers.
2.15 The port handled 610,000 tons of cargo at its own berths in 1996. In addition,local oil terminals handled a further 160,000 tons, giving a total of 770,000 tons.International cargo accounted for 97% of the total handled at the port, and almost 97% ofthe cargo was imports. Cargo volumes have fluctuated erratically since independence in1991, mainly because food aid cargoes have varied. The total cargo (excluding petroleumproducts) at the main port are detailed in Table 2.1:
-9-
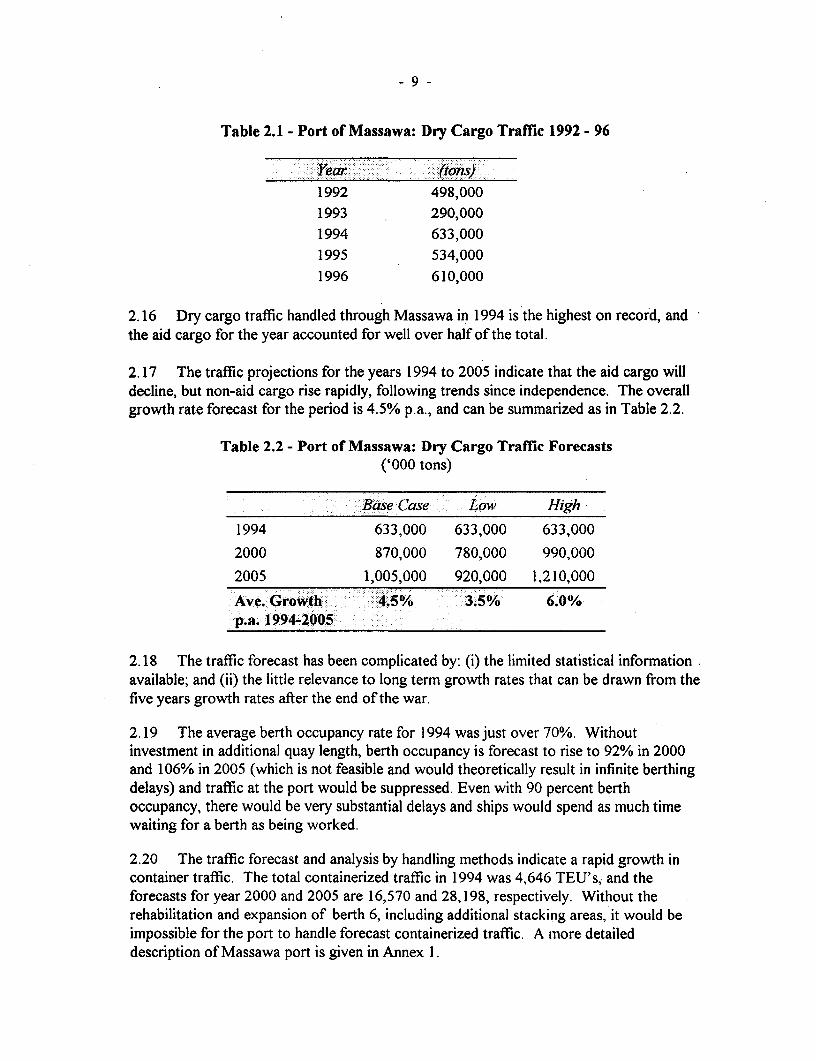
Table 2.1 - Port of Massawa: Dry Cargo Traffic 1992 - 96
- - .Year ( - ztons)1992 498,0001993 290,0001994 633,0001995 534,0001996 610,000
2.16 Dry cargo traffic handled through Massawa in 1994 is the highest on record, andthe aid cargo for the year accounted for well over half of the total.
2.17 The traffic projections for the years 1994 to 2005 indicate that the aid cargo willdecline, but non-aid cargo rise rapidly, following trends since independence. The overallgrowth rate forecast for the period is 4.5% p.a., and can be summarized as in Table 2.2.
Table 2.2 - Port of Massawa: Dry Cargo Traffic Forecasts('000 tons)
Base (:ase Low High
1994 633,000 633,000 633,000
2000 870,000 780,000 990,000
2005 1,005,000 920,000 1,210,000
Ave. Growth 4.5% 3.5% 6.0%p.a. 1994-2005
2.18 The traffic forecast has been complicated by: (i) the limited statistical informationavailable; and (ii) the little relevance to long term growth rates that can be drawn from thefive years growth rates after the end of the war.
2.19 The average berth occupancy rate for 1994 was just over 70%. Withoutinvestment in additional quay length, berth occupancy is forecast to rise to 92% in 2000and 106% in 2005 (which is not feasible and would theoretically result in infinite berthingdelays) and traffic at the port would be suppressed. Even with 90 percent berthoccupancy, there would be very substantial delays and ships would spend as much timewaiting for a berth as being worked.
2.20 The traffic forecast and analysis by handling methods indicate a rapid growth incontainer traffic. The total containerized traffic in 1994 was 4,646 TEU's, and theforecasts for year 2000 and 2005 are 16,570 and 28,198, respectively. Without therehabilitation and expansion of berth 6, including additional stacking areas, it would beimpossible for the port to handle forecast containerized traffic. A more detaileddescription of Massawa port is given in Annex 1.
- 10 -
C. PORT OF ASSAB
2.21 The present commercial port was completed in 1959 and consists of two jettieswhich extend SSE from the shore forning a basin 300 m wide. The general cargo berthsare aligned to the predominant wind direction on the inner faces of the jetties. The berthsare protected from waves generated by SE winds by a detached breakwater.
2.22 The North Jetty provides a total berth length of 490 m which is divided into 3berths (berths 1, 2 and 3). All berths provide 11.0 m depth of water alongside. The SouthJetty provides a total berth length of 530 m which is divided into 4 berths (Berths 8 to 1 1).The available depths of water alongside are between 5.8 m (Berth 8) to 10.0 m (Berths 10and 1-1). The berths on both jetties are of concrete block construction, and the overallwidth of the jetties is around 100 m. At the outer end of the South Jetty is a smallconcrete Ro/Ro ramp for berthing Ro/Ro vessels with either stern or bow ramp. To thesouth of the port is the Assab Oil Refinery and a number of marine oil terminal facilitiesfor discharging/loading of crude oil and refined products.
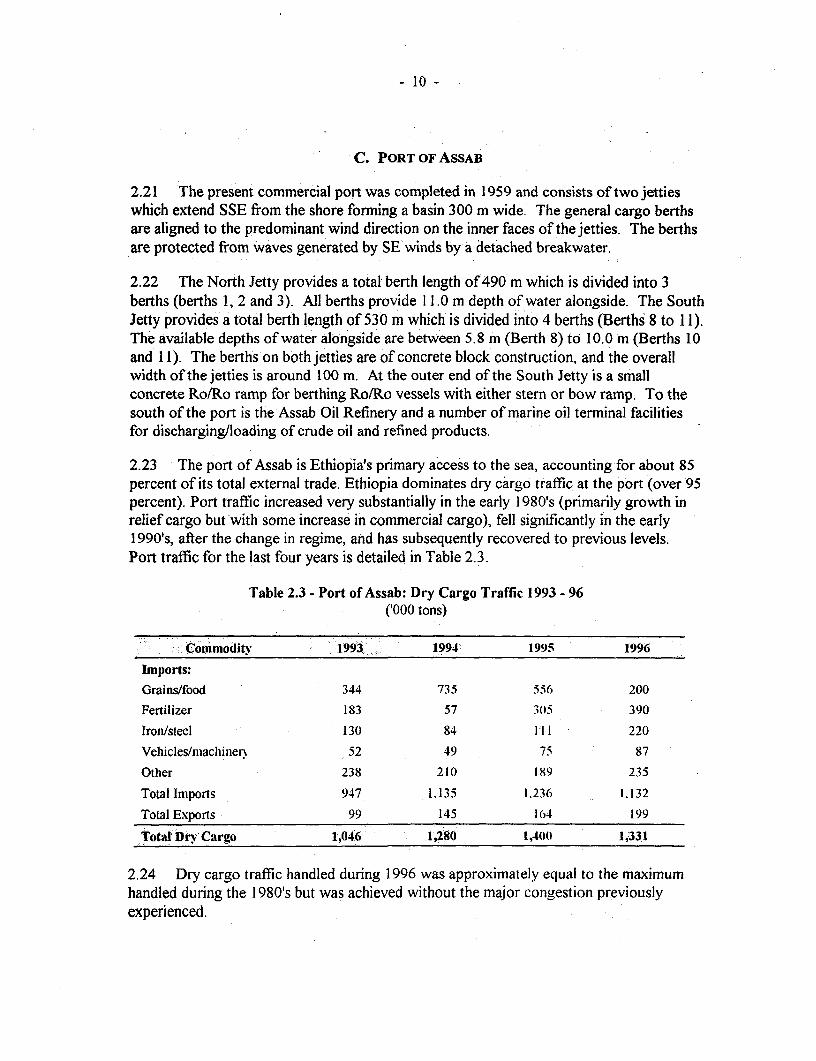
2.23 The port of Assab is Ethiopia's primary access to the sea, accounting for about 85percent of its total external trade. Ethiopia dominates dry cargo traffic at the port (over 95percent). Port traffic increased very substantially in the early 1980's (primarily growth inrelief cargo but 'with some increase in commercial cargo), fell significantly in the early1990's, after the change in regime, and has subsequently recovered to previous levels.Port traffic for the last four years is detailed in Table 2.3.
Table 2.3 - Port of Assab: Dry Cargo Traffic 1993 - 96('000 tons)
Commodity 1993. 1994: 1995 1996
Imports:Grains/food 344 735 5s6 200Fertilizer 183 57 3(05 390
Iron/steel 130 84 111 220Vehicles/machinmer 52 49 75 87Other 238 210 189 235
Total Imports 947 1.135 1.236 1.132
Total Exports 99 145 164 199
Total Dry Cargo 1,04 6 1,280 1,40(1 1,331
2.24 Dry cargo traffic handled during 1996 was approximately equal to the maximumhandled during the 1980's but was achieved without the major congestion previouslyexperienced.
2.25 Major increases in the total volume of dry cargo traffic are not expected but verysubstantial shifts in the commodity distribution are probable:
* the high level of 1996 fertilizer imports is expected to continue, even if donorassistance is reduced;
* grain production in Ethiopia will expand significantly and there will be agradual decline in the average level of food imports, although there will still bemarked fluctuations depending upon rainfall and domestic production;
* economic growth in Ethiopia will result in a continued increase in imports ofraw materials, vehicles and machinery and other general cargo. The growthrate is expected to be approximately equal to the growth in GDP, i.e. about 6percent per annum; and
* coffee and other agricultural exports have increased since 1992, and thisgrowth is expected to continue.
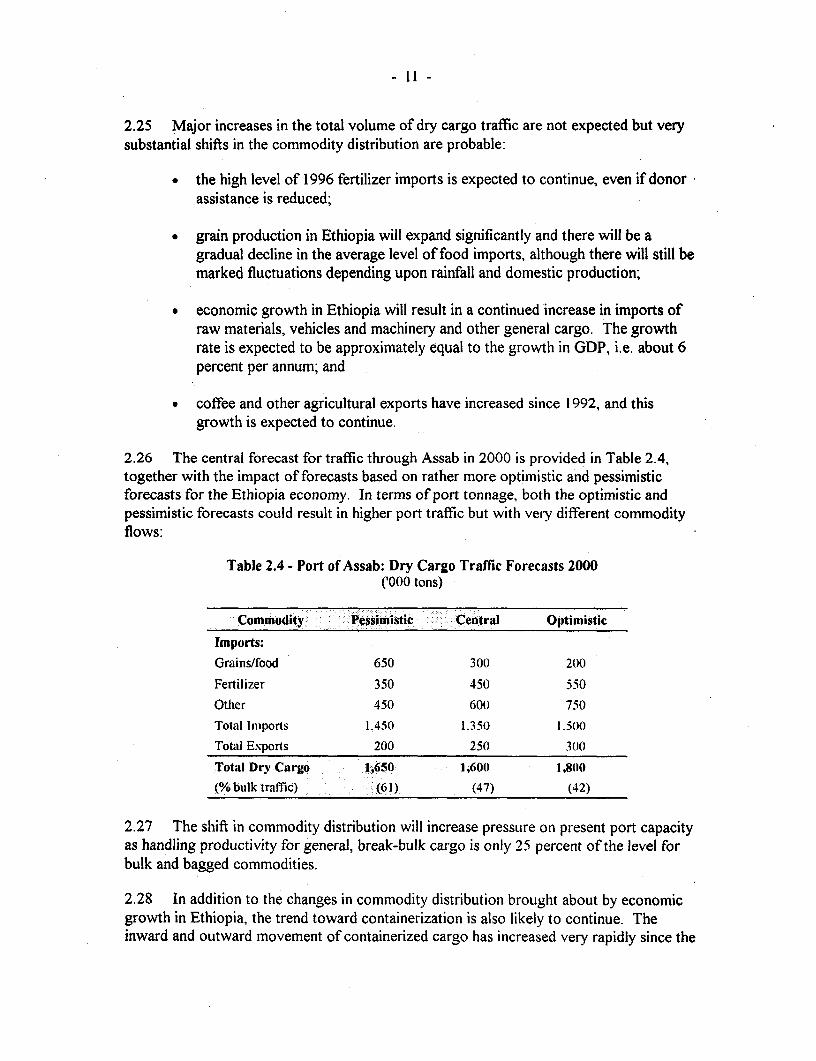
2.26 The central forecast for traffic through Assab in 2000 is provided in Table 2.4,together with the impact of forecasts based on rather more optimistic and pessimisticforecasts for the Ethiopia economy. In terms of port tonnage, both the optimistic andpessimistic forecasts could result in higher port traffic but with veiy different commodityflows:
Table 2.4 - Port of Assab: Dry Cargo Traffic Forecasts 2000('000 tons)
Commodity Pessimistic Central Optimistic
Imports:
Grains/food 650 300 200
Fertilizer 350 450 550Other 450 600 750
Total Imports 1,450 1.350 1.500
Total Exports 200 250 3((
Total Dry Cargo 1,650 1,600 1,8(10
(% bulk traffic) (61) (47) (42)
2.27 The shift in commodity distribution will increase pressure on present port capacityas handling productivity for general, break-bulk cargo is only 25 percent of the level forbulk and bagged commodities.
2.28 In addition to the changes in commodity distribution brought about by economicgrowth in Ethiopia, the trend toward containerization is also likely to continue. Theinward and outward movement of containerized cargo has increased very rapidly since the
- 12 -
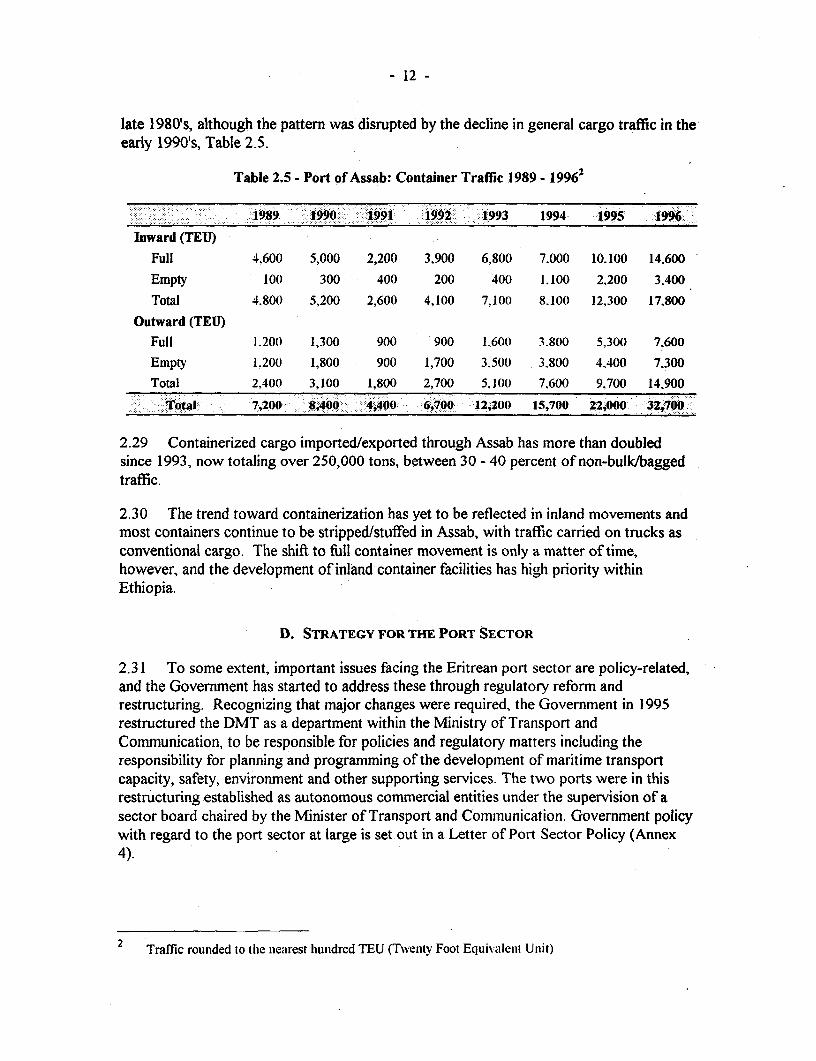
late 1980's, although the pattern was disrupted by the decline in general cargo traffic in theearly 1990's, Table 2.5.
Table 2.5 - Port of Assab: Container Traffic 1989 - 19962
-- ;: 1989. 1$g990:0 190 i 910- 0-199 2-" 1993 1994 1995 19I:
Inward (TEU)Full 4,600 5,000 2,200 3,900 6,800 7.000 10.100 14.600
Empty 100 300 400 200 400 1.100 2.200 3,400
Total 4.800 5,200 2,600 4,100 7.100 8.100 12,300 17.800
Outward (TEU)
Full 1.200 1,300 900 900 1.600 3.800 5,300 7.600
Empty 1.200 1,800 900 1,700 3.500 3.800 4.400 7,300
Total 2.400 3,100 1,800 2,700 5.100 7.600 9,700 14.900To': ' "Qtal; 0 7,200 8,400 4,400 6,700 12,200 15,700 22,000 32,700
2.29 Containerized cargo imported/exported through Assab has more than doubledsince 1993, now totaling over 250,000 tons, between 30 - 40 percent of non-bulk/baggedtraffic.
2.30 The trend toward containerization has yet to be reflected in inland movements andmost containers continue to be stripped/stuffed in Assab, with traffic carried on trucks asconventional cargo. The shift to full container movement is only a matter of time,however, and the development of inland container facilities has high priority withinEthiopia.
D. STRATEGY FOR THE PORT SECTOR
2.31 To some extent, important issues facing the Eritrean port sector are policy-related,and the Government has started to address these through regulatory reform andrestructuring. Recognizing that major changes were required, the Government in 1995restructured the DMT as a department within the Ministry of Transport andCommunication, to be responsible for policies and regulatory matters including theresponsibility for planning and programming of the development of maritime transportcapacity, safety, environment and other supporting services. The two ports were in thisrestructuring established as autonomous commercial entities under the supervision of asector board chaired by the Minister of Transport and Communication. Government policywith regard to the port sector at large is set out in a Letter of Port Sector Policy (Annex4).
2 Traffic rounded to the nearest hunidred TEU (Twenty Foot Equivalenl Unit)

- 13 -
3. THE PROJECT
A. IDENTIFICATION AND PREPARATION
3.1 Following the Government's request in January 1995 for World Bank assistance inthe ports sector, an identification mission was launched in February 1995 to discuss thestrategies and key issues, and to start preparatory works. A study was commissioned inlate May 1995 under Danish Trust Fund financing to: (i) prepare an overall portdevelopment program for Massawa (Phase I for the year 1995 to 2005) including trafficforecasting and engineering works for the rehabilitation of Berths 5 and 6; (ii) prepare aprogram for improvements in port operations; and (iii) recommend appropriateimprovements in administrative and management systems. The project was pre-appraisedin January 1996, appraised in April 1996, and post-appraised in April 1997.
B. OBJECTIVES
3.2 The proposed project is the first phase of the Government's program fordevelopment of the port sector. (The second and third phases wi]l be the subject of aDevelopment Study to be carried out under the project.) It supports the economic andrecovery program contained in the Government's Policy and Sector Strategy Papers(Macro-Policy), and in the Country Assistance Strategy (Report # 15324-ER, February 5,1996). The aim is for Eritrea to be an outward oriented and trading nation, and ports willtherefore play a critical role in the future expansion of the economy.
3.3 To address the urgent capacity requirements up to the year 2005, the proposedproject is designed to increase substantially the productivity and capacity of the two portsof Massawa and Assab. To this end, the project would provide the financial and technicalassistance required to rehabilitate and upgrade the two ports, optimizing the use ofexisting facilities, and to raise the quality and level of services to international standards.
C. PROJECT DESCRIPTION
3.4 In addition to the changes which are needed in the institutional set-up and in themanagement and operation of the two ports, investments in the infrastructure arenecessary to provide the capacity necessary to meet the forecast traffic demands. Theoverall composition of the proposed project is as follows:
Project Components
3.5 Civil Works (US$18.65 million)'. This component consists of repair,rehabilitation and extension of berths 5 and 6, dredging in front of the new berth 6 to 12 m
Amounts shown are basc costs.
- 14 -
depth, reclamation of land behind berth 6, and heavy duty pavement for the new containerstacking yard. Also included under this component are clearing of the apron and storageareas adjacent to berths 5 and 6, rehabilitation of the electrical and storm drainagesystems, a building for the port administration and customs authorities, a workshop, anequipment shed and improvements to warehouses in the port.
3.6 Cargo Handling Equipment (US$22.65 million). Most of the equipmentincluded in this component is for handling of containers. Investment in Massawa is for amobile container handling crane, tugmasters and trailers, a 20 ton mobile crane, a firefighting truck, shore cranes and cargo handling and communication equipment. Aprovisional sum for spare parts for repairs of old fork lift trucks and shore cranes, and apilot boat is also included. For Assab are included two mobile cranes to carry out ship-to-shore handling of containers, reach stackers for full and empty containers at the stackingyard, tugmasters and trailers, small fork lift trucks for stripping and stuffing containers andfor operating in the ship's hold, a 50 ton mobile crane and a fire fighting truck. Areplacement tugboat for Assab has also been included under this component.
3.7 Environment (US$1.6 million). Facilities and equipment, estimated atUS$800,000 for each of the two ports, have been included in the project to improveoperating practices regarding handling of hazardous cargo, as well as control of dischargeof bilge water and solid waste from ships, and oil spill combat equipment includingsupport in institutional building and training for the two ports to comply with a NationalOil Spill Contingency Plan, presently under preparation with assistance from theInternational Maritime Organization (IMO).
3.8 Training (US$0.6 million). The project will provide funds for training programs,particularly in the fields of port operations and equipment maintenance, including overseastraining at recognized international institutes, and/or at overseas ports with similarfacilities and operational constraints and systems. The training component will be closelycoordinated with the ongoing EPDP program (para. 2.6). Included in this component isalso equipment and non-wage operating costs for the Project Coordination Unit (PCU,para. 4. 1).
3.9 Consultancy Services (US$4.5 million). The project will include financing ofconsultancy services for: (i) supervision of the civil works in Massawa; (ii) short termexperts to assist in drafting technical specifications and bidding documents for equipmentand spare parts procurement, evaluation of bids and recommendations for award ofcontracts; (iii) specific studies in the field of maritime and port legislation, MIS, costaccounting, tariff analysis and commercialization of port activities; (iv) a study of the longterm development of the port sector (Phases II and III); and (v) short term technicalassistance in port management and operations, and equipment maintenance.
- 15 -
D. COST ESTIMATES
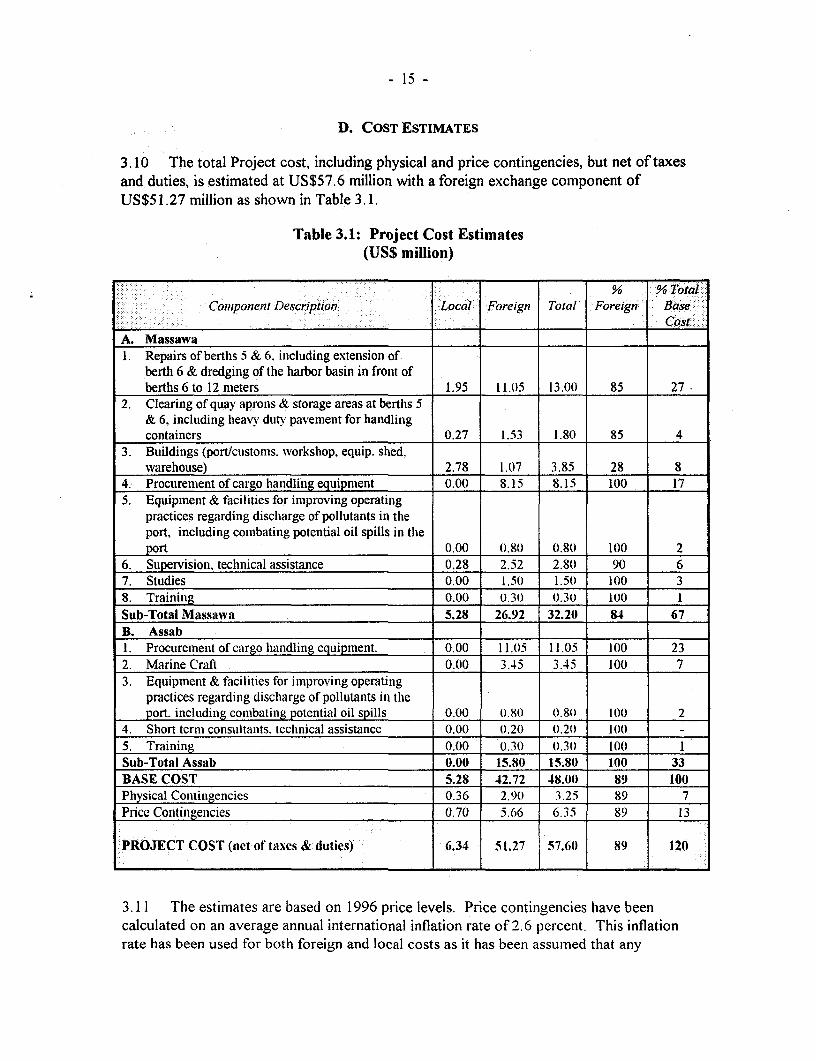
3.10 The total Project cost, including physical and price contingencies, but net of taxesand duties, is estimated at US$57.6 million with a foreign exchange component ofUS$51.27 million as shown in Table 3.1.
Table 3.1: Project Cost Estimates(US$ million)
% % Total..Component Description Local Foreign Total Foreign Base
-__________________________________________________ ._____ -___-__. Cost:A. Massawa1. Repairs of berths 5 & 6. including extension of
berth 6 & dredging of the harbor basin in front ofberths 6 to 12 meters 1.95 11.05 13.00 85 27
2. Clearing of quay aprons & storage areas at berths 5& 6, including heavy duty pavement for handlingcontainers 0.27 1.53 1.80 85 4
3. Buildings (port/customs. workshop, equip. shed.warehouse) 2.78 1.07 3.85 28 8
4. Procurement of cargo haiidling equipment 0.00 8.15 8.15 100 175. Equipment & facilities for improving operating
practices regarding disclharge of pollutants in theport, including combating potential oil spills in theport 0.00 0.80 0.80 100 2
6. Supervision, techniical assistance 0.28 2.52 2.80) 90 67. Studies 0.00 1.50 1.50( 100 38. Training 0.00 0.30 0.30 100 1Sub-Total Massawa 5.28 26.92 32.21 84 67B. Assab1. Procurement of cargo hanidling equipment. 0.00 11.0 11.05 100 232. Marine Crafi 0.00 3.45 3.45 100 73. Equipment & facilities for improving operating
practices regarding discharge of pollutants in theport. including combating potential oil spills 0.00 (.8( t).80 100 2
4. Short term consultanits. techliical assistance 0.00 0.2() 0.20 100 -
5. Training 0.00 0.30 0.30) 100 1Sub-Total Assab 0.00 15.80 15.80 100 33BASE COST 5.28 42.72 48.00 89 100Physical Continigencies 0.36 2.90 3.25 89 7Price Contingenicies 0.70 5.66 6.35 89 13
PROJECT COST (net of taxes & duties) 6.34 51.27 57.60 89 120
3.11 The estimates are based on 1996 price levels. Price contingencies have beencalculated on an average annual international inflation rate of 2.6 percent. This inflationrate has been used for both foreign and local costs as it has been assumed that any

- 16
differences between local and international price inflation will be offset by equivalentadjustments in Eritrea's foreign exchange rate. Physical contingencies of 10 percent havebeen added to the base cost of civil works. Price and physical contingencies total US$9.6million, or 20 percent of the total project cost.
E. FINANCING
3.12 IDA's contribution will be US$30.3 million, or 53 percent of the total project costnet of taxes. Italy has agreed to co-finance US$21.0 million of the cost of the Massawacomponent under an untied grant. The Grant Agreement was approved by the Board ofItalian Cooperation on July 26, 1996, and a Trust Fund Agreement was signed betweenItaly and IDA on October 22, 1996. An Agreement between Eritrea and IDA on purposesand terms and conditions for withdrawal of the Italian Grant was signed on June 9, 1997.The State of Eritrea will finance the local component of the project, estimated at theequivalent of US$6.3 million.
Table 3.2: Financing Plan(US$ million)
Project Con poM ent MDA Italy GOE Total %:IDA..7...... ... po GOE Tot.al7..... ..
A. Massawa 11.3 21.0 6.3 38.6 29
B. Assab 19.0 0.0 0.0 19.0 100
Total Project -30. 21.0 6.3 57.6 53
3.13 The Government's policy is that commercial entities like the ports would berequired to generate at a minimum revenues sufficient to cover working capitalrequirements and debt service obligations. The intention is therefore that the proposedIDA Credit of US$30.3 million, as well as the Italian Grant of US$2 1.0 equivalent, will beon-lent to the two ports at an interest rate equivalent to a commercial loan, and that theports would bear the foreign exchange risk.
3.14 Subsidiary loan agreements between the Government and each of the ports ofMassawa and Assab will be signed as soon as the new maritime and port legislation hasbeen completed, and the two ports have been granted their own financial autonomy. Asindicated in the Letter of Port Sector Policy, it is estimated that subsidiary loanagreements with the ports will signed and effective as of December 3 1, 1999.
- 17
4. PROJECT IMPLEMENTATION
A. INSTITUTIONAL RESPONSIBILITIES
4.1 Implementation of the project will be the responsibility of the Ministry ofTransport and Communication (MTC) through its Department of Maritime Transport(DMT). A Project Coordination Unit (PCU) has already been established for the life ofthe project and is located at the Port Liaison Office in Asmara. The unit is headed by aProject Coordinator, and includes financial and procurement expertise. The functions ofthe unit will include:
* Overall coordination of project activities
* Supervision of short-term consultants
* Project monitoring and evaluation:
Keeping project recordsPreparing project accountsMonitoring of procurementMonitoring of key performance indicatorsPreparing project reports (quarterly and annually)
- DisbursementsPreparing withdrawal applicationsMonitoring disbursementsOpening letters of creditSpecial Account
3 Procurement (either directly or through supervision of consultants)
4.2 To clarify the roles and responsibilities of each entity involved in projectimplementation, a Project Implementation Plan (PIP) has been prepared. The content ofthe PIP was discussed and agreed during negotiations. Annex 7 gives a summary chart of.the key project implementation steps; detailed implementation plans for the project as awhole and specific components are included in the PIP (copy in the Project Files).
4.3 A meeting of port users (port authorities, customs, representatives of the truckingindustry, shipping agencies, etc.) will be convened regularly (once every quarter) at eachport to report on project progress and discuss issues which may affect the port users in thecourse of project implementation.
- 18 -
B. PRoCuREMENT
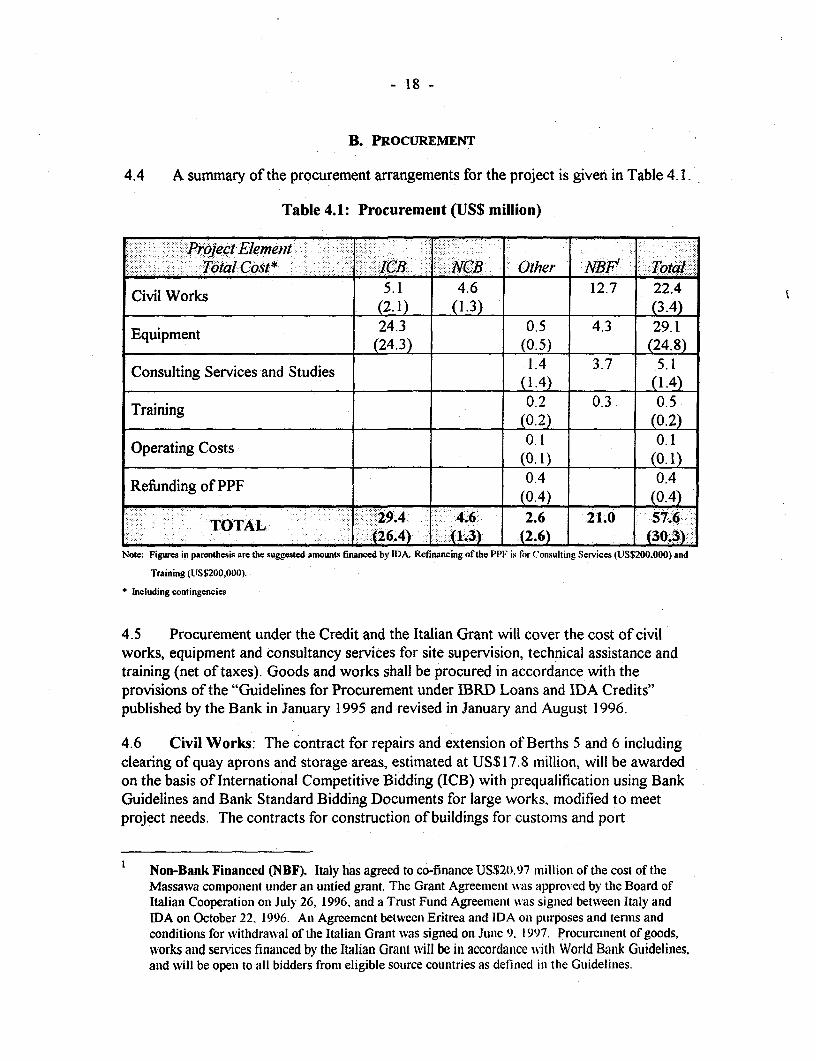
4.4 A summary of the procurement arrangements for the project is given in Table 4. 1.
Table 4.1: Procurement (US$ million)
Poect Element.... ... .T otal Cost*; IC NCB Other NBP Tolat.
Civil Works 5.1 4.6 12.7 22.4(2.1) (1.3) (3.4)
Equipment 24.3 0.5 4.3 29.1(24.3) (0.5) (24.8)
Consulting Services and Studies (1.4) 3.7 5.1_~~~~~~14 (1.)
Training (0.2 0.3 0.5Training ~~~______ (0.2) _ __ (0.2)
Operating Costs 0.1 0.1(0.1) (0.1)
Refunding of PPF 0.4 0.4(0.4) 0.4)Refunding of PPF (0.4) __2_.4 (014)
29.4- T A -4.6 2.6 21.0 57.6TOTAL:: :::E::;i : : ::: ;t -i(V26.4) (1.3) (2.) : (30.3-)
Note: Figures in parcnthesis are the suggested amounts financed by IDA. Refinancing of the PPF is for Consulting Services (US$200.000) and
Training (USS200.000).
* Including contingencies
4.5 Procurement under the Credit and the Italian Grant will cover the cost of civilworks, equipment and consultancy services for site supervision, technical assistance andtraining (net of taxes). Goods and works shall be procured in accordance with theprovisions of the "Guidelines for Procurement under IBRD Loans and IDA Credits"published by the Bank in January 1995 and revised in January and August 1996.
4.6 Civil Works: The contract for repairs and extension of Berths 5 and 6 includingclearing of quay aprons and storage areas, estimated at US$17.8 million, will be awardedon the basis of International Competitive Bidding (ICB) with prequalification using BankGuidelines and Bank Standard Bidding Documents for large works, modified to meetproject needs. The contracts for construction of buildings for customs and port
Non-Bank Financed (NBF). Italy has agreed to co-finance US$20.97 million of the cost of theMassawa component under an untied grant. The Grant Agreement was approved by the Board ofItalian Cooperation on July 26, 1996. and a Trust Fund Agreemenit was signed between Italy andIDA on October 22. 1996. An Agreement between Eritrea and IDA on purposes and termis andconditions for withdrawal of the Italian Grant was signed onl June 9. 1997. Procurement of goods,works and services financed by the Italian Grant wvill be in accordance with World Bank Guidelines,and will be open to all bidders from eligible source countries as defined in the Guidelinies.

- 19 -
administration, as well as a workshop, an equipment shed and improvements towarehouses in the port of Massawa, estimated at less than US$500,000 equivalent percontract up to an aggregate amount of US$4.6 million, will be awarded on the basis ofNational Competitive Bidding (NCB) procedures acceptable to IDA. This would includeadvertising the works, public opening of bids, clearly stated evaluation criteria and awardto the lowest bidder. Foreign bidders, if interested, would not be precluded fromparticipation. Assurances to this effect have been obtained and the NCB documents,based on World Bank Standard Bidding Documents, will be subject to prior review byIDA. The Civil Works contracts will be supervised by consulting firms appointed inaccordance with Bank guidelines.
4.7 Equipment: The different contracts for procurement of general cargo andcontainer handling equipment, as well as for the tug boat and equipment and facilities forimproving operating practices in the two ports, including equipment for fire fighting andcombating potential oil spills, estimated at in total US$28.6 million, will be procuredthrough ICB following the Bank guidelines and using Bank Standard Bidding Documentswith appropriate modifications. Small quantities of goods such as office equipment andsupplies, consumable materials and spare parts, which are normally available off-the shelfat competitive prices and cannot be grouped into packages of at least US$25,000, wouldbe procured through prudent national shopping, based on price quotations obtained fromat least three reliable suppliers, provided that the aggregate amount does not exceedUS$500,000.
4.8 Consultancy Services and Studies: Consultancy services funded under the Creditand the Italian Grant, totaling US$5.4 million, would be for: (i) supervision of civil works;(ii) short term experts to assist in drafting technical specifications and bidding documents.for equipment and spare parts procurement, evaluation of bids and recommendations foraward of contracts; (iii) specific studies in the field of maritime and port legislation, MIS,cost accounting, tariff analysis and commercialization of port activities; (iv) a study of thelong term development of the port sector (Phases II and III); and (v) short term technicalassistance in port management and operations, and equipment maintenance.
4.9 The consultancy services will be procured in accordance with the Bank'sGuidelines for the Selection and Employment of Consultants published in January 1997and using the Standard Form of Contract for Consultants Services. The services will beprocured through competition among qualified short-listed firms in which selection will bebased on Quality-and Cost-Based Selection (QCBS). For short term assignments(assistance in drafting bidding documents, specific studies in port legislation, MIS, costaccounting, tariff analysis and commercialization of port activities, technical assistance inport management and equipment maintenance) estimated to cost less than US$75,000 percontract up to an aggregate of US$500,000, the selection would be based on theConsultants' Qualifications. Single-Source Selection will be exceptionally used forvery small (short term) assignments estimated to cost less than US$25,000 per contract upto an aggregate of US$150,000, where a rapid selection is required and/or only onefirm/individual is qualified.
- 20 -
4.10 Short-lists for contracts (estimated at less than US$200,000 per contract) for thedesign and site supervision of buildings to be constructed in the port of Massawa (portadministration, customs, workshop, equipment shed, warehouses) may be comprisedentirely of national consultants if a sufficient number of qualified firms (at least three) areavailable at competitive costs. However, if foreign firms have expressed interest for thosecontracts, they will not be excluded from consideration. The standard Letter of Invitationand Form of Contracts as developed by the Bank will be used for appointment ofconsultants. Simplified contracts will be used for short-term assignments, i.e. those notexceeding three months, carried out by firms or individual consultants. The Governmenthas been briefed about the features of the new Consultants Guidelines (January 1997), inparticular with regard to advertisement and public bid opening.
4.11 Training: Selection of consultants and firms providing services for lectures andtraining, estimated to cost less than US$100,000 per contract up to an aggregate ofUS$700,000 will be based on the Consultants' Qualifications among those expressinginterests in the assignment or approached directly. Single Source Selection, estimated atless than US$25,000 per contract up to an aggregate of US$100,000, will be exceptionallyused for the training of management staff.
4.12 All IDA and Italian grant financed contracts for goods and works aboveUS$100,000 would be subject to prior review by IDA, as would all consultancy contractsfor firms above US$100,000 and for individuals above US$75,000. A GeneralProcurement Notice (GPN) was initially published in the Development Business Forum onJune 16, 1996, and an update of the GPN was published in issue 464 of June 16, 1997.An invitation for prequalification of civil works contractors was published on June 16,1997. Specific procurement notices will be published as per the Guidelines.
4.13 The PCU established for the project has already sent two of its key staff to attend aBank sponsored seminar in procurement of Goods and Equipment. The same staff arescheduled for similar training in Procurement of Works and Consulting Services, to becompleted by March 31, 1998. In preparing TORs, technical specifications and biddingdocuments, as well as for evaluating proposals and negotiating contracts, the PCU willalso have access to expertise from DMT's Engineering Department, and short termConsultants from specialized firms. The importance of having PCU adequately staffed forcarrying out procurement efficiently during the implementation of the project wasdiscussed and agreed with the Borrower during post-appraisal.
4.14 At negotiations, standard procurement processing time for key activities wereagreed with the Borrower, and are reflected in the PIP.
- 21 -
C. DISBURSEMENT
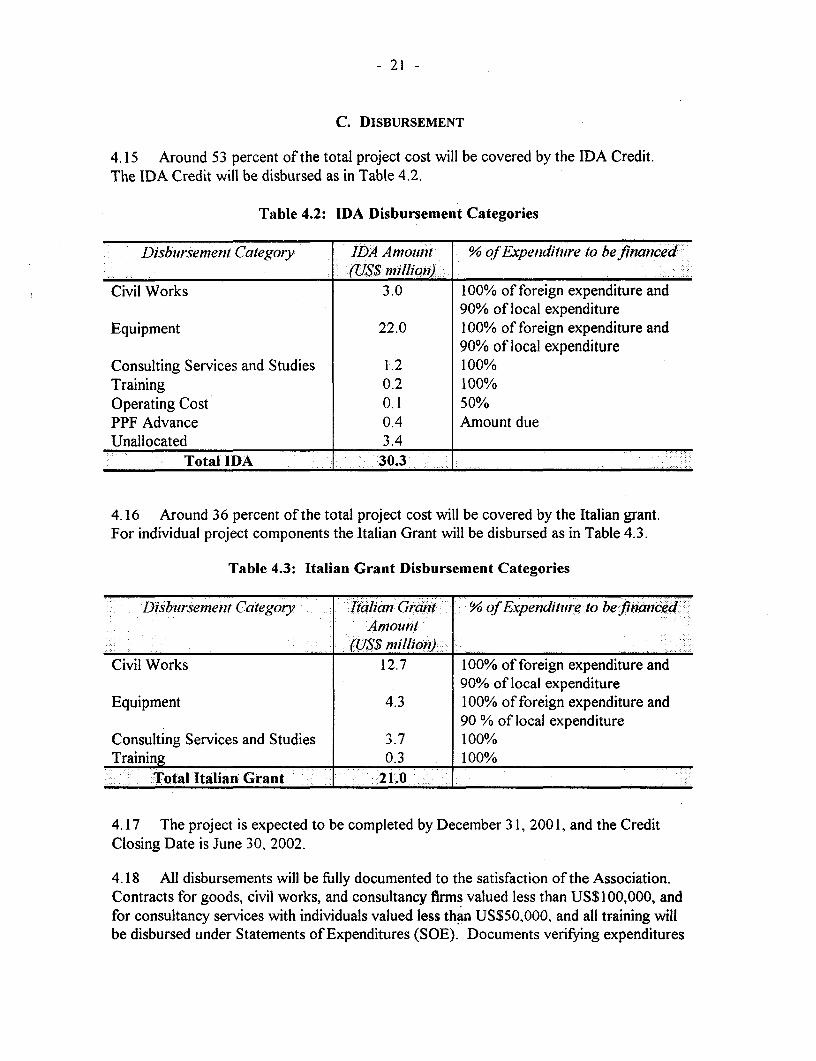
4.15 Around 53 percent of the total project cost will be covered by the IDA Credit.The IDA Credit will be disbursed as in Table 4.2.
Table 4.2: IDA Disbursement Categories
Disbutrsenenil (Category IDA Amount % of Expenidituire to be financed-(USS nillion,)
Civil Works 3.0 100% of foreign expenditure and90% of local expenditure
Equipment 22.0 100% of foreign expenditure and90% of local expenditure
Consulting Services and Studies 1.2 100%Training 0.2 100%Operating Cost 0.1 50%PPF Advance 0.4 Amount dueUnallocated 3.4
Total IDA 30.3 _-
4.16 Around 36 percent of the total project cost will be covered by the Italian grant.For individual project components the Italian Grant will be disbursed as in Table 4.3.
Table 4.3: Italian Grant Disbursement Categories
Disbtursemetnt Category Italian Grant % of Expendituire to be finanicedAmounit
(USS million) :-Civil Works 12.7 100% of foreign expenditure and
90% of local expenditureEquipment 4.3 100% of foreign expenditure and
90 % of local expenditureConsulting Services and Studies 3.7 100%Training 0.3 100%
Total Italian Grant 21.0
4.17 The project is expected to be completed by December 3 1, 200 1, and the CreditClosing Date is June 30, 2002.
4.18 All disbursements will be frilly documented to the satisfaction of the Association.Contracts for goods, civil works, and consultancy firms valued less than US$ 100,000, andfor consultancy services with individuals valued less than US$50,000, and all training willbe disbursed under Statements of Expenditures (SOE). Documents verifying expenditures
- 22 -
under the SOE procedures will be retained for review by IDA supervision missions. Tofacilitate the availability of funds for the Project, a Special Account would be establishedand maintained on terms and conditions satisfactory to IDA. An initial deposit ofUS$500,000 will be replenished on the basis of satisfactory documentary evidence,provided to IDA, of eligible payments made from the account for goods and servicesrequired for the Project. An estimated schedule of disbursement of the proceeds from the.IDA Credit and the Italian Grant are in Annex 8.
D. REPORTING AND AUDITING
4.19 The PCU (DMT) will be responsible for accounting, audit and financial reportingactivities. Funds accounts will be maintained in accordance with Generally AcceptedAccounting Standards (GAAS) on a PC-based accounting program. Training will beprovided to the PCU staff to familiarize them with the accounting and MIS programsbefore the beginning of project implementation. The annual financial statements will beaudited in accordance with International Standards of Auditing by independent auditorsacceptable to the Government and IDA.
4.20 The Project's audited financial statements with the auditor's report thereon, andthe auditor's management letter covering internal control and any accounting proceduresweaknesses discovered as a result of the audit, will be sent to IDA within six months ofthe end of the period audited.
4.21 The DMT will also have the financial statements of Massawa and Assab portsaudited by independent auditors acceptable to the Government and IDA. The auditedaccounts of the two ports will be sent to IDA not later than six months after the end of thefiscal year.
4.22 DMT through the PCU will be responsible for overall Project reporting and willprovide quarterly progress reports. DMT will also be responsible for the preparation of anevaluation report on the project's execution and initial operation, which will be annexedunedited to the Implementation Completion Report (ICR) to be finalized within sixmonths of the closing date of the proposed project.
E. MONITORING AND SUPERVISION
4.23 To facilitate control and monitoring, the PCU will maintain a projectimplementation schedule which is being prepared using computerized network software.This will enable the PCU to monitor and track project progress in procurement,disbursements and implementation, and to take remedial action where necessary.
4.24 The PIP includes an agreed format of a quarterly progress report, which IDAshould receive from the PCU on implementation progress of the project. The quarterlyreport will also include port statistics including operational performances of the two ports.

- 23 -
A set of key performance indicators on improvements in cargo handling capacities andoperational productivity to be attained during the implementation of the project have beenagreed with DMT and are included in Annex 6.
4.25 IDA would monitor project implementation through field visits, implementationsupport missions, reviews of progress reports and consultations with the borrower and thetwo ports. Estimates of timing of IDA missions, areas of focus, skills requirements andinputs are outlined in Annex 5. On or around November 30, 1999, the Government wouldconvene a mid-term review mission. The objective of the mission would be to review theoverall status of project implementation, adherence to the implementation plan, anddetermine any required changes in design or implementation arrangements needed toensure achievement of the project's development objectives. Specifically, the reviewmeeting would focus on the status of progress in: (i) revise and enact the country'smaritime legislation; (ii) revise and enact legislation to establish the two ports as separatejuridical authorities; (iii) establish the minimum return the Government expects the portsto generate from their operations; (iv) establish a capital structure for each port authority,including the terms and conditions of long-term debt in this structure; and (v) establish apolicy for the financing of future investments in the port sector.

- 24 -
5. ECONOMIC ANALYSIS
A. BACKGROUND
5.1 The ports of Massawa and Assab perform substantially different roles for theEritrean economy:
Massawa: the port is the land-sea interface for Eritrean overseas trade. The porthas been used quite extensively for food relief to Northern Ethiopia but transittraffic now forms only a small part of total port traffic. The port has littlecompetition for Eritrean cargo as both Assab and Port Sudan are very inadequatesubstitutes.
Assab: the main transit port for Ethiopian trade which handles very little Eritreandry cargo. The oil refinery does supply Eritrea but oil traffic will be little affectedby the proposed project. The port could be characterized as a revenue andemployment generating enterprise for the Eritrean economy. While Assabpresently handles 85 percent of Ethiopia's overseas trade, Djibouti is a potentialalternative and increasing efforts are being made to improve its links with Ethiopia.
5.2 These rather different roles have important implications for the distribution ofbenefits generated by the proposed port investments. Such benefits are normallydistributed between the port operator and the port users. In the case of Assab, many ofthe port user benefits will accrue to the Ethiopian economy and this, together with thepotential competition from the port of Djibouti, has to be factored into the analysis inorder to obtain the likely benefits to the Eritrean economy.
5.3 The proposed investments have been evaluated using standard port appraisalmethodology and techniques, assessing the implications of port traffic, cargo handlingrates and berth capacity on berth occupancy, shipping delays and thus user costs. Theanalysis is based on queuing theory with a random arrival pattern for ships and 'Erlang 2'distributions for ship service times'. These statistical distributions were validated bycomparison to the actual arrival and service patterns at the two ports. The costs andbenefits of the proposed investments are estimated net of indirect taxes and other transferpayments. Shadow pricing of unskilled labor and other local costs was not consideredrelevant to the analysis because:
* a very high proportion of the costs (almost 90 percent) and all the benefits(reduced shipping costs) will be in foreign exchange; and
* unskilled labor will form a very small proportion of total construction costs and aneven smaller proportion of changes in port operating costs, given the type ofequipment used.
UNCTAD "Port Development", Second Edition. New York, 1985

- 25 -
B. MASSAWA PORT INVESTMENT2
The Demand for Port Services
5.4 Traffic at the port of Massawa has undergone very substantial changes since 1994with a major decline in food imports and increases in cement and general cargo imports.There is an extremely limited database upon which to forecast future traffic and,consequently, forecasts must be treated with caution and additional weight given to theproject sensitivity analysis.
Table 5.1 - Massawa Port: Traffic Forecasts
Low Traffic Base Traffic High Traffic
Population growth p.a. (%) 2.7 2.7 2.7
GNP growth p.a. (%) 3.0 7.5 9.0
Cereals production p.a. (%) 3.0 6.0 8.0
Traffic 2000 '000 tonnes
Bulk 210 120 70
Bagged 295 380 440
Break bulk 195 235 310
Container 80 135 170
Total 780 870 990
Traffic 2005 '00 toines
Bulk 245 110 65
Bagged 345 410 550
Break bulk -225 255 270
Container 105 230 325
Total 920 1,005 1,210
5.5 In terms of port services, there is relatively little difference in the handling rates forbulk and bagged cargo. The important differences are with respect to break bulk andcontainer traffic which presently have very low handling productivity at Massawa.
2 The analysis of the Massawa Port Component is detailed in Annex I

- 26 -
Operational Impact of Proposed Investments
5.6 Without a significant increase in effective port capacity, Massawa will not be ableto handle the base traffic forecast. The total forecast tonnage grows at a relatively modestrate but there is a significant shift to containers and general cargo. Berth occupancy willbe 92 percent in 2000, with very long berthing delays, and 106 percent in 2005, which isnot feasible (100 percent berth occupancy would theoretically result in an infinite berthingdelay). Some expansion in port capacity is thus urgently required, if Massawa is to servicethe expanding Eritrean economy.
5.7 The investment proposed for the port of Massawa can be conceptually consideredas three distinct and separable components:
* Clearance and rationalization of cargo handling and storage areas, combined withimproved handling operations and management;
* New general cargo handling equipment which will only become fully effective withthe rationalized cargo working areas; and
* Repair of berths Nos. 5 & 6, extension of berth 6, deepening of the berth draft to12 meter, and the provision of specialized ship-to-shore container handlingequipment.
5.8 The expected impact of the investment on cargo handling productivity, berthoccupancy.and berthing delays is detailed in Table 5.2. The effects of each component areassessed sequentially, in order of their cost.
Table 5.2 - Massawa Port: Impact of Port Investments
(i) Cargo Handling Productivity (tonnes/day)
ACargo Category Without Rationalization of New HandlingProect -Cargo Handling Areas Equipment
Bulk Cargo 850 950 1100
Bagged Cargo 900 1,000 1200
Break Bulk Cargo 200 230 270
Containers 720 1,375 2,350*
Ferry Cargo 65 65 65* possible only with extension of Berth No. 6
- 27 -
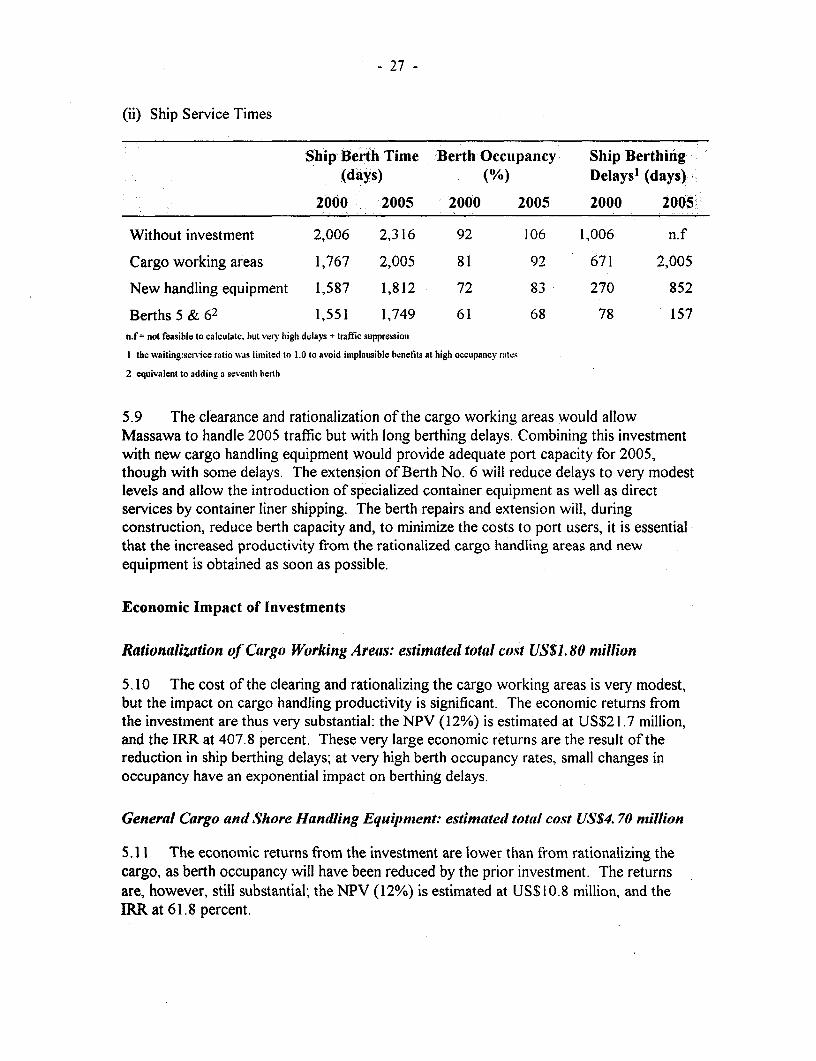
(ii) Ship Service Times
Ship Berth Time Berth Occupancy Ship Berthing(days) (8/e) Delays' (days)
2000 2005 2000 2005 2000 2005
Without investment 2,006 2,316 92 106 1,006 n.f
Cargo working areas 1,767 2,005 81 92 671 2,005
New handling equipment 1,587 1,812 72 83 270 852
Berths 5 & 62 1,551 1,749 61 68 78 157n.f = not feasible to calculate. hut very high dolays + traffic suppression
I the waiting:service ratio %%as limited to 1.0 to avoid inmplausible benefits at high occupancy ratczi
2 equivalent to adding a seventh berth
5.9 The clearance and rationalization of the cargo working areas would allowMassawa to handle 2005 traffic but with long berthing delays. Combining this investmentwith new cargo handling equipment would provide adequate port capacity for 2005,though with some delays. The extension of Berth No. 6 will reduce delays to very modestlevels and allow the introduction of specialized container equipment as well as directservices by container liner shipping. The berth repairs and extension will, duringconstruction, reduce berth capacity and, to minimize the costs to port users, it is essential*that the increased productivity from the rationalized cargo handling areas and newequipment is obtained as soon as possible.
Economic Impact of Investments
Rationalization of Cargo Working Areas: estimated total cost US$1. 80 million
5.10 The cost of the clearing and rationalizing the cargo working areas is very modest,but the impact on cargo handling productivity is significant. The economic returns fromthe investment are thus very substantial: the NPV (12%) is estimated at US$21.7 million,and the IRR at 407.8 percent. These very large economic returns are the result of thereduction in ship berthing delays; at very high berth occupancy rates, small changes inoccupancy have an exponential impact on berthing delays.
General Cargo and Shore Handlling Equipment: estimatedl total cost US$4.70 million
5.11 The economic returns from the investment are lower than from rationalizing thecargo, as berth occupancy will have been reduced by the prior investment. The returnsare, however, still substantial; the NPV (12%) is estimated at US$10.8 million, and theIRR at 61.8 percent.
- 28 -
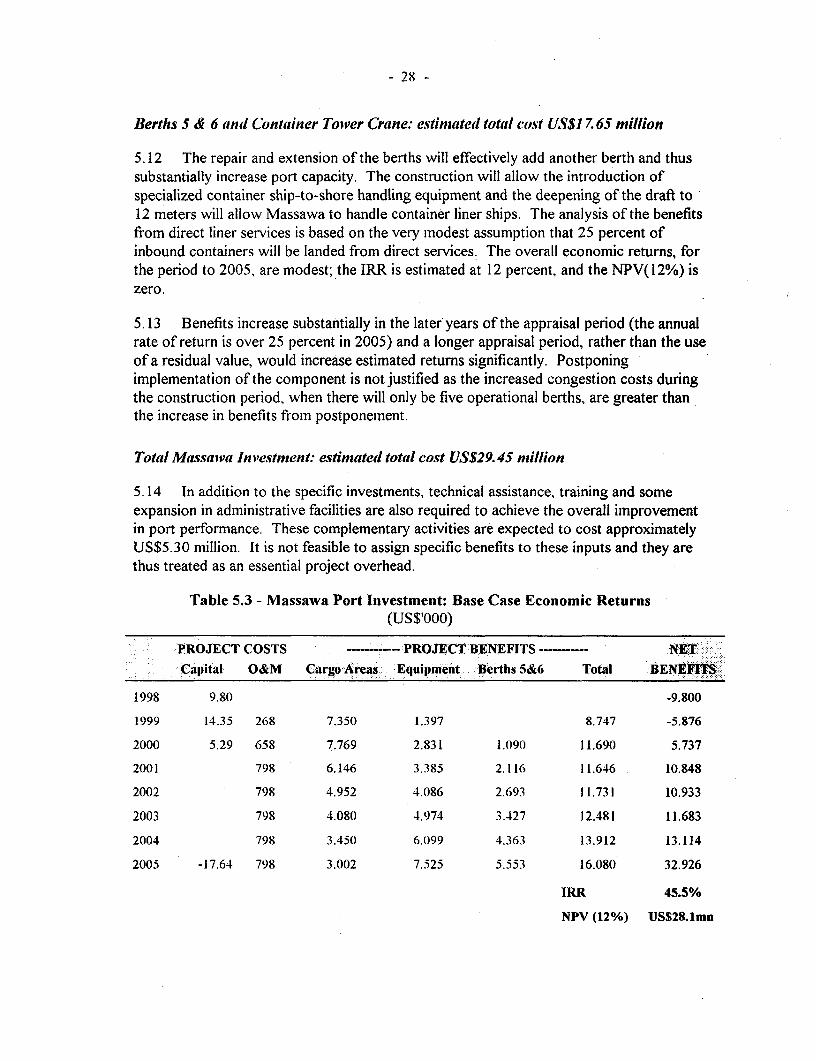
Berths 5 & 6 and Container Tower Crane: estimated total cost US$17. 65 million
5.12 The repair and extension of the berths will effectively add another berth and thussubstantially increase port capacity. The construction will allow the introduction ofspecialized container ship-to-shore handling equipment and the deepening of the draft to12 meters will allow Massawa to handle container liner ships. The analysis of the benefitsfrom direct liner services is based on the very modest assumption that 25 percent ofinbound containers will be landed from direct services. The overall economic returns, forthe period to 2005, are modest; the IRR is estimated at 12 percent, and the NPV(12%) iszero.
5.13 Benefits increase substantially in the later years of the appraisal period (the annualrate of return is over 25 percent in 2005) and a longer appraisal period, rather than the useof a residual value, would increase estimated returns significantly. Postponingimplementation of the component is not justified as the increased congestion costs duringthe construction period, when there will only be five operational berths, are greater thanthe increase in benefits from postponement.
Total Massaiva Investment: estintated total cost US$29.45 million
5.14 In addition to the specific investments, technical assistance, training and someexpansion in administrative facilities are also required to achieve the overall improvementin port performance. These complementary activities are expected to cost approximatelyUS$5.30 million. It is not feasible to assign specific benefits to these inputs and they arethus treated as an essential project overhead.
Table 5.3 - Massawa Port Investment: Base Case Economic Returns(US$'000)
PROJECT COSTS ------- PROJECT BENEFITS -------- NET -Capital O&M CargoAreas& -Equipmentt, Berths 5&6 Total BENEFTS.
1998 9.80 -9.800
1999 14.35 268 7.350 1.397 8.747 -5.876
2000 5.29 658 7.769 2.831 1.09() 11.690 5.737
2001 798 6.146 3.385 2.116 11.646 10.848
2002 798 4.952 4.086 2.693 11.731 10.933
2003 798 4.080 4.974 3.427 12.481 11.683
2004 798 3.450 6.099 4.363 13.912 13.114
2005 -17.64 798 3.002 7.525 5.553 16.080 32.926
IRR 45.5%
NPV (12%) US$28.1mn
- 29
5.15 Overall, the project generates a high economic rate of return which is notunexpected given that, without the investment, the port will become totally congested bythe year 2005 and Eritrea does not have a satisfactory alternative access to the sea trade.
5.16 The project also includes an investment of US$1.25 million for pollution and firecontrol. The investment will improve facilities for the discharge of pollutants and forcombating minor oil spills. In view of the very limited investment and the majorimprovement in environmental protection, this investment is considered very cost-effectiveand fully justified.
Sensitivity Analysis
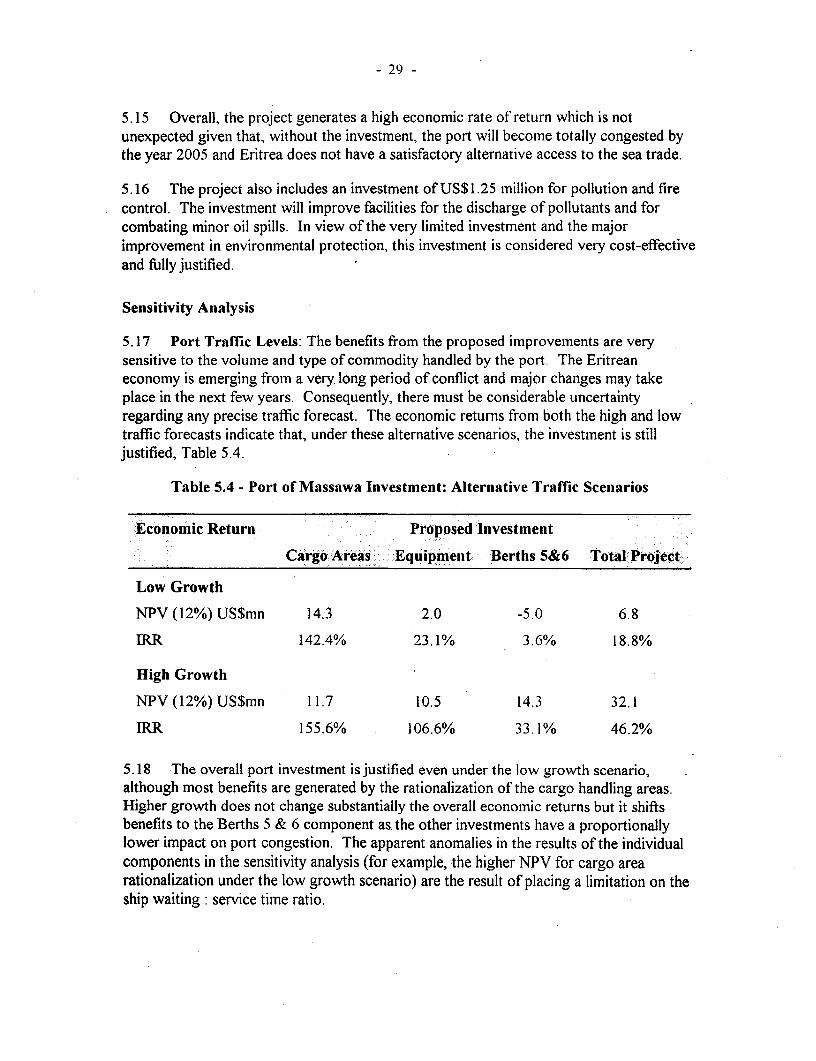
5.17 Port Traffic Levels: The benefits from the proposed improvements are verysensitive to the volume and type of commodity handled by the port. The Eritreaneconomy is emerging from a very long period of conflict and major changes may takeplace in the next few years. Consequently, there must be considerable uncertaintyregarding any precise traffic forecast. The economic returns from both the high and lowtraffic forecasts indicate that, under these alternative scenarios, the investment is stilljustified, Table 5.4.
Table 5.4 - Port of Massawa Investment: Alternative Traffic Scenarios
:Economic Return Proposed Investment
Cargo Areas- Equipment Berths 5&6 Total Project
Low Growth
NPV (12%) US$mn 14.3 2.0 -5.0 6.8
IRR 142.4% 23.1% 3.6% 18.8%
High Growth
NPV (12%) US$mn 11.7 10.5 14.3 32.1
IRR 155.6% 106.6% 33.1% 46.2%
5.18 The overall port investment is justified even under the low growth scenario,although most benefits are generated by the rationalization of the cargo handling areas.Higher growth does not change substantially the overall economic returns but it shiftsbenefits to the Berths 5 & 6 component as, the other investments have a proportionallylower impact on port congestion. The apparent anomalies in the results of the individualcomponents in the sensitivity analysis (for example, the higher NPV for cargo arearationalization under the low growth scenario) are the result of placing a limitation on theship waiting: service time ratio.
- 30 -
5.19 Project Investmeint Costs: The project is relatively insensitive to plausiblechanges in investment costs. Under the base level estimates, project costs would have toincrease by over 150 percent to reduce the economic return to 12 percent. Under the lowgrowth scenario, a 40 percent increase in project costs would reduce the economic returnto 12 percent. Such cost escalation is unlikely as the costs of the equipment (30 percentof project costs) are known, and detailed engineering studies have been undertaken.
5.20 Cargo Handling Rates: If the improvements in cargo handling rates are reducedto 50 percent of their expected levels, project benefits will be reduced significantly. Theproject is still, however, justified as the addition of the additional berth provides theadditional capacity required. The economic returns under the base and high growthscenarios remain over 30 percent but, under the low traffic scenario, the economic returnsfall to a rather marginal 12.2 percent. The estimated gains in cargo handling rates atMassawa will, however, only bring rates for bulk, bagged and break bulk cargo to levelsalready achieved at Assab and are considered fuilly feasible.
5.21 Overall Assessment of Project Sensitivity: the proposed project is justified as arelatively short-term capacity enhancing investment, irrespective of the traffic scenario.Even under the low traffic scenario (considered highly unlikely by the Government and thePort Authority), a satisfactory rate of return is generated and it would require almost a 40percent increase in project costs to reduce the rate of return to a marginal 12 percent.Under the high traffic scenario, additional port capacity would become desirable towardthe end of the project period, justifying the inclusion of a longer term planning componentwithin this project.
C. ASSAB PORT INVESTMENT 3
The Demand for Port Services
5.22 Over 95 percent of dry cargo transiting the port are Ethiopian imports or exports.Traffic demand is thus determined by the development of the Ethiopian economy and, inthe longer term, by Ethiopia's development of alternative transit routes4 . During theperiod 1994 - 1996, overall port tonnage changed little but there was a major shift fromfood imports to fertilizer and other imports. Economic growth in Ethiopia is still heavilydependent on agriculture which, in turn, depends on rainfall. Marked fluctuations in thevolume and composition in Ethiopian cargo are thus likely until the economy becomes lessdependent on agriculture. Traffic forecasts have been based on three scenarios for theEthiopian economy, Table 5.5. The most marked change in Assab traffic in recent years
For more detailed analvsis of the Assab Port Investment, see Anne.N 2
4 In the short-term. the land access routes to Djibotiti have severe operational constraints and largescale traffic diversion may not be a possibility. In the longer-terii. xvith the development of a moredirect road route. Djibouti m-ay become a much more serious competitor. Eveni in the short-term,howvever. Djibouti could capture more of Ethiopia's container traffic. if conditions at Assab %vere todeteriorate seriously.
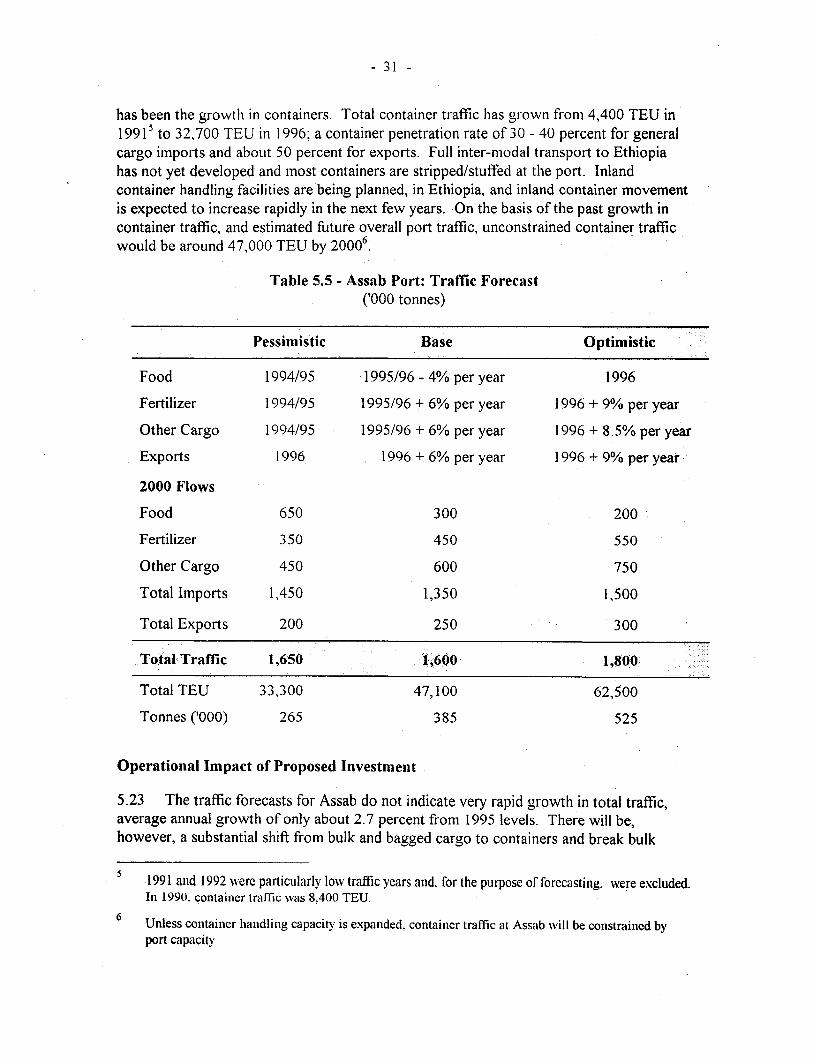
- 31l -
has been the growth in containers. Total container traffic has grown from 4,400 TEU in19915 to 32,700 TEU in 1996; a container penetration rate of 30 - 40 percent for generalcargo imports and about 50 percent for exports. Full inter-modal transport to Ethiopiahas not yet developed and most containers are stripped/stuffed at the port. Inlandcontainer handling facilities are being planned, in Ethiopia, and inland container movementis expected to increase rapidly in the next few years. On the basis of the past growth incontainer traffic, and estimated future overall port traffic, unconstrained container trafficwould be around 47,000 TEU by 20006.
Table 5.5 - Assab Port: Traffic Forecast('000 tonnes)
Pessimistic Base Optimistic
Food 1994/95 1995/96 - 4% per year 1996
Fertilizer 1994/95 1995/96 + 6% per year 1996 + 9% per year
Other Cargo 1994/95 1995/96 + 6% per year 1996 + 8.5% per year
Exports 1996 1996 + 6% per year 1996 + 9% per year
2000 Flows
Food 650 300 200
Fertilizer 350 450 550
Other Cargo 450 600 750
Total Imports 1,450 1,350 1,500
Total Exports 200 250 300
Total Traffic 1,650 1,600 1,800
Total TEU 33,300 47,100 62,500
Tonnes ('000) 265 385 525
Operational Impact of Proposed Investmeiit
5.23 The traffic forecasts for Assab do not indicate very rapid growth in total traffic,average annual growth of only about 2.7 percent from 1995 levels. There will be,however, a substantial shift from bulk and bagged cargo to containers and break bulk
5 1991 anid 1992 were particularly low traffic years and. for the purpose of forecasting. were excluded.In 1990. container traffic was 8.400 TEU.
6 Unless contaiiner handlinig capacity is expanded. container traffic at Assab will be constrained byport capacity
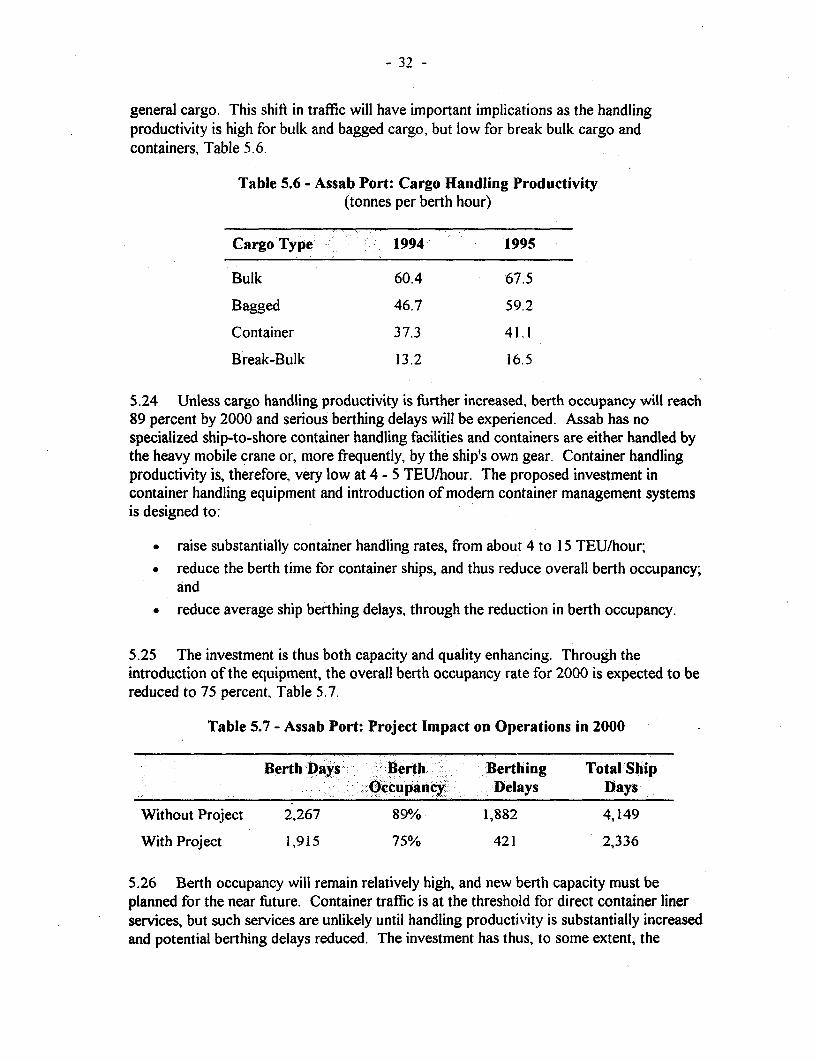
- 32 -
general cargo. This shift in traffic will have important implications as the handlingproductivity is high for bulk and bagged cargo, but low for break bulk cargo andcontainers, Table 5.6.
Table 5.6 - Assab Port: Cargo Handling Productivity(tonnes per berth hour)
Cargo Type 1994 1995
Bulk 60.4 67.5
Bagged 46.7 59.2
Container 37.3 41.1
Break-Bulk 13.2 16.5
5.24 Unless cargo handling productivity is further increased, berth occupancy will reach89 percent by 2000 and serious berthing delays will be experienced. Assab has nospecialized ship-to-shore container handling facilities and containers are either handled bythe heavy mobile crane or, more frequently, by the ship's own gear. Container handlingproductivity is, therefore, very low at 4 - 5 TEUlhour. The proposed investment incontainer handling equipment and introduction of modem container management systemsis designed to:
* raise substantially container handling rates, from about 4 to 15 TEU/hour;
- reduce the berth time for container ships, and thus reduce overall berth occupancy;and
* reduce average ship berthing delays, through the reduction in berth occupancy.
5.25 The investment is thus both capacity and quality enhancing. Through theintroduction of the equipment, the overall berth occupancy rate for 2000 is expected to bereduced to 75 percent, Table 5.7.
Table 5.7 - Assab Port: Project Impact on Operations in 2000
Berth Days :Berth . Berthing Total Shipf -Occupancy. : Delays Days
Without Project 2,267 89% 1,882 4,149
With Project 1,915 75% 421 2,336
5.26 Berth occupancy will remain relatively high, and new berth capacity must beplanned for the near future. Container traffic is at the threshold for direct container linerservices, but such services are unlikely until handling productivity is substantially increasedand potential berthing delays reduced. The investment has thus, to some extent, the

- 33
nature of a short-term emergency measure, until additional container berth capacity isprovided. None of the equipment will become redundant, however, with the provision ofspecialized container berths.
5.27 While berth occupancy is the primary source of ship delays, ships wait 20 hourslonger for a berth than is theoretically expected. Inadequate tug capacity (both thenumber and pulling power) combined with the high prevailing winds, during the periodOctober - May, is a major factor in these additional delays, although poor communicationsare also a contributing factor. The project will provide Assab with an additional powerfultug and this should substantially reduce the delays presently caused by inadequate tugcapacity.
Economic Impact of lnvestment
Potential Economic Returns on Container Handlling Equipment
5.28 If project benefits are calculated using the conventional methodology for portprojects, the returns from the investment are extremely high. Based on expectedreductions in ship berth time and berthing delays, port user costs will be reduced by almostUS$9.0 million in 2000. This must be compared with the component cost of US$1 1.1million (US$10.6 million for equipment and US$0.5 million for associated technicalassistance to improve operating systems). Even if it assumed that benefits remain constantthereafter, an economic return of over 50 percent is generated, Table 5.8.
Table 5.8 - Assab Port: Economic Analysis for Equipnment Investment
(i) User Cost Savings: 2000
Without Project With Project Net Benefits
Ship Days US$mn Ship Days US$mn US$mn
Berth time 2,267 10.65 1,915 9.00 1.65
Berthing delay 1,882 9.41 421 2.11 7.30
Total 4,149 20.06 2,336 11.11 8.95
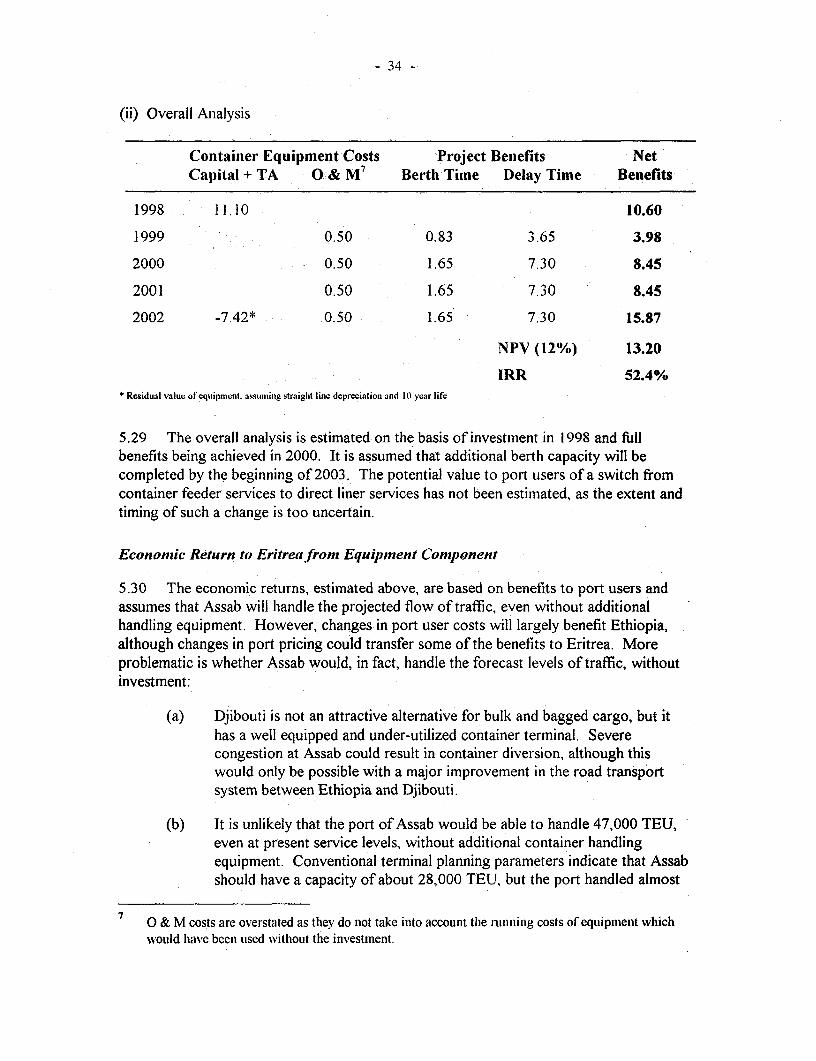
- 34 -
(ii) Overall Analysis
Containier Equipment Costs Project Benefits NetCapital + TA O& M7 Berth Time Delay Time Benefits
1998 11.10 10.60
1999 0.50 0.83 3.65 3.98
2000 0.50 1.65 7.30 8.45
2001 0.50 1.65 7.30 8.45
2002 -7.42* 0.50 1.65 7.30 15.87
NPV (120%) 13.20
IRR 52.4%* Residu:al value of equipmcnt. asumuing straigIlt line.depreciation and 10 year life
5.29 The overall analysis is estimated on the basis of investment in 1998 and fullbenefits being achieved in 2000. It is assumed that additional berth capacity will becompleted by the beginning of 2003. The potential value to port users of a switch fromcontainer feeder services to direct liner services has not been estimated, as the extent andtiming of such a change is too uncertain.
Economtc Return to Eritrea from Equipment Component
5.30 The economic returns, estimated above, are based on benefits to port users andassumes that Assab will handle the projected flow of traffic, even without additionalhandling equipment. However, changes in port user costs will largely benefit Ethiopia,although changes in port pricing could transfer some of the benefits to Eritrea. Moreproblematic is whether Assab would, in fact, handle the forecast levels of traffic, withoutinvestment:
(a) Djibouti is not an attractive alternative for bulk and bagged cargo, but ithas a well equipped and under-utilized container terminal. Severecongestion at Assab could result in container diversion, although thiswould only be possible with a major improvement in the road transportsystem between Ethiopia and Djibouti.
(b) It is unlikely that the port of Assab would be able to handle 47,000 TEU,even at present service levels, without additional container handlingequipment. Conventional terminal planning parameters indicate that Assabshould have a capacity of about 28,000 TEU, but the port handled almost
O & M costs are overstated as they do not take into account the niniiig costs of equipimienit whichwould have been used without the investment.

- 35 -
33,000 TEU in 1996. It is very doubtful, however, whether the port couldhandle the 40 percent growth forecast for 2000, without investment.
5.31 The overall rate of return for the Eritrean economy will depend partly on thepotential level of diversion to Djibouti, if no investment is made at Assab, and partly ondecisions on raising port charges on containers, to reflect the improved level of service. Itis clear, however, that adequate returns for the Eritrean economy can be generated, Table5.9. An increase in port charges of US$25/TEU (about 10 percent of existing rates)would be sufficient to generate a 12 percent return on the investment, even if Assab couldhandle as many as 42,500 TEU, without any investment.
Table 5.9 - Port of Assab: Potential Economic Rates to Eritrea(Economic Rate of Return)
Assab Capacity Increase in Container Handlinig Charges(TEU/year) No Increase US$15/TEU US$25/TEU
35,000 17.7% 23.9% 28.0%
37,500 12.5% 18.7% 22.8%
40,000 7.5% 13.5% 17.6%
42,500 2.6% 8.5% 12.5%
5.32 The realistic commercial capacity of Assab is probably in the range 37,500 -40,000 TEU, beyond which shippers would use alternative routes. An economic rate ofreturn for the Eritrean economy of at least 15 percent could be easily generated.
Economic Return on thte Environmental Protection Contponent
5.33 The project includes an investment of US$0.8 million for pollution controlequipment, mainly for combating minor oil spills. Assab handles a substantial flow of bothcrude oil and refined products, and the investment is considered very cost-effective andfully justified on environmental grounds.
Econontic Return on thte Tug Component
5.34 The present inadequate level of tug capacity raises considerable problems forvessels above 5,000 GRT. Particularly vulnerable to the strong winds (28 - 40 knotsduring October - May) are the crude oil tankers, half laden bulk carriers, and car carriers.The US$3.35 million investment in a tugboat of 2,000-2,400 BP is considered to be fullyjustified on both safety and environmental grounds. The pollution control equipmentprovided under the project could not handle a major incident with a crude oil carrier.
5.35 The tug investment will not only provide much needed security for the port butwill also assist in reducing berthing delays and thus port user costs. Without the required

- 36
tug capacity, larger vessels often have to wait for winds to diminish before berthing.Unfortunately the port authority does not keep the detailed records necessary to assess theprecise potential reduction in berthing delay. Average berthing delays are, however, 20hours higher than can be explained by berth occupancy. The tug would be economicallyjustified, if this 'unexplained' berthing delay was reduced by 25 percent (i.e. an average 5hours per vessel) with an economic rate of return of 1 1.8 percent. If the 'unexplained'berthing delay was reduced by 50 percent, to 10 hours per vessel, the economic rate ofreturn on the tug component would rise to almost 32 percent.
5.36 Assab Port management considers that a realistic estimate of the reduction will liesomewhere between these two estimates: the economic rate of return from a 7.5 hourreduction in berthing delays is 22.4 percent, with an NPV (12%) of US$1.77 million.
Sensitivity Analysis for Container Handling
5.37 On the basis of the central forecasts of traffic and cargo handling rates, theinvestment generates a high rate of return as a short-term measure before additional berthcapacity is constructed. The sensitivity of the economic feasibility of the project wasassessed by testing the analysis to the following changes in the underlying parameters:
(a) Port traffic: at high rates of berth occupancy, relatively small changes inport traffic have significant impacts on berthing delays and thus overall portuser costs; and
(b) Cargo handling rates: the cargo handling rates for the new containerequipment have been estimated on an extremely conservative basis (50percent of the potential). Much less certain are the cargo handling rates forother cargo categories and these will substantially affect overall berthoccupancy and delays. To test the sensitivity the central rates were variedby +1- 15 percent.
5.38 Over 95 percent of the investment is for standard container handling equipment;the cost of this equipment is well known and, consequently, such costs were not includedin the sensitivity testing, Table 5.10.
Table 5.10 - Port of Assab: Sensitivity Analysis - Container Handling Equipment(Economic Rate of Return)
Cargo Traffic Forecast
Cargo Handling Rate Pessimistict: C entral Optimistic
Low 72.6% * *
Central 14.6% 52.4% *
High (-) 7.8% 48.8%* Berth occupancy :- 100 percent. rates.of return very high
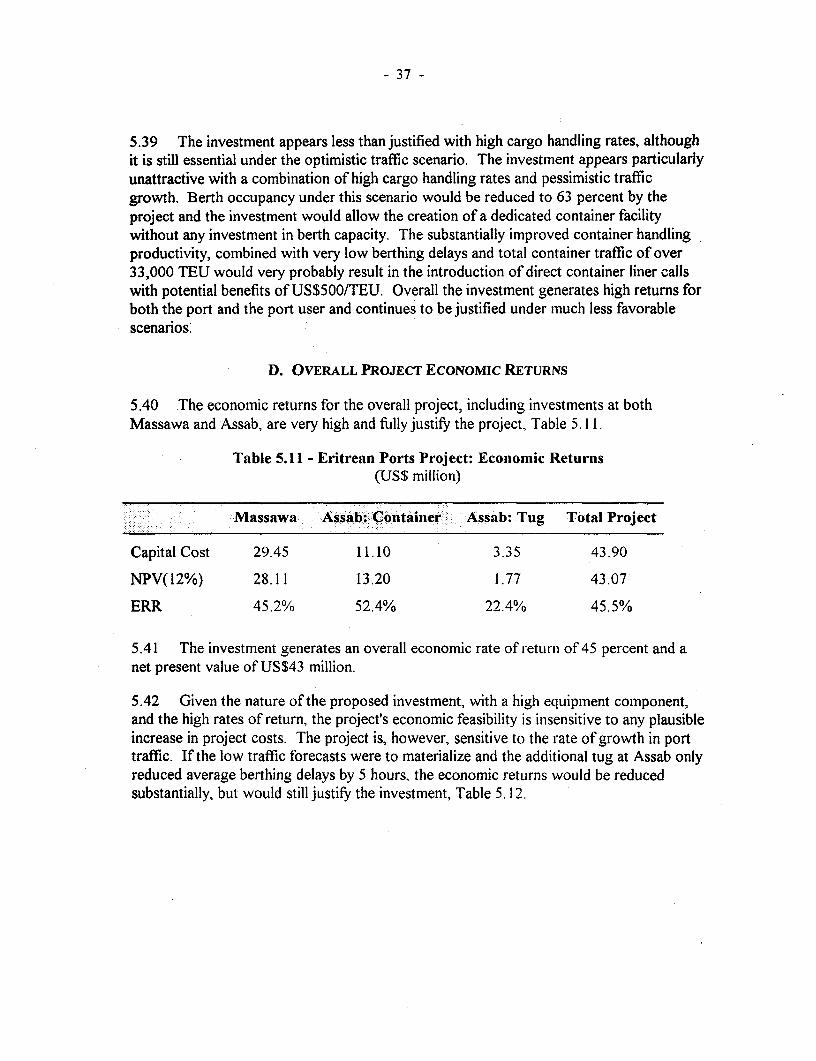
- 37 -
5.39 The investment appears less than justified with high cargo handling rates, althoughit is still essential under the optimistic traffic scenario. The investment appears particularlyunattractive with a combination of high cargo handling rates and pessimistic trafficgrowth. Berth occupancy under this scenario would be reduced to 63 percent by theproject and the investment would allow the creation of a dedicated container facilitywithout any investment in berth capacity. The substantially improved container handlingproductivity, combined with very low berthing delays and total container traffic of over33,000 TEU would very probably result in the introduction of direct container liner callswith potential benefits of US$500/TEU. Overall the investment generates high returns forboth the port and the port user and continues to be justified under much less favorablescenarios;
D. OVERALL PROJECT ECONOMIC RETURNS
5.40 The economic returns for the overall project, including investments at bothMassawa and Assab, are very high and fully justify the project, Table 5. 1 1.
Table 5.11 - Eritrean Ports Project: Ecoitomic Returns(US$ million)
Massawa Assab: Container Assab: Tug Total Project
Capital Cost 29.45 11.10 3.35 43.90
NPV(12%) 28.11 13.20 1.77 43.07
ERR 45.2% 52.4% 22.4% 45.5%
5.41 The investment generates an overall economic rate of return of 45 percent and anet present value of US$43 million.
5.42 Given the nature of the proposed investment, with a high equipment component,and the high rates of return, the project's economic feasibility is insensitive to any plausibleincrease in project costs. The project is, however, sensitive to the rate of growth in porttraffic. If the low traffic forecasts were to materialize and the additional tug at Assab onlyreduced average berthing delays by 5 hours, the economic returns would be reducedsubstantially, but would still justify the investment, Table 5. 12.
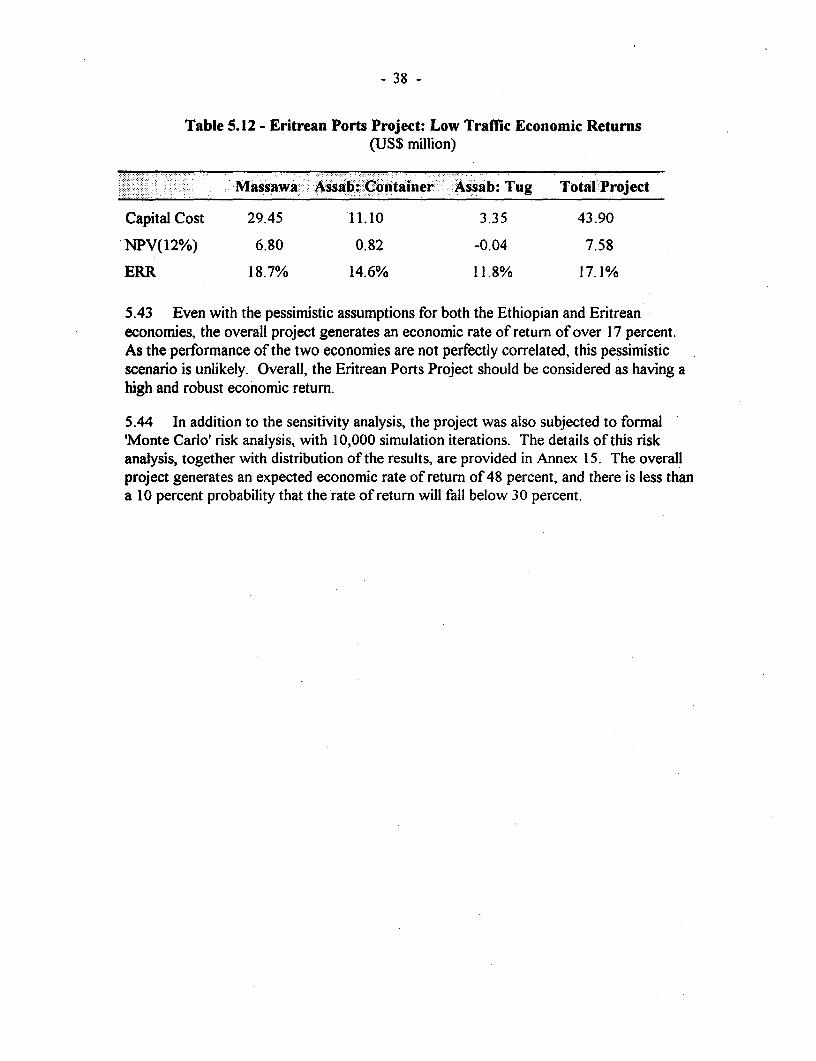
-38-
Table 5.12 - Eritrean Ports Project: Low Traffic Economic Returns(US$ million)
Massawa: As :b Cntainer ;Asab: Tug Total Project
Capital Cost 29.45 11.10 3.35 43.90
NPV(12%) 6.80 0.82 -0.04 7.58
ERR 18.7% 14.6% 11.8% 17.1%
5.43 Even with the pessimistic assumptions for both the Ethiopian and Eritreaneconomies, the overall project generates an economic rate of return of over 17 percent.As the performance of the two economies are not perfectly correlated, this pessimisticscenario is unlikely. Overall, the Eritrean Ports Project should be considered as having ahigh and robust economic return.
5.44 In addition to the sensitivity analysis, the project was also subjected to formal'Monte Carlo' risk analysis, with 10,000 simulation iterations. The details of this riskanalysis, together with distribution of the results, are provided in Annex 15. The overallproject generates an expected economic rate of return of 48 percent, and there is less thana 10 percent probability that the rate of return will fall below 30 percent.
- 39 -
6. FINANCIAL ANALYSIS
A. SECTOR FINANCIAL ISSUES
6.1 Tariffs and Costing System: The current structure and levels of tariffs for shipservices and cargo handling were established in May 1993. Both MPA and APA applythe same tariffs, which are quoted in US dollars. Eritrean and Ethiopian nationals andships can make payments in Birr, while others are required to pay in hard currency; it isestimated that about 40 percent of the port revenues are paid in hard currency.
6.2 The level and structure of tariffs are based on APA's operational costing system,which was developed in 1987 with financing under a World Bank Credit. According toAPA, its operational costing system captures most of its operating costs, including thedepreciation charges of its operational fixed assets at replacement cost. Although APAhas carried out asset revaluation and implements an operational costing system, MPA hasnot conducted an asset evaluation and does not have a costing system. APA has notapplied the re-valued assets in its financial statements. Since MPA and APA differ inrevenue pattern, cost structure and level of capital investment, MPA may need toestablish its own tariffs under the new institutional setup. Assistance for tariff reviewsand asset revaluation for MPA and APA is to be provided under the project.
6.3 Audit: The Audit Service Corporation has recently completed the auditing ofAPA's accounts for 1994 and 1995, and will complete the 1992 to 1995 accounts forMPA during the first quarter of 1998. It is estimated that the audit of MPA's and APA'saccounts for 1996 will be completed by June 30, 1998. During project implementation,financial statements, project accounts, special accounts and statements of expenditures forthe project as well as for MPA and APA will be audited in accordance with InternationalStandards of Auditing by independent auditors acceptable to the Government and IDA,and will be submitted to the IDA within six months from the closing of the financial year.
6.4 Future Financial Restructuring of Port Authorities: The Government'spolicy, as outlined in the Letter of Sector Policy (Annex 4), is to develop a framework forthe efficient commercial management and operation of the ports of Assab and Massawa.To implement this policy, the Governent plans to take the following measures:
(i) enact legislation to re-establish the port authorities as separatejuridical and commercially autonomous enterprises;
(ii) define a capital structure and set overall financial performancegoals for the re-established entities; these measures would set, ineffect, the financial terms and conditions under which the existingcapital employed in the ports would be inherited by the newentities; and
(iii) establish the terms and conditions under which the Governmentwould provide financing for investments by the ports in the future.

- 40 -
During negotiations, it was confirmed that, consistent with the above performancefiamework, all IDA financing under this project would be on-lent to the ports oncommercial terms.
6.5 The implementation of the measures envisage by the Government would requiresubstantial preparatory work including: (a) confmrmation of the existing assets andliabilities of the ports; (b) revaluation of the fixed assets of the ports to set an appropriateeconomic measure of the value of capital employed by the entities; (c) assessments of theperformance potential of the ports authorities given evolving competitive conditions andtheir plans for investments, training and modernization of their business planning andcontrol systems. Much of this preparatory work is already under way and would befurther supported by assistance to be provided under the project. The Government hasconfirmed in the Letter of Port Sector Policy (Annex 4) that all the required activitieswould be completed by December 31, 1999, and that the policy framework, including theterms and conditions for on-lending IDA funds (among other resources), would also be inplace by that date.
B. PORT OF MASSAWA
Financial Performance of the Massawa Port Administration during 1992-19%
6.6 MPA's summary financial performance for 1992-96 is as follows; detailedfinancial statements are in Annex 11:
............ . . .......... ....,
Revenues (Birr million) 32 35 64 51 54Operating Margin (%) 26 52 62 55 57ReturnonTotalNetAssets(%) - 13 22 13 13A/C Receivable (Month) - 19 18 26 27
_arg. 1. 57 .. 1 . .. I .= ._
6.7 Revenues and Operating Margin: MPA's revenue and operating margin havebeen steadily increasing. From 1993 to 1994, MPA's revenue increased by 80 percentfrom Birr 35.6 million to Birr 64.5 million because of the over 90 percent increase incargo volume (mainly due to a surge of aid cargo). For the period of 1995 and 1996, theannual revenue amounted to some Birr 50 million, which seems to be the intrinsic levelfor MPA.
6.8 Over the past five years, cargo handling charges accounted for over 45 percent oftotal revenue, followed by storage penalty (20 percent) and equipment hire (15 percent).
6.9 Over the period 1993-96, MPA's operating margin (which equals its profits, sinceMPA has no debt service obligations) increased 60 percent from Birr 18.7 million to Birr30.8 million. Its profit margin has been consistent at around 50-60 percent throughout
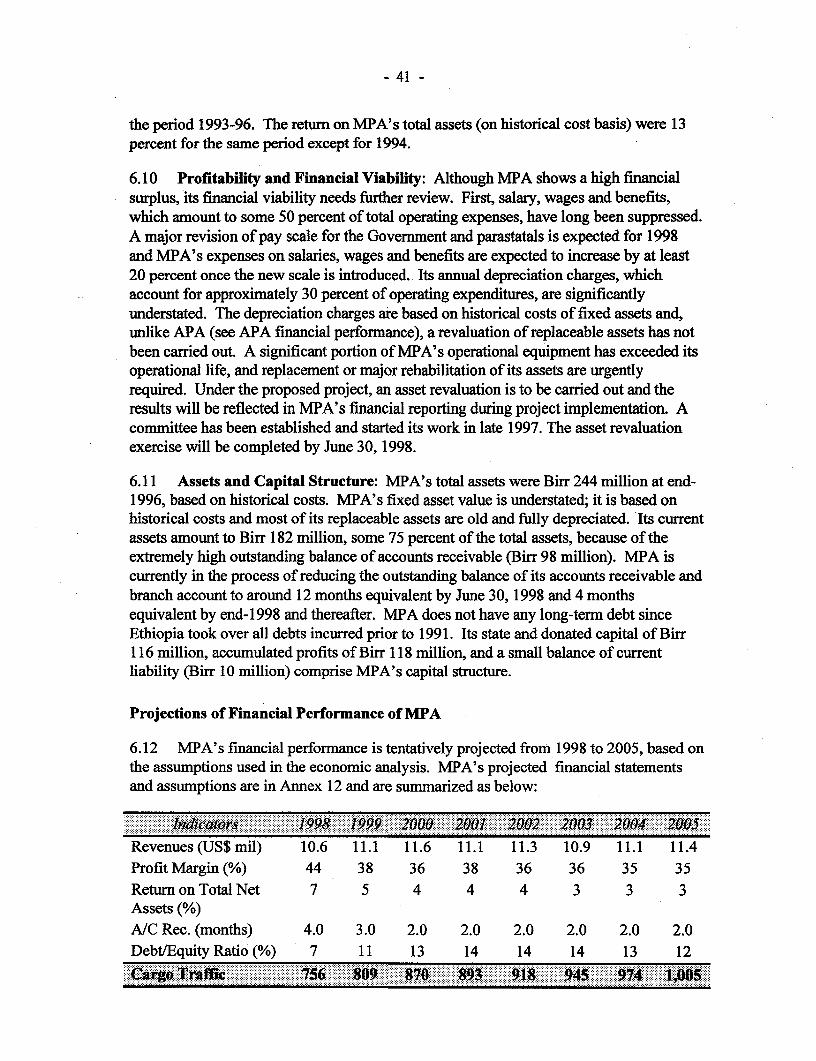
- 41 -
the period 1993-96. The return on MPA's total assets (on historical cost basis) were 13percent for the same period except for 1994.
6.10 Profitability and Financial Viability: Although MPA shows a high financialsurplus, its financial viability needs further review. First, salary, wages and benefits,which amount to some 50 percent of total operating expenses, have long been suppressed.A major revision of pay scale for the Government and parastatals is expected for 1998and MPA's expenses on salaries, wages and benefits are expected to increase by at least20 percent once the new scale is introduced. Its annual depreciation charges, whichaccount for approximately 30 percent of operating expenditures, are significantlyunderstated. The depreciation charges are based on historical costs of fixed assets and,unlike APA (see APA financial performance), a revaluation of replaceable assets has notbeen carried out. A significant portion of MPA's operational equipment has exceeded itsoperational life, and replacement or major rehabilitation of its assets are urgentlyrequired. Under the proposed project, an asset revaluation is to be carried out and theresults will be reflected in MPA's financial reporting during project implementation. Acommittee has been established and started its work in late 1997. The asset revaluationexercise will be completed by June 30, 1998.
6.11 Assets and Capital Structure: MPA's total assets were Birr 244 million at end-1996, based on historical costs. MPA's fixed asset value is understated; it is based onhistorical costs and most of its replaceable assets are old and fully depreciated. Its currentassets amount to Birr 182 million, some 75 percent of the total assets, because of theextremely high outstanding balance of accounts receivable (Birr 98 million). MPA iscurrently in the process of reducing the outstanding balance of its accounts receivable andbranch account to around 12 months equivalent by June 30, 1998 and 4 monthsequivalent by end-1998 and thereafter. MPA does not have any long-term debt sinceEthiopia took over all debts incurred prior to 1991. Its state and donated capital of Birr116 million, accumulated profits of Birr 118 million, and a small balance of currentliability (Birr 10 million) comprise MPA's capital structure.
Projections of Financial Performance of MPA
6.12 MPA's financial performance is tentatively projected from 1998 to 2005, based onthe assumptions used in the economic analysis. MPA's projected financial statementsand assumptions are in Annex 12 and are summarized as below:
Indicato.r.......&. 1998 1999 M 20W :::200-1 202 20 2004.:: 2005...X....... .. ............. ....... .......................... . .. ............. ........... ....................... .... . . . . . .
Revenues(US$mil) 10.6 11.1 11.6 11.1 11.3 10.9 11.1 11.4Profit Margin(%) 44 38 36 38 36 36 35 35Retum on Total Net 7 5 4 4 4 3 3 3Assets (%)A/C Rec. (months) 4.0 3.0 2.0 2.0 2.0 2.0 2.0 2.0Debt/EquityRatio(%) 7 11 13 14 14 14 13 12
r 75 8 :7 8'3 91' ""45' 9'4 '"1'""'" '''"''''''''''
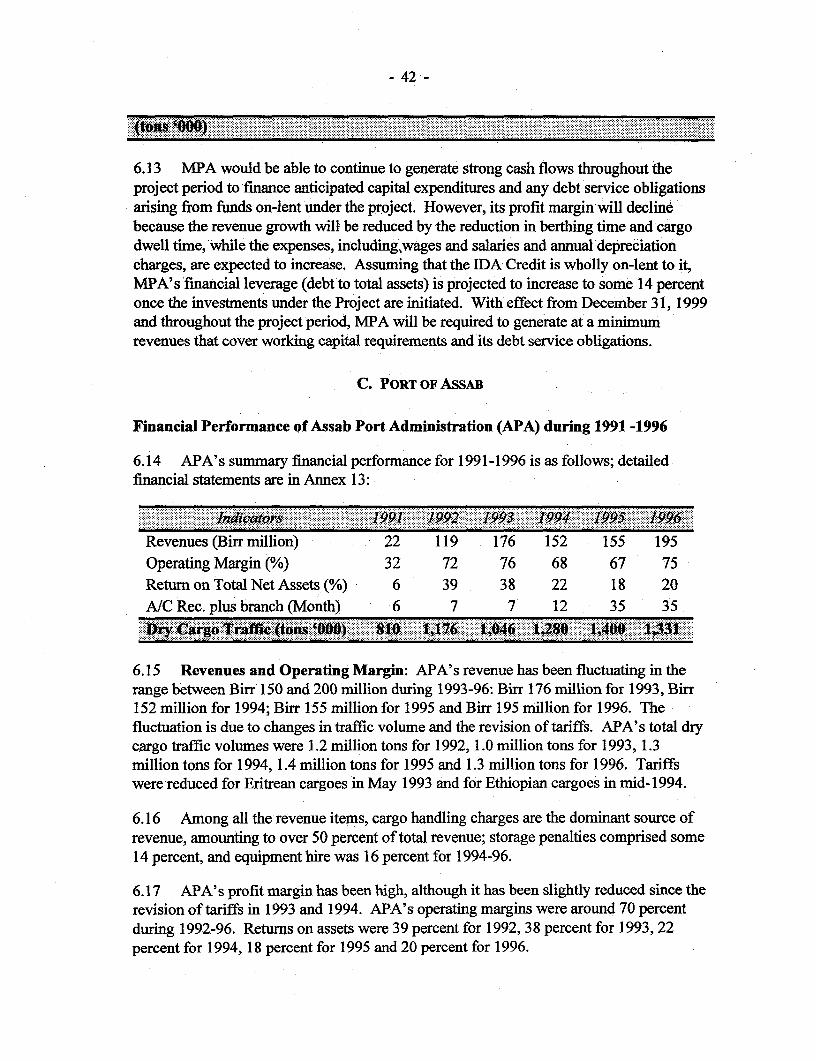
- 42 -
.~~~~~~~~~~~~~~~~~~~~ .....
6.13 MPA would be able to continue to generate strong cash flows throughout theproject period to finance anticipated capital expenditures and any debt service obligationsarising from funds on-lent under the project. However, its profit margin will declinebecause the revenue growth will be reduced by the reduction in berthing time and cargodwell time, while the expenses, including,wages and salaries and annual depreciationcharges, are expected to increase. Assuming that the IDA Credit is wholly on-lent to it,MPA's financial leverage (debt to total assets) is projected to increase to some 14 percentonce the investments under the Project are initiated. With effect from December 31, 1999and throughout the project period, MPA will be required to generate at a minimumrevenues that cover working capital requirements and its debt service obligations.
C. PORT OF ASSAB
Financial Performance of Assab Port Administration (APA) during 1991 -1996
6.14 APA's summary financial performance for 1991-1996 is as follows; detailedfinancial statements are in Annex 13:
Revenues (Birrmnillion) 22 119 176 152 155 195Operating Margin (%) 32 72 76 68 67 75Return on Total Net Assets (%) 6 39 38 22 18 20AIC Rec. plus branch (Month) 6 7 7 12 35 35
. X..."-"'- P~~~~~~~~~~~~~~~~~~~~~~~~~~~~~~~~~~~~~~~~~~~~~~~......
6.15 Revenues and Operating Margin: APA's revenue has been fluctuating in therange between Birr 150 and 200 million during 1993-96: Bir 176 million for 1993, Bi5152 million for 1994; Birr 155 million for 1995 and Birr 195 million for 1996. Thefluctuation is due to changes in traffic volume and the revision of tariffs. APA's total drycargo traffic volumes were 1.2 million tonsAfor 19 1 in tons for 1993, 1.3million tons for 1994, 1.4 million tons for 1995 and 1.3 million tons for 1996. Tariffswere reduced for Eritrean cargoes in May 1993 and for Ethiopian cargoes in mid-1994.
6.16 Among all the revenue items, cargo handling charges are the dominant source ofrevenue, amounting to over 50 percent of total revenue; storage penalties comprised some14 percent, and equipment hire was 16 percent for 1994-96.
6.17 APA's profit margin has been high, although it has been slightly reduced since therevision of tariffs in 1993 and 1994. APA's operating margins were around 70 percentduring 1992-96. Returns on assets were 39 percent for 1992, 38 percent for 1993, 22percent for 1994, 18 percent for 1995 and 20 percent for 1996.
- 43 -
6.18 Assets and Capital Structure: APA's current assets are inflated by a highoutstanding balance of accounts receivable and inter-office receivable accounts (Birr 41million and Birr 527 million, respectively, at end-December 1996) amounting to 80percent of its total asset value. A significant portion of the accounts receivable wasaccumulated during the period right after independence and is mostly owed by ERSTAS,which collects shipping and cargo handling charges on behalf of APA. Because thecountry's banks lacked proper bank correspondence agreements with international banksat the time of independence, the Ministry of Finance established a liaison office forERSTAS in Italy to receive deposits for shipping charges from shipping lines. Thecharges collected by the liaison office were finally transferred to APA in late 1997. APAis presently in the process of reducing the outstanding balance of its accounts receivableto around 12 months by June 30, 1998 and 4 months by end-1998 and thereafter.
6.19 APA's fixed asset value is understated in its financial statements; however, itsreplaceable assets in operation have been re-valued at replacement cost during the pasttariff revisions. The total book value of its fixed assets (before depreciation) was Birr186 million as of end-December 1996. At replacement cost, its fixed assets could beworth more than Birr 700 million before depreciation; for example, major infrastructure,including the breakwater and jetties, is estimated at some Birr 340 million, comparedwith the historical cost of Birr 21 million; tug boats and pilot boats are estimated at Binr54 million, vis-a-vis Birr 13 million at historical cost; and port equipment, which includesshore cranes, mobile cranes, lift trucks, trailers and grain handling equipment, isestimated to cost Birr 200 million at replacement cost, compared with Biff 49 million athistorical cost.
6.20 APA has no outstanding balance of loans since all past debt service obligationsprior to independence were taken over by Ethiopia. Ninety nine percent of its total assets(Birr 711 million) is financed by capital contributions from the Government and donorsand its accumulated profits.
6.21 Expenditures and Financial Sustainability: Although APA's current financialprofitability seems to be sustainable by the continuing implementation of cost-basedtariffs and its costing system, its future financial sustainability still requires furtherreview.
6.22 First, APA's salaries, wages and benefits, which amount to some 60 percent oftotal operating expenses, have long been suppressed. A major revision on pay scale forthe Government and parastatals is expected for 1998 and APA's expenses on salaries,wages and benefits are expected to increase by at least 20 percent once the new scale isintroduced.
6.23 Second, since APA's fixed asset value is understated in its financial statements,its annual depreciation charges do not reflect real capital requirements for replacement ofits operational assets. Since APA has carried out a revision of the tariff, includingrevaluation of its operational fixed assets, annual depreciation charges of its replaceableoperational fixed assets at replacement cost would be reflected in its financial reportingand be monitored during project implementation.
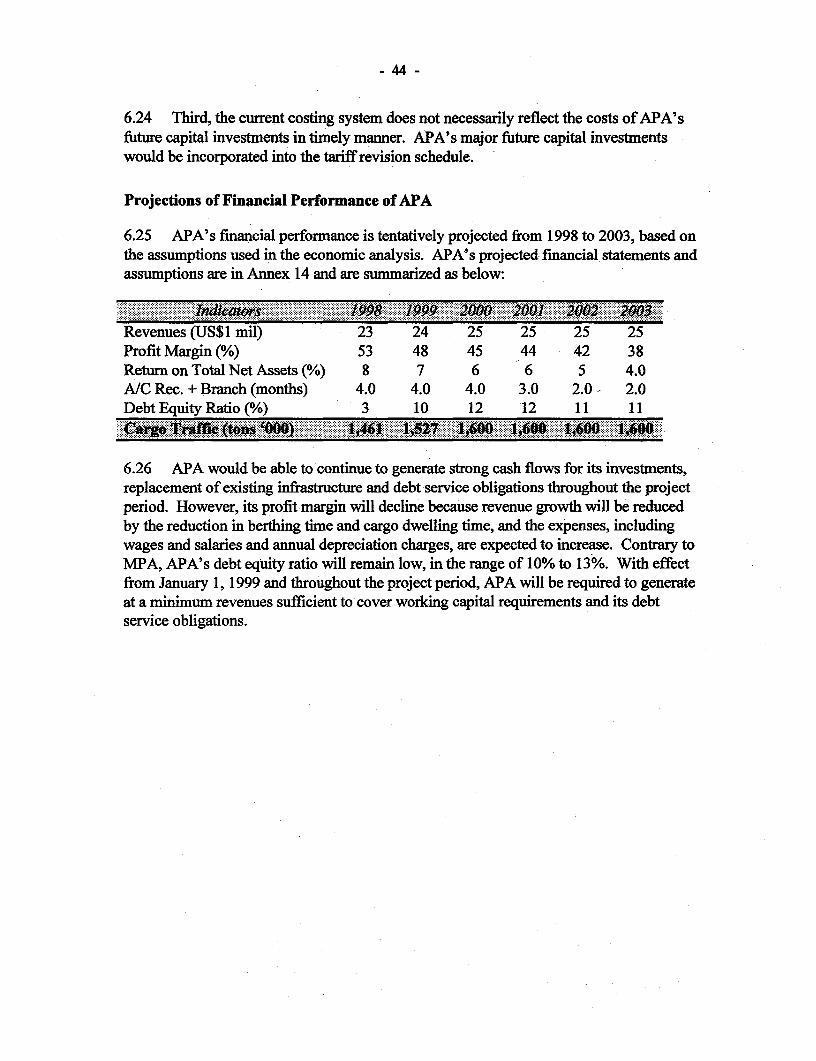
-44-
6.24 Third, the current costing system does not necessarily reflect the costs of APA'sfuture capital investments in timely manner. APA's major future capital investmentswould be incorporated into the tariff revision schedule.
Projections of Financial Performance of APA
6.25 APA's financial performance is tentatively projected from 1998 to 2003, based onthe assumptions used in the economic analysis. APA's projected financial statements andassumptions are in Annex 14 and are summarized as below:
... ~~ ~~~~~~~~~~ ........... .....
Revenues (US$1 mil) 23 24 25 25 25 25Profit Margin (%) 53 48 45 44 42 38Return on Total Net Assets (%/6) 8 7 6 6 5 4.0A/C Rec. + Branch (months) 4.0 4.0 4.0 3.0 2.0 2.0DebtEquityRatio(%) 3 10 12 12 11 11
-... .. ...... ..a. . . i .::: ^:::: i::: :..... .. ... . j..:.. ,.... j. .,,,,.,,.. . ' :'i j ':,,, , ',. .,''M> ,,.': "
6.26 APA would be able to continue to generate strong cash flows for its investments,replacement of existing infrastructure and debt service obligations throughout the projectperiod. However, its profit margin will decline because revenue growth will be reducedby the reduction in berthing time and cargo dwelling time, and the expenses, includingwages and salaries and annual depreciation charges, are expected to increase. Contrary toMPA, APA's debt equity ratio will remain low, in the range of 10% to 13%. With effectfrom January 1, 1999 and throughout the project period, APA will be required to generateat a minimum revenues sufficient to cover working capital requirements and its debtservice obligations.

-45-
7. ENVIRONMENTAL IMPACT, PROJECTSUSTAINABILITY AND RISK
A. ENVIRONMENTAL IMPACT
7.1 The project is rated "A" as it comprises dredging and reclamation of some50,000m3 in front of berth 6, and handling of potentially hazardous material. Theenvironmental impact assessment, however, revealed that the material to be dredged isfree from contamination, and is suitable for the land reclamation required behind berth 6.Final design and bidding documents for the rehabilitation of berths 5 and 6 will ensure thatappropriate measures are taken by the contractor to mitigate potential adverseenvironmental impact of the dredging activities, including disposal of dredged material. Asummary of the environmental assessment is attached in Annex 10. In light of theregulations stipulated under the International Convention for the Prevention of Pollutionfrom Ships (MARPOL 73/78), a review has been carried out of the port of Massawa'soperating practice regarding control of discharge of pollutants in the port, including oilyballast, bilge water and sewage, as well as their contingency plans in case of oil spillageand fire. The review has assessed what kind of facilities and operating adjustments thatwould be required for Eritrea to sign and ratify the MARPOL Convention.
Environmental Impacts During Construction
7.2 The project is expected to have a neutral impact on the environment. The projectincludes repairs and realignment of Berths 5 and 6, dredging of material in a turning basinoutside the rehabilitated Berth 6, and reclamation of land behind the rehabilitated Berth 6.The principal environmental impacts and the mitigation proposed are outlined below:
* The realignment of Berths 5 and 6 is assumed to lead to a slight increase inwater circulation within the port and may therefore have a minor positiveimpact on the marine environment.
* Construction of Berths 5 and 6 (sheet pile installation etc.) will cause minortemporary impacts. These, however, are not considered serious and will notcause lasting damage to the marine environment.
* The project includes dredging of approximately 50,000m3'. Analysis of thematerial to be dredged has shown that it is suitable for r eclamation purposes,and free from contamination of heavy metals. The dredged material will beused for reclamation of land behind the extension of Berth 6.
7.3 In order to reduce the impact of dredging and reclamation the following workingmethods will be adhered to:

-46-
* Dredging works shall be carried out by suitable equipment, i.e. a cuttersuction dredger.
* Dredging and reclamation will be carried out after the sheet pile wall has beeninstalled in front of the lagoon to be reclaimed, thereby creating a closed basinwhere sedimentation can take place. The content of solid material shall bebelow 2-3 % before water is let back to the harbor/sea.
* A survey of unexploded ordnances in the area to be dredged shall beperformed before the works start.
7.4 Some 40 port staff (ex-fighters) who were given shelter in the port after theLiberation War, as well as a number of staff from the Customs Authority and theMinistries of Finance and Health (about 120 people in total), were during the preparationof the project living in government-owned houses in the port of Massawa. Both the Portand the Massawa Municipal Authority had already determined that for safety and securityreasons no-one should be living within the port boundaries. Steps have therefore beentaken through the DMT and the Municipality of Massawa to ensure alternativeaccommodation for these people, with houses being set aside for them in new housingdevelopments. As of September 1997 suitable alternative accommodation had beenarranged for 90 people; the remaining 30 will be housed before the end of November,1997.
Treatment of Hazardous and Noxious Cargo
7.5 The port has very limited facilities and guidelines for handling and storage ofhazardous and noxious cargo. Under the project the ports will set new procedures andelaborate on emergency plans in case of accidents. The procedures to be introduced willbe based on IMO guidelines.
Handling of Ships Waste
7.6 Facilities in the two ports for collection, storage, and treatment of ship's waste arevery limited. Oily waste is collected only from the ports own tug boats. The oily wastefrom these vessels is stored in a small tank truck until it is full, when the waste is dumpedoutside the port area. For all other vessels calling at the two ports there are no facilitiesoffered to discharge oily waste. The two ports' operational practices regarding control ofdischarge of pollutants, including collection of garbage and oily ballast, bilge water andsewage, will be improved under the project as a first step for Eritrea to eventually sign andratify the MARPOL 73/78 Convention.
National Oil Spill Contingency Plan
7.7 Eritrea has decided to develop and implement a National Oil Spill Response Plan inconjunction with the local and international oil industry. This plan will:
-47-
* assess the risk of oil spills from all sources that could threaten the coastlineand its associated islands and coral reefs;
* identify sensitive areas, socio-economic as well as environmental, that wouldneed protection; and
* develop response strategies suitable for the region.
7.8 The project will provide funds to finance equipment needs consistent with theresponse strategies, and to finance training programs for oil spill contingency planners andresponders. In developing the component DMT, will work closely with the IMO and withthe International Petroleum Industry Environmental Conservation Association (IPIECA)and benefit from their expertise in the field. The marine environment pollution preventionassessment for Eritrea is part of a larger study on navigation risk assessment and plan forthe Red Sea and Gulf of Aden, to be funded under a Norwegian Trust Fund.
Maritime Safety
7.9 Assab is very exposed to winds; the area is heavily influenced by the north eastmonsoons in the Indian Ocean, particularly during the winter months of October to maywhen winds reach Beaufort Force 7 (28 to 33 knots) and frequently Force 8 (34 - 40knots). During berthing and unberthing, vessels must rely almost entirely on the tugs tocounteract the wind effect.
7.10 The port has presently two tug boats, one in a reasonably good condition (built1987 - 1,600 HP), and one in very poor condition (built 1980 - 1,400 HP). The shortageof adequate tug services is increasingly causing great concern regarding safe ship handlingin the port, particularly during berthing/unberthing of crude oil tankers to the mooringbuoy, and to the oil jetties for refined products.
7.11 To arrange for the minimum requirement of 2 suitable tug boats, and for adequatebollard pull requirement and safe ship handling, the project will provide for an additionalpowerful tugboat of around 2,000 to 2,400 HP.
B. PROJECT SUSTAINABILITY
7.12 The Government's commitment in the Letter of Port Sector Policy would ensureadequate tariffs and cost containment measures to maintain port profitability andcompetitiveness with comparable ports in the region. Restructuring of the ports, theprovision of training and TA and placing them within a commercial framework willenhance project sustainability.
C. PROJECT RISK
7.13 During implementation of the civil works component (a period of about twoyears), berths 5 and 6 in Massawa will at different times be out of commission and handed
-48-
over to the civil contractor. There is a risk during this time that the port area will be soheavily congested that the contractor's work will be hampered. To minimize the risk ofdelays and cost escalation of the civil works, the bidding/contract document(s) will includespecific and detailed clauses on phasing of the works, and modalities for coordination andliaison between the contractor and the operations department. There are also risks anduncertainty as to the local capacity and lack of experience of DMT and the two ports toimplement and manage the project. Flexible overall project design, the early establishmentof a Project Coordination Unit, technical assistance and training, and frequent projectsupervision and reviews have been included to manage these risks.

-49-
8. AGREEMENTS AND RECOMMENDATION
A. AGREEMENTS REACHED DURING NEGOTIATIONS
8.1 At negotiations, agreement was reached on:
(a) Content of the Letter of Port Sector Policy (para. 2.31).
(b) Content of the Project Implementation Plan (PIP) (para. 4.2).
(c) The Borrower to have the Project Account, Special Account and SOEs, aswell as the accounts of the two ports audited by independent auditorssatisfactory to IDA, and the reports sent to IDA within six months of the endof the fiscal year (paras. 4.19, 4.20 4.21 and 6.3).
(d) Improvements in cargo handling capacities and operational productivity to beattained during the implementation of the project (para. 4.24 and Annex 6).
(e) That DMT will be responsible for the preparation of an evaluation report onthe project's execution and initial operation, which will be annexed uneditedto the Implementation Completion Report (ICR) to be finalized within sixmonths of the closing date of the proposed project (para. 4.22).
(f) Standard procurement processing time for key activities (para. 4.14).
B. RECOMMENDATION
8.2 Based on the above assurances and agreements, the Project is suitable for a Creditto the State of Eritrea of SDR 22.2 million (US$30.3 million equivalent) on standardterms with forty years maturity, including 10 years of grace.
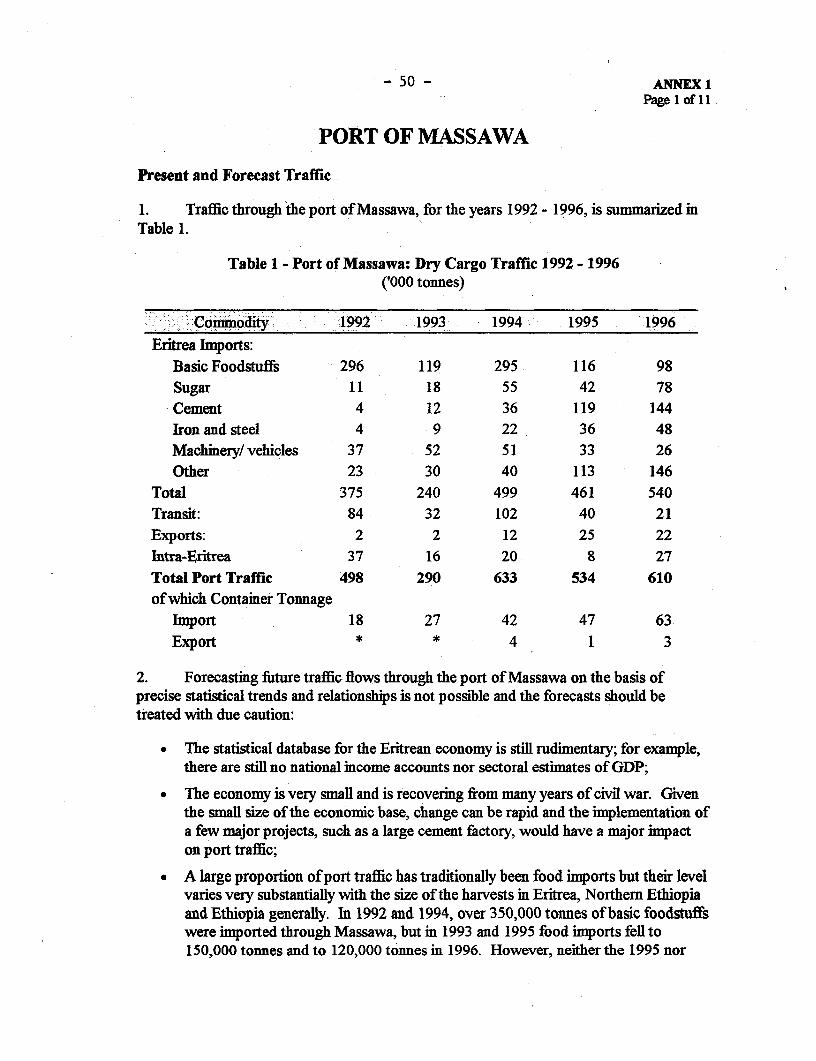
- 50 - ANNEX IPage 1 of11
PORT OF MASSAWA
Present and Forecast Traffic
1. Traffic through the port of Massawa, for the years 1992 - 1996, is summarized inTable 1.
Table 1 - Port of Massawa: Dry Cargo Traffic 1992 - 1996('000 tonnes)
Comtmoddity 1992 1993 1994 1995 1996Eritrea Imports:
Basic Foodstuffs 296 119 295 116 98Sugar 11 18 55 42 78Cement 4 12 36 119 144Iron and steel 4 9 22 36 48Machinery/ vehicles 37 52 51 33 26Other 23 30 40 113 146
Total 375 240 499 461 540Transit: 84 32 102 40 21Exports: 2 2 12 25 22Intra-Eritrea 37 16 20 8 27Total Port Traffic 498 290 633 534 610of which Container Tonnage
Import 18 27 42 47 63
Export * * 4 1 3
2. Forecasting future traffic flows through the port of Massawa on the basis ofprecise statistical trends and relationships is not possible and the forecasts should betreated with due caution:
* The statistical database for the Eritrean economy is still rudimentary; for example,there are still no national income accounts nor sectoral estimates of GDP;
* The economy is very small and is recovering from many years of civil war. Giventhe small size of the economic base, change can be rapid and the implementation ofa few major projects, such as a large cement factory, would have a major impacton port traffic;
* A large proportion of port traffic has traditionally been food imports but their levelvaries very substantially with the size of the harvests in Eritrea, Northern Ethiopiaand Ethiopia generally. In 1992 and 1994, over 350,000 tonnes of basic foodstuffswere imported through Massawa, but in 1993 and 1995 food imports fell to150,000 tonnes and to 120,000 tonnes in 1996. However, neither the 1995 nor
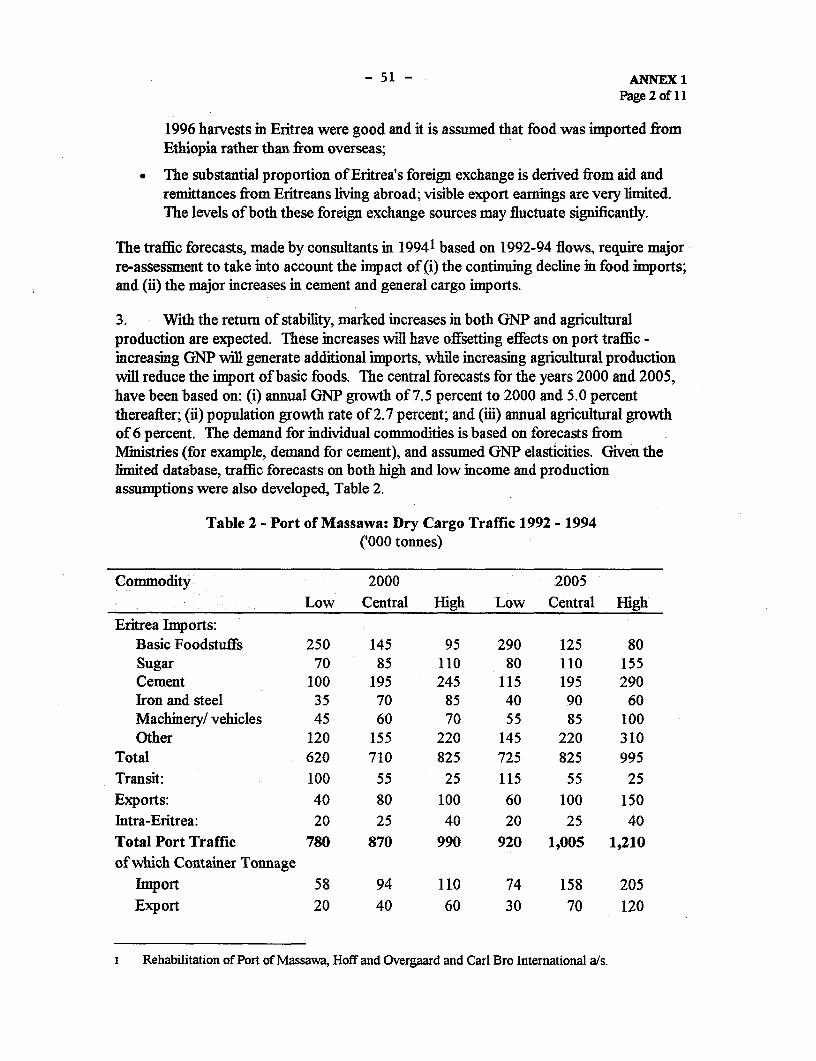
- 51 - ANNEX 1Page 2 of 11
1996 harvests in Eritrea were good and it is assumed that food was imported fromEthiopia rather than from overseas;
The substantial proportion of Eritrea's foreign exchange is derived from aid andremittances from Eritreans living abroad; visible export earnings are very limited.The levels of both these foreign exchange sources may fluctuate significantly.
The traffic forecasts, made by consultants in 19941 based on 1992-94 flows, require majorre-assessment to take into account the impact of (i) the continuing decline in food imports;and (ii) the major increases in cement and general cargo imports.
3. With the return of stability, marked increases in both GNP and agriculturalproduction are expected. These increases will have offsetting effects on port traffic -increasing GNP will generate additional imports, while increasing agricultural productionwill reduce the import of basic foods. The central forecasts for the years 2000 and 2005,have been based on: (i) annual GNP growth of 7.5 percent to 2000 and 5.0 percentthereafter; (ii) population growth rate of 2.7 percent; and (iii) annual agricultural growthof 6 percent. The demand for individual commodities is based on forecasts fromMinistries (for example, demand for cement), and assumed GNP elasticities. Given thelimited database, traffic forecasts on both high and low income and productionassumptions were also developed, Table 2.
Table 2 - Port of Massawa: Dry Cargo Traffic 1992 - 1994('000 tonnes)
Commodity 2000 2005Low Central High Low Central High
Eritrea Imports:Basic Foodstuffs 250 145 95 290 125 80Sugar 70 85 110 80 110 155Cement 100 195 245 115 195 290Iron and steel 35 70 85 40 90 60Machinery/ vehicles 45 60 70 55 85 100Other 120 155 220 145 220 310
Total 620 710 825 725 825 995Transit: 100 55 25 115 55 25Exports: 40 80 100 60 100 150Intra-Eritrea: 20 25 40 20 25 40Total Port Traffic 780 870 990 920 1,005 1,210of which Container Tonnage
bport 58 94 110 74 158 205Export 20 40 60 30 70 120
I Rehabilitation of Port of Massawa, Hoff and Overgaard and Carl Bro International als.
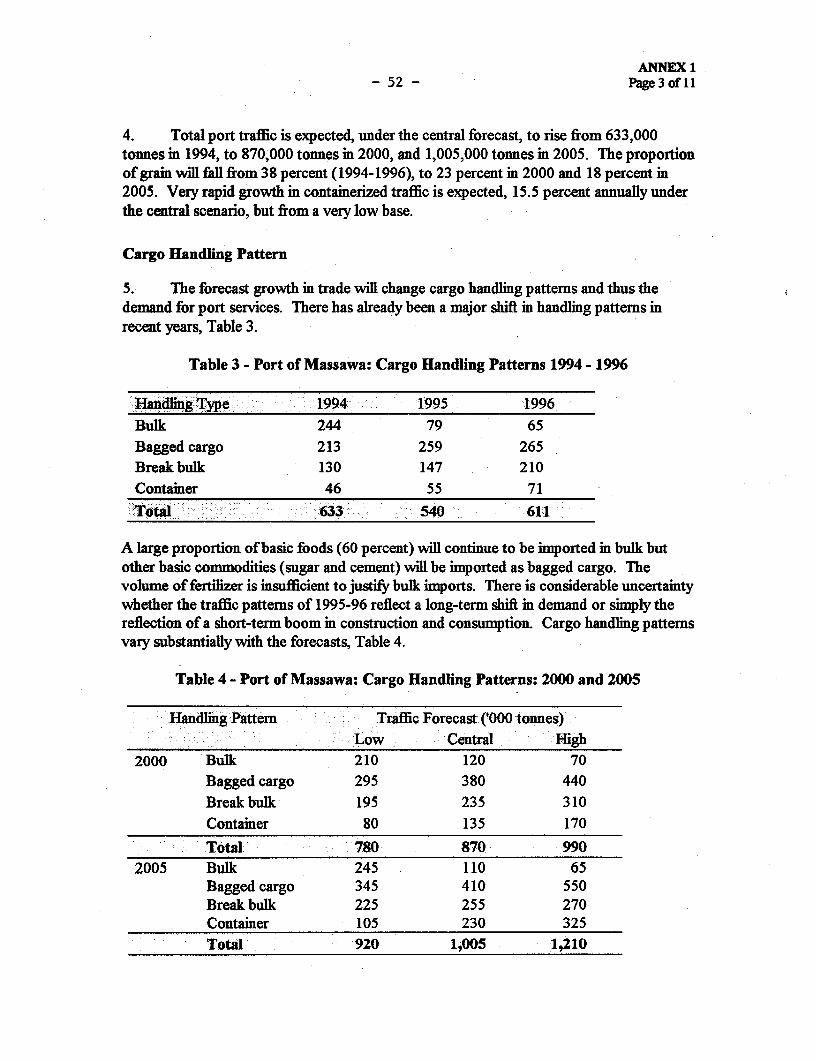
ANNEX 1- 52 - Page 3 of 11
4. Total port traffic is expected, under the central forecast, to rise from 633,000tonnes in 1994, to 870,000 tonnes in 2000, and 1,005,000 tonnes in 2005. The proportionof grain wiMl fall from 38 percent (1994-1996), to 23 percent in 2000 and 18 percent in2005. Very rapid growth in containerized traffic is expected, 15.5 percent annually underthe central scenario, but from a very low base.
Cargo Handling Pattern
5. The forecast growth in trade will change cargo handling patterns and thus thedemand for port services. There has already been a major shift in handlng pattems inrecent years, Table 3.
Table 3 - Port of Massawa: Cargo Handling Patterns 1994 - 1996
H gand Te: - 1994- 1995 1996Bulk 244 79 65Bagged cargo 213 259 265Break bulk 130 147 210Container 46 55 71
:otal 633 5040 61-1
A large proportion of basic foods (60 percent) will continue to be imported in bulk butother basic commodities (sugar and cement) will be imported as bagged cargo. Thevolume of fertilizer is insufficient to justify bulk imports. There is considerable uncertaintywhether the traffic pattems of 1995-96 reflect a long-term shift in demand or simply thereflection of a short-term boom in construction and consumption. Cargo handling patternsvary substantially with the forecasts, Table 4.
Table 4 - Port of Massawa: Cargo Handling Patterns: 2000 and 2005
Handing Pattem Traffic Forecast ('000 tonnes)Low Central Eigh
2000 Bulk 210 120 70Bagged cargo 295 380 440Break bulk 195 235 310Container 80 135 170
Total 780 870 9902005 Bulk 245 110 65
Bagged cargo 345 410 550Break bulk 225 255 270Container 105 230 325Total 920 1,005 1,210

ANNEX 1- 53 - Page 4 of II
Cargo Handling Productivity
6. The proposed project is expected to improve cargo handling productivity verysubstantially through the clearance of the cargo working areas, the introduction ofimproved operational practices and the provision of additional handlng equipment. Theexpected cargo handling rates are detailed in Table 4.
Table 5 - Port of Massawa: Cargo Handling Productivity(Tonnes/Berth Day)
Cargo Category Without Project Rationalization of Cargo New HandlingHandling Areas Equipment
Bulk Cargo 850 950 1,100Bagged Cargo 900 1,000 1,200Break Bulk Cargo 200 230 270Containers 720 1,375 2,350*Ferry Cargo 65 65 65
l possible cnly wih extsion of Belth No. 6
7. The project will increase handling productivity for all traffic except the Red Seaferries. The project will have its most marked impact on container handling rates, whichare presently extremely low. The impacts of the expected traffic growth, the proposedinvestments in handling equipment, and the extension to Berth No. 6 on expected berthoccupancy rates are shown in Table 5.
Table 6 - Port of Massawa: Berth Occupancy Rates (%/e)
Growth Scenario Improvement Scenario 1994 2000 2005Low Do-nothing 70 80 92
Rationalized cargo handling areas 72 82Equipment 65 74Extension to Berth No. 6 55 62
Central Do-nothing 70 92 106Rationalized cargo handling areas 81 92Equipment 72 83Extension to Berth No. 6 61 68
High Do-nothing 70 109 120Rationalized cargo handling areas 95 102Equipment 85 92Extension to Berth No. 6 71 75
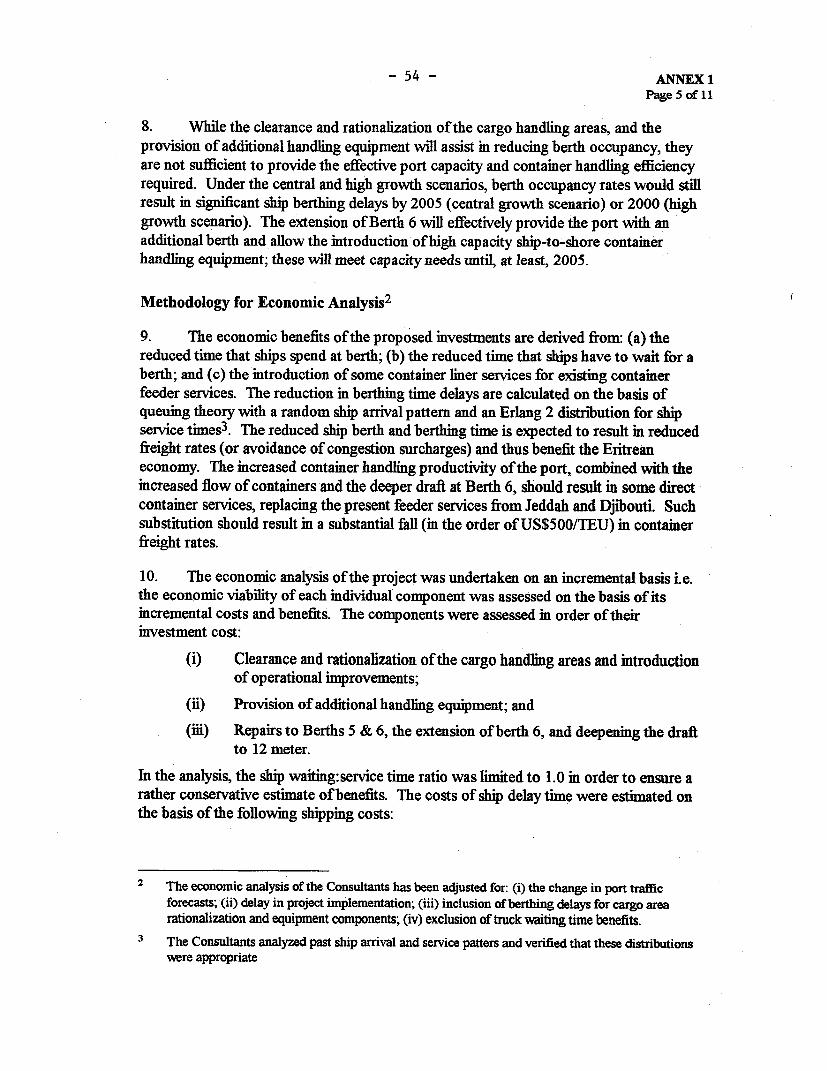
-54 - ANNEX 1Page 5 of 11
8. While the clearance and rationalization of the cargo handling areas, and theprovision of additional handling equipment will assist in reducing berth occupancy, theyare not sufficient to provide the effective port capacity and container handling efficiencyrequired. Under the central and high growth scenarios, berth occupancy rates would stillresult in significant ship berthing delays by 2005 (central growth scenario) or 2000 (highgrowth scenario). The extension of Berth 6 will effectively provide the port with anadditional berth and allow the introduction of high capacity ship-to-shore contaimerhandling equipment; these will meet capacity needs until, at least, 2005.
Methodology for Economic Analysis2
9. The economic benefits of the proposed investments are derived from: (a) thereduced time that ships spend at berth; (b) the reduced time that ships have to wait for aberth; and (c) the introduction of some container liner services for existing containerfeeder services. The reduction in berthing time delays are calculated on the basis ofqueuing theory with a random ship arrival pattern and an Erlang 2 distribution for shipservice times3. The reduced ship berth and berthing time is expected to result im reducedfreight rates (or avoidance of congestion surcharges) and thus benefit the Eritreaneconomy. The increased container handling productivity of the port, combined with theincreased flow of containers and the deeper draft at Berth 6, should result in some directcontainer services, replacing the present feeder services from Jeddah and Djibouti. Suchsubstitution should result in a substantial fall (in the order of US$500/TEU) in containerfreight rates.
10. The economic analysis of the project was undertaken on an incremental basis i.e.the economic viability of each individual component was assessed on the basis of itsincremental costs and benefits. The components were assessed in order of theirinvestment cost:
(i) Clearance and rationalization of the cargo handlng areas and introductionof operational improvements;
(ii) Provision of additional handling equipment; and
(iii) Repairs to Berths 5 & 6, the extension of berth 6, and deepening the draftto 12 meter.
In the analysis, the ship waiting: service time ratio was limited to 1.0 in order to ensure arather conservative estimate of benefits. The costs of ship delay time were estimated onthe basis of the following shipping costs:
2 The economic analysis of the Consultants has been adjusted for: (i) the change in port trafficforecasts; (ii) delay in project implementation; (iii) inclusion of berthing delays for cargo arearationalization and equipment components; (iv) exclusion of truck waiting time benefits.
3 The Consultants analyzed past ship arrival and service patters and verified that these distributionswere appropriate
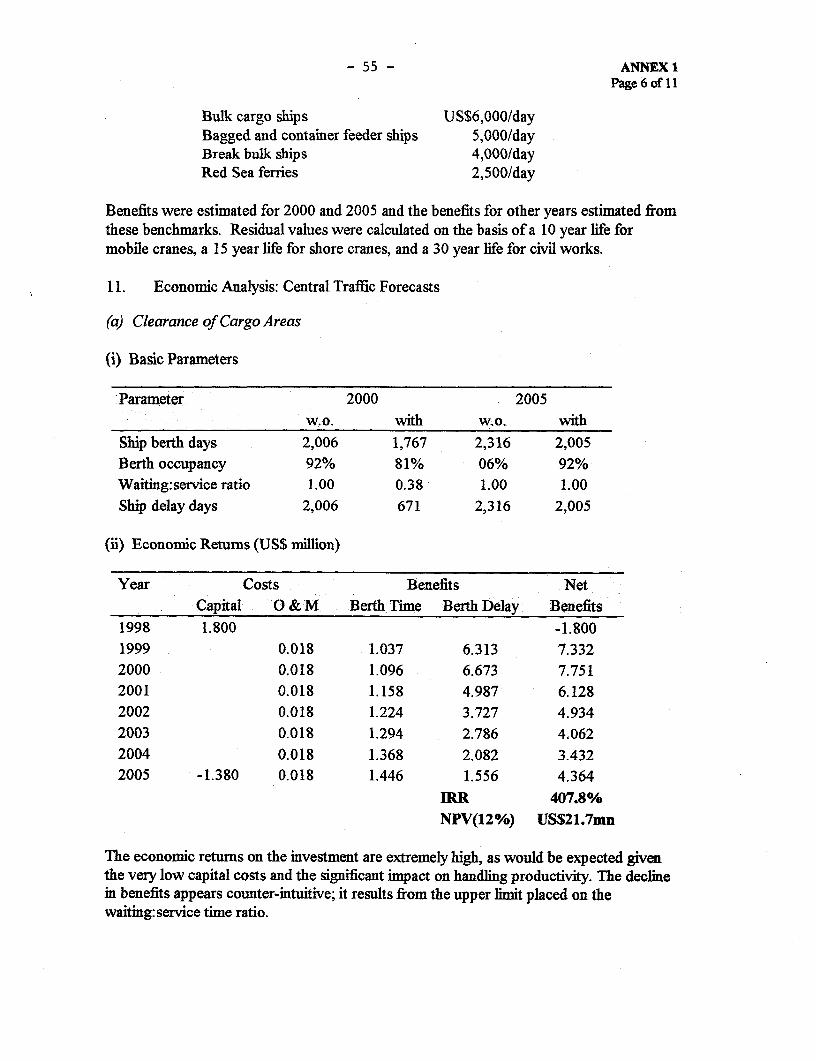
-55 - ANNEX IPage 6 of 11
Bulk cargo ships US$6,000/dayBagged and container feeder ships 5,000/dayBreak bulk ships 4,000/dayRed Sea fenies 2,500/day
Benefits were estimated for 2000 and 2005 and the benefits for other years estimated fromthese benchmarks. Residual values were calculated on the basis of a 10 year life formobile cranes, a 15 year life for shore cranes, and a 30 year life for civil works.
11. Economic Analysis: Central Traffic Forecasts
(a) Clearance of Cargo Areas
(i) Basic Parameters
Parameter 2000 2005w.o. with w.o. with
Ship berth days 2,006 1,767 2,316 2,005Berth occupancy 92% 81% 06% 92%Waiting:service ratio 1.00 0.38 1.00 1.00Ship delay days 2,006 671 2,316 2,005
(ii) Economic Retums (US$ million)
Year Costs Benefits NetCapital O & M Berth Time Berth Delay Benefits
1998 1.800 -1.8001999 0.018 1.037 6.313 7.3322000 0.018 1.096 6.673 7.7512001 0.018 1.158 4.987 6.1282002 0.018 1.224 3.727 4.9342003 0.018 1.294 2.786 4.0622004 0.018 1.368 2.082 3.4322005 -1.380 0.018 1.446 1.556 4.364
IRR 407.8%NPV(12%) US$21.7mn
The economic retums on the investment are extremely high, as would be expected giventhe very low capital costs and the significant impact on handling productivity. The declinein benefits appears counter-intuitive; it results from the upper limit placed on thewaiting: service time ratio.

- 56 - ANNEX 1Page 7 of 11
(b) AdditionalCargoHandlingEquipment
(i) Basic Parameters
Parameter 2000 2005w.o. with w.o. with
Ship berth days 1,767 1,587 2,005 1,812Berth occupancy 81% 72% 92% 83%Waiting:service ratio 0.38 0.17 1.00 0.47Ship delay days 671 270 2,005 852
(ii) Economic Returns (US$ million)
Year Costs Benefits NetCapital O & M Berth Time Delay Time Benefits
1998 2.350 -2.3501999 2.350 0.250 0.406 0.991 -1.2032000 0.500 0.823 2.008 2.3312001 0.500 0.834 2.551 2.8852002 0.500 0.845 3.241 3.5862003 0.500 0.857 4.117 4.4742004 0.500 0.868 5.231 5.5992005 1.850 0.500 0.880 6.645 8.875
1R1 61.8%NPV(12%) US$10.8mn
The economic returns from investment in conventional cargo handling equipment andshore handling container equipment are substantial
(c) Berths 5 & 6
(i) Basic Parameters
Parameter .2000 2005w.o. wit w.o.: with
Ship berth days 1,587 1,551 1,812 1,749Berth occupancy 72% 61% 83% 68%Waiting:service ratio 0.17 0.05 0.47 0.09Ship delay days 270 78 852 157

ANNEX 1- 57 - Page 8 of II
(ii) Economic Returns (US$ million)
Year Costs Benefits NetCapital 0 & M Berth Time Berth Delay Direct TEU4 Benefits
1998 3.530 -3.5301999 8.825 -8.8252000 5.295 0.140 0.091 0.481 0.519 -4.3452001 0.280 0.202 1.251 0.663 1.8362002 0.280 0.226 1.621 0.846 2.4132003 0.280 0.253 2.094 1.081 3.1472004 0.280 0.283 2.700 1.380 4.0832005 14.414 0.280 0.317 3.472 1.763 19.687
HRR 12.0%
NPV(12%) US$0.Omn
The investment in the additional berth capacity and ship-to-shore container handlingequipment appears marginal, generating only a 12 percent rate of return. The rate ofreturn in the first full year of operation is 9.2 percent (rising to 26.5 percent by 2005) andthis would suggest the desirability of postponing the investment. Postponement of theberth extension would, however, substantially increase costs as one berth has to be closedduring the construction period, creating additional congestion and berthing delays whichmore than offset the increase in benefits. In view of their impact on port operations duringthe construction period, repairs to Berth No. 5 and extension of Berth No. 6 should becompleted at the very earliest opportunity.
(d) Total Massawa Project
In addition to the specific physical investments, technical assistance, training and someinvestment in administrative buildings will be required. These items are expected to costapproximately US$5.3 million and are necessary to achieve the overall improvement inport performance and capacity. It is not possible, however, to estimate specific benefitsfor these elements and they are thus treated as a project overhead. The results of theoverall analysis are detailed in Table 6.
4 25 percent of inbound containers shipped by direct container liner services
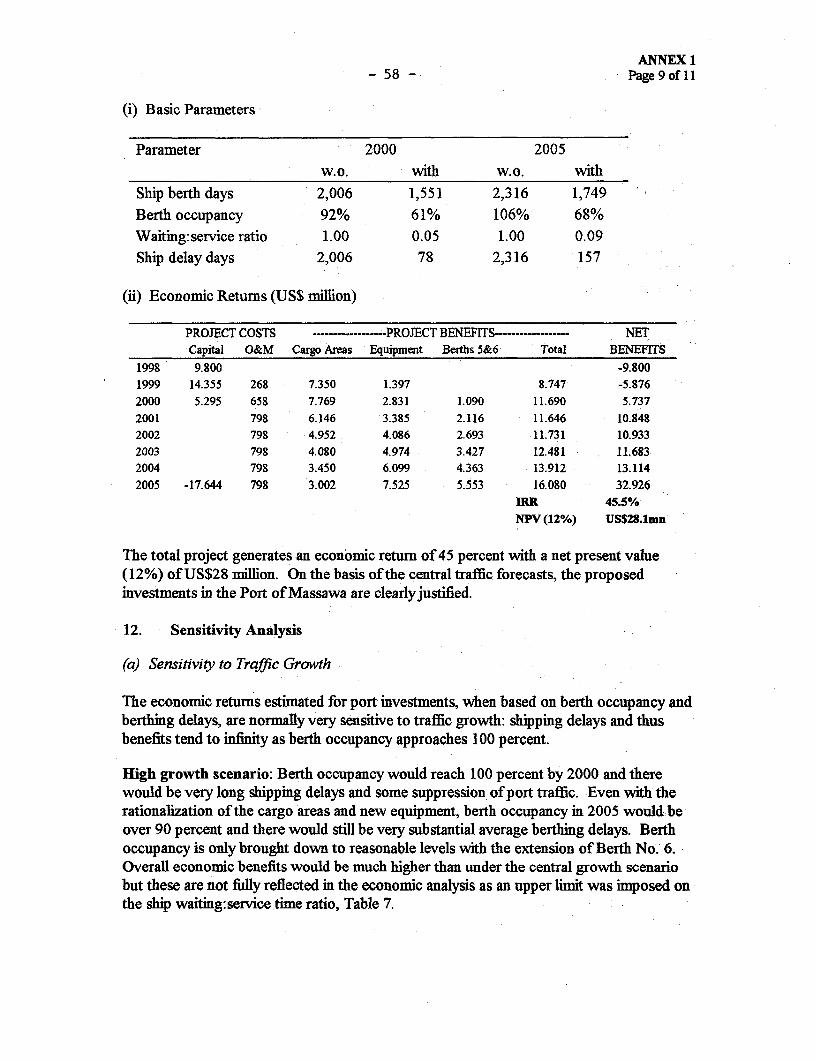
ANNEX 1- 58 - Page9ofl1
(i) Basic Parameters
Parameter 2000 2005w.o. with w.o. with
Ship berth days 2,006 1,551 2,316 1,749Berth occupancy 92% 61% 106% 68%Waiting:service ratio 1.00 0.05 1.00 0.09Ship delay days 2,006 78 2,316 157
(ii) Economic Returns (US$ million)
PROJECT COSTS ------------------PROJECT BENEFTS------------------ NETCapital O&M Cargo Areas Equipment Berths 5&6 Total BENEFITS
1998 9.800 -9.8001999 14.355 268 7.350 1.397 8.747 -5.8762000 5.295 658 7.769 2.831 1.090 11.690 5.7372001 798 6.146 3.385 2.116 11.646 10.8482002 798 4.952 4.086 2.693 11.731 10.9332003 798 4.080 4.974 3.427 12.481 11.6832004 798 3.450 6.099 4.363 13.912 13.1142005 -17.644 798 3.002 7.525 5.553 16.080 32.926
XRR 45.5%NPV (12%) US$28.lmn
The total project generates an economic return of 45 percent with a net present value(12%) of US$28 million. On the basis of the central traffic forecasts, the proposedinvestments in the Port of Massawa are clearly justified.
12. Sensitivity Analysis
(a) Sensitivity to Traffic Growth
The economic retums estimated for port investments, when based on berth occupancy andberthing delays, are normally very sensitive to traffic growth: shipping delays and thusbenefits tend to infinity as berth occupancy approaches 100 percent.
High growth scenario: Berth occupancy would reach 100 percent by 2000 and therewould be very long shipping delays and some suppression of port traffic. Even with therationalization of the cargo areas and new equipment, berth occupancy in 2005 would beover 90 percent and there would still be very substantial average berthing delays. Berthoccupancy is only brought down to reasonable levels with the extension of Berth No. 6.Overall economic benefits would be much higher than under the central growth scenariobut these are not filly reflected in the economic analysis as an upper limit was imposed onthe ship waiting:service time ratio, Table 7.
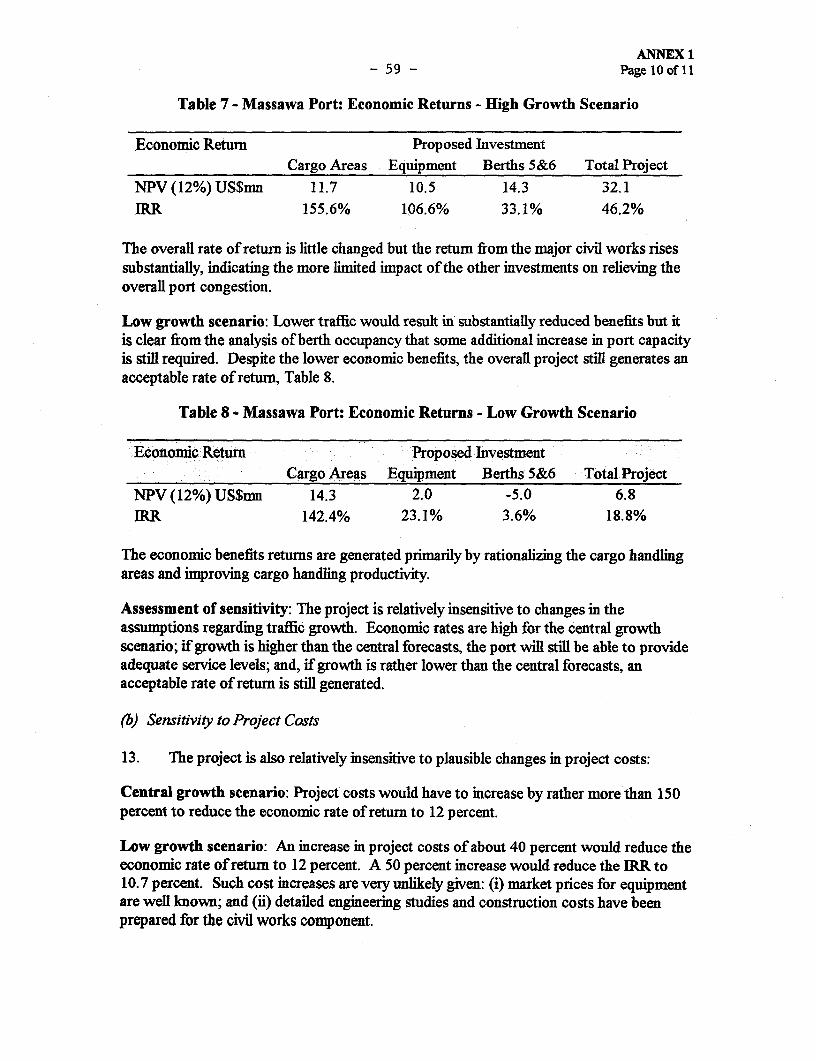
ANNEX 1- 59 - Page lOoflI
Table 7 - Massawa Port: Economic Returns - Hligh Growth Scenario
Economic Return Proposed InvestmentCargo Areas Equipment Berths 5&6 Total Project
NPV (12%) US$mn 11.7 10.5 14.3 32.1IRR 155.6% 106.6% 33.1% 46.2%
The overall rate of return is little changed but the return from the major civil works risessubstantially, indicating the more limited impact of the other investments on relieving theoverall port congestion.
Low growth scenario: Lower traffic would result in substantially reduced benefits but itis clear from the analysis of berth occupancy that some additional increase in port capacityis still required. Despite the lower economic benefits, the overall project still generates anacceptable rate of return, Table 8.
Table 8 - Massawa Port: Economic Returns - Low Growth Scenario
Economic Return Proposed InvestmentCargo Areas Equipment Berths 5&6 Total Project
NPV (12%) US$mn 14.3 2.0 -5.0 6.8IRR 142.4% 23.1% 3.6% 18.8%
The economic benefits returns are generated primarily by rationalizing the cargo handlingareas and improving cargo handling productivity.
Assessment of sensitivity: The project is relatively insensitive to changes in theassumptions regarding traffic growth. Economic rates are high for the central growthscenario; if growth is higher than the central forecasts, the port will still be able to provideadequate service levels; and, if growth is rather lower than the central forecasts, anacceptable rate of return is still generated.
(b) Sensitivity to Project Costs
13. The project is also relatively insensitive to plausible changes in project costs:
Central growth scenario: Project costs would have to increase by rather more than 150percent to reduce the economic rate of return to 12 percent.
Low growth scenario: An increase in project costs of about 40 percent would reduce theeconomic rate of return to 12 percent. A 50 percent increase would reduce the IRR to10.7 percent. Such cost increases are very unlikely given: (i) market prices for equipmentare well known; and (ii) detailed engineering studies and construction costs have beenprepared for the civil works component.

ANNEX 1- 60 - Page 11 of 11
(c) Sensitivity to Productivity Assumptions
14. Substantial increases in cargo handling productivity are foreseen by the clearanceof the cargo handling areas and the additional handling equipment. If the productivitygains were reduced to 50 percent of the forecast levels, the overall investment would stillbe justified, irrespective of the traffic scenario, Table 9.
Table 9 - Massawa Port: Economic Returns - Reduced Productivity Gains
Economic Return Traffic ForecastLow Central High
NPV (12%) US$mn 0.24 17.64 20.17IRR 12.2% 32.2% 32.1%
The benefits from the rationalization of the cargo handling areas and investment inequipment are reduced. The reduction in these benefits are, however, partially offset byincreased benefits to the berth repairs and extension as a result of the increased residualcongestion which would remain after the impact of the other investments.
(d) Overall Assessment of Sensitivity and Project Risks
15. The project generates very high rates of return and is insensitive to plausiblechanges in project parameters. The overall level of economic returns is sensitive to thegrowth in port traffic but, even with low growth and a substantial reduction inproductivity benefits, the investment is still justified. The Eritrean Ports Authority and theGovernment believe that the central traffic forecast is rather conservative and they expecta much faster rate of growth. Though the investment will allow the high traffic forecast tobe accommodated, the evolution of traffic at Massawa will need to be kept under reviewto ensure that future capacity is provided at the appropriate time.

ANNEX 2- 61 - Page I of16
PORT OF ASSAB
Present and Forecast Port Traffic
1. The port of Assab is Ethiopia's primary access to the sea, handling about 85percent of its total external trade. Ethiopia dominates dry cargo traffic at the port (over95 percent). Port traffic increased very substantially in the early 1980's (primarily growthin relief cargo but with some increase in commercial cargo), fell significantly in the early1990's after the change in regime, and has subsequently recovered to previous levels. Porttraffics for the last four years are detailed in Table 1.
Table 1 - Port of Assab: Dry Cargo Traffic 1993 - 96('000 tonnes)
Commodity 1993 1994 1995 1996Imports:Grains/food 344 735 556 200Fertilizer 183 57 305 390Iron/steel 130 84 111 220Vehicles/machinery 52 49 75 87Other 238 210 189 235Total Imports 947 1,135 1,236 1,132Total Exports 99 145 164 199Total Dry Cargo 1,046 1,280 1,400 1,331
2. Dry cargo traffic handled during 1995 was approximately equal to the maximmhandled during the 1980's but was achieved without the major congestion previouslyexperienced. Improved port performance reflects a shift to direct delivery for bulk andbagged commodities, increased inland transport capacity, upgraded storage areas, andmore efficient port operations.
3. Major increases in the total volume of dry cargo traffic are not expected but verysubstantial shifts in the commodity distribution are probable:
* the high level of fertilizer imports is expected to continue, even if donor assistanceis reduced;
* grain production in Ethiopia will expand significantly and there will be a gradualdecline in food imports, although there will still be marked fluctuations in annualflows, depending upon rainfll and domestic production;
* economic growth in Ethiopia will increase imports of raw materials, vehicles,machinery and other general cargo. The growth rate is expected to beapproximately equal to the growth in GDP, i.e. about 6 percent per annum; and
* coffee and other agricultural exports have increased since 1992, and this growth isexpected to continue.
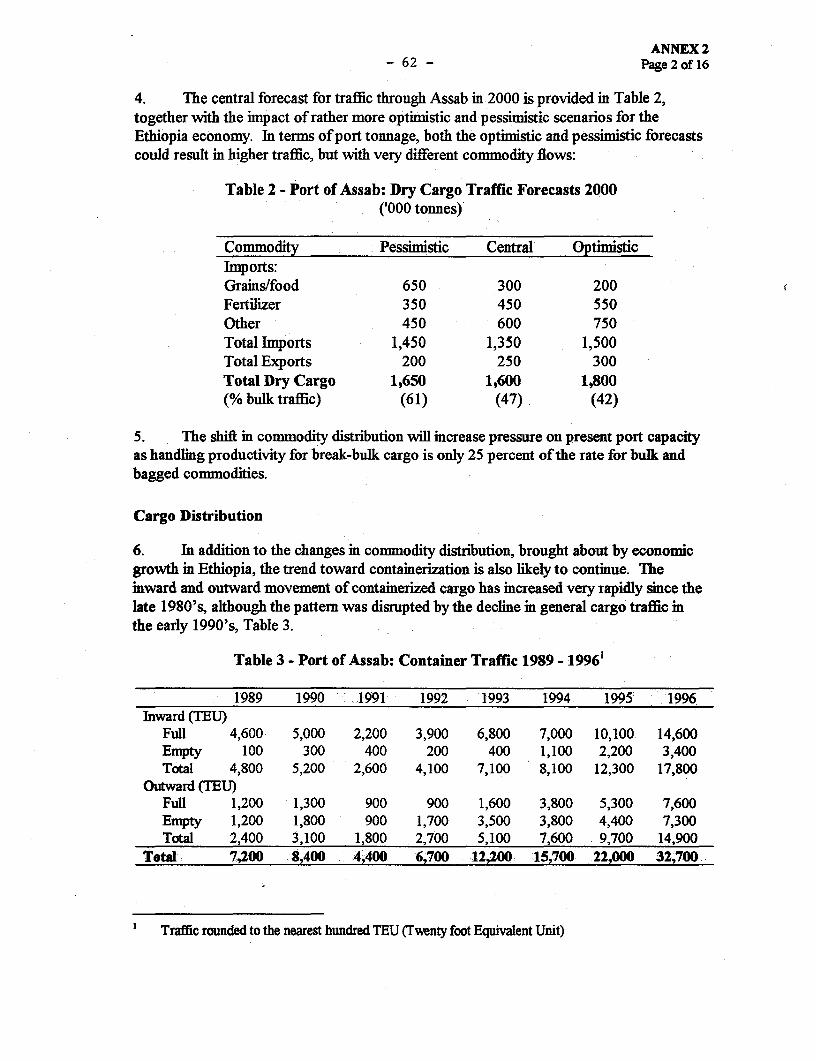
ANNEX 2- 62 - Page 2 of l6
4. The central forecast for traffic through Assab in 2000 is provided in Table 2,together with the impact of rather more optimistic and pessimistic scenarios for theEthiopia economy. In terms of port tonnage, both the optimistic and pessimistic forecastscould result in higher traffic, but with very different commodity flows:
Table 2 - Port of Assab: Dry Cargo Traffic Forecasts 2000('000 tonnes)
Commodity Pessimistic Central OptimisticImports:Grains/food 650 300 200Fertilizer 350 450 550Other 450 600 750Total Imports 1,450 1,350 1,500Total Exports 200 250 300Total Dry Cargo 1,650 1,600 1,800(% bulk traffic) (61) (47) (42)
5. The shift in commodity distribution will increase pressure on present port capacityas handling productivity for break-bulk cargo is only 25 percent of the rate for bulk andbagged commodities.
Cargo Distribution
6. In addition to the changes in commodity distribution, brought about by economicgrowth in Ethiopia, the trend toward containerization is also likely to continue. Theinward and outward movement of containerized cargo has increased very rapidly since thelate 1980's, although the pattern was disrupted by the decline in general cargo traffic inthe early 1990's, Table 3.
Table 3 - Port of Assab: Container Traffic 1989 - 19961
1989 1990 -1991 1992 1993 1994 1995 1996Inward (TEU)
Full 4,600 5,000 2,200 3,900 6,800 7,000 10,100 14,600Empty 100 300 400 200 400 1,100 2,200 3,400Total 4,800 5,200 2,600 4,100 7,100 8,100 12,300 17,800
Outward (TEU)Full 1,200 1,300 900 900 1,600 3,800 5,300 7,600Empty 1,200 1,800 900 1,700 3,500 3,800 4,400 7,300Total 2,400 3,100 1,800 2,700 5,100 7,600 9,700 14,900
Total 7,200 8,400 4,400 6,700 12,200 15,700 22,000 32,700
Traffic rounded to the nearest hundred TEU (Twenty foot Equivalent Unit)
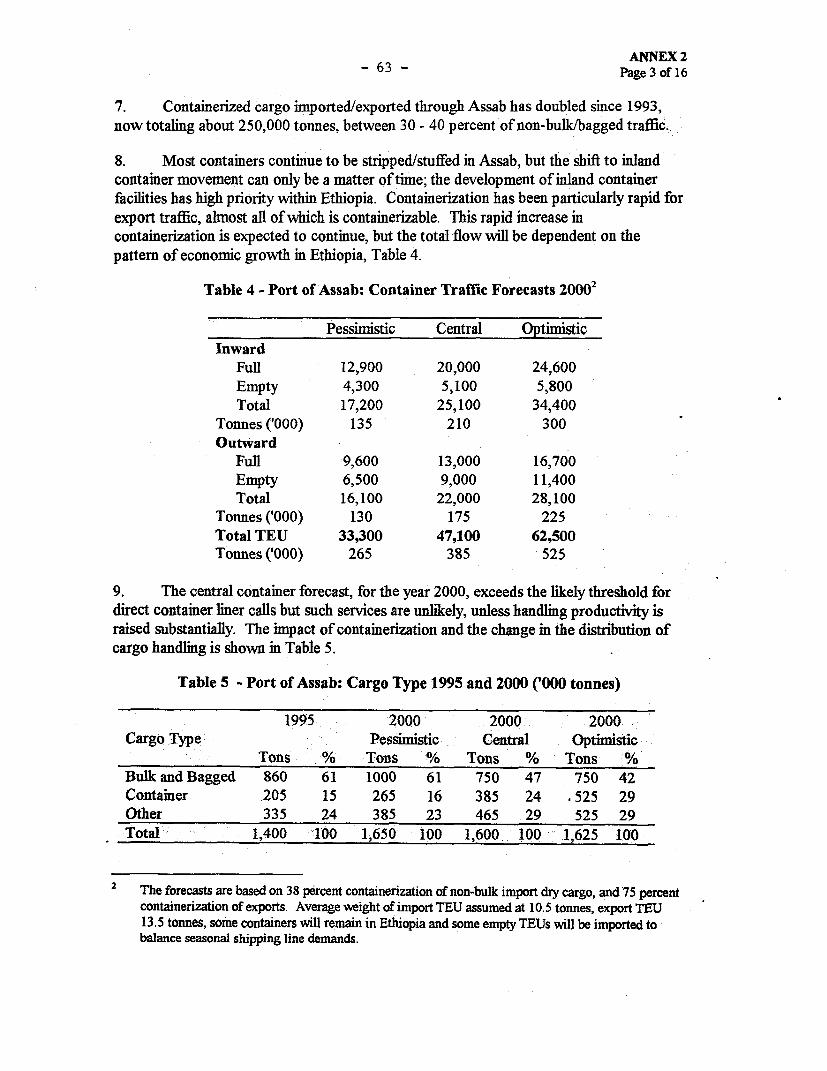
ANNEX 2- 63 - Page 3 of 16
7. Containerized cargo imported/exported through Assab has doubled since 1993,now totaling about 250,000 tonnes, between 30 - 40 percent of non-bulk/bagged traffic.
8. Most containers continue to be stripped/stuffed in Assab, but the shift to inlandcontainer movement can only be a matter of time; the development of inland containerfacilities has high priority within Ethiopia. Containerization has been particularly rapid forexport traffic, almost all of which is containelizable. This rapid increase incontainerization is expected to continue, but the total flow will be dependent on thepattern of economic growth in Ethiopia, Table 4.
Table 4 - Port of Assab: Container Traffic Forecasts 20002
Pessimistic Central OptimisticInward
Full 12,900 20,000 24,600Empty 4,300 5,100 5,800Total 17,200 25,100 34,400
Tonnes ('000) 135 210 300Outward
Full 9,600 13,000 16,700Empty 6,500 9,000 11,400Total 16,100 22,000 28,100
Tonnes ('000) 130 175 225Total TEU 33,300 47,100 62,500Tonnes ('000) 265 385 525
9. The central container forecast, for the year 2000, exceeds the likely threshold fordirect container liner calls but such services are unlikely, unless handling productivity israised substantially. The impact of containerization and the change in the distribution ofcargo handling is shown in Table 5.
Table 5 - Port of Assab: Cargo Type 1995 and 2000 ('000 tonnes)
1995 2000 2000 2000Cargo Type Pessimistic Central Optimistic
Tons % Tons % Tons % Tons %Bulk and Bagged 860 61 1000 61 750 47 750 42Container 205 15 265 16 385 24 .525 29Other 335 24 385 23 465 29 525 29Total 1,400 100 1,650 100 1,600 100 1,625 100
2 The forecasts are based on 38 percent containerization of non-bulk import dry cargo, and 75 percentcontainerization of exports. Average weight of import TEU assumed at 10.5 tonnes, export TEU13.5 tonnes, some containers will remain in Ethiopia and some empty TEUs will be imported tobalance seasonal shipping line demands.
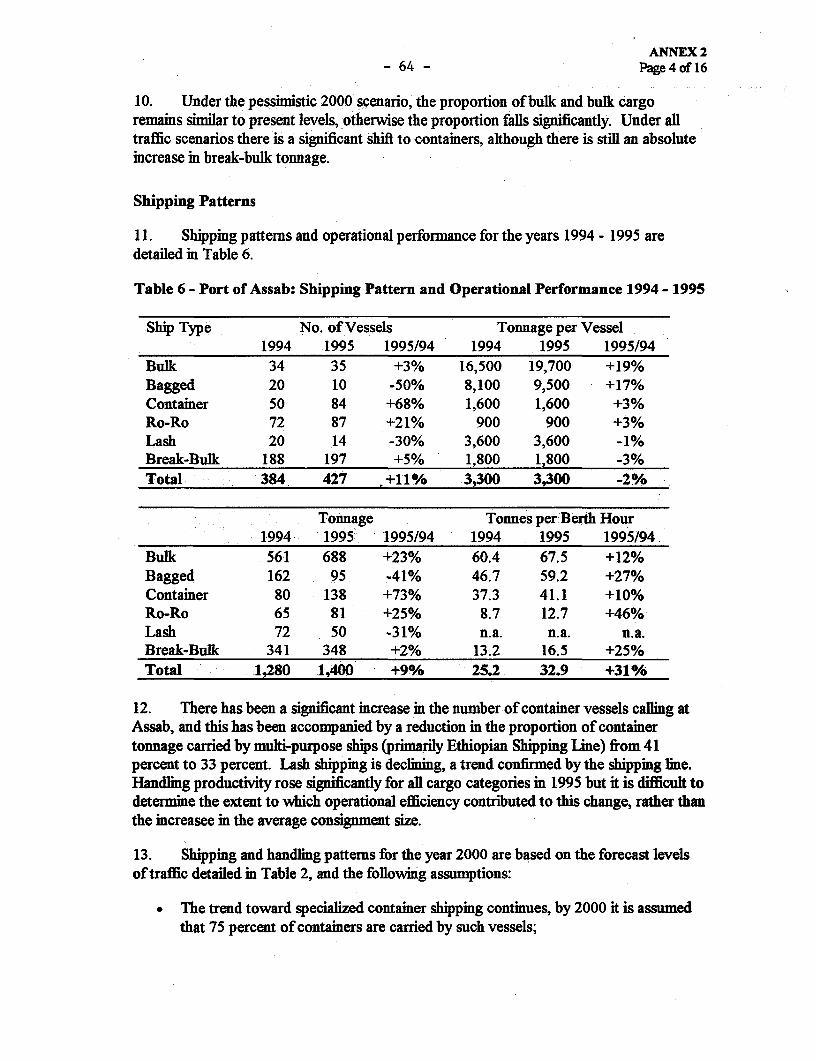
ANNEX 2- 64 - Page4ofl6
10. Under the pessimistic 2000 scenario, the proportion of bulk and bulk cargo
remains similar to present levels, otherwise the proportion fails significantly. Under alltraffic scenarios there is a significant shift to containers, although there is still an absolute
increase in break-bulk tonnage.
Shipping Patterns
11. Shipping patterns and operational performance for the years 1994 - 1995 are
detailed in Table 6.
Table 6 - Port of Assab: Shipping Pattern and Operational Performance 1994 - 1995
Ship Type No. of Vessels Tonnage per Vessel
1994 1995 1995/94 1994 1995 1995/94Bulk 34 35 +3% 16,500 19,700 +19%Bagged 20 10 -50% 8,100 9,500 +17%Container 50 84 +68% 1,600 1,600 +3%Ro-Ro 72 87 +21% 900 900 +3%Lash 20 14 -30% 3,600 3,600 -1%Break-Bulk 188 197 +5% 1,800 1,800 -3%Total 384 427 r+11 % 3,300 3,300 -2/O
Tonnage Tonnes per Berth Hour1994 1995- -1995/94 1994 1995 1995/94
Bulk 561 688 +23% 60.4 67.5 +12%Bagged 162 95 -41% 46.7 59.2 +27%Container 80 138 +73% 37.3 41.1 +10%Ro-Ro 65 81 +25% 8.7 12.7 +46%Lash 72 50 -31% n.a. n.a. n.a.Break-Bulk 341 348 +2% 13.2 16.5 +25%
Total 1,280 1,400 +9% 25.2 32.9 +31%
12. There has been a significant increase in the number of container vessels calling atAssab, and this has been accompanied by a reduction in the proportion of container
tonnage carried by multi-purpose ships (primarily Ethiopian Shipping Line) from 41percent to 33 percent. Lash shipping is declining, a trend confirmed by the shipping line.
Handling productivity rose significantly for all cargo categories in 1995 but it is difficult todetermine the extent to which operational efficiency contributed to this change, rather than
the increasee in the average consignment size.
13. Shipping and handling pattems for the year 2000 are based on the forecast levels
of traffic detailed in Table 2, and the following assumptions:
The trend toward specialized container shipping continues, by 2000 it is assumed
that 75 percent of containers are carried by such vessels;
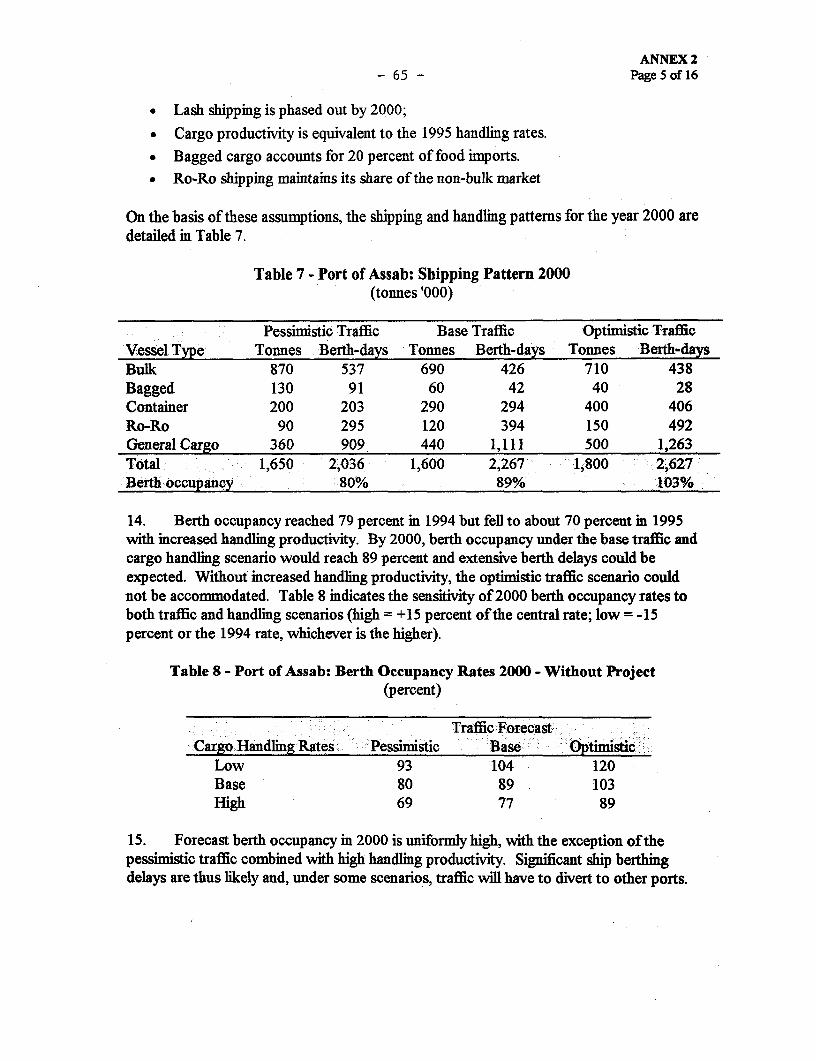
ANNEX 2- 65 - Page 5 of l6
Lash shipping is phased out by 2000;
Cargo productivity is equivalent to the 1995 handling rates.Bagged cargo accounts for 20 percent of food imports.
* Ro-Ro shipping maintains its share of the non-bulk market
On the basis of these assumptions, the shipping and handling patterns for the year 2000 aredetailed in Table 7.
Table 7 - Port of Assab: Shipping Pattern 2000(tonnes '000)
Pessimistic Traffic Base Traffic Optimistic TrafficVessel Type Tonnes Berth-days Tonnes Berth-days Tonnes Berth-daysBulk 870 537 690 426 710 438Bagged 130 91 60 42 40 28Container 200 203 290 294 400 406Ro-Ro 90 295 120 394 150 492General Cargo 360 909 440 1,111 500 1,263Total 1,650 2,036 1,600 2,267 1,800 2,627Berth occupancy 80% 89% 103%
14. Berth occupancy reached 79 percent in 1994 but fell to about 70 percent in 1995with increased handling productivity. By 2000, berth occupancy under the base traffic andcargo handling scenario would reach 89 percent and extensive berth delays could beexpected. Without increased handling productivity, the optimistic traffic scenario couldnot be accommodated. Table 8 indicates the sensitivity of 2000 berth occupancy rates toboth traffic and handling scenarios (high = +15 percent of the central rate; low = -15percent or the 1994 rate, whichever is the higher).
Table 8 - Port of Assab: Berth Occupancy Rates 2000 - Without Project(percent)
Traffic ForecastCargo Handling Rates Pessimistic Base optimistic-
Low 93 104 120Base 80 89 . 103High 69 77 89
15. Forecast berth occupancy in 2000 is uniformly high, with the exception of thepessimistic traffic combined with high handling productivity. Significant ship berthingdelays are thus likely and, under some scenarios, traffic will have to divert to other ports.
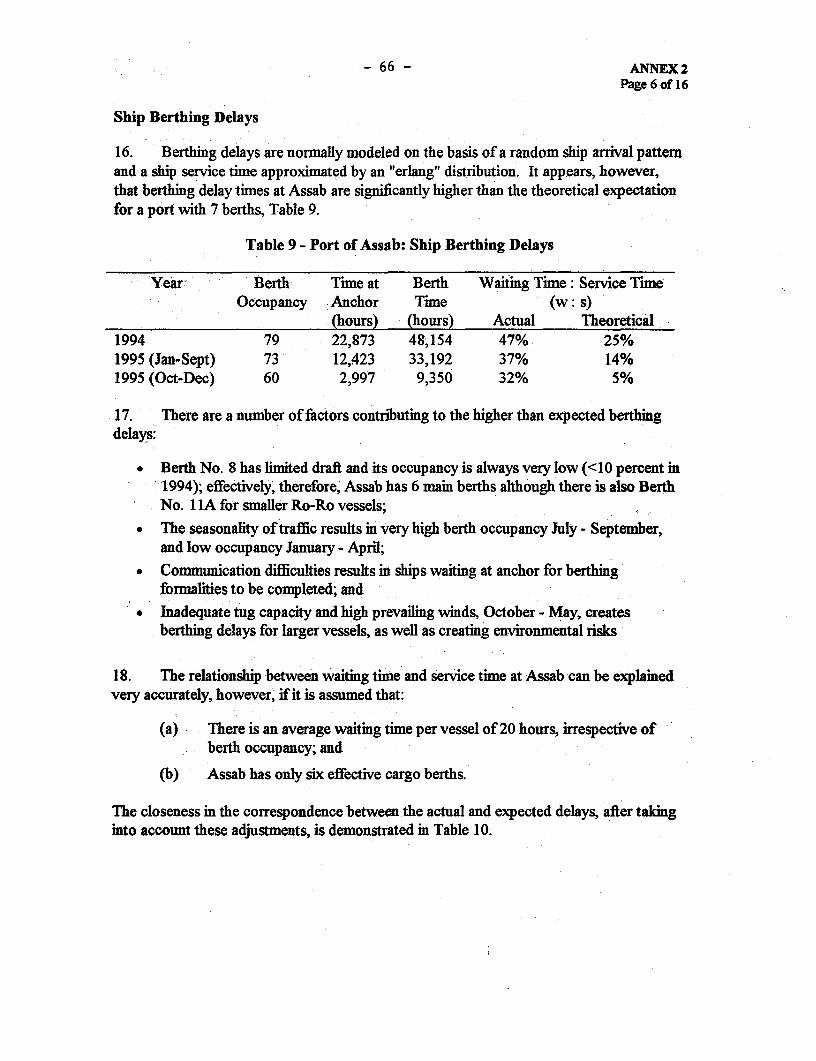
- 66 - ANNEX2Page 6 of 16
Ship Berthing Delays
16. Berthing delays are normally modeled on the basis of a random ship arnival patternand a ship service time approximated by an "erlang" distribution. It appears, however,that berthing delay times at Assab are significantly higher than the theoretical expectationfor a port with 7 berths, Table 9.
Table 9 - Port of Assab: Ship Berthing Delays
Year, Berth Time at Berth Waiting Time: Service TimeOccupancy Anchor Time (w: s)
(hours) (hours) Actual Theoretical1994 79 22,873 48,154 47% 25%1995 (Jan-Sept) 73 12,423 33,192 37% 14%1995 (Oct-Dec) 60 2,997 9,350 32% 5%
17. There are a number of factors contributing to the higher than expected berthingdelays:
* Berth No. 8 has limited draft and its occupancy is always very low (<10 percent in1994); effectively, therefore, Assab has 6 main berths although there is also BerthNo. 1 lA for smaller Ro-Ro vessels;
* The seasonalty of traffic results im very high berth occupancy July - September,and low occupancy January - April;
* Communication difficulties results in ships waiting at anchor for berthingformalhies to be completed; and
* Inadequate tug capacity and high prevailing winds, October - May, createsberthing delays for larger vessels, as well as creating environmental risks
18. The relationship between waiting time and service time at Assab can be explainedvery accurately, however, if it is assumed that:
(a) There is an average waiting time per vessel of 20 hours, irrespective ofberth occupancy; and
(b) Assab has only six effective cargo berths.
The closeness in the correspondence between the actual and expected delays, after takinginto account these adjustments, is demonstrated in Table 10.
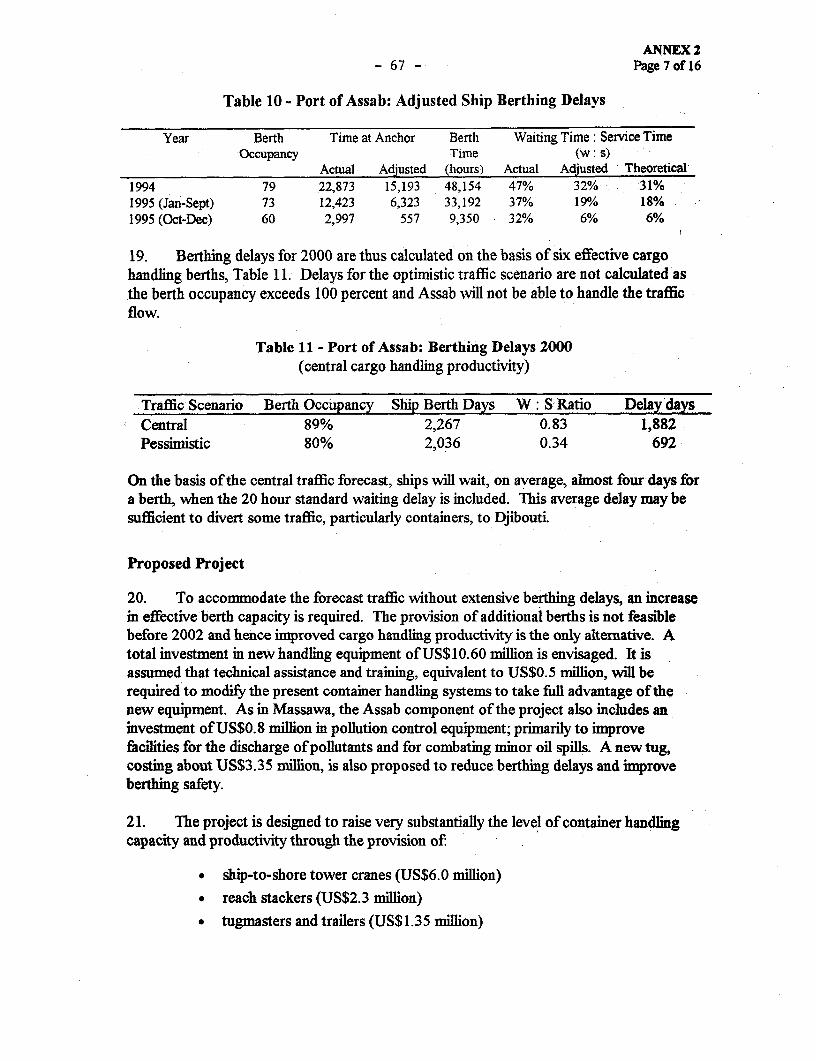
ANNEX 2- 67 - Page 7 of 16
Table 10 - Port of Assab: Adjusted Ship Berthing Delays
Year Berth Time at Anchor Berth Waiting Time: Service TimeOccupancy Time (w: s)
Actual Adjusted (hours) Actual Adjusted Theoretical1994 79 22,873 15,193 48,154 47% 32% 31%1995 (Jan-Sept) 73 12,423 6,323 33,192 37% 19% 18%1995 (Oct-Dec) 60 2,997 557 9,350 32% 6% 6%
19. Berthing delays for 2000 are thus calculated on the basis of six effective cargohandling berths, Table 11. Delays for the optimistic traffic scenario are not calculated asthe berth occupancy exceeds 100 percent and Assab will not be able to handle the trafficflow.
Table 11 - Port of Assab: Berthing Delays 2000(central cargo handling productivity)
Traffic Scenario Berth Occupancy Ship Berth Days W: S Ratio DelaydaysCentral 89% 2,267 0.83 1,882Pessimistic 80% 2,036 0.34 692
On the basis of the central traffic forecast, ships will wait, on average, almost four days fora berth, when the 20 hour standard waiting delay is included. This average delay may besufficient to divert some traffic, particularly containers, to Djibouti.
Proposed Project
20. To accommodate the forecast traffic without extensive berthing delays, an increasein effective berth capacity is required. The provision of additional berths is not feasiblebefore 2002 and hence improved cargo handling productivity is the only alternative. Atotal investment in new handling equipment of US$10.60 million is envisaged. It isassumed that technical assistance and training, equivalent to US$0.5 million, will berequired to modify the present container handling systems to take full advantage of thenew equipment. As in Massawa, the Assab component of the project also includes aninvestment of US$0.8 million in pollution control equipment; primarily to improvefacilities for the discharge of pollutants and for combating minor oil spills. A new tug,costing about US$3.35 million, is also proposed to reduce berthing delays and improveberthing safety.
21. The project is designed to raise very substantially the level of container handlingcapacity and productivity through the provision of:
* ship-to-shore tower cranes (US$6.0 million)
* reach stackers (US$2.3 million)
* tugmasters and trailers (US$1.35 million)
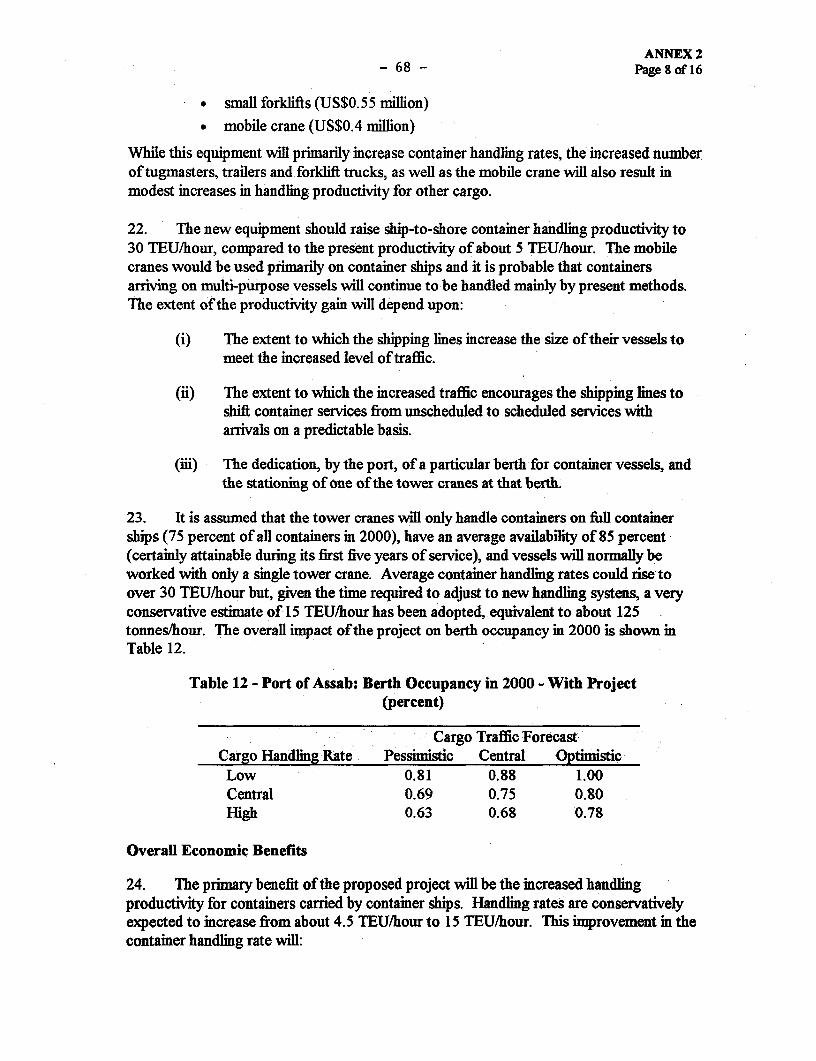
ANNEX 2- 68 - Page 8 of 16
. small forklifts (US$0.55 million)
* mobile crane (US$0.4 million)
While this equipment will primarily increase container handling rates, the increased numberoftugmasters, trailers and forklift trucks, as well as the mobile crane will also result inmodest increases in handling productivity for other cargo.
22. The new equipment should raise ship-to-shore container handling productivity to30 TEU/hour, compared to the present productivity of about 5 TEU/hour. The mobilecranes would be used primarily on container ships and it is probable that containersarriving on multi-purpose vessels will continue to be handled mainly by present methods.The extent of the productivity gain will depend upon:
(i) The extent to which the shipping lines increase the size of their vessels tomeet the increased level of traffic.
(ii) The extent to which the increased traffic encourages the shipping lines toshift container services from unscheduled to scheduled services witharrivals on a predictable basis.
(iii) The dedication, by the port, of a particular berth for container vessels, andthe stationing of one of the tower cranes at that berth.
23. It is assumed that the tower cranes will only handle containers on full containerships (75 percent of all containers in 2000), have an average availability of 85 percent(certainly attainable during its first five years of service), and vessels will normally beworked with only a single tower crane. Average container handling rates could rise toover 30 TEU/hour but, given the time required to adjust to new handling systens, a veryconservative estimate of 15 TEU/hour has been adopted, equivalent to about 125tonnes/hour. The overall impact of the project on berth occupancy in 2000 is shown inTable 12.
Table 12 - Port of Assab: Berth Occupancy in 2000 - With Project(percent)
Cargo Traffic ForecastCargo Handling Rate Pessimistic Central OptimisticLow 0.81 0.88 1.00Central 0.69 0.75 0.80High 0.63 0.68 0.78
Overall Economic Benefits
24. The primary benefit of the proposed project will be the increased handlingproductivity for containers carried by container ships. Handling rates are conservativelyexpected to increase from about 4.5 TEU/hour to 15 TEU/hour. This improvement in thecontainer handling rate will:

ANNEX 2- 69 - Page9ofl6
(i) Reduce the berth time for container ships;
(ii) Reduce overall berth occupancy, thus reducing berthing delays for all ships,
as well as allowing the port to handle increased cargo; and
(iii) Increase the likelihood that the container lines will shift from feeder
services to direct liner calls. This shift in the container service could reduce
the container freight rates by, at least, US$500/TEU.
25. In view of the high berth occupancy rates, even with the investment, the shift todirect liner services is uncertain and these benefits, which could be very substantial, have
not been included in the economic analysis. Based on the conventional methodology usedfor estimating economic benefits from port investment, the project's economic benefits are
detailed in Table 13.
Table 13 - Port of Assab: Project Benefits in 2000Central Forecasts
(a) Without Investment
Vessel Tonnes Handling Berth Cost BerthCost Berthing Delay Costs(000) tons/hour Days US$/day US$mn
Bulk 690 67.5 426 6,000 2.56 Berthoccupancy 89%Bagged 60 59.2 42 5,000 0.21 W:Sratio 0.83Container 290 41.1 294 5,000 1.47 Shipdelay(days) 1,882Ro-Ro 120 12.7 394 5,000 1.97 Shipcost/day 5,000Generalcargo 440 16.5 1,111 4,000 4.44Total 1,600 2,267 10.65 DelaycostUS$mn 9.41
(b) With Investment
Vessel Tonnes Handling Berth Cost BerthCost Berthing Delay Costs(000) tons/hour Days US$/day US$mn
Bulk 690 70.8 406 6,000 2.44 Berthoccupancy 75%Bagged 60 62.5 40 5,000 0.21 W:Sratio 0.22Container 290 124.5 97 5,000 0.49 Shipdelay(days) 421Ro-Ro 120 12.7 394 5,000 1.97 Shipcost/day 5,000Generalcargo 440 18.8 998 4,000 3.91Total 1,500 1,915 9.00 DelaycostUS$mn 2.11
(c) Project Benefits 2000
Ship Costs Without Investment With Investment Project Benefits
(US$ mn) (US$ mn) (US$ mn)
Berth time 10.65 9.00 1.65Berthing delay time 9.41 2.11 7.30
Total 20.06 11.11 8.95
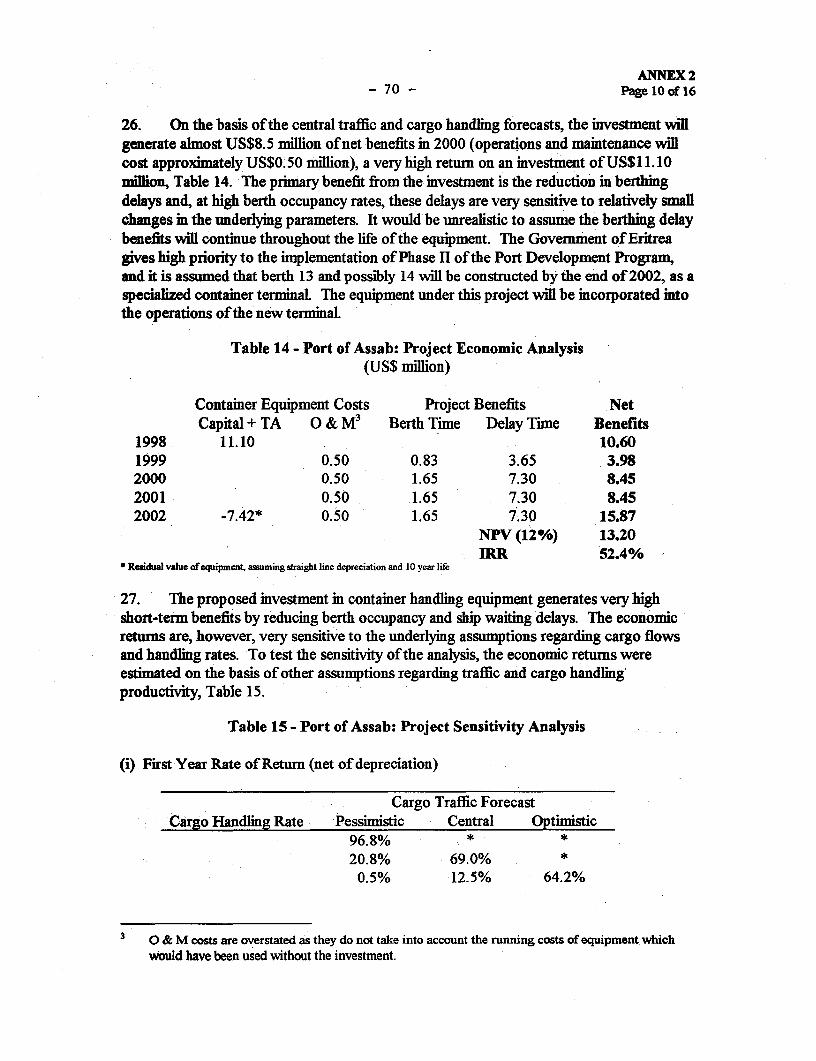
ANNEX 2- 70 - Page lOof 16
26. On the basis of the central traffic and cargo handling forecasts, the investment willgenerate almost US$8.5 million of net benefits in 2000 (operations and maintenance willcost approximately US$0.50 million), a very high return on an investment of US$11. 10million, Table 14. The primary benefit from the investment is the reduction im berthingdelays and, at high berth occupancy rates, these delays are very sensitive to relatively smallchanges in the underlying parameters. It would be unrealistic to assume the berthing delaybenefits will continue throughout the life of the equipment. The Government of Eritreagives high priority to the implementation of Phase II of the Port Development Program,and it is assumed that berth 13 and possibly 14 will be constructed by the end of 2002, as aspecialzed container terminal. The equipment under this project will be incorporated intothe operations of the new terminal.
Table 14 - Port of Assab: Project Economic Analysis(US$ million)
Container Equipment Costs Project Benefits NetCapital + TA O & M3 Berth Time Delay Time Benefits
1998 11.10 10.601999 0.50 0.83 3.65 3.982000 0.50 1.65 7.30 8.452001 0.50 1.65 7.30 8.452002 -7.42* 0.50 1.65 7.30 15.87
NPV (12i/) 13.20IRR 52.4% -
* Residual value of equipment, assuming straight line depreciation and 10 year life
27. The proposed investment in container handling equipment generates very highshort-term benefits by reducing berth occupancy and ship waiting delays. The economicreturns are, however, very sensitive to the underlying assumptions regarding cargo flowsand handling rates. To test the sensitivity of the analysis, the economic returns wereestimated on the basis of other assumptions regarding traffic and cargo handlingproductivity, Table 15.
Table 15 - Port of Assab: Project Sensitivity Analysis
(i) First Year Rate of Retumn (net of depreciation)
Cargo Traffic ForecastCargo Handling Rate Pessimistic Central Optimistic
96.8% * *
20.8% 69.0% *0.5% 12.5% 64.2%
3 0 & M costs are overstated as they do not take into account the running costs of equipment whichwould have been used without the investment.
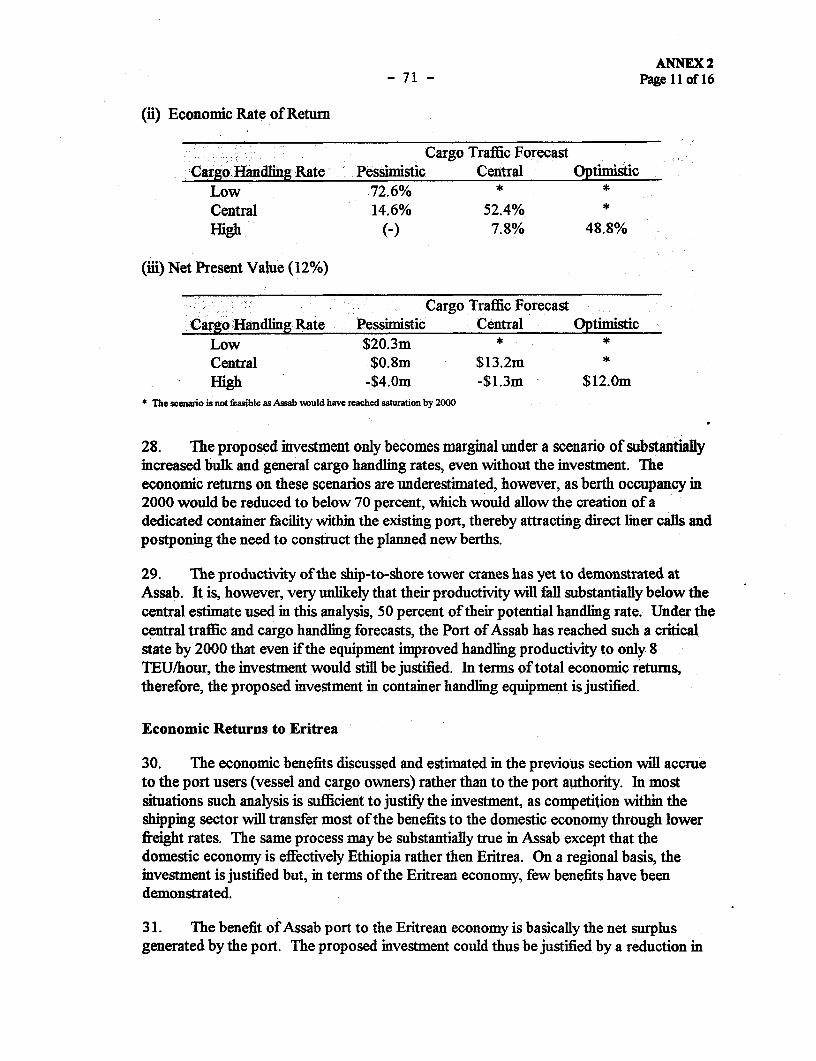
ANNEX 2- 71 - Page 11 of 16
(ii) Economic Rate of Return
Cargo Traffic ForecastCargo Handling Rate Pessimistic Central Optimistic
Low 72.6% * *Central 14.6% 52.4% *High (-) 7.8% 48.8%
(iii) Net Present Value (12%)
Cargo Traffic ForecastCargo Handlng Rate Pessimistic Central Optimistic
Low $20.3m * *Central $0.8m $13.2m *High -$4.0m -$1.3m $12.0m
* The scenario is not fiasible as Assab %ould have reached saturation by 2000
28. The proposed investment only becomes marginal under a scenario of substantiallyincreased bulk and general cargo handling rates, even without the investment. Theeconomic returns on these scenarios are underestimated, however, as berth occupancy in2000 would be reduced to below 70 percent, which would allow the creation of adedicated container facility within the existing port, thereby attracting direct liner calls andpostponing the need to construct the planned new berths.
29. The productivity of the ship-to-shore tower cranes has yet to demonstrated atAssab. It is, however, very unlikely that their productivity will fall substantially below thecentral estimate used in this analysis, 50 percent of their potential handling rate. Under thecentral traffic and cargo handling forecasts, the Port of Assab has reached such a criticalstate by 2000 that even if the equipment improved handling productivity to only 8TEU/hour, the investment would still be justified. In terms of total economic retums,therefore, the proposed investment in container handling equipment is justified.
Economic Returns to Eritrea
30. The economic benefits discussed and estimated in the previous section will accrueto the port users (vessel and cargo owners) rather than to the port authority. In mostsituations such analysis is sufficient to justify the investment, as competition within theshipping sector will transfer most of the benefits to the domestic economy through lowerfreight rates. The same process may be substantially true in Assab except that thedomestic economy is effectively Ethiopia rather then Eritrea. On a regional basis, theinvestment is justified but, in terms of the Eritrean economy, few benefits have beendemonstrated.
31. The benefit of Assab port to the Eritrean economy is basically the net surplusgenerated by the port. The proposed investment could thus be justified by a reduction in
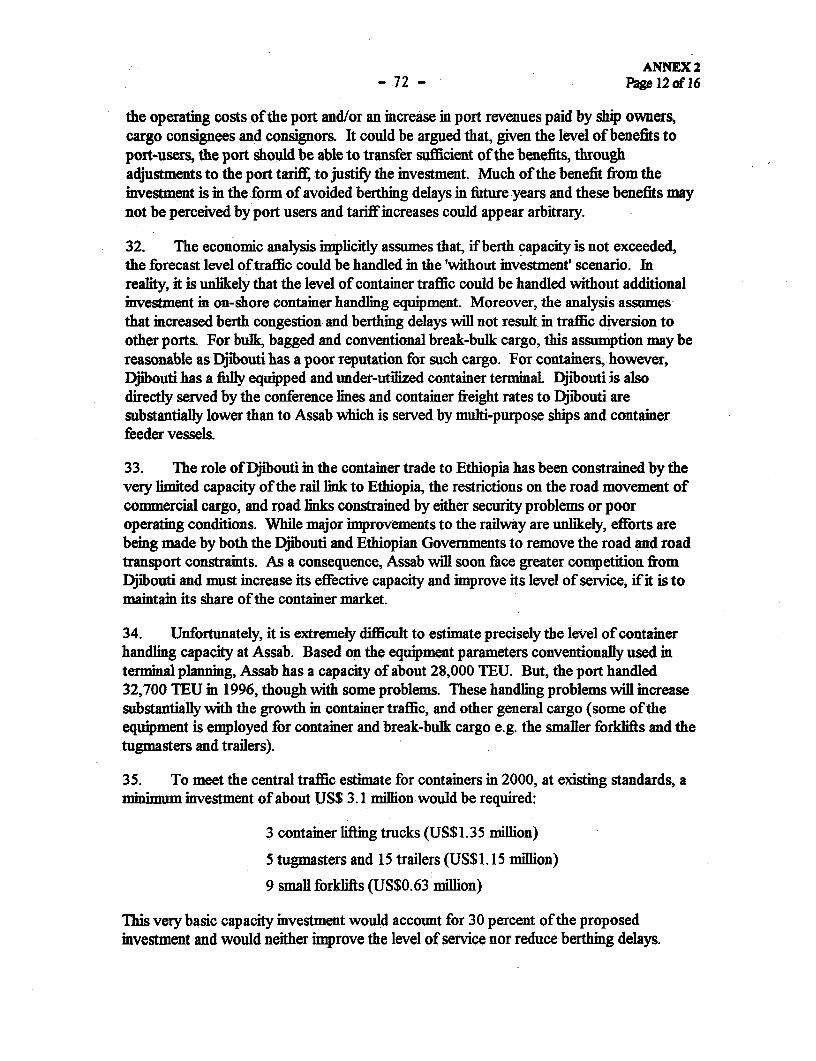
-72- ANNEX2- 72 - - Page 12 of 16
the operating costs of the port and/or an increase in port revenues paid by ship owners,cargo consignees and consignors. It could be argued that, given the level of benefits toport-users, the port should be able to transfer sufficient of the benefits, throughadjustments to the port tariff to justify the investment. Much of the benefit from theinvestment is in the form of avoided berthing delays in future years and these benefits maynot be perceived by port users and tariff increases could appear arbitrary.
32. The economic analysis implicitly assumes that, if berth capacity is not exceeded,the forecast level of.traffic could be handled in the 'without investment' scenario. Inreality, it is unlikely that the level of container traffic could be handled without additionalinvestment in on-shore container handling equipment. Moreover, the analysis assumesthat increased berth congestion and berthing delays will not result in traffic diversion toother ports. For bulk, bagged and conventional break-bulk cargo, this assumption may bereasonable as Djibouti has a poor reputation for such cargo. For containers, however,Djibouti has a fully equipped and under-utilized container terminal. Djibouti is alsodirectly served by the conference lines and container freight rates to Djibouti aresubstantially lower than to Assab which is served by multi-purpose ships and containerfeeder vessels.
33. The role of Djibouti in the container trade to Ethiopia has been constrained by thevery limited capacity of the rail link to Ethiopia, the restrictions on the road movement ofcommercial cargo, and road links constrained by either security problems or pooroperating conditions. While major improvements to the railway are unlikely, efforts arebeing made by both the Dfibouti and Ethiopian Governments to remove the road and roadtransport constraints. As a consequence, Assab will soon face greater competition fromDjibouti and must increase its effective capacity and improve its level of service, if it is tomaintain its share of the container market.
34. Unfortunately, it is extremely difficult to estimate precisely the level of containerhandling capacity at Assab. Based on the equipment parameters conventionally used interminal planning, Assab has a capacity of about 28,000 TEU. But, the port handled32,700 TEU in 1996, though with some problems. These handling problems will increasesubstantially with the growth in container traffic, and other general cargo (some of theequipment is employed for container and break-bulk cargo e.g. the smaller forklifts and thetugmasters and trailers).
35. To meet the central traffic estimate for containers in 2000, at existing standards, aminimum investment of about US$ 3.1 million would be required:
3 container lifting trucks (US$1.35 milion)
5 tugmasters and 15 trailers (US$1. 15 million)
9 small forklifts (US$0.63 million)
This very basic capacity investment would account for 30 percent of the proposedinvestment and would neither improve the level of service nor reduce berthing delays.

ANNEX 2- 73 - Page 13 of 16
36. Some of the traffic and handling rate scenarios indicate that Assab, withoutinvestment, will have exceeded berth capacity by 2000, and some traffic would have beensuppressed or, more likely, diverted to Djibouti. Even under the central traffic and cargohandling estimates, berthing delays in 2000 would average about 4 days per vessel, at acost of over US$100/TEU and this would be in addition to the penalty which Assabalready faces from being served by feeder vessels. With these cost and service penalties, itis almost inevitable that some container traffic will divert to Djibouti. The problem isforecasting the potential level of diversion, combining the increased accessibility ofPjibouti (through improved land transport) and deteriorating conditions at Assab.
37. To test the potential financial benefits of the investment for the Port of Assab, anumber of scenarios of potential capacity limits, and increased container handling charges(to reflect improved quality of service) were tested, Table 16. These scenarios areunderestimates of the total financial benefits to the Port as they exclude the benefits toother traffics of the investment, and the reduced shipping revenue, if container shipping isreduced. The estimates are based on the central forecast for container traffic.
Table 16 - Port of Assab: Financial Returns
(i) Financial Rate of Return
Assab Capacity Increase in Container Handling Charges(TEU/year) US$ 0 US$15/TEU US$25/TEU
35,000 17.7% 23.9% 28.0%37,500 12.5% 18.7% 22.8%40,000 7.5% 13.5% 17.6%42,500 2.6% 8.5% 12.5%
(ii) Financial Net Present Value (US$ million)
Assab Capacity Increase in Container Handling Charges(TEU/year) US$ 0 US$15/TEU US$25/TEU
35,000 1.6 3.3 4.537,500 0.2 1.9 3.040,000 -1.3 0.4 1.642,500 -2.7 -1.0 0.1
38. Even if the container handling capacity of Assab was as high as 42,500 TEU/year,which is veiy unlikely, the investment would be financial viable with an additional chargeof US$25/TEU, an increase of about 10 percent increase on existing charges. Theinvestment would be justified, without any additional handling charge, if capacity was only37,500 TEU/year, which is already 33% higher than the capacity calculated withconventional container terminal equipment planning parameters.
39. The investment will maintain overall service standards at the Port of Assab, andprovide considerably enhanced container handling facilities. The investment is essential to

- 74 - ANNEX2Page 14 of 16
maintain Assab's competitive position, as Ethiopia's main port, in the face of the potentialincreased competition from Djibouti especially for the growing container trade. Theprovision of the improved facilities will encourage the provision of direct liner serviceswhich would substantially reduce freight charges to Assab, a benefit not quantified andincluded in the analysis.
Environmental protection.
40. As in Massawa, the Assab component of the project also includes an investment ofUS$0.8 million in pollution equipment; primarily to improve facilities for the discharge ofpollutants and for combating minor oil spills. In view of the very limited investment andmajor improvement in environmental protection, this investment is considered to be verycost-effective and fully justified.
41. Assab is very exposed to winds; the area is heavily influenced by the north eastmonsoons in the Indian Ocean, particularly during the winter months of October to May,when the wind reaches Beaufort Force 7 (28 to 33 knots) and frequently Force 8 (34 to 40knots). The problems of ship handling during these windy conditions have been increasingwith the increased number of large vessels with greater windage areas4 /. During berthingand unberthing, vessels must rely almost entirely on the tugs to counteract the wind effect.The number and size of ships calling at Assab in 1992 - 1995, and the forecast for 2000are shown in Table 17.
Table 17 - Port of Assab: ship Arrivals
Ship Category Ship Size, GRT 1992 1993 1994 1995 2000A 500-5,000 206 273 341 389 400B 5,001-15,000 104 91 114 120 140C above 15,001 71 90 93 91 100
Total 381 454 548 600 640
42. The tug requirement varies according to ship size, location of berth within the portarea and prevailing weather conditions. For the purposes of assessing tug needs in 2000,the following assumptions are considered realistic:
Category A: One-third (133) of this group require no tugs at all, one-third (133) requires 1tug on arrival only, and one-third (133) require 1 tug on arrival and 1 tug on departure;
Category B: Two-thirds (93) of this group require 2 tugs on arrival and 1 tug ondeparture, and one-third (47) require 2 tugs on arrival and 2 tugs on departure;
4 / Particularly sensitive are the crude oil tankers mooring at the crude oil terminal (a conventional buoymooring at sea, around 1000 m from the shoreline), half laden bulk vessels, and car carriers.
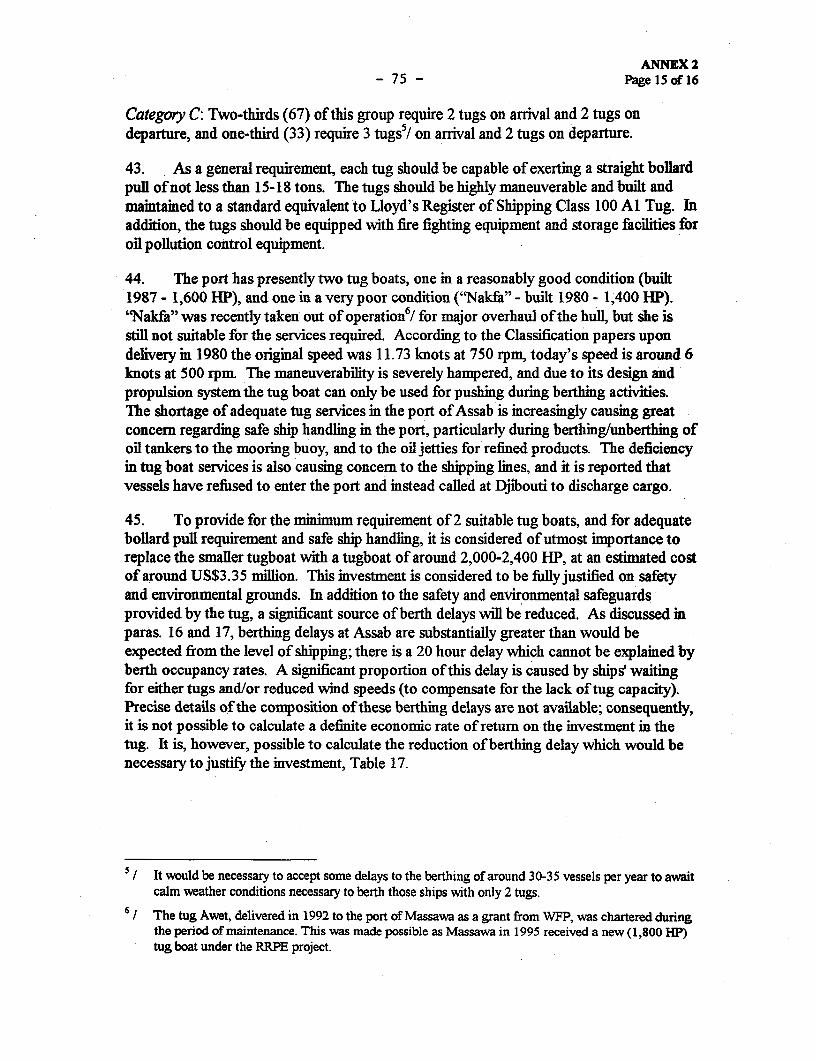
ANNEX 2- 75 - Page 15 of 16
Category C: Two-thirds (67) of this group require 2 tugs on arrival and 2 tugs ondeparture, and one-third (33) require 3 tugs5/ on arrival and 2 tugs on departure.
43. As a general requirement, each tug should be capable of exerting a straight bollardpull of not less than 15-18 tons. The tugs should be highly maneuverable and built andmaintained to a standard equivalent to Lloyd's Register of Shipping Class 100 Al Tug. Inaddition, the tugs should be equipped with fire fighting equipment and storage facilities foroil pollution control equipment.
44. The port has presently two tug boats, one in a reasonably good condition (built1987 - 1,600 HP), and one in a very poor condition ("Nakfa" - built 1980 - 1,400 HP)."Nakfa" was recently taken out of operation6 / for major overhaul of the hull, but she isstill not suitable for the services required. According to the Classification papers upondelivery in 1980 the original speed was 11.73 knots at 750 rpm, today's speed is around 6knots at 500 rpm. The maneuverability is severely hampered, and due to its design andpropulsion system the tug boat can only be used for pushing during berthing activities.The shortage of adequate tug services in the port of Assab is increasingly causing greatconcern regarding safe ship handling in the port, particularly during berthing/unberthing ofoil tankers to the mooring buoy, and to the oil jetties for refined products. The deficiencyin tug boat services is also causing concern to the shipping lines, and it is reported thatvessels have refused to enter the port and instead called at Djibouti to discharge cargo.
45. To provide for the minimum requirement of 2 suitable tug boats, and for adequatebollard pull requirement and safe ship handling, it is considered of utmost importance toreplace the smaller tugboat with a tugboat of around 2,000-2,400 HP, at an estimated costof around US$3.35 million. This investment is considered to be filly justified on safetyand environmental grounds. In addition to the safety and environmental safeguardsprovided by the tug, a significant source of berth delays will be reduced. As discussed inparas. 16 and 17, berthing delays at Assab are substantially greater than would beexpected from the level of shipping; there is a 20 hour delay which cannot be explained byberth occupancy rates. A significant proportion of this delay is caused by ships' waitingfor either tugs and/or reduced wind speeds (to compensate for the lack of tug capacity).Precise details of the composition of these berthing delays are not available; consequently,it is not possible to calculate a definite economic rate of return on the investment in thetug. It is, however, possible to calculate the reduction of berthing delay which would benecessary to justify the investment, Table 17.
5 / It would be necessary to accept some delays to the berthing of around 30-35 vessels per year to awaitcalm weather conditions necessary to berth those ships with only 2 tugs.
61 The tug Awet, delivered in 1992 to the port of Massawa as a grant from WFP, was chartered duringthe period of maintenance. This was made possible as Massawa in 1995 received a new (1,800 HP)tug boat under the RRPE project.
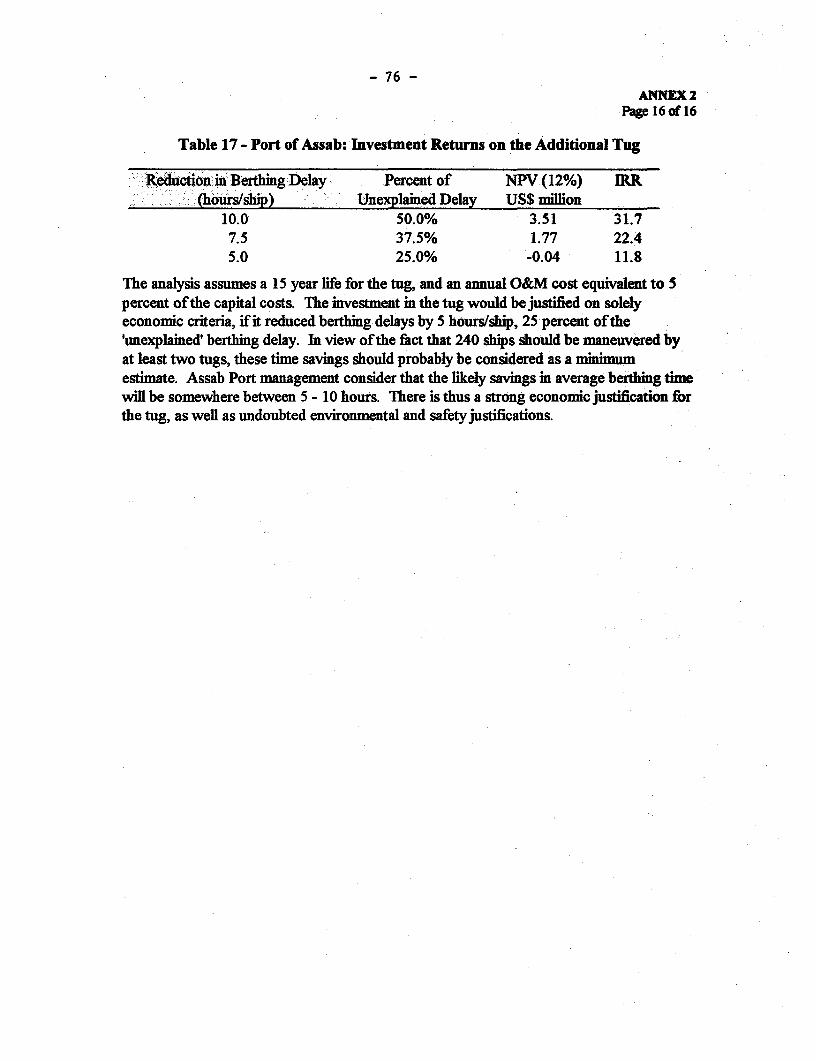
- 76 -
ANNEX 2Page 16 of 16
Table 17 - Port of Assab: Investment Returns on the Additional Tug
ReductionMiBerthing:Delay. Percent of NPV (12%) IRRf(hours/ship) Unexplained Delay US$ million
10.0 50.0% 3.51 31.77.5 37.5% 1.77 22.45.0 25.0% -0.04 11.8
The analysis assumes a 15 year life for the tug, and an annual O&M cost equivalent to 5percent ofthe capital costs. The investment in the tug would be justified on solelyeconomic criteria, if it reduced berthing delays by 5 hours/ship, 25 percent of the'unexplained' berthing delay. In view of the fact that 240 ships should be maneuvered byat least two tugs, these time savings should probably be considered as a minimumestimate. Assab Port management consider that the likely savings in average berthing timewill be somewhere between 5 - 10 hours. There is thus a strong economic justification forthe tug, as well as undoubted environmental and safety justifications.
77 ANNEX3Page 1 of 8
ERITREAN PORTS AUTHORITY
PORT SECTOR DEVELOPMENT STUDY
DRAFT TERMS OF REFERENCE
L Background to the Assignment
1. Eritrea has two national ports, Massawa Port and Assab Port, which presentlyserve both Eritrea and neighboring countries.
2. Massawa Port is located on the southern shore of the Red Sea, to the north ofEritrea. The port has quite good natural conditions and a long history. In the past theport played an important role in trading, economic development, communication andexchange with foreign countries. In recent years, its activities have been constrained bywar, outdated facilities, inadequate and obsolete equipment and lack of maintenance. Theport has six commercial berths, constructed between 1918 - 1941, which have lengths of137 - 176m, and depths of 4.9 - 9. lI. The port handled almost 650,000 tons of dry cargoin 1994 with:
65 percent berth occupancy- 122 hour ship tum-around time- 40 hour ship anchorage time- 82 hour ship berth timei 21 tons per ship-berth hour
3. Assab Port is a modern port, constructed in early 1960, located in the south ofEritrea. Ethiopian cargo accounts for over 95 percent of its traffic and the port has tocompete for this traffic with neighboring countries. Compared.to Massawa, the port iswell equipped but is experiencing constraints for container handling. The port has sevencommercial berths, which have lengths of 80 - 160m and depths of 5.5 - 1 1.Om. Theseberths handle over one million tons of dry cargo with:
73 percent berth occupancy155 hour ship turn-around time42 hour ship anchorage time113 hour ship berth time
* 28 tons per ship-berth hour
4. The Government of Eritrea has embarked on a three phase Port DevelopmentProgram to make the sector modern and competitive so that it can play a key innovativerole in the reconstruction of the country and the promotion of its foreign trade:

- 78 -ANNEX3
Page 2 of 8
Phase 1(1997 - 2001):: Rehabilitation and upgrading of Massawa Port0 Construction of multi-purpose berth at Massawa*; . Provision of handlng equipment to meet traffic
requirements
Phase 1 (2001 - 2005)* :t Remodeling and expansion of Massawa Port with
construction of a container terminal. Construction of a container terminal at Assab Port. Revitalization and upgrading of the Massawa ship-repair
yard
Phase 11 (2005 - 2010). Construction of a new port at Massawa, outside the exitg
port area
5. As part of the Development Program a rehabilitation study was conducted forMassawa Port. The study prepared a development and rehabilitation program for theperiod 1995 - 2004. The study recommended the following:
* Rehabilitation of berths 5 & 63 Extension of berth 6* : Increasing draft for berths 5 & 6 to 12 meter- ItReclamation of the lagoon behind the breakwater for container
stacking- Rationalization of the cargo working areas, including demolition of
buildings between the warehouses and the open shed* New cargo handling equipment
6. The implementation of the proposed project will commence in late-1997. Thetraffic forecasts indicate, however, that further capacity expansion will be needed in thevery near fiuture and it is thus necessary to plan for Phases II and HI as theirimplementation is clearly inevitable. This plannig will run concurrently with theexecution of Phase I of the Development Program.
IL Objectives of the Assignment
7. The basic objective of the assignment is to prepare a Master Plan for the portsector in Eritrea, within the context of the Port Development Program. To meet this basicobjective the following will be necessary:
(a) Full feasibility study for the potential expansion of both Massawa andAssab Ports (Phase 11), including the construction of specialized berthstogether with their equipment and associated facilities. The study should
- - ANNEX3Page 3 of 8
prepare preliminary engineering designs for the container terminal atMassawa and a detailed review of the existing designs for the containerterminal at Assab. The study should provide terms of reference for thefurther detailed engineering studies that will be required.
(b) Full feasibility study for the revitalization and upgrading of the ship repairyard in Massawa, emphasizing the development of ship repair facilities(slipways, dry docks and/or floating docks) on the basis of different vesselcapacity scenarios i.e. 1000, 5000, and 10000 DWT vessels. Indetermining the economic and financial feasibility for the ship repairfacilities, the study will assess the demand for such repair facilities fromboth the Eritrean and regional shipping fleets, and identify the existingsupply of such facilities within the region.
(c) Master Plan study for the implementation of Phase HI of the PortDevelopment Program, focusing on requirements for:
BerthsStorage areasEquipment and facilities
. -Manpower
8. The study will identify the potential locations for the new port, prepare outlineengineering designs for each location and provide cost estimates for their likelydevelopment costs in terms of both port infrastructure and facilities, and associated landtransport infrastructure. The Master Plan will prepare recommendations for the scope andtiming of the development of the new port on the basis of the prospective demand for thefacility and the estimated costs. The study will also assess potential financingarrangements for the development of the new port, including both public and privatefunding sources.
(a) Review of potential industrial developments at Massawa to determinemedium and longer-term demands for port capacity and facilities. Thestudy will assess the potential feasibility for the establishment for suchactivities as:
heavy port-based industries, such as cement* exporting processing zones (EPZ) and free trade zones (FTZ)* transshipment and transit facilities
9. The review will assess the potential demand for such activities taking into accountsimilar existing or proposed facilities within the region, the services offered and the tariffsand rates charged. On the basis of the review, the Consultant will estimate both the natureand capacity of port facilities required to meet the demand from these new activities.
- 80 - ANNEX 3
Page 4 of 8
(a) Review of existing oil terminals and jetties at both Assab and Massawa, mcollaboration with concerned public and private sector institutions andpreparation of a development program to ensure adequate and cost-effective capacity combined with secure environmental protection.
(b) Policy study which will identify and analyze the major issues facing the portand port-related sectors, including adiministrative and management systemswithin the ports, respective roles of the public and private sectors, andpromotion of efficient containerization.
IIL Scope of the Assignment
10. The scope of the consultant's services is defined in the light of the objectivesdescribed in Section II:
* Describe the main features of the sector in a manner which clearly identifiesthe nature of the problems and opportunities in the sector.
* Review existing and Phase I port facilities including port infrastructure(berths, drafts, etc.), floating craft (tugs, launches, dredgers, etc.), cargohandling equipment (ship-to-shore, and on-shore equipment), and cargostorage facilities. The review will identify the types of cargo handled(general cargo, dry and liquid bulk, containers, dangerous and hazardousgoods, and transit cargo) and the facilities available for such cargoes.
* Review existing port services including the loadig/unloading of cargo,storage, and transport through the ports, and assess the performance of theseservices in terms of ship service and waiting times, cargo detention times,and cargo loss and damage.
* Review past trends and present port traffic by vessel category (coastal,regional, international), type (bulk cargo, tanker, general cargo, container,ro-ro), and size, as well as by the tonnage of different commodities importedand exported.
Prepare reasonable forecasts of port traffic and utilization for the period tothe year 2010, by commodity and mode of cargo handling (bulk, bagged,break-bulk, container, other specialized handling).
Review institutional arrangements and managerial capacity within the portsector including ownership, financing, investment, regulation, licensing, andthe roles of the public and private sectors.
- 81 - ANNEX 3Page 5 of 8
Review the existing interactions between the port, the surrounding urbanareas and the land transport networks. Identify actual and posslblebottlenecks hampering port operations and prepare mitigation proposals.
Prepare forecasts for the development of port-related industrial, transit,storage and transshipment areas. Identify and assess sites for the proposedEPZ/FTZ together with their infrastructure requirements.
Identify and assess alternative sites for the Phase II container berth atMassawa.
* Identify and assess alternative sites for a potential new Massawa Port (Phasem[).
* Undertake preliminary engineering and hydrological investigations forproposed projects at the alternative sites (Phases II and HI), and preparedetailed economic and financial assessments of the viability of the projects.
* Undertake detailed environment impact assessment studies for the proposedPhase II expansion at Assab and Massawa, in accordance with World Bankguidelines. Prepare overall environmental assessment of the proposed newport and associated EPZ/FTZ facilities at Massawa.
IV. Assistance to be provided by DMT
11. The Department of Maritime Transport (DMT) will furmish all available maps,plans, data, documents, studies and other relevant information to the consultants. TheDMT will also assist and facilitate:
* Eritrean entry and exit visas for the Consultant's personnel.
* The import and export of the Consultant's equipment as well as the personaleffects of the Consultants personnel, in accordance with the relevantprovisions of the contract.
12. In addition, the DMT will provide, at no cost to the Consultant, the following:
* counterpart staff, as mutually agreed between the Consultant and the DMT;and
* adequate office space and office furniture.
- 82 - ANNEXX3
Page 6 of 8
V. Consultant's Expertise
13. This is a large and varied assignment and the Consultant's personnel shal includeall the necessary experts which are required to complete the work as specified. TheConsultant's personnel should include, but not be limited to:
Team leader who shall be a highly experienced transport specialist witharound 20 years experience in the sector, including substantial port expertisebut also with experience in other transport sub-sectors. The team leadershould have a successfil track record as the manager of large multi-disciplinary projects.
* Transport economist with over 15 years experience, including innovativeways of financing transport infrastructure.
* Port engineer with around 15 years of experience,. including extensiveexperience in port maintenance, rehabilitation and construction projects.
' Mechanical engineer with about 15 years experience, particularly in shiprepair yard activities.
* Port operations expert with about 15 years experience, including extensiveexperience in the establishment, operations and management of containerterminals.
14. The Consultant's team must also possess extensive knowledge and experiencewith:
* the environmental assessment of port construction and industrialdevelopments in developing countries.
* the use of the Logical Framework approach to project analysis.
* the financial analysis of port and port related operations and investment.
industrial market analysis and the development and operations ofEPZ/FTZ.
* procurement and implementation procedures for projects funded by theWorld Bank and other major donors.
15. The Consultant will have extensive experience in the design and construction ofmajor port projects in developing countries and possess the full range of engineering andhydrological expertise to meet the requirements of the assignment.
- 83 - ANNEX 3
Page 7 of 8
VL Reporting Requirements
16. All reports (both draft and final) and communications related to this assignmentshall be in English.
17. Reports shall be presented by the Consultant at the office of the DMT in Asmaraand to the World Bank. Following receipt of comments, and subject to any furtherguidance from the DMT, the consultant shall proceed with preparation of the next stage ofthe assignment.
18. The Consultant shall submit with the Final Report, one copy of ali documents inWord 6.0 and Excel 5.0 (or later), (or another format to be agreed with the DMT) to eachof the receipts of the Final Report as specified below. The diskettes shall be 3.5", 720kbor 1.44Mb, and IBM-PC and Microsoft DOS compatible.
Recipients: Department of Ministry of National Authorizing World BankMaritime Transport Officer AFTTI1
,____________________ =Transport Inception Report 8 2 5 3Interim Report 8 2 2 3Draft Final 8 2 2 3Report = _
Final Report 20 20 15 5PC Diskette 3 1 1 1Postal Address PO Box 679/1120 PO Box 569 NAO, Office of the 1818 H Street, NW
Asmara, Eritrea Asmara, President. PO Box Washington, DCEritrea Asmara, Eritrea 20433 U.S.A.
Telephone 291-1-121317 291-1-114 307 291-1-119 701 1-202-473 4542Tele-fax 291-1-121316 291-1-127 048 291-1-125 123 1-202-473 8326
19. The Consultant shall prepare and forward the inception, interim, draft final andfinal reports according to the time schedule below (Section VII). The draft final and finalreports shall be organized that the studies, detailed in Section II, are presented as self-contained volumes, together with an overall summary report.
20. The Inception Report should include the Consultant's initial assessment of thePorts of Assab and Massawa, the work undertaken, and a detailed work plan for thecompletion of the assignment.
21. The Interim Report should summarize the activities undertaken, the findings, theissues identified and the problems encountered. The Interim Report should also detail theConsultant's traffic demand forecasts, and their basis, for both Ports up to the year 2010.
22. The Draft and Final Reports should include all findings and recommendationstogether with all maps, diagrams, designs, data and relevant calculations in order to allowfurther analysis to be undertaken, if required, by the DMT or subsequent consultants.
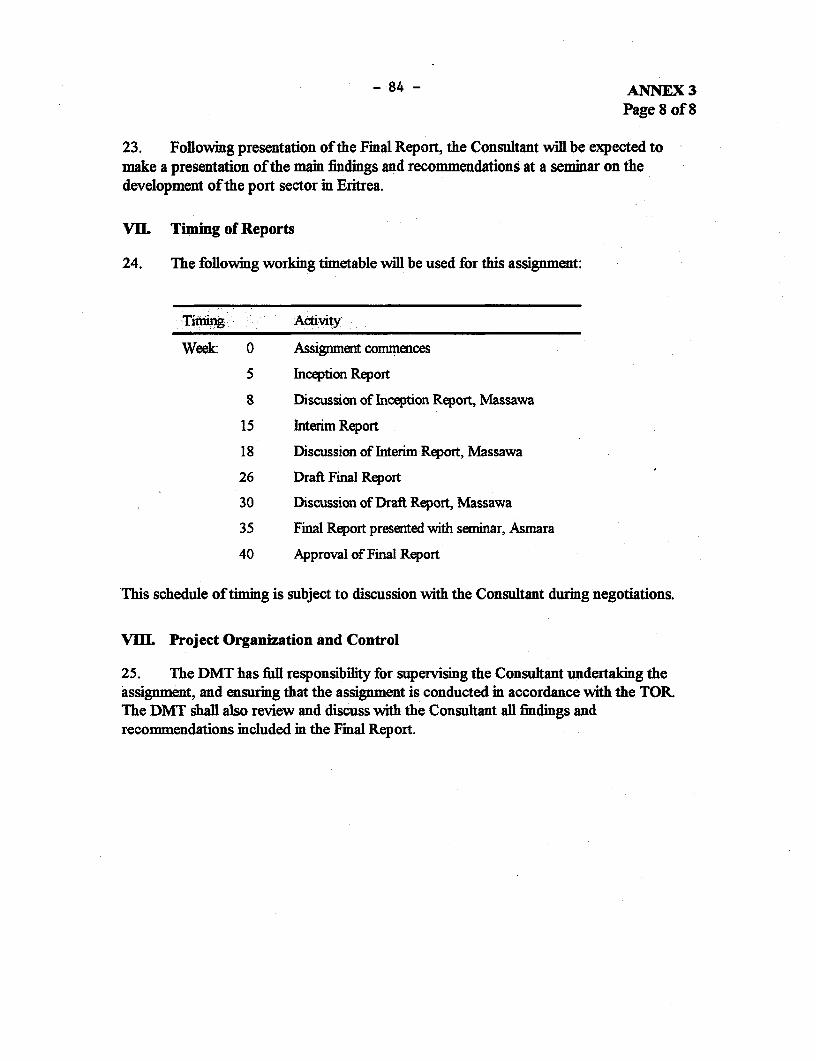
- 84 - ANNEX 3Page 8 of 8
23. Following presentation of the Final Report, the Consultant will be expected tomake a presentation of the main findings and recommendations at a seminar on thedevelopment of the port sector in Eritrea.
VH. Timing of Reports
24. The following working timetable will be used for this assignment:
Timing Activity
Week: 0 Assignment commences
5 Inception Report
8 Discussion of Inception Report, Massawa
15 Interim Report
18 Discussion of Interim Report, Massawa
26 Draft Final Report
30 Discussion of Draft Report, Massawa
35 Final Report presented with seminar, Asmara
40 Approval of Final Report
This schedule of timing is subject to discussion with the Consultant during negotiations.
VIIL Project Organization and Control
25. The DMT has full responsibility for supervising the Consultant undertaking theassignment, and ensuring that the assignment is conducted in accordance with the TOR.The DMT shall also review and discuss with the Consultant all findings andrecommendations included in the Final Report.
-85-
ANNEX 4Page I of 3
The Stame of Eritrea
Ministry of Transport & Communications
Ref. MTC / 17 1 498/97Date: 17/10/97
Ms. Oey Astra MeesookCountry Director EritreaThe world Bank
Dear Madam:
Re: 1RrrREA - Letter of Port Sector Policy
1. Eritrea's Macro-Economic policy states that this country aims to becomea trading nation, the future prosperity of the people will depend on Eritrea'sinternational trade. As a matter of pre-condition to achieving this aim, thereis need, alongside other indispensable measure, to rehabilitate the facilitiesof the ports of Masswa and Assab, to improve their perforrmance, and makethem competitive as well as addressing environmental issues.
2. During thirty years of war and deliberate negligence of the DergGovemrnment, the port of Masswa had its capacity drastically reduced; part ofits berth capacity collapsed, main equipment & supporting facilities weredestroyed or worn out and skilled manpower depleted. Today all primaryindicators like berth throughput, labour productivity, transit time, shorehandling practices, cargo tracking, etc. are by intemational standards eitherlow or very low depending on the cargo handled. Assab compare favorablewith Masswa, though by international standards its performance is low.
3. In order to tun development plans into reality the Government isadhering to a policy of encouraging domcstic and foreign investnent with theparticipation of the private sector in the overall maritime transport services.
Tcl -114307-114093- 114422 1%L£YIAY . trV.v ,JtA P.O. Box 569 .-1' Fa : 291 - 1 - 127049 t\ _.TVv. LA - ASMARA
ERIRMEA i,

- 86 -ANNEX 4
Page 2 of 3
The State of EritreaMinistry of Transport & Communications
4. In 1955 the Government decided to organize the ports within aDepartment of Maritime Transport (DMT) under the Ministry of Transport &Communication, and the two ports as well as the Eritrean Shipping andTransit Agency Services (ERSTAS) were established as commercial entitiesunder the supervision of a sector board chaired by the Minster of Transportand Communication (Proclamation No. 83/1995).
5. For the ports, the Government's policy is to continue to develop thefr-amework for the efficient commercial management and operation of theports of Assab and Masswa. To this end the Government intends to take thefollowing actions:* revise and enact the country's maritime legislation to meet current IMO
conventions on maritime safety and environment;a revise and enact legislation to establish the port as separate juridical
authorities under a revised ports act; this act would affirm the ports'powers to act commercially as well as their obligation to achieveperformaance objectives consistenq with the Government's overalldevelopment goals;
* establish the minimum return it expects the port authorities to generatefrom their operations:
* establish a capital structure for each port authority, including the termsand conditions of long-term debt in this structure;
X establish a policy for the financing of future investments in the port bythe Government, including their terms and conditions of any debt providedunder this policy;
* Strengthen the frame work for the periodic reporting by the portauthorities to the DMT on their performance.
6. These actions will be implemented progressively over the cgmtog.1wa. The implementation will rcquire the introduction of new or revised
systems and procedures for conducting and monitoring the operation of theports, assessment of the ports assets and potential operating capacity, andextensive training of the workforce. In this regard, the Government's aim is tocontinuc to draw as much as possible upon best practices for portsoperations and managemcnt worldwide.
Tcl: 114307.11 4 093 -11 4 4 2 2I Y-.%L N _%_Y.V "na P.o. Box 569*Fla :291-I -127048 1Rr M F _V.£A- L, A 1_
ERITRHA LJ
- 87 -
ANNEX 4Page 3 of 3
The State of Eritrea
Ministry of Transport & Communications
7. In addition to financing specific equipment and infrastructure, theGovernment envisages that the proposed IDA financed Ports RehabilitationProject would be an important step in its effort to acquire lmowledge of suchbest industry practices.
8 With regard to the project, and consistent with the sector strategyoutlined in this Policy Letter, the Government intends to take the followingactions:
a) all IDA financing for investments in the ports will be on-lent to the ports oncommercial terms. These terms will be defined by December 31. 1999 withinthe framework of the financing policy as outlined in this Policy. Letter;
b) in relation to the Government's policy with regard to the financial returnsfrom the operations of the ports. it is the government's intention to ensure tothe extent possible that the ports will generate, at minimum, cash flows fromtheir operations that are sufficient to cover their working capitalrequirements and debt service obligations. It is the Governments intention tospecify these terms by December 31.1999 after completion of all actionsnecessary to establish a capital structure for the ports. Subsequent toestablishing financial objectives for the ports, the Government will expect, ascurrently, that the management of the ports will take all actions necessary toachieve such objectives, including maintaining appropriate levels of accountsreceivable.
Sincerely yours
_~~~
Shleh Kekia TMinister Mfinisty of Tr _ns.
ToI*114307-114093 . 114422 t :gv.v .;L P.O.Box S69 *' Fax :291-1 -12704I l -_TV. £A - lU5 ASMARA
ERTrEA
- 88 - ANNEX 5
Page 1 of 2
SUPERVISION STRATEGY AND STAFF INPUT
BORROWER'S CONTRIBUTION TO SUPERVISION
1. The Borrower's supervision activities would be carried out by the Department ofMaritime Transport (DMT) within the Ministry of Transport. A Project CoordinationUnit (PCU) will be established for the life of the project and located at the Department'sPort Liasion Office in Asmara. The unit will be headed by of a Project Coordinator, andwill include financial and procurement expertise. The supervisory functions of the unit willinvolve the following:
(a) Submission to IDA of quarterly progress reports on all Project components,including operational performances for the two ports, and statistical information;
(b) Submission to IDA of all consultant's reports produced in connection with projectactivities;
(c) The audits of project accounts and the Special Account, as well as financialaccounts of the two ports of Massawa and Assab, will be sent to IDA within sixmonths of the close of each fiscal year; and
(d) PCU will be responsible for coordinating arrangements for Bank supervisionmissions and for providing information required by missions.
Bank Supervision
2. In addition to regular supervision missions to be carried out by IDA, in accordancewith the schedule set out below, IDA staff would spend time at Headquarters dealing withcorrespondence, reviewing and approving procurement documents, disbursement requests,quarterly reports, and audited accounts. The amount of time required for supervision ofthe project in Washington is estimated to be as follows:
Project Year 1 10 staffweeksYear 2 10 staffweeksYear 3 6 staffweeksYear 4 4 staffweeksYear 5 4 staffweeks
Six staffweeks will also be required for the final supervision and preparation of theImplementation Completion Report.
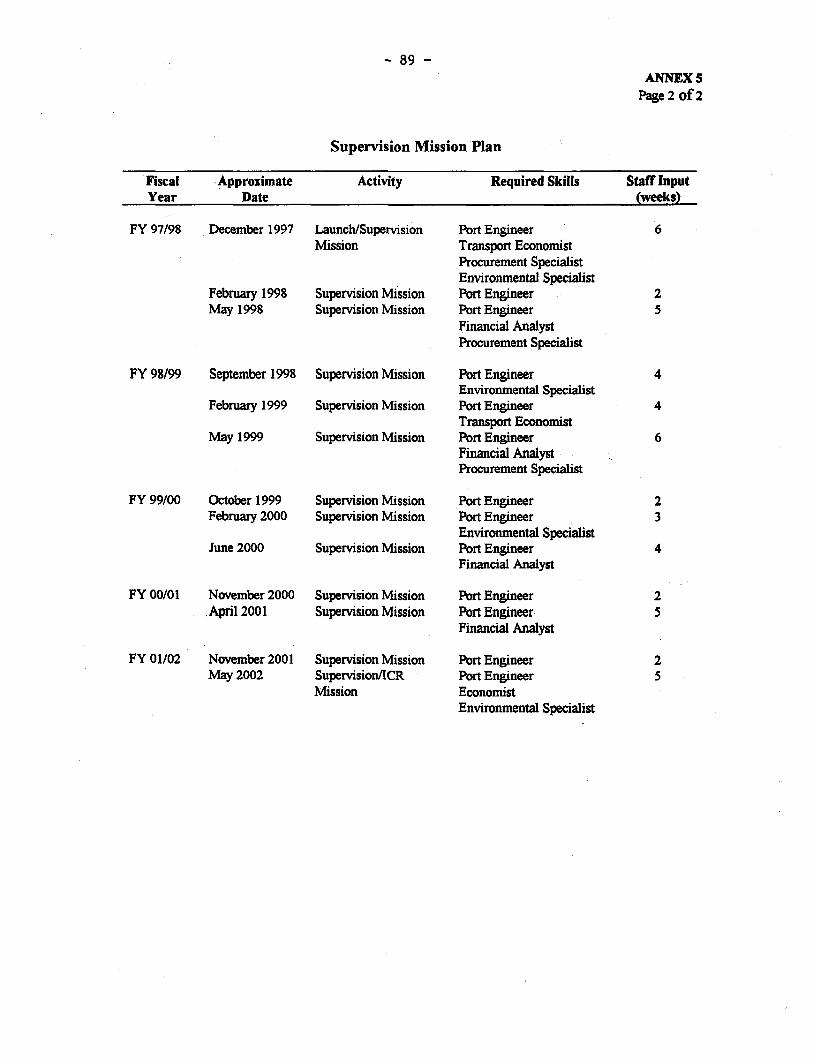
- 89 -ANNEX 5
Page 2 of 2
Supervision Mission Plan
Fiscal Approximate Activity Required Skills Staff InputYear Date (weeks)
FY 97/98 December 1997 Launch/Supervision Port Engineer 6Mission Transport Economist
Procurement SpecialistEnvironmental Specialist
February 1998 Supervision Mission Port Engineer 2May 1998 Supervision Mission Port Engineer 5
Financial AnalystProcurement Specialist
FY 98/99 September 1998 Supervision Mission Port Engineer 4Environmental Specialist
February 1999 Supervision Mission Port Engineer 4Transport Economist
May 1999 Supervision Mission Port Engineer 6Financial AnalystProcurement Specialist
FY 99/00 October 1999 Supervision Mission Port Engineer 2February 2000 Supervision Mission Port Engineer 3
Environmental SpecialistJune 2000 Supervision Mission Port Engineer 4
Financial Analyst
FY 00/01 November 2000 Supervision Mission Port Engineer 2April 2001 Supervision Mission Port Engineer 5
Financial Analyst
FY 01/02 November 2001 Supervision Mission Port Engineer 2May 2002 Supervision/lCR Port Engineer 5
Mission EconomistEnvironmental Specialist
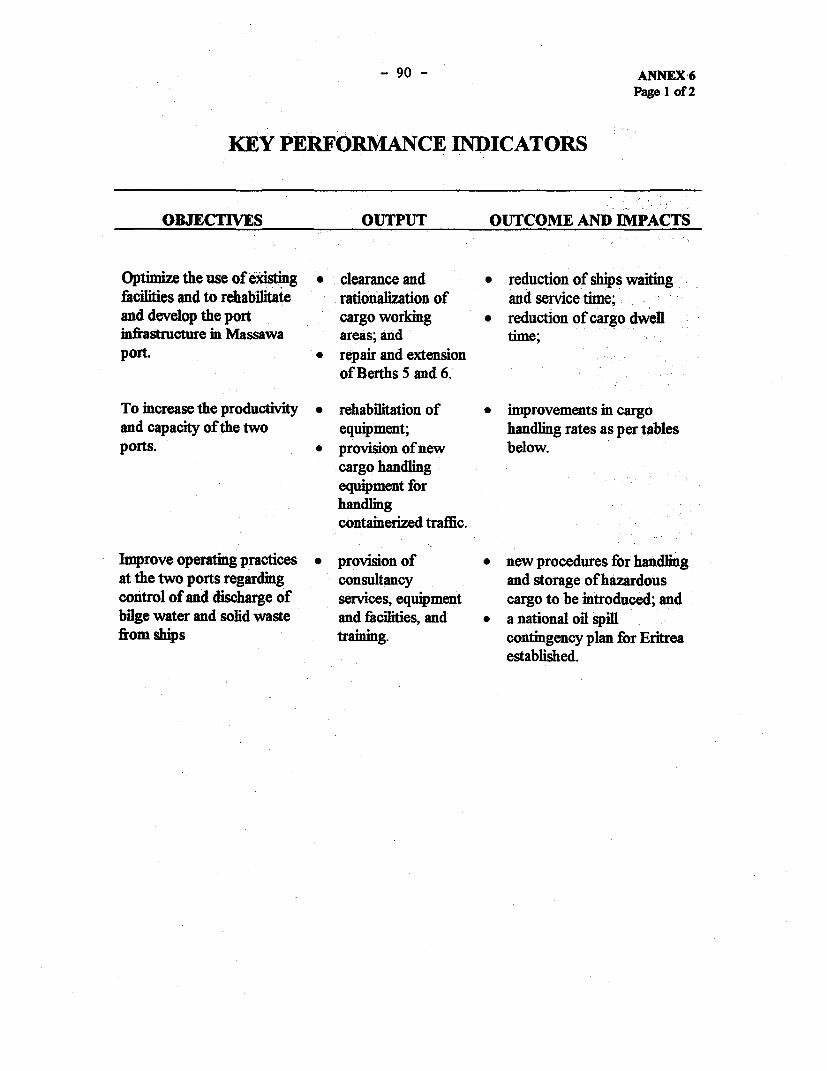
- 90 - ANNEX 6
Page 1 of 2
KEY PERFORMANCE INDICATORS
OBJECTIVES OUTPUT OUTCOME AND IMPACTS
Optimize the use of existing * clearance and * reduction of ships waitingfacilities and to rehabilitate rationalization of and service time;.and develop the port cargo working * reduction of cargo dwellinfrastructure in Massawa areas; and time;port. * repair and extension
of Berths 5 and 6.
To increase the productivity * rehabilitation of * improvements in cargoand capacity of the two equipment; handlng rates as per tablesports. * provision of new below.
cargo handlingequipment forhandlingcontainerized traffic.
Improve operating practices * provision of * new procedures for handlngat the two ports regarding consultancy and storage of hazardouscontrol of and discharge of services, equipment cargo to be introduced; andbilge water and solid waste and faciliies, and * a national oil spillfrom ships training. contingency plan for Eritrea
established.
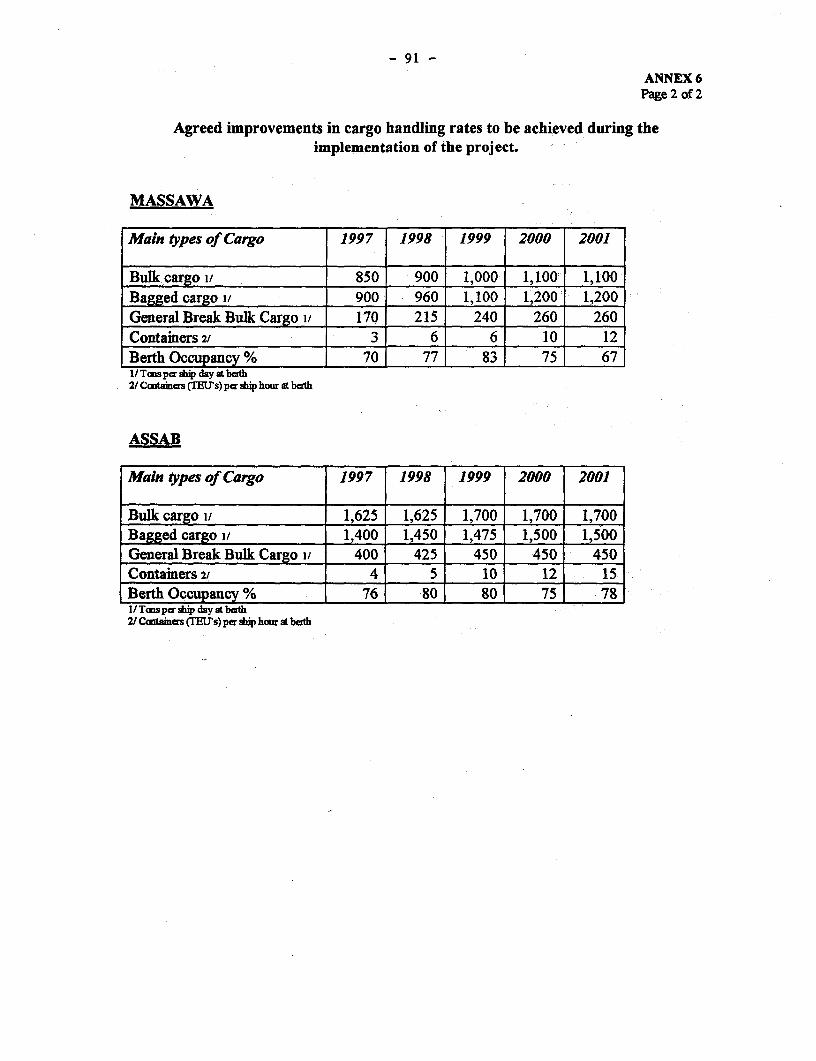
- 91 -
ANNEX 6Page 2 of 2
Agreed improvements in cargo handling rates to be achieved during theimplementation of the project.
MASSAWA
Main types of Cargo 1997 1998 1999 2000 2001
Bulk cargo it 850 900 1,000 1,100 1,100Bagged cargo i/ 900 960 1,100 1,200 1,200General Break Bulk Cargo i/ 170 215 240 260 260Containers 2/ 3 6 6 10 12Berth Occupancy % 70 77 83 75 671/Tas pe ship day at beth2/ Coutins (CIEUs) pa ship hour at bath
ASSAB
Main types of Cargo 1997 1998 1999 2000 2001
Bulk cargo i_ 1,625 1,625 1,700 1,700 1,700Bagged cargo I/ 1,400 1,450 1,475 1,500 1,500General Break Bulk Cargo i/ 400 425 450 450 450Containers 21 4 5 10 12 15Berth Occupancy% 76 80 80 75 781/ Tcnsp bdip day at bath2/ Catainers (TEU's) per ship hour at beath
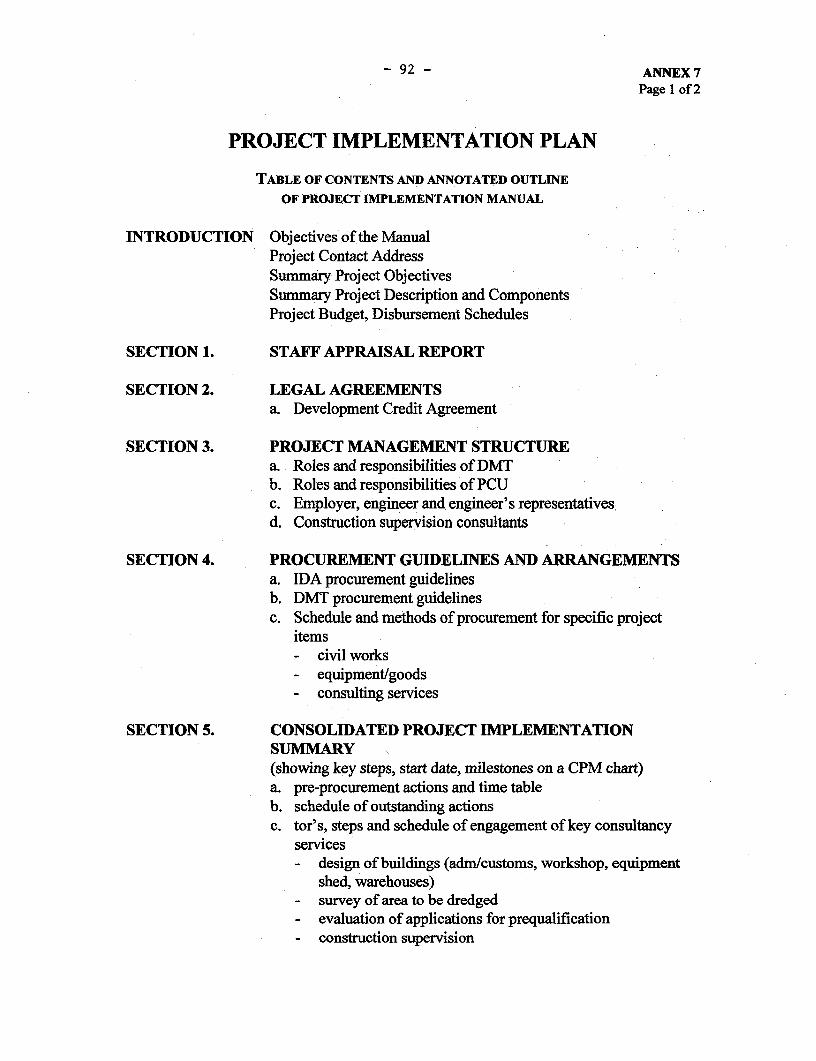
- 92 - ANNEX7
Page I of 2
PROJECT IMPLEMENTATION PLAN
TABLE OF CONTENTS AND ANNOTATED OUTLINE
OF PROJECT IMPLEMENTATION MANUAL
INTRODUCTION Objectives of the ManualProject Contact AddressSummary Project ObjectivesSummary Project Description and ComponentsProject Budget, Disbursement Schedules
SECTION 1. STAFF APPRAISAL REPORT
SECTION 2. LEGAL AGREEMENTSa. Development Credit Agreement
SECTION 3. PROJECT MANAGEMENT STRUCTUREa. Roles and responsibilities of DMTb. Roles and responsibilities of PCUc. Employer, engineer and engineer's representativesd. Construction supervision consultants
SECTION 4. PROCUREMENT GUIDELINES AND ARRANGEMENTSa. IDA procurement guidelinesb. DMT procurement guidelinesc. Schedule and methods of procurement for specific project
items- civil works- equipment/goods- consulting services
SECTION 5. CONSOLII)ATED PROJECT IMPLEMENTATIONSUMMARY X(showing key steps, start date, milestones on a CPM chart)a. pre-procurement actions and time tableb. schedule of outstanding actionsc. tor's, steps and schedule of engagement of key consultancy
services- design of buildings (adm/customs, workshop, equipment
shed, warehouses)- survey of area to be dredged- evaluation of applications for prequalification- construction supervision
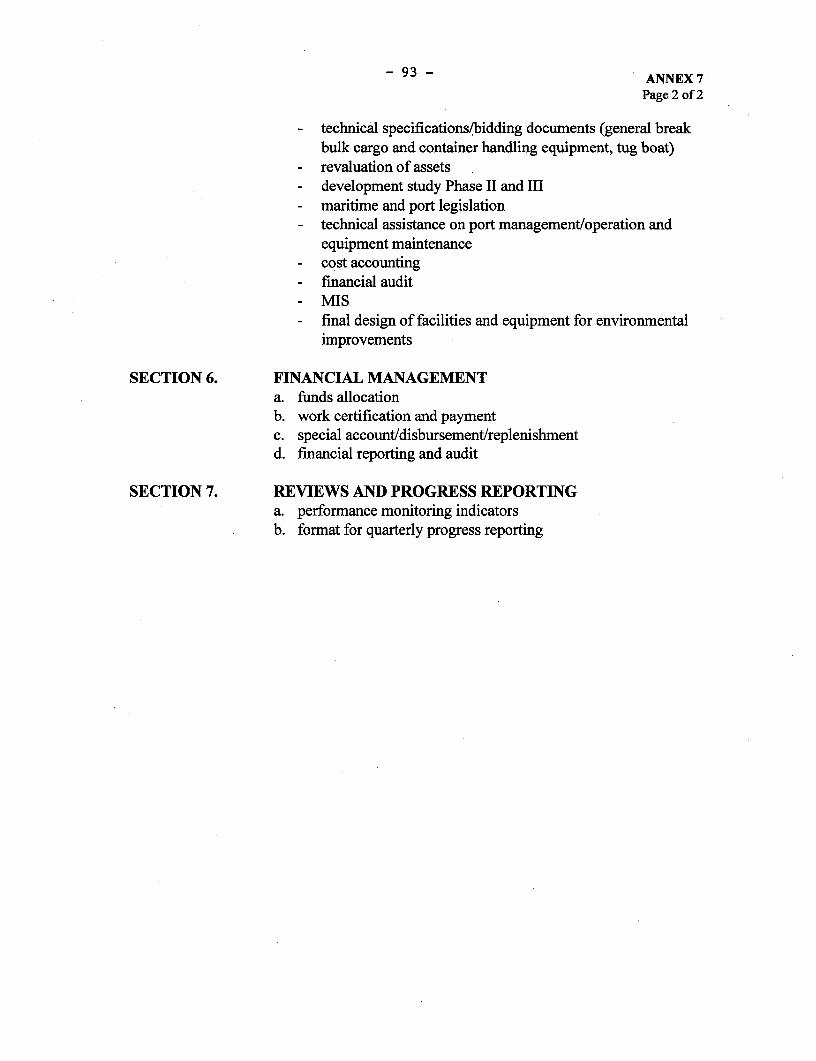
93 - ANNEX 7Page 2 of 2
- technical specifications/bidding documents (general breakbulk cargo and container handling equipment, tug boat)
- revaluation of assets- development study Phase II and III- maritime and port legislation- technical assistance on port management/operation and
equipment maintenance- cost accounting- financial audit- MIS- final design of facilities and equipment for environmental
improvements
SECTION 6. FINANCIAL MANAGEMENTa. funds allocationb. work certification and paymentc. special account/disbursement/replenishmentd. financial reporting and audit
SECTION 7. REVIEWS AND PROGRESS REPORTINGa. performance monitoring indicatorsb. format for quarterly progress reporting

- 94 -ANNEXS8Page I of 2
SCHEDULES OF DISBURSEMENTS
Estimated Schedule of Disbursement, IDA Credit (US$ million)
Fiscal~ Yarn Emdi' '' (USS $Mil $ u) (SS M11' u.,',.,":,.,":,.',.,',.., ... '':'.'"''"''" :''::"'.'' "''':' "'."'' ' " ' "{ "' . ''..''.....'..... ......
Fiscal Year 1998December 31, 1997 0.1 0.1 1June 30, 1998 1.7 1.8 6
Fiscal Year 1999December 31, 1998 3.7 5.5 18June 30, 1999 5.1 10.6 35
Fiscal Year 2000December 31, 1999 7.5 18.1 60June 30, 2000 4.6 22.7 75
Fiscal Year 2001December 31, 2000 3.1 25.8 85June 30, 2001 1.5 27.3 90
Fiscal Year 2002December 31, 2001 1.5 28.8 95June 30, 2002 1.5 30.3 100
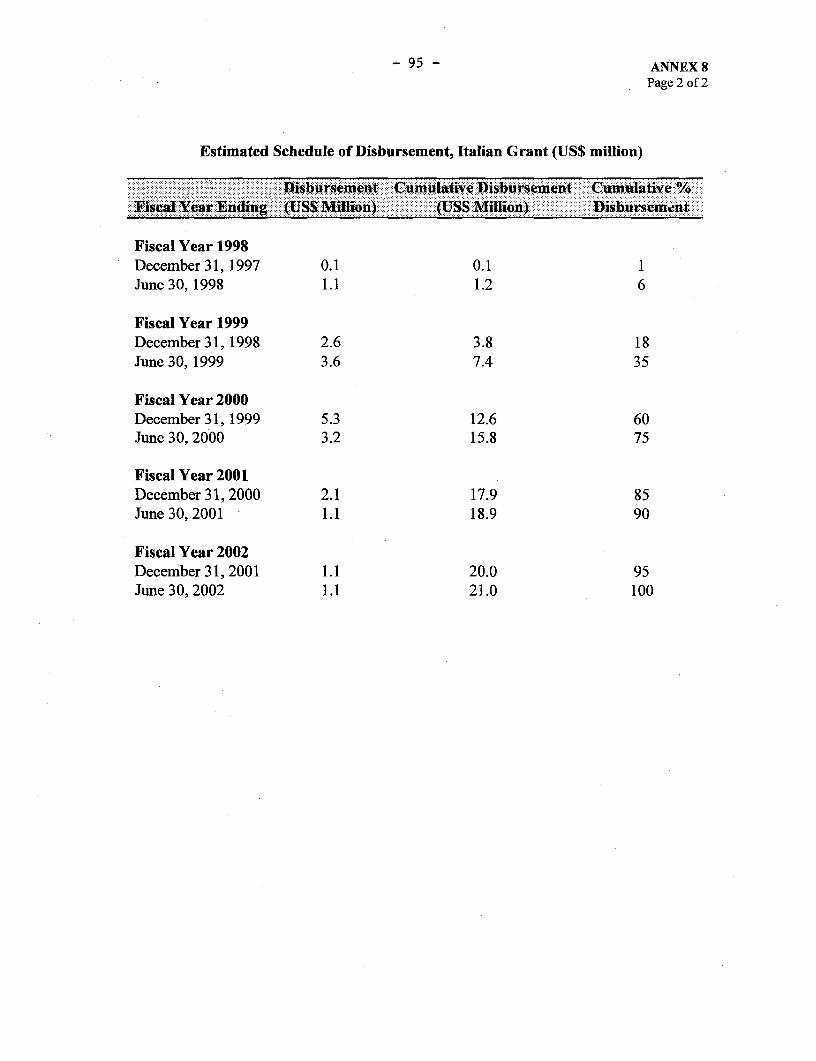
- 95 - ANNEX 8Page 2 of 2
Estimated Schedule of Disbursement, Italian Grant (US$ million)
-is rem t C ulative iursin C ti -%. . . . . . ..... . . . . . . . . . . .Fiscal~~~ YerEdng(S ilion (11$Millin).: Disburseme~nt
Fiscal Year 1998December 31, 1997 0.1 0.1 1June30, 1998 1.1 1.2 6
Fiscal Year 1999December31, 1998 2.6 3.8 18June 30, 1999 3.6 7.4 35
Fiscal Year 2000December 31, 1999 5.3 12.6 60June 30, 2000 3.2 15.8 75
Fiscal Year 2001December 31, 2000 2.1 17.9 85June 30, 2001 1.1 18.9 90
Fiscal Year 2002December 31, 2001 1.1 20.0 95June 30, 2002 1.1 21.0 100
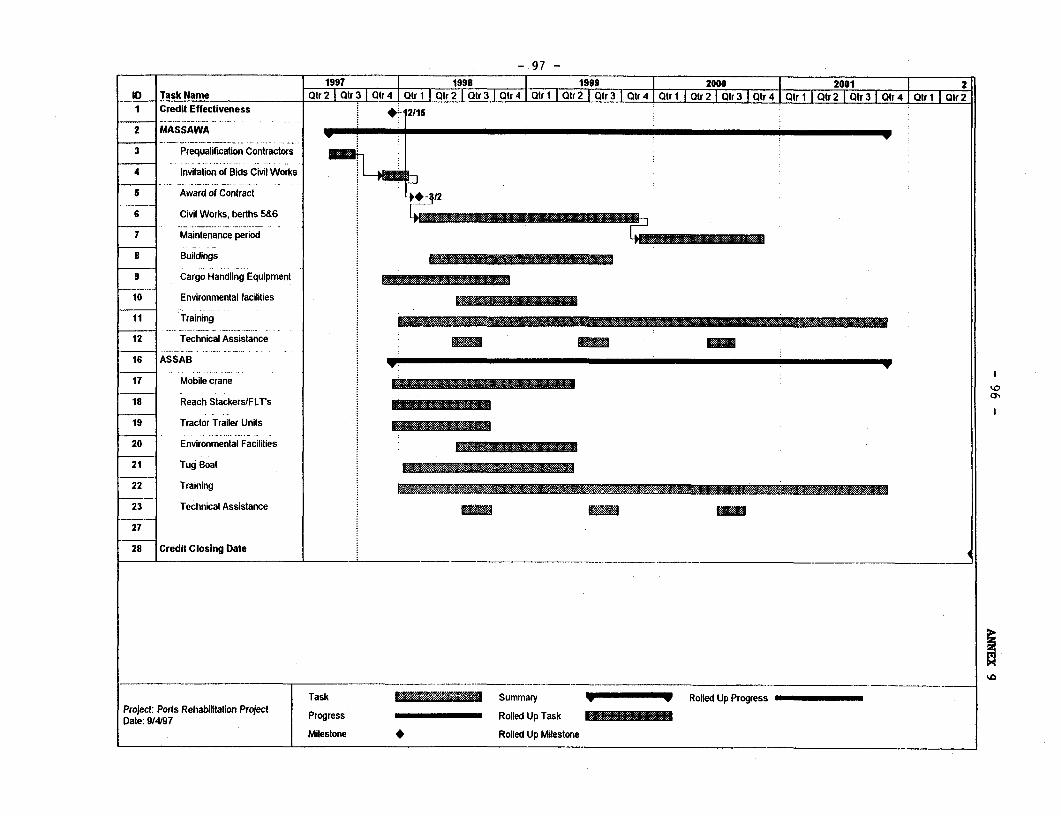
- 97 -
1997 1998 1999 2000 2001 2ID Task Name Qlr 2 Otr 3 Qtr 4 Otr 1 Qtr2 Qtr3 r4 rtr2 Qr 3 Qrr4 Ql Qlr 2 | Qtr 3 Qtr 4 Qtr 1 | Qtr 2 Qtr 3 Otr4 Qtr trI Credit Effectiveness . 2116
2 MASSAWA
3 Prequalification Contractors
4 Invitation of Bids Civil Works
5 Award of Contract
6 Civil Works, berths 5&6
7 Maintenance period
a Buildings
9 Cargo Handling Equipment
10 Environmental facilities
11 Training
12 Technical Assistance
16 ASSAB
17 Mobile crane
18 Reach Stackers/FLT's .
19 Tractor Trailer Units
20 Environmental Facilities
21 Tug Boat
22 Training
23 Technical Assistance
27
28 Credit Closing Date
__________________I __ ___ ._._________________ _ __ _ _ _ __ ___
Task Summary Rolled Up ProgressProject: Ports Rehabilitation Project Progress Rolled Up TaskDate: 9/4/97
Milestone Rolled Up Milestone
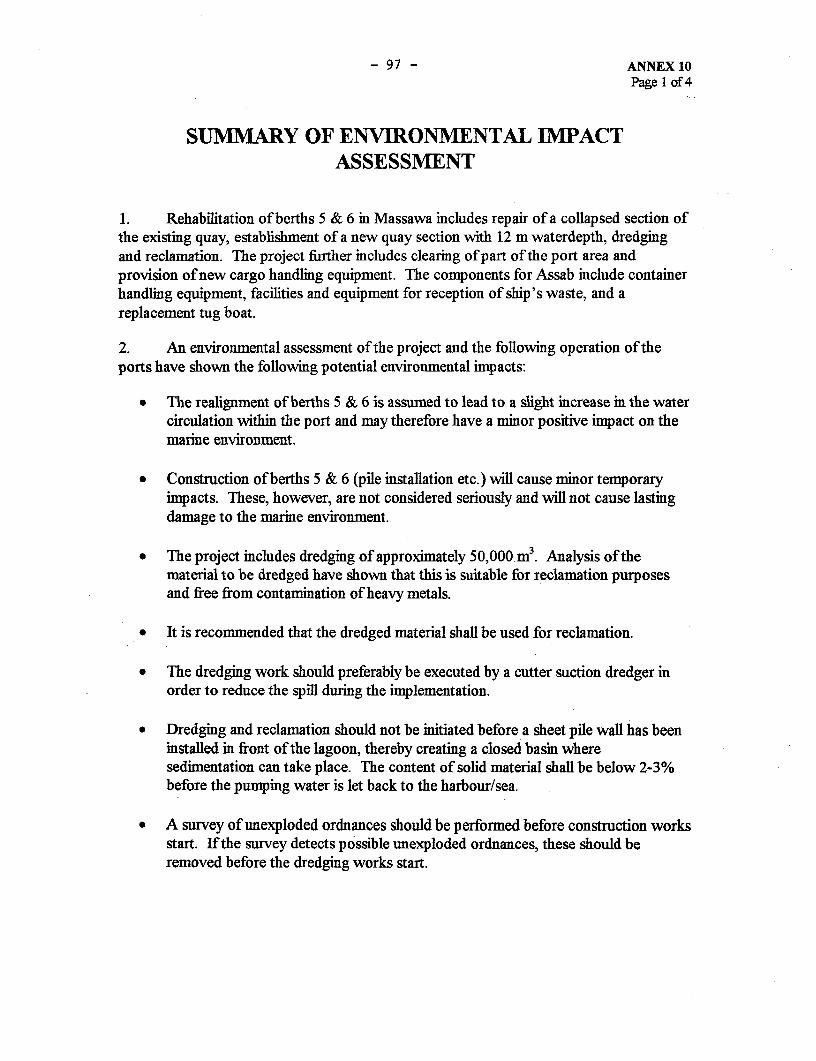
- 97 - ANNEX 10Page 1 of 4
SUMMARY OF ENVIRONMENTAL IMPACTASSESSMENT
1. Rehabilitation of berths 5 & 6 in Massawa includes repair of a collapsed section ofthe existing quay, establishment of a new quay section with 12 m waterdepth, dredgingand reclamation. The project further includes clearing of part of the port area andprovision of new cargo handling equipment. The components for Assab include containerhandlng equipment, facilities and equipment for reception of ship's waste, and areplacement tug boat.
2. An environmental assessment of the project and the following operation of theports have shown the following potential environmental impacts:
* The realignment of berths 5 & 6 is assumed to lead to a slight increase in the watercirculation within the port and may therefore have a minor positive impact on themarine environment.
* Construction of berths 5 & 6 (pile installation etc.) will cause minor temporaryimpacts. These, however, are not considered seriously and will not cause lastingdamage to the marine environment.
* The project includes dredging of approximately 50,000 n3. Analysis of thematerial to be dredged have shown that this is suitable for reclamation purposesand free from contamination of heavy metals.
- It is recommended that the dredged material shall be used for reclamation.
* The dredging work should preferably be executed by a cutter suction dredger inorder to reduce the spill during the implementation.
* Dredging and reclamation should not be initiated before a sheet pile wall has beeninstalled in front of the lagoon, thereby creating a closed basin wheresedimentation can take place. The content of solid material shall be below 2-3%before the pumping water is let back to the harbour/sea.
* A survey of unexploded ordnances should be performed before construction worksstart. If the survey detects possible unexploded ordnances, these should beremoved before the dredging works start.
- 98 ANNEX 10Page 2 of 4
Resettlement
3. Some 40 port staff (ex-fighters) who were given shelter in the port after theLiberation War, as well as a number of staff from the Customs Authority and theMinistries of Finance and Health (about 120 people in total) are currently living ingovernment-owned houses in the port of Massawa. Both the Port Authority and theMassawa Municipal Authority have determined that for safety and security reasons no-oneshould be living within the port boundaries. Steps are being taken through the PortAuthority and Municipality of Massawa to ensure alternative accommodation for thesepeople, with houses being set aside for them in a new housing development currentlyunder construction.
Treatment of Hazardous and Noxious Cargo
4. The ports have very limited facilties and guidelines for handling and storage ofhazardous and noxious cargo. Currently the ports normally require such materials to behandled as direct delivery in order to avoid storage of materials such as explosives andvery toxic cargo.
5. The existing procedures for handling and storage of hazardous cargo areinadequate and do not meet international standards. -Likewise the -equipment forcombating accidents are insufficient.
6. The ports will under the project establish procedures for handling and storage ofthis kind of cargo, as well as establishing emergency plans in case of accidents for thedifferent cargo types. The procedures would be in accordance with guidelines developedby IMO.
7. Establishment of improved procedures for handling and storage of dangerouscargo and the subsequent compliance with these procedures will have a positiveenvironmental impact.
Handling of Ship's Wastes
8. At present facilities in the ports of Massawa and Assab for collection, storage andtreatment of ship's waste are very limited.
9. The project will provide for improvements of equipment and facilities for receptionof ship's waste, including bilgewater, sludge from oily separators and used lubricants, andsolid waste. Treatment of oily waste wil be done at the refinery in Assab, while chemicalshave to be taken to Jeddah or other places for final treatment.
10. The system to be established for reception of solid waste will be closelycoordinated with the Municipalities of Massawa and Assab, as the solid waste will have tobe dumped at the existing dumping site.
- 99 - ANNEX 10Page 3 of 4
11. Implementation of the above facilities should reduce the amount of waste dumpedby sea and wil therefore have a positive environmental impact.
Maritime Safety
12. Assab is very exposed to winds; the area is heavily influenced by the north eastmonsoons in the Indian Ocean, particularly during the winter months of October to maywhen wind reaches Beaufort Force 7 (28 to 33 knots) and frequently Force 8 (34 to 40knots). During berthing and unberthing vessels must rely almost entirely on the tugs tocounteract the wind effect.
13. The port has presently two tug boats, one in a reasonable good condition (built1987 - 1,600 HP), and one in a very poor condition (built 1980 - 1,400 HP). Theshortage of adequate tug services in the port is increasingly causing great concernregarding safe ship handling in the port, particularly during berthing/unberthing of crudeoil tankers to the mooring buoy, and to the oil jetties for refined products.
14. To arrange for the minimum requirement of 2 suitable tug boats, and for adequatebollard pull requirement and safe ship handling, the project will provide for an additionalpowerful tug boat of around 2,000 to 2,400 HP.
National Oil Spill Contingency Plan
15. The State of Eritrea has no National Oil Spill Response Plan developed, and thetwo ports have no equipment for combating potential oil spills. The project, inconjunction with local and International oil industry interests, will provide for equipmentand facilities for Eritrea to develop a National Oil Spill Response Plan. Draft Terms ofReference for the final design the component has been agreed with the Borrower.
Draft TOR
16. The objective of this component is to ensure the structured development ofadequate and tested National Oil Spill Response Plans for the State of Eritrea. Theconsultant should visit the country and, in conjunction with local and International oilindustry interests, lay out a program in agreement with the appropriate local and nationalEritrean Government agencies that will:
(a) assess the risk of oil spills from all sources that could threaten the coastlineand its associated islands and coral reefs;
(b) identify sensitive areas, socio-economic as well as environmental, thatwould need protection;
(c) develop response strategies suitable for the region;
- 100 - ANNEX 10Page 4 of 4
(d) identify any additional equipment needs consistent with those responsestrategies and having due regard to the financial and infrastructureconstraints of the country;
(e) define a training program for oil spill contingency planners and responders;
(f) define an oil spill exercise program that will ensure the gradualdevelopment of local expertise in this field; and
(g) In carrying out this task the consultant should take into account:
(i) the need for the ownership of the program to be vested in theappropriate National Authorities and the substance of the programto be based on partnership with industry at both national andintemational levels;
(ii) the IMO Consultant report "Assessment of the Ability of The Stateof Eritrea to respond to Marine Pollution Emergencies"(M.S.Dillon m, 15 - 28 Oct, 1995);
(iii) the present arrangements put in place by government and industrylocally and nationally;
(iv) the various IMO and Industry publications and Guidelines on SpillResponse matters;
(v) the need to integrate key plan holders into the planning cycle,especially in respect of plan ownership, training andimplementation;
(vi) the need to ensure that the arrangements recommended will create aviable and sustainable response plan;
(vii) the current organizational arrangements in place regarding theallocation of roles and responsibilities for oil spill policies, practicesand response strategies within the State and if necessary andappropriate make recommendations for improvement; and
(viii) the need to allow for ongoing support and guidance from theconsultant to achieve the objectives set for the development of thenecessary spill response capacity within the country.
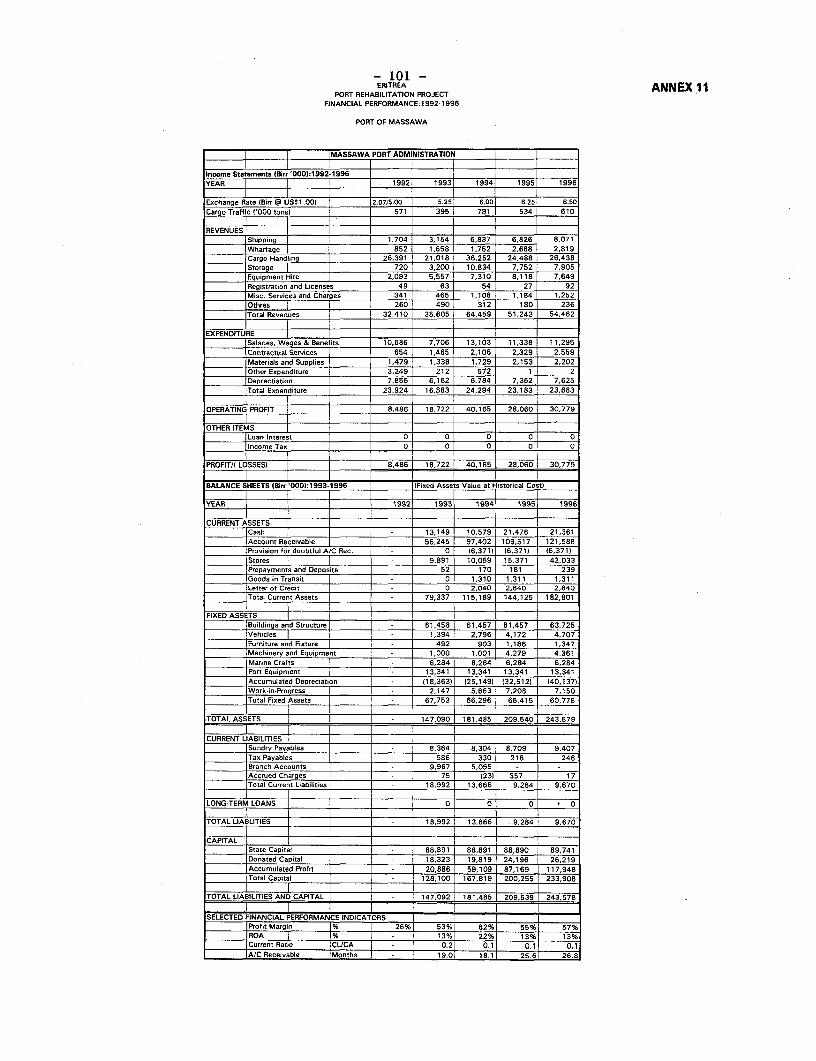
- 101 -ERiTREA ANNEX 11
PORT REHABILITATION PROJECTFINANCIAL PERFORMANCE1 992-1 996
PORT OF MASSAWA
MASSAWA PORT ADMINISTRATION
Income Statements (Eir B000):1992-1996YEAR 1992 19931 1994 1995 1996
Exchange Rate IBirr @ US$ 1.00) 2.07/5.00 5 5.25 6.00 6.25 6.50Cargo Traffic ('000 tonsl )571 395 781 534 610
REVENUES Shipping S 1.704 31154 406.837 6,826 8,071Wharage 2 1658 19752 2.668 2,819Cargo Handlg 26,83921 21,0184 31,25 24,488 26.438Storage F _ i 72 3,F200 10,834 =7,7520 7.905Equipmece Hire 2,093 56,57 7,310 8,118 7,649Registration and Licenses 49 63 d54 27 92Misc. Se,ices and Chares 341 495 1,1085 1,1 4,252Othres amt 2a0 4d 40 312 180 239Total Revenues _ 32,410 35,605 64,459 51,243 54.462
EXPENDITURE ISalares, Warges & Benef 10,686 7,706 13,103 11,331 11,2Contractual Sereices 64[ 1,465 0 2,106 2,329 2,559Materials and Supplies 1,479 1,338 1,729 2,153 2,202OtherBExpenditure 3g249 212 s 572aSrDeprectiation 7856 6.162 26.784 7.362 7,625Total Expen diture 9232924 1883 24,294 23.13 123,643
OPERATINC PROFIT E im8486 18,722 40,165 279060I 306779
OTHER ITEMS ILoan Intere:st 0 0 0
i Encome Tax O 0 1 11 1 1,
PROFIT_ LOSSES) A a r i F 18,7221 40612 5 28,0601 30,779
BALANCE SHEEtS FBid A000):1s93-1996 Fixe_dAssets67,753 62 655 6
YEAR 19 i i92| 1993 19941 199S| tss
CURRENT ASSETS - 1 1 j 2 235
Cash P13,149 | 105579 21,476 214361Account Receivable 6 109517 121,588TProistl forrdtubtfulte - 2 3 0 .6,3716 96,371) 16,371)Stores i T9r - 88,891 80,891 15,371 42,033Prepayments and DePosits 1 23 190 24181 239Goodsuin Transit 1i - 20 59,109 1,3116 11311|Letter of Credit 0 2.040 2,640 | 2,640Total CurrentAssets 78,337 115,189 144,125 182,801
FIXED ASSETS i T Buildings and Structure A - 61,458 6 11,457 261,457 263,725Vehicles I 1,394 2,796 14172 1 4707|Fum,ture and F.xtu,e | | , | 492 | 903 |1 186 | 1,347tMach,nery and Equipment - i 1,000 j 1,001 j4,279 j 4.361PMarine Crafts i- 6 296 5 62%4 16,284 672%4Port Equipment 13%341 213341 13,341 13341Accumulated_DCren ciaction - (1,363) 25,1 032.5121 140,137)Work-i_-Pro/ress Reeval2,147 MoSth63 i 71206 27150|Total Fixed Assets i - 67,753 i66,296 i65,415 i60,7786
TOTAL ASSETS |, |147,090 181B,485 209,540 !243.579CURRENT LIABILITIES|
Sundry Payables 8.364 | 8,304 |8.709 | 9,407Tax Payables ! 586 330 218 2461gBranch Accounts , j 9,967 j 5.055 i i-Accrued Charges 75 | 23) 357 17|Total Current LUabilities i18,992 1 13,66A6 1 9,284 9 67C
LONG-TERM LOANS | | | 0 0 | 0 0
TOTAL LIABLITIES j j18,992 13,666 9.284 | 9.670
CAPITAL
iState Capiata 88 |6,891 |88,891 |88,890 8 9,741|Donated Capital |18,323 |19,819 |24.196 j26,219
Accumulated Profit - 20,886 59,109 |87,169 r117,949gTotal Capital 128,100 |167.819 |200,255 |233,908
TOTAL LIABILITIES AND CAPITAL | | |1702i181,485 |209,539 |243 578
SELECTED FINANCIAL PERFORMANCE7 INDCAOR|ProfitMargin j 26i 53%| 62%1 5%l 579pROA | i 13X 22%1 13% 13%ijCurren ai |LC 0.21 -0.1| 0.1 | 0 iJAIC Receivable Imonths I - 19.0| 18.11 25.61 26.8

- 102 -POT ERITREA ANNEX 12
P RTERHABLrrATION PROJECTFINANCIAL~ PROQIECTIONS:1997-2D05 Page I of 2
PORT OF MASSAWA
- - j I~~~EPITREA: PORT REHABILITATION,PROJECT
FINANCIAIMASSAWA POFRT ADMINISTRATION
FANILPROJECTIONS: CENTRAL SCENARIO - WITH PROJECTIIINCOME STATEMNT (CONSTANT 1837UII 10
YEAR 1337 133 18lo 200 20011 2101121 20021 2004 2003
(199 US.0=r 6.6DREVENUES
Shp 1.505 1.595' 1.695 1,799 1,8691 1.945 -2,027 2,115 2.211Cm11 Hmx 4,339 4,622 4,947 5,323 5,463 5,615 5,7791 5,956 6,148Storae 1,641 1,700 1.770 1,751. 1,6911 1,3 1,5811 1,533 14688E%M -tr 1,219 1,23 1,315 1,301 1,2861 1,272 121I 1,251 1.244Otresm16anirmanGrarts forP Ex. 207 1,381 1,396 1,414 821 828 276 284 293Total Reveries9 8,911 10,561 11,126 11,588 11.129 11,294 10,924 11,140 11.285
EXPENDITRSaiarles, Wgs & Beneits 2,114 2,261 2,423 2,535 2.617 2.703 2.794 2.890 2,991Pret RelatedPmsonel Ex. 0 1,160 1.160 1.160 560 560 0 0 0
CatacteiSe'~~~~~~~4Ces ~~248 264 283 3D4 312 321 330 340 351Ma =li 31 O 334 356 381 410 421 432 445 458 473O&M anNew E ppft0 287 675 843 852 861 870 879 888COW tirdlje 100 100 100 100 100 100 100 100 100
s evaon , 1.155 1,109 1,065 1,022 981 942 904 868 833Dpecia9mn nNew E-ji, 36*ast 0 341 794 996 1.019 1.041 1,064 1.086 1.109Toted il 3,951 5,875 6,881 7,371 6,862 6,960 6,507 6,622 6,748
OPERATING PROFITI 4,960 4,683 4,245 4,217 4,268 4,334 4.417 4,518 4,638
OTHER ITEMSILom,Itmst0 0 0 0 0 225 443 616 707
PROFIT BEFORE TAXEs 4,960 4,683 4,245 4,217 4,28 4,109 3,974 3,901 3,932
kbcormeTa 35.0% 0 1,639 1,486 1,476 1,494 1,438 1,391 1,365 1,376
PROFIT LOSES)AFTER TAXES 4,960 3,044 2,760 2,741 2,774 2Z671 2,583 2,536 2,556
ACCUMULATEDPROFITS ~~~~~~~~~~11,084 14,128 16,887 19,628 22,402 25,073 2,5 012 3,4
PriorYear*nrw
BALANCE SHEETS (CONSTANT 1*37 US 0YEALRS 1537 1833 1931 200 -20 2002 2902 2004 20
(1997 USSI.00 = r 6.60
CURRENT ASSETS I ICash9,2 15,597 18,887 22,736 29,244 33,782 36.923 38,323 39,946lAcc rRc6a~e 891 3,520 2,782 1,931 1,855 1,882 1,821 1,857 1,897Stres icevt 2,427 3,135 4,664 6.643 8,445 10,305 12,232 14,233 16,319
IPrep miad Dpsits 35 40 45 52 60 60 76 i 85 94 COlerS I___ 2,971 3.520 2,782 1,931 1,855 1,8521 1,8211 1,857 1,897iTotao,are" Assets 23,364 25,812 29,159 33,294 41.458 47,921 52,5731 56,354 60,154
FIXED ASSETS IB91dr1g mid SEucxe 9,605 14.985 21,810 29.105 29.105 29.10105 205 29105 29,105Vetides 1450 450 450 650 650 850 850 1,050 1,050
Pur,trem16Fodtre ~~~~ ~~~~~144 144 144 144 144 144 144 1144 144Macory EmoE 220 200 220 250' 260 260 270 260 300MrIne crafts 1,005 1,005 1.05 1005 1,005 1,005 1,005 1,000 1,005Port E -pmr I __ 2,135 6,360 10,485 10,7851 11,0885 11,385 11.685 11.985 12,285Acoajasted Deprea on ____ ,237) 8,687) 10,546 11,564) 12,564) 14,546) 16,516) 18,470 .20413)WCarkIflProWess____ 858 1.200 1.500 1.000 900 500 0 0 0Tota Roed Assets ___ ___ 7,231 15.657 25,069 31.375 30,485 25.702 26.943 25,099 23,476
TOTAL SETS .... I.. I30,595 41,469 54 281 64,609 7:l194=3 :!76,602:3~ ~79,1516 81,453 83,630
CURRENT UABIUTIES
Stidy Payables - 1,258 1,000 1,000 1,200 1,200 1,300 1,400 1,500 1,500
TOTAL LIABILTIES 2NCPTA 05951 4690 54225 64609 1.710930 76,623 711602 1282145 83440
DC rieated Revmje 3o973 4.07 3.097 2.097 20,7 2.07 2073 2.097 2.097
Re DcAstS -aPONes.EoRal 723% 11.1% 13.1% 13.9%/ 14.2% 3135% 312.% 312.%lCuertRaM (L/-A)l 1 007 0.0 0.6 005 0. 0.4 0-0
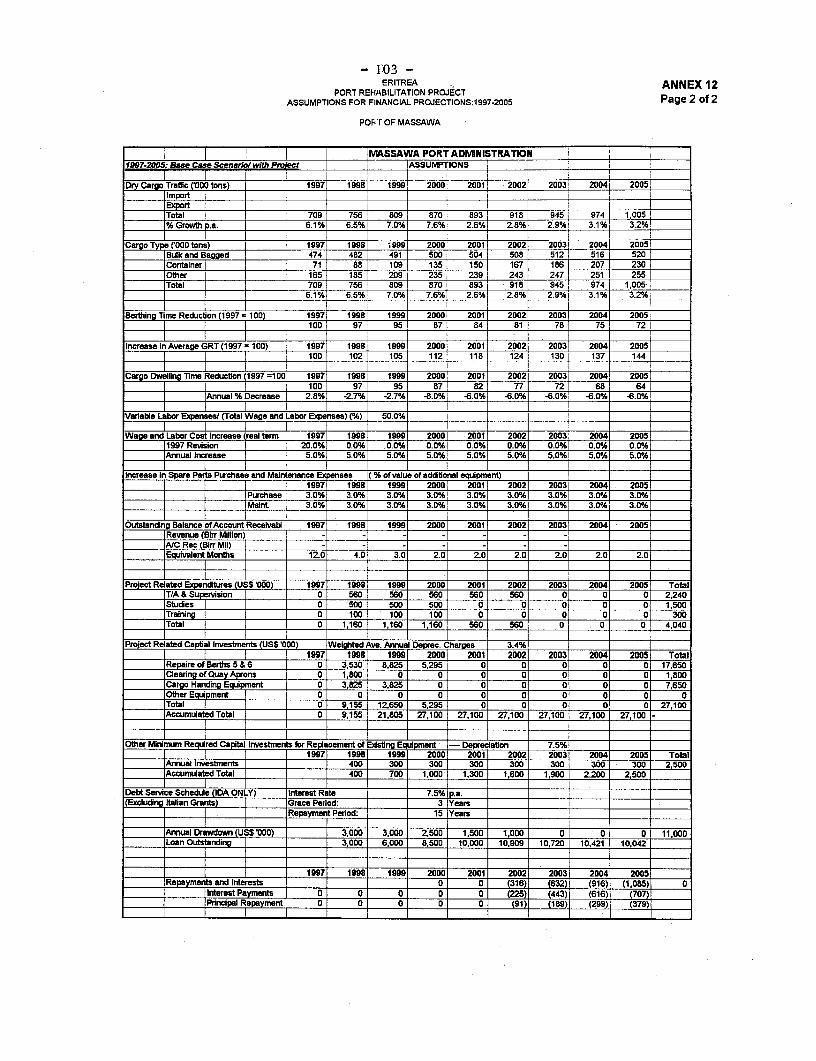
- 1j03 -
ERITRE-A ANNEX 12PORT REHABILITATION PROJECT Pg2f
ASSUMPTIONS FOR FINANCIAL PROJECTIONS:1997-2005Pae2o2
PopFdrOF MASSAWA
__________ ~~~~MASSAWA PORT ADrVNISTRATION i __
1997-2005: Base Case 1cnr, ihPoet J ASSLIMT16ON-S
DyCarg Traffic COOOCtons) ____ 1997' 19981 1_9_99 20001 2001' 20021 2003 20041 2005,iIImport
Total 709 756 809 870 93 9181 945;1 974 1.0051I% Growth Ra. ____ 6.1% 6.5% 7.0% 7.6% 2.6%'4 2.8% 2.9%'i 3.1%1 3.2% I
Cargo Type ('000 tons) 1997 1 998 I99 00 2001 2002 2003' 2004~ 2005'lBulkand Bagged 474 482 491 500 504 508~ 512 516 520IContainer I 71 88 109 135 150 167 186 207 1 230 _______
l_other I 165 185 209~ 235~ 239 243~ 247k 251 I 255Total ____ 709 756 809 8701 893 918 945 974 1,0
______ ______ ~~~~6.1% 6.5%1 7.0%1 7.6%' 2.6% 2.8% I 2.9%T 3.1% 3%
Berthing lime Reduction (11997 = 100) 1997 1998 1999 2000 2001 2002 20031 2004 2005100 97 95 87 841 81 78~ 75' 72
Increasesin Average GRT (1997 =100) 1997 1998 1999i 2000 20011 20'02 2003 2004 20051 1 1 ~~~100 102 105 112 118 124 130 137 144
Carg Dwelling lime Reduiction (11997 =1 00 1997 1998. 1999 2000 2001 2002 203 204 2005[ 100 97 95 87 82 77 7 68 64
i Annual % Decrease F 2.8% -2.7%1 -2.7% 8.% -6.0% -6.0%A -6.0% -6.0% -6.0%
Variable Lbor Exe se/ (Total Wage and Labor Expenses) (%) 500
Wag and Labor Cost Increase relterm 1997 1998 1999 2000 2001 202 2003' 2004 20051997 Re~~~~4sion ~20.0%A 0.0%A 0.0% 0.0% 0.0% 0.% 0.0% 0.0% 0.0%,Annual Increase 5.0% ~5.0% 5.0% 5.0% 5.0%1 5.0% 5.0% 5.0%A 5.0%
rIncrease in SpePf Pwchase and Main'tenance Exses (% of yelpe of addltionral equpment)1997 199 199 2000 2001 2002 2-0031 2004 2005
urmchase 3.0% -3.0%l 3.0%j 3.0% 3.0% 3.0% 3.0% 3.0%A 3.0%Mnt 3.0% 3.0% 3.0% I 3.0% 3.0%A 3.0%] 3.0% 3.0% 3.0%
Outstanckng Balance of Account Receivabl 1997 1998 1999 2000 2001 2002 2003 2004 20051Revenue (Birr Million) - - - - - -
Equivalent Month 12.0 4.0 3.0 2,0 2.0 2.0 2.0 2.0 2.0
___ctRlte_ xp__es(S$00 1997 1998 1999 2000 2001 2002 2003 2004 2005 TotalI_T_A__ Supaieervision 0 3530 8,82 5,29 50 50 0 0 0 17.650
~~ ~~~~~~ ~~ ~ ~ ~~0 1,00 0 50 0 0 0 0 0 1,800
___ ~~~~~~~~~~~ ~~0 10 10 10 0 0 0 0 0 300______ T I 0 9,155 12,1650 1.295 50 50 0 0 0 27.040
PojethRer latmu Red Capia netalnvenstmenSfrR aWemghedt Adtnr Eql Der - Dhres 3citin4 .1 1 ~~~1997 1998 1999. 2000 2001 2002 2003 2004 2005 Total
Rep_annualf Inestmens ___6 _ 4050 3002 3009 30 30 30 30 30 27,6500ClaccungiaofdTtal prn ___ 4,00 70 .00 130 160 190 220 2,00 18
Cxd Ialian GHants) qLpmn G ac Pe 82iod:2 3 Years 765Oth E 'prenRape en Period: 15 Years
Anua Drwon(1'00 _ 3,000 12,000 52,50 150 100 0 0, 0 11.1000LoanOuAtstadin Total __ 3,000 61000 87,500 10,000 2710909 2710,70 2710,421 10,042
F11997 19a 1999 2000 2001 2002 2003 2004 2005 ToaRAcumLated Interests ,00 130 (16)0 (632) (916) (1,50850
Det aceShoLd ID N)Interest Rat0 070 0 5(25 pa) 66) (77
Princi I Re Rept y0e 0 0erod01 0 91 (89a29) (39

104 -fRrTREA ANNEX 13
PORT REHABILITATION PROJECTFINANCIAL STATEMENTS: 1 991-1996
PORT OF ASSAB
|ASSAB PORT ADMINISTRATION
Income Statements IEBir '000f:1991-1996YEAR 19911 19921 1993i 1994| 19959 1996
Exchange Rate (Birr @ US$1.00) 2.07 2.0715.001 5.251 6.001 6.25 6.50Dry Cargo Trafic('000 tons) 8101 1,176 1.046 ! 1,280 1,400 1.331
REVENUESShipping 1,507 5.325 11,273 14,060 14.921 18,394Wharfage 649 3,212 6,823 5.205 5,422| 7,432Cargo Handling 13,881 57.792 104.343 81.898 82,581 I 95.891Storage 3.957 38.847 25,411 T 25.139 22,036 34,430Equipment Hire 2,021 10,420 24,435 18.973 23,409 31,199Registration and Licenses 6 235 362 450 687 600Misc. Services and Charasg 77 2,134 1,856 4.406 2,178 2,796Othres T 386 840 1,692 1.649 3.680 3.768Total Revenues 22.484 118,805 176.195 151,780 154,814 194,510
EXPENDITU RESalaries. Wages h Benefits 7.257 16,518 24.216 29.356 29,576 26.142Contractual Services 624 1,562 2,820 2,197 2,611 4,603Materials and Supples 2.716 5.598 6,075 7.299 9.034 9.067Other Expenditure 0 77 116 181 218 225Deprectiation 4.594 9.063 9,100 8,994 8,987 9.005Total Expenditure 15,191 32.818 42.327 48,027 50.426 49.042
OPERATING PROFIT 7,293 85,987 133,868 10S.753 104,388 145,468
OTHER ITEMSLoan Interest 0 0 Olncome Tax 0 0 O o OO
PROFIT/I LOSSES) 7.293 85.987 133.868 103.753 104.388 145,468
ACCUMULATED PROFITS 7.293 93,280 227.148 330.543 434,931 580,399Prior Year Ad,ustment I i (3581BALANCE SHEETS I.lr 'OOO).:991-1996 (Fixed Assets Value at Historical Cost)YEAR _ ______1991 1992 1993 19941 1995 1996
CURRENT ASSETSCash 5.875 35.507 36,210 12.397 . 18,955 38.906Account Receivable 11,770 71.453 95.855 156.453 165.431 40.978Provision for doubtful A/C Rec. 0 0 0 0 0 0Stores 38.648 37.448 38.786 39.515 44.887 44.255PrepaYments and Deposits 2 8,724 9,193 5,271 4.367 15,527Branches f 29 368 115.926 195.884 282.3131 527,162Total Current Assets 56.324 153.500 259049.520 515.953 666.828
FIXED ASSETS
Buildings and Structure 83,223 83,223 83.223 83.223 _ - _
Vehicles 5.511 5.511 51 7312Furnitur arid Fixture 44.112 4128 4,224 4473Machinery and Egupment 7.178 7,184 7.293! 7.303Marine Crafts 12,893 12,893 12.893 12,893Port Equip-ent 51,103 51.103 54.756 54.756Accumulated Depredation 189.891) (98,954) (108.0541 (116.9811 -Work-in-Prooress 29 114 444 425 1 -ITotal Fixed As ets 74.158 65.202 60,290 53.404 50,615 44.196
TOTAL ASSETS 130,482 218.702 356.260 462.924 566.568 711.024
CURRENT LAUABtUT i|Sundry Payables | 3,880 4,739 1.701 4,089 1,934 2.140Tax Payables 1 1 483 518 377 300 195Accrued CI M.es 601 1,134 602 802 1.496 754Total Current LiabiLties 4,492. 6.356 2,821 - 6.268 3,730 3.089
LONG-TERM LOANS 0 0 0 O O
TOTAL LIABUTIES 4.492 | 6,356 2.821 5,268 3,730 3.089
CAPfTALStateCapital 118.8 . 668 11818.668 119,358 119.358Donated Capital 0 399 7,623 8,449 9,378 9,378Accumulated Profit 7.293 93.280 227.148 330.543 434,101 579,200Total Capital 125.961 212,347 353,439 457.656 562,837 707.936
TOTAL LABILMTES AND CAIlTAL 130,453 218,703 356.260 462.924 566.567 | 711.025
SELECTED FINANCIAL PERFORMANCE INDICATORSiProt Marin % 32% 72% 76% 68% 67% 75%6
IROA I % 6% 39% 38% 22% 18% 20%currentRatio |CLCA 0.1 0.0 0.0 0.0 0.0 0.0
A/C Rec.+Branches IMonths 6.3 7.3 14.4 ,27.9 34.7 35.1
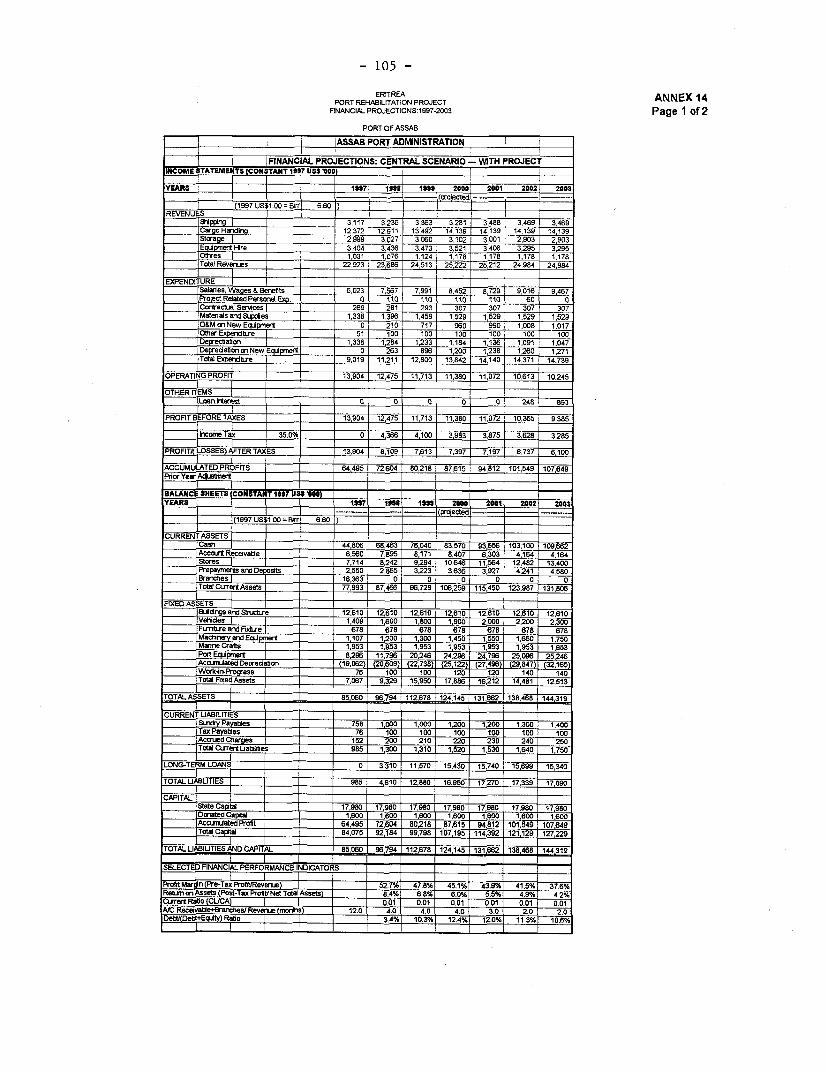
- 105 -
ERITREA A NX1PORT REHABILITATION PROJECT N FX1
FINANCIAL PROJECTIONS:1997-2003 Page 1 of 2
PORT OF ASSAB
2,999 3027 3,060 3,020 3,001 2,032 2,903
Ehppn I-Ir 3,4041 3,436 3,473 3,5281 3,406 3,2695 3,2695
OSTCS 1,0~~~~~~~~~~31 .7 1,124 1,179 1,179 1,179 1,179ToW Revm,jes 22,9~~~~~~~~~2.3 2366 24,513 25.222 25,212 I24,994 24,994
EXWENDITURE I i 10- l 0 o1Sa1aies, Wa es& Benefts 6,28,87 791 9452 9,729 9,016 9,467ProtectRelated Persor nd 0 110 10 10 10 6 CflVactA Services 1 ___ 269 291 293 307 307 307 307Materials aid Stples 1,339 1,39 1459 1,529 159 159 1,529O&MonNewE Dert 0 20 717 060 90 1,OOE 1,017Other E re 51 100 100 100 100I 100I 100
De ectasor, 1339 ~~~~~~ ~~~1,294 -1233 1,184 1,136 1,09111,047DeprecaatonNewro 0n263 9 96 1,200 1,239 1,260 1,271ToWt tir 9,019 11,211 12,900 13,942 14.140 14,371 i14,739
OPERATINGPROFIT I 1 13,904 112,475 -11,713 1,30 107 1,63 024
OTHER ITEMS I I ItLnanlrtwest aL' a 0 O 248 860
PROFIT BIEFORE TA XES 13,904 i~5 11,713 11,39B0 11Tl,072 1W0,3-65 9,395
ilmeTax 35.0% 0__4,366 4,100 3,993 3,87513,628 38
PROFIT LOSSES AFTER TAXES -~13,90 9,109 7,613 7,397 7,197 6,737 6,100
ACCUMULATED PROITS 164,495 72,-604 90,218 8~7,615 94 812 101,549 107,649
P'rior Yearw
BALANC SEETS (CONSTANT 1887 UJ.$ 000)YEARS 1so7 lose I1858 2800 200 2002 2001
11997 USS,,00=Brr 6.60
Acc~ Receivable 1 1,107 1800 81,30 14507 155,03 1,650 41,75MSt-eCs 1,95371 1,983 19534 10,953 1,9534 12,953 13,953Port E est 2965 11,7965 320248 242636 425,09 25246
Ac snaa'ed Deea_a996 ,09 2,39 512 2746 9,4 3,6Wati7e es 7636 10 00 120 10 a14 10
TO ocAssets 77,067 93 91,957 7992612 1,91 1,1TotAalST 0.rrent267 124,145 13160 1239,498 1431980
Pa ties 759~~~~~1261 12 1,00 ,20 12,200 T21,00 12,4100TaxPa tIes 76~~~~~~~140 100 1000 0 21000 1,00 1 001
AMachOr 52 20110 20 30 20 2,50Tarin C.raftUa 1tc,953 10 1,931 1,9520 1,9530 1,940 1,750
LON-T rM LOANSer 0,9 31,3160 1,270 159,43 154 25,069 15,340
TOTA rUkiE 997 41 1 2,8I90 1690 17270 17,33 17,0
_____ 1~~~~~~~~~~~~~= 7=,99 i 92 175,980 190 17902 __
N RcsaetifratsRvucmrs10 . .1.0 30 20 2.01
Dets~~E Rats 358 4% 10.3 12.4% 12.0% 113%0 140.8
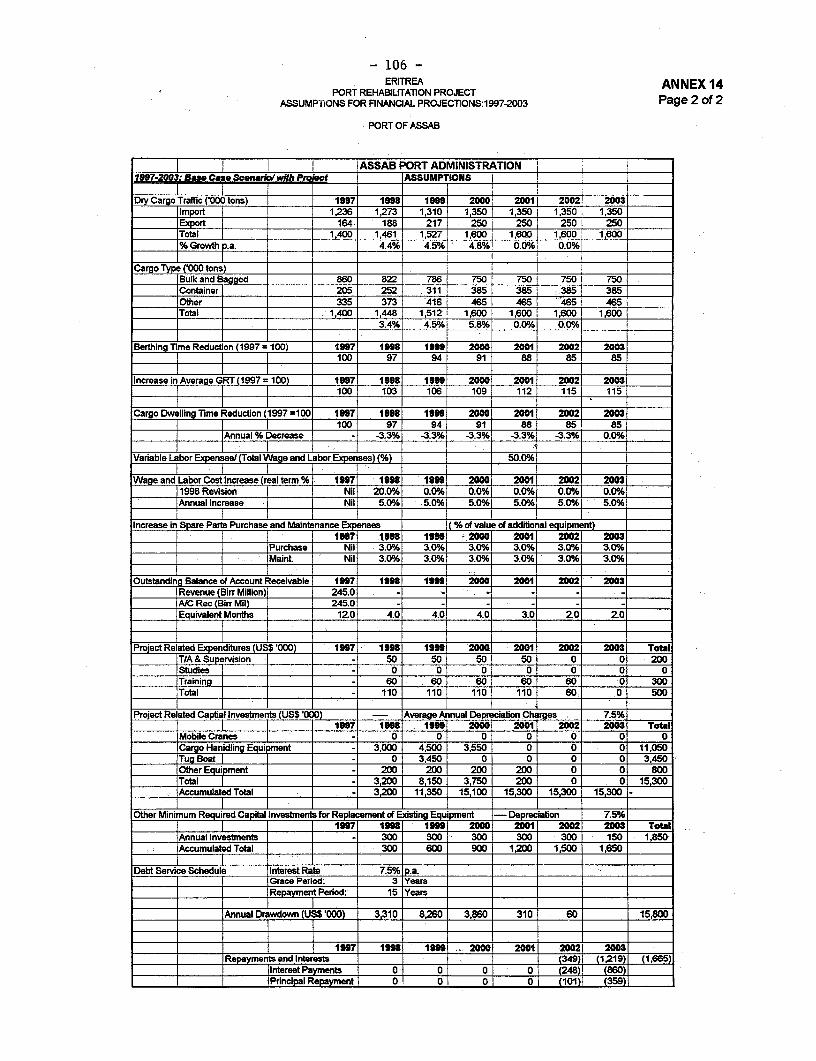
-106 -
ERITREA ANNEX 14PORT REHAEILuTATION PROJECT
ASSUMPi iONS FOR FINANCAAL PROJECTIONS:1997-2003 Page 2 of 2
PORT OF ASSAB
I I ~~~~~~~~~~~~~~~ASSAB PORT ADMINISTRATON 198742003: Baa. Case Soon.r with P £ASSUMPTIONS I __________
DyCarg oTraffic ('000 tons) 1997 1998 1999 20001 20011 20021 2003]____llprt 11,236 1,273 1,31011,350 11,3501 1,350 i1,3501 _
Export L164 188 217 2501 250 1 250 1 50]Total _____ 1,400 1,461* 1,527 1,6004 1,600 t 1,6001 1,600 ___
% Grovvth ~~~4.4% 4.5%/ 4.8%]0 0. 0%;0 0.0%1___
Cargo Typ ('000 tons) I___Bulk and Bagged 860 822 786 750 750[ 750! 750 ____
Container 205 252 311 3851 385 31 853853851 __
___ ter 335 373! 4161 465! 465 ____ 465! ___
____Total 1,400 1,448 1,5121 1,600 1,600 1,600j 1,6001_________ ______ ~~~~~ ~~~~~ ~~~~3.4%1 4.5%/ 5.8%/ 00%O 00o%I
BetigreReducton (1997 100 1997 1998 1999 20 00 2001 2002 2003100 97 94 91 88 85 85
Increase in Average C~T(1997- 100) 19971 1998 19991 2000 2001 i111F21 200_____________ ~~~~ ~~~~ ~~~100 103 106 109 112 115 115
Cargo Dwelling Time Reduction (1997 =1 00 199711 1998 1999 2000 2001 20021 2003_______ I I ~~~~ ~~~ ~~~ ~~~100 97 94 91 88 85 a
___ _ Annual % Decrease -] -3.3%-' -3.3%/ -3.3% -3.3%A -3.3 0.0%
Variable Labor Exe (oa adLbor Expenises) (%) 50.0%
ean _____Increas term___ 1997j 1998 1999 2000 2001 20021 2003
___11998 Revision J_ __ Nil] 20.00% 0.0%/ 0.00% 0.0%/ 0.0%/ 0.0%/
___ Annual increase # ~Nill 5.0%/ .0o 5(/ 5.0%1 5.0% 5.0%ifri
Increasein Spare Pails Purchase and Maintnance Expenses (%do value of additional equ1ipment)_______ ______ I ______ ~~~~~1997j 1998 1999 2001 20011 1141 2 0
Purchase Nil I 3.0%/ 3.0% 3.0% I 3.0%1 3. 0 %! 3.0%A
______ _____ ~~~~~~Maint __Nil 3.OOA 3.0%A 3.0% 3.0% 3.0% 3.0%Outatandin Balance of Account Receivable 1997} 1998 1999 2000 2001 2002 2003
1Revenue (Birr Million) 245.0 - - - - - -
A/ e BifMt 245.0 - - - - - -
EqiaetMnh 12.0 4.0 4.0 4.0 3.0 2.0 2.0
Project Related Epnditures (USS '000) 19971 ~19986 1999 2000 2001 2002 2003 TotalTIA &Supervision - so s0 so 50 0 0 200Studies _ _ __- 0 0 0 0 0 0 0Trainingj__ - 60 60 60 60 60 0 300Total ____- 110 110 110 110 60 ~ 0 500
Project Re CaptiajlInveste (US$ 000j - Average Anual Dep caloiClw 7.5%___j]_ __ 1997 1998 199 2000 2001 2002 2003 Tftal
Mobile Cranes j ______- 0 0 0 0 0 0 0-C~a H '~dl Equipment ___- 3,000 4,500 3,550 0 0 0 11,050Z,___4_________ 3,450 0 0 0 0 3,450
____OterE ulpment 4 ___ - 200 200 200 200 0 0 800Total_ I ___- 3,200 8,150 3,750 200 0 0 15,300A____ umulate Total -1 3,200 11,350 15,100 15,300 15,S300 15,300-
Other Minimum Reuired Capital Investments for Re dcmeto Existing Equimet - Depreciation 7.5% ___
______ ______ 11991117 1998 1999 2000 2001 2002 2003 TOtalAnnu__ al nv~estments _ 300 300 300 300 300 150 1,850
_ lAccmuaedTtal 300 600 900 1,200 1,500 1,650 _
Debt Service Schedule Interest Rate 7.50A pa.-______ ~~~~~~~~Grace Period: 3 Years
______ ______ _____ ~Repaym2T Period: 15 Years___
______ ~~~~~Annual Drawdown CUS OO 3,310 8,260 3,860 310 60 ____ 15,800
_____ ~~~~~~~~~InterestPaymnts 0 0 0 0 248 0)
Prnia eamn 0 0- 0 0 (101), (359)1 _ _
- 107 -
ANNEX 15Page 1 of 8
RISK ANALYSIS
Assumptions
1. The rationale and assumptions made for the calculation of the Internal Rate ofRetum (IRR) are identical to those made in the deterministic economic analysis (numberof berths, savings amount per vessel type, etc.).
2. The statistical assumptions on characteristics of the distributions used were chosenrather subjectively because of the lack of detailed data. They have nonetheless beendeemed accurate enough to represent the overall likelihood that the project will reach itseconomic targets.
On growth
3. The normal distribution used for simulating the growth of traffic is based on thehigh-medium-low scenarios elaborated for the growth of the overall Eritrean economy.Because the medium scenario seems to be a somewhat easily achievable target, thedistribution is biased to allow 20% more chance for the growth rate to be within themedium-high interval than for it to be within the low-medium interval.
4. On the grounds that there is no particular reason for the Eritrean economy toperform either extremely successfilly or extremely poorly, the shape given to thedistribution provides for 80% of the simulated values to gather within the interval mediumscenario plus 40% and medium scenario minus 20%.
5. Because the economy growth rate between 2000 and 2005 and the rate betweennow and the year 2000 will most likely follow similar patterns, the simulations are linked.
6. It is most probable that not all cargo types will follow the general growth at theexact same pace. The analysis is therefore designed to provide relative flexibility amongthe growth rates applied to each cargo type.
On delays
7. A fairly pessimistic normal distribution whose characteristics imply a 40% chancefor the project to be delayed by one year and a 10% chance for it to be delayed by twoyears provide for possible delays in implementation of the project. The delays at each ofthe ports are assumed to be independent because problems in implementation are expectedto arise mainly from local difficulties.
On handling capacity
8. The expected handling rates will depend not only on the equipment provided underthe project but also on the management improvements. Therefore, they cannot be
- 108 - ANNEX 15Page 2 of 8
deterministicly defined and an uniform distribution allows them to fluctuate around thetechnically designed capacities.
Results
9. Each of the investments show very good prospects. The project in Massawa issignificantly more secure (virtually 100% chance to reach an internal rate of return higherthan 20%) than that of the project in Assab (90% to achieve the same goal). Thisdifference lies (i) in the short period over which the Assab's project is being assessed (untilyear 2002) and, therefore, the significantly greater impact that delays could have, and(ii) in the concept of the two components, at Assab the project essentially focuses onimproving facilities for the container traffic, whereas the Massawa investment covers alltypes of cargo.
10. The pattern of results for the overall project, with 95% chance to reach a rate ofreturn higher than 35%, shows how well the project provides for current needs. A verypositive aspect shown by this analysis, is that it is almost four times more probable that theproject achieves a rate of return superior to 50% (probability of about 22%) than it is forthe project to reach a rate of return below 30% (probability of less than 5%),demonstrating the extent to which the "12%" traditional hmit for acceptance is surpassed.
11. The model's simulation was computed on the software Palisade ,Risk Version1.12 running it for 10,000 iterations. The rate of return has been estimated for the year1997.
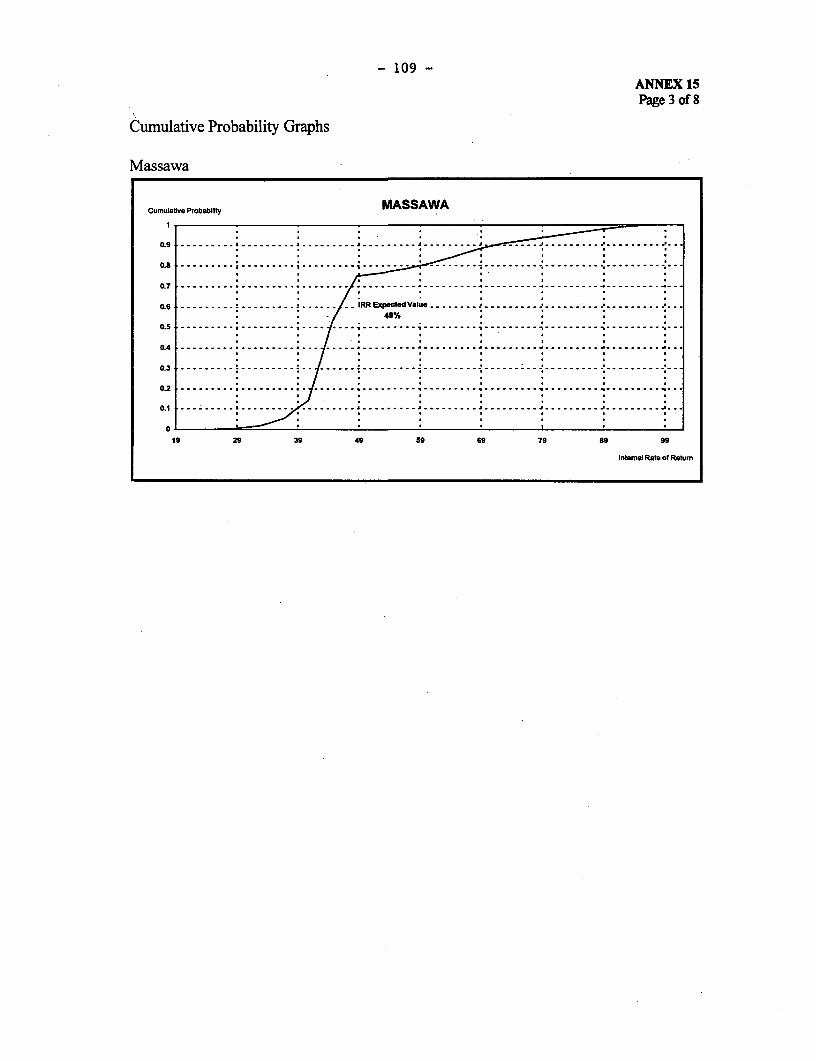
- 109 -
ANNEX 15Page 3 of 8
Cumulative Probability Graphs
Massawa
Cumulative Probability MASSAWA
0.9 ------ ----- _ ----- _ .............. , ._ .... ... _..._.._._.__._._
06 ------ -------------- --- --------- ----- -t-....... ,_ _ , _
0.3---------- --- ----- -------- ----- '- --- ---- - -------- ------------- -----------------
0.6 -, - -- 'RRExptdVal .-
19 29 39 49 9 69 79 S999
0.5 --------- l ---------
0.
19 29 39 49 59 69 79 89 99
Internal Rate of Return
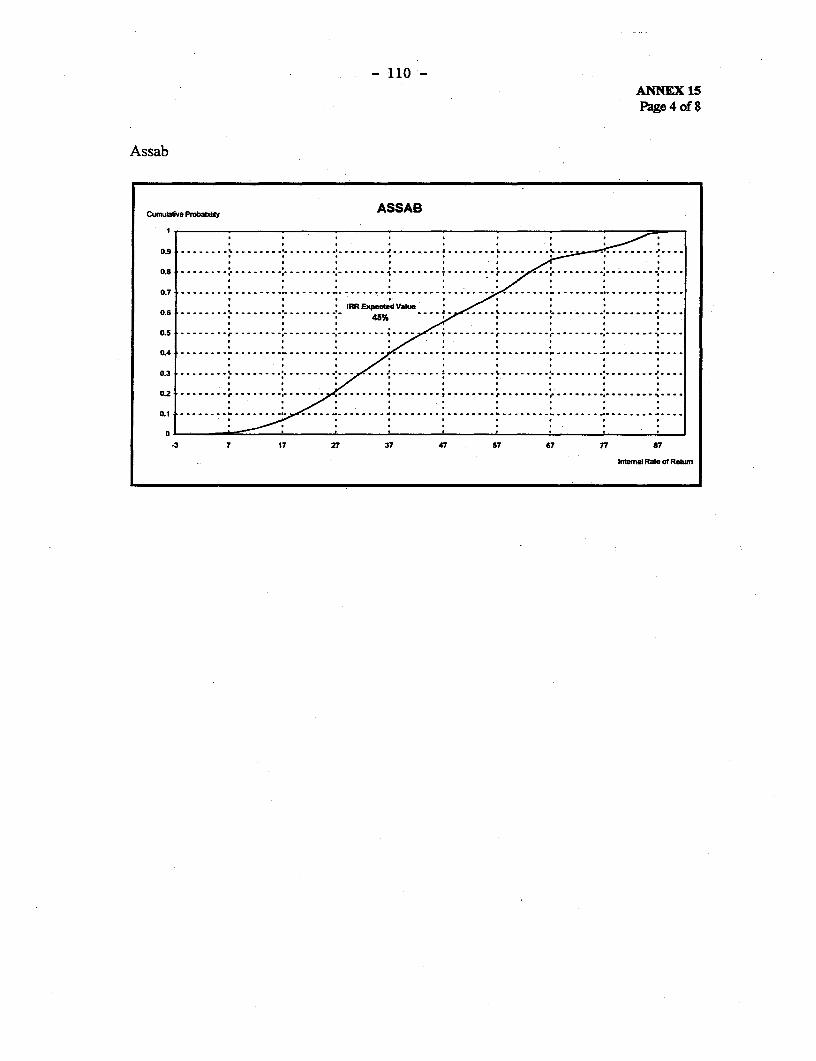
-110-ANNEX 15Page 4 of 8
Assab
Cumultive Probahiiy ASSAB
0.9 - t~~.............. ------- - L......
- ----- - - - --- - - - - - --- - -- -- - --- -- -- - - - --- -- -- --- - -> - -- ..--.--..- I-.s-..-..
0.7 _ --- --------------- ^ -,
* * IRR Expectd Value0.6 .. . . . 6 . . .. .. . .. .. . .. . . .. ... . . .. . . . . . . ... I. . . .
0.5 6 ,- s..., . . ........ . ..
0.4 -- -- -- - - ..... .
0.3 *- - ----- - ---- -----0.2 *-------e--.-*---, - .--- a--**5z--s**~~-g-v----------- - ------v--. e --v*-----
0.2 ----- ........ ... ........ ..... ......... 4...
-3 7 17 27 37 47 ST 67 77 a7
Intma Rate of Retum
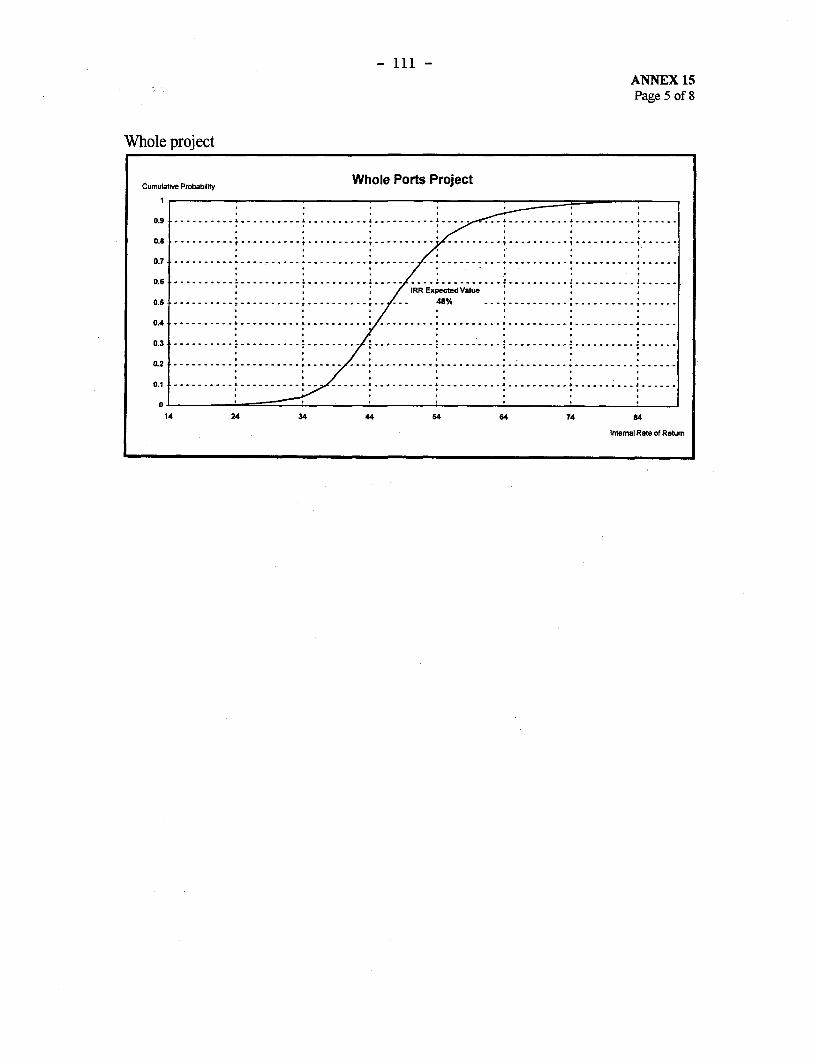
- 111 -
ANNEX 15Page 5 of 8
Whole project
Cumulatve Probability Whole Port Project
0.9 ----------- .............. L 1._.................................. ---------
*~~~~~~~~~ IRR Expected Value
0.5 * .- - .- - - . 48% . . . .---
0.2./0.6 - -- ...................'…0.3 -,--,,,-,,-,,--- --- ,---,- -- ,---,-- ............. ,,, ,,...__.,_.. _,,_
0.2 .... __...... L ----------------- --------- ---------- .
14 24 34 54 54 64 74 84
Internal Rate of Return
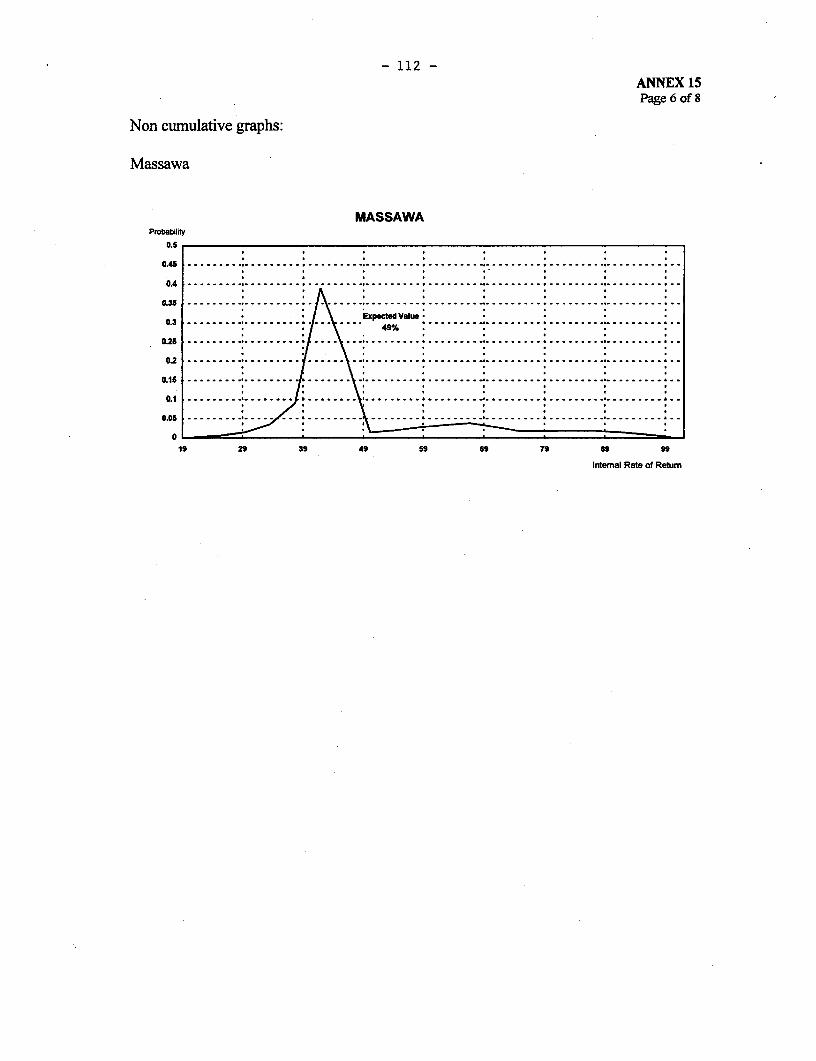
- 112 -
ANNEX 15Page 6 of 8
Non cumulative graphs:
Massawa
MASSAWAProbability
o.s
0.45 , .......... . ..... ............. . . . -.-.........--- -- -- --,- . . . . .---------------
0.4-0A3 - - - - -. . . . . . . .....-.-.-.-.-..-.-.-.-.-.-..-.-.-.-.-.-..-.--------.
0.3 Expeed Value ....... . .0.325 \ _. 49%
0.26 - - ............ ..................
0.2 ... . . .. ... . . .... .... .. ... --- --
0.15 6 .
0.1..*. s
0.05 . , - _ .... ......... ..*......
019 29 39 49 59 69 79 89 99
Intemal Rate of Retum
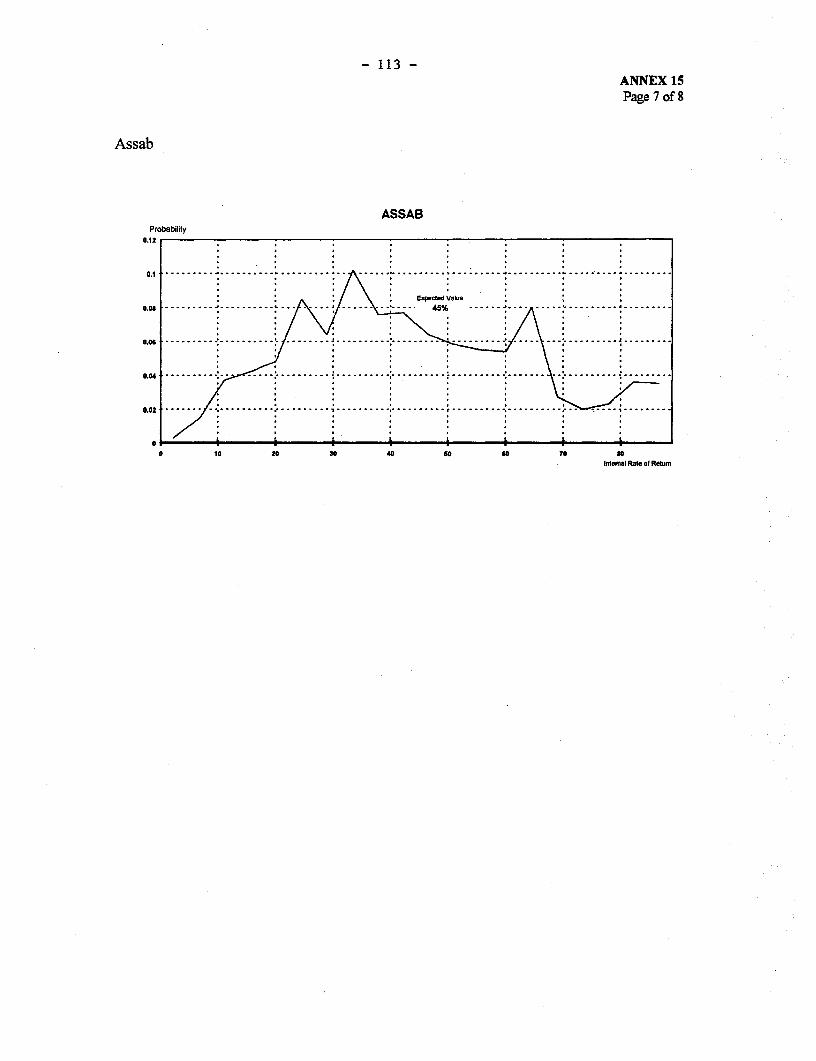
- 113 -
ANNEX 15Page 7 of 8
Assab
ASSABProbability
0.12
E.pecledValueo.os . . . . . . . ..X5 .. .... ,.. 5 ... .. ,.,,,.. ... ,
o.e6 - - - - - . ..... .. .. . ... .. ........... .. .. . .
03.02 , . . .. .- .v . . . . . . . . ."' . ....... I
f * : : , ~ ~ ~ ~ ~ ~ ~~~~~~~~~~~~~~~L L L iO-
0 10 20 30 40 so Go 70 soIntenal Rate of Retum
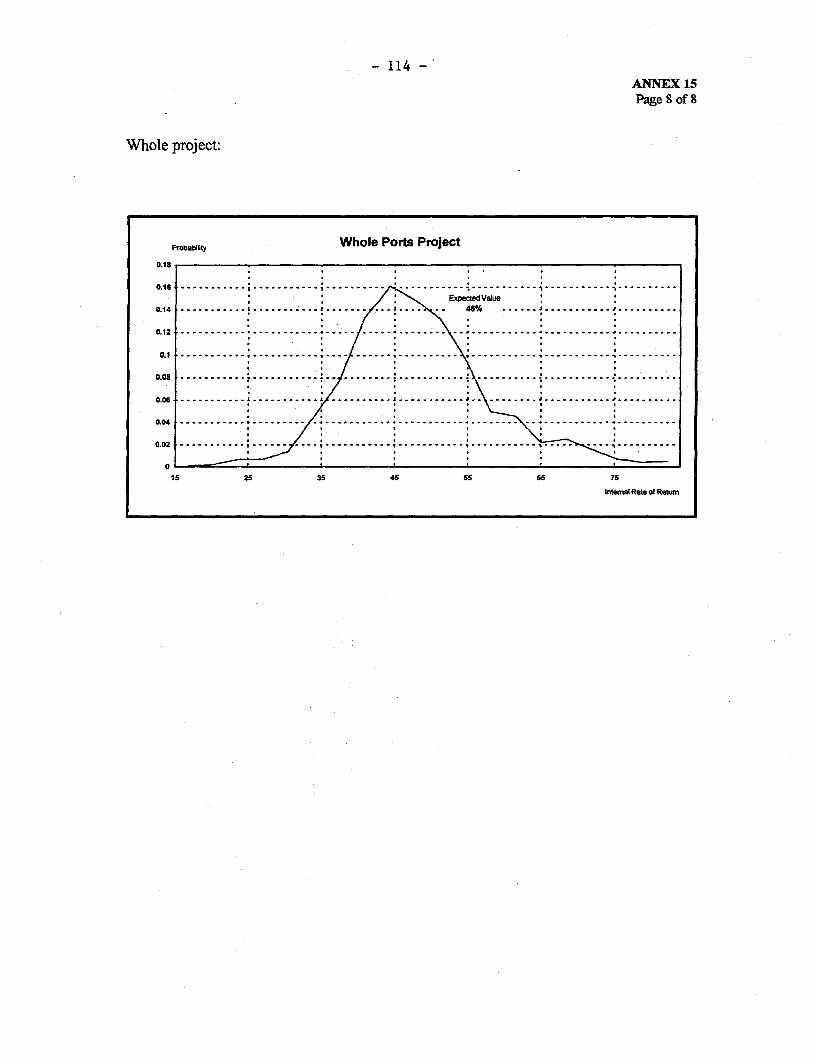
- 114 -
ANNEX 15Page 8 of 8
Whole project:
Probatft Whole Ports Project0.18
0.16 ............------------ - --- ......-- ----- ---- __ _ ---------- ---------/ ' X ExPectedVaue
0.14 --- --- - 48% --------- ----------
0.12 ------------ '-----------'------'------- ..-'-----------------------''---------
0.1 ..- -'' '. t0.08- '.i...'___ .\ _ _'.............. ......... ....... _____..... ----------------
0.08 ......... . ..........
0.04 .--------------- -----... ...------ - .---
o.04 ' .......... ........ . ............... .................
0.02 ,....... , , ,-,
015 25 35 45 55 65 75
IffmalRate of Retum

MASSAWA PORTORGANIZATIONAL CHART
|Sector Board
Massawa Portl
Legal Service Internal _Audit
Port Services Plan & Program(24) (3)
Finance Marketing Operations Technical Pilotage(63) (11) (159) (44) (39)| _ ____ __ _ _ go~~~~~4

ASSAB PORTORGANIZATIONAL CHART
Sector Board
| Assab Port f
GM~~~~~~~~~~~~~~~~~~~~~a
U3)Internal Auditori
(3)i
rLiaison Office I
Port Seculrity i°(25)
Planning &i Programming
_5~~~~~~~~~~~E(6)
Division (296) (48) Division (211)~~~~~~~~~~~~~~~~~~~~~~~~s o

- 117 -ANNEX 17
DOCUMENTS IN PROJECT FILE
1. Rehabilitation of Port of Massawa, Final Report, Hoff&Overgaard - Carl BroInternational a/s, January 1996.
2. Human Resources Development & Training Needs, Ports of Eritrea, GTZ-Uniconsult,November 1995.
3. Training Outline, Ports of Eritrea, GTZ-Uniconsult, February 1996.
4. Improvement of Terminal Productivity in the ports of Assab and Massawa, GTZ-Uniconsult, February 1996.
5. Rehabilitation of Port of Massawa, Prequalification Documents, Hoff&Overgaard-Carl Bro International a/s, June 1997.
6. Rehabilitation of Port of Massawa, Draft Bidding Documents, Hoff&Overgaard-CarlBro International a/s, August 1997.
7. Project Implementation Plan (PIP), DMT, 1997.
8. Draft Mission Report on the assessment of the ability of the State of Eritrea torespond to Marine Pollution Emergencies - IMO October 1995.

MAP SECTION

IBRD 27961
3D3633 33', 3' AT 3'
ERITREA
PORTS REHABILITATION-13SU
PROJECT
If 2 ' ~ SAUDI ARABIA PROJECT LOCATIONS
S U D A N f T-W 4-
j qS'lo WAD R _ 1t . i IP ( ROJECTLOCADONS
33' )D &16 I ' MAJOR ROAnS~~~~~~~~~~~~~~~~~~~~~~~~~~~~~~~~~~~~~~~~~~~~~~~~~~~~MJR OD
/ ) I N SECO[~~~~~~~~~~~~~~~~~~~~~~~~~~~~~~~~~~~~~~~~~111IDARD ROADS
) - -- - R~~~~~~~~~~~~~~~~~~~~~~~~~~~~~~~~~~~~~~~~~~~~~~~~~~~~~AILROADS
I' N HALED ~ ~ ~ ~ ~ 6•S - --- >-ACP RIVERS
I I ---- - AS~~~~~~~~~~~~~~~~~~~~~~~~~~~~~~~~~~~~~~~~~~~~~~~NERMITTENT STREAMD
A.CyM > , 0 , f SELECTED TOWNS
-~~~~~~ A~~~~~~~~~~~~3kt -. A' ~~~~~~~~~~~~~~~~~~~~~~~~NATIONAL CAITAIL
; A-miG 'I , 41, i ! - - ITIVERNATIONA BOULI4DARIES
16, V D..
ni .
1( 3AoIW, N Is . a- , . i E S e A '
J' - 0 0 , N 6 , _59- 1 A -R F
<666641 Ad EN,; ,6
6643,'' 1
43633636~~~~ ~~ ~~ 17 KLOMETERS
i \ thmbo %+ > . SUDAN ,j j glBOUTI~~~~~~Di
IE -F I
S, Ad,,.,
!~ ~ ~ ~~~66d6 E,~DW T6bI H , I N =l < >
.\ -- /11"
1 . ~1'0
1 . 3, u S -.-- 509 i:A~~~~~~~~T.Ad,Ab
'2 ~~~~~~~~~~ El 634 WT
33D6 ~ ~ ~ ~ ~ ~ ~ ~ ~ ~ ~ ~ ~ ~ ~ ~ ~ ~ ~ ~~~~~EZlAR
E 3 T344I66 PAE CIE A 66ETHElIZ
Med.,~~~~~~~~~&dL IDA
~~~~~~~~ 1 6> 66~~~~~~~~~~~~~~~~~~~~~~~~~~~~~~~~~~~~~~~~~~~.L, 6ANA0CEAt
r - ~ ~ ~~ / 3,63,3666 3633,63343 '6 Ab,.cAJ,i~~~~~~~~~~~A, 3N I A' Ut> SAUDI ARARIA 22-~~~~~~~~~~~~~~MA 199
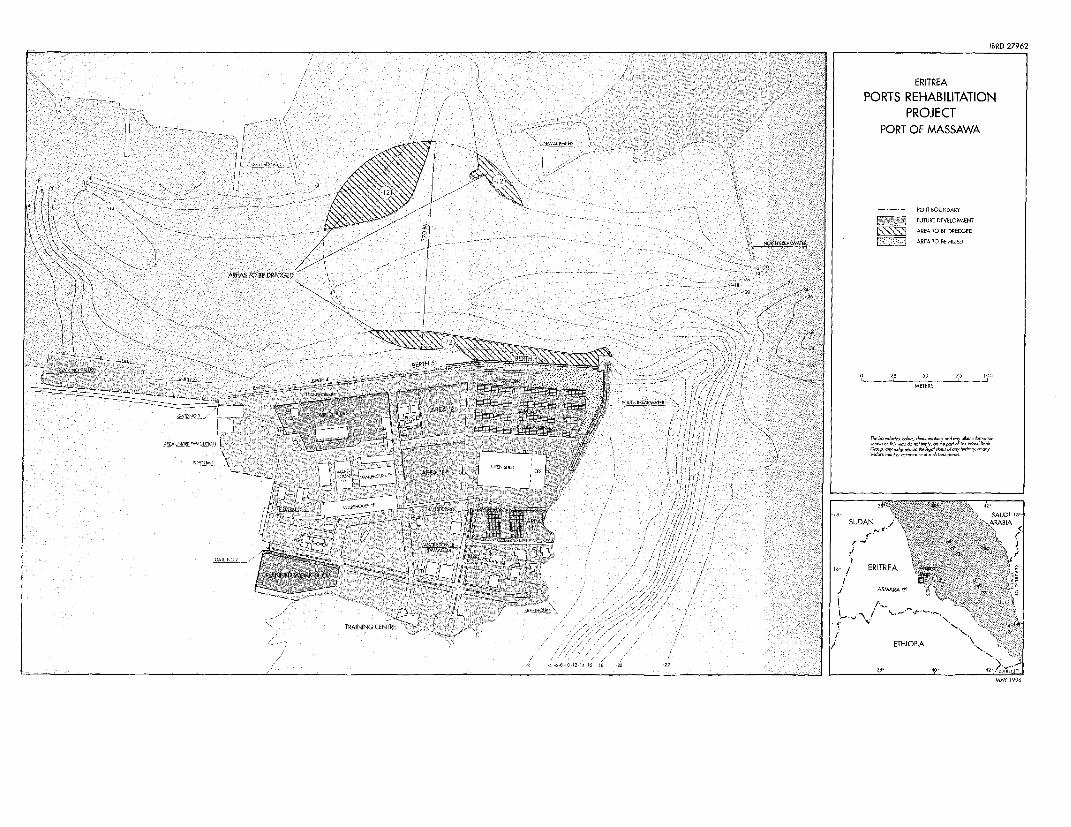
IBRD 27962
/ ~~~~~~ER~ITREAPORTS REHABILITATION
PROJECTPORT OF MASSAWA
N 2~~~~~~~~
-- 1', ~~~~~~~~~~~~~~~~~~~~~~~~~~~~~~~~~~~~~~~~~~~~~~POERE OUNDARY
V X EUVTJEE DEVELOPMENT~~~~~~~~~~~~~~~~~~~~~~~~~~~~~~~~~~~~~~~~~~~~~~~~~~~~~~~FrREDVLOMN
- RE OREELE
AREAS TO BE DREDGED~~~~~~~~~~~~~~~~~~~~~~~~~~~~~~~~~~~~~~~~~~~~~~AE T EDRDE
I~~~~~ - VTORTLTRREATATTATRR ~~~~~~~~~~~~~~~~~~~~~~~~~~~~~~~~~~~AREA TO BE FIREDOE
AREAI~~~~~~~~~~~~~N- -U1111- 'A.-- An,~~~~~~~~~~~~~~~~~~~~~~~~~~~~~~~~~~~~~A- N
-ARATAA~ ~ ~ ~ ~ ~ ~ ~ ~ ~ ~ ~ ~ ~~~~~~~~~~~~~~~~~~~~~~~~~~~~~~~~~~~~~AMR
A TRANSOTAFP 5 TRININ/CE/
SCAM BRERA'RLARRR \ ~ ~ ~ ~ ~ ~ ~ ~ ~ ETHOP
Q 1~~~ 1~~ 1~~ W 22~AT/TAUT -- A9~~~~~~~~~~~~~~~~~~~~~~~~~~~~~~~~~~~~~~~~~~~~~~R~~~~~~~~ TAR ~ ~ ~ ~ ~ ~ ~~ ~~ ~3
r TA/TA ~~~~~~~~~~~~~~~~~~~~~ AT4T;TRTAR,~~~~~~~~~~~~~~~~~~~~~~~~AY 99