stadium of the future - oracle
TRANSCRIPT


of fans said they would spend
more on food and drink if
waiting times were shorter58%
of fans would pick up an
order from an express line at
a concession stand
74%
of fans said in-seat delivery of food and drink to their seat would improve the stadium experience
76%
of fans are interested in joining
a loyalty program but only 3% are
in one
65%
is the maximum acceptable waiting time to buy food and drink
10minutes
of fans are using paperless tickets at
games, biometric payment and other
technologies are less appealing
48%
2 Stadium of the Future

Methodology
Fans from five countries across a number of sports were surveyed for this report:
- Australia (Australian Rules Football)
- Canada (Ice Hockey)
- Germany (Soccer)
- UK (Soccer)
- US (MLB, NFL, Soccer, NHL)
The respondents all met the following criteria:
- Avid fan of the target sport
- Attended at least one live event of the target sport in the last 12 months
What Is the Stadium of the Future? Technology is changing every aspect of sport, and the game day experience for fans is no exception. Stadiums are striving to provide a greater spectacle at live events, with more entertainment and enhanced enjoyment of the game. Food and beverage is a critical part of this; 94% of sports fans say that they buy food and drink at a game at least occasionally, making it significant both for fan satisfaction and for revenue generation.
So, what do fans want from their game day experience?
1. To enjoy food and drink at the stadium: 72% of US fans always or usually purchase food at a game, while 76% always or usually buy a beverage, spending an average total of $42 per game.
2. To stay in their seats: Nearly 30% of fans globally ranked being able to stay in their seat as the most important way to improve the food and beverage experience at the stadium, closely followed by faster transaction times.
3. Shorter lines and wait times: Fans value their time at games, and are willing to pay a premium for it. 59% of fans would spend more on food and beverage if their wait time were to be cut in half.
4. Easier ordering options: Fans are willing to use new ordering options. 68% were very interested in using a mobile application to order food and beverage, and 63% said they would use self-service kiosk ordering.
5. Futuristic technology that doesn’t disrupt the game: Fans are already using new technology, like paperless tickets and contactless payment methods, but are less interested in technology that wouldn't enhance their game day experience. For example, only 5% of fans globally were more interested in receiving an order from a robot than a human.
6. Loyalty rewards: 63% of fans globally are interested in joining a loyalty rewards program, but less than 3% actually participate in one.
Stadium of the Future 3

What Do Fans Want? Fans are extremely interested in making food and beverage purchases while at a stadium. 94% of fans surveyed said they had bought food or drink at a game at least occasionally, with 34% saying that they always bought a beverage and 27% always purchasing food.
Although the overwhelming majority of fans are making regular concession purchases, 72% of fans cited that they have had issues with their food and beverage experience at games. Given how much fans are already willing to spend on concessions, despite being deterred by multiple factors, there is an opportunity to increase lost stadium revenue if concessions operations were more streamlined.
97% of US fans have purchased food at a game on at least one occasion.
Average Spend on Food & Beverages when Attending Games
Food Purchase Frequency Beverage Purchase Frequency
USD Conversion: $24 $25 $17 $19
$42United States
(USD)
$34Australia
(AUD)
$33Canada
(CAD)
€15Germany
(Euros)
£15United Kingdom
(GBP)
41%
23%
25%
28%
20%
21%
31%
29%
30%
29%
30%
28%
72%
52%
55%
57%
50%
49%
United States
International (Net)
Australia
Canada
Germany
United Kingdom
Food Purchase FrequencyAlways Most Games Net (top 2 box)
45%
31%
26%
33%
41%
25%
31%
31%
32%
30%
30%
31%
76%
62%
58%
63%
71%
56%
United States
International (Net)
Australia
Canada
Germany
United Kingdom
Beverage Purchase FrequencyAlways Most Games Net (top 2 box)
41%
23%
25%
28%
20%
21%
31%
29%
30%
29%
30%
28%
72%
52%
55%
57%
50%
49%
United States
International (Net)
Australia
Canada
Germany
United Kingdom
Food Purchase FrequencyAlways Most Games Net (top 2 box)
45%
31%
26%
33%
41%
25%
31%
31%
32%
30%
30%
31%
76%
62%
58%
63%
71%
56%
United States
International (Net)
Australia
Canada
Germany
United Kingdom
Beverage Purchase FrequencyAlways Most Games Net (top 2 box)
4 Stadium of the Future
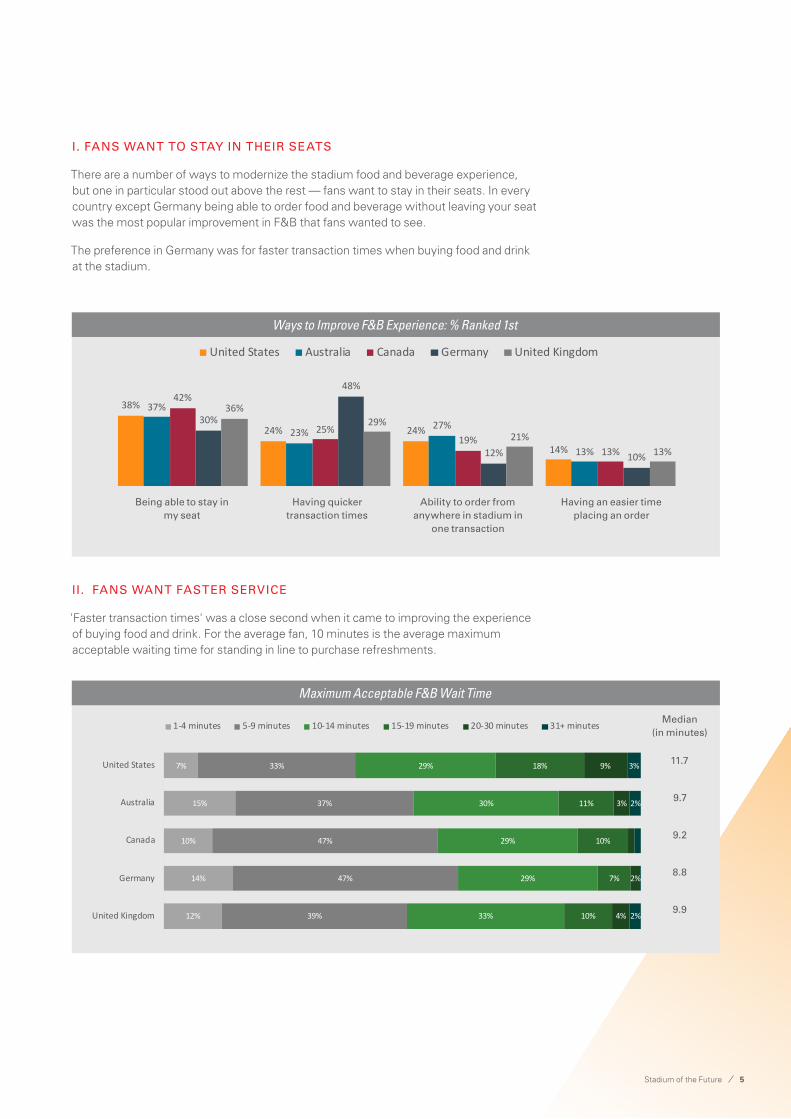
I. FANS WANT TO STAY IN THEIR SEATS
There are a number of ways to modernize the stadium food and beverage experience, but one in particular stood out above the rest — fans want to stay in their seats. In every country except Germany being able to order food and beverage without leaving your seat was the most popular improvement in F&B that fans wanted to see.
The preference in Germany was for faster transaction times when buying food and drink at the stadium.
II. FANS WANT FASTER SERVICE
'Faster transaction times' was a close second when it came to improving the experience of buying food and drink. For the average fan, 10 minutes is the average maximum acceptable waiting time for standing in line to purchase refreshments.
Ways to Improve F&B Experience: % Ranked 1st
Maximum Acceptable F&B Wait Time
38%
24% 24%
14%
37%
23%27%
13%
42%
25%19%
13%
30%
48%
12% 10%
36%29%
21%13%
Being able to stay in my seat Having quicker transactiontimes
Ability to order fromanywhere in stadium in one
transaction
Having an easier time placingan order
Ways to Improve F&B Experience% Ranked 1st
United States Australia Canada Germany United Kingdom
Being able to stay in my seat
Having quicker transaction times
Ability to order from anywhere in stadium in
one transaction
Having an easier time placing an order
7%
15%
10%
14%
12%
33%
37%
47%
47%
39%
29%
30%
29%
29%
33%
18%
11%
10%
7%
10%
9%
3%
2%
4%
3%
2%
2%
United States
Australia
Canada
Germany
United Kingdom
Maximum Acceptable F&B Wait Time1-4 minutes 5-9 minutes 10-14 minutes 15-19 minutes 20-30 minutes 31+ minutes
7%
15%
10%
14%
12%
33%
37%
47%
47%
39%
29%
30%
29%
29%
33%
18%
11%
10%
7%
10%
9%
3%
2%
4%
3%
2%
2%
United States
Australia
Canada
Germany
United Kingdom
Maximum Acceptable F&B Wait Time1-4 minutes 5-9 minutes 10-14 minutes 15-19 minutes 20-30 minutes 31+ minutes Median
(in minutes)
11.7
9.7
9.2
8.8
9.9
Stadium of the Future 5

Projected F&B Spending with Reduced Wait Time*
14%
10%
18%
17%
15%
15%
14%
9%
11%
8%
5%
3%
5%
2%
4%
7%
2%
2%
66%
44%
55%
United States
Australia
Canada
Projected F&B Spending with Reduced Wait Time*$1-$10 more $11-$20 more $21-$30 more $31-$40 more $41-$50 more $51+ more NET would spend more
20%
17%
21%
22%
11%
9%
8%
5%
3%
3%
4%
4%
68%
61%
Germany
United Kingdom
£/€1-5 more £/€6-10 more £/€11-15 more £/€16-20 more £/€21-25 more £/€26+ more NET would spend more
III. FANS WILL BUY MORE IF SERVICE IS FASTER
Slow service has a direct impact on revenues. When asked if they would spend more on food and beverage purchases if their wait time was cut in half, fans resoundingly answered “yes”.
In Germany, 68% percent of fans were willing to spend more for faster service, with the US and the UK close behind. Of these fans, the majority indicated that they would spend the equivalent of $10 US more per game — which translates into significant revenues for stadiums that hold thousands of fans.
6 Stadium of the Future

US attendees expressed more willingness to use new ordering, payment or collection options
85% 82%76% 74% 71% 69% 69%
63%58%
45% 43% 41%
74% 72%66%
60% 61%
51%57%
51%57%
36% 34%
26%
Delivery to seat
Express line Mobile app in seat
Tablet in-seat
Self-service kiosk
Tablet in-line Mobile app elsewhere
Loaded ticket
Contactless payment
Fingerprint Locker pick-up
Facial recognition
Likelihood to Use F&B Options(% definitely or probably would use)
US International
Ordering Options Payment Options Collection Options
US fans are more willing to use new technologies than fans in other countries.
Are fans willing to use new technologies when buying food and drink? I. FANS VERY LIKELY TO USE NEW SERVICES
If one thing was abundantly clear from this research, it is that fans are willing to embrace new technology if it will help them to access food and drink more quickly.
We asked the fans how likely they would be to use a variety of technology options for ordering, collecting, and paying for their food and drink. Even the least popular of these concepts — payment by facial recognition — was considered to be something that 41% of US fans would definitely or probably use. There is clearly an appetite for more technology in the food and beverage purchase process.
Stadium of the Future 7

Likelihood to Utilize F&B Ordering Options: % definitely or probably would use
II. MOBILE, TABLET AND KIOSK ORDERING WERE POPULAR
In nearly every country, over 50% of the fans surveyed said that they would be likely to use mobile apps, tablets, or kiosks to allow them to order food and drink.
38%
24% 24%
14%
37%
23%27%
13%
42%
25%19%
13%
30%
48%
12% 10%
36%29%
21%13%
Being able to stay in my seat Having quicker transactiontimes
Ability to order fromanywhere in stadium in one
transaction
Having an easier time placingan order
Ways to Improve F&B Experience% Ranked 1st
United States Australia Canada Germany United Kingdom
76% 74% 71% 69% 69%66%
56%63%
58%
47%
69%65% 62% 59% 59%60% 57% 56%
50%45%
69%64% 62% 62%
54%
Using a mobile app from myseat
Using a stadium-providedtablet while in my seat
Using a self-service kiosk Using a mobile app fromsomewhere else in the
stadium
Using a stadium-providedtablet while waiting in line
Likelihood to Utilize F&B Ordering Options(% definitely or probably would use)
United States Australia Canada Germany United Kingdom
Using a mobile app from my seat
Using a mobile app from somewhere else in the stadium
Using a stadium-provided tablet while in my seat
Using a stadium-provided tablet while waiting in line
Using a self-service kiosk
8 Stadium of the Future

Likelihood to Utilize F&B Payment Options: % definitely or probably would use
Likelihood to Utilize F&B Receiving Options: % definitely or probably would use
38%
24% 24%
14%
37%
23%27%
13%
42%
25%19%
13%
30%
48%
12% 10%
36%29%
21%13%
Being able to stay in my seat Having quicker transactiontimes
Ability to order fromanywhere in stadium in one
transaction
Having an easier time placingan order
Ways to Improve F&B Experience% Ranked 1st
United States Australia Canada Germany United Kingdom
Contactless or mobile payment
Delivery to my seat from an in-seat server
Loaded value on ticket
Pick-up at an express line at a concession stand
Using my fingerprint
Pick-up from a locker
Using facial recognition software
III. BIOMETRIC PAYMENT OPTIONS WERE LESS APPEALING
Simple payment is a critical part of a speedy food and beverage purchase. But while half of fans seemed keen on contactless, mobile, or loaded value ticket options, interest in fingerprint or facial recognition was less pronounced.
IV. IN-SEAT DELIVERY AND EXPRESS LINES WERE PREFERRED FOR FOOD AND DRINK COLLECTION
In-seat delivery was not the only preference; 74% of fans said they would be likely to use express pick-up lines at a concession stand if they were available.
58%63%
45%41%
54%48%
33%26%
56% 56%
31%24%
49% 51%
31%
19%
70%
50% 47%
36%
Contactless or mobile payment Loaded value on ticket Using my fingerprint Using facial recognition software
Likelihood to Utilize F&B Payment Options(% definitely or probably would use)
United States Australia Canada Germany United Kingdom
85% 82%
43%
76% 75%
33%
79%74%
32%
67%70%
33%
76%71%
40%
Delivery to my seat from an in-seat server Pick-up at an express line at a concession stand Pick-up from a locker
Likelihood to Utilize F&B Receiving Options (% definitely or probably would use)
United States Australia Canada Germany United Kingdom
Stadium of the Future 9

Which Technologies Will Stadiums Use to Support Food and Beverage Service In the Future? From massive jumbotrons to interactive social media campaigns, stadiums are already foraying into technology offerings to keep fans engaged. With so many technological advances already having been made in recent years, stadiums are eager to push the envelope to win the title of most advanced and innovative venue.
It’s critical that stadiums do not overlook concessions as an area of improvement to keep the fan of the future satisfied. So, what exactly can we expect to see as we look ahead?
10 Stadium of the Future

Likelihood to Utilize F&B Options: % definitely or probably would use
I. NEW TECHNOLOGIES: WHICH ONES WOULD FANS USE?
We asked the fans to consider other technology options that could augment the food and beverage experience at a game.
Automated service and delivery was most popular — 57% of fans would welcome the ability to walk into a stadium and have your favorite food and drink ready for you at the right time in the right place. 41% said that they would be likely to use drone delivery or voice activated virtual assistants, while 37% would use augmented reality to see food options. 31% would pay more to have food delivered from outside the stadium. Having food suggested by analytics or social media activity were the least popular, on 30% and 26% respectively.
38%
24% 24%
14%
37%
23%27%
13%
42%
25%19%
13%
30%
48%
12% 10%
36%29%
21%13%
Being able to stay in my seat Having quicker transactiontimes
Ability to order fromanywhere in stadium in one
transaction
Having an easier time placingan order
Ways to Improve F&B Experience% Ranked 1st
United States Australia Canada Germany United Kingdom
66%
55%50% 51%
44% 43%37%
56%
40% 38%33%
28% 25% 22%
57%
39% 41%36%
26% 29%24%
49%
32% 36%27% 24% 22% 20%
57%
41% 43% 39%33% 29% 27%
Automated service anddelivery
Ordering via a virtualassistant (similar to Siri
or Alexa)
Drone delivery to myseat
Augmented/virtualreality to view food and
beverage options
Pay a premium to havemeals from outside ofthe stadium delivered
Food and beveragesuggestions based on
fan analytics
Food and beveragesuggestions based on
your social mediaactivity
Likelihood to Utilize F&B Options(% definitely or probably would use)
United States Australia Canada Germany United Kingdom
Automated service and delivery
Food and beverage suggestions based on fan
analytics
Drone delivery to my seat
Augmented/virtual reality to view food and beverage
options
Pay a premium to have meals from outside of the
stadium delivered
Ordering via a virtual assistant (similar to Siri or Alexa)
Food and beverage suggestions based on your
social media activity
Stadium of the Future 11

Interest in Receiving F&B from Humans or Robots
Expect Stadiums To Stop Accepting Cash in the Near Future
44%
56%
45%
66%
53%
United States
Australia
Canada
Germany
United Kingdom
Expect Stadiums To Stop Accepting Cash in the Near Future
United States
Australia
Canada
Germany
United Kingdom
United States Australia Canada Germany United Kingdom
48% 42%50%
33%42%
20%21%
17%
26%23%
25% 31% 27% 38% 30%
5% 4% 3% 1% 4%2% 2% 3% 1% 2%
United States Australia Canada Germany United Kingdom
Interest in Receiving F&B from Humans or Robots
Primarily from a staff member
Somewhat more from a staff member
Equally from either
Somewhat more from a robotPrimarily from a robotPrimarily from a robot
Somewhat more from a robot
Equally from either
Somewhat more from a staff member
Primarily from a staff member
II. FANS WEREN’T VERY INTERESTED IN RECEIVING THEIR ORDERS FROM A ROBOT
Compared to other technologies, there was minimal interest in being served by a robot. Fans are looking for faster service and perceive that robots will not speed up the process.
III. MOST FANS THINK THAT STADIUMS WILL BECOME TOTALLY CASHLESS
Some stadiums around the world are already making the move to become cashless, where only credit or debit cards, mobile payment, or loaded value cards are accepted, both to increase service speed and simplify operations. While there has certainly been opposition to this in some areas, 66% of German fans expect stadiums to be cashless within five years. Even in the US, where expectations of a cashless experience were lowest, 44% of fans expect not to be using cash at sporting venues by 2024.
12 Stadium of the Future

Behaviors at Sporting Events Over the Last 2 Years
38%
24% 24%
14%
37%
23%27%
13%
42%
25%19%
13%
30%
48%
12% 10%
36%29%
21%13%
Being able to stay in my seat Having quicker transactiontimes
Ability to order fromanywhere in stadium in one
transaction
Having an easier time placingan order
Ways to Improve F&B Experience% Ranked 1st
United States Australia Canada Germany United Kingdom
Used a paperless ticket to enter the venue
(e.g., membership card, mobile phone)
Downloaded a mobile app from a specific
team or venue
Had a loaded value ticket for use on food, beverages
or merchandise
Joined a loyalty rewards program for
a specific team or venue
IV. SPORTS FANS ARE ALREADY USING NEWER TECHNOLOGIES
In most countries, almost half of fans said they had already used a paperless ticket to attend a game. Use of loaded value tickets to buy food, drink or merchandise was lower but nearly a third had downloaded a mobile app from their team or stadium.
44%36%
23%17%
48%
24%
13% 12%
45%
25%
13% 13%
26% 25% 23%
8%
41%
31%
14% 15%
Behaviors at Sporting Events Over the Last 2 YearsUnited States Australia Canada Germany United Kingdom
Stadium of the Future 13

What Do Fans Want from a Loyalty Program? When it comes to loyalty, sports fans set the standard. The ability to show dedicated, unwavering support through thick and thin is part and parcel of following a team. But how do sports teams and venues monitor and reward fans for their loyalty and encourage them to keep coming to games?
Interest in Joining Loyalty Program for F&B Purchases: % somewhat or very interested
I. FANS WANT TO JOIN LOYALTY PROGRAMS
There's a huge opportunity here; in every country we surveyed, over half of the fans expressed an interest in joining a loyalty program, with Germany and the US leading the way on 70% and 69% respectively.
United States
Australia
Canada
Germany
United Kingdom
69%
53%
64%
70%
61%
United States
Australia
Canada
Germany
United Kingdom
Interest in Joining Loyalty Program for F&B Purchases(% somewhat or very interested)
14 Stadium of the Future

Interest in Joining F&B Loyalty Program
II. …BUT PARTICIPATION IS LOW
But what's interesting is that only a tiny proportion of fans has actually joined a loyalty program for their team — just 4% in the US right down to 1% in Canada.
What can stadiums do to get more fans engaged in loyalty programs?
III. FANS WANT LOYALTY APPS MANAGED BY THE TEAM OR STADIUM
Fans remain faithful to their team in all ways — the vast majority prefer a loyalty program managed by their home team or stadium.
9%
19%
13%
9%
14%
17%
25%
23%
17%
22%
25%
30%
27%
35%
33%
43%
23%
37%
35%
28%
4%
3%
1%
3%
3%
United States
Australia
Canada
Germany
United Kingdom
Interest in Joining F&B Loyalty ProgramNot at all interested A little bit interested Somewhat interested Very interested I am already a member
9%
19%
13%
9%
14%
17%
25%
23%
17%
22%
25%
30%
27%
35%
33%
43%
23%
37%
35%
28%
4%
3%
1%
3%
3%
United States
Australia
Canada
Germany
United Kingdom
Interest in Joining F&B Loyalty ProgramNot at all interested A little bit interested Somewhat interested Very interested I am already a member
United States
Australia
Canada
Germany
United Kingdom
Preference for Management of Loyalty Program App: % Selected
32%40%
15%11%
48%
29%
12% 9%
33%40%
13% 12%
63%
22%
9% 6%
59%
23%
8% 9%
The team The stadium The league A third party
Preference for Management of Loyalty Program App% Selected
United States Australia Canada Germany United Kingdom
38%
24% 24%
14%
37%
23%27%
13%
42%
25%19%
13%
30%
48%
12% 10%
36%29%
21%13%
Being able to stay in my seat Having quicker transactiontimes
Ability to order fromanywhere in stadium in one
transaction
Having an easier time placingan order
Ways to Improve F&B Experience% Ranked 1st
United States Australia Canada Germany United Kingdom
The team The stadium The league A third party
Stadium of the Future 15

Effect of Including Options in Loyalty Program: % makes me more interested in loyalty program
Loaded Ticket Preferences
IV. CUSTOMERS ARE VERY INTERESTED IN A VARIETY OF LOYALTY PROGRAM BENEFITS
There is a variety of exciting options available to keep fans engaged and feeling rewarded.
V. LOADED TICKETS ARE A POPULAR FORM OF LOYALTY, AND FANS PREFER TO BE ABLE TO RELOAD TICKET VALUES REMOTELY
Loaded tickets ranked as one of the preferred methods of loyalty, and it makes sense — fans want efficiency and autonomy from a loyalty program. This option is less difficult for fans to use, and allows them to spend as much as they would like on concessions without having to use any additional payment methods.
67% 66% 63%
38%
62%55% 59%
28%
69% 69%62%
32%
57%51% 52%
21%
62% 64%59%
28%
Effect of Including Options in Loyalty Program% makes me more interested in loyalty program
United States Australia Canada Germany United Kingdom
38%
24% 24%
14%
37%
23%27%
13%
42%
25%19%
13%
30%
48%
12% 10%
36%29%
21%13%
Being able to stay in my seat Having quicker transactiontimes
Ability to order fromanywhere in stadium in one
transaction
Having an easier time placingan order
Ways to Improve F&B Experience% Ranked 1st
United States Australia Canada Germany United Kingdom
Ability to accrue points to be used towards merchandise or
concessions
Coupons/deals based on prior purchases I’ve made
Privileges for members (e.g., express lines,
locker access)
Suggestions on what to order based on prior orders
39%
31% 30%
43%37%
61%
69% 70%
57%63%
United States Australia Canada Germany United Kingdom
Loaded Ticket PreferencesReload it at a kiosk in the stadium Reload it remotely
KIOSK KIOSK
KIOSKKIOSK
KIOSK
REMOTEREMOTE
REMOTEREMOTE
REMOTE
United States Australia Canada Germany United Kingdom
16 Stadium of the Future

Conclusion The sports industry is fast-paced and stadiums need to keep up with the growing demands of their fan base. With new technologies emerging to enhance the fan experience, here are some key takeaways:
Fans want to stay in their seats
When it comes to game day experience, fans value the game and their loyalty to their team above all else. They want to be able to enjoy food and beverages at the stadium, but in the most convenient ways possible. Keeping up with the fan of the future requires faster, more convenient service options, whether that be self-ordering and express lines at concessions or in-seat delivery.
Sports fans are open to new technology
According to the data, the majority of stadium-going sports fans are technically savvy and interested in using new technology. If an improved ordering or receiving method will allow them to save time, they are definitely willing to use it.
…They are already using it
Almost half of the fans we spoke to are already using paperless tickets to access the venue. Half also expect stadiums to be cashless within the next few years.
Loyalty programs are a huge opportunity for teams and stadiums to connect with fans
Stadiums have a huge opportunity on their hands with loyalty programs. While tiny numbers of fans are participating in a loyalty program, 63% are very interested in doing so. Increasing this participation could be extremely valuable for stadiums looking to stay engaged with their fan base and encourage further concessions purchases.
1
2
3
4
Stadium of the Future 17

Copyright © 2019, Oracle and/or its affiliates. All rights reserved. This document is provided for information purposes only, and the contents hereof are subject to change without notice. This document is not warranted to be error-free, nor subject to any other warranties or conditions, whether expressed orally or implied in law, including implied warranties and conditions of merchantability or fitness for a particular purpose. We specifically disclaim any liability with respect to this document, and no contractual obligations are formed either directly or indirectly by this document. This document may not be reproduced or transmitted in any form or by any means, electronic or mechanical, for any purpose, without our prior written permission.
Oracle and Java are registered trademarks of Oracle and/or its affiliates. Other names may be trademarks of their respective owners.
Intel and Intel Xeon are trademarks or registered trademarks of Intel Corporation. All SPARC trademarks are used under license and are trademarks or registered trademarks of SPARC International, Inc. AMD, Opteron, the AMD logo, and the AMD Opteron logo are trademarks or registered trademarks of Advanced Micro Devices. UNIX is a registered trademark of The Open Group.
180419
ORACLE CORPORATION
Worldwide Headquarters500 Oracle Parkway, Redwood Shores, CA 94065, USA
Worldwide InquiriesTELE + 1.650.506.7000 + 1.800.ORACLE1
FA X + 1.650.506.7200 oracle.com
CONNECT WITH US
blogs.oracle.com/foodandbeverage facebook.com/OracleFoodBev twitter.com/oraclefoodbev
ORACLE FOOD AND BEVERAGE
Oracle Food and Beverage brings 35 years of experience providing industry-leading technology solutions to sports and entertainment venues worldwide. The company’s point-of-sale platform is the premier food and beverage management solution, enabling operators to deliver an efficient and innovative fan experience throughout their venue. Key features include: point-of-sale, inventory management, loyalty rewards, third-party integrations for in-seat ordering, and more.
Additionally, robust Oracle MICROS hardware is specifically designed and built to withstand the rugged sports and entertainment environment. Options include fixed point-of-sale devices, such as the Workstation 6 Series, the 310 Compact Workstation, and the 700 Series tablets. Oracle Food and Beverage has the solutions to meet your venue’s needs.
TURNKEY INTELLIGENCE
Founded in 1996, Turnkey Intelligence is the foremost market research provider in the fields of sports, live entertainment, and partnership marketing. Our clients include major professional sports leagues such as the NFL and NBA; 50+ professional sports teams across the five major U.S. leagues; professional sports venues; and sponsor/brand companies.