stable isotopes of carbon and nitrogen in the study of ...sethnewsome.org/sethnewsome/ee_files/kelly...
TRANSCRIPT
REVIEW/SYNTHÈSE
Stable isotopes of carbon and nitrogen in thestudy of avian and mammalian trophic ecology
Jeffrey F. Kelly
Abstract: Differential fractionation of stable isotopes of carbon during photosynthesis causes C4 plants and C3 plantsto have distinct carbon-isotope signatures. In addition, marine C3 plants have stable-isotope ratios of carbon that areintermediate between C4 and terrestrial C3 plants. The direct incorporation of the carbon-isotope ratio (13C/12C) ofplants into consumers’ tissues makes this ratio useful in studies of animal ecology. The heavy isotope of nitrogen (15N)is preferentially incorporated into the tissues of the consumer from the diet, which results in a systematic enrichment innitrogen-isotope ratio (15N/14N) with each trophic level. Consequently, stable isotopes of nitrogen have been used pri-marily to assess position in food chains. The literature pertaining to the use of stable isotopes of carbon and nitrogenin animal trophic ecology was reviewed. Data from 102 studies that reported stable-isotope ratios of carbon and (or)nitrogen of wild birds and (or) mammals were compiled and analyzed relative to diet, latitude, body size, and habitatmoisture. These analyses supported the predicted relationships among trophic groups. Carbon-isotope ratios differedamong species that relied on C3, C4, and marine food chains. Likewise, nitrogen-isotope ratios were enriched in terres-trial carnivorous mammals relative to terrestrial herbivorous mammals. Also, marine carnivores that ate vertebrates hadnitrogen-isotope ratios that were enriched over the ratios of those that ate invertebrates. Data from the literature alsoindicated that (i) the carbon-isotope ratio of carnivore bone collagen was inversely related to latitude, which was likelythe result of an inverse relationship between the proportion of carbon in the food chain that was fixed by C4 plants andlatitude; (ii ) seabirds and marine mammals from northern oceans had higher nitrogen-isotope ratios than those fromsouthern oceans; (iii ) the nitrogen-isotope ratios of terrestrial mammals that used xeric habitats were higher than theratios of those that used mesic habitats, indicating that water stress can have important effects on the nitrogen-isotoperatio; (iv) there was no relationship between body mass and nitrogen-isotope ratio for either bone collagen or muscle ofcarnivores; and (v) there was linear covariation between stable-isotope ratios of carbon and nitrogen in marine foodchains (but not in terrestrial C3 or C4 food chains), which is likely a product of increases in carbon-isotope ratio withtrophic level in marine food chains. Differences in stable-isotope composition among trophic groups were detecteddespite variation attributable to geographic location, climate, and analytical techniques, indicating that these effects arelarge and pervasive. Consequently, as knowledge of the distribution of stable isotopes of carbon and nitrogen increases,they will probably become an increasingly important tool in the study of avian and mammalian trophic ecology.27
Résumé: Le fractionnement différentiel des isotopes stables de carbone durant la photosynthèse fait que les plantes C4
et les plantes C3 ont des signatures d’isotopes de carbone différentes. En outre, chez les plantes C3 marines, le rapportentre les isotopes stables de carbone est intermédiaire entre celui des plantes C4 et celui des plantes C3 terrestres.L’intégration directe du rapport des isotopes de carbone (13C/12C) des plantes consommées dans les tissus du consom-mateur rend ce rapport très utile en écologie animale. L’isotope lourd de l’azote (15N) est l’isotope de prédilection et ilest absorbé dans les aliments pour être incorporé dans les tissus du consommateur, ce qui résulte en un enrichissementsystématique du rapport entre les isotopes d’azote (15N/14N) à chaque niveau de la chaîne alimentaire. Conséquemment,des isotopes stables d’azote ont été utilisés surtout pour évaluer les positions dans la chaîne alimentaire. La littératuresur l’utilisation des isotopes stables de carbone ou d’azote en écologie animale trophique a été révisée. Les données de102 études sur les rapports entre les isotopes stables de carbone et (ou) d’azote ont été compilées pour des oiseaux et(ou) des mammifères sauvages et examinées en fonction du régime alimentaire, de la latitude, de la taille du corps etde l’humidité dans l’habitat. Les analyses ont permis de confirmer les hypothèses sur les relations entre les groupestrophiques. Les rapports entre les isotopes de carbone diffèrent chez les espèces qui ont recours aux isotopes C3 et C4
ou qui se nourrissent à même la chaîne alimentaire marine. De même, les rapports entre les isotopes d’azote sont enri-chis chez les mammifères carnivores terrestres par comparaison aux herbivores. De plus, chez les carnivores marins quiconsomment des vertébrés, les rapports entre les isotopes d’azote sont plus élevés que chez ceux qui consomment des
Can. J. Zool.78: 1–27 (2000) © 2000 NRC Canada
1
Received January 28, 1999. Accepted August 10, 1999.
J.F. Kelly. Rocky Mountain Research Station, United States Department of Agriculture Forest Service, 2205 Columbia,SE Albuquerque, NM 87106, U.S.A. (e-mail: jkelly/[email protected]).
J:\cjz\cjz78\cjz-01\Z99-165.vpFriday, February 25, 2000 1:54:19 PM
Color profile: DisabledComposite Default screen

invertébrés. Les données de la littérature indiquent également que (i) le rapport entre les isotopes de carbone dans lecollagène osseux des carnivores est en relation inverse avec la latitude, probablement parce q’il existe une relation in-verse entre la proportion de carbone dans la chaîne alimentaire fixée par les plantes C4 et la latitude, (ii ) les oiseaux etles mammifères marins des mers nordiques ont des rapports entre les isotopes d’azote élevés comparativement à ceuxdes mers australes, (iii ) les rapports entre les isotopes d’azote des mammifères terrestres des milieux secs sont plus éle-vés que ceux des mammifères de milieux mésiques, ce qui indique que le stress hydrique peut avoir des effets impor-tants sur le rapport entre les isotopes d’azote, (iv) il n’y a pas de corrélation entre la masse totale et le rapport entreles isotopes d’azote, ni dans le collagène des os, ni dans les muscles des carnivores, (v) il y a covariation linéaire entreles rapports des isotopes de carbone et d’azote dans les chaînes alimentaires marines (mais pas dans les chaînes terres-tres du C3 ou du C4), ce qui résulte probablement de l’augmentation des rapports entre les isotopes de carbone à mesurequ’augmente le niveau trophique. Des différences dans la composition des isotopes stables prévalent chez les différentsgroupes trophiques et elles sont apparentes en dépit de la variation attribuable au lieu géographique, au climat et auxtechniques d’analyse, ce qui indique qu’il s’agit d’effets dominants, à grande échelle. Conséquemment, à mesure quenous acquérons des informations sur les isotopes stables de carbone et d’azote, ceux-ci sont susceptibles de devenir desoutils de plus en plus importants dans l’étude de l’écologie trophique des oiseaux et des mammifères.
[Traduit par la Rédaction]
Review / SynthèseIntroduction
Stable isotopes of carbon (13C/12C) and nitrogen (15N/14N)have a broad array of applications in ecology (Peterson andFry 1987; Rundel et al. 1989; Lajtha and Michener 1994),one of which is the investigation of the trophic ecology ofwild birds and mammals. Stable isotopes of carbon and ni-trogen have been used to study animal ecology since the late1970s, and their use in studies of wild birds and mammalshas grown rapidly (Fig. 1).
In the 1970s and 1980s, samples of animal tissues had tobe combusted to gas (CO2 for stable-isotope ratios of carbonand N2 for those of nitrogen), often through a series of com-plex and labor-intensive procedures. After combustion, thestable-isotope ratios of the gases were measured with a dual-inlet gas isotope ratio mass spectrometer, as they are today.Because sample processing was labor-intensive and techni-cally difficult, researchers were more limited in the numberof samples they could process. This limitation on samplesize probably curtailed some investigations of the subtle spatialand temporal variation that characterizes much of ecology.In 1988, a system that made it possible to obtain carbon- andnitrogen-isotope ratios from a large number of samples withminimal sample preparation became available commercially(Brand 1996). This system links a combustion furnace witha gas chromatograph interfaced with a dual-inlet gas isotoperatio mass spectrometer (Brand 1996). The important aspectsof this and other advances for ecologists are that (i) fullyautomated measurement of both carbon- and nitrogen-isotope ratios from the same sample has become routine,(ii ) the processing of up to 80 samples per day has becomeroutine (Boutton 1991), and (iii ) the cost of analysis has de-creased.
This technical advance would be of little importance forecologists if data on carbon- and nitrogen-isotope ratios didnot provide unique information. The difficulty of getting un-biased and complete observations of foraging behavior ofwild birds and mammals remains a primary problem in tradi-tional diet studies. In many environments (e.g., fresh water,ocean, dense vegetation), it can be impossible to determinewhat food is being consumed through direct observation.Data obtained from both foraging observations and stomachcontents have inherent biases, such as differential digestibil-ity of prey items, that are difficult to overcome. Moreover,
the complex spatial, temporal, and behavioral variation introphic systems makes linking foraging behavior to preypopulations difficult (Wiens 1984; Morrison et al. 1990;Kelly 1996). Augmenting traditional dietary informationwith stable-isotope data can improve understanding of thetrophic ecology of birds and mammals in many instances.For these reasons, the use of stable-isotope ratios of carbonand nitrogen for understanding avian and mammaliantrophic ecology has continued to grow (Fig. 1).
This review has two objectives: first, to describe what isknown about the natural distributions of stable isotopes ofcarbon and nitrogen as they pertain to the trophic ecology ofbirds and mammals and, second, to use data compiled fromthe literature to quantify these patterns.
Units of measure and standardsThe ratio of stable isotopes is expressed most often in
delta (δ) notation:
[1] δ = ((Rsample/Rstandard) – 1) × 1000
whereδ is the isotope ratio of the sample relative to a stan-dard.Rsampleand Rstandardare the fractions of heavy to lightisotopes in the sample and standard, respectively. One issubtracted from theRsample/Rstandardfraction so that sampleswith a lower ratio of heavy isotopes than the standard have anegative value and those with higher ratios of heavy isotopesthan the standard have a positive value. This number is thenmultiplied by 1000 so that theδ notation is in units of partsper thousand (‰), often referred to as “per mil notation.”For carbon, the international standard is the Peedee Belem-nite (PDB) marine fossil limestone formation from SouthCarolina (Craig 1957). The standard for nitrogen is atmo-spheric nitrogen (Ehleringer and Rundel 1989). Most plantand animal tissues have a negative value ofδ13C and a posi-tive value ofδ15N. That is, they have a lower13C/12C ratiothan PDB and a higher15N/14N ratio than atmospheric nitro-gen.
Literature compilation and descriptionStable-isotope ratios of carbon or nitrogen for wild birds
or mammals were sought for statistical analysis. Key Wordswere used to search the BIOSIS electronic data base (1986–1997) and the Zoological Record (1993–1997). Recent stud-
© 2000 NRC Canada
2 Can. J. Zool. Vol. 78, 2000
J:\cjz\cjz78\cjz-01\Z99-165.vpFriday, February 25, 2000 1:54:20 PM
Color profile: DisabledComposite Default screen

ies were reviewed to generate the following keywords forthe literature search: bird, mammal, stable isotope, stablecarbon, stable nitrogen, carbon-13, nitrogen-15,13C, 15N,δ15N, δ13C, delta15N, and delta13C. Because the focus of thisreview was wild birds and mammals, studies of rats (Rattusrattus) and pigs (Sus scrofa), which commonly were medicallaboratory studies of domesticated animals, were not in-cluded. The only laboratory studies retained in the data setwere those of species that occur primarily in the wild. Refer-ences cited in each of these studies were reviewed to findany additional studies missed in the previous search steps.Thus, the vast majority of published studies are included.These procedures produced 102 studies of carbon- and (or)nitrogen-isotope ratios in birds and (or) mammals (Appen-dix, Table A1).
Of the 102 studies included in the review, 60 reportedstable-isotope ratios of carbon from mammals, while 41 re-ported stable-isotope ratios of carbon from birds (Appendix,Table A1). Thirty-five studies reported stable-isotope ratiosof nitrogen for mammals, while 32 studies reported stable-isotope ratios of nitrogen for birds. Over half the studies(53) reported values for both carbon and nitrogen. Of the 37studies that dealt primarily with birds, 25 were concernedwith a single order. Most of the 12 studies that did not con-centrate on a single order dealt with seabirds. Fifty-six stud-ies focused on mammals and 9 survey or food-web studiesdealt with both birds and mammals.
Most (91) of the 102 studies reported descriptive fielddata and 12 reported experimental data; 3 studies reportedcombinations of experimental and descriptive data from thefield and laboratory (Appendix, Table A1). Of the experi-ments, laboratory data were reported for 11 and field datafor 3; the majority of studies were concerned with diet (59)or food-web structure (10). The primary concern of a sur-prisingly large number of studies (11) was the use of isotopedata for tracking the locations of animals. Most frequently,the studies of birds (21) were done in North America. Far
more studies of mammals were done in North America (26)and Africa (18) than on other continents.
Particularly evident was the lack of data on passerinebirds and rodents. These orders are the most speciose intheir respective classes, yet they provide a small fraction ofthe data reported. The lack of data on these groups is per-haps related to their small body size. There seems to be aclear bias toward conducting isotope research on large-bodied birds and mammals. Most data were from either ter-restrial mammalian herbivores or marine carnivores. Dataavailable from terrestrial mammals were heavily skewed to-ward δ13C values of bone collagen, whereas data from avianand mammalian marine carnivores were slightly skewed to-ward δ15N values of muscle (Table 1).
Delta13C andδ15N values for wild birds or mammals thatwere feeding under natural conditions were compiled fromas many of these studies as possible. When more than one
© 2000 NRC Canada
Review / Synthèse 3
Fig. 1. Histogram of the number of studies in which stable iso-topes of carbon and nitrogen were used to investigate the trophicecology of wild birds and (or) mammals.
Environment Diet
δ13C value δ15N value δ13C–δ15N pairs
Bone Muscle Bone Muscle Bone Muscle
MammalsTerrestrial C3 plant 35 4 26 3 25 0
C4 plant 18 2 9 0 9 0Invertebrate 4 3 4 0 4 0Vertebrate 16 1 14 1 14 0Omnivorous 4 0 4 0 4 0
Marine Herbivorous 1 0 0 0 0 0Invertebrate 8 8 8 11 8 7Vertebrate 11 10 10 12 9 10
BirdsTerrestrial C3 plant 2 3 1 2 1 2
Invertebrate 1 6 1 2 1 2Vertebrate 3 1 3 0 3 0
Marine Invertebrate 3 9 9 14 2 8Vertebrate 8 15 16 28 7 13
Grand total 114 62 105 73 87 42
Table 1. The number of species in each environment and diet category for which data onδ13Cand δ15N values in bone collagen and muscle tissue were found.
J:\cjz\cjz78\cjz-01\Z99-165.vpFriday, February 25, 2000 1:54:26 PM
Color profile: DisabledComposite Default screen

measurement was available for a species, only the mean ofthe largest sample from a single study was used. Some anal-yses required onlyδ13C or δ15N values, while others requiredpaired δ13C and δ15N values from the same organism. Foreach analysis, data from the study with the largest applicablesample size were used. That is, theδ13C, δ15N, and pairedvalues used for a given species may each come from differ-ent studies (Appendix, Table A2).
Diets could have been classified simply by plotting theisotope data and then using a clustering algorithm to creategroupings. Without a priori information on diet, however,this approach would not have provided a strong test of theability of isotopes to distinguish among animals from differ-ent trophic groups. In contrast, using an independent datasource to classify the diets of animals prior to examining thepatterns in isotope ratios provides a rigorous test of the abil-ity of stable isotopes to distinguish among trophic groups.For a priori diet classifications, Nowak (1991) and Ehrlichet al. (1988) were used for mammals and birds, respectively.Species were divided into herbivores, carnivores, and omni-vores. Only species that eat both plant and animal tissueswere considered omnivores. Herbivores were further catego-rized as eating C3 plants or C4 plants (C3 plants use theenzyme Rubisco (RuBP) to fix CO2 as part of the Calvincycle. C4 plants fix CO2 with phosphoenolpyruvate (PEP)carboxylase prior to its entry into the Calvin cycle), and car-nivores that eat primarily vertebrates were distinguishedfrom those that eat primarily invertebrates. The food chainof each species was categorized as depending on C3, C4, ormarine plants (Appendix, Table A2). Scientific names notprovided in the text are included in Table A2.
The moistness of a species’ habitat, the species’ bodysize, and the latitude where the sample was collected wereestimated. All estimates were obtained without reference tothe isotope data. Habitat descriptions provided in the litera-ture and in Nowak (1991) were used to categorize each ter-restrial mammal’s habitat as either mesic or xeric. Anyspecies whose habitat was known to be restricted in accessto permanent fresh water was categorized as mesic. Forsome species, no habitat description that allowed its classifi-cation as either xeric or mesic was found. For as many sam-ples as possible, latitude was assigned on the basis of study-site descriptions. To estimate body mass, Dunning (1993)was used for birds and Silva and Downing (1995) for mam-mals (Appendix, Table A2).
Only analyses of bone collagen and muscle are presented,because they were the only tissues commonly reported in theliterature for both birds and mammals (Table 1). Of the mea-surements reported on bone and muscle tissues,δ13C valuesfor bone collagen were most common, whereasδ13C andδ15N values for muscle tissue, particularly from terrestrialmammals, were comparatively rare. Therefore, most analy-ses presented compare results for bone and muscle in marinebirds and mammals but only report results for bone in terres-trial mammals.
Whether lipids were extracted prior to isotope analyseswas also recorded. If there was any mention of treatmentwith ether, chloroform, sodium hydroxide, or a Soxhlet ap-paratus, samples were categorized as lipid-extracted. If lipidextraction was not mentioned or implied, samples were con-sidered to have been untreated.
Statistical analysesWhen the independent variables were categorical, one-
way analyses of variance (ANOVAs) were used to detect dif-ferences among categories. When ANOVAs indicated signif-icant variation (P < 0.05) and there were more than twocategories, least-significant-difference post-hoc tests were used.When the independent variable was continuous, linear re-gression analyses were employed. Residuals of all analyseswere examined for heteroscedasticity, and Kolmogorov–Smirnov tests for normality were used. Anα level of 0.05was used to evaluate the significance of all tests.
Use of stable isotopes of carbon andnitrogen as dietary tracers
Carbon
HistoryEhleringer and Rundel (1989) attribute the first use of sta-
ble isotopes of carbon in natural materials to Neir andGulbransen (1939). Most natural materials haveδ13C valuesbetween 0 and –110‰, although most components of terres-trial, marine, and freshwater ecosystems haveδ13C valuesbetween 0 and –40‰ (Boutton 1991). Studies of the tissuesof living organisms began in the early 1950s (Ehleringer andRundel 1989). The first hint of the utility of carbon isotopesfor the study of trophic ecology came when the difference inthe isotope signatures of C3 and C4 plants was discovered(Bender 1971; Smith and Epstein 1971). This utility isderived from two properties: first, some sources of dietarycarbon have distinct carbon-isotope signatures, and second,the isotope signature of a food is incorporated into the con-sumer’s tissues.
Photosynthesis creates distinct carbon-isotope signaturesWith regard to animal ecology, the primary process that
creates sources with identifiable carbon-isotope signatures isphotosynthesis. Stable isotopes of carbon are used most of-ten to distinguish carbon fixed by terrestrial C3 plants fromthat fixed by C4 plants or marine C3 plants. Distinguishingbetween C4 plants and plants that use a third photosyntheticpathway, crassulacean acid metabolism (CAM), is difficultwith carbon isotopes only, but can be done if they are usedin combination with hydrogen isotopes (Sternberg 1989;Ehleringer 1991; Lajtha and Marshall 1994). Because CAMplants are relatively sparsely distributed and have not re-ceived much attention relative to animal ecology (but seeFleming et al. 1993), they are not discussed further here.
Carbon fixed by terrestrial C3 plants (δ13C = –27‰, range =–35 to –21‰) can be distinguished from that fixed by C4plants (δ13C = –13‰, range = –14 to –10‰), because itcontains relatively few 13C isotopes (Boutton 1991;Ehleringer 1991). This difference is due to discriminationagainst 13C isotopes by the primary CO2-fixing enzyme(RuBP) of C3 plants. In C4 plants, the primary enzyme forCO2 fixation (PEP carboxylase) does not discriminateagainst13C as strongly as that of C3 plants (O’Leary 1981,1988; Farquhar et al. 1989). While marine phytoplanktonuses the C3 photosynthetic pathway, its carbon-isotope sig-nature is significantly heavier (–22‰) than that of terrestrialC3 plants. There is some uncertainty as to the cause of thisdifference, but potential explanations include the use of bi-
© 2000 NRC Canada
4 Can. J. Zool. Vol. 78, 2000
J:\cjz\cjz78\cjz-01\Z99-165.vpFriday, February 25, 2000 1:54:26 PM
Color profile: DisabledComposite Default screen

carbonate as a carbon source in marine systems and theslower diffusion of CO2 in water, which might counteractenzymatic discrimination (O’Leary 1988; Boutton 1991).Slow diffusion of CO2 has been shown to cause similarlyhigh δ13C values in freshwater C3 plants in static environ-ments (Raven 1987). Because phytoplankton has lighterδ13Cvalues than many inshore plants (e.g., seagrasses, averageδ13C = –10‰, range = –15 to –3‰), inshore carbon sourcescan sometimes be distinguished from pelagic sources (Fry1983; Fry and Sherr 1989; Boutton 1991; Hobson et al.1994; Jarman et al. 1997).
Carbon-isotope ratios of consumers’ tissuesGiven that foods can vary considerably in their carbon-
isotope signatures, the utility of these isotopes for trophicstudies hinges on the relationship between the isotope com-position of a consumer’s diet and that of its tissues. DeNiroand Epstein (1978a) were the first to provide evidence thatthe carbon-isotope composition of a consumer was a directreflection of its diet. They documented this pattern by feed-ing eight species of invertebrates and mice (Mus musculus)diets of known composition and then measuring the isotopecomposition of their tissues. DeNiro and Epstein (1978a)also demonstrated that whole bodies of consumers were en-riched in 13C only slightly over their diet (i.e., the diet–consumer fractionation of carbon isotopes was less than2‰). Finally, they reported that the difference in the carbon-isotope values between individual tissues and diet dependedon both the diet and the tissue type.
Ensuing studies have confirmed and refined these generalpatterns. The results of a variety of experiments have corrob-orated the primary conclusion that the carbon-isotope com-position of birds (von Schirnding et al. 1982; Mizutani et al.1991, 1992; Hobson and Clark 1992a, 1992b, 1993; Hobsonet al. 1993; Hobson 1995) and mammals (Tieszen et al.1983; Hobson et al. 1996; Hilderbrand et al. 1996) is a di-rect reflection of whether they depend on C3, C4, or marinefood chains.
Additional studies have verified Epstein and DeNiro’s(1978a) finding that enrichment inδ13C values of whole-body samples relative to diet is slight (Haines and Montague1979; Rau and Anderson 1981). The use of biopsy tech-niques, coupled with the large body size of most birds andmammals, makes whole-body samples for these taxa un-usual; rather, data usually pertain to specific tissues. Experi-mental studies on mammals indicated that theδ13C values ofmost tissues were within 5‰ of the diet (DeNiro and Ep-stein 1981; Tieszen et al. 1983; Tieszen and Boutton 1989;Hobson et al. 1996). In birds, experimental studies indicatedthat most tissues were enriched by 1–6‰ over the diet (e.g.,Mizutani et al. 1991, 1992; Hobson and Clark 1992b). Whileenrichment of specific tissues of birds and mammals variedamong studies, there were a few general patterns: (i) lipidstended to be highly depleted in13C, (ii ) bone collagen andintegument (skin, hair, and feathers) tended to be among themost enriched tissues in both birds and mammals, and(iii ) there was only slight (1–2‰) enrichment of muscle tis-sue and whole-body samples over the diet (DeNiro andEpstein 1978a; Tieszen et al. 1983; Tieszen and Boutton1989; Gearing 1991; Mizutani et al. 1991, 1992; Hobson andClark 1992b; Hilderbrand et al. 1996; Hobson et al. 1996).
Field studies of mammals have indicated that bone colla-gen is enriched by 4–6‰ over local vegetation (e.g., van derMerwe 1982; Ambrose 1993). In these cases, however, theactual composition of the diets was unknown. In other fieldstudies that have attempted to useδ13C values to constructavian and mammalian food webs, it has been found thatcarbon is generally only slightly enriched (1–2‰) with eachtrophic step (Schoeninger and DeNiro 1984; Ambrose andDeNiro 1986; Hobson and Welch 1992; Hobson et al. 1994).Systematic enrichment inδ13C values in marine food chainshas been reported (Rau et al. 1983; Boutton 1991). Moststudies, however, indicated that in marine environments,13Cenrichment occurred at low trophic levels but not amongvertebrate consumers (Rau et al. 1983; Wada et al. 1987; Fry1988; Hobson and Welch 1992; Hobson 1993; Hobson et al.1994).
The minor stepwise trophic enrichment of the carbon-isotope ratio that has been documented among vertebrateconsumers limits its use in assessing trophic level. However,this characteristic enhances the utility of carbon-isotope ratiosfor tracking carbon sources through a food chain (Petersonand Fry 1987; Michener and Schell 1994). Specifically, be-cause there is little enrichment with increase in trophic level,the carbon-isotope signature of secondary and tertiary con-sumers should reflect the source of carbon (C3, C4, or ma-rine plants) at the base of their food chain. For example,Schoeninger and DeNiro (1984) demonstrated that for ter-restrial and marine carnivores, carbon-isotope signatureswere indistinguishable from those of their primary prey. Fur-thermore, Ambrose and DeNiro (1986) showed that amongterrestrial species, carbon-isotope signatures can indicatewhether carnivores had fed on herbivores that had eaten pri-marily C3 or C4 plants.
Testing trophic patterns with carbon-isotope data fromfield studies
The utility of δ13C values for identifying the carbonsources used by consumers is most evident from the numer-ous field studies in which they have been used to distinguishC3 from C4 food chains (Teeri and Schoeller 1979; Ambroseand DeNiro 1986; Alisauskas and Hobson 1993; Fleming etal. 1993; Herrera et al. 1993; MacFadden and Cerling 1994;MacFadden 1997; Alisauskas et al. 1998) or between terres-trial (presumed C3) and marine food chains (Schoeningerand DeNiro 1984; Hobson 1987, 1990; Mizutani et al. 1990;Hobson and Sealy 1991; Angerbjorn et al. 1994; Hilder-brand et al. 1996; Ben-David et al. 1997a, 1997b; Bearhopet al. 1999). Data compiled from such studies indicate thatδ13C values of bone collagen clearly distinguished betweenterrestrial mammalian herbivores that relied primarily on C3plants and those that relied primarily on C4 plants (Table 2).Similarly, the δ13C values of bone collagen varied signifi-cantly among carnivores that relied on C4, C3, and marinetrophic chains. Bone from species that relied on C4 foodchains was enriched by 8–10‰ over bone from species thatrelied on C3 food chains. Theδ13C values of carnivorous ma-rine mammals were intermediate between those of C3 and C4food chains; theδ13C values of marine species were signifi-cantly heavier (6.3‰) than those of carnivores in C3 foodchains (Table 2). Similarly, theδ13C values of marine birdswere significantly enriched over those of birds from terres-
© 2000 NRC Canada
Review / Synthèse 5
J:\cjz\cjz78\cjz-01\Z99-165.vpFriday, February 25, 2000 1:54:27 PM
Color profile: DisabledComposite Default screen

trial C3 food chains for both bone (5.2‰) and muscle tissue(4.5‰; Table 2).
There was no significant enrichment inδ13C values be-tween mammalian herbivores and carnivores in C3 and C4food chains. In fact, carnivores in C3 food chains were, onaverage, depleted in13C relative to herbivores by 1.5‰ (Ta-ble 2). In C4 trophic chains, carnivores were enriched by0.8‰ relative to herbivores (Table 2). These slight differ-ences support the findings of numerous studies: there is littleenrichment inδ13C values with increase in trophic level, atleast in terrestrial mammals.
Large-scale gradients in carbon-isotope ratiosThere are a number of well-known biogeographic patterns
in C3, C4, and marine plants that create gradients inδ13C val-ues over large scales. Delta13C values of C3 terrestrial plantshave been shown to be inversely correlated with latitude(Korner et al. 1991). In addition, the prevalence of C4 plantsdeclines with increasing latitude and altitude (Teeri andStowe 1976; Tieszen et al. 1979). Furthermore, a latitudinaldecline inδ13C values has been documented in marine plank-ton (Sackett et al. 1965; Rau et al. 1982; Goericke et al.1994). Some studies have shown patterns which suggest alatitudinal gradient in theδ13C values of consumers’ tissuesand authors have speculated that this pattern might be re-lated to the latitudinal gradients inδ13C values of C3 plants,in the proportion of C3 to C4 plants, and inδ13C values ofmarine phytoplankton (Rau et al. 1982; Chamberlain et al.1997).
Data compiled for this review also demonstrate thatδ13Cvalues of bone collagen of carnivorous marine mammals,carnivorous terrestrial mammals, and carnivorous seabirdstrack these latitudinal declines inδ13C values (Figs. 2a–2c).Surprisingly, this pattern was not found in the bone collagenof terrestrial herbivores (R2 = 0.02,F[1,46] = 1.7,P = 0.19) orwhen the herbivores were divided into those that ate C3plants and those that ate C4 plants (Fig. 2d). Intraspecificpatterns in two herbivores for which samples were reason-ably large were also examined. African elephants,Loxodonta africana, showed a decrease inδ13C values withlatitude, while there was no significant pattern among white-tailed deer,Odocoileus virginianus(Figs. 2e and 2f). Neithermammalian (R2 = 0.18, F[1,15] = 3.3, P = 0.09) nor avian(R2 = 0.05,F[1,22] = 1.0,P = 0.32) carnivorous marine mam-mals showed significant variation inδ13C values of muscletissue with latitude. Too few data were available to test forthis relationship in other groups.
The latitudinal decline inδ13C values of carnivorous terres-trial mammal bone is likely a direct result of similar patterns
in plants at the base of the food chain. The lack of similarvariation among herbivorous mammals, except African ele-phants, may seem to contradict the pattern in carnivores, butthere is a single explanation that reconciles these patterns.Herbivorous mammals generally restrict their diet to eitherC3 or C4 plants, which is the basis of the ecological classifi-cation of browsers and grazers (see below). Within C3plants, the latitudinal cline inδ13C values is slight relative tothe distinction between C3 and C4 plants (Korner et al.1991). Thus, at both the inter- and the intra-specific level,herbivorous mammals with diets restricted to C3 plants (e.g.,white-tailed deer) would be expected to show only a slightlatitudinal cline inδ13C values. Inter- and intra-specific pat-terns in those unusual herbivorous mammals that readily eatboth C3 and C4 plants (e.g., African elephant) should, how-ever, show relatively steep latitudinal clines. In contrast tomost herbivorous mammals, carnivorous mammals are unlikelyto select prey on the basis of whether they eat primarily C3or C4 plants. Thus, carnivores would seem more likely thanherbivores to reflect the average composition of C3 and C4plants at a given locale. In this way, incorporation of preyfrom both C3 and C4 food chains in the diets of carnivoresbut not in the diets of herbivores may explain the latitudinalpatterns evident in Fig. 2. Of course, this speculation shouldnot be accepted without testing. In general, more research isneeded to quantify the trophic linkages that maintain latitu-dinal gradients inδ13C values. In particular, large-scale intra-and inter-specific studies that use systematic study designsto investigate the relationships betweenδ13C values, diet,and latitude would be useful.
Effects of lipid extraction on carbon-isotope ratiosDifferences in the analytical treatment of samples creates
some difficulties in comparingδ13C values among studies. Inparticular, lipids are sometimes extracted from tissues priorto stable-isotope analysis. The rationale for lipid extractionis that it is depleted in13C relative to other tissues. Lipidsare most often removed with a Soxhlet apparatus, using ei-ther chloroform or ether, although sodium hydroxide hasbeen shown to be equally effective (Ambrose 1993). The ef-fects of lipid extraction onδ13C values are greater in lipid-rich tissues (e.g., muscle, liver) than in lipid-poor tissues(e.g., hair; Tieszen and Boutton 1989). Lipids haveδ13C val-ues about 6–12‰ greater than bone or muscle (DeNiro andEpstein 1977; McConnaughey and McRoy 1979; Ambrose1990). Alexander et al. (1996) corrected for the lipid contentof muscle by multiplying the percent lipid content of the tis-sue by the difference between theδ13C values of lipid ex-tracted and non-extracted tissues. This approach suggests
© 2000 NRC Canada
6 Can. J. Zool. Vol. 78, 2000
Tissue
Carbon source
Trophicgroup C3 C4 Marine F P
Mammals Herbivore Bone –18.3±4.2 –10.1±3.8 48.9 <0.001Carnivore Bone –19.8±2.1a –9.3±3.1a –13.5±1.7a 62.6 <0.001
Birds Carnivore Bone –21.3±3.9 –16.1±2.4 10.2 <0.007Carnivore Muscle –23.3±4.8 –18.8±2.2 12.0 <0.001
Note: Values are given as the mean ± SD. Sample sizes are provided in Table 1.aLeast-significant-difference post-hoc tests indicate that this value differs significantly from all other
values in this row.
Table 2. Delta13C values of birds and mammals by trophic group.
J:\cjz\cjz78\cjz-01\Z99-165.vpFriday, February 25, 2000 1:54:28 PM
Color profile: DisabledComposite Default screen

that a tissue containing 20‰ lipid would have aδ13C value2.4‰ greater when lipids were extracted than when the tis-sue contained lipids (0.2 × –12‰). This example is probablyan extreme case, and real differences will usually be smaller(Alexander et al. 1996).
Among data compiled for this review, the use of lipid ex-traction appears to be idiosyncratic. For instance, lipids wereextracted from nearly all muscle-tissue samples of marinebirds (21 of 24), probably because muscle is a lipid-rich tis-sue. Lipids were extracted from half the muscle samples ofmarine mammals (10 of 18) and the bone samples of terres-
trial herbivorous mammals (24 of 53), but from few bonesamples of marine mammals (2 of 19). These data indicatethat only for marine birds is there evidence of a significantdifference between lipid-extracted and untreated tissuesamong studies (Table 3). The difference between lipid-extracted and untreated muscle (1.3‰) and bone (1.4‰) wassmaller than the standard deviation for most samples (Ta-ble 3). The most powerful test was for differences in theδ13C values of bone collagen among terrestrial C3 herbi-vores. Interestingly, theδ13C value of the lipid-extractedbone was lighter than that of untreated bone, although not
© 2000 NRC Canada
Review / Synthèse 7
Fig. 2. Relationships between carbon-isotope ratios and latitude for carnivorous terrestrial mammals (A), carnivorous marine mammals(B), carnivorous marine birds (C), all herbivorous terrestrial mammals (D), African elephants (E), and white-tailed deer (F). The datafor white-tailed deer are from Cormie and Schwarcz (1994). Equations for the regression lines are given in the formY = slope (±SE)X + intercept (±SE). Data from north and south latitudes are pooled in A–D.
J:\cjz\cjz78\cjz-01\Z99-165.vpFriday, February 25, 2000 1:55:03 PM
Color profile: DisabledComposite Default screen

significantly so (F[16,19] = 3.5, P = 0.07; Table 3). In fact,average values for extracted tissues were lighter than thosefor non-extracted tissues in most (5 of 7) groups of mam-mals examined (Table 3). This pattern likely indicates thatfor the purpose of making broad comparisons among spe-cies, lipid extraction does not create an overwhelming bias.Nonetheless, it is a systematic source of variation that maymake detection of ecological patterns more difficult. There-fore, standardization of lipid-extraction techniques wouldundoubtedly add clarity to investigations of animal ecologythat rely on isotopic tracers.
Using carbon-isotope ratios of tissues as time-integratedsamples
Feeding experiments have shown that the turnover rate ofisotopes in a particular tissue is a product of that tissue’smetabolic rate (Tieszen et al. 1983; Hobson and Clark1992a). Thus, different tissues provide dietary informationthat is integrated over different time scales (Hobson andClark 1992a; Hilderbrand et al. 1996; Hobson et al. 1996).In Quail (Coutrinix japonica), for instance, blood had higherturnover rates of carbon isotopes than muscle, which in turnhad higher turnover rates than bone (Hobson and Clark1992a). Also, the isotope composition of hair and feathersreflects the diet at the time they were grown. This property,and that they can be sampled without killing the animal,have made these tissues particularly attractive for isotopestudies (Mizutani et al. 1990, 1992; Kelly and Finch 1998;Schoeninger et al. 1997, 1998).
Carbon-isotope ratios of browsers’ versus grazers’ tissuesSome authors of carbon-isotope studies have divided ter-
restrial herbivorous mammals on the basis of whether they
eat grass (grazers) or other plants (browsers) rather thanwhether they eat C3 or C4 plants. For instance, Ambrose andDeNiro (1986), DeNiro and Epstein (1978b), and Vogel(1978) found a clear distinction between browsers and graz-ers in regions of Africa where C4 grasslands predominate,because grazers eat C4 grasses and browsers eat C3 forbs andshrubs. This situation is somewhat unusual in that few biomesare dominated by C4 plants (e.g., Teeri and Stowe 1976).When grazers have access only to grasslands dominated byC3 grasses, which is more typical, there is no difference inδ13C values between browsers and grazers. For example, thegrasslands of Alberta are dominated by C3 grasses and inthis environment Chisholm et al. (1986) found that the bonecollagen of grazers (e.g., the bison,Bison bison) had δ13Cvalues between –18 and –20‰. Cormie and Schwarcz(1994) examined the bone collagen of a browser (white-tailed deer) from most regions of North America. The subsetof these deer from Alberta hadδ13C values between –18 and–22‰. The nearly total overlap in isotope signature forbison and white-tailed deer in Alberta illustrates that withregard to isotope composition, the important distinction iswhether a herbivorous mammal eats C3 or C4 plants and notwhether it grazes or browses.
Nonetheless, for some investigations, the important eco-logical distinction is whether a species browses or grazes. Intheory, because nearly all C4 plants are grasses, grazers canrely on either C3 or C4 carbon sources, whereas browsers areconfined to C3 sources. When 54 terrestrial herbivorousmammal were classified as browsers, grazers, or mixed feed-ers (one species was a granivore), all 23 browsers relied onC3 plants (δ13C = –19.7 ± 2.7‰) as expected, as did 12 of 13mixed feeders (δ13C = –17.3 ± 5.1‰). Similarly 17 of 20grazers ate C4 plants (δ13C = –9.7 ± 3.0‰). Because of a
© 2000 NRC Canada
8 Can. J. Zool. Vol. 78, 2000
Trophic group Food chain
Lipid treatment
Extracted Non-extracted
MuscleMammals Carnivore Marine ns –18.0±0.7 (10) –18.3±0.9 (8)
C3 — –18.7±1.8 (4)Herbivore C3 –28.7 (1) –13.2±3.3 (3)
C4 — –13.7±3.5 (2)Birds Carnivore Marine* –18.7±1.7 (21) –20.0±5.2 (3)
C3 –18.9 (1) –24.0±4.8 (6)Herbivore C3 –22.9±2.6 (2) –24.4 (1)
Bone collagenMammals Carnivore Marine ns –16.0±0.4 (2) –13.±1.5 (17)
C3 ns –20.7±1.5 (9) –17.1±1.2 (3)C4 –9.3±3.1 (8) —
Herbivore C3 ns –19.4±3.5 (16) –17.3±4.8 (19)C4 ns –9.2±1.7 (8) –10.7±4.8 (10)
Omnivore C3 –19.7±1.5 (3) –19.3 (1)Birds Carnivore Marine* –15.1±0.2 (3) –16.5±2.7 (8)
C3 — –21.3±3.9 (4)Herbivore C3 — –21.9±0.9 (2)
Note: Values are given as the mean ± SD; numbers in parentheses are sample sizes. Differences betweenlipid-extracted and non-extracted values were evaluated witht tests when samples were adequate; ns,nonsigificant (P > 0.05); *, P < 0.05.
Table 3. Comparison ofδ13C values of tissues from which lipids were or were not extracted.
J:\cjz\cjz78\cjz-01\Z99-165.vpFriday, February 25, 2000 1:55:04 PM
Color profile: DisabledComposite Default screen

lack of data for C3 grazers, the practical difference betweenbrowser versus grazer and C3 versus C4 classification sys-tems for data in this review is minimal.
Nitrogen
Sources with distinct nitrogen-isotope signaturesMost natural materials haveδ15N values between –20 and
+45‰ (DeNiro and Hastorf 1985; Mizutani and Wada 1988;Mizutani et al. 1986; Peterson and Fry 1987; Ehleringer andRundel 1989). As was the case for carbon isotopes, the util-ity of nitrogen isotopes in animal ecology relies on their dis-tribution in foods and how they are incorporated into thetissues of consumers. Unlike carbon isotopes, there is no sin-gle process, like photosynthesis, that creates a large isotopicfractionation of nitrogen isotopes in plants that can be tracedthrough food webs. Moreover, comparingδ15N values acrossfood webs or large spatial scales is problematic, particularlyin terrestrial environments. The fundamental problem is thatterrestrial plants vary widely inδ15N values. Peterson andFry (1987) reported foliageδ15N values of between –8 and+3‰, but more positive values (up to 18‰) have been re-ported for desert plants (Shearer et al. 1983; Schoeningerand DeNiro 1984). This 26‰ variation (–8 to +18‰) is de-rived from a number of sources, primarily (i) the large varia-tion in δ15N values of soils (δ15N = 9.2 ± 2.1‰, range =2–12‰; Shearer et al. 1978; Shearer and Kohl 1989) and(ii ) the systematic enrichment of deep-rooted plants overthose with shallow roots (Virginia et al. 1989).
Despite this variation, it has been shown that nitrogen iso-topes are useful for identifying the contributions of severaltypes of plants to food chains. On average,δ15N values ofmarine phytoplankton (average 7‰, range 1–16‰) tend tobe enriched by about 4‰ relative to those of terrestrialplants (average 3‰, range –8 to +18‰; Schoeninger andDeNiro 1984; Sealy et al. 1987; Ambrose 1993), with theexception of plants in some marine environments wherenitrogen fixation plays an important role (e.g., coral reefsand salt marshes; Capone and Carpenter 1982; Schoeningerand DeNiro 1984). Among terrestrial plants,δ15N values ofnitrogen-fixing plants (average 1‰, range –7 to +7‰) aredepleted by 2‰, on average, relative to non-nitrogen-fixingplants (Virginia and Delwiche 1982; Schoeninger andDeNiro 1984; Virginia et al. 1989; Lajtha and Marshall1994). This difference in nitrogen fixation in plants also hasconsequences for consumers. For instance, Schoeninger etal. (1998) showed that the percentage of time spent foragingon nitrogen-fixing legumes was directly related to theδ15Nvalues of white-footed sportive lemurs (Lepilemur luecopus).Thus, despite the large variation inδ15N values of plants,there are some general patterns that can be useful for identi-fying sources of nitrogen in consumers’ diets in special cir-cumstances. Typically, however, it is difficult to identify therelative contribution of various plant types to food chains onthe basis of nitrogen-isotope ratios.
Fractionation of nitrogen isotopes in digestion andexcretion
In terms of total isotope composition, the nitrogen iso-topes in an animal’s tissues are ultimately determined bythose absorbed from the diet minus those excreted as by-
products of metabolism in the form of nitrogenous wastes.The primary source of nitrogen for most animals are aminoacids derived from digested proteins. In mammals at least,these amino acids enter the bloodstream and are taken up bycells, primarily in the liver or muscle, where many of themare converted to ammonia and carbohydrate through deamin-ation or transamination. Ammonia is then converted to urea,diffused into the blood, and eventually excreted via the kid-neys. Carbohydrates produced by deamination and transamin-ation can be used to produce energy, CO2, and water, orto build fatty acids. Most amino acids not used for energy orfat synthesis are used to build proteins (Vander et al. 1975;Eckert et al. 1988).
It is during the absorption of nitrogen isotopes from thediet and conversion of amino acids to other compounds thatisotope fractionation is thought to take place (Minagwa andWada 1984; Schoeninger and DeNiro 1984; Ambrose andDeNiro 1986). That ingested food has a higher15N/14N ratiothan feces is evidence that14N is preferentially removedfrom the diet in the digestive tract of mammals (Steele andDaniel 1978; Sutoh et al. 1987). Alone, this fractionationwould lead to lowerδ15N values in the tissues of mammalsthan in their diets. Working in opposition to this process,however, is the fractionation of nitrogen isotopes during theproduction of urea or uric acid. Urea and uric acid havelower δ15N values than mammalian tissues, indicating that14N is preferentially excreted (Steele and Daniel 1978;Minagwa and Wada 1984). If isotope fractionation duringthe absorption of nitrogen from the diet was greater thanduring the production of nitrogenous wastes, thenδ15N val-ues in tissues of consumers would be depleted relative to thediet. In reality, the opposite is true. The fractionation associ-ated with the production of nitrogenous waste appears to begreater than that associated with the absorption of nitrogenfrom the diet. That is, consumers’ tissues tend to be enrichedin δ15N values relative to the diet rather than depleted(Minagwa and Wada 1984; Ambrose 1993; Michener andSchell 1994).
Nitrogen-isotope ratios of consumers’ bodiesThe primary utility of nitrogen-isotope ratios for animal
ecology lies in their relationship with trophic level. DeNiroand Epstein (1981) were the first to experimentally docu-ment an average of 3‰ (range 0–10‰) enrichment inδ15Nvalues for whole-body samples over the diet. Because oflimited data from whole-body samples of birds and mam-mals, the estimate of 3‰ enrichment of whole-body sampleshas not received much verification in these taxa. Studies ofother taxa, however, have generally supported the 3‰ en-richment inδ15N for whole bodies over diet (e.g., Minagwaand Wada 1984; Peterson and Fry 1987). Experiments thathave determined the diet–tissue fractionation of nitrogen iso-topes for birds and mammals show that most tissues are en-riched over the diet by 1–5‰ (DeNiro and Epstein 1981;Mizutani et al. 1991, 1992; Hobson and Clark 1992a; Hob-son et al. 1996). These studies suggest some patterns innitrogen-isotope fractionation among tissues. Feathers, bone,and skin tend to be more enriched in15N than most tissues,and δ15N values of muscle tissue more closely reflect thoseof the whole body than do other tissues.
© 2000 NRC Canada
Review / Synthèse 9
J:\cjz\cjz78\cjz-01\Z99-165.vpFriday, February 25, 2000 1:55:04 PM
Color profile: DisabledComposite Default screen

In a number of food-web studiesδ15N values havebeen successfully used to describe trophic relationships(Schoeninger and Deniro 1984; Sealy et al. 1987; Hobsonand Montevecchi 1991; Rau et al. 1992; Hobson and Welch1992; Bocherens et al. 1995; Hobson et al. 1997c; Kwak andZedler 1997). In combination, these results and those of lab-oratory experiments support the generalization that, on aver-age, a 3–4‰ enrichment inδ15N values accompanies eachtrophic step (Peterson and Fry 1987; Tieszen et al. 1989;Ambrose 1993; Koch et al. 1994; Michener and Schell1994).
Based on these patterns, herbivores are expected to havelower δ15N values than carnivores. Furthermore, if trophicchains of carnivores that eat vertebrates are longer thanthose of carnivores that eat invertebrates, as is often implied,higher δ15N values would be expected in carnivores that eatvertebrates. Finally, since omnivores, as defined for thisstudy, eat both plants and animals, they should haveδ15Nvalues intermediate between those of herbivores and carni-vores. Koch et al. (1994), however, suggest that omnivoresshould occupy the highest trophic level.
Data from the literature indicate thatδ15N values of carni-vores that ate invertebrates (12.6‰) were significantly en-riched over herbivores, omnivores, and carnivores that atevertebrates by 5.5, 3.4, and 5.5‰, respectively (Fig. 3).These data demonstrate that values for both groups of carni-vores were significantly enriched over those for herbivoresas expected. Contrary to expectations, however, carnivoresthat ate invertebrates had higherδ15N values than those thatate vertebrates. Also at odds with predictions was the findingthat omnivores had the lowestδ15N values of any trophicgroup.
Results from marine species were more consistent withpredictions. Marine mammals that ate vertebrates had signif-icantly higherδ15N values than those that ate invertebrates inboth bone (2.7‰ enrichment) and muscle (4.9‰ enrich-
ment) (Fig. 4a). Marine birds that ate vertebrates also hadsignificantly higherδ15N values than those that ate inverte-brates in bone (3.1‰ enrichment) but not in muscle(Fig. 4b).
Seabirds and marine mammals from oceans at north-temperate and arctic latitudes had higherδ15N values thanthose from oceans at south-temperate and antarctic latitudes.Data for all but two species of seabirds (White-tailedTropicbird and Magnificent Frigatebird) were collected at ei-ther >30°N or >30°S. For bone and muscle, species fromnorthern latitudes generally had greaterδ15N values (bone,16.3 ± 2.1‰,N = 19; muscle, 14.5 ± 2.1‰,N = 27) thanthose from southern latitudes (bone, 10.9 ± 0.7‰,N = 5; t =6.4, P < 0.001; muscle, 8.1 ± 3.1‰,N = 15; t = 7.1, P <0.001). This pattern was also evident for mammalian muscle,where northern species had higherδ15N values (14.8 ±3.0‰, N = 18) than southern species (10.0 ± 5.4‰,N = 5;t = 2.7, P < 0.02). Only 1 of 18 bone samples of marinemammals was from a southern latitude.
The trophic-level differences between species that ate ver-tebrates and invertebrates were still evident when a distinc-tion was made between northern and southern oceans.Seabirds from northern oceans that ate vertebrates hadhigher
© 2000 NRC Canada
10 Can. J. Zool. Vol. 78, 2000
Fig. 3. Nitrogen-isotope ratios (mean ± SD) of bone collagen fortrophic groups of terrestrial mammals. Carnivores were dividedinto those that ate vertebrates and those that ate invertebrates.An ANOVA was used to test for overall significance of variationin δ15N values among groups (F[3,53] = 7.8, P < 0.001). Differ-ences between specific groups were tested with least significantdifference post hoc tests. Different letters denote trophic groupsthat differ significantly inδ15N values. Numbers above the ab-scissa are sample sizes.
Fig. 4. Differences in nitrogen-isotope ratios (mean ± SD) ofbone collagen and muscle between trophic groups of marinemammals (A) and marine birds (B). Within each tissue type,comparisons (t tests) were made between species that eat verte-brates and those that eat invertebrates. Samples that differ signif-icantly are labeled with different letters. Numbers below theabscissa are sample sizes.
J:\cjz\cjz78\cjz-01\Z99-165.vpFriday, February 25, 2000 1:55:20 PM
Color profile: DisabledComposite Default screen

δ15N values (muscle: 15.4 ± 0.9‰,N = 15; bone: 17.2± 1.3‰,N = 13) than those that ate invertebrates (muscle: 13.2 ±2.4‰, N = 12; t = 2.9,P < 0.02; bone: 14.2± 2.0‰, N = 6;t = 3.4,P < 0.02). Likewise, mammals from northern oceansthat ate vertebrates had higherδ15N values for muscle (16.6 ±2.4‰, N = 10) than those that ate invertebrates (12.6 ±2.1‰, N = 8; t = 3.7, P < 0.002). There were too few sam-ples in some diet categories to do similar tests for speciesfrom southern oceans. In total, these results support the no-tion that there is a trophic-level difference between marinespecies that eat vertebrates and those that eat invertebrates,at least in northern oceans. The clear results obtained frommarine species contrast with the complex picture for terres-trial mammals. This difference is certainly due, in part, toclimatic, topographic, and edaphic influences of terrestrialenvironments onδ15N values of plants and consumers.
Water and nutritional stressThe degree to which nitrogen isotopes are fractionated in
the production of nitrogenous waste appears to be related, atleast in mammals, to the water stress experienced (Ambroseand DeNiro 1986; Sealy et al. 1987; Cormie and Schwarcz1996). The effect of water stress is thought to contribute tothe finding of an inverse relationship between annual rainfalland theδ15N values of consumers’ tissues (Heaton et al.1986; Sealy et al. 1987; Cormie and Schwarcz 1996). Alikely explanation for this pattern is that the fractionation ofnitrogen isotopes is greater in the production of concentratednitrogenous waste than in the production of dilute nitroge-nous waste, which would result in elevatedδ15N values(Ambrose 1991, 1993; Cormie and Schwarz 1996). The highδ15N values found in plants of arid regions (Shearer et al.1983; Heaton 1987) may also contribute to this pattern.There has been some debate about the effects of water stresson the δ15N values for ruminants and hind-gut fermentersthat can recycle urea to the gut as a source of nitrogen formicrobial digestion. Sealy et al. (1987) have argued that thisrecycling of urea would result in higherδ15N values in water-stressed ruminants. Ambrose (1991, 1993) argued that, with-out regard to recycling nitrogen, water stress alone wouldincreaseδ15N values in ruminants because of increased frac-tionation during the production of urea. Moreover, Ambrose(1991, 1993) reasoned that in protein-stressed herbivores,the recycling of nitrogen to the gut will reduceδ15N values,because the nitrogen in urea has lowerδ15N values than bodytissues and14N is preferentially absorbed during digestion.
Nutritional stress also causes an elevation inδ15N values.That is, catabolism of the body’s proteins during periods ofstress may elevateδ15N values (Hobson and Clark 1992b;Ambrose 1993; Cormie and Schwarcz 1996). This patternmay help to explain the finding thatδ15N values can varywidely both among species fed the same diet and among in-dividuals of the same species that are fed different diets(DeNiro and Epstein 1981). Hobson and Clark (1992b)showed that the fractionation factor for most tissues wasgreater (up to 6‰) for American Crows (Corvus brachy-ramphus) fed plant-based diets than for those fed fish (perch,Perca flavescens). Birds that were fed fish also gained moremass than those fed plant diets, which supports the conclu-sion that food stress caused these differences in fractionationbetween diet and tissues. This conclusion was later upheld ina combined experimental and field study that documentedenrichedδ15N values in birds subjected to nutritional stress(Hobson et al. 1993).
Data compiled for this review demonstrate enrichment inδ15N values in species that use xeric habitats relative to thosethat use mesic habitats. ANOVA indicated that there was anoverall effect of habitat moisture on theδ15N values of bonecollagen for terrestrial mammals (Table 4). Even with thiseffect accounted for, however, the differences inδ15N valuesamong trophic levels remained significant (Table 4). For her-bivores and carnivores that ate vertebrates, the use of xerichabitats was associated with significantly enrichedδ15N val-ues (2.4‰) relative to species that used mesic habitats (Ta-ble 5). The few carnivores that ate invertebrates showed thesame qualitative trend (4.8‰ enrichment). These valuesagree roughly with the few enrichment values available fromcontrolled experiments on nutritional stress (Hobson 1993).In South Africa, an enrichment of 2.4‰ in bone collagenwould be indicative of a 200-mm difference in annual rain-fall (Sealy et al. 1987).
The difference in enrichment inδ15N values of xeric spe-cies over mesic species was identical for herbivores and car-nivores, which seems to support the urine-concentrationmodel of Ambrose (1991, 1993) rather than the recyclingmodel of Sealy et al. (1987). That is, if recycling of urea tothe gut of herbivores is a major cause of the enrichment inδ15N values in species in xeric environments, then the en-richment in herbivores should have been greater than that incarnivores, which it was not. It may also be possible, thoughit seems unlikely, that carnivores from xeric habitats eatnothing but herbivores from xeric habitats, which would pro-
© 2000 NRC Canada
Review / Synthèse 11
Source ofvariance
Type III sumof squares df
Meansquare F P
Trophic level 110.2 3 36.7 7.8 <0.001Habitat moisture 65.3 1 65.3 13.9 <0.001Interaction 4.9 2 2.5 0.5 <0.597Error 235.4 50 4.7
Table 4. Results of an ANOVA in which theδ15N value for bonecollagen of terrestrial mammals was the dependent variable andtrophic level (herbivore, omnivore, or carnivore) and habitatmoisture (xeric or mesic) were the independent class variables;carnivores were divided into those that eat vertebrates and thosethat eat invertebrates. Diet
Habitat moisture
PMesic Xeric ta
Herbivore 6.3±2.2 (23) 8.7±2.8 (12) 2.6 0.02Omnivore 6.3±1.0 (4) —Carnivore
Invertebrates 10.2±1.1 (2) 15.0±3.2 (2) 1.9 0.26Vertebrates 8.2±1.9 (8) 10.6±0.7 (8) 3.4 0.01
Note: Values are given as the mean ± SD; numbers in parentheses aresample sizes.
aResults oft tests for effects within each trophic group.
Table 5. Delta15N values of bone collagen of terrestrial mam-mals by trophic level; carnivores are divided into those that eatvertebrates and those that eat invertebrates.
J:\cjz\cjz78\cjz-01\Z99-165.vpFriday, February 25, 2000 1:55:21 PM
Color profile: DisabledComposite Default screen

© 2000 NRC Canada
12 Can. J. Zool. Vol. 78, 2000
duce an enrichment in these xeric-habitat carnivores similarto that found here. Also, since nothing is known about theprotein content of the diets of the animals in the sample,Ambrose’s (1991, 1993) prediction that recycling of nitro-gen would lower theδ15N values of protein-stressed herbi-vores could not be tested here. Overall, these data seem tosupport the notion that increased fractionation of nitrogenisotopes in the production of concentrated urine leads to ele-vatedδ15N values in species in xeric environments.
Given thatδ15N enrichment associated with habitat mois-ture is nearly as great as that associated with each trophicstep, it is important for researchers to remain vigilant con-cerning the potential of nutritional and water stress to influ-ence nitrogen-isotope ratios. Attempting to minimize varia-tion due to nutritional status or climatic conditions would beworthwhile. Research aimed at determining the extent towhich δ15N values of consumers in arid regions are a prod-uct of (i) elevated15N concentrations in plants, (ii ) increasedfractionation in the production of nitrogenous wastes, or(iii ) catabolism of body protein during periods of nutritionalstress would also be useful.
Age, body size, and nitrogen-isotope ratioLaboratory studies of nitrogen isotopes often use young
animals that are still growing. Therefore, applying the re-sults of these studies to field situations requires that isotopecontent and fractionation in young animals be equivalent tothose of older, larger animals eating the same diet. Conse-quently, the relationship between body size and nitrogen-isotope ratio is of interest. A further rationale for examiningthe relationship between body size andδ15N values is that inmany taxa, body size is a determinant of diet (e.g., Wernerand Gilliam 1984). Among carnivores particularly, largerspecies tend to occupy a higher trophic position. Thus,trophic position is, in part, dependent on body size (Peters1983; Brown and Lomilino 1998). Relatively few studieshave tested for the effects of age and body size onδ15N val-ues. They have generally looked for intraspecific patternsand, with the exception of Rau et al. (1982), found none(Minagwa and Wada 1984; Sutoh et al. 1987; Schell et al.1989a, 1989b; Hobson and Clark 1992b; Best and Schell1996). The lack of evidence for intraspecific relationshipsbetween body size andδ15N values does not rule out the po-tential for meaningful interspecific variation, particularlysince it is interspecific variation in body size that has beenlinked most closely to trophic position.
Data compiled for this review show no evidence of an in-crease inδ15N values with body size. In bone collagen ofseabirds, there was a significant decrease inδ15N with in-creasing body mass (Table 6). The relationship betweenδ15N
values and body mass in marine mammals was also nearlysignificantly negative. These patterns are the opposite of theexpected increase inδ15N values with body mass. Therewere no patterns in the relationship betweenδ15N values andbody mass for muscle tissue of seabirds or marine mammals.The significant pattern found in bone of seabirds dissolves ifthe samples are divided into those from northern oceans andthose from southern oceans. Thus, it seems that the differ-ence in isotope signatures of species in northern and south-ern oceans is primarily responsible for the negative relation-ship detected between body mass andδ15N values. Thus,the primary result is that there is no detectable increasein δ15N values with body mass at the interspecific level,which is similar to results obtained in previous studies.
Covariation of carbon- and nitrogen-isotope ratiosThere is evidence that the relative enrichment in15N in
consumers’ tissues is not independent of their enrichment in13C. Mizutani et al. (1991) showed a positive linear relation-ship betweenδ15N and δ13C values among the tissues of asingle Cormorant (δ15N = 1.11 ×δ13C + 32.3;R2 = 0.85). Ifthere is a mechanism that linksδ15N and δ13C values withinan individual, it remains unclear. In some instances, a similarpattern has been found at the intraspecific level as well(Sealy et al. 1987; Vogel et al. 1990a; Cormie and Schwarz1994; Hilderbrand et al. 1996). Sealy et al. (1987) reported alinear relationship betweenδ15N andδ13C values in humans(δ15N = 0.57 ×δ13C + 22.5;R2 = 0.19). There is also limitedevidence for linear positive associations betweenδ15N andδ13C values within food webs and across broader species as-semblages (Bocherens et al. 1995; Ben-David et al. 1997a).Thackeray et al. (1993) reported separate relationships forAfrican browsers (δ15N = 1.03 ×δ13C + 28.7;R2 = 0.40) andgrazers (δ15N = –1.09 ×δ13C – 3.5;R2 = 0.71). If these rela-tionships are purely a product of trophic-level enrichment, aslope of between 1.5 and 4 would be expected (i.e., a 3–4‰increase inδ15N values divided by a 1–2‰ increase inδ13Cvalues); all the reported relationships have slopes that areshallower than this range.
Interpretation of these relationships is difficult, particu-larly at the interspecific level. Data compiled for this reviewshow a significant positive relationship betweenδ15N andδ13C values in bone collage (Fig. 5, Table 7). As is also clearfrom Fig. 5, however, this trend is primarily due to the rela-tionship between the isotope signatures of C3, C4, and ma-rine plants. That is, the positive relationship betweenδ15Nand δ13C values in bone collage is likely the result of C3plants growing in more mesic areas than C4 plants. Becauseδ15N values are greater in species in xeric environments (Ta-
Environment ClassSlope(x ± SE)
Intercept(x ± SE) R2 df F Pslope
Bone Marine Birds –2.41±0.93 22.3±2.8 0.24 21 6.7 0.02Mammals –0.57±0.28 18.7±1.7 0.21 16 4.2 0.06
Terrestrial Mammals –0.43±0.65 11.6±2.6 0.03 16 0.4 0.52Muscle Marine Birds 0.68±1.19 10.2±3.3 0.01 39 0.3 0.57
Mammals –1.17±0.97 20.5±5.7 0.02 21 1.5 0.24
Table 6. Results of linear regression analyses in which theδ15N values of carnivores were usedas the dependent variable and body mass was used as the independent variable.
J:\cjz\cjz78\cjz-01\Z99-165.vpFriday, February 25, 2000 1:55:22 PM
Color profile: DisabledComposite Default screen
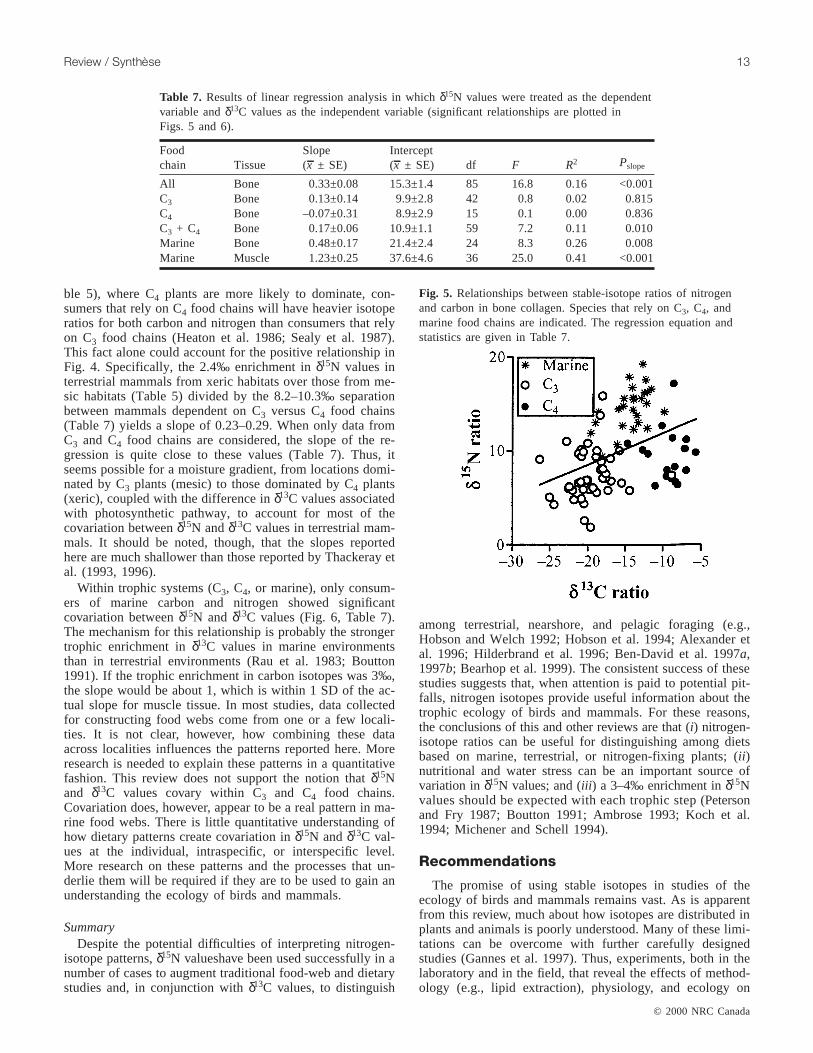
ble 5), where C4 plants are more likely to dominate, con-sumers that rely on C4 food chains will have heavier isotoperatios for both carbon and nitrogen than consumers that relyon C3 food chains (Heaton et al. 1986; Sealy et al. 1987).This fact alone could account for the positive relationship inFig. 4. Specifically, the 2.4‰ enrichment inδ15N values interrestrial mammals from xeric habitats over those from me-sic habitats (Table 5) divided by the 8.2–10.3‰ separationbetween mammals dependent on C3 versus C4 food chains(Table 7) yields a slope of 0.23–0.29. When only data fromC3 and C4 food chains are considered, the slope of the re-gression is quite close to these values (Table 7). Thus, itseems possible for a moisture gradient, from locations domi-nated by C3 plants (mesic) to those dominated by C4 plants(xeric), coupled with the difference inδ13C values associatedwith photosynthetic pathway, to account for most of thecovariation betweenδ15N andδ13C values in terrestrial mam-mals. It should be noted, though, that the slopes reportedhere are much shallower than those reported by Thackeray etal. (1993, 1996).
Within trophic systems (C3, C4, or marine), only consum-ers of marine carbon and nitrogen showed significantcovariation betweenδ15N and δ13C values (Fig. 6, Table 7).The mechanism for this relationship is probably the strongertrophic enrichment inδ13C values in marine environmentsthan in terrestrial environments (Rau et al. 1983; Boutton1991). If the trophic enrichment in carbon isotopes was 3‰,the slope would be about 1, which is within 1 SD of the ac-tual slope for muscle tissue. In most studies, data collectedfor constructing food webs come from one or a few locali-ties. It is not clear, however, how combining these dataacross localities influences the patterns reported here. Moreresearch is needed to explain these patterns in a quantitativefashion. This review does not support the notion thatδ15Nand δ13C values covary within C3 and C4 food chains.Covariation does, however, appear to be a real pattern in ma-rine food webs. There is little quantitative understanding ofhow dietary patterns create covariation inδ15N andδ13C val-ues at the individual, intraspecific, or interspecific level.More research on these patterns and the processes that un-derlie them will be required if they are to be used to gain anunderstanding the ecology of birds and mammals.
SummaryDespite the potential difficulties of interpreting nitrogen-
isotope patterns,δ15N valueshave been used successfully in anumber of cases to augment traditional food-web and dietarystudies and, in conjunction withδ13C values, to distinguish
among terrestrial, nearshore, and pelagic foraging (e.g.,Hobson and Welch 1992; Hobson et al. 1994; Alexander etal. 1996; Hilderbrand et al. 1996; Ben-David et al. 1997a,1997b; Bearhop et al. 1999). The consistent success of thesestudies suggests that, when attention is paid to potential pit-falls, nitrogen isotopes provide useful information about thetrophic ecology of birds and mammals. For these reasons,the conclusions of this and other reviews are that (i) nitrogen-isotope ratios can be useful for distinguishing among dietsbased on marine, terrestrial, or nitrogen-fixing plants; (ii )nutritional and water stress can be an important source ofvariation inδ15N values; and (iii ) a 3–4‰ enrichment inδ15Nvalues should be expected with each trophic step(Petersonand Fry 1987; Boutton 1991; Ambrose 1993; Koch et al.1994; Michener and Schell 1994).
Recommendations
The promise of using stable isotopes in studies of theecology of birds and mammals remains vast. As is apparentfrom this review, much about how isotopes are distributed inplants and animals is poorly understood. Many of these limi-tations can be overcome with further carefully designedstudies (Gannes et al. 1997). Thus, experiments, both in thelaboratory and in the field, that reveal the effects of method-ology (e.g., lipid extraction), physiology, and ecology on
© 2000 NRC Canada
Review / Synthèse 13
Foodchain Tissue
Slope(x ± SE)
Intercept(x ± SE) df F R2 Pslope
All Bone 0.33±0.08 15.3±1.4 85 16.8 0.16 <0.001C3 Bone 0.13±0.14 9.9±2.8 42 0.8 0.02 0.815C4 Bone –0.07±0.31 8.9±2.9 15 0.1 0.00 0.836C3 + C4 Bone 0.17±0.06 10.9±1.1 59 7.2 0.11 0.010Marine Bone 0.48±0.17 21.4±2.4 24 8.3 0.26 0.008Marine Muscle 1.23±0.25 37.6±4.6 36 25.0 0.41 <0.001
Table 7. Results of linear regression analysis in whichδ15N values were treated as the dependentvariable andδ13C values as the independent variable (significant relationships are plotted inFigs. 5 and 6).
Fig. 5. Relationships between stable-isotope ratios of nitrogenand carbon in bone collagen. Species that rely on C3, C4, andmarine food chains are indicated. The regression equation andstatistics are given in Table 7.
J:\cjz\cjz78\cjz-01\Z99-165.vpFriday, February 25, 2000 1:55:28 PM
Color profile: DisabledComposite Default screen

patterns of natural variation in stable-isotope ratios, haveparticular value. More direct linkages between controlledlaboratory studies and descriptive field studies have the po-tential to increase our understanding of the trophic ecologyof wild animals (Gannes et al. 1997). In addition, advancesin our understanding continue to accelerate with technologi-cal advances. Because it is now possible to examine the spa-tial and temporal variation that is so central to ecology,studies that use stable isotopes to document this variationshould be a high priority. In essence, the ideal would be tohave an isotope geographic information system, that is, spa-tial and temporal data on isotope ratios of soil, water, plants,and animals which would provide context for further study.To this end, the potential for using museum collections toexamine variation across large spatial and temporal scaleswould seem to be enormous (e.g., Hilderbrand et al. 1996).
On another front, the potential to examine the isotope ratiosof specific compounds, such as essential versus nonessentialamino acids, appears to open new areas of investigation thathave been heretofore untapped (Macko 1994).
A large number of the studies reviewed here report dataon species that have some legal protection because they arerare. These investigations are aided by the potential to usebiopsy techniques to obtain samples without jeopardizingthe health of the animal; these techniques should be em-ployed wherever possible. The use of stable-isotope tech-niques to aid in the conservation of these species should belauded and supported. It has become increasingly clear thatstable-isotope technology can provide information relevantto contaminant effects (Macko and Ostrom 1994; Jarman etal. 1997) and current versus historical diets (Hilderbrand etal. 1996), as well as basic trophic information that could beof value in many conservation efforts. There are numerousother applied topics where stable-isotope data could improveour ecological understanding: the effects of exotic or pestspecies on nutrient flows, the influences of agricultural de-velopment on habitat use, and the effects of domestic preda-tors on urban wildlife, for instance. To expedite work onsuch topics, collaboration between scientists with expertisein applied conservation issues and those with a backgroundin isotope ecology should be fostered.
Acknowledgements
Credit for what is useful in this review belongs to thosewho spent 20 years collecting the data presented; errors infact or interpretation are mine. I thank I. Gilmour, K.A.Hobson, R. King, and P.T. Stapp for comments on the manu-script, V. Atudorei, J.L. Cartron, Z.D. Sharp, and T. Turnerfor discussions about isotope ecology, and the staff of theRocky Mountain Research Station for support.
References
Abend, A.G., and Smith, T.D. 1995. Differences in ratios of stableisotopes of nitrogen in long-finned pilot whales (Globicephalusmelas) in the western and eastern North Atlantic. Int. Counc.Explor. Sea J. Mar. Sci.52: 837–841.
Abend, A.G., and Smith, T.D. 1997. Differences in stable isotoperatios of carbon and nitrogen between long-finned pilot whales(Globicephalus melas) and their primary prey in the westernNorth Atlantic. Int. Counc. Explor. Sea J. Mar. Sci.54: 500–503.
Alexander, S.A., Hobson, K.A., Gratto-Trevor, C.L., and Diamond,A.W. 1996. Conventional and isotopic determinations ofshorebird diets at an inland stopover: the importance of inverte-brates andPotamogeton pectinatustubers. Can. J. Zool.74:1057–1068.
Alisauskas, R.T., and Hobson, K.A. 1993. Determination of lessersnow goose diets and winter distribution using stable isotopeanalysis. J. Wildl. Manag.57: 49–54.
Alisauskas, R.T., Klaas, E.E., Hobson, K.A., and Ankney, C.D.1998. Stable-carbon isotopes support use of adventitious colorto discern winter origins of lesser snow geese. J. Field Ornithol.69: 262–268.
Ambrose, S.H. 1990. Preparation and characterization of bone andtooth collagen for isotopic analysis. J. Archaeol. Sci.17: 431–451.
© 2000 NRC Canada
14 Can. J. Zool. Vol. 78, 2000
Fig. 6. Relationships between stable-isotope ratios of nitrogenand carbon for muscle (A) and bone collagen (B) of species thatrely on marine food chains. Birds and mammals are both dividedinto those that eat vertebrates and those that eat invertebrates.Regression equations and statistics are given in Table 7.
J:\cjz\cjz78\cjz-01\Z99-165.vpFriday, February 25, 2000 1:55:33 PM
Color profile: DisabledComposite Default screen

Ambrose, S.H. 1991. Effects of diet, climate and physiology on ni-trogen isotope abundances in terrestrial food webs. J. Archaeol.Sci. 18: 293–317.
Ambrose, S.H. 1993. Isotopic analysis of paleodiets: methodologi-cal and interpretive considerations.In Investigations of ancienthuman tissue.Edited by M.K. Sanford. Gordon and Breach,Langhorne, Pa. pp. 59–130.
Ambrose, S.H., and DeNiro, M.J. 1986. The isotopic ecology ofEast African mammals. Oecologia,69: 395–406.
Ames, A.L., Van Vleet, E.S., and Sackett, W.M. 1996. The use ofstable carbon analysis for determining the dietary habits of theFlorida manatee,Trichechus manatus latirostris. Mar. Mamm.Sci. 12: 555–563.
Angerbjorn, A., Hersteinsson, P., Liden, K., and Nelson, E. 1994.Dietary variation in Arctic foxes (Alopex lagopus)—an analysisof stable carbon isotopes. Oecologia,99: 226–232.
Bada, J.L., Peterson, R.O., Schimmelmann, A., and Hedges,R.E.M. 1990. Moose teeth as monitors of environmental isoto-pic parameters. Oecologia,82: 102–106.
Bearhop, S., Thompson, D.R., Waldron, S., Russell, I.C., Alexan-der, G., and Furness, R.W. 1999. Stable isotopes indicate the ex-tent of freshwater feeding by cormorantsPhalacrocorax carboshot at inland fisheries in England. J. Appl. Ecol.36: 75–84.
Ben-David, M., Flynn, R.W., and Schell, D.M. 1997a. Annualchanges in diets of martens: evidence from stable isotope analy-sis. Oecologia,111: 280–291.
Ben-David, M., Hanley, T.A., Klien, D.R., and Schell, D.M. 1997b.Seasonal changes in diets of coastal and riverine mink: the roleof spawning Pacific salmon. Can. J. Zool.75: 803–811.
Bender, M.M. 1971. Variations in the13C/12C ratios of plants in re-lation to the pathway of carbon dioxide fixation. Phytochemistry(Oxf.), 10: 1239–1244.
Best, P.B., and Schell, D.M. 1996. Stable isotopes in southern rightwhale (Eubalaena australis) baleen as indicators of seasonalmovements, feeding and growth. Mar. Biol. (Berl.),124: 483–494.
Bocherens, H., Fizet, M., and Mariotti, A. 1994. Diet, physiology,and ecology of fossil mammals as inferred from stable carbonand nitrogen isotope biogeochemistry: implications for Pleisto-cene bears. Palaeogeogr. Palaeoclimatol. Palaeoecol.107: 213–225.
Bocherens, H., Fogel, M.L., Tuross, N., and Zeder, M. 1995.Trophic structure and climatic information from isotopic signa-tures in Pleistocene cave fauna of southern England. J.Archaeol. Sci.22: 327–340.
Borobia, M., Gearing, P.J., Simard, Y., and Gearing, J.N. 1995.Blubber fatty acids of finback and humpback whales from thegulf of St. Lawrence. Mar. Biol. (Berl.),122: 341–353.
Boutton, T.W. 1991. Stable carbon isotope ratios of natural materi-als II: atmospheric, terrestrial, marine and freshwater environ-ments.In Carbon isotope techniques.Edited byD.C. Colemanand B. Fry. Academic Press, San Diego. pp. 173–186.
Brand, W.A. 1996. High precision isotope ratio monitoring tech-niques in mass spectrometry. J. Mass Spectrom.31: 225–235.
Broman, D., Naf, C., Rolff, C. Zebuhr, Y., Fry, B., and Hobbie, J.1992. Using ratios of stable nitrogen isotopes to estimatebioaccumulation and flux of polychlorinated dibenzo-p-dioxins(PCDDs) and dibenzofurans (PCDF) in two food chains fromthe North Baltic. Environ. Toxicol. Chem.11: 331–345.
Brown, J.N., and Lomolino, M.V. 1998. Biogeography. SinauerAssocates Inc., Sunderland, Mass.
Capone, D.G., and Carpenter, E.J. 1982. Nitrogen fixation in themarine environment. Science (Washington, D.C.),217: 1140–1142.
Chamberlain, C.P., Blum, J.D., Holmes, R.T., Feng, X., Sherry,T.W., and Graves, G.R. 1997. The use of isotope tracers foridentifying populations of migratory birds. Oecologia,109:132–141.
Chisholm, B., Driver, J., Dube, S., and Schwarcz, H.P. 1986. As-sessment of prehistoric bison foraging and movement patternsvia stable-carbon isotopic analysis. Plains Anthropol.31: 193–205.
Collier, K.J., and Lyon, G.L. 1991. Trophic pathways and diet ofblue duck (Hymenolaimus malacorhynchos) on ManganuiateaoRiver: a stable carbon isotope study. N.Z. J. Mar. FreshwaterRes.25: 181–186.
Cormie, A.P., and Schwarcz, H.P. 1994. Stable isotopes of nitrogenand carbon of North American white-tailed deer and implica-tions for paleodietary and other food web studies. Palaeogeogr.Palaeoclimatol. Palaeoecol.107: 227–241.
Cormie, A.P., and Schwarcz, H.P. 1996. Effects of climate on deerboneδ15N andδ13C: lack of precipitation effects onδ15N for ani-mals consuming low amounts of C4 plants. Geochim. Cosmo-chim. Acta,60: 4161–4166.
Craig, H. 1957. Isotopic standards for carbon and oxygen and cor-rection factors for mass-spectrometric analysis of carbon diox-ide. Geochim. Cosmochim. Acta,12: 133–149.
DeNiro, M.J., and Epstein, S. 1977. Mechanisms of carbon isotopefractionation associated with lipid synthesis. Science (Washing-ton, D.C.),197: 261–263.
DeNiro, M.J., and Epstein, S. 1978a. Influence of diet on the dis-tribution of carbon isotopes in animals. Geochim. Cosmochim.Acta, 42: 495–506.
DeNiro, M.J., and Epstein, S. 1978b. Carbon isotopic evidence fordifferent feeding patterns in two hyrax species occupying thesame habitat. Science (Washington, D.C.),210: 906–908.
DeNiro, M.J., and Epstein, S. 1981. Influence of diet on the distri-bution of nitrogen isotopes in animals. Geochim. Cosmochim.Acta, 45: 341–351.
DeNiro, M.J., and Hastorf, C. 1985. Alteration of15N/14N and13C/12C ratios of plant matter during the initial stages ofdiagenesis: studies using archaeological specimens from Peru.Geochim Cosmochim. Acta,49: 97–115.
DeNiro, M.J., Schoeninger, M.J., and Hastorf, C.A. 1985. Effect ofheating on the stable carbon and nitrogen isotope ratios of bonecollagen. J Archaeol. Sci.12: 1–7.
Des Marais, D.J., Mitchell, J.M., Meinschein, W.G., and Hayes,J.M. 1980. The carbon isotope biogeochemistry of the individ-ual hydrocarbons in bat guano and the ecology of insectivorousbats in the region of Carlsbad, New Mexico. Geochim.Cosmochim. Acta,44: 2075–2086.
Dunning, J.B. 1993. CRC handbook of avian body masses. CRCPress. Boca Raton, Fla.
Eckert, R., Randall, D., and Augustine, G. 1988. Animal physiol-ogy: mechanisms and adaptations. W.H. Freeman and Co., SanFrancisco.
Ehleringer, J.R. 1991.13C/12C fractionation and its utility in terres-trial plant studies.In Carbon isotope techniques.Edited byD.C.Coleman and B. Fry. Academic Press, San Diego. pp. 187–201.
Ehleringer, J.R., and Rundel, P.W. 1989. Stable Isotopes: history,units, and instrumentation.In Stable isotopes in ecological re-search.Edited by P.W. Rundel, J.R. Rundel, and K.A. Nagy.Springer-Verlag, New York. pp. 1–16.
Ehrlich, P.R., Dobkin, D.S., and Wheye, D. 1988. The birdershandbook. Simon and Schuster, New York.
Farquhar, G.D., Ehleringer, J.R., and Hubick, K.T. 1989. Carbonisotope discrimination and photosynthesis. Annu. Rev. PlantPhysiol. Plant Mol. Biol.40: 503–537.
© 2000 NRC Canada
Review / Synthèse 15
J:\cjz\cjz78\cjz-01\Z99-165.vpFriday, February 25, 2000 1:55:34 PM
Color profile: DisabledComposite Default screen
© 2000 NRC Canada
16 Can. J. Zool. Vol. 78, 2000
Fleming, T.H., Nuñez, R.A., and Sternberg, L.S.L. 1993. Seasonalchanges in diets of migrant and non-migrant nectarivorous batsas revealed by carbon stable isotope analysis. Oecologia,94:72–75.
Furness, R.W., and Camphuysen, C.J. 1997. Seabirds as monitorsof the marine environment. Int. Counc. Explor. Sea J. Mar Sci.54: 726–737.
Fry, B. 1983. Fish and shrimp migrations in the northern Gulf ofMexico analyzed using stable C, N, and S isotope ratios. Fish.Bull. 81: 789–801.
Fry, B. 1988. Food web structure on Georges Bank from stable C,N, and S isotopic compositions. Limnol. Oceanogr.33: 1182–1190.
Fry, B., and Sherr, E.B. 1989.δ13C measurements as indicators ofcarbon flow in marine and freshwater ecosystems.In Stable iso-topes in ecological research.Edited byP.W. Rundel, J.R. Rundel,and K.A. Nagy. Springer-Verlag, New York. pp.196–229.
Gannes, L., O’Brien, D.M., and Martinez del Rio, C. 1997. Stableisotopes in animal ecology: assumptions, caveats, and a call formore laboratory experiments. Ecology,78: 1271–1276.
Gearing, J.N. 1991. The study of diet and trophic relationshipsthrough natural abundance of13C. In Carbon isotope techniques.Edited by D.C. Coleman and B. Fry. Academic Press, SanDiego. pp. 201–216.
Gilmour, I., Johnston, M.A., Pillinger, C.T., Pond, C.M., Mattacks,C.A., and Prestrud, P. 1995. The carbon isotopic composition ofindividual fatty acids as indicators of dietary history in Arcticfoxes on Svalbard. Philos. Trans. R. Soc. Lond. B Biol. Sci.349: 135–142.
Gloutney, M.L., and Hobson, K.A. 1998. Field preservation tech-niques for the analysis of stable carbon and nitrogen isotope ra-tios in eggs. J. Field Ornithol.69: 223–227.
Goericke, R., Montoya, J.P., and Fry, B. 1994. Physiology of isoto-pic fractionation in algae and cyanobacteria.In Stable isotopesin ecology and environmental science.Edited byK. Lajtha andR.H. Michener. Blackwell Scientific, London. pp. 187–221.
Gould, P., Ostrom, P., and Walker, W. 1997. Trophic relationshipsof albatrosses associated with squid and large-mesh drift-netfisheries in the North Pacific Ocean. Can. J. Zool.75: 549–562.
Grupe, G., and Kruger, H.-H. 1990. Feeding ecology of the stoneand pine marten revealed by element analysis of their skeleton.Sci. Total Environ.90: 227–240.
Haines, E.B., and Montague, C.L. 1979. Food sources of estuarineinvertebrates analyzed using13C/12C ratios. Ecology,60: 48–56.
Heaton, T.H.E. 1987. The15N/14N ratios of plants in South Africaand Namibia: relationship to climate and coastal/saline environ-ments. Oecologia,74: 236–246.
Heaton, T.H.E., Vogel, J.C., von la Chevallerie, G., and Collett, G.1986. Climate influence on the isotopic composition of bone ni-trogen. Nature (Lond.),322: 822–823.
Herrera, L.G., Fleming, M.T., and Findley, J.S. 1993. Geographicvariation in carbon composition of the pallid bat,Antrozouspallidus, and its dietary implications. J. Mammal.74: 601–606.
Hilderbrand, G.V., Farley, S.D., Robbins, C.T., Hanley, T.A., Titus,K., and Servheen, C. 1996. Use of stable isotopes to determinediets of living and extinct bears. Can. J. Zool.74: 2080–2088.
Hobson, K.A. 1987. Use of stable-carbon isotope analysis to esti-mate marine and terrestrial protein content in gull diets. Can. J.Zool. 65: 1210–1213.
Hobson, K.A. 1990. Stable isotope analysis of marbled murrelets:evidence for freshwater feeding and determination of trophiclevel. Condor,92: 897–903.
Hobson, K.A. 1993. Trophic relationships among high arctic sea-
birds: insights from tissue-dependent stable-isotope models.Mar. Ecol. Prog. Ser.95: 7–18.
Hobson, K.A. 1995. Reconstructing avian diets using stable-carbonand nitrogen isotope analysis of egg components: patterns ofisotopic fractionation and turnover. Condor,97: 752–762.
Hobson, K.A., and Clark, R.G. 1992a. Assessing avian diets usingstable isotopes I: Turnover of13C in tissues. Condor,94: 181–188.
Hobson, K.A., and Clark, R.G. 1992b. Assessing avian diets usingstable isotopes II: Factors influencing diet–tissue fractionation.Condor,94: 189–197.
Hobson, K.A., and Clark, R.G. 1993. Turnover of13C and plasmafractions of blood: implications for nondestructive sampling inavian dietary studies. Auk,110: 638–641.
Hobson, K.A., and Montevecchi, W.A. 1991. Stable isotopic deter-minations of trophic relationships of great auks. Oecologia,87:528–531.
Hobson, K.A., and Schwarcz, H.P. 1986. The variation inδ13C val-ues in bone collagen for two wild herbivore populations: impli-cations for palaeodiet studies. J. Archaeol. Sci.13: 101–106.
Hobson, K.A., and Sealy, S.G. 1991. Marine protein contributionsto the diet of northern saw-whet owls on the Queen Charlotte Is-lands: a stable-isotope approach. Auk,108: 437–440.
Hobson, K.A., and Sease, J.L. 1998. Stable isotope analyses oftooth annuli reveal temporal dietary records: an example usingsteller sea lions. Mar. Mamm. Sci.14: 116–129.
Hobson, K.A., and Welch, H.E. 1992. Determination of trophic re-lationships within a high arctic marine food web usingδ13C andδ15N analysis. Mar. Ecol. Prog. Ser.84: 9–18.
Hobson, K.A., Alisauskas, R.T., and Clark, R.G. 1993. Stable-nitrogen isotope enrichment in avian tissue due to fasting andnutritional stress: implication for isotopic analyses of diet. Con-dor, 95: 388–394.
Hobson, K.A., Piatt, J.F., and Pitocchelli, J. 1994. Using stable iso-topes to determine seabird trophic relationships. J. Anim. Ecol.63: 786–798.
Hobson, K.A., Schell, D.M., Renouf, D., and Noseworthy, E. 1996.Stable carbon and nitrogen isotopic fractionation between dietand tissues of captive seals: implications for dietary reconstruc-tions involving marine mammals. Can. J. Fish. Aquat. Sci.53:528–533.
Hobson, K.A., Gibbs, H.L., and Gloutney, M.L. 1997a. Preserva-tion of blood and tissue samples for stable-carbon and stable-nitrogen isotope analysis. Can. J. Zool.75: 1720–1723.
Hobson, K.A., Hughes, K.D., and Ewins, P.J. 1997b. Using stable-isotope analysis to identify endogenous and exogenous sourcesof nutrients in eggs of migratory birds: applications to greatlakes contaminants research. Auk,114: 467–478.
Hobson, K.A., Sease, J.L., Merrick, R.L., and Piatt, J.F. 1997c. In-vestigating trophic relationships of pinnipeds in Alaska andWashington using stable isotope ratios of nitrogen and carbon.Mar. Mamm. Sci.13: 114–132.
Horsup, A., and Marsh, H. 1992. The diet of the allied rock-wallaby, Petrogale assimilis, in the wet–dry tropics. Wildl. Res.19: 17–33.
Jarman, W.M., Hobson, K.A., Sydeman, W.J., Bacon, C.E., andMcLaren, E.B. 1996. Influence of trophic position and feedinglocation on contaminant levels in the Gulf of the Farallones foodweb revealed by stable isotope analysis. Environ. Sci. Technol.30: 654–660.
Jarman, W.M., Sydeman, W.J., Hobson, K.A., and Bergqvist, P.-A.1997. Relationship of polychlorinated dibenzo-p-dioxin andpolychlorinated dibenzofuran levels to stable-nitrogen isotope
J:\cjz\cjz78\cjz-01\Z99-165.vpFriday, February 25, 2000 1:55:35 PM
Color profile: DisabledComposite Default screen

abundance in marine birds and mammals in coastal California.Environ. Toxicol. Chem.16: 1010–1013.
Johnson, B.J., Miller, G.H., Fogel, M.L., and Beaumont, P.B. 1997.The determination of late Quaternary paleoenvironments atEquus Cave, South Africa, using stable isotopes and aminoracemization in ostrich eggshell. Palaeogeogr. Palaeoclimatol.Palaeoecol.136: 121–137.
Kelly, J.F. 1996. Effects of substrate on prey use by belted king-fishers (Ceryle alcyon): a test of the prey abundance–availabilityassumption. Can. J. Zool.74: 693–697.
Kelly, J.F., and Finch, D.M. 1998. Tracking migrant songbirds withstable isotopes. Trends Ecol. Evol.13: 48–49.
Koch, P.L., Fogel, M.L., and Tuross, N. 1994. Tracing the diets offossil animals using stable isotopes.In Stable isotopes in ecol-ogy and environmental science.Edited byK. Lajtha and R.H.Michener. Blackwell Scientific, London. pp. 63–92.
Koch, P.L., Heisinger, J., Moss, C., Carlson, R.W., Fogel, M.L.,and Behrensmeyer, A.K. 1995. Isotopic tracking of change indiet and habitat use in African elephants. Science (Washington,D.C.), 267: 1340–1343.
Korner, Ch., Farquhar, G.D., and Wong, S.C. 1991. Carbon isotopediscrimination by plants follows latitudinal and altitudinaltrends. Oecologia,88: 30–40.
Kwak, T.J., and Zedler, J.B. 1997. Food web analysis of southernCalifornia coastal wetlands using multiple stable isotopes.Oecologia,110: 262–277.
Lajtha, K., and Marshall, J.D. 1994. Sources of variation in the sta-ble isotopic composition of plants.In Stable isotopes in ecologyand environmental science.Edited by K. Lajtha and R.H.Michener. Blackwell Scientific, London. pp. 1–21.
Lajtha, K., and Michener, R.H. 1994. Stable isotopes in ecologyand environmental science. Blackwell Scientific, London.
MacFadden, B.J. 1997. Origin and evolution of the grazing guild inNew World terrestrial mammals. Trends Ecol. Evol.12: 183–187.
MacFadden, B.J., and Cerling, T.E. 1994. Fossil horses, carbonisotopes and global change. Trends Ecol. Evol.9: 481–487.
Macko, S.A. 1994. Compound specific approaches using stable iso-topes.In Stable isotopes in ecology and environmental science.Edited byK. Lajtha and R.H. Michener. Blackwell Scientific,London. pp. 241–247.
Macko, S.A., and Ostrom, N.E. 1994. Pollution studies using sta-ble isotopes.In Stable isotopes in ecology and environmentalscience.Edited byK. Lajtha and R.H. Michener. Blackwell Sci-entific, London. pp. 45–62.
McConnaughey, T., and McRoy, C.P. 1979. Food web structure andthe fractionation of carbon isotopes in the Bering Sea. Mar.Biol. (Berl.), 53: 257–262.
McFarlane, D.A., Keeler, R.C., and Mizutani, H. 1995. Ammoniavolatilization in a Mexican bat cave ecosystem. Biogeo-chemistry (Dordr.),30: 1–8.
Michener, R.H., and Schell, D.M. 1994. Stable isotope ratios astracers in marine aquatic food webs.In Stable isotopes in ecol-ogy and environmental science.Edited byK. Lajtha and R.H.Michener. Blackwell Scientific, London. pp. 138–157.
Minagawa, M., and Wada, E. 1984. Stepwise enrichment of15Nalong food chains: further evidence and the relation betweenδ15N and animal age. Geochim. Cosmochim. Acta,48: 1135–1140.
Minami, H., Minagawa, M., and Ogi, H. 1995. Changes in stablecarbon and nitrogen isotope ratios in sooty and short-tailedshearwaters during their northward migration. Condor,97: 565–574.
Mizutani, H., and Wada, E. 1988. Nitrogen and carbon isotope ra-tios in seabird rookeries and their ecological implications. Ecol-ogy, 69: 340–349.
Mizutani, H., Kabaya, Y., and Wada, E. 1985. Ammoniavolatization and high15N/14N ratio in a penguin rookery inAntarctica. Geochem. J.19: 323–327.
Mizutani, H., Hasegawa, H., and Wada, E. 1986. High nitrogenisotope ratio for soils of seabird rookeries. Biogeochemistry(Dordr.), 2: 221–247.
Mizutani, H., Fukuda, M., Kabaya, Y., and Wada, E. 1990. Carbonisotope ratio of feathers reveals feeding behavior of cormorants.Auk, 107: 400–437.
Mizutani, H., Kabaya, Y., and Wada, E. 1991. Nitrogen and carbonisotope compositions relate linearly in cormorant tissues and itsdiet. Isotopenpraxis,27: 166–168.
Mizutani, H., Fukuda, M., and Kabaya, Y. 1992.13C and15N en-richment factors of feathers of 11 species of adult birds. Ecol-ogy, 73: 1391–1395.
Moors, P.J., Speir, T.W., and Lyon, G.L. 1988. Soil analyses and13C/12C ratios identify sites of deserted rockhopper penguin col-onies. Auk,105: 796–799.
Morrison, M.L., Ralph, C.J., Verner, J., and Jehl, J.R., Jr. 1990.Avian foraging: theory methodology, and applications. Stud.Avian Biol. 13: 1–515.
Muir, D.C.G., Segstro, M.D., Hobson, K.A., Ford, C.A., Stewart,R.E.A., and Olpinski, S. 1995. Can seal eating explain elevatedlevels of PCBs and organochlorine pesticides in walrus blubberfrom eastern Hudson Bay (Canada)? Environ. Pollut.90: 335–348.
Neir, A.O., and Gulbransen, E.A. 1939. Variations in the relativeabundance of the carbon isotopes. J. Am. Chem. Soc.61: 697–698.
Nelson, D., Desbrosse, A., Lien, J., Ostrom, P., and Seton, R. 1991.A new stranding record of the pygmy sperm whale,Kogiabreviceps, in waters off eastern Canada. Can. Field-Nat.105:407–408.
Nowak, R.M. 1991. Walker’s mammals of the world. John’sHopkins University Press, Baltimore.
O’Leary, M.H. 1981. Carbon isotope fractionations in plants.Phytochemistry (Oxf.),20: 553–567.
O’Leary, M.H. 1988. Carbon isotopes in photosynthesis. BioSci-ence,38: 328–336.
Ostrom, P., Lein, J., and Macko, S. 1993. Evaluation of the diet ofSowerby’s beaked whale,Mesoplodon bidens, based on isotopiccomparisons among northwestern Atlantic cetaceans. Can. J.Zool. 71: 858–861.
Peters, R.H. 1983. Ecological implications of body size. Cam-bridge University Press, Cambridge.
Peterson, B.J., and Fry, B. 1987. Stable isotopes in ecosystem stud-ies. Annu. Rev. Ecol. Syst.18: 293–320.
Pond, C.M., Mattacks, C.A., Gilmour, I., Johnston, M.A., andPillinger, C.T. 1995. Chemical and carbon isotopic compositionof fatty acids in adipose tissue as indicators of dietary history inwild arctic foxes (Alopex lagopus) on Svalbard. J. Zool. (Lond.),236: 611–623.
Ramsay, M.A., and Hobson, K.A. 1991. Polar bears make little useof terrestrial food webs: evidence from stable-carbon isotopeanalysis. Oecologia,86: 598–600.
Rau, G.H., and Anderson, N.H. 1981. Use of13C/12C to trace dis-solved and particulate organic matter utilization by populationsof an aquatic invertebrate. Oecologia,48: 19–21.
Rau, G.H., Sweeney, R.E., and Kaplan, I.R. 1982. Plankton13C:12C ratio changes with latitude: differences between north-ern and southern oceans. Deep-Sea Res.18: 1035–1039.
© 2000 NRC Canada
Review / Synthèse 17
J:\cjz\cjz78\cjz-01\Z99-165.vpFriday, February 25, 2000 1:55:35 PM
Color profile: DisabledComposite Default screen

Rau, G.H., Mearns A.J., Young, D.R., Olson, R.J., Schafer, H.A.,and Kaplan, I.R. 1983. Animal13C/12C correlates with trophiclevel in pelagic food webs. Ecology,64: 1314–1318.
Rau, G.H., Ainley, D.G., Bengtson, J.L., Torres, J.J., and Hopkins,T.L. 1992.15N/14N and13C/12C in Weddell Sea birds, seals, andfish: implications for diet and trophic structure. Mar. Ecol. Prog.Ser.84: 1–8.
Raven, J.A. 1987. Application of mass spectrometry to biochemi-cal and physiological studies. Biochem. Plants,13: 127–180.
Robbins, C.T. 1983. Wildlife feeding and nutrition. AcademicPress, New York.
Rundel, P.W., Ehleringer, J.R., and Nag, K.A. 1989. Stable iso-topes in ecological research. Springer-Verlag, New York.
Sackett, W.M., Eckelmann, W.R., Bender, M.L., and Be, A.W.H.1965. Temperature dependence of carbon isotope composition inmarine plankton and sediments. Science (Washington, D.C.),148: 235–237.
Schaffner, F.C., and Swart, P.K. 1991. Influence of diet and envi-ronmental water on the carbon and oxygen isotopic signatures ofseabird eggshell carbonate. Bull. Mar. Sci.48: 23–38.
Schell, D.M., and Ziemann, P.J. 1989. Natural carbon isotope trac-ers in arctic aquatic food webs.In Stable isotopes in ecologicalresearch.Edited by P.W. Rundel, J.R. Ehleringer, and K.A.Nagy. Springer-Verlag, New York. pp. 231–251.
Schell, D.M., Saupe, S.M., and Haubenstock, N. 1989a. Bowheadwhale (Balaena mysticetus) growth and feeding as estimated byδ13C techniques. Mar. Biol. (Berl.),103: 433–443.
Schell, D.M., Saupe, S.M., and Haubenstock, N. 1989b. Naturalisotope abundances in bowhead whale (Balaena mysticetus) ba-leen: markers of aging and habitat usage.In Stable isotopes inecological research.Edited byP.W. Rundel, J.R. Ehleringer, andK.A. Nagy. Springer-Verlag, New York. pp. 261–269.
Schmutz, J.A., and Hobson, K.A. 1998. Geographic, temporal andage-specific variation in diets of glaucous gulls in westernAlaska. Condor,100: 119–130.
Schoeninger, M.J., and DeNiro, M.J. 1982. Carbon isotope ratiosof apatite from fossil bone cannot be used to reconstruct diets ofanimals. Nature (Lond.),297: 1982.
Schoeninger, M.J., and DeNiro, M.J. 1984. Nitrogen and carbonisotopic composition of bone collagen from marine and terres-trial animals. Geochim. Cosmochim. Acta,48: 625–639.
Schoeninger, M.J., Iwaniec, U.T., and Glander, K.E. 1997. Stableisotope ratios indicate diet and habitat use in New World mon-keys. Am. J. Phys. Anthropol.103: 69–83.
Schoeninger, M.J., Iwaniec, U.T., and Nash, L.T. 1998. Ecologicalattributes recorded in stable isotope ratios of arboreal prosimianhair. Oecologia,113: 222–230.
Sealy, J.C., van Der Merwe, N.J., Lee Thorp, J.A., and Lanham,J.L. 1987. Nitrogen isotopic ecology in southern Africa: impli-cations for environmental and dietary tracing. Geochim.Cosmochim. Acta,51: 2707–2717.
Shearer, G., and Kohl, D.H. 1989. Estimates of N2 fixation in eco-systems: the need for and basis of the15N natural abundancemethod. In Stable isotopes in ecological research.Edited byP.W. Rundel, J.R. Ehleringer, and K.A. Nagy. Springer-Verlag,New York. pp. 342–374.
Shearer, G., Kohl, D.H., and Virginia, R.A. 1983. Estimates of N2-fixation from variation in the natural abundance of15N inSonoran Desert plants. Oecologia,56: 365–373.
Shearer, G.B., Kohl, D.H., and Chien, S.H. 1978. The nitrogen-15abundance in a wide variety of soils. Soil Sci. Soc. Am. J.42:899–902.
Sillen, A. 1988. Elemental and isotopic analyses of mammalianfauna from southern Africa and their implications for paleo-dietary research. Am. J. Phys. Anthropol.76: 49–60.
Sillen, A., and Lee-Thorp, J.A. 1994. Trace element and isotopicaspects of predator–prey relationships in terrestrial food webs.Palaeogeogr. Palaeoclimatol. Palaeoecol.107: 243–255.
Silva, M., and Downing, J.A. 1995. CRC handbook of mammalianbody masses. CRC Press, Boca Raton, Fla.
Smith, B.N., and Epstein, S. 1971. Two categories of13C/12C ratiosfor higher plants. Plant Physiol.47: 380–384.
Smith, R.J. Hobson, K.A., Koopman, H.N., and Lavigne, D.M.1996. Distinguishing between populations of fresh- and salt-water harbour seals (Phoca vitulina) using stable-isotope ratiosand fatty acid profiles. Can. J. Fish. Aquat. Sci.53: 272–279.
Steele, K.W., and Daniel, R.M. 1978. Fractionation of nitrogen iso-topes by animals: a further complication to the use of variationsin the natural abundance of15N for tracer studies. J. Agric. Sci.90: 7–9.
Sternberg, L.S.L. 1989. Oxygen and hydrogen isotope ratios inplant cellulose: mechanisms and applications.In Stable isotopesin ecological research.Edited byP.W. Rundel, J.R. Ehleringer,and K.A. Nagy. Springer-Verlag, New York. pp. 124–141.
Sukumar, R., and Ramesh, R. 1992. Stable carbon isotope ratios inAsian elephant collagen: implications for dietary studies.Oecologia,91: 536–539.
Sukumar, R., Bhattacharya, S.K., and Krishnamurthy, R.V. 1987.Carbon isotopic evidence for different feeding patterns in anAsian elephant population. Curr. Sci. (Bangalore),56: 11–14.
Sutoh, M., Koyama, T., and Yonyeyama, T. 1987. Variations of nat-ural 15N abundances in the tissues and digesta of domestic ani-mals. Radioisotopes,36: 74–77.
Sydeman, W.J., Hobson, K.A., Pyle, P., and McLaren, E.B. 1997.Trophic relationships among seabirds in central California: com-bined stable isotope and conventional dietary approach. Condor,99: 327–336.
Teeri, J.A., and Schoeller, D.A. 1979.δ13C values of an herbivoreand the ratio of C3 to C4 plant carbon in its diet. Oecologia,39:197–200.
Teeri, J.A., and Stowe, L.G. 1976. Climatic pattern and the distri-bution of C4 grasses in North America. Oecologia,23: 1–12.
Thackeray, J.F., van der Merwe, N.J., Lee-Thorp, J.A., and Sealy,J. 1993. Relationships between stable carbon and nitrogen iso-tope ratios in bone collagen of African ungulates. S. Afr. J.Zool. 89: 458–459.
Thackeray, J.F., Henzi, S.P., and Brain, C. 1996. Stable carbon andnitrogen isotope analysis of bone collagen inPapiocynocephalus ursinus: comparison with ungulates andHomo sa-piens from southern and East African environments. S. Afr. J.Sci. 92: 209–211.
Thompson, D.R., and Furness, R.W. 1995. Stable isotope ratios ofcarbon and nitrogen in feathers indicate seasonal dietary shiftsin northern fulmars. Auk,112: 493–498.
Thompson, D.R., Furness, R.W., and Lewis, S.A. 1995. Diets andlong-term changes inδ15N and δ13C values in northern fulmars,Fulmaris glacialis, from two northeast Atlantic colonies. Mar.Ecol. Prog. Ser.125: 3–11.
Tieszen, L.L., and Boutton, T.W. 1989. Stable carbon isotopes interrestrial ecosystem research.In Stable isotopes in ecologicalresearch.Edited by P.W. Rundel, J.R. Ehleringer, and K.A.Nagy. Springer-Verlag, New York. pp. 167–195.
Tieszen, L.L., Hein, D., Qvortrup, S., Troughton, J.N., andImbamba, S.K. 1979. Use ofδ13C values to determine vegetationselectivity in east African herbivores. Oecologia,37: 351–359.
© 2000 NRC Canada
18 Can. J. Zool. Vol. 78, 2000
J:\cjz\cjz78\cjz-01\Z99-165.vpFriday, February 25, 2000 1:55:36 PM
Color profile: DisabledComposite Default screen

Tieszen, L.L., Boutton, T.W., Tesdahl, K.G., and Slade, N.G. 1983.Fractionation and turnover of stable carbon isotopes in animaltissues: implications forδ13C analysis of diet. Oecologia,57:32–37.
Tieszen, L.L., Boutton, T.W., Ottochilo, W.K., and Nelson, D.E.1989. An assessment of long-term food habits of Tsavo ele-phants based on stable carbon and nitrogen isotope ratios ofbone collagen. Afr. J. Ecol.27: 219–226.
Vander, A.J., Sherman, J.N., and Luciano, D.S. 1975. Human phys-iology: the mechanisms of body function. McGraw–Hill BookCo., New York.
van der Merwe, N.J. 1982. Carbon isotopes, photosynthesis and ar-chaeology. Am. Sci.70: 209–215.
van der Merwe, N.J., Lee-Thorp, J.A., and Bell, R.H.V. 1988. Car-bon isotopes as indicators of elephant diets and African environ-ments. Afr. J. Ecol.26: 163–172.
van der Merwe, N.J., Lee-Thorp, J.A., Thackeray, J.F., Hall-Martin, A., Krueger, F.J., Coetzee, H., Bell, R.H.V., andLindeque, M. 1990. Source-area determination of elephant ivoryby isotopic analysis. Nature (Lond.),346: 744–745.
Virginia, R.A., and Delwiche, C.C. 1982. Natural15N abundance ofpresumed N2-fixing and non-N2-fixing plants from selected eco-systems. Oecologia,54: 317–325.
Virginia, R.A., Jarrell, W.M., Rundel, P.W., Shearer, G., and Kohl,D.H. 1989. The use of variation in the natural abundance of15N
to assess symbiotic nitrogen fixation by woody plants.In Stableisotopes in ecological research.Edited by P.W. Rundel, J.R.Ehleringer, and K.A. Nagy. Springer-Verlag, New York.pp. 345–394.
Vogel, J.C. 1978. Isotopic assessment of the dietary habits ofungulates. S. Afr. J. Sci.74: 298–301.
Vogel, J.C., Talma, A.S., Hall-Martin, A.J., and Viljoen, P.J. 1990a.Carbon and nitrogen isotopes in elephants. S. Afr. J. Sci.86:147–150.
Vogel, J.C., Eglington, B., and Auret, J.M. 1990b. Isotope finger-prints in elephant bone and ivory. Nature (Lond.),346: 747–749.
von Schirnding, Y., van der Merwe, N.J., and Vogel, J.C. 1982. In-fluence of diet and age on carbon isotope ratios in ostrich egg-shell. Archaeometry,24: 3–20.
Wada, E., Teragaki, M., Kobaya, Y., and Nemoto, T. 1987.15N and13C abundances in the Arrtic Ocean with emphasis on the bio-geochemical structure of the food web. Deep-Sea Res.34: 829–841.
Werner, E.E., and Gilliam, J.F. 1984. the ontogenetic niche andspecies interactions in size-structured populations. Annu. Rev.Ecol. Syst.15: 393–425.
Wiens, J.A. 1984. Resource systems, populations, and communi-ties. In A new ecology. Edited by P.W. Price, C.N.Slobodchikoff, and W.S. Gaud. John Wiley & Sons, New York.pp. 397–436.
Appendix
© 2000 NRC Canada
Review / Synthèse 19
Order Isotopea Question Methodsb Continent Environment Source
BirdsStruthioniformes C, N Climate F, D Africa Terrestrial Johnson et al. 1997
C Diet F, D Africa Terrestrial von Schirnding et al. 1982Sphenisciformes C Tracer F, D Australia Marine Moors et al. 1988
C Tracer F, D Antarctica Marine Mizutani et al. 1985Procellariiformes C, N Food web F, D Marine Gould et al. 1997
C, N Diet F, D Asia Marine Minami et al. 1995C, N Diet F, D Europe Marine Thompson and Furness 1995C, N Diet F, D Europe Marine Thompson et al. 1995
Pelecaniformes C, N Method E, L Asia Marine Mizutani et al. 1991C Diet F, D Asia Marine Mizutani et al. 1990
Anseriiformes C, N Diet B North America Terrestrial Hobson et al. 1993C, N Diet F, D North America Terrestrial Alisauskas and Hobson 1993C Tracer F, D North America Terrestrial Alisauskas et al. 1998C Diet F, D Australia Terrestrial Collier and Lyon 1991
Galliformes C, N Method F, E North America Terrestrial Gloutney and Hobson 1998C, N Method E, L North America Terrestrial Hobson et al. 1997aC Diet E, L North America Terrestrial Hobson and Clark 1992a
Charadriiformes C, N Diet F, D North America Marine Schmutz and Hobson 1998C, N Diet F, D North America Terrestrial Alexander et al. 1996N Food web F, D North America Marine Hobson and Montevecchi 1991C, N Diet F, D North America Marine Hobson 1990C Diet F, D North America Marine Hobson 1987
Strigiformes C, N Diet F, D North America Terrestrial Hobson and Sealy 1991Passeriformes C Diet E, L North America Terrestrial Hobson and Clark 1993
C Tracer F, D North America Terrestrial Chamberlain et al. 1997Multiplec C, N Pollution F, D Europe Marine Broman et al. 1992
Table A1. The focal taxonomic order, isotope ratios measured, the question asked, the methods used, and the continent and environ-ment in which the study was carried out for 102 studies that report stable carbon isotope ratios and (or) stable nitrogen isotope ratiosof birds and (or) mammals.
J:\cjz\cjz78\cjz-01\Z99-165.vpFriday, February 25, 2000 1:55:37 PM
Color profile: DisabledComposite Default screen

© 2000 NRC Canada
20 Can. J. Zool. Vol. 78, 2000
C, N Diet E, L North America Terrestrial Hobson and Clark 1992bC, N Diet E, L North America Terrestrial Hobson 1995C Tracer F, D North America Marine and terrestrial Hobson et al. 1997bC, N Food web F, D North America Marine Hobson et al. 1994C, N Diet F, D North America Marine Kwak and Zedler 1997C, N Food web F, D North America Terrestrial Hobson 1993C, N Diet E, L Asia Terrestrial Mizutani et al. 1992C, N Nutrient F, D Antarctica Marine Mizutani and Wada 1988N Nutrient F, D Asia Marine Mizutani et al. 1986C Diet F, D North America Marine Schaffner and Swart 1991
Climate Marine Furness and Camphuysen 1997MammalsMarsupialia C Diet F, D Australia Terrestrial Horsup and Marsh 1992Chiroptera C Diet F, D North America Terrestrial Des Marais et al. 1980
C Diet F, D North America Terrestrial Fleming et al. 1993N Nutrient F, D North America Terrestrial McFarlane et al. 1995C Diet F, D North America Terrestrial Herrera et al. 1993
Primates C, N Diet F, D South America Terrestrial Schoeninger et al. 1997C, N Diet F, D Africa Terrestrial Schoeninger et al. 1998C, N Paleontology F, D Africa Terrestrial Thackeray et al. 1996
Cetacea N Tracer F, D Europe Marine Abend and Smith 1995N Diet F, D North America Marine Abend and Smith 1997C Tracer F, D Africa Marine Best and Schell 1996C Diet F, D North America Marine Borobia et al. 1995C, N Diet F, D North America Marine Nelson et al. 1991C, N Diet F, D North America Marine Ostrom et al. 1993C Tracer F, D North America Marine Schell et al. 1989aC Tracer F, D North America Marine Schell et al. 1989b
Carnivora C, N Diet F, D North America Terrestrial Ben-David et al. 1997aC, N Diet F, D North America Terrestrial Ben-David et al. 1997bC Diet F, D Europe Terrestrial Angerbjorn et al. 1994C Diet F, D Europe Terrestrial Gilmour et al. 1995C Diet F, D Europe Terrestrial Grupe and Krueger 1990C, N Diet B North America Terrestrial Hilderbrand et al. 1996C Diet F, D Europe Terrestrial Pond et al. 1995C Diet F, D North America Terrestrial Ramsay and Hobson 1991C Food web F, D Africa Terrestrial Sillen and Lee-Thorp 1994
Pinnipedia C, N Diet F, D North America Marine Hobson and Sease 1998C, N Food web F, D North America Marine Hobson et al. 1997cC, N Diet E, L North America Marine Hobson et al. 1996C Tracer F, D North America Marine Smith et al. 1996C, N Diet F, D North America Marine Muir et al. 1995
Proboscidea C, N Diet F, D Africa Terrestrial Tieszen et al. 1989C Diet F, D Asia Terrestrial Sukumar and Ramesh 1992C Diet F, D Asia Terrestrial Sukumar et al. 1987C, N Diet F, D Africa Terrestrial van der Merwe et al. 1990C Diet F, D Africa Terrestrial van der Merwe et al. 1988C, N Diet F, D Africa Terrestrial Vogel et al. 1990aC, N Diet F, D Africa Terrestrial Vogel et al. 1990bC, N Diet F, D Africa Terrestrial Koch et al. 1995
Hyracoidea C Diet F, D Africa Terrestrial DeNiro and Epstein 1978bSirenia C Diet F, L, D North America Marine Ames et al. 1996Perissodactyla C Climate F, D North America Terrestrial MacFadden and Cerling 1994Artiodactyla C, N Diet F, D Africa Terrestrial Ambrose and Deniro 1986
C, N Climate F, D North America Terrestrial Bada et al. 1990C, N Climate F, D North America Terrestrial Cormie and Schwarcz 1996C, N Climate F, D North America Terrestrial Cormie and Schwarcz 1994C Paleontology F, D North America Terrestrial Hobson and Schwarcz 1986
Table A1 (continued).
J:\cjz\cjz78\cjz-01\Z99-165.vpFriday, February 25, 2000 1:55:38 PM
Color profile: DisabledComposite Default screen

© 2000 NRC Canada
Review / Synthèse 21
C, N Diet F, D Africa Terrestrial Thackeray et al. 1993C Diet F, D Africa Terrestrial Vogel 1978C Diet F, D Africa Terrestrial Tieszen et al. 1979C Paleontology F, D Terrestrial MacFadden 1997C Tracer F, D North America Terrestrial Chisholm et al. 1986
Multiplec C, N Diet F, D Europe Terrestrial Bocherens et al. 1995C, N Paleontology F, D Europe Terrestrial Bocherens et al. 1994C, N Climate F, D Africa Terrestrial Heaton et al. 1986C Diet F, D Africa Terrestrial Schoeninger and DeNiro 1982C Paleontology F, D Africa Terrestrial Sillen 1988
Birds and mammalsMultiplec C, N Method E, L North America Terrestrial DeNiro et al. 1985
C, N Food web F, D North America Marine Hobson and Welch 1992N Pollution F, D North America Marine Jarman et al. 1997C, N Pollution F, D North America Marine Jarman et al. 1996C, N Food web F, D Antarctica Marine Rau et al. 1992C Food web F, D North America Marine Schell and Ziemann 1989C, N Diet F, D Marine and terrestrial Schoeninger and Deniro 1984C, N Diet F, D North America Marine Sydeman et al. 1997N Food web F, D Africa Terrestrial Sealy et al. 1987
aC, carbon isotope ratios presented in the study; N, nitrogen isotope ratios presented in the study.bB, field, laboratory, experimental, and descriptive; D, descriptive; E, experimental; F, field; L, laboratory.cStudy focused on more than one taxonomic order.
Table A1 (concluded).
Common nameδ13C(‰)
δ15N(‰) Tissue Dieta
Trophicchainb Latitudec Massd
Habitatmoisturee Study
BirdsStruthioniformes
Struthio camelus Ostrich –21.3 Bone H3 C3 33 4.92 Von Schirnding et al.1982
PodicipediformesPodiceps nigricollis Eared Grebe –26.3 9.1 Bone I C3 36 2.47 Schoeninger and
DeNiro 1984Aechmophorus
occidentalisWestern Grebe –18.6 14.2 Bone V M 36 3.17 Schoeninger and
DeNiro 1984Sphenisciformes
Aptenodytes patagonicus King Penguin –19.0 13.0 Bone I M 51 4.12 Schoeninger andDeNiro 1984
Pygoscelis papua Gentoo Penguin –16.1 10.7 Bone V M 51 3.77 Schoeninger andDeNiro 1984
Pygoscelis adeliae Adelie Penguin 9.5 Bone I M 77 3.69 Mizutani et al. 19865.9 Muscle I M 65 3.69 Rau et al. 1992
Eudyptes chrysolophus Macaroni Penguin –18.1 9.4 Bone I M 51 3.59 Schoeninger andDeNiro 1984
Spheniscus demersus Jackass Penguin 16.1 Muscle I 34 Sealy et al. 1987Procellariiformes
Diomedea nigripes Black-footedAlbatross
–18.2 14.4 Muscle I M 43 3.50 Gould et al. 1997f
Diomedea immutabilis Laysan Albatross –18.8 12.0 Muscle I M 43 3.48 Gould et al. 1997f
Macronectes giganteus Southern GiantFulmar
8.7 Muscle V M 65 3.66 Rau et al. 1992
Fulmarus glacialis Northern Fulmar 17.4 Bone V M 74 2.74 Hobson 1993f
–15.3 14.8 Bone V M 57 2.74 Thompson andFurness 1995f
15.3 Muscle V M 74 2.74 Hobson 1993f
–19.2 15.3 Muscle V M 74 2.74 Hobson and Welch1992f
Table A2. Summary of data from the literature on stable carbon isotope values, stable nitrogen isotope values, diet, trophic chain, lati-tude, log body mass, and habitat moisture.
J:\cjz\cjz78\cjz-01\Z99-165.vpFriday, February 25, 2000 1:55:39 PM
Color profile: DisabledComposite Default screen

© 2000 NRC Canada
22 Can. J. Zool. Vol. 78, 2000
Fulmarus glacialoides Antarctic Fulmar –19.6 11.9 Bone V M 51 3.00 Schoeninger andDeNiro 1984
6.7 Muscle V M 65 3.00 Rau et al. 1992Thalassoica antarctica Antarctic Petrel 5.6 Muscle V M 65 2.88 Rau et al. 1992Daption capense Cape Petrel 6.5 Muscle V M 65 2.63 Rau et al. 1992Pagodroma nivea Snow Petrel 7.2 Muscle V M 65 2.43 Rau et al. 1992Pterodroma brevirostris Kerguelan Petrel 7.8 Muscle V M 65 2.55 Rau et al. 1992Halobaena caerulea Blue Petrel 6.3 Muscle V M 65 2.31 Rau et al. 1992Pachyptila vittata Antarctic Prion 6.4 Muscle V M 65 2.29 Rau et al. 1992Puffinus griseus Sooty Shearwater 15.8 Bone I M 53 2.90 Hobson et al. 1994f
–20.1 9.2 Muscle I M 38 2.90 Minami et al. 1995f
Puffinus tenuirostris Short-tailedShearwater
–23.0 8.0 Muscle I M 40 2.73 Minami et al. 1995f
Oceanites oceanicus Wilson’s StormPetrel
8.3 Muscle V M 65 1.51 Rau et al. 1992f
Oceanodroma leucorhoa Leach’s StormPetrel
17.1 Bone V M 56 1.60 Hobson et al. 1994f
–21.2 13.8 Bone V M 56 1.60 Hobson et al. 1994f
Oceanodroma furcata Fork-tailed StormPetrel
17.9 Bone V M 53 1.74 Hobson et al. 1994f
15.9 Muscle V M 53 1.74 Hobson et al. 1994f
PelecaniformesPhaethon lepturus White-tailed
Tropicbird–15.6 Muscle V M 18 2.52 Schaffner and Swart
1991Fregata magnificens Magnificent
Frigatebird–12.1 12.4 Bone V M 18 3.17 Schoeninger and
DeNiro 1984Sula capensis Cape Gannett 13.7 Muscle V M 34 3.43 Sealy et al. 1987Phalacrocorax capensis Cape Cormorant 14.6 Muscle V M 34 3.08 Sealy et al. 1987Phalacrocorax pelagicus Pelagic Cormorant –18.7 15.8 Muscle V M 55 3.27 Hobson et al. 1994f
Pelecanus occidentalis Brown Pelican –14.5 17.9 Bone V M 36 3.54 Schoeninger andDeNiro 1984
CiconiiformesArdea herodias Great Blue Heron –14.0 15.7 Muscle V M 40 3.38 Schoeninger and
DeNiro 1984Nycticorax nycticorax Black-Crowned
Night Heron–20.9 10.1 Bone V C3 36 2.95 Schoeninger and
DeNiro 1984Anseriformes
Chen caerulescens Snow Goose –21.0 10.2 Muscle H3 C3 29 3.42 Alisauskas andHobson 1993f
Chen rossii Ross’ Goose –24.7 7.5 Muscle H3 C3 65 3.20 Hobson et al. 1993f
Chloephaga picta Magellan Goose –22.5 6.0 Bone H3 C3 51 3.44 Schoeninger andDeNiro 1984
Somateria mollissima Common Eider 15.7 Bone I M 75 3.32 Hobson 1993f
13.2 Muscle I M 75 3.32 Hobson 1993f
–20.3 8.1 Muscle I M 59 3.32 Broman et al. 1992f
Clangula hyemalis Oldsquaw –25.7 Muscle I M 70 2.94 Schell and Ziemann1989
Melanitta perspicillata Surf Scoter 11.8 Bone I M 54 2.98 Hobson et al. 1994f
Melanitta fusca White-wingedScoter
12.2 Bone I M 54 3.24 Hobson et al. 1994f
FalconiformesButeo lagopus Rough-legged
Hawk–16.9 6.8 Bone V C3 36 2.98 Schoeninger and
DeNiro 1984Gruiformes
Rallus longirostris Light-footedClapper Rail
–18.4 17.9 Muscle I C3 33 2.47 Kwak and Zedler1997
Porzana carolina Sora –24.4 12.1 Muscle H3 C3 33 1.87 Kwak and Zedler1997
CharadriiformesCalidris melanotos Pectoral
Sandpiper–27.9 Muscle I C3 70 1.91 Schell and Ziemann
1989Calidris pusilla Semipalmated
Sandpiper–26.1 Muscle I C3 70 1.50 Schell and Ziemann
1989
Table A2 (continued).
J:\cjz\cjz78\cjz-01\Z99-165.vpFriday, February 25, 2000 1:55:41 PM
Color profile: DisabledComposite Default screen

© 2000 NRC Canada
Review / Synthèse 23
Phalaropus fulicaria Red Phalarope –27.3 Muscle I C3 70 2.94 Schell and Ziemann1989
Larus canus Mew Gull 15.3 Muscle V M 55 2.61 Hobson et al. 1994f
Larus glaucescens Glaucous-wingedGull
–15.0 Bone I M 49 3.00 Hobson 1987f
–19.5 15.1 Muscle I M 55 3.00 Hobson 1993f
Larus occidentalis Western Gull –15.1 Bone V M 37 3.00 Hobson 1987f
Larus hyberboreus Glaucous Gull 19.1 Bone V M 74 3.15 Hobson 1993f
–17.6 17.0 Muscle V M 74 3.15 Hobson and Welch1992f
Rissa tridactyla Black-leggedKittiwake
17.2 Bone V M 74 2.61 Hobson 1993f
Sterna elegans Elegant Tern –18.8 Muscle V M 32 2.41 Schaffner and Swart1991
Sterna paradisaea Arctic Tern 5.9 Muscle V M 65 2.04 Rau et al. 1992Sterna vittata Antarctic Tern 5.4 Muscle V M 65 2.15 Rau et al. 1992Alle alle Dovekie 13.3 Bone I M 60 2.21 Hobson and
Montevecchi 1991f
12.9 Muscle I M 74 2.21 Hobson 1993f
Uria aalge Common Murre 18.5 Bone V M 49 3.00 Hobson andMontevecchi 1991f
–18.1 15.3 Muscle V M 55 3.00 Hobson et al. 1994f
Uria lomvia Thick-billedMurre
17.3 Bone V M 74 2.98 Hobson 1993f
15.8 Muscle V M 74 2.98 Hobson 1993f
–18.4 15.8 Muscle V M 74 2.98 Hobson and Welch1992f
Pinguinus impennis Great Auk 15.8 Bone V M 49 Hobson andMontevecchi 1991f
Cepphus grylle Black Guillemot 18.2 Bone V M 74 2.61 Hobson 1993f
15.4 Muscle V M 74 2.61 Hobson 1993f
–17.3 15.4 Muscle V M 74 2.61 Hobson and Welch1992f
Cepphus columba Pigeon Guillemot –15.7 16.5 Muscle V M 48 2.69 Hobson et al. 1994f
Brachyramphusmarmoratus
Marbled Murrelet –16.5 15.3 Muscle V M 48 2.35 Hobson et al. 1994f
Brachyramphusbrevirostris
Kittlitz’s Murrelet 14.5 Muscle I M 59 2.35 Hobson et al. 1994f
Synthliboramphusantiquus
Ancient Murrelet –16.4 15.0 Muscle I M 49 2.31 Hobson et al. 1994f
Ptychoramphus aleuticus Cassin’s Auklet 16.4 Bone I M 48 2.27 Hobson et al. 1994f
–18.5 14.5 Muscle I M 48 2.27 Hobson et al. 1994f
Cyclorrhynchus psittacula Parakeet Auklet 13.8 Muscle I M 55 2.42 Hobson et al. 1994f
Aethia cristatella Crested Auklet 12.5 Muscle I M 55 2.42 Hobson et al. 1994f
Cerorhinca monocerata Rhinoceros Auklet 17.6 Bone V M 48 2.72 Hobson et al. 1994f
–17.3 15.9 Muscle V M 48 2.72 Hobson et al. 1994f
Fratercula corniculata Horned Puffin –20.3 13.3 Muscle V M 55 2.79 Hobson et al. 1994f
Fratercula cirrhata Tufted Puffin –18.5 14.7 Muscle V M 50 2.89 Hobson et al. 1994f
StrigiformesTyto alba Barn Owl –21.2 9.7 Bone V C3 36 2.73 Schoeninger and
DeNiro 1984Aegolius acadicus Northern Saw-
whet Owl–18.9 Muscle V C3 54 1.88 Hobson and Sealy
1991f
PasseriformesCalcarius lapponicus Lapland Longspur –27.0 Muscle I C3 70 2.94 Schell and Ziemann
1989MammalsInsectivora
Erinaceus europaeus Hedgehog –20.8 9.4 Bone I C3 49 2.84 Me Bocherens et al. 1994f
ChiropteraMacrotus californicus Leafnose bat –19.6 Muscle I C3 29 1.08 Me Herrera et al. 1993Eptesicus fuscus Big brown bat –19.5 Muscle I C3 35 1.23 Me Herrera et al. 1993Antrozous pallidus Pallid bat –17.0 Muscle I C3 35 1.32 Me Herrera et al. 1993
Table A2 (continued).
J:\cjz\cjz78\cjz-01\Z99-165.vpFriday, February 25, 2000 1:55:42 PM
Color profile: DisabledComposite Default screen

© 2000 NRC Canada
24 Can. J. Zool. Vol. 78, 2000
Tadarida brasiliensis Mexican freetailbat
–19.7 Muscle I C3 26 1.06 Me Herrera et al. 1993
PrimatesCercopithecus mitis Blue monkey –19.4 5.9 Bone H3 C3 2 3.83 Me Ambrose and DeNiro
1986f
Colobus guerza Black and whitecolobus
–18.8 5.6 Bone H3 C3 2 4.01 Me Ambrose and DeNiro1986f
Papio anubius Anubis baboon –17.3 5.8 Bone H3 C3 2 4.25 Ambrose and DeNiro1986f
Papio cynocephalus Chacma baboon –19.3 6.1 Bone O C3 30 4.28 Me Thackeray et al. 1996Rodentia
Pedetes capensis Springhare 8.0 Bone H3 C3 34 3.49 Xe Sealy et al. 19878.8 Muscle H3 C3 34 3.49 Xe Sealy et al. 1987
Neotoma lepida Wood rat –14.4 5.8 Bone H3 C3 36 2.16 Xe Schoeninger andDeNiro 1984
Microtus townsendii Field vole –23.2 Bone H3 C3 49 1.57 Me Hobson and Schwarcz1986
Hystrix africaeaustralis Porcupine –15.5 6.6 Bone H3 C3 2 4.29 Me Ambrose and DeNiro1986f
CetaceaTursiops truncatus Bottle-nosed
dolphin–12.5 16.2 Bone V M 36 5.34 Schoeninger and
DeNiro 1984Delphinus delphis Common dolphin –13.9 15.5 Bone V M 36 4.76 Schoeninger and
DeNiro 1984–17.8 14.8 Muscle V M 49 4.76 Ostrom et al. 1993
Lagenorhynchusalbirostris
White-beakeddolphin
–18.1 16.2 Muscle V M 49 5.26 Ostrom et al. 1993
Lagenorhynchusobliquidens
Pacific white-sided dolphin
–12.2 15.1 Bone V M 36 4.79 Schoeninger andDeNiro 1984
Globicephala melas Long-finned pilotwhale
–18.0 13.3 Muscle I M 41 6.44 Abend and Smith1997
Globicephala sieboldii Short-finned pilotwhale
–12.1 16.3 Bone I M 36 6.44 Schoeninger andDeNiro 1984
Lissodelphis borealis Northern rightwhale dolphin
–18.7 11.8 Muscle V M 4.90 Gould et al. 1997f
Phocoena phoceona Harbor porpoise –11.6 16.6 Bone V M 36 4.78 Schoeninger andDeNiro 1984
Phocoenoides dalli Dall’s porpoise –12.9 15.6 Bone V M 36 5.16 Schoeninger andDeNiro 1984
Delphinapterus leucas Beluga whale –14.1 16.8 Bone V M 60 5.91 Schoeninger andDeNiro 1984
–18.1 16.6 Bone V M 74 5.91 Hobson and Welch1992f
Modon monoceros Narwhal –18.0 15.8 Muscle V M 74 6.08 Hobson and Welch1992f
Mesoplodon bidens Sowerby’s beakedwhale
–18.5 11.7 Muscle I M 49 6.53 Ostrom et al. 1993
Kogia breviceps Pygmy spermwhale
–17.2 11.9 Muscle I M 49 5.56 Ostrom et al. 1993
Eschrichtius robustus Gray whale –13.3 13.0 Bone I M 36 7.45 Schoeninger andDeNiro 1984
Balaenopteraacutorostrata
Minke whale –14.0 14.4 Bone I M 36 6.95 Schoeninger andDeNiro 1984
–18.3 12.3 Muscle I M 49 6.95 Ostrom et al. 1993Balaenoptera physalus Fin whale –15.4 12.7 Bone I M 40 7.90 Schoeninger and
DeNiro 1984Balaenoptera musculus Blue whale –13.5 13.8 Bone I M 36 8.18 Schoeninger and
DeNiro 1984–20.1 9.6 Muscle I M 49 8.18 Ostrom et al. 1993
Megaptera novaeangliae Humpback whale –18.7 13.4 Muscle I M 49 7.60 Ostrom et al. 1993Balaena mysticetus Bowhead whale –15.9 14.5 Bone I M 65 8.04 Schoeninger and
DeNiro 1984
Table A2 (continued).
J:\cjz\cjz78\cjz-01\Z99-165.vpFriday, February 25, 2000 1:55:43 PM
Color profile: DisabledComposite Default screen

© 2000 NRC Canada
Review / Synthèse 25
CarnivoraAlopex lagopus Arctic fox –20.6 5.9 Bone V C3 60 3.54 Me Schoeninger and
DeNiro 1984–17.7 Bone V C3 66 3.54 Me Angerbjorn et al.
1994f
Canis aureus Golden jackal –8.7 11.4 Bone V C4 2 0.97 Xe Ambrose and DeNiro1986f
Canis lupus Wolf –20.6 9.9 Bone V C3 65 4.53 Me Bocherens et al. 1994f
Otocyon megalotis Bat-eared fox –8.6 17.2 Bone I C4 2 3.62 Xe Ambrose and DeNiro1986f
Ursus americanus Black bear –20.8 4.9 Bone O C3 45 5.13 Me Bocherens et al. 1994f
Ursus arctos Brown bear –20.2 6.9 Bone O C3 41 5.25 Me Bocherens et al. 1994f
Ursus maritimus Polar bear –15.7 Bone V M 61 5.48 Ramsay and Hobson1991f
–18.0 21.1 Muscle V M 75 5.48 Hobson and Welch1992f
Procyon lotor Racoon –22.8 11.0 Bone I C3 45 3.77 Me Bocherens et al. 1994f
Mustela vison Mink –16.0 16.5 Muscle V C3 57 2.94 Me Ben-David et al.1997b
Martes foina Stone marten –20.7 Bone V C3 51 3.00 Me Grupe and Kruger1990f
Martes martes Pine marten –20.3 Bone V C3 51 3.14 Me Grupe and Kruger1990f
Martes pennanti Fisher –20.9 6.7 Bone V C3 55 3.43 Me Bocherens et al. 1994f
Mellivora capensis Honey badger –14.7 10.8 Bone V C4 2 3.89 Xe Ambrose and DeNiro1986f
Enhydra lutris Sea otter –9.8 14.2 Bone I M 40 2.43 Schoeninger andDeniro 1984
Genetta genneta Genette –20.0 10.8 Bone V C3 65 3.21 Bocherens et al. 1994f
Ichneumia albicauda White-tailedmongoose
–10.1 12.7 Bone I C4 2 3.63 Xe Ambrose and DeNiro1986f
Crocuta crocuta Spotted hyena –6.9 11.2 Bone V C4 2 4.84 Xe Ambrose and DeNiro1986f
Felis concolor Mountain lion –17.6 7.6 Bone V C3 36 4.69 Schoeninger andDeNiro 1984
Lynx canadensis Bobcat –15.8 10.0 Bone V C3 36 3.97 Schoeninger andDeNiro 1984
Lynx rufus Lynx –22.4 6.2 Bone V C3 55 3.98 Me Bocherens et al. 1994f
Panthera tigris Tiger –18.0 8.1 Bone V C3 20 5.05 Me Schoeninger andDeNiro 1984
Panthera pardus Leopard –7.1 10.2 Bone V C4 2 4.63 Ambrose and DeNiro1986f
Panthera leo Lion –5.7 9.8 Bone V C4 2 5.24 Xe Ambrose and DeNiro1986f
Acinonyx jubatus Cheetah –12.7 10.1 Bone V C4 2 4.69 Xe Ambrose and DeNiro1986f
PinnipediaCallorhinus ursinus Northern fur seal –18.9 16.6 Muscle V M 57 5.04 Hobson et al. 1997cArctocephalus gazella Antarctic fur seal 7.8 Muscle I M 65 4.97 Rau et al. 1992Arctocephalus pusillus Cape fur seal 17.6 Bone V M 34 5.03 Sealy et al. 1987
19.4 Muscle V M 34 5.03 Sealy et al. 1987Eumetopias jubatus Northern sea lion –18.2 17.5 Muscle V M 60 5.83 Hobson et al. 1997cf
Zalophus californianus California sea lion –12.7 19.3 Bone V M 40 4.88 Schoeninger andDeNiro 1984
Odobenus rosmarus Walrus –13.9 12.3 Bone I M 60 6.03 Schoeninger andDeNiro 1984
–18.7 11.7 Muscle I M 65 6.03 Muir et al. 1995f
Lobodon carcinophagus Crabeater seal 5.9 Muscle I M 65 5.36 Rau et al. 1992Hydrurga leptonyx Leopard seal 7.7 Muscle V M 65 5.74 Rau et al. 1992Ommatophoca rossii Ross’ seal 9.1 Muscle I M 65 5.48 Rau et al. 1992Erignathus barbatus Bearded seal –16.6 16.8 Muscle I M 74 5.39 Hobson and Welch
1992f
Table A2 (continued).
J:\cjz\cjz78\cjz-01\Z99-165.vpFriday, February 25, 2000 1:55:45 PM
Color profile: DisabledComposite Default screen

© 2000 NRC Canada
26 Can. J. Zool. Vol. 78, 2000
Phoca groenlandica Harp seal –15.2 15.6 Bone V M 50 5.19 Schoeninger andDeNiro 1984
Phoca hispida Ringed seal –16.2 Bone V M 63 5.01 Ramsay and Hobson1991f
–17.3 17.3 Muscle V M 74 5.01 Hobson and Welch1992f
Phoca vitulina Harbor seal –12.3 17.6 Bone V M 36 5.04 Schoeninger andDeNiro 1984
–17.6 18.6 Muscle V M 60 5.04 Hobson et al. 1997cf
ProboscideaElephas maximus Asian elephant –18.6 Bone H3 C3 18 6.40 Me Sukumar and Ramesh
1992Loxodonta africana African elephant –18.4 13.8 Bone H3 C3 0 6.40 Me Tieszen et al. 1989
HyracoideaProcavia capensis Hyrax –11.0 Bone H3 C3 3 3.51 Xe DeNiro and Epstein
1978bHeterohyrax brucei Gray hyrax –20.0 Bone H3 C3 3 3.48 Xe DeNiro and Epstein
1978b–17.0 9.2 Bone H3 C3 2 3.48 Xe Ambrose and DeNiro
1986f
PerissodactylaEquus zebra Mountain zebra –11.8 Bone H4 C4 5.46 Me Vogel 1978Equus burchelli Burchell’s zebra –8.3 6.7 Bone H4 C4 2 5.33 Me Ambrose and DeNiro
1986f
Ceratotherium simum White rhinoceros –10.2 Bone H4 C4 5.26 Me Vogel 1978Artiodactyla
Potamochoerus porcus Bushpig –18.0 7.1 Bone O C3 2 4.74 Me Ambrose and DeNiro1986f
Hylochoerusmeinertzhageni
Giant forest hog –24.4 4.3 Bone H3 C3 2 5.15 Me Ambrose and DeNiro1986f
Phacochoerusaethiopicus
Warthog –8.8 7.4 Bone H3 C3 2 4.83 Me Ambrose and DeNiro1986f
–10.6 Muscle H3 C3 22 4.83 Me Vogel 1978Hippopotamus
amphibiusHippopotamus –8.4 8.3 Bone H4 C4 2 6.15 Me Ambrose and DeNiro
1986f
Odocoileus hemionius Mule deer –22.0 5.8 Bone H3 C3 26 4.66 Me Schoeninger andDeNiro 1984
–20.6 Bone H3 C3 41 4.66 Me Hobson and Schwarcz1986
Odocoileus virginianus White-tailed deer –21.3 4.8 Bone H3 C3 55 4.76 Me Cormie and Schwarcz1994
Rangifer tarandus Reindeer –19.6 1.9 Bone H3 C3 65 5.03 Me Bocherens et al. 1994f
–28.7 Muscle H3 C3 70 5.03 Me Schell and Ziemann1989
Giraffa camelopardalis Giraffe –20.0 6.9 Bone H3 C3 2 6.00 Xe Ambrose and DeNiro1986f
Tragelaphus angasi Nyala –18.7 Bone H3 C3 4.88 Vogel 1978Tragelaphus scriptus Bushbuck –21.2 6.6 Bone H3 C3 2 4.70 Me Ambrose and DeNiro
1986f
Tragelaphus strepsiceros Greater kudu –21.1 Bone H3 C3 18 5.29 Xe Sillen 1988f
Tragelaphus imberbis Lesser kudu –21.1 Bone H3 C3 25 5.13 Xe Vogel 1978Tragelaphus euryceros Bongo –25.0 5.2 Bone H3 C3 2 5.52 Me Ambrose and DeNiro
1986f
Taurotragus oryx Eland –18.3 8.0 Bone H3 C3 2 5.56 Xe Ambrose and DeNiro1986f
Syncerus caffer Buffalo –11.0 6.3 Bone H4 C4 2 5.70 Me Ambrose and DeNiro1986f
Bison bison Bison –20.5 4.4 Bone H3 C3 60 5.83 Xe Bocherens et al. 1994f
–19.3 Bone H3 C3 52 5.83 Xe Chisholm et al. 1986
Sylvicapra grimmia Duiker –21.2 Bone H3 C3 14 4.21 Me van der Merwe et al.1988
–19.8 5.9 Bone H3 C3 2 4.21 Me Ambrose and DeNiro1986f
Table A2 (continued).
J:\cjz\cjz78\cjz-01\Z99-165.vpFriday, February 25, 2000 1:55:46 PM
Color profile: DisabledComposite Default screen

© 2000 NRC Canada
Review / Synthèse 27
Kobus ellipsiprymnus Waterbuck –9.5 7.3 Bone H4 C4 2 5.20 Me Ambrose and DeNiro1986f
Redunca arundinum Reedbuck –6.4 Bone H4 C4 18 4.65 Me Sillen 1988f
Redunca redunca Bohor reedbuck –8.9 7.1 Bone H4 C4 2 4.60 Me Ambrose and DeNiro1986f
Redunca fulvorofula Mountainreedbuck
–8.0 6.4 Bone H4 C4 2 4.49 Me Ambrose and DeNiro1986f
Hippotragus equinus Roan antelope –13.6 Bone H4 C4 5.40 Vogel 1978Oryx gazella Gemsbok –11.5 Bone H3 C3 22 5.32 Xe Vogel 1978
–12.1 Muscle H3 C3 22 5.32 Xe Vogel 1978Damaliscus dorcas Bontebok –8.0 Bone H4 C4 4.79 Xe Vogel 1978Damaliscus lunatus Topi –6.8 Bone H4 C4 25 5.11 van der Merwe et al.
1988Alcephalus buselaphalus Hartebeest –9.2 Bone H4 C4 34 5.13 Me Vogel 1978
–10.5 Muscle H4 C4 34 5.13 Me Vogel 1978Sigmoceros lichtensteinii Lichtenstein’s
hartebeest–6.5 Bone H3 C3 14 5.24 Me van der Merwe et al.
1988Connochaetes gnou Black wildebeest –7.3 Bone H4 C4 27 5.26 Xe van der Merwe et al.
1988Connochaetes taurinus Blue wildebeest –6.9 7.9 Bone H4 C4 27 5.27 Xe Ambrose and DeNiro
1986f
–9.0 Bone H4 C4 5.27 Xe Vogel 1978Oreotragus oreotragus Klipspringer –18.8 10.0 Bone H3 C3 2 4.08 Xe Ambrose and DeNiro
1986f
Ourebia ourebi Oribi –8.2 Bone H3 C3 4.10 Vogel 1978Raphicerus campestris Steenbok 6.1 Bone H3 C3 4.05 Xe Sealy et al. 1987
–17.6 7.1 Bone H3 C3 2 4.05 Xe Ambrose and DeNiro1986f
5.7 Muscle H3 C3 4.05 Xe Sealy et al. 1987Raphicerus melanotis Cape grysbok –23.1 Bone H4 C4 4.02 Xe Vogel 1978Madoqua kirki Kirk’s dik dik –18.9 9.4 Bone H3 C3 2 4.74 Xe Ambrose and DeNiro
1986f
Aepyceros melampus Impala –9.4 8.0 Bone H4 C4 2 4.70 Me Ambrose and DeNiro1986f
–15.5 Muscle H4 C4 25 4.70 Me Vogel 1978Gazella thomsoni Thompson’s
gazelle–12.0 9.7 Bone H4 C4 2 4.34 Xe Ambrose and DeNiro
1986f
Gazella granti Grant’s gazelle –18.2 8.9 Bone H3 C3 2 4.70 Xe Ambrose and DeNiro1986f
Antidorcas marsupialis Springbok 15.9 Bone H3 C3 4.59 Xe Sealy et al. 1987–18.1 Bone H3 C3 34 4.59 Xe Vogel 1978
15.6 Muscle H3 C3 4.59 Xe Sealy et al. 1987Rupicapra rupicapra Chamois –20.4 2.6 Bone H3 C3 43 4.18 Me Bocherens et al. 1994f
Ovibus moschatus Muskox –20.6 5.9 Bone H3 C3 65 2.32 Me Bocherens et al. 1994f
aH3, herbivores that eat C3 plants; H4, herbivores that eat C4 plants; V, carnivores that eat vertebrates; I, carnivores that eat invertebrates; O, omnivoresthat eat both plants and animals.
bTrophic chain on which the species relies: C3, C4, or marine (M).cWhen two values are give for latitude, the first was used to relateδ13C values of bone and the second to relateδ13C values of muscle. Units are
degrees of latitude.dLog body mass.eEstimated for terrestrial mammals only: Xe, species uses xeric habitats; Me, species uses mesic habitats.fLipids were extracted from sample, otherwise no treatment of lipids was indicated in the Methods.
Table A2 (concluded).
J:\cjz\cjz78\cjz-01\Z99-165.vpFriday, February 25, 2000 1:55:47 PM
Color profile: DisabledComposite Default screen