stable carbon and nitrogen isotopic compositions of...
TRANSCRIPT

lable at ScienceDirect
Atmospheric Environment 131 (2016) 243e253
Contents lists avai
Atmospheric Environment
journal homepage: www.elsevier .com/locate/atmosenv
Stable carbon and nitrogen isotopic compositions of ambient aerosolscollected from Okinawa Island in the western North Pacific Rim, anoutflow region of Asian dusts and pollutants
Bhagawati Kunwar, Kimitaka Kawamura*, Chunmao ZhuInstitute of Low Temperature Science, Hokkaido University, N19 W8, Kita-ku, Sapporo, Japan
h i g h l i g h t s
� We measured stable carbon and nitrogen isotope ratios in Okinawa aerosols.� We found serious transport of Asian dust and pollutants in winter and spring.� d13C of Okinawa aerosol are ca. 2‰ higher than those of Chinese megacities.� Organic aerosols may be photochemically more aged during atmospheric transport.� We found significant contribution of Ca in spring but carbonate was already titrated.
a r t i c l e i n f o
Article history:Received 17 December 2015Received in revised form19 January 2016Accepted 20 January 2016Available online 27 January 2016
Keywords:Isotope ratiosTotal carbonTotal nitrogenNitrateWater-soluble organic nitrogen
* Corresponding author.E-mail address: [email protected]
http://dx.doi.org/10.1016/j.atmosenv.2016.01.0351352-2310/© 2016 Elsevier Ltd. All rights reserved.
a b s t r a c t
Stable carbon (d13C) and nitrogen (d15N) isotope ratios were measured for total carbon (TC) and nitrogen(TN), respectively, in aerosol (TSP) samples collected at Cape Hedo, Okinawa, an outflow region of Asianpollutants, during 2009e2010. The averaged d13C and d15N ratios are �22.2‰ and þ12.5‰, respectively.The d13C values are similar in both spring (�22.5‰) and winter (�22.5‰), suggesting the similar sourcesand/or source regions. We found that d13C from Okinawa aerosols are ca. 2‰ higher than those reportedfrom Chinese megacities probably due to photochemical aging of organic aerosols. A strong correlation(r ¼ 0.81) was found between nss-Ca and TSP, suggesting that springtime aerosols are influenced fromAsian dusts. However, carbonates in the Asian dusts were titrated with acidic species such as sulfuric acidand oxalic acid during atmospheric transport although two samples suggested the presence of remainingcarbonate. No correlations were found between d13C and tracer compounds (levoglucosan, elementalcarbon, oxalic acid, and Naþ). During winter and spring, coal burning is significant source in China. Basedon isotopic mass balance, contribution of coal burning origin particles to total aerosol carbon was esti-mated as ca. 97% in winter, which is probably associated with the high emissions in China. Contributionof NO3
� to TN was on average 45% whereas that of NH4þ was 18%. These results suggest that vehicular
exhaust is an important source of TN in Okinawa aerosols. Concentration of water-soluble organic ni-trogen (WSON) is higher in summer, suggesting that WSON is more emitted from the ocean in warmerseason whereas inorganic nitrogen is more emitted in winter and spring from pollution sources in theAsian continent.
© 2016 Elsevier Ltd. All rights reserved.
1. Introduction
Atmospheric aerosols are solid particles suspended in gaseousand liquid phase. They are emitted to the atmosphere from naturaland anthropogenic sources. In East Asia, fossil fuel consumption,
(K. Kawamura).
biomass burning, industrial and vehicular emissions have signifi-cantly increased due to the growing economies (Ohara et al., 2007).Primary organic aerosols are formed by the direct emissions ofbiogenic and anthropogenic particles to the atmosphere. Secondaryorganic aerosols (SOA) are formed by the atmospheric oxidation ofbiogenic and anthropogenic volatile organic compounds (VOC)during long-range atmospheric transport (Hallquist et al., 2009;Pokhrel et al., 2015; 2016). In East Asia, atmospheric aerosols and

B. Kunwar et al. / Atmospheric Environment 131 (2016) 243e253244
their precursors are significantly emitted from the highly populatedand rapidly developing industrial regions and are transported tothe North Pacific. Okinawa Island is located in the western NorthPacific Rim: an outflow region of Asian aerosols and theirprecursors.
Studies on aerosol isotopic composition have been conducted inEast Asia. Stable carbon and nitrogen isotope ratios can be used toidentify the sources and transformation processes of atmosphericparticles (Cachier et al., 1986; Kawamura et al., 2004; Kawashimaand Haneishi, 2012; Kundu et al., 2010; Kundu and Kawamura,2014; Cao et al., 2011). Recently, Miyazaki et al. (2012) discussedthe source of water-soluble organic carbon (WSOC) in forest aero-sols using d13C ratios. Kinetic isotope effect (KIE) is defined as theratio of rate constant for the species containing 12C and 13C atoms(k12/k13), which can be obtained from the slope of the regressionline for the relation between the concentrations and stable carbonisotope ratio (d13C). d13C values are largely dependend on the agingof polar compounds such as oxalic acid (Pavuluri et al., 2012).During oxidation processes, the isotopic fractionation occurs leav-ing the lighter isotopes in the product and heavier isotopes in thereactants due to the KIE (Fisseha et al., 2009).
In addition, d13C can be used to evaluate the source from coalcombustion, biogenic and vehicular emission (G�orka and Jedrysek,2008; G�orka et al., 2009, 2014). Takahashi et al. (2008) measuredd13Celemental carbon (EC) in TSP samples in Beijing, China (annualaverage �24.6 ± 0.7‰) and in Tokyo (�25.1 ± 0.1‰). They reportedhigher values (�23.4 ± 1.2‰) in China during winter due to sig-nificant emissions from coal combustion. L�opez-Veneroni (2009)reported d13CTC in PM2.5 and in PM10 in Mexico, which was influ-enced from the dust, diesel and gasoline vehicles. Similarly,Kawashima and Haneishi (2012) reported d13CEC for the emissionsfrom gasoline-powered vehicles (�24.4 to �20.6‰), diesel-powered vehicles (�24.2 to �24.9‰), coal burning (�23.3‰) andsoils (�18.8‰). Based on the isotopic mass balance equation, G�orkaet al. (2014) estimated the contribution of biogenic and anthropo-genic sources for PM10 samples.
Oxidation products of VOC have lower vapour pressure than theprecursor VOC and can partition into the particle phase, formingSOA (Hallquist et al., 2009). Organic compounds that are present inparticulate matter can be scavenged from the atmosphere by dryand wet deposition. During deposition process of particles, isotopefractionation does not occur. However, reactions within the parti-cles can change the isotope ratios. Although these reactions are notfully understood, it is known that if photochemical degradation ofoxalic acid catalysed by iron species is significant, the isotope ratiosof remaining oxalic acid become higher due to KIE effects (Pavuluriet al., 2012). If oxalic acid were the major component of organicaerossol, d13C of aerossol TC should become higher during longrange atmospheric transport. Organic compounds produced by theoxidation processes show smaller isotope ratios (Fisseha et al.,2009) while the remaining precursors are enriched with heavierisotopes (Anderson et al., 2004). d13C of aerosols can also be used todistinguish the contribution of C3 versus C4 vegetation type(Martinelli et al., 2002).
Nitrogen (N2) in the atmosphere can be converted into NO3� and
NH4þ via nitrification or denitrification process (Hem, 1985; Raven
et al., 1992). Volatile organic nitrogen is released to the atmo-sphere during the plant and animal decay. Fossil fuel combustionand industrial emission contribute gaseous NOx and nitrate, whichcan travel long distances. The use of d15N can decipher the origin,cycling of organic and inorganic nitrogen as well as atmosphericprocessing of nitrogen species (Cornell et al., 1995; Yeatman et al.,2001; Kelly et al., 2005). The importance of d15N in the atmo-sphere is well documented in many literature (e.g., Kundu et al.,2010). In the atmosphere there are naturally occurring two stable
isotopes of 14N and 15N. 14N is most common and its abundance inN2 gas is 99.63% (Mariotti, 1983). With regard to reaction kinetics,two nitrogen isotopes show different behaviors. Thus, dependingupon the nature of formation processes and their precursors, iso-topic composition of particular nitrogen species will be different(Pavuluri et al., 2011).
Here, we report one year observation of stable carbon and ni-trogen isotope ratios of the ambient aerosols (TSP samples)collected at Cape Hedo, Okinawa Island in thewestern North PacificRim: an outflow region of Asian dusts and pollutants. The majorgoal of this study is to identify the specific sources of carbonaceousaerosols in the Asian outflow regions during winter, spring, sum-mer and autumn. In winter and spring, anthropogenic activities areknown to influence the study site, whereas in summer marine ac-tivities influence the site (Kunwar and Kawamura, 2014a). Here, wealso discuss seasonal changes of the isotope ratios in terms ofsource and source regions, and the aging of organic aerosols duringlong-range atmospheric transport.
2. Experimental
2.1. Site description and aerosol sampling
Aerosol samples were collected from November 2009 for twoyears and half on the rooftop of the facility of Cape Hedo Atmo-sphere and Aerosol Measurement Station (CHAAMS, 26.87�N,128.26�E). CHAAMS is located at the northwestern edge of OkinawaIsland, Japan (see Fig. 1), which is within the outflow region of EastAsian dusts and pollutants. Because of its location, CHAAMS hasbeen used as a supersite of the Atmospheric Brown Clouds (ABC)project by the United Nations Environment Programme (UNEP) forthe study of atmospheric aerosols (Takami et al., 2007). The sur-roundings of Cape Hedo are covered with subtropical rain forestand thus there are no major industries near the station andanthropogenic activities are insignificant (Yamamoto andKawamura, 2011; Sato et al., 2009; Takami et al., 2007; Duncanet al., 2007; Verma et al., 2011). It is influenced by the East Asianmonsoon inwinter to spring whereas the monsoon from the PacificOcean affects the region in summer to fall (Sato et al., 2009).Therefore, continental air masses arrive over the sampling site inwinter to spring. This is supported by air mass trajectory analyses(Fig. S1).
Aerosol (TSP) samples (n ¼ 50) were collected on a weekly basisusing a pre-combusted quartz fiber filter and high-volume airsampler (Kunwar and Kawamura, 2014a,b) at a flow rate of60 m3 h�1 on a weekly basis. The average volume of the aircollected is 9500 m3. Filter samples were placed in a preheatedglass jar with a Teflon-lined screw cap, shipped from Cape Hedo toSapporo and stored in a freezer room at �20 �C until analysis. Thesampling period for each sample is 7 days. Quartz fiber filter mayadsorb organic vapor, causing positive artifacts on the measure-ments. However, due to relatively long sampling period (oneweek),we consider that artifacts were minimal.
2.2. Measurements of TC and TN, and their stable isotopes
Tomeasure total carbon (TC) and nitrogen (TN), we combusted asmall filter disc (3.14 cm2) placed in a tin cup at 1400 �C usingelemental analyzer (EA) (Carlo Ebra, EA 1500). All the nitrogenspecies are converted to NO and further reduced to N2 in a reduc-tion column. Carbonaceous species are oxidized to carbon dioxide(CO2). N2 and CO2 are separated on a packed column of gas chro-matograph installed in EA and measured with a thermal conduc-tivity detector (Pavuluri et al., 2010; Kawamura et al., 2004).Portions of CO2 and N2 gases were transferred to EA/isotope ratio

Fig. 1. Map of Cape Hedo, Okinawa, Japan where one year sampling was performed.
B. Kunwar et al. / Atmospheric Environment 131 (2016) 243e253 245
mass spectrometer (irMS) via an interface (ConFlo II) for isotoperatio measurement. The d13C values of TC and d15N of TN arecalculated using the following equation:
d13Cð‰Þ ¼hð13C=12CÞsample
.ð13C=12CÞstandard � 1
i� 1000
(1)
d15Nð‰Þ ¼hð15N=14NÞsample
.ð15N=14NÞstandard � 1
i� 1000
(2)
Organic nitrogen (ON) is calculated using following equation(Wang et al., 2010):
ON ¼ TN� 14��h
NO�3
i.62þ
hNHþ
4
i.18
�(3)
NO�3 and NHþ
4 are the major ions detected in our samples.
2.3. Measurements of WSOC, WSTN, and major inorganic ions
Concentrations of water-soluble organic carbon (WSOC) andwater-soluble total nitrogen (WSTN) were measured using a totalcarbon and nitrogen analyzer (Shimadzu TOC-VCSH). Cation (NH4
þ)and anion (NO3
�) was measured using ion chromatograph (IC) (761Compact IC, Metrohm, Switzerland), as reported in Kunwar andKawamura (2014a). The analytical errors in duplicate analysis ofthe authentic standards were within 5%. We also measured organiccarbon (OC)/elemental carbon (EC) using a Sunset Laboratory car-bon analyzer (Kunwar and Kawamura, 2014a).
2.4. Backward air mass trajectory analysis
Five-day back trajectory analyses were performed to identify thesource regions of air masses arriving over Cape Hedo, at 500 mabove ground level for selected samples using the Hybrid Single-Particle Lagrangian Integrated Trajectory (HYSPLIT4) model(http://www.arl.noaa.gov/ready/hysplit4.html), NOAA Air Re-sources Laboratory, Silver Spring, Maryland, United States (Draxlerand Hess, 1997). Fig. 2 shows the air mass trajectories calculated forselected weeks during winter (December, January and February),spring (March, April and May), summer (June, July and August) andautumn (September, October and November). In spring and winter,our sampling sitewas strongly influenced by the outflows from East
Asia whereas in summer the site was largely affected by oceanic airmasses (Fig. S1).
3. Results and discussion
3.1. Seasonal variations of TC, TN
Table 1 summarizes the data for TC, TN and their stable isotopeswith averages and ranges. Concentrations of TC ranged from 1.0 to5.2 mg m�3 (av. 2.3 ± 1.0 mg m�3). Very high concentration wasobserved on March 16 (7.3 mg m�3) during dust event whereas veryhigh concentration of TN was observed on June 8. Concentrationdata of TC on March 16 and of TN on June 8 are treated as outliers,which are not included in the calculation but explained separately.Weekly concentrations of TC are given in Fig. 3a. The seasonal TCconcentrations were 2.0 ± 0.60 mg m�3 (range: 1.1e3.2 mg m�3) inwinter, 2.3 ± 1.0 mg m�3 (1.2e5.2 mg m�3) in spring, 2.1 ±0.63 mg m�3 (1.1e3.7 mg m�3) in summer, and 1.7 ± 0.63 mg m�3
(1.0e2.6 mg m�3) in autumn. However, seasonal differences are notstatistically significant betweenwinter and spring season (t ¼ �0.7,p ¼ 0.45), and spring and summer (t ¼ 1.6, p ¼ 0.13). HigherTC concentrations in spring and winter suggest that Cape Hedo isseriously influenced by polluted air masses from the Asian conti-nent (Fig. 2). Trajectory analyses show that air masses occasionallypassed over the ocean. In addition, there is an influence of dust andsoils, and biogenic emission during spring. Spring is a growingseason in both continent and ocean (Tambunan et al., 2007;Kunwar and Kawamura, 2014a). Biogenic emission from localvegetation is also important in spring.
We detected the highest concentration of TC (7.3 mgm�3) duringdust event (March 16). In this filter sample, we observed lots of dustparticles, suggesting that high TC content is associated with dustloading. Fine dust particles can enrich organic carbon than coarseparticles (Kawamura et al., 2004). Dust particles also contain car-bonate carbon. In fact, soil dust particles collected from GunsuProvince, China (CJ-1 and CJ-2 yellow sand standards) showed thepresence of inorganic (carbonate) carbon, whose contents areequivalent to organic carbon (Kawamura et al., 2004). Wang et al.(2013) also found higher concentration of TC during dust event inChina.
OC/EC ratios are higher in summer (12.5) than winter (4.4),suggesting that major fraction of OC come from biogenic sourcesprobably due to the enhanced activities of oceanic phytoplankton

Fig. 2. Five-day backward trajectories for selected weeks during winter, spring, summer and autumn. Backward trajectories at 500 m above ground level were drawnwith the NOAAHYSPLIT model.
Table 1Mass concentrations of TC and TN, nitrate- and ammonium-nitrogen, and stable carbon and nitrogen isotope ratios in aerosols from Cape Hedo, Okinawa (n ¼ 50).
Species Winter Spring Summer Autumn
Ave ± STD Range Ave ± STD Range Ave ± STD Range Ave ± STD Range
Total carbon (TC, mg m�3)) 2.0 ± 0.6 1.2e3.2 2.3 ± 1.0 1.2e5.2 2.1 ± 0.63 1.1e3.7 1.7 ± 0.63 1.0e2.6Total nitrogen (TN, mg m�3) 1.19 ± 0.58 0.5e2.4 0.93 ± 0.50 0.4e2.1 0.27 ± 0.10 0.15e0.49 0.43 ± 0.19 0.22e0.96TC/Aerosol mass (%) 3.0 ± 1.2 1.2e5.4 3.0 ± 1.7 1.0e6.5 5.4 ± 1.8 2.8e8.1 3.6 ± 2.3 0.69e8.7TN/Aerosol mass (%) 1.8 ± 1.05 0.48e3.6 1.0 ± 0.85 0.38e3.5 0.94 ± 0.65 0.24e2.9 0.86 ± 0.51 0.22e1.9C/N 1.9 ± 0.67 1.0e3.5 3.0 ± 0.76 1.8e4.8 7.1 ± 2.5 1.1e12 4.4 ± 1.8 2.1e7.5d13C (‰) �22.5 ± 0.62 �24.2 to �21.6 �22.5 ± 0.71 �23.5 to �21.7 �22.9 ± 0.69 �23.9 to �21.6 �22.3 ± 0.88 �22.9 to �19.5d15N (‰) 13.6 ± 1.72 10.4e15.4 13.3 ± 2.7 8.3e18.9 11.1 ± 1.19 9.7e13.2 11.9 ± 2.24 8.0e16.1NO3
�-N 0.41 ± 0.18 0.16e1.4 0.48 ± 0.35 0.16e1.4 0.13 ± 0.02 0.03e0.54 0.27 ± 0.14 0.12e0.50NH4
þ-N 0.39 ± 0.20 0.11e0.75 0.17 ± 0.07 0.00e0.29 0.01 ± 0.02 0.00e0.07 0.08 ± 0.11 0.00e0.27
Note: Outliers have been not included for TC, TN and their stable isotope ratios.
B. Kunwar et al. / Atmospheric Environment 131 (2016) 243e253246
and other biota. However, no statistically significant correlation(r¼ 0.0) was found between OC and Naþ even in summer, althoughmost of the air masses came from the ocean (Fig. S1). Naþ is pri-marily emitted from the marine source. No correlation between OCand Naþ suggests the secondary source of OC. Concentrations of TC
in Cape Hedo are several times lower than those reported frommany Chinese cities including Beijing (Ho et al., 2006; Wang et al.,2010), Gosan, Korea (Kawamura et al., 2004; Kundu et al., 2010),Chennai, India (Pavuluri et al., 2010) and Tokyo (Kawamura andIkushima, 1993). But, they are ca. 5 times higher than those from
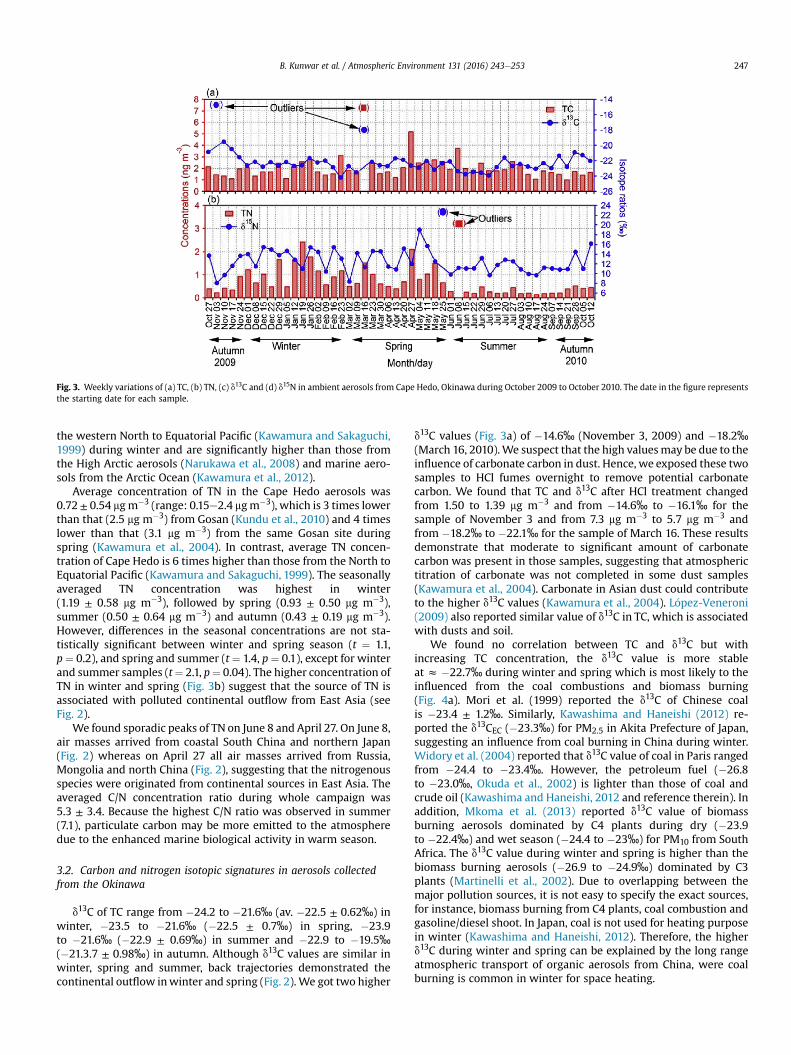
Fig. 3. Weekly variations of (a) TC, (b) TN, (c) d13C and (d) d15N in ambient aerosols from Cape Hedo, Okinawa during October 2009 to October 2010. The date in the figure representsthe starting date for each sample.
B. Kunwar et al. / Atmospheric Environment 131 (2016) 243e253 247
the western North to Equatorial Pacific (Kawamura and Sakaguchi,1999) during winter and are significantly higher than those fromthe High Arctic aerosols (Narukawa et al., 2008) and marine aero-sols from the Arctic Ocean (Kawamura et al., 2012).
Average concentration of TN in the Cape Hedo aerosols was0.72± 0.54 mgm�3 (range: 0.15e2.4 mgm�3), which is 3 times lowerthan that (2.5 mg m�3) from Gosan (Kundu et al., 2010) and 4 timeslower than that (3.1 mg m�3) from the same Gosan site duringspring (Kawamura et al., 2004). In contrast, average TN concen-tration of Cape Hedo is 6 times higher than those from the North toEquatorial Pacific (Kawamura and Sakaguchi, 1999). The seasonallyaveraged TN concentration was highest in winter(1.19 ± 0.58 mg m�3), followed by spring (0.93 ± 0.50 mg m�3),summer (0.50 ± 0.64 mg m�3) and autumn (0.43 ± 0.19 mg m�3).However, differences in the seasonal concentrations are not sta-tistically significant between winter and spring season (t ¼ 1.1,p¼ 0.2), and spring and summer (t ¼ 1.4, p¼ 0.1), except for winterand summer samples (t¼ 2.1, p¼ 0.04). The higher concentration ofTN in winter and spring (Fig. 3b) suggest that the source of TN isassociated with polluted continental outflow from East Asia (seeFig. 2).
We found sporadic peaks of TN on June 8 and April 27. On June 8,air masses arrived from coastal South China and northern Japan(Fig. 2) whereas on April 27 all air masses arrived from Russia,Mongolia and north China (Fig. 2), suggesting that the nitrogenousspecies were originated from continental sources in East Asia. Theaveraged C/N concentration ratio during whole campaign was5.3 ± 3.4. Because the highest C/N ratio was observed in summer(7.1), particulate carbon may be more emitted to the atmospheredue to the enhanced marine biological activity in warm season.
3.2. Carbon and nitrogen isotopic signatures in aerosols collectedfrom the Okinawa
d13C of TC range from �24.2 to �21.6‰ (av. �22.5 ± 0.62‰) inwinter, �23.5 to �21.6‰ (�22.5 ± 0.7‰) in spring, �23.9to �21.6‰ (�22.9 ± 0.69‰) in summer and �22.9 to �19.5‰(�21.3.7 ± 0.98‰) in autumn. Although d13C values are similar inwinter, spring and summer, back trajectories demonstrated thecontinental outflow inwinter and spring (Fig. 2). We got two higher
d13C values (Fig. 3a) of �14.6‰ (November 3, 2009) and �18.2‰(March 16, 2010).We suspect that the high valuesmay be due to theinfluence of carbonate carbon in dust. Hence, we exposed these twosamples to HCl fumes overnight to remove potential carbonatecarbon. We found that TC and d13C after HCl treatment changedfrom 1.50 to 1.39 mg m�3 and from �14.6‰ to �16.1‰ for thesample of November 3 and from 7.3 mg m�3 to 5.7 mg m�3 andfrom �18.2‰ to �22.1‰ for the sample of March 16. These resultsdemonstrate that moderate to significant amount of carbonatecarbon was present in those samples, suggesting that atmospherictitration of carbonate was not completed in some dust samples(Kawamura et al., 2004). Carbonate in Asian dust could contributeto the higher d13C values (Kawamura et al., 2004). L�opez-Veneroni(2009) also reported similar value of d13C in TC, which is associatedwith dusts and soil.
We found no correlation between TC and d13C but withincreasing TC concentration, the d13C value is more stableat z �22.7‰ during winter and spring which is most likely to theinfluenced from the coal combustions and biomass burning(Fig. 4a). Mori et al. (1999) reported the d13C of Chinese coalis �23.4 ± 1.2‰. Similarly, Kawashima and Haneishi (2012) re-ported the d13CEC (�23.3‰) for PM2.5 in Akita Prefecture of Japan,suggesting an influence from coal burning in China during winter.Widory et al. (2004) reported that d13C value of coal in Paris rangedfrom �24.4 to �23.4‰. However, the petroleum fuel (�26.8to �23.0‰, Okuda et al., 2002) is lighter than those of coal andcrude oil (Kawashima and Haneishi, 2012 and reference therein). Inaddition, Mkoma et al. (2013) reported d13C value of biomassburning aerosols dominated by C4 plants during dry (�23.9to �22.4‰) and wet season (�24.4 to �23‰) for PM10 from SouthAfrica. The d13C value during winter and spring is higher than thebiomass burning aerosols (�26.9 to �24.9‰) dominated by C3plants (Martinelli et al., 2002). Due to overlapping between themajor pollution sources, it is not easy to specify the exact sources,for instance, biomass burning from C4 plants, coal combustion andgasoline/diesel shoot. In Japan, coal is not used for heating purposein winter (Kawashima and Haneishi, 2012). Therefore, the higherd13C during winter and spring can be explained by the long rangeatmospheric transport of organic aerosols from China, were coalburning is common in winter for space heating.

Fig. 4. a. Relation between TC concentrations and d13C in TSP samples collected from Cape Hedo, Okinawa. Fig. 4b. Relation between TN concentrations and d15N in TSP samplescollected from Cape Hedo, Okinawa.
B. Kunwar et al. / Atmospheric Environment 131 (2016) 243e253248
Plotting of reciprocal of TC concentration versus d13C data (bi-nary mixing modelee.g., G�orka et al., 2014; Sohn, 2005) can deci-pher the identification of carbon sources. The potential d13C endmember of TC during winter is �23.4‰ (Figure in S2). The relativecontribution of particles originated from coal burning (Ccoal) duringwinter can be estimated by equation (1) in supporting information(SI). Based on the isotopic mass balance equation, the calculatedcontribution Ccoal in Okinawa aerosols is 97% during winter. Thiscalculation suggests a significant contribution of coal combustionover Okinawa via long-range atmospheric transport. China has thehighest rate of coal consumption in the world, generating morethan 75% of its energy from coal (Chen et al., 2005). Moreover, blackcarbon emissions in China are 1499 Gg, of which 36% are consumedin industry and 55% are consumed for residential heating.
As mentioned above, most of the air parcels come from Chinaduring winter and spring (see Fig. S1). Thus, it is also important tocompare our data with those from Chinese cities (Cao et al., 2011)and Gosan site (Jung and Kawamura, 2011; Kawamura et al., 2004;Kundu et al., 2010); especially Gosan is located on the pathwayfrom China to Okinawa (see Fig. 1). The average d13C value in thenorthern part of China during winter is �24.4‰ (Cao et al., 2011),which is slightly lower (by 1.0‰) than that (�23.4‰) of Gosanaerosols (Kawamura et al., 2004). The d13C value of Gosan aerosolsis also lower than wintertime Okinawa aerosols (�22.5‰), sug-gesting an enrichment of 13C by 1.9‰ than that of Chinese aerosols.
To confirm the Asian dust contribution to the Okinawa aerosols,we performed correlation analyses between nss-Ca and TC inspring. We found a strong correlation (r2 ¼ 0.67) between nss-Caand TC, suggesting a significant influence from Asian dust inwhich nss-Ca is enriched (Kawamura et al., 2004). However, we didnot obtain any good correlation (r ¼ 0.06) between nss-Ca/TC andd13C, suggesting that most carbonate is titrated by acidic species(such as H2SO4) in the aerosols during the long-range transportfrom China to Okinawa. This result is in contrast to that of Gosansite (Kawamura et al., 2004), where atmospheric titration of car-bonate is less significant due to the short distance from the sourceregions in China. This may suggest that, during long-range atmo-spheric transport, organic aerosols are internally mixed with min-eral dust when they pass over the continent, coast and ocean.
To identify the source regions of summer aerosols, we per-formed air mass back trajectory analyses for each sample and foundthat all the samples, except for 4 samples, have marine influencewith some continental influence as seen in Fig. 2. We found verynarrow range of d13C (�21.6 to �23.9‰) in summer. These valuesare comparable to those (�23.3 to �20‰) reported for the marine
aerosols by Ceburnis et al. (2011). Interestingly, we obtained lowerd13C value in summer samples, which may be due to potential in-fluence from Philippines (Fig. 2). Loh et al. (2004) showed thatprotein like materials, carbohydrates and dissolved organic carbonin oceanwater ranged from�21.1 to�20.7‰. Fry and Parker (1979)showed larger d13C values for the marine phytoplankton (�18to �24‰) and marine macro algae (�8 to �27‰), suggesting thatsummertime aerosols are more influenced from phytoplankton andmacro algae in the ocean.
In addition, Xiao and Liu (2010) reported C/N ratios in riverphytoplankton with a range of 4e10. Interestingly, summer sam-ples show the similar range (range: 4 to 11.6), which further sup-ports that marine emission from phytoplankton is an importantsource of organic aerosols in summer.
The d15N in Okinawa aerosols ranged from 8.0 to 18.9‰(12.2 ± 2.2‰, excluding outlier), which are slightly smaller thanthose (6.8e26.2‰, av. 15.1 ± 3.4‰) from Gosan aerosols (Kunduet al., 2010). The d15N value ranged from 10.4 to 15.4‰(13.6 ± 1.7‰) in winter, 8.3e18.9‰ (13.3 ± 0.5‰) in spring,9.7e13.2‰ (11.1 ± 1.2‰) in summer, and 8.0e16.1‰ (11.9 ± 2.2‰)in autumn. The average values are similar in winter and spring,suggesting a similar type of source is likely in winter and spring.Further, the d15N are similar during autumn and summer. Theaverage value d15N of TN for biomass burning aerosols is 23.5‰(23.5e25.7‰) (Kundu et al., 2010) whereas it is 15‰ in the marineaerosols from Jeju Island in the East China Sea (Kundu et al., 2010).d15N from Cape Hedo is similar to that (10.6‰) of aerosol samplesfrom Piracicaba, Brazil (Martinelli et al., 2002).
d15N derived from the combustion of natural gas and fuel oilranged from 2.9 to 15.4‰, �19 to 2.9‰, respectively (Widory,2007). Those of diesel oil varied from 3.9 to 5.4‰ whereas that ofunleaded gasoline was 4.6‰ (Widory, 2007). Heaton (1990) re-ported that d15N of NOx derived from diesel engines rangefrom �13 to �2‰ whereas those from coal-fired power stationsrange from 6 to 13‰. In spite of an increase in the concentration ofTN, d15N value is stable around at ~12.4‰, which is most likely adominant nitrogen source during winter and spring (Fig. 4b). Thisvalue from Okinawa is similar to that reported from coal-fired po-wer station and combustion of natural gases (Heaton, 1990). Inaddition, d15N value of our study is similar to those (5.0e13.7‰, av.9.9 ± 2.0‰) reported by G�orka et al. (2012) and those (5.3e16.1‰,10.7 ± 3.1‰) by Widory (2007) for PM10 aerosol samples. Yeatmanet al. (2001) reported lesser d15N value in coastal region (�20 to22‰) for NH4
þ. In the Okinawa aerosols, there is no correlationbetween d15N and TN.

Fig. 5. Relation between d13C versus d15N with signed level of potential sources in TSP samples collected from Cape Hedo, Okinawa. Data of d13C and d15N adopted from (a) Fry andParker (1979), (b) Gleason and Kyser (1984), (c) Chesselet et al. (1981), (d) Peng et al. (2006), (e) Kundu et al. (2010), (f) Heaton (1990), (g) Widory (2007), (h) Mkoma et al. (2013).
B. Kunwar et al. / Atmospheric Environment 131 (2016) 243e253 249
Fig. 5 shows the relation between d13C and d15N with signedlevel of sources reported in previous studies. No significant corre-lation was found between d13C and d15N, suggesting that differentsources of aerosol C and N in Okinawa. During winter when d13Cranged from �24.2 to �21.6‰, d15N ranged from 10.4 to 15.4‰.During growing season (spring) when d13C values rangedfrom �23.5 to �21.7‰, d15N ranged from 8.3 to 18.3‰. The d15Nvalues are higher in spring. The overlapping of data during winterand spring may suggest emissions from the coal burning for spaceheating in China, industrial coal-power plant and biomass burning,which are major sources of nitrogenous species during winter andspring.
As suggested by Pavuluri et al. (2010), the enrichment of 15N inaerosol is due to the following two reaction mechanisms betweengas and aerosols, leaving larger d15N values in the particles:
NH3 þ Hþ/NHþ4 (1)
HNO3/Hþ þ NO�3 (2)
In equation (1), the conversion of gaseous NH3 to particle NH4þ
occurs under the lower pH conditions of aerosols. It is meaningfulto describe that the measured pH of the water extracts from Oki-nawa aerosol samples is on average 5.3, which is lower than that ofspring samples (5.6). Sulfuric acid probably contributed to lowerthe pH of the atmospheric aerosols. However, the N budget andpossible isotopic reactions/exchanges in the atmosphere are verycomplicated (Widory, 2007; Ciezka et al., 2015).
3.3. Sources of WSOC and ON
We found a strong correlation (r ¼ 0.88) between TC and TN inspring (Fig. 6). We also found a fairly good correlation (r ¼ 0.74)between TC and TN in winter. The high OC/EC ratios throughoutfour seasons in Okinawa suggest that organic aerosols aresecondarily formed by the oxidation of organic precursors (Kunwarand Kawamura, 2014a). To better understand the variation of d13C
(primary or secondary), we conducted correlation analysis forWSOC vs d13C because WSOC is mainly formed by the atmosphericoxidation of precursor organics. However, we did not find anysignificant correlation (r ¼ 0.14) in four seasons. Levoglucosan,which is an excellent tracer of biomass burning (Simoneit, 2002; Fuet al., 2011), did not present any significant correlation with d13C inall seasons (Table 2). EC that is a tracer of primary source ofincomplete combustion, showed no correlation (r ¼ 0.01) with d13Cin all seasons. Oxalic acid (C2), a tracer of SOA, showed no corre-lation with d13C, suggesting the different sources and formationprocesses. Further, Naþ, a tracer of primary marine source, showedno correlation with d13C in all seasons (Table 2); even in summerwhen most of the air masses come from the Pacific Ocean.
Organic nitrogen (ON) is an important component, but its sourceand formation mechanisms are poorly understood although thesources of organic nitrogen are possibly derived from algal bloomsand marine bacteria (Facchini et al., 2008; Muller et al., 2009),degraded protein (Kuznetsova et al., 2005), livestock/animal hus-bandry, and biomass burning (Mace et al., 2003). Iinuma et al.(2007) and Nojima et al. (1983) reported that nitrophenols areoriginated from biomass burning and vehicular exhaust. Organicnitrogen (ON) showed higher concentration in winter(0.38 ± 0.24 mgm�3) followed by summer (0.35 ± 0.72) mgm�3) andspring (0.28 ± 0.24 mg m�3) whereas the lowest concentration wasobtained in autumn (0.12 ± 0.05 mg m�3), although the seasonalaverages are not statistically significant for winter and spring(t ¼ 1.09, p ¼ 0.29), spring and summer (t ¼ �0.32, p ¼ 0.75), andsummer and autumn (t ¼ �1.0, p ¼ 0.31). The winter maximum ofON may be associated with influences from polluted air massesfrom the Asian continent. We found that concentration of WSON islower in winter and higher in summer (Kunwar and Kawamura,2014a).
To better understand the sources of ON and WSON in summer,we performed correlation analysis between ON and Naþ; the latteris a tracer of primary oceanic emission. However, we did not findany correlation, suggesting that ON and also WSON are not

Fig. 6. Correlation analysis between total nitrogen (TN) and total carbon (TC) in aerosol samples collected from Cape Hedo, Okinawa.
Table 2Correlation coefficients (r) of d13C with various tracers in Okinawa aerosols for four seasons.
Tracer compounds Winter Spring Summer Autumn
Levoglucosan (biomass burning tracer) �0.27 0.53 �0.24 0.08EC (tracer of incomplete combustion) �0.45 0.49 �0.33 �0.15Oxalic acid (tracer of secondary organic aerosol) �0.07 0.45 �0.34 �0.09Naþ (tracer of primary source from marine) �0.06 0.38 0.16 0.36
**Correlation is significant at 0.01 level (two-tailed).*Correlation is significant at 0.01 level (two-tailed).
B. Kunwar et al. / Atmospheric Environment 131 (2016) 243e253250
primarily derived from the ocean, but derived secondarily by theoxidation of organic precursors emitted from marine biogenicsources. Wang et al. (2010) reported that the concentration ofWSON is 4 times higher in winter (22 mg m�3) than in spring(5.2 mg m�3) in Chinese aerosols. However, in our sampling sitewinter and springtime WSON levels are almost same, suggestingthat there are additional biogenic sources of WSON in spring.
3.4. Contribution of NO3� and NH4
þ to TN
Table 1 shows the seasonal average and concentration range forOkinawa aerosols. Higher concentrations of NO3
�-N were observedduring spring and winter and lower concentration was observedduring summer. Similarly, highest NH4
þ-N was observed duringwinter. Higher concentrations of NO3
�-N during winter and springsuggest an influence from the vehicular emission. Similarly, higherconcentration of NH4
þ-N during winter suggests that biomass
burning in East Asia has an impact on the study area.Relations of NO3
�-N and NH4þ-N against to TN are shown in Fig. 7.
The strong correlations of TN with NO3�-N (r ¼ 0.84) and NH4
þ-N(0.80) suggest that nitrate and ammonium are formed from thesimilar sources and/or source regions. The main nitrogen species isNO3
�, which contributes about 45% of TN. In contrast, NH4þ con-
tributes only 18% of TN. Meanwhile, ON accounts for 37% of TN(Fig. 8). The higher contribution of NO3
� to TN than NH4þ supports
that our sampling site is significantly influenced by vehicularemissions and biomass burnings in East Asia through a long-rangeatmospheric transport (Zhu et al., 2015). The highest contributionof NO3
� to TN was found to be 51.3% in spring followed by winter(37%) and the lowest value was observed in summer (34%). Incontrast, the highest contribution of NH4
þ to TNwas found inwinter(29%) followed by spring (23%) whereas the lowest value was foundin summer (3%). Both NO3
�-N and NH4þ-N show good correlations
with TN (r ¼ 0.91 and 0.89, respectively), suggesting that they are

Fig. 7. Scatter plots between NO3�-N or NH4
þ-N versus TN in aerosols collected in CapeHedo, Okinawa. The points in the bracket represent the outliers. The original data ofnitrate and ammonium are from Kunwar and Kawamura (2014a).
Fig. 8. Scatter plot between NO3�-N and NH4
þ-N versus TN in ambient aerosolscollected in Cape Hedo, Okinawa. The point in the bracket represents the outliers. Theoriginal data of nitrate and ammonium are from Kunwar and Kawamura (2014a).
B. Kunwar et al. / Atmospheric Environment 131 (2016) 243e253 251
originated from similar sources. However, the lowest contributionof NO3
� and NH4þ to TN in summer may suggest that organic nitro-
gen contributes more to TN in summer probably from marinesources.
4. Summary and conclusions
Stable carbon and nitrogen isotope ratios were determined foraerosol (TSP) samples from Okinawa, an outflow region of EastAsian aerosols. We found similar d13C values in winter(�22.5 ± 0.62‰) and spring (�22.5±0.71‰), suggesting thatwinter- and springtime aerosols are influenced by continentalsources such as coal combustions. During winter, contribution ofcoal combustion to aerosol TC is 97%. Very high d13C (�14.6to �18.2‰) was obtained on March 16 and November 3. We foundthat significant amount of mineral dust (carbonates) is responsiblefor such a high d13C for the sample of March 16. In contrast, minor
dust contribution was found for the sample of November 3. d13Cvalues obtained in the Okinawa aerosols are higher by ca. 2‰ thanthose reported from Chinese megacities during wintertime, sug-gesting that the photochemical aging of organic aerosols during thelong-range transport. No correlation between nss-Ca/TC and d13Csuggest that carbonates were mostly disappeared due to the at-mospheric titration by acidic species during long-range transport.
d15N in winter (13.6 ± 1.7‰) and spring (13.3 ± 2.7‰) showedalmost similar values, suggesting the presence of similar source ofnitrogen. The possible dominant source of d15N (~12.4) in winterand spring suggest the mixed biomass and coal burning in homeheating and coal burning in industries (eg. coal fired-power plants)origin. In contrast, d15N during summer (11.1 ± 1.1‰) is lower thanwinter and spring, suggesting that the air quality over Cape Hedo isinfluenced by clean oceanic air masses during summer. Contribu-tion of NO3
� to TN is higher (45%) than that of NH4þ (18%), suggesting
that vehicular emission in East Asia is the most important source ofTN in Cape Hedo, Okinawa. Higher concentration of ON in winter-time is due to the enhanced emission of water insoluble organicnitrogen in cold season from East Asia.
Acknowledgements
This study was in part supported by the Japan Society for thePromotion of Science (Grant-in-Aid Nos. 1920405 and 24221001)and by the Environment Research and Technology DevelopmentFund (B-0903) from the Ministry of the Environment, Japan. Wethank S. Yamamoto and T. Arakaki for the help in aerosol samplingat Cape Hedo, Okinawa and A. Takami of the National Institute ofEnvironmental Studies, Japan for the courtesy to use the CHAARMsite at Cape Hedo. We also thank the NOAA Air Resources Labora-tory (ARL) for the provision of the HYSPLIT transport model andREADY website (http://www.arl.noaa.gov/ready.php) used in thispublication.
Appendix A. Supplementary data
Supplementary data related to this article can be found at http://dx.doi.org/10.1016/j.atmosenv.2016.01.035.
References
Anderson, R.S., Iannone, R., Thompson, A.E., Rudolph, J., Huang, L., 2004. Carbonkinetic isotope effects in the gas phase reactions of aromatic hydrocarbons withthe OH radical at 296±4K. Geophys. Res. Lett. 31. Art. No. L15108.
Cachier, H., Buat-M�enard, M.P., Fontugne, M., Chesselet, R., 1986. Long-rangetransport of continentally-derived particulate carbon in the marine atmo-sphere: evidence from stable carbon isotope studies. Tellus., Ser. B 38, 161e177.
Cao, J., Chow, J.C., Tao, J., Lee, S.-C., Waston, J.G., Ho, K.F., Wang, G., Zhu, C.S.,Han, Y.M., 2011. Stable carbon isotopes in aerosols from Chinese cities: influenceof fossil fuels. Atmos. Environ. 45, 1359e1363.
Ceburnis, D., Garbaras, A., Szidat, S., Rinaldi, M., Fahrni, S., Perron, N., Wacker, L.,Leinert, S., Remeikis, V., Faccini, M.C., Prevot, A.S.H., Jennings, S.G., Ramonet, M.,O'Dowd, C.D., 2011. Quantification of carbonaceous matter origin in submicronmarine aerosol by 13C and 14C isotope analysis. Atmos. Chem. Phys. 11,8593e8606.
Chen, Y.J., Sheng, G.Y., Bi, X.B., Feng, Y.L., Mai, B.X., Fu, J.M., 2005. Emission factors forcarbonaceous particles and polycyclic aromatic hydrocarbons from residentialcoal combustion in China. Environ. Sci. Technol. 39, 1861e1867.
Chesselet, R., Fontugne, M., Buat/Menard, P., Ezat, U., Lambert, C.E., 1981. Theorigin of particulate organic carbon in the marine atmosphere as indicated byits stable isotope composition. J. Geophys. Res. 8, 345e348.
Ciezka, M., Modelska, M., Gorka, M., Trojanowska-Olichwer, A., Widory, D., 2015.Chemical and isotopic interpretation of major ion compositions from precipi-tation: a one-year temporal monitoring study in Wroclaw, SW Poland. J. Atmos.Chem. http://dx.doi.org/10.1007/s10874-015-9316-2.
Cornell, S., Rendell, A., Jickells, T., 1995. Atmospheric inputs of dissolved organicnitrogen to the oceans. Nature 376, 243e246.
Draxler, R.R., Hess, G.D., 1997. Description of the HYSPLIT_4 Modeling System. NOAATechnical Memorandum ERL ARL-224.
Duncan, F., Jacob, D.G., Park, R.J., 2007. The impact of transpacific transport ofmineral dust in the united states. Atmos. Environ. 41, 1251e1266.

B. Kunwar et al. / Atmospheric Environment 131 (2016) 243e253252
Facchini, M.C., Decesari, S., Rinaldi, M., Carbone, C., Finessi, E., Mircea, M., Fuzzi, S.,Moretti, F., Tagliavini, E., Ceburnis, D., O'Dowd, C.D., 2008. Important source ofmarine secondary organic aerosol from biogenic amines. Environ. Sci. Technol.42, 9116e9121.
Fisseha, R., et al., 2009. Stable carbon isotope composition of secondary organicaerosol from b-pinene oxidation. J. Geophys. Res. 114, D02304. http://dx.doi.org/10.1029/2008JD011326.
Fry, B., Parker, P.L., 1979. Animal diet in Texas seagrass meadows: d13C evidence forthe importance of benthic plants. Estuar. Coast. Mar. Sci. 8, 499e509.
Fu, P., Kawamura, K., Miura, K., 2011. Molecular characterization of marine organicaerosols collected during a round-the-world cruise. J. Geophys. Res. 116,D13302. http://dx.doi.org/10.1029/2011JD015604.
Gleason, J.D., Kyser, T.K., 1984. Stable isotope compositions of gases and vegetationnear naturally burning coal. Nature 307.
G�orka, M., Jedrysek, M.O., 2008. d13C in organic atmospheric dust deposited atWroc1aw (SW Poland): critical remarks on the passive method. Geol. Q. 52,115e126.
G�orka, M., Jedrysek, M.O., Maj, J., Worobiec, A., Buczynska, A., Stefaniak, E., Krata, A.,Van Grieken, R., Zwozdziak, A., Sowka, I., Zwozdziak, J., Lewicka-Szczebak, D.,2009. Comparative assessment of air quality in two health resorts using carbonisotopes and palynological analyses. Atmos. Environ. 43, 682e688.
G�orka, M., Zwolinska, E., Malkiewicz, M., Lewicka-Szczebak, D., Jedrysek, M.O., 2012.Carbon and nitrogen isotopic analysis coupled with palynological data of PM10in Wroc1aw city (SW Poland) e assessment of anthropogenic impact. IsotopesEnviron. Health Stud. 48, 327e344.
G�orka, M., Rybicki, M., Simoneit, B.R.T., Marynowski, L., 2014. Determination ofmultiple organic matter sources in aerosol PM10 from Wroc1aw, Poland usingmolecular and stable carbon isotope compositions. Atmos. Environ. 89,739e748.
Hallquist, M., et al., 2009. The formation, properties and impact of secondaryorganic aerosol: current and emerging issues. Atmos. Chem. Phys. 9,5155e5236.
Heaton, T.H.E., 1990. 15N/14N ratios of NOx from vehicle engines and coal-firedpower stations. Tellus. 42B, 304e307.
Hem, J.D., 1985. Study and Interpretation of the Chemical Characteristics of NaturalWater. USGS Water-Supply Paper, Washington, D.C., p. 2254
Ho, K.F., Lee, S.C., Cao, J.J., Li, Y.S., Chow, J.C., Watson, J.G., Fung, K., 2006. Variabilityof organic and elemental carbon, water soluble organic carbon, and isotopes inHong Kong. Atmos. Chem. Phys. 6, 4569e4576.
Iinuma, Y., Bruggemann, Gnauk, T., Muller, K., Andreae, M.O., Helas, G., Parmar, R.,Herrmann, H., 2007. Source characterization of biomass burning particles: thecombustion of selected European conifers, African hardwood, savanna grass,and German and Indonesian peat. J. Geophys. Res. 112, D08209. http://dx.doi.org/10.1029/2006JD007120.
Jung, J., Kawamura, K., 2011. Springtime carbon episodes at Gosan background siterevealed by total carbon, stable carbon isotopic composition, and thermalcharacterstics of carbonaceous particles. Atmos. Chem. Phys. 11, 10911e10928.
Kawamura, K., Ikushima, K., 1993. Seasonal changes in the distribution of dicar-boxylic acids in the urban atmosphere. Environ. Sci. Technol. 27, 2227e2235.
Kawamura, K., Kobayashi, M., Tsubonuma, N., Mochida, M., Watanabe, T., Lee, M.,2004. Organic and inorganic compositions of marine aerosols from East Asia:seasonal variations of water-soluble dicarboxylic acids, major ions, total carbonand nitrogen, and stable C and N isotopic composition. In: Hill, R.J., et al. (Eds.),Geochemical Investigations in Earth and Space Science: a Tribute to Isaac R.Kaplan. The Geochemical Society, pp. 243e265. Publication No. 9.
Kawamura, K., Ono, K., Tachibana, E., Charrie, B., Sempere, R., 2012. Distributions oflow molecular weight dicarboxylic acids, ketoacids and a-dicarbonyls in themarine aerosols collected over the Arctic Ocean during late summer. Bio-geoscience. 9, 4725e4737.
Kawamura, K., Sakaguchi, F., 1999. Molecular distributions of water soluble dicar-boxylic acids in marine aerosols over the Pacific Ocean including tropic.J. Geophys. Res. 104, 3501e3509.
Kawashima, H., Haneishi, Y., 2012. Effects of combustion emissions from theEurasian continent in winter on seasonal d13C of elemental carbon in aerosols inJapan. Atmos. Environ. 46, 568e579.
Kelly, S.D., Stein, C., Jickells, T.D., 2005. Carbon and nitrogen isotopic analysis ofatmospheric organic matter. Atmos. Environ. 39, 6007e6011.
Kundu, S., Kawamura, K., Lee, M., 2010. Seasonal variation of the concentrations ofnitrogenous species and their nitrogen isotopic ratios in aerosols at Gosan, JejuIsland: Implications for atmospheric processing and source changes of aerosols.J. Geophys. Res. 115, D20305. http://dx.doi.org/10.1029/2009JD013323.
Kundu, S., Kawamura, K., 2014. Seasonal variations of stable carbon isotopiccomposition of bulk aerosol carbon from Gosan site, Jeju Island in the EastChina Sea. Atmos. Environ. 94, 316e322.
Kunwar, B., Kawamura, K., 2014a. One-year observations of carbonaceous andnitrogenous components and major ions in the aerosols from subtropical Oki-nawa Island, an outflow region of Asian dusts. Atmos. Chem. Phys. 14,1819e1836. http://dx.doi.org/10.5194/acp-14-1819-2014.
Kunwar, B., Kawamura, K., 2014b. Seasonal distributions and sources of low mo-lecular weight dicarboxylic acids, u- oxocarboxylic acids, pyruvic acid, a-dicarbonyls and fatty acids in ambient aerosols from subtropical Okinawa in thewestern Pacific rim. Environ. Chem. http://dx.doi.org/10.1071/EN14097.
Kuznetsova, M., Lee, C., Aller, J., 2005. Characterization of the proteinaceous matterin marine. Mar. Chem. 96, 359e377.
Loh, A.N., Bauer, J.E., Druffel, E.R.M., 2004. Variable ageing and storage of dissolved
organic component in the open ocean. Nature 430, 877e881.L�opez-Veneroni, D., 2009. The stable carbon isotope composition of PM2.5 and
PM10 in Mexico City Metropolitan area air. Atmos. Environ. 43, 4491e4502.http://dx.doi.org/10.1016/j.atmosenv.2009.06.036.
Mace, K.A., Artaxo, P., Duce, R.A., 2003. Water- soluble organic nitrogen in AmazonBasin aerosols during the dry (biomass burning) and wet seasons. J. Geophys.Res. 108 http://dx.doi.org/10.1029/2003JD003557.
Mkoma, S., Kawamura, K., Fu, P., 2013. Contributions of biomass/biofuel burning toorganic aerosls and particulate matter in Tanzania, East Africa, based on ana-lyses of ionic species, organic and elemental carbon, levoglucosan and man-nosan. Atmos. Chem. Phys. 13, 10325e10338.
Martinelli, L.A., Camargo, P.B., Lara, L.B.L.S., Victoria, R.L., Artaxo, P., 2002. Stablecarbon and nitrogen isotopic composition of bulk aerosol particles in a C4 plantlandscape of southeast Brazil. Atmos. Environ. 36, 2427e2432.
Mariotti, A., 1983. Atmospheric nitrogen is a reliable standard for natural 15Nabundance measurements. Nature. 303, 685e687.
Miyazaki, Y., Fu, P., Kawamura, K., Mizoguchi, Y., Yamanoi, K., 2012. Seasonal vari-ations of stable carbon isotopic composition and biogenic tracer compounds ofwater soluble organic aerosols in deciduous forest. Atmos. Chem. Phys. 12,1367e1376.
Muller, C., Iinuma, Y., Karstensen, J., van Pinxteren, D., Lehmann, S., Gnauk, T.,Herrmann, H., 2009. Seasonal variation of aliphatic amines in marine sub-micrometer particles at the Cape Verde islands, 2009. Atmos. Chem. Phys. 9,9587e9597. http://dx.doi.org/10.5194/acp-9-9587.
Narukawa, M., Kawamura, K., Li, S.-M., Bottenheim, J.W., 2008. Stable carbon iso-topic ratios and ionic composition of the high-Arctic aerosols: an increase ind13C values from winter to spring. J. Geophys. Res. 113, D02312. http://dx.doi.org/10.1029/2007JD008755.
Nojima, K., Kawaguchi, A., Ohya, T., Kanno, S., Hirobe, M., 1983. Studies on photo-chemical reaction of air pollutants. 10. Identification of nitrphenols in sus-pended particulates. Chem. Pharm. Bull. 31, 1047e1051.
Ohara, T., Akimoto, H., Kurokawa, J., Horii, N., Yamaji, K., Yan, X., Hayasaka, T., 2007.An Asian emission inventory of anthropogenic emission sources for the period1980-2020. J. Geophys. Res. 102 (21), 307e21,313.
Okuda, T., Kumata, H., Zakaria, M.P., Naraoka, H., Shiwatari, R., Takada, H., 2002.Source identification of Malaysian atmospheric polycyclic aromatic hydro-carbonsnearby forest fires using molecular and isotopic compositions. Atmos.Environ. 36, 611e618.
Pavuluri, C.M., Kawamura, K., Swaminathan, T., 2010. Water-soluble organic carbon,dicarboxylic acids, ketoacids, and a-dicarbonyls in the tropical Indian aerosols.J. Geophys. Res. 115, D11302. http://dx.doi.org/10.1029/2009JD012661.
Pavuluri, C.M., Kawamura, K., Swaminathan, T., Tachibana, E., 2011. Stable carbonisotopic compositions of total carbon, dicarboxylic acids and glyoxylic acid inthe tropical Indian aerosols: Implications for sources and photochemical pro-cessing of organic aerosols. J. Geophys. Res.-atmos. 116, D18307. http://dx.doi.org/10.1029/2011JD015617.
Peng, L., You, Y., Bai, J.P., Zhu, T., Xie, K.C., Feng, Y.C., Li, Z., 2006. Stable carbonisotope evidence for origin of atmospheric polycyclic aromatic hydrocarbons inZhengzhou and Urumchi, China. Geochem. J. 40, 219e226.
Pokhrel, A., Kawamura, K., Seki, O., Matoba, S., Shiraiwa, T., 2015. Ice core profiles ofsaturated fatty acids (C12:0-C30:0) and oleic acid (C18:1) from southern Alaskasince 1734 AD: a link to climate change in the Northern Hemisphere. Atmos.Environ. 100, 202e209.
Pokhrel, A., Kawamura, K., Ono, K., Seki, O., Fu, P., Matoba, S., Shiraiwa, T., 2016. Icecore records of monoterpene- and isoprene-SOA tracers from Aurora Peak inAlaska since 1660s: Implication for climate change variability in the NorthPacific Rim. Atmos. Environ. http://dx.doi.org/10.1016.
Raven, P.H., Evert, R.F., Eichhorn, S.E., 1992. Biology of Plants, fifth ed. Worth Pub-lishers, New York, New York, pp. 602e611.
Sato, K., Li, H., Tanaka, Y., Ogawa, S., Iwasaki, Y., Takami, A., Hatakeyama, S., 2009.Long-range transport of particulate polycyclic aromatic hydrocarbons at CapeHedo remote island site in the East China Sea between 2005 and 2008. J. Atmos.Chem. 61, 243e257.
Simoneit, B.R.T., 2002. Biomass burning: a review of organic tracers for smoke fromincomplete combustion. Appl. Geochem. 17, 129e162.
Sohn, R.A., 2005. A general inversion for end member ratios in binary mixingsystem. Geochem. Geophys. Geosystems 6 http://dx. Doi.org/10.1029.
Takahashi, K., Mori, I., Nishikawa, M., Quan, H., Sakamoto, K., 2008. Carbonaceouscomponents of atmospheric aerosols in Beijing and Tokyo. Earozoru Kenkyu 23,194e199 (in Japanese with English abstract).
Takami, A., Miyoshi, T., Shimono, A., Kaneyasu, N., Kato, S., Kajii, Y., Hatakeyama, S.,2007. Transport of anthropogenic aerosols from Asia and subsequent chemicaltoluene, and p-xylene. J. Phys. Chem. A 105, 7865e7874.
Tambunan, P., Baba, S., Kuniyoshi, A., Iwasaki, H., Nakamura, T., Yamasaki, H.,Oku, H., 2007. Isoprene emission from tropical trees in Okinawa Island, Japan2006. Chemosphere 65, 2138e2144.
Verma, R.L., Kondo, Y., Oshima, N., Matsui, H., Kita, K., Sahu, L.K., Kato, S., Kajii, Y.,Takami, A., Miyakawa, T., 2011. Seasonal variations of the transport of blackcarbon and carbon monoxide from the Asian continent to the western Pacific inthe boundary layer. J. Geophys. Res. 116, D21307. http://dx.doi.org/10.1029/2011JD015830.
Wang, G., Xie, M., Hu, S., Gao, S., Tachibana, E., Kawamura, K., 2010. Dicarboxylicacids, metals and isotopic compositions of C and N in atmospheric aerosolsfrom inland China: implications for dust and coal burning emission and sec-ondary aerosol formation. Atmos. Chem. Phys. 10, 6087e6096.

B. Kunwar et al. / Atmospheric Environment 131 (2016) 243e253 253
Wang, G., Zhou, B.H., Cheng, C.L., Cao, J.J., Li, J.J., Meng, J.J., Tao, J., Zhang, R.J., Fu, P.Q.,2013. Impact of Gobi desert on aerosol chemistry of Xi’an, inland China duringspring 2009: differences in composition and size distribution between the ur-ban ground surface and mountain atmosphere. Atmos. Chem. Phys. 13,819e835.
Widory, D., 2007. Nitrogen isotopes: tracers of origin and processes affecting PM10in the atmosphere of Paris. Atmos. Environ. 41, 2382e2390.
Widory, D., Roy, S., Le Moullec, Y., Goupil, G., Cocherie, A., Guerrot, C., 2004. Theorigin of atmospheric particles in Paris: a view through carbon and lead iso-topes. Atmos. Environ. 38, 953e961.
Xiao, Y.-H., Liu, C.-Q., 2010. Identifying organic matter provenance in sediments
using isotopic ratios in an urban river. Geochem. J. 44, 181e187.Yamamoto, S., Kawamura, K., 2011. Stable hydrogen isotopic compositions of fossil
fuel-derived n-alkanes in the atmospheric aerosols from Okinawa, Japan. Res.Org. Geochem. 27, 81e89.
Yeatman, S.G., Spokes, L.J., Dennis, P.F., Jickells, T.D., 2001. Comparisons of aerosolnitrogen isotopic composition at two polluted coastal sites. Atmos. Environ. 35,1307e1320.
Zhu, C., Kawamura, K., Kunwar, B., 2015. Effect of biomass burning over westernNorth Pacific Rim: wintertime maxima of anhydrosugars in ambient aerosolsfrom Okinawa. Atmos. Chem. Phys. 15, 1959e1973.