stabilization, adjustment and growth prospects in transition economies€¦ · ·...
TRANSCRIPT

Stabilization, Adjustment and Growth Prospects in
Transition Economies
Cevdet Denizer
Macroeconomics and Growth Division
Policy Research Department
The World Bank
February 1997
The findings, interpretations, and conclusions expressed in this paper are entirely the authors. They do
not necessarily represent those of the World Bank, its Executive Directors, or the countries they
represent.
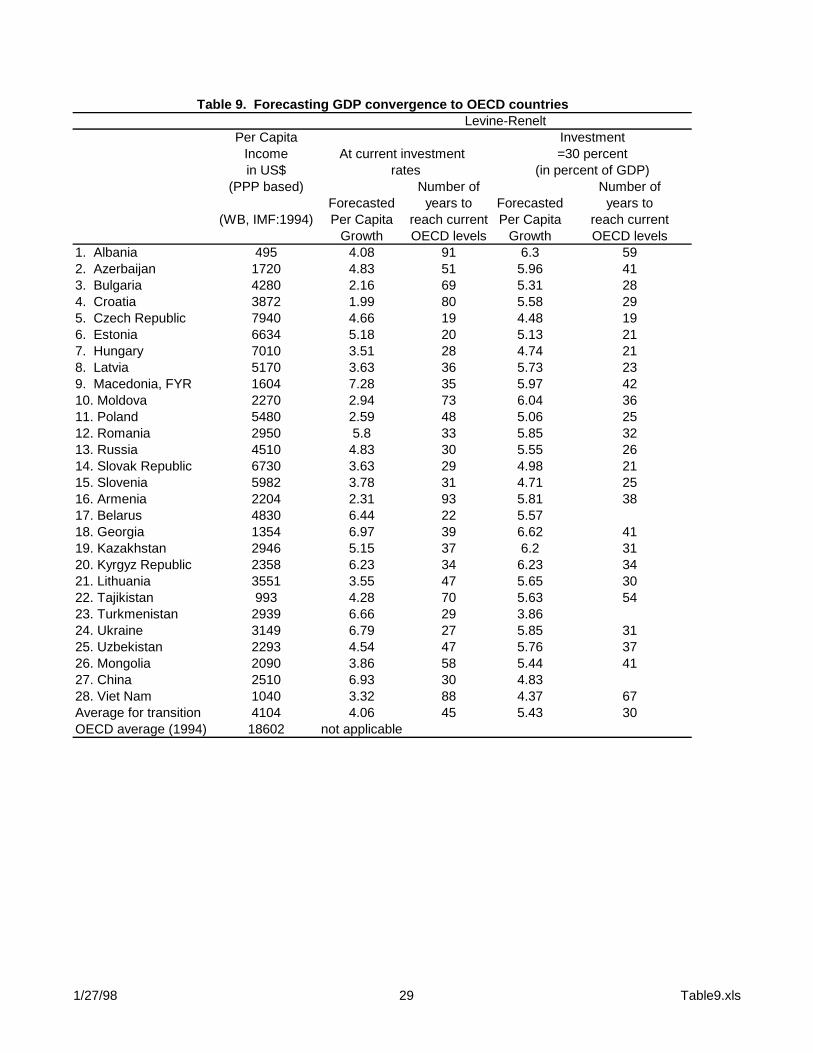
Table 9. Forecasting GDP convergence to OECD countriesLevine-Renelt
Per Capita InvestmentIncome At current investment =30 percentin US$ rates (in percent of GDP)
(PPP based) Number of Number ofForecasted years to Forecasted years to
(WB, IMF:1994) Per Capita reach current Per Capita reach currentGrowth OECD levels Growth OECD levels
1. Albania 495 4.08 91 6.3 592. Azerbaijan 1720 4.83 51 5.96 413. Bulgaria 4280 2.16 69 5.31 284. Croatia 3872 1.99 80 5.58 295. Czech Republic 7940 4.66 19 4.48 196. Estonia 6634 5.18 20 5.13 217. Hungary 7010 3.51 28 4.74 218. Latvia 5170 3.63 36 5.73 239. Macedonia, FYR 1604 7.28 35 5.97 4210. Moldova 2270 2.94 73 6.04 3611. Poland 5480 2.59 48 5.06 2512. Romania 2950 5.8 33 5.85 3213. Russia 4510 4.83 30 5.55 2614. Slovak Republic 6730 3.63 29 4.98 2115. Slovenia 5982 3.78 31 4.71 2516. Armenia 2204 2.31 93 5.81 3817. Belarus 4830 6.44 22 5.5718. Georgia 1354 6.97 39 6.62 4119. Kazakhstan 2946 5.15 37 6.2 3120. Kyrgyz Republic 2358 6.23 34 6.23 3421. Lithuania 3551 3.55 47 5.65 3022. Tajikistan 993 4.28 70 5.63 5423. Turkmenistan 2939 6.66 29 3.8624. Ukraine 3149 6.79 27 5.85 3125. Uzbekistan 2293 4.54 47 5.76 3726. Mongolia 2090 3.86 58 5.44 4127. China 2510 6.93 30 4.8328. Viet Nam 1040 3.32 88 4.37 67Average for transition 4104 4.06 45 5.43 30OECD average (1994) 18602 not applicable
1/27/98 29 Table9.xls

Table 8. Forecasting Long-term Trend Growth (Levine-Renelt)Population Secondary School Gross Per Capita Forecasted Forecasted
Growth Enrollment Capital Formation Income Per Capita GrowthRate (share of school (share of GDP) in US$ Growth Rate
age population in current prices PPP based Rate(WB) (WB, KZ) (OECD, WEO) (WB, IMF)
1. Albania 1.19 0.79 0.17 495 4.08 5.272. Azerbaijan 1.28 0.83 0.24 1720 4.83 6.103. Bulgaria -0.35 0.71 0.12 4280 2.16 1.804. Croatia 0.06 0.80 0.10 3872 1.99 2.065. Czech Republic -0.06 0.89 0.31 7940 4.66 4.606. Estonia -0.31 0.92 0.30 6634 5.18 4.867. Hungary -0.53 0.81 0.23 7010 3.51 2.988. Latvia -0.53 0.92 0.18 5170 3.63 3.109. Macedonia, FYR 1.12 0.80 0.38 1604 7.28 8.4010. Moldova 0.41 0.81 0.12 2270 2.94 3.3511. Poland 0.20 0.83 0.16 5480 2.59 2.7912. Romania 0.19 0.80 0.30 2950 5.80 5.9913. Russia 0.55 0.92 0.26 4510 4.83 5.3814. Slovak Republic 0.35 0.96 0.22 6730 3.63 3.9815. Slovenia 0.41 0.80 0.25 5982 3.78 4.1916. Armenia 1.40 0.85 0.10 2204 2.31 3.7417. Belarus 0.20 0.92 0.35 4830 6.44 6.6618. Georgia -0.20 0.82 0.32 1354 6.97 6.7619. Kazakhstan 0.10 0.90 0.24 2946 5.15 5.2620. Kyrgyz Republic 0.40 0.88 0.30 2358 6.23 6.6621. Lithuania 0.00 0.78 0.18 3551 3.55 3.5522. Tajikistan 2.00 0.73 0.22 993 4.28 6.3623. Turkmenistan 4.60 0.70 0.46 2939 6.66 11.5724. Ukraine 0.00 0.80 0.35 3149 6.79 6.7925. Uzbekistan 2.20 0.94 0.23 2293 4.54 6.8426. Mongolia 1.90 0.78 0.21 2090 3.86 5.8427. China 1.20 0.55 0.42 2510 6.93 8.2128. Viet Nam 2.10 0.35 0.24 1040 3.32 5.49Average 0.26 0.84 0.22 4443 4.06 4.32Sources: International Monetary Fund (IMF), The World Bank (WB), Organization for Economic Co-operationand Development (OECD), and Krajnyak and Zettelmeyer (KZ, 1996), and author's estimates.
1/27/98 28 Table8.xls

TABLE 7:Fiscal Deficits and Quasi-Fiscal Expenditures for Selected Countries, 1992-94
(as percentage of GDP)
Fiscal Deficits CB Implicit Subsidy a) Total
1992 1993 1994 1992 1993 1994 1992 1993 1994
Advanced ReformersPoland 6.8 2.9 2.9 0.0 0.0 0.0 6.8 2.9 2.9
Hungary 5.7 7.0 6.5 0.0 0.0 0.0 5.7 7.0 6.5Czech Republic 0.5 -0.6 -0.5 0.3 0.8 0.1 0.8 0.2 -0.4
Slovakia 13.1 7.6 2.5 0.3 1.7 0.0 13.4 9.3 2.5
Intermediate ReformersBulgaria 5.0 11.1 6.1 1.3 0.8 0.7 6.3 11.9 6.8Estonia -0.5 1.4 0.0 - 0.2 0.3 - 1.6 0.3
Romania 5.5 1.0 3.0 5.9 3.9 0.0 11.4 4.9 3.0Russia 3.4 8.1 8.8 11.3 1.7 0.0 14.7 9.8 8.8
Kazakhstan 7.3 1.2 4.5 32.7 2.6 40.0 7.1
Slow ReformersBelarus 6.4 9.4 1.5 26.5 9.3 3.4 32.9 18.7 4.9
Turkmenistan 10.1 3.6 1.1 12.5 21.2 6.4 22.6 24.8 7.5Uzbekistan 10.2 8.4 2.0 13.1 18.5 19.0 23.3 26.9 21.0
a) Implicit subsidy from the Central Bank to commercial banks and economy due to difference between the Central Bank refinancing rate and inflation. Annual figures are averages of monthly (quarterly) figuresb) For 1992 the nominal federation subsidy is divided 2 to 1 in favor of the Czech Republic.c) Calculations done on quarterly basis.Source: De Melo, Denizer and Gelb (1996).
b)
b)
c)
c)
c)
c)
c)
1/27/98 27 Table7.xls

TABLE 6:Money, Interest Rates and Real Balances
Group CountriesCumul
Lib Index
Broad Money Growth
(Average Monthly Change 1992-94)
Real Money Balances1991=100
Discount Rate in Real Terms, percent (average)
92 93 94 1992-1994 end-1994
Advanced Slovenia 4.16 5 92 127 164 -3 -1Reformers Poland 4.14 3 98 101 104 1 3
Hungary 4.11 2 105 106 102 0 1Czech Republic 3.61 1 106 104 111 -1 -1Slovak Republic 3.53 1 95 84 86 -1 -1Averages 3.91 2 99 104 113 -1 0
High Bulgaria 2.96 4 91 76 68 -3 0Intermediate Estonia 2.93 7 25 20 21 n/a -3
Reformers Lithuania 2.62 9 30 17 20 n/a n/aLatvia 2.39 6 29 28 34 -8 0Romania 2.35 7 63 43 41 -8 12Albania 2.30 5 82 89 105 -4 2Mongolia 2.27 6 56 36 40 -16 -8Averages 2.55 6 54 44 47 -8 1
Low Russia 1.92 15 32 23 16 -17 -2Intermediate Kyrgyz Republic 1.81 11 36 16 8 -19 9
Reformers Moldova 1.62 13 23 9 3 -18 0Kazakhstan 1.31 19 21 14 8 -31 4Averages 1.67 15 28 16 9 -21 3
Slow Uzbekistan 1.11 19 45 53 71 -35 -12Reformers Belarus 1.07 20 35 33 17 -34 -5
Ukraine 0.80 22 40 26 13 -29 -40Turkmenistan 0.63 23 63 73 9 -45 -48Averages 0.90 21 46 46 28 -36 -26
Affected Croatia 4.02 16 68 60 76 -9 2by War FYR Macedonia 3.92 19 89 91 89 -1 1
Armenia 1.44 24 22 7 2 -33 -26Georgia 1.32 29 29 24 6 n/a n/aAzerbaijan 1.03 17 40 40 19 -40 -52Tajikistan 0.95 19 39 30 n/a -30 -16Averages 2.11 21 48 42 39 -23 -18
East Viet Nam 3.42 n/a 97 107 n/a 1 0.6Asia China 3.08 2 123 141 168 -5 -5
Averages 3.25 n/a 110 124 n/a -2 -2.2
NB: The discount rates in real terms are calculated assuming quarterly compounding. All averages aresimple averages.a/ Data for 1992 are for the federation.b/ Broad money growth rate is taken from a quarterly average made monthly by taking a cubic root.c/ The average discount rate is for 1992-93. For Vietnam, the lending rate for working capital is used.d/ The rates for 1992-93 are decompounded on monthly basis.e/ Average interest rate collected over different types of credit.f/ The NBE credit auction rate is used for end 1994.g/ The discount rate used is the clearing and settlement account; a mid point of range is used.Source: De Melo, Denizer and Gelb (1996).
a
a
b
b
c/
c/
f/
e
g
a
c/
1/27/98 26 Table6.xls

TABLE 5:Levels and Change in Revenue, Expenditures and Fiscal Balance, 1989-94
Change in Levels, 1994Cumul (% of GDP) (% of GDP)
Group Countries Lib Index Revenue Expenditure Balance Revenue Expenditure Balance
Advanced Slovenia 4.16 4.6 5.8 -1.2 46.6 47.5 -0.9Reformers Poland 4.14 6.5 1.5 5.0 47.9 50.4 -2.5
Hungary 4.11 -6.8 -1.7 -5.1 52.3 58.8 -6.5
Czech Republic 3.61 -10.9 -13.8 2.9 51.2 50.7 0.5
Slovak Republic 3.53 -11.6 -11.5 -0.1 50.5 53.0 -2.5Averages 3.91 -3.6 -3.9 0.3 49.7 52.1 -2.4
High Bulgaria 2.96 -21.9 -17.3 -4.6 38.0 44.1 -6.1Intermediate Estonia 2.93 -8.0 -7.5 -0.5 35.0 35.0 0.0
Reformers Lithuania 2.62 -25.2 -17.1 -8.1 25.1 30.4 -5.3Latvia 2.39 -15.1 -12.3 -2.8 36.7 38.7 -2.0Romania 2.35 -18.5 -7.1 -11.4 32.6 35.6 -3.0Albania 2.30 -20.3 -16.0 -4.3 27.7 41.0 -13.3Mongolia 2.27 -12.4 -17.3 5.0 36.2 48.0 -11.8Averages 2.55 -17.3 -13.5 -3.8 33.0 39.0 -5.9
Low Russia 1.90 -4.5 -4.4 -0.1 36.3 45.1 -8.8Intermediate Kyrgyz Republic 1.81 -14.2 -3.7 -10.4 24.3 32.7 -8.4
Reformers Moldova 1.62 -18.2 -7.8 -7.1 17.1 25.9 -8.8Kazakhstan 1.31 -21.7 -15.7 -6.0 19.0 23.5 -4.5Averages 1.66 -14.6 -7.9 -5.9 24.2 31.8 -7.6
Slow Uzbekistan 1.11 7.8 9.2 -1.4 43.0 45.0 -2.0
Reformers Belarus 1.07 -1.6 3.4 -1.5 36.6 38.1 -1.5Ukraine 0.80 15.9 25.7 -8.4 42.3 51.4 -9.1Turkmenistan 0.63 -26.2 -23.9 -2.3 6.2 7.3 -1.1Averages 0.90 -1.0 3.6 -3.4 32.0 35.5 -3.4
Affected Croatia 4.02 12.3 8.1 4.1 27.2 27.6 -0.4by War FYR Macedonia 3.92 6.6 5.6 1.1 42.8 45.4 -2.6
Armenia 1.44 -15.2 11.2 -21.6 37.0 61.0 -24.0Georgia 1.32 -16.5 -6.6 -8.1 15.0 24.0 -9.0Azerbaijan 1.03 10.2 24.7 -11.5 36.0 49.0 -13.0Tajikistan 0.95 -4.9 -0.5 -1.0 35.4 38.1 -2.7Averages 2.11 -1.2 7.1 -6.2 32.2 40.9 -8.6
East Viet Nam 3.42 8.7 -3.2 5.5 24.7 25.2 -0.5Asia China 3.08 -5.1 -4.7 -0.4 11.4 13.3 -1.9
Averages 3.25 1.8 -2.2 2.5 18.1 19.3 -1.2
a/
a/
b/
1/27/98 25 Table5.xls

a/ 1989 figures for Czechoslovakia.b/ Change over 1991-94Source: IMF, World Bank, De Melo, Denizer and Gelb (1996).
1/27/98 26 Table5.xls
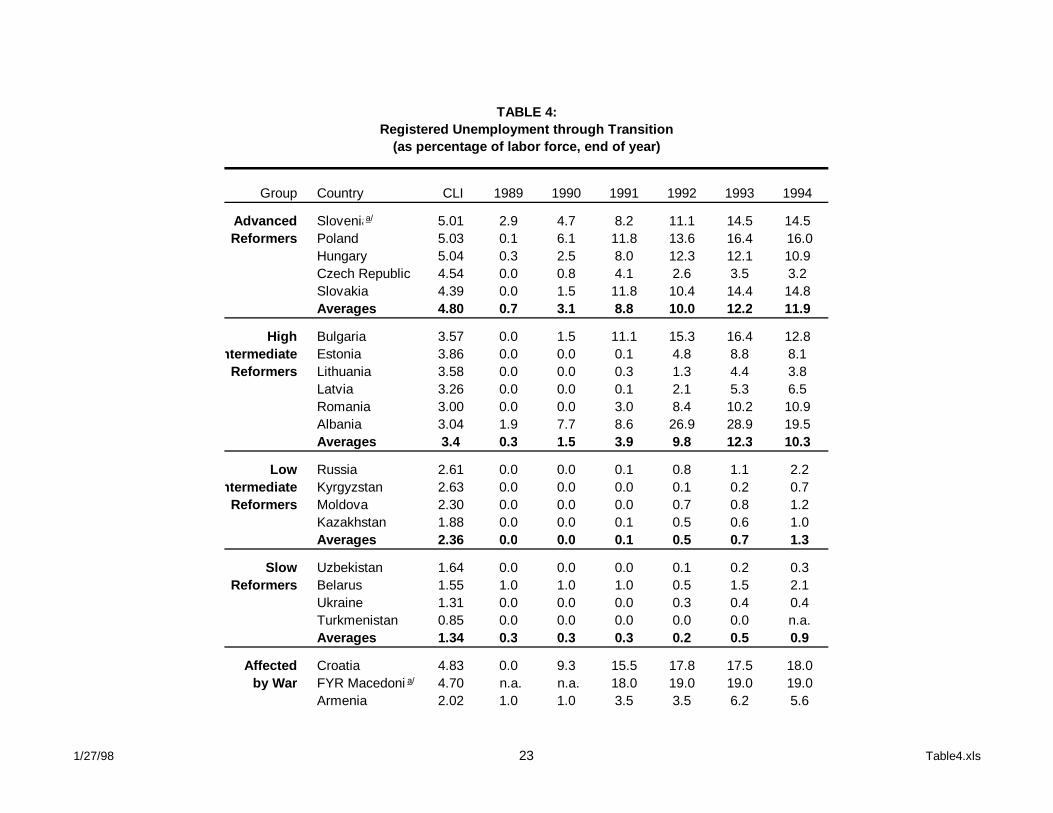
TABLE 4:Registered Unemployment through Transition
(as percentage of labor force, end of year)
Group Country CLI 1989 1990 1991 1992 1993 1994
Advanced Slovenia 5.01 2.9 4.7 8.2 11.1 14.5 14.5Reformers Poland 5.03 0.1 6.1 11.8 13.6 16.4 16.0
Hungary 5.04 0.3 2.5 8.0 12.3 12.1 10.9Czech Republic 4.54 0.0 0.8 4.1 2.6 3.5 3.2Slovakia 4.39 0.0 1.5 11.8 10.4 14.4 14.8Averages 4.80 0.7 3.1 8.8 10.0 12.2 11.9
High Bulgaria 3.57 0.0 1.5 11.1 15.3 16.4 12.8Intermediate Estonia 3.86 0.0 0.0 0.1 4.8 8.8 8.1
Reformers Lithuania 3.58 0.0 0.0 0.3 1.3 4.4 3.8Latvia 3.26 0.0 0.0 0.1 2.1 5.3 6.5Romania 3.00 0.0 0.0 3.0 8.4 10.2 10.9Albania 3.04 1.9 7.7 8.6 26.9 28.9 19.5Averages 3.4 0.3 1.5 3.9 9.8 12.3 10.3
Low Russia 2.61 0.0 0.0 0.1 0.8 1.1 2.2Intermediate Kyrgyzstan 2.63 0.0 0.0 0.0 0.1 0.2 0.7
Reformers Moldova 2.30 0.0 0.0 0.0 0.7 0.8 1.2Kazakhstan 1.88 0.0 0.0 0.1 0.5 0.6 1.0Averages 2.36 0.0 0.0 0.1 0.5 0.7 1.3
Slow Uzbekistan 1.64 0.0 0.0 0.0 0.1 0.2 0.3Reformers Belarus 1.55 1.0 1.0 1.0 0.5 1.5 2.1
Ukraine 1.31 0.0 0.0 0.0 0.3 0.4 0.4Turkmenistan 0.85 0.0 0.0 0.0 0.0 0.0 n.a.Averages 1.34 0.3 0.3 0.3 0.2 0.5 0.9
Affected Croatia 4.83 0.0 9.3 15.5 17.8 17.5 18.0by War FYR Macedonia 4.70 n.a. n.a. 18.0 19.0 19.0 19.0
Armenia 2.02 1.0 1.0 3.5 3.5 6.2 5.6
a/
a/
1/27/98 23 Table4.xls

Group Country CLI 1989 1990 1991 1992 1993 1994Georgia 1.81 0.0 0.0 0.0 5.4 8.4 n.a.Azerbaijan 1.47 0.0 0.0 0.1 0.2 0.7 0.9Tajikistan 1.34 0.0 0.0 0.0 0.3 1.1 1.7Averages 2.70 0.2 1.7 6.2 7.7 8.8 9.0
East Viet Nam 4.07 n/a n/a n/a n/a n/a n/aAsia China 3.67 2.6 2.5 2.3 2.3 2.6 2.8
Averages 3.87 n/a n/a n/a n/a n/a n/a
Source: De Melo, Denizer, Gelb (1996).
1/27/98 24 Table4.xls

TABLE 3:Sectoral Shifts at Constant Prices, 1989-94
Change in shareCumul % of GDP
Group Countries Lib Index Industry Agriculture ServicesAdvanced Slovenia 5.01 -23.3 -3.8 27.1
Reformers Poland 5.03 -21.4 -2.0 23.4Hungary 5.04 -0.2 -1.7 1.9Czech Republic 4.54 -10.5 -0.5 11.0Slovak Republic 4.39 -14.8 0.2 14.6Averages 4.8 -14.0 -1.6 15.6
High Bulgaria 3.57 -10.3 4.3 6.0Intermediate Estonia 3.86 -12.7 -10.1 22.8
Reformers Lithuania 3.58 -11.5 2.6 8.9Latvia 3.26 -18.8 1.9 16.9Romania 3.00 -6.5 6.2 0.3Albania 3.04 -20.1 14.8 5.3Mongolia 2.94 3.0 4.3 -7.3Averages 3.3 -11.0 3.4 7.6
Low Russia 2.61 3.5 6.5 -10.0Intermediate Kyrgyz Republic 2.63 -7.8 7.2 0.6
Reformers Moldova 2.30 3.5 6.5 -10.0Kazakhstan 1.88 -6.3 17.5 -11.2Averages 2.4 -1.8 9.4 -7.7
Slow Uzbekistan 1.64 -7.6 12.7 -5.1Reformers Belarus 1.55 5.8 -2.8 -3.0
Ukraine 1.31 -11.2 10.0 1.2Turkmenistan 0.85 -4.5 0.1 4.4Averages 1.3 -4.4 5.0 -0.6
Affected Croatia 4.83 -4.0 0.8 3.2by War FYR Macedonia 4.70 9.1 -6.0 -3.1
Armenia 2.02 -6.4 0.0 6.4Georgia 1.81 -8.7 18.3 -9.6Azerbaijan 1.47 -14.8 0.2 14.6Tajikistan 1.34 n.a. n.a. n.a.Averages 3.0 -5.0 2.7 2.3
East Viet Nam 4.07 -1.1 -6.0 7.1Asia China 3.67 18.6 -6.1 -12.5
Averages 3.9 8.8 -6.1 -2.7
a/ Change over 1989-93b/ Change over 1989-92c/ Change over 1989-91Source: De Melo, Denizer and Gelb (1996)
a/
a/
a/
b/a/
b/
a/
a/
c/
c/
1/27/98 22 Table3.xls
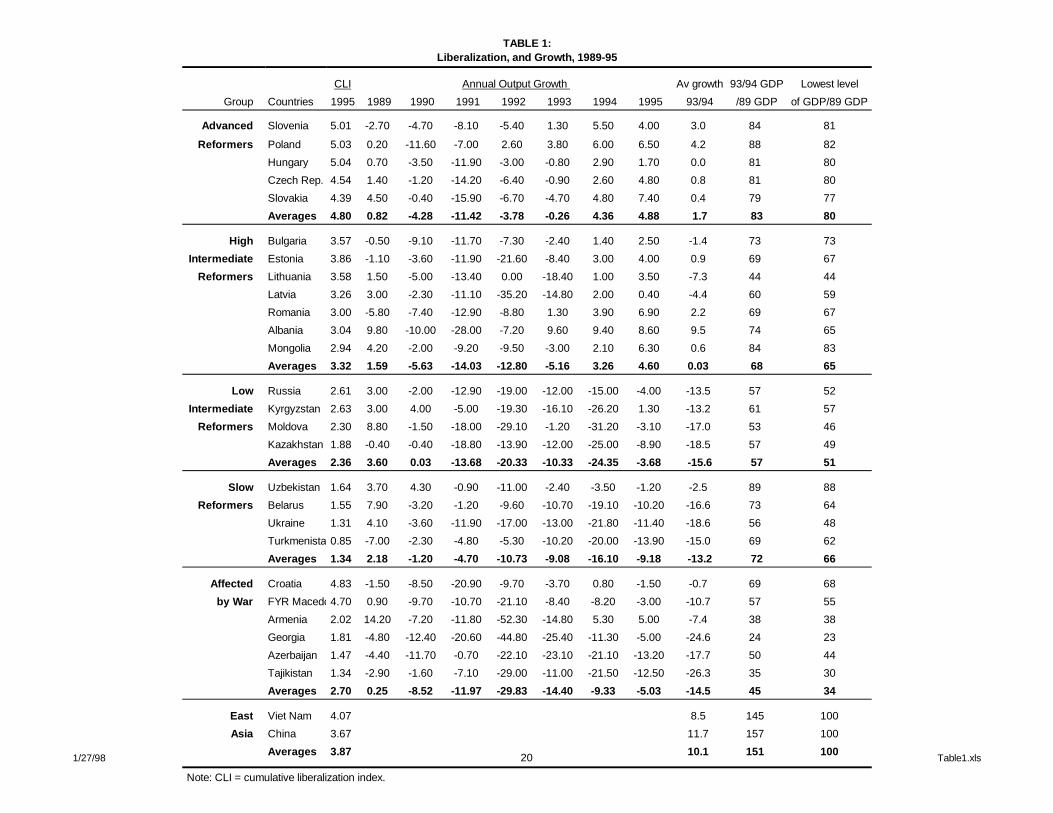
TABLE 1:Liberalization, and Growth, 1989-95
CLI Annual Output Growth Av growth 93/94 GDP Lowest level
Group Countries 1995 1989 1990 1991 1992 1993 1994 1995 93/94 /89 GDP of GDP/89 GDP
Advanced Slovenia 5.01 -2.70 -4.70 -8.10 -5.40 1.30 5.50 4.00 3.0 84 81
Reformers Poland 5.03 0.20 -11.60 -7.00 2.60 3.80 6.00 6.50 4.2 88 82
Hungary 5.04 0.70 -3.50 -11.90 -3.00 -0.80 2.90 1.70 0.0 81 80
Czech Rep. 4.54 1.40 -1.20 -14.20 -6.40 -0.90 2.60 4.80 0.8 81 80
Slovakia 4.39 4.50 -0.40 -15.90 -6.70 -4.70 4.80 7.40 0.4 79 77
Averages 4.80 0.82 -4.28 -11.42 -3.78 -0.26 4.36 4.88 1.7 83 80
High Bulgaria 3.57 -0.50 -9.10 -11.70 -7.30 -2.40 1.40 2.50 -1.4 73 73
Intermediate Estonia 3.86 -1.10 -3.60 -11.90 -21.60 -8.40 3.00 4.00 0.9 69 67
Reformers Lithuania 3.58 1.50 -5.00 -13.40 0.00 -18.40 1.00 3.50 -7.3 44 44
Latvia 3.26 3.00 -2.30 -11.10 -35.20 -14.80 2.00 0.40 -4.4 60 59
Romania 3.00 -5.80 -7.40 -12.90 -8.80 1.30 3.90 6.90 2.2 69 67
Albania 3.04 9.80 -10.00 -28.00 -7.20 9.60 9.40 8.60 9.5 74 65
Mongolia 2.94 4.20 -2.00 -9.20 -9.50 -3.00 2.10 6.30 0.6 84 83
Averages 3.32 1.59 -5.63 -14.03 -12.80 -5.16 3.26 4.60 0.03 68 65
Low Russia 2.61 3.00 -2.00 -12.90 -19.00 -12.00 -15.00 -4.00 -13.5 57 52
Intermediate Kyrgyzstan 2.63 3.00 4.00 -5.00 -19.30 -16.10 -26.20 1.30 -13.2 61 57
Reformers Moldova 2.30 8.80 -1.50 -18.00 -29.10 -1.20 -31.20 -3.10 -17.0 53 46
Kazakhstan 1.88 -0.40 -0.40 -18.80 -13.90 -12.00 -25.00 -8.90 -18.5 57 49
Averages 2.36 3.60 0.03 -13.68 -20.33 -10.33 -24.35 -3.68 -15.6 57 51
Slow Uzbekistan 1.64 3.70 4.30 -0.90 -11.00 -2.40 -3.50 -1.20 -2.5 89 88
Reformers Belarus 1.55 7.90 -3.20 -1.20 -9.60 -10.70 -19.10 -10.20 -16.6 73 64
Ukraine 1.31 4.10 -3.60 -11.90 -17.00 -13.00 -21.80 -11.40 -18.6 56 48
Turkmenistan0.85 -7.00 -2.30 -4.80 -5.30 -10.20 -20.00 -13.90 -15.0 69 62
Averages 1.34 2.18 -1.20 -4.70 -10.73 -9.08 -16.10 -9.18 -13.2 72 66
Affected Croatia 4.83 -1.50 -8.50 -20.90 -9.70 -3.70 0.80 -1.50 -0.7 69 68
by War FYR Macedonia4.70 0.90 -9.70 -10.70 -21.10 -8.40 -8.20 -3.00 -10.7 57 55
Armenia 2.02 14.20 -7.20 -11.80 -52.30 -14.80 5.30 5.00 -7.4 38 38
Georgia 1.81 -4.80 -12.40 -20.60 -44.80 -25.40 -11.30 -5.00 -24.6 24 23
Azerbaijan 1.47 -4.40 -11.70 -0.70 -22.10 -23.10 -21.10 -13.20 -17.7 50 44
Tajikistan 1.34 -2.90 -1.60 -7.10 -29.00 -11.00 -21.50 -12.50 -26.3 35 30
Averages 2.70 0.25 -8.52 -11.97 -29.83 -14.40 -9.33 -5.03 -14.5 45 34
East Viet Nam 4.07 8.5 145 100
Asia China 3.67 11.7 157 100
Averages 3.87 10.1 151 100
Note: CLI = cumulative liberalization index.
1/27/98 20 Table1.xls

Source: De Melo, Denizer, Gelb (1996)
1/27/98 21 Table1.xls

Group 1 16Group 2 10Group 3 4Group 4 -1
Figure 1. Change in share of service sector in GDP
Low IntermediateReformers
AdvancedReformers
High Intermediate Reformers
Low Reformers-2
0
2
4
6
8
10
12
14
16
18
1/27/98 28 Figure1.xls

Figure 1. Change in share of service sector in GDP
Low IntermediateReformers
High Intermediate Reformers
Low Reformers
1/27/98 29 Figure1.xls

2
I. INTRODUCTION
It is now almost eight years since the transition from plan to market and from one party to
democratic rule has begun in Eastern Europe (EE), and over five years in the former Soviet Union
(FSU). It is widely agreed that this political and economic transition, affecting about one fourth of the
world's population, has been a unique and historic experience1. In EE political regimes changed in a
very short time ending one party system socialism. In further east, the collapse of the FSU resulted in
fourteen newly independent states. Output declines surpassed expectations and some countries lost
more than half of their GDPs by 1995. Over the course of the transition inflation has reached
thousands of percent, especially in FSU countries, sharply lowering wages and hence living standards.
The scope and scale of necessary policy reforms to complete the transition have been
unprecedented. Since the entire economic and political edifice has collapsed, the transition required a
"systemic change; liberalization of tightly controlled prices under socialism, freeing of foreign trade and
opening up current and capital accounts, allowing private sector entry, privatization and enactment of
laws for private property ownership, and restructuring of financial systems. However, the issue was
not simply implementing these reforms. As noted by Bruno (1993) the main novelty in EE and FSU
lied in "the revolutionary change in institutions and in the required norms of economic behavior...",
Clearly, this includes, in fact requires, redefining the role of the State, a major task by itself.
On this front, the EE and FSU countries faced different challenges. While the EE countries
were sovereign states prior to the collapse of socialism, with the exception of Russia and the Baltics,
1 For a review of socialist sytem and some aspects of transition experience in a historical context see Kornai(1992). For a review of conceptual linkages among reform policies see Kornai (1995), and Blanchard (1997). For acomprehensive review of the economic issues during transition see Lavigne (1995). Stiglitz(1994) also discusses someimportant aspects of transition. Gros and Steinherr(1995) provide a thorough review of transition in EE. Eurpean Bankfor Reconstruction and Developmet (EBRD) provides a review of transition in its annual Transition Report since 1994. For a comprehensive review of transition, including China's experience, see World Development Report (1996).

3
the FSU states that became sovereign nations after the dissolution of in 1991 faced a double task: (i)
developing an administrative capacity so as to function as a sovereign nation state; and (ii) creating
national economies out of a highly integrated all Union plan based economy and converting it into a
market based one. Hence, it was clear in the beginning that transition in the FSU would be more
problematic.
To this day, the transition has been an uneven process and cross country experience has varied
significantly. Despite early difficulties, some countries have made impressive progress. Almost all EE
countries stabilized their economies and by 1994 most were enjoying growth. In the FSU, output and
inflation performance has been much more variable and transition has been more difficult as was
expected. With the exception of a handful of countries, the majority of the countries in the FSU
delayed reforms or adopted reforms gradually, and they suffered higher output falls and higher inflation
than in EE. Nevertheless, by the beginning of 1995 stabilization efforts picked up in almost all FSU
countries and most managed to control inflation. Structural reforms, however, with the exception of a
few countries, have progressed at a slower pace and growth performance has not been as strong as in
EE.
Against this background, the objective of this paper is twofold. As the discussion above
suggests and noted in the literature, reforms and economic outcomes varied widely across countries
and this gave rise to "transition patterns" in terms of growth and inflation (World Bank). What
accounts for these patterns? Is it largely due to policy variations or inherited initial conditions, or both?
These questions are the focus of the first part of the paper. In the second part, the paper considers the
growth prospects of transition economies. Since they all suffered from output declines and improving
welfare requires growth, this issue is high on the agenda for all transition economies. The focus is on

4
the analysis of factors of that could facilitate or hinder growth based on the findings of the current
empirical growth literature.
The limitations of the data used in this paper and in other transition related studies is well
known and are discussed elsewhere2. However, since the focus of the paper is on comparative
patterns broadly rather than precise estimates of various aggregates or their analysis, it is thought that
available data could serve the purpose on hand reasonably well.
II. PERFORMANCE DURING THE TRANSITION
This section provides a review of main macroeconomic aggregates, GDP growth and inflation
rates in the EE and FSU up to 1996. The data organized according to the Cumulative Liberalization
Index (CLI) originally prepared by de Melo, Denizer and Gelb (DDG). The CLI is annual and covers
the period between 1989 - 1995. It is composed of three sub-indices and each vary between zero,
representing a centrally planned economy and one, representing a reformed, market based economy.
These are internal or domestic price liberalization and competition (I); foreign trade liberalization and
current and capital account convertibility (E) and privatization, new entry regulations and small and
large enterprise development (P). Using these three sub-indices and assigning them weights (0.3, 0.3,
and 0.4 respectively) DDG create a cumulative liberalization index (CLI) for the same time period. In
this way, the CLI captures both the intensity and duration of reforms.
Following this exercise, the countries are grouped into reform categories. Countries that were
affected by regional tensions or civil wars, are shown separately. The groupings are arranged by the
following values of the CLI:
2 For a discussion of the nature of data biases in transition countries see World Development Report (1996).

5
Group 1: advanced reformers, CLI>4
Group 2: (high) intermediate reformers, 2.7<CLI<4
Group 3: (low) intermediate reformers, 1.7<CLI<2.7
Group 4: slow reformers, CLI<1.7
As shown in table 1, when transition started out, 1989 in EE and late 1991 in FSU, there was a
recession in all countries. This was expected and many analysts pointed this out early in the transition
(Bruno 1991, Fischer and Gelb 1991). What was not expected, however, was the severity of the
declines in output. Initial years of transition saw massive declines in reported GDP, which reached to
an average of 41 percent of GDP by 1995, as noted by Fischer et al (1996). In the case of FSU, output
collapse started in 1992 although in most countries output has been falling since 1989. This was
mainly due to the breakdown of the CMEA trading system, and given the interlinked nature of
production structure in the FSU, output falls were simply unavoidable early on in the process.
Inflation has also increased rapidly initially. This largely reflected the effects of price
liberalization and hence it was a necessary level adjustment towards international prices. However,
continued increases in prices after the initial spurt largely reflected the effects of monetary financing of
deficits. Only three countries in Europe (Czech Republic) managed to contain inflation in double digits
throughout. In the FSU inflation first increased in 1991 from previous low levels. Starting in 1992,
price increases reached record levels, with Armeina and Ukraine recording inflation rates of 10,000
percent in the year of maximum inflation. Every country in FSU, except the Baltics, at one point
experienced inflation rates of more than 1000 percent.
6
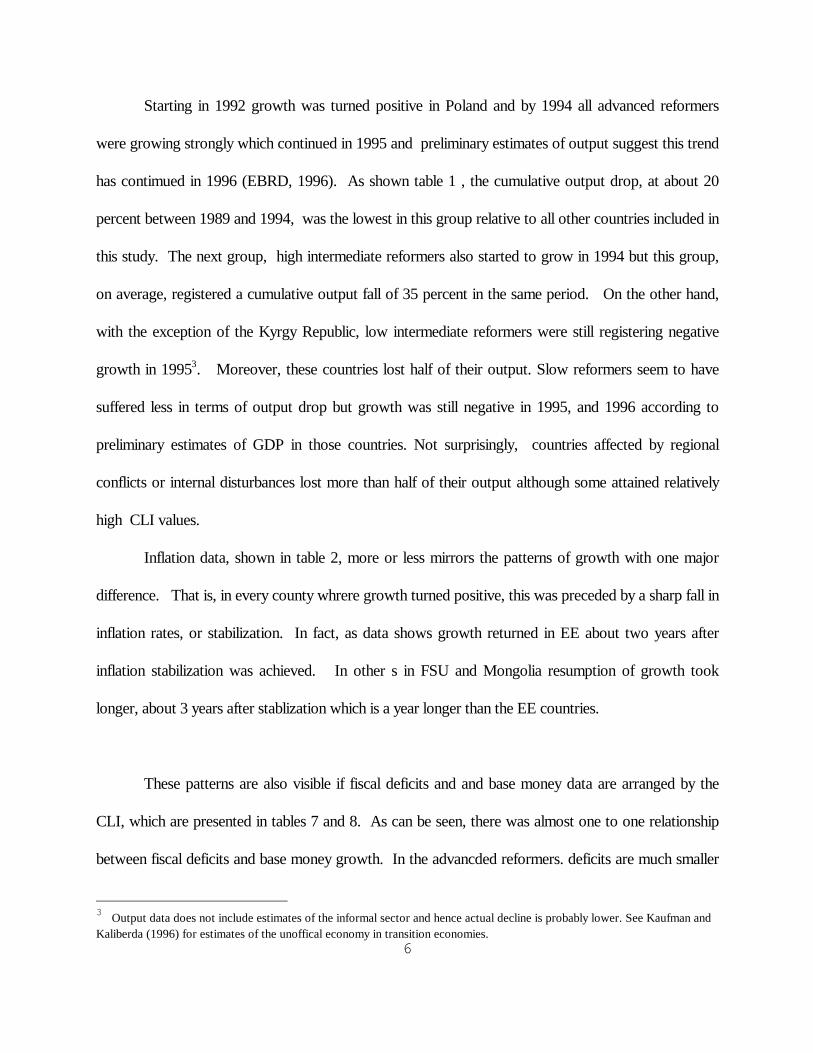
Starting in 1992 growth was turned positive in Poland and by 1994 all advanced reformers
were growing strongly which continued in 1995 and preliminary estimates of output suggest this trend
has contimued in 1996 (EBRD, 1996). As shown table 1 , the cumulative output drop, at about 20
percent between 1989 and 1994, was the lowest in this group relative to all other countries included in
this study. The next group, high intermediate reformers also started to grow in 1994 but this group,
on average, registered a cumulative output fall of 35 percent in the same period. On the other hand,
with the exception of the Kyrgy Republic, low intermediate reformers were still registering negative
growth in 19953. Moreover, these countries lost half of their output. Slow reformers seem to have
suffered less in terms of output drop but growth was still negative in 1995, and 1996 according to
preliminary estimates of GDP in those countries. Not surprisingly, countries affected by regional
conflicts or internal disturbances lost more than half of their output although some attained relatively
high CLI values.
Inflation data, shown in table 2, more or less mirrors the patterns of growth with one major
difference. That is, in every county whrere growth turned positive, this was preceded by a sharp fall in
inflation rates, or stabilization. In fact, as data shows growth returned in EE about two years after
inflation stabilization was achieved. In other s in FSU and Mongolia resumption of growth took
longer, about 3 years after stablization which is a year longer than the EE countries.
These patterns are also visible if fiscal deficits and and base money data are arranged by the
CLI, which are presented in tables 7 and 8. As can be seen, there was almost one to one relationship
between fiscal deficits and base money growth. In the advancded reformers. deficits are much smaller
3 Output data does not include estimates of the informal sector and hence actual decline is probably lower. See Kaufman andKaliberda (1996) for estimates of the unoffical economy in transition economies.

7
and the monetary policy is not under pressure to accommodate the deficits. In the second and third
group deficits are larger but base money growth was still under control as domestic and foreign
financing were available which in turn depended upon reforms. The slow reforming group seem to
have lesser deficits than the second and third group but this hides subsidized central bank lending. As
shown by DDG (1996) and reproduced in this paper as table 9, such lending, which is an element of
quasi-fiscal deficits, ranged 9-20 percent of GDP in slow reforrmers and as a result base money growth
was rapid.
III. REFORMS, GROWTH AND INFLATION
What lies at the source of this differential reform, output and inflation performance across
countries? It is obvious that one source is the economic policies followed by countries. To explore the
relationship between policies and outcomes, a cross country regression analysis is carried out similar to
DDG (1996). In this framework growth and inflation equations are estimated as functions of the CLI
and some other control variables. Since the other source of cross country variation could be due to
initial conditions (ICs), this paper extends the DDG study including proxies for ICs into the regression
equations.
The other variables included in the regression analysis are the following. In the first equation,
the dependent variable is the GDP growth rate (GR). The CLI is the key variable. A positive
relationship would be an indication of the beneficial effects of economic policies or reforms on growth.
Since overindustrialization was one of the features of centrally planned economies, the share of
industry in GDP (IS) was included in the equations. The rationale is that the more industrialized a
country, the disruption of trade and financial flows due to the collapse of planning would be larger and

8
reduce growth rate during the transition period. In this way the effects of trade dependence are also
captured.
There are two initial condition proxies included in the equations. The first is a dummy variable
for institutional factors (IF). It is given a value of one for the countries which were market oriented
and sovereign states before becoming socialist countries. The idea is to understand the importance of
market memory and administrative capacity during the transition. As noted already most FSU
countries, except the Baltics, were never independent states in their history and this could be an
important determinant of their ability to reform. The second factor considered is the distance, (DM)
from markets. For this purpose, following Murrell (1996) the distance (in miles) from Vienna is used.
The goal is to understand the importance of geographical distance from rich markets on growth
performance. Regional tensions are also captured with a dummy variable (RT).
The following equation is estimated with t ratios in parenthesis:
GR = -3.2 + 1.9CLI - 1.2IS - 4.7DM + 3.9IF - 9.1RT ......... ..(1)
(-2.8) (3.1) (-2.2) (-4.2) (1.9) (-3.7)
Adjusted R2: 0.57
For inflation a different specification is proposed. In addition to the CLI, fiscal deficits (FD)
and repressed inflation (RI) are added. Fiscal deficits are consolidated budget deficits of each country.
9
Repressed inflation is calculated by change in wages less change in GDP. Since only wage payments
were made in cash under central planning, wage rises beyond GDP growth would mean the
accumulation of financial assets by households given shortages of goods. This is also known as
monetary overhang. Hence, the larger the repressed inflation, the larger the price increases would be.
The estimated equation is:
LogINF = 3.7 - 4.2CLI + 1.2FD + 2.9RINF + 9RT................(2)
(2.9) (-2.4) (4.33) (1.8) (2.5)
Adjusted R2: 0.63
According to the results in the first equation, CLI was positively related to growth. The
coefficient of industry confirms our expectation that more developed countries would face larger
declines in their growth rates. Both initial condition variables enter with the expected sign. This
suggest that countries that were not independent states in their history and far from rich markets
suffered more during the transition. This is an important finding as it suggests that initial conditions
matter in the transition period and this may have limplications for long run growth potential of the
countries in question. Regional tension variable enters with a negative sign as anticipated. While the
estimated coefficient needs to be interpreted with caution as they only capture broad relationships
between the variables used, the large coefficient of regional tension variable is suggestive of how much
it could add to the decline in the growth rate in addition to other factors.

10
Results of the inflation equation are also in line with our apriori expectations. Comprehensive
and sustained reform efforts were negatively related to inflation rates. Smaller fiscal deficits also
reduce inflation although it is significance level is lower than the CLI coefficient. This is expected
because reforms reduce subsidies which in turn reduce fiscal deficits. Repressed inflation enters with a
positive sign which suggests that this variable as expected. Regional tension (RT) variable has a
positive coefficient as expected and highly significant4
Regressions were also run with the individual components of the index. The results show that
this does not change the qualitative conclusions and hence they are not presented . In each case they
are significant and enter with the expected sign. There is a change in the coefficients but this is
relatively small in magnitude.
IV. REFORMS AND STRUCTURAL CHANGE: THE LINKS AND THE PROGRESS
The effects of the intensity and duration of reforms on economic structure can be analyzed by
examining three indicators. The first one is the share of services. Previously, this was a repressed
sector, and with the liberalization of the economy, it was expected that services would expand rapidly.
As shown in table 3, this was realized and rapidly reforming economies recording the largest increases
as a percentage in their GDPs. In fact, given the decline in the shares of industry and agriculture, it
seems that the link between growth and reforms were largely driven by the growth of the services
sector.
The other indicator of structural change is the change in the share of private sector in GDP. It
goes without saying that private sector’s share was low under socialism. However, again there were
4 Controlling for the effects of different reform start dates did not change the results. Hence time profile of inflation andgrowth support the results presented in this paper. For a description of the technique how this could be done see DDG (1996).
11
differences across countries. In EE, Poland, for example, had a sizable agricultural sector and private
sector accounted for between 30-40 percent in EE before transition began. In FSU, the share was
quite small averaging about 15-20 percent of GDP at the most. By 1994, about 3 years after reforms
private sector surpassed 50 percent mark in all advanced reformers and by 1996 this percentage was up
by as much as 75 percent in Czech Republic and Albania (figure 1). In FSU, excluding Baltics, this
process has been slower and three years after the collapse of the FSU, or in 1995, private sector share
as a whole remained relatively low, about 37 percent on average. Only Russian Federation had a larger
share of private sector than the public sector as of mid-1996. The Kyrghz Republic was the second
after Russia with 50 percent.
Change in employment is also an indication of adjustment and restructuring. While the data on
employment in FSU is particularly problematic, the broad trends can be observed and compared to the
EE countries. As shown in table 4, advanced reformers and high intermediate reformers differ radically
on this measure. Measured unemployment rose steadily between in EE and the Baltics whereas it
remained at negligible levels in the FSU countries. While unofficial data suggests employment is much
higher in FSU as well, the registered unemployment data does not show this. Since enterprise labor
shedding has been much slower in FSU this maybe normal. However, it is evident that reallocation of
labor has been happening at a more rapid rate in EE than FSU.
Taken together these patterns suggest the following. First, since service sector growth led the
recovery and this was due to the de novo entry by small and medium firms through new-start ups and
not privatization, it seems that growth came from reallocation of resources and hence increased
efficiency (Gomulka, 1996). Changes in investment ratios point to the same conclusion. As shown by
De Melo et al (1996) investment ratios fell from around 36 percent on average under socialism to

12
about 20-25 percent range over the course of transition. The fact that many transition countries are
now growing for the last couple of years with these lower investment rates is a clear indication that
investment efficiency is much higher now than before.
The link to reforms seem reasonably straightforward. In reforming countries liberalizing the
economy forced sectors that suffered form structural demand shift due to collapse of communism to
adjust. At the same, since this involved the elimination of subsidies (hard budget constraints), it
permitted new and expanding sectors to obtain resources. This in turn supported growth in new new
and productive sectors and moderated the decline in GDP. Hence, reforming transition economies
required simultaneous implementation of macro and micro policies. Moreover, as the experience
shows, this did not involve a trade off between growth and stabilization5. What policy choices affected
were the time profile of output declines, not their cumulative decline since the structural demand shift
was a permanent event. Given this situation, status quo, or non-reform was not a policy choice. This
also implied that delaying reforms would not improve output performance and it is in this sense rapid
reforms are desirable. Clearly and with the benefit of hindsight, the issue was not fast reform versus
gradual reform for growth performance and inflation performance but one of trade-off between
reforms and growth and inflation.
V. ECONOMIC GROWTH POTENTIAL IN THE LONG TERM
Section III analyzed the determinants of growth during the transition period using cross
country regression equations. The results are indicative of this period and they are literally transitory
findings. Further, as economies move along, the explanatory power of independent variables used in
5 Bruno and Easterly (1994) and Easterly (1996) show that stabilization programs do not necessarily involveoutput losses. In fact, Easterly shows that most stabilization programs are expansionary.

13
equation 1 will be diminished. Hence, a longer run growth potential analysis would require standard
growth determinants type of analysis. However, sufficient time has not passed yet to estimate
meaningful long term growth equations for transition economies.
Given this problem, we adopt the approach used by Fischer, Sahay and Vegh (1996), which
relies on the existing cross-country growth determinants found in Barro (1991), and Levine and Renelt
(1992). Fischer et al carry out such analysis for 15 of the 26 transition countries considered in this
study. In this paper, their analysis is extended for all 26 transition economies in EE and FSU. The
basic strategy is to use coefficients estimated by Levine and Renelt (LR) and estimate growth rates for
transition economies as a function of initial conditions and control variables that condition the long run
growth process in the neo-classical models of growth. Our analysis draws on LR because their analysis
includes variables that are shown to be robust in various specifications of the growth equation.
The long run growth determinants for the 26 countries under study are presented in
table 5. Data sources are given under each variable heading in the same table. The equation used to
estimate future growth rates takes the following form:
gp(t) = f( Y(0), SSE(0), IN(t), PGR(t) )
In this formulation gp(t) is the growth rate of per capita income. Y(0) is the initial per capita
income, SSE(0) is the secondary school enrollment ratio measured as a percentage of the total
secondary school aged population, IN(t) is the ratio of physical investment to GDP, and PGR(t) is the
population growth rate. It is expected that the per capita growth rate, gp, would have a negative
relationship to (Y0). This is due to the neoclassical convergence hypothesis which posits that poorer

14
countries should grow faster than the richer countries holding everything else constant. SSE is
included to capture human capital's impact on growth and it is expected that this variable would have a
positive relationship to gp. As shown in the literature higher investment rates tend to increase growth
rates although the efficiency of investment is also important. PGR is expected to have a negative
relationship with gp.
As shown in table 5, there are large differences across countries in terms of per capita income.
This is even true for the FSU countries which shows the former Union was not successful in reducing
gp differences among its constituents. It is clear that the EE countries and the Baltics are closer to
middle income counties than most of the FSU. Investment levels declined from previous highs as
noted already and as of 1994 averaged around 25 percent of GDP which seems reasonable. It is
however relatively low in Albania, Bulgaria, Croatia, Macedonia, and Poland. On the other hand they
are unrealistically high in Belarus and Turkmenistan which is probably due to measurement problems.
As noted by Fischer et al (1996), the most interesting feature of this table is the high secondary
school enrollment ratios. This reflects the importance attached to education under socialism and
should be regarded as a potential source for growth. While this is so, what is important is to realize
that there will be different skill needs under a market based system and all transition economies will
continue to need to invest in human capital.
Population growth rates show a significant degree of variation across countries. The EE and
Baltics have low growth rates while some parts of the FSU, mostly Central Asian countries, have rates.
This suggests higher growth rates for the EE and Baltics and lower for the Central Asian states.
Using this data and the coefficients of the Levine and Renelt equation, given below, per capita
growth rates could be forecasted.
15
gp = -0.83 - 0.35Y(1960) - 0.38POP + 3.17SEC + 17.5INV
where Y(1960) refers to the initial level of real per capita income at international prices, POP is
the growth rate of the population, SEC is the secondary school enrollment rate, and INV is the share of
investment in GDP.
The results are also presented in table 5. There are again significant variations among the
countries but on average the forecasted growth rate seems to be around 5 percent. The results are
mostly in line with our expectations. Countries with higher investment in human capital and physical
capital are forecasted to grow faster.
Using these results, it is not difficult to estimate the number of years it would take these
countries to reach current OECD levels of income per capita. While this exercise maybe more relevant
for the EE and the Baltics, it nevertheless provides some idea how long it may take the FSU countries
if their objective is to enjoy per capita income levels similar to the OECD. The results are presented in
table 6. It is clear that it would take most EE and Baltic countries between 20 and 25 years. Russia
and Belarus also fall in this range. On the other hand, given initial conditions and economic policies it
would take most other FSU longer, on average about 45 years.
Given the parameter values in the Levine and Renelt growth equation various simulation exercises
could be performed by changing the variables (levels or growth rates) included in the study. In this
paper, the focus is on investment6. In particular we ask the question: what would be the impact of
raising growth to 30 percent of GDP from its current levels? The result, also presented in table 6,
6 For the countries that already had investment ratios above 30 percent this exercise was not performed.
16
show substantial change in long term growth rates, which is expected. In some cases, the differences
are drastic. For example, Armenia's per capita growth rate jumps to 5.8 percent from 2.3 percent
which in turn reduces the number of years to converge to OECD levels by 55. This shows the
sensitivity of growth rates to changes in investment and is a clear indication that transition countries
should aim to save more and invest more.
VI. POLICY ISSUES AND CONCLUSIONS
The main findings of this paper are that reforms in transition economies were successful in
reducing inflation and restoring growth. Important as they are, these findings, however, can not
explain the transition experience. The question was how to respond to the advent of transition and this
is where most countries in EE differed from the FSU, with the exception of Baltics. As explained in
the paper, the EE countries rapidly moved with reforms while the FSU countries were in general, late
in developing reform programs and implementing them. But why so?
The crucial difference which largely determined economic policy choices or reform strategies
was the political change. It is no secret that almost all EE countries and the Baltics wanted to break
away from communism and FSU domination, and transition there in was first characterized by political
change. Communists were discredited and removed from power which gave rise to a “period of
extraordinary politics” which provided the window opportunity for reforms. (Balcerowicz and Gelb,
1994) . The collapse of the FSU, onthe other hand, was different. While there were indications of
discontent with the Union, with the exception of the Baltics, these were not as strong as in the EE
countries and there were explicit demands for independence. More importantly, when the FSU
collapsed, this did not lead to a political change in most FSU states.

17
Given this, rather than reforming quickly, the former communists hoped that the
Commonwealth of Independent States (CIS), which was set up after the collapse of the FSU, would
evolve into a loose federation so that trade and financial links would not disappear. In fact, until the
Russian Federation issued new rubles and forced out other countries out of the ruble zone in late 1993
many countries did not want implement policies that were too different than Russia's. What political
leaders did not realize at the time, however, was the permanent nature of the change which required
adjustment. In short, the reform choices were heavily conditioned by the countries' politics and their
perceptions and aspirations.
Most clear evidence is the behavior of Baltics. Sharing very similar production structure with
other FSU states they left the Union early in the process. Following this, they adopted their currencies
and were successful in stabilizing their economies. This is quite telling. All ruble zone countries had
the option of moving out of it but did not do so until late 1993. In fact, there is a quickening of pace of
reforms after the collapse of the ruble zone in the FSU. As this experience show, knowing where to go
has been an important determinant of reforms. The EE and Baltics, wanting to join the European
Union (EU) and encouraged by it, first initiated political change which in turn led to reforms. Most
FSU countries, not fully knowing whom to align themselves with initially saw no other country other
than the Russian Federation, which in turn heavily influenced their reforms.
Once reforms are launched, the outcomes are quite similar as this paper showed. Growth starts
about two full years after stabilization although the FSU took about a year longer. This suggests, initial
conditions, which are shown to be important in this paper are relevant factors in the process of
transition.
18
Longer term prospects seem more favorable for the EE and the Baltics in the short to medium
term. Nevertheless, they still have a catching up to do with the OECD countries as our results showed.
However, if they are admitted to the EU, which seems likely after the year 2000, they may attain high
growth rates even in the longer term. The FSU countries have even more catching up to do than the
EE countries. In the short to medium term countries with slower population growth rates and strong
reform efforts could be expected to enjoy rapid rates of growth per capita. The Central Asian
countries have relatively high population rates and this is likely to affect their per capita growth rates
negatively in the short to medium term. What this suggests is that they need high economic growth
rates, exceeding their population growth rates, a clear indication that there is not much room for
slowing reforms. Furhter, given the benefits of integration, there is a strong case for Central Asian
countries to push for an economic union, which would also facilitate the resructuring of their
economies.

19

20

21

22

23

24

25

26

27

28

29

30
References
Aghion, Philippe and Olivier Blanchard. "On The Speed of Adjustment In Central Europe", in S.Fischer and J. Rotemberg (eds) NBER Macroeconomics Annual, The MIT Press, Vol. 9, pp.284-320, 1994.
Alesina, Alberto. " Political Models of Macroeconomic Policy and Fiscal Reforms", in Voting ForReforms, S. Haggard and S. Webb (eds), World Bank, Oxford University Press, pp. 37-60.1994.
Aslund, Anders. "Lessons of the First Four Years of Systemic Change in Eastern Europe", in Journalof Comparative Economics, vol. 19, no. 1, August 1994, pp. 22-39.
Balcerowicz, Leszek. "Common Fallacies In The Debate On The Economic Transition In Central AndEastern Europe", EBRD Discussion Paper No. 11, October 1993.
________ and Alan Gelb, 1994. "Macropolicies in Transition to a Market Economy: A Three-YearPerspective", prepared for the World Bank Annual Conference on Development Economics,April 28-29, Washington, D.C.
Banerjee, Biswait, Vincent Koen, Thomas Krueger, Marl S. Lutz, Michael Marrese, and TapioSaavalainen (1995). Road Maps of Transition, The Baltics, the Czech Republic, Hungary andRussia, IMF Occasional Paper No. 127, September 1995.
Barro, Robert J. 1991. “Economic Growth in a Cross Section of Countries,” Quarterly Journal ofEconomics,” 06, May, pp. 407-443.
Bennett, Adam, G.G. (1994). "Currency Boards: Issues and Experiences," IMF Paper on PolicyAnalysis and Assessment 94/18.
Berg, Andrew. "Recession and Structural Adjustment in Poland", paper presented at IMF Seminartitled "Recession and Reform in Poland", January 1993. (?)
_______ "Does Macroeconomic Reform Cause Structural Adjustment? Lessons From Poland".Journal of Comparative Economics, Vol.18, No.3, pp. 376-410, June, 1994
_______and Jeffrey Sachs. "Structural Adjustment And International Trade In Eastern Europe: TheCase of Poland", Economic Policy: A European Forum, No. 14, pp. 117-173, April 1992.
Blanchard, Olivier Jean. “The Economics of Post-Communist Transition,” Clarendon Lectures inEconomics, Oxford University Press, forthcoming 1997.

31
, Kenneth A. Froot, and Jeffrey D. Sachs, The Transition in Eastern Europe:Volume II - Restructuring, The University of Chicago Press, Chicago.
Blejer, Mario I. and Adrienne Cheasty eds. 1993. How to Measure the Fiscal Deficit, InternationalMonetary Fund, Washington, D.C.
Brada, Joseph, I.J. Singh, and Adam Torok (1994). Firms Afloat and Firms Adrift:Hungarian Industryand the Economic Transition, M.E. Sharpe, London and New York.
Bredenkamp, Hugh. (1993). "Conducting Monetary and Credit Policy in Countries of the FormerSoviet Union: Some Issues and Options", IMF Working Paper 93/23.
Bruno, Michael, 1993a. Crisis, Stabilization and Economic Reform: Therapy by Consensus, OxfordUniversity Press, Oxford.
Bruno, Michael. 1993b. "Stabilization and the Macroeconomics of Transition: How Different isEastern Europe?," in Economics of Transition, Vol. 1, No. 1, EBRD, pp. 5-19.
Burda, Michael C. 1994. Structural Change and Unemployment in Central and Eastern Europe: SomeKey Issues, Discussion Paper Series No. 977, Centre for Economic Policy Research, London,June.
Calvo, Guillermo, Ratna Sahay and Carlos Vegh. (1995) "Capital Flows in Central and EasternEurope: Evidence and Policy Options", Draft IMF Working Paper.
________.and Manmohan S. Kumar, 1994. "Money Demand, Bank Credit, and EconomicPerformance in Former Socialist Economies", Staff Papers, International Monetary Fund,Vo.41, No.2, pp. 314-349, June, 1994.
________.and Carlos Vegh (1992). "Inflation Stabilization and Nominal Anchors," IMF Papers onPolicy Analysis and Assessment 92/4.
Chadka, Bankim, Fabrizio Coricelli, and Kornelia Krajnyak. "Economic Restructuring, Unemployment,and Growth in a Transition Economy", Staff Papers, International Monetary Fund, Vol.40,N0.4, pp. 744-781, December 1993.
_________ and Fabrizio Coricelli. 1994. Fiscal Constraints and the Speed of Transition, DiscussionPaper Series No. 993, Centre for Economic Policy Research, London, July.
Chu, Ke-young and Gerd Schwartz. 1994. "Output Decline and Government Expenditures inEuropean Transition Economies," IMF Working Paper No. WP/94/68, International MonetaryFund, Washington, D.C., June.

32
Citrin, Daniel, J. Anderson, J. Zettelmeyer (1995). " The IMF's Approach to Stabilization in the Baltics,Russia and the Other FSU Countries, " Economic Policy in Transition Economies (MOCT),Kluwer Academic Publishers, Vol. 5, No. 2.
Conway, Patrick (1995). Currency Proliferation: The Economic Legacy of the Soviet Union.Forthcoming, Princeton Studies in International Finance.
Coricelli, Fabrizio. 1994. "Fiscal Issues in Transition Economies," Department of Economics,University of Sienna, Italy, September.
Dabrowski, Marek. 1995. "Different Strategies of Transition to a Market Economy: How Do TheyWork in Practice?", mimeo, Transition Economies Division, Policy Research Department,World Bank.
de Grauwe, Paul. 1995. "Monetary Policies in the EMS" in C. Bordes, E. Girardin, J. Melitz (eds.)European Currency Crises and After, Manchester University Press, Manchester and NewYork.
de Melo, Martha, Cevdet Denizer, and Alan Gelb. 1996. “From Plan To Market: Patterns ofTransition,” Policy Research Department, World Bank, April (revised).
, Cevdet Denizer, Alan Gelb, and Stoyan Tenev. 1997 forthcoming. "ExplainingTransition: the Role of Initial Conditions in Reforming Socialist Countries", Policy ResearchDepartment, World Bank, Washington, D.C.
, and Alan Gelb, “A Comparative Analysis of Twenty Eight Transition Economies inEurope and Asia,” Post-Soviet Geography and Economics, 1996, 37, no. 5, pp. 265-285.
Easterly, William. (1995) "When is stabilization expansionary?", Working Paper, Policy ResearchDepartment, World Bank, Washington, D.C.
Easterly, William and Michael Bruno. 1994. "Inflation Crises and Long-run Growth", mimeo, PolicyResearch Department, World Bank.
Easterly, William, Martha de Melo, and Gur Ofer. 1994. "Services as a Major Source of Growth inRussia and Other Former Soviet States", Working Paper Series No. ?, Policy ResearchDepartment, World Bank. Mario Blejer, ed., Macroeconomic and Structural Aspects ofRussian Economic Reform, International Center for Growth.
Edwards, Sebastian (1992). "Stabilization and Liberalization Policies for Economies in Transition:Latin American Lessons for Eastern Europe," in C. Clauge and Rausser (eds.) The Emergenceof Market Economies in Eastern Europe, Basil Blackwell Publishers.
European Bank for Reconstruction and Development. 1994. Transition Report, EBRD, London.

33
________.(1995). Transition Report Update, EBRD, London. April 1995.
Fan, Qimiao and Mark Shaffer. " Government Financial Transfers and Enterprise Adjustment in Russia,With Comparison To Central And Eastern Europe", World Bank Discussion Paper, Europeand Central Asia Region, Washington DC, June 1994.
Fedorov, Boris (1995). "Macroeconomic Policy and Stabilization in Russia", in Aslund, Anders (ed.)Russian Economic Reform at Risk, London and New York: Pinter.
Fischer, Stanley. (1986). "Exchange Rate versus Money Targets in Disinflation" in Indexing, Inflationand Economic Policy, MIT Press.
__________ and Alan Gelb. (1991). "The Process of Economic Transformation", Journal of EconomicPerspectives 5(1).
, Ratna Sahay, and Carlos A. Végh. “Stabilization and Growth in Transition Economies:The Early Experience,” The Journal of Economic Perspectives, Vol. 10, No. 2, Spring 1996, pp. 45-66.
, “From Transition to Market: Evidence and GrowthProspects,” International Monetary Fund, Washington, D.C., August 1996.
Gelb, Jefferson, and Singh. (1993). "Can Communist Economies Transform Incrementally? TheExperience of China", in O. Blanchard and S. Fischer (eds) NBER Macroeconomics Annual,The MIT Press, Vol.8, pp. 87-133.
Gros, Daniel and Alfred Steinherr. 1995. Winds of Change: Economic Transition in Central andEasteru Europe, Longman Group UK Limited, United Kingdom.
Hanke, Steve, and Kurt Schuler (1994). Currency Boards for Developing Countries. A Handbook,International Center for Economic Growth, ICS Press, San Francisco.
Havrylyshyn, Oleh, M. Miller and W. Perraudin (1994). "Deficits, inflation and the political economy ofUkraine", Economic Policy, no. 19, October.
Helliwell, John F. 1994. "Empirical Linkages Between Democracy and Economic Growth," in BritishJournal of Political Science, Vol. 24, part 2, pp. 225-248.
Horst, Siebert (ed). Overcoming the Transformation Crisis, Institut fur Weltwirtschaft an derUniversitat Kiel, 1993.
Hughes, Gordon and Paul Hare, 1994. The International Competitiveness of Industries in Bulgaria,Czechoslovakia, Hungary, and Poland, Oxford Economic Papers 46, pgs. 200-221.

34
Hung, Nguyen Manh, editor. 1992. The Challenges of Vietnam's Reconstruction, Indochina Institute,George Mason University, Fairfax, Virginia, and East-West Center, Honolulu.
Ickes, Barry and Randi Ryterman. 1993. "From Enterprise to Firm: Notes for a Theory of theEnterprise in Transition", Chapter 5 in The Postcommunist Economic Transformation, editedby Robert Campbell, Westview Press, Boulder.
Inkeles, Alex. 1990. "Introduction: On Measuring Democracy", in Studies in ComparativeInternational Development, Vol. 25, no. 1, pp.3-6.
International Monetary Fund. 1994. World Economic Outlook: World Economic and FinancialSurveys, Washington, D.C., October.
_________."1995. World Economic Outlook: World Outlook Economic and Financial Surveys,Washington, D.C., May.
_________."Financial Relations Among Countries of the Former Soviet Union", in IMF EconomicReview, no. 1.
Jackman, Richard. 1994. "Economic Policy and Employment in the Transition Economies of Centraland Eastern Europe: What Have We Learned?," in International Labour Review, Vol. 133, No.3, pp. 327-345.
Karatnycky, Adrian. 1995. "Democracies on the Rise, Democracies at Risk", in Freedom Review.January/February 1995, Freedom House, pp. 5-22.
Kierzkowski, Henryk, Edmund Phelps, and Gylfi Zoega. 1994. "Mechanisms of Economic Collapseand Growth in Eastern Europe," PPRG Discussion Paper No. 30, Polish Policy ResearchGroup, Warsaw.
Kopits, George and Erik Offerdal. 1994. "Fiscal Policy in Transition Economies: A Major Challenge,"in Finance and Development, Vol. 31, No. 4, pp. 10-13, International Monetary Fund/TheWorld Bank, Washington, D.C., December.
Kornai, János. 1995. Highway and Byways: Studies on Reform and Post-Communist Transition, TheMIT Press, Massachusetts-London.
. 1993a. "Transformational Recession: A General Phenomenon Examined through theExample of Hungary's Development", Economie Applique, vol. 46, no. 2, pp. 181-227.
. 1993b. " The Evolution of Financial Discipline under the Postsocialist System", Kyklos,Vol.46, No. 3.

35
. 1992. The Socialist System: The Political Economy of Communism, PrincetonUniversity Press, New Jersey.
Lane, Timothy, and Elias Dinopoulos. "Fiscal Constraints on Market Oriented Reform in a SocialistEconomy" Working Paper, International Monetary Fund, Research Department, July 1991.
Lavigne, Marie. 1995. The Economics of Transition: From Socialist Economy to Market Economy,St. Martin’s Press, New York.
Leijonhufvud, Axel. 1994. "The Macroeconomic Dilemma of Russia", Commencement Lecture at theCentral European University, Prague, August.
Levine, Ross and David Renelt. 1992. “A Sensitivity Analysis of Cross-Country Growth Regressions,”American Economic Review, 82, September, pp. 942-963.
McKinnon, Ronald I. "Financial Growth and Macroeconomic Stability in China, 1978-1992:Implications for Russia and Other Transitional Economies", Journal of ComparativeEconomics, Vol. 18, No. 3, pp. 438-470, June, 1994.
Milanovic, Branko. 1995. "Poverty, Inequality and Social Policy in Transition Economies", ResearchProject on Income Distribution during the Transition, Paper no. 9, Policy ResearchDepartment, Washington, D.C. April.
Murrell, Peter. “How Far Has the Transition Progressed?” The Journal of Economic Perspectives, Vol.10, No. 2, pp. 25-44, Spring 1996.
Ofer, Gur. 1987. "Soviet Economic Growth: 1928-85", Journal of Economic Literature, 25, 4, pp.1767-1833.
Portes, Richard, editor, 1993. Economic Transformation in Central Europe: A Progress Report,Centre for Economic Policy Research, London.
Rona-Tas, Akos. 1994. "The First Shall be Last? Entrepreneurship and Communist Cadres in theTransition from Socialism", in American Journal of Sociology, vol. 100, no. 1 pp. 40-69.
Rostowski, Jacek. "Systemic Requirements for Monetary Stability in Eastern Europe and the FSU",IMF Working Paper, WP/94/24.
Saavalainen, T.O. (1995). "Stabilization in the Baltic Countries: A Comparative Analysis." IMFWorking Paper, WP/95/44.

36
Sachs, Jeffrey (1994). "Russia's Struggle with Stabilization: Conceptual Issues and Evidence," Paperpresented at the World Bank's Annual Conference on Development Economics.
__________and Wing Thye Woo, (1994). "Structural Factors in the Economic Reforms of China,Eastern Europe, and the Former Soviet Union", Economic Policy, Vol. 18, April 1994.
Sahay, Ratna and Carlos Végh, (1995). "Inflation and Stabilization in Transition Economies: AComparison with Market Economies", IMF Working Paper, WP/95/8.
_________. (1995) "Dollarization in Transition Economies: Evidence and Policy Implications"Unpublished, March, 1995.
Sargent, Thomas (1982). "The Ends of Four Big Inflations", in Robert Hall (ed.), Inflation, Causesand Effects, National Bureau of Economic Research, published by The University of ChicagoPress, Chicago.
Stiglitz, Joseph E. 1994. Whither Socialism, The MIT Press, Masachusetts-London.
Tanzi, Vito (ed). Fiscal Policies in Economies in Transition, International Monetary Fund, WashingtonDC, 1992.
Tanzi, Vito 1993. "The Budget Deficit in Transition: A Cautionary Note," in IMF Staff Papers, Vol.40, No. 3, pp. 697-707, International Monetary Fund, Washington, D.C., September.
Taylor, Lance (1994). "Market Met Its Match: Lessons For Future From The Transition's Initial Years1994", Journal of Comparative Economics, Vol.19, pp. 64-87.
Thuyet, Pham van. 1995. "Legal Framework and Private Sector Development in TransitionalEconomies: the Case of Vietnam", mimeo, Policy Research Department, World Bank.
Végh, Carlos A. "Stopping High Inflation: An Analytical Overview" IMF Staff Papers, Vol.39, No.3,pp. 626-695, September 1992.
Windell, James, Richard Anker and Gyorgy Sziraczki (1995) "Kyrghzstan: Enterprise restructuringand labor shedding in a free-fall economy, 1991-1994", Labor Market Paper No. 5,Employment Department, International Labor Office, Geneva.
Wing, Thye Woo. "The Art of Reforming Centrally Planned Economies: Comparing China, Poland,and Russia", Journal of Comparative Economics, Vol. 18, No.3, pp. 276-309, June, 1994.
World Bank, Uzbekistan: An Agenda for Reform, Washington, D.C.
World Bank (1995), Kyrgyz Republic Economic Report, Washington, D.C.
37
World Bank (1996), World Development Report: From Plan to Market, Washington, D.C.
Yusuf, Shahid. " China's Macroeconomic Performance and Management During Transition", Journalof Economic Perspectives, Vol.8, No.2, pp 71-92, June 1994.

38