stability in a volatile world - home | partnerre
TRANSCRIPT

Annual R
eport 2008
x
3x 5x
6x
x
3x
5x
6x
www.partnerre.com
x
3x
5x
6x
risk
capitalbusinessmanagem
ent
reinsurance
value
return
market
equityclients
industry
years
also
balancereturns
volatility
portfolio
new
loss
manage
underw
riting
diversification
shareholders
linesinvestm
ent
asset
year
people
strategy
company
opportunities
believe
one
level
framework
well
across
economic
financial
approach
processes
organization
catastrophe
right
good
sheet
make
limits
appetite
cycle
losses
side
appropriate
reinsurers
time
within
cultu
re
take
stability
reserving
assets
companies
key
pricing
models
strong
may
actuarial
underwriters
cedants
events
insurance
premiums
assume
actuaries
shock
attractive
think
areas
continue
focus
price
achieve
exposure
example
every
particular
important
line
liability
long-term
growth
superior
allows
total
skills
view
structure
claim
s
securities
just
ensure
impact
measure
assumed
book
potentialcapacity
future
strategic
first
liabilities
ability
policies
provide
success
position
demand
information
trend
s
around
results
clear
casualty
products
partmust
different
higher
billion
three
amount
several consistent
large
unit
diversified
U.S.
net
income
aggregatemany
less
need
term
Stability in a Volatile WorldAnnual Report 2008

12/1
993
3/19
946/
1994
9/19
9412
/199
43/
1995
6/19
959/
1995
12/1
995
3/19
966/
1996
9/19
9612
/199
63/
1997
6/19
979/
1997
12/1
997
3/19
986/
1998
9/19
9812
/199
83/
1999
6/19
999/
1999
12/1
999
3/20
006/
2000
9/20
0012
/200
03/
2001
6/20
019/
2001
12/2
001
3/20
026/
2002
9/20
0212
/200
23/
2003
6/20
039/
2003
12/2
003
3/20
046/
2004
9/20
0412
/200
43/
2005
6/20
059/
2005
12/2
005
3/20
066/
2006
9/20
0612
/200
63/
2007
6/20
079/
2007
12/2
007
3/20
086/
2008
9/20
0812
/200
8
100
120
140
160
180
200
220
240
260
280
300
320
340
360
380
400
420
Financial Highlights
(expressed in millions of U.S. dollars, except per share data)
* Source: Bloomberg
The Company’s Annual Report contains measures such as operating earnings, operating earnings per share and operating return on e quity that
are considered non-GAAP measures. See page 20 for a reconciliation of those non-GAAP measures to the most comparable GAAP measures.
For the years ended December 31, 2004 2005 2006 2007 2008
$ 3,853 $ 3,616 $ 3,689 $ 3,757 $ 3,989 Net premiums written
4,166 4,206 4,187 4,211 3,980 Total revenues
492 (51) 749 718 47 Net income (loss)
386 (252) 656 822 469
Operating earnings (loss) available to common shareholders
Earnings (loss) per common share:
$ 7.15 $ (4.59 ) $ 11.36 $ 14.29 $ 8.43
Diluted operating earnings (loss)per common share
8.71 (1.56) 12.37 11.87 0.22
Diluted net income (loss) per common share
16.8% (8.9)% 25.5% 25.2% 12.3%
Operating return on beginning common shareholders’ equity
20.4% (3.0)% 27.8% 20.9% 0.3%
Return on beginning common shareholders’ equity calculated with net income (loss) available to common shareholders
Non-life ratios:
65.6% 87.3% 54.8% 50.8% 63.9% Loss ratio
23.0 23.0 23.1 22.9 23.3 Acquisition ratio
6.0 6.0 6.5 6.7 6.9 Other operating expense ratio
94.6% 116.3% 84.4% 80.4% 94.1% Combined ratio
At December 31, 2004 2005 2006 2007 2008
$ 12,717 $ 13,783 $ 15,034 $ 16,149 $ 16,279 Total assets
3,352 3,093 3,786 4,322 4,199 Total shareholders’ equity
50.99 44.57 56.07 67.96 63.95
Diluted book value per common and common share equivalents
3,398 3,725 4,054 4,477 4,023 Market capitalization
Comparative Performance Graph
PartnerRe Share Price S&P 500
Compound
Annual Return*
Price: 8.8%
Dividend: 2.5%
Total: 11.3%
Corporate Headquarters
Bermuda
Wellesley House90 Pitts Bay RoadPembroke HM 08BermudaPhone +1 441 292 0888Fax +1 441 292 7010
Principal Offi ces
Dublin
5th Floor, Block 1 The Oval 160 Shelbourne Road Dublin 4 Ireland Phone +353 1 637 9600 Fax +353 1 637 9660
Greenwich
One Greenwich PlazaGreenwich, CT 06830-6352USAPhone +1 203 485 4200Fax +1 203 485 4300
Paris
153 rue de Courcelles75817 Paris Cedex 17FrancePhone +33 1 44 01 17 17Fax +33 1 44 01 17 80
Zurich
Bellerivestrasse 368034 ZurichSwitzerland Phone +41 44 385 35 35Fax +41 44 385 35 00
Branch Offi ces
Hong Kong
3417 Sun Hung Kai Centre30 Harbour RoadWanchai, Hong KongPhone +852 2598 8813Fax +852 2598 0886
Singapore
2 Battery RoadMaybank Tower, #23-01Singapore 049907Phone +65 6538 2066Fax +65 6538 1176
Toronto
130 King Street WestSuite 2300, P.O. Box 166Toronto, Ontario M5X 1C7CanadaPhone +1 416 861 0033Fax +1 416 861 0200
Representative Offi ces
Beijing
Room 1211, Offi ce Tower C1 Oriental Plaza No. 1 East Chang An Avenue Dong Cheng District Beijing 100738 People’s Republic of China Phone +86 10 8518 5780 Fax +86 10 8518 9676
Mexico City
Av. Presidente Masaryk No. 111Piso 1 (Regus)Col. Chapultepec Morales (Polanco)11560 México, D.F.MéxicoPhone +5255 9171 1716Fax +5255 3300 5999
Santiago
Av. Vitacura 2939 of 2701Las Condes – SantiagoChilePhone +56 2 799 2600Fax +56 2 799 2610
Sao Paulo
Al. Ministro Rocha Azevedonº 38 – conj. 103CEP 01410-000 Cerqueira CésarSao Paulo/SPBrazilPhone +5511 3146 8600Fax +5511 3146 8608
Seoul
Suite 400, Leema Building146-1 Soosong-Dong, Chongro-GuSeoul 110-755KoreaPhone +82 2 398 5846Fax +82 2 398 5807
Tokyo
Fukoku Seimei Building 5F2-2-2 Uchisaiwaicho Chiyoda-kuTokyo 100-0011JapanPhone +813 5251 5301Fax +813 5251 5302
521258_P000_covers.indd Cover2521258_P000_covers.indd Cover2 3/18/09 1:16:12 AM3/18/09 1:16:12 AM

Stability in a Volatile WorldAnnual Report 2008
521258_P001-020_FRONT.indd 1521258_P001-020_FRONT.indd 1 3/18/09 12:02:29 AM3/18/09 12:02:29 AM
PartnerReAnnual Report 2008
2
Table of Contents Letter from the ChairmanJohn A. Rollwagen
Letter from the CEOPatrick Thiele
Stability in a Volatile World
Reconciliation of Non-GAAP Measures
Selected Consolidated Financial Data
Management’s Discussion and Analysis of Financial Condition and Results of Operation
Quantitative and Qualitative Disclosures about Market Risk
PartnerRe Ltd. Consolidated Financial Statements
Notes to Consolidated Financial Statements
Report of Independent Registered Public Accounting Firm
Controls and Procedures
Audit Committee Report
Comparison of 5-Year Cumulative Total Return
PartnerRe Organization
Shareholder Information
3
4
10
20
22
23
95
102
106
157
158
162
163
164
168
On the CoverThe most frequently used words in the PartnerRe Annual Report essays from 2001 to 2008. The larger the word, the more often it is used (common words are excluded).
521258_P001-020_FRONT.indd 2521258_P001-020_FRONT.indd 2 3/18/09 12:02:45 AM3/18/09 12:02:45 AM

3
To Our Shareholders:
2008 was a year of unprecedented challenges, with the worst fi nancial crisis since the Great Depression and the third worst property catastrophe for the insurance/reinsurance industry on record. Nonetheless, PartnerRe has maintained its strong position in the market, preserved its reputation and its client base, and produced an acceptable set of results. This is quite an achievement, and I congratulate PartnerRe’s management team and employees for their part in it.
Over the past year, the Board has continued to focus on refi ning the Company’s risk management approach. We have developed a truly integrated framework that allows the Board and executive management to have a comprehensive understanding of the organization’s risk landscape. We are also very pleased with the latest steps in the development and structure of the Capital Markets Group, in conjunction with that process.
The Company’s management development program proved its effectiveness in 2008, with a smooth transfer of leadership from Bruno Meyenhofer to Costas Miranthis in PartnerRe Global and preparation for Tad Walker’s transition to new leadership in PartnerRe U.S. On behalf of the Board, I would like to thank Scott Moore for his enormous contribution to the Company over the years, both in the capacity of founding CFO until 1998, and as President and CEO of the U.S. business unit over the past 10 years. We wish him all the best in his retirement.
Looking ahead, the Board has confi dence in the new generation of capable and thoughtful leaders who join the present strong management team. We know they will continue to build on the excellent work of their predecessors and we look forward to working with them.
John A. RollwagenChairman of the Board
Letter from the Chairman
Letter from the Chairman John A. Rollwagen
521258_P001-020_FRONT.indd 3521258_P001-020_FRONT.indd 3 3/18/09 12:02:17 AM3/18/09 12:02:17 AM

4 PartnerReAnnual Report 2008
To Our Shareholders:
The title of our 2007 Annual Report was “a successful year, a challenging future”. Obviously, it was a bit more challenging than we had expected.
A Review of 2008 Our tests in 2008 revolved around the collapse of the world’s capital markets and the impact of that on our asset portfolio. With over $11 billion of cash and invested assets, we are exposed to investment risk in the credit and equity markets. Despite a horrendous market, we were able to achieve a small positive total return for the year on a local currency basis. This is an excellent result on a relative basis, but we fell short of our return goals on an absolute basis.
On the other hand, we had a year of good profi tability in our reinsurance risk classes, generating a 12% operating return on beginning shareholder’s equity, close to our long-term goal of 13%. We achieved that despite enduring the third worst catastrophe year on record and despite the fact that a number of our reinsurance lines had experienced declining prices for three years and several were negatively impacted by the turmoil in the capital markets. Specifi cally, we reserved for an anticipated increasing loss emergence in our D&O/E&O book and our credit and surety book.
In addition, our balance sheet was stable year over year, which is a signifi cant achievement in a year like 2008. Invested assets and cash were up 1.3%, non-life loss reserves increased 4% to $7.5 billion, and our common shareholders’ equity was down only 3% to $3.7 billion. While we are disappointed in any year that does
Operating Return on Beginning Common Shareholders’ Equity
12.3
%
25.2
%
25.5
%
Letter from the CEO
200
6
2007
2008
Net Income ($ millions)
$74
9
$71
8
$47
Patrick ThielePresident and Chief Executive Offi cer

5
not result in a 10% growth in book value or economic value per share for our shareholders, we think that it was a credible performance in a diffi cult year.
We also recognize that the real test of a reinsurer’s success is its performance over the longer term. Since 2002, we have grown our book value per share at an 11% compound rate and our economic value per share at 13%. Looking back at other major loss years within this time frame, the decreasing volatility of our book value also illustrates our success in achieving long-term stability. In 2001, after 9/11, our book value per share declined by 18% from the previous year; in 2005, as a result of the impact of Hurricanes Katrina, Rita and Wilma, it declined by 13%. When comparing those levels of decline with the 6% dip in 2008, it is clear that we have built resilience into our portfolio. Finally, within the same time frame, we increased our shareholder dividend every year to the 2009 rate of $1.88 per share.
Risk Management For a reinsurance company, well controlled risk is as important as adequate return. While 2008 was not a great year for PartnerRe from a return standpoint, I believe it was a stand-out year for our risk management systems.
We accept the fact that we are in a volatile business, with exposure to both insurance and capital markets risk. We cannot promise smooth results and ever-ascending book value. We do promise to pay meticulous attention to downside risk, and to manage our business in a balanced fashion so as to protect you from dramatic drops in shareholder wealth.
We do that by:• eschewing excessive amounts of leverage • pricing risk appropriately and consistently across the entire
company – both in the reinsurance and capital markets• valuing our long-tail liability exposures and our non-liquid
invested assets prudently • setting absolute exposure limits to the “killer” risks of casualty,
catastrophe and equity/equity-like investments.
Most importantly, we have instilled a sense of responsibility in all our employees through a culture of trust and appropriately aligned compensation systems.
Our risk management framework and system were tested in 2008 and we responded well. In a climate of volatility, our structure, strategy, capacity and workforce remained stable and intact. Elsewhere in this report, we describe in more detail the key factors in our risk management approach that ensure balance and so help to create that stability.
2009 and BeyondLooking forward, I am encouraged by several factors.
First, it seems likely that we will experience better markets in 2009 than we did last year. While growth in the reinsurance market will be hard to come by, I am hopeful that a better demand/supply balance will mean steady-to-rising prices, maintaining adequate levels of profi tability. I also believe that
Operating EarningsAvailable toCommon Shareholders ($ millions)
$82
2
$46
9
$65
6
Diluted Operating Earnings per Common Share
$14
.29
$11
.36
$8.
43
200
6
2007
2008
ComprehensiveIncome (Loss) ($ millions)
$88
9
$78
5
$(1
14)
Letter from the CEO Patrick Thiele
PRe_AR08_Front_03_20_09.indd 5PRe_AR08_Front_03_20_09.indd 5 3/24/09 10:20:26 AM3/24/09 10:20:26 AM

6
returns in capital market assets should improve as a result of the dramatic price declines in virtually all asset classes. PartnerRe has the fi nancial strength as well as the technical and managerial skills to participate fully in both markets.
Second, I believe strongly that the reinsurance industry has improved its risk evaluation, valuation and management skills to the point that there has been a permanent shift upward in its risk/return profi le, certainly relative to other fi nancial businesses. I also believe that the pain and trauma that we are feeling in the capital markets will lead eventually to more stable, more enduring stock and credit markets, where risk is understood and valued properly. You can be assured that PartnerRe will be there, with its human and fi nancial capital intact, to take well priced risks and provide adequate returns to our shareholders.
Thank YouPartnerRe continues to evolve as an organization, partly as a result of growth and partly due to natural retirements within our employee base. By the end of 2008, three of our most accomplished and respected people had decided that they wanted to more fully experience life outside of a reinsurance company and announced their retirement: Kurt Angst, John Davidson and Scott Moore.
All three built their operations virtually from scratch and managed them into profi table, mature businesses. Kurt Angst, Head of Specialty Lines, Global, and underwriter extraordinaire, played a critical role in building the four Global business units and our worldwide reinsurance system. John Davidson, Chief Economist, Capital Markets and chief investment offi cer since 2002, built our internal investment capability and brought virtually all of our invested assets under in-house management.
Scott Moore joined PartnerRe as a member of the Company’s original executive team in 1993 and since that time has made a huge contribution to the successful growth and profi tability of the whole PartnerRe organization, fi rst as founding CFO and then as President and CEO of PartnerRe U.S. for 10 years. Scott has been a valuable member of the Group Executive Committee, providing guidance and counsel to me and my executive colleagues.
PartnerRe owes Kurt, John and Scott an enormous debt of gratitude for helping to make the Company what it is today. We wish them well and, while we have excellent replacements for them, we will miss them personally and professionally.
Finally, I wish to thank all our employees, who worked so hard and who made such good decisions in 2008. Without them, there would be no PartnerRe.
Patrick ThielePresident and Chief Executive Offi cer
PartnerReAnnual Report 2008
Diluted Book Value per Common and Common Share Equivalents
$56
.07
$67
.96
$63
.95
200
6
2007
2008
Dividends Declared and Paid per Common Share
$1.
60
$1.
84
$1.
72
31% Zurich
25% Paris
31% Greenwich
7% Bermuda 6% Other
Distribution ofEmployeesTotal: 995
521258_P001-020_FRONT.indd 6521258_P001-020_FRONT.indd 6 3/18/09 12:03:35 AM3/18/09 12:03:35 AM

7PartnerReAnnual Report 2008
Executive Management
Costas MiranthisCEO, PartnerRe Global
Albert BenchimolEVP and Chief Financial Offi cer, PartnerRe Ltd.CEO, Capital Markets
Tad WalkerPresident & CEO,PartnerRe U.S.
Scott MooreDeputy Chairman,PartnerRe U.S.
Bruno MeyenhoferChairman, PartnerRe Global

8 PartnerReAnnual Report 2008
Organization
Clients/ Objectives
Lines of Business/ Scope of Work
Specialty Lines
Our Business at a Glance
Business Units
U.S.Standard Lines Specialty Casualty Specialty Lines
• Property per risk• E&S property• General liability• Multiline
• Directors and Officers Liability
• Professional Liability• Umbrella• E&S• Excess Casualty• Medical Malpractice• Hospital Professional
Liability• Environmental• Miscellaneous E&O• Workers Compensation• Fiduciary• Governmental Entity• Clash• EPLI
• Agriculture: MPCI, crop hail, livestock, and other non-farm exposures on a pro-rata basis.
• Program business: MGAs, RRGs, captives and companies.
• Structured Risk: Prospective aggregate stop loss, LPT/adverse development covers, multiyear structured catastrophe and XOL covers, capped quota-share.
• Surety and Fidelity: Regional and national companies.
• Terrorism: Aggregate terrorism coverage for regional companies.
One business unit writing standard property and casualty for U.S. clients and organized by geographic scope:
• National• Regional
One business unit writing specialty casualty business and serving U.S. clients.
Organized by line of business and serving U.S. clients:
• Agriculture• Program Business• Structured Risk• Surety and Fidelity• Terrorism
Leading national and regional insurance companies in the U.S.
Products and services are provided through reinsurance intermediaries.
Specialty U.S. carriers or dedicated departments within large U.S. companies underwriting in their areas of expertise.
Products and services are provided through reinsurance intermediaries.
Leading property and casualty insurance companies within the U.S. market.
Products and services are provided through reinsurance intermediaries.
• Agriculture: Crop hail, MPCI, aquaculture, forestry, bloodstock, livestock.
• Aviation/Space: Airlines, manufacturers, airport operators, general aviation, space.
• Credit/Surety: Domestic and export credit, surety bonds.
• Energy Onshore: Onshore oil and gas operations, mining, power generation.
• Engineering: Construction/erection, delay in start-up, boiler/machinery, business interruption.
• Marine/Energy Offshore: Hull, cargo, specie, marine liabilities, loss of hire, P&I, energy offshore.
• Specialty Casualty: Products liability, professional liability, medical malpractice, D&O.
• Specialty Property: Property damage, business interruption, nuclear, terrorism pools.
Organized into eight departments by client or line of business:
• Agriculture• Aviation/Space• Credit/Surety• Energy Onshore• Engineering• Marine/Energy Offshore• Specialty Casualty• Specialty Property
National, regional and monoline insurance companies, pools and captives worldwide for Aviation/Space, Credit, Energy Onshore, Engineering, Marine/Energy Offshore and Facultative Property. All other lines exclude business from U.S. clients.
Traditional and structured reinsurance solutions and services are provided to clients directly and through reinsurance intermediaries.
GlobalProperty & Casualty
• Property• General Liability• Employers Liability• Workers Compensation• Personal Accident• Motor
Organized into seven depart-ments along geographic lines:
• Northern Europe• Central and Eastern Europe• Southern Europe and
Latin America• France and Benelux• Canada• Greater China and
South East Asia• Overseas (including
Australia, Japan, Korea, Middle East, Africa, Turkey, India)
National and regional insurance companies and pools in all geographic markets, excluding U.S.
Traditional and structured reinsurance solutions and services are provided to clients directly and through reinsurance intermediaries.
PRe_AR08_Front_03_20_09.indd 8PRe_AR08_Front_03_20_09.indd 8 3/24/09 10:24:35 AM3/24/09 10:24:35 AM

9Our Business at a Glance
Life
Group Functions
Finance and ActuarialCapital MarketsCatastrophe
• Natural perils• Catastrophe bonds• Industry loss warranties• Advanced research and
event modeling using our own CatFocus® models for tropical storms (U.S., Caribbean, Japan, Australia, Taiwan, Philippines) and earth-quake (worldwide) as well as European windstorm.
One worldwide business unit organized into two departments:
• Underwriting• Research
National, regional and monoline insurance companies, pools and captives in all geographic markets. Non-traditional business clients include individual corporations.
Traditional reinsurance and insurance-linked securities solutions and services are provided to clients directly and through reinsurance intermediaries. Services include proprietary modeling of natural hazards such as windstorm and earthquake.
One business unit organized into five departments by line of business and geography:
Mortality & Morbidity• UK & Ireland• France, Canada, Northern
& Southern Europe• Central & Eastern Europe• Asia, Spain & Latin
America
Longevity
Life insurance companies in Europe, Canada, Asia and Latin America.
Traditional reinsurance and insurance-linked securities solutions and services are provided to clients directly and through reinsurance intermediaries. Services include support on existing products and assistance in the development of new products such as impaired life annuities, long-term-care products or mortality.
• Mortality and morbidity risks
• Longevity risks
Organized into two business units and backed by a common risk management and operations support function:
Fixed Income
Capital Assets • Equities• Principal Finance• Strategic Investments• Insurance-linked Securities
• Preserve liquidity and protection of capital.
• Generate investment income and capital gains.
• Leverage investment skills to capitalize on convergence of reinsurance and capital markets.
• Identify, analyze and assume capital markets risks.
• Diversify across asset risk classes and geographies.
Responsible for the assumption and management of PartnerRe’s capital markets risks, including our investment portfolio and alternative risk products worldwide, with an approach that distinguishes between funds that support our reinsurance operations and those that represent the investment of our shareholders’ capital.
Aligned with Group organizational structure, along Group and business unit lines, to ensure appropriate financial controls and maximize shareholder returns, while minimizing financial risk.
• Ensure appropriate control environment.
• Asset/liability management across the Group.
• Groupwide capital allocation.
• Financial performance measurement.
• Financial reporting.• Actuarial reserving.• Tax analysis and planning.
Responsible for the Group’s fiduciary and control functions; transactional accounting and processing; external reporting; decision support; actuarial analysis and reserving; planning; risk management and treasury; rating agencies and investor relations.
Aligned with Group organizational structure, along Group and business unit lines:
• Group roles include strategic planning, policy and control.
• Business unit roles focus on execution and operational support.
Human Resources: Attract, develop and retain talent in the organization.
Information Technology: Provide effective information technology tools worldwide.
Legal and Compliance: Provide legal advice to all business units and group functions and ensure compliance with all legal and regulatory requirements.
Corporate Communications: Ensure consistent understanding of messages and information internally and externally.
Internal Audit: Provide internal control and risk assurance services, as well as Sarbanes-Oxley compliance testing.
Responsible for ensuring that all support requirements – Human Resources, Information Technology, Legal and Compliance, Corporate Communications, Internal Audit – are met on a Group and local basis.
Support
PRe_AR08_Front_03_20_09.indd 9PRe_AR08_Front_03_20_09.indd 9 3/24/09 10:24:44 AM3/24/09 10:24:44 AM

risk
capitalbusinessm
anag
emen
t
reinsurance
value
return
market
equity
clients
industry
years
also
balance
retu
rns
volatility
portfolio
new
loss
manage
und
erw
riti
ng
diversifi cation
shareholders
lines
investm
ent
asset
year
people
strategy
compan
y
opportunities
believeon
e
level
framew
orkwell
across
econom
ic
fi nan
cial
appr
oach
proc
esse
s
organization
cata
stro
phe
right
good
shee
t
make
limit
s
appetite
cycle
losses
side
appropriate
reinsurers
tim
e
with
in
cult
ure
take
stability
rese
rvin
gassets
companies
key
pricing
models
strong
may
actuarial
underwriters
cedants
even
ts
insurance
premiums
assume
actuaries
shock
attractive
thin
k
area
s
continue
focus
price
ach
ieve
expo
sure
example
every
particular
importan
t
line
liability
long-term
growth
superior
allows
total
skills
view
structurecl
aim
s
securities
just
ensure
impa
ct
measure
assumed
book
potential
capa
city
future
stra
tegi
c
fi rs
t
liabilities
abili
ty
polic
ies provide
success
position
deman
d
information
tren
ds
around
resu
lts
clear
casualty
prod
ucts
part
mus
t
diff erent
higher
billion
three
amount
several consistent
large
unit
diversifi ed
U.S.
net
income
aggregate
many
less
need
term
521258_P001-020_FRONT.indd 10521258_P001-020_FRONT.indd 10 3/25/09 1:31:33 AM3/25/09 1:31:33 AM

11PartnerReAnnual Report 2008
In the aftermath of a very volatile year, with a one-in-75-year shock in the fi nancial markets and the third worst catastrophe year recorded, PartnerRe remains intact, stable and well positioned to meet future opportunities.
That’s not just luck, nor is it due to a few individuals with exceptional prescience in avoiding bad risks. It is because we have spent years building a risk management framework that works for us. Our talented teams work within that framework of policies and processes, intelligently and consistently evaluating risks and opportunities to protect the organization from the downside, while seeking an appropriate return.
We do not claim to have the perfect model. Our risk management framework is a work-in-progress, continuously being refi ned and updated. We are nonetheless proud of our achievement to date and believe the effectiveness of our approach is validated by our results.
We have described our risk management philosophy, framework and practices in great detail over the past fi ve years. This year, we give a brief overview of how our approach has provided stability in these volatile times, with additional insight from senior operating managers in their own words. Stability is good for clients and brokers, who want continuity of capacity and an unquestioned ability to pay claims. Stability is good for employees, who want to know their jobs are safe. Stability is good for shareholders, who can count on an appropriate return for the risk assumed and, most importantly, can rely on the Company to make it through the worst of times intact.
Stability in a Volatile World
“ At PartnerRe, we focus on downside risk. We have a culture of thinking about worst case scenarios –
not just what has happened, but what might happen. When it comes to understanding risk, history is not a substitute for analysis.”Marvin Pestcoe Head of Capital Assets, Capital Markets Group
PRe_AR08_Front_03_20_09.indd 11PRe_AR08_Front_03_20_09.indd 11 3/24/09 10:26:45 AM3/24/09 10:26:45 AM

PartnerReAnnual Report 2008
days
2004
2005
2006
2007
2008
1 2 3 4 5 6 7 8 9 10 11 12 13 14 15 16 17 18 19 20 21 22 23 24 25 26 27 28 29 30 31
521258_P001-020_FRONT.indd 12521258_P001-020_FRONT.indd 12 3/25/09 4:41:11 AM3/25/09 4:41:11 AM

13PartnerReAnnual Report 2008
Risk Management in Perspective
The frequency with which the phrase “risk management” has appeared in the Financial Times over the last fi ve years.
It’s all about riskAt PartnerRe, risk assumption is our business. Our success is wholly dependent on our ability to manage risk, so we focus fi rst on the risk and then we consider the expected return.
– Risk management is at the core of our value proposition. We transform the uncertainty presented by risk into the certainty of claims payment for our clients. We must also produce an adequate return for our shareholders. Our challenge is to fi nd the optimal balance between the returns that we can produce over the course of the market cycle and the risk to which we expose our capital.
– Risk management is integral to our fi ve-point strategy, which encompasses diversifi cation, risk appetite, active capital management, excellence in evaluating and valuing risk, and consistency in how we deal with reinsurance and capital markets risks.
– Risk management is embedded in our culture, which encourages ownership and responsibility for risk management at all levels, with aligned return goals and compensation systems.
There are four key factors in our approach to risk management that have led to the stability that we have been able to achieve over the past eight years: Diversifi cationDiversifi cation is our primary risk management tool and provides the cornerstone of our stability. It allows us to offer effi cient risk solutions to our clients, manage volatility and enhance overall return by mitigating the economic impact of any single event or development.
We seek a prudent balance between traditional reinsurance and capital markets risks that enhance the diversifi cation and returns of our consolidated risk portfolio. On the reinsurance side, we are diversifi ed by geography, by lines of business and by distribution system, both as a Group and within business units. On the capital markets side, we are diversifi ed by asset class, industry, geography, currency and security.
We are always seeking new opportunities to diversify. For example, in 2008 our Global business unit achieved further diversifi cation by integrating the international reinsurance business acquired from Mutuelle Centrale de Reassurance and the U.S. expanded its agriculture business.
“ You can fi nd risk management footprints in every transaction at PartnerRe. Our risk dashboard defi nes the organization’s tolerance for risk and everybody from the Board of Directors to the most junior underwriter knows what the limits are.” Dick Sanford Head of Specialty Casualty, U.S.
“ Our underwriters see PartnerRe as a risk-assumer and risk-manager. We do not transfer the risk. We assume it and manage it.” Alain Flandrin Head of Property & Casualty, Global
521258_P001-020_FRONT.indd 13521258_P001-020_FRONT.indd 13 3/18/09 12:05:35 AM3/18/09 12:05:35 AM

PartnerReAnnual Report 2008
14
Risk Governance at a Glance
PartnerRe’s key policy statements are linked to our top Company risks. Each statement is captured by a Group Policy, and then reiterated in more specifi c policies in different parts ofthe organization.
Good governance Effective risk management requires a sound governance structure and a clear set of principles and policies that apply across the organization. PartnerRe’s organizational structure is designed for effective and effi cient management of the Company’s risks, with a balance between centralized control and decentralized management in the business units. The business unit structure also provides clarity around risk ownership: each assumed risk has one entry-point into the Company.
Executive Management and the Board are responsible for setting our vision and goals, including overall risk appetite and return expectations (ROE target). Strategy and principles are recommended by Executive Management and approved by the full Board.
There is a policy or set of policies to manage every risk that we can control, with Group policy statements and key Group policies established by the CEO, and Business Unit/Group Function policies at the next level. Risk management policies and processes are maintained by management, audited by Internal Audit and the results of audits are monitored by the Board’s Audit Committee. Over-arching all of our daily actions, across the organization, is the Code of Business Conduct and Ethics.
Good governance is critical for stability because it provides the safeguards that allow us to optimize the balance between risk and return. We can set our volatility appetite moderately above the market, creating greater shareholder value, because we know we have the necessary controls in place to protect the Company from the downside risk that could impair our balance sheet.
Our industry and markets change and evolve, so governance cannot be static. Management is constantly reviewing and refi ning PartnerRe’s approach. In 2008, the focus was on Integrated Risk Management and in particular further aligning and integrating the existing risk management processes of the Capital Markets and Reinsurance Operations into the consolidated Group framework.
“ What’s different about PartnerRe is that risk management is integrated. Everybody is responsible for the risk they assume but they’re supported by teams of professionals who focus exclusively on risk management. That combination enables a more thorough under- standing of the risks we assume; ultimately, we fi nd the right balance between risk and reward.” Dom Tobey Head of Risk Management and Reserving, Global
“ Overarching all that we do are the key principles and policy statements that are linked to our top risks – each one is picked up and reiterated at a more granular level in more specifi c policies in different parts of the organization.”Amanda Sodergren Chief Legal Offi cer, Group
PRe_AR08_Front_03_20_09.indd 14PRe_AR08_Front_03_20_09.indd 14 3/25/09 5:01:37 AM3/25/09 5:01:37 AM

How do we effectively manage our assumed and capital risk exposure and earn an adequate return?
How do we make sure that fi nancial risks such as fraud, reporting, legal compliance, foreign exchange, tax, and credit risk are managed to avoid losses to the company?
How do we manage new initiatives such as acquisitions and new products/markets to avoid mistakes?
How do we ensure good decision making at relevant levels of the organization?
How do we protect our reputation with clients, investors, rating agencies and regulators?
How do we manage the operational risk that our control processes might themselves fail?
Capital at Risk Policy
Retrocession Policy
Reserving Policy
Capital Markets Policy
Underwriting Guidelines
Acquisition Policy
Valuation Policy
External Communications Policy
Equity Policy
Compensation Policy
We centrally set and monitor absolute limits on our exposure to our shock losses.
We employ a consistent pricing methodology for all of our risks.
We use retrocession sparingly.
We reserve the lead year of long tail lines with prudence and recognize the inherent volatility.
Our non-life and life reserves are supported by investment grade fi xed income securities matched as to quantity, duration and currency.
We do not manage reinsurance or investment risks for others.
We manage our underwriting and investments internally.
We make acquisitions only when they can be bought at or below economic value and integrated.
Our invested assets will be held at market for liquid investments and at fair value for investments which require signifi cant management judgment. Management’s best estimate of fair value will never be greater than the value recommended to the Group Valuation Committee.
The CEO and the EC are the only people who can speak for PartnerRe as a Group to external audiences on strategic matters.
All senior managers will be signifi cant shareholders of PartnerRe.
We do not pay a “carry” or percentage of profi ts to any individual at PartnerRe.
The primary metric for our annual incentive will be ROE.
Company Risks Policy Statements Key Group
Policies
Our Key Policies and supporting processes are subject to internal audit annually to ensure that they are operating effectively as designed.
PRe_AR08_Front_03_20_09.indd 15PRe_AR08_Front_03_20_09.indd 15 3/24/09 10:29:01 AM3/24/09 10:29:01 AM

capital at risk
maximum desired capital level
minimum required capital
known unmodeled loss
known modeled loss
economic capital
return period
PRe_AR08_Front_03_20_09.indd 16PRe_AR08_Front_03_20_09.indd 16 3/23/09 9:39:07 AM3/23/09 9:39:07 AM

17PartnerReAnnual Report 2008
A sound technical frameworkPartnerRe’s integrated risk management framework provides a common basis for identifying, evaluating and managing our assumed risks across different risk categories and business units. This promotes consistent decision-making and execution on both the reinsurance and capital markets sides of our business, and at all levels of the Company, which in turn leads to stability.
We apply a common unifying principle to every risk. We use capital to measure risk and apply a consistent capital charge methodology to every risk we assume. This allows us to measure risk consistently across the Group and enables us to evaluate whether risks – both reinsurance and capital markets – are adequately priced. It also allows us to identify and manage interrelationships between the various categories of risk, manage the portfolio dynamically and leverage the benefi ts of diversifi cation.
We employ state of the art tools to model all of our reinsurance and capital markets risks and quantify their fi nancial consequences to PartnerRe. We combine these measurements in our Capital at Risk model, a fi nancial modeling tool that provides a holistic view of the capital we put at risk at PartnerRe in any year. This allows us to optimize return relative to risk by allocating more capital to those lines that promise greater return for a risk level consistent with our risk appetite. The model is continually being expanded, with capital markets business coming fully on line in early 2009.
The Capital at Risk model also allows us to have a very clear idea of how much capital we should hold, not just to meet our anticipated obligations, but to ensure we can ride out unforeseen losses. Our starting point for capital adequacy is to hold enough economic capital to weather an extreme event or aggregation of events. In addition, we hold capital to weather “model error” – and on top of that, we hold capital to account for the “unknown unknowns”. That total capital is known as our minimum desired economic capital and is monitored at the Board level.
As we know that models are never 100% foolproof, we take one step further. We impose absolute limits to those areas of risk – catastrophe, casualty and equity investment – that have the greatest potential for shock losses. No matter how attractive a return may appear, or how “safe” the models suggest a risk to be, we will not exceed our established limits for those risks. Our limits are clearly communicated to and understood by every underwriter and asset manager.
Ultimately this framework should allow us to consistently make good risk decisions and protect against the model error that has hurt many fi nancial institutions in the recent crisis.
“ The key is how well the risk is understood. We must understand the whole business that we’re underwriting: the various loss scenarios, the interdependencies, and the underlying risk. If you don’t understand it, you can’t price it and you can’t manage it.” Franck Pinette Head of Life, Global
“ We are fully aware there are events and circumstances we cannot foresee or model appropriately. Only risk limits and accumulation management can protect against an unknowable downside risk and prevent the over-leveraging of our capital base.” Eric Gesick Chief Actuarial Offi cer, Group
Capital Adequacy
PartnerRe’s starting point for capital adequacy is to hold enough economic capital to weather our total foreseeable economic loss, whether modeled or not – where all worst-case scenarios take place at the same time. On top of that, we hold capital to account for model error. We desire to hold additional capital to address unknown-unknowns up to a maximum desired capital level.
PRe_AR08_Front_03_20_09.indd 17PRe_AR08_Front_03_20_09.indd 17 3/24/09 10:32:17 AM3/24/09 10:32:17 AM

PartnerReAnnual Report 2008
18
Skilled people and an appropriate cultureThe people who put the strategy, methodologies and policies into practice are just as important as the framework. Our culture does not depend on “superstars,” nor is it a “tick-the-box” environment that discourages individual initiative. We aim to fi nd a happy medium that allows our people the fl exibility to use their talent and exercise decision-making responsibility within the framework described. The emphasis on balance between qualitative judgment and quantitative analysis is refl ected in the skill sets of our employees. Our underwriters and investment managers work closely with actuaries and analysts when making risk-assumption decisions.
A notable feature of PartnerRe’s culture is a high level of understanding and engagement with the Company’s risk management approach. Regular, clear and open communication has helped to build a consistent risk management culture across our diverse organization. Our underwriters, actuaries and investment managers share a similar perspective on risk, and see the policies and processes not as obstacles, but as valuable tools to assist them as they balance the risk/return ratio of treaties and investments. At the same time, the Company’s return goals and compensation systems are designed to reward behavior that builds stable, long-term value, not just short-term profi t.
We work hard to retain and develop our staff, nurturing future leaders with the same values as the present senior management, who will sustain our effective risk management culture as they move up through the organization. The continuity provided by good retention rates and internal succession also helps to ensure stability within our organization.
Stability through balanceDiversifi cation, good governance, a sound and consistent technical framework, skilled people and an appropriate risk-management culture: it all adds up to a balanced approach to managing our business. That in turn ensures the long-term stability, which ultimately benefi ts our clients, our employees and our shareholders.
“ You’ll see the core aspects of risk taking across the organization whether you’re in Greenwich or Zurich. The way a PartnerRe underwriter looks at risk is probably more similar across our organization than any other reinsurer.”Charles Goldie Head of Specialty Lines, U.S.
“ Risk management really starts for us at the interview process. Every employee has the opportunity to make a big impact, so it’s important that people not only have the proper risk assessment skills but also fi t the culture.”
David Graham, Head of Fixed Income, Capital Markets Group
PartnerRe’s Risk Management in Perspective
The consistency in PartnerRe’s approach to risk management is refl ected in published statements over the past eight years.
PRe_AR08_Front_03_20_09.indd 18PRe_AR08_Front_03_20_09.indd 18 3/24/09 10:33:29 AM3/24/09 10:33:29 AM

2001 “We intend to reduce our dependence on external managers and are establishing an asset management function within PartnerRe. This…will allow us to more effi ciently and productively manage our balance sheet.”
2006 “We view investment risk as an integral part of our core business. We now manage 95% of our total invested assets in-house. This allows us to have a more holistic approach to our business, complementing our reinsurance operations with prudent matching of assets to liabilities.”
2001
2002
2003
2004
2005
2006
2007
2008
2004 “We now manage virtually all our assets in-house so that we have the same kind of view on the investment portfolio side as we have on the liability side.”
2005 “We believe that diversifi cation is a powerful risk mitigation tool that increases portfolio returns per unit of risk.”
2008 “The most successful reinsurers will be those that fi nd a prudent balance between capital markets risk and traditional reinsurance, with a consistent risk management approach on both sides of the balance sheet.”
2001 “PartnerRe has a diversifi ed book of business – by geography and by line. This is key to our ability to mitigate risk and manage volatility.”
2003 “Appropriate diversifi cation increases return per unit of risk, provides access to reinsurance business opportunities worldwide and reduces overall volatility – all critical to successful risk management over a cycle.”
2006 “We use diversifi cation on multiple levels. The more revenue we can develop at an adequate price level from non-correlating zones, the better positioned we are to absorb losses without impairing capital.”
2008 “Proprietary quantitative and qualitative analysis are essential to understanding the nature and extent of risks, so that underwriters can make an informed evaluation, and an accurate value – or price – can be determined.”
2004 “Building and running proprietary models provides an independent view of risk.”
2006 “A solid understanding of our clients, their needs and their markets is critical to ensuring a product of value… Through dialogue and openly sharing analysis and data, our cedants have the benefi t of an independent view of their risk.”
2007 “We review, evaluate, value and manage [capital markets] risks ourselves, not through a third party.”
2007 “When a risk taker is dealing with complex, new and dangerous risks, there must be in-house evaluation capabilities to be successful in the longer term.”
2004 “We evaluate risk by using both quantitative analysis and qualitative reviews. We have a number of different models to help us do that, but equally important is the fact that we have people with the skills to interpret the outputs from the models and the experience to select appropriate assumptions for our models.”
521258_P001-020_FRONT.indd 19521258_P001-020_FRONT.indd 19 3/18/09 12:07:16 AM3/18/09 12:07:16 AM
PartnerReAnnual Report 2008
20
2004 2005 2006 2007 2008
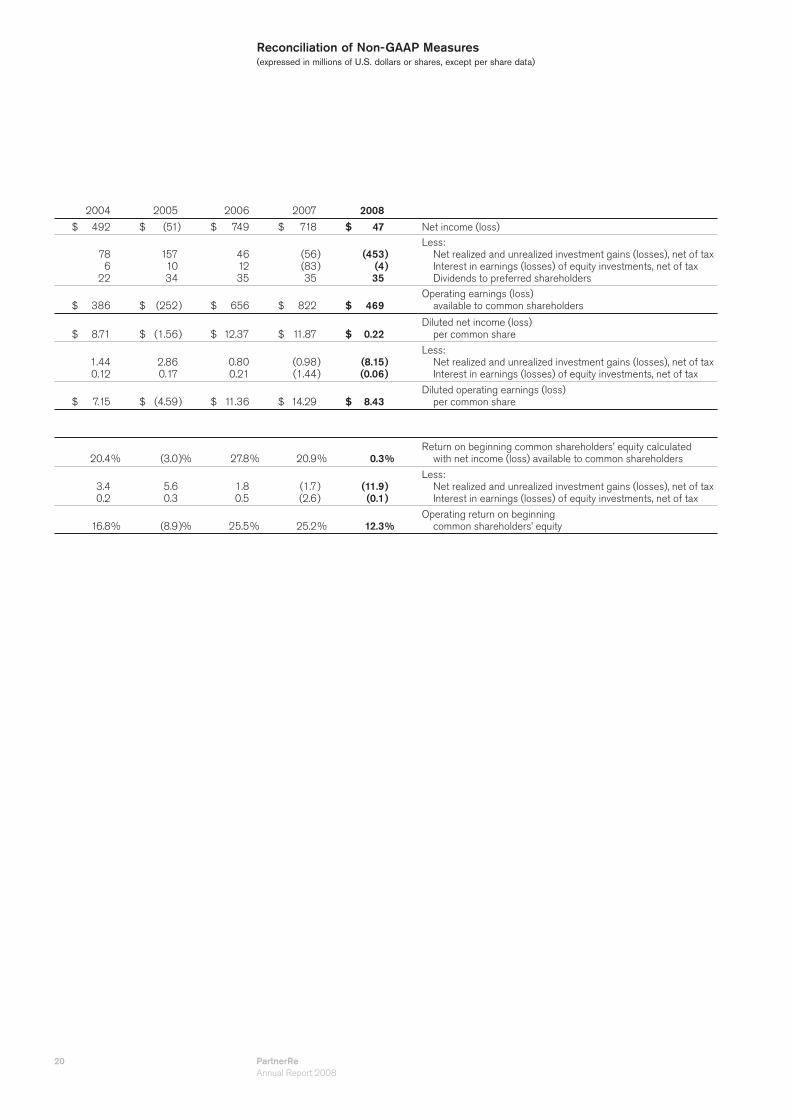
$ 492 $ (51 ) $ 749 $ 718 $ 47 Net income (loss)
78 6 22
157 10 34
46 12 35
(56 (83 35
))
(453 (4 35
))
Less: Net realized and unrealized investment gains (losses), net of tax Interest in earnings (losses) of equity investments, net of tax Dividends to preferred shareholders
$ 386 $ (252) $ 656 $ 822 $ 469 Operating earnings (loss) available to common shareholders
$ 8.71 $ (1.56) $ 12.37 $ 11.87 $ 0.22 Diluted net income (loss) per common share
1.44 0.12
2.86 0.17
0.80 0.21
(0.98(1.44
))
(8.15(0.06
))
Less: Net realized and unrealized investment gains (losses), net of tax Interest in earnings (losses) of equity investments, net of tax
$ 7.15 $ (4.59) $ 11.36 $ 14.29 $ 8.43 Diluted operating earnings (loss) per common share
20.4% (3.0)% 27.8% 20.9% 0.3%Return on beginning common shareholders’ equity calculated with net income (loss) available to common shareholders
3.4 0.2
5.60.3
1.80.5
(1.7(2.6
))
(11.9(0.1
))
Less: Net realized and unrealized investment gains (losses), net of tax Interest in earnings (losses) of equity investments, net of tax
16.8% (8.9)% 25.5% 25.2% 12.3%Operating return on beginning common shareholders’ equity
Reconciliation of Non-GAAP Measures(expressed in millions of U.S. dollars or shares, except per share data)
521258_P001-020_FRONT.indd 20521258_P001-020_FRONT.indd 20 3/18/09 12:07:33 AM3/18/09 12:07:33 AM

PartnerReAnnual Report 2008
21
Certain statements contained in this document, including Management’s Discussion and Analysis, may be considered forward-looking statements as defi ned in section 27A of the United States Securities Act of 1933 and section 21E of the United States Securities Exchange Act of 1934. Forward-looking statements are made based upon Management’s assumptions and expectations concerning the potential effect of future events on the Company’s fi nancial performance and are made pursuant to the safe harbor provisions of the Private Securities Litigation Reform Act of 1995. These forward-looking statements are subject to certain signifi cant risks, uncertainties and assumptions about our business that could cause actual results to differ materially from those refl ected in such statements. These risks, uncertainties and assumptions are described in more detail in the Company’s Annual Report on Form 10-K as fi led with the Securities and Exchange Commission on February 27, 2009.
The words “believe,” “anticipate,” “estimate,” “project,” “plan,” “expect,” “intend,” “hope,” “forecast,” “evaluate,” “will likely result” or “will continue” or words of similar impact generally involve forward-looking statements. We caution readers not to place undue reliance on these forward-looking statements, which speak only as of their dates. The Company undertakes no obligation to publicly update or revise any forward-looking statements, whether as a result of new information, future events or otherwise.
PartnerRe Ltd.Forward-Looking Statements
521258_P021-101_MDA.indd 21521258_P021-101_MDA.indd 21 3/18/09 12:10:57 AM3/18/09 12:10:57 AM

22 PartnerReAnnual Report 2008
PartnerRe Ltd.Selected Consolidated Financial Data (Expressed in millions of U.S. dollars or shares, except per share data)
The following Selected Consolidated Financial Data is prepared in accordance with accounting principles
generally accepted in the United States. This data should be read in conjunction with the Consolidated Financial
Statements and the accompanying Notes to Consolidated Financial Statements.
For the years ended
December 31, 2004 2005 2006 2007 2008 Statement of Operations Data
$ 3,888 $ 3,665 $ 3,734 $ 3,810 $ 4,028 Gross premiums written
3,853 3,616 3,689 3,757 3,989 Net premiums written
$ 3,734 $ 3,599 $ 3,667 $ 3,777 $ 3,928 Net premiums earned
298 365 449 523 573 Net investment income
117 207 47 (72) (531) Net realized and unrealized investment gains (losses)
17 35 24 (17) 10 Other income (loss)
4,166 4,206 4,187 4,211 3,980 Total revenues
2,476 3,087 2,111 2,082 2,609 Losses and loss expenses and life policy benefi ts
3,673 4,244 3,355 3,328 3,918 Total expenses
493 (38) 832 883 62Income (loss) before taxes and interest in earnings (losses) of equity investments
7 23 95 82 10 Income tax expense
6 10 12 (83) (5) Interest in earnings (losses) of equity investments
$ 492 $ (51) $ 749 $ 718 $ 47 Net income (loss)
$ 8.80 $ (1.56) $ 12.58 $ 12.18 $ 0.22 Basic net income (loss) per common share
$ 8.71 $ (1.56) $ 12.37 $ 11.87 $ 0.22 Diluted net income (loss) per common share
$ 1.36 $ 1.52 $ 1.60 $ 1.72 $ 1.84 Dividends declared and paid per common share
54.0 55.0 57.8 57.6 55.6Weighted average number of common and common share equivalents outstanding
Non-life Ratios
65.6% 87.3% 54.8% 50.8% 63.9% Loss ratio
23.0 23.0 23.1 22.9 23.3 Acquisition ratio
6.0 6.0 6.5 6.7 6.9 Other operating expense ratio
94.6% 116.3% 84.4% 80.4% 94.1% Combined ratio
At December 31, 2004 2005 2006 2007 2008 Balance Sheet Data
$ 8,398 $ 9,579 $ 10,679 $ 11,572 $ 11,724 Total investments and cash
12,717 13,783 15,034 16,149 16,279 Total assets
7,044 7,962 8,301 8,773 8,943Unpaid losses and loss expenses and policy benefi ts for life and annuity contracts
220 620 620 620 200 Long-term debt
— — — — 250 Debt related to senior notes
— — 258 258 258 Debt related to capital effi cient notes
206 206 — — — Debt related to trust preferred securities
3,352 3,093 3,786 4,322 4,199 Total shareholders’ equity
$ 50.99 $ 44.57 $ 56.07 $ 67.96 $ 63.95Diluted book value per common and common share equivalents outstanding
54.9 56.7 57.1 54.3 56.5 Number of common shares outstanding, net of treasury shares
521258_P021-101_MDA.indd 22521258_P021-101_MDA.indd 22 3/18/09 12:11:12 AM3/18/09 12:11:12 AM

PartnerReAnnual Report 2008
23
PartnerRe Ltd.Management’s Discussion and Analysis of Financial Condition and Results of Operation
Executive OverviewThe Company is a leading global reinsurer, with a broadly diversifi ed and balanced portfolio of traditional reinsurance risks and capital markets risks. Successful risk management is the foundation of the Company’s value proposition, with diversifi cation of risks at the core of its risk management strategy.
The Company’s ability to succeed in the risk assumption and management business is dependent on its ability to accurately analyze and quantify risk, to understand volatility and how risks aggregate or correlate, and to establish the appropriate capital requirements and absolute limits for the risks assumed. All risks are managed by the Company within an integrated framework of policies and processes that ensure the intelligent and consistent evaluation and valuation of risk, and ultimately provide an appropriate return to shareholders.
The Company’s economic objective is to manage a portfolio of risks that will generate compound annual diluted book value per share growth of 10 percent and an average operating return on beginning shareholders’ equity of 13 percent over a reinsurance cycle.
In its reinsurance portfolio, the Company writes all lines of business in virtually all markets worldwide, and differentiates itself through its risk management strategy and its fi nancial strength. In assuming its clients’ risks, the Company removes the volatility associated with those risks from the clients’ fi nancial statements, and then manages those risks and the risk-related volatility. Through its broad product and geographic diversifi cation, its excellent execution capabilities and its local presence in most major markets, the Company is able to stabilize returns, respond quickly to market needs, and capitalize on business opportunities virtually anywhere in the world.
Similarly, for the Company’s capital markets risks, which include both public and private market investments, diversifi cation of risks is critical to achieving the risk and return objectives of the Company. The Company’s investment policy distinguishes between liquid, high quality assets that support the Company’s liabilities, and the more diversifi ed, higher risk asset classes that make up the Company’s capital funds. While there will be years where capital markets risks achieve less than the risk-free rate of return, or potentially even negative results, the Company believes the rewards for assuming these risks in a disciplined and measured way will produce a positive excess return to the Company over time. Additionally, since capital markets risks are not fully correlated with the Company’s reinsurance risks, this increases the overall diversifi cation of the Company’s total risk portfolio.
The reinsurance markets have historically been highly cyclical in nature. The cycle is driven by competition, the amount of capital and capacity in the industry, loss events and investment returns. The Company’s long-term strategy to generate shareholder value focuses on broad product, asset and geographic diversifi cation of risks, assuming a moderately greater degree of risk than the market average, actively managing its capital across its portfolio and over the duration of the cycle, adding value through underwriting and transactional excellence and achieving superior returns on invested assets in the context of a disciplined risk framework.
The Company generates its reinsurance revenue from premiums. Premium rates and terms and conditions vary by line of business depending on market conditions. Pricing cycles are driven by supply of capital in the industry and demand for reinsurance and other risk transfer products. The reinsurance business is also infl uenced by several other factors, including variations in interest rates and fi nancial markets, changes in legal, regulatory and judicial environments, loss trends, infl ation and general economic conditions.
521258_P021-101_MDA.indd 23521258_P021-101_MDA.indd 23 3/18/09 12:11:28 AM3/18/09 12:11:28 AM

PartnerRe Ltd.Management’s Discussion and Analysis of Financial Condition and Results of Operation
24 PartnerReAnnual Report 2008
Throughout the late 1990s, the industry’s operating profi tability and cash fl ows declined as a result of declining prices, a deterioration in terms and conditions and increasing loss costs. These negative trends were, however, offset by high investment returns that led to continued growth in capital. Between 2001 and 2004, premium rates increased, driven by large loss events and there were steep declines in interest rates and equity values, adding to the pressure for improvements in pricing and underwriting terms. These began to reverse in late 2003 and continued into 2004, when the Company began to see a fl attening in the rate of improvement in the terms and conditions of the most profi table lines, and a slower rate of improvement in those lines that had not yet reached their peak in terms of profi tability. During 2005, pricing was generally fl at to down, except for wind-exposed lines, with 2005 being the worst year in the history of the industry in terms of catastrophe losses, with Hurricane Katrina being the largest insured event ever, two other signifi cant Atlantic hurricanes, Rita and Wilma, as well as a signifi cant windstorm and a fl ood in Europe. Consequently, the Company observed in 2006 strong pricing increases in the lines and geographies that were affected by the large 2005 catastrophic loss events. Pricing in other lines was generally stable. In 2007, pricing remained strong for U.S. wind-exposed lines, while all other lines saw pricing declines.
In 2008, pricing declined in most major markets and most lines of business. There was a continuation of the trend toward increasing risk retention by cedants, and restructuring proportional coverages to non-proportional treaties, which led to the reduction in the amount of premiums in the reinsurance marketplace. The second half of 2008 was highly unusual on many levels: severity of losses, such as Hurricane Ike, the third largest natural catastrophe in history, frequency of losses and severe and widespread fi nancial turmoil stemming from the sub-prime mortgage and resulting global credit and fi nancial crisis. The fi nancial markets have experienced severe dislocation and unprecedented events during 2008, including extreme volatility in foreign exchange markets and worldwide equity markets, signifi cant declines in risk-free interest rates and increases in credit spreads, risk assets under-performing risk-free assets and several fi nancial institutions being subject to government bail-out packages both in the U.S. and Europe. The ongoing fi nancial and capital markets crises are likely to be a transforming event for the reinsurance industry, given a new sense of risk and exposure and continued volatility. This will not only impact the normal reinsurance pricing and profi t cycle, but also the capital markets, given continued volatility, increased regulation and certain investment products and strategies that have been largely discredited.
The January 1, 2009 renewal saw market conditions beginning to stabilize overall, and improve signifi cantly in catastrophe-exposed lines. U.S. casualty lines remained uncertain at the January 1, 2009 renewals, with no indication of improving pricing or terms and conditions, despite growing evidence of increasing loss trends. The Company grew in markets with the most attractive risk and return opportunities, and maintained its position in lines where priced profi tability has stabilized, but not yet improved. Management believes it has maintained the diversifi cation in its risk portfolio and maintained a similarly priced technical ratio (defi ned below) to that of the January 1, 2008 renewal.
A key challenge facing the Company is to successfully manage through all phases of the reinsurance cycle. The Company is confi dent in its long-term strategy, and believes that by closely monitoring the progression of each line of business, being selective in the business that it writes, and maintaining the diversifi cation and balance of its portfolio, it will optimize returns. Individual lines of business and markets have their own unique characteristics and are at different stages of the reinsurance pricing cycle at any given point in time. Management believes it has achieved appropriate portfolio diversifi cation by product, geography, line and type of business, length of tail, and distribution channel, and that this diversifi cation, in addition to the fi nancial strength of the Company and its strong global
521258_P021-101_MDA.indd 24521258_P021-101_MDA.indd 24 3/18/09 12:11:41 AM3/18/09 12:11:41 AM
PartnerReAnnual Report 2008
25
PartnerRe Ltd.Management’s Discussion and Analysis of Financial Condition and Results of Operation
franchise, will help to mitigate cyclical declines in underwriting profi tability and to achieve a more stable return over time.
Within the Company’s Life segment, the reinsurance market is differentiated between mortality and longevity products, with mortality being the larger market. For the mortality markets in which the Company writes business, the Company observed stable pricing for continental Europe and Latin America. In contrast, there are more competitive conditions in the U.K. and Ireland, and while these two markets remain attractive, appropriate risk selection and pricing is important. The Company does not write life business in the U.S. market.
The Company’s profi tability is signifi cantly affected by the level of its losses and loss expenses incurred. The Company recognizes losses and loss expenses on the basis of actual and expected claims on business written and earned. The Company’s Non-life net reserve position at December 31, 2008 was $7.4 billion. Management believes that it follows prudent reserving policies to maintain a strong fi nancial position. A key challenge for the Company is the accurate estimation of loss reserves for each line of business, which is critical in order to accurately determine the profi tability of each line and allocate the appropriate amount of capital to each line in a manner that optimizes profi tability.
At year end 2008, given the deterioration in global credit markets and worldwide economies, the Company re-evaluated the loss potential for business written in its Global (Non-U.S.) credit/surety, and to a lesser extent, the U.S. surety line of business, and its Global (Non-U.S.) and U.S. specialty casualty lines of business, primarily directors and offi cers exposures, to ensure that the Company has reserved for an anticipated increase in claims for the 2006, 2007 and 2008 underwriting years. The Company’s reserves for unpaid losses and loss expenses for its credit/surety and specialty casualty lines of business represent Management’s best estimate of the ultimate cost to settle the liabilities based on information available at December 31, 2008.
The Company’s capital markets and investment operations, including public and private market investments, experienced a diffi cult year in 2008, with signifi cant economic fallout resulting from the deterioration of the credit markets which began in 2007 and the collapse of the credit and equity markets in 2008. The impact of the turmoil in the credit markets and broader economy was partially mitigated by the Company’s high quality asset portfolio. The Company’s total return on its investment portfolio was well below the risk-free rate of return during 2008, but nevertheless was a positive return, excluding the impact of foreign exchange. The Company believes that capital markets risks managed in a disciplined and measured way will generate positive excess return to the Company over time.
The Company generates revenue from its substantial and high quality investment portfolio. The Company follows prudent investment guidelines through a strategy that seeks to maximize returns while managing investment risk in line with the Company’s overall objectives of earnings stability and long-term book value growth. The Company allocates its invested assets into two categories: liability funds and capital funds. See the discussion of liability funds and capital funds in Financial Condition, Liquidity and Capital Resources. A key challenge for the Company is achieving the right balance between current investment income and total returns (that include price appreciation or depreciation) in changing market conditions. The Company regularly reviews the allocation of investments to asset classes within its investment portfolio and allocates investments to those asset classes the Company anticipates will outperform in the near future, subject to limits and guidelines. Similarly, the Company reduces its exposure to risk asset classes where returns are underperforming, as was the case during 2008 when the Company substantially reduced its allocation to equities. The Company may also lengthen or shorten the duration of its fi xed income portfolio in anticipation of changes in interest rates, or increase or decrease the amount of credit risk it assumes, depending on credit spreads and anticipated economic conditions.
521258_P021-101_MDA.indd 25521258_P021-101_MDA.indd 25 3/18/09 12:11:57 AM3/18/09 12:11:57 AM

PartnerRe Ltd.Management’s Discussion and Analysis of Financial Condition and Results of Operation
26 PartnerReAnnual Report 2008
Key Financial MeasuresIn addition to the Consolidated Balance Sheets and Consolidated Statement of Operations and Comprehensive Income, Management uses three key measures to evaluate its fi nancial performance, as well as the overall growth in value generated for the Company’s common shareholders.
Diluted Book Value per Share
Management uses growth in diluted book value per share as a prime measure of the value the Company is generating for its common shareholders, as Management believes that growth in the Company’s diluted book value per share ultimately translates into growth in the Company’s stock price. Diluted book value per share is calculated using common shareholders’ equity (shareholders’ equity less the liquidation value of preferred shares) divided by the number of fully diluted common shares outstanding (assuming exercise of all stock-based awards and other dilutive securities). Diluted book value per share is impacted by the Company’s net income and external factors such as foreign exchange, interest rates and equity markets, which can drive changes in unrealized gains or losses on its investment portfolio. Over the past six years, since December 31, 2002, the Company has generated a compound annual growth rate in diluted book value per share in excess of 11%.
ROE
Management uses operating return on beginning shareholders’ equity (ROE) as a measure of profi tability that focuses on the return to common shareholders. It is calculated using operating earnings (loss) available to common shareholders (net income or loss excluding net after-tax realized gains or losses on investments, net after-tax interest in earnings or losses of equity investments and preferred share dividends) divided by beginning common shareholders’ equity. Management has set an average 13% ROE target over the reinsurance cycle, which Management believes provides an attractive return to shareholders for the risk assumed. Each business unit and support department throughout the Company is focused on seeking to ensure that the Company meets the 13% return objective. This means that most economic decisions, including capital allocation and underwriting pricing decisions, incorporate an ROE impact analysis. For the purpose of that analysis, an appropriate amount of capital (equity) is allocated to each transaction for determining the transaction’s priced return on deployed capital. Subject to an adequate return for the risk level as well as other factors, such as the contribution of each risk to the overall risk level and risk diversifi cation, capital is allocated to the transactions generating the highest priced return on deployed capital. Management’s challenge consists of (i) allocating an appropriate amount of capital to each transaction based on the incremental risk created by the transaction, (ii) properly estimating the Company’s overall risk level and the impact of each transaction on the overall risk level, and (iii) assessing the diversifi cation benefi t, if any, of each transaction. The risk for the Company lies in mis-estimating any one of these factors, which are critical in calculating a meaningful priced return on deployed capital, and entering into transactions that do not contribute to the Company’s 13% ROE objective.
Combined Ratio
The combined ratio is used industry-wide as a measure of underwriting profi tability for Non-life business. The combined ratio is the sum of the technical ratio (losses and loss expenses and acquisition costs divided by net premiums earned) and the other operating expense ratio (other operating expenses divided by net premiums earned). A combined ratio under 100% indicates underwriting profi tability, as the total losses and loss expenses, acquisition costs and other operating expenses are less than the premiums earned on that business. While an important metric of success, the combined ratio does not refl ect all components of profi tability, as it does not recognize the impact of interest income earned on premiums between the time premiums are received and the time loss payments are ultimately made
521258_P021-101_MDA.indd 26521258_P021-101_MDA.indd 26 3/18/09 12:12:11 AM3/18/09 12:12:11 AM

PartnerReAnnual Report 2008
27
PartnerRe Ltd.Management’s Discussion and Analysis of Financial Condition and Results of Operation
to clients. Since 2001, the Company had six years of underwriting profi tability refl ected in combined ratios of less than 100% for its Non-life segment. In 2005, when the industry recorded its worst year in history in terms of catastrophe losses, with Hurricane Katrina being the largest insured event ever, the Company recorded a net underwriting loss and Non-life combined ratio of 116.3%. In 2008, the Company maintained a Non-life combined ratio of 94.1% for the year, after incurring large catastrophic losses for Hurricane Ike. The key challenges in managing the combined ratio metric consist of (i) focusing on underwriting profi table business even in the weaker part of the reinsurance cycle, as opposed to growing the book of business at the cost of profi tability, (ii) diversifying the portfolio to achieve a good balance of business, with the expectation that underwriting losses in certain lines or markets may potentially be offset by underwriting profi ts in other lines or markets, and (iii) maintaining control over expenses.
Other Key Issues of ManagementEnterprise Culture
Management is focused on ensuring that the structure and culture of the organization promote intelligent, prudent, transparent and ethical decision-making. Management believes that a sound enterprise culture starts with the tone at the top. The Executive Management holds regular company-wide information sessions to present and review Management’s latest decisions, whether operational, fi nancial or structural, as well as the fi nancial results of the Company. Employees are encouraged to address questions related to the Company’s results, strategy or Management decisions, either anonymously or otherwise to Management so that they can be answered during these information sessions. Management believes that these sessions provide a consistent message to all employees about the Company’s value of transparency. Management also strives to promote a work environment that (i) aligns the skill set of individuals with challenges encountered by the Company, (ii) includes segregation of duties to ensure objectivity in decision making, and (iii) provides a compensation structure that encourages and rewards intelligent and ethical behavior. To that effect, the Company has a written Code of Business Conduct and Ethics and provides employees with a direct communication channel to the Audit Committee in the event they become aware of questionable behavior of Management or anyone else. Finally, Management believes that building a sound internal control environment, including a strong internal audit function, helps ensure that behaviors are consistent with the Company’s cultural values.
Capital Adequacy
A key challenge for Management is to maintain an appropriate level of capital, especially in light of the current disruptions in the global credit and capital markets. Management’s fi rst priority is to hold suffi cient capital to meet all of the Company’s obligations to cedants, meet regulatory requirements and support its position as one of the stronger reinsurers in the industry. Holding an excessive amount of capital, however, will reduce the Company’s ROE. Consequently, Management closely monitors its capital needs and capital level throughout the cycle, and in times of volatility and turmoil in global capital markets, and actively takes steps to increase or decrease the Company’s capital in order to achieve the proper balance of fi nancial strength and shareholder returns. Capital management is achieved by either deploying capital to fund attractive business opportunities, or in times of excess capital, returning capital to shareholders by way of share repurchases and dividends.
Liquidity and Cash Flows
The Company aims to be a reliable and fi nancially secure partner to its cedants. This means that the Company must maintain suffi cient liquidity at all times so that it can support its cedants by settling claims quickly. The Company generates cash fl ows primarily from its underwriting and investment operations. Management believes that a profi table, well-run reinsurance organization will generate suffi cient cash from premium receipts to pay claims, acquisition costs and operating expenses in most years. To the extent that underwriting
521258_P021-101_MDA.indd 27521258_P021-101_MDA.indd 27 3/18/09 12:12:25 AM3/18/09 12:12:25 AM

PartnerRe Ltd.Management’s Discussion and Analysis of Financial Condition and Results of Operation
28 PartnerReAnnual Report 2008
cash fl ows are not suffi cient to cover operating cash outfl ows in any year, the Company may utilize cash fl ows generated from investments and may ultimately liquidate assets from its investment portfolio. Management ensures that its liquidity requirements are supported by maintaining a high-quality, well-balanced and liquid investment portfolio, and by matching the duration of its investments with that of its net reinsurance liabilities. In 2009, the Company expects to continue to generate positive operating cash fl ows, absent a series of unusual catastrophic events. Management also maintains credit facilities with banks that can provide effi cient access to cash in the event of an unforeseen cash requirement.
Risk Management
A key challenge in the reinsurance industry is to create economic value through the intelligent assumption of reinsurance and capital markets and investment risk, but also to limit or mitigate those risks that can destroy tangible as well as intangible value. Management believes that every organization faces numerous risks that could threaten the successful achievement of a company’s goals and objectives. These include choice of strategy and markets, economic and business cycles, competition, changes in regulation, data quality and security, fraud, business interruption and management continuity; all factors which can be viewed as either strategic or operational risks that are common to any industry. In addition to these risks, the Company assumes risks and its results are primarily determined by how well the Company understands, prices and manages assumed risk. While many industries and companies start with a return goal and then attempt to shed risks that may derail that goal, the Company starts with a capital-based risk appetite and then looks for risks that meet its return targets within that framework. Management believes that this construct allows the Company to balance the cedants’ need for absolute certainty of claims payment with the shareholders’ need for an adequate return on their capital.
The Company has a clearly defi ned governance structure for risk management. Executive Management and the Board are responsible for setting the vision and goals including risk appetite and return expectations. Strategy and principles are recommended by Executive Management and approved by the Board. Key policies and Group policies are established by the Chief Executive Offi cer and policies at the next level down are established by Business Unit and functional management. Risk management policies and processes are audited by Internal Audit and the results of audits are monitored by the Audit Committee of the Board.
The Company manages assumed risk at a strategic level through diversifi cation, risk appetite, and absolute limits. For each key risk, the Board approves a risk appetite that the Company defi nes as the percentage of economic capital the Company is willing to expose to economic loss with a modeled probability of occurring once every 15 years and once every 75 years. The Company manages its exposure to key risks such that the modeled economic loss at a 1 in 15 year and a 1 in 75 year return period are less than the economic capital the Company is willing to expose to the key risks at those return periods. In addition, the Risk Management and Finance Committee of the Board approve aggregate and absolute risk limits for the key risks. The Company’s risk limits are stated as explicit numerical expressions, such as total aggregate limits in a catastrophe zone, earned premium for casualty business, and the market value of equity and equity-like securities. Executive and Business Unit Management set additional specifi c and aggregate risk limits within those limits approved by the Risk Management and Finance Committee. The actual level of risk is dependent on current market conditions and the need for balance in the Company’s portfolio of risks. On a quarterly basis, Management reviews and reports to the Board the actual utilization of limits against approved limits and modeled economic loss against approved appetite for the key risks.
521258_P021-101_MDA.indd 28521258_P021-101_MDA.indd 28 3/18/09 12:12:42 AM3/18/09 12:12:42 AM

PartnerReAnnual Report 2008
29
PartnerRe Ltd.Management’s Discussion and Analysis of Financial Condition and Results of Operation
Individual business units manage assumed risks, subject to the appetite and principles approved by the Board, limits approved by the Risk Management and Finance Committee, and policies established by Executive and Business Unit Management. At an operational level, business units manage assumed risk through risk mitigation strategies for assumed risks including strong processes, technical risk assessment and collaboration among different groups of professionals who each contribute a particular area of expertise.
Strategic risks are managed by Executive Management and include the direction and governance of the Company, as well as its response to key external factors faced by the reinsurance industry.
Operational and fi nancial risks are managed by designated functions within the organization. They include failures or weaknesses in fi nancial reporting and controls, regulatory non-compliance, poor cash management, fraud, breach of information technology security and reliance on third party vendors. The Company seeks to minimize these risks through robust processes and controls. Controls and monitoring processes throughout the organization seek to ensure that the Executive Management and the Board have a comprehensive view of the Company’s risks and related mitigation strategies at all times.
The major risks to the Company’s balance sheet are typically due to events that Management refers to as shock losses. The Company defi nes a shock loss as an event that has the potential to materially damage economic value. The Company defi nes its economic value as the difference between the net present value of tangible assets and the net present value of liabilities, using appropriate risk discount rates. For traded assets, the calculated net present values are equivalent to market values.
There are three areas of risk that the Company has currently identifi ed as having the greatest potential for shock losses: catastrophe, reserving for casualty and other long-tail lines, and equity and equity-like investment risk. The Company manages the risk of shock losses by setting risk appetite and limits as described above for each type of shock loss. The Company establishes limits to manage the absolute maximum foreseeable loss from any one event and considers the possibility that several shock losses could occur at one time, for example a major catastrophe event accompanied by a collapse in the equity markets. Management believes that the limits that it has placed on shock losses will allow the Company to continue writing business should such an event occur.
Other risks such as interest rate risk and credit risk have the ability to impact results substantially and may result in volatility in results from quarter to quarter, but Management believes that by themselves, they are unlikely to represent a material downside threat to the Company’s long-term economic value. See Quantitative and Qualitative Disclosures about Market Risk for additional disclosure on interest rate risk, credit spread risk, foreign currency risk, credit risk and equity price risk.
The Company seeks to maintain a risk appetite moderately above the average of the reinsurance market because Management believes that this position offers the best potential for creating shareholder value at an acceptable risk level. The most profi table products generally present the most volatility and potential downside risk. Management believes that the Company’s actual risk profi le is equal to or less than the average of the reinsurance market because of the level of diversifi cation achieved in the portfolio, the strict adherence to risk appetite and limits, and the risk mitigation strategies employed.
Catastrophe RiskThe Company defi nes this risk as the risk that the aggregate losses from natural perils materially exceed the net premiums that are received to cover such risks. The Company considers both the loss of capital due to a single large event and the loss of capital that would occur from multiple (but potentially smaller) events in any year.
521258_P021-101_MDA.indd 29521258_P021-101_MDA.indd 29 3/18/09 12:12:56 AM3/18/09 12:12:56 AM
PartnerRe Ltd.Management’s Discussion and Analysis of Financial Condition and Results of Operation
30 PartnerReAnnual Report 2008
The Company imposes an absolute limit to catastrophe risk from any single loss through exposure limit caps in each zone and to each peril. Limits from catastrophe exposed business include limits on both reinsurance treaties and insurance linked securities. This risk is managed through the real-time allocation of catastrophe exposure capacity in each exposure zone to different business units, regular modeling of aggregate loss scenarios through proprietary models and a combination of quantitative and qualitative analysis. A zone is a geographic area in which the insurance risks are considered to be correlated to a single catastrophic event. Not all zones have the same limit and zones are broadly defi ned so that it would be highly unlikely for any single event to substantially erode the aggregate exposure limits from more than one zone. Even extremely high severity/low likelihood events will only partially exhaust the limits in any zone, as they are likely to only affect a part of the area covered by a wide zone.
The Company manages its catastrophe exposures such that the chance of an economic loss to the Company from all catastrophe losses in aggregate in any one year exceeding $960 million has a modeled probability of occurring less than once every 75 years. To measure this probability, the Company uses proprietary models that take into account not only the exposures in any zone, but also the likely frequency and severity of catastrophic events. This quantitative analysis is supplemented with the professional judgment of experienced underwriters. At December 31, 2008, the modeled economic loss to the Company from a 1 in 75 year catastrophic loss was $810 million, in aggregate, for all zones.
Casualty Reserving RiskThe Company defi nes this risk as the risk that the estimates of ultimate losses that underlie its booked reserves for casualty and other long-tail lines will prove to be too low, leading to substantial reserve strengthening. The tolerance set by the Company for this risk is measured using total earned premiums for casualty and other long-tail lines for the four most recent underwriting periods.
One of the greatest risks in long-tail lines of business, and particularly in U.S. casualty, is that the loss trends are higher than the assumptions underlying the Company’s ultimate loss estimates, resulting in ultimate losses that exceed recorded loss reserves. When loss trends prove to be higher than those underlying the reserving assumptions, the risk is great because of a stacking up effect: for long-tail lines, the Company carries reserves to cover claims arising from several years of underwriting activity and these reserves are likely to be adversely affected by unfavorable loss trends. The effect is likely to be more pronounced for recent underwriting years because, with the passage of time, actual loss emergence and data provide greater confi dence around the adequacy of ultimate liability estimates for older underwriting years. Management believes that the volume of long-tail business most exposed to these reserving uncertainties should be limited.
The Company manages and mitigates the reserve risk for long-tail lines in a variety of ways. Underwriters and pricing actuaries follow a disciplined underwriting process that utilizes all available data and information, including industry trends, and the Company establishes prudent reserving policies for determining carried reserves. These policies are systematic and Management endeavors to apply them consistently over time. See Critical Accounting Policies and Estimates — Losses and Loss Expenses and Life Policy Benefi ts below.
The Company manages its casualty and other long-tail lines exposure such that the chance of an economic loss to the Company from prior years’ deterioration in casualty and other long-tail reserves exceeding $480 million has a modeled probability of occurring less than
521258_P021-101_MDA.indd 30521258_P021-101_MDA.indd 30 3/18/09 12:13:11 AM3/18/09 12:13:11 AM
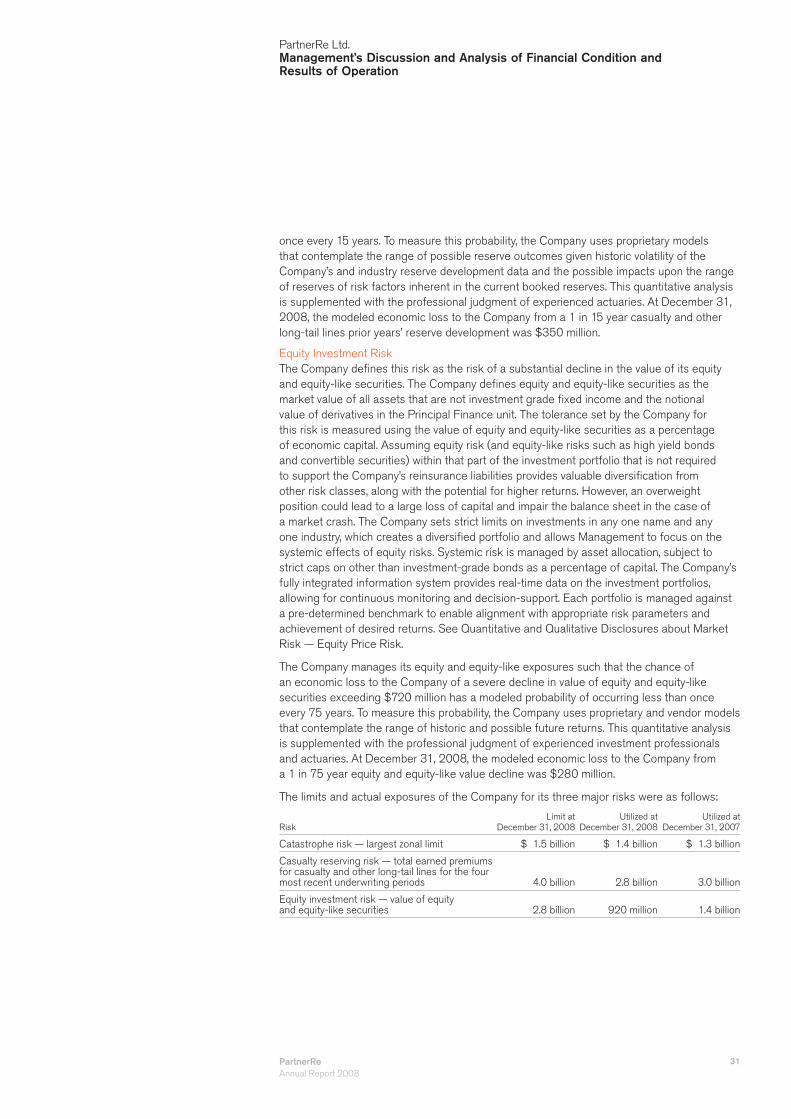
PartnerReAnnual Report 2008
31
PartnerRe Ltd.Management’s Discussion and Analysis of Financial Condition and Results of Operation
once every 15 years. To measure this probability, the Company uses proprietary models that contemplate the range of possible reserve outcomes given historic volatility of the Company’s and industry reserve development data and the possible impacts upon the range of reserves of risk factors inherent in the current booked reserves. This quantitative analysis is supplemented with the professional judgment of experienced actuaries. At December 31, 2008, the modeled economic loss to the Company from a 1 in 15 year casualty and other long-tail lines prior years’ reserve development was $350 million.
Equity Investment RiskThe Company defi nes this risk as the risk of a substantial decline in the value of its equity and equity-like securities. The Company defi nes equity and equity-like securities as the market value of all assets that are not investment grade fi xed income and the notional value of derivatives in the Principal Finance unit. The tolerance set by the Company for this risk is measured using the value of equity and equity-like securities as a percentage of economic capital. Assuming equity risk (and equity-like risks such as high yield bonds and convertible securities) within that part of the investment portfolio that is not required to support the Company’s reinsurance liabilities provides valuable diversifi cation from other risk classes, along with the potential for higher returns. However, an overweight position could lead to a large loss of capital and impair the balance sheet in the case of a market crash. The Company sets strict limits on investments in any one name and any one industry, which creates a diversifi ed portfolio and allows Management to focus on the systemic effects of equity risks. Systemic risk is managed by asset allocation, subject to strict caps on other than investment-grade bonds as a percentage of capital. The Company’s fully integrated information system provides real-time data on the investment portfolios, allowing for continuous monitoring and decision-support. Each portfolio is managed against a pre-determined benchmark to enable alignment with appropriate risk parameters and achievement of desired returns. See Quantitative and Qualitative Disclosures about Market Risk — Equity Price Risk.
The Company manages its equity and equity-like exposures such that the chance of an economic loss to the Company of a severe decline in value of equity and equity-like securities exceeding $720 million has a modeled probability of occurring less than once every 75 years. To measure this probability, the Company uses proprietary and vendor models that contemplate the range of historic and possible future returns. This quantitative analysis is supplemented with the professional judgment of experienced investment professionals and actuaries. At December 31, 2008, the modeled economic loss to the Company from a 1 in 75 year equity and equity-like value decline was $280 million.
The limits and actual exposures of the Company for its three major risks were as follows:
RiskLimit at
December 31, 2008Utilized at
December 31, 2008Utilized at
December 31, 2007
Catastrophe risk — largest zonal limit $ 1.5 billion $ 1.4 billion $ 1.3 billion
Casualty reserving risk — total earned premiums for casualty and other long-tail lines for the four most recent underwriting periods 4.0 billion 2.8 billion 3.0 billion
Equity investment risk — value of equity and equity-like securities 2.8 billion 920 million 1.4 billion
521258_P021-101_MDA.indd 31521258_P021-101_MDA.indd 31 3/18/09 12:13:24 AM3/18/09 12:13:24 AM

PartnerRe Ltd.Management’s Discussion and Analysis of Financial Condition and Results of Operation
32 PartnerReAnnual Report 2008
Critical Accounting Policies and EstimatesThe Company’s Consolidated Financial Statements have been prepared in accordance with accounting principles generally accepted in the United States (U.S. GAAP). The preparation of fi nancial statements in conformity with U.S. GAAP requires Management to make estimates and assumptions that affect the reported amounts of assets and liabilities at the date of the fi nancial statements and the reported amounts of revenues and expenses during the reporting period. The following presents a discussion of those accounting policies and estimates that Management believes are the most critical to its operations and require the most diffi cult, subjective and complex judgment. If actual events differ signifi cantly from the underlying assumptions and estimates used by Management, there could be material adjustments to prior estimates that could potentially adversely affect the Company’s results of operations, fi nancial condition and liquidity. These critical accounting policies and estimates should be read in conjunction with the Company’s Notes to Consolidated Financial Statements, including Note 2, Signifi cant Accounting Policies, for a full understanding of the Company’s accounting policies. The sensitivity estimates that follow are based on outcomes that the Company considers reasonably likely to occur.
Losses and Loss Expenses and Life Policy BenefitsLosses and Loss Expenses
Because a signifi cant amount of time can elapse between the assumption of risk, occurrence of a loss event, the reporting of the event to an insurance company (the primary company or the cedant), the subsequent reporting to the reinsurance company (the reinsurer) and the ultimate payment of the claim on the loss event by the reinsurer, the Company’s liability for unpaid losses and loss expenses (loss reserves) is based largely upon estimates. The Company categorizes loss reserves into three types of reserves: reported outstanding loss reserves (case reserves), additional case reserves (ACRs) and incurred but not reported (IBNR) reserves. Case reserves represent unpaid losses reported by the Company’s cedants and recorded by the Company. ACRs are established for particular circumstances where, on the basis of individual loss reports, the Company estimates that the particular loss or collection of losses covered by a treaty may be greater than those advised by the cedant. IBNR reserves represent a provision for claims that have been incurred but not yet reported to the Company, as well as future loss development on losses already reported, in excess of the case reserves and ACRs. Unlike case reserves and ACRs, IBNR reserves are often calculated at an aggregated level and cannot usually be directly identifi ed as reserves for a particular loss or treaty. The Company updates its estimates for each of the aforementioned categories on a quarterly basis using information received from its cedants. The Company also estimates the future unallocated loss adjustment expenses (ULAE) associated with the loss reserves and these form part of the Company’s loss adjustment expense reserves. The Company’s Non-life loss reserves for each category, line and sub-segment are reported in the tables included later in this section.
The amount of time that elapses before a claim is reported to the cedant and then subsequently reported to the reinsurer is commonly referred to in the industry as the reporting tail. Lines of business for which claims are reported quickly are commonly referred to as short-tail lines; and lines of business for which a longer period of time elapses before claims are reported to the reinsurer are commonly referred to as long-tail lines. In general, for reinsurance, the time lags are longer than for primary business due to the delay that occurs between the cedant becoming aware of a loss and reporting the information to its reinsurer(s). The delay varies by reinsurance market (country of cedant), type of treaty, whether losses are paid by the cedant and the size of the loss. The delay could vary from a few weeks to a year or sometimes longer. The Company considers agriculture, catastrophe, energy, property, motor business written in the U.S., proportional motor business written outside of the U.S., specialty property and structured risk to be short-tail lines; aviation/space, credit/surety, engineering, marine and multiline to be medium-tail lines; and casualty, non-proportional motor business
521258_P021-101_MDA.indd 32521258_P021-101_MDA.indd 32 3/18/09 12:13:38 AM3/18/09 12:13:38 AM
PartnerReAnnual Report 2008
33
PartnerRe Ltd.Management’s Discussion and Analysis of Financial Condition and Results of Operation
written outside of the U.S. and specialty casualty to be long-tail lines of business. For all lines, the Company’s objective is to estimate ultimate losses and loss expenses. Total loss reserves are then calculated by subtracting losses paid. Similarly, IBNR reserves are calculated by subtraction of case reserves and ACRs from total loss reserves.
The Company analyzes its ultimate losses and loss expenses after consideration of the loss experience of various reserving cells. The Company assigns treaties to reserving cells and allocates losses from the treaty to the reserving cell. The reserving cells are selected in order to ensure that the underlying treaties have homogeneous loss development characteristics (e.g., reporting tail) but are large enough to make estimation of trends credible. The selection of reserving cells is reviewed annually and changes over time as the business of the Company evolves. For each reserving cell, the Company tabulates losses in reserving triangles that show the total reported or paid claims at each fi nancial year end by underwriting year cohort. An underwriting year is the year during which the reinsurance treaty was entered into as opposed to the year in which the loss occurred (accident year), or the calendar year for which fi nancial results are reported. For each reserving cell, the Company’s estimates of loss reserves are reached after a review of the results of several commonly accepted actuarial projection methodologies. In selecting its best estimate, the Company considers the appropriateness of each methodology to the individual circumstances of the cell and underwriting year for which the projection is made. The methodologies that the Company employs include, but may not be limited to, paid and reported Chain Ladder methods, Expected Loss Ratio method, paid and reported Bornhuetter-Ferguson (B-F) methods, and paid and reported Benktander methods. In addition, the Company uses other methodologies to estimate liabilities for specifi c types of claims. For example, internal and vendor catastrophe models are typically used in the estimation of loss and loss expenses at the early stages of catastrophe losses before loss information is reported to the reinsurer. In the case of asbestos and environmental claims, the Company has established reserves for future losses and allocated loss expenses based on the results of periodic actuarial studies, which consider the underlying exposures of the Company’s cedants.
The reserve methodologies employed by the Company are dependent on data that the Company collects. This data consists primarily of loss amounts and loss payments reported by the Company’s cedants, and premiums written and earned reported by cedants or estimated by the Company. The actuarial methods used by the Company to project loss reserves that it will pay in the future (future liabilities) do not generally include methodologies that are dependent on claim counts reported, claim counts settled or claim counts open as, due to the nature of the Company’s business, this information is not routinely provided by cedants for every treaty. Consequently, actuarial methods relying on this information cannot be used by the Company to estimate loss reserves.
A brief description of the reserving methods commonly employed by the Company and a discussion of their particular advantages and disadvantages follows:
Chain Ladder (CL) Development Methods (Reported or Paid)These methods use the underlying assumption that losses reported (paid) for each underwriting year at a particular development stage follow a stable pattern. For example, the CL development method assumes that on average, every underwriting year will display the same percentage of ultimate liabilities reported by the Company’s cedants (say x%) at 24 months after the inception of the underwriting year. The percentages reported (paid) are established for each development stage (e.g., at 12 months, 24 months, etc.) after examining historical averages from the loss development data. These are sometimes supplemented by external benchmark information. Ultimate liabilities are estimated by multiplying the actual reported (paid) losses by the reciprocal of the assumed reported (paid) percentage (e.g., 1/x%). Reserves are then calculated by subtracting paid claims from the estimated ultimate liabilities.
521258_P021-101_MDA.indd 33521258_P021-101_MDA.indd 33 3/18/09 12:13:54 AM3/18/09 12:13:54 AM

PartnerRe Ltd.Management’s Discussion and Analysis of Financial Condition and Results of Operation
34 PartnerReAnnual Report 2008
The main strengths of the method are that it is reactive to loss emergence (payments) and that it makes full use of historical experience on claim emergence (payments). For homogeneous low volatility lines, under stable economic conditions the method can often produce good estimates of ultimate liabilities and reserves. However, the method has weaknesses when the underlying assumption of stable patterns is not true. This may be the consequence of changes in the mix of business, changes in claim infl ation trends, changes in claim reporting practices or the presence of large claims, among other things. Furthermore, the method tends to produce volatile estimates of ultimate liabilities in situations where there is volatility in reported (paid) patterns. In particular, when the expected percentage reported (paid) is low, small deviations between actual and expected claims can lead to very volatile estimates of ultimate liabilities and reserves. Consequently, this method is often unsuitable for projections at early development stages of an underwriting year. Finally, the method fails to incorporate any information regarding market conditions, pricing, etc., which could improve the estimate of liabilities and reserves. It therefore tends not to perform very well in situations where there are rapidly changing market conditions.
Expected Loss Ratio (ELR) MethodThis method estimates ultimate losses for an underwriting year by applying an estimated loss ratio to the earned premium for that underwriting year. Although the method is insensitive to actual reported or paid losses, it can often be useful at the early stages of development when very few losses have been reported or paid, and the principal sources of information available to the Company consist of information obtained during pricing and qualitative information supplied by the cedant. However, the lack of sensitivity to reported or paid losses means that the method is usually inappropriate at later stages of development.
Bornhuetter-Ferguson (B-F) Methods (Reported or Paid)These methods aim to address the concerns of the Chain Ladder Development methods, which are the variability at early stages of development and the failure to incorporate external information such as pricing. However, the B-F methods are more sensitive to reported and paid losses than the Expected Loss Ratio method, and can be seen as a blend of the Expected Loss Ratio and Chain Ladder development methods. Unreported (unpaid) claims are calculated using an expected reporting (payment) pattern and an externally determined estimate of ultimate liabilities (usually determined by multiplying an a priori loss ratio with estimates of premium volume). The accuracy of the a priori loss ratio is a critical assumption in this method. Usually a priori loss ratios are initially determined on the basis of pricing information, but may also be adjusted to refl ect other information that subsequently emerges about underlying loss experience. Although the method tends to provide less volatile indications at early stages of development and refl ects changes in the external environment, this method can be slow to react to emerging loss development (payment). In particular, to the extent that the a priori loss ratios prove to be inaccurate (and are not revised), the B-F methods will produce loss estimates that take longer to converge with the fi nal settlement value of loss liabilities.
Benktander (B-K) Methods (Reported or Paid)These methods can be viewed as a blend between the Chain Ladder Development and the B-F methods described above. The blend is based on predetermined weights at each development stage that depend on the reported (paid) development patterns.
Although mitigated to some extent, this method still exhibits the same advantages and disadvantages as the B-F method, but the mechanics of the calculation imply that it is more reactive to loss emergence (payment) than the B-F method.
521258_P021-101_MDA.indd 34521258_P021-101_MDA.indd 34 3/18/09 12:14:07 AM3/18/09 12:14:07 AM

PartnerReAnnual Report 2008
35
PartnerRe Ltd.Management’s Discussion and Analysis of Financial Condition and Results of Operation
In determining the Company’s loss reserves, the selected best estimate is often a blend of the results from two or more methods (e.g., weighted averages). The judgment as to which method(s) is most appropriate for a particular underwriting year and reserving cell could change over time as new information emerges regarding underlying loss activity and other data issues. Furthermore, as each line is typically composed of several reserving cells, it is likely that the reserves for the line will be dependent on several reserving methods. This is because reserves for a line are the result of aggregating the reserves for each constituent reserving cell and that a different method could be selected for each reserving cell. Although it is not appropriate to refer to reserves for a line as being determined by a particular method, the table below summarizes the methods that were given principal weight in selecting the best estimates of reserves in each reserving line and can therefore be viewed as key drivers of selected reserves. The table distinguishes methods for mature and immature underwriting years, as they are often different. The defi nition of maturity is specifi c to a line and is related to the reporting tail. If at the reserve evaluation date, a signifi cant proportion of losses for the underwriting year are expected to have been reported, then the underwriting year is deemed to be mature, otherwise it is deemed to be immature. For short-tail lines, such as property or agriculture, immature years can refer to the one or two most recent underwriting years, while for longer tail lines, such as casualty, immature years can refer to the three or four most recent underwriting years.
To the extent that the principal reserving methods used for major components of a reserving line are different, these are separately identifi ed in the table below.
Reserving line for Non-life Segment
Non-life Sub-segment
Immature Underwriting Years
Mature Underwriting Years
Property U.S. Reported B-F Reported B-F
Property/Specialty PropertyGlobal (Non-U.S.) P&C/
Global (Non-U.S.) Specialty Paid/Reported B-K Reported CL
Casualty U.S. Expected Loss Ratio Reported B-F
Casualty/Specialty CasualtyGlobal (Non-U.S.) P&C/
Global (Non-U.S.) SpecialtyExpected Loss Ratio/
Reported B-F Reported B-F
Multiline U.S.Expected Loss Ratio/
Reported B-F Reported B-F
Motor U.S. Expected Loss Ratio Reported B-F
Motor — Proportional Global (Non-U.S.) P&C Reported B-F Reported B-F
Motor — Non-proportional Global (Non-U.S.) P&C Expected Loss Ratio Reported B-F
AgricultureU.S./
Global (Non-U.S.) SpecialtyExpected Loss Ratio/
Reported B-K Reported B-F
Aviation/Space Global (Non-U.S.) SpecialtyExpected Loss Ratio/
Reported B-F Reported B-F
Catastrophe CatastropheExpected Loss Ratio based on
exposure analysis Reported B-F
Credit/SuretyU.S./
Global (Non-U.S.) SpecialtyExpected Loss Ratio/
Reported B-FReported B-F/Reported B-K
Engineering Global (Non-U.S.) Specialty Paid/Reported B-F Reported B-F
Energy Onshore Global (Non-U.S.) SpecialtyExpected Loss Ratio/
Reported B-F Reported CL
Marine/Energy Offshore Global (Non-U.S.) Specialty Reported B-FReported B-F/
Reported CL
Other (1)U.S./Global (Non-U.S.) P&C/
Global (Non-U.S.) Specialty Periodic actuarial studies Periodic actuarial studies(1) The other reserving line is primarily related to structured risk reinsurance and non-active lines of business.
521258_P021-101_MDA.indd 35521258_P021-101_MDA.indd 35 3/24/09 5:30:57 AM3/24/09 5:30:57 AM

PartnerRe Ltd.Management’s Discussion and Analysis of Financial Condition and Results of Operation
36 PartnerReAnnual Report 2008
Ultimate losses for lines impacted by the rapidly deteriorating fi nancial condition of the world economies in 2008, particularly in the fourth quarter of 2008, cannot be estimated by standard actuarial techniques alone. The majority of the Company’s underwriting exposure related to this issue arises from business written in U.S. and Global (Non-U.S.) specialty casualty, primarily directors and offi cers exposures, Global (Non-U.S.) credit/surety, and to a lesser extent, U.S. surety during the underwriting years 2006, 2007, and 2008. The potential ultimate liability for these exposures was evaluated through an analysis of the Company’s exposure to these risks, which include but are not limited to, sub-prime mortgage related exposures. For specialty casualty, the analysis was based on information received from cedants both at the time the exposed business was written and supplemented by discussions with cedants, evaluation of known securities class action fi lings, current industry data regarding the likelihood of securities class actions and other potential suits against companies exposed to the effects of fi nancial stress, estimates of exposed industry premium, estimates of the Company’s market share of exposed industry premium and estimates of industry-wide insured losses. For credit/surety, the analysis was based on information received from cedants both at the time the exposed business was written supplemented by discussions with cedants, historical experience in times of similar fi nancial stress, reported claim information and internal modeling.
The reserving methods used by the Company are dependent on a number of key parameter assumptions. The principal parameter assumptions underlying the methods used by the Company are:i. the loss development factors used to form an expectation of the evolution of reported
and paid claims for several years following the inception of the underwriting year. These are often derived by examining the Company’s data after due consideration of the underlying factors listed below. In some cases, where the Company lacks suffi cient volume to have statistical credibility, external benchmarks are used to supplement the Company’s data;
ii. the tail factors used to refl ect development of paid and reported losses after several years have elapsed since the inception of the underwriting year;
iii. the a priori loss ratios used as inputs in the B-F methods; andiv. the selected loss ratios used as inputs in the Expected Loss Ratio method.
The validity of all parameter assumptions used in the reserving process is reaffi rmed on a quarterly basis. Reaffi rmation of the parameter assumptions means that the actuaries determine that the parameter assumptions continue to form a sound basis for projection of future liabilities. Parameter assumptions used in projecting future liabilities are themselves estimates based on historical information. As new information becomes available (e.g., additional losses reported), the Company’s actuaries determine whether a revised estimate of the parameter assumptions that refl ects all available information is consistent with the previous parameter assumptions employed. In general, to the extent that the revised estimate of the parameter assumptions are within a close range of the original assumptions, the Company determines that the parameter assumptions employed continue to form an appropriate basis for projections and continue to use the original assumptions in its models. In this case, any differences could be attributed to the imprecise nature of the parameter estimation process. However, to the extent that the deviations between the two sets of estimates are not within a close range of the original assumptions, the Company reacts by adopting the revised assumptions as a basis for its reserve models. Notwithstanding
521258_P021-101_MDA.indd 36521258_P021-101_MDA.indd 36 3/18/09 12:14:35 AM3/18/09 12:14:35 AM

PartnerReAnnual Report 2008
37
PartnerRe Ltd.Management’s Discussion and Analysis of Financial Condition and Results of Operation
the above, even where the Company has experienced no material deviations from its original assumptions during any quarter, the Company will generally revise the reserving parameter assumptions at least once a year to refl ect all accumulated available information.
In addition to examining the data, the selection of the parameter assumptions is dependent on several underlying factors. The Company’s actuaries review these underlying factors and determine the extent to which these are likely to be stable over the time frame during which losses are projected, and the extent to which these factors are consistent with the Company’s data. If these factors are determined to be stable and consistent with the data, the estimation of the reserving parameter assumptions are mainly carried out using actuarial and statistical techniques applied to the Company’s data. To the extent that the actuaries determine that they cannot continue to rely on the stability of these factors, the statistical estimates of parameter assumptions are modifi ed to refl ect the direction of the change. The main underlying factors upon which the estimates of reserving parameters are predicated are:
i. the cedant’s business practices will proceed as in the past with no material changes either in submission of accounts or cash fl ows;
ii. any internal delays in processing accounts received by the cedant are not materially different from that experienced historically, and hence the implicit reserving allowance made in loss reserves through the methods continues to be appropriate;
iii. case reserve reporting practices, particularly the methodologies used to establish and report case reserves, are unchanged from historical practices;
iv. the Company’s internal claim practices, particularly the level and extent of use of ACRs are unchanged;
v. historical levels of claim infl ation can be projected into the future and will have no material effect on either the acceleration or deceleration of claim reporting and payment patterns;
vi. the selection of reserving cells results in homogeneous and credible future expectations for all business in the cell and any changes in underlying treaty terms are either refl ected in cell selection or explicitly allowed in the selection of trends;
vii. in cases where benchmarks are used, they are derived from the experience of similar business; and
viii. the Company can form a credible initial expectation of the ultimate loss ratio of recent underwriting years through a review of pricing information, supplemented by qualitative information on market events.
The Company’s best estimate of total loss reserves is typically in excess of the midpoint of the actuarial reserve estimates. The Company believes that there is potentially signifi cant risk in estimating loss reserves for long-tail lines of business and for immature underwriting years that may not be adequately captured through traditional actuarial projection methodologies. As discussed above, these methodologies usually rely heavily on projections of prior year trends into the future. In selecting its best estimate of future liabilities, the Company considers both the results of actuarial point estimates of loss reserves as well as the potential variability of these estimates as captured by a reasonable range of actuarial reserve estimates. Selected reserves are always within the indicated reasonable range of estimates indicated by the Company’s actuaries. In determining the appropriate best estimate, the Company reviews (i) the position of overall reserves within the actuarial reserve range, (ii) the result of bottom up analysis by underwriting year refl ecting the impact of parameter uncertainty in actuarial calculations, and (iii) specifi c qualitative information on events that may have an effect on future claims but which may not have been adequately refl ected in actuarial mid-estimates, such as potential for outstanding litigation, claims practices of cedants, etc.
521258_P021-101_MDA.indd 37521258_P021-101_MDA.indd 37 3/18/09 12:14:56 AM3/18/09 12:14:56 AM

PartnerRe Ltd.Management’s Discussion and Analysis of Financial Condition and Results of Operation
38 PartnerReAnnual Report 2008
During 2008, 2007 and 2006, the Company reviewed its estimate for prior year losses for each sub-segment of the Non-life segment and, in light of developing data, determined to adjust its ultimate loss ratios for prior accident years. The following table summarizes the net prior year favorable (adverse) reserve development for the Company’s Non-life operations for the years ended December 31, 2008, 2007 and 2006 (in millions of U.S. dollars):
2008 2007 2006
Prior year net favorable (adverse) reserve development:
Non-life segment:
U.S. $ 92 $ 72 $ 2
Global (Non-U.S.) P&C 166 97 66
Global (Non-U.S.) Specialty 82 203 208
Catastrophe 78 42 (24)
Total net Non-life prior year reserve development $ 418 $ 414 $ 252
For a discussion of net prior year favorable (adverse) reserve development by segment and sub-segment, see Results by Segment below and Note 5 to Consolidated Financial Statements.
The table below summarizes the net prior year favorable (adverse) reserve development for the year ended December 31, 2008 by reserving line for the Company’s Non-life segment (in millions of U.S. dollars):
Reserving linesNet favorable (adverse)
prior year reserve development
Property/Specialty Property $ 118
Casualty/Specialty Casualty 112
Multiline (3)
Motor — U.S. business (7)
Motor — Non-U.S. Proportional business (1)
Motor — Non-U.S. Non-proportional business 27
Agriculture 31
Aviation/Space 52
Catastrophe 78
Credit/Surety 8
Engineering 9
Energy Onshore (7)
Marine/Energy Offshore 1
Total net Non-life prior year reserve development $ 418
The following paragraphs discuss how losses paid and reported during the year ended December 31, 2008 compared with the Company’s expectations, and how the Company modifi ed its reserving parameter assumptions in line with the emerging development in each reserving line.
Property: Aggregate losses reported for the U.S. property line were lower than expected, and the Company selected reserving methods that gave more weight to the actual development. Losses reported for the Non-U.S. property line were lower than expected for most years, and the Company refl ected this experience by using reserving methods that give more weight to the actual development and by lowering its loss ratio picks for those years.
521258_P021-101_MDA.indd 38521258_P021-101_MDA.indd 38 3/18/09 12:15:10 AM3/18/09 12:15:10 AM

PartnerReAnnual Report 2008
39
PartnerRe Ltd.Management’s Discussion and Analysis of Financial Condition and Results of Operation
Casualty: Aggregate losses reported and paid for the Non-U.S. casualty line were signifi cantly below the Company’s expectations mainly for underwriting years 2003–2006, and the Company refl ected this experience by lowering its loss ratio picks for those underwriting years. Aggregate losses reported for the U.S. casualty line were lower than expected mainly due to the 2004–2005 underwriting years.
Multiline: Aggregate reported losses were higher than expected for underwriting year 2007 and lower than expected for underwriting years 2006 and prior. The Company refl ected this experience by using reserving methods that give more weight to the actual development.
Motor:
Aggregate losses reported for the U.S. motor line were higher than expected. The -Company selected higher loss ratios refl ecting this development in addition to changing loss development assumptions. Aggregate losses reported for the Non-U.S. motor proportional line were generally in line -with expectations and reserving assumptions were not materially changed. Aggregate losses reported and paid for the Non-U.S. motor non-proportional line were -signifi cantly lower than expectations in most countries. The Company did not materially change its loss development assumptions, but reduced loss ratio picks to refl ect the positive experience.
Agriculture: The aggregate losses reported during the year for U.S. and non-U.S. business were below the Company’s expectations, primarily for the 2007 underwriting year. The Company lowered its loss ratio picks, but did not otherwise materially alter its reserving assumptions.
Aviation/Space: The overall losses reported during the year were signifi cantly lower than the Company’s expectations for most underwriting years. The Company refl ected this experience by selecting faster development patterns and selecting lower loss ratios.
Catastrophe: Losses reported in this line are largely a function of the presence or absence of catastrophic events during the year. Losses reported in respect of prior year catastrophe events were lower than expectations. The Company reduced its reserves for the 2005 hurricane losses as a result of reduced concerns on litigation developments that may affect some of the Company’s cedants in the future and hence the claims reported to the Company. The Company also reduced its reserves for some smaller 2007 events.
Credit/Surety: The aggregate losses reported during the year were signifi cantly lower than expected. The Company refl ected this favorable experience by selecting lower loss ratios. However, the Company expects future reported losses to increase for non-U.S. credit/surety business, particularly for the 2007 underwriting year resulting from the worsening fi nancial conditions in 2008. Therefore, the Company increased its non-U.S. credit/surety 2007 a priori loss ratio and selected higher loss ratios for the 2007 underwriting year.
Engineering: The aggregate reported losses were modestly lower than expectations. The Company refl ected this experience by selecting lower loss ratios and selecting slightly faster development patterns.
Energy Onshore: Aggregate reported losses were slightly higher than expected, mostly due to underwriting year 2006. The Company did not materially change its reserving assumptions for this line but increased its loss ratio for the 2006 underwriting year.
Marine/Energy Offshore: The aggregate reported losses during the year were modestly lower than expected. The Company refl ected this favorable experience by reducing its loss ratio selections for underwriting years 2005 and prior.
521258_P021-101_MDA.indd 39521258_P021-101_MDA.indd 39 3/18/09 12:15:24 AM3/18/09 12:15:24 AM

PartnerRe Ltd.Management’s Discussion and Analysis of Financial Condition and Results of Operation
40 PartnerReAnnual Report 2008
As an example of the sensitivity of the Company’s reserves to reserving parameterassumptions, the tables below summarize, by reserving line, the effect on the Company’sreserves of higher/lower a priori loss ratio selections, higher/lower loss development factorsi
and higher/lower tail factors. The Company believes that the illustrated sensitivities to thereserving parameter assumptions are indicative of the potential variability inherent in theestimation process of those parameters.
Reserving lines selected assumptions
Highera priori
loss ratios
Higher lossdevelopment
factorsHigher tail
factors (*)
Lowera priori
loss ratios
Lower lossdevelopment
factorsLower tail
factors (*)
Property/Specialty Property 5 points 3 months 2% (5) points (3) months (2)%
Casualty/Specialty Casualty 10 6 10 (10) (6) (10)
Multiline 5 6 5 (5) (6) (5)
Motor — U.S. business 5 3 2 (5) (3) (2)
Motor — Non-U.S. Proportional business 5 3 2 (5) (3) (2)
Motor — Non-U.S. Non-proportional business 10 12 10 (10) (12) (10)
Agriculture 5 3 2 (5) (3) (2)
Aviation/Space 5 3 5 (5) (3) (5)
Catastrophe 5 3 2 (5) (3) (2)
Credit/Surety 5 3 2 (5) (3) (2)
Engineering 10 6 5 (10) (6) (5)
Energy Onshore 5 3 2 (5) (3) (2)
Marine/Energy Offshore 5 3 5 (5) (3) (5)
Reserving lines selected sensitivity(in million of U.S. dollars)
Higher a priori
loss ratios
Higher lossdevelopment
factorsHigher tail
factors (*)
Lowera priori
loss ratios
Lower lossdevelopment
factorsLower tail
factors (*)
Property/Specialty Property $ 30 $ 45 $ 5 $ (30) $ (35) $ (5 )
Casualty/Specialty Casualty 260 140 160 (255) (100) (165)
Multiline 10 30 30 (5) (10) (15)
Motor — U.S. business 5 10 10 (5) (5) (5)
Motor — Non-U.S. Proportional business 5 — — (5) — —
Motor — Non-U.S. Non-proportional business 25 45 50 (25) (40) (50)
Agriculture — 5 — — — —
Aviation/Space 5 30 15 (5) (15) (10)
Catastrophe — — — — — —
Credit/Surety 20 10 — (20) (5) (5)
Engineering 15 25 20 (15) (20) (10)
Energy Onshore — 5 — — (5) —
Marine/Energy Offshore 5 15 5 (5) (10) —(*) Tail factors are defi ned as aggregate development factors after 10 years from the inception of an underwriting year.
Some reserving lines show little sensitivity to a priori loss ratio, loss development factor or tail i
factor as the Company may use reserving methods such as the Expected Loss Ratio methodin several of its reserving cells within those lines. It is not appropriate to sum the total impactfor a specifi c factor or the total impact for a specifi c reserving line as the lines of businessare not perfectly correlated.
PRe AR08-Fin_MDA-03_20_09.indd 40PRe AR08-Fin_MDA-03_20_09.indd 40 3/24/09 9:16:12 AM3/24/09 9:16:12 AM

PartnerReAnnual Report 2008
41
PartnerRe Ltd.Management’s Discussion and Analysis of Financial Condition and Results of Operation
Case reserves are reported to the Company by its cedants, while ACRs and IBNR are estimated by the Company. The following table shows the gross reserves reported by cedants (case reserves), those estimated by the Company (ACRs and IBNR reserves) and the total net loss reserves recorded as of December 31, 2008 by reserving line for the Company’s Non-life operations (in millions of U.S. dollars):
Reserving lines Case reserves ACRsIBNR
reserves
Total grossloss reserves
recordedCeded loss
reserves
Total netloss reserves
recorded
Property/Specialty Property $ 457 $ — $ 291 $ 748 $ — $ 748
Casualty/Specialty Casualty 989 128 2,179 3,296 (48) 3,248
Multiline 76 18 129 223 (1) 222
Motor — U.S. business 46 2 60 108 — 108
Motor — Non-U.S. Proportional business 165 — 28 193 (18) 175
Motor — Non-U.S. Non-proportional business 414 8 447 869 (2) 867
Agriculture 9 2 237 248 — 248
Aviation/Space 217 3 165 385 (35) 350
Catastrophe 191 123 15 329 — 329
Credit/Surety 199 1 144 344 — 344
Engineering 180 2 163 345 (6) 339
Energy Onshore 58 12 55 125 — 125
Marine/Energy Offshore 106 12 140 258 (15) 243
Other 1 — 39 40 — 40
Total Non-life reserves $ 3,108 $ 311 $ 4,092 $ 7,511 $ (125) $ 7,386
The net loss reserves represent the Company’s best estimate of future losses and loss expense amounts. Loss reserves are estimates involving actuarial and statistical projections at a given time to refl ect the Company’s expectations of the costs of the ultimate settlement and administration of claims. Estimates of ultimate liabilities are contingent on many future events and the eventual outcome of these events may be different from the assumptions underlying the reserve estimates. In the event that the business environment and social trends diverge from historical trends, the Company may have to adjust its loss reserves to amounts falling signifi cantly outside its current estimate. Management believes that the recorded loss reserves represent its best estimate of future liabilities based on information available as of December 31, 2008. The estimates are continually reviewed and the ultimate liability may be in excess of, or less than, the amounts provided, for which any adjustments will be refl ected in the period in which the need for an adjustment is determined. The Company estimates its net loss reserves using single actuarial point estimates. Ranges around these actuarial point estimates are developed using stochastic simulations and techniques and provide an indication as to the degree of variability of the loss reserves. The Company interprets the ranges produced by these techniques as confi dence intervals around the Company’s best estimates for each Non-life sub-segment. However, due to the inherent volatility in the business written by the Company, there can be no guarantee that the fi nal settlement of the loss reserves will fall within these ranges.
521258_P021-101_MDA.indd 41521258_P021-101_MDA.indd 41 3/18/09 12:15:53 AM3/18/09 12:15:53 AM

PartnerRe Ltd.Management’s Discussion and Analysis of Financial Condition and Results of Operation
42 PartnerReAnnual Report 2008
The actuarial point estimates recorded by the Company, and the range of estimates around these point estimates at December 31, 2008 and 2007, were as follows for each Non-life sub-segment (in millions of U.S. dollars):
Recorded Point Estimate High Low
2008 Net Non-life segment loss reserves:
U.S. $ 2,778 $ 3,039 $ 2,166
Global (Non-U.S.) P&C 2,252 2,380 1,958
Global (Non-U.S.) Specialty 2,027 2,118 1,760
Catastrophe 329 350 296
2007 Net Non-life segment loss reserves:
U.S. $ 2,486 $ 2,764 $ 1,887
Global (Non-U.S.) P&C 2,498 2,637 2,150
Global (Non-U.S.) Specialty 1,829 1,923 1,577
Catastrophe 286 300 252
It is not appropriate to add together the ranges of each sub-segment in an effort to determine a high and low range around the Company’s total Non-life carried loss reserves.
The rapidly deteriorating fi nancial condition of the world economies in 2008, particularly in the fourth quarter of 2008, has increased the expectation of losses and increased the degree of uncertainty related to the range of possible ultimate liabilities for several classes of business that are potentially exposed to the effects of fi nancial stress. A signifi cant degree of judgment was used to estimate the range of potential losses and there is a considerable degree of uncertainty related to the range of possible ultimate liabilities.
Based on information currently available and the range of potential estimated ultimate liabilities, the Company believes that the unpaid loss and loss expense reserves for U.S. and Global (Non-U.S.) specialty casualty, Global (Non-U.S.) credit/surety, U.S. surety and other potentially exposed classes of business contemplate a reasonable provision for exposures related to the effect of increased fi nancial stress in the world economies. The Company is unaware of any specifi c issues that would materially affect its unpaid loss and loss expenses estimates related to this exposure. The Company’s unpaid losses and loss expenses reserves at December 31, 2008 for U.S. and Global (Non-U.S.) specialty casualty were $1,924 million, of which $1,010 million relates to the 2006, 2007 and 2008 underwriting years. The Company’s unpaid losses and loss expenses reserves at December 31, 2008 for Global (Non-U.S.) credit/surety and U.S. surety were $344 million, of which $232 million relates to the 2006, 2007, and 2008 underwriting years.
Included in the business that is considered to have a long reporting tail is the Company’s exposure to asbestos and environmental claims. The Company’s net unpaid losses and loss expenses reserves as of December 31, 2008 included $83 million that represents an estimate of its net ultimate liability for asbestos and environmental claims.
The majority of the net asbestos and environmental reserves as of December 31, 2008 relates to U.S. casualty exposures arising from business written by PartnerRe SA and PartnerRe U.S. prior to January 1, 1992 by certain companies which were at the time part of the AGF Group and are currently part of the Company’s subsidiaries. Ultimate loss estimates for such claims cannot be estimated using traditional reserving techniques and there are signifi cant uncertainties in estimating the amount of the Company’s potential losses for these claims. In view of the changes in the legal and tort environment that affect the development of such claims, the uncertainties inherent in estimating asbestos and environmental claims are not likely to be resolved in the near future. The Company actively evaluates potential exposure to asbestos and environmental claims and establishes additional reserves as
521258_P021-101_MDA.indd 42521258_P021-101_MDA.indd 42 3/18/09 12:16:08 AM3/18/09 12:16:08 AM

PartnerReAnnual Report 2008
43
PartnerRe Ltd.Management’s Discussion and Analysis of Financial Condition and Results of Operation
appropriate. The Company believes that it has made a reasonable provision for these exposures and is unaware of any specifi c issues that would materially affect its loss and loss expense estimates. (See Note 5 to Consolidated Financial Statements).
Life Policy Benefits
Policy benefi ts for life and annuity contracts relate to the business in the Company’s Life operations, which predominately includes reinsurance of longevity, subdivided into standard and non-standard annuities, and mortality business, which includes traditional death and disability covers (with various riders), term assurance and critical illness (TCI) written in the UK and Ireland, and guaranteed minimum death benefi t (GMDB) written in Continental Europe.
The Company categorizes life reserves into three types of reserves: reported outstanding loss reserves (case reserves), incurred but not reported (IBNR) reserves and reserves for future policy benefi ts. Case reserves represent unpaid losses reported by the Company’s cedants and recorded by the Company. IBNR reserves represent a provision for claims that have been incurred but not yet reported to the Company, as well as future loss development on losses already reported, in excess of the case reserves. Reserves for future policy benefi ts, which relate to future events occurring on policies in force over an extended period of time, are calculated as the present value of future expected benefi ts to be paid, reduced by the present value of future expected premiums. Such liabilities are established based on methods and underlying assumptions in accordance with U.S. GAAP and applicable actuarial standards. Principal assumptions used in the establishment of reserves for future policy benefi ts have been determined based upon information reported by ceding companies, supplemented by the Company’s actuarial estimates of mortality, critical illness, persistency and future investment income, with appropriate provision to refl ect uncertainty.
For the traditional life portfolio, case reserves, IBNR reserves and reserves for future policy benefi ts are mainly calculated at the treaty level. The Company updates its estimates for each of the aforementioned categories on a quarterly basis using information received from its cedants.
For the products that are covered by the long duration provisions of Financial Accounting Standards Board (FASB) Statement No. 60 “Accounting and Reporting by Insurance Enterprises” (SFAS 60), a reserve adequacy test is performed at least once a year based on the latest best estimate assumptions by line of business, including an experience analysis and a review of likely future experience. If such review produces reserves in excess of those currently held, then the locked-in assumptions will be revised and a loss recognized.
LongevityThe reserving methodology for the annuity portfolio of reinsurance contracts within the longevity book is in accordance with SFAS 60 as amended by SFAS No. 97, “Accounting and Reporting by Insurance Enterprises for Certain Long-Duration Contracts and for Realized Gains and Losses from the Sale of Investments” (SFAS 97). Many of these contracts subject the Company to risks arising from policyholder mortality over a period that extends beyond the periods in which premiums are collected. Annuity payments and expenses for policies within the annuity reinsurance portfolio are projected over the lifetime of the contract to calculate a net present value of future cash fl ows. Assumptions for each element (mortality, expenses and interest) are determined at the issue of the contract and are locked-in throughout the term of the contract unless a premium defi ciency exists. The assumptions are best estimate assumptions plus provisions for adverse deviations on the key risk elements (i.e., mortality and interest). Provisions for adverse deviation are designed to cover reasonable deviations from the best estimate outcome of the contract.
For standard annuities, the main risk is a faster increase in future life span than expected in the medium to long term. Non-standard annuities are annuities sold to people with aggravated health conditions and are usually medically underwritten on an individual basis.
521258_P021-101_MDA.indd 43521258_P021-101_MDA.indd 43 3/18/09 12:16:21 AM3/18/09 12:16:21 AM

PartnerRe Ltd.Management’s Discussion and Analysis of Financial Condition and Results of Operation
44 PartnerReAnnual Report 2008
The main risk in non-standard annuities is an inadequate assessment of the future life span of the people insured.
For the year ended December 31, 2008, the Company increased net prior year reserves by $2 million due to higher losses reported by cedants. For the year ended December 31, 2007, the Company increased net prior year reserves by $26 million, including $11 million of loss recognition as required by SFAS 60 for the impaired life annuity portfolio due to worse than expected loss development in the year and a change in assumptions used to value future policy benefi ts for the non-standard annuity business.
MortalityThe reserves for the short-term traditional mortality business are established in accordance with the short duration provisions of SFAS 60. They consist of case reserves and IBNR, calculated at the treaty level based upon cedant information and use the Expected Loss Ratio method, described in the Losses and Loss Expenses section above. Given the very short-term loss development of this portion of the portfolio, this method is appropriate.
The reserves for the long-term traditional mortality and TCI reinsurance portfolio are established in accordance with the long duration provisions of SFAS 60. Assumptions for each element (mortality, critical illness, lapses, expenses and interest) are determined at the issue of the contract and are locked-in throughout the term of the contract unless a premium defi ciency exists. The assumptions are best estimate assumptions plus provisions for adverse deviations on the key risk elements (i.e. mortality, critical illness, lapses and interest).
The reserves for the GMDB reinsurance business are established in accordance with the universal life provisions of SFAS 97. Key assumptions for this business are mortality, lapses, interest rates, credit spreads and stock market performance. For the last parameter, a stochastic option pricing approach is used and the benefi ts used in calculating the liabilities are based on the average benefi ts payable over a range of scenarios. The assumptions of investment performance and volatility are consistent with the historical experience of the respective underlying funds (correlated to the EuroStoxx50 or the CAC 40 Index). The Company regularly evaluates the assumptions used and adjusts them if actual experience or other evidence suggests that the earlier assumptions should be revised.
For the year ended December 31, 2008, the Company increased net prior year reserves by $22 million. The reserve increase predominately resulted from the impact of unfavorable fi nancial markets impacts on the GMDB portfolio. With regard to the GMDB portfolio, increases in credit spreads resulted in a $15 million increase in future policy benefi ts on the structured products, and signifi cant declines in equity markets resulted in an $18 million increase in future policy benefi ts on the equity linked products. The long-term and TCI business experienced worse than expected loss development in the year, resulting in a prior year reserve increase of $4 million. The short-term business experienced loss development that was better than expected, resulting in a favorable prior year reserve development of $15 million, which partially offset the deterioration in the GMDB portfolio. For the year ended December 31, 2007, the Company decreased net prior year reserves by $24 million, predominately due to favorable reserve development on long and short-term traditional mortality products and TCI.
521258_P021-101_MDA.indd 44521258_P021-101_MDA.indd 44 3/18/09 12:16:34 AM3/18/09 12:16:34 AM

PartnerReAnnual Report 2008
45
PartnerRe Ltd.Management’s Discussion and Analysis of Financial Condition and Results of Operation
The following table provides the gross and net reserves for the Company’s life reinsurancebook at December 31, 2008 (in millions of U.S. dollars):
Reserving lines Case reservesIBNR
reserves
Reserves forfuture policy
benefi ts
Total Lifereservesrecorded
Longevity $ 1 $ 49 $ 513 $ 563
Mortality 134 367 368 869
Total gross reserves 135 416 881 1,432
Ceded reserves (11) (7) (6) (24)
Total net reserves $ 124 $ 409 $ 875 $ 1,408
Included in the total reserves for future policy benefi ts at December 31, 2008 was$51 million of provisions for adverse deviation.
As an example of the sensitivity of the Company’s policy benefi ts for life and annuitycontracts to reserving parameter assumptions, the table below summarizes, by reserving line,the effect of different assumption selections.
Reserving lines Factors Change
Impact ontotal Lifereserves
(in millions ofU.S. dollars)
Longevity
Impaired life annuity Life expectancy + 1 year $ 25
Other annuitiesMortality improvements
per annum + 1% 19
Mortality
Long-term and TCI Mortality + 1% 23
GMDB Stock market performance - 10% 10
It is not appropriate to sum the total impact for a specifi c reserving line or the total impact for a specifi c factor because the reinsurance portfolios are not perfectly correlated.
Premiums and Acquisition CostsThe Company provides proportional and non-proportional reinsurance coverage to cedants(insurance companies). In most cases, cedants seek protection for business that they havenot yet written at the time they enter into reinsurance agreements and thus have to estimatethe volume of premiums they will cede to the Company. Reporting delays are inherent in thereinsurance industry and vary in length by reinsurance market (country of cedant) and typeof treaty. As delays can vary from a few weeks to a year or sometimes longer, the Companyproduces accounting estimates to report premiums and acquisition costs until it receives thecedants’ actual results. Approximately, 45%, 44% and 44% of the Company’s reported netpremiums written for 2008, 2007 and 2006, respectively, were based upon estimates.
Under proportional treaties, which represented 71% of gross premiums written for the yearDecember 31, 2008, the Company shares proportionally in both the premiums and losses ofthe cedant and pays the cedant a commission to cover the cedant’s acquisition costs. Underthis type of treaty, the Company’s ultimate premiums written and earned and acquisitioncosts are not known at the inception of the treaty and must be estimated until the cedantreports its actual results to the Company. Under non-proportional treaties, which represented29% of gross premiums written for the year December 31, 2008, the Company is typicallyexposed to loss events in excess of a predetermined dollar amount or loss ratio and receivesa fi xed or minimum premium, which is subject to upward adjustment depending on thepremium volume written by the cedant.
521258_P021-101_MDA.indd 45521258_P021-101_MDA.indd 45 3/24/09 8:59:18 AM3/24/09 8:59:18 AM

PartnerRe Ltd.Management’s Discussion and Analysis of Financial Condition and Results of Operation
46 PartnerReAnnual Report 2008
Reported premiums written and earned and acquisition costs on proportional treaties are generally based upon reports received from cedants and brokers, supplemented by the Company’s own estimates of premiums written and acquisition costs for which ceding company reports have not been received. Premium and acquisition cost estimates are determined at the individual treaty level. The determination of estimates requires a review of the Company’s experience with cedants, familiarity with each geographic market, a thorough understanding of the individual characteristics of each line of business and the ability to project the impact of current economic indicators on the volume of business written and ceded by the Company’s cedants. Estimates for premiums and acquisition costs are updated continuously as new information is received from the cedants. Differences between such estimates and actual amounts are recorded in the period in which estimates are changed or the actual amounts are determined.
The magnitude and impact of a change in premium estimate differs for proportional and non-proportional treaties. Non-proportional treaties generally include a fi xed minimum premium and an adjustment premium, which is generally less than 5% of the fi xed minimum premium. While fi xed minimum premiums require no estimation, adjustment premiums are estimated and could be subject to changes in estimates. Although proportional treaties may be subject to larger changes in premium estimates, as the Company generally receives cedant statements in arrears and must estimate all premiums for periods ranging from one month to more than one year (depending on the frequency of cedant statements), the pre-tax impact is mitigated by changes in the cedant’s related reported acquisition costs and losses. The impact of the change in estimate on premiums earned and pre-tax results varies depending on when the change becomes known during the risk period and the underlying profi tability of the treaty. For the year ended December 31, 2008, the Company recorded reductions of $15 million and $1 million in net premiums written and net premiums earned, respectively, related to changes in Non-life premium estimates of prior year reported premiums. These reductions, after the corresponding adjustments to acquisition costs and losses and loss expenses, had no material impact on consolidated pre-tax income. However, these adjustments for the year ended December 31, 2008 are the result of offsetting impacts in the Company’s Non-life sub-segments. The Company’s U.S., Global (Non-U.S.) P&C and Catastrophe sub-segments reported combined decreases in net premiums written and net premiums earned of $102 million and $64 million, respectively, which were partially offset by the Global (Non-U.S.) Specialty sub-segment, which reported increases in net premiums written and net premiums earned of $87 million and $63 million, respectively.
A 5% increase (decrease) in net premium written estimates and the corresponding acquisition costs for all of the Company’s Non-life non-proportional treaties would increase (decrease) the 2008 pre-tax income by approximately $21 million, assuming the changes become known at the mid-point of the risk period.
For proportional treaties, the impact of a change in net premium written estimates on pre-tax income varies depending on the losses and loss expenses and acquisition costs of the treaty affected by the change. For example, a 5% increase (decrease) in net premiums written and the corresponding acquisition costs and losses in 2008 across all Non-life proportional treaties would increase (decrease) pre-tax income by approximately $7 million, applying the 2008 reported technical ratio and assuming that the changes become known at the mid-point of the risk period.
A 1% increase (decrease) in acquisition costs for all of the Company’s Non-life treaties (both proportional and non-proportional) for the year ended December 31, 2008, would decrease (increase) pre-tax income by approximately $4 million, assuming no change in premium estimates and that the changes become known at the mid-point of the risk period.
521258_P021-101_MDA.indd 46521258_P021-101_MDA.indd 46 3/18/09 12:17:00 AM3/18/09 12:17:00 AM

PartnerReAnnual Report 2008
47
PartnerRe Ltd.Management’s Discussion and Analysis of Financial Condition and Results of Operation
Acquisition costs, primarily brokerage fees, commissions and excise taxes, which vary directlywith, and are primarily related to, the acquisition of reinsurance contracts, are capitalizedand charged to expense as the related premium is earned. The recovery of deferred policyacquisition costs is dependent upon the future profi tability of the related business. Deferredpolicy acquisition costs recoverability testing is performed at least once a year together with the reserve adequacy test, based on the latest best estimate assumptions by line of business.
Income TaxesFASB Statement No. 109 “Accounting for Income Taxes” (SFAS 109) provides that adeferred tax asset or liability is to be recognized for the estimated future tax effectsattributable to temporary differences and carryforwards. SFAS 109 also establishesprocedures to assess whether a valuation allowance should be established for deferred taxassets. All available evidence, both positive and negative, is considered to determine whether,based on the weight of that evidence, a valuation allowance is needed for some portion orall of a deferred tax asset. Management must use its judgment in considering the relativeimpact of positive and negative evidence. The Company also establishes tax liabilitiesrelating to uncertain tax positions as defi ned in FASB Interpretation No. 48, “Accounting forUncertainty in Income Taxes – an interpretation of FASB Statement No. 109” (FIN 48).See Note 2(i) and Note 7 to Consolidated Financial Statements.
The Company has estimated the future tax effects attributed to temporary differencesand has a deferred tax asset at December 31, 2008 of $192 million. The most signifi cantcomponents of the deferred tax asset relate to loss reserve discounting for tax purposesin the United States and operating tax loss carryforwards in Ireland. At December 31, 2008,the deferred tax asset relating to the Irish tax loss carryforward was $27 million, and issubject to an indefi nite carryforward period.
The Company has projected future taxable income in the tax jurisdictions in which thedeferred tax assets arise. These projections are based on Management’s projectionsof premium and investment income, and technical and expense ratios. Based on theseprojections, Management evaluates the need for a valuation allowance. The Company didnot have any valuation allowance at December 31, 2008 or 2007. A 10% reduction in thedeferred tax asset of $192 million as of December 31, 2008 would result in a $19 millioncharge to net income and a corresponding reduction in total assets.
The deferred tax liabilities as of December 31, 2008 were $105 million. In accordance withSFAS 109, the Company has assumed that the future reversal of deferred tax liabilitieswill result in an increase in taxes payable in future years. Underlying this assumption isan expectation that the Company will continue to be subject to taxation in the various taxjurisdictions and that the Company will continue to generate taxable revenues in excess ofdeductions. A 10% increase in the deferred tax liability as of December 31, 2008 wouldresult in a $11 million charge to net income and a corresponding increase in total liabilities.
The Company’s unrecognized tax benefi t related to FIN 48 was a liability of $40 millionat December 31, 2008. A 10% increase in the unrecognized tax benefi t as of December 31,2008 would result in a $4 million charge to net income and a corresponding increase intotal liabilities.
Valuation of Investments, including certain derivative financial instrumentsThe Company adopted FASB Statement No. 157, “Fair Value Measurements” (SFAS 157)on January 1, 2008. Fair value is the price received to sell an asset or paid to transfer aliability in an orderly transaction between market participants at the measurement date. TheCompany measures the fair value of fi nancial instruments according to a fair value hierarchythat prioritizes the information used to measure fair value into three broad levels.
PRe AR08-Fin_MDA-03_20_09.indd 47PRe AR08-Fin_MDA-03_20_09.indd 47 3/23/09 9:55:28 AM3/23/09 9:55:28 AM

PartnerRe Ltd.Management’s Discussion and Analysis of Financial Condition and Results of Operation
48 PartnerReAnnual Report 2008
The SFAS 157 fair value hierarchy prioritizes the inputs to valuation techniques used to measure fair value by maximizing the use of observable inputs and minimizing the use of unobservable inputs by requiring that the most observable inputs be used when available. Observable inputs are inputs that market participants would use in pricing an asset or liability based on market data obtained from sources independent of the Company. Unobservable inputs are inputs that refl ect the Company’s assumptions about what market participants would use in pricing the asset or liability based on the best information available in the circumstances. The level in the hierarchy within which a given fair value measurement falls is determined based on the lowest level input that is signifi cant to the measurement.
The Company must determine the appropriate level in the hierarchy for each fi nancial instrument that it measures at fair value. In determining fair value, the Company uses various valuation approaches, including market, income and cost approaches. See Note 3 to Consolidated Financial Statements for more detail on the valuation techniques, methods and assumptions that were used by the Company to estimate the fair value of its fi xed maturities and short-term investments, equities and other invested assets. See Note 17 to Consolidated Financial Statements for more discussion of the Company’s use of derivative fi nancial instruments.
The Company records all of its fi xed maturity and equity investments and certain other invested assets, including derivative fi nancial instruments, at fair value in its Consolidated Balance Sheets. The changes in fair value of all of the Company’s investments carried at fair value are recorded in net realized and unrealized investment gains and losses in the Consolidated Statements of Operations and are included in the determination of net income in the period in which they are recorded.
Under the SFAS 157 hierarchy, Management uses certain assumptions and judgments to derive the fair value of its investments, particularly for those assets with signifi cant unobservable inputs, commonly referred to as Level 3 assets. At December 31, 2008, the Company had $96 million of Level 3 assets, including fi xed maturities ($78 million), equities ($34 million) and other invested assets (negative $16 million, mainly refl ecting fair value adjustments on derivatives). For the fi xed maturities and equities, a 10% decline in the fair value of these investments would result in an $11 million pre-tax charge to income and a corresponding reduction in investments and total assets.
Included in other invested assets, the Company has various loans receivable totaling $26 million at December 31, 2008. In addition, included in the Company’s other invested assets are entities which are accounted for using the equity method and investments for which the Company uses investment company accounting, totaling $92 million at December 31, 2008. The Company does not measure its investments that are accounted for using the equity method of accounting or investment company accounting at fair value. For loans receivable and investments that are accounted for using the equity method of accounting and investment company accounting, a 10% decline in the carrying value of these investments would result in a $12 million pre-tax charge to income and a corresponding reduction in investments and total assets.
The Company utilizes derivatives for a variety of purposes, as discussed in Note 17 to Consolidated Financial Statements. The Company’s derivatives are carried at fair value, which is based on quoted market prices, or internal valuation models where quoted market prices are not available.
The Company has entered into non-traded weather derivatives and total return and interest rate swaps. Included in the Level 3 other invested assets are weather derivatives from the Company’s insurance-linked securities unit with unrealized losses of $5 million on a notional
521258_P021-101_MDA.indd 48521258_P021-101_MDA.indd 48 3/18/09 12:17:25 AM3/18/09 12:17:25 AM

PartnerReAnnual Report 2008
49
PartnerRe Ltd.Management’s Discussion and Analysis of Financial Condition and Results of Operation
exposure of $60 million, and the principal fi nance unit, with unrealized losses on its total return swap portfolio of $25 million on notional exposure of $240 million, and unrealized losses on its interest rate swap portfolio of $12 million.
In aggregate, the Company is not signifi cantly exposed to changes in the valuation of its total return and interest rate swap portfolio due to changes in the general level of interest rates. However, at December 31, 2008, the Company estimated that a 100 basis point increase or decrease in all risk spread assumptions used in the Company’s internal valuation models would result in a $5 million decrease or a $6 million increase, respectively, in the fair value of its total return and interest rate swap portfolio.
The Company is exposed to changes in the expected amount of future cash fl ows of the reference assets in its total return swap portfolio. The Company’s total return swap portfolio references many different underlying assets with a number of risk factors. At December 31, 2008, the notional value of the total return swap portfolio was $240 million and the fair value of the assets underlying the total return swap portfolio was $215 million. The Company estimated that each 1% increase or decrease in the amount of all expected future cash fl ows related to the reference assets would result in a $2 million increase or decrease, respectively, in the fair value of its total return swap portfolio.
GoodwillFASB Statement No. 142, “Goodwill and Other Intangible Assets” (SFAS 142) requires that the Company make an annual assessment as to whether the value of the Company’s goodwill asset is impaired. Impairment, which can be either partial or full, is based on a fair value analysis by individual reporting unit. Based upon the Company’s assessment at the reporting unit level, there was no impairment of its goodwill asset of $430 million as of December 31, 2008.
In making an assessment of the value of its goodwill, the Company uses both market based and non-market based valuations. Assumptions underlying these valuations include an analysis of the Company’s stock price relative to both its book value and its net income in addition to forecasts of future cash fl ows and future profi ts. Signifi cant changes in the data underlying these assumptions could result in an assessment of impairment of the Company’s goodwill asset. In addition, if the current economic environment and/or the Company’s fi nancial performance were to deteriorate signifi cantly, this could lead to an impairment of goodwill, the write-off of which would be recorded against net income in the period such deterioration occurred. If a 5% decline in the fair value of the reporting units occurred, this would not result in an impairment of the goodwill asset at December 31, 2008.
Results of OperationsThe following discussion of Results of Operations contains forward-looking statements based upon assumptions and expectations concerning the potential effect of future events that are subject to uncertainties. See Item 1A of Part I of the Company’s report on Form 10-K for a complete list of the Company’s risk factors. Any of these risk factors could cause actual results to differ materially from those refl ected in such forward-looking statements.
The Company’s reporting currency is the U.S dollar. The Company’s subsidiaries and branches have one of the following functional currencies: U.S. dollar, euro or Canadian dollar. As a signifi cant portion of the Company’s operations is transacted in foreign currencies, fl uctuations in foreign exchange rates may affect year over year comparisons. To the extent that fl uctuations in foreign exchange rates affect comparisons, their impact has been quantifi ed, when possible, and discussed in each of the relevant sections. See Note 2(j) to Consolidated Financial Statements for a discussion on translation of foreign currencies.
521258_P021-101_MDA.indd 49521258_P021-101_MDA.indd 49 3/18/09 12:17:39 AM3/18/09 12:17:39 AM

PartnerRe Ltd.Management’s Discussion and Analysis of Financial Condition and Results of Operation
50 PartnerReAnnual Report 2008
The foreign exchange fl uctuations for the principal currencies in which the Company transacts business were as follows:
the U.S. dollar average exchange rate was weaker against most currencies, except the -British pound, in 2008 compared to 2007 and was weaker against most currencies, except the Japanese yen, in 2007 compared to 2006; the U.S. dollar strengthened against the British pound, euro and Canadian dollar and -weakened against the Swiss franc and Japanese yen at December 31, 2008 compared to December 31, 2007.
OverviewThe Company measures its performance in several ways. Among the performance measures accepted under U.S. GAAP is diluted net income per share, a measure that focuses on the return provided to the Company’s common shareholders. Diluted net income per share is obtained by dividing net income available to common shareholders by the weighted average number of common and common share equivalents outstanding. Net income available to common shareholders is defi ned as net income less preferred dividends.
As the Company’s reinsurance operations are exposed to low-frequency high-severity risk events, some of which are seasonal, results for certain years may include unusually low loss experience, while results for other years may include signifi cant catastrophic losses. For example, the Company’s results for 2008 and 2007 included losses from large catastrophic events, while 2006 included no signifi cant catastrophic loss. To the extent that losses related to large catastrophic events affect the year over year comparison of the Company’s results, their impact has been quantifi ed and discussed in each of the relevant sections.
In 2008, the Company incurred losses of $305 million, net of reinstatement premiums, related to Hurricane Ike compared to $50 million, net of reinstatement premiums, relating to European windstorm Kyrill in 2007. The Company’s actual losses from Hurricane Ike may exceed the estimated losses as a result of, among other things, an increase in industry incurred loss estimates and the receipt of additional information from cedants, brokers and loss adjusters.
The following table refl ects the components of the Company’s incurred losses of $305 million, net of reinstatement premiums, related to Hurricane Ike and the impact on the Company’s segments and sub-segments during the year ended December 31, 2008 (in millions of U.S. dollars):
U.S.
Global(Non-U.S.)
P&C
Global(Non-U.S.)Specialty Catastrophe
TotalNon-life
SegmentLife
SegmentCorporateand Other Total
Losses and loss expenses $ (67) $ — $ (67) $ (183) $ (317) $ — $ (15) $ (332)
Reinstatement or additional premiums earned 9 — 3 20 32 — 2 34
Impact on technical result $ (58) $ — $ (64) $ (163) $ (285) $ — $ (13) $ (298)
Realized investment losses — — (5) (5)
Other loss (2) — — (2)
Impact on pre-tax income $ (287) $ — $ (18) $ (305)
The Company adopted SFAS 159 on January 1, 2008. Prior to the adoption of SFAS 159, unrealized gains and losses, net of tax, on available for sale securities were recorded as a component of accumulated other comprehensive income in the Consolidated Balance Sheets. Following the adoption of SFAS 159, the Company’s available for sale securities have been reclassifi ed as trading securities and all changes in pre-tax unrealized gains and losses are recorded in net realized and unrealized investment losses in the Consolidated Statement of Operations.
521258_P021-101_MDA.indd 50521258_P021-101_MDA.indd 50 3/18/09 12:17:53 AM3/18/09 12:17:53 AM

PartnerReAnnual Report 2008
51
PartnerRe Ltd.Management’s Discussion and Analysis of Financial Condition and Results of Operation
During the second half of 2008, the world’s fi nancial markets experienced unprecedented events and severe dislocation, which led to the U.S. government approving a $700 billion package to provide increased liquidity to eligible fi nancial institutions. The concerns spread to Europe and Asia, as there was a growing recognition that the problems were not contained in the U.S., and other governments provided similar bail-out packages to support their economies. Interest rates decreased, credit spreads widened, equity markets declined and the U.S. dollar strengthened against most currencies.
While the Company has a high-quality, well balanced and liquid investment portfolio, it has been impacted by macro events in the economy and fi nancial markets. The Company’s fi nancial position and results of operations include a decline in the fair value of its investment portfolio, and the related increase in the level of unrealized losses on investments, which, following the adoption of SFAS 159 are recorded in net income, and a decline in the currency translation account given the strengthening of the U.S. dollar against other major currencies at December 31, 2008.
The impacts of the global fi nancial and economic crisis are wide-ranging and have also affected the Company’s reinsurance operations. Accordingly, the Company has revised its loss estimates and increased its prior year reserves in certain lines of business for the 2006, 2007 and 2008 underwriting years, where increased reported claims are anticipated, given deteriorating economic and credit conditions. The Company’s loss reserves related to the impacted lines of business represent Management’s best estimate of the cost to settle the ultimate liabilities related to these events based on information available at December 31, 2008.
These factors are discussed below in Review of Net Income, Results by Segment and Financial Condition, Liquidity and Capital Resources. These events and continuing disruptions, uncertainty or volatility in the capital or credit markets may continue to affect our results of operations and fi nancial condition in the future.
Net income, preferred dividends, net income available to common shareholders and diluted net income per share for the years ended December 31, 2008, 2007 and 2006 were as follows (in millions of U.S. dollars, except per share data):
2008 2007 2006
Net income $ 47 $ 718 $ 749
Less: preferred dividends 35 35 34
Net income available to common shareholders $ 12 $ 683 $ 715
Diluted net income per share $ 0.22 $ 11.87 $ 12.37
The decline in net income, net income available to common shareholders and diluted net income per share for 2008 compared to 2007 resulted primarily from an increase in net realized and unrealized investment losses of $459 million, an increase of $255 million in large catastrophic losses relating to Hurricane Ike in 2008 compared to European windstorm Kyrill in 2007, and higher mid-sized losses and loss estimates on certain lines of business, and was partially offset by a decrease in losses from the Company’s interest in the results of equity investments, a lower tax charge and higher net investment income in 2008 compared to 2007. These items are discussed in the Review of Net Income.
Net income, net income available to common shareholders and diluted net income per share for 2007 decreased compared to 2006, primarily as a result of higher net realized investment losses, losses from the Company’s interest in the results of equity investments and other losses from the Company’s principal fi nance line, which were partially offset by an increase in the Non-life underwriting result, higher net investment income and a lower income tax expense in 2007 compared to 2006.
521258_P021-101_MDA.indd 51521258_P021-101_MDA.indd 51 3/18/09 12:18:06 AM3/18/09 12:18:06 AM

PartnerRe Ltd.Management’s Discussion and Analysis of Financial Condition and Results of Operation
52 PartnerReAnnual Report 2008
Review of Net IncomeManagement analyzes the Company’s net income in three parts: underwriting result, investment result and other components of net income. Underwriting result consists of net premiums earned and other income or loss less losses and loss expenses and life policy benefi ts, acquisition costs and other operating expenses. Net investment income includes interest and dividends, net of investment expenses, generated by the Company’s investment portfolio, as well as interest income generated on funds held. Net realized and unrealized investment gains and losses include sales of the Company’s fi xed income, equity and other invested assets, changes in net unrealized gains and losses in 2008 and other-than-temporary impairment charges in 2007 and 2006. Interest in earnings or losses of equity investments includes the Company’s strategic investments, including ChannelRe Holdings. Other components of net income include other income or loss, other operating expenses, interest expense, net foreign exchange gains and losses and income tax expense.
The components of net income for the years ended December 31, 2008, 2007 and 2006 were as follows (in millions of U.S. dollars):
2008
% Change2008 over
2007 2007
% Change2007 over
2006 2006
Underwriting result:
Non-life $ 199 (69)% $ 635 27% $ 499
Life (50) 54 (33) 44 (22)
Investment result:
Net investment income 573 9 523 16 449
Net realized and unrealized investment (losses) gains (531) 633 (72) NM 47
Interest in (losses) earnings of equity investments (5) (93) (83) NM 12
Corporate and Other:
Technical result 1 (59) 3 NM —
Other income (loss) 6 NM (24) NM 19
Other operating expenses (91) 14 (80) 6 (75)
Interest expense (51) (5) (54) (12) (61)
Net foreign exchange gains (losses) 6 NM (15) (33) (24)
Income tax expense (10) (88) (82) (14) (95)
Net income $ 47 (94) $ 718 (4) $ 749
NM: not meaningful
Underwriting result is a key measurement that the Company uses to manage and evaluate its Non-life and Life segments, as it is a primary measure of underlying profi tability for the Company’s core reinsurance operations, separate from the investment results. The Company believes that in order to enhance the understanding of its profi tability, it is useful for investors to evaluate the components of net income separately and in the aggregate. Underwriting result should not be considered a substitute for net income and does not refl ect the overall profi tability of the business, which is also impacted by investment results and other items.
2008 over 2007
The underwriting result for the Non-life segment decreased by $436 million, from $635 million in 2007 to $199 million in 2008. The decrease was principally attributable to:
an increase in large catastrophic losses of $237 million, net of reinstatement premiums, -relating to Hurricane Ike in 2008 compared to European windstorm Kyrill in 2007; a decrease of approximately $186 million resulting primarily from higher loss estimates for -the 2007 and 2008 underwriting years in certain lines of business refl ecting deteriorating economic and credit conditions, and also a higher frequency of mid-sized losses and
521258_P021-101_MDA.indd 52521258_P021-101_MDA.indd 52 3/18/09 12:18:20 AM3/18/09 12:18:20 AM

PartnerReAnnual Report 2008
53
PartnerRe Ltd.Management’s Discussion and Analysis of Financial Condition and Results of Operation
normal fl uctuations in profi tability between periods generally, given the softening marketconditions; and an increase of $17 million in other operating expenses; partially offset by- an increase of $4 million in net favorable development on prior accident years, from-$414 million in 2007 to $418 million in 2008. The components of the net favorable loss development are described in more detail in the discussion of individual sub-segments inResults by Segment below.
Underwriting result for the Life segment decreased from a loss of $33 million in 2007 toa loss of $50 million in 2008, primarily due to higher operating expenses of $10 millionand a decrease of $7 million in the technical result. The decrease of $7 million in thetechnical result was driven by an increase in net adverse prior year reserve development of$22 million refl ecting charges in our GMDB line due to adverse capital market conditions.This was partially offset by a change in the mix of business to the mortality line and normalfl uctuations in profi tability between periods. See Results by Segment below for more details.
The Company reported net investment income of $573 million in 2008 compared to$523 million in 2007. The 9% increase in net investment income is primarily attributable tothe increase in the asset base resulting from the investment of the Company’s signifi cantcash fl ows from operations and from higher reinvestment rates on fi xed maturity bonds,on average, during 2008. Higher average foreign exchange rates also contributed 2% ofthe increase as a result of the weakening of the U.S. dollar, on average, in 2008 comparedto 2007.
Net realized and unrealized investment losses increased by $459 million, from a loss of$72 million in 2007 to a loss of $531 million in 2008. The increase in net realized andunrealized investment losses in 2008 was mainly due to increases in credit spreads,declines in worldwide equity markets and defaults on certain corporate bonds, which werepartially offset by decreases in U.S. and European risk-free interest rates. Net realized andunrealized investment losses of $531 million in 2008 were primarily due to net realizedlosses on equities of $230 million, change in net unrealized losses on fi xed maturities of$151 million, change in net unrealized losses on equities of $145 million, and net realizedlosses on fi xed maturities of $16 million, partially offset by other net realized and unrealizedgains of $11 million. The unrealized investment losses refl ect the Company’s adoption ofSFAS 159, which was effective January 1, 2008. Thus, the results of 2008 and 2007 arenot comparable. See Net Realized and Unrealized Investment (Losses) Gains below for moredetails on the net realized and unrealized loss activity.
Interest in the results of equity investments increased from a loss of $83 million in 2007 toa loss of $5 million in 2008. The loss recorded in the 2007 period was due to a $93 millioncharge related to the Company’s investment in ChannelRe Holdings. As this investment isfully written off, no similar charge was recorded in the 2008 period. See the discussion in Corporate and Other below for more details.
Technical result and other income (loss) in Corporate and Other relate to principal fi nancetransactions and insurance-linked securities. The decrease in the technical result fromincome of $3 million in 2007 to income of $1 million in 2008 is primarily related to largecatastrophic losses from Hurricane Ike of $13 million, net of reinstatement premiums, in the insurance-linked securities line in 2008, which is partially offset by higher net premiumsearned in 2008 compared to 2007. Other income (loss) increased from a loss of $24 millionin 2007 to income of $6 million in 2008. The 2007 period refl ected write-downs andmark-to-market adjustments on various transactions in the principal fi nance line. See thediscussion in Corporate and Other below.
PRe AR08-Fin_MDA-03_20_09.indd 53PRe AR08-Fin_MDA-03_20_09.indd 53 3/23/09 10:15:40 AM3/23/09 10:15:40 AM

PartnerRe Ltd.Management’s Discussion and Analysis of Financial Condition and Results of Operation
54 PartnerReAnnual Report 2008
Other operating expenses included in Corporate and Other increased by $11 million from $80 million in 2007 to $91 million in 2008. The increase was primarily due to an increase in personnel costs, including stock-based compensation expense.
Interest expense decreased by $3 million, from $54 million in 2007 to $51 million in 2008 mainly due to lower interest expense on the Company’s $400 million fl oating-rate long-term debt, partially offset by a make-whole payment of $3 million incurred in 2008 related to the early retirement of the Company’s $220 million bank loan.
Net foreign exchange gains were $6 million in 2008 compared to losses of $15 million in 2007. The Company hedges a signifi cant portion of its currency risk exposure, as discussed in Quantitative and Qualitative Disclosures about Market Risk. The net foreign exchange gains in 2008 were mainly a result of lower forward points paid, which refl ect the interest rate differential between currencies bought and sold against the U.S. dollar and euro, and changes in the Company’s net U.S. dollar assets in its subsidiaries whose functional currency is other than the U.S. dollar, partially offset by the impact of the currency movements on unhedged securities against the functional currencies of the Company’s subsidiaries or branches.
Income tax expense decreased by $72 million, from $82 million in 2007 to $10 million in 2008 refl ecting lower pre-tax results. The income tax expense of $10 million in 2008 was primarily due to a non-recurring tax charge of approximately $46 million resulting from asset transfers between various subsidiaries and branches relating to the Company’s European reorganization on January 1, 2008, and an increase in the FIN 48 liability for unrecognized tax benefi ts, and was partially offset by a tax benefi t associated with the net realized and unrealized losses on investments and other tax benefi ts associated with favorable foreign exchange revaluations.
2007 over 2006
The underwriting result for the Non-life segment increased by $136 million, from $499 million in 2006 to $635 million in 2007. The increase was principally attributable to:
an increase of $162 million in net favorable development on prior accident year losses, -from $252 million in 2006 to $414 million in 2007; and an increase in the volume of premiums earned of $31 million and normal fl uctuations in -profi tability between periods of approximately $1 million; partially offset by an increase in the level of large catastrophic losses of $50 million, net of reinstatement -premiums, relating to European windstorm Kyrill in 2007; and an increase in other operating expenses of $8 million. -
The components of the net favorable loss development are described in more detail in the discussion of individual sub-segments in the next section.
Underwriting result for the Life segment decreased from a loss of $22 million in 2006 to a loss of $33 million in 2007, primarily due to a decrease of $14 million in net prior year reserve development in 2007 compared to 2006, and higher operating expenses, partially offset by an increase in profi tability in the mortality line.
The Company reported net investment income of $523 million in 2007 compared to $449 million in 2006. The 16% increase in net investment income was primarily attributable to the increase in the asset base resulting from the investment of the Company’s signifi cant cash fl ows from operations, which totaled $1,227 million in 2007 and from higher reinvestment rates during 2007. Changes in average foreign exchange rates contributed 3% of the increase as a result of the weakening of the U.S. dollar, on average, in 2007 compared 2006.
Net realized investment (losses) gains decreased by $119 million, from a gain of $47 million in 2006 to a loss of $72 million in 2007, mainly due to an increase in other-than-temporary
521258_P021-101_MDA.indd 54521258_P021-101_MDA.indd 54 3/18/09 12:18:47 AM3/18/09 12:18:47 AM

PartnerReAnnual Report 2008
55
PartnerRe Ltd.Management’s Discussion and Analysis of Financial Condition and Results of Operation
impairment charges of $98 million in 2007 over 2006. Realized investment gains and losses are generally a function of multiple factors, with the most signifi cant being the prevailing interest rates and equity market conditions, the timing of disposition of fi xed maturities and equity securities, and charges for the recognition of other-than-temporary impairments in the Company’s investment portfolio. The other-than-temporary impairment charges were primarily due to the increase in interest rates and to equity securities with large unrealized loss positions that were written down. See Net Realized and Unrealized Investment (Losses) Gains for more details on the realized gain and loss activity.
Interest in the results of equity investments decreased from income of $12 million in 2006 to a loss of $83 million in 2007, primarily due to the write-down of the Company’s investment in ChannelRe Holdings due to unrealized mark-to-market losses of Channel Reinsurance’s credit derivative portfolio. See the discussion in Corporate and Other below.
The increase of $3 million in the technical result for 2007 compared to 2006 resulted primarily from the insurance-linked securities line. The decrease of $43 million in other (loss) income in 2007 compared to 2006 was primarily attributable to a decrease of $35 million from the principal fi nance line due to write-downs and mark-to-market adjustments on various transactions in 2007, while 2006 benefi ted from accelerated profi t recognition on the early termination of a number of long term contracts. See the discussion in Corporate and Other below.
Other operating expenses included in Corporate and Other increased by $5 million, primarily due to an increase in personnel costs and increases in consulting and professional fees.
Interest expense decreased by $7 million in 2007 compared to 2006, primarily due to an expense of $6 million incurred in December 2006 upon the redemption of the Company’s trust preferred securities, representing the unamortized portion of the trust preferred securities’ issuance costs.
Net foreign exchange losses were $15 million and $24 million in 2007 and 2006, respectively. The decrease in the foreign exchange loss in 2007 was mainly due to lower forward points paid and gains on currencies that the Company does not hedge.
Income tax expense decreased by $13 million, from $95 million in 2006 to $82 million in 2007. The decrease resulted primarily from a tax benefi t of $7 million in 2007 due to a net reduction of the FIN 48 liability for unrecognized tax benefi ts relating primarily to the expiration of various statutes of limitations and completion of tax audits, and from a favorable tax benefi t of $8 million related to the weakening of the U.S. dollar against the Swiss franc and the euro.
Results by SegmentThe Company monitors the performance of its operations in three segments, Non-life, Life and Corporate & Other. The Non-life segment is further divided into four sub-segments, U.S., Global (Non-U.S.) P&C, Global (Non-U.S.) Specialty and Catastrophe. Segments and sub-segments represent markets that are reasonably homogeneous in terms of geography, client types, buying patterns, underlying risk patterns and approach to risk management. See the description of the Company’s segments and sub-segments as well as a discussion of how the Company measures its segment results in Note 19 to Consolidated Financial Statements.
Segment results are shown net of intercompany transactions. Business reported in the Global (Non-U.S.) P&C and Global (Non-U.S.) Specialty sub-segments and the Life segment is, to a signifi cant extent, denominated in foreign currencies and is reported in U.S. dollars at the average foreign exchange rates for each year. The U.S. dollar has fl uctuated against the euro and other currencies during each of the three years presented and this should be considered when making year to year comparisons.
521258_P021-101_MDA.indd 55521258_P021-101_MDA.indd 55 3/18/09 12:19:00 AM3/18/09 12:19:00 AM

PartnerRe Ltd.Management’s Discussion and Analysis of Financial Condition and Results of Operation
56 PartnerReAnnual Report 2008
Non-life Segment
U.S.The technical result of the U.S. sub-segment has fl uctuated in the last three years refl ecting varying levels of large loss events, a higher level of mid-sized losses predominantly in the agriculture and property lines of business and development on prior years’ reserves, which impacted year-to-year comparisons as discussed below. This sub-segment includes the U.S. casualty line, which represented approximately 45%, 50% and 52% of net premiums written in this sub-segment for 2008, 2007 and 2006, respectively. This line typically tends to have a higher loss ratio and a lower technical result, due to the long-tail nature of the risks involved. Casualty treaties typically provide for investment income on premiums invested over a longer period as losses are typically paid later than for other lines. Investment income, however, is not considered in the calculation of technical result.
The following table provides the components of the technical result and the corresponding ratios for this sub-segment (in millions of U.S. dollars):
2008
% Change2008 over
2007 2007
% Change2007 over
2006 2006
Gross premiums written $ 1,072 5% $ 1,020 (1)% $ 1,030
Net premiums written 1,064 4 1,020 (1) 1,029
Net premiums earned $ 1,088 9 $ 999 (3) $ 1,030
Losses and loss expenses (812) 33 (608) (16) (725)
Acquisition costs (261) 9 (241) (1) (243)
Technical result (1) $ 15 (90) $ 150 143 $ 62
Loss ratio (2) 74.6% 60.8% 70.3%
Acquisition ratio (3) 24.0 24.1 23.7
Technical ratio (4) 98.6% 84.9% 94.0%
(1) Technical result is defi ned as net premiums earned less losses and loss expenses and acquisition costs.
(2) Loss ratio is obtained by dividing losses and loss expenses by net premiums earned.
(3) Acquisition ratio is obtained by dividing acquisition costs by net premiums earned.
(4) Technical ratio is defi ned as the sum of the loss ratio and the acquisition ratio.
Premiums
The U.S. sub-segment represented 27%, 27% and 28% of total net premiums written in 2008, 2007 and 2006, respectively.
2008 over 2007
Gross and net premiums written and net premiums earned increased by 5%, 4% and 9%, respectively, in 2008 compared to 2007. The increase in gross and net premiums written resulted primarily from growth in the Company’s agriculture and property lines of business. Due to the increased opportunities in the agriculture line, the Company recorded $247 million in net premiums written, after the impact of $8 million of retrocessional cover, compared to $124 million in 2007. The growth in premiums written in the agriculture line of business increased the Company’s exposure to commodity price risk for crops, as well as drought and other agricultural risks. Separately, the Company wrote a treaty on December 31, 2008 with premiums of $31 million which will be earned in 2009. The increase in gross and net premiums written in the agriculture and property lines was partially offset by decreases in all other lines of business due to higher cedant retentions. The increase in net premiums earned of 9% in 2008 compared to 2007 was greater than the increase in net premiums written of 4% due to the change in the mix of business towards agriculture, which is written on a loss occurring basis, and a decrease in business written in most lines, except agriculture and property. Notwithstanding the increased competition prevailing in certain lines and markets of
PRe AR08-Fin_MDA-03_20_09.indd 56PRe AR08-Fin_MDA-03_20_09.indd 56 3/24/09 10:12:13 AM3/24/09 10:12:13 AM

PartnerReAnnual Report 2008
57
PartnerRe Ltd.Management’s Discussion and Analysis of Financial Condition and Results of Operation
this sub-segment and the increased risk retention by cedants, the Company was able to write business that met its portfolio objectives.
2007 over 2006
Gross and net premiums written and net premiums earned decreased 1%, 1% and 3% respectively, in 2007 compared to 2006. The small decrease resulted from all lines of business, with the exception of the multiline and surety lines, which increased compared to 2006. Net premiums written were also impacted by higher negative premium adjustments received from cedants in 2007. The decline in net premiums earned in 2007 compared to 2006 is primarily due to a shift in the mix of business from loss occurring to risk attaching business, which earns premiums at a slower pace.
Losses and loss expenses and loss ratio2008 over 2007
The losses and loss expenses and loss ratio reported in 2008 refl ected a) net favorable loss development on prior accident years of $92 million, or 8.4 points on the loss ratio of this sub-segment; b) large catastrophic losses related to Hurricane Ike of $67 million, or 5.6 points on the loss ratio of this sub-segment; c) higher loss estimates for the 2007 and 2008 underwriting years in the specialty casualty line of business refl ecting the deteriorating economic and fi nancial market conditions; d) a higher level of mid-sized losses mainly in the agriculture, property and structured risk lines of business; and e) an increase in the book of business and exposure, as evidenced by the increase in net premiums earned. The net favorable development of $92 million included net favorable development for prior accident years in all lines of business, with the exception of the motor and multiline lines of business, which experienced net adverse development for prior accident years of $10 million. Loss information provided by cedants in 2008 for prior accident years included no individually signifi cant losses or reductions of losses but a series of attritional losses or reductions. Based on the Company’s assessment of this loss information, the Company decreased its expected ultimate loss ratios for all lines of business (increased for motor and multiline), which had the net effect of decreasing (increasing for motor and multiline) prior year loss estimates.
The increase of $204 million in losses and loss expenses in 2008 compared to 2007 included:
an increase in losses and loss expenses of approximately $157 million resulting primarily -from an increase in the book of business and exposure, mainly in the agriculture line of business, and higher loss estimates for the 2007 and 2008 underwriting years in the specialty casualty line of business, due to reasons discussed above, and a higher level of mid-sized losses and normal fl uctuations in profi tability between periods; an increase in large catastrophic losses of $67 million resulting from Hurricane Ike; and -was partially offset by an increase of $20 million in net favorable prior year development. -
2007 over 2006
The losses and loss expenses and loss ratio reported for 2007 refl ected a) no large catastrophic losses; b) net favorable loss development on prior accident years of $72 million, or 7.2 points on the loss ratio of this sub-segment; and c) a decrease in the book of business and exposure, as evidenced by the decrease in net premiums earned. The net favorable loss development of $72 million included net favorable loss development for prior accident years in all lines of business, with the exception of multiline, which included net adverse loss development for prior accident years of $5 million. Loss information provided by cedants in 2007 for prior accident years included no individually signifi cant losses or reductions of losses but a series of attritional losses or reductions. Based on the Company’s assessment of this loss information, the Company decreased its expected ultimate loss ratios primarily
521258_P021-101_MDA.indd 57521258_P021-101_MDA.indd 57 3/18/09 12:19:26 AM3/18/09 12:19:26 AM

PartnerRe Ltd.Management’s Discussion and Analysis of Financial Condition and Results of Operation
58 PartnerReAnnual Report 2008
for all lines of business (increased for multiline), which had the net effect of decreasing (increasing for multiline) prior year loss estimates.
The decrease of $117 million in losses and loss expenses for 2007 compared to 2006 included:
an increase of $70 million in net favorable prior year development; and - a decrease in losses and loss expenses of approximately $47 million resulting from a -combination of the lower loss ratio estimates for the 2007 underwriting year, based on favorable pricing indications, lower net premiums earned and normal fl uctuations in profi tability between periods.
Acquisition costs and acquisition ratio2008 over 2007
The acquisition costs increased in 2008 compared to 2007 as a result of higher net premiums earned. While the acquisition ratio for 2008 remained fl at compared to the same period in 2007, the effect of the shift in the mix of business to the agriculture line reduced the acquisition ratio, which was offset by increases in the acquisition ratio for all other lines of business.
2007 over 2006
The acquisition costs decreased in 2007 compared to 2006 primarily as a result of lower net premiums earned. The increase in the acquisition ratio in 2007 compared to 2006 was the result of a modest shift from non-proportional to proportional business, which generally carries a higher acquisition ratio.
Technical result and technical ratio2008 over 2007
The decrease of $135 million in the technical result and corresponding increase in technical ratio in 2008 compared to 2007 was primarily attributable to a decrease of $97 million resulting from a higher level of mid-sized losses mainly in the agriculture, property and structured risk lines of business, higher loss estimates on the 2007 and 2008 underwriting years mainly related to the specialty casualty line of business and normal fl uctuations in profi tability between periods, and an increase in large catastrophic losses of $58 million relating to Hurricane Ike, net of $9 million of reinstatement premiums, partially offset by an increase in net favorable prior year development of $20 million.
2007 over 2006
The increase of $88 million in the technical result and corresponding decrease in the technical ratio for 2007 compared to 2006 was primarily explained by an increase in net favorable prior year development of $70 million, and an increase of $18 million resulting from the normal fl uctuations in profi tability between periods.
2009 Outlook
During the January 1, 2009 renewals, the Company saw diverse market conditions. The property market displayed a general strengthening in pricing as well as terms and conditions, while the casualty market pricing continued to decline, albeit at a decelerating pace. While approximately 40% of the January 1, 2009 renewal business remains in process (primarily related to the agriculture business, which traditionally renews later in the fi rst quarter), the Company’s book of business indicated potential growth in this sub-segment primarily due to increased opportunities in the property line. Based on overall pricing indications and renewal information received from cedants and brokers, and assuming similar conditions experienced during the January 1, 2009 renewals, Management expects an increase in demand for property coverages during the remainder of the year with similar terms and pricing, while remaining cautious about adding exposure in the U.S. specialty casualty line of business given pricing declines.
U.S. (continued)
521258_P021-101_MDA.indd 58521258_P021-101_MDA.indd 58 3/18/09 12:19:39 AM3/18/09 12:19:39 AM
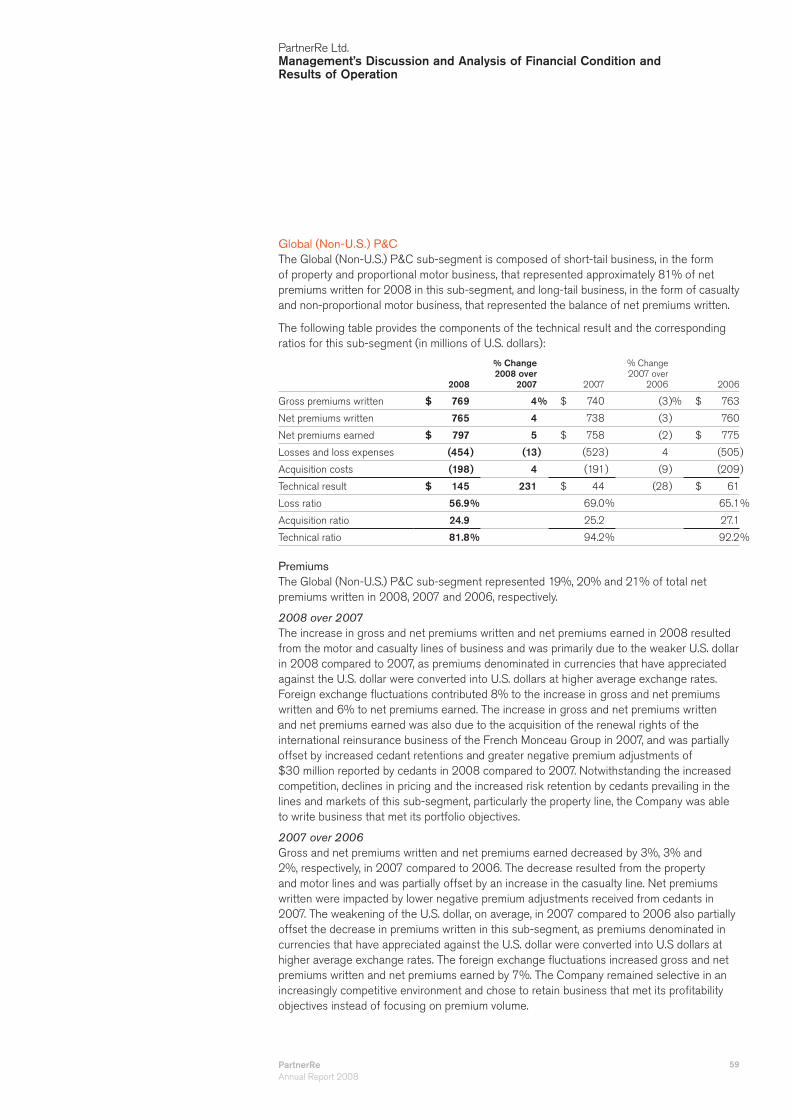
PartnerReAnnual Report 2008
59
PartnerRe Ltd.Management’s Discussion and Analysis of Financial Condition and Results of Operation
Global (Non-U.S.) P&C
The Global (Non-U.S.) P&C sub-segment is composed of short-tail business, in the form of property and proportional motor business, that represented approximately 81% of net premiums written for 2008 in this sub-segment, and long-tail business, in the form of casualty and non-proportional motor business, that represented the balance of net premiums written.
The following table provides the components of the technical result and the corresponding ratios for this sub-segment (in millions of U.S. dollars):
2008
% Change2008 over
2007 2007
% Change2007 over
2006 2006
Gross premiums written $ 769 4% $ 740 (3)% $ 763
Net premiums written 765 4 738 (3) 760
Net premiums earned $ 797 5 $ 758 (2) $ 775
Losses and loss expenses (454) (13) (523) 4 (505)
Acquisition costs (198) 4 (191) (9) (209)
Technical result $ 145 231 $ 44 (28) $ 61
Loss ratio 56.9% 69.0% 65.1%
Acquisition ratio 24.9 25.2 27.1
Technical ratio 81.8% 94.2% 92.2%
Premiums
The Global (Non-U.S.) P&C sub-segment represented 19%, 20% and 21% of total net premiums written in 2008, 2007 and 2006, respectively.
2008 over 2007
The increase in gross and net premiums written and net premiums earned in 2008 resulted from the motor and casualty lines of business and was primarily due to the weaker U.S. dollar in 2008 compared to 2007, as premiums denominated in currencies that have appreciated against the U.S. dollar were converted into U.S. dollars at higher average exchange rates. Foreign exchange fl uctuations contributed 8% to the increase in gross and net premiums written and 6% to net premiums earned. The increase in gross and net premiums written and net premiums earned was also due to the acquisition of the renewal rights of the international reinsurance business of the French Monceau Group in 2007, and was partially offset by increased cedant retentions and greater negative premium adjustments of $30 million reported by cedants in 2008 compared to 2007. Notwithstanding the increased competition, declines in pricing and the increased risk retention by cedants prevailing in the lines and markets of this sub-segment, particularly the property line, the Company was able to write business that met its portfolio objectives.
2007 over 2006
Gross and net premiums written and net premiums earned decreased by 3%, 3% and 2%, respectively, in 2007 compared to 2006. The decrease resulted from the property and motor lines and was partially offset by an increase in the casualty line. Net premiums written were impacted by lower negative premium adjustments received from cedants in 2007. The weakening of the U.S. dollar, on average, in 2007 compared to 2006 also partially offset the decrease in premiums written in this sub-segment, as premiums denominated in currencies that have appreciated against the U.S. dollar were converted into U.S dollars at higher average exchange rates. The foreign exchange fl uctuations increased gross and net premiums written and net premiums earned by 7%. The Company remained selective in an increasingly competitive environment and chose to retain business that met its profi tability objectives instead of focusing on premium volume.
PRe AR08-Fin_MDA-03_20_09.indd 59PRe AR08-Fin_MDA-03_20_09.indd 59 3/24/09 9:31:57 AM3/24/09 9:31:57 AM
PartnerRe Ltd.Management’s Discussion and Analysis of Financial Condition and Results of Operation
60 PartnerReAnnual Report 2008
Losses and loss expenses and loss ratio2008 over 2007
The losses and loss expenses and loss ratio reported in 2008 refl ected a) net favorable loss development on prior accident years of $166 million, or 20.8 points on the loss ratio; b) higher level of mid-sized losses mainly in the property line of business; and c) an increase in the book of business and exposure as evidenced by the increase in net premiums earned. The net favorable loss development of $166 million included net favorable development in all lines of business, but was most pronounced in the property line, and was primarily due to favorable loss emergence, as losses reported by cedants in 2008 for prior accident years were lower than the Company expected. Loss information provided by cedants in 2008 for prior accident years included no individually signifi cant losses or reductions of losses but a series of attritional losses or reductions. Based on the Company’s assessment of this loss information, the Company decreased its expected ultimate loss ratios for all lines, which had the net effect of decreasing prior year loss estimates.
The decrease of $69 million in losses and loss expenses in 2008 compared to 2007 included: an increase of $69 million in net favorable prior year development; and - a decrease of $12 million in large catastrophic losses; partially offset by - an increase in losses and loss expenses of approximately $12 million resulting from a -combination of an increase in the book of business, a higher level of mid-sized losses, modestly lower profi tability on the business written in 2008 and normal fl uctuations in profi tability between periods.
2007 over 2006
The losses and loss expenses and loss ratio reported in 2007 refl ected a) losses related to European windstorm Kyrill of $12 million, or 1.7 points on the loss ratio; b) a higher level of mid-sized losses; c) net favorable loss development on prior accident years of $97 million, or 12.8 points on the loss ratio; and d) a decrease in the book of business and exposure as evidenced by the decrease in net premiums earned. The net favorable loss development of $97 million included net favorable development in all lines of business and was primarily due to favorable loss emergence, as losses reported by cedants during 2007 for prior accident years were lower than the Company expected. Loss information provided by cedants in 2007 for prior accident years included no individually signifi cant losses or reductions of losses but a series of attritional losses or reductions. Based on the Company’s assessment of this loss information, the Company decreased its expected ultimate loss ratios for all lines, which had the net effect of decreasing prior year loss estimates.
The increase of $18 million in losses and loss expenses for 2007 compared to 2006 included: an increase in loss and loss expenses resulting from a higher level of mid-sized losses, -partially offset by the decrease in the book of business and exposure, and normal fl uctuations in profi tability between periods totaling approximately $37 million; and an increase in large catastrophic losses of $12 million; and was partially offset by - an increase of $31 million in net favorable prior year development. -
Acquisition costs and acquisition ratio2008 over 2007
The acquisition costs increased in 2008 compared to 2007 as a result of higher net premiums earned. The acquisition ratio decreased slightly following a shift in the distribution of net premiums earned during the year in this sub-segment to motor and casualty.
2007 over 2006
The decrease in acquisition costs in 2007 compared to 2006 was primarily due to the reduction in the Company’s book of business and exposure, as evidenced by the decrease in net premiums earned and higher acquisition costs in 2006 from sliding scale and profi t commission adjustments, which also increased the acquisition ratio in 2006.
Global (Non-U.S.) P&C (continued)
521258_P021-101_MDA.indd 60521258_P021-101_MDA.indd 60 3/18/09 12:20:07 AM3/18/09 12:20:07 AM
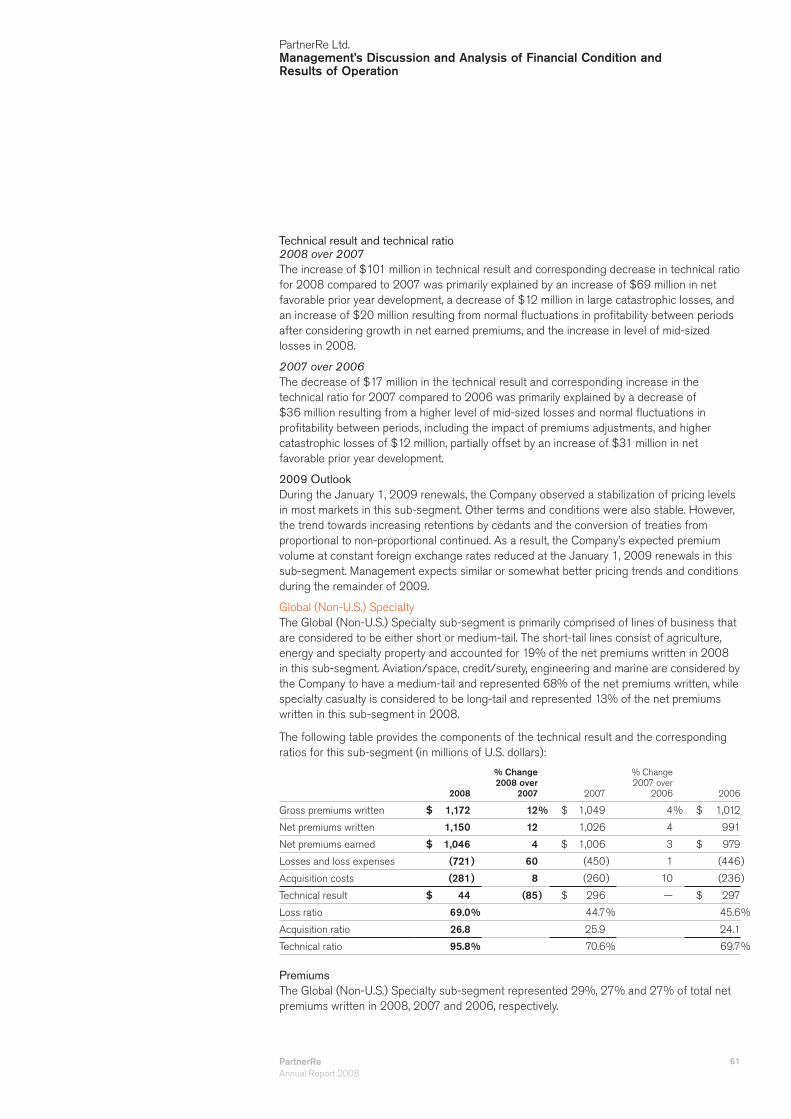
PartnerReAnnual Report 2008
61
PartnerRe Ltd.Management’s Discussion and Analysis of Financial Condition and Results of Operation
Technical result and technical ratio2008 over 2007
The increase of $101 million in technical result and corresponding decrease in technical ratio for 2008 compared to 2007 was primarily explained by an increase of $69 million in net favorable prior year development, a decrease of $12 million in large catastrophic losses, and an increase of $20 million resulting from normal fl uctuations in profi tability between periods after considering growth in net earned premiums, and the increase in level of mid-sized losses in 2008.
2007 over 2006
The decrease of $17 million in the technical result and corresponding increase in the technical ratio for 2007 compared to 2006 was primarily explained by a decrease of $36 million resulting from a higher level of mid-sized losses and normal fl uctuations in profi tability between periods, including the impact of premiums adjustments, and higher catastrophic losses of $12 million, partially offset by an increase of $31 million in net favorable prior year development.
2009 Outlook
During the January 1, 2009 renewals, the Company observed a stabilization of pricing levels in most markets in this sub-segment. Other terms and conditions were also stable. However, the trend towards increasing retentions by cedants and the conversion of treaties from proportional to non-proportional continued. As a result, the Company’s expected premium volume at constant foreign exchange rates reduced at the January 1, 2009 renewals in this sub-segment. Management expects similar or somewhat better pricing trends and conditions during the remainder of 2009.
Global (Non-U.S.) SpecialtyThe Global (Non-U.S.) Specialty sub-segment is primarily comprised of lines of business that are considered to be either short or medium-tail. The short-tail lines consist of agriculture, energy and specialty property and accounted for 19% of the net premiums written in 2008 in this sub-segment. Aviation/space, credit/surety, engineering and marine are considered by the Company to have a medium-tail and represented 68% of the net premiums written, while specialty casualty is considered to be long-tail and represented 13% of the net premiums written in this sub-segment in 2008.
The following table provides the components of the technical result and the corresponding ratios for this sub-segment (in millions of U.S. dollars):
2008
% Change2008 over
2007 2007
% Change2007 over
2006 2006
Gross premiums written $ 1,172 12% $ 1,049 4% $ 1,012
Net premiums written 1,150 12 1,026 4 991
Net premiums earned $ 1,046 4 $ 1,006 3 $ 979
Losses and loss expenses (721) 60 (450) 1 (446)
Acquisition costs (281) 8 (260) 10 (236)
Technical result $ 44 (85) $ 296 — $ 297
Loss ratio 69.0% 44.7% 45.6%
Acquisition ratio 26.8 25.9 24.1
Technical ratio 95.8% 70.6% 69.7%
Premiums
The Global (Non-U.S.) Specialty sub-segment represented 29%, 27% and 27% of total net premiums written in 2008, 2007 and 2006, respectively.
521258_P021-101_MDA.indd 61521258_P021-101_MDA.indd 61 3/18/09 12:20:20 AM3/18/09 12:20:20 AM

PartnerRe Ltd.Management’s Discussion and Analysis of Financial Condition and Results of Operation
62 PartnerReAnnual Report 2008
2008 over 2007
Gross and net premiums written increased by 12% in 2008 compared to 2007. The increase resulted from all lines of business, with the most signifi cant increases in net premiums written in the credit/surety and specialty casualty lines of business. Net premiums written were also impacted by higher positive premium adjustments of $37 million reported by cedants in 2008 compared to 2007, which resulted primarily from the engineering line of business. The increase of 12% in net premiums written in 2008 is higher than the increase of 4% in net premiums earned as a result of refi ning the Company’s earnings pattern methodology in certain lines of business. The weaker U.S. dollar in 2008 compared to 2007 also contributed signifi cantly to the increase in premiums. Foreign exchange fl uctuations contributed 5%, 6% and 5% to the increase in gross and net premiums written and net premiums earned, respectively. Notwithstanding the increased competition, declines in pricing and increased risk retention by cedants prevailing in certain lines and markets of this sub-segment, the Company was able to write business that met its portfolio objectives.
2007 over 2006
Gross and net premiums written and net premiums earned increased by 4%, 4% and 3%, respectively, in 2007 compared to 2006. The increase resulted from most lines of business, with the exception of aviation and energy, which decreased compared to 2006. Net premiums written were also impacted by lower positive premium adjustments received from cedants in 2007. The weakening of the U.S. dollar, on average, in 2007 compared to 2006 contributed signifi cantly to the increase in premiums, as premiums denominated in currencies that have appreciated against the U.S. dollar were converted into U.S dollars at higher average exchange rates. Foreign exchange fl uctuations contributed 5% to the increase in gross and net premiums written and net premiums earned.
Losses and loss expenses and loss ratio2008 over 2007
The losses and loss expenses and loss ratio reported in 2008 for this sub-segment refl ected a) net favorable loss development on prior accident years of $82 million, or 7.8 points on the loss ratio; b) large catastrophic losses related to Hurricane Ike of $67 million, or 6.2 points on the loss ratio of this sub-segment; c) a higher than usual level of mid-sized losses mainly in the energy, engineering and specialty casualty lines of business; d) higher loss estimates for the 2006, 2007 and 2008 underwriting years in the credit/surety line of business refl ecting deteriorating economic and credit conditions as a result of the global fi nancial crisis; and e) an increase in the book of business and exposure as evidenced by the increase in net premiums earned. The net favorable development of $82 million reported in 2008 included net favorable development for prior accident years in all lines of business with the exception of the energy line, which incurred net adverse loss development for prior accident years of $7 million. Loss information provided by cedants in 2008 for prior accident years was lower than the Company expected (higher for the energy line) and included no individually signifi cant losses or reductions of losses but a series of attritional losses or reductions. Based on the Company’s assessment of this loss information, the Company decreased its expected ultimate loss ratios for all lines of business with the exception of the energy line, which had the net effect of decreasing (increasing for the energy line) the level of prior year loss estimates.
The increase of $271 million in losses and loss expenses in 2008 compared to 2007 included: a decrease of $121 million in net favorable prior year development; - an increase in losses and loss expenses of approximately $90 million resulting from -a combination of higher loss estimates for the 2007 and 2008 underwriting years in the credit/surety line of business, a higher level of mid-sized losses, modestly lower profi tability on the business written in 2008, an increase in the book of business and normal fl uctuations in profi tability between periods; and an increase of $60 million in large catastrophic losses. -
521258_P021-101_MDA.indd 62521258_P021-101_MDA.indd 62 3/18/09 12:20:33 AM3/18/09 12:20:33 AM

PartnerReAnnual Report 2008
63
PartnerRe Ltd.Management’s Discussion and Analysis of Financial Condition and Results of Operation
2007 over 2006
The losses and loss expenses and loss ratio reported in 2007 refl ected a) losses related to European windstorm Kyrill of $7 million, or 0.7 points on the loss ratio; b) net favorable loss development on prior accident years of $203 million, or 20.1 points on the loss ratio; and c) an increase in the book of business and exposure as evidenced by the increase in net premiums earned. The net favorable development of $203 million included net favorable development for prior accident years in all lines of business and was primarily due to favorable loss emergence, as losses reported by cedants during 2007 for prior accident years were lower than the Company expected. Loss information provided by cedants in 2007 for prior accident years included no individually signifi cant losses or reductions of losses but a series of attritional losses or reductions. Based on the Company’s assessment of this loss information, the Company decreased its expected ultimate loss ratios for all lines, which had the net effect of decreasing the level of prior year loss estimates.
The increase of $4 million in losses and loss expenses for 2007 compared to 2006 included: an increase in large catastrophic losses of $7 million; and - a decrease of $5 million in net favorable prior year development; and was partially offset by - a decrease in losses and loss expenses of approximately $8 million resulting from a -combination of normal fl uctuations in profi tability between periods, partially offset by the increase in the book of business and exposure.
Acquisition costs and acquisition ratio2008 over 2007
The increase in acquisition costs in 2008 compared to 2007 is as a result of higher net premiums earned and due to the write-off of $15 million of acquisition costs in the credit/surety line of business, refl ecting anticipated profi tability on premiums to be earned in 2009. The increase in acquisition ratio is also due to this charge, which was partially offset by a slight decrease in the acquisition ratio for other lines attributable to a modest shift between lines of business that carry different acquisition ratios.
2007 over 2006
The increase in acquisition costs and acquisition ratio in 2007 compared to 2006 was attributable to an increase in net premiums earned, a modest shift between lines of business that carry different acquisition ratios, deterioration in the acquisition cost ratio in the credit/surety line of business, and profi t commission adjustments.
Technical result and technical ratio2008 over 2007
The decrease of $252 million in the technical result and corresponding increase in the technical ratio in 2008 compared to 2007 is explained by a decrease of $121 million in net favorable prior year development, a decrease of $74 million resulting from higher loss estimates for the 2007 and 2008 underwriting years for the credit/surety line of business, a higher level of mid-sized losses, modestly lower profi tability on business written in 2008 and normal fl uctuations in profi tability between periods, and an increase of $57 million, net of $3 million reinstatement premiums, in large catastrophic losses in 2008 compared to 2007.
2007 over 2006
The decrease of $1 million in the technical result and corresponding increase in the technical ratio for 2007 compared to 2006 was primarily explained by an increase of $7 million in the level of large catastrophic losses and a decrease of $5 million in net favorable prior year development, partially offset by an increase of $11 million resulting from normal fl uctuations in profi tability between periods.
521258_P021-101_MDA.indd 63521258_P021-101_MDA.indd 63 3/18/09 12:20:46 AM3/18/09 12:20:46 AM
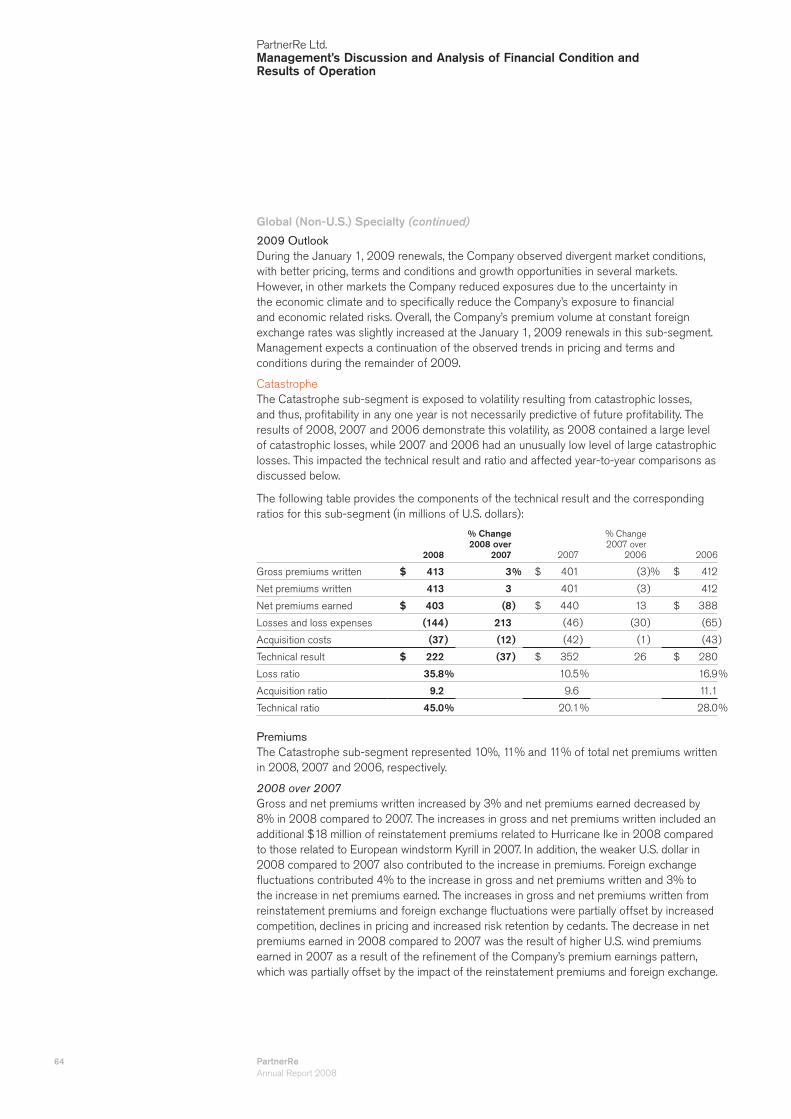
PartnerRe Ltd.Management’s Discussion and Analysis of Financial Condition and Results of Operation
64 PartnerReAnnual Report 2008
2009 Outlook
During the January 1, 2009 renewals, the Company observed divergent market conditions, with better pricing, terms and conditions and growth opportunities in several markets. However, in other markets the Company reduced exposures due to the uncertainty in the economic climate and to specifi cally reduce the Company’s exposure to fi nancial and economic related risks. Overall, the Company’s premium volume at constant foreign exchange rates was slightly increased at the January 1, 2009 renewals in this sub-segment. Management expects a continuation of the observed trends in pricing and terms and conditions during the remainder of 2009.
CatastropheThe Catastrophe sub-segment is exposed to volatility resulting from catastrophic losses, and thus, profi tability in any one year is not necessarily predictive of future profi tability. The results of 2008, 2007 and 2006 demonstrate this volatility, as 2008 contained a large level of catastrophic losses, while 2007 and 2006 had an unusually low level of large catastrophic losses. This impacted the technical result and ratio and affected year-to-year comparisons as discussed below.
The following table provides the components of the technical result and the corresponding ratios for this sub-segment (in millions of U.S. dollars):
2008
% Change2008 over
2007 2007
% Change2007 over
2006 2006
Gross premiums written $ 413 3% $ 401 (3)% $ 412
Net premiums written 413 3 401 (3) 412
Net premiums earned $ 403 (8) $ 440 13 $ 388
Losses and loss expenses (144) 213 (46) (30) (65)
Acquisition costs (37) (12) (42) (1) (43)
Technical result $ 222 (37) $ 352 26 $ 280
Loss ratio 35.8% 10.5% 16.9%
Acquisition ratio 9.2 9.6 11.1
Technical ratio 45.0% 20.1% 28.0%
Premiums
The Catastrophe sub-segment represented 10%, 11% and 11% of total net premiums written in 2008, 2007 and 2006, respectively.
2008 over 2007
Gross and net premiums written increased by 3% and net premiums earned decreased by 8% in 2008 compared to 2007. The increases in gross and net premiums written included an additional $18 million of reinstatement premiums related to Hurricane Ike in 2008 compared to those related to European windstorm Kyrill in 2007. In addition, the weaker U.S. dollar in 2008 compared to 2007 also contributed to the increase in premiums. Foreign exchange fl uctuations contributed 4% to the increase in gross and net premiums written and 3% to the increase in net premiums earned. The increases in gross and net premiums written from reinstatement premiums and foreign exchange fl uctuations were partially offset by increased competition, declines in pricing and increased risk retention by cedants. The decrease in net premiums earned in 2008 compared to 2007 was the result of higher U.S. wind premiums earned in 2007 as a result of the refi nement of the Company’s premium earnings pattern, which was partially offset by the impact of the reinstatement premiums and foreign exchange.
Global (Non-U.S.) Specialty (continued)
521258_P021-101_MDA.indd 64521258_P021-101_MDA.indd 64 3/18/09 12:21:01 AM3/18/09 12:21:01 AM

PartnerReAnnual Report 2008
65
PartnerRe Ltd.Management’s Discussion and Analysis of Financial Condition and Results of Operation
2007 over 2006
Gross and net premiums written decreased by 3% and net premiums earned increased by 13% in 2007 compared to 2006. The increase in net premiums earned in 2007 compared to 2006 was primarily the result of refi ning the application of the Company’s methodology related to its U.S. wind earnings pattern. The weakening of the U.S. dollar, on average, in 2007 compared to 2006 partially offset the decrease in premiums written in this sub-segment, as premiums denominated in currencies that have appreciated against the U.S. dollar were converted into U.S dollars at higher average exchange rates. The foreign exchange fl uctuations increased gross and net premiums written by 2% and contributed 3% to the increase in net premiums earned.
Losses and loss expenses and loss ratio2008 over 2007
The losses and loss expenses and loss ratio reported in 2008 for this sub-segment refl ected a) large catastrophic losses related to Hurricane Ike of $183 million, or 45.8 points on the loss ratio of this sub-segment; b) net favorable loss development on prior accident years of $78 million, or 19.4 points on the loss ratio; and c) a lower level of mid-sized loss activity during 2008. The net favorable development of $78 million was primarily due to favorable loss emergence, as losses reported by cedants during 2008 for prior accident years were lower than the Company expected. Based on the Company’s assessment of this loss information, the Company decreased its expected ultimate loss ratio, which had the effect of decreasing the level of prior year loss estimates.
The increase of $98 million in losses and loss expenses for 2008 compared to 2007 included: an increase of $150 million in large catastrophic losses; partially offset by - an increase of $36 million in net favorable prior year development; and - a decrease in losses and loss expenses of approximately $16 million resulting from -a low level of mid-sized loss activity in 2008 and normal fl uctuations in profi tability between periods.
2007 over 2006
The losses and loss expenses and loss ratio reported in 2007 refl ected a) losses related to European windstorm Kyrill of $33 million, or 7.5 points on the loss ratio; and b) net favorable loss development on prior accident years of $42 million, or 9.7 points on the loss ratio. The net favorable loss development of $42 million was primarily due to favorable loss emergence, as losses reported by cedants during 2007 for prior accident years were lower than the Company expected, and the reduction of the additional IBNR reserve established by the Company in 2006 on the large 2005 catastrophic loss events due to reduced concerns on litigation developments and evolving out of court settlement trends. Based on the Company’s assessment of this loss information, the Company decreased its expected ultimate loss ratio, which had the effect of decreasing the level of prior year loss estimates.
The decrease of $19 million in losses and loss expenses for 2007 compared to 2006 included: an improvement of $66 million in net prior year development; partially offset by - an increase in large catastrophic losses of $33 million; and - an increase in losses and loss expenses of approximately $14 million resulting from -normal fl uctuations in profi tability between periods.
Acquisition costs and acquisition ratio2008 over 2007
The decrease in acquisition costs in 2008 compared to 2007 is primarily due to the decrease in the Company’s book of business and exposure, as evidenced by the decrease in net premiums earned. The decrease in the acquisition ratio in 2008 compared to 2007
521258_P021-101_MDA.indd 65521258_P021-101_MDA.indd 65 3/18/09 12:21:15 AM3/18/09 12:21:15 AM

PartnerRe Ltd.Management’s Discussion and Analysis of Financial Condition and Results of Operation
66 PartnerReAnnual Report 2008
was primarily due the impact of reinstatement premiums, which do not have associated acquisition costs.
2007 over 2006
The decrease in acquisition costs and acquisition ratio in 2007 compared to 2006 was primarily due to a modest shift from proportional to non-proportional business.
Technical result and technical ratio2008 over 2007
The decrease of $130 million in the technical result and corresponding increase in the technical ratio in 2008 compared to 2007 was primarily explained by an increase of $132 million, net of $18 million additional reinstatement premiums, in large catastrophic losses and a decrease of $34 million resulting from normal fl uctuations in profi tability between periods, which was partially offset by an increase of $36 million in net favorable prior year development.
2007 over 2006
The increase of $72 million in the technical result and corresponding decrease in the technical ratio for 2007 compared to 2006 was primarily explained by an improvement of $66 million in net favorable prior year development, an increase of $37 million in net premiums earned and normal fl uctuations in profi tability between periods, partially offset by an increase of $31 million in large catastrophic losses, net of reinstatement premiums.
2009 Outlook
During the January 1, 2009 renewals, the Company observed overall strengthening of terms and conditions and pricing, but the degree of strengthening varied by market. The Company’s expected premium volume increased at the January 1, 2009 renewals in this sub-segment, with growth more pronounced in certain markets. Management expects a continuation of these trends and conditions for the remainder of 2009.
Life Segment
The following table provides the components of the allocated underwriting result for this segment (in millions of U.S. dollars):
2008
% Change2008 over
2007 2007
% Change2007 over
2006 2006
Gross premiums written $ 584 (2)% $ 597 18% $ 507
Net premiums written 579 2 569 17 487
Net premiums earned $ 576 1 $ 571 17 $ 487
Life policy benefi ts (463) 2 (455) 25 (363)
Acquisition costs (120) 4 (116) (1) (117)
Technical result $ (7) NM $ — (93) $ 7
Other operating expenses (43) 33 (33) 11 (29)
Net investment income 67 24 54 4 51
Allocated underwriting result (1) $ 17 (21) $ 21 (26) $ 29
NM: not meaningful
(1) Allocated underwriting result is defi ned as net premiums earned and allocated net investment income less life policy benefi ts, acquisition costs and other operating expenses.
Premiums
The Life segment represented 14%, 15% and 13% of total net premiums written in 2008, 2007 and 2006, respectively.
Catastrophe (continued)
521258_P021-101_MDA.indd 66521258_P021-101_MDA.indd 66 3/18/09 12:21:27 AM3/18/09 12:21:27 AM

PartnerReAnnual Report 2008
67
PartnerRe Ltd.Management’s Discussion and Analysis of Financial Condition and Results of Operation
2008 over 2007
Gross premiums written decreased by 2%, and net premiums written and earned increased by 2% and 1% in 2008 compared to 2007, respectively. The decrease in gross premiums written in 2008 compared to 2007 was primarily driven by the non-renewal of a large longevity treaty, which was partially offset by the impact of foreign exchange and an additional $14 million of premiums reported by a cedant for a longevity treaty in run-off. Net premiums written increased despite the decrease in gross premiums written primarily because the Company purchased additional reinsurance protection in the mortality line of business in 2007 compared to 2008. The weaker U.S. dollar in 2008 and resulting foreign exchange fl uctuations contributed an increase of 5% to gross and net premiums written and net premiums earned.
2007 over 2006
The increases in gross and net premiums written and net premiums earned in 2007 compared to 2006 resulted from an increase in the mortality and health lines, partially offset by a decrease in the longevity line. Growth in the mortality line resulted from intrinsic growth in the business written by the Company’s cedants, which resulted in more volume ceded to the Company on existing treaties, and new business generated by the Company. The weakening of the U.S. dollar, on average, in 2007 compared to 2006 contributed to the increase in premiums written in this segment, as premiums denominated in currencies that have appreciated against the U.S. dollar were converted into U.S. dollars at higher average exchange rates. Foreign exchange fl uctuations contributed 8% to the increase in gross and net premiums written and net premiums earned.
Life policy benefits2008 over 2007
Life policy benefi ts increased by 2% in 2008 compared to 2007. The increase was primarily due to an increase in net adverse prior year reserve development of $22 million and additional life policy benefi ts of $21 million in 2008 reported by a cedant for a longevity treaty in run-off, which were partially offset by a change in the mix of business as the mortality line, which generally carries a lower level of life policy benefi ts than the longevity line, increased its percentage of the Life segment’s net premiums earned. The increase in net adverse prior year reserve development of $22 million refl ected adverse development of $24 million in 2008 compared to $2 million in 2007. The $24 million of net adverse prior year reserve development in 2008 is comprised of $33 million of adverse development from the GMDB business and was partially offset by favorable development from short-term products. The adverse development on the GMDB business was primarily due to benefi t reserves being linked to the performance of underlying capital market assets in France and also due to the impact of increased credit spreads on index-linked products that are interest-rate sensitive.
2007 over 2006
Life policy benefi ts increased by $92 million in 2007 compared to 2006. This was primarily attributable to the growth in the Company’s book of business and exposure, as evidenced by the 17% increase in net premiums earned for this segment. Life policy benefi ts for 2007 included net adverse prior year development of $2 million compared to net favorable prior year development of $12 million in 2006. The net adverse development of $2 million reported in 2007 included net adverse loss development in the longevity line of $26 million, partially offset by net favorable loss development in the mortality line of $24 million. The net adverse loss development in the longevity line in 2007 was primarily due to losses developing worse than expected and a change in assumptions used to value future policy benefi ts for the non-standard annuity business, while the net favorable loss development in the mortality line in 2007 was primarily due to favorable reserve development on long and short-term traditional mortality and TCI products.
521258_P021-101_MDA.indd 67521258_P021-101_MDA.indd 67 3/18/09 12:21:41 AM3/18/09 12:21:41 AM

PartnerRe Ltd.Management’s Discussion and Analysis of Financial Condition and Results of Operation
68 PartnerReAnnual Report 2008
Acquisition costs2008 over 2007
The increase in acquisition costs in 2008 compared to 2007 was primarily attributable to higher rate of lapses than expected on TCI products in the mortality line and profi t commission adjustments, which was partially offset by a decrease of $6 million in acquisition costs reported by a cedant for a longevity treaty in run-off.
2007 over 2006
The decrease of $1 million in acquisition costs in 2007 compared to 2006 was primarily attributable to a change in reporting by a cedant to reduce acquisition costs on a mortality treaty compared to 2006. In addition, the 2006 period included higher acquisition costs for the health line resulting from sliding scale and profi t commission adjustments and higher acquisition cost adjustments reported by a cedant for a longevity treaty compared to 2007.
Net investment income2008 over 2007
Net investment income increased by $13 million in 2008 compared to 2007 primarily as a result of higher invested assets from the growth in the book of business. The 2007 comparative fi gure was also affected by a decrease of $4 million due to the commutation of a fi nancing treaty.
2007 over 2006
Net investment income increased by $3 million in 2007 compared to 2006 as a result of higher invested assets from the growth in the book of business. The comparison was also affected by the commutation of a fi nancing treaty in 2007, which resulted in a decrease of net investment income of $4 million. In addition, net investment income reported by a cedant for a longevity treaty was $6 million lower in 2007 compared to 2006.
Allocated underwriting result2008 over 2007
The decrease in allocated underwriting result of $4 million in 2008 compared to 2007 is primarily explained by an increase in operating expenses of $10 million and a decrease in technical result of $7 million, which were partially offset by an increase in allocated investment income of $13 million. The decrease in the technical result of $7 million was driven by an increase of $22 million in net adverse prior year reserve development, which was partially offset by a change in the mix of business to the mortality line, as discussed above.
2007 over 2006
The decrease of $8 million in allocated underwriting result in 2007 compared to 2006 is primarily explained by the increase in net adverse prior year development of $14 million and higher operating expenses, partially offset by an increase in profi tability of the mortality line, and an increase in net investment income of $3 million.
2009 Outlook
The Life segment experiences only limited active renewals, as several contracts are written on a continuous basis. The active renewal is mainly in the mortality line. For those treaties that actively renewed, pricing conditions and terms were stable. The Company expects a small increase in premiums written during 2009, assuming constant foreign exchange rates.
Life Segment (continued)
521258_P021-101_MDA.indd 68521258_P021-101_MDA.indd 68 3/18/09 12:21:54 AM3/18/09 12:21:54 AM
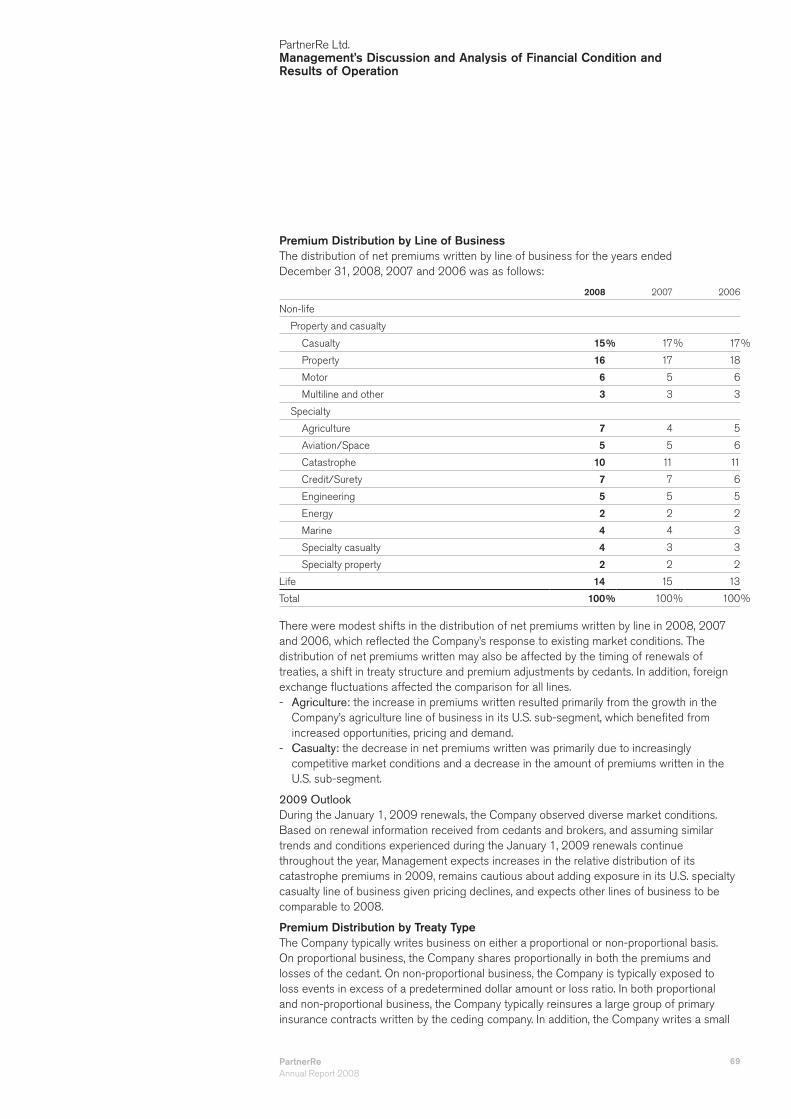
PartnerReAnnual Report 2008
69
PartnerRe Ltd.Management’s Discussion and Analysis of Financial Condition and Results of Operation
Premium Distribution by Line of BusinessThe distribution of net premiums written by line of business for the years ended December 31, 2008, 2007 and 2006 was as follows:
2008 2007 2006
Non-life
Property and casualty
Casualty 15% 17% 17%
Property 16 17 18
Motor 6 5 6
Multiline and other 3 3 3
Specialty
Agriculture 7 4 5
Aviation/Space 5 5 6
Catastrophe 10 11 11
Credit/Surety 7 7 6
Engineering 5 5 5
Energy 2 2 2
Marine 4 4 3
Specialty casualty 4 3 3
Specialty property 2 2 2
Life 14 15 13
Total 100% 100% 100%
There were modest shifts in the distribution of net premiums written by line in 2008, 2007 and 2006, which refl ected the Company’s response to existing market conditions. The distribution of net premiums written may also be affected by the timing of renewals of treaties, a shift in treaty structure and premium adjustments by cedants. In addition, foreign exchange fl uctuations affected the comparison for all lines.
Agriculture: - the increase in premiums written resulted primarily from the growth in the Company’s agriculture line of business in its U.S. sub-segment, which benefi ted from increased opportunities, pricing and demand. Casualty: - the decrease in net premiums written was primarily due to increasingly competitive market conditions and a decrease in the amount of premiums written in the U.S. sub-segment.
2009 Outlook
During the January 1, 2009 renewals, the Company observed diverse market conditions. Based on renewal information received from cedants and brokers, and assuming similar trends and conditions experienced during the January 1, 2009 renewals continue throughout the year, Management expects increases in the relative distribution of its catastrophe premiums in 2009, remains cautious about adding exposure in its U.S. specialty casualty line of business given pricing declines, and expects other lines of business to be comparable to 2008.
Premium Distribution by Treaty TypeThe Company typically writes business on either a proportional or non-proportional basis. On proportional business, the Company shares proportionally in both the premiums and losses of the cedant. On non-proportional business, the Company is typically exposed to loss events in excess of a predetermined dollar amount or loss ratio. In both proportional and non-proportional business, the Company typically reinsures a large group of primary insurance contracts written by the ceding company. In addition, the Company writes a small
521258_P021-101_MDA.indd 69521258_P021-101_MDA.indd 69 3/18/09 12:22:07 AM3/18/09 12:22:07 AM

PartnerRe Ltd.Management’s Discussion and Analysis of Financial Condition and Results of Operation
70 PartnerReAnnual Report 2008
percentage of its business on a facultative basis. Facultative arrangements are generally specifi c to an individual risk and can be written on either a proportional or non-proportional basis. Generally, the Company has more infl uence over pricing, as well as terms and conditions, in non-proportional and facultative arrangements.
The distribution of gross premiums written by treaty type for the years ended December 31, 2008, 2007 and 2006 was as follows:
2008 2007 2006
Non-life Segment
Proportional 55% 52% 51%
Non-Proportional 27 28 30
Facultative 4 4 5
Life Segment
Proportional 13 15 13
Non-Proportional 1 1 1
Total 100% 100% 100%
The distribution of gross premiums written by treaty type is affected by changes in the allocation of capacity among lines of business, the timing of receipt by the Company of cedant accounts and premium adjustments by cedants. In addition, foreign exchange fl uctuations affected the comparison for all treaty types.
The increase in the percentage of proportional gross premiums written for the Non-life segment in 2008 compared to 2007 resulted primarily from the growth in the Company’s agriculture line of business in its U.S. sub-segment. The decrease in the percentage of non-proportional gross premiums written for the Non-life segment in 2007 compared to 2006, resulted primarily from timing differences in the recognition of premiums in the U.S. sub-segment.
The decrease in the percentage of proportional gross premiums written for the Life segment in 2008 compared to 2007 results primarily from the non-renewal of a large longevity treaty in 2008 which was written on a proportional basis. The increase in the percentage of proportional gross premiums written for the Life segment in 2007 compared to 2006 resulted from the increase in the Company’s mortality business.
2009 Outlook
Based on renewal information from cedants and brokers, and assuming similar conditions experienced during the January 1, 2009 renewals continue throughout the year, Management expects the distribution of gross premiums written by treaty type in 2009 to be similar to 2008.
Premium Distribution by Geographic RegionThe geographic distribution of gross premiums written for the years ended December 31, 2008, 2007 and 2006 was as follows:
2008 2007 2006
Europe 46% 45% 42%
North America 41 42 43
Latin America, Caribbean and Africa 8 7 7
Asia, Australia and New Zealand 5 6 8
Total 100% 100% 100%
521258_P021-101_MDA.indd 70521258_P021-101_MDA.indd 70 3/18/09 12:22:24 AM3/18/09 12:22:24 AM

PartnerReAnnual Report 2008
71
PartnerRe Ltd.Management’s Discussion and Analysis of Financial Condition and Results of Operation
The distribution of gross premiums written was comparable between all periods. The distribution of gross premiums for all non-U.S. regions was affected by foreign exchange fl uctuations which increased the non-U.S. premiums, as premiums denominated in currencies that have appreciated against the U.S. dollar were converted into U.S. dollars at higher average exchange rates.
2009 Outlook
Based on renewal information from cedants and brokers, and assuming similar conditions experienced during the January 1, 2009 renewals continue throughout the year and assuming constant foreign exchange rates, Management expects the distribution of gross premiums written by geographic region in 2009 to be similar to 2008.
Premium Distribution by Production SourceThe Company generates its gross premiums written both through brokers and through direct relationships with cedants. The percentage of gross premiums written by production source for the years ended December 31, 2008, 2007 and 2006 was as follows:
2008 2007 2006
Broker 71% 69% 69%
Direct 29 31 31
The shift from direct to broker in 2008 compared to 2007 refl ected an increase in gross premiums written through brokers in Europe, and a modest shift in the mix of gross premiums written in other geographic locations. The distribution of gross premiums written was comparable in 2007 and 2006.
2009 Outlook
Based on renewal information from cedants and brokers, and assuming similar conditions experienced during the January 1, 2009 renewals continue throughout the year, Management expects the production source of gross premiums written in 2009 to be similar to 2008.
Corporate and OtherCorporate and Other is comprised of the Company’s capital markets and investment related activities, including principal fi nance transactions, insurance-linked securities and strategic investments, and its corporate activities, including other operating expenses.
Net Investment Income
The table below provides net investment income by asset source for the years ended December 31, 2008, 2007 and 2006 (in millions of U.S. dollars):
2008
% Change2008 over
2007 2007
% Change2007 over
2006 2006
Fixed maturities $ 515 22% $ 422 26% $ 334
Short-term investments, trading securities, cash
and cash equivalents 19 (66) 56 (9) 61
Equities 29 (19) 36 10 33
Funds held and other 37 15 32 (20) 40
Investment expenses (27) 20 (23) 16 (19)
Net investment income $ 573 9 $ 523 16 $ 449
Because of the interest-sensitive nature of some of the Company’s Life products, net investment income is considered in Management’s assessment of the profi tability of the Life segment (see Life segment above). The following discussion includes net investment income from all investment activities, including the net investment income allocated to the Life segment.
521258_P021-101_MDA.indd 71521258_P021-101_MDA.indd 71 3/18/09 12:22:38 AM3/18/09 12:22:38 AM

PartnerRe Ltd.Management’s Discussion and Analysis of Financial Condition and Results of Operation
72 PartnerReAnnual Report 2008
2008 over 2007
Net investment income increased in 2008 compared to 2007 due to: an increase in net investment income from fi xed maturities due to an increase in the asset -base resulting from the reinvestment of cash fl ows from operations of $1,159 million and from a change in asset allocation from equities to fi xed maturities given the uncertainty and turmoil in equity markets, and higher average reinvestment rates on fi xed maturities in 2008 compared to 2007; and the weakening of the U.S. dollar, on average, during 2008 compared to 2007 contributed -2% of the increase in net investment income; partially offset by a decrease in net investment income from short-term investments and cash and cash -equivalents due to a lower average balance of cash and cash equivalents and lower yields on short-term investments and cash and cash equivalents during 2008 compared to the same period in 2007; a decrease in net investment income from equities due to the reduction in the level -of equity exposures held and lower dividends received on equity securities in 2008 compared to 2007; and an increase in investment expenses of $4 million due to the increase in invested assets -from 2007 to 2008.
2007 over 2006
Net investment income increased in 2007 compared to 2006 due to: an increase in net investment income from fi xed maturities and equities primarily due to an -increase in the asset base resulting from the reinvestment of cash fl ows from operations of $1,099 million, before the net sales of $128 million of trading securities, in 2007 and higher reinvestment rates during 2007; and the weakening of the U.S. dollar, on average, in 2007 compared to 2006 contributed 3% -of the increase in net investment income; partially offset by a decrease in net investment income from short-term investments, trading securities, and -cash and cash equivalents primarily due to the smaller asset allocation in 2007 to cash and cash equivalents and trading securities; a decrease in net investment income on funds held due to the effect of the commutation -of a fi nancing treaty in the Company’s Life segment in 2007, which resulted in a decrease of $4 million of net investment income, and a decrease of $6 million in net investment income reported by a cedant for a longevity treaty in 2007 compared to 2006; and an increase in investment expenses of $4 million resulting from the increase in the -asset base.
2009 Outlook
Management expects a number of offsetting factors to affect net investment income in 2009 as compared to 2008. Positive factors include the Company’s larger invested asset base and the expected positive cash fl ow from operations (including net investment income). Management expects these favorable factors to be offset by lower reinvestment rates due to lower U.S. and European interest rates. Assuming constant foreign exchange rates, Management expects net investment income for 2009 to be comparable to 2008.
Net Realized and Unrealized Investment (Losses) Gains
The Company’s portfolio managers have dual investment objectives of optimizing current investment income and achieving capital appreciation. To meet these objectives, it is often desirable to buy and sell securities to take advantage of changing market conditions and to reposition the investment portfolios. Accordingly, recognition of realized gains and losses is considered by the Company to be a normal consequence of its ongoing investment management activities. Realized and unrealized investment gains and losses are generally a function of multiple factors, with the most signifi cant being prevailing interest rates and equity and credit market conditions.
521258_P021-101_MDA.indd 72521258_P021-101_MDA.indd 72 3/18/09 12:22:51 AM3/18/09 12:22:51 AM

PartnerReAnnual Report 2008
73
PartnerRe Ltd.Management’s Discussion and Analysis of Financial Condition and Results of Operation
As discussed in Overview above, the unprecedented events in the fi nancial markets during the year ended December 31, 2008 had a signifi cant impact on the Company’s investment portfolio and the related level of realized and unrealized losses on investments. For the year ended December 31, 2008, the investment portfolio and net realized and net unrealized investment losses were primarily impacted by increased credit spreads, declines in equity markets and defaults on certain corporate bonds, which were partially offset by a decline in U.S. and European interest rates.
The components of net realized and unrealized investment (losses) gains for the years ended December 31, 2008, 2007 and 2006 were as follows (in millions of U.S. dollars):
2008 2007 2006
Net realized investment losses on fi xed maturities and short-term investments, excluding other-than-temporary impairments $ (16) $ (17) $ (28)
Net realized investment (losses) gains on equities, excluding other-than-temporary impairments (230) 82 91
Other-than-temporary impairments — (125) (27)
Net realized gains on trading securities — 19 22
Change in net unrealized investment (losses) gains on trading securities — (31) 11
Net realized and unrealized investment losses on equity securities sold but not yet purchased — (9) (10)
Net realized and unrealized gains on designated hedging activities — 7 10
Net realized gains (losses) on other invested assets — 10 (1)
Change in net unrealized gains on other invested assets 3 — —
Change in net unrealized investment losses on fi xed maturities subject to the fair value option under SFAS 159 (151) — —
Change in net unrealized investment gains on short-term investments subject to the fair value option under SFAS 159 1 — —
Change in net unrealized investment losses on equities subject to the fair value option under SFAS 159 (145) — —
Net other realized and unrealized investment gains (losses) 7 (8) (21)
Net realized and unrealized investment (losses) gains $ (531) $ (72) $ 47
The Company adopted SFAS 159 on January 1, 2008. Prior to the adoption of SFAS 159, unrealized gains and losses, net of tax, on available for sale securities were recorded as a component of accumulated other comprehensive income in the Consolidated Balance Sheets. Following the adoption of SFAS 159, the Company’s available for sale securities have been reclassifi ed as trading securities and all changes in pre-tax unrealized investment gains and losses are recorded in net realized and unrealized investment losses in the Consolidated Statements of Operations. The net realized and unrealized investment gains and losses on securities previously classifi ed as trading have been recorded within the related investment classifi cation (fi xed maturities or equities) beginning in 2008, and the change in net unrealized investment gains and losses on such securities are included in change in net unrealized investment gains and losses on securities subject to the fair value option under SFAS 159. Following the adoption of SFAS 159, the Company is no longer required to record other-than-temporary impairment charges, as changes in market value are now recorded in net income.
The Company utilizes derivative fi nancial instruments as part of its overall currency risk management strategy to hedge the fair value of certain fi xed income securities that were previously classifi ed as available for sale. Prior to the adoption of SFAS 159 on January 1, 2008, these derivatives were designated as fair value hedges under SFAS 133 “Accounting for Derivative Instruments and Hedging Activities” (SFAS 133) and changes in the fair values
521258_P021-101_MDA.indd 73521258_P021-101_MDA.indd 73 3/18/09 12:23:03 AM3/18/09 12:23:03 AM

PartnerRe Ltd.Management’s Discussion and Analysis of Financial Condition and Results of Operation
74 PartnerReAnnual Report 2008
of these derivatives and the hedged item related to foreign currency were recognized in net realized investment gains and losses in the Consolidated Statement of Operations. As a result of adopting SFAS 159, and in accordance with SFAS 133, changes in the fair values of these securities are recognized in net realized and unrealized investment gains and losses, while changes in the fair value of the foreign currency derivatives are recognized in net foreign exchange gains and losses in the Consolidated Statement of Operations.
2008 over 2007
Net realized and unrealized investment losses increased by $459 million, from a $72 million loss in 2007 to a $531 million loss in 2008 due to increases in credit spreads, declines in worldwide equity markets and defaults on certain corporate bonds, which were partially offset by decreases in U.S. and European risk-free interest rates. Net realized and unrealized investment losses of $531 million in 2008 were primarily due to net realized losses on equities of $230 million, change in net unrealized losses on fi xed maturities of $151 million, change in net unrealized losses on equities of $145 million, and net realized losses on fi xed maturities of $16 million, partially offset by other net realized and unrealized gains of $11 million. The unrealized investment losses refl ect the Company’s adoption of SFAS 159, which was effective January 1, 2008. Thus, the results of 2008 and 2007 are not comparable.
Change in net unrealized gains on other invested assets was $3 million in 2008, compared to net realized gains of $10 million in 2007. The net realized and unrealized gains on other invested assets of $3 million in 2008 primarily related to changes in unrealized gains on treasury and equity futures and credit default swaps, which were partially offset by the change in unrealized losses on insurance linked securities and principal fi nance transactions. The net realized gains on other invested assets of $10 million in 2007 primarily related to treasury futures.
Net other realized and unrealized investment gains of $7 million in 2008 resulted primarily from a $15 million gain related to the expiration of certain representations and warranties the Company provided related to the sale of its U.S. life operations in 2000, which was partially offset by an unrealized loss of $7 million from the Company’s application of the guidance of Derivatives Implementation Group (DIG) Issue No. B36, “Embedded Derivatives: Modifi ed Coinsurance Arrangements and Debt Instruments That Incorporate Credit Risk Exposures That Are Unrelated or Only Partially Related to the Creditworthiness of the Obligor under Those Instruments” (DIG B36). Net other realized and unrealized investment losses of $8 million in 2007 resulted primarily from the impact of foreign exchange on the sale of equity securities.
2007 over 2006
During the years ended December 31, 2007 and 2006, the Company recorded charges for other-than-temporary impairments relating to its investment portfolio of $125 million ($57 million related to fi xed maturity securities and $68 million related to equity securities) and $27 million ($25 million related to fi xed maturity securities and $2 million related to equity securities). Typically, the Company considered impairment to have occurred when events have occurred that are likely to prevent the Company from recovering its investment in the security. The other-than-temporary impairment charges on fi xed maturity securities were mainly a result of wider credit spreads. The Company also recorded other-than-temporary impairment charges on equity securities with large unrealized loss positions. The Company’s other-than-temporary impairment charge for 2007 did not include any write-downs related to sub-prime mortgages as it did not have any direct exposure to the sub-prime mortgage sector in its investment portfolio. Approximately 53% of the impairments recorded in 2007 related to securities of the fi nance sector and approximately 34% related
521258_P021-101_MDA.indd 74521258_P021-101_MDA.indd 74 3/18/09 12:23:15 AM3/18/09 12:23:15 AM

PartnerReAnnual Report 2008
75
PartnerRe Ltd.Management’s Discussion and Analysis of Financial Condition and Results of Operation
to securities of the health care, consumer discretionary and industrial sectors, while the balance was related to securities of the retail and manufacturing sector. Approximately 60% of the impairments recorded in 2006 related to securities of the industrial and manufacturing sector, while the balance was related to securities of the banking and fi nance sector.
Net realized gains on trading securities, change in net unrealized investment (losses) gains on trading securities and net realized and unrealized investment losses on equity securities sold but not yet purchased result from the timing of disposition and the change in fair value of the trading securities.
Net realized and unrealized investment gains on designated hedging activities are primarily due to the comparative interest rate differential between the U.S. dollar and the euro during each period.
Net realized and unrealized gains on other invested assets were $10 million in 2007 compared to net realized and unrealized losses of $1 million in 2006. The difference between 2007 and 2006 resulted primarily from the increase of $14 million in net realized and unrealized gains on treasury futures recorded in 2007 compared to 2006.
Net other realized and unrealized investment losses resulted primarily from the impact of foreign exchange on the sale of equity securities.
Interest in (Losses) Earnings of Equity Investments
The interest in the results of equity investments represents the Company’s share of earnings related to private placement investments and limited partnerships in which the Company has more than a minor interest.
2008 over 2007
Losses from the Company’s interest in the results of equity investments amounted to $5 million in 2008, compared to losses of $83 million in 2007. The loss in 2008 is primarily related to unrealized mark-to-market losses and write-downs related to several unrelated private placement and limited partnership investments, while the loss in 2007 primarily refl ected the write-down of $93 million of the Company’s investment in ChannelRe Holdings as discussed below.
2007 over 2006
Losses from the Company’s interest in the results of equity investments amounted to $83 million in 2007, compared to earnings of $12 million in 2006.
Included in the interest in the results of equity investments is the Company’s share of the results of ChannelRe Holdings. In 2004, the Company purchased a 20% ownership in ChannelRe Holdings, a non-publicly traded fi nancial guaranty reinsurer, which assumed a portfolio of in-force business from MBIA and provides reinsurance services exclusively to MBIA. At December 31, 2007, the value of the Company’s investment in ChannelRe Holdings was written down to $nil, compared to $98 million at December 31, 2006. The underlying risks of this investment are municipal, non-U.S. infrastructure, structured fi nance transactions and CDOs. ChannelRe Holdings has some direct exposure to seasoned sub-prime mortgages in its reinsurance portfolio, and no direct exposure to sub-prime mortgages issued after 2004. ChannelRe Holdings also guaranteed certain CDOs that include sub-prime mortgage collateral. These have high attachment points, and are considered to be well structured.
ChannelRe Holdings provides some coverages on a derivative basis rather than on an insurance basis. The risks and obligations for ChannelRe Holdings are the same under both types of coverages. While coverages on an insurance basis would not be affected by the volatility of the investment market, ChannelRe Holdings has to mark-to-market the value
521258_P021-101_MDA.indd 75521258_P021-101_MDA.indd 75 3/18/09 12:23:31 AM3/18/09 12:23:31 AM

PartnerRe Ltd.Management’s Discussion and Analysis of Financial Condition and Results of Operation
76 PartnerReAnnual Report 2008
of the derivatives based on the current market price of the underlying security, whether or not they expect to incur a claim for losses. Over time, the mark-to-market losses could be reversed if credit spreads tighten or the underlying securities continue to perform as they approach maturity.
The Company’s interest in ChannelRe Holdings’ negative results for the twelve month period ended September 30, 2007 was $6 million, which the Company recorded on a one-quarter lag. However, the Company recorded an additional charge of $87 million in its Consolidated Statements of Operations for the year ended December 31, 2007 to refl ect the write-down of its total investment in ChannelRe Holdings due to unrealized mark-to-market losses on Channel Reinsurance’s credit derivative portfolio, which Channel Reinsurance expected to incur during the three month period ended December 31, 2007 and which were expected to result in ChannelRe Holdings having negative U.S. GAAP shareholders’ equity at that date. ChannelRe Holdings’ fi nancial statements as of December 31, 2007 did present negative U.S. GAAP shareholders’ equity.
Partially offsetting the charge related to ChannelRe Holdings in 2007, the Company recorded $10 million of interest in earnings of equity investments related to other private placement investments and limited partnerships in which the Company has more than a minor interest.
2009 Outlook
With respect to strategic investments, the Company expects to see an increased fl ow of potential opportunities during 2009 as a result of the disruptions in the capital markets. The Company will evaluate these potential new opportunities for attractiveness during the year.
Technical Result and Other Income (Loss)2008 over 2007
Technical result and other income included in Corporate and Other of $1 million and $6 million in 2008 are primarily related to income on insurance linked securities and principal fi nance transactions, and compare to a technical result of $3 million and other loss of $24 million in 2007. The decrease of $2 million in the technical result in 2008 compared to 2007 is primarily related to large catastrophic losses from Hurricane Ike of $13 million, net of reinstatement premiums, in the insurance-linked securities line in 2008, which is partially offset by higher net premiums earned in 2008 compared to 2007. The increase in other income of $30 million in 2008 primarily related to write-downs and mark-to-market adjustments on various transactions in the principal fi nance line in 2007. Subsequent to the adoption of SFAS 159 on January 1, 2008, these are now refl ected in net realized and unrealized investment (losses) gains in the Consolidated Statements of Operations.
2007 over 2006
The increase of $3 million in the technical result for 2007 compared to 2006 resulted primarily from the insurance-linked securities line, which had a technical result of $2 million in 2007, compared to break even in 2006. The decrease of $43 million in other (loss) income in 2007 compared to 2006 was primarily attributable to a decrease of $35 million from the principal fi nance line due to write-downs and mark-to-market adjustments on various transactions in 2007, while 2006 benefi ted from accelerated profi t recognition on the early termination of a number of long-term contracts, and from a decrease of $7 million from the insurance-linked securities line as a result of warmer than expected weather conditions in Japan in 2007.
521258_P021-101_MDA.indd 76521258_P021-101_MDA.indd 76 3/18/09 12:23:45 AM3/18/09 12:23:45 AM

PartnerReAnnual Report 2008
77
PartnerRe Ltd.Management’s Discussion and Analysis of Financial Condition and Results of Operation
Other Operating Expenses
Other operating expenses were as follows (in millions of U.S. dollars):
2008
% Change2008 over
2007 2007
% Change2007 over
2006 2006
Other operating expenses $ 365 12% $ 327 5% $ 310
Other operating expenses represent 9.3%, 8.6% and 8.4% of the net premiums earned (both life and non-life) in 2008, 2007 and 2006, respectively. Other operating expenses included in Corporate and Other were $91 million, $80 million and $75 million, of which $75 million, $67 million and $62 million are related to corporate activities for 2008, 2007 and 2006, respectively.
2008 over 2007
The increase in operating expenses of 12% in 2008 compared to 2007 was primarily a result of higher personnel costs of $22 million, including salaries and stock-based compensation expense, and an increase in withholding taxes of $7 million, which were partially offset by a decrease in fi xed asset depreciation charges. The weakening of the U.S. dollar, on average, in 2008 compared to 2007, contributed 5% to the increase in other operating expenses.
2007 over 2006
The increase in operating expenses of 5% in 2007 compared to 2006 consisted primarily of increases in personnel costs of $16 million and consulting and professional fees of $5 million, partially offset by decreases of $4 million in fi xed asset depreciation and other costs. The weakening of the U.S. dollar, on average, in 2007 compared to 2006 contributed 3% to the increase of other operating expenses.
Financial Condition, Liquidity and Capital ResourcesInvestmentsTotal investments and cash were $11.7 billion at December 31, 2008, compared to $11.6 billion at December 31, 2007. The major factors infl uencing the increase during, 2008 were:
net cash provided by operating activities of $1,159 million; - net proceeds from the Company’s common shares of $113 million related to shares sold -under the forward sale agreement of $212 million and $11 million related to the issuance of common shares under the Company’s equity plans, partially offset by the repurchase of common shares of $110 million under the Company’s share repurchase program; and net proceeds of $28 million from the issuance of Senior Notes, the redemption of the -5.81% fi xed rate bank loan and associated fi nancing costs; partially offset by a decrease in the market value of the investment portfolio (realized and unrealized) of -$531 million resulting from a decrease in the equity portfolio of $375 million and the fi xed maturity portfolio of $167 million, which was partially offset by other net realized and unrealized gains of $11 million; dividend payments on common and preferred shares totaling $135 million; - a decrease in net payable for securities purchased of $17 million; and - other factors, the primary one being the net negative infl uence of the effect of a stronger -U.S. dollar, relative to the euro and other currencies as it relates to the conversion of invested assets into U.S. dollars, amounting to approximately $464 million.
The Company employs a prudent investment philosophy. It maintains a high-quality, well-balanced and liquid portfolio having the dual objectives of optimizing current investment income and achieving capital appreciation. The Company’s invested assets are comprised of total investments, cash and cash equivalents and accrued investment income. From a risk
521258_P021-101_MDA.indd 77521258_P021-101_MDA.indd 77 3/18/09 12:23:57 AM3/18/09 12:23:57 AM

PartnerRe Ltd.Management’s Discussion and Analysis of Financial Condition and Results of Operation
78 PartnerReAnnual Report 2008
management perspective, the Company allocates its invested assets into two categories: liability funds and capital funds. Liability funds represent invested assets supporting the net reinsurance liabilities, defi ned as the Company’s operating and reinsurance liabilities net of reinsurance assets, and are invested entirely in high-quality fi xed income securities. The preservation of liquidity and protection of capital are the primary investment objectives for these assets. The portfolio managers are required to adhere to investment guidelines as to minimum ratings and issuer and sector concentration limitations. Liability funds are invested in a way that generally matches them to the corresponding liabilities in terms of both duration and currency composition to protect the Company against changes in interest and foreign exchange rates. Capital funds represent the capital of the Company and contain most of the asset classes typically viewed as offering a higher risk and higher return profi le, subject to risk assumption and portfolio diversifi cation guidelines which include issuer and sector concentration limitations. Capital funds may be invested in investment grade and below investment grade fi xed income securities, preferred and common stocks, private equity and bond investments, and convertible fi xed income securities. The Company believes that an allocation of a portion of its investments to equities is both prudent and desirable, as it helps to achieve broader asset diversifi cation (lower risk) and maximizes the portfolio’s total return over time.
At December 31, 2008, the liability funds totaled $7.2 billion and were comprised of cash and cash equivalents and high-quality fi xed income securities. The capital funds, which totaled $4.7 billion, were comprised of cash and cash equivalents, investment grade and below investment grade fi xed income securities, preferred and common stocks, private equity and bond investments, and convertible fi xed income securities.
The Company’s investment strategy allows for the use of derivative instruments, subject to strict limitations. The Company utilizes various derivative instruments such as futures contracts, credit default swaps, foreign currency option contracts, foreign exchange forward contracts, written covered call options and total return and interest rate swaps for the purpose of hedging market risk, replicating investment positions, managing market exposure and duration risks, or enhancing investment performance that would be allowed under the Company’s investment policy if implemented in other ways.
Trading Securities
Effective January 1, 2008, the Company adopted SFAS 159. As a result of the adoption of SFAS 159, fi xed maturities, short-term investments and equities that were previously classifi ed as available for sale were reclassifi ed as trading securities. The market value of investments classifi ed as trading securities was $10.8 billion at December 31, 2008. Trading securities are carried at fair value with changes in fair value included in net realized and unrealized investment gains and losses in the Consolidated Statements of Operations. At December 31, 2007, prior to the adoption of SFAS 159, investments classifi ed as available for sale comprised approximately 96% of the Company’s total investments (excluding other invested assets), with 4% being classifi ed as trading securities.
At December 31, 2008, approximately 97% of the Company’s fi xed income securities, including bank loans and other fi xed income type mutual funds, were rated investment-grade (BBB- or higher) by Standard & Poor’s (or estimated equivalent) and 96% of the Company’s fi xed income securities were publicly traded. At December 31, 2007, approximately 96% of the Company’s fi xed income securities, including bank loans and other fi xed income type mutual funds, were rated investment-grade by Standard & Poor’s (or estimated equivalent) and 96% of the invested assets held by the Company were publicly traded. The average credit quality of the Company’s fi xed income securities at December 31, 2008 and 2007 was AA.
521258_P021-101_MDA.indd 78521258_P021-101_MDA.indd 78 3/18/09 12:24:10 AM3/18/09 12:24:10 AM
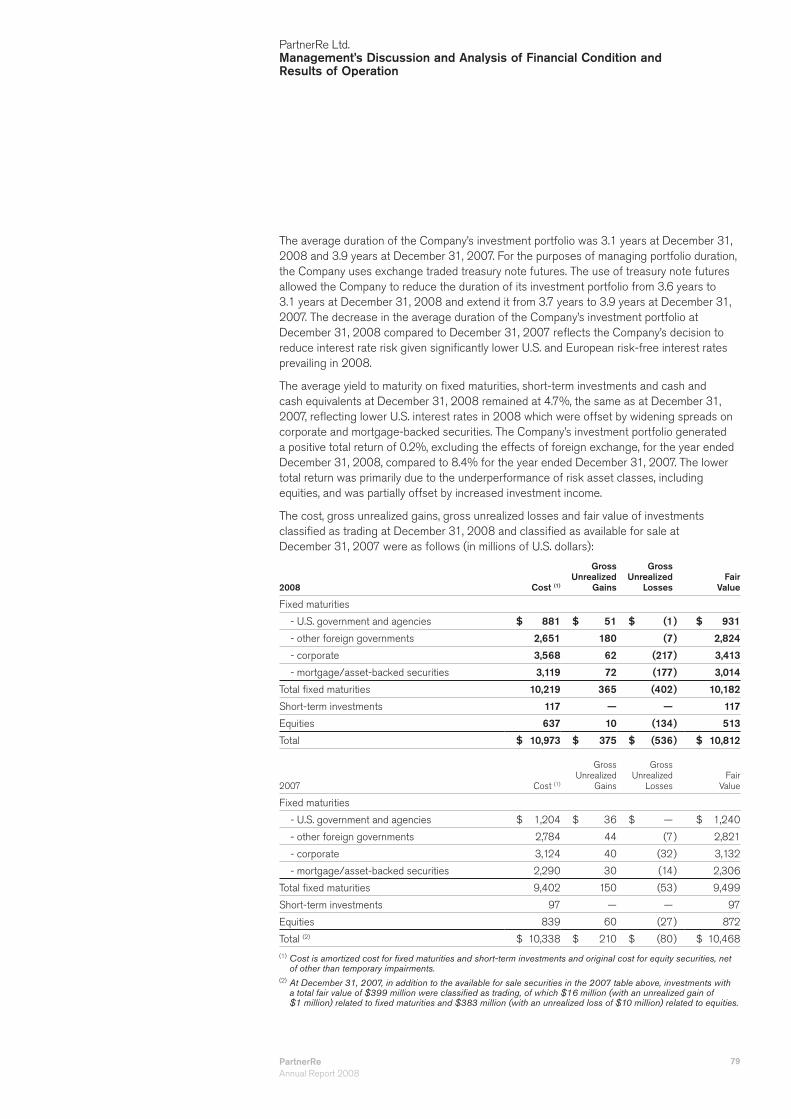
PartnerReAnnual Report 2008
79
PartnerRe Ltd.Management’s Discussion and Analysis of Financial Condition and Results of Operation
The average duration of the Company’s investment portfolio was 3.1 years at December 31, 2008 and 3.9 years at December 31, 2007. For the purposes of managing portfolio duration, the Company uses exchange traded treasury note futures. The use of treasury note futures allowed the Company to reduce the duration of its investment portfolio from 3.6 years to 3.1 years at December 31, 2008 and extend it from 3.7 years to 3.9 years at December 31, 2007. The decrease in the average duration of the Company’s investment portfolio at December 31, 2008 compared to December 31, 2007 refl ects the Company’s decision to reduce interest rate risk given signifi cantly lower U.S. and European risk-free interest rates prevailing in 2008.
The average yield to maturity on fi xed maturities, short-term investments and cash and cash equivalents at December 31, 2008 remained at 4.7%, the same as at December 31, 2007, refl ecting lower U.S. interest rates in 2008 which were offset by widening spreads on corporate and mortgage-backed securities. The Company’s investment portfolio generated a positive total return of 0.2%, excluding the effects of foreign exchange, for the year ended December 31, 2008, compared to 8.4% for the year ended December 31, 2007. The lower total return was primarily due to the underperformance of risk asset classes, including equities, and was partially offset by increased investment income.
The cost, gross unrealized gains, gross unrealized losses and fair value of investments classifi ed as trading at December 31, 2008 and classifi ed as available for sale at December 31, 2007 were as follows (in millions of U.S. dollars):
2008 Cost (1)
GrossUnrealized
Gains
GrossUnrealized
LossesFair
Value
Fixed maturities
- U.S. government and agencies $ 881 $ 51 $ (1) $ 931
- other foreign governments 2,651 180 (7) 2,824
- corporate 3,568 62 (217) 3,413
- mortgage/asset-backed securities 3,119 72 (177) 3,014
Total fi xed maturities 10,219 365 (402) 10,182
Short-term investments 117 — — 117
Equities 637 10 (134) 513
Total $ 10,973 $ 375 $ (536) $ 10,812
2007 Cost (1)
GrossUnrealized
Gains
GrossUnrealized
LossesFair
Value
Fixed maturities
- U.S. government and agencies $ 1,204 $ 36 $ — $ 1,240
- other foreign governments 2,784 44 (7) 2,821
- corporate 3,124 40 (32) 3,132
- mortgage/asset-backed securities 2,290 30 (14) 2,306
Total fi xed maturities 9,402 150 (53) 9,499
Short-term investments 97 — — 97
Equities 839 60 (27) 872
Total (2) $ 10,338 $ 210 $ (80) $ 10,468
(1) Cost is amortized cost for fi xed maturities and short-term investments and original cost for equity securities, net of other than temporary impairments.
(2) At December 31, 2007, in addition to the available for sale securities in the 2007 table above, investments with a total fair value of $399 million were classifi ed as trading, of which $16 million (with an unrealized gain of $1 million) related to fi xed maturities and $383 million (with an unrealized loss of $10 million) related to equities.
521258_P021-101_MDA.indd 79521258_P021-101_MDA.indd 79 3/18/09 12:24:25 AM3/18/09 12:24:25 AM

PartnerRe Ltd.Management’s Discussion and Analysis of Financial Condition and Results of Operation
80 PartnerReAnnual Report 2008
The increase in fi xed maturities and short-term investments from $9.6 billion at December 31, 2007 to $10.3 billion at December 31, 2008 is primarily related to new cash fl ows and a reduction in the Company’s asset allocation to equities, given the uncertainty and turmoil in the fi nancial markets during the latter half of 2008, and also refl ects an increase in mortgage-backed and corporate securities, partially offset by a decrease in U.S. government and agencies.
U.S. government and agencies included both U.S. treasuries and agencies of the U.S. government. At December 31, 2008, U.S. treasuries accounted for 90% of this category. Although U.S. treasuries and U.S. agencies are not rated, they are generally considered to have credit quality equivalent to or greater than AAA corporate issues.
Included in other foreign governments are obligations of non-U.S. governments and their agencies. At December 31, 2008, 88% of this category was rated AAA, while investment grade foreign government and agency obligations accounted for the remaining 12%. The largest three foreign government issuers (Germany, France and Canada) accounted for 87% of this category at December 31, 2008.
Corporate bonds are comprised of obligations of U.S. and foreign corporations. At December 31, 2008, 94% of these investments were rated investment grade (BBB- or higher) by Standard & Poor’s (or estimated equivalent), while 64% were rated A- or better. While the ten largest issuers accounted for 25% of the corporate bonds held by the Company at December 31, 2008, no single issuer accounted for more than 4% of total corporate bonds or 1% of the Company’s total investments and cash at December 31, 2008. At December 31, 2008, U.S. bonds comprised 83% of this category, and the main exposures by economic sector were 36% in fi nance (15% were banks), 14% in communications, 13% in consumer noncyclicals and 10% in industrials. Within the fi nance sector, 99% of corporate bonds were rated investment grade and 89% were rated A- or better at December 31, 2008.
In the mortgage/asset-backed securities category, 90% were U.S. mortgage-backed and asset-backed securities at December 31, 2008. These securities generally have a low risk of default as they are backed by an agency of the U.S. government, which enforces standards on the mortgages before accepting them into the program. They are considered prime mortgages and the major risk is uncertainty of the timing of pre-payments. Although these securities do not carry a formal rating, they are generally considered to have a credit quality equivalent to or greater than AAA. While there have been recent market concerns regarding sub-prime mortgages, the Company did not have direct exposure to these types of securities in its own portfolio at December 31, 2008, other than a $6 million investment in a distressed asset vehicle (included in other invested assets) where the Company deemed that the entry point and price of the investment were attractive. Of the Company’s U.S. mortgage/asset-backed securities of $2.7 billion at December 31, 2008, approximately 5% were rated below AA by Standard & Poor’s (or estimated equivalent). The remaining 10% of this category at December 31, 2008 was comprised of non-U.S. mortgage-backed and asset-backed securities, all of which were rated investment grade (BBB- or higher) by Standard & Poor’s (or estimated equivalent). Within that, 89% were rated AA or higher by Standard & Poor’s (or estimated equivalent).
Short-term investments primarily consisted of obligations of U.S. corporations and U.S. government agencies. At December 31, 2008, corporates comprised 57% of this category, 88% of which were rated investment grade, and 78% of which were in the fi nance sector.
Publicly traded common stocks (including public exchange traded funds and REITS) comprised 84% of equities at December 31, 2008. The majority of the remaining balance was comprised of a $42 million bank loan portfolio, which accounted for 8% of equities, with the balance primarily in high yield and convertible investments. Of the publicly traded
521258_P021-101_MDA.indd 80521258_P021-101_MDA.indd 80 3/18/09 12:24:39 AM3/18/09 12:24:39 AM

PartnerReAnnual Report 2008
81
PartnerRe Ltd.Management’s Discussion and Analysis of Financial Condition and Results of Operation
common stocks, exchange traded funds and REITS, U.S. issuers represented 73% at December 31, 2008. While the ten largest common stocks accounted for 23% of equities (excluding equities held in exchange traded funds and mutual funds) at December 31, 2008, no single common stock issuer accounted for more than 5% of total equities or 1% of the Company’s total investments and cash at December 31, 2008. At December 31, 2008, the largest publicly traded common stock exposures by economic sector were 28% in consumer noncyclicals, 19% in fi nance, 11% in communications, and 11% in energy. The decrease in the Company’s equity portfolio from $0.9 billion at December 31, 2007 to $0.5 billion at December 31, 2008 was primarily due to a change in asset allocation from equities to fi xed income securities and also due to a reduction in market values, both of which were driven by the uncertainty and turmoil in worldwide equity markets.
Maturity DistributionThe distribution of fi xed maturities and short-term investments at December 31, 2008, by contractual maturity date, is shown below (in millions of U.S. dollars). Actual maturities may differ from contractual maturities because certain borrowers have the right to call or prepay certain obligations with or without call or prepayment penalties.
Amortized Cost Fair Value
One year or less $ 546 $ 545
More than one year through fi ve years 3,650 3,649
More than fi ve years through ten years 2,631 2,730
More than ten years 390 361
Subtotal 7,217 7,285
Mortgage/asset-backed securities 3,119 3,014
Total $ 10,336 $ 10,299
Rating DistributionThe following table provides a breakdown of the credit quality of the Company’s fi xed income securities at December 31, 2008:
Rating Category% of Total Fixed
Income Securities
AAA 62 %
AA 5
A 19
BBB 11
Below investment-grade/unrated 3
100 %
The Company’s AAA (or equivalent) rated securities, as a percentage of its total fi xed income portfolio, decreased from 65% at December 31, 2007 to 62% at December 31, 2008. This decrease was the result of a change in asset allocation from U.S. government treasury securities to corporate bonds and mortgage/asset-backed securities given increased credit spreads. The Company’s A (or equivalent) rated securities increased from 12% to 19% over the same period. The average credit quality of the Company’s fi xed income investment portfolio at December 31, 2008 and 2007 was AA.
Other Invested Assets
At December 31, 2008 and 2007, the Company had other invested assets of $74 million and $50 million, respectively. The Company’s other invested assets consist primarily of investments in non-publicly traded companies, private placement equity investments, and other specialty asset classes. These assets, together with the Company’s derivative fi nancial
521258_P021-101_MDA.indd 81521258_P021-101_MDA.indd 81 3/18/09 12:24:52 AM3/18/09 12:24:52 AM

PartnerRe Ltd.Management’s Discussion and Analysis of Financial Condition and Results of Operation
82 PartnerReAnnual Report 2008
instruments that were in an unrealized loss position at December 31, 2008, are reported within other invested assets in the Company’s Consolidated Balance Sheets.
As part of the insurance-linked securities line, the Company has entered into various weather derivatives, for which the underlying risks include parametric weather risks. The Company uses internal valuation models to estimate the fair value of these derivatives and develops assumptions that require signifi cant judgment. The fair value of weather derivatives (the Company’s net liabilities) was a net unrealized loss of $5 million and $2 million at December 31, 2008 and 2007, respectively. At December 31, 2008 and 2007, the total notional value of the Company’s derivatives was $60 million and $39 million, respectively.
As part of its principal fi nance transactions, the Company has entered into total return, interest rate, and credit default swaps, which are accounted for as derivative fi nancial instruments.
For total return and interest swaps within principal fi nance, the Company uses internal valuation models to estimate the fair value and develops assumptions that require signifi cant judgment, such as the timing of future cash fl ows, credit spreads and general level of interest rates. At December 31, 2008, the fair value of the Company’s assumed exposure in the form of total return and interest rate swaps (the Company’s net liabilities), was an unrealized loss of $25 million and $12 million, respectively. At December 31, 2008, the notional value of the Company’s assumed exposure in the form of total return swaps was $240 million. At December 31, 2007, the net fair value and notional value of the Company’s swaps was an unrealized loss of $34 million and $273 million, respectively.
The principal fi nance portfolio mix has broadened, and as a result, the proportion of the portfolio related to apparel and retail future fl ow or intellectual property backed transactions has declined from 56% as of December 31, 2007 to 50% as of December 31, 2008, with the remainder distributed over a number of generally unrelated risks. At December 31, 2008 and 2007, approximately 50% and 56%, respectively, of the underlying investments were rated investment-grade.
For credit default swaps within principal fi nance, the Company uses externally modeled quoted prices that use observable market inputs to estimate the fair value. At December 31, 2008, the fair value of the Company’s assumed exposure in the form of credit default swaps (the Company’s net liabilities), was an unrealized loss of $5 million, which was offset by purchased protection in the form of credit default swaps with an unrealized gain of $7 million. At December 31, 2008, the notional value of the Company’s assumed exposure in the form of credit defaults swaps was $17 million, which was offset by protection purchased through the use of credit default swaps with a notional value of $19 million. At December 31, 2007, there were no credit default swap transactions outstanding within principal fi nance.
The Company utilizes credit default swaps to mitigate the risk associated with its underwriting obligations, most notably in the credit/surety line, to replicate investment positions or to manage market exposures and to reduce the credit risk for specifi c fi xed maturities in its investment portfolio. The counterparties to the Company’s credit default swaps are all highly rated fi nancial institutions. Excluding the credit default swaps included within the principal fi nance portfolio described above, the fair value of these credit default swaps was a net unrealized gain of $2 million and a net unrealized loss of $2 million at December 31, 2008 and 2007, respectively. At December 31, 2008, the notional value of these credit default swaps was $248 million, comprised of $277 million of credit protection purchased and $29 million of credit exposure assumed. As discussed above, the Company uses externally modeled quoted prices that use observable market inputs to estimate the fair value of these swaps.
521258_P021-101_MDA.indd 82521258_P021-101_MDA.indd 82 3/18/09 12:25:04 AM3/18/09 12:25:04 AM

PartnerReAnnual Report 2008
83
PartnerRe Ltd.Management’s Discussion and Analysis of Financial Condition and Results of Operation
The Company uses exchange traded treasury note futures for the purposes of managing portfolio duration. The notional value of the treasury note futures was a net short position of $1,112 million and a long position of $485 million at December 31, 2008 and 2007, respectively, while the fair value of the futures contracts, recorded in other invested assets, was a net unrealized gain of $9 million and $1 million at December 31, 2008 and 2007 respectively. The Company also uses equity futures to replicate equity investment positions. The notional value of the equity futures was a short position of $10 million and $nil at December 31, 2008 and 2007, respectively, while the fair value of the equity futures, recorded in other invested assets, was a net unrealized loss of $1 million and $nil at December 31, 2008 and 2007, respectively.
The Company utilizes foreign exchange forward contracts and foreign currency option contracts as part of its overall currency risk management and investment strategies. Foreign exchange forward contracts outstanding as of December 31, 2008 and 2007 resulted in a net unrealized loss of $5 million and an unrealized gain of $20 million, respectively. Foreign currency option contracts outstanding as of December 31, 2008 and 2007 resulted in an unrealized loss of $8 million and an unrealized gain of $1 million, respectively.
At December 31, 2008 and 2007, the Company had $83 million and $56 million, respectively, in strategic investments. These strategic investments included investments in non-publicly traded companies, private placement equity investments and other specialty asset classes. The Company also had $26 million in notes receivable at December 31, 2008.
Funds Held by Reinsured Companies (Cedants)The Company writes certain business on a funds held basis. As of December 31, 2008 and 2007, the Company recorded $786 million and $1,083 million, respectively, of funds held assets in its Consolidated Balance Sheets, representing 5% of the Company’s total assets at December 31, 2008. The decline in funds held assets at December 31, 2008 compared to December 31, 2007 is primarily due to the stronger U.S. dollar conversion of funds held assets on contracts that are denominated in currencies that have depreciated against the U.S. dollar and due to the non-renewal of a longevity contract which was written on a funds held basis.
Under such contractual arrangements, the cedant retains the net funds that would have otherwise been remitted to the Company and credits the net fund balance with investment income. In general, the purpose of the funds held balances is to provide cedants with additional security that the Company will honor its obligations. The Company is subject to the credit risk of the cedant in the event of insolvency or the cedant’s failure to honor the value of the funds held balances for any other reason. However, the Company’s credit risk is somewhat mitigated by the fact that the Company generally has the contractual ability to offset any shortfall in the payment of the funds held balances with amounts owed by the Company to the cedant for losses payable and other amounts contractually due. At December 31, 2008, the fi ve largest cedants represented 66% of the funds held asset, with overall net offsetting liabilities owed by the Company to those cedants.
Approximately 71% of the funds held assets at December 31, 2008 earned investment income based upon a predetermined interest rate, either fi xed contractually at the inception of the contract or based upon a recognized market index (e.g., LIBOR). Interest rates at December 31, 2008 ranged from 1.0% to 5.0%. Under these contractual arrangements, there are no specifi c assets linked to the funds held assets, and the Company is only exposed to the credit risk of the cedant. These arrangements include two of the fi ve cedants with the largest funds held assets, which represented 39% of the Company’s total funds held asset.
521258_P021-101_MDA.indd 83521258_P021-101_MDA.indd 83 3/18/09 12:25:18 AM3/18/09 12:25:18 AM

PartnerRe Ltd.Management’s Discussion and Analysis of Financial Condition and Results of Operation
84 PartnerReAnnual Report 2008
With respect to the remaining 29% of the funds held assets at December 31, 2008, the Company receives an investment return based upon either the results of a pool of assets held by the cedant, or the investment return earned by the cedant on its entire investment portfolio. This portion of the Company’s funds held assets at December 31, 2008 included three of the fi ve cedants with the largest funds held assets, representing 27% of the Company’s total funds held assets. The Company does not legally own or directly control the investments underlying its funds held assets and only has recourse to the cedant for the receivable balances and no claim to the underlying securities that support the balances. Decisions as to purchases and sales of assets underlying the funds held balances are made by the cedant; in some circumstances, investment guidelines regarding the minimum credit quality of the underlying assets may be agreed upon between the cedant and the Company as part of the reinsurance agreement, or the Company may participate in an investment oversight committee regarding the investment of the net funds, but investment decisions are not otherwise infl uenced by the Company.
Within this portion of the funds held assets, the Company has several annuity treaties which are structured so that the return on the funds held balances is tied to the performance of an underlying group of assets held by the cedant, including fl uctuations in the market value of the underlying assets. One such treaty is a retrocessional agreement under which the Company receives more limited data than what is generally received under a direct reinsurance agreement. In these arrangements, the objective of the reinsurance agreement is to provide for the covered longevity risk and to earn a net investment return on an underlying pool of assets greater than is contractually due to the annuity holders. While the Company is also exposed to the creditworthiness of the cedant, the risk of loss to the Company is somewhat mitigated, as the Company generally has the contractual ability to offset a shortfall in the funds held asset with amounts owed to the cedant. The Company also has non-life treaties in which the investment performance of the net funds held asset corresponds to the interest income on the assets held by the cedant; however, the Company is not directly exposed to the underlying credit risk of these investments, as they serve only as collateral for the Company’s receivables. That is, the amount owed to the Company is unaffected by changes in the market value of the investments underlying the funds held.
In those cases where the Company is exposed to the credit or interest rate risk of an underlying pool of assets, the Company has applied the guidance of DIG B36. Accordingly, the Company recognizes as a realized gain or loss the value of the credit and/or interest rate derivative embedded within the funds held asset balance. In the case of the Company’s annuity contracts, there is also generally a resulting offsetting adjustment to deferred acquisition costs related to this business. At December 31, 2008, the cumulative value of such embedded derivatives was determined to be a loss of approximately $17 million, which is substantially offset by a comparable but opposite adjustment to deferred acquisition costs.
Unpaid Losses and Loss ExpensesThe Company establishes loss reserves to cover the estimated liability for the payment of all losses and loss expenses incurred with respect to premiums earned on the contracts that the Company writes. Loss reserves do not represent an exact calculation of the liability. Estimates of ultimate liabilities are contingent on many future events and the eventual outcome of these events may be different from the assumptions underlying the reserve estimates. The Company believes that the recorded unpaid losses and loss expenses represent Management’s best estimate of the cost to settle the ultimate liabilities based on information available at December 31, 2008.
521258_P021-101_MDA.indd 84521258_P021-101_MDA.indd 84 3/18/09 12:25:30 AM3/18/09 12:25:30 AM

PartnerReAnnual Report 2008
85
PartnerRe Ltd.Management’s Discussion and Analysis of Financial Condition and Results of Operation
At December 31, 2008 and 2007, the Company recorded gross Non-life reserves for unpaid losses and loss expenses of $7,511 million and $7,231 million, respectively, and net Non-life reserves for unpaid losses and loss expenses of $7,385 million and $7,099 million, respectively.
The following table provides a reconciliation of the net Non-life reserves for unpaid losses and loss expenses for the years ended December 31, 2008, 2007 and 2006 (in millions of U.S. dollars):
2008 2007 2006
Net liability at beginning of year $ 7,099 $ 6,732 $ 6,552
Net incurred losses related to:
Current year 2,564 2,042 2,000
Prior years (418) (414) (252)
2,146 1,628 1,748
Net paid losses (1,581) (1,620) (1,860)
Effects of foreign exchange rate changes (279) 359 292
Net liability at end of year $ 7,385 $ 7,099 $ 6,732
See Critical Accounting Policies and Estimates — Losses and Loss Expenses and Life Policy Benefi ts and Review of Net Income–Results by Segment above for a discussion of losses and loss expenses and prior years’ reserve developments for a discussion of the impact of foreign exchange on the net reserves.
The 2008 net incurred losses included $332 million for Hurricane Ike, the 2007 net incurred losses included $53 million for European windstorm Kyrill, and the 2006 net incurred losses refl ected low large loss activity. The Non-life ratio of paid losses to net premiums earned was 47%, 51% and 59%, and the Non-life ratio of paid losses to incurred losses was 74%, 100% and 106% for the years ended December 31, 2008, 2007 and 2006, respectively. The lower non-life ratio of paid losses to incurred losses for the year ended December 31, 2008 compared to 2007 and 2006 is due to a higher level of net incurred losses in 2008, resulting primarily from Hurricane Ike, as well as lower paid losses in 2008 compared to 2007 and 2006, which included loss payments from the 2005 hurricane events.
Policy Benefits for Life and Annuity ContractsAt December 31, 2008 and 2007, the Company recorded gross policy benefi ts for life and annuity contracts of $1,432 million and $1,542 million, respectively, and net policy benefi ts for life and annuity contracts of $1,408 million and $1,499 million, respectively.
The following table provides a reconciliation of the net policy benefi ts for life and annuity contracts for the years ended December 31, 2008, 2007 and 2006 (in millions of U.S. dollars):
2008 2007 2006
Net liability at beginning of year $ 1,499 $ 1,388 $ 1,193
Net incurred losses 463 455 363
Net paid losses (353) (430) (278)
Effects of foreign exchange rate changes (201) 86 110
Net liability at end of year $ 1,408 $ 1,499 $ 1,388
The decrease in net policy benefi ts for life and annuity contracts of $91 million from December 31, 2007 compared to December 31, 2008 is due to the stronger U.S. dollar conversion of policy benefi ts for life and annuity contracts that are denominated in
521258_P021-101_MDA.indd 85521258_P021-101_MDA.indd 85 3/18/09 12:25:42 AM3/18/09 12:25:42 AM

PartnerRe Ltd.Management’s Discussion and Analysis of Financial Condition and Results of Operation
86 PartnerReAnnual Report 2008
currencies that have depreciated against the U.S. dollar, and was partially offset by an increase in net incurred losses, and a decrease in net paid losses in 2008 compared to 2007 due to the commutation of a fi nancing treaty in 2007.
See Critical Accounting Policies and Estimates — Losses and Loss Expenses and Life Policy Benefi ts and Review of Net Income — Results by Segment above for a discussion of life policy benefi ts and prior years’ reserve developments.
Contractual Obligations and CommitmentsIn the normal course of its business, the Company is a party to a variety of contractual obligations as summarized below. These contractual obligations are considered by the Company when assessing its liquidity requirements, and the Company is confi dent in its ability to meet all of its obligations. Contractual obligations at December 31, 2008, were as follows (in millions of U.S. dollars):
Total < 1 year 1-3 years 3-5 years > 5 years
Contractual obligations:
Current portion of long-term debt — principal (1) $ 200.0 $ 200.0 $ — $ — $ —
Long-term debt — principal 200.0 — 200.0 — —
Long-term debt — interest 6.7 4.3 2.4 — —
Operating leases 151.5 26.6 51.7 38.0 35.2
Other operating agreements 27.4 9.2 15.4 2.8 —
Contract fees under forward sale agreement 8.1 5.4 2.7 — —
Other invested assets (2) 89.1 51.1 34.5 3.5 —
Unpaid losses and loss expenses (3) 7,510.7 2,152.1 1,988.0 1,060.3 2,310.3
Policy benefi ts for life and annuity contracts (4) 2,228.9 275.6 158.3 161.4 1,633.6
Deposit liabilities (4) 500.2 56.7 60.2 70.1 313.2
Other long-term liabilities:
Senior Notes — principal (5) 250.0 — — — 250.0
Senior Notes — interest NA 17.2 34.4 34.4 17.2 per annum
CENts — principal (6) 250.0 — — — 250.0
CENts — interest NA 16.1 32.2 32.2 16.1 per annum
Series C cumulative preferred shares — principal (7) 290.0 — — — 290.0
Series C cumulative preferred shares — dividends NA 19.6 39.2 39.2 19.6 per annum
Series D cumulative preferred shares — principal (7) 230.0 — — — 230.0
Series D cumulative preferred shares — dividends NA 15.0 29.9 29.9 15.0 per annum
NA: not applicable(1) On January 14, 2009, the Company repaid the current portion of its long-term debt. Accordingly, the Company’s interest obligation has not been included in the
above table.(2) The amounts above for other invested assets represent the Company’s expected timing of funding capital commitments related to its strategic investments.(3) The Company’s unpaid losses and loss expenses represent Management’s best estimate of the cost to settle the ultimate liabilities based on information available
as of December 31, 2008, and are not fi xed amounts payable pursuant to contractual commitments. The timing and amounts of actual loss payments related to these reserves might vary signifi cantly from the Company’s current estimate of the expected timing and amounts of loss payments based on many factors, including large individual losses as well as general market conditions.
(4) Policy benefi ts for life and annuity contracts and deposit liabilities recorded in the Company’s Consolidated Balance Sheet at December 31, 2008 of $1,432 million and $362 million, respectively, are computed on a discounted basis, whereas the expected payments by period in the table above are the estimated payments at a future time and do not refl ect a discount of the amount payable.
(5) PartnerRe Finance A LLC does not meet the consolidation requirements of FIN 46(R). Accordingly, the Company shows the related intercompany debt of $250.0 million in its Consolidated Balance Sheets.
(6) PartnerRe Finance II Inc. does not meet the consolidation requirements of FIN 46(R). Accordingly, the Company shows the related intercompany debt of $257.6 million in its Consolidated Balance Sheets.
(7) The Company’s Series C and Series D preferred shares are perpetual and have no mandatory redemption requirement. See Note 14 to Consolidated Financial Statements for further information.
521258_P021-101_MDA.indd 86521258_P021-101_MDA.indd 86 3/18/09 12:25:55 AM3/18/09 12:25:55 AM

PartnerReAnnual Report 2008
87
PartnerRe Ltd.Management’s Discussion and Analysis of Financial Condition and Results of Operation
The Contractual Obligations and Commitments table above does not include an estimate of the period of cash settlement of its tax liabilities with the respective taxing authorities given the Company cannot make a reasonably reliable estimate of the timing of cash settlements.
Due to the limited nature of the information presented above, it should not be considered indicative of the Company’s liquidity or capital needs. See Liquidity below.
Shareholders’ Equity and Capital Resources ManagementShareholders’ equity at December 31, 2008 was $4.2 billion, a 2.8% decrease compared to $4.3 billion at December 31, 2007. The major factors contributing to the decrease in shareholders’ equity in 2008 were:
a $163 million decline in the currency translation adjustment, resulting primarily from the -translation of PartnerRe Holdings Europe Limited’s fi nancial statements into the U.S. dollar, including an unrealized loss related to the Company’s designated foreign exchange forward contracts hedging its net investment in foreign subsidiaries and branches; dividends declared on both the Company’s common and preferred shares of $135 million; - repurchase of common shares of $110 million under the Company’s share repurchase -program; and a $13 million increase in the Company’s unfunded pension obligation; partially offset by - proceeds of $212 million from the reissuance of common shares held in treasury related -to the maturity of the Company’s forward sale agreement; net income of $47 million; - a $24 million increase in additional paid in capital due to share-based compensation -expenses and the issuance of common shares under the Company’s employee equity plans of $32 million, which was partially offset by $8 million of contract fees related to the extension of half of the Company’s forward sale agreement; and a $15 million change in net unrealized gains on investments, net of tax. -
On January 1, 2008, following the adoption of SFAS 159, the Company reclassifi ed $106 million from net unrealized gains, net of tax, included in accumulated other comprehensive income to opening retained earnings. This reclassifi cation had no impact on the Company’s total shareholders’ equity.
As part of its long-term strategy, the Company will continue to actively manage capital resources to support its operations throughout the reinsurance cycle and for the benefi t of its shareholders, subject to the ability to maintain strong ratings from the major rating agencies and the unquestioned ability to pay claims as they arise. Generally, the Company seeks to increase its capital when its current capital position is not suffi cient to support the volume of attractive business opportunities available. Conversely, the Company will seek to reduce its capital, through dividends or stock repurchases, when available business opportunities are insuffi cient to fully utilize the Company’s capital at adequate returns.
Management uses growth in diluted book value per share as a prime measure of the value the Company is generating for its common shareholders, as Management believes that growth in the Company’s diluted book value per share ultimately translates into growth in the Company’s stock price. Diluted book value per share is calculated using common shareholders’ equity (shareholders’ equity less the liquidation value of preferred shares) divided by the number of fully diluted common shares outstanding (assuming exercise of all stock-based awards and other dilutive securities). The Company’s diluted book value per share decreased by 6% to $63.95 at December 31, 2008 from $67.96 at December 31, 2007 due to the decline in shareholders’ equity noted above, as well as additional shares outstanding as a result of net shares issuances in 2008.
521258_P021-101_MDA.indd 87521258_P021-101_MDA.indd 87 3/18/09 12:26:08 AM3/18/09 12:26:08 AM

PartnerRe Ltd.Management’s Discussion and Analysis of Financial Condition and Results of Operation
88 PartnerReAnnual Report 2008
The table below sets forth the capital structure of the Company at December 31, 2008 and 2007 (in millions of U.S. dollars):
2008 2007
Capital Structure:
Long-term debt $ 200 4% $ 620 12%
Senior notes (1) 250 5 — —
Capital effi cient notes (2) 250 5 250 5
6.75% Series C cumulative preferred shares, aggregate liquidation 290 6 290 6
6.5% Series D cumulative preferred shares, aggregate liquidation 230 5 230 4
Common shareholders’ equity 3,679 75 3,802 73
Total Capital $ 4,899 100% $ 5,192 100%
(1) PartnerRe Finance A LLC, the issuer of the Senior Notes, does not meet the consolidation requirements of FIN 46(R). Accordingly, the Company shows the related intercompany debt of $250.0 million in its Consolidated Balance Sheets.
(2) PartnerRe Finance II, the issuer of the capital effi cient notes, does not meet the consolidation requirements of FIN 46(R). Accordingly, the Company shows the related intercompany debt of $257.6 million in its Consolidated Balance Sheets.
In May 2008, PartnerRe Finance A LLC (PartnerRe Finance A), an indirect wholly-owned subsidiary of the Company, issued $250 million aggregate principal amount of 6.875% Senior Notes (Senior Notes). The Senior Notes will mature on June 1, 2018 and may be redeemed at the option of the issuer, in whole or in part, at any time. Interest on the Senior Notes is payable semi-annually commencing on December 1, 2008 at an annual fi xed rate of 6.875%, and cannot be deferred.
The Senior Notes are ranked as senior unsecured obligations of PartnerRe Finance A. The Company has fully and unconditionally guaranteed all obligations of PartnerRe Finance A under the Senior Notes. The Company’s obligations under this guarantee are senior and unsecured and rank equally with all other senior unsecured indebtedness of the Company. The proceeds from the Senior Notes were used to redeem the $220 million, 5.81% fi xed rate bank loan owed by PartnerRe U.S. Corporation (PartnerRe U.S. Holdings), a subsidiary of the Company, and the remaining net proceeds were used for general corporate purposes.
In October 2005, the Company entered into a forward sale agreement under which it agreed to sell approximately 6.7 million of its common shares to an affi liate of Citigroup Global Markets Inc., which affi liate is referred to as the forward counterparty. Under the forward sale agreement, the Company would deliver common shares to the forward counterparty on one or more settlement dates chosen by the Company prior to October 2008.
Under the terms of the unamended half of the forward sale agreement, in 2008 the Company delivered 3,366,295 common shares to the forward counterparty for total proceeds of $211.6 million (see Notes 14 and 15 to Consolidated Financial Statements).
On July 31, 2008, the Company amended the existing forward sale agreement. Under the terms of the amendment, half the contract matured according to its original term beginning on September 26, 2008, while the remaining half is extended to April 2010 (see Off-Balance Sheet Arrangements below).
In October 2005, the Company entered into a loan agreement with Citibank, N.A. under which the Company borrowed $400 million. The loan, which had an original maturity of April 2009, bears interest quarterly at a fl oating rate of 3-month LIBOR plus 0.50%. The
521258_P021-101_MDA.indd 88521258_P021-101_MDA.indd 88 3/18/09 12:26:22 AM3/18/09 12:26:22 AM

PartnerReAnnual Report 2008
89
PartnerRe Ltd.Management’s Discussion and Analysis of Financial Condition and Results of Operation
Company was not permitted to prepay the loan prior to its maturity, and the loan was not callable or puttable by the lender other than upon an event of default.
On July 31, 2008, the Company entered into an amendment (Loan Amendment) to the loan agreement with Citibank N.A. Under the terms of the Loan Amendment, the maturity of half of the original $400 million loan was extended to July 12, 2010. The remaining half of the original loan retained its original maturity of April 27, 2009. Under the Loan Amendment, the amended half of the loan will bear interest quarterly at a fl oating rate of 3-month LIBOR plus 0.50% through April 27, 2009 and at a rate of 3-month LIBOR plus 0.85% thereafter. The interest rate on the unamended half of the loan remained unchanged at 3-month LIBOR plus 0.50%.
On January 8, 2009, the Company entered into a second amendment to the loan agreement with Citibank N.A. Under the terms of the second loan amendment, the Company has a right to prepay the half of the original $400 million loan that has a maturity of April 27, 2009. Any such prepayment under the terms of the second loan amendment will be accompanied by payment of accrued and unpaid interest on the prepayment amount. The remaining half of the loan will have a maturity of July 12, 2010 and the Company will not have a right to prepay this amount. The loan is otherwise unchanged.
On January 14, 2009, the Company repaid half of the original $400 million loan that was due April 27, 2009.
In November 2006, PartnerRe Finance II Inc. (PartnerRe Finance II), an indirect wholly-owned subsidiary of the Company, issued $250 million aggregate principal amount of 6.440% Fixed-to-Floating Rate Junior Subordinated Capital Effi cient Notes (CENts). The CENts will mature on December 1, 2066 and may be redeemed at the option of the issuer, in whole or in part, after December 1, 2016 or earlier upon occurrence of specifi c rating agency or tax events. The CENts are ranked as junior subordinated unsecured obligations of PartnerRe Finance II. The Company has fully and unconditionally guaranteed on a subordinated basis all obligations of PartnerRe Finance II under the CENts. The Company’s obligations under this guarantee are unsecured and rank junior in priority of payments to the Company’s current and long-term debt and Senior Notes.
In September 2008, the Company’s Board of Directors increased the shares authorized for repurchase by the Company to 5 million shares. At December 31, 2008, the Company had 5 million common shares remaining under its current share repurchase authorization. During 2008, the Company repurchased an aggregate of 1,532,460 of its common shares pursuant to its repurchase program at a total cost of approximately $110 million, representing an average cost of $71.79 per share, of which a cumulative 1.3 million common shares are currently held in treasury and are available for reissuance.
During 2007, the Company repurchased in the open market 3.6 million of its common shares pursuant to its share repurchase program at a total cost of $275.0 million, representing an average cost of $76.06 per share. No shares were repurchased in 2006.
LiquidityLiquidity is a measure of the Company’s ability to access suffi cient cash fl ows to meet the short-term and long-term cash requirements of its business operations. Management believes that its signifi cant cash fl ows from operations and high quality liquid investment portfolio will provide suffi cient liquidity for the foreseeable future. Cash and cash equivalents were $838 million at December 31, 2008. Cash fl ows from operations in 2008 decreased to $1,159 million, from $1,227 million in 2007. This decrease in cash fl ows from operations
521258_P021-101_MDA.indd 89521258_P021-101_MDA.indd 89 3/18/09 12:26:35 AM3/18/09 12:26:35 AM

PartnerRe Ltd.Management’s Discussion and Analysis of Financial Condition and Results of Operation
90 PartnerReAnnual Report 2008
was mainly due to a change in asset allocation to sell approximately $128 million of trading securities in 2007, which were classifi ed as operating cash fl ows. Following the adoption of SFAS 159 on January 1, 2008, purchases and sales of trading securities are classifi ed as investing cash fl ows. Without the impact of trading securities, net cash provided by operating activities in 2007 was $1,099 million compared to $1,159 million in 2008.
The increase in cash fl ows in 2008 compared to 2007 was primarily due to a 9% increase in net investment income and lower taxes paid, which was partially offset by lower underwriting cash fl ows. The growth in net investment income was primarily a result of an increase in the asset base of the fi xed maturity portfolio, higher average reinvestment rates on fi xed maturities in 2008 compared to 2007, and the weakening of the U.S. dollar, on average, during 2008 compared to 2007. The lower underwriting cash fl ows in 2008 compared to 2007 were primarily driven by an increase in operating expenses.
The Company is a holding company with no operations or signifi cant assets other than the capital stock of the Company’s subsidiaries and other intercompany balances. The Company has cash outfl ows in the form of operating expenses, interest payments related to its long-term debt, dividends to both common and preferred shareholders and, from time to time, cash outfl ows for principal repayments related to its long-term debt, and the repurchase of its common shares under its share repurchase program. For the year ended December 31, 2008, the Company incurred operating expenses of $73 million, interest paid was $16 million, common dividends paid were $100 million and preferred dividends paid were $35 million. In addition, the Company paid approximately $10 million of contract fees and interest related to its forward sale agreement in 2008. In January 2009, the Company announced that it was increasing its quarterly dividend to $0.47 per common share or approximately $106 million in total for 2009, assuming a constant number of common shares outstanding and a constant dividend rate, and it will pay approximately $35 million in dividends to preferred shareholders.
The Company relies primarily on cash dividends and payments from its subsidiaries to pay the operating expenses, interest expense, shareholder dividends and other obligations of the holding company that may arise from time to time. The Company expects future dividends and other permitted payments from its subsidiaries to be the principal source of its funds to pay expenses and dividends. The payment of dividends by the reinsurance subsidiaries to the Company is limited under Bermuda and Irish laws and certain statutes of various U.S. states in which PartnerRe U.S. is licensed to transact business. There are currently no signifi cant restrictions on the payment of dividends by Partner Reinsurance. However, PartnerRe Europe is currently restricted from paying dividends under Irish company law given it has negative retained earnings due to transactions undertaken as part of its reorganization, and PartnerRe U.S. is currently restricted from paying dividends under New York law given it has negative earned surplus (see Note 11 to Consolidated Financial Statements).
The reinsurance subsidiaries of the Company depend upon cash infl ows from the collection of premiums as well as investment income and proceeds from the sales and maturities of investments to meet their obligations. Cash outfl ows are in the form of claims payments, purchase of investments, operating expenses, income tax payments, intercompany payments as well as dividend payments to the holding company, and additionally, in the case of PartnerRe U.S. Holdings, interest payments on the Senior Notes and the CENts. PartnerRe U.S. Holdings and its subsidiaries have $250 million in Senior Notes as well as $250 million of CENts outstanding at December 31, 2008 and it will pay approximately $33 million in aggregate interest payments in 2009 related to this debt.
521258_P021-101_MDA.indd 90521258_P021-101_MDA.indd 90 3/18/09 12:26:49 AM3/18/09 12:26:49 AM

PartnerReAnnual Report 2008
91
PartnerRe Ltd.Management’s Discussion and Analysis of Financial Condition and Results of Operation
Historically, the operating subsidiaries of the Company have generated suffi cient cash fl ows to meet all of their obligations. Because of the inherent volatility of the business written by the Company, the seasonality in the timing of payments by cedants, the irregular timing of loss payments, the impact of a change in interest rates and credit spreads on the investment income as well as seasonality in coupon payment dates for fi xed income securities, cash fl ows from operating activities may vary signifi cantly between periods. The Company expects that annual positive cash fl ows from operating activities will be suffi cient to cover claims payments through 2009, absent a series of unusual catastrophic events. In the unlikely event that paid losses accelerate beyond the ability to fund such payments from operating cash fl ows, the Company would use its cash balances available, or liquidate a portion of its high quality and liquid investment portfolio. As discussed under Investments above, the Company’s investments and cash totaled $11.7 billion at December 31, 2008, the main components of which were investment grade fi xed income securities, short-term investments and cash and cash equivalents totaling $10.9 billion.
The Company and its subsidiaries have access to a revolving line of credit of up to $350 million as part of the Company’s syndicated unsecured credit facility (see Credit Facilities below). As of December 31, 2008, there were no borrowings under this line of credit.
Financial strength ratings and senior unsecured debt ratings represent the opinions of rating agencies on the Company’s capacity to meet its obligations. In the event of a signifi cant downgrade in ratings, the Company’s ability to write business and to access the capital markets could be impacted. Some of the Company’s reinsurance treaties contain special funding and termination clauses that would be triggered in the event the Company or one of its subsidiaries is downgraded by one of the major rating agencies to levels specifi ed in the treaties, or the Company’s capital is signifi cantly reduced. If such an event were to occur, the Company would be required, in certain instances, to post collateral in the form of letters of credit and/or trust accounts against existing outstanding losses, if any, related to the treaty. In a limited number of instances, the subject treaties could be cancelled retroactively or commuted by the cedant (see Risk Factors in Item 1A of Part I of the Company’s Form 10-K for the Company’s fi nancial strength ratings).
Credit FacilitiesIn the normal course of its operations, the Company enters into agreements with fi nancial institutions to obtain unsecured credit facilities. These facilities are used primarily for the issuance of letters of credit, although a portion of these facilities may be used for liquidity purposes. Under the terms of certain reinsurance agreements, irrevocable letters of credit are issued on an unsecured basis in respect of cedants’ reported loss and unearned premium reserves (see Note 18 to Consolidated Financial Statements).
Included in the total credit facilities available to the Company at December 31, 2008, is a $700 million fi ve-year syndicated, unsecured credit facility which matures in September 2010. In February 2009, the Company and its lenders agreed to release one of the participants from its obligations under the syndicated facility. As such, the facility has been reduced from $700 million to $660 million. All other terms and conditions remain unchanged. This credit facility enables the Company to potentially increase its available credit from $660 million to $960 million. The ability of the Company to increase its available credit to $960 million is subject to the agreement of the credit facility participants and, given the current fi nancial crisis and related credit environment, this may be limited.
521258_P021-101_MDA.indd 91521258_P021-101_MDA.indd 91 3/18/09 12:27:03 AM3/18/09 12:27:03 AM

PartnerRe Ltd.Management’s Discussion and Analysis of Financial Condition and Results of Operation
92 PartnerReAnnual Report 2008
The Company and its subsidiaries have access to a revolving line of credit of up to $350 million as part of the Company’s syndicated unsecured credit facility. As of December 31, 2008, there were no borrowings under this line of credit.
The syndicated unsecured credit facility allows for an adjustment to the level of pricing should the Company experience a change in its senior unsecured debt ratings. The pricing grid provides the Company greater fl exibility and simultaneously provides participants under the facility some price protection. As long as the Company maintains a minimum senior unsecured debt rating of BBB+ by Standard & Poor’s and Baa1 by Moody’s, the pricing on the facility will not change signifi cantly (see Risk Factors in Item 1A of Part I of the Company’s Form 10-K for the Company’s fi nancial strength ratings).
Some of the credit facilities contain customary default, cross payment and acceleration provisions and require that the Company maintain certain covenants. The Company’s breach of any of the covenants would result in an event of default, upon which the Company may be required to repay any outstanding borrowings and replace or cash collateralize letters of credit issued under these facilities. The long-term debt and capital securities issued by the Company and its subsidiaries contain similar provisions. These include, but are not limited to, failure to make interest and principal payments, breaches of various covenants, payment defaults or acceleration of indebtedness, certain events of bankruptcy and changes in control of the Company. At December 31, 2008, the Company was in compliance with all required covenants, and no conditions of default existed related to the Company’s credit facilities or any of its debt or capital securities.
Off-Balance Sheet ArrangementsIn October 2005, the Company entered into a forward sale agreement under which it agreed to sell approximately 6.7 million of its common shares to an affi liate of Citigroup Global Markets Inc., which affi liate is referred to as the forward counterparty. Under the forward sale agreement, the Company would deliver common shares to the forward counterparty on one or more settlement dates chosen by the Company prior to October 2008.
Under the terms of the unamended half of the forward sale agreement, in 2008 the Company delivered 3,366,295 common shares to the forward counterparty for total proceeds of $211.6 million.
On July 31, 2008, the Company amended the existing forward sale agreement. Under the terms of the amendment, half the contract matured according to its original term beginning on September 26, 2008 (see Shareholders’ Equity and Capital Resources Management above), while the remaining half is extended to April 2010.
The extension with the forward counterparty allows the Company to deliver 3,366,295 of the 6,732,590 common shares subject to the original contract to the forward counterparty at any time during the remaining term of the agreement, which will mature beginning on April 28, 2010. The future sale price of the Company’s common shares under the amended half of the forward sale agreement will vary depending upon the market price of its common shares over a 40 trading day period surrounding the maturity of the forward sale agreement in April 2010, subject to a minimum price per share of $59.33 and a maximum price per share of $84.43 at December 31, 2008. If the Company elects to settle all or a portion of the forward sale agreement prior to its maturity, the Company will deliver common shares to the forward counterparty and will initially receive the present value of the minimum price per share, and the remaining payment, if any, due to the Company will be made at maturity of the agreement based on the excess of the market price of the Company’s common shares over the minimum
521258_P021-101_MDA.indd 92521258_P021-101_MDA.indd 92 3/18/09 12:27:16 AM3/18/09 12:27:16 AM

PartnerReAnnual Report 2008
93
PartnerRe Ltd.Management’s Discussion and Analysis of Financial Condition and Results of Operation
price per share at maturity of the contract. Settlement of the forward sale agreement may be accelerated by the forward counterparty upon the occurrence of certain events, and the maximum and minimum purchase prices will be reduced or increased quarterly depending on the amount of the Company’s dividends (see Note 15 to Consolidated Financial Statements).
CurrencyThe Company’s reporting currency is the U.S. dollar. The Company has exposure to foreign currency risk due to both its ownership of its Irish, French and Canadian subsidiaries and branches, whose functional currencies are the euro and Canadian dollar, and to underwriting reinsurance exposures, collecting premiums and paying claims and other operating expenses in currencies other than the U.S. dollar and holding certain net assets in such currencies. The Company’s most signifi cant foreign currency exposure is to the euro.
At December 31, 2008, the value of the U.S. dollar strengthened approximately 28% against the British pound, 20% against the Canadian dollar and 4% against the euro compared to December 31, 2007. Since a large proportion of the Company’s assets and liabilities are expressed in these currencies, there was a decrease in the U.S. dollar value of the assets and liabilities denominated in these currencies at December 31, 2008.
Net foreign exchange gains amounted to $6 million during the year ended December 31, 2008 compared to losses of $15 million and $24 million during the years ended December 31, 2007 and 2006, respectively (see Review of Net Income above). In accordance with SFAS 52, “Foreign Currency Translation”, the foreign exchange gain or loss resulting from the translation of its subsidiaries’ and branches’ fi nancial statements (expressed in euro or Canadian dollar functional currency) into U.S. dollars is classifi ed in the currency translation adjustment account, which is a component of accumulated other comprehensive income in shareholders’ equity. The currency translation adjustment account decreased by $163 million during the year ended December 31, 2008 compared to increases of $129 million and $56 million during the years ended December 31, 2007 and 2006, refl ecting both the Company’s net asset exposure to currencies other than the U.S. dollar and the impact of signifi cant foreign exchange fl uctuations, particularly in 2008.
The following table provides a reconciliation of the currency translation adjustment for the years ended December 31, 2008, 2007 and 2006 (in millions of U.S. dollars):
2008 2007 2006
Currency translation adjustment at beginning of year $ 198 $ 69 $ 13
Change in currency translation adjustment included in accumulated other comprehensive income (126) 129 56
Net unrealized loss on designated net investment hedges included in accumulated other comprehensive income (37) — —
Currency translation adjustment at end of year $ 35 $ 198 $ 69
During the fourth quarter of 2008, the Company entered into foreign exchange contracts (with notional amounts of euro 250 million and Canadian $125 million) to hedge a portion of its net investment exposure to euro and Canadian dollar exchange fl uctuations resulting from the translations of its Irish, French and Canadian subsidiaries and branches. The net unrealized loss of $37 million at December 31, 2008 is included in the table above. See Quantitative and Qualitative Disclosures About Market Risk — Foreign Currency Risk below for a discussion of the Company’s risk related to changes in foreign currency movements.
521258_P021-101_MDA.indd 93521258_P021-101_MDA.indd 93 3/18/09 12:27:29 AM3/18/09 12:27:29 AM

PartnerRe Ltd.Management’s Discussion and Analysis of Financial Condition and Results of Operation
94 PartnerReAnnual Report 2008
Effects of InflationThe effects of infl ation are considered implicitly in pricing and estimating reserves for unpaid losses and loss expenses. The actual effects of infl ation on the results of operations of the Company cannot be accurately known until claims are ultimately settled.
New Accounting PronouncementsFSP SFAS 157-2
In February 2008, the FASB issued FSP SFAS 157-2, “Effective Date of FASB Statement No. 157” (FSP SFAS 157-2), which permits a one-year deferral of the application of SFAS 157 for all non-fi nancial assets and non-fi nancial liabilities, except those that are recognized or disclosed at fair value in the fi nancial statements on a recurring basis. The Company will adopt FSP SFAS 157-2 for non-fi nancial assets and non-fi nancial liabilities on January 1, 2009 and is currently evaluating the impact of this adoption on its consolidated shareholders’ equity and net income.
SFAS 160
In December 2007, the FASB issued Statement No. 160, “Noncontrolling Interests in Consolidated Financial Statements — an amendment of ARB No. 51” (SFAS 160). SFAS 160 amends Accounting Research Bulletin No. 51, “Consolidated Financial Statements” (ARB 51) to establish accounting and reporting standards for a noncontrolling interest in a subsidiary and for the deconsolidation of a subsidiary. It also amends certain of ARB 51’s consolidation procedures for consistency with the requirements of FASB Statement No. 141 (revised 2007), “Business Combinations”.
SFAS 160 will be effective for fi scal years beginning after December 15, 2008, and the Company will adopt SFAS 160 as of January 1, 2009. SFAS 160 may not be applied retroactively and early adoption is prohibited. The Company is currently evaluating the impact of the adoption of SFAS 160 on its consolidated shareholders’ equity and net income.
EITF 07-05
In June 2008, the FASB’s Emerging Issues Task Force reached a consensus regarding EITF Issue No. 07-5, “Determining Whether an Instrument (or Embedded Feature) Is Indexed to an Entity’s Own Stock” (EITF 07-5). EITF 07-5 outlines a two-step approach to evaluate the instrument’s contingent exercise provisions, if any, and to evaluate the instrument’s settlement provisions when determining whether an equity-linked fi nancial instrument (or embedded feature) is indexed to an entity’s own stock. EITF 07-5 is effective for fi scal years beginning after December 15, 2008 and must be applied to outstanding instruments as of the beginning of the fi scal year of adoption as a cumulative-effect adjustment to the opening balance of retained earnings. Early adoption is not permitted. The Company is currently evaluating the impact of the adoption of EITF 07-5.
521258_P021-101_MDA.indd 94521258_P021-101_MDA.indd 94 3/18/09 12:27:43 AM3/18/09 12:27:43 AM

PartnerReAnnual Report 2008
95
PartnerRe Ltd.Quantitative and Qualitative Disclosures about Market Risk
OverviewManagement believes that the Company is principally exposed to fi ve types of market related risk: interest rate risk, credit spread risk, foreign currency risk, counterparty credit risk and equity price risk. How these risks relate to the Company, and the process used to manage them, is discussed below.
As discussed previously in this report, the Company’s investment philosophy distinguishes between assets that are generally matched against the estimated net reinsurance assets and liabilities (liability funds) and those assets that represent shareholder capital (capital funds). At December 31, 2008, liability funds represented 61% (or $7.2 billion) of the Company’s total invested assets. Liability funds are invested in a way that generally matches them to the corresponding liabilities in both duration and currency composition. This practice seeks to protect the Company against changes in interest rates and foreign exchange rates. Although the focus of this discussion is to identify risk exposures that impact the market value of assets alone, it is important to recognize that the risks discussed herein are signifi cantly mitigated to the extent that the Company’s investment strategy allows market forces to infl uence the economic valuation of assets and liabilities in a way that is generally offsetting.
At December 31, 2008, capital funds represented 39% (or $4.7 billion) of the Company’s total invested assets. These assets represent shareholders’ capital and are invested in a diversifi ed portfolio with the objective of maximizing investment return, subject to prudent risk constraints. Capital funds contain most of the asset classes typically viewed as offering a higher risk and higher return profi le, such as preferred and common stocks, private equity and bond investments and convertible and high-yield fi xed income securities, in addition to investment-grade securities. At December 31, 2008, 80% of the Company’s capital funds were invested in investment grade fi xed income securities, which was refl ective of the Company’s current view of available returns for higher risk assets. The Company’s investment philosophy is to reduce foreign currency risk on capital funds by investing primarily in U.S. dollar denominated investments. In considering the market risk of capital funds, it is important to recognize the benefi ts of portfolio diversifi cation. Although these asset classes in isolation may introduce more risk into the portfolio, market forces have a tendency to infl uence each class in different ways and at different times. Consequently, the aggregate risk introduced by a portfolio of these assets should be less than might be estimated by summing the individual risks.
The Company’s investment strategy allows the use of derivative investments, subject to strict limitations. Derivative instruments may be used to hedge market risk, to enhance investment performance, to replicate investment positions or to manage market exposure and duration risks that would be allowed under the Company’s investment policy if implemented in other ways. The use of fi nancial leverage, whether achieved through derivatives or margin borrowing, requires approval from the Risk Management and Finance Committee of the Board. The Company also imposes a high standard for the credit quality of counterparties in all derivative transactions and aims to diversify its counterparty credit risk exposure. (See Note 17 to the Consolidated Financial Statements for additional information concerning derivatives.)
The following comments address those areas where the Company believes it has exposure to material market risk in its operations.
521258_P021-101_MDA.indd 95521258_P021-101_MDA.indd 95 3/18/09 12:27:56 AM3/18/09 12:27:56 AM

PartnerRe Ltd.Quantitative and Qualitative Disclosures about Market Risk
96 PartnerReAnnual Report 2008
Interest Rate RiskThe Company’s fi xed income portfolio is exposed to interest rate risk. Fluctuations in interest rates have a direct impact on the market valuation of these securities. The Company manages interest rate risk on liability funds by constructing bond portfolios in which the economic impact of a general interest rate shift is comparable to the impact on the related liabilities. This process involves matching the duration of the investment portfolio to the estimated duration of the liabilities. For loss reserves and policy benefi ts related to non-life and traditional life business, the estimated duration of the Company’s liabilities is based on projected claims payout patterns. For policy benefi ts related to annuity business, the Company estimates duration based on its commitment to annuitants. The Company believes that this matching process mitigates the overall interest rate risk on an economic basis. The Company manages the exposure to interest rate volatility on capital funds by choosing a duration profi le that it believes will optimize the risk-reward relationship.
While this matching of duration insulates the Company from the economic impact of interest rate changes, changes in interest rates do impact the reported U.S. GAAP shareholders’ equity of the Company. The Company’s liabilities are carried at their nominal value, and are not adjusted for changes in interest rates, with the exception of certain policy benefi ts for life and annuity contracts and deposit liabilities that are interest rate sensitive; however, the Company’s invested assets are carried at fair value, which refl ects such changes. As a result, an increase in interest rates will result in a decrease in the fair value of the Company’s investments and a corresponding decrease, net of applicable taxes, in the Company’s shareholders’ equity. A decrease in interest rates would have the opposite effect.
At December 31, 2008, the Company held approximately $3,014 million of its total invested assets in mortgage/asset-backed securities. These assets are exposed to prepayment risk, the adverse impact of which is more evident in a declining interest rate environment.
At December 31, 2008, the Company estimates that the hypothetical case of an immediate 100 basis points or 200 basis points parallel shift in global bond curves would result in a change in fair value of investments exposed to interest rates and total invested assets and shareholders’ equity as follows (in millions of U.S. dollars):
-200 basis points
% change
-100 basispoints
% change
December 31,2008
+100 basispoints
% change
+200 basispoints
% change
Fair value of investments exposed to interest rates (including accrued interest) $ 11,992 6% $ 11,649 3% $ 11,306 $ 10,963 (3)% $ 10,620 (6)%
Total invested assets (including accrued interest) 12,580 6 12,237 3 11,894 11,551 (3) 11,208 (6)
Shareholders’ equity 4,885 16 4,542 8 4,199 3,856 (8) 3,513 (16)
This change does not take into account any potential mitigating impact from the equity market, taxes or the corresponding change in the economic value of the Company’s reinsurance liabilities, which, as noted above, would substantially offset the economic impact on invested assets, although the offset would not be refl ected in the Consolidated Balance Sheets.
As discussed above, the Company strives to match the foreign currency exposure in its fi xed income portfolio to its multicurrency liabilities. The Company believes that this matching process creates a diversifi cation benefi t. Consequently, the exact market value effect of a change in interest rates will depend on which countries experience interest rate changes and the foreign currency mix of the Company’s fi xed income portfolio at the time of the interest rate changes. See Foreign Currency Risk.
521258_P021-101_MDA.indd 96521258_P021-101_MDA.indd 96 3/18/09 12:28:10 AM3/18/09 12:28:10 AM

PartnerReAnnual Report 2008
97
PartnerRe Ltd.Quantitative and Qualitative Disclosures about Market Risk
At December 31, 2007, the Company estimated that the hypothetical case of an immediate 100 basis point adverse parallel shift in global bond curves would result in an approximate 4%, or $404 million, decrease in the fair value of investments exposed to interest rates, or an approximate 3% and 9% decrease of the total invested assets and shareholders’ equity, respectively. Accordingly, the impact of an immediate change in interest rates on the Company’s fair value of investments, total invested assets and shareholders’ equity has not changed signifi cantly at December 31, 2008 compared to December 31, 2007.
Interest rate movements also affect the economic value of the Company’s outstanding debt obligations and preferred securities in the same way that they affect the Company’s fi xed income investments, and this can result in a liability whose economic value is different from the value reported in the Consolidated Balance Sheets. The Company believes that the economic fair value of its outstanding long-term debt, senior notes, capital effi cient notes (CENts) and preferred securities at December 31, 2008 was as follows (in millions of U.S. dollars):
Carrying Value Fair Value
Long-term debt $ 200 $ 196
Senior Notes (1) 250 237
Capital effi cient notes (2) 250 95
Series C cumulative preferred shares 290 220
Series D cumulative preferred shares 230 164
(1) PartnerRe Finance A LLC, the issuer of the Senior Notes, does not meet the consolidation requirements of FIN 46(R). Accordingly, the Company shows the related intercompany debt of $250.0 million in its Consolidated Balance Sheets.
(2) PartnerRe Finance II, the issuer of the capital effi cient notes, does not meet the consolidation requirements of FIN 46(R). Accordingly, the Company shows the related intercompany debt of $257.6 million in its Consolidated Balance Sheets. The fair value of the capital effi cient notes was based on the initial issuance of $250.0 million from PartnerRe Finance II.
The fair value of the long-term debt has been calculated as the present value of estimated future cash fl ows using a discount rate refl ective of the current market cost of borrowing under similar terms and conditions. The fair value of the Senior Notes and CENts has been calculated using quoted market prices based on the initial issuance of $250.0 million from PartnerRe Finance A and $250.0 million from PartnerRe Finance II, respectively. For the Company’s Series C and Series D cumulative preferred shares, fair value is based on quoted market prices, while carrying value is based on the liquidation value of the securities.
The fair value of the Company’s Series C and Series D cumulative preferred shares has not changed signifi cantly at December 31, 2008 compared to December 31, 2007. The $135 million decrease in the fair value of the capital effi cient notes from $230 million at December 31, 2007 to $95 million at December 31, 2008 refl ects increased credit spreads in the current fi nancial environment for this type of debt instrument.
Credit Spread RiskThe Company’s fi xed income portfolio is exposed to credit spread risk. Fluctuations in market credit spreads have a direct impact on the market valuation of these securities. The Company manages credit spread risk by the selection of securities within its fi xed income portfolio. Changes in credit spreads directly affect the market value of certain fi xed income securities, but do not necessarily result in a change in the future expected cash fl ows associated with holding individual securities. Other factors, including liquidity, supply and demand, and changing risk preferences of investors, may affect market credit spreads without any change in the underlying credit quality of the security.
521258_P021-101_MDA.indd 97521258_P021-101_MDA.indd 97 3/18/09 12:28:23 AM3/18/09 12:28:23 AM
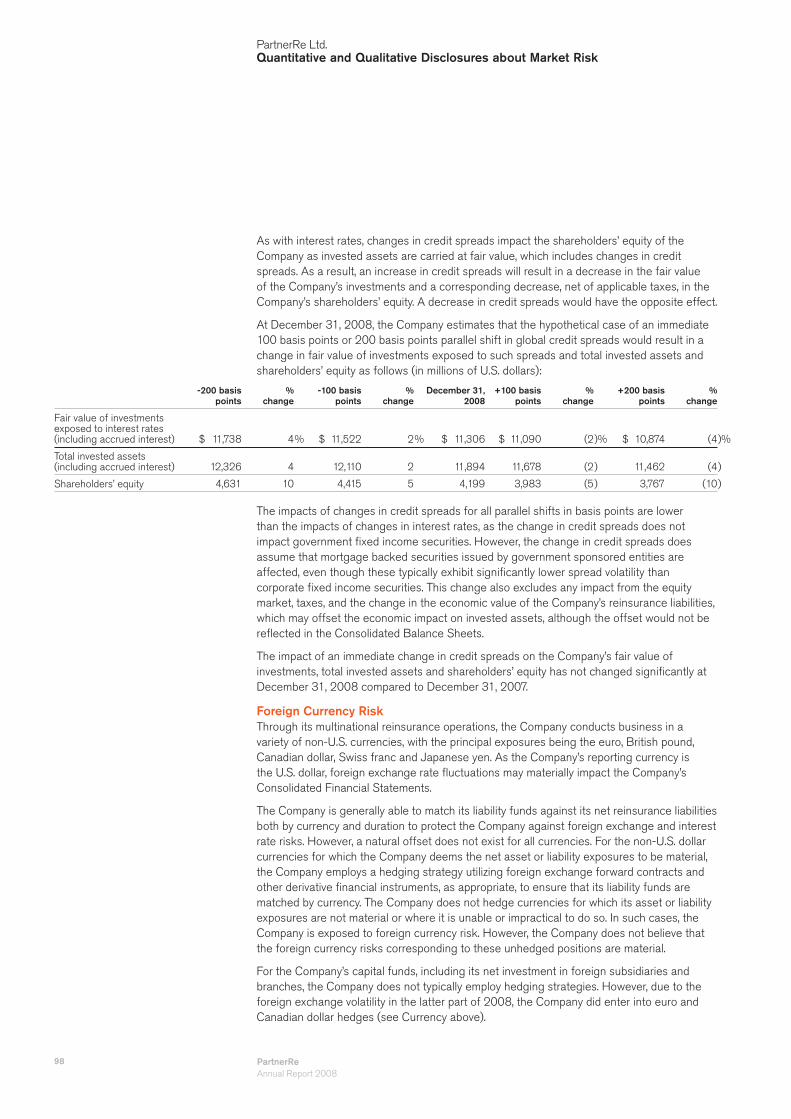
PartnerRe Ltd.Quantitative and Qualitative Disclosures about Market Risk
98 PartnerReAnnual Report 2008
As with interest rates, changes in credit spreads impact the shareholders’ equity of the Company as invested assets are carried at fair value, which includes changes in credit spreads. As a result, an increase in credit spreads will result in a decrease in the fair value of the Company’s investments and a corresponding decrease, net of applicable taxes, in the Company’s shareholders’ equity. A decrease in credit spreads would have the opposite effect.
At December 31, 2008, the Company estimates that the hypothetical case of an immediate 100 basis points or 200 basis points parallel shift in global credit spreads would result in a change in fair value of investments exposed to such spreads and total invested assets and shareholders’ equity as follows (in millions of U.S. dollars):
-200 basis points
% change
-100 basispoints
% change
December 31,2008
+100 basispoints
% change
+200 basispoints
% change
Fair value of investments exposed to interest rates (including accrued interest) $ 11,738 4% $ 11,522 2% $ 11,306 $ 11,090 (2)% $ 10,874 (4)%
Total invested assets (including accrued interest) 12,326 4 12,110 2 11,894 11,678 (2) 11,462 (4)
Shareholders’ equity 4,631 10 4,415 5 4,199 3,983 (5) 3,767 (10)
The impacts of changes in credit spreads for all parallel shifts in basis points are lower than the impacts of changes in interest rates, as the change in credit spreads does not impact government fi xed income securities. However, the change in credit spreads does assume that mortgage backed securities issued by government sponsored entities are affected, even though these typically exhibit signifi cantly lower spread volatility than corporate fi xed income securities. This change also excludes any impact from the equity market, taxes, and the change in the economic value of the Company’s reinsurance liabilities, which may offset the economic impact on invested assets, although the offset would not be refl ected in the Consolidated Balance Sheets.
The impact of an immediate change in credit spreads on the Company’s fair value of investments, total invested assets and shareholders’ equity has not changed signifi cantly at December 31, 2008 compared to December 31, 2007.
Foreign Currency RiskThrough its multinational reinsurance operations, the Company conducts business in a variety of non-U.S. currencies, with the principal exposures being the euro, British pound, Canadian dollar, Swiss franc and Japanese yen. As the Company’s reporting currency is the U.S. dollar, foreign exchange rate fl uctuations may materially impact the Company’s Consolidated Financial Statements.
The Company is generally able to match its liability funds against its net reinsurance liabilities both by currency and duration to protect the Company against foreign exchange and interest rate risks. However, a natural offset does not exist for all currencies. For the non-U.S. dollar currencies for which the Company deems the net asset or liability exposures to be material, the Company employs a hedging strategy utilizing foreign exchange forward contracts and other derivative fi nancial instruments, as appropriate, to ensure that its liability funds are matched by currency. The Company does not hedge currencies for which its asset or liability exposures are not material or where it is unable or impractical to do so. In such cases, the Company is exposed to foreign currency risk. However, the Company does not believe that the foreign currency risks corresponding to these unhedged positions are material.
For the Company’s capital funds, including its net investment in foreign subsidiaries and branches, the Company does not typically employ hedging strategies. However, due to the foreign exchange volatility in the latter part of 2008, the Company did enter into euro and Canadian dollar hedges (see Currency above).
521258_P021-101_MDA.indd 98521258_P021-101_MDA.indd 98 3/18/09 12:28:36 AM3/18/09 12:28:36 AM

PartnerReAnnual Report 2008
99
PartnerRe Ltd.Quantitative and Qualitative Disclosures about Market Risk
The table below summarizes the Company’s gross and net exposure in its December 31, 2008 Consolidated Balance Sheet to foreign currency as well as the associated foreign currency derivatives the Company has put in place to manage this exposure (in millions of U.S. dollars):
euro GBP CAD CHF JPY Other Total (1)
Invested assets $ 2,869 $ 284 $ 493 $ 20 $ 26 $ 47 $ 3,739
Other net liabilities (2,373) (193) (232) (224) (49) (367) (3,438)
Total foreign currency exposure 496 91 261 (204) (23) (320) 301
Total derivative amount (98) (82) (44) 180 58 320 334
Net foreign currency exposure $ 398 $ 9 $ 217 $ (24) $ 35 $ — $ 635(1) As the U.S. dollar is the Company’s reporting currency, there is no currency risk attached to the U.S. dollar and it is excluded from this table. The U.S. dollar
accounted for the difference between the Company’s total foreign currency exposure in this table and the invested assets and other net liabilities in the Company’s Consolidated Balance Sheet.
The above numbers include the Company’s investment in PartnerRe Europe, whose functional currency is the euro, and certain of its branches, whose functional currencies are the euro or Canadian dollar, and the foreign exchange forward contracts that the Company entered into during the fourth quarter of 2008 to hedge a portion of its translation exposure in light of the signifi cant volatility in foreign exchange markets.
Assuming all other variables are held constant and disregarding any tax effects, a change in the U.S. dollar of 10% or 20% relative to the other currencies held by the Company would result in a change in the Company’s net assets of $64 million and $127 million, respectively, inclusive of the effect of the derivative and net investment hedges.
At December 31, 2007, the Company’s net foreign currency exposure in its Consolidated Balance Sheet, after the effect of derivatives, was $844 million. The $209 million decrease in the Company’s net foreign currency exposure compared to December 31, 2007 primarily refl ects a reduction in the Company’s euro exposure which is the result of entering into the net investment hedge.
Counterparty Credit RiskThe Company has exposure to credit risk primarily as a holder of fi xed income securities. The Company controls this exposure by emphasizing investment grade credit quality in the fi xed income securities it purchases. At December 31, 2008, approximately 62% of the Company’s fi xed income portfolio was rated AAA (or equivalent rating), 86% was rated A- or better and 3% of the Company’s fi xed income portfolio was rated below investment-grade. The Company believes this high quality concentration reduces its exposure to credit risk on fi xed income investments to an acceptable level. At December 31, 2008, the Company is not exposed to any signifi cant credit concentration risk on its investments, excluding securities issued by the U.S. and other AAA-rated sovereign governments, with the single largest corporate issuer and the top 10 corporate issuers accounting for 3.4% and 24.7% of the Company’s total corporate fi xed income securities, respectively. The Company keeps cash and cash equivalents in several banks and may keep up to $500 million, excluding custodial accounts, at any point in time in any one bank.
To a lesser extent, the Company also has credit risk exposure as a party to foreign exchange forward contracts and other derivative contracts. To mitigate this risk, the Company monitors its exposure by counterparty, aims to diversify its counterparty credit risk and ensures that counterparties to these contracts are high credit quality international banks or counterparties. These contracts are generally of short duration (approximately 90 days) and settle on a net basis, which means that the Company is exposed to the movement of one currency against the other, as opposed to the notional amount of the contracts. At
521258_P021-101_MDA.indd 99521258_P021-101_MDA.indd 99 3/18/09 12:28:49 AM3/18/09 12:28:49 AM

PartnerRe Ltd.Quantitative and Qualitative Disclosures about Market Risk
100 PartnerReAnnual Report 2008
December 31, 2008, the Company’s absolute notional value of foreign exchange forward contracts and foreign currency option contracts, including the net investment hedge, was $1,764 million, while the net value of those contracts was an unrealized loss of $13 million.
The Company is also exposed to credit risk in its underwriting operations, most notably in the credit/surety line and as part of it principal fi nance activities. Loss experience in these lines of business is cyclical and is affected by the general economic environment. The Company provides its clients in these lines of business with protection against credit deterioration, defaults or other types of fi nancial non-performance of or by the underlying credits that are the subject of the protection provided and, accordingly, the Company is exposed to the credit risk of those credits. As with all of the Company’s business, these risks are subject to rigorous underwriting and pricing standards. In addition, the Company strives to mitigate the risks associated with these credit-sensitive lines of business through the use of risk management techniques such as risk diversifi cation, careful monitoring of risk aggregations and accumulations and, at times, through the use of retrocessional reinsurance protection and the purchase of credit default swaps and total return and interest rate swaps. The Company purchased protection related to its investment portfolio, credit/surety line and principal fi nance activities primarily in the form of credit default swaps with a notional value of $296 million and an unrealized gain of $20 million at December 31, 2008.
At December 31, 2008, the notional value of the Company’s total return swaps was $240 million with an unrealized loss of $25 million, and the fair value of its interest rate swaps was an unrealized loss of $12 million. Separately, the Company has also assumed credit risk to replicate investment positions in the form of credit default swaps with a notional value of $46 million and an unrealized loss of $16 million at December 31, 2008.
The Company is subject to the credit risk of its cedants in the event of their insolvency or their failure to honor the value of the funds held balances due to the Company for any other reason. However, the Company’s credit risk is somewhat mitigated by the fact that the Company generally has the contractual ability to offset any shortfall in the payment of the funds held balances with amounts owed by the Company to cedants for losses payable and other amounts contractually due. Funds held balances for which the Company receives an investment return based upon either the results of a pool of assets held by the cedant or the investment return earned by the cedant on its investment portfolio are exposed to an additional layer of credit risk. The Company is also exposed to some extent to the underlying fi nancial market risk of the pool of assets, inasmuch as the underlying policies may have guaranteed minimum returns.
The Company has exposure to credit risk as it relates to its business written through brokers if any of the Company’s brokers is unable to fulfi ll their contractual obligations with respect to payments to the Company. In addition, in some jurisdictions, if the broker fails to make payments to the insured under the Company’s policy, the Company might remain liable to the insured for the defi ciency. See Risk Factors in Item 1A of Part I of the Company’s report on Form 10-K for detailed information on two brokers that accounted for approximately 42% of the Company’s gross premiums written for the year ended December 31, 2008.
The Company has exposure to credit risk as it relates to its reinsurance balances receivable and reinsurance recoverable on paid and unpaid losses. Reinsurance balances receivable from the Company’s clients at December 31, 2008 were $1,720 million, including balances both currently due and accrued. The Company believes that credit risk related to these balances is mitigated by several factors, including but not limited to, credit checks performed as part of the underwriting process and monitoring of aged receivable balances.
521258_P021-101_MDA.indd 100521258_P021-101_MDA.indd 100 3/18/09 12:29:10 AM3/18/09 12:29:10 AM

PartnerReAnnual Report 2008
101
PartnerRe Ltd.Quantitative and Qualitative Disclosures about Market Risk
In addition, as the vast majority of its reinsurance agreements permit the Company the right to offset reinsurance balances receivable from clients against losses payable to them, the Company believes that the credit risk in this area is substantially reduced. Provisions are made for amounts considered potentially uncollectible and the allowance for uncollectible reinsurance balances receivable was $6 million at December 31, 2008.
Although the Company does not rely heavily on retrocessional reinsurance, it does require its reinsurers to have adequate fi nancial strength. The Company evaluates the fi nancial condition of its reinsurers and monitors its concentration of credit risk on an ongoing basis. Provisions are made for amounts considered potentially uncollectible. The balance of reinsurance recoverable on paid and unpaid losses was $154 million, which is net of the allowance provided for uncollectible reinsurance recoverables of $6 million at December 31, 2008.
The concentrations of the Company’s counterparty credit risk exposures have not changed signifi cantly compared to December 31, 2007.
Equity Price RiskThe Company invests a portion of its capital funds in marketable equity securities (fair market value of $439 million, excluding fi xed income mutual funds of $74 million) at December 31, 2008. These equity investments are exposed to equity price risk, defi ned as the potential for loss in market value due to a decline in equity prices. The Company believes that the effects of diversifi cation and the relatively small size of its investments in equities relative to total invested assets mitigate its exposure to equity price risk. The Company estimates that its equity investment portfolio has a beta versus the S&P 500 and MSCI EAFE Indexes of approximately 0.9 on average. Portfolio beta measures the response of a portfolio’s performance relative to a market return, where a beta of 1 would be an equivalent return to the index. Given the estimated beta for the Company’s equity portfolio, a 10% and 20% movement in the S&P 500 and MSCI EAFE Indexes would result in a change in the fair value of the Company’s equity portfolio, total invested assets and shareholders’ equity as follows:
20%decrease
%change
10%decrease
%change
December 31,2008
10%increase
%change
20%increase
%change
Equities (excluding fi xed income mutual funds) $ 362 (17)% $ 401 (9)% $ 439 $ 477 9% $ 516 17%
Total invested assets (excluding accrued interest) 11,648 (1) 11,687 — 11,725 11,763 — 11,802 1
Shareholders’ equity 4,122 (2) 4,161 (1) 4,199 4,237 1 4,276 2
This change does not take into account any potential mitigating impact from the fi xed income market or taxes.
At December 31, 2007, the Company estimated that a 10% decrease in the S&P 500 Index would result in an approximate 9%, or $120 million, decrease in the fair value of the Company’s equity portfolio, or an approximate 1% and 3% decrease of the total invested assets and shareholders’ equity, respectively. Accordingly, the percentage impact of a decrease in equity markets on the Company’s equity portfolio has not changed signifi cantly at December 31, 2008 compared to December 31, 2007, however, the absolute impacts on the Company’s equity portfolio, total invested assets and shareholders’ equity are signifi cantly reduced compared to December 31, 2007, as a result of the decrease in the equity portfolio.
521258_P021-101_MDA.indd 101521258_P021-101_MDA.indd 101 3/18/09 12:29:28 AM3/18/09 12:29:28 AM
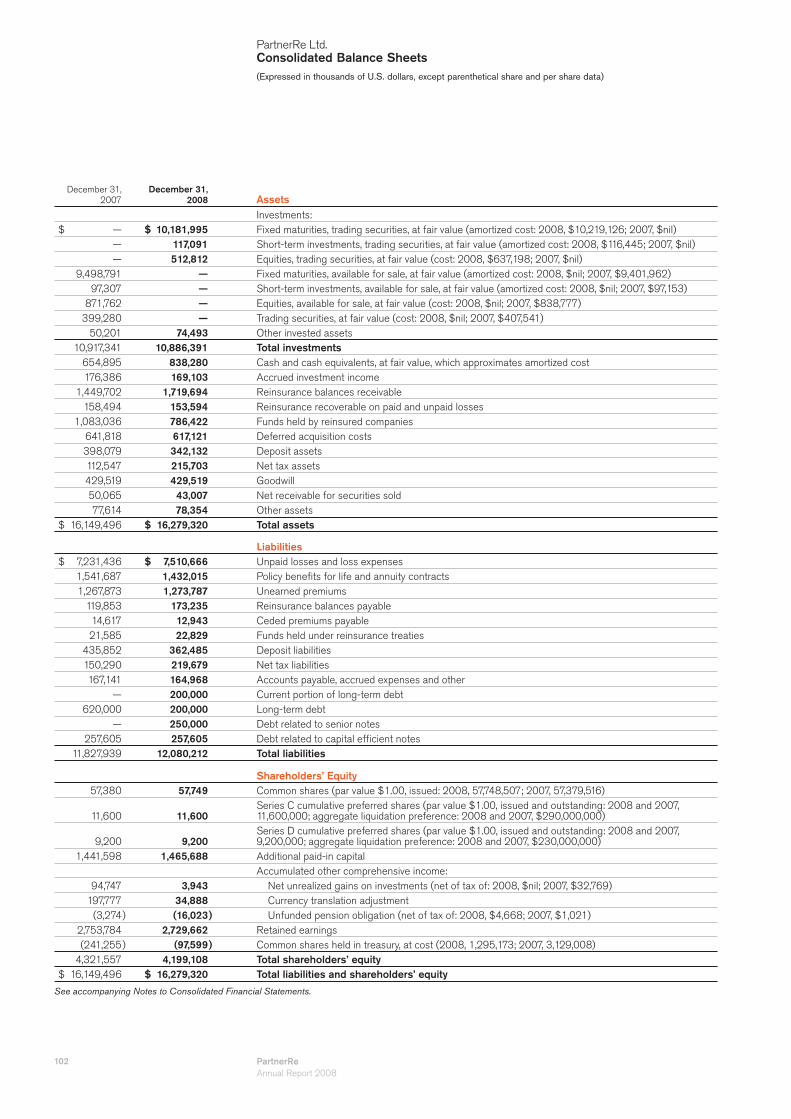
102 PartnerReAnnual Report 2008
PartnerRe Ltd.Consolidated Balance Sheets(Expressed in thousands of U.S. dollars, except parenthetical share and per share data)
December 31,2007
December 31,2008 Assets
Investments: $ — $ 10,181,995 Fixed maturities, trading securities, at fair value (amortized cost: 2008, $10,219,126; 2007, $nil) — 117,091 Short-term investments, trading securities, at fair value (amortized cost: 2008, $116,445; 2007, $nil) — 512,812 Equities, trading securities, at fair value (cost: 2008, $637,198; 2007, $nil) 9,498,791 — Fixed maturities, available for sale, at fair value (amortized cost: 2008, $nil; 2007, $9,401,962) 97,307 — Short-term investments, available for sale, at fair value (amortized cost: 2008, $nil; 2007, $97,153) 871,762 — Equities, available for sale, at fair value (cost: 2008, $nil; 2007, $838,777) 399,280 — Trading securities, at fair value (cost: 2008, $nil; 2007, $407,541) 50,201 74,493 Other invested assets 10,917,341 10,886,391 Total investments 654,895 838,280 Cash and cash equivalents, at fair value, which approximates amortized cost 176,386 169,103 Accrued investment income 1,449,702 1,719,694 Reinsurance balances receivable 158,494 153,594 Reinsurance recoverable on paid and unpaid losses 1,083,036 786,422 Funds held by reinsured companies 641,818 617,121 Deferred acquisition costs 398,079 342,132 Deposit assets 112,547 215,703 Net tax assets 429,519 429,519 Goodwill 50,065 43,007 Net receivable for securities sold 77,614 78,354 Other assets $ 16,149,496 $ 16,279,320 Total assets
Liabilities $ 7,231,436 $ 7,510,666 Unpaid losses and loss expenses 1,541,687 1,432,015 Policy benefi ts for life and annuity contracts 1,267,873 1,273,787 Unearned premiums 119,853 173,235 Reinsurance balances payable 14,617 12,943 Ceded premiums payable 21,585 22,829 Funds held under reinsurance treaties 435,852 362,485 Deposit liabilities 150,290 219,679 Net tax liabilities 167,141 164,968 Accounts payable, accrued expenses and other — 200,000 Current portion of long-term debt 620,000 200,000 Long-term debt — 250,000 Debt related to senior notes 257,605 257,605 Debt related to capital effi cient notes 11,827,939 12,080,212 Total liabilities
Shareholders’ Equity 57,380 57,749 Common shares (par value $1.00, issued: 2008, 57,748,507; 2007, 57,379,516)
11,600 11,600Series C cumulative preferred shares (par value $1.00, issued and outstanding: 2008 and 2007, 11,600,000; aggregate liquidation preference: 2008 and 2007, $290,000,000)
9,200 9,200Series D cumulative preferred shares (par value $1.00, issued and outstanding: 2008 and 2007, 9,200,000; aggregate liquidation preference: 2008 and 2007, $230,000,000)
1,441,598 1,465,688 Additional paid-in capitalAccumulated other comprehensive income:
94,747 3,943 Net unrealized gains on investments (net of tax of: 2008, $nil; 2007, $32,769) 197,777 34,888 Currency translation adjustment (3,274) (16,023) Unfunded pension obligation (net of tax of: 2008, $4,668; 2007, $1,021) 2,753,784 2,729,662 Retained earnings (241,255) (97,599) Common shares held in treasury, at cost (2008, 1,295,173; 2007, 3,129,008) 4,321,557 4,199,108 Total shareholders’ equity $ 16,149,496 $ 16,279,320 Total liabilities and shareholders’ equity
See accompanying Notes to Consolidated Financial Statements.
521258_P102-156_FIN.indd 102521258_P102-156_FIN.indd 102 3/18/09 12:32:20 AM3/18/09 12:32:20 AM

PartnerReAnnual Report 2008
103
PartnerRe Ltd.Consolidated Statements of Operations and Comprehensive Income(Expressed in thousands of U.S. dollars, except share and per share data)
For the yearended
December 31,2006
For the yearended
December 31,2007
For the yearended
December 31,2008 Revenues
$ 3,733,920 $ 3,810,164 $ 4,028,248 Gross premiums written
$ 3,689,548 $ 3,757,109 $ 3,989,435 Net premiums written
(22,280) 20,362 (61,411) (Increase) decrease in unearned premiums
3,667,268 3,777,471 3,928,024 Net premiums earned
449,401 523,259 572,964 Net investment income
47,160 (72,492) (531,360) Net realized and unrealized investment gains (losses)
23,555 (17,479) 10,335 Other income (loss)
4,187,384 4,210,759 3,979,963 Total revenues
Expenses
2,111,337 2,082,461 2,609,220 Losses and loss expenses and life policy benefi ts
849,241 849,715 898,882 Acquisition costs
309,544 326,486 365,009 Other operating expenses
61,387 54,017 51,228 Interest expense
23,204 15,552 (6,221) Net foreign exchange losses (gains)
3,354,713 3,328,231 3,918,118 Total expenses
832,671 882,528 61,845 Income before taxes and interest in earnings (losses) of equity investments
95,305 81,748 9,705 Income tax expense
11,966 (82,968) (5,573) Interest in earnings (losses) of equity investments
749,332 717,812 46,567 Net income
34,525 34,525 34,525 Preferred dividends
$ 714,807 $ 683,287 $ 12,042 Net income available to common shareholders
Comprehensive income (loss), net of tax
$ 749,332 $ 717,812 $ 46,567 Net income
(20,136) 37,834 15,157 Change in net unrealized gains or losses on investments, net of tax
56,120 129,043 (162,889) Change in currency translation adjustment
(418) 4,003 (12,749) Change in unfunded pension obligation, net of tax
$ 784,898 $ 888,692 $ (113,914) Comprehensive income (loss)
Per share data
Net income per common share:
$ 12.58 $ 12.18 $ 0.22 Basic net income
$ 12.37 $ 11.87 $ 0.22 Diluted net income
56,822,496 56,104,359 54,347,052 Weighted average number of common shares outstanding
57,802,787 57,557,920 55,639,600Weighted average number of common and common share equivalents outstanding
$ 1.60 $ 1.72 $ 1.84 Dividends declared per common share
See accompanying Notes to Consolidated Financial Statements.
521258_P102-156_FIN.indd 103521258_P102-156_FIN.indd 103 3/18/09 12:32:36 AM3/18/09 12:32:36 AM

104 PartnerReAnnual Report 2008
PartnerRe Ltd.Consolidated Statements of Shareholders’ Equity(Expressed in thousands of U.S. dollars)
For the yearended
December 31,2006
For the yearended
December 31,2007
For the yearended
December 31,2008 Common shares
$ 56,730 $ 57,076 $ 57,380 Balance at beginning of year
346 791 369 Issue of common shares
— (487) — Repurchase of common shares
57,076 57,380 57,749 Balance at end of year
Preferred shares
20,800 20,800 20,800 Balance at beginning and end of year
Additional paid-in capital
1,373,992 1,413,977 1,441,598 Balance at beginning of year
40,092 60,918 24,090 Issue of common shares
— (33,297) — Repurchase of common shares
(107) — — Reclassifi cation of deferred compensation under SFAS 123(R)
1,413,977 1,441,598 1,465,688 Balance at end of year
Deferred compensation
(107) — — Balance at beginning of year
107 — — Reclassifi cation of deferred compensation under SFAS 123(R)
— — — Balance at end of year
Accumulated other comprehensive income
89,663 118,370 289,250 Balance at beginning of year
— — (105,961) Impact of adopting SFAS 159
(20,136) 37,834 15,157 Change in net unrealized gains or losses on investments, net of tax
56,120 129,043 (162,889) Change in currency translation adjustment
Unfunded pension obligation, net of tax
(418) 4,003 (12,749) Change in unfunded pension obligation, net of tax
(6,859) — — Transition adjustment to apply SFAS 158
118,370 289,250 22,808 Balance at end of year
Retained earnings
1,551,709 2,175,624 2,753,784 Balance at beginning of year
749,332 717,812 46,567 Net income
(90,892) (96,406) (100,102) Dividends on common shares
(34,525) (34,525) (34,525) Dividends on preferred shares
— — (42,023) Reissuance of treasury shares
— — 105,961 Impact of adopting SFAS 159
— (8,721) — Impact of adopting FIN 48
2,175,624 2,753,784 2,729,662 Balance at end of year
Common shares held in treasury
— — (241,255) Balance at beginning of year
— (241,255) (110,017) Repurchase of common shares
— — 253,673 Reissuance of treasury shares
— (241,255) (97,599) Balance at end of year
$ 3,785,847 $ 4,321,557 $ 4,199,108 Total shareholders’ equity
See accompanying Notes to Consolidated Financial Statements.
521258_P102-156_FIN.indd 104521258_P102-156_FIN.indd 104 3/18/09 12:32:48 AM3/18/09 12:32:48 AM

PartnerReAnnual Report 2008
105
PartnerRe Ltd.Consolidated Statements of Cash Flows(Expressed in thousands of U.S. dollars)
For the yearended
December 31,2006
For the yearended
December 31,2007
For the yearended
December 31,2008 Cash flows from operating activities
$ 749,332 $ 717,812 $ 46,567 Net income
Adjustments to reconcile net income to net cash provided by operating activities:
22,311 1,800 7,923 Amortization of net premium on investments
(47,160) 72,492 531,360 Net realized and unrealized investment (gains) losses
Changes in:
(390,470) 127,748 — Net (purchases) sales of trading securities
(12,328) 209,659 (284,771) Reinsurance balances, net
49,126 15,500 2,708 Reinsurance recoverable on paid and unpaid losses
50,049 (34,958) 155,427 Funds held by reinsured companies
(73,207) (55,642) (20,289) Deferred acquisition costs
71,614 15,663 (22,680) Net tax assets and liabilities
(73,617) 16,620 651,021 Unpaid losses and loss expenses including life policy benefi ts
22,280 (20,362) 61,411 Unearned premiums
100,501 145,499 36,540 Other changes in operating assets and liabilities
23,343 15,551 (6,219) Other, net
491,774 1,227,382 1,158,998 Net cash provided by operating activities
Cash flows from investing activities
3,897,715 4,100,792 6,045,475 Sales of fi xed maturities
731,133 963,975 844,948 Redemptions of fi xed maturities
(5,620,788) (6,362,080) (8,093,855) Purchases of fi xed maturities
27,532 175,169 189,452 Sales of short-term investments
295,005 143,040 4,537 Redemptions of short-term investments
(209,743) (272,496) (212,189) Purchases of short-term investments
9,669,692 1,707,193 1,677,671 Sales of equities
(9,236,119) (1,653,316) (1,338,682) Purchases of equities
8,689 4,332 (61,451) Other, net
(436,884) (1,193,391) (944,094) Net cash used in investing activities
Cash flows from financing activities
(125,417) (130,931) (134,627) Cash dividends paid to shareholders
— (275,039) (110,017) Repurchase of common shares
17,225 37,907 222,736 Proceeds from issuance of common and treasury shares
— — (220,000) Redemption of long-term debt
— — 250,000 Proceeds from issuance of senior notes
(9,594) (10,414) (10,006) Contract fees on forward sale agreement
244,096 — — Net issue of capital effi cient notes
(200,000) — — Net redemption of trust preferred securities
(73,690) (378,477) (1,914) Net cash used in financing activities
6,210 10,593 (29,605) Effect of foreign exchange rate changes on cash
(12,590) (333,893) 183,385 (Decrease) increase in cash and cash equivalents 1,001,378 988,788 654,895 Cash and cash equivalents — beginning of year $ 988,788 $ 654,895 $ 838,280 Cash and cash equivalents — end of year
Supplemental cash flow information:
$ 26,869 $ 65,457 $ 36,007 Taxes paid
$ 51,759 $ 55,110 $ 51,190 Interest paid
See accompanying Notes to Consolidated Financial Statements.
521258_P102-156_FIN.indd 105521258_P102-156_FIN.indd 105 3/18/09 12:33:04 AM3/18/09 12:33:04 AM

PartnerRe Ltd.Notes to Consolidated Financial Statements
106 PartnerReAnnual Report 2008
1. OrganizationPartnerRe Ltd. (the Company) provides reinsurance on a worldwide basis through its principal wholly owned subsidiaries, Partner Reinsurance Company Ltd. (Partner Reinsurance), Partner Reinsurance Company of the U.S. (PartnerRe U.S.) and Partner Reinsurance Europe Limited (PartnerRe Europe). Risks reinsured include, but are not limited to property, casualty, motor, agriculture, aviation/space, catastrophe, credit/surety, engineering, energy, marine, specialty property, specialty casualty, multiline and other lines, life/annuity and health and alternative risk products. The Company’s alternative risk products include weather and credit protection to fi nancial, industrial and service companies on a worldwide basis.
The Company was incorporated in August 1993 under the laws of Bermuda. The Company commenced operations in November 1993 upon completion of the sale of common shares and warrants pursuant to subscription agreements and an initial public offering. In July 1997, the Company completed the acquisition of SAFR (subsequently renamed PartnerRe SA), and in December 1998, the Company completed the acquisition of the reinsurance operations of Winterthur Group (Winterthur Re).
On January 1, 2008, the Company completed a reorganization, at which time PartnerRe SA ceased its underwriting operations. As part of the reorganization, PartnerRe SA, its Canadian non-life branch and the Swiss branch of Partner Reinsurance transferred substantially all of their business, assets and liabilities to PartnerRe Europe. Following the reorganization, PartnerRe Europe is the principal reinsurance carrier for all of the Company’s business underwritten in France, Ireland and Switzerland and for the non-life business underwritten in Canada. Contemporaneously, the business, assets and liabilities of the Canadian life branch of PartnerRe SA were transferred to a new Canadian life branch of Partner Reinsurance.
2. Signifi cant Accounting PoliciesThe Company’s Consolidated Financial Statements have been prepared in accordance with accounting principles generally accepted in the United States (U.S. GAAP). The Consolidated Financial Statements include the accounts of the Company and its subsidiaries, including those that meet the consolidation requirements of variable interest entities (VIEs). Intercompany accounts and transactions have been eliminated. To facilitate comparison of information across periods, certain reclassifi cations have been made to prior year amounts to conform to the current year’s presentation.
The preparation of fi nancial statements in conformity with U.S. GAAP requires Management to make estimates and assumptions that affect the reported amounts of assets and liabilities at the date of the fi nancial statements and the reported amounts of revenues and expenses during the reporting period. While Management believes that the amounts included in the Consolidated Financial Statements refl ect its best estimates and assumptions, actual results could differ from those estimates. The Company’s principal estimates include:
Unpaid losses and loss expenses; - Policy benefi ts for life and annuity contracts; - Gross and net premiums written and net premiums earned; - Recoverability of deferred acquisition costs; - Recoverability of deferred tax assets; - Valuation of goodwill; and - Valuation of fi xed maturity and equity investments that are measured using signifi cant -unobservable inputs and valuation of other invested assets, including certain derivative fi nancial instruments.
521258_P102-156_FIN.indd 106521258_P102-156_FIN.indd 106 3/18/09 12:33:19 AM3/18/09 12:33:19 AM

PartnerReAnnual Report 2008
107
PartnerRe Ltd.Notes to Consolidated Financial Statements
(a) PremiumsGross premiums written and earned are based upon reports received from ceding companies, supplemented by the Company’s own estimates of premiums written and earned for which ceding company reports have not been received. Differences between such estimates and actual amounts are recorded in the period in which the estimates are changed or the actual amounts are determined. Net premiums written and earned are presented net of ceded premiums, which represent the cost of retrocessional protection purchased by the Company. Premiums are earned on a basis that is consistent with the risks covered under the terms of the reinsurance contracts, which is generally one to two years. For U.S. and European wind and certain other risks, premiums are earned commensurate with the seasonality of the underlying exposure. Unearned premiums represent the portion of premiums written which is applicable to the unexpired risks under contracts in force. Premiums related to individual life and annuity business are recorded over the premium-paying period on the underlying policies. Premiums on annuity and universal life contracts for which there is no signifi cant mortality or critical illness risk are accounted for in a manner consistent with accounting for interest-bearing fi nancial instruments and are not reported as revenues, but rather as direct deposits to the contract. Amounts assessed against annuity and universal life policyholders are recognized as revenue in the period assessed.
(b) Losses and Loss Expenses and Life Policy BenefitsThe liability for unpaid losses and loss expenses includes amounts determined from loss reports on individual treaties (case reserves), additional case reserves when the Company’s loss estimate is higher than reported by the cedants (ACRs) and amounts for losses incurred but not yet reported to the Company (IBNR). Such reserves are estimated by Management based upon reports received from ceding companies, supplemented by the Company’s own actuarial estimates of reserves for which ceding company reports have not been received, and based on the Company’s own historical experience. To the extent that the Company’s own historical experience is inadequate for estimating reserves, such estimates may be determined based upon industry experience and Management’s judgment. The estimates are continually reviewed and the ultimate liability may be in excess of, or less than, the amounts provided. Any adjustments are refl ected in the periods in which they are determined, which may affect the Company’s operating results in future periods.
The liabilities for policy benefi ts for ordinary life and accident and health policies have been established based upon information reported by ceding companies, supplemented by the Company’s actuarial estimates of mortality, critical illness, persistency and future investment income, with appropriate provision to refl ect uncertainty. Future policy benefi t reserves for annuity and universal life contracts are carried at their accumulated values. Reserves for policy claims and benefi ts include both mortality and critical illness claims in the process of settlement, and claims that have been incurred but not yet reported.
(c) Deferred Acquisition CostsAcquisition costs, primarily brokerage fees, commissions and excise taxes, which vary directly with, and are primarily related to, the acquisition of reinsurance contracts, are capitalized and charged to expense as the related premium is earned. Anticipated losses and loss expenses, other costs and investment income related to these premiums are considered in determining the recoverability of deferred acquisition costs. Acquisition costs related to individual life and annuity contracts are deferred and amortized over the premium-paying periods in proportion to anticipated premium income, allowing for lapses, terminations and anticipated investment income. Acquisition costs related to universal life and single premium annuity contracts for which there is no signifi cant mortality or critical illness risk are deferred and amortized over the lives of the contracts as a percentage of the estimated gross profi ts expected to be realized on the contracts.
521258_P102-156_FIN.indd 107521258_P102-156_FIN.indd 107 3/18/09 12:33:32 AM3/18/09 12:33:32 AM

PartnerRe Ltd.Notes to Consolidated Financial Statements
108 PartnerReAnnual Report 2008
(d) Funds Held by Reinsured Companies (Cedants)The Company writes certain business on a funds held basis. Under such contractual arrangements, the cedant retains the premiums that would have otherwise been paid to the Company and the Company earns interest on these funds. With the exception of those arrangements discussed below, the Company generally earns investment income on the funds held balances based upon a predetermined interest rate, either fi xed contractually at the inception of the contract or based upon a recognized index (e.g., LIBOR).
In certain circumstances, the Company may receive an investment return based upon either the result of a pool of assets held by the cedant, generally used to collateralize the funds held balance, or the investment return earned by the cedant on its entire investment portfolio. This is most common in the Company’s life reinsurance business. In these arrangements, gross investment returns are typically refl ected in net investment income with a corresponding increase or decrease (net of a spread) being recorded as life policy benefi ts in the Company’s Consolidated Statements of Operations. In these arrangements, the Company is exposed, to a limited extent, to the underlying credit risk of the pool of assets inasmuch as the underlying life policies may have guaranteed minimum returns. In such cases, an embedded derivative exists under Statement of Financial Accounting Standards (SFAS) No. 133 Derivatives Implementation Group (DIG) Issue No. B36 “Embedded Derivatives: Modifi ed Coinsurance Arrangements and Debt Instruments That Incorporate Credit Risk Exposures That Are Unrelated or Only Partially Related to the Creditworthiness of the Obligor under Those Instruments”. The fair value of these derivatives is recorded by the Company as an increase or decrease to the funds held balance, which is substantially offset by a comparable but opposite adjustment to deferred acquisition costs.
(e) Deposit Assets and LiabilitiesIn the normal course of its operations, the Company enters into certain contracts that do not meet the risk transfer provisions of SFAS No. 113 “Accounting and Reporting for Reinsurance of Short-Duration and Long-Duration Contracts” (SFAS 113). While these contracts do not meet the risk transfer provisions of SFAS 113, there is a remote possibility that the Company will suffer a loss. These contracts are accounted for using the deposit accounting method in accordance with Statement of Position 98-7 “Deposit Accounting: Accounting for Insurance and Reinsurance Contracts That Do Not Transfer Insurance Risk”. For these contracts, the Company originally records deposit liabilities for an amount equivalent to the consideration received. The consideration to be retained by the Company, irrespective of the experience of the contracts, is earned over the expected settlement period of the contracts, with any unearned portion recorded as a component of deposit liabilities. Actuarial studies are used to estimate the fi nal liabilities under these contracts and the appropriate accretion rates to increase or decrease the liabilities over the term of the contracts. The change for the period is recorded in other income or loss in the Consolidated Statements of Operations.
Under some of these contracts, cedants retain the assets on a funds held basis. In those cases, the Company records those assets as deposit assets and records the related income in other income or loss in the Consolidated Statements of Operations.
(f) InvestmentsEffective January 1, 2008, the Company adopted Financial Accounting Standards Board (FASB) Statement No. 157, “Fair Value Measurements” (SFAS 157). Fair value is the price received to sell an asset or paid to transfer a liability in an orderly transaction between market participants at the measurement date. The Company measures the fair value of fi nancial instruments according to a fair value hierarchy that prioritizes the information used to measure fair value into three broad levels.
521258_P102-156_FIN.indd 108521258_P102-156_FIN.indd 108 3/18/09 12:33:47 AM3/18/09 12:33:47 AM

PartnerReAnnual Report 2008
109
PartnerRe Ltd.Notes to Consolidated Financial Statements
In October 2008, the FASB issued FSP SFAS 157-3 “Determining the Fair Value of a Financial Asset When the Market for That Asset Is Not Active” (FSP SFAS 157-3), which clarifi es the application of SFAS 157 and provides considerations in determining the fair value of a fi nancial asset when the market for that fi nancial asset is not active.
The adoption of SFAS 157 and FSP SFAS 157-3 did not have a material impact on the Company’s consolidated shareholders’ equity or net income. See Note 3 for additional information on fair value.
Effective January 1, 2008, the Company adopted FASB Statement No. 159, “The Fair Value Option for Financial Assets and Financial Liabilities — Including an amendment of FASB Statement No. 115” (SFAS 159). SFAS 159 allows entities to choose, at specifi ed election dates, to measure eligible fi nancial assets and fi nancial liabilities at fair value that are not otherwise required to be measured at fair value. Following the election of the fair value option for an eligible item, changes in that item’s fair value in subsequent reporting periods must be recognized in earnings.
Under the provisions of SFAS 159, the Company elected the fair value option for all of its fi xed maturities, short-term investments, equities and certain other invested assets (including swaps and derivatives but excluding certain other invested assets, such as those that are accounted for using the equity method of accounting or investment company accounting).
On adoption of SFAS 159, the Company recorded a cumulative effect adjustment of $106.0 million, net of taxes, which decreased accumulated other comprehensive income and increased opening retained earnings as of January 1, 2008. The adoption of SFAS 159 did not have any impact on the Company’s consolidated net income, shareholders’ equity nor its comprehensive income.
Following the adoption of SFAS 159, all of the Company’s fi xed maturities, short-term investments and equities that were previously classifi ed as available for sale securities, as well as certain other invested assets, are reported as trading securities. Trading securities are carried at fair value with all changes in fair value included in net realized and unrealized investment gains and losses in the Consolidated Statements of Operations. Prior to the adoption of SFAS 159, fi xed maturities, short-term investments and equities that were classifi ed as available for sale were carried at fair value with the difference between cost or amortized cost and fair value, net of the effect of taxes, included as a separate component of accumulated other comprehensive income in the Consolidated Balance Sheets. The Company believes that accounting for its investments as trading provides a better presentation of the Company’s total return on its investments and also removes an element of management judgment from the preparation of its fi nancial statements by no longer requiring an assessment of its investments for other-than-temporary impairment. Prior to the adoption of SFAS 159, the Company evaluated the fair value of its investments on a periodic basis to determine whether a decline in fair value below the amortized cost basis (original cost basis for equities) was other-than-temporary. If the decline in fair value was judged to be other-than-temporary, the cost or amortized cost of the individual security was written down to fair value and a new cost basis was established, with the amount of the write-down included as a realized investment loss in the period in which the determination of other-than-temporary impairment was made.
Short-term investments comprise securities with a maturity greater than three months but less than one year from the date of purchase.
Other invested assets consist primarily of investments in non-publicly traded companies, private placement equity investments, derivative fi nancial instruments and other specialty asset classes. Entities in which the Company has an ownership of more than 20% and less than 50% of the voting shares, and limited partnerships in which the Company has more
521258_P102-156_FIN.indd 109521258_P102-156_FIN.indd 109 3/18/09 12:34:01 AM3/18/09 12:34:01 AM

PartnerRe Ltd.Notes to Consolidated Financial Statements
110 PartnerReAnnual Report 2008
than a minor interest, are accounted for using the equity method. Other invested assets are recorded based on valuation techniques depending on the nature of the individual assets. The valuation techniques used by the Company are generally commensurate with standard valuation techniques for each asset class.
Net investment income includes interest and dividend income, amortization of premiums and discounts on fi xed maturities and short-term investments and investment income on funds held, and is net of investment expenses and withholding taxes. Investment income is recognized when earned. Realized gains and losses on the disposal of investments are determined on a fi rst-in, fi rst-out basis. Investment purchases and sales are recorded on a trade-date basis.
(g) Cash and Cash EquivalentsCash equivalents are carried at fair value and include debt securities that, at purchase, have a maturity of three months or less.
(h) GoodwillGoodwill represents the excess of the purchase price over the fair value of the net assets acquired of PartnerRe SA and Winterthur Re. SFAS No. 142 “Goodwill and Other Intangible Assets”, requires that the Company perform, at a minimum, an annual valuation of its goodwill asset to test it for impairment. The Company has established September 30 as the date for performing its annual impairment test. If, as a result of the assessment, the Company determines that the value of its goodwill asset is impaired, goodwill will be written down in the period in which the determination is made. Neither the Company’s initial valuation nor its subsequent valuations has indicated any impairment of the Company’s goodwill asset.
(i) Income TaxesCertain subsidiaries and branches of the Company operate in jurisdictions where they are subject to taxation. Current and deferred income taxes are charged or credited to net income, or, in certain cases, to accumulated other comprehensive income, based upon enacted tax laws and rates applicable in the relevant jurisdiction in the period in which the tax becomes accruable or realizable. Deferred income taxes are provided for all temporary differences between the bases of assets and liabilities used in the Consolidated Balance Sheets and those used in the various jurisdictional tax returns. When Management’s assessment indicates that it is more likely than not that deferred income tax assets will not be realized, a valuation allowance is recorded against the deferred tax assets. The Company recognizes a tax benefi t relating to uncertain tax positions only where the position is more likely than not to be sustained assuming examination by tax authorities. A liability must be recognized for any tax benefi t (along with any interest and penalty, if applicable) claimed in a tax return in excess of the amount allowed under FASB Interpretation No. 48, “Accounting for Uncertainty in Income Taxes — an interpretation of FASB Statement No. 109” (FIN 48).
(j) Translation of Foreign CurrenciesThe reporting currency of the Company is the U.S. dollar. The national currencies of the Company’s subsidiaries and branches are generally their functional currencies, except for the Bermuda subsidiaries and the Company’s Swiss branch, whose functional currencies are the U.S. dollar. In translating the fi nancial statements of those subsidiaries or branches whose functional currency is other than the U.S. dollar, assets and liabilities are converted into U.S. dollars using the rates of exchange in effect at the balance sheet dates, and revenues and expenses are converted using the average foreign exchange rates for the period. The effect of translation adjustments are reported in the Consolidated Balance Sheets as currency translation adjustment, a separate component of accumulated other comprehensive income.
In recording foreign currency transactions, revenue and expense items are converted into the functional currency at the average rates of exchange for the period. Assets and liabilities
521258_P102-156_FIN.indd 110521258_P102-156_FIN.indd 110 3/18/09 12:34:15 AM3/18/09 12:34:15 AM
PartnerReAnnual Report 2008
111
PartnerRe Ltd.Notes to Consolidated Financial Statements
originating in currencies other than the functional currency are translated into the functional currency at the rates of exchange in effect at the balance sheet dates. The resulting foreign exchange gains or losses are included in net foreign exchange gains and losses in the Consolidated Statements of Operations. The Company also records realized and unrealized foreign exchange gains and losses on certain hedged items in net foreign exchange gains and losses in the Consolidated Statements of Operations (see Note 2(k)).
(k) Derivatives Used in Hedging ActivitiesThe Company utilizes derivative fi nancial instruments as part of its overall currency risk management strategy. SFAS No. 133 “Accounting for Derivative Instruments and Hedging Activities” (SFAS 133) requires the recognition of all derivative fi nancial instruments, including embedded derivative instruments, as either assets or liabilities in the Consolidated Balance Sheets and measurement of those instruments at fair value. On the date the Company enters into a derivative contract, Management designates whether the derivative is to be used as a hedge of an identifi ed underlying exposure (a designated hedge). The accounting for gains and losses associated with changes in the fair value of a derivative and the effect on the Consolidated Financial Statements depends on its hedge designation and whether the hedge is highly effective in achieving offsetting changes in the fair value of the asset or liability being hedged.
Following the adoption of SFAS 159, derivatives employed by the Company to hedge currency exposure related to fi xed income securities and derivatives employed by the Company to hedge currency exposure related to other reinsurance assets and liabilities, except for the hedge of the Company’s net investment in non-U.S. dollar functional currency subsidiaries and branches, are no longer designated as hedges under SFAS 133. The changes in fair value of the non-designated hedges are recognized in net foreign exchange gains and losses in the Consolidated Statements of Operations.
Prior to the adoption of SFAS 159, the Company used currency derivatives to hedge the fair value of certain available for sale fi xed income securities related to the Company’s liability funds (funds representing invested assets supporting net reinsurance liabilities, defi ned as the Company’s operating and reinsurance liabilities net of reinsurance assets). These derivatives were designated as fair value hedges under SFAS 133, and accordingly, the changes in fair value of the derivative and the hedged item related to foreign currency were recognized in net realized investment gains and losses in the Consolidated Statements of Operations.
As part of its overall strategy to manage its level of currency exposure, the Company uses forward foreign exchange derivatives to partially hedge the net investment in certain non-U.S. dollar functional currency subsidiaries and branches. These derivatives have been designated as net investment hedges under SFAS 133, and accordingly, the changes in fair value of the derivative and the hedged item related to foreign currency are recognized in currency translation adjustment in the Consolidated Balance Sheets.
The Company formally documents all relationships between designated hedging instruments and hedged items, as well as its risk management objective and strategy for undertaking various hedge transactions. In this documentation, the Company specifi cally identifi es the asset or liability that has been designated as a hedged item and states how the hedging instrument is expected to hedge the risks related to the hedged item. The Company formally measures effectiveness of its designated hedging relationships, both at the hedge inception and on an ongoing basis. The Company assesses the effectiveness of its designated hedges using the period-to-period dollar offset method on an individual currency basis. If the ratio obtained with this method is within the range of 80% to 125%, the Company considers the hedge effective under SFAS 133. The time value component of the designated net investment hedges is included in the assessment of hedge effectiveness.
521258_P102-156_FIN.indd 111521258_P102-156_FIN.indd 111 3/18/09 12:34:28 AM3/18/09 12:34:28 AM

PartnerRe Ltd.Notes to Consolidated Financial Statements
112 PartnerReAnnual Report 2008
The Company will discontinue hedge accounting prospectively if it is determined that the derivative is no longer effective in offsetting changes in the fair value of a hedged item. To the extent that the Company discontinues hedge accounting related to its net investment in non-U.S. dollar functional currency subsidiaries and branches, because, based on Management’s assessment, the derivative no longer qualifi es as an effective hedge, the derivative will continue to be carried in the Consolidated Balance Sheets at its fair value, with changes in its fair value recognized in current period net income through net foreign exchange (gains) losses.
(l) Investment Related DerivativesThe Company’s investment strategy allows for the use of derivative instruments, subject to strict limitations. The Company utilizes various derivative instruments such as futures contracts, credit default swaps, foreign currency option contracts, foreign exchange forward contracts and written covered call options for the purpose of replicating investment positions, managing market exposure and duration risks, or enhancing investment performance. These instruments are recorded at fair value as assets and liabilities in the Consolidated Balance Sheets and changes in fair value are included in net realized and unrealized investment gains and losses in the Consolidated Statements of Operations, and changes in the fair value of foreign currency option contracts and foreign exchange forward contracts are included in net foreign exchange gains and losses in the Consolidated Statements of Operations. The fair value of these derivatives are based on quoted market prices, or internal valuation models where quoted market prices are not available. Margin balances required by counterparties, which are equal to a percentage of the total value of open futures contracts, are included in cash and cash equivalents.
(m) Weather DerivativesThe Company has entered into weather related transactions that are structured as insurance, reinsurance or derivatives. When those transactions are determined to be derivatives, they are recorded at fair value with the changes in fair value reported in net realized and unrealized investment gains and losses in the Consolidated Statements of Operations. The Company uses internal valuation models to estimate the fair value of these derivatives.
(n) Total Return and Interest Rate SwapsThe Company has entered into total return and interest rate swaps. Margins related to these swaps are included in other income or loss in the Consolidated Statements of Operations and any changes in the fair value of the swaps are included in net realized and unrealized investment gains and losses in the Consolidated Statements of Operations. The Company records these swaps at fair value, based on internal valuation models.
(o) Treasury SharesCommon shares repurchased by the Company and not cancelled are classifi ed as treasury shares, and are recorded at cost. This results in a reduction of shareholders’ equity in the Consolidated Balance Sheets. When shares are reissued from treasury, the Company uses the average cost method to determine the cost of the reissued shares. Gains on sales of treasury stock are credited to additional paid-in capital, while losses are charged to additional paid-in capital to the extent that previous net gains from sales or retirements of treasury shares are included therein, otherwise losses are charged to retained earnings.
(p) Net Income per Common ShareDiluted net income per common share is defi ned as net income available to common shareholders divided by the weighted average number of common and common share equivalents outstanding, calculated using the treasury stock method for all potentially dilutive securities. Net income available to common shareholders is defi ned as net income less preferred share dividends. When the effect of dilutive securities would be anti-dilutive,
521258_P102-156_FIN.indd 112521258_P102-156_FIN.indd 112 3/18/09 12:34:42 AM3/18/09 12:34:42 AM

PartnerReAnnual Report 2008
113
PartnerRe Ltd.Notes to Consolidated Financial Statements
these securities are excluded from the calculation of diluted net income per share. Basic net income per share is defi ned as net income available to common shareholders divided by the weighted average number of common shares outstanding for the period, giving no effect to dilutive securities.
(q) Share-Based CompensationThe Company currently uses fi ve types of share-based compensation: stock options, restricted shares (RS), restricted share units (RSU), stock appreciation rights (SAR) and shares issued under the Company’s employee stock purchase plans.
The fair value of the compensation cost is measured at the grant date and is expensed over the period for which the employee is required to provide services in exchange for the award. Forfeiture benefi ts are estimated at the time of grant and incorporated in the determination of share-based compensation costs. Awards granted to employees who are eligible for retirement and do not have to provide additional services are expensed at the date of grant.
(r) PensionsThe Company adopted SFAS No. 158, “Employers’ Accounting for Defi ned Benefi t Pension and Other Postretirement Plans — an amendment of FASB Statements No. 87, 88, 106, and 132(R)” (SFAS 158) as of December 31, 2006. The Company recognizes an asset or a liability in the Consolidated Balance Sheets for the funded status of defi ned benefi t plans that are overfunded or underfunded, respectively, measured as the difference between the fair value of plan assets and the pension obligation and recognizes changes in the funded status of defi ned benefi t plans in the year in which the changes occur as a component of accumulated other comprehensive income, net of tax.
(s) Variable Interest EntitiesFASB Interpretation No. 46 (revised December 2003) “Consolidation of Variable Interest Entities — an interpretation of ARB No. 51” (FIN 46(R)) requires a variable interest entity (VIE) to be consolidated by a company if that company is determined to be the primary benefi ciary of the VIE, such that it is subject to a majority of the risk of loss from the VIE’s activities or is entitled to receive a majority of the VIE’s residual returns or both. A VIE is a corporation, partnership, trust or any other legal structure used for business purposes that either (a) does not have equity investors with voting rights or (b) has equity investors that do not provide suffi cient fi nancial resources for the entity to support its activities. The Company has determined that PartnerRe Finance A, which issued the Senior Notes, and PartnerRe Finance II, which issued the capital effi cient notes (CENts), do not meet the consolidation requirements of FIN 46(R). As a result, the Company has not consolidated PartnerRe Finance A and PartnerRe Finance II and has refl ected the debt issued by the Company related to the Senior Notes and CENts as liabilities in the Consolidated Balance Sheets (see Note 13). The interest on the debt related to the Senior Notes and CENts is reported as interest expense in the Consolidated Statements of Operations.
(t) Segment ReportingThe Company monitors the performance of its operations in three segments, Non-life, Life and Corporate & Other. The Non-life segment is further divided into four sub-segments: U.S., Global (Non-U.S.) Property and Casualty (Global (Non-U.S.) P&C), Global (Non-U.S.) Specialty, and Catastrophe.
Segments and sub-segments represent markets that are reasonably homogeneous in terms of geography, client types, buying patterns, underlying risk patterns and approach to risk management. These segments and sub-segments were determined in accordance with SFAS No. 131, “Disclosures about Segments of an Enterprise and Related Information”.
521258_P102-156_FIN.indd 113521258_P102-156_FIN.indd 113 3/18/09 12:34:55 AM3/18/09 12:34:55 AM

PartnerRe Ltd.Notes to Consolidated Financial Statements
114 PartnerReAnnual Report 2008
(u) Recent Accounting Pronouncements FSP SFAS 157-2
In February 2008, the FASB issued FSP SFAS 157-2, “Effective Date of FASB Statement No. 157” (FSP SFAS 157-2), which permits a one-year deferral of the application of SFAS 157 for all non-fi nancial assets and non-fi nancial liabilities, except those that are recognized or disclosed at fair value in the fi nancial statements on a recurring basis. The Company will adopt FSP SFAS 157-2 for non-fi nancial assets and non-fi nancial liabilities on January 1, 2009 and is currently evaluating the impact of this adoption on its consolidated shareholders’ equity and net income.
SFAS 160
In December 2007, the FASB issued Statement No. 160, “Noncontrolling Interests in Consolidated Financial Statements — an amendment of ARB No. 51” (SFAS 160). SFAS 160 amends Accounting Research Bulletin No. 51, “Consolidated Financial Statements” (ARB 51) to establish accounting and reporting standards for a noncontrolling interest in a subsidiary and for the deconsolidation of a subsidiary. It also amends certain of ARB 51’s consolidation procedures for consistency with the requirements of FASB Statement No. 141 (revised 2007), “Business Combinations”.
SFAS 160 will be effective for fi scal years beginning after December 15, 2008, and the Company will adopt SFAS 160 as of January 1, 2009. SFAS 160 may not be applied retroactively and early adoption is prohibited. The Company is currently evaluating the impact of the adoption of SFAS 160 on its consolidated shareholders’ equity and net income.
SFAS 163
In May 2008, the FASB issued Statement No. 163, “Accounting for Financial Guarantee Insurance Contracts — an interpretation of FASB Statement No. 60” (SFAS 163). SFAS 163 clarifi es the recognition and measurement of premium revenue and claim liabilities, and requires expanded disclosures about an entity’s fi nancial guarantee insurance contracts. SFAS 163 is effective for fi nancial statements issued for fi scal years beginning after December 15, 2008. The Company has determined that the impact of the adoption of SFAS 163 on its consolidated shareholders’ equity and net income is immaterial and no additional disclosures are required at December 31, 2008.
EITF 07-05
In June 2008, the FASB’s Emerging Issues Task Force reached a consensus regarding EITF Issue No. 07-5, “Determining Whether an Instrument (or Embedded Feature) Is Indexed to an Entity’s Own Stock” (EITF 07-5). EITF 07-5 outlines a two-step approach to evaluate the instrument’s contingent exercise provisions, if any, and to evaluate the instrument’s settlement provisions when determining whether an equity-linked fi nancial instrument (or embedded feature) is indexed to an entity’s own stock. EITF 07-5 is effective for fi scal years beginning after December 15, 2008 and must be applied to outstanding instruments as of the beginning of the fi scal year of adoption as a cumulative-effect adjustment to the opening balance of retained earnings. Early adoption is not permitted. The Company is currently evaluating the impact of the adoption of EITF 07-5.
3. Fair value
(a) SFAS 157The SFAS 157 fair value hierarchy prioritizes the inputs to valuation techniques used to measure fair value by maximizing the use of observable inputs and minimizing the use of unobservable inputs by requiring that the most observable inputs be used when available. Observable inputs are inputs that market participants would use in pricing an asset or liability based on market data obtained from sources independent of the Company. Unobservable inputs are inputs that refl ect the Company’s assumptions about what market participants
521258_P102-156_FIN.indd 114521258_P102-156_FIN.indd 114 3/18/09 12:35:08 AM3/18/09 12:35:08 AM

PartnerReAnnual Report 2008
115
PartnerRe Ltd.Notes to Consolidated Financial Statements
would use in pricing the asset or liability based on the best information available in the circumstances. The level in the hierarchy within which a given fair value measurement falls is determined based on the lowest level input that is signifi cant to the measurement.
The Company must determine the appropriate level in the hierarchy for each fi nancial instrument that it measures at fair value. In determining fair value, the Company uses various valuation approaches, including market, income and cost approaches. The hierarchy is broken down into three levels based on the reliability of inputs as follows:
Level 1 inputs — Unadjusted, quoted prices in active markets for identical assets or -liabilities that the Company has the ability to access.
The Company’s fi nancial instruments that it measures at fair value using Level 1 inputs generally include: equities listed on a major exchange and exchange traded derivatives, such as futures and options that are actively traded.
Level 2 inputs — Quoted prices in active markets for similar assets or liabilities, quoted -prices for identical or similar assets or liabilities in inactive markets and directly or indirectly observable inputs, other than quoted prices, used in industry accepted models.
The Company’s fi nancial instruments that it measures at fair value using Level 2 inputs generally include: U.S. Treasury bonds; U.S. Government Sponsored Entities; Organization for Economic Co-operation and Development Sovereign Treasury bonds; investment grade and high yield corporate bonds; catastrophe bonds; mortgage-backed securities; asset-backed securities (“ABS”); foreign exchange forward contracts and over-the-counter derivatives such as foreign currency option contracts, equity put and call options, interest rate swaps and credit default swaps.
Level 3 inputs — Unobservable inputs. -
The Company’s fi nancial instruments that it measures at fair value using Level 3 inputs generally include: unlisted equities including preference shares; unit trusts; private ABS; credit linked notes; loans receivable; total return swaps and weather derivatives.
At December 31, 2008, the Company’s fi nancial instruments measured at fair value were categorized between Levels 1, 2 and 3 as follows (in thousands of U.S. dollars):
Quoted prices in active markets for
identical assets(Level 1)
Signifi cant otherobservable inputs
(Level 2)
Signifi cantunobservable
inputs(Level 3) Total
Fixed maturities, trading securities $ — $ 10,103,857 $ 78,138 $ 10,181,995
Short-term investments, trading securities — 116,954 137 117,091
Equities, trading securities 436,627 42,638 33,547 512,812
Other invested assets — (870) (16,136) (17,006)
Total $ 436,627 $ 10,262,579 $ 95,686 $ 10,794,892
At December 31, 2008, the aggregate carrying amounts of items included in Other invested assets that the Company did not measure at fair value were $91.5 million, which primarily related to the Company’s investments that are accounted for using the equity method of accounting or investment company accounting.
Substantially all of the accrued investment income in the Consolidated Balance Sheet as of December 31, 2008 related to the Company’s fi xed maturities, short-term investments and equities for which the fair value option was elected.
521258_P102-156_FIN.indd 115521258_P102-156_FIN.indd 115 3/18/09 12:35:21 AM3/18/09 12:35:21 AM

PartnerRe Ltd.Notes to Consolidated Financial Statements
116 PartnerReAnnual Report 2008
The following table is a reconciliation of the beginning and ending balances for all fi nancialinstruments measured at fair value using Level 3 inputs for the year ended December 31,2008 (in thousands of U.S. dollars):
Fixed maturitiesShort-term
investments EquitiesOther invested
assets Total
Balance at beginning of year $ 15,166 $ — $ 39,606 $ (14,838) $ 39,934
Realized and unrealized investment(losses) gains included in net income (7,684) 23 (6,059) (12,368) (26,088)
Net purchases, sales and settlements 74,114 114 — 11,070 85,298
Transfers out of Level 3 (3,458) — — — (3,458)
Balance at end of year $ 78,138 $ 137 $ 33,547 $ (16,136) $ 95,686
Change in unrealized investment (losses)gains relating to assets held at end of year $ (7,684) $ 23 $ (6,059) $ (27,742) $ (41,462)
Changes in the fair value of the Company’s fi nancial instruments measured at fair value, forwhich the fair value option was elected, during the year ended December 31, 2008 were asfollows (in thousands of U.S. dollars):
For the year endedDecember 31, 2008
Fixed maturities, trading securities $ (150,860)
Short-term investments, trading securities 551
Equities, trading securities (144,634)
Total $ (294,943)
All of the above changes in fair value are included in the Consolidated Statements ofOperations under the caption Net realized and unrealized investment (losses) gains.
The following methods and assumptions were used by the Company in estimating thefair value of each class of fi nancial asset recorded in the Consolidated Balance Sheets.Following the adoption of SFAS 157 and FSP SFAS 157-3, there have been no materialchanges in the Company’s valuation techniques.
Fixed maturities and short-term investmentsSubstantially all of the Company’s fi xed maturities and short-term investments arecategorized as Level 2 within the SFAS 157 hierarchy. The Company receives prices fromindependent pricing sources to measure the fair values of its fi xed maturity investments.The independent pricing sources obtain market quotations and actual transaction prices forsecurities that have quoted prices in active markets. Each source has its own proprietarymethod for determining the fair value of securities that are not actively traded. In general,these methods involve the use of “matrix pricing” in which the independent pricing sourceapplies the credit spread for a comparable security that has traded recently to the currentyield curve to determine a reasonable fair value. The Company uses a pricing serviceranking to consistently select the most appropriate pricing service in instances where itreceives multiple quotes on the same security. When fair values are unavailable from theseindependent pricing sources, quotes are obtained directly from broker-dealers who areactive in the corresponding markets. Most of the Company’s fi xed maturities are pricedfrom the pricing services or dealer quotes. The Company will typically not make adjustmentsto prices received from pricing services or dealer quotes; however, in instances where thequoted external price for a security uses signifi cant unobservable inputs, the Company willcategorize that security as Level 3. The Company’s private ABS are classifi ed as Level 3.For all fi xed maturity investments, the bid price is used for estimating fair value.
521258_P102-156_FIN.indd 116521258_P102-156_FIN.indd 116 3/24/09 12:14:13 PM3/24/09 12:14:13 PM

PartnerReAnnual Report 2008
117
PartnerRe Ltd.Notes to Consolidated Financial Statements
To validate prices, the Company compares the fair value estimates to its knowledge of the current market and will investigate prices that it considers not to be representative of fair value. The Company also reviews an internally generated fi xed maturity price validation report which converts prices received for fi xed maturity investments from the independent pricing sources and from broker-dealers quotes and plots option adjusted spreads (OAS) and duration on a sector and rating basis. The OAS is calculated using established algorithms developed by an independent risk analytics platform vendor. The OAS on the fi xed maturity price validation report are compared for securities in a similar sector and having a similar rating, and outliers are identifi ed and investigated for price reasonableness. In addition, the Company completes quantitative analyses to compare the performance of each fi xed maturity investment portfolio to the performance of an appropriate benchmark, with signifi cant differences identifi ed and investigated.
EquitiesSubstantially all of the Company’s equities are categorized as either Level 1 or Level 2 within the SFAS 157 hierarchy. For equities categorized as Level 1, the Company receives prices based on closing exchange prices from independent pricing sources to measure fair value. Equities categorized as Level 2 are generally mutual funds invested in securities other than the common stock of publicly traded companies (such as emerging market debt funds or bank loan funds). These funds provide daily net asset values which the Company uses in determining fair value for these investments. For funds where the net asset value is not provided on a daily basis, the asset is classifi ed as Level 3.
To validate prices, the Company completes quantitative analyses to compare the performance of each equity investment portfolio to the performance of an appropriate benchmark, with signifi cant differences identifi ed and investigated.
Other invested assetsThe Company’s foreign exchange forward contracts, foreign currency option contracts, equity put and call options, interest rate swaps and credit default swaps are categorized as Level 2 within the SFAS 157 hierarchy. Included within the Company’s Level 3 categorization are unlisted equities including preference shares, unit trusts, credit linked notes, loans receivable, total return swaps and weather derivatives. The Company will generally either (i) receive a price based on a manager’s or trustee’s valuation for the asset; or (ii) develop an internal discounted cash fl ow model to measure fair value. Where the Company receives prices from the manager or trustee, these prices are based on the manager’s or trustee’s estimate of fair value for the assets and are generally audited on an annual basis. Where the Company develops its own discounted cash fl ow models, the inputs will be specifi c to the asset in question, based on appropriate historical information, adjusted as necessary, and using appropriate discount rates. As part of the Company’s modeling to determine the fair value of an investment, the Company considers counterparty credit risk as an input to the model, however, the majority of the Company’s counterparties are highly rated institutions and the failure of any counterparty would not have a signifi cant impact on the Company’s fi nancial statements.
To validate prices, the Company will compare them to benchmarks, where appropriate, or to the business results generally within that asset class and specifi cally to those particular assets. In addition, the fair value measurements of all investments categorized as Level 3 within the SFAS 157 hierarchy are presented to, and peer reviewed by, an internal valuation committee that the Company has established.
521258_P102-156_FIN.indd 117521258_P102-156_FIN.indd 117 3/18/09 12:35:51 AM3/18/09 12:35:51 AM

PartnerRe Ltd.Notes to Consolidated Financial Statements
118 PartnerReAnnual Report 2008
(b) Fair Value of Financial Instruments Prior to the Adoption of SFAS 157 and Fair Value of Financial Instrument LiabilitiesThere were no material differences in the Company’s valuation techniques for fi nancial instrument assets described above prior to the adoption of SFAS 157 and the carrying value of the Company’s fi nancial instrument assets equaled their fair value. At December 31, 2007, included in other invested assets were fi nancial instruments with negative carrying and fair values of $15.8 million. The negative fair value of these other invested assets refl ects fair value adjustments on derivative fi nancial instruments. In accordance with SFAS No. 107 “Disclosures about Fair Value of Financial Instruments” (SFAS 107), the Company’s investments accounted for under the equity method were excluded for the purpose of the fair value disclosure.
The following methods and assumptions were used by the Company in estimating the fair value of each class of fi nancial instrument liability recorded in the Consolidated Balance Sheets for which the Company does not measure that instrument at fair value. SFAS 107 excludes insurance contracts (other than fi nancial guarantees), investment contracts and certain other fi nancial instruments.
Policy benefi ts for life and annuity contracts have a fair value equal to the cash value available to the policyholder should the policyholder surrender the policy. The fair value of the current and long-term debt have been calculated as the present value of estimated future cash fl ows using a discount rate refl ective of the current market cost of borrowing under similar terms and conditions. The fair value of the Senior Notes and CENts has been calculated using quoted market prices based on the initial issuance of $250.0 million from PartnerRe Finance A and $250.0 million from PartnerRe Finance II, respectively.
The carrying values and fair values of the fi nancial instrument liabilities recorded in the Consolidated Balance Sheets as of December 31, 2008 and 2007 were as follows (in thousands of U.S. dollars):
2008 2007
CarryingValue Fair Value
CarryingValue Fair Value
Policy benefi ts for life and annuity contracts (1) $ 1,432,015 $ 1,432,015 $ 1,541,687 $ 1,541,687
Current portion of long-term debt 200,000 200,000 — —
Long-term debt 200,000 196,103 620,000 626,840
Debt related to senior notes (2) 250,000 237,095 — —
Debt related to capital effi cient notes (3) 250,000 94,536 257,605 229,475(1) Policy benefi ts for life and annuity contracts included short-duration and long-duration contracts.(2) PartnerRe Finance A LLC, the issuer of the Senior Notes, does not meet the consolidation requirements of FIN 46(R). Accordingly, the Company shows the related
intercompany debt of $250.0 million in its Consolidated Balance Sheets.(3) PartnerRe Finance II, the issuer of the capital effi cient notes, does not meet the consolidation requirements of FIN 46(R). Accordingly, the Company shows the
related intercompany debt of $257.6 million in its Consolidated Balance Sheets. The fair value of the capital effi cient notes was based on the initial issuance of $250.0 million from PartnerRe Finance II.
521258_P102-156_FIN.indd 118521258_P102-156_FIN.indd 118 3/18/09 12:36:27 AM3/18/09 12:36:27 AM

PartnerReAnnual Report 2008
119
PartnerRe Ltd.Notes to Consolidated Financial Statements
4. Investments
(a) Fixed Maturities, Short-Term Investments and EquitiesThe cost, gross unrealized gains, gross unrealized losses and fair value of investments at December 31, 2008 and 2007 were as follows (in thousands of U.S. dollars):
2008 – Trading securities Cost (1)
GrossUnrealized
Gains
GrossUnrealized
LossesFair
Value
Fixed maturities
- U.S. government and agencies $ 880,562 $ 50,515 $ (239) $ 930,838
- other foreign governments 2,651,298 180,154 (7,339) 2,824,113
- corporate 3,568,060 61,790 (216,549) 3,413,301
- mortgage/asset-backed securities 3,119,206 72,146 (177,609) 3,013,743
Total fi xed maturities 10,219,126 364,605 (401,736) 10,181,995
Short-term investments 116,445 707 (61) 117,091
Equities 637,198 10,119 (134,505) 512,812
Total $ 10,972,769 $ 375,431 $ (536,302) $ 10,811,898
2007 – Available for sale securities Cost (1)
GrossUnrealized
Gains
GrossUnrealized
LossesFair
Value
Fixed maturities
- U.S. government and agencies $ 1,203,740 $ 35,733 $ (53) $ 1,239,420
- other foreign governments 2,784,360 43,742 (7,430) 2,820,672
- corporate 3,124,263 40,257 (31,631) 3,132,889
- mortgage/asset-backed securities 2,289,599 30,155 (13,944) 2,305,810
Total fi xed maturities 9,401,962 149,887 (53,058) 9,498,791
Short-term investments 97,153 200 (46) 97,307
Equities 838,777 60,274 (27,289) 871,762
Total $ 10,337,892 $ 210,361 $ (80,393) $ 10,467,860(1) Cost is amortized cost for fi xed maturities and short-term investments and original cost for equities, net of other-than-temporary impairments.
At December 31, 2007, in addition to the securities shown in the above table that were classifi ed as available for sale, the Company held fi xed maturities that were classifi ed as trading with a fair value of $16.4 million (amortized cost: $15.0 million; unrealized gain: $1.4 million) and equities that were classifi ed as trading with a fair value of $382.9 million (cost: $392.5 million; unrealized loss: $9.6 million).
(b) Maturity Distribution of Fixed Maturities and Short-Term InvestmentsThe distribution of fi xed maturities and short-term investments at December 31, 2008, by contractual maturity date, is shown below (in thousands of U.S. dollars). Actual maturities may differ from contractual maturities because certain borrowers have the right to call or prepay certain obligations with or without call or prepayment penalties.
Amortized Cost Fair Value
One year or less $ 546,165 $ 545,007
More than one year through fi ve years 3,649,298 3,649,230
More than fi ve years through ten years 2,631,011 2,730,006
More than ten years 389,891 361,100
Subtotal 7,216,365 7,285,343
Mortgage/asset-backed securities 3,119,206 3,013,743
Total $ 10,335,571 $ 10,299,086
521258_P102-156_FIN.indd 119521258_P102-156_FIN.indd 119 3/18/09 12:36:42 AM3/18/09 12:36:42 AM
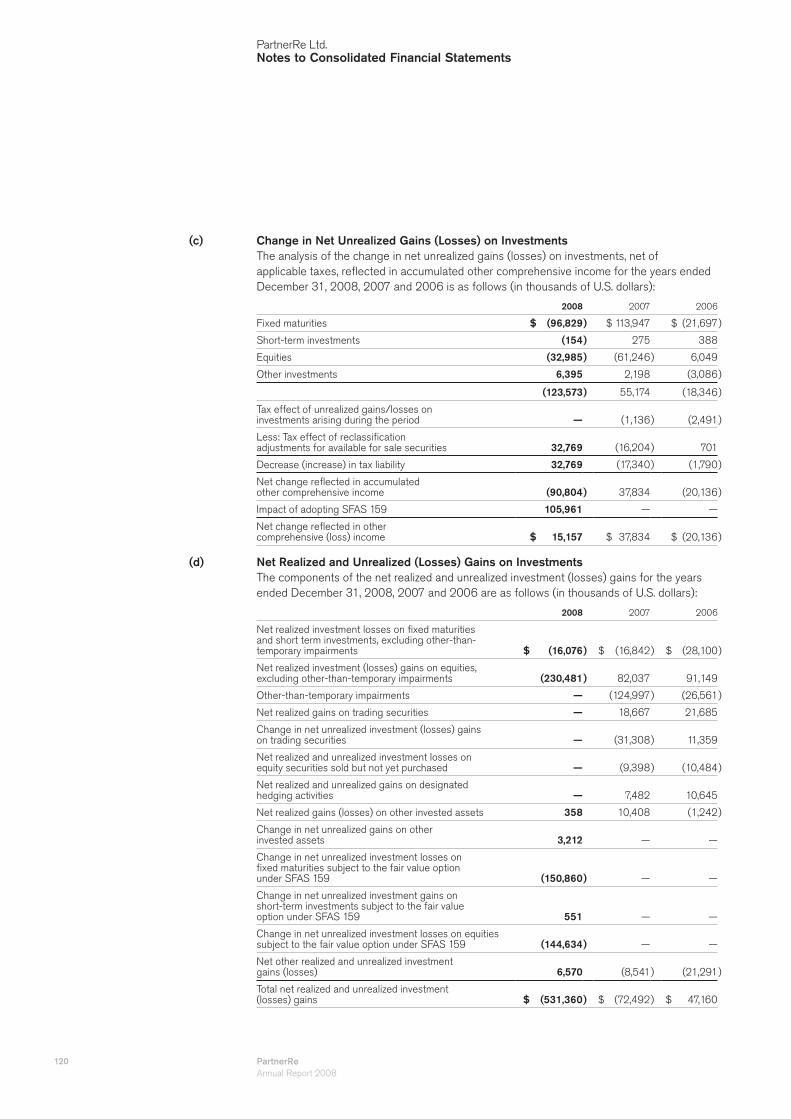
PartnerRe Ltd.Notes to Consolidated Financial Statements
120 PartnerReAnnual Report 2008
(c) Change in Net Unrealized Gains (Losses) on InvestmentsThe analysis of the change in net unrealized gains (losses) on investments, net of applicable taxes, refl ected in accumulated other comprehensive income for the years ended December 31, 2008, 2007 and 2006 is as follows (in thousands of U.S. dollars):
2008 2007 2006
Fixed maturities $ (96,829) $ 113,947 $ (21,697)
Short-term investments (154) 275 388
Equities (32,985) (61,246) 6,049
Other investments 6,395 2,198 (3,086)
(123,573) 55,174 (18,346)
Tax effect of unrealized gains/losses on investments arising during the period — (1,136) (2,491)
Less: Tax effect of reclassifi cation adjustments for available for sale securities 32,769 (16,204) 701
Decrease (increase) in tax liability 32,769 (17,340) (1,790)
Net change refl ected in accumulated other comprehensive income (90,804) 37,834 (20,136)
Impact of adopting SFAS 159 105,961 — —
Net change refl ected in other comprehensive (loss) income $ 15,157 $ 37,834 $ (20,136)
(d) Net Realized and Unrealized (Losses) Gains on InvestmentsThe components of the net realized and unrealized investment (losses) gains for the years ended December 31, 2008, 2007 and 2006 are as follows (in thousands of U.S. dollars):
2008 2007 2006
Net realized investment losses on fi xed maturities and short term investments, excluding other-than-temporary impairments $ (16,076) $ (16,842) $ (28,100)
Net realized investment (losses) gains on equities, excluding other-than-temporary impairments (230,481) 82,037 91,149
Other-than-temporary impairments — (124,997) (26,561)
Net realized gains on trading securities — 18,667 21,685
Change in net unrealized investment (losses) gains on trading securities — (31,308) 11,359
Net realized and unrealized investment losses on equity securities sold but not yet purchased — (9,398) (10,484)
Net realized and unrealized gains on designated hedging activities — 7,482 10,645
Net realized gains (losses) on other invested assets 358 10,408 (1,242)
Change in net unrealized gains on other invested assets 3,212 — —
Change in net unrealized investment losses on fi xed maturities subject to the fair value option under SFAS 159 (150,860) — —
Change in net unrealized investment gains on short-term investments subject to the fair value option under SFAS 159 551 — —
Change in net unrealized investment losses on equities subject to the fair value option under SFAS 159 (144,634) — —
Net other realized and unrealized investment gains (losses) 6,570 (8,541) (21,291)
Total net realized and unrealized investment (losses) gains $ (531,360) $ (72,492) $ 47,160
521258_P102-156_FIN.indd 120521258_P102-156_FIN.indd 120 3/18/09 12:36:56 AM3/18/09 12:36:56 AM

PartnerReAnnual Report 2008
121
PartnerRe Ltd.Notes to Consolidated Financial Statements
The Company adopted SFAS 159 effective January 1, 2008. For all periods prior to the adoption of SFAS 159, unrealized gains and losses, net of tax, on available for sale securities were recorded as a component of accumulated other comprehensive income in the Consolidated Balance Sheets. Following the adoption of SFAS 159, the Company’s available for sale securities have been reclassifi ed as trading securities and all changes in pre-tax unrealized investment gains and losses are recorded in net realized and unrealized investment (losses) gains in the Consolidated Statement of Operations. Net investment income and net realized and unrealized investment gains and losses on securities previously classifi ed as trading have been recorded within the related investments classifi cation (fi xed maturities or equities) beginning in 2008, and the change in net unrealized investment gains and losses on such securities are included in change in net unrealized investment gains and losses on securities subject to the fair value option under SFAS 159.
Proceeds from the sale of investments classifi ed as available for sale for the years ended December 31, 2007 and 2006 were $5,989.3 million and $13,550.3 million, respectively. Realized investment (losses) gains on securities classifi ed as available for sale for the years ended December 31, 2007 and 2006 were as follows (in thousands of U.S. dollars):
2007 2006
Gross realized gains $ 188,066 $ 268,265
Gross realized losses excluding other-than-temporary impairments (122,871) (205,216)
Other-than-temporary impairments (124,997) (26,561)
Total net realized investment (losses) gains on available for sale securities $ (59,802) $ 36,488
(e) Net Investment IncomeThe components of net investment income for the years ended December 31, 2008, 2007 and 2006 were as follows (in thousands of U.S. dollars):
2008 2007 2006
Fixed maturities $ 514,751 $ 421,672 $ 333,888
Short-term investments, trading securities, cash and cash equivalents 18,884 55,618 61,453
Equities 29,415 36,383 33,163
Funds held and other 37,261 32,339 40,446
Investment expenses (27,347) (22,753) (19,549)
Net investment income $ 572,964 $ 523,259 $ 449,401
The Company generally earns investment income on funds held by reinsured companies based upon a predetermined interest rate, either fi xed contractually at the inception of the contract or based upon a recognized index (e.g., LIBOR). Interest rates ranged from 1.0% to 5.0% at December 31, 2008 and from 1.0% to 6.0% at December 31, 2007.
(f) Pledged AssetsAt December 31, 2008 and 2007, approximately $15.7 million and $27.5 million, respectively, of cash and cash equivalents and approximately $1,119.3 million and $1,410.6 million, respectively, of securities were deposited, pledged or held in escrow accounts in favor of ceding companies and other counterparties or government authorities to comply with reinsurance contract provisions and insurance laws or to support long-term debt.
521258_P102-156_FIN.indd 121521258_P102-156_FIN.indd 121 3/18/09 12:37:11 AM3/18/09 12:37:11 AM

PartnerRe Ltd.Notes to Consolidated Financial Statements
122 PartnerReAnnual Report 2008
(g) Net Receivable for Securities SoldIncluded in net receivable for securities sold at December 31, 2008 and 2007 were gross payable and receivable balances. The components of net receivable for securities sold at December 31, 2008 and 2007 were as follows (in thousands of U.S. dollars):
2008 2007
Receivable for securities sold $ 43,007 $ 84,313
Payable for securities purchased — (34,248)
Net receivable for securities sold $ 43,007 $ 50,065
5. Unpaid Losses and Loss Expenses and Policy Benefi ts for Life and Annuity Contracts
(a) Unpaid Losses and Loss ExpensesUnpaid losses and loss expenses are categorized into three types of reserves: reported outstanding loss reserves (case reserves), additional case reserves (ACRs) and incurred but not reported (IBNR) reserves. Case reserves represent unpaid losses reported by the Company’s cedants and recorded by the Company. ACRs are established for particular circumstances where, on the basis of individual loss reports, the Company estimates that the particular loss or collection of losses covered by a treaty may be greater than those advised by the cedant. IBNR reserves represent a provision for claims that have been incurred but not yet reported to the Company, as well as future loss development on losses already reported, in excess of the case reserves and ACRs. The following table shows unpaid losses and loss expenses reported by cedants (case reserves) and those estimated by the Company (ACRs and IBNR reserves) at December 31, 2008 and 2007 (in thousands of U.S. dollars):
2008 2007
Case reserves $ 3,107,780 $ 3,062,414
ACRs 311,408 306,487
IBNR reserves 4,091,478 3,862,535
Total unpaid losses and loss expenses $ 7,510,666 $ 7,231,436
The table below is a reconciliation of the beginning and ending liability for unpaid losses and loss expenses, excluding policy benefi ts for life and annuity contracts, for the years ended December 31, 2008, 2007 and 2006 (in thousands of U.S. dollars):
2008 2007 2006
Gross liability at beginning of year $ 7,231,436 $ 6,870,785 $ 6,737,661
Reinsurance recoverable at beginning of year 132,479 138,585 185,280
Net liability at beginning of year 7,098,957 6,732,200 6,552,381
Net incurred losses related to:
Current year 2,564,174 2,041,752 1,999,730
Prior years (417,936) (414,043) (251,748)
2,146,238 1,627,709 1,747,982
Net paid losses related to:
Current year 240,031 146,403 141,559
Prior years 1,340,788 1,473,964 1,718,996
1,580,819 1,620,367 1,860,555
Effects of foreign exchange rate changes (278,925) 359,415 292,392
Net liability at end of year 7,385,451 7,098,957 6,732,200
Reinsurance recoverable at end of year 125,215 132,479 138,585
Gross liability at end of year $ 7,510,666 $ 7,231,436 $ 6,870,785
521258_P102-156_FIN.indd 122521258_P102-156_FIN.indd 122 3/18/09 12:37:24 AM3/18/09 12:37:24 AM

PartnerReAnnual Report 2008
123
PartnerRe Ltd.Notes to Consolidated Financial Statements
The table below is a reconciliation of losses and loss expenses including life policy benefi ts for the years ended December 31, 2008, 2007 and 2006 (in thousands of U.S. dollars):
2008 2007 2006
Net incurred losses related to:
Non-life $ 2,146,238 $ 1,627,709 $ 1,747,982
Life 462,982 454,752 363,355
Losses and loss expenses and life policy benefi ts $ 2,609,220 $ 2,082,461 $ 2,111,337
The following table summarizes the net prior year (favorable) adverse development of loss reserves for each of the Company’s Non-life sub-segments for the years ended December 31, 2008, 2007 and 2006 (in millions of U.S. dollars):
2008 2007 2006
Prior year net (favorable) adverse loss development:
Non-life sub-segment
U.S. $ (92) $ (72) $ (2)
Global (Non-U.S.) P&C (166) (97) (66)
Global (Non-U.S.) Specialty (82) (203) (208)
Catastrophe (78) (42) 24
Total net Non-life prior year loss development $ (418) $ (414) $ (252)
Within the Company’s U.S. sub-segment, the Company reported net favorable loss development for prior accident years in 2008, 2007 and 2006. The net favorable development in 2008 included net favorable development for prior accident years in all lines of business, with the exception of the motor and multiline lines of business, which experienced net adverse loss development for prior accident years of $10 million. The net favorable development in 2007 included net favorable loss development for prior accident years in all lines of business, with the exception of multiline, which included net adverse loss development of $5 million. The net favorable loss development in 2006 included net favorable development for prior accident years in the agriculture, casualty and multiline lines of $27 million, partially offset by net adverse development in the property, motor, surety and structured risk lines of $25 million (including a net adverse development of $13 million related to the 2005 Hurricanes Katrina, Rita and Wilma). Other than for losses related to the 2005 hurricanes, loss information provided by cedants during each of these years for prior accident years included no individually signifi cant losses or reductions but a series of attritional losses or reductions. Attritional losses are losses that may not be signifi cant on an individual basis, but are monitored on an aggregated basis by the Company to identify trends that may be meaningful from a reserving standpoint.
For the Global (Non-U.S.) P&C sub-segment, the Company reported net favorable development for prior accident years in 2008, 2007 and 2006. The net favorable development in 2008 included net favorable development in all lines of business, but was most pronounced in the property line, and was primarily due to favorable loss emergence, as losses reported by cedants in 2008 for prior accident years were lower than the Company expected. Losses reported by cedants in 2007 regarding prior accident years were also lower than expected in all lines of business, which led the Company to decrease its expected ultimate loss ratios and loss estimates. The Company observed an improvement in loss experience in the property and casualty lines, and deterioration in the motor line in 2006. Loss information provided by cedants during each of these years for prior accident years included no individually signifi cant losses or reductions but a series of attritional losses or reductions.
521258_P102-156_FIN.indd 123521258_P102-156_FIN.indd 123 3/18/09 12:37:38 AM3/18/09 12:37:38 AM

PartnerRe Ltd.Notes to Consolidated Financial Statements
124 PartnerReAnnual Report 2008
For the Global (Non-U.S.) Specialty sub-segment, the Company reported net favorable loss development for prior accident years in 2008, 2007 and 2006. The net favorable development in 2008 included net favorable development in all lines of business with the exception of the energy line, which incurred net adverse development for prior accident years of $7 million. Losses reported by cedants during 2008, 2007 and 2006 for prior accident years were lower than the Company expected in most lines of business, which led the Company to decrease its expected ultimate loss ratios and loss estimates for prior year losses in each of these years. Loss information provided by cedants during each of these years for prior accident years included no individually signifi cant losses or reductions but a series of attritional losses or reductions.
For the Catastrophe sub-segment, the Company reported net favorable development for prior accident years in 2008 and 2007 and net adverse loss development in 2006. During 2008 and 2007, the net favorable development was primarily due to favorable loss emergence, as losses reported by cedants for prior accident years were lower than the Company expected. During 2006, the net adverse loss development on prior accident years of $24 million included net adverse loss development of $36 million related to the large 2005 catastrophic losses. Other than for losses related to the 2005 hurricanes, loss information provided by cedants for prior accident years included no signifi cant losses or reductions but a series of attritional losses or reductions.
Sub-Prime and Financial Crisis Exposures
Ultimate losses for lines impacted by the rapidly deteriorating fi nancial condition of the world economies in 2008, particularly in the fourth quarter of 2008, cannot be estimated by standard actuarial techniques alone. The majority of the Company’s underwriting exposure related to this issue arises from business written in U.S. and Global (Non-U.S.) specialty casualty, primarily directors and offi cers exposures, Global (Non-U.S.) credit/surety, and to a lesser extent, U.S. surety during the underwriting years 2006, 2007, and 2008. The potential ultimate liability for these exposures was evaluated through an analysis of the Company’s exposure to these risks, which include but are not limited to, sub-prime mortgage related exposures. For specialty casualty, the analysis was based on information received from cedants both at the time the exposed business was written and supplemented by discussions with cedants, evaluation of known securities class action fi lings, current industry data regarding the likelihood of securities class actions and other potential suits against companies exposed to the effects of fi nancial stress, estimates of exposed industry premium, estimates of the Company’s market share of exposed industry premium and estimates of industry-wide insured losses. For credit/surety, the analysis was based on information received from cedants both at the time the exposed business was written supplemented by discussions with cedants, historical experience in times of similar fi nancial stress, reported claim information and internal modeling.
Based on information currently available and the range of potential estimated ultimate liabilities, the Company believes that the unpaid loss and loss expense reserves for U.S. and Global (Non-U.S.) specialty casualty, Global (Non-U.S.) credit/surety, U.S. surety and other potentially exposed classes of business contemplate a reasonable provision for exposures related to the effect of increased fi nancial stress in the world economies. The Company is unaware of any specifi c issues that would materially affect its unpaid loss and loss expense reserves related to this exposure.
521258_P102-156_FIN.indd 124521258_P102-156_FIN.indd 124 3/18/09 12:37:51 AM3/18/09 12:37:51 AM

PartnerReAnnual Report 2008
125
PartnerRe Ltd.Notes to Consolidated Financial Statements
Asbestos and Environmental Claims
The Company’s net reserve for unpaid losses and loss expenses at December 31, 2008 and 2007 included $82.5 million and $87.7 million, respectively, that represents estimates of its net ultimate liability for asbestos and environmental claims. The gross liability for such claims at December 31, 2008 and 2007 was $92.2 million and $97.8 million, respectively, of which $85.6 million and $89.1 million, respectively, relate to U.S. casualty exposures arising from business written by PartnerRe SA and PartnerRe U.S. Ultimate loss estimates for such claims cannot be estimated using traditional reserving techniques and there are signifi cant uncertainties in estimating the amount of the Company’s potential losses for these claims. In view of the legal and tort environment that affect the development of such claims, the uncertainties inherent in estimating asbestos and environmental claims are not likely to be resolved in the near future. There can be no assurance that the reserves established by the Company will not be adversely affected by development of other latent exposures, and further, there can be no assurance that the reserves established by the Company will be adequate. The Company does, however, actively evaluate potential exposure to asbestos and environmental claims and establishes additional reserves as appropriate. The Company believes that it has made a reasonable provision for these exposures and is unaware of any specifi c issues that would materially affect its unpaid losses and loss expense reserves related to this exposure.
(b) Policy Benefits for Life and Annuity ContractsThe Life segment reported net adverse development for prior accident years of $24 million and $2 million during the years ended December 31, 2008 and 2007 and net favorable development for prior accident years of $12 million for the year ended December 31, 2006.
The net adverse development and the net favorable development reported in 2008, 2007 and 2006 was primarily related to certain proportional guaranteed minimum death benefi t treaties, where the payout is linked to the performance of underlying capital market assets and where increases in credit spreads have impacted certain indexed-linked products that are interest-rate sensitive, as well as the receipt of additional reported loss information from cedants.
The Company used interest rate assumptions to estimate its liabilities for policy benefi ts for life and annuity contracts which ranged from 1.0% to 5.0% and 1.0% to 4.9% at December 31, 2008 and 2007, respectively.
6. Ceded ReinsuranceThe Company uses retrocessional agreements to reduce its exposure to risk of loss on reinsurance assumed. These agreements provide for recovery from retrocessionaires of a portion of losses and loss expenses. The Company remains liable to its cedants to the extent that the retrocessionaires do not meet their obligations under these agreements, and therefore the Company evaluates the fi nancial condition of its reinsurers and monitors concentration of credit risk on an ongoing basis. Provisions are made for amounts considered potentially uncollectible. The allowance for uncollectible reinsurance recoverable was $5.8 million and $9.4 million at December 31, 2008 and 2007, respectively.
521258_P102-156_FIN.indd 125521258_P102-156_FIN.indd 125 3/18/09 12:38:05 AM3/18/09 12:38:05 AM

PartnerRe Ltd.Notes to Consolidated Financial Statements
126 PartnerReAnnual Report 2008
Net premiums written, net premiums earned and losses and loss expenses and life policy benefi ts are reported net of reinsurance in the Company’s Consolidated Statements of Operations. Assumed, ceded and net amounts for the years ended December 31, 2008, 2007 and 2006 were as follows (in thousands of U.S. dollars):
2008Premiums
WrittenPremiums
Earned
Losses and Loss
Expenses and Life
Policy Benefi ts
Assumed $ 4,028,248 $ 3,967,704 $ 2,613,434
Ceded 38,813 39,680 4,214
Net $ 3,989,435 $ 3,928,024 $ 2,609,220
2007
Assumed $ 3,810,164 $ 3,830,396 $ 2,088,065
Ceded 53,055 52,925 5,604
Net $ 3,757,109 $ 3,777,471 $ 2,082,461
2006
Assumed $ 3,733,920 $ 3,710,529 $ 2,120,716
Ceded 44,372 43,261 9,379
Net $ 3,689,548 $ 3,667,268 $ 2,111,337
7. TaxationThe Company and its Bermuda domiciled subsidiaries are not subject to Bermuda income or capital gains tax under current Bermuda law. In the event that there is a change in current law such that taxes on income or capital gains are imposed, the Company and its Bermuda domiciled subsidiaries would be exempt from such tax until March 2016 pursuant to the Bermuda Exempted Undertakings Tax Protection Act of 1966.
The Company has subsidiaries and branches that operate in various other jurisdictions around the world that are subject to tax in the jurisdictions in which they operate. The signifi cant jurisdictions in which the Company’s subsidiaries and branches are subject to tax are Canada, France, Ireland, Switzerland and the United States.
While not currently under examination in any of the major taxing jurisdictions in which it operates, income tax returns are open for examination for the tax years 2004–2008 in Canada, Ireland and Switzerland, 2005–2008 in the United States and 2006–2008 in France. As a global organization, the Company may be subject to a variety of transfer pricing or permanent establishment challenges by taxing authorities in various jurisdictions. Management believes that adequate provision has been made in the Consolidated Financial Statements for any potential assessments that may result from tax examinations for all open tax years.
521258_P102-156_FIN.indd 126521258_P102-156_FIN.indd 126 3/18/09 12:38:19 AM3/18/09 12:38:19 AM

PartnerReAnnual Report 2008
127
PartnerRe Ltd.Notes to Consolidated Financial Statements
Income tax expense for the years ended December 31, 2008, 2007 and 2006 was as follows (in thousands of U.S. dollars):
2008 2007 2006
Current income tax expense (benefi t)
U.S. $ (31,071) $ 42,090 $ 25,992
Non U.S. 107,360 (10,980) 37,667
Total current income tax expense $ 76,289 $ 31,110 $ 63,659
Deferred income tax (benefi t) expense
U.S. $ (44,673) $ (23,270) $ (4,510)
Non U.S. (56,111) 79,660 36,156
Total deferred income tax (benefi t) expense $ (100,784) $ 56,390 $ 31,646
FIN 48 unrecognized tax expense (benefi t)
U.S. $ — $ — $ —
Non U.S. 34,200 (5,752) —
Total FIN 48 unrecognized tax expense (benefi t) $ 34,200 $ (5,752) $ —
Total income tax expense (benefi t)
U.S. $ (75,744) $ 18,820 $ 21,482
Non U.S. 85,449 62,928 73,823
Total income tax expense $ 9,705 $ 81,748 $ 95,305
The following table is a reconciliation of the actual income tax rate for the years ended December 31, 2008, 2007 and 2006 to the amount computed by applying the effective rate of 0% under Bermuda law to income or loss before income taxes (in thousands of U.S. dollars):
2008 2007 2006
Net income $ 46,567 $ 717,812 $ 749,332
Income tax expense 9,705 81,748 95,305
Income before taxes $ 56,272 $ 799,560 $ 844,637
Reconciliation of effective tax rate (% of income before taxes)
Expected tax rate 0.0% 0.0% 0.0%
Foreign taxes at local expected tax rates (117.6) 12.0 11.3
Impact of foreign exchange gains/losses (25.9) (1.0) 0.4
Prior year refund/adjustments (3.8) 0.3 0.4
FIN 48 unrecognized tax benefi t 26.6 (0.9) —
Expenses not deductible and tax-exempt income 167.1 0.2 (0.2)
Impact of enacted changes in tax rates (15.0) — —
Other (14.2) (0.4) (0.6)
Actual tax rate 17.2% 10.2% 11.3%
521258_P102-156_FIN.indd 127521258_P102-156_FIN.indd 127 3/18/09 12:38:35 AM3/18/09 12:38:35 AM

PartnerRe Ltd.Notes to Consolidated Financial Statements
128 PartnerReAnnual Report 2008
Deferred tax assets and liabilities refl ect the tax impact of temporary differences between the carrying amounts of assets and liabilities for fi nancial reporting and income tax purposes. Signifi cant components of the net deferred tax assets and liabilities as of December 31, 2008 and 2007 were as follows (in thousands of U.S. dollars):
2008 2007
Deferred tax assets
Discounting of loss reserves and adjustment to life policy reserves $ 93,283 $ 66,263
Unrealized depreciation and timing differences on investments 20,799 —
Tax loss carryforwards 27,507 49,295
Unearned premiums 20,502 21,584
Other deferred tax assets 29,673 15,404
191,764 152,546
FIN 48 liability decreasing deferred tax assets — (16,124)
Deferred tax assets 191,764 136,422
Deferred tax liabilities
Deferred acquisition costs 48,187 105,248
Goodwill 21,271 18,946
Tax equalization reserves 35,921 28,431
Unrealized appreciation and timing differences on investments — 4,527
Other deferred tax liabilities — 6,243
Deferred tax liabilities 105,379 163,395
Net deferred tax assets (liabilities) $ 86,385 $ (26,973)
The net tax assets and liabilities and their components at December 31, 2008 and 2007 were as follows (in thousands of U.S. dollars):
2008 2007
Net tax assets $ 215,703 $ 112,547
Net tax liabilities (219,679) (150,290)
Net tax liabilities $ (3,976) $ (37,743)
2008 2007
Net current tax liabilities $ (50,639) $ (3,514)
Net deferred tax assets (liabilities) 86,385 (26,973)
Net FIN 48 unrecognized tax benefi t (39,722) (7,256)
Net tax liabilities $ (3,976) $ (37,743)
As of December 31, 2008 and 2007, the Company had net deferred tax assets of $27.5 million and $49.3 million relating to operating loss carryforwards primarily in Ireland (2008) and France (2007). Irish and French tax laws allow tax losses to be carried forward for an unlimited period.
Realization of the deferred tax asset is dependent on generating suffi cient taxable income in future periods. Although realization is not assured, Management believes that it is more likely than not that the deferred tax asset will be realized.
521258_P102-156_FIN.indd 128521258_P102-156_FIN.indd 128 3/18/09 12:38:49 AM3/18/09 12:38:49 AM

PartnerReAnnual Report 2008
129
PartnerRe Ltd.Notes to Consolidated Financial Statements
The Company establishes tax liabilities relating to uncertain tax positions as defi ned inFIN 48. The effect of the adoption of FIN 48 on the Company’s Consolidated Statement ofShareholders’ Equity was a reduction in opening retained earnings on January 1, 2007 of$8.7 million.
The total amount of unrecognized tax benefi ts for the years ended December 31, 2008 and2007 was as follows (in thousands of U.S. dollars):
January 1,2008
Changes intax positionstaken during
a prior period
Tax positionstaken during
the currentperiod
Change as a result of
a lapse ofthe statute of
limitations
Impact of the change
in foreigncurrency
exchangerates
December 31,2008
Unrecognized tax benefi ts that, if recognized, would impact the effective tax rate $ 24,613 $ 8,264 $ 3,034 $ 3,325 $ (28) $ 39,208
Interest and penalties recognized on the above 190 370 — — (1) 559
Total unrecognized tax benefi ts, including interests and penalties $ 24,803 $ 8,634 $ 3,034 $ 3,325 $ (29) $ 39,767
For the year ended December 31, 2008, there were no unrecognized tax benefi ts that, ifrecognized, would create a temporary difference between the reported amount of an item inthe Company’s Consolidated Balance Sheet and its tax basis.
January 1,2007 (date
of adoption)
Changes intax positionstaken duringa prior period
Tax positionstaken during
the currentperiod
Change as a result of
a lapse ofthe statute of
limitations
Impact of the change
in foreigncurrency
exchangerates
December 31,2007
Unrecognized tax benefi ts that, if recognized, would impact the effective tax rate $ 28,915 $ (12,723) $ 1,444 $ 3,980 $ 2,997 $ 24,613
Interest and penalties recognized on the above 387 (197) — — — 190
Total $ 29,302 $ (12,920) $ 1,444 $ 3,980 $ 2,997 $ 24,803
Unrecognized tax benefi ts that, if recognized, would create a temporary difference between the reportedamount of an item in the Company’s ConsolidatedBalance Sheet and its tax basis $ 2,221 $ (2,221) $ — $ — $ — $ —
Total unrecognized tax benefi ts, including interests and penalties $ 31,523 $ (15,141) $ 1,444 $ 3,980 $ 2,997 $ 24,803
For the year ended December 31, 2007, there were no interest and penalties recognized onsuch temporary difference.
The total unrecognized tax benefi ts of $39.8 million and $24.8 million at December 31,2008 and 2007, respectively, were recorded in net current tax liabilities (2008, $0.1 million; 2007, $1.4 million), net deferred tax liabilities (2008, $nil; 2007, $16.1 million) and netFIN 48 unrecognized tax benefi t (2008, $39.7 million; 2007, $7.3 million). The Companyrecognizes interest and penalties as income tax expense in its Consolidated Statementsof Operations.
The total amount of unrecognized tax benefi ts for which it is reasonably possible to changewithin twelve months was $15.0 million at December 31, 2008, which primarily relates to theexpected expiration of the statute of limitations related to foreign exchange tax positions andvarious intra-group transactions in Europe.
PRe_AR08-Fin_ConBalSh,Notes-03_20_09.indd 129PRe_AR08-Fin_ConBalSh,Notes-03_20_09.indd 129 3/23/09 10:26:21 AM3/23/09 10:26:21 AM

PartnerRe Ltd.Notes to Consolidated Financial Statements
130 PartnerReAnnual Report 2008
8. Agreements with Related PartiesThe Company was party to agreements with Atradius N.V. since December 2003 (a company in which a board member is a supervisory director) and Delta Lloyd since May 2008 (a company in which a board member is a director).
Agreements with Atradius N.V.In the normal course of its underwriting activities, the Company and certain subsidiaries entered into reinsurance contracts with Atradius N.V. The activity included in the Consolidated Statements of Operations related to Atradius N.V. for the years ended December 31, 2008, 2007 and 2006 was as follows (in thousands of U.S. dollars):
2008 2007 2006
Net premiums written $ 67,295 $ 56,520 $ 48,470
Net premiums earned 65,252 55,675 44,768
Losses and loss expenses and life policy benefi ts 42,096 27,127 19,204
Acquisition costs 25,533 27,503 17,002
Included in the Consolidated Balance Sheets at December 31, 2008 and 2007 were the following balances related to Atradius N.V. (in thousands of U.S. dollars):
2008 2007
Reinsurance balances receivable $ 20,054 $ 17,805
Unpaid losses and loss expenses 65,799 62,059
Unearned premiums 32,611 31,676
Other net assets 14,040 13,590
Other AgreementsIn the normal course of its underwriting activities, the Company and certain subsidiaries entered into reinsurance contracts with Delta Lloyd. The activity included in the Consolidated Statements of Operations related to Delta Lloyd for the year ended December 31, 2008 includes net premiums earned of $1.8 million and losses and loss expenses and life policy benefi ts of $1.2 million. Included in the Consolidated Balance Sheets at December 31, 2008 were unpaid losses and loss expenses of $8.1 million.
In the normal course of its investment operations, the Company bought or held securities of companies in which board members of the Company are also directors or non-executive directors. All transactions entered into as part of the investment portfolio were completed on market terms.
9. Retirement Benefi t ArrangementsFor employee retirement benefi ts, the Company maintains defi ned contribution plans, an active defi ned benefi t plan and a frozen non-contributory defi ned benefi t plan.
Defined Contribution PlansContributions are made by the Company, and in some locations, these contributions are supplemented by the local plan participants. Contributions are based on a percentage of the participant’s base salary depending upon competitive local market practice. Vesting provisions meet legal compliance standards and market trends; the accumulated benefi ts for the majority of these plans vest immediately or over a four-year period. As required by law, certain retirement plans also provide for death and disability benefi ts and lump sum indemnities to employees upon retirement.
The Company incurred expenses for these defi ned contribution arrangements of $13.1 million, $10.3 million and $10.0 million for the years ended December 31, 2008, 2007 and 2006, respectively.
521258_P102-156_FIN.indd 130521258_P102-156_FIN.indd 130 3/18/09 12:39:24 AM3/18/09 12:39:24 AM

PartnerReAnnual Report 2008
131
PartnerRe Ltd.Notes to Consolidated Financial Statements
Active Defined Benefit PlanSince 1999, the Company has maintained an active pension plan for its Zurich offi ceemployees (the Zurich Plan), which was classifi ed and accounted for as a defi ned contributionplan. Amendments to the Zurich Plan during 2006, in conjunction with changes to Swisspension law, led the Company to conclude that the features of the plan made it a hybrid plan(which is accounted for as a defi ned benefi t plan) for the year ended December 31, 2006and onwards.
At December 31, 2008 and 2007, the funded status of the Zurich Plan was as follows(in thousands of U.S. dollars):
Funded status 2008 2007
Unfunded pension obligation at beginning of year $ 2,371 $ 7,661
Change in pension obligation
Service cost 3,825 3,543
Interest cost 2,477 1,964
Plan participants’ contributions 6,637 4,860
Actuarial loss (gain) 8,957 (4,381)
Benefi ts paid (4,820) (5,329)
Foreign currency adjustments 6,014 5,603
Change in pension obligation 23,090 6,260
Change in fair value of plan assets
Actual return on plan assets (2,563) 2,046
Employer contributions 5,200 4,609
Plan participants’ contributions 6,637 4,860
Benefi ts paid (4,820) (5,329)
Foreign currency adjustments 4,979 5,364
Change in fair value of plan assets 9,433 11,550
Funded status
Unfunded pension obligation at end of year $ 16,028 $ 2,371
Additional information:
Projected benefi t obligation $ 95,495 $ 72,405
Accumulated pension obligation 91,494 70,032
Fair value of plan assets 79,467 70,034
At December 31, 2008 and 2007, the funded status at the end of the year was includedin accounts payable, accrued expenses and other in the Consolidated Balance Sheets. Thetotal amounts recognized in accumulated other comprehensive income at December 31,2008 and 2007 were $14.7 million (net of $4.0 million of taxes) and $2.9 million (net of$0.8 million of taxes), respectively.
Of the $6.9 million transition adjustment recorded under SFAS 158 in 2006, $5.5 millionremains in accumulated other comprehensive income at December 31, 2008. Of thistransition adjustment, $0.6 million (pre-tax) is expected to be recognized in net periodicbenefi t cost in 2009. The Company expects to recognize $0.3 million amortization ofactuarial loss in net periodic benefi t cost in 2009.
521258_P102-156_FIN.indd 131521258_P102-156_FIN.indd 131 3/24/09 1:24:57 PM3/24/09 1:24:57 PM

PartnerRe Ltd.Notes to Consolidated Financial Statements
132 PartnerReAnnual Report 2008
The components of net periodic benefi t cost for the years ended December 31, 2008, 2007 and 2006 consisted of (in thousands of U.S. dollars):
2008 2007 2006
Service cost $ 3,825 $ 3,543 $ 3,197
Interest cost 2,477 1,964 1,882
Expected return on plan assets (2,752) (1,876) (1,973)
Transition obligation amortization 570 1,099 —
Net periodic benefi t cost $ 4,120 $ 4,730 $ 3,106
At December 31, 2008 and 2007, the Zurich Plan’s asset allocation was as follows:
2008 2007
Debt securities 69% 65%
Real estate 13 13
Equity securities 9 12
Other 9 10
Total 100% 100%
The investment strategy of the Zurich Plan’s Pension Committee is to achieve a consistent long-term return which will provide suffi cient funding for future pension obligations while limiting risk. The majority of the Zurich Plan’s assets are invested in insured funds and the remainder are invested in equities. The investment strategy is reviewed regularly.
The expected long-term rate of return on plan assets is based on the expected asset allocation and assumptions concerning long-term interest rates, infl ation rates and risk premiums for equities above the risk-free rates of return. These assumptions take into consideration historical long-term rates of return for the relevant asset categories.
The assumptions used to determine the pension obligation and net periodic benefi t cost for the years ended December 31, 2008, 2007 and 2006 were as follows:
2008Pension
obligation
2008Net periodicbenefi t cost
2007Pension
obligation
2007Net periodicbenefi t cost
2006Pension
obligation
2006Net periodicbenefi t cost
Discount rate 2.75% 3.5% 3.5% 3.0% 3.0% 3.0%
Expected return on plan assets — 3.75 — 3.25 — 3.25
Rate of compensation increase 3.5 3.5 3.5 3.5 3.5 3.5
At December 31, 2008, estimated employer contributions to be paid in 2009 were $5.1 million and future benefi t payments were estimated to be paid as follows (in thousands of U.S. dollars):
Period Amount
2009 $ 3,694
2010 4,276
2011 4,628
2012 5,483
2013 5,017
2014 to 2018 26,160
The Company does not believe that any plan assets will be returned to the Company during 2009.
521258_P102-156_FIN.indd 132521258_P102-156_FIN.indd 132 3/18/09 12:39:52 AM3/18/09 12:39:52 AM

PartnerReAnnual Report 2008
133
PartnerRe Ltd.Notes to Consolidated Financial Statements
Frozen Defined Benefit PlanPrior to June 1999, the Company had defi ned benefi t plans in place covering substantially all of its employees. All active employees previously enrolled in defi ned benefi t plans have been transferred to defi ned contribution plans or the Zurich Plan. Benefi t accruals under the former defi ned benefi t plans were either frozen, except for certain disabled participants, or rolled into defi ned contribution plans or the Zurich Plan. At December 31, 2008 and 2007, the frozen defi ned benefi t plan had plan assets of $6.1 million and $7.5 million, respectively, with a pension obligation of $5.9 million and $6.4 million, respectively, resulting in the defi ned benefi t plan being overfunded by $0.2 million and $1.1 million, respectively. The total amounts recognized in accumulated other comprehensive income at December 31, 2008 and 2007 were $1.4 million (net of $0.7 million of taxes) and $0.4 million (net of $0.2 million of taxes), respectively.
10. Stock and Stock Option Plans Employee Equity PlanIn May 2005, the shareholders approved the PartnerRe Ltd. 2005 Employee Equity Plan (the EEP) and replaced the existing employee plan, the Employee Incentive Plan (the EIP). The EEP permits the grant of stock options, restricted shares (RS), restricted share units (RSU), share appreciation rights (SAR) or other share-based awards to employees of the Company. The EEP is administered by the Compensation Committee of the Board (the Committee).
In May 2008, the Company approved an allocation of an additional 0.6 million shares to the EEP. Currently, the plan permits the grant of up to 2.9 million shares, of which a total of 1.3 million shares can be issued as either RS or RSU and 1.6 million shares can be issued as stock options or SARs. If an award under the EEP is cancelled or forfeited without the delivery of the full number of shares underlying such award, only the net number of shares actually delivered to the participant will be counted against the EEP’s authorized shares. Under the EEP, the exercise price of the award will not be less than the fair value of the award at the time of grant. The fair value is defi ned in the EEP as the closing price reported on the grant date. Awards issued under the EEP generally vest over 3 years of continuous service, either ratably or with a cliff-vest provision, are expensed ratably over the vesting period and have a ten year contractual term. Participants in the EEP are eligible to receive dividends, which the Company records as an expense, on awards that are unvested. Shares available for grant under the EIP at the time of replacement were transferred and became available for grant under the EEP, including an additional 1.0 million common shares approved by shareholders for issuance under the EEP.
Certain awards to certain senior executives will, if the Committee intends such award to qualify as “qualifi ed performance based compensation” under Section 162(m) of the Internal Revenue Code (IRC), become earned and payable only if pre-established targets relating to one or more of the following performance measures are achieved: (i) earnings per share, (ii) fi nancial year return on common equity, (iii) underwriting year return on equity, (iv) return on net assets, (v) organizational objectives, and (vi) premium growth. The individual maximum number of shares underlying any such share-denominated award granted in any year will be 800,000 shares, and the individual maximum amount earned with respect to any such non-share denominated award granted in any year will be $5,000,000.
Non-Employee Directors’ Stock PlanThe Non-Employee Directors’ Stock Plan (Directors’ Stock Plan), which is shareholder-approved, permits the grant of up to 0.5 million stock options, RS, RSU, alternative awards and other share-based awards. Under the Directors’ Stock Plan, the exercise price of the stock options will be equivalent to the fair value of the stock options at the time of grant, as defi ned in the Directors’ Stock Plan. Option awards issued under the Directors’ Stock
521258_P102-156_FIN.indd 133521258_P102-156_FIN.indd 133 3/18/09 12:40:06 AM3/18/09 12:40:06 AM

PartnerRe Ltd.Notes to Consolidated Financial Statements
134 PartnerReAnnual Report 2008
Plan generally vest at the time of grant and are expensed immediately and have a ten-year contractual term. RSU awards issued under the Directors’ Stock Plan generally vest at the time of grant with a minimum delivery date restriction of fi ve years and are expensed immediately. At December 31, 2008, 0.1 million shares remained available for issuance under this plan.
Employee Share Purchase PlanThe Employee Share Purchase Plan (the ESPP), which is shareholder-approved, has one offering period per year with two purchase periods of six months. All employees are eligible to participate in the ESPP and can contribute between 1% and 10% of their base salary toward the purchase of the Company’s shares up to the limit set by the IRC. Employees who enroll in the ESPP may purchase the Company’s shares at a 15% discount of the fair value. Participants in the ESPP are eligible to receive dividends on their shares as of the purchase date. A total of 0.4 million common shares may be issued under the ESPP.
Swiss Share Purchase PlanThe Swiss Share Purchase Plan (the SSPP) has two offering periods per year with two purchase periods of six months. All full-time Swiss employees are eligible to participate in the SSPP and can contribute between 1% and 8% of their base salary toward the purchase of the Company’s shares up to a maximum of 5,000 Swiss francs per annum. Employees who enroll in the SSPP may purchase the Company’s shares at a 40% discount of the fair value. There is a restriction on transfer or sale of these shares for a period of two years following purchase. Participants in the SSPP are eligible to receive dividends on their shares as of the purchase date. A total of 0.1 million common shares may be issued under the SSPP.
Share-Based CompensationUnder each of the Company’s equity plans, the Company issues new shares upon the exercise of stock options or the conversion of RSU and SAR into shares.
For the years ended December 31, 2008, 2007 and 2006, the Company’s share-based compensation expense was $28.1 million, $24.9 million and $23.0 million, respectively with a tax benefi t of $2.0 million, $1.0 million and $2.2 million, respectively. The adoption of SFAS No. 123 (revised 2004), “Share-Based Payment” (SFAS 123(R)) resulted in additional compensation expense in 2006 of $2.0 million, or approximately $0.03 per basic and diluted share.
Stock Options
During 2008, 2007 and 2006, the Company issued 119,052 stock options, 76,434 stock options and 83,435 stock options with a weighted average grant date fair value of $11.07, $13.76 and $14.87, respectively.
In 2008, 2007 and 2006 153,146 stock options, 707,444 stock options and 285,382 stock options with a total grant date value of $2.3 million, $10.0 million and $4.1 million were exercised, respectively. The aggregate intrinsic value of stock options exercised for the years ended December 31, 2008, 2007 and 2006 was $3.4 million, $18.9 million and $5.6 million, respectively. The Company received $8.1 million, $35.1 million and $14.1 million from stock option exercises for the years ended December 31, 2008, 2007 and 2006, respectively.
In 2008 and 2007, the Company’s U.S. subsidiaries deducted $1.2 million and $5.2 million from their taxable income upon exercises of stock options with a corresponding tax benefi t realized on options exercised of $0.4 million and $1.8 million, respectively. Shareholders’ equity at December 31, 2008 and 2007, refl ects a tax benefi t of $1.9 million and $1.8 million, respectively, related to compensation expense deductions for stock options exercised by employees of the Company’s U.S. subsidiaries.
521258_P102-156_FIN.indd 134521258_P102-156_FIN.indd 134 3/18/09 12:40:23 AM3/18/09 12:40:23 AM

PartnerReAnnual Report 2008
135
PartnerRe Ltd.Notes to Consolidated Financial Statements
The activity related to the Company’s stock options for the years ended December 31, 2008,2007 and 2006 was as follows:
Options
2008WeightedAverageExercise
Price Options
2007WeightedAverageExercise
Price Options
2006WeightedAverageExercise
Price
Outstanding at beginning of year 2,431,754 $ 55.08 3,087,861 $ 53.38 3,323,006 $ 52.79
Granted 119,052 74.41 76,434 73.19 83,435 63.29
Exercised (153,146) 53.01 (707,444) 49.65 (285,382) 49.12
Forfeited or expired (8,280) 54.20 (25,097) 53.76 (33,198) 55.92
Outstanding at end of year 2,389,380 56.00 2,431,754 55.08 3,087,861 53.38
Options exercisable at end of year 2,331,416 $ 55.62 2,181,609 $ 54.62 2,417,987 $ 52.01
Stock options vested and expected to vest and the weighted average exercise price forthese stock options was 2,386,008 stock options and $55.98, respectively, at December 31,2008. The aggregate intrinsic value and weighted average remaining contractual term ofstock options vested and expected to vest at December 31, 2008 was $36.9 million and4.6 years, respectively. The aggregate intrinsic value and weighted average remainingcontractual term of stock options exercisable at December 31, 2008 was $36.8 million and4.5 years, respectively.
The following table summarizes information about stock options outstanding atDecember 31, 2008:
Options Outstanding Options Exercisable
Range of Exercise PricesNumber
Outstanding
WeightedAverage
RemainingContractualLife (years)
WeightedAverageExercise
PriceNumber
Exercisable
WeightedAverageExercise
Price
$36.31 – $49.60 173,885 1.5 $ 44.04 173,885 $ 44.04
$49.61 – $53.66 595,229 3.6 50.62 595,229 50.62
$53.67 – $55.63 957,892 4.3 54.99 957,892 54.99
$55.64 – $62.70 275,391 6.2 62.00 263,691 61.98
$62.71 – $73.19 303,656 7.1 66.03 288,267 65.87
$73.20 – $75.85 83,327 9.3 74.74 52,452 74.08
$36.31 – $75.85 2,389,380 4.7 $ 56.00 2,331,416 $ 55.62
The Company values stock options issued with a Black-Scholes valuation model and usedthe following assumptions for the years ended December 31, 2008, 2007 and 2006:
Weighted average assumptions used 2008 2007 2006
Expected life 6 years 6 years 6 years
Expected volatility 15.9% 17.1% 22.4%
Risk-free interest rate 3.2% 4.5% 5.0%
Dividend yield 2.5% 2.5% 2.6%
The Company used the simplifi ed method for vanilla options under Staff Accounting BulletinNo. 107, “Share-Based Payment” (SAB 107) to determine the expected life of options.Expected volatility is based on the historical volatility of the Company’s common shares overa period equivalent to the expected life of the Company’s options. The risk-free interestrate is based on the market yield of U.S treasury securities with maturities equivalent to theexpected life of the Company’s options. The dividend yield is based on the average dividendyield of the Company’s shares over the expected life of the Company’s options.
PRe_AR08-Fin_ConBalSh,Notes-03_20_09.indd 135PRe_AR08-Fin_ConBalSh,Notes-03_20_09.indd 135 3/23/09 10:28:52 AM3/23/09 10:28:52 AM

PartnerRe Ltd.Notes to Consolidated Financial Statements
136 PartnerReAnnual Report 2008
Restricted Share Units
During 2008, 2007 and 2006, the Company issued 241,458 RSU, 316,427 RSU and 118,193 RSU with a weighted average grant date fair value of $77.19, $71.63 and $61.77, respectively. The Company values RSU issued under all plans at the fair value of its common shares at the time of grant, as defi ned by the plan document.
The activity related to the Company’s RSU for the years ended December 31, 2008, 2007 and 2006 was as follows:
2008 2007 2006
Outstanding at beginning of period 681,428 398,912 294,174
Granted 241,458 316,427 118,193
Released (159,636) (20,510) (2,990)
Forfeited (11,515) (13,401) (10,465)
Outstanding at end of period 751,735 681,428 398,912
Of the 751,735 RSU outstanding at December 31, 2008, 118,766 are subject to a fi ve year delivery date restriction from the grant date and were not released for conversion into shares.
Total unrecognized share-based compensation expense related to unvested RSU was approximately $16.1 million at December 31, 2008, which is expected to be recognized over a weighted-average period of 1.7 years.
Share Appreciation Rights (SAR)
During 2008, 2007 and 2006, the Company issued 339,920 SAR, 360,228 SAR and 174,770 SAR with a weighted average grant date fair value of $11.50, $13.88 and $14.37, respectively.
The activity related to the Company’s SAR for the years ended December 31, 2008, 2007 and 2006 was as follows:
2008 2007 2006
Outstanding at beginning of period 510,518 164,770 —
Granted 339,920 360,228 174,770
Exercised (2,772) (1,980) —
Forfeited (23,628) (12,500) (10,000)
Outstanding at end of period 824,038 510,518 164,770
Total unrecognized share-based compensation expense related to unvested SAR was approximately $4.4 million at December 31, 2008, which is expected to be recognized over a weighted-average period of 1.8 years.
The Company values SAR issued with a Black-Scholes valuation model and used the following assumptions for the years ended December 31, 2008, 2007 and 2006:
Weighted average assumptions used 2008 2007 2006
Expected life 6 years 6 years 6 years
Expected volatility 16.0 % 18.0 % 23.2 %
Risk-free interest rate 3.3 % 4.6 % 4.6 %
Dividend yield 2.6 % 2.5 % 2.6 %
In determining the weighted average assumptions used, the Company used the same methodology as described in stock options above.
521258_P102-156_FIN.indd 136521258_P102-156_FIN.indd 136 3/18/09 12:40:51 AM3/18/09 12:40:51 AM

PartnerReAnnual Report 2008
137
PartnerRe Ltd.Notes to Consolidated Financial Statements
11. Dividend Restrictions and Statutory RequirementsThe Company’s ability to pay common and preferred shareholders’ dividends and its expenses is dependent mainly on cash dividends from Partner Reinsurance, PartnerRe Europe and PartnerRe U.S. (collectively the reinsurance subsidiaries). The payment of such dividends by the reinsurance subsidiaries to the Company is limited under Bermuda and Irish laws and certain statutes of various U.S. states in which PartnerRe U.S. is licensed to transact business. The restrictions are generally based on net income and/or certain levels of policyholders’ earned surplus as determined in accordance with the relevant statutory accounting practices. As of December 31, 2008, there were no signifi cant restrictions on the payment of dividends by Partner Reinsurance. However, PartnerRe Europe is currently restricted from paying dividends under Irish company law given it has negative retained earnings due to transactions undertaken as part of the reorganization (see Note 1), and PartnerRe U.S. is currently restricted from paying dividends under New York law given it has negative earned surplus.
The reinsurance subsidiaries are required to fi le annual statements with insurance regulatory authorities prepared on an accounting basis prescribed or permitted by such authorities (statutory basis), maintain minimum levels of solvency and liquidity and comply with risk-based capital requirements and licensing rules. As of December 31, 2008, the reinsurance subsidiaries’ solvency, liquidity and risk-based capital amounts were in excess of the minimum levels required. The typical adjustments to insurance statutory basis amounts to convert to U.S. GAAP include elimination of certain statutory reserves, deferral of certain acquisition costs, recognition of goodwill and deferred income taxes, valuation of bonds at fair value and presentation of ceded reinsurance balances gross of assumed balances.
The statutory net income (loss) of the Company’s reinsurance subsidiaries for the years ended December 31, 2008, 2007 and 2006 was as follows (in thousands of U.S. dollars):
2008 (unaudited) 2007 2006
Partner Reinsurance $ 484,070 $ 765,394 $ 673,274
PartnerRe Europe (144,591) (932) (31)
PartnerRe U.S. (30,105) 35,924 66,643
The following table summarizes the statutory shareholders’ equity of the Company’s reinsurance subsidiaries as of December 31, 2008 and 2007 (in thousands of U.S. dollars):
2008 (unaudited) 2007
Partner Reinsurance $ 2,625,946 $ 2,973,854
PartnerRe Europe 1,256,493 126,613
PartnerRe U.S. 608,313 677,081
PartnerRe Europe’s statutory net income and shareholders’ equity for 2007 and 2006 are prior to its reorganization (see Note 1). At December 31, 2008, the Company’s Swiss and French operations are branches of PartnerRe Europe and are regulated by the Irish Financial Regulatory Authority as prescribed by the EU Reinsurance Directive.
521258_P102-156_FIN.indd 137521258_P102-156_FIN.indd 137 3/18/09 12:41:04 AM3/18/09 12:41:04 AM

PartnerRe Ltd.Notes to Consolidated Financial Statements
138 PartnerReAnnual Report 2008
12. DebtIn connection with the acquisition of the reinsurance operations of Winterthur Re in 1998, the Company’s subsidiary, PartnerRe U.S. Corporation (PartnerRe U.S. Holdings) obtained a $220.0 million, 5.81% fi xed rate bank loan. The loan, which was fully collaterized, was repaid in 2008 using the proceeds from the issuance of the Senior Notes (see Note 13). PartnerRe U.S. Holdings incurred interest expense of $8.7 million and paid interest of $9.6 million for the year ended December 31, 2008 and incurred interest expense and paid interest of $13.0 million in each of the years ended December 31, 2007 and 2006 in relation to this loan.
In October 2005, the Company entered into a loan agreement with Citibank, N.A. under which the Company borrowed $400.0 million. The loan, which had an original maturity of April 2009, bears interest quarterly at a fl oating rate of 3-month LIBOR plus 0.50%. The Company was not permitted to prepay the loan prior to its maturity, and the loan was not callable or puttable by the lender other than upon an event of default. Citibank, N.A. has pledged its rights under the loan agreement, including the proceeds of any repayment or syndication of the loan, to the Company to secure its obligations to the Company under a forward sale agreement (see Note 15), subject to Citibank, N.A.’s right to substitute cash collateral.
On July 31, 2008, the Company entered into an amendment (Loan Amendment) to the loan agreement with Citibank N.A. Under the terms of the Loan Amendment, the maturity of half of the original $400.0 million loan was extended to July 12, 2010. The remaining half of the original loan retained its original maturity of April 27, 2009. Under the Loan Amendment, the amended half of the loan will bear interest quarterly at a fl oating rate of 3-month LIBOR plus 0.50% through April 27, 2009 and at a rate of 3-month LIBOR plus 0.85% thereafter. The interest rate on the unamended half of the loan remained unchanged at 3-month LIBOR plus 0.50%.
The Company incurred interest expense of $15.2 million, $23.5 million and $22.7 million and paid interest of $16.1 million, $23.7 million and $2l.8 million for the years ended December 31, 2008, 2007 and 2006, respectively, in relation to this loan.
13. Debt Related to Senior Notes and Capital Effi cient Notes Senior Notes
In May 2008, PartnerRe Finance A LLC (PartnerRe Finance A), an indirect wholly-owned subsidiary of the Company, issued $250.0 million aggregate principal amount of 6.875% Senior Notes (Senior Notes). The Senior Notes will mature on June 1, 2018 and may be redeemed at the option of the issuer, in whole or in part, at any time. Interest on the Senior Notes is payable semi-annually commencing on December 1, 2008 at an annual fi xed rate of 6.875%, and cannot be deferred.
The Senior Notes are ranked as senior unsecured obligations of PartnerRe Finance A. The Company has fully and unconditionally guaranteed all obligations of PartnerRe Finance A under the Senior Notes. The Company’s obligations under this guarantee are senior and unsecured and rank equally with all other senior unsecured indebtedness of the Company. The proceeds from the Senior Notes were used to redeem the $220.0 million, 5.81% fi xed rate bank loan owed by PartnerRe U.S. Holdings and the remaining net proceeds were used for general corporate purposes (see Note 12).
Contemporaneously, PartnerRe U.S. Holdings issued a 6.875% promissory note, with a principal amount of $250.0 million to PartnerRe Finance A. Under the term of the promissory note, PartnerRe U.S. Holdings promises to pay to PartnerRe Finance A the principal amount on June 1, 2018, unless previously paid. Interest on the promissory note is payable semi-
521258_P102-156_FIN.indd 138521258_P102-156_FIN.indd 138 3/18/09 12:41:19 AM3/18/09 12:41:19 AM

PartnerReAnnual Report 2008
139
PartnerRe Ltd.Notes to Consolidated Financial Statements
annually commencing on December 1, 2008 at an annual fi xed rate of 6.875%, and cannot be deferred. For the year ended December 31, 2008, the Company incurred interest expense of $10.2 million and paid interest of $8.8 million.
Capital Efficient Notes (CENts)In November 2006, PartnerRe Finance II Inc. (PartnerRe Finance II), an indirect wholly-owned subsidiary of the Company, issued $250.0 million aggregate principal amount of 6.440% Fixed-to-Floating Rate Junior Subordinated CENts. The CENts will mature on December 1, 2066 and may be redeemed at the option of the issuer, in whole or in part, after December 1, 2016 or earlier upon occurrence of specifi c rating agency or tax events. Interest on the CENts is payable semi-annually commencing on June 1, 2007 to December 1, 2016 at an annual fi xed rate of 6.440% and will be payable quarterly thereafter until maturity at an annual rate of 3-month LIBOR plus a margin equal to 2.325%.
PartnerRe Finance II may elect to defer one or more interest payments for up to ten years, although interest will continue to accrue and compound at the rate of interest applicable to the CENts. The CENts are ranked as junior subordinated unsecured obligations of PartnerRe Finance II. The Company has fully and unconditionally guaranteed on a subordinated basis all obligations of PartnerRe Finance II under the CENts. The Company’s obligations under this guarantee are unsecured and rank junior in priority of payments to the Company’s current and long-term debt and Senior Notes. The Company used a portion of the net proceeds from the CENts to effect the redemption of all of the $200.0 million liquidation amount of its 7.90% trust preferred securities issued in 2001 and the remaining net proceeds were used for general corporate purposes.
Contemporaneously, PartnerRe U.S. Holdings issued a 6.440% Fixed-to-Floating Rate promissory note, with a principal amount of $257.6 million to PartnerRe Finance II. Under the term of the promissory note, PartnerRe U.S. Holdings promises to pay to PartnerRe Finance II the principal amount on December 1, 2066, unless previously paid. Interest on the promissory note is payable semi-annually commencing on June 1, 2007 to December 1, 2016 at an annual fi xed rate of 6.440% and will be payable quarterly thereafter until maturity at an annual rate of 3-month LIBOR plus a margin equal to 2.325%. For the years ended December 31, 2008 and 2007, the Company incurred interest expense of $16.6 million and $16.5 million, respectively, and paid interest of $16.6 million and $17.7 million, respectively.
The Company does not consolidate PartnerRe Finance A, which issued the Senior Notes, or PartnerRe Finance II, which issued the CENts, as they do not meet the consolidation requirements under FIN 46(R). The Company has refl ected the debt related to the Senior Notes and the CENts in its Consolidated Balance Sheets.
14. Shareholders’ Equity Authorized Shares
At December 31, 2008 and 2007, the total authorized shares of the Company were 200 million shares, par value $1.00 per share, as follows (in millions of shares):
2008 2007
Designated common shares 130.0 130.0
Designated 6.75% Series C cumulative redeemable preferred shares 11.6 11.6
Designated 6.5% Series D cumulative redeemable preferred shares 9.2 9.2
Designated and redeemed preference shares 14.0 14.0
Undesignated 35.2 35.2
200.0 200.0
521258_P102-156_FIN.indd 139521258_P102-156_FIN.indd 139 3/18/09 12:41:35 AM3/18/09 12:41:35 AM

PartnerRe Ltd.Notes to Consolidated Financial Statements
140 PartnerReAnnual Report 2008
Common SharesIn September 2008, the Company’s Board of Directors increased the shares authorized for repurchase by the Company to 5 million shares. At December 31, 2008, the Company had 5 million common shares remaining under its current share repurchase authorization.
During 2008, the Company repurchased 1.5 million of its common shares pursuant to its repurchase program at a total cost of $110.0 million, representing an average cost of $71.79 per share. During 2007, the Company repurchased in the open market 3.6 million of its common shares pursuant to its share repurchase program at a total cost of $275.0 million, representing an average cost of $76.06 per share. During 2006, the Company did not repurchase any common shares.
On July 31, 2008, the Company amended its existing forward sale agreement (see Note 15). Under the terms of the amendment, half the contract matured according to its original term beginning on September 26, 2008, while the remaining half is extended to April 2010. Under the maturing forward sale agreement, the Company delivered 3,366,295 common shares to the forward counterparty over the 40 day valuation period for total proceeds of $211.6 million. The value received per share was the average daily market price per share over the valuation period, subject to a minimum price per share of $59.37.
At December 31, 2008, approximately 1.3 million common shares are held in treasury and available for reissuance.
Series C Cumulative Preferred SharesIn May 2003, the Company issued 11.6 million of 6.75% Series C cumulative redeemable preferred shares (Series C preferred shares) for a total consideration of $280.9 million after underwriting discounts and commissions totaling $9.1 million. Beginning May 8, 2008, the Company may redeem the Series C preferred shares at $25.00 per share plus accrued and unpaid dividends without interest. Dividends on the Series C preferred shares are cumulative from the date of issuance and are payable quarterly in arrears. In the event of liquidation of the Company, the holders of outstanding preferred shares would have preference over the common shareholders and would receive a distribution of $25.00 per share, or an aggregate value of $290 million, plus accrued and unpaid dividends.
Series D Cumulative Preferred SharesIn November 2004, the Company issued 9.2 million of 6.5% Series D cumulative redeemable preferred shares (Series D preferred shares) for a total consideration of $222.3 million after underwriting discounts and commissions totaling $7.7 million. The Series D preferred shares cannot be redeemed before November 15, 2009. Beginning November 15, 2009, the Company may redeem the Series D preferred shares at $25.00 per share plus accrued and unpaid dividends without interest. Dividends on the Series D preferred shares are cumulative from the date of issuance and are payable quarterly in arrears. In the event of liquidation of the Company, the holders of outstanding preferred shares would have preference over the common shareholders and would receive a distribution of $25.00 per share, or an aggregate value of $230 million, plus accrued and unpaid dividends.
521258_P102-156_FIN.indd 140521258_P102-156_FIN.indd 140 3/18/09 12:41:52 AM3/18/09 12:41:52 AM

PartnerReAnnual Report 2008
141
PartnerRe Ltd.Notes to Consolidated Financial Statements
Net Income per ShareThe reconciliation of basic and diluted net income per share for the years ended December 31, 2008, 2007 and 2006 is as follows (in thousands of U.S. dollars or shares, except per share amounts):
Numerator: 2008 2007 2006
Net income $ 46,567 $ 717,812 $ 749,332
Less: preferred dividends (34,525) (34,525) (34,525)
Net income available to common shareholders $ 12,042 $ 683,287 $ 714,807
Denominator:
Weighted average number of common shares outstanding — basic 54,347.1 56,104.4 56,822.5
Stock options and other (1) 1,292.5 1,453.5 980.3
Weighted average number of common and common share equivalents outstanding — diluted 55,639.6 57,557.9 57,802.8
Basic net income per share $ 0.22 $ 12.18 $ 12.58
Diluted net income per share $ 0.22 $ 11.87 $ 12.37
(1) At December 31, 2008, 2007 and 2006, stock options to purchase 870.1 thousand, 4.7 thousand and nil common shares, respectively, were excluded from the calculation of diluted weighted average number of common and common share equivalents outstanding because their exercise prices were greater than the average market price of the common shares.
15. Off-Balance Sheet ArrangementsIn October 2005, the Company entered into a forward sale agreement under which it agreed to sell approximately 6.7 million of its common shares to an affi liate of Citigroup Global Markets Inc., which affi liate is referred to as the forward counterparty. Under the forward sale agreement, the Company would deliver common shares to the forward counterparty on one or more settlement dates chosen by the Company prior to October 2008.
Under the terms of the unamended half of the forward sale agreement, in 2008 the Company delivered 3,366,295 common shares to the forward counterparty for total proceeds of $211.6 million (see Note 14).
On July 31, 2008, the Company amended the existing forward sale agreement. Under the terms of the amendment, half the contract matured according to its original term beginning on September 26, 2008, while the remaining half is extended to April 2010.
The extension with the forward counterparty allows the Company to deliver 3,366,295 of the 6,732,590 common shares subject to the original contract to the forward counterparty at any time during the remaining term of the agreement, which will mature beginning on April 28, 2010. The future sale price of the Company’s common shares under the amended half of the forward sale agreement will vary depending upon the market price of its common shares over a 40 trading day period surrounding the maturity of the forward sale agreement in April 2010, subject to a minimum price per share of $59.33 and a maximum price per share of $84.43 at December 31, 2008. If the Company elects to settle all or a portion of the forward sale agreement prior to its maturity, the Company will deliver common shares to the forward counterparty and will initially receive the present value of the minimum price per share, and the remaining payment, if any, due to the Company will be made at maturity of the agreement based on the excess of the market price of the Company’s common shares over the minimum price per share at maturity of the contract. Settlement of the forward sale agreement may be accelerated by the forward counterparty upon the occurrence of certain events, and the maximum and minimum purchase prices will be reduced or increased quarterly depending on the amount of the Company’s dividends.
521258_P102-156_FIN.indd 141521258_P102-156_FIN.indd 141 3/18/09 12:42:07 AM3/18/09 12:42:07 AM

PartnerRe Ltd.Notes to Consolidated Financial Statements
142 PartnerReAnnual Report 2008
Under the terms of the extended forward sale agreement, contract fees of approximately $8.1 million were recorded against additional paid-in capital in 2008 and will be paid over the contract period. Prior to the issuance of shares under the forward sale agreement, this transaction has no other impact on the Company’s common shareholders’ equity, and the Company calculates the dilutive impact related to the forward sale agreement, if any, using the treasury stock method prescribed under SFAS 128, “Earnings per Share”.
For the fourth quarter of 2007, the diluted net income per share included the dilutive effect of 115,350 shares related to this agreement, as the Company’s average share price exceeded the maximum price per share during the fourth quarter of 2007. The 2008 and 2006 diluted net income per share did not include any dilutive effect related to this agreement.
16. Commitments and Contingencies
(a) Concentration of Credit RiskThe Company’s investment portfolio is managed following prudent standards of diversifi cation and a prudent investment philosophy. The Company is not exposed to any signifi cant credit concentration risk on its investments, except for debt securities issued by the U.S. and other AAA-rated sovereign governments. The Company keeps cash and cash equivalents in several banks and may keep up to $500 million, excluding custodial accounts, at any point in time in any one bank.
The Company’s investment strategy allows for the use of derivative instruments, subject to strict limitations. Derivative instruments may be used to replicate investment positions, manage currency, market exposure and duration risk, or to enhance investment performance that would be allowed under the Company’s investment policy if implemented in other ways. The Company is exposed to credit risk in the event of non-performance by the counterparties to the Company’s foreign exchange forward contracts and other derivative contracts. However, the Company diversifi es the counterparties to its derivative contracts to reduce credit risk, and because the counterparties to these contracts are high-credit-quality international banks, the Company does not anticipate non-performance. These contracts are generally of short duration and settle on a net basis. The difference between the contract amounts and the related market value represents the Company’s maximum credit exposure.
The Company is also exposed to credit risk in its underwriting operations, most notably in the credit/surety line and for different life and alternative risk products. Loss experience in these lines of business is cyclical and is affected by the state of the general economic environment. The Company provides its clients in these lines of business with reinsurance protection against credit deterioration, defaults or other types of fi nancial non-performance of or by the underlying credits that are the subject of the reinsurance provided and, accordingly, the Company is exposed to the credit risk of those credits. The Company mitigates the risks associated with these credit-sensitive lines of business through the use of risk management techniques such as risk diversifi cation, careful monitoring of risk aggregations and accumulations and, at times, through the use of retrocessional reinsurance protection and the purchase of credit default swaps and total return and interest rate swaps.
The Company has exposure to credit risk as it relates to its business written through brokers, if any of the Company’s brokers is unable to fulfi ll their contractual obligations with respect to payments to the Company. In addition, in some jurisdictions, if the broker fails to make payments to the insured under the Company’s policy, the Company might remain liable to the insured for the defi ciency.
The Company has exposure to credit risk related to reinsurance balances receivable and reinsurance recoverable on paid and unpaid losses (see Note 6). The credit risk exposure related to these balances is mitigated by several factors, including but not limited to, credit
521258_P102-156_FIN.indd 142521258_P102-156_FIN.indd 142 3/18/09 12:42:23 AM3/18/09 12:42:23 AM

PartnerReAnnual Report 2008
143
PartnerRe Ltd.Notes to Consolidated Financial Statements
checks performed as part of the underwriting process, monitoring of aged receivable balances and the contractual right to offset premiums receivable or funds held balances against unpaid losses and loss expenses. As of December 31, 2008 and 2007, the Company has recorded a provision for uncollectible premiums receivable of $6.5 million and $10.8 million, respectively.
The Company is also subject to the credit risk of its cedants in the event of insolvency or the cedant’s failure to honor the value of funds held balances for any other reason. However, the Company’s credit risk is mitigated, to some extent, by the fact that the Company generally has the contractual ability to offset any shortfall in the payment of the premiums receivable or funds held balances with amounts owed by the Company to the cedant for losses payable and other amounts contractually due.
(b) Lease ArrangementsThe Company leases offi ce space under operating leases expiring in various years through 2019. The leases are renewable at the option of the lessee under certain circumstances. The following is a schedule of future minimum rental payments, exclusive of escalation clauses, on non-cancelable leases as of December 31, 2008 (in thousands of U.S. dollars):
Period Amount
2009 $ 26,624
2010 26,124
2011 25,571
2012 23,305
2013 14,754
2014 through 2019 35,158
Total future minimum rental payments $ 151,536
Rent expense for the years ended December 31, 2008, 2007 and 2006 was $28.8 million, $25.9 million and $25.3 million, respectively.
The Company has also entered into non-cancelable operating subleases expiring in various years through 2010. The minimum rental income to be received by the Company in the future is $2.3 million. The leases are renewable at the option of the lessee under certain circumstances.
(c) Employment AgreementsThe Company has entered into employment agreements with its executive offi cers. These agreements provide for annual compensation in the form of salary, benefi ts, annual incentive payments, stock-based compensation, the reimbursement of certain expenses, retention incentive payments, as well as certain severance provisions.
(d) Other AgreementsThe Company has entered into service agreements and lease contracts that provide for business and information technology support and computer equipment. Future payments under these contracts amount to $27.4 million through 2014.
The Company has entered into strategic investments with unfunded capital commitments totaling $89.1 million through 2012. The Company expects to fund capital commitments of $51.1 million, $18.0 million, $16.5 million and $3.5 million during 2009, 2010, 2011 and 2012, respectively.
Under the terms of the Company’s extended forward sale agreement (see Note 15), the Company will pay approximately $8.1 million, including interest, in contract fees through 2010.
521258_P102-156_FIN.indd 143521258_P102-156_FIN.indd 143 3/18/09 12:42:43 AM3/18/09 12:42:43 AM

PartnerRe Ltd.Notes to Consolidated Financial Statements
144 PartnerReAnnual Report 2008
(e) Legal ProceedingsLitigation
The Company’s reinsurance subsidiaries, and the insurance and reinsurance industry in general, are subject to litigation and arbitration in the normal course of their business operations. In addition to claims litigation, the Company and its subsidiaries may be subject to lawsuits and regulatory actions in the normal course of business that do not arise from or directly relate to claims on reinsurance treaties. This category of business litigation typically involves, among other things, allegations of underwriting errors or misconduct, employment claims or regulatory activity. While the outcome of business litigation cannot be predicted with certainty, the Company will dispute all allegations against the Company and/or its subsidiaries that Management believes are without merit.
As of December 31, 2008, the Company was not a party to any litigation or arbitration that it believes could have a material adverse effect on the fi nancial condition, results of operations or liquidity of the Company.
Subpoenas
In June 2005, the Company received a subpoena from the United States Attorney for the Southern District of New York requesting information relating to the Company’s fi nite reinsurance products. In addition, the Company’s wholly owned subsidiary, PartnerRe U.S., received a subpoena from the Florida Offi ce of Insurance Regulation in April 2005 requesting information in connection with its investigation of insurance industry practices related to fi nite reinsurance activities. The Company has responded promptly to all requests for information.
In January 2007, PartnerRe U.S. received a subpoena from the Attorney General for the State of Connecticut requesting information relating to the Company’s participation in certain underwriting agreements that existed in 2002 and prior. The Company has responded promptly to all requests for information.
17. Derivatives Foreign Exchange Forward Contracts
The Company utilizes foreign exchange forward contracts as part of its overall currency risk management and investment strategies. In accordance with SFAS 133, these derivative instruments are recorded in the Consolidated Balance Sheets at fair value, with changes in fair value recognized in net foreign exchange gains and losses in the Consolidated Statements of Operations.
Foreign exchange forward contracts outstanding with a notional value of $1,323.9 million had a net unrealized gain of $20.3 million as of December 31, 2007.
The Company also utilizes foreign exchange forward contracts to hedge a portion of its net investment exposure resulting from the translation of its foreign subsidiaries and branches whose functional currency is other than the U.S. dollar. During the fourth quarter of 2008, the Company entered into foreign exchange forward contracts with notional amounts of Euro 250 million and Canadian $125 million. A portion of these contracts have been designated as fair value hedges under SFAS 133.
Foreign Currency Option ContractsThe Company also utilizes foreign currency option contracts to mitigate foreign currency risk. For the year ended December 31, 2007, the balances related to contracts maturing on December 31 were a receivable of $0.8 million. At December 31, 2007, there were no outstanding contracts.
Futures ContractsExchange traded treasury note futures are used by the Company for the purposes of managing portfolio duration. The notional value of the treasury futures was a long position of
521258_P102-156_FIN.indd 144521258_P102-156_FIN.indd 144 3/18/09 12:42:56 AM3/18/09 12:42:56 AM

PartnerReAnnual Report 2008
145
PartnerRe Ltd.Notes to Consolidated Financial Statements
$485 million at December 31, 2007. The fair value of futures contracts was a net unrealized gain of $0.9 million at December 31, 2007.
Credit Default SwapsThe Company purchases protection through credit default swaps to mitigate the risk associated with its underwriting operations, most notably in the credit/surety line and to manage market exposures. These credit default swaps are recorded at fair value and the Company uses externally modeled quoted prices that use observable market inputs to estimate the fair value. The fair value of protection purchased through credit default swaps was a net unrealized gain of $0.3 million and a notional value of $498 million at December 31, 2007.
The Company assumes credit risk through credit default swaps to replicate investment positions. The original term of these credit default swaps is generally fi ve years or less and there are no recourse provisions associated with these swaps. While the Company would be required to perform under exposure assumed through credit default swaps in the event of a default on the underlying issuer, no issuer was in default at December 31, 2008. The counterparties on the Company’s assumed credit default swaps are all highly rated fi nancial institutions. The fair value of the Company’s assumed credit default swaps was an unrealized loss of $2.1 million and the notional value was $34 million at December 31, 2007.
Weather DerivativesThe Company has entered into various weather derivatives. The fair value of weather derivatives (the Company’s net liabilities) was a net unrealized loss of $1.8 million at December 31, 2007. The notional value of the Company’s weather derivatives was $39 million at December 31, 2007.
Total Return and Interest Rate SwapsThe Company has entered into total return swaps referencing various project and principal fi nance obligations. The Company has also entered into interest rate swaps to mitigate interest rate risk on certain total return swaps. The fair value of those derivatives (the Company’s net liabilities) was a net unrealized loss of $33.7 million at December 31, 2007. The notional value of the Company’s total return swaps was $273 million at December 31, 2007.
Pursuant to the Company’s adoption of the disclosure requirements of SFAS 161 “Disclosures about Derivative Instruments and Hedging Activities — an amendment of FASB Statement No. 133” (SFAS 161), the fair values and notional values of derivatives included in the Company’s Consolidated Balance Sheet at December 31, 2008 were as follows (in thousands of U.S. dollars):
Derivatives designated as hedges Fair ValueNotional
Value
Foreign exchange forward contracts (net investment hedge) $ (37,470) $ 443,210
Derivatives not designated as hedges
Foreign exchange forward contracts $ 32,522 $ 1,196,830
Foreign currency option contracts (8,027) 123,932
Futures contracts 7,991 1,122,524
Credit default swaps (protection purchased) 20,305 295,665
Credit default swaps (assumed risks) (16,191) 46,130
Weather derivatives (5,393) 60,000
Total return swaps (24,898) 239,733
Interest rate swaps (12,355) —
Total derivatives not designated as hedges $ (6,046)
Total derivatives $ (43,516)
521258_P102-156_FIN.indd 145521258_P102-156_FIN.indd 145 3/18/09 12:43:10 AM3/18/09 12:43:10 AM

PartnerRe Ltd.Notes to Consolidated Financial Statements
146 PartnerReAnnual Report 2008
The fair value of all derivatives at December 31, 2008 is recorded in other invested assets in the Company’s Consolidated Balance Sheet. The effect of net investment hedging derivatives for the year ended December 31, 2008 was a $37.5 million loss recognized in accumulated other comprehensive income and $nil included in the Consolidated Statement of Operations.
The effect of derivatives not designated as hedges included in the Consolidated Statement of Operations for the year ended December 31, 2008 was as follows (in thousands of U.S. dollars):
Derivatives not designated as hedges
Location of (loss) gain on derivatives recognized in income
Amount of (loss) gainon derivatives
recognized in income
Foreign exchange forward contractsNet foreign exchange gains and losses $ (19,706)
Foreign currency option contractsNet foreign exchangegains and losses (15,167)
Futures contractsNet realized and unrealized investment gains and losses 7,150
Credit default swaps (protection purchased)
Net realized and unrealized investment gains and losses 19,311
Credit default swaps (assumed risks)
Net realized and unrealized investment gains and losses (15,581)
Weather derivativesNet realized and unrealized investment gains and losses 5,367
Total return swapsNet realized and unrealized investment gains and losses (1,049)
Interest rate swapsNet realized and unrealized investment gains and losses (8,795)
OtherNet realized and unrealized investment gains and losses 449
Total derivatives not designated as hedges $ (28,021)
18. Credit AgreementsIn the normal course of its operations, the Company enters into agreements with fi nancial institutions to obtain unsecured credit facilities. As of December 31, 2008, the total amount of such credit facilities available to the Company was $794.1 million. These facilities are used primarily for the issuance of letters of credit, although a portion of these facilities may also be used for liquidity purposes. Under the terms of certain reinsurance agreements, irrevocable letters of credit were issued on an unsecured basis in the amount of $570.4 million at December 31, 2008, in respect of reported loss and unearned premium reserves.
Included in the total credit facilities available to the Company at December 31, 2008 is a $700 million fi ve-year syndicated, unsecured credit facility. In February 2009, the Company and its lenders agreed to release one of the participants from its obligations under the syndicated facility. As such, the facility has been reduced from $700 million to $660 million. All other terms and conditions remain unchanged. This unsecured credit facility has the following terms: (i) a maturity date of September 30, 2010, (ii) a $300 million accordion feature, which enables the Company to potentially increase its available credit from $660 million to $960 million, and (iii) a minimum consolidated tangible net worth requirement as defi ned below. The ability of the Company to increase its available credit to $960 million is subject to the agreement of the credit facility participants and, given the current fi nancial crisis and related credit environment, this may be limited.
521258_P102-156_FIN.indd 146521258_P102-156_FIN.indd 146 3/18/09 12:43:24 AM3/18/09 12:43:24 AM
PartnerReAnnual Report 2008
147
PartnerRe Ltd.Notes to Consolidated Financial Statements
This facility is predominantly used for the issuance of letters of credit, although the Company and its subsidiaries have access to a revolving line of credit of up to $350 million as part of the Company’s syndicated unsecured credit facility. At December 31, 2008 and 2007, there were no borrowings under this revolving line of credit.
Some of the credit facilities contain customary default, cross payment and acceleration provisions and require that the Company maintain certain covenants, including the following:i. a fi nancial strength rating from A.M. Best of at least A- (for the Company’s material
reinsurance subsidiaries that are rated by A.M. Best);ii. a maximum ratio of total debt to total capitalization of 35% (for the purposes of this
covenant, debt does not include the CENts); andiii. a minimum consolidated tangible net worth of $2,100 million plus 50% of cumulative
net income (if positive) since July 1, 2005 through the most recent June 30 or December 31, for periods subsequent to June 30, 2006. For the purposes of this covenant, consolidated tangible net worth includes the CENts and excludes goodwill. Minimum tangible net worth required at December 31, 2008 was $2,695.7 million.
Additionally, the syndicated unsecured credit facility allows for an adjustment to the level of pricing should the Company experience a change in its senior unsecured debt ratings. The pricing grid provides the Company greater fl exibility and simultaneously provides participants under the facility some price protection. As long as the Company maintains a minimum senior unsecured debt rating of BBB+ by Standard & Poor’s and Baa1 by Moody’s, the pricing on the facility will not change signifi cantly.
The Company’s breach of any of the covenants would result in an event of default, upon which the Company may be required to repay any outstanding borrowings and replace or cash collateralize letters of credit issued under these facilities. At December 31, 2008 and 2007, the Company was not in breach of any of the covenants and no conditions of default existed under its facilities. Its total debt to total capitalization ratio was 12.7% and 11.9%, respectively, and its consolidated tangible net worth was $4,019.6 million and $4,142.1 million, at December 31, 2008 and 2007, respectively.
19. Segment InformationThe Company monitors the performance of its operations in three segments, Non-life, Life and Corporate & Other. The Non-life segment is further divided into four sub-segments: U.S., Global (Non-U.S.) P&C, Global (Non-U.S.) Specialty and Catastrophe.
The U.S. sub-segment includes property, casualty, motor, multiline, agriculture, surety and other risks generally originating in the United States. The Global (Non-U.S.) P&C sub-segment includes property, casualty and motor business generally originating outside of the United States. The Global (Non-U.S.) Specialty sub-segment is comprised of business that is generally considered to be specialized due to the sophisticated technical underwriting required to analyze risks, and is global in nature. This sub-segment consists of several lines of business for which the Company believes it has developed specialized knowledge and underwriting capabilities. These lines of business include agriculture, aviation/space, credit/surety, engineering, energy, marine, specialty property, specialty casualty and other lines. The Catastrophe sub-segment is comprised of the Company’s catastrophe line of business. The Life segment includes life, health and annuity lines of business. Corporate and Other is comprised of the Company’s capital markets and investment related activities, including principal fi nance transactions, insurance-linked securities and strategic investments, and its corporate activities, including other operating expenses.
521258_P102-156_FIN.indd 147521258_P102-156_FIN.indd 147 3/18/09 12:43:37 AM3/18/09 12:43:37 AM
PartnerRe Ltd.Notes to Consolidated Financial Statements
148 PartnerReAnnual Report 2008
Because the Company does not manage its assets by segment, net investment income is not allocated to the Non-life segment. However, because of the interest-sensitive nature of some of the Company’s Life products, net investment income is considered in Management’s assessment of the profi tability of the Life segment. The following items are not considered in evaluating the results of the Non-life and Life segments: net realized and unrealized investment gains and losses, interest expense, net foreign exchange gains and losses and income tax expense or benefi t. Segment results are shown net of intercompany transactions.
Management measures results for the Non-life segment on the basis of the loss ratio, acquisition ratio, technical ratio, other operating expense ratio and combined ratio (defi ned below). Management measures results for the Non-life sub-segments on the basis of the loss ratio, acquisition ratio and technical ratio. Management measures results for the Life segment on the basis of the allocated underwriting result, which includes revenues from net premiums earned, other income or loss and allocated net investment income for Life, and expenses from life policy benefi ts, acquisition costs and other operating expenses.
The following tables provide a summary of the segment revenues and results for the years ended December 31, 2008, 2007 and 2006 (in millions of U.S. dollars, except ratios):
521258_P102-156_FIN.indd 148521258_P102-156_FIN.indd 148 3/18/09 12:43:49 AM3/18/09 12:43:49 AM

PartnerReAnnual Report 2008
149
PartnerRe Ltd.Notes to Consolidated Financial Statements
Segment InformationFor the Year Ended December 31, 2008
U.S.
Global(Non-U.S.)
P&C
Global(Non-U.S.)Specialty Catastrophe
TotalNon-life
SegmentLife
Segment
Corporateand
Other Total
Gross premiums written $ 1,072 $ 769 $ 1,172 $ 413 $ 3,426 $ 584 $ 18 $ 4,028
Net premiums written $ 1,064 $ 765 $ 1,150 $ 413 $ 3,392 $ 579 $ 18 $ 3,989
Decrease (increase) in unearned premiums 24 32 (104) (10) (58) (3) — (61)
Net premiums earned $ 1,088 $ 797 $ 1,046 $ 403 $ 3,334 $ 576 $ 18 $ 3,928
Losses and loss expenses and life policy benefi ts (812) (454) (721) (144) (2,131) (463) (15) (2,609)
Acquisition costs (261) (198) (281) (37) (777) (120) (2) (899)
Technical result $ 15 $ 145 $ 44 $ 222 $ 426 $ (7) $ 1 $ 420
Other income 4 — 6 10
Other operating expenses (231) (43) (91) (365)
Underwriting result $ 199 $ (50) n/a $ 65
Net investment income 67 506 573
Allocated underwriting result (1) $ 17 n/a n/a
Net realized and unrealized investment losses (531) (531)
Interest expense (51) (51)
Net foreign exchange gains 6 6
Income tax expense (10) (10)
Interest in losses of equity investments (5) (5)
Net income n/a $ 47
Loss ratio (2) 74.6% 56.9% 69.0% 35.8% 63.9%
Acquisition ratio (3) 24.0 24.9 26.8 9.2 23.3
Technical ratio (4) 98.6% 81.8% 95.8% 45.0% 87.2%
Other operating expense ratio (5) 6.9
Combined ratio (6) 94.1%(1) Allocated underwriting result is defi ned as net premiums earned, other income or loss and allocated net investment income less life policy benefi ts, acquisition costs
and other operating expenses.(2) Loss ratio is obtained by dividing losses and loss expenses by net premiums earned.(3) Acquisition ratio is obtained by dividing acquisition costs by net premiums earned.(4) Technical ratio is defi ned as the sum of the loss ratio and the acquisition ratio.(5) Other operating expense ratio is obtained by dividing other operating expenses by net premiums earned.(6) Combined ratio is defi ned as the sum of the technical ratio and the other operating expense ratio.
521258_P102-156_FIN.indd 149521258_P102-156_FIN.indd 149 3/18/09 12:44:04 AM3/18/09 12:44:04 AM

PartnerRe Ltd.Notes to Consolidated Financial Statements
150 PartnerReAnnual Report 2008
Segment InformationFor the Year Ended December 31, 2007
U.S.
Global(Non-U.S.)
P&C
Global(Non-U.S.)
Specialty Catastrophe
TotalNon-life
SegmentLife
Segment
Corporateand
Other (A) Total
Gross premiums written $ 1,020 $ 740 $ 1,049 $ 401 $ 3,210 $ 597 $ 3 $ 3,810
Net premiums written $ 1,020 $ 738 $ 1,026 $ 401 $ 3,185 $ 569 $ 3 $ 3,757
(Increase) decrease in unearned premiums (21) 20 (20) 39 18 2 — 20
Net premiums earned $ 999 $ 758 $ 1,006 $ 440 $ 3,203 $ 571 $ 3 $ 3,777
Losses and loss expenses and life policy benefi ts (608) (523) (450) (46) (1,627) (455) — (2,082)
Acquisition costs (241) (191) (260) (42) (734) (116) — (850)
Technical result $ 150 $ 44 $ 296 $ 352 $ 842
$ — $ 3 $ 845
Other income (loss) 7 — (24) (17)
Other operating expenses (214) (33) (80) (327)
Underwriting result $ 635 $ (33) n/a $ 501
Net investment income 54 469 523
Allocated underwriting result (1) $ 21 n/a n/a
Net realized investment losses (72) (72)
Interest expense (54) (54)
Net foreign exchange losses (15) (15)
Income tax expense (82) (82)
Interest in losses of equity investments (83) (83)
Net income n/a $ 718
Loss ratio (2) 60.8% 69.0% 44.7% 10.5% 50.8%
Acquisition ratio (3) 24.1 25.2 25.9 9.6 22.9
Technical ratio (4) 84.9% 94.2% 70.6% 20.1% 73.7%
Other operating expense ratio (5) 6.7
Combined ratio (6) 80.4%(A) The Company reports the results of ChannelRe Holdings on a one-quarter lag. The 2007 period includes the Company’s share of ChannelRe Holdings’ net loss
and a charge which represents the write-down of its total investment in ChannelRe Holdings due to anticipated unrealized mark-to-market losses on Channel Reinsurance Ltd’s credit derivative portfolio, which it expected to incur during the three months ended December 31, 2007, for a total of $92.8 million (see Note 21).
521258_P102-156_FIN.indd 150521258_P102-156_FIN.indd 150 3/18/09 12:44:20 AM3/18/09 12:44:20 AM

PartnerReAnnual Report 2008
151
PartnerRe Ltd.Notes to Consolidated Financial Statements
Segment InformationFor the Year Ended December 31, 2006
U.S.
Global(Non-U.S.)
P&C
Global(Non-U.S.)
Specialty Catastrophe
TotalNon-life
SegmentLife
Segment
Corporateand
Other (B) Total
Gross premiums written $ 1,030 $ 763 $ 1,012 $ 412 $ 3,217 $ 507 $ 10 $ 3,734
Net premiums written $ 1,029 $ 760 $ 991 $ 412 $ 3,192 $ 487 $ 10 $ 3,689
Decrease (increase) in unearned premiums 1 15 (12) (24) (20) — (2) (22)
Net premiums earned $ 1,030 $ 775 $ 979 $ 388 $ 3,172 $ 487 $ 8 $ 3,667
Losses and loss expenses and life policy benefi ts (725) (505) (446) (65) (1,741) (363) (7) (2,111)
Acquisition costs (243) (209) (236) (43) (731) (117) (1) (849)
Technical result $ 62 $ 61 $ 297 $ 280 $ 700 $ 7 $ — $ 707
Other income 5 — 19 24
Other operating expenses (206) (29) (75) (310)
Underwriting result $ 499 $ (22) n/a $ 421
Net investment income 51 398 449
Allocated underwriting result (1) $ 29 n/a n/a
Net realized investment gains 47 47
Interest expense (61) (61)
Net foreign exchange losses (24) (24)
Income tax expense (95) (95)
Interest in earnings of equity investments 12 12
Net income n/a $ 749
Loss ratio (2) 70.3% 65.1% 45.6% 16.9% 54.8%
Acquisition ratio (3) 23.7 27.1 24.1 11.1 23.1
Technical ratio (4) 94.0% 92.2% 69.7% 28.0% 77.9%
Other operating expense ratio (5) 6.5
Combined ratio (6) 84.4%(B) The 2006 period includes the Company’s share of ChannelRe Holdings’ net income in the amount of $11.7 million for the period from October 2005 to
September 2006, as the Company reports the results of ChannelRe Holdings on a one-quarter lag.
521258_P102-156_FIN.indd 151521258_P102-156_FIN.indd 151 3/18/09 12:44:35 AM3/18/09 12:44:35 AM

PartnerRe Ltd.Notes to Consolidated Financial Statements
152 PartnerReAnnual Report 2008
The following table provides the distribution of net premiums written by line of business for the years ended December 31, 2008, 2007 and 2006:
2008 2007 2006
Non-life
Property and casualty
Casualty 15% 17% 17%
Property 16 17 18
Motor 6 5 6
Multiline and other 3 3 3
Specialty
Agriculture 7 4 5
Aviation/Space 5 5 6
Catastrophe 10 11 11
Credit/Surety 7 7 6
Engineering 5 5 5
Energy 2 2 2
Marine 4 4 3
Specialty casualty 4 3 3
Specialty property 2 2 2
Life 14 15 13
Total 100% 100% 100%
The following table provides the geographic distribution of gross premiums written based on the location of the underlying risk for the years ended December 31, 2008, 2007 and 2006:
2008 2007 2006
Europe 46% 45% 42%
North America 41 42 43
Latin America, Caribbean and Africa 8 7 7
Asia, Australia and New Zealand 5 6 8
Total 100% 100% 100%
521258_P102-156_FIN.indd 152521258_P102-156_FIN.indd 152 3/18/09 12:44:50 AM3/18/09 12:44:50 AM

PartnerReAnnual Report 2008
153
PartnerRe Ltd.Notes to Consolidated Financial Statements
The Company produces its business both through brokers and through direct relationships with insurance company clients. None of the Company’s cedants accounted for more than 7% of total gross premiums written during the years ended December 31, 2008, 2007 and 2006.
The Company had two brokers that individually accounted for 10% or more of its gross premiums written during the years ended December 31, 2008, 2007 and 2006. The brokers accounted for 23%, 17% and 18% and 19%, 19% and 20% of gross premiums written for the years ended December 31, 2008, 2007 and 2006, respectively.
The following table summarizes the percentage of gross premiums written through these two brokers by segment and sub-segment for the years ended December 31, 2008, 2007 and 2006:
2008 2007 2006
Non-life
U.S. 71% 64% 65%
Global (Non-U.S.) P&C 30 29 28
Global (Non-U.S.) Specialty 25 19 24
Catastrophe 74 47 49
Life 18 17 15
521258_P102-156_FIN.indd 153521258_P102-156_FIN.indd 153 3/18/09 12:45:07 AM3/18/09 12:45:07 AM

PartnerRe Ltd.Notes to Consolidated Financial Statements
154 PartnerReAnnual Report 2008
20. Unaudited Quarterly Financial Information
2008 2007
(in millions of U.S. dollars, exceptper share amounts)
FourthQuarter
ThirdQuarter
SecondQuarter
FirstQuarter
FourthQuarter
ThirdQuarter
SecondQuarter
FirstQuarter
Net premiums written $ 752.4 $ 869.2 $ 956.3 $ 1,411.6 $ 714.4 $ 873.5 $ 898.7 $ 1,270.6
Net premiums earned 984.3 1,078.5 955.5 909.8 989.7 1,056.4 889.3 842.0
Net investment income 144.3 146.1 145.5 137.0 137.8 135.6 130.9 119.0
Net realized and unrealized investment gains (losses) (1) 64.0 (324.2) (296.2) 25.1 (16.5) (3.1) (53.7) 0.8
Other income (loss) 7.9 (3.8) 4.6 1.6 (14.5) 5.4 (8.9) 0.5
Total revenues 1,200.5 896.6 809.4 1,073.5 1,096.5 1,194.3 957.6 962.3
Losses and loss expenses and life policy benefi ts 718.9 752.0 548.7 589.7 517.6 562.1 524.0 478.7
Acquisition costs 233.7 232.8 228.2 204.2 227.2 215.5 206.3 200.7
Other operating expenses 89.1 86.9 96.7 92.3 88.5 79.1 80.0 79.0
Interest expense 12.5 11.9 14.9 11.9 13.4 13.6 13.5 13.5
Net foreign exchange (gains) losses (14.1) 4.6 (1.5) 4.8 (1.6) 3.6 9.3 4.3
Total expenses 1,040.1 1,088.2 887.0 902.9 845.1 873.9 833.1 776.2
Income (loss) before taxes and interest in (losses) earnings of
equity investments 160.4 (191.6) (77.6) 170.6 251.4 320.4 124.5 186.1
Income tax expense (benefi t) 59.9 (39.5) (53.4) 42.7 4.3 34.8 22.7 19.9
Interest in (losses) earnings of equity investments (5.2) 0.4 (1.8) 1.1 (66.5) (22.7) 3.2 3.0
Net income (loss) 95.3 (151.7) (26.0) 129.0 180.6 262.9 105.0 169.2
Preferred dividends 8.6 8.6 8.6 8.6 8.6 8.6 8.6 8.6
Net income (loss) available to common shareholders $ 86.7 $ (160.3) $ (34.6) $ 120.4 $ 172.0 $ 254.3 $ 96.4 $ 160.6
Basic net income (loss) per common share $ 1.56 $ (3.01) $ (0.64) $ 2.22 $ 3.13 $ 4.55 $ 1.70 $ 2.82
Diluted net income (loss) per common share 1.53 (3.01) (0.64) 2.16 3.04 4.44 1.66 2.76
Dividends declared per common share 0.46 0.46 0.46 0.46 0.43 0.43 0.43 0.43
Common share price range:
High $ 72.76 $ 74.40 $ 77.66 $ 82.23 $ 83.54 $ 80.04 $ 77.76 $ 71.53
Low 48.48 63.05 69.13 73.77 78.28 69.11 68.42 66.95(1) Following the adoption of SFAS 159 on January 1, 2008, net realized and unrealized investment gains (losses) include both realized and unrealized gains (losses)
on investments. Prior to the adoption of SFAS 159, net realized investment gains (losses) included realized gains (losses) on investments and other-than-temporary impairment charges.
521258_P102-156_FIN.indd 154521258_P102-156_FIN.indd 154 3/18/09 12:45:20 AM3/18/09 12:45:20 AM

PartnerReAnnual Report 2008
155
PartnerRe Ltd.Notes to Consolidated Financial Statements
21. Summarized Financial Information of ChannelRe HoldingsChannelRe Holdings is a non-publicly traded fi nancial guaranty reinsurer based in Bermuda, which assumed a portfolio of in-force business from MBIA, and which participates in MBIA reinsurance treaties and provides facultative reinsurance support to MBIA. The Company’s investment represents 20% of the common shares of Channel Reinsurance Ltd. (“Channel Reinsurance”), which is a subsidiary and the primary asset of ChannelRe Holdings. The investment in ChannelRe Holdings is accounted for using the equity method. The Company’s share of ChannelRe Holdings’ net income and accumulated other comprehensive income is reported in the Company’s net income and accumulated other comprehensive income, respectively, on a one-quarter lag. The Company calculates its share of ChannelRe Holdings’ net income and accumulated other comprehensive income on the basis of the Company’s ownership percentage of ChannelRe Holdings’ common shares currently outstanding.
The following tables provide summarized fi nancial information for ChannelRe Holdings. As the Company calculates its share of ChannelRe Holdings’ results on a one-quarter lag, the results presented below include summarized fi nancial information for the twelve month periods from October 1 to September 30.
In addition to ChannelRe Holdings’ results for the twelve month period ended September 30, 2007 below, the Company recorded an additional charge of $87 million in its Consolidated Statements of Operations for the year ended December 31, 2007. This additional charge represented the write-down to $nil of its investment in ChannelRe Holdings due to unrealized mark-to-market losses on Channel Reinsurance’s credit derivative portfolio, which Channel Reinsurance expected to incur during the three months ended December 31, 2007, and which were expected to result in ChannelRe Holdings having negative U.S. GAAP shareholders’ equity at that date. ChannelRe Holdings’ fi nancial statements as of December 31, 2007 and September 30, 2008 did present negative U.S. GAAP shareholders’ equity, and accordingly at December 31, 2008, the carrying value of the Company’s investment in ChannelRe Holdings remains $nil.
As ChannelRe Holdings has a fi nancial year-end of December 31, this information is not presented in the annual fi nancial statements of ChannelRe Holdings.
Balance Sheet Data (in millions of U.S. dollars):
September 30,2008
September 30,2007
Total investments available for sale $ 691 $ 638
Cash and cash equivalents 8 19
Deferred acquisition costs 32 37
Derivative assets 86 20
Other assets 9 11
Total assets $ 826 $ 725
Deferred premium revenue $ 123 $ 145
Loss and loss adjustment expense reserves 41 28
Derivative liabilities 743 115
Other liabilities 9 7
Total liabilities 916 295
Minority interest (25) 120
Shareholders’ (defi cit) equity (65) 310
Total liabilities, minority interest and shareholders’ (defi cit) equity $ 826 $ 725
521258_P102-156_FIN.indd 155521258_P102-156_FIN.indd 155 3/18/09 12:45:35 AM3/18/09 12:45:35 AM

PartnerRe Ltd.Notes to Consolidated Financial Statements
156 PartnerReAnnual Report 2008
Income Statement Data (in millions of U.S. dollars):
For the period fromOctober 1, 2007 to
September 30, 2008
For the period fromOctober 1, 2006 to
September 30, 2007
For the period fromOctober 1, 2005 to
September 30, 2006
Premiums earned $ 48 $ 45 $ 56
Net investment income 30 29 24
Total revenues 78 74 80
Losses incurred 27 12 7
Acquisition costs 12 12 15
Operating expenses 3 4 8
Total expenses 42 28 30
Realized gains and other settlements on derivatives 19 14 10
Unrealized losses on derivatives (561) (91) (1)
Net change in fair value of derivatives (542) (77) 9
Other gains (losses) 1 2 (1)
Net realized and unrealized (losses) gains (541) (75) 8
Minority interest 141 8 (16)
Net (loss) income $ (364) $ (21) $ 42
22. Subsequent EventsOn January 8, 2009, the Company entered into a second amendment to the loan agreement, dated as of October 25, 2005, among the Company, as borrower, Citibank, N.A., as administrative agent, and Citibank, N.A., as lender, which originally evidenced a three-and-a-half year term loan agreement with Citibank, N.A. Under the terms of the second loan amendment, the Company has a right to prepay the half of the original $400.0 million loan that has a maturity of April 27, 2009. Any such prepayment under the terms of the second loan amendment will be accompanied by payment of accrued and unpaid interest on the prepayment amount. The remaining half of the loan will have a maturity of July 12, 2010 and the Company will not have a right to prepay this amount. The loan is otherwise unchanged.
On January 14, 2009, the Company repaid the half of the original $400.0 million loan that was due April 27, 2009.
521258_P102-156_FIN.indd 156521258_P102-156_FIN.indd 156 3/18/09 12:45:56 AM3/18/09 12:45:56 AM

PartnerReAnnual Report 2008
157
To the Board of Directors and Shareholders of PartnerRe Ltd.
We have audited the accompanying consolidated balance sheets of PartnerRe Ltd. and subsidiaries (the “Company”) as of December 31, 2008 and 2007, and the related consolidated statements of operations and comprehensive income, shareholders’ equity, and cash fl ows for each of the three years in the period ended December 31, 2008. These fi nancial statements are the responsibility of the Company’s management. Our responsibility is to express an opinion on these fi nancial statements based on our audits.
We conducted our audits in accordance with the standards of the Public Company Accounting Oversight Board (United States). Those standards require that we plan and perform the audit to obtain reasonable assurance about whether the fi nancial statements are free of material misstatement. An audit includes examining, on a test basis, evidence supporting the amounts and disclosures in the fi nancial statements. An audit also includes assessing the accounting principles used and signifi cant estimates made by management, as well as evaluating the overall fi nancial statement presentation. We believe that our audits provide a reasonable basis for our opinion.
In our opinion, such consolidated fi nancial statements present fairly, in all material respects, the fi nancial position of PartnerRe Ltd. and subsidiaries as of December 31, 2008 and 2007, and the results of their operations and their cash fl ows for each of the three years in the period ended December 31, 2008, in conformity with accounting principles generally accepted in the United States of America.
We have also audited, in accordance with the standards of the Public Company Accounting Oversight Board (United States), the Company’s internal control over fi nancial reporting as of December 31, 2008, based on the criteria established in Internal Control—Integrated Framework issued by the Committee of Sponsoring Organizations of the Treadway Commission and our report dated February 27, 2009 expressed an unqualifi ed opinion on the Company’s internal control over fi nancial reporting.
Deloitte & ToucheHamilton, BermudaFebruary 27, 2009
Report of Independent Registered Public Accounting Firm
521258_P157-168_BACK.indd 157521258_P157-168_BACK.indd 157 3/18/09 12:47:27 AM3/18/09 12:47:27 AM

PartnerReAnnual Report 2008
158
Disclosure Controls and ProceduresThe Company carried out an evaluation, under the supervision and with the participation of Management, including the Chief Executive Offi cer and Chief Financial Offi cer, as of December 31, 2008, of the effectiveness of the design and operation of its disclosure controls and procedures, as defi ned in Rules 13a-15(e) and 15d-15(e) under the Securities Exchange Act of 1934, as amended. Based upon that evaluation, the Chief Executive Offi cer and Chief Financial Offi cer concluded that, as of December 31, 2008, the disclosure controls and procedures are effective such that information required to be disclosed by the Company in reports that it fi les or submits pursuant to the Securities Exchange Act is recorded, processed, summarized and reported within the time periods specifi ed in the rules and forms of the Securities and Exchange Commission and is accumulated and communicated to Management, including its principal executive and principal fi nancial offi cers, as appropriate to allow timely decisions regarding required disclosures.
Management’s Report on Internal Control over Financial ReportingManagement is responsible for establishing and maintaining adequate internal control over fi nancial reporting as defi ned in Rules 13a-15(f) and 15d-15(f) under the Securities Exchange Act of 1934, as amended. Internal control over fi nancial reporting is designed to provide reasonable assurance regarding the reliability of fi nancial reporting and the preparation of fi nancial statements for external purposes in accordance with generally accepted accounting principles. Internal control over fi nancial reporting includes those policies and procedures that:
(i) pertain to the maintenance of records that, in reasonable detail, accurately and fairly refl ect the transactions and dispositions of the assets of the Company;
(ii) provide reasonable assurance that transactions are recorded as necessary to permit preparation of fi nancial statements in accordance with generally accepted accounting principles, and that receipts and expenditures are being made only in accordance with authorizations of Management and directors; and
(iii) provide reasonable assurance regarding prevention or timely detection of unauthorized acquisition, use, or disposition of assets that could have a material effect on the fi nancial statements.
Because of its inherent limitations, internal control over fi nancial reporting may not prevent or detect material misstatements. Also, projections of any evaluation of effectiveness to future periods are subject to the risk that the controls may become inadequate because of changes in conditions, or that the degree of compliance with the policies or procedures may deteriorate.
Controls and Procedures
521258_P157-168_BACK.indd 158521258_P157-168_BACK.indd 158 3/18/09 12:47:41 AM3/18/09 12:47:41 AM

PartnerReAnnual Report 2008
159
Management has assessed the effectiveness of internal control over fi nancial reporting as of December 31, 2008. In making this assessment, Management used the criteria set forth by the Committee of Sponsoring Organizations of the Treadway Commission (COSO) in Internal Control-Integrated Framework.
Based on our assessment and those criteria, Management believes that the Company maintained effective internal control over fi nancial reporting as of December 31, 2008.
Deloitte & Touche, the Company’s independent registered public accounting fi rm, has issued a report on the effectiveness of the Company’s internal control over fi nancial reporting, and its report appears overleaf.
Controls and Procedures
521258_P157-168_BACK.indd 159521258_P157-168_BACK.indd 159 3/18/09 12:47:56 AM3/18/09 12:47:56 AM
PartnerReAnnual Report 2008
160
To the Board of Directors and Shareholders of PartnerRe Ltd.
We have audited the internal control over fi nancial reporting of PartnerRe Ltd. and subsidiaries (the “Company”) as of December 31, 2008, based on criteria established in Internal Control—Integrated Framework issued by the Committee of Sponsoring Organizations of the Treadway Commission. The Company’s management is responsible for maintaining effective internal control over fi nancial reporting and for its assessment of the effectiveness of internal control over fi nancial reporting, included in the accompanying Management’s Report on Internal Control over Financial Reporting. Our responsibility is to express an opinion on the Company’s internal control over fi nancial reporting based on our audit.
We conducted our audit in accordance with the standards of the Public Company Accounting Oversight Board (United States). Those standards require that we plan and perform the audit to obtain reasonable assurance about whether effective internal control over fi nancial reporting was maintained in all material respects. Our audit included obtaining an understanding of internal control over fi nancial reporting, assessing the risk that a material weakness exists, testing and evaluating the design and operating effectiveness of internal control based on the assessed risk, and performing such other procedures as we considered necessary in the circumstances. We believe that our audit provides a reasonable basis for our opinion.
A company’s internal control over fi nancial reporting is a process designed by, or under the supervision of, the company’s principal executive and principal fi nancial offi cers, or persons performing similar functions, and effected by the company’s board of directors, management, and other personnel to provide reasonable assurance regarding the reliability of fi nancial reporting and the preparation of fi nancial statements for external purposes in accordance with generally accepted accounting principles. A company’s internal control over fi nancial reporting includes those policies and procedures that (1) pertain to the maintenance of records that, in reasonable detail, accurately and fairly refl ect the transactions and dispositions of the assets of the company; (2) provide reasonable assurance that transactions are recorded as necessary to permit preparation of fi nancial statements in accordance with generally accepted accounting principles, and that receipts and expenditures of the company are being made only in accordance with authorizations of management and directors of the company; and (3) provide reasonable assurance regarding prevention or timely detection of unauthorized acquisition, use, or disposition of the company’s assets that could have a material effect on the fi nancial statements.
Because of the inherent limitations of internal control over fi nancial reporting, including the possibility of collusion or improper management override of controls, material misstatements due to error or fraud may not be prevented or detected on a timely basis. Also, projections of any evaluation of the effectiveness of the internal control over fi nancial reporting to future periods are subject to the risk that the controls may become inadequate because of changes in conditions, or that the degree of compliance with the policies or procedures may deteriorate.
Report of Independent Registered Public Accounting Firm
521258_P157-168_BACK.indd 160521258_P157-168_BACK.indd 160 3/18/09 12:48:10 AM3/18/09 12:48:10 AM

PartnerReAnnual Report 2008
161
In our opinion, the Company maintained, in all material respects, effective internal control over fi nancial reporting as of December 31, 2008, based on the criteria established in Internal Control—Integrated Framework issued by the Committee of Sponsoring Organizations of the Treadway Commission.
We have also audited, in accordance with the standards of the Public Company Accounting Oversight Board (United States), the consolidated fi nancial statements as of and for the year ended December 31, 2008 of the Company and our report dated February 27, 2009 expressed an unqualifi ed opinion on those fi nancial statements.
Deloitte & ToucheHamilton, Bermuda February 27, 2009
Report of Independent Registered Public Accounting Firm
521258_P157-168_BACK.indd 161521258_P157-168_BACK.indd 161 3/18/09 12:48:24 AM3/18/09 12:48:24 AM

PartnerReAnnual Report 2008
162
The Audit Committee has discussed with the independent registered public accounting fi rm, Deloitte & Touche (“Deloitte”), the matters required to be discussed by Statement on Auditing Standards No. 61, as amended (Communication with Audit Committees) and Regulation S-X Rule 2-07.
The Audit Committee and Deloitte have discussed Deloitte’s independence and whether Deloitte can provide non-audit related services and maintain independence from management and PartnerRe. The Audit Committee has received from Deloitte the written disclosures and the letter required by PCAOB Rule 3526 (Communication with Audit Committees Concerning Independence) including written materials addressing Deloitte’s internal quality control procedures.
During fi scal year 2008, the Audit Committee had eight meetings, including telephonic meetings, to discuss (among other things) PartnerRe’s quarterly results. The meetings were conducted to encourage communication among the members of the Audit Committee, management, the internal auditors, and Deloitte. The Audit Committee also discussed with Deloitte the overall scope and plans for Deloitte’s audits and the results of such audits. The Audit Committee met with representatives from Deloitte, both with and without management present.
The Audit Committee has reviewed and discussed the audited fi nancial statements for the year ended December 31, 2008 with management and with Deloitte. Based on the above-mentioned reviews and discussions, the Audit Committee has recommended to the Board that the audited fi nancial statements be included in PartnerRe’s Annual Report on Form 10-K for the year ended December 31, 2008.
Kevin M. TwomeyChairman, Audit Committee
Rémy Sautter Vice Chairman, Audit Committee
Vito H. BaumgartnerMember, Audit Committee
Jan H. HolsboerMember, Audit Committee
Jürgen ZechMember, Audit Committee
Audit Committee Report
521258_P157-168_BACK.indd 162521258_P157-168_BACK.indd 162 3/18/09 12:48:38 AM3/18/09 12:48:38 AM

PartnerReAnnual Report 2008
163
PartnerRe Ltd.Comparison of 5-Year Cumulative Total Return
12/03 12/04 12/05 12/06 12/07 12/08
PartnerRe
S&P 500
S&P 1500 Composite Property & Casualty Insurance
$0
$50
$100
$150
$200
The graph set forth below compares the cumulative shareholder return, including reinvestment of dividends, on the Company’s common shares to such return for Standard & Poor’s (“S&P”) 500 Composite Stock Price Index, and S&P’s 1500 Composite Property & Casualty Insurance Index for the period commencing on December 31, 2003 and ending on December 31, 2008, assuming $100 was invested on December 31, 2003.
Each measurement point on the graph below represents the cumulative shareholder return as measured by the last sale price at the end of each year during the period from December 31, 2003 through December 31, 2008. As depicted in the graph below, during this period the cumulative total shareholder return on the Company’s common shares was 39%, the cumulative total return for the S&P 500 Composite Stock Price Index was -11% and the cumulative total return for the S&P 1500 Composite Property & Casualty Insurance Index was 1%.
The Company has attempted to identify an index which most closely matches our business. There are no indices that properly refl ect the returns of the reinsurance industry. The S&P 1500 Composite Property & Casualty Insurance Index is utilized as it is the broadest index of companies in the Property and Casualty industry. We caution the reader that this index of 23 companies does not include any companies primarily engaged in the reinsurance business, and therefore it is provided to offer context for evaluating performance, rather than direct comparison.
$100 invested on 12/31/03 in stock & index-including reinvestment of dividends. Fiscal year ending December 31.
Copyright © 2009 S&P, a division of The McGraw-Hill Companies Inc. All rights reserved.
521258_P157-168_BACK.indd 163521258_P157-168_BACK.indd 163 3/18/09 12:48:51 AM3/18/09 12:48:51 AM

1
2
3
4
5
6
7
8
9
10
11
12
13
14
15
16
17
27
28
29
30
31 31
32
33
34
35
18
19
20
21
22
23
24
25
26
164 PartnerRe Annual Report 2008
PartnerRe Organization
Senior Operating Management
John Adimari1 Chief Operations Offi cer, U.S.
Bill Babcock2 Finance Director, Group
Emmanuel Clarke3 Head of Specialty Lines, Global
Laurie Desmet4 Chief Accounting Offi cer, Group
Ted Dziurman5 Head of Catastrophe, Global
Alain Flandrin6 Head of Property & Casualty, Global
Eric Gesick7 Chief Actuarial Offi cer, Group
Dennis Giannos8 Head of Standard Lines, U.S.
Nick Giuntini 9 Chief Risk and Financial Offi cer,Capital Markets
Charles Goldie10 Head of Specialty Lines, U.S.
David Graham11 Head of Fixed Income, Capital Markets
Jon LaBerge12 Chief Operating Offi cer, Capital Markets
Marvin Pestcoe13 Head of Capital Assets, Capital Markets
Franck Pinette14 Head of Life, Global
Dick Sanford15 Head of Specialty Casualty, U.S.
Dom Tobey16 Head of Risk Management & Reserving, Global
Stephan Winands17 Chief Financial Offi cer, Global
Business Unit and Support Management
GroupJoe Barbosa18 Group Treasurer
Abigail Clifford19 Chief Human Resources Offi cer
Richard Glaser20 Head of Tax
Lindsay Hyland21 Group Human Resources Director
Kevin Lehman22 Chief Audit Executive
Mike Mitchard23 Chief Information Technology Offi cer
David Outtrim24 Group Controller
Christine Patton25 Secretary and Corporate Counsel to the Board
Celia Powell26 Chief Communications Offi cer
Robin Sidders27 Investor Relations Director
Amanda Sodergren28 Chief Legal Offi cer
Ian Speirs29 Compensation and Benefi ts Director
GlobalScott Altstadt30 Deputy Head of Property & Casualty
Felix Arbenz31 Head of Specialty Casualty
Patrick Bachofen32 Head of Specialty Property
Markus Bassler33 Head of Energy Onshore
Emil Bergundthal34 Head of Greater China and South East Asia, Head of Singapore Offi ce
Francis Blumberg35 Head of Canada, Head of Toronto Offi ce

36
37
38
39
40
41
42
43
44
45
46
47
48
49
50
51
52
53
54
55
56
57
58
59
60
61
62
63
64
65
66
67
68
69
70
71
72
73
74
165PartnerRe Annual Report 2008
PartnerRe Organization
Florian Boecker36 Head of Life Market, Central & Eastern Europe
Jürg Buff37 Head of Engineering
Hervé Castella38 Head Account Executive
Claude Chèvre39 Head of Life Market, Asia, Latin America and Spain
Patrick Chevrel40 Head of France and Benelux
Laura Davis41 Head of Catastrophe, Bermuda
Pascale Gallego42 Head of Life Market, Northern & Southern Europe and Canada
Dean Graham43 Deputy Head of Life
Ian Houston44 Head of Non-life Reinsurance, Dublin
Christoph Kägi45 Head of Northern Europe
Gary Ketels46 General Counsel and Head of Legal & Claims
Patrick Lacourte47 Head of PartnerRe Insurance, Dublin
Pierre Laurent48 Head of Overseas
Jean-Marie Le Goff49 Head of Human Resources
Jeremy Lilburn50 Head of Agriculture
Philip Nye51 Head of Hong Kong Offi ce
John O’Neill52 Head of Life Market, Ireland and U.K.
Salvatore Orlando53 Head of Southern Europe and Latin America
Marcus Pollak54 Head of Credit & Surety
Adrian Poxon55 Head of Marine/Energy Offshore
Erik Rüttener56 Head of Catastrophe Research
Brian Secrett57 Chief Underwriting Offi cer, Catastrophe
Rick Thomas58 Head of Catastrophe, Zurich
Eija Tuulensuu59 Head of Client and Corporate Communications
Benjamin Weber60 Head of Aviation/Space
Franz Wettach61 Head of Central and Eastern Europe
U.S.David Durbin62 Head of Research and Development
Jeffrey Englander63 Chief Reserving Actuary
Vincent Forgione64 Human Resources Director
Tom Forsyth65 General Counsel
Wayne Hommes66 Head of Risk & Capital Management
Carol Ann O’Dea67 Head of Claims
John Peppard68 Head of Programs
Mike Zielin69 Head of Agriculture
Capital MarketsJoseph Hissong70 Head of Strategic Investments
Dave Moran71 Head of Principal Finance
David Phillips72 Head of Equities
Brian Tobben73 Head of Insurance-linked Securities
Marc Wetherhill74 Legal and Compliance Executive
166
PartnerRe Organization
PartnerRe Annual Report 2008
Samantha Adams • Craig Addison • John Adimari • Marc Aerne • Anthony Albano • Chantal Albert • Claudia Albrecht •Jean-Pierre Aldon • Bernard Alig • Meridith Alin • Charles A. Allen • Jayne Allen • Abigail Allen • Rory Allen • OliviaAlleno • Scott Altstadt • Magdalena Amat Garcia • Maria Amelio • Georg Andrea • Daniel Anelante • Kurt Angst • Michel Ansermet • Anthony Antonelli • Shiori Anzai • Hema Arava • Felix Arbenz • Olivier Argence-Lafon • Simon Arnot • Kevin Arrington • Stella Assante • Joanna Mary Atkin • Isidra Aumont • Rebecca Ausenda • Hélène Avedikian •Bill Babcock • Zina-Zahia Baccouche • Patrick Bachofen • Karin Bachofen • Marc Bagarry • Krishendu Bagchi • Marcia Bailey • Wayne Baker • Kathrin Balderer • Andreas Balg • Joyce Banks • Laurie Bannister • Joe Barbosa • Marie-Christine Barjon • Daryl Barnes • Markus Barnikol • Alain Barraud • Sophie Barre • Michele Barresi • PhilippeBartolo • Dawn Barwood-Parent • Markus Bassler • Rolf Bätscher • Jesca Baumann • Carmen Baumgartner-Riedi •Nalan Bayindir • Anthia Bean • Patrick Beaudoin • Emmanuel Becache • Jean Pierre Bedoussac • Barbara Beer • Rinat Bektleuov • Amin Belabou • Arlette Belard • Feten Ben Said • Albert Benchimol • Louis Benevento • MichaelBennis • Charline Bercot • Jonathan Berenbom • Denise Berger-Abouaf • Emil Bergundthal • Claude Bernard • Tracey Berry • Conrad Bertschi • Michael Bevacqua • Alexandra Beverley • Julia Bhend • Andrew Bierig • Andrea Binda • Martine Binois • Richard Bischoff • Corinne Bitterlin • Peter Bitterlin • José Blanco • Roman Blank • Francis Blumberg • Michael Bluzer • Gillian Bobb • Florian Boecker • Robert Boghos • Didier Boizot • Lisa Bolger • DanielBollier • Jean Bonaney • Melissa Bontemps • Thierry Bony • Elodie Bordage-Fontana • Sophie Borrens • MaudBoucheneb • Elisabete Bougis • Valerie Boulley • Frédéric Boulliung • Scott Bounty • Alain Bourdet • Pascal Bourquin • Estelle Boussendorffer • Alain Boxhammer • Stanislas Boyer • Corinne Bretonnet • Richard Brewer • Robert Brian • Herve Brice • Romain Bridet • Patrick Brodard • Alisha Brown • James Brown • Elaine Brown • Bridget Browne • Silvija Brozak • Jürg Buff • Sven Bühlmann • Fabienne Bui Dinh • Sonia Burchall • Marguerite Burger • Yvonne Bürgi-Zollinger • Isabel Burkart • Peter Buser • Patricia Buteau • Jean Pierre Buteau • Bill Cadigan • Jean PierreCaillard • Elena Cameron-Sheffield • Tricia Campbell • William Camperlengo • Morgann Canny • Roman Cantieni • John Capizzi • Alix Carbonell • Dalia Cardoso • Cecile Carel • Patrick Carnec • Claudia Carnevale • Hervé Castella • Carlo Casty • Debra Catapano • Dominique Cattrini • Barbara Chadwick • Katie Chaiprasert • Sharon Meow GekChan • Christian Chan Kwoc Keung • Jeff Chandler • Marc Charpentier • Philippe Charton • Alexander Chasan • Caroline Chedal Anglay • Dana Cheng • Patrick Chereau • Ruby Wai Ting Cheung • Anne Chevalier • RomainChevalier • Claude Chèvre • Patrick Chevrel • Nicola Chiappa • Monica Christiansen • Angela Chung • Celeste Ciarletti • Maylis Cicile • Rafael Citelli Dos Reis • Emmanuel Clarke • Abigail Clifford • Teddy Clochard • Rael Coen •Graciela Collazos • Olivia Collet-Hirth • Olivier Collignon • Dario Compagnone • Dalia Concepcion • Barbara Contreras • Leo Cook • Michael Cooze • John Coppinger • Stevan Corbett • Ines Corbezzolo • Brigitte Corbonnois • Monique Cornier • Fiona Correia • Anna Cortese • Benjamin Cosseron • Lucy Costa • Raymond-Marc Courgeau •Marie Pierre Courtefois • Isabelle Courtin • Mike Covney • Elizabeth Craig • Richard Cromwell • Christina Cronin •Dorothy Crosby • Hildegard Crucenzo-Sutter • Marie-Odile Da Silva • Ingrid Dahlquist • Betty Dang • JeannineDanner • Isabelle Darget • Léa Dassonville-Stankovicova • John Davidson • Laura Davis • Fabrice De Berny • JeanineDe Brito • Claudette De Luca • Roberto De Matteis • Gautier de Montmollin • Arnaud De Rodellec Du Porzic • GinaDe Simone • Elizabeth Deacon • Andrew Dean • Thierry Dehais • Nicolas Dehon • Ana Del Mazo • Francoise Delattre • Paul Della-Marta • Chantal Delor • Howard Dembitzer • Jill DePaoli • Katia Depuydt • Erick Derotte • MarionDesenfant • Nataya DeSilva • Laurie Desmet • Olivier Dessus • Marianna Detering • Lourdes Diaz • John DiBuduo • François Dick • Ben Dickens • Kurt Dickmann • Patricia Dietrich • Paul DiViesti • Cheryl D’Onofrio • Gwennaële Dorange • Myriam Dossche • Huong Douangphrachandr • Paul Dragisic • Marlene Dreano • Werner Dreyer • Mariline Drouard • Robert DuBien • Clemens Daniel Dubischar • Virginie Dubost • Juliette Duchassaing • Fabian Düggelin •Yvonne Dulong • Claudie Dupuis • Evelyne Duquesne • David Durbin • Ted Dziurman • Andrew Eckhardt • WayneEdwards • Stefan Eichl • Ghassan El Haddad • Aline Elouard • Anne Emily • Christian Engeln • Joseph Englander • Jeffrey Englander • Anuradha Mili Eppler • Atilla Erarslan • Arely Espinoza Sonderegger • Michael Ewald • BrigitteExer • Deka Farah Lodone • Isabelle Fauche • Paul Feldsher • Laure Feldstein-Ohana • Larry Feringa • Elia Ferreira • John Ferris • Nancy Fico • Lisa Fidelibus • Nigel Findlater • Isabelle Fiole • Silvio Fischer • Susan Fischer • Alain Flandrin • Doris Flury • Harvey Ford • Vincent Forgione • Thomas Forsyth • Liliane Foulonneau • Patrice Fourgassie •Thibault Fournel • Lucy Fox • Velda Franco • Markus Frank • Karen Franklin • Kim-Lee Franks • Hector Freire • Christian Fremond • Jean Frey • Sylvie Fromentin • Alex Frutieaux • Christian Fuchs • Georg H. Fülles • ElizabethFurtado • Roswitha Fux • Rudolf Gaehler • Patrizia Gaetani • Didier Gailleul • Gregory Gale • Pascale Gallego • Nathalie Gandrille • Arthur Gang • Giacomo Ganz • Leo Gartmann • Stefan Gasser • Milena Gasser • Philippe Gayraud • Christian Gehrein • Marion Gehring • Katie Geis • Ezio Gennaro • Rose Gerken • Vincent Gerondeau • Eric Gesick • Dennis Giannos • Tracy Gilbert • Annick Gilbert • Serge Gili • Rosemary Gitsham • Nick Giuntini • IngridGjonaj • Richard Glaser • Cynthia Gleason • Michael Gledhill • Michael Gloade • Gregor Alexander Gloor • NeilGlosman • Susanne Gnädinger • Thomas Gnehm • Sylvie Goettelmann • Charles Goldie • Nadege Goncalves • NadineGondelle • Ricky Gorham • Didier Gouery • Thierry Goujaud • Danielle Goujet • Prabagarane Govindan • Beat Graber •Maya Graf • Dean Graham • David Graham • Kenneth Graham • Andreas Grieder • Robert Grippo • Serge Grisoni •Felix Grond • Daniela Grossi • Huguette Grozos • Christine Gruyer • Nicole Grzelak • Yolanda Gueniat • Martine Guentleur • Pierre Guerin • Fritz Gugger • Olivier Guiffart • Gaby Gysin • Stéphanie Haas • Kheira Hadj-Cherif • Marina Hägeli • Michael Halford • Shareena Hall • Magda Haller • Lynn Halper • Nicole Hamays • Daniel Hammer • Albert Hamon • Nicole Hanhart • Rizwan Haque • François Haro • Marie Francoise Harrissart Riols • Marc Hasenbalg • Darlene Haut • Anna Haykin • Malcolm Haylock • Victoria Hayward • Paul Hazel • Matthew Hazzard • Claudia Heck •Matthias Heer • Charlene Heffernan • John Heins • Thomas Heintz • Markus Heizmann • Ernst Held • Christophe Hemond • Didier Henaux • Klaus Johann Henrich • Bruno Henriques • Dianne Henry • Robert Herbecq • Esra Hergert • Arlette Hermet • Inmaculada Hernandez • Marta Hernandez • Marina Hess • Christian Heule • Cornelia Hildebrand • Shelia Hill • Barbara Hirzel • Joseph Hissong • Venessa Hizon • Kelly Hodsoll • Christoph Hofstetter • Lotte Holler • Judy Hollis • Denise Hollis • Madeleine Holzer • Wayne Hommes • Yichun Horn • Ian Houston • GeraldHoward • Francine Hoyt • Andrea Hrodek • Sasa Jiesha Hu • Brigitte Huber • René Hug • Bill Hughes • Nicholas Hughes • Margaret Hunt • Pietro Hunziker • James Hupprich • Marie ChrIstine Hurbain • Isabelle Hurter Stofer • Michel Hurtevent • Tracy Hutchins • Philip Huys • Lindsay Hyland • Hector Ibarra • Alexis Emil Iglauer • Pascal Illien • Yoshiko Inoue • Alexander Irion • Maurus Iseli • Wendell Jackson • James Jackson • Roger Jacobsen • Sophia James •Reinier Jansen • Sandy Jarrett • Sylvain Jarrier • Riitta Jauch • Claudia Jenny • Eileen Johnson • Christiane Jolivet •Thomas Joray • Willan Joseph • Hans Rudolf Jufer • Daniel Junker • Leo Junquera • Christoph Kägi • Christiane Kaiser • Richard Kane • Sofia Faye Karampampa • Madeleine Kästli • Richard Kasyjanski • Pascal Kaul • Martin Kauth • Daniel Keenan • Lowell Keith • Daniel Keller • Martine Keraval • Jean Pierre Kervella • Gary Ketels • ToniKhalaf • Abedalrazq Khalil • TK Khan • Kwang Taek Kim • Amy Kim • Peter Knellwolf • Beate Kohl • Hans Konecnik •Jim Konstanty • Kishore Kothapalli • Robert Kouba • Marika Kournioti • Petra Kragler • Gary Kratzer • Beat Krauer •
PRe_AR08-back-03_07_09.indd 166PRe_AR08-back-03_07_09.indd 166 3/23/09 1:58:32 PM3/23/09 1:58:32 PM
PartnerReAnnual Report 2008
167
PartnerRe Organization
Kurt Kraushaar • Richard Krivo • Bart Krom • Margrit Küchler • Amit Kumar • Martin Küpfer • Marianne Küpfer • Caroline Kuruneri • Ada La Jara Fazio • Jon LaBerge • Pierre Lacoste • Christiane Lacour • Patrick Lacourte • Bjorn Ladewig • Mélissa Lafosse • Marian Lagger • Kristiina Lahtinen • Andrew Laing • Patrick Lang • Philipp Langerweger • Edwige Langlade • Dennis LaPak • Mylene Laplace • Stephanie Lapointe • Irma Lara • Daniel Larkin • Julius Latham • Adrian Läubli • Pascal Laugaro • Franck Laurence • Pierre Laurent • Julia Lavolpe • Veronique Le Boles • Jean-Marie Le Goff • Jocelyne Le Guennec • Danielle Le Moullec • Patrick Lecanu • Jean-Michel Lecerf • Christophe Lecerf • Catherine Ledieu • Nelson Lee • Bernard Hiong Wee Lee • Chak Kiat Sebastian Lee • Lena Lan Fong Lee • Albert Lee • Rosario Legaspi • Ghislaine Leglise • Kevin Lehman • Urs Lehmann • Philippe Leveque • Lisa Lewis • Dominique Lhuillier • Jun Li • Susana Li • Linda Li • Patrick Li • Christopher Liberti • Gail Liebson • Hélène Lieutenant • Jeremy Lilburn • Christina Lilburn • Grace Lin • Barbara Linsi • Ryan Lipschutz • Lin Liu • Heather Locklear • Diana Lofaro • Peter Longhi • Charlene Hui Ling Low • Birgit Lüdi • Samuel Luk • Asimina Luongo • Richard Lupinacci • Karla Lusi • Simon Lutz • Markus Lützelschwab • Edward Lynch • Paula Macedo • Jayen Madia • Alvaro Madronero • Thomas Mager • Thierry Magnien • Paulachan Maliakal • Martine Manaud • Christian Marais • Joseph Marcianti • Gilles Maret • Dimitri Markov • Albert Maroun • Winnie Marshall • Philip Martin • William Martin • Bernhard Märtl • Douglas Mason • Jaime Masters • Lucette Mathouchanh • Karen Matrunich • Henri Mauxion • Christopher Mayfield • Karin Mayrhofer-Duss • Mark McCaffrey • Jennifer McCarron • Michael McDonald • Fraser McKenzie • Steven McLaughlin • Thomas McLoughlin • Rita McNally-Hasler • Lucas Mebold • Marianne Meier • Annina Meier-Camenisch • Bruno Melloul • Lucy Mendieta • Lily Mendoza • Meng Meng • Clara Mercado • George Meropoulos • Anne Mery • Martine Meunier • Anwar Mewati • Bruno Meyenhofer • Thomas Meyer • Richard Meyerholz • Frederic Michel • Patrice Michellon • Gail Middleton • Jennifer Middough • Audrey Miginiac • Costas Miranthis • Mike Mitchard • Georges Modol • Christoph Moggi • David Molyneux • Sonam Phuntsok Monkhar • Scott Moore • Irene Morales • Dave Moran • Yerger Morehead • Nadege Morel • John Moreno • Francoise Moreno • James Mortimer • Thomas Möschinger • Verena Motzel • George Muhle • Christopher Mulligan • Beatrix Münger • Shuri Munt • Valentina Munteanu • Laura Murphy • Shinji Nagao • East Namkung • Marie Navarro • Yasmin Neeser Leeuwarden • Léa Nefussi • Stacye Nekritz • Arnold Nektalov • Zorah Neveu • Serge Neveu • Jan Sin Ngor • Minh Trang Nguyen • Hoai Nguyen • Nathalie Nicolas • Rosa Nigro • Philip Nye • Robert Oates • Glennis Ocampo De Jesus • Astrid Ochsner • Carol Ann O’Dea • Finbar O’Flanagan • Jean O’Neill • John O’Neill • Salvatore Orlando • Victor Osuna • Christina Ouerfelli • Africa Outerbridge • David Outtrim • Ming Ow • Todd Owyang • Thomas Pálffy • Steven Palmer • Andrew Palo • Patrick Palomeque • Carman Chieh-Ming Pang • Jennifer Pappas • Ami Parekh • Brigitte Pasquier • Alberto Pasquinelli • Anita Passot • Saif Pathan • Morgan Patterson • Christine Patton • Lewis Paul • Galyna Pavlova • Naty Pena • Bruce Pendergast • Francoise Penisson • John Peper • John Peppard • José Perez • Maria Perreant • Marie Claude Perrillat Amede • Marvin Pestcoe • Lynn Petilli • Brett Peven • David Phillips • Sandra Phillips • Chairatch Phrompechrut • Andrea Piatti • Thierry Picou • Antoine Pin • Franck Pinette • Sabine Pistor • Sheila Plant • Laurence Plateau • Sean Podielsky • Catherine Polcari • Craig Politte • Marcus Pollak • Victoria Ponterio • Marco Porri • Laurence Porte • Mathieu Potin • Celia Powell • Adrian Poxon • Gregory Preble • Manuel Prechtl • David Preti • Marina Prokhorova • Maureen Pudelka • Bertrand Puget • Odette Puivin • Virginie Pujalte • Beatrice Pujol • Rolf Pulfer • Jo-Ann Pully • Joseph Pulvirenti • Patricia Quarnstrom • Guadalupe Quindos • Andrea Raack • Marie Jose Radonjic • Kathleen Rahilly • Malika Rais • Maritza Ramirez • Sandra Ramtahal • Vito Randazzo • Suresh Rangasamy • Nancy Raphael • Anna Rapp • Jürg Raschle • Gino Ratto • Donna Reed • Jean Regalado • Marybeth Rice • Mark Rieder • Dominique Ries • Brigitte Rioni • Toni Rishar • Robert Risholm • Sandra Risi • Sara Ritola • Pierre Rivier • Christina Rizzo • Jane Louise Roberts • Carole Roberts • Debralee Robinson • Laurent Rochat • Xiaomei Rochat • Serge Rocourt • Raquel Rodriguez • Nadine Rodriguez • Karl Roessler • Thomas Rogall • Martin Rohrer • Roman Romeo • Pamela Rosati • Messody Roset • Christine Rouger • Francoise Roy • Pascale Ruault • Macarena Rubio • Catherine Rudow • Rolf Rüegg • Giuseppe Ruggieri • Dorinne Ruggiero • Sandra Rushbrook • Erik Rüttener • Joanne Ryan • Thomas Ryser • Brian Sabia • Dalila Sadaoui • Maria De Los Angeles Saidonni • Maria Salamon • Elisabeth Salmon • Olivier Salmon • Amanda Samai • Isabelle Samb • James Sanchez • Patrick Sancier • Dick Sanford • Matthias Sänger • Alexandra Sani • Lisa Santasiero • Chantal Sarti • Sergine Savary-Kruppa • Joe Saydlowski • Isabelle Schaller • Martine Schaller-Fringeli • Peter Schällibaum • Hansjörg Schären • Robert Schätti • Ricardo Schellenberg • Andrea Schellenberg • Anton Scherer • Yvonne Scherz Hausammann • Marlene Schimenz • Daniel Schirato • Thierry Schmid • Thomas Schneider • Gabriela Schneider • Andrea Schneider • Daniela Schoch Baruffol • Judit Scholz • Stephan Schrecke • Jürg Schürer • Edgar Schurr • Jürgen Schwärmer • Katrin Schwenk • Michelle Scott • Carolyn Searles • Brian Secrett • Samer Semaan • Martine Seni • Nathalie Senrens • Charlene Seon • Kathleen Servidea • Dino Sestito • Kevin Shang • Lisa Shereck • Marcella Sherlock • Marta Shevchik • Donald Shushack • Robin Sidders • Tina Sideris • Ariane Siegrist • Andreas Silva • Steven Simmons • Elizabeth Simmons • Sandra Simons • Suthakaran Sivapalan • Stephen Smigel • Thomas Smith • Sandra Smith • Randolph Smith • Yaniko Smith • Kelli Soares • Amanda Sodergren • Donna Solieri • Dawn Somner • Maryvonne Somsack • Maryse Souquiere Lagarde • Cathy Sousa-Lombardi • Aurore Soyer Rocourt • Ian Speirs • Paul Stacy • Irene Städeli • Markus Stäger • Nicole Stahel • Thomas Startup • Beatrice Staub • Petra Steiner • Daniela Steiner • Gero Stenzel • Eva Stockmann • Renée Strasser • William Strasser • Susanne Straube-Ericson • Sharon Sung • Catherine Sutcliffe • Fabrice Suter • Tomas Sztymon • Shereen Tan • Patrick Tanzola • Daniel Tarabocchia • Bouhalem Tarmoul • Vanessa Tarzia • Neetusha Teelockchand • Magdalena Temesi-Cano • Hope Tera • Denny Tesch • Ursula Thalmann • Patrick Thiele • Sara Thomas • Richard Thomas • Gerald Thomas • Justin Thomas • Jacob Thomas • Jean-Luc Thomas • Paula Thompson • Kenneth Thompson • Sameer Tikoo • Robert Tinari • Michael Ting • Desiree Tinsley • Manfred Tischhauser • Béatrice Tison • Brian Tobben • Dom Tobey • Jeffrey Toone • Florence Tourneux • Christoph Trachsel • Walter Tremp • Violet Trinidad • Sarah Troy • Kim Truran-Coffey • Alexander Tully • Eija Tuulensuu • Sauro Uguccioni • Jonathan Vagnier • Susan Valdes • Jan van den Berg • Ton van der Minnen • Arjen van Summeren • Natalia Vayner-Heyraud • Danny Vega • Renato Verderame • Sylvie Veyrent • Dominique Vidal • Laurent Vilcot • Arnaud Villain • Natalia Villavicencio • Francois Vilnet • Corinne Vincentelli • Francoise Visiedo • Despina Vladu • Christian Vogel • Peter Vogt • Victoria von Atzigen • Franziska von Rohr • Kyle Vrieze • Christiane Vulliez • Norbert Wackerle • David Stanley Waddell • Tanika Wade • Paula-Mae Wade • Hans Walder • Brigitte Waldvogel • Thuy Walgren • Tad Walker • Ivor Wallace • Donna Walsh • Jean Claude Wasterlain • Chantal Wasterlain • Benjamin Weber • Alain Weber • Katherine Wee • Olivier Wenk • Carol Anne West • Marc Wetherhill • Franz Wettach • Sarah Wheeler • Anthony Wilde • Ronald Wilkins • Jason Williams • James Wilson • Stephan Winands • John Windas • William Winnis • Matthias Wisotzki • Lukas Wissler • Vivienne Mee Ling Wong • John Wong • Bella Wong • Sophie Wu Häberli • Urs Wüst • Yan Yan Xi • Simon Jiangtao Xiong • Nerissa Kit Man Yan • Susan Poh Suan Yap • Dom Yarnell • David Yim • Naoko Yotsumoto • Tracy Yu • Austin Yuen • Shin Yukawa • Inna Yulman • Robert Zahner • Thomas Zelger • Martin Zeller • Michael Zielin • Hernan Zilleruelo • Sarah Zimmerli • Erhard Zingg • Doris Zizi • Robert Zsunkan • Eva Züger • Lovette Zuill • Irena Zumbrunn • Pius Zuppiger
521258_P157-168_BACK.indd 167521258_P157-168_BACK.indd 167 3/18/09 12:50:51 AM3/18/09 12:50:51 AM
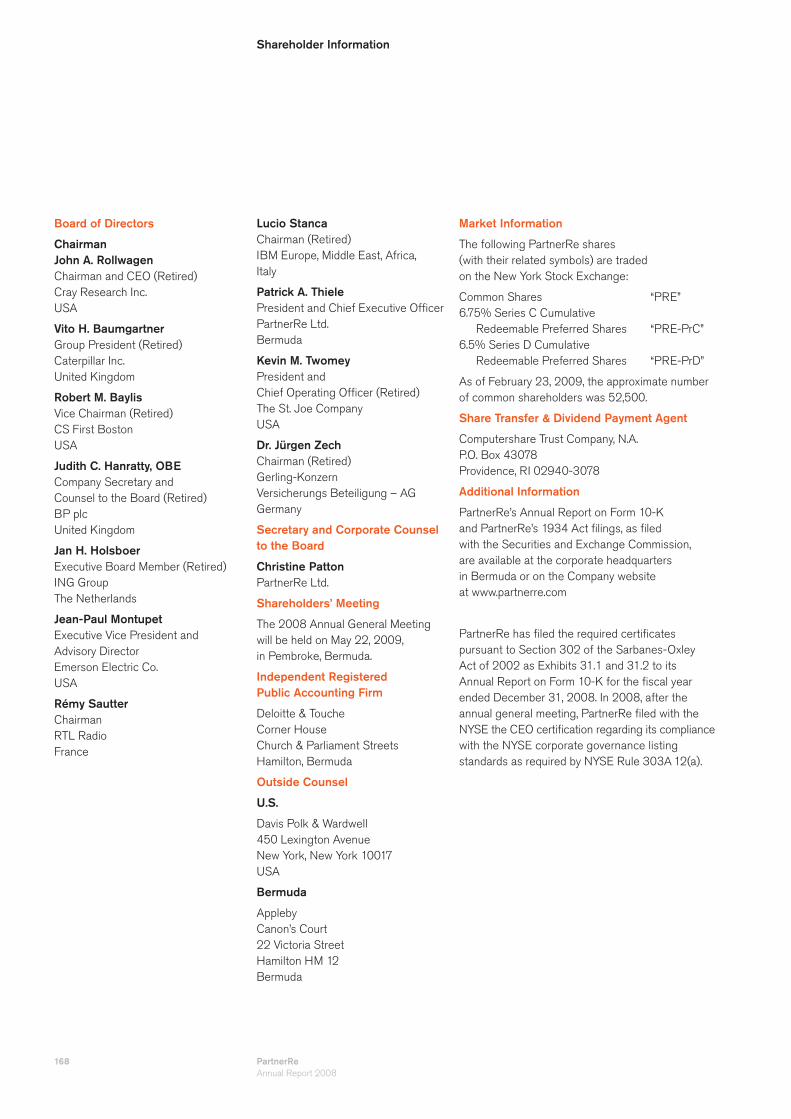
PartnerReAnnual Report 2008
168
Board of Directors
Chairman John A. Rollwagen Chairman and CEO (Retired) Cray Research Inc.USA
Vito H. Baumgartner Group President (Retired) Caterpillar Inc. United Kingdom
Robert M. Baylis Vice Chairman (Retired) CS First BostonUSA
Judith C. Hanratty, OBE Company Secretary and Counsel to the Board (Retired) BP plc United Kingdom
Jan H. Holsboer Executive Board Member (Retired) ING Group The Netherlands
Jean-Paul Montupet Executive Vice President and Advisory Director Emerson Electric Co.USA
Rémy Sautter Chairman RTL Radio France
Lucio Stanca Chairman (Retired) IBM Europe, Middle East, Africa, Italy
Patrick A. Thiele President and Chief Executive Offi cer PartnerRe Ltd. Bermuda
Kevin M. Twomey President and Chief Operating Offi cer (Retired) The St. Joe Company USA
Dr. Jürgen Zech Chairman (Retired) Gerling-Konzern Versicherungs Beteiligung – AG Germany
Secretary and Corporate Counsel to the Board
Christine Patton PartnerRe Ltd.
Shareholders’ Meeting
The 2008 Annual General Meeting will be held on May 22, 2009, in Pembroke, Bermuda.
Independent Registered Public Accounting Firm
Deloitte & ToucheCorner HouseChurch & Parliament Streets Hamilton, Bermuda
Outside Counsel
U.S.
Davis Polk & Wardwell 450 Lexington Avenue New York, New York 10017USA
Bermuda
ApplebyCanon’s Court 22 Victoria Street Hamilton HM 12 Bermuda
Market Information
The following PartnerRe shares (with their related symbols) are traded on the New York Stock Exchange:
Common Shares “PRE” 6.75% Series C Cumulative Redeemable Preferred Shares “PRE-PrC” 6.5% Series D Cumulative Redeemable Preferred Shares “PRE-PrD”
As of February 23, 2009, the approximate number of common shareholders was 52,500.
Share Transfer & Dividend Payment Agent
Computershare Trust Company, N.A.P.O. Box 43078Providence, RI 02940-3078
Additional Information
PartnerRe’s Annual Report on Form 10-K and PartnerRe’s 1934 Act fi lings, as fi led with the Securities and Exchange Commission, are available at the corporate headquarters in Bermuda or on the Company website at www.partnerre.com
PartnerRe has fi led the required certifi cates pursuant to Section 302 of the Sarbanes-Oxley Act of 2002 as Exhibits 31.1 and 31.2 to its Annual Report on Form 10-K for the fi scal year ended December 31, 2008. In 2008, after the annual general meeting, PartnerRe fi led with the NYSE the CEO certifi cation regarding its compliance with the NYSE corporate governance listing standards as required by NYSE Rule 303A 12(a).
Shareholder Information
521258_P157-168_BACK.indd 168521258_P157-168_BACK.indd 168 3/18/09 12:51:05 AM3/18/09 12:51:05 AM

12/1
993
3/19
946/
1994
9/19
9412
/199
43/
1995
6/19
959/
1995
12/1
995
3/19
966/
1996
9/19
9612
/199
63/
1997
6/19
979/
1997
12/1
997
3/19
986/
1998
9/19
9812
/199
83/
1999
6/19
999/
1999
12/1
999
3/20
006/
2000
9/20
0012
/200
03/
2001
6/20
019/
2001
12/2
001
3/20
026/
2002
9/20
0212
/200
23/
2003
6/20
039/
2003
12/2
003
3/20
046/
2004
9/20
0412
/200
43/
2005
6/20
059/
2005
12/2
005
3/20
066/
2006
9/20
0612
/200
63/
2007
6/20
079/
2007
12/2
007
3/20
086/
2008
9/20
0812
/200
8
100
120
140
160
180
200
220
240
260
280
300
320
340
360
380
400
420
Financial Highlights
(expressed in millions of U.S. dollars, except per share data)
* Source: Bloomberg
The Company’s Annual Report contains measures such as operating earnings, operating earnings per share and operating return on e quity that
are considered non-GAAP measures. See page 20 for a reconciliation of those non-GAAP measures to the most comparable GAAP measures.
For the years ended December 31, 2004 2005 2006 2007 2008
$ 3,853 $ 3,616 $ 3,689 $ 3,757 $ 3,989 Net premiums written
4,166 4,206 4,187 4,211 3,980 Total revenues
492 (51) 749 718 47 Net income (loss)
386 (252) 656 822 469
Operating earnings (loss) available to common shareholders
Earnings (loss) per common share:
$ 7.15 $ (4.59 ) $ 11.36 $ 14.29 $ 8.43
Diluted operating earnings (loss)per common share
8.71 (1.56) 12.37 11.87 0.22
Diluted net income (loss) per common share
16.8% (8.9)% 25.5% 25.2% 12.3%
Operating return on beginning common shareholders’ equity
20.4% (3.0)% 27.8% 20.9% 0.3%
Return on beginning common shareholders’ equity calculated with net income (loss) available to common shareholders
Non-life ratios:
65.6% 87.3% 54.8% 50.8% 63.9% Loss ratio
23.0 23.0 23.1 22.9 23.3 Acquisition ratio
6.0 6.0 6.5 6.7 6.9 Other operating expense ratio
94.6% 116.3% 84.4% 80.4% 94.1% Combined ratio
At December 31, 2004 2005 2006 2007 2008
$ 12,717 $ 13,783 $ 15,034 $ 16,149 $ 16,279 Total assets
3,352 3,093 3,786 4,322 4,199 Total shareholders’ equity
50.99 44.57 56.07 67.96 63.95
Diluted book value per common and common share equivalents
3,398 3,725 4,054 4,477 4,023 Market capitalization
Comparative Performance Graph
PartnerRe Share Price S&P 500
Compound
Annual Return*
Price: 8.8%
Dividend: 2.5%
Total: 11.3%
Corporate Headquarters
Bermuda
Wellesley House90 Pitts Bay RoadPembroke HM 08BermudaPhone +1 441 292 0888Fax +1 441 292 7010
Principal Offi ces
Dublin
5th Floor, Block 1 The Oval 160 Shelbourne Road Dublin 4 Ireland Phone +353 1 637 9600 Fax +353 1 637 9660
Greenwich
One Greenwich PlazaGreenwich, CT 06830-6352USAPhone +1 203 485 4200Fax +1 203 485 4300
Paris
153 rue de Courcelles75817 Paris Cedex 17FrancePhone +33 1 44 01 17 17Fax +33 1 44 01 17 80
Zurich
Bellerivestrasse 368034 ZurichSwitzerland Phone +41 44 385 35 35Fax +41 44 385 35 00
Branch Offi ces
Hong Kong
3417 Sun Hung Kai Centre30 Harbour RoadWanchai, Hong KongPhone +852 2598 8813Fax +852 2598 0886
Singapore
2 Battery RoadMaybank Tower, #23-01Singapore 049907Phone +65 6538 2066Fax +65 6538 1176
Toronto
130 King Street WestSuite 2300, P.O. Box 166Toronto, Ontario M5X 1C7CanadaPhone +1 416 861 0033Fax +1 416 861 0200
Representative Offi ces
Beijing
Room 1211, Offi ce Tower C1 Oriental Plaza No. 1 East Chang An Avenue Dong Cheng District Beijing 100738 People’s Republic of China Phone +86 10 8518 5780 Fax +86 10 8518 9676
Mexico City
Av. Presidente Masaryk No. 111Piso 1 (Regus)Col. Chapultepec Morales (Polanco)11560 México, D.F.MéxicoPhone +5255 9171 1716Fax +5255 3300 5999
Santiago
Av. Vitacura 2939 of 2701Las Condes – SantiagoChilePhone +56 2 799 2600Fax +56 2 799 2610
Sao Paulo
Al. Ministro Rocha Azevedonº 38 – conj. 103CEP 01410-000 Cerqueira CésarSao Paulo/SPBrazilPhone +5511 3146 8600Fax +5511 3146 8608
Seoul
Suite 400, Leema Building146-1 Soosong-Dong, Chongro-GuSeoul 110-755KoreaPhone +82 2 398 5846Fax +82 2 398 5807
Tokyo
Fukoku Seimei Building 5F2-2-2 Uchisaiwaicho Chiyoda-kuTokyo 100-0011JapanPhone +813 5251 5301Fax +813 5251 5302
521258_P000_covers.indd Cover2521258_P000_covers.indd Cover2 3/18/09 1:16:12 AM3/18/09 1:16:12 AM

Annual R
ep
ort 2
00
8
www.partnerre.com
risk
capitalbusinessm
anag
emen
t
reinsurance
value
return
market
equity
clients
industry
years
also
balance
retu
rns
volatility
portfolio
new
loss
manage
und
erw
riti
ng
diversifi cation
shareholders
lines
investm
ent
asset
year
people
strategy
compan
y
opportunities
believe
one
level
framew
ork
well
across
econom
ic
fi nan
cial
appr
oach
proc
esse
s
organization
cata
stro
phe
right
good
shee
t
make
limit
s
appetite
cycle
losses
side
appropriate
reinsurers
tim
e
with
in
cult
ure
take
stability
rese
rvin
g
assets
companies
key
pricing
models
strong
may
actuarial
underwriters
cedants
even
ts
insurance
premiums
assume
actuaries
shock
attractive
thin
k
area
s
continue
focus
price
ach
ieve
expo
sure
example
every
particular
importan
t
line
liability
long-term
growth
superior
allows
total
skills
view
structure
clai
ms
securities
just
ensure
impa
ct
measure
assumed
book
potential
capa
city
future
stra
tegi
c
fi rs
t
liabilities
abili
ty
polic
ies provide
success
position
deman
d
information
tren
ds
around
resu
lts
clear
casualty
prod
ucts
part
mus
t
diff erent
higher
billion
three
amount
several consistent
large
unit
diversifi ed
U.S.
net
income
aggregate
many
less
even
t
need
term
Stability in a Volatile WorldAnnual Report 2008
521258_P000_covers.indd Cover1521258_P000_covers.indd Cover1 3/23/09 10:44:52 AM3/23/09 10:44:52 AM