stability assessment of biopharmaceutical formulations · resumo o vasto uso de anticorpos com fins...
TRANSCRIPT

Stability Assessment of Biopharmaceutical Formulations
Joana Baltazar Domingues
Dissertation submitted for obtaining the Master’s degree in
Biological Engineering
Jury
President: Prof. Maria Raquel Murias dos Santos Aires Barros
Supervisor: Dr. Ana Margarida Nunes da Mata Pires de Azevedo
Co-Supervisor: Prof. José António Leonardo dos Santos
Examiner: Prof. Marília Clemente Velez Mateus
November 2011

ACKNOWLEDGEMENTS
First, I would like to thank my supervisor Dr. Ana Azevedo for giving me the opportunity to develop
this work and for her help throughout this process. It wouldn’t have been possible to conclude this
work without her knowledge and insightful ideas. I am profoundly grateful for her kindness and
constant support, availability and encouragement.
I would also like to express my gratitude to my co-supervisor, Professor José Santos for the
availability, as well as for the knowledge shared.
Special thanks to my laboratory colleagues for their warm welcoming into the group. I would like to
thank Luis Borlido for sharing with me some of his brightness and to José Oliveira for all the help he
gave me along this process.
To my family, the biggest thank for the interest, patience and support shown. To my father, thank
you for always trying to help me and for sharing your knowledge and insights. A special word to my
mother, for being the rock in my life and for inspiring me to always exceed myself. You represent
everything I one day hope to become.
I would like to thank my boyfriend, João Ferreira, for all the love, patience and motivation he gave
me at all times. Thank you for believing in me more than I believe in myself.
At last, but not least, I would like to thank all my friends for their friendship, as well as the support
and motivation that they have given me throughout this journey. I would like to pay a special
acknowledgement to my friends João Burgal and Joana Carmelo for the constant interest
demonstrated in my work, as well as for the motivation they have always given me.

ii

iii
ABSTRACT
Antibodies are widely used for therapeutic purposes. A common problem associated with
therapeutic antibodies is to ensure their long term stability which constitutes a formulation challenge.
Therefore, in this thesis the stability of antibodies has been studied in the absence and in the presence
of common additives present in therapeutic formulations in order to identify which additive leads to
higher antibody stabilization.
First, IgG stability was evaluated against heat denaturation, pH induced denaturation and
mechanical shear stress induced degradation. Then, IgG stability in solutions with sucrose, glycine,
maltose, L-histidine and D-trehalose was tested against thermal and pH induced denaturation.
Aggregation studies were also conducted for different values of temperature and pH using dynamic
light scattering. The biological activity was determined by affinity chromatography and conformational
studies conducted by circular dichroism spectroscopy.
IgG was found to be resistant to shear stress up to 49 Pa induced in a concentric-cylinder shear
device and against induced denaturation at pH 3. At pH 2, irreversible denaturation occurred at some
extent. Regarding heat denaturation, IgG suffered only mild structural changes at 60°C but at 70°C
significant loss of biological activity, extensive structural changes and IgG precipitation were verified.
IgG showed higher tendency for aggregation upon incubation at 70°C than upon incubation at pH
values distant from the isoelectric range (pI ≈9).
Maltose was identified as the best IgG stabilizer since it provided complete stabilization at low pH
and the highest stabilization against heat denaturation. Generally, maltose was also able to reduce
IgG’s tendency for aggregation.
Keywords: Antibodies, Stability, Aggregation, Maltose, Circular Dichroism Spectroscopy, Dynamic
Light Scattering

iv

v
RESUMO
O vasto uso de anticorpos com fins terapêuticos impõe que a sua estabilidade a longo prazo seja
assegurada, o que constitui um desafio no desenvolvimento da formulação terapêutica. Assim,
estudou-se a estabilidade do anticorpo na ausência e presença de aditivos comummente presentes em
formulações terapêuticas com o objectivo de identificar o aditivo que conduz a maior estabilização do
anticorpo.
Primeiramente avaliou-se a desnaturação da IgG induzida pela temperatura, pH e tensões de corte
de origem mecânica. A estabilidade da IgG em soluções contendo sacarose, glicina, maltose, L-histidina
e D-trealose foi testada em condições desnaturantes de temperatura e pH. Os efeitos da temperatura e
do pH na agregação foram estudados por dispersão dinâmica de luz. A actividade biológica foi
determinada por cromatografia de afinidade sendo os estudos conformacionais efectuados por
dicroísmo circular.
Verificou-se que a IgG consegue resistir a tensões de corte de 49 Pa induzidas num módulo de
cilindros concêntricos rotativo bem como à desnaturação induzida a pH 3. A pH 2 ocorreu
desnaturação irreversível em alguma extensão. A 60°C a IgG sofreu apenas leves mudanças
estruturais , mas a 70°C verificou-se perda significativa de actividade biológica, extensas alterações
estruturais e formação de precipitados. Verificou-se maior tendência para agregação após incubação
a 70°C do que após incubação a pH afastados do ponto isoeléctrico da IgG.
A maltose apresentou-se como o melhor estabilizador da IgG dado oferecer completa estabilização
a pH baixo e a melhor estabilização face à desnaturação induzida pela temperatura, contribuindo
também para a redução da tendência para agregação.
Palavras-chave: Anticorpos, Estabilidade, Agregação, Maltose, Dicroísmo Circular, Dispersão
Dinâmica de Luz

vi

vii
TABLE OF CONTENTS
ACKNOWLEDGEMENTS ............................................................................................................. I
ABSTRACT ............................................................................................................................... III
RESUMO .................................................................................................................................. V
TABLE OF CONTENTS .............................................................................................................. VII
LIST OF FIGURES ...................................................................................................................... IX
LIST OF TABLES ...................................................................................................................... XV
LIST OF ABREVIATIONS .......................................................................................................... XVI
INTRODUCTION ....................................................................................................................... 1
1.1 BACKGROUND .........................................................................................................................1
1.2 OBJECTIVES .............................................................................................................................1
1.3 OUTLINE .................................................................................................................................2
2 LITERATURE REVIEW ........................................................................................................... 3
2.1 MONOCLONAL ANTIBODIES .......................................................................................................3
2.2 MABS’ HISTORICAL AND ECONOMICAL BACKGROUND ....................................................................7
2.3 STABILITY REQUIREMENTS .........................................................................................................9
2.4 PUBLISHED STUDIES ............................................................................................................... 10
2.5 DENATURATION CAUSED BY SHEAR STRESS ................................................................................ 13
2.5.1 Vorticular Flow Membrane Modules ........................................................................ 13
2.6 STABILITY ASSESSMENT .......................................................................................................... 15
2.6.1 Affinity Chromatography .......................................................................................... 15
2.6.2 Circular Dichroism ..................................................................................................... 17
2.6.3 Dynamic Light Scattering .......................................................................................... 23
3 MATERIALS AND METHODS ............................................................................................... 26
3.1 MATERIALS .......................................................................................................................... 26
3.1.1 Biologicals ................................................................................................................. 26
3.1.2 Chemicals .................................................................................................................. 26
3.2 METHODS ............................................................................................................................ 27
3.2.1 Sample Preparation .................................................................................................. 27
viii
3.2.1.1 Stability Assessment of IgG without additives ........................................... 27
3.2.1.2 Stability Assessment of IgG with additives................................................. 28
3.2.2 Analytical Methods.................................................................................................... 29
4 RESULTS AND DISCUSSION ................................................................................................. 31
4.1 STABILITY ASSESSMENT OF IGG WITHOUT ADDITIVES ................................................................... 31
4.1.1 Thermal induced denaturation ................................................................................. 31
4.1.2 pH induced denaturation .......................................................................................... 37
4.1.3 Mechanical Shear Stress induced degradation ......................................................... 40
4.2 STABILITY ASSESSMENT OF IGG WITH ADDITIVES ......................................................................... 44
4.2.1 Thermal induced denaturation ................................................................................. 44
4.2.2 pH induced denaturation .......................................................................................... 48
4.3 AGGREGATION STUDIES FOR IGG ............................................................................................. 50
4.3.1 pH effect on IgG aggregation .................................................................................... 51
4.3.2 Temperature effect on IgG aggregation .................................................................... 53
5 CONCLUSION AND FUTURE PRESPECTIVES ......................................................................... 57
REFERENCES ........................................................................................................................... 59
APPENDIX A - RELEVANT LITERATURE DATA ......................................................................... 63
APPENDIX B - RETAINED BIOLOGICAL ACTIVITY OVER TIME .................................................. 64
APPENDIX C - CD SPECTRA................................................................................................... 68
APPENDIX D - DLS SIZE DISTRIBUTIONS ................................................................................ 75

ix
LIST OF FIGURES
Figure 2.1 – IgG representation showing the light and heavy chains as well as the constant and variable
regions. Adapted from (6). .......................................................................................................................... 4
Figure 2.2 – Representation of IgG’s structure highlighting its several domains, as well as the Fab and Fc
fragments. The secondary structure of the Fab fragment is reptresented in detail (7). The Fv fragment
corresponds to an unstable fragment able to bind to an antigen with two V regions, VL and VH (2). ...... 5
Figure 2.3 – Representation of IgG’s secondary structure, evidencing the high content of β-sheets (8). . 6
Figure 2.4 – Schematic drawing of a CCSD, showing Taylor vortices (26). ...............................................14
Figure 2.5 – (A) Plane polarized light resolved into two circularly polarized components – left, L, and
right, R. As long as the intensities and phases of the two circularly polarized components remain equal,
their resultant will lie in a plane with oscillating magnitude. (B) If the right circularly polarized
component is less intense (more absorbed) than the left one, the electric vector of the light follows an
elliptical path, thus corresponding to elliptically polarized light (36). ......................................................18
Figure 2.6 – Typical CD spectra for particular secondary structural motifs (α-helix, β-sheet, random coil)
used in CD protein structure fitting programs (38). ..................................................................................21
Figure 4.1 – Retained Biological Activity (%) after 50 hours of incubation at 60°C of IgG solutions in PBS
(pH 7.4) with the initial concentrations of 1, 5, 10 and 15 g/L. ................................................................32
Figure 4.2 – Far-UV CD spectra of IgG in PBS (pH 7.4) before incubation () and after 50 hours of
incubation () at 60°C for the initial concentration of (A) 1 g/L, (B) 5 g/L, (C) 10 g/L and (D) 15 g/L. ....33
Figure 4.3 – Retained Biological Activity (%) after 2, 8 and 36 hours of incubation at 70°C of IgG
solutions in PBS (pH 7.4) with the initial concentrations of 1, 5, 10 and 15 g/L. ......................................34
Figure 4.4 – Precipitation occured after 8 hours of incubation at 70°C for the initial concentrations of
IgG in solution of: (A) 1 g/L, (B) 5 g/L, (C) 10 g/L and (D) 15 g/L. ..............................................................34
Figure 4.5 - Far-UV CD spectra of IgG in PBS (pH 7.4) before incubation () and after 8 hours of
incubation () at 70°C for the initial concentration of (A) 1g/L, (B) 5 g/L, (C) 10 g/L and (D) 15 g/L. .....36
Figure 4.6 – Retained Biological Activity (%) after 50 hours of incubation of IgG solutions with PBS at pH
3.02 with the initial concentrations of 1, 5, 10 and 15 g/L. ......................................................................37
Figure 4.7 - Far-UV CD spectra of IgG in PBS before incubation () and after 50 hours of incubation
() at pH 3.02 for the initial concentration of (A) 1 g/L, (B) 5 g/L, (C) 10 g/L and (D) 15 g/L. .................38
Figure 4.8 - Retained Biological Activity (%) after 9 hours of incubation of IgG solutions with PBS at pH
2.1 with the initial concentrations of 1, 5, 10 and 15 g/L. ........................................................................39

x
Figure 4.9 - Far-UV CD spectra of IgG in PBS before incubation () and after 9 hours of incubation ()
at pH 2.1 for the initial concentration of (A) 1 g/L, (B) 5 g/L, (C) 10 g/L and (D) 15 g/L. .......................... 40
Figure 4.10 – Far-UV CD spectra of IgG in PBS at pH 7.4 for several periods of time spent in the shear
field. The initial concentration of IgG was of 1 g/L and the angular speed of the inner rotating cylinder
of 1000 rpm. ............................................................................................................................................. 41
Figure 4.11 – Far-UV CD spectra of IgG in PBS at pH 7.4 for several periods of time spent in the shear
field. The initial concentration of IgG was of 1 g/L and the angular speed of the inner rotating cylinder
of 2000 rpm. ............................................................................................................................................. 42
Figure 4.12 – Far-UV CD spectra of IgG in PBS at pH 7.4 for several periods of time spent in the shear
field. The initial concentration of IgG was of 1 g/L and the angular speed of the inner rotating cylinder
of 3000 rpm. ............................................................................................................................................. 42
Figure 4.13 – Far-UV CD spectra of IgG in PBS at pH 7.4 for several periods of time spent in the shear
field. The initial concentration of IgG was of 15 g/L and the angular speed of the inner rotating cylinder
of 3000 rpm. ............................................................................................................................................. 43
Figure 4.14 – Retained Biological Activity (%) of IgG after a period of circulation in the shear field of 30
minutes. .................................................................................................................................................... 44
Figure 4.15 - Retained Biological Activity (%) after incubation at 70°C for a period of 8h of IgG solutions
with the initial concentrations of 1, 5, 10 and 15 g/L. The buffers used consisted in PBS with 10% (w/v)
of additive except for L-histidine in which the concentration of additive in the buffer was of 2% (w/v).
.................................................................................................................................................................. 45
Figure 4.16 - Retained Biological Activity (%) after incubation at 70°C for a period of 8h of IgG solutions
with the initial concentrations of 1, 5, 10 and 15 g/L. The buffers used consisted in PBS with 2% (w/v) of
additive. .................................................................................................................................................... 46
Figure 4.17 - Far-UV CD spectra of IgG in PBS with 10% (w/v) of maltose (pH ≈ 7) before incubation ()
and after 8 hours of incubation () at 70°C for the initial concentration of (A) 1g/L, (B) 5 g/L, (C) 10 g/L
and (D) 15 g/L. .......................................................................................................................................... 47
Figure 4.18 - Retained Biological Activity (%) after incubation of IgG solutions with the initial
concentrations of 1, 5, 10 and 15g/L at pH ≈ 2 for a period of 9h. The buffers used consisted in PBS with
10% (w/v) of additive except for L-histidine in which the concentration of additive in the buffer was of
2% (w/v). ................................................................................................................................................... 48
Figure 4.19 - Far-UV CD spectra of IgG in PBS with 10% (w/v) of maltose before incubation () and
after 9 hours of incubation () at pH 2.1 for the initial concentration of (A) 1 g/L, (B) 5 g/L, (C) 10 g/L
and (D) 15 g/L. .......................................................................................................................................... 49

xi
Figure 4.20 – Size (nm) of IgG in PBS at pH 2.1 before incubation and after 9 hours of incubation in PBS
at pH 2.1 and PBS with 10% (w/v) maltose at pH 2.1. ..............................................................................52
Figure 4.21 - Size (nm) of IgG in PBS at pH 11.3 before incubation and after 9 hours of incubation in PBS
at pH 11.3 and PBS with 10% (w/v) maltose at pH 11.5. ..........................................................................53
Figure 4.22 – Size (nm) of native IgG and IgG after 8 hours of incubation at 70 °C in PBS and PBS with
10% (w/v) maltose – pH ≈ 7. .....................................................................................................................54
Figure 4.23 – Variations in size of IgG in solution over time of incubation at 70°C in hours for the initial
concentration of IgG in solution of (A) 1g/L and (B) 15g/L, both in absence and presence of maltose.
The Fold Increase in Size corresponds to the ratio between the size at a given time and the initial
particle size................................................................................................................................................55
Figure B.1 - Retained Biological Activity (%) over time (h) of incubation at 60°C of IgG in PBS (pH 7.4)
with the initial concentrations of 1, 5, 10 and 15 g/L. ..............................................................................64
Figure B.2 - Retained Biological Activity (%) over time (h) of incubation at 70°C of IgG in PBS (pH 7.4)
with the initial concentrations of 1, 5, 10 and 15 g/L. ..............................................................................64
Figure B.3 - Retained Biological Activity (%) over time (h) of incubation of IgG solutions with PBS at pH
3.02 with the initial concentrations of 1, 5, 10 and 15 g/L. ......................................................................65
Figure B.4 - Retained Biological Activity (%) over time (h) of incubation of IgG solutions with PBS at pH 2
with the initial concentrations of 1, 5, 10 and 15 g/L. ..............................................................................65
Figure B.5 - Retained Biological activity (%) over time (min) of induced mechanical shear stress with the
inner cylinder rotating at 1000, 2000 and 3000 rpm and 3000 rpm for the initial concentrations of IgG
of 1 g/L and 15 g/L, respectively. ..............................................................................................................66
Figure B.6 – Comparison of the Retained Biological activity (%) over time (h) of induced thermal
denaturation (70°C) for the initial concentrations of IgG in PBS with (continuous line) and without
(dashed line) 10% (w/v) maltose of 1, 5, 10 and 15 g/L, respectively. .....................................................66
Figure B.7 – Comparison of the Retained Biological activity (%) over time (h) of pH induced
denaturation (pH ≈ 2) for the initial concentrations of IgG in PBS with and without 10% (w/v) maltose
of 1, 5, 10 and 15 g/L, respectively. ..........................................................................................................67
Figure C.1 – Far-UV CD spectra of IgG in PBS with 10% (w/v) of glycine (pH ≈ 7) before incubation ()
and after 8 hours of incubation () at 70°C for the initial concentration of (A) 1 g/L, (B) 5 g/L, (C) 10 g/L
and (D) 15 g/L.……………………………………………………………………..……………….................................................68
Figure C.2 – Far-UV CD spectra of IgG in PBS with 10% (w/v) of glycine before incubation () and after
9 hours of incubation () at pH 2.1 for the initial concentration of (A) 1 g/L, (B) 5 g/L, (C) 10 g/L and (D)
15 g/L. ........................................................................................................................................................69

xii
Figure C.3 – Far-UV CD spectra of IgG in PBS with 10% (w/v) of D-trehalose (pH ≈ 7) before incubation
() and after 8 hours of incubation () at 70°C for the initial concentration of (A) 1 g/L, (B) 5 g/L, (C)
10 g/L and (D) 15 g/L. ……………….…………………………………………………………………………………………………………70
Figure C.4 – Far-UV CD spectra of IgG in PBS with 10% (w/v) of trehalose (pH ≈ 7) before incubation ()
and after 9 hours of incubation () at pH 2.1 for the initial concentration of (A) 1 g/L, (B) 5 g/L, (C) 10
g/L and (D) 15 g/L. .................................................................................................................................... 71
Figure C.5 – Far-UV CD spectra of IgG in PBS with 10% (w/v) of sucrose (pH ≈ 7) before incubation ()
and after 8 hours of incubation () at 70°C for the initial concentration of (A) 1 g/L, (B) 5 g/L, (C) 10 g/L
and (D) 15 g/L. .......................................................................................................................................... 72
Figure C.6 – Far-UV CD spectra of IgG in PBS with 10% (w/v) of sucrose before incubation () and after
9 hours of incubation () at pH 2.1 for the initial concentration of (A) 1 g/L, (B) 5 g/L, (C) 10 g/L and (D)
15 g/L. ....................................................................................................................................................... 73
Figure C.7 – Far-UV CD spectra of IgG in PBS with 2% (w/v) of maltose before incubation () and after
8 hours of incubation () at 70°C for the initial concentration of (A) 1 g/L, (B) 5 g/L, (C) 10 g/L and (D)
15 g/L. ....................................................................................................................................................... 74
Figure D.1 – Histogram showing the size distribution of an IgG solution in PBS (pH 2.1) before 9 hours
of incubation at pH ≈ 2, for the concentrations of row (A) 1 g/L and row (B) 15 g/L. The y-axis is the
intensity of the average scattered light (%) – Size distribution by Intensity - or total volume of particles
in the different size bins (%) – Size Distribution by Volume. The x-axis is the absolute size of the scatters
(nm). ......................................................................................................................................................... 75
Figure D.2 – Histogram showing the size distribution of an IgG solution in PBS (pH 11.3) before 9 hours
of incubation at pH ≈ 11, for the concentrations of row (A) 1 g/L and row (B) 15 g/L. The y-axis is the
intensity of the average scattered light (%) – Size distribution by Intensity - or total volume of particles
in the different size bins (%) – Size Distribution by Volume. The x-axis is the absolute size of the scatters
(nm). ......................................................................................................................................................... 76
Figure D.3 – Histogram showing the size distribution of an IgG solution in PBS with 10% (w/v) of
maltose after 9 hours of incubation at pH 2.06 for the concentrations of (A) 1 g/L (B) 15 g/L. The y-axis
is the intensity of the average scattered light (%) – Size distribution by Intensity - or total volume of
particles in the different size bins (%) – Size Distribution by Volume. The x-axis is the absolute size of
the scatters (nm). ..................................................................................................................................... 77
Figure D.4 – Histogram showing the size distribution of an IgG solution in PBS with 10% (w/v) of
maltose after 9 hours of incubation at pH 11.45 for the concentrations of row (A) 1 g/L and row (B) 15
g/L. The y-axis is the intensity of the average scattered light (%) – Size distribution by Intensity - or total

xiii
volume of particles in the different size bins (%) – Size Distribution by Volume. The x-axis is the
absolute size of the scatters (nm). ........................................................................................................... 78
Figure D.5 – Histogram showing the size distribution of an IgG solution in PBS after 9 hours of
incubation at pH 2.1 for the concentrations of (A) 1 g/L (B) 15 g/L. The y-axis is the intensity of the
average scattered light (%) – Size distribution by Intensity - or total volume of particles in the different
size bins (%) – Size Distribution by Volume. The x-axis is the absolute size of the scatters (nm). ...........79
Figure D.6 – Histogram showing the size distribution of an IgG solution in PBS after 9 hours of
incubation at pH 11.3 for the concentrations of (A) 1 g/L (B) 15 g/L. The y-axis is the intensity of the
average scattered light (%) – Size distribution by Intensity - or total volume of particles in the different
size bins (%) – Size Distribution by Volume. The x-axis is the absolute size of the scatters (nm). ...........80
Figure D.7 – Histogram showing the size distribution of an IgG solution (1 g/L) in row (A) PBS at room
temperature; row (B) PBS after 8 hours of incubation at 70°C; row (C) PBS with 10% (w/v) of maltose
after 8 hours of incubation at 70°C. The y-axis is the intensity of the average scattered light (%) – Size
distribution by Intensity - or total volume of particles in the different size bins (%) – Size Distribution by
Volume. The x-axis is the absolute size of the scatters (nm). ...................................................................81
Figure D.8 – Histogram showing the size distribution of an IgG solution (15 g/L) in row (A) PBS at room
temperature; row (B) PBS after 8 hours of incubation at 70°C; row (C) PBS with 10% (w/v) of maltose
after 8 hours of incubation at 70°C. The y-axis is the intensity of the average scattered light (%) – Size
distribution by Intensity - or total volume of particles in the different size bins (%) – Size Distribution by
Volume. The x-axis is the absolute size of the scatters (nm). ...................................................................82
Figure D.9 – Histogram showing the size distribution of an IgG solution in PBS after 0.5 hours of
incubation at 70°C for the concentrations of (A) 1 g/L (B) 15 g/L. The y-axis is the intensity of the
average scattered light (%) – Size distribution by Intensity - or total volume of particles in the different
size bins (%) – Size Distribution by Volume. The x-axis is the absolute size of the scatters (nm). ...........83
Figure D.10 – Histogram showing the size distribution of an IgG solution in PBS with 10% (w/v) of
maltose after 0.5 hours of incubation at 70°C for the concentrations of (A) 1 g/L (B) 15 g/L. The y-axis is
the intensity of the average scattered light (%) – Size distribution by Intensity - or total volume of
particles in the different size bins (%) – Size Distribution by Volume. The x-axis is the absolute size of
the scatters (nm). ......................................................................................................................................84
Figure D.11 – Histogram showing the size distribution of an IgG solution in PBS after 1 hour of
incubation at 70°C for the concentrations of (A) 1 g/L (B) 15 g/L. The y-axis is the intensity of the
average scattered light (%) – Size distribution by Intensity - or total volume of particles in the different
size bins (%) – Size Distribution by Volume. The x-axis is the absolute size of the scatters (nm). ...........85

xiv
Figure D.12 – Histogram showing the size distribution of an IgG solution in PBS with 10% (w/v) of
maltose after 1 hour of incubation at 70°C for the concentrations of (A) 1 g/L (B) 15 g/L. The y-axis is
the intensity of the average scattered light (%) – Size distribution by Intensity - or total volume of
particles in the different size bins (%) – Size Distribution by Volume. The x-axis is the absolute size of
the scatters (nm). ..................................................................................................................................... 86
Figure D.13 – Histogram showing the size distribution of an IgG solution in PBS after 5 hours of
incubation at 70°C for the concentrations of (A) 1 g/L (B) 15 g/L. The y-axis is the intensity of the
average scattered light (%) – Size distribution by Intensity - or total volume of particles in the different
size bins (%) – Size Distribution by Volume. The x-axis is the absolute size of the scatters (nm). ........... 87
Figure D.14 – Histogram showing the size distribution of an IgG solution in PBS with 10% (w/v) of
maltose after 5 hours of incubation at 70°C for the concentrations of (A) 1 g/L (B) 15 g/L. The y-axis is
the intensity of the average scattered light (%) – Size distribution by Intensity - or total volume of
particles in the different size bins (%) – Size Distribution by Volume. The x-axis is the absolute size of
the scatters (nm). ..................................................................................................................................... 88
Figure D.15 – Histogram showing the size distribution of an IgG solution in PBS after 6 hours of
incubation at 70°C for the concentrations of (A) 1 g/L (B) 15 g/L. The y-axis is the intensity of the
average scattered light (%) – Size distribution by Intensity - or total volume of particles in the different
size bins (%) – Size Distribution by Volume. The x-axis is the absolute size of the scatters (nm). ........... 89
Figure D.16 – Histogram showing the size distribution of an IgG solution in PBS with 10% (w/v) of
maltose after 6 hours of incubation at 70°C for the concentrations of (A) 1 g/L (B) 15 g/L. The y-axis is
the intensity of the average scattered light (%) – Size distribution by Intensity - or total volume of
particles in the different size bins (%) – Size Distribution by Volume. The x-axis is the absolute size of
the scatters (nm). ..................................................................................................................................... 90
Figure D.17 – Histogram showing the size distribution of an IgG solution in PBS after 7 hours of
incubation at 70°C for the concentrations of (A) 1 g/L (B) 15 g/L. The y-axis is the intensity of the
average scattered light (%) – Size distribution by Intensity - or total volume of particles in the different
size bins (%) – Size Distribution by Volume. The x-axis is the absolute size of the scatters (nm). ........... 91
Figure D.18 – Histogram showing the size distribution of an IgG solution in PBS with 10% (w/v) of
maltose after 7 hours of incubation at 70°C for the concentrations of (A) 1 g/L (B) 15 g/L. The y-axis is
the intensity of the average scattered light (%) – Size distribution by Intensity - or total volume of
particles in the different size bins (%) – Size Distribution by Volume. The x-axis is the absolute size of
the scatters (nm). ..................................................................................................................................... 92

xv
LIST OF TABLES
Table 2.1 – Monoclonal Antibodies currently in the market – generic name, molecule type, marketing
company and approval status (11). ............................................................................................................. 8
Table 3.1 – Specifications of the chemical compounds used....................................................................26
Table 4.1 – Taylor number, shear rate (s-1) and shear stress (Pa) imposed on the IgG molecules during
the mechanical shear stress assay for the different angular speeds of the inner cylinder tested. ..........41
Table A.1 – Physicochemical properties (Relative Molecular Weigth of the molecule and the heavy
chain and Isoelectric point) of the several subclasses of Human IgG (2). .................................................63
Table A.2 – Binding and elution conditions commonly used with Protein A for Human IgG purification
(values for each subclass) (2). ...................................................................................................................63
Table A.3 – Data used in the calculations of the average and maximum shear rate and wall shear stress
at the membrane surface. Dimensions of the rotary separation chamber: inner and outter cylinder
radius (cm) an anular gap (mm) (22) and water cinematic viscosity at 20°C (45). ...................................63

xvi
LIST OF ABREVIATIONS
IgG – Immunoglobulin G
mAb – Monoclonal Antibody
CD – Circular Dichroism
DLS – Dynamic Light Scattering
PBS – Phosphate Buffer Saline
pI – Isoelectric point
CCSD – Concentric-cylinder Shear Device

1
INTRODUCTION
1.1 BACKGROUND
Therapies with biotechnology-derived products have been increasing steadily over the past years.
Antibodies, in particular, are widely used as convenient and valuable tools not only for therapy
purposes but as well as for immunochemical and biochemical analyses. Progress in monoclonal
antibody technology has led to the production of substantial amounts of highly specific monoclonal
antibodies (mAbs) (1). In fact, mAbs are the fastest growing class of biopharmaceuticals (2) with over
25 mAbs already approved for several diseases.
A common problem associated with these therapeutic proteins is that many of those proteins are
required in high doses, administered as part of high-dosing regimens (3), which makes necessary to
ensure stabilization of the active-product, not only during production and purification, but also during
storage. This constraint imposes the need to find proper formulations for those biopharmaceuticals,
which can be a challenge on its own. The successful formulation of proteins depends on a thorough
understanding of their physico-chemical and biological characteristics since the therapeutic activity of
proteins is highly dependent on their conformational structure. The protein conformational structure is
flexible and sensitive to external conditions (3). It is, therefore, essential to study, not only which
factors can cause disruption of the protein stability, but also to test different formulations in order to
identify which type of compounds may be relevant to the active-product stabilization and that may,
consequently, be added to the formulations to achieve that purpose.
1.2 OBJECTIVES
The main objective of the work developed in this thesis was to assess the stability of different
formulations of human therapeutic antibodies against temperature induced denaturation, pH induced
denaturation and mechanical shear stress. The goal was to identify which of the additives commonly
present in commercialized formulations of human therapeutic antibodies lead to higher antibody
stabilization.

2
1.3 OUTLINE
In order to assess the stability provided by preservatives added to the antibody formulations in the
market, several experiments were conducted with the purpose of evaluating the resistance to thermal
and pH denaturation as well as to mechanical shear stress.
The work conducted in this thesis is divided in three major parts: first the stability of the antibody
was tested against the three factors under analysis without the presence of any additive; then, and
based on the results obtained on the first part of the process, the stabilization potential of each
additive was evaluated and finally, aggregation studies were conducted for different conditions of
temperature and pH.

3
2 LITERATURE REVIEW
2.1 MONOCLONAL ANTIBODIES
Antibodies are key elements in the immune response in which they exert two main functions: At a
first level they are responsible to recognise and bind any foreign material (antigen) which is achieved
by the binding to molecular structures at the surface of the antigen – antigen determinants; A second
plane of action involves the binding of the so called effector molecules to the antibody-coated antigen,
thus triggering a serious of complex elimination mechanisms. The first task requires a great diversity of
antibodies in order to bind to each antigen while the second task imposes the need of those antibodies
to share some common features. These conflicting requirements are met by the antibody structure (4).
There is a basic configuration common to all immunoglobulin monomers consisting in two light
chains (L) and two heavy chains (H) (5). The two identical heavy chains span both the Fab and Fc
fragments while light chains are associated only with the Fab fragment (4). There are two types of light
chains, namely lambda (λ) and kappa (κ), being that, in humans, kappa chains are more prevalent than
lambda chains. Regarding the heavy chains, there are five main variants, namely: μ, γ, α, ε and δ, each
corresponding to one of the Immunoglobulin classes – IgM, IgG, IgA, IgE and IgD, respectively (5). The
heavy chains can be, furthermore, grouped into different forms or subclasses – these depending on the
species in evaluation. Since the focus of the study conducted in this thesis is on IgG, this particular class
will be addressed with further detail. Regarding the subclasses of the IgG molecule in humans, there
are four types with the heavy chains γ1, γ2, γ3 and γ4 which give rise to IgG1, IgG2, IgG3 and IgG4
subclasses, respectively.
The IgG molecule is organized into 12 homologous regions or domains, each one with a length of
approximately 110 amino acids. Each light chain consists in two domains: a variable (VL) and a constant
domain (CL). On the other hand, the heavy chain is constituted by four domains, three of which are
constant (CH1, CH2 and CH3) and only one variable (VH) (Figure 2.1). Disulfide bonds link the light chains to
the heavy chains as well as the two heavy chains to each other. Note that each domain possesses an
additional disulfide bond.

4
Figure 2.1 – IgG representation showing the light and heavy chains as well as the constant and variable regions.
Adapted from (6).
The three dimensional structure of the IgG molecule adopts a Y-shaped conformation, as illustrated
by Figure 2.1. It can be divided into three units, two of which are involved in antigen binding – Fab
(fragment antigen binding) and one involved with the binding to the effector molecules – Fc (fraction
crystallisable, since it crystallizes readily) (Figure 2.2). The shortest arms, each formed by four domains
(VL, CL, VH and CH1), contain the Fab fragments forming the antigen binding site (ABS). Note that, since
both the light chains have identical amino acid sequences, as well as the two heavy chains, each
immunoglobulin monomer has two abs. The Fc fragment corresponds to the stem of the ‘Y’ and is
formed by the constant domains of the heavy chains, CH2 and CH3. The Fab arms are linked to the Fc by
an extended polypeptide chain – hinge (which tends to be exposed and is sensitive to the attack of
proteases that cleave the molecule into its two functional groups) – being both the Fab and Fc
fragments roughly in the same plane.
In addition, all domains (except CH2) are in close lateral or in ‘sideways’ association with another
domain – the so called phenomenon of domain pairing. The CH2 domains have two sugar chains
interposed between them and exhibit as well a weak cis-interactions with the neighbour domains on
the same polypeptide chain.
Comparative studies of the sequence of several monoclonal IgG proteins indicate that the C-
terminal half of the light chain and approximately ¾ of the heavy chain (also C-terminal) show very
little sequence variation between IgG molecules, quite the opposite of the N-terminal of roughly 100
amino acid residues that showed considerable sequence variability in both the light and the heavy
chains. Comprised within these variable regions there are short sequences of extreme sequence

5
variability called hypervariable regions. These hypervariable regions are most likely associated with
the recognition of the diverse antigens – for that reason they are often called CDRs (complementary
determinant regions) (Figure 2.2). Three of those regions are located in the light chain while the fourth
is located in the heavy chain.
Figure 2.2 – Representation of IgG’s structure highlighting its several domains, as well as the Fab and Fc
fragments. The secondary structure of the Fab fragment is reptresented in detail (7). The Fv fragment
corresponds to an unstable fragment able to bind to an antigen with two V regions, VL and VH (2).
IgG molecule is very flexible and so, it can adopt many different conformations. This property may
help to achieve a better performance of its functions: Fab-Fab flexibility may provide a ‘wider range’ of
action, this meaning that the antibody may interact with determinants with different spacings; Fc-Fab
flexibility may help the antibody in different environments with the interaction with common effector
molecules.
Regarding the domains structure, each domain possesses a common pattern of polypeptide chain
folding, which consists in two β-sheets surrounding an internal volume of highly tight hydrophobic
residues (Figure 2.3). This arrangement is stabilized by an internal disulfide bond connecting the two β-
sheets in a central position. Both sheets are constituted by anti-parallel β-strands (one with three, the
other with four). These strands (also termed framework regions) are joined by bends or ‘loops’ that, in
general, show little secondary structure. The residues involved in the β-sheets tend to be quite
conserved, on the contraire of what happens with the residues in the ‘loops’ where there is a greater
diversity. It is important to note that the β-sheets of a variable domain are more distorted that those
from a constant domain. Furthermore, the variable domain possesses an extra ‘loop’.
Accounting the Fab fragment structure, the four individual domains are grouped in two different
ways. The VL and VH domains are paired trough the two respective three-strand- β-sheet layers while

6
the CH1 and CL domains are grouped trough the two four-strand- β-sheet layers. The interacting faces of
the domains are essentially hydrophobic and, consequently, the driving force for domain pairing is the
removal of those residues from aqueous environment. Further stabilization of the arrangement occurs
by a disulfide bond between the CH1 and the CL domains. The cis-interactions between CH1 and VH
domains and VL and CL domains are very limited thus allowing ‘elbow bending’.
For the Fc fragment the two CH3 domains are paired while the CH2 domains show no close
interaction. Still, they have interposed between them two branched N-linked carbohydrate chains that
have limited contact with each other. The CH2 domains contain the binding site for several important
effector molecules (4).
Figure 2.3 – Representation of IgG’s secondary structure, evidencing the high content of β-sheets (8).
Regarding Human IgG’s physicochemical properties, IgG presents a relative molecular weight (Mr)
that varies within the interval 150 000 - 160 000 Da. The Isoelectric point (pI) is comprised between 4
and 9, being in most cases higher than 6.0 (often more basic than other serum proteins). The
hydrophobicity of the IgG molecule is higher than most other proteins and so, precipitation occurs
more readily in ammonium sulphate for IgG than for other proteins. IgG is very soluble in aqueous
buffers but low near pI or in very low salt concentrations (depending on the antibody) (2). Specific
values for the several subclasses of human IgG can be consulted with further detail in Table A.1
(Appendix A).

7
2.2 MABS’ HISTORICAL AND ECONOMICAL BACKGROUND
Monoclonal antibodies (MAbs) are highly specific antibodies produced from single B-cell. The
high specificity of a monoclonal antibody is a significant advantage, particularly in therapeutic
applications (2).
The production of murine monoclonal antibodies (mAbs) was first reported in 1975. Initially,
they were derived from a murine hybridoma cell line (9). These hybridoma cells were created by
isolation of plasma cell precursors (B-cells) which were then fused with immortal cells (myeloma cells).
After combination and expansion, these hybridoma cells secrete only one antibody type, a murine mAb
(2). By 1980, mAbs were already being tested in humans (10). However, murine mAbs presented
several problems such as short serum half-life, weak immune response recruitment, development of
human anti-mouse antibody immunogenic response (HAMA response), the possibility of a fatal allergic
reaction, the loss of efficacy and function after small epitopic changes seen mostly in highly mutagenic
viruses often leading to drug resistance, and the need for repeated and higher doses of the antibody,
particularly in chronic disorders increasing the risk of side effects (11). Although Chimeric mAbs (fusion
of murine variable domains with human constant domains) – first reported in 1984 (10) - solved the
problem of interaction with the human immune system, the human anti-chimeric antibody response
still constituted a problem (11). Humanized mAbs, firstly reported in 1986, were developed to address
the remaining problems associated with chimeric mAbs (10). Approximately 85–90% human, these
humanized murine antibodies are less immunogenic than chimeric antibodies and have either limited
or eliminated the serious immune reactions that often occur in some patients (11). Currently, there are
several mAbs in the market, some of which are entirely human – in fact, the first fully human antibody
was only approved by the FDA in 2002 (9).
Table 2.1 shows some of those commercialized mAbs, specifying their type, marketing company and
approval status by the FDA and EMEA.

8
Table 2.1 – Monoclonal Antibodies currently in the market – generic name, molecule type, marketing company
and approval status (11).
Currently mAbs represent one of the successes of the biotechnology industry having a significant
impact on the market both due to their sales volume and their vast applications. In 2010, the sales
volume of mAbs exceeded 40 billion US Dollars and is expected to reach at least 70 billion US Dollars by
2015. The majority of the approved antibodies are targeting cancer and autoimmune diseases with the
top 5 grossing antibodies populating these two areas. In addition, over 100 monoclonal antibodies are
in Phase II and III of clinical development and numerous others are in various pre-clinical and safety
studies (9).

9
2.3 STABILITY REQUIREMENTS
According to the FDA (Food and Drug Administration), the product stability should meet the
requirements imposed by a previously developed clinical protocol. FDA states that product evaluation
should follow a stability program that includes tests for the physic-chemical integrity (fragmentation
and aggregation), potency, sterility, as well as, moisture, pH and preservative stability, at regular
intervals during the dating period. The FDA also requires the need of stability tests that assure the
biological activity, which should include a manufacturer’s in-house reference standard. Whenever
possible, a single lot of test antigen should be used throughout the study. A quantitative potency assay
should also be conducted in order to allow a meaningful comparison of activities. Finally, FDA requires
accelerated stability tests, i.e., stability testing after storage at temperatures higher than the normal
temperatures of storage. That can help to identify and to establish which tests are indicators of
stability. Specific parameters that are stability indicators should be monitored in all the lots of the
stability test program. Data from the accelerated stability tests can be used as support but should not
replace real-time data for product approval (12).
EMEA (European Medicines Agency) imposes the requirement to perform tests that help
determining and finding the optimal formulations to avoid the development of visible particulates
during storage. These visible particulates are the result of the natural tendency of immunoglobulins to
form aggregates, especially when in high concentration, which is common for several drugs since such
high concentrations of immunoglobulin are often needed to reach the intended therapeutic effect (13).
Antibody formulations may be aggregate-free after the last polishing step but that doesn’t imply that
aggregates won’t form during storage. In fact, protein aggregation is encountered routinely during
purification, refolding, sterilization, shipping and storage processes due to the existence of chemical
and physical stresses. Both native and denatured proteins may aggregate: aggregation of denatured
proteins is extremely common while aggregation of native proteins is most common upon long periods
of storage (it may also occur during freeze drying). Aggregation is undesirable because it causes a
decrease in the drug efficacy (14); in fact, irreversible aggregation has a direct impact on drug potency,
immunogenicity and on the unfolded protein response. Reversible aggregation may also lead to
problems during drug administration if the dissociation is slow on the physiological time scale (3). For
those reasons, aggregation levels even as low as 1% over a 2-year shelf life can cause a product to be
clinically unacceptable (14).

10
2.4 PUBLISHED STUDIES
Several studies have been conducted over the last years in order to assess the stability of IgG alone
as well as the influence of numerous factors that might contribute either to increase the stability of IgG
or to induce its degradation. The subsequent paragraphs present a brief description of some studies
conducted on this matter as well as of the information derived from them.
In 1995, Alexander and Hughes monitored the thermal stability and degradation of an internalizing
chimeric (human/mouse) monoclonal antibody (BR96) using capillary electrophoresis and MALDI-MS.
After 166 h of thermal stress at 60°C, the percentage of ionization by MALTI-MS carried by the intact
antibody molecular ions had clearly decreased, while that due to additional ion species had
significantly increased. These additional ion species correspond to fragments without one light chain,
without a Fab arm and to the formation of separated heavy-chain and light-chain moieties. Several of
these fragments resulted from simple disulfide linkage disruption. In addition, species less in mass than
common antibody subunits were also observed, demonstrating peptide as well as disulfide bond
cleavage. The observation that a small number of well-defined species were formed during the study
suggests that the cleavage induced by thermal stress is very site-specific within the IgG (15).
In 1998, Vermeer et al. studied the structural changes of IgG (a monoclonal mouse immunoglobulin
G from isotype 1) induced by heat treatment and by adsorption onto a hydrophobic Teflon surface.
Using differential scanning calorimetry and circular dichroism measurements it was shown that heat-
induced denaturation doesn’t lead to complete unfolding into an extended polypeptide chain, but
leaves a significant part of the IgG molecule in a globular or corpuscular form. It was verified that
heating dissolved IgG causes a decrease of the fractions of β-sheet and β-turn conformations, whereas
those of random coil and, to a lesser extent, α-helix increased (1).
Later, in 2000, the denaturation of IgG (a monoclonal mouse anti-rat antibody of isotype 2b) was
studied by the same group using different calorimetric methods (differential scanning calorimetry and
isothermal calorimetry) and by circular dichroism spectroscopy. The thermogram of the
immunoglobulin showed two main transitions that are a superimposition of distinct denaturation
steps. The transitions were independent and the unfolding was followed by an irreversible aggregation
step. Each transition has different sensibility to changes in temperature and pH: the Fab fragment is
most sensitive to heat treatment while the Fc fragment is most sensitive to decreasing pH. The
denaturation mode also affects the structure of the aggregates formed. It was also shown that below
the unfolding temperature, the denaturation rate is controlled by the unfolding step whereas at higher
temperatures (where a relatively high concentration of partially unfolded IgG molecules is present),
the rate of aggregation is so fast that the molecules become trapped in the aggregates before being

11
fully denatured. The CD spectra revealed a strong correlation between the changes in the secondary
structure and the denaturation transitions observed by calorimetry. After heat and pH-induced
denaturation, it was observed that a significant fraction of the secondary structure remained (16).
In the same year, this group also studied the effect of low molecular weight surfactants on the
thermal stability of immunoglobulin G (monoclonal mouse anti-rat antibody of isotype 2b) by
differential scanning calorimetry, being the corresponding change in the secondary structure
investigated using circular dichroism spectroscopy. The rate of aggregate formation, both in the
presence and absence of surfactant, was also monitored by dynamic light scattering. At low surfactant
concentrations (SDS:Tween 20 mixture) the thermal stability of the protein was not affected. With
increasing surfactant concentration the protein structure was perturbed, most probably due to
hydrophobic interaction with the surfactant, leading to a lower thermal stability. At even higher
concentrations, the surfactant molecules encapsulated the protein molecules, so that the unfolded
state was strongly suppressed due to restricted conformational freedom in a confined volume.
Interaction with the surfactant mixture at intermediate concentration showed a strong influence in the
secondary structure of IgG: α-helix and random coil conformations were promoted and the percentage
of β-sheets and β-turns was reduced (17).
Conformation, acid-induced conformational changes and stability of the murine monoclonal
antibody CB4-1 and its Fab and Fc fragments, were analysed by circular dichroism, fluorescence, and
differential scanning calorimetry measurements by Wefle et al. (1999). It was shown that lowering the
pH to 3.5, reduces the stability but does not change the conformation of the CB4-1 antibody. At pH
values between 3.5 and 2.0, conformational changes and the formation of new structures were
observed. Deconvolution of the bimodal DSC curves of the CB4-1 antibody revealed five `two-state'
transitions at pH 7.5. At pH 5 and below, only four transitions were found. Half transition
temperatures, Tm, and molar enthalpy changes, ΔHm, gradually decreased at pH 4 and 3.4. At pH 2.1,
two low-temperature and two high-temperature transitions were identified. The Fab and Fc fragments
behaved similarly. Deconvolution of their monophasic DSC curves yielded two `two-state' transitions
for each fragment. Tm and ΔHm values gradually decrease at pH 4.0 and 3.4; and at pH 2.1 and 2.8 for
Fab and Fc, respectively, one of the transitions was found at high temperature (18).
In 2004, Bermudez and Forciniti monitored the denaturation and aggregation of human polyclonal
IgG by aqueous two-phase partitioning, capillary electrophoresis and dynamic light scattering. The
denaturant agent used was urea, added in various concentrations. In the absence of urea, the size
obtained for native IgG was 10.9 nm, being also present a small fraction (≈1%) of dimmers and large
aggregates in the commercial IgG sample. Upon a concentration of 8M of urea, it was verified an
increase in the monomer size to 13.9 nm in an unfolded state. It was also observed that the larger the

12
extension of denaturation, the higher the number of dimmers and monomers present (because
although there is an increased aggregation, breakage of the larger aggregates had occured) (14).
The effect of solvent environment on the conformation and stability of human polyclonal IgG in
solution was evaluated in 2005 by Szenci et al. using different techniques. It was observed that the
conformational stability decreases with decreasing pH while the resistance to aggregation increases.
The optimum pH range determined for storage was 5.0-6.0, being a compromise between
conformational stability and the tendency for oligomerization. Regarding the thermal stability of IgG, it
was shown that additives in physiologically acceptable concentrations exert no influence. In contrast,
glucose or sorbitol, in concentrations as low as 1%, had a significant effect on the tertiary structures.
On its turn, 0.3% leucine, even though it didn’t increase the conformational stability, caused a decrease
in the tendency for aggregation more effectively than 1% glucose or sorbitol. Regarding the
temperature effect, it was observed an increase in the dimmer content upon storage at 5°C which was
partially reverted upon incubation at 37°C. It was also suggested that storage at temperatures higher
than 5°C may help to maintain the optimal proportion of dimmers (19).
Liu et al. (2006) characterized the stability of a fully human monoclonal IgG after 6 months
incubation at 40°C employing mass spectrometry and chromatography analyses. It was found that
deamidation, fragmentation and N-terminal glutamate cyclization to form pyroglutamate were the
major degradation pathways. Three major deamidation sites were identified and one site in a small
tryptic peptide accounted for more than 80% of the total. Peptide cleavage was observed at several
positions between different pairs of aminoacids. Most of the cleavage sites were located in the hinge
or other flexible regions of the IgG molecule (20).
Recently, in 2011, Kanmert et al. studied the thermal induction of an alternative folded state in
human IgG-Fc. It was reported the formation of a non-native, folded state of the Fc fragment of human
IgG4 (IgG4-Fc) induced by a high temperature at neutral pH and at a physiological salt concentration.
The obtained structure was similar to the molten globule state in that it displays a high degree of
secondary structure content and surface-exposed hydrophobic residues. However, it was highly
resistant to chemical denaturation. The thermally induced state of human IgG4-Fc was thus associated
with typical properties of the so-called alternatively folded state previously described for murine IgG,
Fab fragments, and individual antibody domains (VL, VH, CH1, and CH3) under acidic conditions in the
presence of anions. It was suggested that, like some of these molecules, human IgG4-Fc in its
alternative fold exists as a mixture of different oligomeric structures, dominated by an equilibrium
between monomeric and heptameric species. Further heating induced the formation of fibrous
structures in the micrometer range (21).

13
2.5 DENATURATION CAUSED BY SHEAR STRESS
The stability of a protein can be affected by both chemical and physical stress, which can ultimately
cause a protein to unfold. Among the physical stresses, the effects of temperature, shear stress and
pressure are relatively well characterized, and plenty of examples can be found in literature. Some
chemical stresses that are also known to induce changes in the structure of proteins include pH, metal
ions, chaeotropic salts, detergents, preservatives, and organic solvents.
Loss of stability induced by shear stress can be observed during routine protein processing or
handling, including pumping, mixing, stirring, membrane filtration, filling, and transportation. In this
thesis, a vorticular flow membrane module was used to induce shear forces on the antibody molecule.
2.5.1 Vorticular Flow Membrane Modules
Vorticular flow membrane modules are highly efficient separation systems which can provide fast,
reproducible separations of fermentation broths, cell culture supernatants, cell homogenates, column
fractions, tissue extracts and a wide variety of simple or complex solutions of proteins and other
biopolymers (22).
Rotating filters are currently used for several separations. They offer the unique advantage of a
greatly reduced plugging of the pores of the filter with particles when compared with standard
filtration techniques, which are severely limited by membrane fouling (23). Other advantages of these
systems are the possibility to obtain high fluxes at high values of transmembrane pressure and a
favourable effect on membrane selectivity. However, the complexity and limitations in membrane area
for some systems contribute to raise the equipment cost (24).
To perform the experiments conducted in this thesis the vorticular flow filtration system was
modified by removing the filter cartridge to leave the inner cylinder as a solid rod. The resulting system
– CCSD (concentric-cylinder shear device) – consisted of an electronic control unit and a closed rotary
separation unit.
The rotary separation unit consists of an inner cylinder rotating within a stationary outer concentric
cylindrical shell. The flow field is best described as supercritical Couette flow in an annulus with a
superimposed axial flow (23). Couette type systems, with an inner cylinder rotating inside a concentric
one, generate toroidal instabilities called Taylor vortices (24). In the presence of an axial velocity
component the Taylor vortices start moving helically along the rotor (25).
The rotation of the inner cylinder creates a centrifugal field that is maximum near the rotating inner
cylinder and decreases to zero at the stationary outer cylinder. This centrifugal field creates a net radial

14
force on non-neutrally buoyant particles. At the same time the Taylor vortices carry particles from near
the inner cylinder to near the outer cylinder and vice versa. The axial flow, on its turn, carries particles
along the length of the rotating cylinder annulus. Figure 2.4 illustrates the CCSD components, showing
the flow regimen and Taylor vortices in detail.
Figure 2.4 – Schematic drawing of a CCSD, showing Taylor vortices (26).
A concerning issue comprised by this system is related to the high shear forces generated by the
Taylor vortices, that may be adverse regarding some components of the solution circulating in the
system. For instance, they may be responsible for animal cells membrane damage, degradation or
structure alteration of proteins resulting in possible changes or loss of function, etc. (23).
The flow regimen in the annulus between the rotating inner cylinder and the stationary outer
cylinder is governed by the Taylor Number, Ta (dimensionless):
where ω denotes the angular speed, Ri the inner cylinder radius, e the annular gap and ν the
kinematic viscosity (26). Couette type systems generate Taylor vortices that appear when the Taylor
number exceeds 42 (24). For 42<Ta<800 laminar flow with vortices occurs in the system, for 800 < Ta <
2000, transitional vortex flow occurs and 2000 < Ta < 10000-15000 turbulent flow with vortexes
dominate flow (27). By measuring the torque exerted on the inner cylinder, Taylor proposed an
√
(2.1)

15
equation for the maximum shear rate (occurring at the wall of the inner rotating cylinder), γm (s-1), in
the inner cylinder that includes both laminar and turbulent regimens (24).
Knowing that shear rate, γm, is defined as
it should be possible to estimate the shear stress at the wall of the inner cylinder, τm, at which the
proteins are subjected if the viscosity, μ, is known (28).
2.6 STABILITY ASSESSMENT
There are different techniques that can be used to monitor and evaluate the stability of proteins. Some
of these techniques, including affinity chromatography, circular dichroism and dynamic light scattering
will be reviewed in this section.
2.6.1 Affinity Chromatography
Affinity Chromatography is a convenient method of isolation and purification of biological
molecules. The molecule to purify is passed through a column containing a chromatographic matrix -
an insoluble polymer or gel, chemical and physically inert- to which a specific ligand is covalently
bound. The separation thus occur based on the degree of affinity of the molecule towards that specific
ligand: molecules with no affinity pass through without being retained whereas molecules with affinity
for the ligand will bind and be retained (29). This technique is unique since it is the only technique that
enables the separation of biomolecules based on its biological function or its structural characteristics.
Affinity Chromatography has many wide ranging applications: it can be used to separate active
biomolecules from denatured or functionally different molecules, to isolate pure substances with a
very low concentration in a large crude sample or to remove specific contaminants thus contributing to
enhance the degree of purity of the biomolecule of interest. It offers high selectivity, hence high
resolution and usually high capacity for proteins of interest.
As previously stated, successful affinity purification requires a biospecific ligand capable of being
coupled in an active with a solid chromatographic matrix. In addition, the ligand/target complex must
⁄
(2.2)
(2.3)

16
be readily dissociated under certain specified conditions in order to release the target molecule in an
active form. In other words, the ligand should bind to the target molecule as strongly as to allow
efficient binding but no so strongly that it inhibits the target molecule of being eluted, this meaning
that the binding should be reversible.
The elution scheme is variable according to the system and may be selective or non-selective
applied in combination with group-specific ligands and highly specific ligands, respectively. Elution of
the target molecule can be achieved either by a change in the buffer composition, extreme conditions
of pH or concentrations of chaotropic agents or even with specific elution that consists in adding a
substance that competes for binding (30).
Regarding the purification of monoclonal IgG by affinity chromatography, the basis for such
separation is its high affinity for Protein A and/or Protein G. These proteins, both from bacterial origin,
create extremely useful and easy to wear media for IgG purification. Protein A is derived from a strain
of Staphylococcus aureus and is covalently bound to the peptidoglycan of the cell wall (31). It consists
of a single polypeptide chain in the form of a cylinder and contains five highly homologous antibody-
binding domains. The binding site for Protein A is located on the Fc fragment of IgG and it occurs
trough an induced hydrophobic fit. At the centre of the Fc binding site and on Protein A resides
histidine residues that are uncharged and hydrophobic at alkaline pH thus strengthening the
interaction between Protein A and the antibody. As the pH shifts to acidic values the histidine residues
become charged and repel each other, allowing the elution of the antibody (32). One molecule of
protein A can bind at least two molecules of IgG (30).
Protein A is suitable for the use in purification of antibodies because, besides being well
characterized and widely available, it has a dissociation constant of 10-7, which reflects its affinity to
the Fc region of IgG. Protein A is also stable in a wide range of pH (pH 2-11) (33). Typically, the elution
pH when using Protein A is approximately 3. Further details on the usual binding and elution conditions
commonly used for IgG purification with Protein A may be consulted in Table A.2 (Appendix A).
Protein G is a cell surface protein from Group G streptococci. The binding mechanism is a non-
immune mechanism. Like protein A, protein G binds specifically to the Fc region of IgG (it is a type III
Fc-receptor). However, it binds more strongly to several polyclonal IgGs and to human IgG. In fact,
protein G is a better choice for the general purpose of capturing antibodies since it binds a broader
range of IgG from eukaryotic species and more classes of IgG. Under standard buffer conditions,
protein G binds to all human subclasses and all mouse IgG subclasses, including mouse IgG1. Protein G
also binds rat IgG2a and IgG2b, which either bind weakly or do not bind at all to Protein A.
Furthermore, it exhibits minimal binding to albumin which results in cleaner preparations and greater
yields (2).

17
As both Protein G and Protein A bind to the Fc region of immunoglobulins, it can be used to probe
whether the Fc region maintains its structural conformation. This type of affinity chromatography is
not a measure of the antibody biological activity, as this is defined by the Fab fragment, but can be an
indication of the folding of the Fc regions, and thus of the all molecule.
2.6.2 Circular Dichroism
Circular Dichroism (CD) is a particularly suitable technique for studies on biological systems. It
explores the differential absorption of right and left circularly polarized light and so, it is uniquely
sensitive to the asymmetry of the system, being ideal to study chiral molecules in solution such as
proteins, polypeptides and nucleic acids (34).
Light, being described as an electromagnetic wave, possesses both an electric and a magnetic field.
These fields oscillate perpendicularly one to the other as well as to the propagation direction. The
polarization of a wave is defined by the orientation in which the electric field (or alternatively the
magnetic field) oscillates.
Linear or plane polarized wave refers to a wave in which the direction the electric vector is
constant, though it can also be the result of two circularly polarized components with the same
amplitude and opposite directions (left and right-handed). On the other hand, in circularly polarized
light, the electric vector rotates along the propagation axis with constant amplitude thus forming a
helix, which describes a circle, at any plane of intersection that is perpendicular to the direction of
propagation. Circularly polarized light will be either left or right-handed, depending whether the
orientation in which the field rotates is to left or to the right, as illustrated in Figure 2.5.
Circularly polarized light can be described as the superimposition of two plane polarized waves with
equal amplitudes oscillating perpendicularly to each other and with a phase difference of π/2 radians. If
the amplitude or the phase shift is different, elliptical polarization will occur instead (35).
Whenever light passes through an optically active molecule, both the left and right circularly
polarized rays will exhibit different velocities (CL≠CR) thus resulting in different wavelengths (λL≠λR) and
extinction coefficients (εL≠εR). Consequently, within the range in which the molecule absorbs,
absorptions will also be different (AL≠AR). The differential absorption (ΔA = AL - AR) or, alternatively, the
difference between the extinction coefficients (Δε = εL - εR) of left and right-handed circularly polarized
light, at a given wavelength, is determined as Circular Dichroism (36).

18
Figure 2.5 – (A) Plane polarized light resolved into two circularly polarized components – left, L, and right, R. As
long as the intensities and phases of the two circularly polarized components remain equal, their resultant will
lie in a plane with oscillating magnitude. (B) If the right circularly polarized component is less intense (more
absorbed) than the left one, the electric vector of the light follows an elliptical path, thus corresponding to
elliptically polarized light (37).
For the quantification and standardized description of CD there is the need to resort to the Beer-
Lambert-Bourguer law (equation (2.4)). If I0 is the intensity of the incident light on the cell and I the
intensity when the light is leaving the cell, then
In an optically active medium two absorptions of the previous kind can be recorded, one referring
to the left circularly polarized light, AL, and the other to the right circularly polarized light, AR. Note that
the intensities, measured when the light encounters the material, are equal for both the left and right
circularly polarized light.
Alternatively, CD can also be expressed in function of the ellipticity parameter (θ). As previously
stated, elliptical polarization derives from the preferential absorption of one of the circular
components. Ellipticity can be determined by a mathematical expression describing the shape of the
formed ellipse, therefore given by the angle corresponding to the arctangent of the ratio between the
minor and major axis of the ellipse, as shown in equation (2.5), where |E| refers to the magnitude of
the electric field vector.
(2.4)
(| | | |
| | | |) (2.5)

19
The angle involved is usually very small so tan (θ) can be approximated to θ in radians. In addition, if
one considers that the intensity of the light is proportional to the square of the electric field vector and
that, as mentioned above, there’s a dependency of the Absorption with the Intensity according to the
Beer-Lambert-Bourguer law, one can obtain the following equation:
If one expands the terms of the previous equation in a Taylor series, neglecting the terms in order
of ΔA by comparison to the unity, equation (2.7) can be obtained once the angle is converted to
degrees.
In order to normalize the experimental data obtained - this meaning to remove any dependency
with light path or solute concentration – the molar ellipticity is defined as:
where C stands for the solute concentration (M) and l the length path of the light (cm).
Combining the Lambert-Beer-Bourguer law with equation (2.9) it is shown that:
At last, it is important to refer that each of the previously described variables are wavelength
dependent and so, they can be plotted in function of the wavelength in order to obtain the CD
spectrum of the molecule under study.
CD data is usually represented by the mean residue ellipticity that accounts the number of peptide
bonds as well as the molecular weight of the protein – this due to the fact that the peptide bond is the
main chromophore in the Far-UV region of the CD spectrum. The mean residue ellipticity can be
determined according to the following equation (35), (38):
(2.6)
( ) (
) (2.7)
[ ] ( )
(2.8)
[ ] ( ) (2.9)

20
where c is the solute concentration (g/L), mrw the mean residue molecular weight and the remaining
variables have the same meaning as above. The mrw can be determined dividing the protein molecular
weight (Mw) by the number of peptide bonds (number of peptide residues (NA) minus 1).
CD of biomolecules has two major strands: it is used to probe either changes in the conformation of
the molecule or its interactions with small achiral molecules (which by themselves show no intensity in
a CD spectrum).
Proteins have well-defined sequences of amino acids (primary structure) folded in a much defined
way. The overall shape of a protein is crucial to its biological activity. The regular and well defined
secondary structures formed are the result of the peptide link between amino acids (O=C-N-) being
planar and rigid but still allowing a somewhat high degree of free rotation regarding the bonds to the
rest of the protein chain. This constringes the possible relative orientation of the neighbour residues
and allows several intramolecular H-bonding between the C-O of one peptide and the N-H of the other.
Each set of common chiral secondary structural units have a somewhat well defined CD spectrum.
Conversely, CD is very useful to study the structure of proteins.
Regarding protein UV spectroscopy, the UV spectra can be divided into near-UV and far-UV spectra.
Near-UV refers to wavelengths between 250 and 300 nm and it is also described as aromatic region, on
account that these are the transitions that play the major role on the intensity of the CD signal.
However, transitions of disulfide bonds (cystines) also contribute for the absorbance intensity in this
region. The far-UV region refers to wavelengths under 250 nm and is primarily influenced by
transitions on the backbone of the protein chain although transitions in the lateral chains may also
have some contribution (in particular, if the α-helix content is low it may occur erroneous
determinations of the protein structure due to that fact). Empirical analysis of the far-UV CD spectrum
provides information on the secondary structure whereas the near-UV spectrum offers inlet on the
tertiary structure.
The lowest energy transition of the peptide chromophore is n→π*transition (similar to those of
ketones) followed by π→π* transition. The first transition occurs at 210-230 nm and its electric
character is polarized roughly along the lines of the carbonyl bond. The latter, dominated by the
[ ] ( )
( )
( )⇔ [ ]
(2.10)

21
carbonyl π-bond, is also influenced by the involvement of the amide nitrogen in the π-orbitals, being its
electric dipole transition moment polarized along the line between nitrogen and oxygen and centred at
190 nm. For α-helix the previous transition occurs around 208 nm.
All the lateral aromatic chains – phenylalanine, tyrosine and tryptophan - have transitions in the
near-UV region. The tryptophan’s indole has two or more transitions at 240-290 nm (εmax at 279 nm)
while both tyrosine and phenylalanine has only one transition (εmax at 279 nm and 258 nm,
respectively). There is also absorption from a cystine disulfide bond. In crescent order of intensity the
transitions are phenylalanine, cystine, tyrosine and tryptofan. Even though the more intense
transitions in this region correspond to tryptophan, they aren’t necessarily dominant because most
proteins have few tryptophans comparatively to the other aromatic groups.
CD can be used to trace changes in the conformation of proteins and for that it is required the
ability to determine – even if with some degree of inaccuracy – the protein structure. All the pure
conformations have their CD spectrum described. In principle, the CD spectrum of a native protein can
be expressed as a linear combination of the appropriate percentages of each component spectrum.
Nevertheless, relative arrangements of structural units and motifs, such as disulfide bonds, contribute
to the observed spectrum. The individual spectra of each motif, described below, are shown in Figure
2.6.
.
Figure 2.6 – Typical CD spectra for particular secondary structural motifs (α-helix, β-sheet, random coil) used in
CD protein structure fitting programs (39).

22
The α-helix motif is a well defined motif in which the nth peptide unit forms H-bonds between its C-
O and the N-H of the (n+4)th peptide as well as its N-H and the C-O of the (n+4)th peptide. The CD
spectra of α-helices exhibit a negative band with separate maxima with similar magnitude at 222 nm
(n→π* transition) and at 208 nm (π→π* transition). It’s the only motif where the π→π* transition has
such a long wavelength component, being therefore easily identifiable. Its magnitude is the highest of
all the motifs and is variable according to the helix and helix length variations, as well as with
interactions with neighbour structural units.
The β-sheet motif results of an alternative efficient formation of H-bond between parallel or anti-
parallel runs of amino acids. These runs of amino acids face in alternate directions so that alternated
amino acids form H-bonds with neighbour runs of amino acids. The β-sheets spectra are characterized
by a negative band at approximately 216 nm and a positive band of similar magnitude at 195 nm (34).
Furthermore, the intensity of absorption is approximately zero at 206.5 nm, while the other
components have a significant contribution at this wavelength. At this wavelength the ellipticity due to
the fraction of β-turns is positive whereas α-helices and random coil structures give a negative
contribution to the ellipticity (1). Typically the strands of an anti-parallel β-sheet are connected by β-
turns where the nth peptide forms an H-bond with the (n+3)rd peptide unit. The term β-turn also refers
to any turn that might happen in the chain. The characteristics of such spectra include a weak red-
shifted negative band (n→π*) near 225 nm, a strong positive π→π* transition between 200 and 205
nm and a strong negative band between 180 and 190 nm.
The completely denatured state of a protein is referenced as ‘random coil’. The term is also used to
designate sections of the protein that don’t fit the standards of neither of the secondary structural
motifs. In general, the CD spectrum shows only negative contribution, approaching to zero around 230
nm.
In order to determine the secondary structure of complex proteins several algorithms have been
developed. All of them rely on common ground, this is, they are based on five hypotheses which, in
general, are valid. The assumptions on which the construction of those algorithms is based are the
following: (i) the contributions of individual secondary structures are additive; (ii) the ensemble-
averaged solution structure and the time-averaged solid structure are equivalent; (iii) the CD
contributions of non peptide chromophores have no influence on the analysis; (iv) the effect of the
tertiary structure on CD is negligible; (v) effects of the geometric variability of the secondary structure
don’t need to be explicitly considered (36).

23
2.6.3 Dynamic Light Scattering
When light collides on matter, the electric field of light induces an oscillating polarization of the
electrons of the molecules. The molecules act then as secondary sources of light and, subsequently,
radiate (scatter) light. The frequency shifts, angular distribution, polarization and intensity of the
scattered light are determined by the size, shape and molecular interactions of the scattering medium.
As a result, it should be possible to obtain information about the structure and molecular dynamic of
the scattering medium based on its light-scattering characteristics (40).
There are two types of light scattering experiments – classical and dynamic - and both can be used
to characterize proteins. Classical light scattering allows the direct measurement of the molecular
mass, so it is useful to determine whether the native form of a protein is a monomer or an oligomer. It
can also be used to measure the mass of aggregates or of other non-native forms present in solution.
On the other hand, dynamic light scattering (DLS) uses the diffracted light to determine the ratio of
diffusion of protein particles (41).
In a DLS experiment, light from a laser passes through a polarizer that defines the polarization of
the monochromatic beam incident on the scattering medium. The scattered light then passes through
an analyser that selects a given polarization and enters at last in the detector. The detector’s position
defines the scattering angle, θ. The intersection of the incident beam with the beam intercepted by the
detector defines a scattering region of volume V – the region under analysis (40).
The data resulting from DLS experiments is usually processed in order to derive a size distribution to
the sample in study, being the size given by the hydrodynamic radius (alternatively called Stokes
radius) of the protein particles. This hydrodynamic size is dependent on the molecular mass and shape
(conformation) of the protein. DLS is particularly suitable for determine the presence of very small
amounts of aggregates (less than 0.01% by weight) and to study samples with a wide variety of masses.
It can also have great utility when comparing the stability of different formulations – monitoring
inclusively real time changes at high temperatures.
With DLS one measures the time dependency of refracted light of a small region of the solution
over a time range of tenths of microseconds to milliseconds. The fluctuations in the intensity of the
scattered light are related with the diffusion ratio of molecules in and out of the region under analysis
(Brownian motion) (41). In other words, Brownian motion is the random movement of particles due to
the bombardment by the solvent molecules that surround them. The larger the particle, the slower the
Brownian motion will be (42).
The data can be analysed to give directly the diffusion coefficients of the light scattering particles.
When multiple species are present, a distribution of the diffusion coefficients is seen.

24
In general, instead of the data being present in function of the diffusion coefficients, it is processed
in order to give the “size” of the particles (radius or diameter). The correlation between the diffusion
and the particle size is based on the theoretical relationships for the Brownian motion of spherical
particles – the Stokes-Einstein equation.
where d(H) is the hydrodynamic diameter; k, the Boltzmann’s constant; D, the translational diffusion
coefficient; T, the absolute temperature; and η, the viscosity. The translational diffusion coefficient will
depend not only on the size of the particle “core”, but also on any surface structure, as well as the
concentration and type of ions in the medium (42). The particle size can be obtained by different
methods: distribution of size by intensity (amount of scattered light by the particles in the different size
bins), by volume (total volume of the particles is the different size bins) or by number (number of
particles in the different size bins) (43).
The hydrodynamic diameter or the Stokes radius, Rh, derived from this method, corresponds to the
size of a spherical particle that would have a diffusion coefficient equal to the one of the native
protein. The data is usually presented in terms of the fraction of particles in function of their size.
Most proteins are not spherical and, consequently, their hydrodynamic size will depend on both
their molecular mass and conformation. Furthermore, the diffusion is affected by water molecules
bound or entrapped by the protein. Therefore, the hydrodynamic size can significantly differ from the
real physical size of the protein. In addition, it isn’t, as well, a reliable measure of the molecular mass.
Despite that, the hydrodynamic size can be direct and accurately determined by DLS.
DLS is, in theory, capable of distinguish whether a protein is a monomer or dimmer - the radius
would be measurably different. However, it cannot resolve monomers from small oligomers neither
can quantify fractions of small oligomers. Generally, two species must differ on their hydrodynamic
radius in a factor of 2 or higher to be resolved into two separate peaks. That factor of 2 regarding the
radius difference is translated into a factor of 8 with regard to the difference in the molecular mass. As
a result, monomers, dimmers, trimmers up to octamers are resolved in one average peak, giving DLS
less use when it comes to analysing small oligomers.
DLS offers the possibility to study samples directly in their formulation buffers as well as samples
with high protein concentration (at least up to 50 mg/mL, sometimes higher). However, the data
interpretation for samples with higher concentrations – in particular, the hydrodynamic radius – can be
somewhat difficult to interpret due to the non ideality effects of the solution. Nevertheless, as in the
( )
(2.11)

25
data for lower protein concentration, the fact that the sample is not homogeneous and contains large
aggregates is not subject to errors.
Another advantage of DLS is its utility to assess the formation of aggregates over the time and to
directly compare the degradation ratio of different formulations. It is possible to conduct somewhat
fast stability studies by monitoring a single sample in situ or by periodic sampling from samples kept at
high temperature.
The major inconvenient of DLS is that it is frequently difficult to measure accurately the amount of
aggregates that might be present in solution, being, in spite of that, a very good technique for relative
comparison studies (41).

26
3 MATERIALS AND METHODS
3.1 MATERIALS
3.1.1 Biologicals
To replicate the formulations as well as to assess the stability of the antibody without additives, the
therapeutic antibody used was Gammanorm from Octapharma with a nominal concentration of 165
mg/mL of human normal immunoglobulin G. The purity degree is 95%, thus corresponding to an
effective concentration of IgG of 156.8 mg/mL. Several subclasses of IgG are present in the following
proportions: IgG1 59%, IgG2 36%, IgG3 4.9% and IgG4 0.5%. The formulation contains a maximum of
82.5 μg/mL of IgA. The list of excipients includes glycine, sodium chloride, sodium acetate (resulting in
approximately in 2.5 mg of sodium per mL of solution) and water for injection (WFI). The product has a
shelf life of 3 years and should be stored at 2-8°C.
3.1.2 Chemicals
The chemical compounds used throughout this thesis are listed in Table 3.1
Table 3.1 – Specifications of the chemical compounds used.
Substance Chemical Formula Purity Molecular
Weight (Da) Company
Glycine NH2CH2COOH ≥99.0% 77.05 Sigma
D-trehalose dihydrate C12H22O11 · 2H2O ≥99.0% 378.33 Sigma
Maltose monohydrate
crystalline C12H22O11 · H2O - 360.32 Merck
Sucrose C12H22O11 ≥99.5% 342.31 Sigma
L-histidine C6H9N3O2 ≥99.0% 155.15 Sigma - Aldrich

27
3.2 METHODS
3.2.1 Sample Preparation
In order to achieve the initial concentrations of 1, 5, 10 and 15 g/L, samples were prepared by
dilution of the stock solution of IgG. For the experiments without additives the preparation was done
with PBS (10 mM phosphate, 150 mM NaCl, pH ≈ 7.4). For the second set of experiments samples were
prepared with PBS with each additive added individually in concentrations of 10% (w/v) for glycine,
maltose, sucrose and D-trehalose, and of 2% (w/v) for L-histidine due to its lower. For comparison
purposes maltose was also studies at a 2% (w/v) concentration.
3.2.1.1 Stability Assessment of IgG without additives
Temperature Assay I – Incubation at 60°C
The solutions were incubated in a bath at constant temperature of 60°C and 200 μL samples
(duplicates from each tube) were collected every 2 hours for a period of 50 hours. The samples were
diluted 1:5 in PBS and then stored at 4°C until further analysis to assess the irreversible temperature
induced denaturation.
Temperature Assay II – Incubation at 70°C
The incubation took place in a bath at constant temperature of 70°C and 200 μL samples were
collected (from each of the two tubes incubated) every 2 hours up to a total time of 36 hours. The
samples were diluted 5 times by the addition of 800 μL of PBS and then stored at 4°C until further
analysis to assess the irreversible temperature induced denaturation.
pH Assay I – Incubation at pH 3.02
Every 2 hours, 200 μL samples (duplicates from each tube) were collected up to a total time of 50
hours. The samples were diluted 5 times by the addition of 800 μL of PBS (pH 7.4). Samples were kept
at all times at 4°C to eliminate any temperature induced denaturation effect. Preparation of PBS at pH
3.02 was achieved by the addition of HCl until the pH was approximately 3.
pH Assay II – Incubation at pH 2.1
Samples of 200 µL were recovered at time intervals of 1 hour up to a total time of 9 hours. The
samples were diluted 5 times with PBS (pH 7.4) and 5 µL of NaOH 1M were added to restore the pH
back to approximately 7 in order to stop the denaturation process and to allow a representative

28
analysis. Samples were kept at all times at 4°C to eliminate any temperature induced denaturation
effect. PBS at pH 2.1 was prepared by gradual addition of HCl until the solution reached a pH of
approximately 2.
Mechanical Shear Stress Assay
The mechanical shear stress assay was performed in a vorticular flow filtering system, Benchmark
Gx from Membrex (Garfield, N.J., USA) without a filtration membrane. 200 µL samples were collected
at several times of circulation - 0, 2, 5, 10, 20 and 30 minutes - in order to evaluate the resistance of
IgG against mechanical shear stress induced degradation. The samples were diluted 5 times with PBS
stored at all times at 4°C to eliminate any temperature induced denaturation effect.
The recirculation rate of the IgG solutions (100 mL) through the annulus was 116.4 mL/min, with a
corresponding superficial velocity of 0.003 m/s. The recirculation of the solutions was accomplished
with a peristaltic pump (from Watson-Marlow, Massachussets, USA).The operating velocities of the
inner cylinder of the CCDS were 1000, 2000 and 3000 rpm. Two initial concentrations of IgG were
tested: 1 g/L – tested at the three velocities previously mentioned - and 15 g/L – tested only at 3000
rpm.
3.2.1.2 Stability Assessment of IgG with additives
Temperature Assay – Incubation at 70°C
The incubation took place in a bath at constant temperature of 70°C and 200 μL samples were
collected from each tube every 2 hours up to a total time of 8 hours. The samples were diluted up to 5
times with PBS and then stored at 4°C until further analysis to assess the irreversible temperature
induced denaturation.
pH Assay – Incubation at pH 2.1
200 µL samples were recovered at time intervals of 1 hour up to a total time of 9 hours. The
samples were diluted 5 times with PBS and 5 µL of NaOH 1M were added to restore the pH back to
approximately 7 in order to stop the denaturation process and to allow further analysis. Samples were
kept at all times at 4°C to eliminate any temperature induced denaturation effect. The several buffers
used were prepared by gradual addition of HCl until the solution reached a pH of approximately 2.

29
3.2.2 Analytical Methods
3.2.2.1 Protein A and Protein G Affinity Chromatography
The protein quantification was conducted in an Äkta 10 System (GE Healthcare, UK) with an
analytical POROS Protein A Affinity Column and/or an analytical POROS Protein G Affinity Column both
from Applied Biosystems (Foster City, CA, USA). Samples from the initial concentration of IgG of 5 g/L,
10 g/L and 15 g/L were further diluted with PBS to reach approximately the same initial antibody
concentration of 200 mg/L before analysis. IgG adsorption to the column was performed in PBS.
Elution was accomplished with the desorption buffer (12 mM HCl, 150 mM NaCl, pH 2-3). After analysis
the column was re-equilibrated with the storage buffer (10 mM NaH2PO4, 0.02% NaN3, pH ≈ 7.4).
Absorbance was measured at 280 nm and IgG concentration estimated based on a calibration curve
prepared by dilution of a 1 g/L stock solution of IgG.
3.2.2.2 Circular Dichroism
The CD spectra were measured with an Applied Photophysics spectropolarimeter, model PiStar –
180 (Leatherhead, UK). For the far-UV measurements (200-250 nm), a Quartz cuvette (Hellma, USA)
with a light path of 1 mm was used. The antibody concentration in the measured samples was of 100
mg/L. In the glycine and maltose assays at pH 2.1, the IgG concentration had to be reduced to 80 mg/L
due to buffer interference in the spectra. Furthermore, measurements for the glycine and maltose at
pH 2.1 assay were done from 205 to 250 nm. For the L-histidine assay, no CD measurements were
taken due to high buffer interference which prevented obtaining reproducible results.
The CD spectra obtained are the result of the average of 20 scans – except for pH assay I and
temperature assays I and II, in which only 10 scans were retrieved. The monochromator bandwidth
was set to 2 nm and each measurement done with a 1 nm step. A blank was performed with the
corresponding control buffer. A tool from the Pro-Data Analysis software was used to smooth the
curves by a parameter of 10.
The mean residue ellipticity was determined by equation (2.10) using a mean residue weight of
113.16 Da (44).
3.2.2.3 Dynamic Light Scattering
The dynamic light scattering experiments were carried out using a Malvern Zetasizer nano- ZS
(Malvern Instruments Ltd, Worcestershire, UK) with a 5 mW He-Ne laser (633 nm) and a fixed
scattering angle of 173 degrees. The direct measurements of the particle size were performed at a
constant temperature of 25°C. The particle size was determined for IgG in PBS and also for IgG after 9h
of incubation at pH ≈ 2 and pH ≈ 11 (in PBS and in PBS with 10% (w/v) of maltose for both pH values).

30
Similar measurements were also performed for IgG solutions in PBS without and with 10% (w/v) of
maltose after incubation at 70°C for a period of 8 hours. For the latter, samples were collected at
regular intervals in order to monitor the formation of aggregates over time. The IgG concentrations
studied in this assay were of 1 and 15 g/L.
For the measurements 1.5 mL disposable polystyrene cuvettes were used. The number of scans was
determined by the equipment according to the characteristics of each sample. The results obtained
were processed and analyzed with the Zetasizer nano-ZS software.

31
4 RESULTS AND DISCUSSION
4.1 STABILITY ASSESSMENT OF IGG WITHOUT ADDITIVES
Ideally the determination of the biological activity of IgG would be performed based on the affinity
of IgG for a specific antigen in order to achieve a higher specificity of the results. However, since the
tests are performed with a mixed population of antibodies, the previous would be impossible from a
practical approach. For that reason, the determination of the IgG concentration in the samples was
done based on the affinity of the Fc fragment of IgG for Protein A and/or Protein G. This mixed
population of antibodies may also be accountable for some variability in the results, given that the
concentration of the different IgG subclasses may vary for each sample and each subclass of IgG may
present a distinct resistance facing different denaturation conditions.
In order to standardize the results from all experiments, the data will be presented not in the form
of concentration but in the form of the percentage of Retained Biological Activity which can be defined
as the ratio between the IgG concentrations of the sample under analysis and the initial sample. In
other words, the Retained Biological Activity represents the fraction of the initial IgG molecules that
remain biologically active at a given time.
4.1.1 Thermal induced denaturation
The thermal induced denaturation was firstly assessed by the incubation of IgG in PBS at 60°C for a
period of time of 50 hours. The evolution of the percentage of Retained Biological Activity over time
can be consulted in Figure B.1 (Appendix B).
Figure 4.1, which shows the retained biological activity for the studied concentrations of IgG after
50 hours of incubation, suggests that there are no major losses of biological activity. In fact, the lowest
value of biological activity, obtained for 10 g/L, was of 74% having the remaining samples at least 89%
of active molecules.

32
Figure 4.1 – Retained Biological Activity (%) after 50 hours of incubation at 60°C of IgG solutions in PBS (pH 7.4)
with the initial concentrations of 1, 5, 10 and 15 g/L.
Despite this minor denaturation, it was important to evaluate the secondary structure of the IgG
molecules in order to determine whether any loss of structure had occurred. This was performed by CD
spectroscopy.
Analysing the graphics shown in Figure 4.2A-D, it is seen that the CD spectra of intact IgG – before
incubation at 60°C - presented are that of a typical immunoglobulin, with a minimum at approximately
217nm, a maximum close to 200 nm and zero intensity around 207 nm, thus representing a high
content of β-sheet. For the initial concentration of IgG of 10 g/L, the minimum at 217 nm broadens and
shifts to a lower wavelength and the wavelength corresponding to zero intensity also shifts to a lower
value. The last modification occurs as well for the sample of initial concentration of 15 g/L which also
shows an overall decrease in the ellipticity. Nevertheless, the general shape of the curve remains
similar to the typical β-sheet curve for all the samples. The CD data is thus in conformity with the
results obtained by HPLC, suggesting that only minor denaturation of the IgG molecules occurs. These
minor denaturation is however more important for higher concentrations of IgG.
90
74
89
0
10
20
30
40
50
60
70
80
90
100
Re
tain
ed
Bio
logi
cal A
ctiv
ity
(%)
IgG Concentration
1 g/L 5 g/L 10 g/L 15 g/L

33
Figure 4.2 – Far-UV CD spectra of IgG in PBS (pH 7.4) before incubation () and after 50 hours of incubation
() at 60°C for the initial concentration of (A) 1 g/L, (B) 5 g/L, (C) 10 g/L and (D) 15 g/L.
The thermal induced denaturation of IgG was then studied at more extreme conditions - incubation
at 70°C for 36 hours. Under these conditions no more than 9% of the IgG molecules remained
biologically active indicating a much higher extent of denaturation. The evolution of the percentage of
Retained Biological Activity over time can be consulted in Figure B.1 (Appendix B).
Observing Figure 4.3 one can conclude that the denaturation of IgG at 70°C is fast and doesn’t
change significantly between 8 and 36 hours of incubation. In fact, the major loss of biological activity
is almost immediate and it occurs between 0 and 2 hours of incubation, as can be seen in Figure 4.3
and Figure B.2, that plots the percentage of active molecules over time of incubation. Therefore, the
total time of incubation at 70°C adopted for further assays and data comparison was of 8 hours.
-5
-4
-3
-2
-1
0
1
2
3
4
5
200 210 220 230 240 250
[θ]
mrw
(1
03
de
g cm
2 d
mo
l-1
)
λ (nm)
(A)
-5
-4
-3
-2
-1
0
1
2
3
4
5
200 210 220 230 240 250
[θ]
mrw
(1
03
de
g cm
2 d
mo
l-1
)
λ (nm)
(B)
-5
-4
-3
-2
-1
0
1
2
3
4
5
200 210 220 230 240 250
[θ]
mrw
(1
03
de
g cm
2 d
mo
l-1
)
λ (nm)
(C)
-5
-4
-3
-2
-1
0
1
2
3
4
5
200 210 220 230 240 250
[θ]
mrw
(1
03
de
g cm
2 d
mo
l-1
)
λ (nm)
(D)

34
Figure 4.3 – Retained Biological Activity (%) after 2, 8 and 36 hours of incubation at 70°C of IgG solutions in PBS
(pH 7.4) with the initial concentrations of 1, 5, 10 and 15 g/L.
Upon incubation at 70°C for both 8 and 36 hours, it was clearly observed the precipitation of IgG, as
it can be seen in Figure 4.4.
Figure 4.4 – Precipitation occured after 8 hours of incubation at 70°C for the initial concentrations of IgG in
solution of: (A) 1 g/L, (B) 5 g/L, (C) 10 g/L and (D) 15 g/L.
IgG unfolds as a consequence of the heat treatment, causing the exposure of the hydrophobic
residues that were located in the interior of the protein (17). The exposure of these hydrophobic
patches in solution triggers the formation of aggregates through intermolecular hydrophobic binding
(16). The aggregates result from the partial unfolding of the Fab-fragments, which then become
associated leaving the Fc-fragments exposed to the aqueous environment (1), (16). The formation of
these aggregates result in the observed precipitation of the IgG molecules.
It has been demonstrated that the heating process of IgG doesn’t lead to a complete unfolding into
an extended polypeptide chain, but leaves a significant part of the IgG molecule in a globular or
8
26 19
24
4 8 6 8 9 7 5 5
0
10
20
30
40
50
60
70
80
90
100
1 g/L 5 g/L 10 g/L 15 g/L
Re
tain
ed
Bio
logi
cal A
ctiv
ity
(%)
IgG Concentration
2h 8h 36h

35
corpuscular form. This occurs because the rate of aggregation is so fast that the molecules become
locked in the aggregates formed before being completely denatured. The aggregation step is thus the
step that induces the irreversibility of the heating denaturation process (reversible unfolding step,
followed by an irreversible process that locks the unfolded protein in a state from which it can no
longer refold) (16).
It is clear from Figure 4.4 that more precipitation occurs for higher values of initial concentration of
IgG in solution that for lower values. Now, if the irreversibility of the denaturation process is due to the
aggregation step which ultimately leads to the precipitation of the antibodies in solution, and that the
amount of precipitate is dependent on the initial concentration, it is patent that increasing the initial
concentration of IgG in solution will ultimately lead to a higher irreversible denaturation.
In face of such extent loss of biological activity, it was important to evaluate the changes that surely
have occurred in IgG’s secondary structure. The CD spectra obtained for the samples are presented in
Figure 4.5A-D.
In all the images it’s patent that a major change occurs in the secondary structure given the
difference between the curves of the samples before and after 8 hours of incubation at 70°C.
Observing Figure 2.6, one can easily identify the similarities between the curve of the random coil
motif and the curve correspondent to the samples after incubation at 70°C. In general, the CD
spectrum of random coils shows only negative contribution, approaching to zero around 230 nm. The
samples after incubation present a curve with only negative contributions but generally close to zero
while the initial ones present a curve in general similar to the one of a regular immunoglobulin.
Furthermore, the ellipticity near 206.5 nm is negative which is consistent with an increased
contribution of random coil motifs. The previous observations suggest that the samples after
incubation possess a higher content of random coils and virtually none of β-sheet. This depletion in β-
sheet content shows that denaturation had occurred in a large extent.

36
Figure 4.5 - Far-UV CD spectra of IgG in PBS (pH 7.4) before incubation () and after 8 hours of incubation ()
at 70°C for the initial concentration of (A) 1 g/L, (B) 5 g/L, (C) 10 g/L and (D) 15 g/L.
Accounting the two temperatures tested to induce heat denaturation of IgG, at 70°C it appeared to
occur irreversible denaturation of the Fc-fragment of IgG while at 60°C the Fc-fragment seems to suffer
only minor alterations. Based on the fact that the percentage of Retained Biological Activity is
determined on the affinity of Protein A and Protein G to the Fc fragment of IgG, it is clear that if the
percentage of retained biological activity is diminished, the Fc fragment has suffered alterations since it
no longer binds to Protein A or G. Nonetheless, at 60°C there are mild changes in the secondary
structure of IgG molecule, suggesting that other fragments of the IgG molecule may be affected upon
incubation at this temperature. This situation may arise from IgG being a multi-domain protein which
results on the fact of (at least) two existing domains denature at different temperatures. In fact, these
evidences are consistent with results obtained in previous studies which suggested that the Fab and Fc
-5
-4
-3
-2
-1
0
1
2
3
4
5
200 210 220 230 240 250
[θ]
mrw
(1
03
de
g cm
2 d
mo
l-1
)
λ (nm)
-5
-4
-3
-2
-1
0
1
2
3
4
5
200 210 220 230 240 250
[θ]
mrw
(1
03
de
g cm
2 d
mo
l-1
)
λ (nm)
-5
-4
-3
-2
-1
0
1
2
3
4
5
200 210 220 230 240 250
[θ]
mrw
(1
03
de
g cm
2 d
mo
l-1
)
λ (nm)
-5
-4
-3
-2
-1
0
1
2
3
4
5
200 210 220 230 240 250
[θ]
mrw
(1
03
de
g cm
2 d
mo
l-1
)
λ (nm)

37
fragments appear to denature independently from each other, occurring at the temperatures of 61°C
and 71°C, respectively (16).
4.1.2 pH induced denaturation
The pH firstly chosen to assess pH induced denaturation was a pH of approximately 3, since
this is the common elution pH of protein A.
Figure 4.6 – Retained Biological Activity (%) after 50 hours of incubation of IgG solutions with PBS at pH 3.02
with the initial concentrations of 1, 5, 10 and 15 g/L.
After 50 hours of incubation at pH 3.02 at 4°C, it was only observed a residual loss of biological
activity for the initial concentrations of IgG of 5 and 10 g/L, respectively with 98% and 97% of the initial
molecules remaining biologically active (Figure 4.6). The CD spectra (Figure 4.7A-D) are in agreement
with the data previously shown, since in all of them the curves for the samples before and after
incubation are for all purposes coincident. This indicates that the secondary structure of IgG remains
intact after 50 hours of incubation in PBS at pH 3.02.
98 97
0
10
20
30
40
50
60
70
80
90
100
Re
tain
ed
Bio
logi
cal A
ctiv
ity
(%)
IgG Concentration
1 g/L 5 g/L 10 g/L 15 g/L

38
Figure 4.7 - Far-UV CD spectra of IgG in PBS before incubation () and after 50 hours of incubation () at pH
3.02 for the initial concentration of (A) 1 g/L, (B) 5 g/L, (C) 10 g/L and (D) 15 g/L.
Since there was no denaturation at pH 3.02 and based on a previous study that revealed an increase
on random coil configuration upon exposure of IgG molecules to a pH of 2 at the temperature of 20°C
(44), it was chosen to incubate the IgG solutions in PBS at pH 2.1 at 4°C – to, as previously stated,
eliminate any contribution of temperature to the induced denaturation.
After a period of 9 hours, the percentage of retained biological activity was significantly lower when
compared with pH ≈ 3, except for the initial concentration of 15 g/L where all IgG remained biologically
active. The loss of activity was especially more pronounced for the concentrations of 5 and 10 g/L of
IgG.
-5
-4
-3
-2
-1
0
1
2
3
4
5
200 210 220 230 240 250
[θ]
mrw
(1
03
de
g cm
2 d
mo
l-1
)
λ (nm) -5
-4
-3
-2
-1
0
1
2
3
4
5
200 210 220 230 240 250
[θ]
mrw
(1
03
de
g cm
2 d
mo
l-1
)
λ (nm)
-5
-4
-3
-2
-1
0
1
2
3
4
5
200 210 220 230 240 250
[θ]
mrw
(1
03
de
g cm
2 d
mo
l-1
)
λ (nm)
-5
-4
-3
-2
-1
0
1
2
3
4
5
200 210 220 230 240 250
[θ]
mrw
(1
03
de
g cm
2 d
mo
l-1
)
λ (nm)

39
Figure 4.8 - Retained Biological Activity (%) after 9 hours of incubation of IgG solutions with PBS at pH 2.1 with
the initial concentrations of 1, 5, 10 and 15 g/L.
The CD spectra of these samples (Figure 4.9A-D) are in concordance with the results shown above.
For the solution with the initial concentration of IgG of 15 g/L the curves of the samples before and
after incubation are very similar and, for most values of wavelength, superimposed, indicating that the
secondary structure of the molecule didn’t suffer alterations. The spectrum corresponding to the IgG
solution with the initial concentration of 1 g/L shows a curve after incubation with the same shape but
lower values of ellipticity than the curve of the sample before incubation at pH 2.1. This suggests that a
change in the secondary structure has occurred but not in major extension, which can be accurately
related to the HPLC data that revealed a value of retained biological activity relatively high (82%). The
samples that revealed a significantly higher loss of function – 5 and 10 g/L – present CD spectra with
more distinct curves of samples before and after incubation: the minimum observed at 217nm
broadens and shifts to a lower wavelength and the wavelength corresponding to zero intensity also
shifts to a lower value. The pronounced differences between the curves indicate a structural change in
a higher extension which had already been suggested by the previous results. It has been reported the
formation of a new, well-defined IgG structures upon exposure at low pH values (pH < 3). The
protonation of amino acid side chains is supposed to cause the reorganization of the native state into a
so called A-state. This new acid-induced structure is characterized by a high degree of secondary
structure, increased accessibility of hydrophobic clusters, increased fluorescence intensity and a
native-like hydrophobic surrounding of the aromatic rings. The A-state is described to be relatively
compact [ (17) , (18), (44)].
82
64
43
0
10
20
30
40
50
60
70
80
90
100
Re
tain
ed
Bio
logi
cal A
ctiv
ity
(%)
IgG Concentration
1 g/L 5 g/L 10 g/L 15 g/L

40
Figure 4.9 - Far-UV CD spectra of IgG in PBS before incubation () and after 9 hours of incubation () at
pH 2.1 for the initial concentration of (A) 1 g/L, (B) 5 g/L, (C) 10 g/L and (D) 15 g/L.
4.1.3 Mechanical Shear Stress induced degradation
Shear forces encountered by Taylor vortices can partition proteins to the air-water interface which
encourages partial unfolding on exposure to the more hydrophobic air phase (3). So, before assessing
the effect of mechanical shear stress on IgG, it was pertinent to determine the extent of the forces
imposed on the IgG molecules during the assay. Resorting to equations (2.1), (2.2) and (2.3) it was
possible to estimate the Taylor number, the shear rate and the shear stress imposed on the IgG
molecules.
-5
-4
-3
-2
-1
0
1
2
3
4
5
200 210 220 230 240 250
[θ]
mrw
(1
03
de
g cm
2 d
mo
l-1
)
λ (nm)
-5
-4
-3
-2
-1
0
1
2
3
4
5
200 210 220 230 240 250
[θ]
mrw
(1
03
de
g cm
2 d
mo
l-1
)
λ (nm)
-5
-4
-3
-2
-1
0
1
2
3
4
5
200 210 220 230 240 250
[θ]
mrw
(1
03
de
g cm
2 d
mo
l-1
)
λ (nm)
-5
-4
-3
-2
-1
0
1
2
3
4
5
200 210 220 230 240 250
[θ]
mrw
(1
03
de
g cm
2 d
mo
l-1
)
λ (nm)

41
Table 4.1 – Taylor number, maximum shear rate (s-1
) and shear stress at the wall of the inner rotating cylinder
(Pa) imposed on the IgG molecules during the mechanical shear stress assay for the different angular speeds of
the inner cylinder tested.
ω (rpm) 1000 2000 3000
Ta 1664 3327 4991
γm (s-1) 9.40x10³ 2.66x10⁴ 4.88x10⁴
τm (Pa) 9 27 49
Initially, tests were performed recirculating an IgG solution with a concentration of 1 g/L in a
concentric-cylinder shear device with an angular speed of the inner cylinder of 1000 rpm.
Figure 4.10 – Far-UV CD spectra of IgG in PBS at pH 7.4 for several periods of time spent in the shear field. The
initial concentration of IgG was of 1 g/L and the angular speed of the inner rotating cylinder of 1000 rpm.
The CD spectra (Figure 4.11) show the behavior of a regular immunoglobulin, being the curve
representative of a high content of β-sheet. The curves are similar in shape and ellipticity values
suggesting that the secondary structure of IgG is maintained throughout the time spent in the shear
field. It is then implied that IgG is capable to resist the induced degradation of shear forces of
approximately 9 Pa.
The angular speed of the inner cylinder was then raised to 2000 rpm in order to evaluate whether
an enhancement in this parameter and, consequently, in the shear stress imposed on IgG would cause
degradation. Figure 4.11 shows again the typical behaviour of an immunoglobulin with a high content
of β-sheet that is maintained throughout the period of permanence in the shear field, showing no
-5
-4
-3
-2
-1
0
1
2
3
4
5
200 210 220 230 240 250
[θ]
mrw
(1
03
de
g cm
2 d
mo
l-1
)
λ (nm)
0 min 2 min 5 min 20 min 30 min 10 min

42
alterations in the secondary structure. The results indicate that IgG in solution at a concentration of 1
g/L is also capable to resist shear stress up to 27 Pa.
Figure 4.11 – Far-UV CD spectra of IgG in PBS at pH 7.4 for several periods of time spent in the shear field. The
initial concentration of IgG was of 1 g/L and the angular speed of the inner rotating cylinder of 2000 rpm.
Given that no degradation was observed for 2000 rpm, the inner cylinder angular speed was then
raised to 3000 rpm.
Figure 4.12 – Far-UV CD spectra of IgG in PBS at pH 7.4 for several periods of time spent in the shear field. The
initial concentration of IgG was of 1 g/L and the angular speed of the inner rotating cylinder of 3000 rpm.
The CD spectra show, once again, the behavior of a regular immunoglobulin with elevated β-sheet
content as well as no alterations in the secondary structure of the IgG. Thus, it is possible to infirm that
IgG in solution with a concentration of 1 g/L is capable to resist an imposed shear stress of 49 Pa.
-5
-3
-1
1
3
5
200 210 220 230 240 250
[θ]
mrw
(1
03
de
g cm
2 d
mo
l-1
)
λ (nm)
0 min 2 min 5 min 20 min 30 min 10 min
-5
-3
-1
1
3
5
200 210 220 230 240 250
[θ]
mrw
(1
03
de
g cm
2 d
mo
l-1
)
λ (nm) 0 min 2 min 5 min 20 min 30 min 10 min
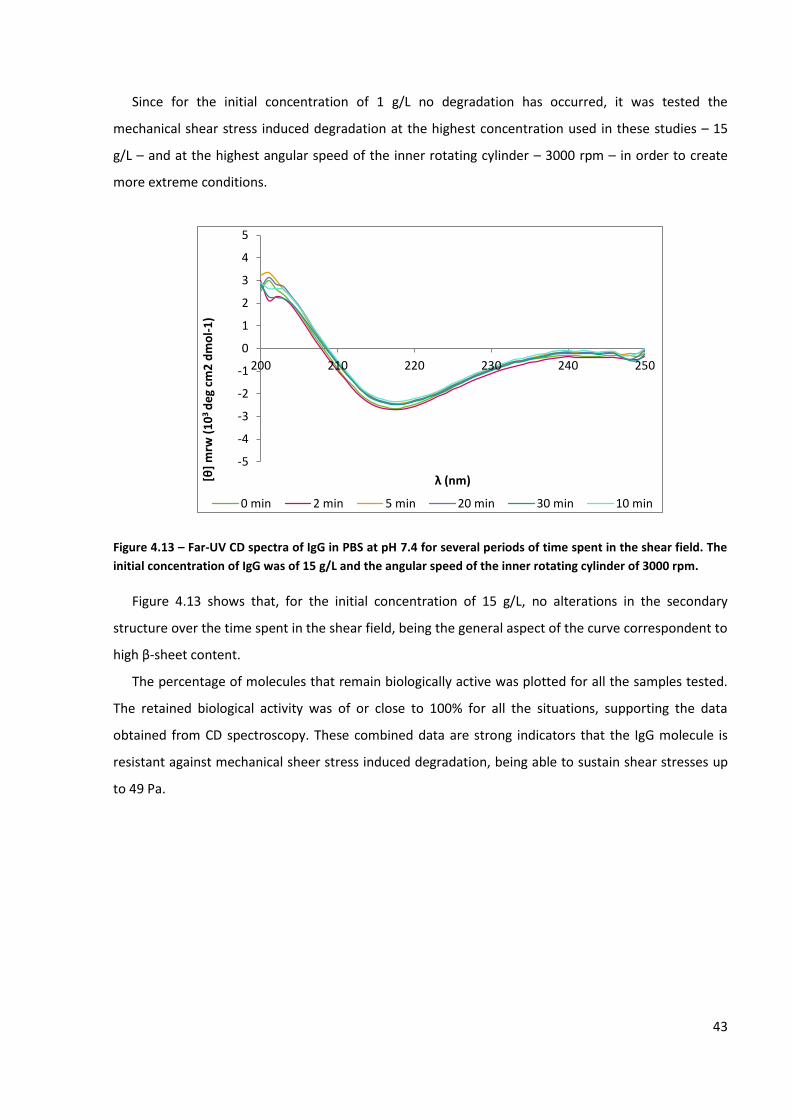
43
Since for the initial concentration of 1 g/L no degradation has occurred, it was tested the
mechanical shear stress induced degradation at the highest concentration used in these studies – 15
g/L – and at the highest angular speed of the inner rotating cylinder – 3000 rpm – in order to create
more extreme conditions.
Figure 4.13 – Far-UV CD spectra of IgG in PBS at pH 7.4 for several periods of time spent in the shear field. The
initial concentration of IgG was of 15 g/L and the angular speed of the inner rotating cylinder of 3000 rpm.
Figure 4.13 shows that, for the initial concentration of 15 g/L, no alterations in the secondary
structure over the time spent in the shear field, being the general aspect of the curve correspondent to
high β-sheet content.
The percentage of molecules that remain biologically active was plotted for all the samples tested.
The retained biological activity was of or close to 100% for all the situations, supporting the data
obtained from CD spectroscopy. These combined data are strong indicators that the IgG molecule is
resistant against mechanical sheer stress induced degradation, being able to sustain shear stresses up
to 49 Pa.
-5
-4
-3
-2
-1
0
1
2
3
4
5
200 210 220 230 240 250
[θ]
mrw
(1
03
de
g cm
2 d
mo
l-1
)
λ (nm)
0 min 2 min 5 min 20 min 30 min 10 min

44
Figure 4.14 – Retained Biological Activity (%) of IgG after a period of circulation in the shear field of 30 minutes.
Previous studies on different proteins showed that the effect of shear and shear rate (>105 s-1) on
protein activity (rhGH and rhDNase) wasn’t significant (28). The results obtained contribute to include
IgG in the lot of proteins capable to resist the partial unfolding induced by shear forces.
When compared to other biomolecules, namely with Plasmid DNA (pDNA), IgG shows better
response facing the shear stress induced degradation. Previous studies report that of pDNA suffers
severe injuries upon shear forces of 10.9 Pa (26) whereas IgG is able to resist degradation induced by
shear forces up to 49 Pa.
4.2 STABILITY ASSESSMENT OF IGG WITH ADDITIVES
In order to evaluate which of the selected additives commonly used in human therapeutic
antibodies formulations is the best stabilizer, IgG solutions with each individual additive were
incubated in the denaturation inducing conditions previously studied (70°C and pH ≈ 2).
4.2.1 Thermal induced denaturation
The retained biological activity of IgG after incubation at 70ºC after a period of 8 hours is shown in
Figure 4.15 for different initial IgG concentrations – 1, 5, 10 and 15 g/L.
0
10
20
30
40
50
60
70
80
90
100
Re
tain
ed
Bio
logi
cal A
ctiv
ity
(%)
IgG Concentration
1000 rpm (1g/L) 2000 rpm (1g/L) 3000 rpm (1g/L) 3000 rpm (15g/L)

45
Figure 4.15 - Retained Biological Activity (%) after incubation at 70°C for a period of 8h of IgG solutions with the
initial concentrations of 1, 5, 10 and 15 g/L. The buffers used consisted in PBS with 10% (w/v) of additive
except for L-histidine in which the concentration of additive in the buffer was of 2% (w/v).
After 8 hours of incubation it was still observed a quite extent denaturation induced by heat, except
for the initial IgG concentration of 1 g/L incubated with maltose in which all the IgG molecules
remained biologically active. This means that maltose is able to fully stabilize IgG at this concentration
against heat induced denaturation. Generally, all the values of retained biological activity obtained
were higher in the presence of these stabilizers when compared with IgG in PBS. Only L-histidine
showed lower percentage of biologically active molecules than IgG alone – at 5 and 15 g/L – and equal
values at 10 g/L.
Figure 4.15 reveals that maltose is the more suitable stabilizer against thermal induced
denaturation of IgG since it achieved the highest values of retained biological activity for most of the
initial concentrations. In fact, maltose allowed a complete stabilization of IgG at the initial
concentration of 1 g/L without any loss of biological function. For the initial concentration of 15 g/L,
glycine had a better performance in stabilizing IgG but the value obtained for the retained biological
activity was very close of the one obtained with maltose.
Once again, as observed before, the higher the initial concentration of IgG, the higher was the
extent of the denaturation.
It was also observed, for all the solutions under study, the formation of IgG precipitates after the 8
hours of incubation at 70°C in amounts correlated with the initial concentration of IgG in solution, as
had already happened upon heat treatment of IgG in PBS.
4 8 6 8
17 17
8 9
47
24
16 18
100
36 33
15
46
7 7 9 7 6 6 5
0
10
20
30
40
50
60
70
80
90
100
1 g/L 5 g/L 10 g/L 15 g/L
Re
tain
ed
Bio
logi
cal A
ctiv
ity
(%)
IgG Concentration
Control Trehalose Glycine Maltose Sucrose L-histidine

46
In view of the fact that the buffer concentration of L-histidine was quite lower than the
concentration of the other additives - 2% (w/v) compared to 10% (w/v) - it was pertinent to evaluate
whether maltose at the same buffer concentration as L-histidine would still provide higher stabilization
against thermal induced denaturation than L-histidine, as shown in Figure 4.16.
Figure 4.16 - Retained Biological Activity (%) after incubation at 70°C for a period of 8h of IgG solutions with the
initial concentrations of 1, 5, 10 and 15 g/L. The buffers used consisted in PBS with 2% (w/v) of additive.
After 8 hours of incubation at 70°C, maltose still revealed a better behavior as a stabilizer of IgG
against heat denaturation, with fairly higher values of retained biological activity than L-histidine. It is
noticeable that the values of the retained biological activity for maltose at a concentration of 2% (w/v)
are significantly lower than for a concentration of 10% (w/v), which denotes the importance of the
stabilizer concentration in the resistance provided against denaturation.
The effect of the presence of a stabilizer on the changes occurring in the secondary structure of IgG
upon heat denaturation was evaluated by CD spectroscopy. The CD spectra for incubation with
maltose are shown in Figure 4.17A-D. For the remaining additives studied the CD spectra are presented
in Appendix C. It is pertinent to observe that it was verified significant structural changes upon heat
treatment in the presence of all the remaining additives.
7 6 6 5
21
10 10 9
0
10
20
30
40
50
60
70
80
90
100
1 g/L 5 g/L 10 g/L 15 g/L
Re
tain
ed
Bio
logi
cal A
ctiv
ity
(%)
IgG concentration
L-histidine 2% (w/v) Maltose 2% (w/v)

47
Figure 4.17 - Far-UV CD spectra of IgG in PBS with 10% (w/v) of maltose (pH ≈ 7) before incubation () and
after 8 hours of incubation () at 70°C for the initial concentration of (A) 1 g/L, (B) 5 g/L, (C) 10 g/L and (D) 15
g/L.
The curve observed for the sample before incubation at 70°C at the initial concentration of 1 g/L is
consistent with high β-sheet content. Despite the ellipticity values between 200 and 220 nm of the
sample after 8 hours of incubation at 70°C being much lower and the minimum at 217 nm being a little
broader when compared with the sample before incubation, the curve still presents a similar shape to
the initial one, indicating that some content of β-sheets is maintained. However, at approximately
206.5 nm, where a typical β-sheet shows an intensity of zero, the curve presents a negative intensity at
that wavelength, thus revealing the existence of random coil and maybe α-helix motifs (which exhibit
negative contributions at that wavelength).
For the remaining studied concentrations, the CD spectra show a slight improvement on the
conservation of the secondary structure upon comparison with the CD spectra for IgG without any
-5
-4
-3
-2
-1
0
1
2
3
4
5
200 210 220 230 240 250
θ m
rw (
10
3 d
eg
cm2
dm
ol-
1)
λ (nm) -5
-4
-3
-2
-1
0
1
2
3
4
5
200 210 220 230 240 250
θ m
rw (
10
3 d
eg
cm2
dm
ol-
1)
λ (nm)
-5
-4
-3
-2
-1
0
1
2
3
4
5
200 210 220 230 240 250
θ m
rw (
10
3 d
eg
cm2
dm
ol-
1)
λ (nm) -5
-4
-3
-2
-1
0
1
2
3
4
5
200 210 220 230 240 250
θ m
rw (
10
3 d
eg
cm2
dm
ol-
1)
λ (nm)

48
additive. While in the one without any additive the curve resembled the typical curve of a random coil
motif, in the presence of maltose the curve shows some resemblance in shape with the curve of a β-
sheet motif, with positive contributions between 200 and approximately 210 nm and a minimum, even
though broader than the one of a typical immunoglobulin, around 215 nm. Even so, the distinction
between the curves of the initial and final samples is fairly pronounced suggesting that changes in the
secondary structure have definitely occurred.
4.2.2 pH induced denaturation
The retained biological activity of IgG after incubation at pH 2.1 after a period of 9 hours is shown in
Figure 4.19 for different initial IgG concentrations – 1, 5, 10 and 15 g/L.
Figure 4.18 - Retained Biological Activity (%) after incubation of IgG solutions with the initial concentrations of
1, 5, 10 and 15g/L at pH ≈ 2 for a period of 9h. The buffers used consisted in PBS with 10% (w/v) of additive
except for L-histidine in which the concentration of additive in the buffer was of 2% (w/v).
Upon incubation at pH ≈ 2 in the presence of the several additives, it was observed some variability
in the stabilization provided by the additives. Depending on the initial concentration of IgG in solution,
the retained biological activity was largely different for the same additive. For example, D-trehalose
behaved fairly well except for the solution of 10 g/L in which the percentage of retained biological
active was drastically lower than for the other initial concentrations and than for IgG alone itself.
Observing Figure 4.18, one can infer that maltose would also be the best stabilizer against pH induced
denaturation since it allows achieving a percentage of molecules biologically active after incubation
82
64 65
97 91
41
82
64 65
96 97
66 71
38
68 71 70 69
0
10
20
30
40
50
60
70
80
90
100
1 g/L 5 g/L 10 g/L 15 g/L
Re
tain
ed
Bio
logi
cal A
ctiv
ity
(%)
IgG concentration
Control Trehalose Glycine Maltose Sucrose L-histidine

49
equal or very close to 100% and it is, furthermore, the additive that showed less variability with the
initial concentration of IgG in solution.
The secondary structure of IgG after incubation was studied to determine whether the remaining
biologically active molecules maintained or not their original secondary structure. Figure 4.19A-D
shows the CD spectra for IgG with maltose as the additive – since it showed the higher percentages of
retained biological activity – while the CD spectra of IgG with each of the remaining additives are
shown in Appendix C. It should be mentioned that, in general, the behavior of the remaining additives
was consistent with the retention of the biological activity achieved in their presence.
Figure 4.19 - Far-UV CD spectra of IgG in PBS with 10% (w/v) of maltose before incubation () and after
9 hours of incubation () at pH 2.1 for the initial concentration of (A) 1 g/L, (B) 5 g/L, (C) 10 g/L and (D) 15 g/L.
The CD spectra exhibit curves identical to those of a typical immunoglobulin with high β-sheet
content characterized by a minimum near 217 nm and zero intensity at approximately 206.5 nm.
Furthermore, in Figure 4.19A-D one can observe that the curves of the samples before and after
-5
-4
-3
-2
-1
0
1
2
3
4
5
205 225 245
[θ]
mrw
(1
03 d
eg
cm2
dm
ol-
1)
λ (nm) -5
-4
-3
-2
-1
0
1
2
3
4
5
205 225 245[θ
] m
rw (
10
3 d
eg
cm2
dm
ol-
1)
λ (nm)
-5
-4
-3
-2
-1
0
1
2
3
4
5
205 225 245
[θ]
mrw
(1
03 d
eg
cm2
dm
ol-
1)
λ (nm) -5
-4
-3
-2
-1
0
1
2
3
4
5
205 225 245
[θ]
mrw
(1
03 d
eg
cm2
dm
ol-
1)
λ (nm)

50
incubation are virtually equal, being almost superimposed. Hence, it is possible to assert that no
alterations on the secondary structure have occurred.
Considering the results obtained both for the thermal and pH induced denaturation it is fair to
conclude that maltose is the most suitable additive for IgG stabilization from amongst the additives
studied. This hardly consists in a great surprise given that sugars have been used for many years as
stabilizing agents for the maintenance of the biological activity of several macromolecules.
It has been recognized that sugars increase the transition temperatures of some proteins in
aqueous solution, being this effect ascribed to the induction of a decrease in H-bond rupturing
potency. Another source of stabilization is attributed to the preferential interaction of the protein with
solvent components in the presence of high concentration of additives - such as the concentration of
maltose used in the studies performed. The surface free energy perturbation by sugars plays a
predominant role in their preferential interaction with proteins. Other contributing factors are the
exclusion volume of the sugars and the chemical nature of the protein surface.
The protein preferential hydration is a common feature of aqueous sugar solutions within the sugar
concentration range ordinarily employed, regardless of the type of protein and the solvent conditions
used. In a three-component system, preferential hydration of a protein is a good indication that the
third component is a stabilizer of the structure of the macromolecule. The stabilizing effect of the third
solution component on proteins can be explained in terms of the positive change in the chemical
potential of the proteins, induced by the addition of these substances. Since the addition of sugars
results in a positive surface free-energy change, and this change is assumed to increase with an
increase in the surface area of the macromolecule, the macromolecule in the denatured state will
experience a greater increase in chemical potential when sugar is added than that in the native form,
i.e., contact of sugar with the denatured state is thermodynamically more unfavorable than with the
native state. This must be reflected in the equilibrium constant, which, in sugar solutions, will shift to a
value favoring the native conditions. It is also strongly suggested that the cohesive force of sugars
responsible for the increase in the surface tension of water is a very important factor governing the
preferential interaction of proteins with solvent components in aqueous sugar solutions and hence the
stabilization of proteins (45).
4.3 AGGREGATION STUDIES FOR IGG
Aggregation properties of IgG solutions are dependent on the conformational stability and
structural properties of individual IgG molecules (19). In a large multi-domain protein like IgG,

51
relatively gentle conditions can be sufficient to initiate aggregation. Partially unfolded states are much
more susceptible to aggregation than the native or completely unfolded state, due to the exposure of
contiguous hydrophobic regions that are hidden in the native state or absent in the denatured state
(3). It is thus extremely important to study the effect on aggregation of environmental factors capable
to lead IgG to these partially unfolded states, such as pH – approximately 2 and 11 - and heat exposure
- 70°C – by the measurement of the size of particles in solution.
Ideally, the size distribution intensity should be the one used to determine the particle size, as those
data are closest to what is really measured (43). However, if the plot shows a substantial tail, or more
than one peak, then Mie theory (named after Gustav Mie) can make use of the input parameter of
sample refractive index to convert the intensity distribution to a volume distribution, which will then
give a more realistic view of the importance of the tail or second peak present (42). Based on that, the
data presented for the pH assay correspond to the mode of the curves of the size distribution by
volume.
On the other hand, the size presented in the temperature assay corresponds to the average size
measured because, in most cases, both the plots of intensity and volume distributions present several
peaks. In addition, the presence of the larger precipitates may compromise the results by masking the
size of smaller aggregates in solution and so, the most adequate approach would be to consider the
contribution of all the peaks that correspond to different identities in solution. Nonetheless, the size
distributions are useful to assess the number of different identities present in solution that provide a
contribution to the average size determined.
This makes it, however, impossible to compare the data of the pH assay with the data from the
temperature assay because only data analyzed with the same distribution can be compared (43).
4.3.1 pH effect on IgG aggregation
When the pH is shifted away from the isoelectric point (in which all the molecules are electrically
neutral), the molecules acquire charges – positive or negative, depending whether the pH is lower or
higher than the isoelectric point. At high pH (pH ≈ 11), the IgG molecules are negatively charged since
the pH is higher than the isoelectric point of IgG (pI ≈ 9). At low pH (pH ≈ 2), a similar situation occurs
but, this turn, with positively charged molecules given that the pH is lower than IgG’s isoelectric point.
It is common knowledge that molecules with the same charge tend to repel each other, so it would be
expected that with the increase of the molecule charge (either positive or negative) the tendency for
aggregation would decrease. It is also expectable that the higher the initial concentration of IgG in
solution, the lower the tendency for aggregation, since there are a higher number of molecules present

52
in solution that may become charged causing more repulsion as result. It has been reported indeed
that oligomerization/aggregation of polyclonal IgG decreases at lower pH, when distancing from the
isoelectric range, while the tendency for denaturation increases (19).
The plots of the size distribution by intensity and by volume for IgG before and after incubation at
pH 2 or 11 in the absence and presence of maltose for two initial concentrations of IgG – 1 g/l and 15
g/l are given in the Appendix D.
Figure 4.20 – Size (nm) of IgG in PBS at pH 2.1 before incubation and after 9 hours of incubation in PBS at pH
2.1 and PBS with 10% (w/v) maltose at pH 2.1.
The tendency expected was not observed upon incubation in PBS at pH 2.1 in which, for both initial
concentrations, the measured size after 9 hours of incubation was higher than for the sample prior to
incubation (Figure 4.20). A size reduction would also be expected due to the formation of the
previously mentioned A-state at low pH values which consists in a fairly compact structure. This may be
due to the fact that these measurements were performed at a salt concentration of 150 mM NaCl, and
thus charge shielding may have occurred. Nevertheless, in the presence of maltose, for both initial
concentrations of IgG in solution, the particle size was somehow reduced, verifying both the low
tendency for aggregation at low pH as well as the capacity of maltose for inhibiting the aggregation
process more than the effect caused by incubation at low pH values alone (repulsion between
molecules caused by the increase of the number of molecules with the same charge).
12,86 11,69
13,74 13,43 11,92
9,63
0
2
4
6
8
10
12
14
1g/L 15g/L
Size
(n
m)
IgG Concentration IgG in PBS (pH 2.1)
IgG in PBS (after 9 h of incubation at pH 2.1)
IgG in PBS with 10% (w/v) maltose (after 9 h of incubation at pH 2.1)

53
Figure 4.21 - Size (nm) of IgG in PBS at pH 11.3 before incubation and after 9 hours of incubation in PBS at pH
11.3 and PBS with 10% (w/v) maltose at pH 11.5.
Regarding the samples incubated at pH ≈ 11 (Figure 4.21), a reduction in size was observed both in
the presence and absence of maltose when compared to IgG at pH ≈ 11 at the beginning of the
incubation. This goes along with the theoretical previsions. It is further observable that the size
determined in the presence of maltose in solution was smaller than in its absence, especially at the
highest initial concentration of IgG in solution tested, 15 g/L. This, once again, indicates that maltose
has the ability to inhibit the aggregation process at high pH values in further extension than the pH
effect alone.
4.3.2 Temperature effect on IgG aggregation
The plots of the size distribution by intensity and volume for native IgG and IgG after incubation at
70°C in PBS both in the absence and presence of maltose for each initial concentration – 1 g/L and 15
g/L - are shown in Figure D.7 and Figure D.8, respectively.
The average particle size is plotted in Figure 4.22 for native IgG and IgG after 8 hours of incubation
at 70°C in PBS with and without maltose, for the initial IgG concentrations of 1 and 15 g/L.
The reported size of native IgG is ≈ 10 nm (14) which is lower than the sizes determined
experimentally (Figure 4.22). This difference may be ascribed as the result of long term storage at low
temperatures of the commercial sample used, which is commonly accepted to happen (19).
10,92
12,57
10,73
12,17
10,57
7,96
0
2
4
6
8
10
12
14
1g/L 15g/L
Size
(n
m)
IgG Concentration IgG in PBS (pH 11.3)
IgG in PBS (after 9 h of incubation at pH 11.3)
IgG in PBS with 10% (w/v) maltose (after 9h of incubation at pH 11.5)

54
Figure 4.22 – Size (nm) of native IgG and IgG after 8 hours of incubation at 70 °C in PBS and PBS with 10% (w/v)
maltose – pH ≈ 7.
For the initial concentration of 1 g/L, it is only observable one peak in the size distribution plots
correspondent to one individual identity present in solution for both IgG before and after 8 hours of
incubation at 70°C. The average size determined after incubation is much higher than the size of native
IgG. The latter would be expected since, as previously described, the mechanism of heat denaturation
comprises an aggregation step which leads to IgG precipitation. In the presence of maltose, the
average size determined – in which there is also the contribution of only one identity - was significantly
lower than in its absence which is in agreement with the results previously obtained: if aggregation is
prevented to a certain extent, the heat denaturation is expected to be gentler.
For the initial concentration of IgG in solution of 15 g/L, only one peak was found in the size
distribution plots for IgG in PBS, before and after heat treatment, corresponding to only one individual
identity in solution. However, in the presence of maltose three peaks are observed in the size
distribution by intensity plot, revealing the presence of three different identities with distinct sizes that
contribute to the average size determined. The average particle size determined after incubation in
PBS alone was enormously higher than the size of native IgG. The same situation occurred for the
sample incubated in PBS with 10% (w/v) of maltose but, in this case, the particle size was quite smaller
than in its absence.
Comparing the solutions of IgG in PBS with 10% (w/v) maltose, the size determined for 1 g/L was
higher than for 15 g/L which contrasts with the results previously obtained: for 1 g/L the retained
biological activity of the IgG molecules was of 100% while, in contrast, for 15 g/L it was of 15%. In
addition, the changes in the secondary structure observed for the sample with the initial concentration
14,25 13,85
1762
2556
413,9
119,2
0
500
1000
1500
2000
2500
3000
1g/L 15g/L
Size
(n
m)
IgG Concentration Native IgG
IgG in PBS (after 8 h of incubation at 70°C)
IgG in PBS with 10% (w/v) maltose (after 8 h of incubation at 70°C)

55
of 1 g/L were less extent than for 15 g/L. Since aggregation plays an important part in heat
denaturation it should be expectable to observe less aggregation for samples more stable against heat
denaturation.
The variations of the particle size with time were plotted in terms of the fold increase in size (ratio
between the particle size at a given time and the initial particle size) to express the aggregation rate
(Figure 4.23).
Figure 4.23 – Variations in size of IgG in solution over time of incubation at 70°C in hours for the initial
concentration of IgG in solution of (A) 1g/L and (B) 15g/L, both in absence and presence of maltose. The Fold
Increase in Size corresponds to the ratio between the size at a given time and the initial particle size.
It has been suggested in previous studies that at higher heating rate and/or incubation around or
above the denaturation temperature, the unfolding occurs at a higher speed, leading to a high
0
500
1000
1500
2000
2500
0 1 2 3 4 5 6 7 8 9
Fold
Incr
eas
e in
Siz
e
Time (h)
IgG in PBS (1g/L) IgG in PBS with 10% (w/v) maltose (1g/L)
0
500
1000
1500
2000
2500
0 1 2 3 4 5 6 7 8 9
Fold
Incr
eas
e in
Siz
e
Time (h)
IgG in PBS (15g/L) IgG in PBS with 10% (w/v) maltose (15g/L)

56
concentration of (partially) unfolded IgG molecules. The rate of aggregation is correspondingly faster,
and it could well be that at such high aggregation rates IgG molecules are incorporated in the
aggregate before they have had sufficient time for complete unfolding (16). In this experiment the
incubation took place at a temperature near the denaturation temperature (T≈71°C for the Fc-
fragment) and so the rate of aggregation would be expected to be high.
The shape of the aggregation curves is significantly different, fact that might be attributed to the
poor quality of the results given the precipitates effect on the light scattering measurements. Even
though the results comprise a certain error, it is possible to verify the expected high rate of
aggregation upon incubation in PBS alone for the two initial concentrations tested. In the presence of
maltose, the rate of aggregation was significantly lower than in its absence, which correlates perfectly
with the already done observation of maltose being able to stabilize IgG facing heat induced
denaturation.
It is also important to refer that the decreasing aggregation tendency observed for the final period
of incubation may be related to native domains initially present in solution being locked in the formed
aggregates.
Maltose proved to give, once again, a positive contribution to IgG stabilization, being generally able
to reduce the tendency for aggregation. The addition of sugars to the protein solution is a popular
approach to stabilize the protein and thereby reduce access to partially unfolded states that favor
aggregation by hydrophobic contacts. The mechanism is the same described before: the sugars are
preferentially excluded from the surface of the protein hence favoring a compact state (3). Protein
structures that exist in such a confined volume tend toward their state of minimum hydrodynamic
volume, being the protein structure stabilized by a confined environment (17).
At last, it is important to include an extra remark. Even though the results for the pH and the
temperature effect on aggregation cannot be quantitatively compared (once the sizes measured do
not result from the same distribution), a qualitative comparison indicates a higher tendency for
aggregation upon heat treatment. This should have been expected given the observed formation of IgG
precipitates at those conditions which didn’t occur upon incubation at pH ≈ 2.

57
5 CONCLUSION AND FUTURE PRESPECTIVES
Long-term stability of IgG depends on the conformational stability and structural properties of
individual IgG molecules (19). The protein chain can assume many possible conformations, the relative
stabilities of which are very sensitive to pH, ionic strength and temperature, amongst other factors (3).
It was observed that IgG is stable upon pH induced denaturation at a pH of approximately 3 but, for
lower pH values (pH ≈ 2) irreversible denaturation occurs in a certain extent. Regarding the thermal
induced denaturation, IgG was found to be relatively stable at 60°C since that most molecules in
solution maintain their biological activity. However, some gentle alterations in the secondary structure
occur upon incubation at this temperature. When the temperature is increased to 70°C extensive
irreversible denaturation occurs given that the major portion of molecules in solution loses their
biological activity and significant changes occur at the secondary structure of IgG. Large IgG
precipitates are also formed after heat treatment at 70°C, being this aggregation step the one that
confers irreversibility to the heat denaturation process. Upon imposed mechanical shear forces, IgG
was capable of maintaining its structure and remaining biologically active, being able to sustain shear
stress up to 49 Pa. Finally, it was observed a tendency for aggregation upon incubation at 70°C at an
elevated aggregation rate which is consistent with the observation made during the heat treatment of
IgG. For the pH effect on aggregation, it was observed a lower tendency for aggregation at elevated pH
(pH ≈ 11), while for a low pH (pH ≈ 2) the particle size increased contrasting with the theoretical
prevision of a lower tendency for aggregation at this pH range.
Maltose at a concentration of 10% (w/v) was found to be the best IgG stabilizer from amongst the
additives studied. In fact it proved to be a quite appropriate stabilizer for IgG since it accomplishes a
full stabilization at low pH (approximately 2), with no loss of biological activity and no alterations in the
secondary structure. It also allows a complete stabilization of IgG in a concentration of 1 g/L against
heat denaturation at 70°C in terms of the ratio of IgG molecules that remain biologically active.
However, the secondary structure showed some alterations after incubation which may only guarantee
that the Fc fragment is stabilized in this situation (since the determination of the retained biological
activity is done based on the affinity of Protein A and G for the Fc-fragment). For the remaining initial
concentrations of IgG in solution the stabilization achieved wasn’t as good but it was still higher than in
the absence of maltose. In general, maltose was also able to reduce the tendency for aggregation both
facing thermal and pH denaturation inducing conditions.

58
It is important to note that the conditions studied are extreme conditions that normally would not
occur in a regular storage environment. This means that if maltose is added to a therapeutic
formulation in a concentration similar to the one studied it should be expected to provide full
stabilization of the IgG molecules, since the environmental conditions are far gentler than the ones
studied.
It should also be noticed that the results from previous studies can be useful as a starting point to
understand the mechanisms adjacent to the induced denaturation processes studied, but should not
be used to strictly compare the resulting data because the type of IgG used in the tests may have a
significant impact on the results obtained.
Future Perspectives
The fact that IgG can resist the shear forces imposed by the CCSD suggests that vorticular flow
membrane modules may be used as an alternative/complementary purification process for IgG.
However, in order to use this system in the downstream process further study is required, namely,
studying the mechanical shear stress induced degradation at higher protein concentrations that many
therapeutic formulations require.
It is known that aggregation is generally quite site specific involving well-defined oligomerization
interfaces but the molecular details of the aggregation process lack some insight. (3) For this reason, at
the present the prevention of aggregation remains largely empirical. Further studies on the
aggregation molecular mechanisms may contribute to find a more specific and more appropriate way
to prevent the formation of aggregates.
Sugars are commonly applied for IgG stabilization, frequently in somewhat high concentrations (5-
10%). However, some sugars, such as maltose and sucrose, may cause adverse effects upon a regular
use which can include renal failure (19). Further work should thus comprise the study of alternative
formulations combining two or more additives that would allow the decrease of the sugar
concentration to a more physiological acceptable one. Alternative compounds that might stabilize the
antibody without endangering patient health by adverse side effects should also be investigated.
Hydrophobic amino acids have been reported as promising alternatives to sugars (19).

59
REFERENCES
[1] 1. Vermeer, A. W.P., Bremer, M. G.E.G. and Norde, W. Structural changes of IgG
induced by heat treatment and by adsorption onto a hydrophobic Te£on surface
studied by circular dichroism spectroscopy. Biochimica et Biophysica Acta. 1425:1-12,
1998.
[2] 2. Antibody Purification Handbook. GE Healthcare Life Sciences. [Online] [Citação: 30
de Março de 2011.]
http://www.gelifesciences.com/aptrix/upp00919.nsf/content/LD_153975280-R350.
[3] 3. Frokjaer, S. and Otzen, D. E. Protein Drug Stability: A Formulation Challenge.
Nature Reviews. 4:298-305, 2005.
[4] 4. Delves, P.J., Martin, S.J., Burton, R.D. and Roitt, I.M. Roitt's essential
immunology. Massachussets, USA : Blackwell Publishing, 2006.
[5] 5. Kayser, F.H., Bienz, K.A., Eckert, J. and Zinkernagel, R.M. Medical
Microbiology. Stuttgart, Germany : Thieme, 2004.
[6] 6. Monoclonal Antibodies: Structures and Characteristics. The University of New
Mexico. [Online] [Citação: 5 de Junho de 2011.]
http://www.unm.edu/~mpachman/Antibodies%20Project/heavy.htm.
[7] 7. Brekke, O.H. and Sandlie, I. Therapeutic antibodies for human diseases at the
dawn of the twenty-first century. Nature Reviews Drug Discovery . 2:52-56, 2003.
[8] 8. Little, M., Kipriyanov, S.M., Le Gall, F. and Moldenhauer, G. Of mice and men:
hybridoma and recombinant antibodies. Immunology Today. 21:364-370, 2000.
[9] 9. Chon, J.H. and Zarbis-Papastoitsis, G. Advances in the production and
downstream processing of antibodies. New Biotechnology. 28:458-463, 2011.
[10] 10. Pavlou, A.K.and Belsey, M.J. The therapeutic antibodies market to 2008.
European Journal of Pharmaceutics and Biopharmaceutics. 59:389-396, 2005.
[11] 11. ElBakri, A., Nelson, P.N. and Abu Odeh, R.O. The state of antibody therapy.
American Society for Histocompatibility and Immunogenetics. 71:1243-1250, 2010.
[12] 12. U.S. Food and Drug Administration. [Online] [Citação: 10 de Maio de 2011.]
http://www.fda.gov/.
[13] 13. European Medicines Agengy. [Online] [Citação: 10 de Maio de 2011.]
http://www.ema.europa.eu/ema/index.jsp?curl=/pages/home/Home_Page.jsp&jsen
abled=true.

60
[14] 14. Bermudez, O. and Forciniti, D. Aggregation and denaturation of antibodies: a
capillary electrophoresis, dynamic light scattering, and aqueous two-phase
partitioning study. Journal of Chromatography B. 807:17-24, 2004.
[15] 15. Alexander, A.J. and Hughes, D.E. Monitoring of IgG Antibody Thermal Stability
by Micellar Electrokinetic Capillary Chromatography and Mat rix-Assisted Laser
Desorpt ion/lonizat ion Mass Spectrometry. Analytical Chemistry. 1995, Vol. 67.
[16] 16. Vermeer, A.W.P. and Norde, W. The Thermal Stability of Immunoglobulin:
Unfolding and Aggregation of a Multi-Domain Protein. Biophysical Journal. 78:394-
404, 2000.
[17] 17. —. The influence of the binding of low molecular weight surfactants on the
thermal stability and secondary structure of IgG. Colloids and Surfaces. 161:139-150,
2000.
[18] 18. Welfle, K., Misselwitz, R., Hausdorf, G., Höhne, W. and Welfle, H.
Conformation, pH-induced conformational changes, and thermal unfolding of anti-p24
(HIV-1) monoclonal antibody CB4-1 and its Fab and Fc fragments. Biochimica et
Biophysica Acta. 1431:120-131, 1999.
[19] 19. Szenczi, A., Kardos, J., Medgyesi, G.A. and Závodszky, P. The effect of solvent
environment on the conformation and stability of human polyclonal IgG in solution.
Biologicals. 34:5-14, 2006.
[20] 20. Liu, H., Gaza-Bulseco, G. and Sun, J. Characterization of the stability of a fully
human monoclonal IgG after prolonged incubation at elevated temperature. Journal
of Chromatography B. 837:35-43, 2006.
[21] 21. Kanmert, D., Brorsson, A., Jonsson, B. and Enander, K. Thermal Induction of an
Alternatively Folded State in Human IgG-Fc. Biochemistry. 50:981-988, 2011.
[22] 22. Downstream processing with hydrophilic membranes in rotary filtration systems -
Benchmark manual by Membrex (Garfield, NJ, USA).
[23] 23. Wereley, S. T. and Lueptow, R. M. Inertial particle motion in a Taylor Couette
rotating filter. Physics of Fluids. 11:325-333, 1999.
[24] 24. Jaffrin, M.Y. Dynamic shear-enhanced membrane filtration: A review of rotating
disks, rotating membranes and vibrating systems. Journal of Membrane Science.
324:7-25, 2008.
[25] 25. Kroner, K. H., Nissinen, V. and Ziegler, H. Improved Dynamic Filtration of
Microbial Suspensions. Biotechnology. 5:921-926, 1987.
[26] 26. Wu, M.L., Freitas, S.S., Monteiro, G.A., Prazeres, D.M.F. and Santos, J.A.L.
Stabilization of naked and condensed plasmid DNA against degradation induced by

61
ultrasounds and high-shear vortices. Biotechnology Applied Biochemistry. 53:237-246,
2009.
[27] 27. Belfort, G., Pimbley, J.M., Greiner, A. and Chung, K.Y. Diagnosis of membrane
fouling using a rotating annular filter. Journal of Membrane Science. 77:1-22, 1993.
[28] 28. Maa, Y. and Hsu, C.C. Effect of High Shear on Proteins. Biotechnology and
Bioengineering. 51:458-465, 1996.
[29] 29. Cuatrecasas, P. Protein Purification by Affinity Chromatography. Journal of
Biological Chemistry. 245:3059-3065, 1970.
[30] 30. Affinity Chromatography, Principles and Methods. GE Healthcare Life Sciences.
[Online] [Citação: 20 de Março de 2011.]
http://www.gelifesciences.com/aptrix/upp00919.nsf/content/LD_149605979-F640.
[31] 31. Hjelm, H., Hjelm, K. and Sjöquist,J. Protein A from Staphylococcus Aureus. Its
isolation by affinity chromatography and its use as an immunosorbent for isolation of
immunoglobulins. FEBS Letters. 28:73-76, 1972.
[32] 32. Bailon, P., Ehrlich, G.K., Fung, W. and Berthold, W. Affinity Chromatography,
Methods and Protocols. New Jersey, USA : Humana Press, 2000.
[33] 33. Huse, K., Böhme, H. and Scholz,G.H. Purification of antibodies by affinity
chromatography. Journal of biochemical and biophysical methods. 51:217-231, 2002.
[34] 34. Gore, M.G. Spectrophotometry and Spectrofluorimetry. New York, USA : Oxford
University Press, 2000.
[35] 35. Borlido, L. Extraction of human IgG in thermo-sensitive aqueous two-phase
systems: Assessment of structural stability by circular dichroism. 2009.
[36] 36. Berova, N., Nakanishi, K.and Woody, R.W. Circular dichroism: principles and
applications. USA : Wiley-VCH, 2000.
[37] 37. Circular Dichroism Spectroscopy. [Online] [Citação: 7 de Abril de 2011.]
http://www.ruppweb.org/cd/cdtutorial.htm.
[38] 38. Kelly, S. M., Thomas, J.J. and Price, N.C. How to study proteins by circular
dichroism. 1751:119-139, 2005.
[39] 39. Circular Dichorism (CD) Spectroscopy. [Online] [Citação: 2 de Abril de 2011.]
http://mach7.bluehill.com/proteinc/cd/cdspec.html#Theory.
[40] 40. Berne, B.J. and Pecora, R. Dynamic light scattering: with applications to
chemistry, biology, and physics. New York, USA : Courier Dover Publications, 2000.
[41] 41. Alliance Protein Laboratories. [Online] [Citação: 15 de Abril de 2011.]
http://www.ap-lab.com/light_scattering.htm.

62
[42] 42. Dynamic Light Scattering: An Introduction in 30 Minutes. Malvern Innovative
solutions in material characterization. [Online] [Citação: 5 de Maio de 2011.]
http://www.malvern.com/malvern/kbase.nsf/search?readform&t=product&q=Zetasiz
er%20Nano&start=11.
[43] 43. Intensity – Volume – Number Which Size is Correct? Malvern Innovative solutions
in material characterization. [Online]
http://www.malvern.com/malvern/kbase.nsf/search?readform&t=product&q=Zetasiz
er%20Nano&start=11.
[44] 44. Borlido, L., Azevedo, A.M. and Aires-Barros, M.R. Extraction of Human IgG in
Thermo-Responsive Aqueous Two-Phase Systems: Assessment of Structural Stability
by Circular Dichroism. Separation Science and Technology. 45:2171-2179, 2010.
[45] 45. Arakawa, T. and Timasheff, S.N. Stabilization of Protein Structure by Sugars.
Biochemistry. 21:6536-6544, 1982.
[46] 46. The Engineering ToolBox. [Online] [Citação: 20 de Outubro de 2011.]
http://www.engineeringtoolbox.com/.
[47] 47. Chang, L., Sheperd, D., Sun, J., Ouellette,D., Grant, K.L., Tang, X. and Pikal,
M.J. Mechanism of Protein Stabilization by Sugars During Freeze-Drying and Storage:
Native Structure Preservation, Specific Interaction, and/or Immobilization in a Glassy
Matrix? Journal of Pharmaceutical Sciences. 94:1427-1442, 2005.

63
APPENDIX A - RELEVANT LITERATURE DATA
Table A.1 – Physicochemical properties (Relative Molecular Weigth of the molecule and the heavy chain and
Isoelectric point) of the several subclasses of Human IgG (2).
Immunoglobulin Relative Molecular Weight (Mr) (kDa) Mr (heavy chain) (kDa) pI
IgG1 146 50 5.0 – 9.5
IgG2 146 50 5.0 – 8.5
IgG3 170 60 8.2 – 9.0
IgG4 146 50 5.0 – 6.0
Table A.2 – Binding and elution conditions commonly used with Protein A for Human IgG purification (values
for each subclass) (2).
Immunoglobulin Protein A binding pH Protein A elution pH
IgG1 6.0 – 7.0 3.5 – 4.5
IgG2 6.0 – 7.0 3.5 – 4.5
IgG3 8.0 – 9.0 ≤7.0
IgG4 7.0 – 8.0 3.0 – 6.0
Table A.3 – Data used in the calculations of the average and maximum shear rate and wall shear stress at the
membrane surface. Dimensions of the rotary separation chamber: inner and outter cylinder radius (cm) an
anular gap (mm) (22) and water dynamic and cinematic viscosity at 20°C1 (46).
Rinner (cm) 2.20
e (mm) 2.3
μwater (Pa.s) at 20°C 1.002x10⁻³
νwater (m2/s) at 20°C 1.004x10⁻⁶
1 The properties considered for the IgG solution were the water properties.

64
APPENDIX B - RETAINED BIOLOGICAL ACTIVITY OVER TIME
B.1. IgG INCUBATED IN PBS
B.1.1. Incubation at 60°C
Figure B.1 - Retained Biological Activity (%) over time (h) of incubation at 60°C of IgG in PBS (pH 7.4) with the
initial concentrations of 1, 5, 10 and 15 g/L.
B.1.2. Incubation at 70°C
Figure B.2 - Retained Biological Activity (%) over time (h) of incubation at 70°C of IgG in PBS (pH 7.4) with the
initial concentrations of 1, 5, 10 and 15 g/L.
0
20
40
60
80
100
0 10 20 30 40 50 60
Re
tain
ed
Bio
logi
cal A
ctiv
ity
(%)
Time (h)
1 g/L 5 g/L 10 g/L 15 g/L
0
10
20
30
40
50
60
70
80
90
100
0 5 10 15 20 25 30 35 40
Re
tain
ed
Bio
logi
cal A
ctiv
ity
(%)
Time (h)
1g/L 5g/L 10g/L 15g/L

65
B.1.3. Incubation at pH 3.02
Figure B.3 - Retained Biological Activity (%) over time (h) of incubation of IgG solutions with PBS at pH 3.02
with the initial concentrations of 1, 5, 10 and 15 g/L.
B.1.4. Incubation at pH 2.1
Figure B.4 - Retained Biological Activity (%) over time (h) of incubation of IgG solutions with PBS at pH 2 with
the initial concentrations of 1, 5, 10 and 15 g/L.
0
20
40
60
80
100
0 10 20 30 40 50 60
Re
tain
ed
Bio
logi
cal A
ctiv
ity
(%)
Time (h)
1 g/L 5 g/L 10 g/L 15 g/L
0
20
40
60
80
100
0 2 4 6 8 10
Re
tain
ed
Bio
logi
cal A
ctiv
ity
(%)
Time (h)
1 g/L 5 g/L 10 g/L 15 g/L

66
B.1.5. Mechanical Shear Stress
Figure B.5 - Retained Biological activity (%) over time (min) of induced mechanical shear stress with the inner
cylinder rotating at 1000, 2000 and 3000 rpm and 3000 rpm for the initial concentrations of IgG of 1 g/L and
15 g/L, respectively.
B.2. INCUBATION IN THE PRESENCE OF MALTOSE
B.1.6. Incubation at 70°C
Figure B.6 – Comparison of the Retained Biological activity (%) over time (h) of induced thermal denaturation
(70°C) for the initial concentrations of IgG in PBS with (continuous line) and without (dashed line) 10% (w/v)
maltose of 1, 5, 10 and 15 g/L, respectively.
0
20
40
60
80
100
0 5 10 15 20 25 30 35Re
tain
de
Bio
logi
cal A
ctiv
ity
(%)
Time (min)
2000 rpm 1000 rpm 3000 rpm 3000 rpm (15g/L)
0
20
40
60
80
100
0 2 4 6 8 10
Re
tain
ed
Bio
logi
cal A
ctiv
ity
(%)
Time (h)
1 g/L 5 g/L 10 g/L 15 g/L
1g/L in PBS 5g/L in PBS 10g/L in PBS 15g/L in PBS

67
B.1.7. Incubation at pH ≈ 2
Figure B.7 – Comparison of the Retained Biological activity (%) over time (h) of pH induced denaturation (pH ≈
2) for the initial concentrations of IgG in PBS with and without 10% (w/v) maltose of 1, 5, 10 and 15 g/L,
respectively.
0
20
40
60
80
100
0 2 4 6 8 10
Re
tain
ed
Bio
logi
cal A
ctiv
ity
(%)
Time (h)
1 g/L 5 g/L 10 g/L 15 g/L
1g/L in PBS 5g/L in PBS 10g/L in PBS 15g/L in PBS

68
APPENDIX C - CD SPECTRA
Figure C.1- Far-UV CD spectra of IgG in PBS with 10% (w/v) of glycine (pH ≈ 7) before incubation () and after 8
hours of incubation () at 70°C for the initial concentration of (A) 1 g/L, (B) 5 g/L, (C) 10 g/L and (D) 15 g/L.
-5
-4
-3
-2
-1
0
1
2
3
4
5
205 225 245
[θ]
mrw
(1
03
de
g cm
2 d
mo
l-1
)
λ (nm)
-5
-4
-3
-2
-1
0
1
2
3
4
5
205 225 245
[θ]
mrw
(1
03 d
eg
cm2
dm
ol-
1)
λ (nm)
-5
-4
-3
-2
-1
0
1
2
3
4
5
205 225 245
[θ]
mrw
(1
03
de
g cm
2 d
mo
l-1
)
λ (nm)
-5
-4
-3
-2
-1
0
1
2
3
4
5
205 225 245
[θ]
mrw
(1
03 d
eg
cm2
dm
ol-
1)
λ (nm)

69
Figure C.2- Far-UV CD spectra of IgG in PBS with 10% (w/v) of glycine before incubation () and after 9 hours
of incubation () at pH 2.1 for the initial concentration of (A) 1 g/L, (B) 5 g/L, (C) 10 g/L and (D) 15 g/L.
-7
-5
-3
-1
1
3
5
205 225 245
[θ]
mrw
(1
03
de
g cm
2 d
mo
l-1
)
λ (nm)
-7
-5
-3
-1
1
3
5
205 225 245
[θ]
mrw
(1
03
de
g cm
2 d
mo
l-1
)
λ (nm)
-7
-5
-3
-1
1
3
5
205 225 245
[θ]
mrw
(1
03
de
g cm
2 d
mo
l-1
)
λ (nm)
-7
-5
-3
-1
1
3
5
205 225 245
[θ]
mrw
(1
03
de
g cm
2 d
mo
l-1
)
λ (nm)

70
Figure C.3 - Far-UV CD spectra of IgG in PBS with 10% (w/v) of D-trehalose (pH ≈ 7) before incubation () and
after 8 hours of incubation () at 70°C for the initial concentration of (A) 1 g/L, (B) 5 g/L, (C) 10 g/L and (D) 15 g/L.
-5
-4
-3
-2
-1
0
1
2
3
4
5
200 210 220 230 240 250
[θ]
mrw
(1
03
de
g cm
2 d
mo
l-1
)
λ (nm) -5
-4
-3
-2
-1
0
1
2
3
4
5
200 210 220 230 240 250
[θ]
mrw
(1
03
de
g cm
2 d
mo
l-1
)
λ (nm)
-5
-4
-3
-2
-1
0
1
2
3
4
5
200 210 220 230 240 250
[θ]
mrw
(1
03
de
g cm
2 d
mo
l-1
)
λ (nm)
-5
-4
-3
-2
-1
0
1
2
3
4
5
200 210 220 230 240 250
[θ]
mrw
(1
03
de
g cm
2 d
mo
l-1
)
λ (nm)

71
Figure C.4 - Far-UV CD spectra of IgG in PBS with 10% (w/v) of trehalose (pH ≈ 7) before incubation () and
after 9 hours of incubation () at pH 2.1 for the initial concentration of (A) 1 g/L, (B) 5 g/L, (C) 10 g/L and (D)
15 g/L.
-5
-4
-3
-2
-1
0
1
2
3
4
5
200 210 220 230 240 250
[θ]
mrw
(1
03
de
g cm
2 d
mo
l-1
)
λ (nm)
-5
-4
-3
-2
-1
0
1
2
3
4
5
200 210 220 230 240 250
[θ]
mrw
(1
03
de
g cm
2 d
mo
l-1
)
λ (nm)
-5
-4
-3
-2
-1
0
1
2
3
4
5
200 210 220 230 240 250
[θ]
mrw
(1
03
de
g cm
2 d
mo
l-1
)
λ (nm)
-5
-4
-3
-2
-1
0
1
2
3
4
5
200 210 220 230 240 250
[θ]
mrw
(1
03
de
g cm
2 d
mo
l-1
)
λ (nm)

72
Figure C.5 - Far-UV CD spectra of IgG in PBS with 10% (w/v) of sucrose (pH ≈ 7) before incubation () and after
8 hours of incubation () at 70°C for the initial concentration of (A) 1 g/L, (B) 5 g/L, (C) 10 g/L and (D) 15 g/L.
-5
-4
-3
-2
-1
0
1
2
3
4
5
200 210 220 230 240 250
[θ]
mrw
(1
03
de
g cm
2 d
mo
l-1
)
λ (nm) -5
-4
-3
-2
-1
0
1
2
3
4
5
200 210 220 230 240 250
[θ]
mrw
(1
03
de
g cm
2 d
mo
l-1
)
λ (nm)
-5
-4
-3
-2
-1
0
1
2
3
4
5
200 210 220 230 240 250
[θ]
mrw
(1
03
de
g cm
2 d
mo
l-1
)
λ (nm) -5
-4
-3
-2
-1
0
1
2
3
4
5
200 210 220 230 240 250
[θ]
mrw
(1
03
de
g cm
2 d
mo
l-1
)
λ (nm)

73
Figure C.6 - Far-UV CD spectra of IgG in PBS with 10% (w/v) of sucrose before incubation () and after 9 hours
of incubation () at pH 2.1 for the initial concentration of (A) 1 g/L, (B) 5 g/L, (C) 10 g/L and (D) 15 g/L.
-5
-4
-3
-2
-1
0
1
2
3
4
5
205 225 245
[θ]
mrw
(1
03
de
g cm
2 d
mo
l-1
)
λ (nm) -5
-4
-3
-2
-1
0
1
2
3
4
5
205 225 245
[θ]
mrw
(1
03
de
g cm
2 d
mo
l-1
)
λ (nm)
-5
-4
-3
-2
-1
0
1
2
3
4
5
205 225 245
[θ]
mrw
(1
03 d
eg
cm2
dm
ol-
1)
λ (nm) -5
-4
-3
-2
-1
0
1
2
3
4
5
205 225 245
[θ]
mrw
(1
03 d
eg
cm2
dm
ol-
1)
λ (nm)

74
Figure C.7 - Far-UV CD spectra of IgG in PBS with 2% (w/v) of maltose before incubation () and after 8 hours
of incubation () at 70°C for the initial concentration of (A) 1 g/L, (B) 5 g/L, (C) 10 g/L and (D) 15 g/L.
-5
-4
-3
-2
-1
0
1
2
3
4
5
200 210 220 230 240 250
θ m
rw (
10
3 d
eg
cm2
dm
ol-
1)
λ (nm) -5
-4
-3
-2
-1
0
1
2
3
4
5
200 210 220 230 240 250
θ m
rw (
10
3 d
eg
cm2
dm
ol-
1)
λ (nm)
-5
-4
-3
-2
-1
0
1
2
3
4
5
200 210 220 230 240 250
θ m
rw (
10
3 d
eg
cm2
dm
ol-
1)
λ (nm) -5
-4
-3
-2
-1
0
1
2
3
4
5
200 210 220 230 240 250
θ m
rw (
10
3 d
eg
cm2
dm
ol-
1)
λ (nm)

75
APPENDIX D - DLS SIZE DISTRIBUTIONS
D.1. EFFECT OF PH ON IgG AGGREGATION
Figure D.1. - Histogram showing the size distribution of an IgG solution in PBS (pH 2.1) before 9 hours of
incubation at pH ≈ 2, for the concentrations of row (A) 1 g/L and row (B) 15 g/L. The y-axis is the intensity of
the average scattered light (%) – Size distribution by Intensity - or total volume of particles in the different size
bins (%) – Size Distribution by Volume. The x-axis is the absolute size of the scatters (nm).

76
Figure D.2. - Histogram showing the size distribution of an IgG solution in PBS (pH 11.3) before 9 hours of
incubation at pH ≈ 11, for the concentrations of row (A) 1 g/L and row (B) 15 g/L. The y-axis is the intensity of
the average scattered light (%) – Size distribution by Intensity - or total volume of particles in the different size
bins (%) – Size Distribution by Volume. The x-axis is the absolute size of the scatters (nm).

77
Figure D.3. - Histogram showing the size distribution of an IgG solution in PBS with 10% (w/v) of maltose after
9 hours of incubation at pH 2.06 for the concentrations of (A) 1 g/L (B) 15 g/L. The y-axis is the intensity of the
average scattered light (%) – Size distribution by Intensity - or total volume of particles in the different size bins
(%) – Size Distribution by Volume. The x-axis is the absolute size of the scatters (nm).

78
Figure D.4. - Histogram showing the size distribution of an IgG solution in PBS with 10% (w/v) of maltose after
9 hours of incubation at pH 11.45 for the concentrations of row (A) 1 g/L and row (B) 15 g/L. The y-axis is the
intensity of the average scattered light (%) – Size distribution by Intensity - or total volume of particles in the
different size bins (%) – Size Distribution by Volume. The x-axis is the absolute size of the scatters (nm).

79
Figure D.5. - Histogram showing the size distribution of an IgG solution in PBS after 9 hours of incubation at pH
2.1 for the concentrations of (A) 1 g/L (B) 15 g/L. The y-axis is the intensity of the average scattered light (%) –
Size distribution by Intensity - or total volume of particles in the different size bins (%) – Size Distribution by
Volume. The x-axis is the absolute size of the scatters (nm).

80
Figure D.6. - Histogram showing the size distribution of an IgG solution in PBS after 9 hours of incubation at pH
11.3 for the concentrations of (A) 1 g/L (B) 15 g/L. The y-axis is the intensity of the average scattered light (%) –
Size distribution by Intensity - or total volume of particles in the different size bins (%) – Size Distribution by
Volume. The x-axis is the absolute size of the scatters (nm).

81
D.2. EFFECT OF TEMPERATURE ON IgG AGGREGATION
D.2.1. Initial and final (8 hours of incubation at 70°C) samples
Figure D.7. - Histogram showing the size distribution of an IgG solution (1 g/L) in row (A) PBS at room
temperature; row (B) PBS after 8 hours of incubation at 70°C; row (C) PBS with 10% (w/v) of maltose after 8
hours of incubation at 70°C. The y-axis is the intensity of the average scattered light (%) – Size distribution by

82
Intensity - or total volume of particles in the different size bins (%) – Size Distribution by Volume. The x-axis is
the absolute size of the scatters (nm).
Figure D.8. - Histogram showing the size distribution of an IgG solution (15 g/L) in row (A) PBS at room
temperature; row (B) PBS after 8 hours of incubation at 70°C; row (C) PBS with 10% (w/v) of maltose after 8

83
hours of incubation at 70°C. The y-axis is the intensity of the average scattered light (%) – Size distribution by
Intensity - or total volume of particles in the different size bins (%) – Size Distribution by Volume. The x-axis is
the absolute size of the scatters (nm).
D.2.2. 0.5 hours
Figure D.9. - Histogram showing the size distribution of an IgG solution in PBS after 0.5 hours of incubation at
70°C for the concentrations of (A) 1 g/L (B) 15 g/L. The y-axis is the intensity of the average scattered light (%) –
Size distribution by Intensity - or total volume of particles in the different size bins (%) – Size Distribution by
Volume. The x-axis is the absolute size of the scatters (nm).

84
Figure D.10. - Histogram showing the size distribution of an IgG solution in PBS with 10% (w/v) of maltose after
0.5 hours of incubation at 70°C for the concentrations of (A) 1 g/L (B) 15 g/L. The y-axis is the intensity of the
average scattered light (%) – Size distribution by Intensity - or total volume of particles in the different size bins
(%) – Size Distribution by Volume. The x-axis is the absolute size of the scatters (nm).

85
D.2.3. 1 hour
Figure D.11. - Histogram showing the size distribution of an IgG solution in PBS after 1 hour of incubation at
70°C for the concentrations of (A) 1 g/L (B) 15 g/L. The y-axis is the intensity of the average scattered light (%) –
Size distribution by Intensity - or total volume of particles in the different size bins (%) – Size Distribution by
Volume. The x-axis is the absolute size of the scatters (nm).

86
Figure D.12. - Histogram showing the size distribution of an IgG solution in PBS with 10% (w/v) of maltose after
1 hour of incubation at 70°C for the concentrations of (A) 1 g/L (B) 15 g/L. The y-axis is the intensity of the
average scattered light (%) – Size distribution by Intensity - or total volume of particles in the different size bins
(%) – Size Distribution by Volume. The x-axis is the absolute size of the scatters (nm).

87
D.2.4. 5 hours
Figure D.13. - Histogram showing the size distribution of an IgG solution in PBS after 5 hours of incubation at
70°C for the concentrations of (A) 1 g/L (B) 15 g/L. The y-axis is the intensity of the average scattered light (%) –
Size distribution by Intensity - or total volume of particles in the different size bins (%) – Size Distribution by
Volume. The x-axis is the absolute size of the scatters (nm).

88
Figure D.14. - Histogram showing the size distribution of an IgG solution in PBS with 10% (w/v) of maltose after
5 hours of incubation at 70°C for the concentrations of (A) 1 g/L (B) 15 g/L. The y-axis is the intensity of the
average scattered light (%) – Size distribution by Intensity - or total volume of particles in the different size bins
(%) – Size Distribution by Volume. The x-axis is the absolute size of the scatters (nm).

89
D.2.5. 6 hours
Figure D.15. - Histogram showing the size distribution of an IgG solution in PBS after 6 hours of incubation at
70°C for the concentrations of (A) 1 g/L (B) 15 g/L. The y-axis is the intensity of the average scattered light (%) –
Size distribution by Intensity - or total volume of particles in the different size bins (%) – Size Distribution by
Volume. The x-axis is the absolute size of the scatters (nm).

90
Figure D.16. - Histogram showing the size distribution of an IgG solution in PBS with 10% (w/v) of maltose after
6 hours of incubation at 70°C for the concentrations of (A) 1 g/L (B) 15 g/L. The y-axis is the intensity of the
average scattered light (%) – Size distribution by Intensity - or total volume of particles in the different size bins
(%) – Size Distribution by Volume. The x-axis is the absolute size of the scatters (nm).

91
D.2.6. 7 hours
Figure D.17. - Histogram showing the size distribution of an IgG solution in PBS after 7 hours of incubation at
70°C for the concentrations of (A) 1 g/L (B) 15 g/L. The y-axis is the intensity of the average scattered light (%) –
Size distribution by Intensity - or total volume of particles in the different size bins (%) – Size Distribution by
Volume. The x-axis is the absolute size of the scatters (nm).

92
Figure D.18. - Histogram showing the size distribution of an IgG solution in PBS with 10% (w/v) of maltose after
7 hours of incubation at 70°C for the concentrations of (A) 1 g/L (B) 15 g/L. The y-axis is the intensity of the
average scattered light (%) – Size distribution by Intensity - or total volume of particles in the different size bins
(%) – Size Distribution by Volume. The x-axis is the absolute size of the scatters (nm).