stability and sensitivity of thums pedestrian model and ... · stability and sensitivity of thums...
TRANSCRIPT
10th
European LS-DYNA Conference 2015, Würzburg, Germany
© 2015 Copyright by DYNAmore GmbH
Stability and Sensitivity of THUMS Pedestrian Model and its Trauma Response to a Real Life Accident
Lianjie Wen1, Christophe Bastien
1, Michael Blundell
1, Clive Neal-Sturgess
1, Kambiz Kayvantash
2
1 Coventry University
Faculty of engineering and Computing Coventry, CV1 5FB, UK
2 CADLM
43 Rue de Saule Trapu 91300 Massy, France
1 Introduction
With dramatically rapid development of computing and modelling technology, occupant and pedestrian safety models went through the development of crash test dummies and multi-body mathematical dynamic modelling to finite element pedestrian human model (THUMS 4.0). THUMS 4.0 is a state of art human model which includes a skeleton structure, as well as internal organs and soft tissues, which makes it a suitable candidate to analyze accident trauma. The THUMS model has been correlated at the limbs level [1], as well as successfully validated against rigid impactor tests, in frontal [1][2], lateral and oblique [3]. Nevertheless, the responses capture during these tests were overall force-displacement characteristics, not at the trauma and injury level [1][3], consequently more research is needed to investigate whether human models are accurate enough and adequate to capture trauma injury levels. The THUMS human model is based on finite element analysis and the injury threshold levels are captured using a plastic strain tensor and only a kinematics computation was undertaken as a mean of validating the model [1]. Little to no research has documented trauma correlation to real-life accidents, but only the kinematics [4] using accident data from the APROSYS database [5]. The APROSYS relates to pedestrian and cyclists fatalities and is limited in the detail photographic evidence on the damage vehicle and the deceased [5], as well as a computation of the thrown away distances and objective measurements of the accident scene. Consequently, Coventry University has approached West Midlands Police in order to access best in class accident data, used in criminal courts, in order to invesigate the accuracity and adequatness of the THUM human model. This paper investigates the stability of the THUMS pedestrian model in different impact scenarios, as well as performing an initial injury response comparison against a real-life pedestrian collision which occurred in Coventry (UK). The study will use a dataset of a fatal accident which has been recorded by West Midland Police (UK) and will focus on the ability for the THUMS model to relate to the pedestrian injury and trauma autopsy results.
2 THUMS Model Stability and Sensitivity
2.1 Stability
The purpose of this section is to investigate whether the THUMS model is stable against a vehicle impact when its position is changed from centreline. In order to investigate this, a generic sedan model was chosen (Toyota Yaris [6]), travelling at the legal limit of a European city of 30km/h and setup to collide with a pedestrian. Three positions were selected including:
the exact centre in front of vehicle – scenario 1
45 degree rotated back to vehicle and aligned with the centre of the vehicle – scenario 2
45-degree rotated back to vehicle and aligned with the outside edge of the vehicle – scenario 3
10th
European LS-DYNA Conference 2015, Würzburg, Germany
© 2015 Copyright by DYNAmore GmbH
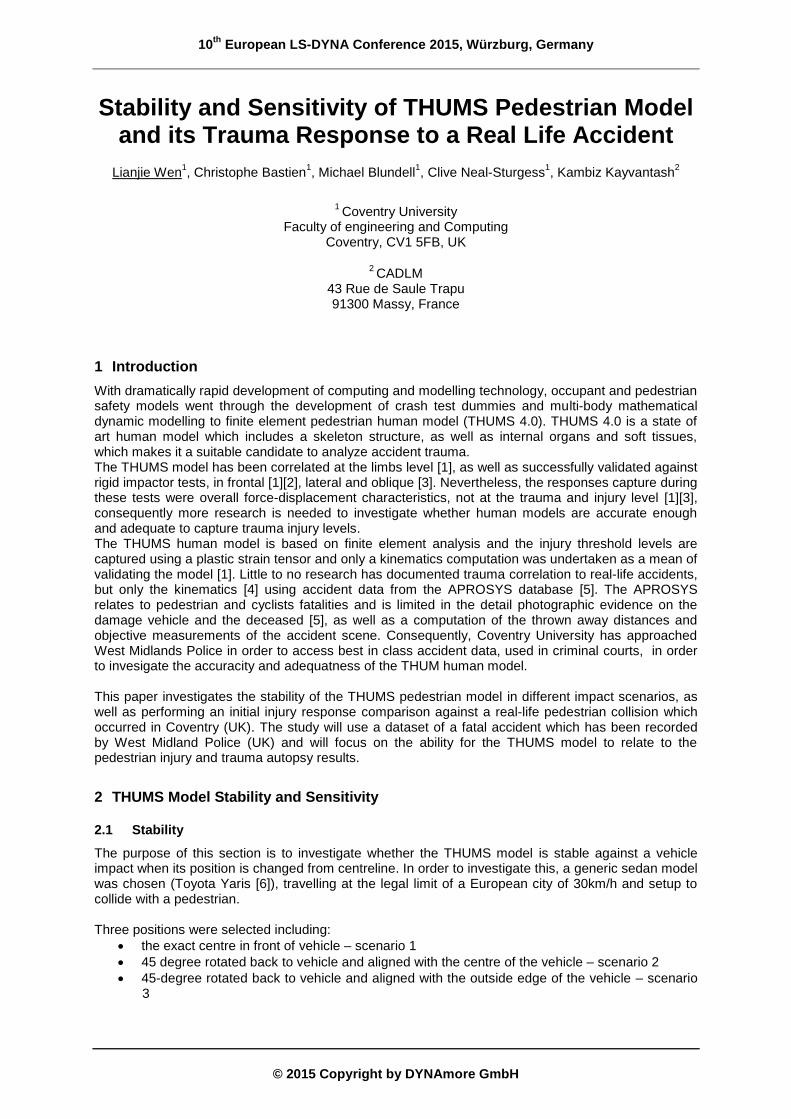
The Toyota Yaris model was validated against a frontal crash test and comprises of deformable structure and non-linear material properties card. The scenarios studied included a vertical gravity fiiled in the verical Z direction and a ground defined as a planar *RIGIDWALL to provide a non-
deformable surface used to position the vehicle and the pedestrian (Fig.1:).
Fig.1: Simulation scenarios used in stability check. Scenario 1 (Left), Scenario 2 (Middle), scenario 3 (Right)
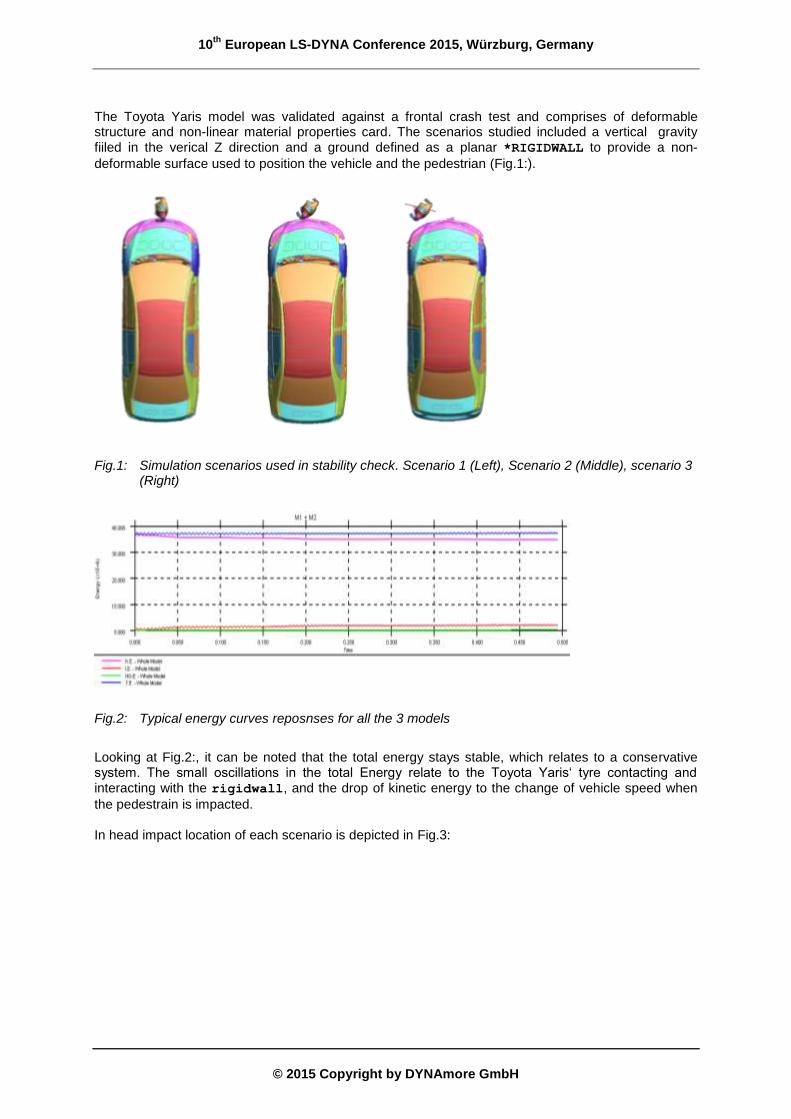
Fig.2: Typical energy curves reposnses for all the 3 models
Looking at Fig.2:, it can be noted that the total energy stays stable, which relates to a conservative system. The small oscillations in the total Energy relate to the Toyota Yaris‘ tyre contacting and interacting with the rigidwall, and the drop of kinetic energy to the change of vehicle speed when
the pedestrain is impacted. In head impact location of each scenario is depicted in Fig.3:
10th
European LS-DYNA Conference 2015, Würzburg, Germany
© 2015 Copyright by DYNAmore GmbH
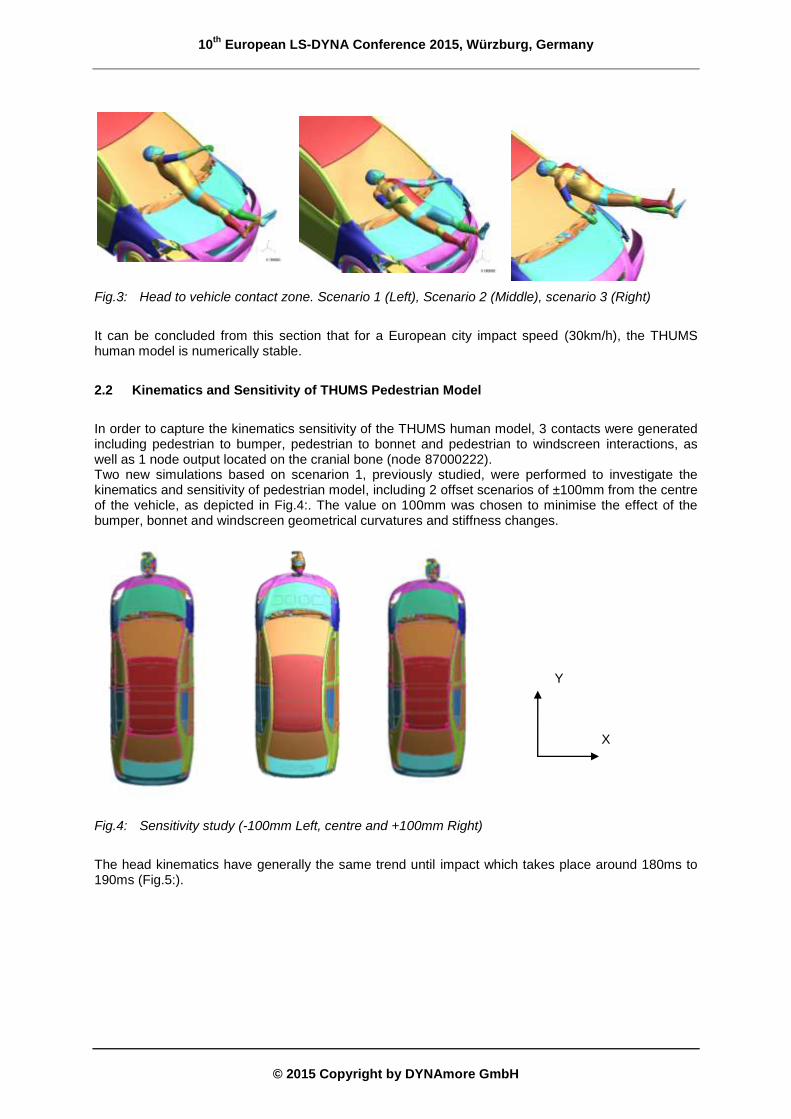
Fig.3: Head to vehicle contact zone. Scenario 1 (Left), Scenario 2 (Middle), scenario 3 (Right)
It can be concluded from this section that for a European city impact speed (30km/h), the THUMS human model is numerically stable.
2.2 Kinematics and Sensitivity of THUMS Pedestrian Model
In order to capture the kinematics sensitivity of the THUMS human model, 3 contacts were generated including pedestrian to bumper, pedestrian to bonnet and pedestrian to windscreen interactions, as well as 1 node output located on the cranial bone (node 87000222). Two new simulations based on scenarion 1, previously studied, were performed to investigate the kinematics and sensitivity of pedestrian model, including 2 offset scenarios of ±100mm from the centre of the vehicle, as depicted in Fig.4:. The value on 100mm was chosen to minimise the effect of the bumper, bonnet and windscreen geometrical curvatures and stiffness changes.
Fig.4: Sensitivity study (-100mm Left, centre and +100mm Right)
The head kinematics have generally the same trend until impact which takes place around 180ms to 190ms (Fig.5:).
X
Y
10th
European LS-DYNA Conference 2015, Würzburg, Germany
© 2015 Copyright by DYNAmore GmbH
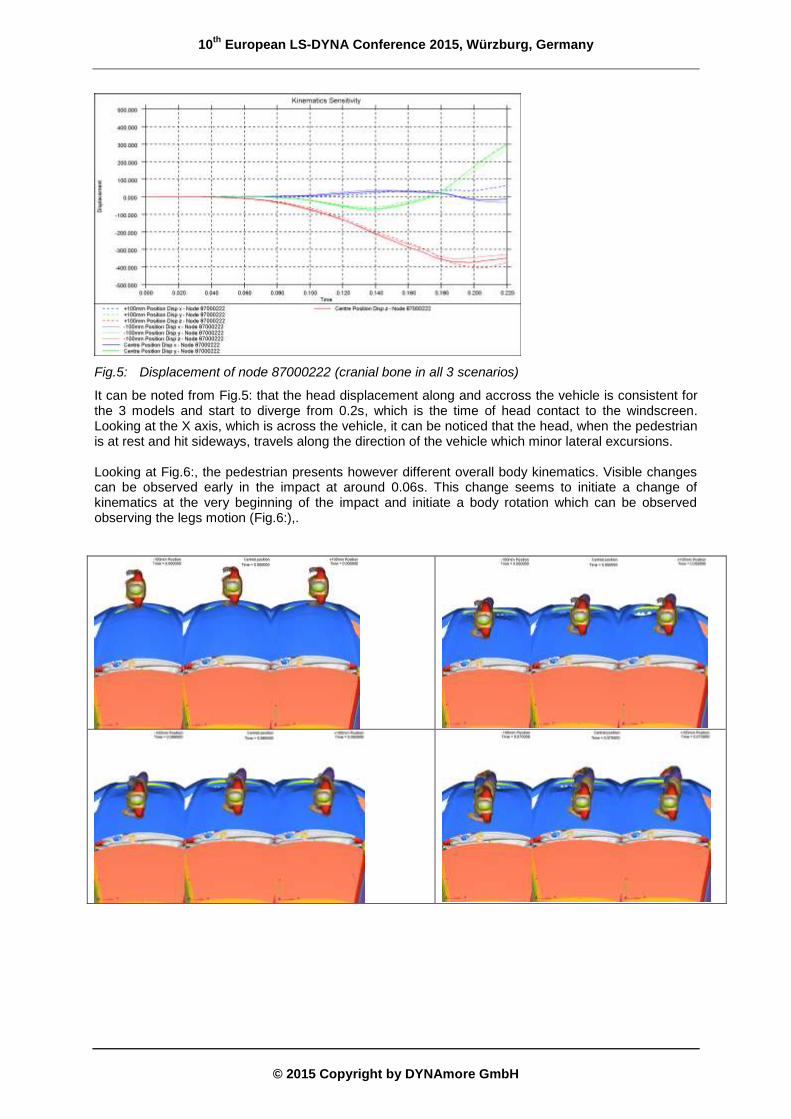
Fig.5: Displacement of node 87000222 (cranial bone in all 3 scenarios)
It can be noted from Fig.5: that the head displacement along and accross the vehicle is consistent for the 3 models and start to diverge from 0.2s, which is the time of head contact to the windscreen. Looking at the X axis, which is across the vehicle, it can be noticed that the head, when the pedestrian is at rest and hit sideways, travels along the direction of the vehicle which minor lateral excursions. Looking at Fig.6:, the pedestrian presents however different overall body kinematics. Visible changes can be observed early in the impact at around 0.06s. This change seems to initiate a change of kinematics at the very beginning of the impact and initiate a body rotation which can be observed observing the legs motion (Fig.6:),.
10th
European LS-DYNA Conference 2015, Würzburg, Germany
© 2015 Copyright by DYNAmore GmbH
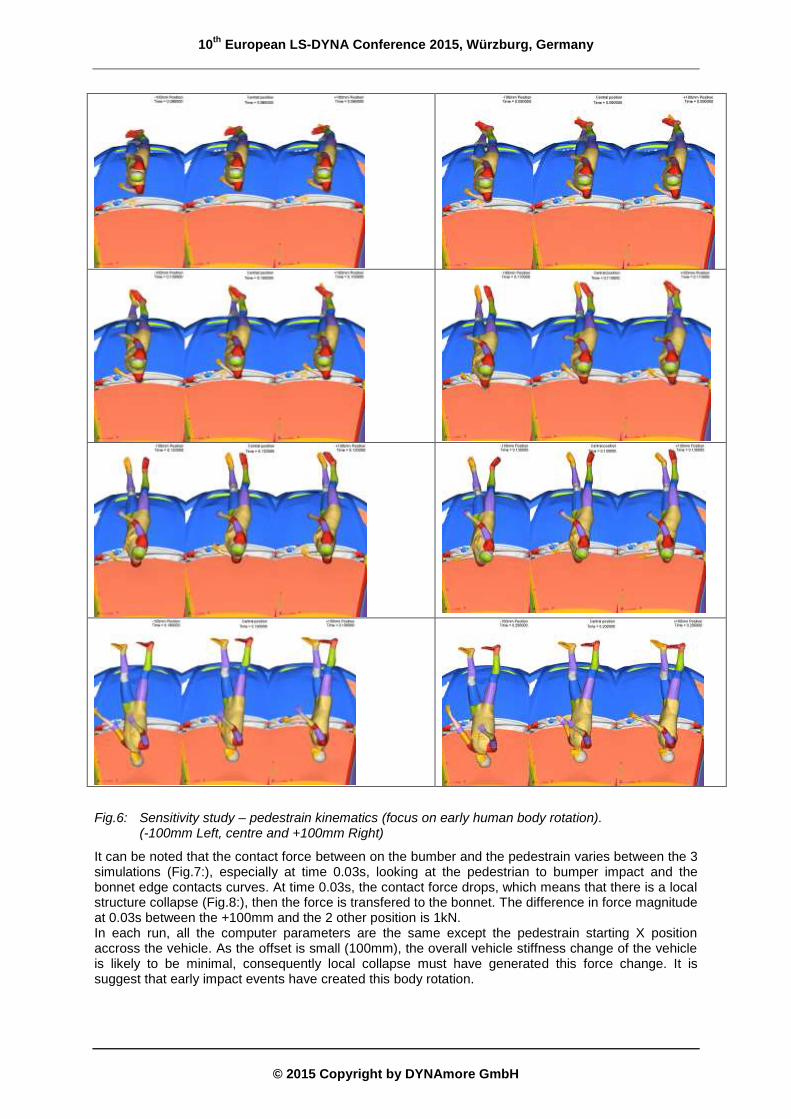
Fig.6: Sensitivity study – pedestrain kinematics (focus on early human body rotation). (-100mm Left, centre and +100mm Right)
It can be noted that the contact force between on the bumber and the pedestrain varies between the 3 simulations (Fig.7:), especially at time 0.03s, looking at the pedestrian to bumper impact and the bonnet edge contacts curves. At time 0.03s, the contact force drops, which means that there is a local structure collapse (Fig.8:), then the force is transfered to the bonnet. The difference in force magnitude at 0.03s between the +100mm and the 2 other position is 1kN. In each run, all the computer parameters are the same except the pedestrain starting X position accross the vehicle. As the offset is small (100mm), the overall vehicle stiffness change of the vehicle is likely to be minimal, consequently local collapse must have generated this force change. It is suggest that early impact events have created this body rotation.
10th
European LS-DYNA Conference 2015, Würzburg, Germany
© 2015 Copyright by DYNAmore GmbH
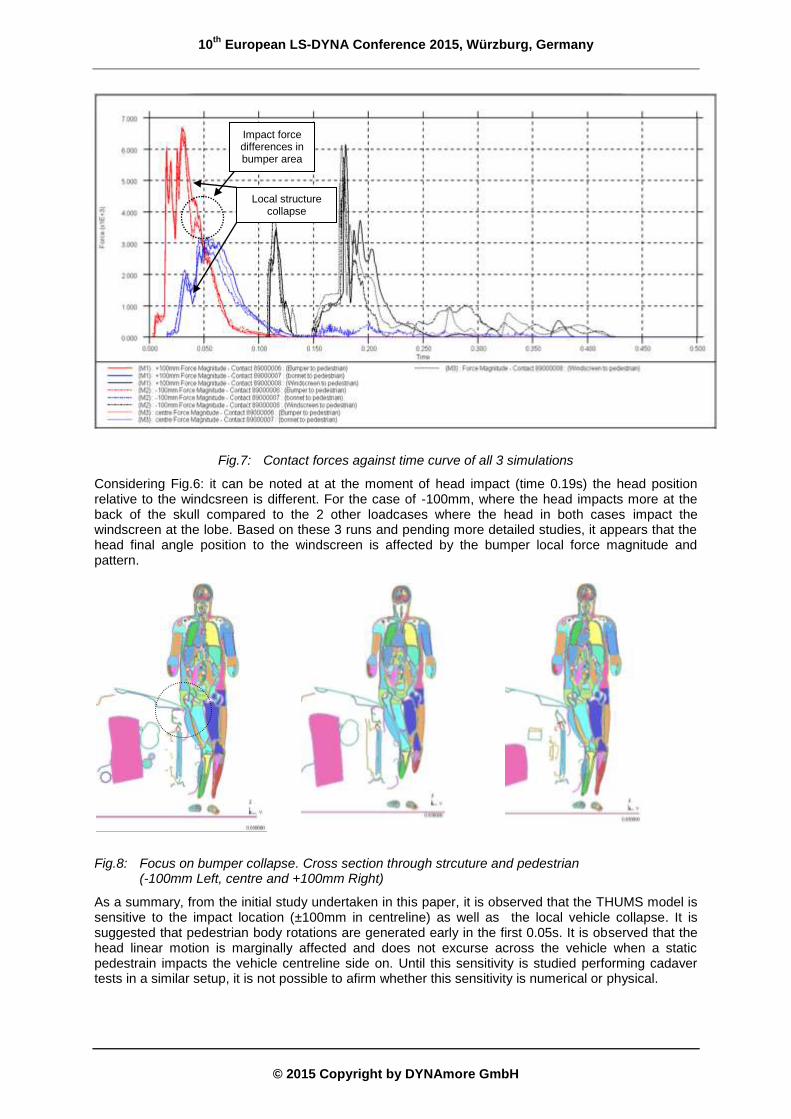
Fig.7: Contact forces against time curve of all 3 simulations
Considering Fig.6: it can be noted at at the moment of head impact (time 0.19s) the head position relative to the windcsreen is different. For the case of -100mm, where the head impacts more at the back of the skull compared to the 2 other loadcases where the head in both cases impact the windscreen at the lobe. Based on these 3 runs and pending more detailed studies, it appears that the head final angle position to the windscreen is affected by the bumper local force magnitude and pattern.
Fig.8: Focus on bumper collapse. Cross section through strcuture and pedestrian (-100mm Left, centre and +100mm Right)
As a summary, from the initial study undertaken in this paper, it is observed that the THUMS model is sensitive to the impact location (±100mm in centreline) as well as the local vehicle collapse. It is suggested that pedestrian body rotations are generated early in the first 0.05s. It is observed that the head linear motion is marginally affected and does not excurse across the vehicle when a static pedestrain impacts the vehicle centreline side on. Until this sensitivity is studied performing cadaver tests in a similar setup, it is not possible to afirm whether this sensitivity is numerical or physical.
Impact force differences in bumper area
Local structure collapse
10th
European LS-DYNA Conference 2015, Würzburg, Germany
© 2015 Copyright by DYNAmore GmbH
3 Trauma Comparison against a Real-Life accident
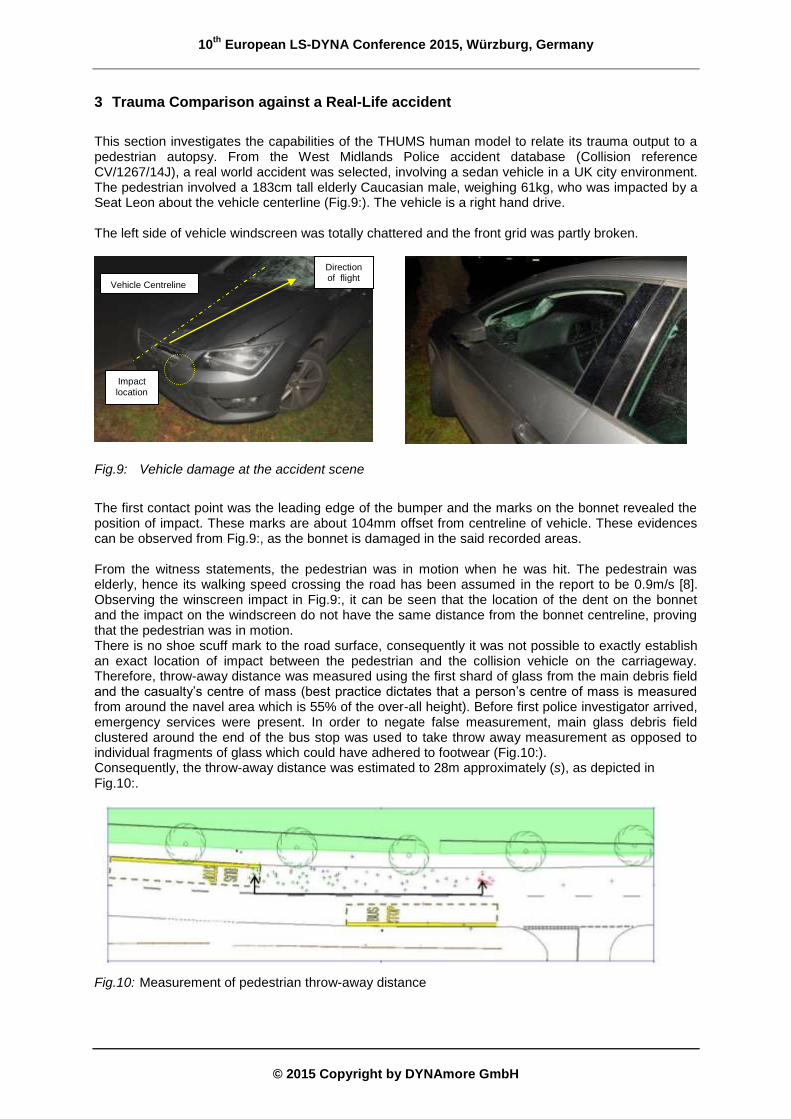
This section investigates the capabilities of the THUMS human model to relate its trauma output to a pedestrian autopsy. From the West Midlands Police accident database (Collision reference CV/1267/14J), a real world accident was selected, involving a sedan vehicle in a UK city environment. The pedestrian involved a 183cm tall elderly Caucasian male, weighing 61kg, who was impacted by a Seat Leon about the vehicle centerline (Fig.9:). The vehicle is a right hand drive. The left side of vehicle windscreen was totally chattered and the front grid was partly broken.
Fig.9: Vehicle damage at the accident scene
The first contact point was the leading edge of the bumper and the marks on the bonnet revealed the position of impact. These marks are about 104mm offset from centreline of vehicle. These evidences can be observed from Fig.9:, as the bonnet is damaged in the said recorded areas. From the witness statements, the pedestrian was in motion when he was hit. The pedestrain was elderly, hence its walking speed crossing the road has been assumed in the report to be 0.9m/s [8]. Observing the winscreen impact in Fig.9:, it can be seen that the location of the dent on the bonnet and the impact on the windscreen do not have the same distance from the bonnet centreline, proving that the pedestrian was in motion. There is no shoe scuff mark to the road surface, consequently it was not possible to exactly establish an exact location of impact between the pedestrian and the collision vehicle on the carriageway. Therefore, throw-away distance was measured using the first shard of glass from the main debris field and the casualty’s centre of mass (best practice dictates that a person’s centre of mass is measured from around the navel area which is 55% of the over-all height). Before first police investigator arrived, emergency services were present. In order to negate false measurement, main glass debris field clustered around the end of the bus stop was used to take throw away measurement as opposed to individual fragments of glass which could have adhered to footwear (Fig.10:). Consequently, the throw-away distance was estimated to 28m approximately (s), as depicted in Fig.10:.
Fig.10: Measurement of pedestrian throw-away distance
Vehicle Centreline
Impact location
Direction of flight
10th
European LS-DYNA Conference 2015, Würzburg, Germany
© 2015 Copyright by DYNAmore GmbH
During the site visit, the coefficient of friction (µ) has been measured to 0.7; consequently, it is possible to evaluate the vehicle impact speed [7] the based on µ, the throw distance s and g (9.81m/s
2), as per Table 1:
16.07 m/s (57.9km/h) 19.61 m/s (70.6km/h)
Table 1: Minimum and maximum vehicle impact speeds calculated from the throw distance and road surface condition
Consequently, it can be noted that, unless video evidence of the impact is obtained, it is very difficult to ascertain the exact throw away distance and vehicle impact speed. If the throw away distance is 28m and the vehicle travelling at 19.61m/s , then the approximate timing for the body to come at rest would be around 1.4s, which is currently out-of the reach of most computers, because of the runtime duration (computing 0.2s takes on Coventry University’s hardware (160 cores per run) 24h). Consequently should the throw distance be correlated, the current THUMS model should be able to do it, but to date it is not practical. In the autopsy results, it was stated that the impacted leg was the right one, which is not logical, as the vehicle was on the left hand side of the pedestrian vehicle before impact. Consequently the left leg had to be hit first. As the pedestrian was in motion, it is suggested that his left leg was not touching the floor and was momentarily not load bearing. Consequently, the left leg mus have been impacted first, but as no bearing load was present at the time, no damage was observed. As the weight was on the right leg, the impact force was therefore transmitted, causing injuries to this limbs (as recorded in the autopsy). As the final stance was not exactly know, as a pre-study, the THUMS model was set with the legs side by side.
4 Analysis
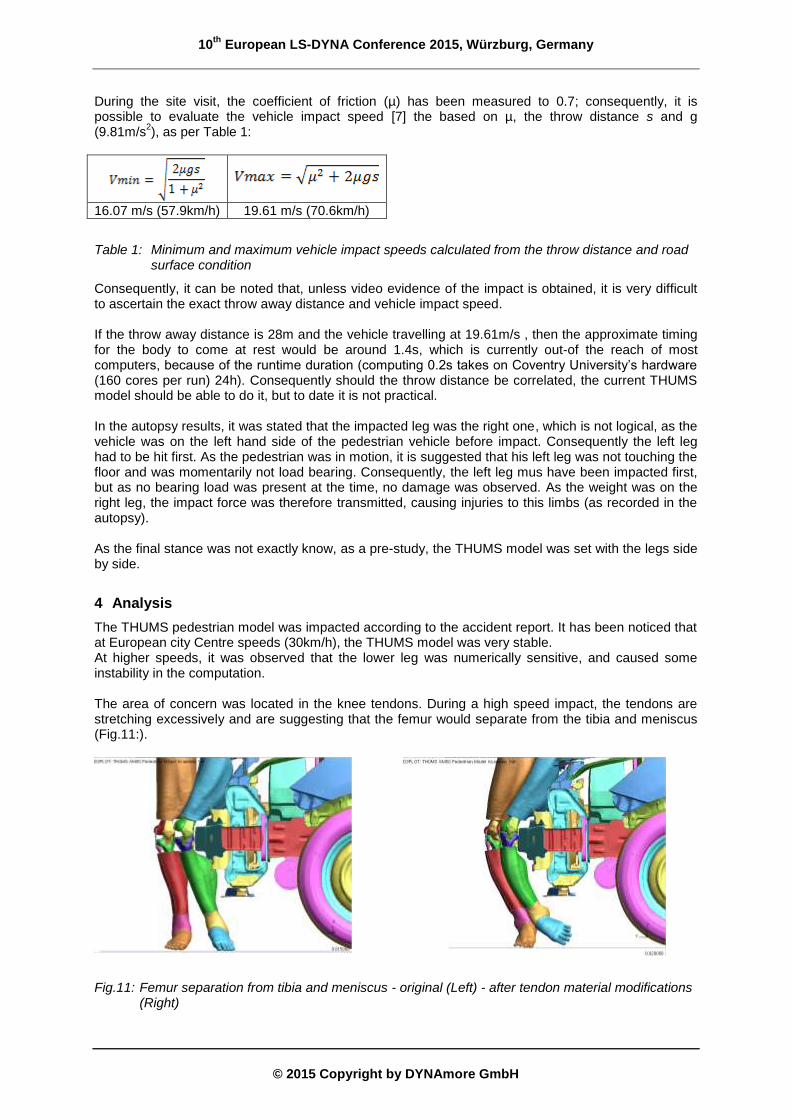
The THUMS pedestrian model was impacted according to the accident report. It has been noticed that at European city Centre speeds (30km/h), the THUMS model was very stable. At higher speeds, it was observed that the lower leg was numerically sensitive, and caused some instability in the computation. The area of concern was located in the knee tendons. During a high speed impact, the tendons are stretching excessively and are suggesting that the femur would separate from the tibia and meniscus (Fig.11:).
Fig.11: Femur separation from tibia and meniscus - original (Left) - after tendon material modifications (Right)
10th
European LS-DYNA Conference 2015, Würzburg, Germany
© 2015 Copyright by DYNAmore GmbH
From the base THUMS model, means of stabilizing the knee area (negative volumes) included:
Changing element formulation of the tendons from ‘1’ to ‘2’ and ‘10’
Changing the hourglass control to stiffen the tendons
Adding Eroding values to the tendon the material card to 10%
Adding a CONTROL_SOLID switch to remove solids with negative volumes
Changing the knee flesh element formulation from ‘13’ to ‘10’. None of these changes gave the necessary stability in the knee area for such impact speeds. It has been observed that the THUMS 4.01 model does not contain any failure criterion in this knee area and maybe some improvements would be required to provide more stability to over-stretched solid elements. As the autopsy only refered to a tibia and fibula fracture and not tibia separation from the femur, it has been assumed that the knee was intact. Consequently, the tendon material properties were altered from a *SIMPLIFIED_MAT_RUBBER to a simple *MAT_ELASTIC material card including a stiff
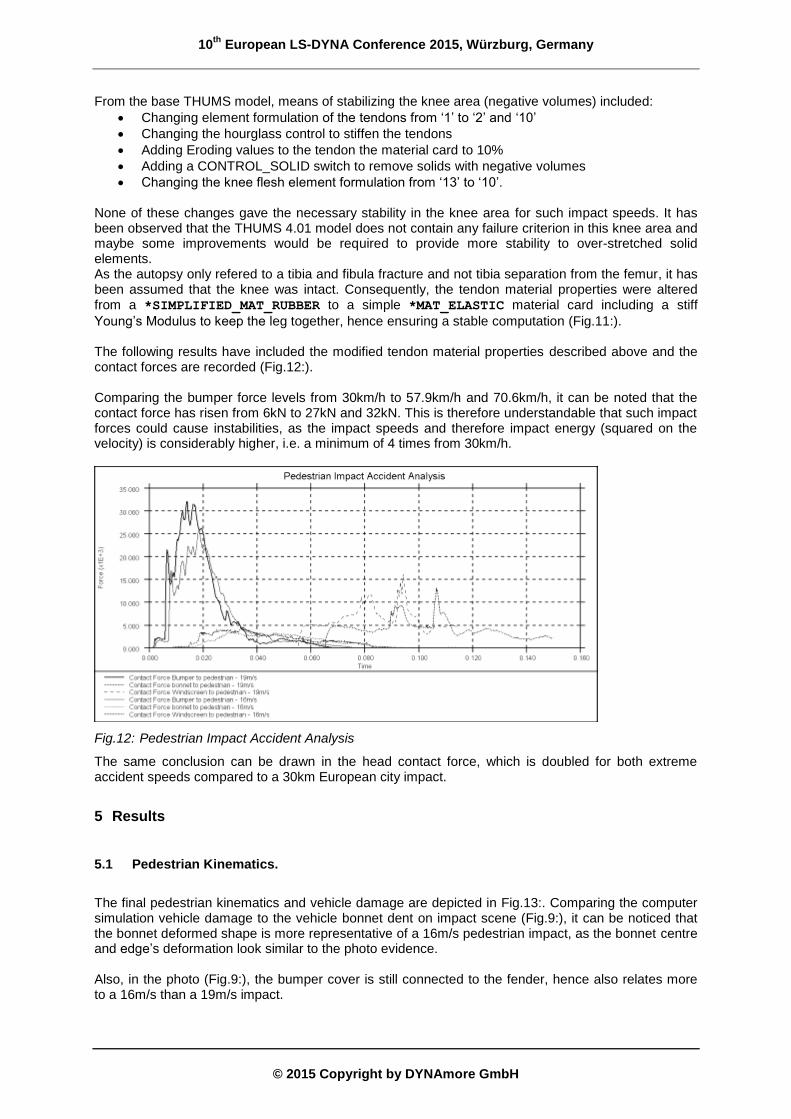
Young’s Modulus to keep the leg together, hence ensuring a stable computation (Fig.11:). The following results have included the modified tendon material properties described above and the contact forces are recorded (Fig.12:). Comparing the bumper force levels from 30km/h to 57.9km/h and 70.6km/h, it can be noted that the contact force has risen from 6kN to 27kN and 32kN. This is therefore understandable that such impact forces could cause instabilities, as the impact speeds and therefore impact energy (squared on the velocity) is considerably higher, i.e. a minimum of 4 times from 30km/h.
Fig.12: Pedestrian Impact Accident Analysis
The same conclusion can be drawn in the head contact force, which is doubled for both extreme accident speeds compared to a 30km European city impact.
5 Results
5.1 Pedestrian Kinematics.
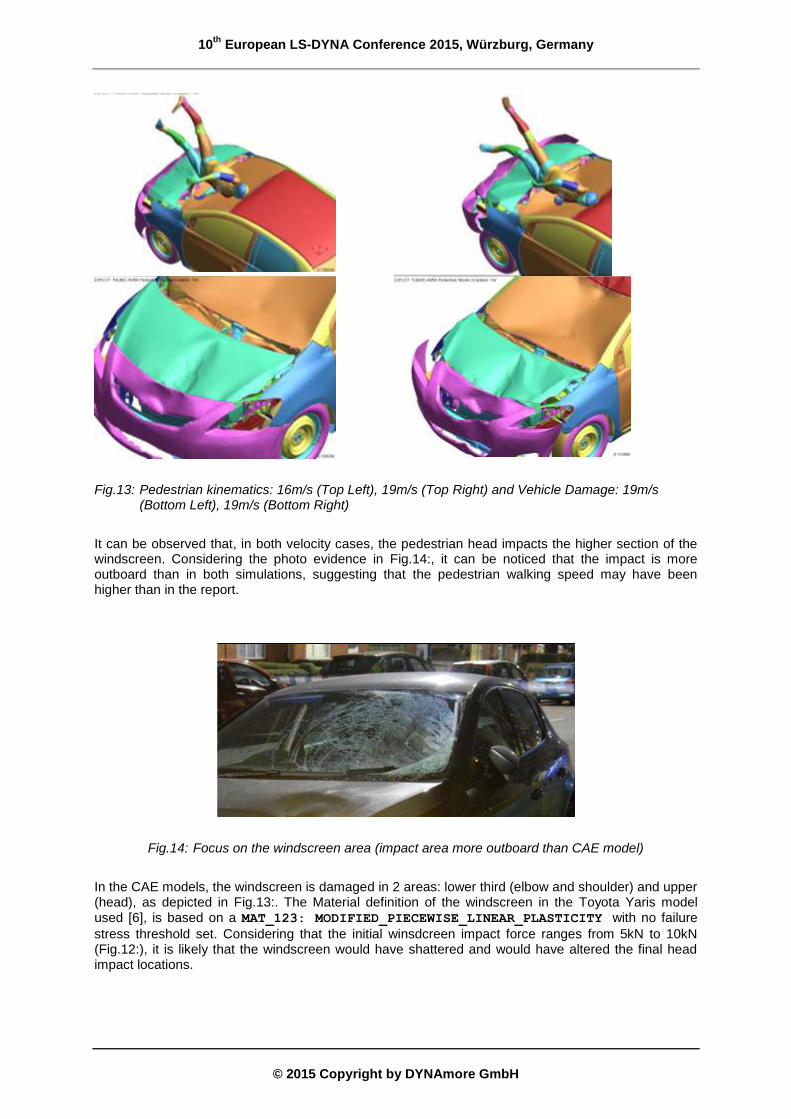
The final pedestrian kinematics and vehicle damage are depicted in Fig.13:. Comparing the computer simulation vehicle damage to the vehicle bonnet dent on impact scene (Fig.9:), it can be noticed that the bonnet deformed shape is more representative of a 16m/s pedestrian impact, as the bonnet centre and edge’s deformation look similar to the photo evidence. Also, in the photo (Fig.9:), the bumper cover is still connected to the fender, hence also relates more to a 16m/s than a 19m/s impact.
10th
European LS-DYNA Conference 2015, Würzburg, Germany
© 2015 Copyright by DYNAmore GmbH
Fig.13: Pedestrian kinematics: 16m/s (Top Left), 19m/s (Top Right) and Vehicle Damage: 19m/s (Bottom Left), 19m/s (Bottom Right)
It can be observed that, in both velocity cases, the pedestrian head impacts the higher section of the windscreen. Considering the photo evidence in Fig.14:, it can be noticed that the impact is more outboard than in both simulations, suggesting that the pedestrian walking speed may have been higher than in the report.
Fig.14: Focus on the windscreen area (impact area more outboard than CAE model)
In the CAE models, the windscreen is damaged in 2 areas: lower third (elbow and shoulder) and upper (head), as depicted in Fig.13:. The Material definition of the windscreen in the Toyota Yaris model used [6], is based on a MAT_123: MODIFIED_PIECEWISE_LINEAR_PLASTICITY with no failure
stress threshold set. Considering that the initial winsdcreen impact force ranges from 5kN to 10kN (Fig.12:), it is likely that the windscreen would have shattered and would have altered the final head impact locations.

10th
European LS-DYNA Conference 2015, Würzburg, Germany
© 2015 Copyright by DYNAmore GmbH
The pedestrian trauma injuries relating to the lowest and highest impact velocities are now going to be extracted following different body region and will be assessed against the THUMS trauma criteria threshold [1]:
Head and Neck
Skeletal
Internal Organ
5.2 Head and neck areas
5.2.1 Superficial head area
Speed 16m/s It can be observed that there are high strain areas in the left neck area. Lesions at the level of the lobes in temporal, frontal and occipital areas with lower strains on the right hand side of the neck.
Fig.15: Posterior (Left) and Lateral view (Right) of head and neck at 16m/s
It can be observed an important risk of lesions around the neck, of the forehead left area. The locartion of these injuries relate to the autopsy report. i.e “abrasion the frontal forehead to the left of the midline and measuring 9x8cm“.
Speed 19m/s It can be observed that there is a high risk of lesions around the front left side of the neck with a higher area strain value higher than at 16m/s at the frontal lobe. The abration area seems to relate more to the autopsy than at 16m/s.
10th
European LS-DYNA Conference 2015, Würzburg, Germany
© 2015 Copyright by DYNAmore GmbH
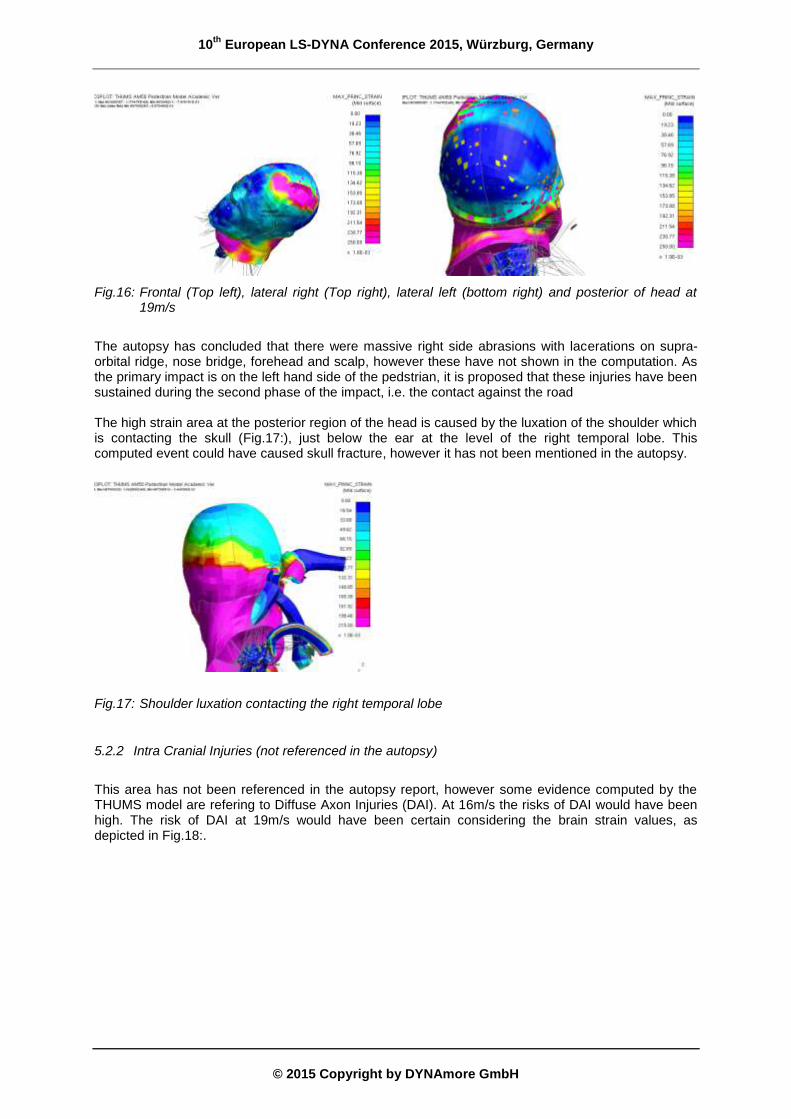
Fig.16: Frontal (Top left), lateral right (Top right), lateral left (bottom right) and posterior of head at 19m/s
The autopsy has concluded that there were massive right side abrasions with lacerations on supra-orbital ridge, nose bridge, forehead and scalp, however these have not shown in the computation. As the primary impact is on the left hand side of the pedstrian, it is proposed that these injuries have been sustained during the second phase of the impact, i.e. the contact against the road The high strain area at the posterior region of the head is caused by the luxation of the shoulder which is contacting the skull (Fig.17:), just below the ear at the level of the right temporal lobe. This computed event could have caused skull fracture, however it has not been mentioned in the autopsy.
Fig.17: Shoulder luxation contacting the right temporal lobe
5.2.2 Intra Cranial Injuries (not referenced in the autopsy)
This area has not been referenced in the autopsy report, however some evidence computed by the THUMS model are refering to Diffuse Axon Injuries (DAI). At 16m/s the risks of DAI would have been high. The risk of DAI at 19m/s would have been certain considering the brain strain values, as depicted in Fig.18:.
10th
European LS-DYNA Conference 2015, Würzburg, Germany
© 2015 Copyright by DYNAmore GmbH
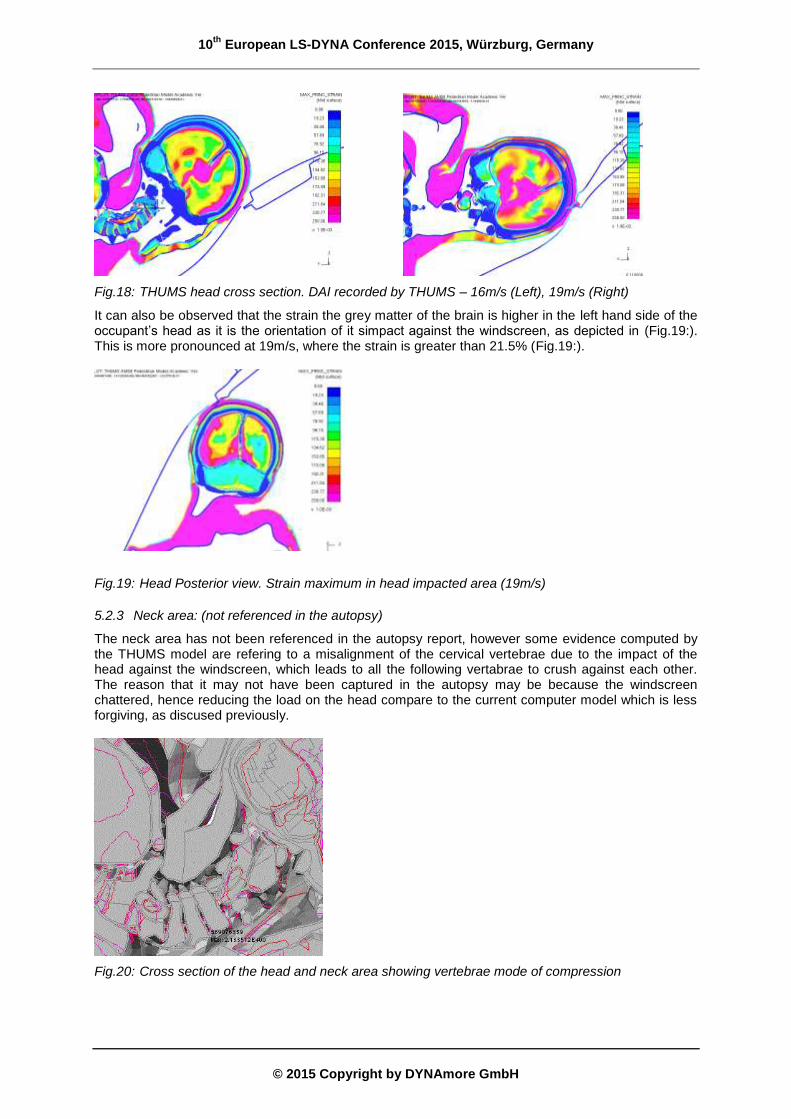
Fig.18: THUMS head cross section. DAI recorded by THUMS – 16m/s (Left), 19m/s (Right)
It can also be observed that the strain the grey matter of the brain is higher in the left hand side of the occupant’s head as it is the orientation of it simpact against the windscreen, as depicted in (Fig.19:). This is more pronounced at 19m/s, where the strain is greater than 21.5% (Fig.19:).
Fig.19: Head Posterior view. Strain maximum in head impacted area (19m/s)
5.2.3 Neck area: (not referenced in the autopsy)
The neck area has not been referenced in the autopsy report, however some evidence computed by the THUMS model are refering to a misalignment of the cervical vertebrae due to the impact of the head against the windscreen, which leads to all the following vertabrae to crush against each other. The reason that it may not have been captured in the autopsy may be because the windscreen chattered, hence reducing the load on the head compare to the current computer model which is less forgiving, as discused previously.
Fig.20: Cross section of the head and neck area showing vertebrae mode of compression

10th
European LS-DYNA Conference 2015, Würzburg, Germany
© 2015 Copyright by DYNAmore GmbH
5.3 Skeletal
The autopsy report refered to the following trauma:
Compound fracture through the distal aspect of the right tibia and fibia
Transverse fracture which appeared unstable through 9th thoracic vertebrae
Fractures to posterior and anterior aspects of the left 1st to 12th ribs
Fractures to the anterior aspect of the right 1st and 9th ribs
Fracture of the left clavicle
Multiple fracture of the pelvis Considering the pelvis area, it can be noticed that there is a high level of strains in the hip and pelvis areas. At 16m/s, strains are observed in the pelvis area, however these are less at 19m/s, where fractures are suggested, as per the autopsy (Fig.21:).
Fig.21: Comparison of pelvis strains. 16m/s (Left) and 19m/s (Right)
Focussing on the knee area, it can also be noted that the right knee at 16m/s contains high level of strains but not enough to suggest fracture. Conveniently, at 19m/s, there is a clear fracture of the tibia and fibia, as the autopsy suggests (Fig.22:). .
Fig.22: Comparison of tibia and fibia strains. 16m/s (Left) and 19m/s (Right)
It can be noted in Fig.22: that the left knee has been damaged on the THUMS model. In the autopsy results, it was stated that the impacted leg was the right one. As the pedestrian was in motion, it is suggested that his left leg was not touching the floor and did not bear any load. The left knee fractures seen in Fig.22: are a consequence of the initial model posture assumption and consequntly should be ignored. It can be noted that in both speed cases, the THUMS predicts a femur fracture, which has not been observed in the autopsy. For the case of the clavicles, in both speeds, the left clavicle is fractured, as depicted in Fig.23:. from the autopsy report, however it is not clear where the clavicle is broken. For 16m/s, it is suggested from the strain plots that both ends are damaged, as per the autopsy.

10th
European LS-DYNA Conference 2015, Würzburg, Germany
© 2015 Copyright by DYNAmore GmbH
At 19m/s the strain values are less than for the lower speed, which maybe be caused by the fact that the pedestrian landed differently on the bonnet giving a different loading in the clavicle area. These values do not suggest fracture.
Fig.23: Clavicle fracture. 16m/s (Left), 19m/s (Right)
Considering the ribs, it can be observed that for both speeds, there is a risk of fracture of ribs 1 to 12 in the anterior area, with more important strains for 19m/s. In the posterior area, it can be seen that the 3rd to the 8th rib are likely to fracture at 19m/s (similar to the autopsy), while for 16m/s the damage would be focused mainly on the 8th rib (Fig.24:).
Fig.24: Comparison of rib risk fracture. 16m/s anterior (top left), lateral (bottom left) and 19m/s anterior (top right), lateral (bottom right)
5.4 Internal Organs
The THUMS model is able to output trauma values which can be compared to the autoposy results [1]. Considering the heart, both speeds refer to local strains, however do not manage to capture the fact that the pericardial cavity is ruptured in the autopsy (Fig.25:).

10th
European LS-DYNA Conference 2015, Würzburg, Germany
© 2015 Copyright by DYNAmore GmbH
Fig.25: Strains in heart area. 16m/s (Left) and 19m/s (Right).
Concerning the gastro-intestinal system, the autopsy stated that “the liver showed obvious rupture over the anterior surface. There was rupture of the spleen“. The Uro-Genital system section of the autopsy related to “perinephric haemorrhage around both kidneys“
Fig.26: Strain in spleen (Top),kidneys (Middle) and liver (Bottom). 16m/s (Left) and 19m/s (Right).
Considering Fig.26:, it can be noted that at both speeds the strainvaluess in the kidney exceed 30%. The area affected at 19m/s is larger and relates more to the autospy results. For the spleen, there are strain levels for both speeds (again matching with the autopsy), however higher strain levels are
10th
European LS-DYNA Conference 2015, Würzburg, Germany
© 2015 Copyright by DYNAmore GmbH
observed at 19m/s. It can be noted that no damage to the liver can be observed at 16m/s, while at 19m/s, the plastic strain value reached 18%, which is close to the 21% to confirm trauma.
6 Discussion
The study has shown that the computed pedestrian head end positions look different, because no failure criteria in the windscreen have been set in the standard Toyota Yaris computer model [6]. Consequently, in order to replicate the final head impact location, this windscreen feature would need to be implemented in future studies. Two areas have been highlighted by the THUMS model, referring to the neck area and the connection between the grey matter and the skull (DAI), but not in the autopsy. It is believed that this is caused by the fact that the computer model’s windscreen does not numerically fail on impact, hence causing artificial forces in the head which is then compressing the vertebrae (Fig.20:). Consequently, the THUMS trauma outcome and the autopsy results diverge in the neck area. Overall, the THUMS model was able to compute trauma values to internal organs (liver, kidney and spleen) successfully matching the area referenced in the autopsy, especially at 19m/s. Heart damage was not correctly captured for either speed. The THUMS predictions were also promising in the ribs area, where comparable damage was observed at 19m/s in a comparable area. The clavicle damage was observed in the autopsy, but only well captured by the 16m/s impact, while marginal fracture was predicted for a 19m/s pedestrian impact. There was a level of interpretation in the leg positions and the likelihood of which leg would have bared the initial body weight just before the impact. Nevertheless the trauma of the right leg accident outcome matched the autopsy results for 19m/s. Knowing, from the initial sensitivity study discussed in this paper that the primary leg impact to bumper has significant effect on the pedestrian body rotation, it is suggested that more left leg position variations need to be investigated to capture a wider range of kinematics and trauma outcomes to ascertain the initial pedestrian stance prior to impact. It was also suggested that the pedestrian walking speed may have been faster than in the report. This can be observed by the impact offset from the bonnet contact area which is less pronounced in the CAE model which is using and *INITIAL_VELOCITY_GENERATION command setting the pedestrian
walking pace at 0.9m/s. It has to be considered, however, that the victim was 8cm taller and 14kg lighter than the THUMS model used. Future studies would require personalizing the human computer model to represent the victim with more accuracy to ensure that mass distributions are representative; hence provide a more accurate kinematics and walking speed estimation. The study has shown in detail the difficulties to evaluate the throw distance at the accident site and that, without video evidence, it is very difficult to be certain of the final distance. The throw-away distance has not been computed in this analysis because of the excessive runtime needed. This step in the future would be necessary, as other trauma injuries were recorded on the right hand side of the pedestrian and could only have been generated by a secondary impact, i.e. falling on the road (scalp bruising in head right area as well as to the right wrist and thumb). There does not seem to be an obvious solution to this computational challenge, as traumatology requires detailed meshes injury predictions, consequently long computation times. The CAE computations have suggested that the impact speed was more likely to be 16m/s than at 19m/s. The bonnet damage looks comparable between the analysis and the photo evidence. It has to be noted that the vehicle model used was of the same type (Sedan), but not the same (Toyota Yaris vs. Seat Leon), consequently some uncertainties in the structural deformation may be present, but to date not quantifiable. It has to be noted that no exact scans of the damaged bonnet deformation were available to the authors to assess whether the depth of the dent, i.e. related to the impact energy, was comparable with the computer model. In this paper, the damage assessment is only visual. Deformation data would have been an adequate mean to assess whether the bonnets stiffness were comparable between the Toyota Yaris and the Seat Leon and perform any necessary structural adjustments. Scanning the damaged vehicle at the accident scene would certainly help towards answering this important information, which would be needed to fine tune the accident reconstruction case. Considering the trauma output from THUMS, it is suggested that the vehicle impact speed to be nearer 19m/s than 16m/s, which is in contradiction with the finding based on the vehicle bonnet damage. Consequently, considering the limitations of this study, it can be suggested that there is no
10th
European LS-DYNA Conference 2015, Würzburg, Germany
© 2015 Copyright by DYNAmore GmbH
apparent link between pedestrian trauma, vehicle speed and vehicle visual damage. More detail data input will be needed to refine the study and confirm this statement, like the potential bonnet structural differences. It has to be observed however that based on the findings of this paper; the range of vehicle impact speed calculated in the West Midlands Police report is realistic.
7 Conclusions
The THUMS model has been tested against a 30km/h pedestrian impact scenario against a typical sedan vehicle, including different postures. The THUMS model proved to be stable at this speed. It has been observed that the kinematics of a pedestrian human model is sensitive at the early impact stage in the bumper area, as localized impact pattern responses dictate the body rotation during the accident. The paper has shown that the knee area is numerically sensitive and would require some improvements to allow the model to compute with much higher impact speeds (16m/s to 19m/s). After local modification of the knee ligament material definition, the THUMS model has shown to be very stable and provide some useful trauma information, which in some area related to the autopsy report provided by West Midlands Police. The THUMS organ trauma (liver, spleen and kidney) results gave a good correlation with the autopsy, as well with the right leg fracture, ribs fracture and head lesions. These trauma injuries were commonly observed at 19m/s (all at 19m/s). It has been observed that the modelling of windscreen shattering is necessary as artificial neck load, computed by THUMS, were not present in the autopsy report in both speed impact scenarios. Overall, the THUMS traumas output against the autopsy were adequate and sometimes differed from the postmortem report because of uncertainties in pedestrian walking speed, bonnet stiffness and windscreen material modelling properties. More research would be needed to reduce these uncertainties, as well as studying other pedestrian accidents, to provide a complete and objective status on the validation the THUMS pedestrian model.
8 Acknowledgments
The authors would like to thank Insp. 1023 R. Harris, Sgt 2205 R. Breeze and PC 6114 S. Jubb for their support and for providing the accident data presented in this publication. The authors are also grateful for the support provided by Yacine Diagne (Université de Reims) for her expertise in biomechanics, as well as Liliana Cowlan (ARUP) and Amit Prem (Coventry University) for their advice on model stability.
References
[1] THUMS, Total Human Model for Safety, AM50 Pedestrain Model. Academic Version
4.0_20111003, October 2011, Toyota Motor Corporation [2] Charles K. Kroell, D. C. S. A. M. N., 1974. Impact Tolerance and Response of the Human
Thorax II. [3] Joshua M. Shaw, R. G. H. J. D. M. B. R. D. J. H. B., 2006. Oblique and Lateral Impact
Response of the PMHS Thorax. Stapp Car Crash Journal, pp. 147-167. [4] AsPeCSS, EU funded project. http://www.aspecss-project.eu/ [5] APROSYS, EU funded project. http://cordis.europa.eu/result/rcn/47920_en.html [6] NCAC vehicle database, http://www.ncac.gwu.edu/vml/models.html [7] Searle J: The Trajectories of Pedestrians, Motorcycles, Motorcyclists etc. Following a Road
Accident SAE 831 622 (2007) [8] Asher et al: Most older pedestrians are unable to cross the road in time; a cross-sectional
study (2012)