stability and repair of dna adducts formed by food-borne
TRANSCRIPT

Shuo Yang
Stability and repair of DNA adducts formed by food-borne
alkenylbenzene liver carcinogens; consequences for hazards and risks
Stability and repair of D
NA
adducts formed by food-borne alkenylbenzene liver carcinogens; consequences for hazards and risks S
huo Yang
INVITATION
To attend the public defence of the dissertation
“Stability and repair of DNA adducts formed
by food-borne alkenylbenzene liver carcinogens;
consequences for hazards and risks”
byShuo Yang
onFriday, 14th of May, 2021
At 11:00 hrs
in an online defence ceremony
You are welcome to join via wurTV
https://weblectures.wur.nl/P2G/Player/Player.aspx?id=C226

Propositions
1. The current levels of dietary intake of estragole and safrole raise a concern.(this thesis)
2. Combining in vitro toxicity with in silico studies provides a strategy for evaluating the potential risks of compounds for which limited in vivo data are available. (this thesis)
3. The development of organoids by 3D bioprinting can be used for high throughput screening of drugs.
4. Limitation is a prelude to creation for the beginner in a new field of research.
5. The clearer the goal you have, the more help you will get.
6. Virtual working makes PhD life harder in spite of higher efficiency.
Propositions belonging to the thesis, entitled:
Stability and repair of DNA adducts formed by food-borne alkenylbenzene liver carcinogens; consequences for hazards and risks
Shuo YangWageningen, 14th May, 2021

Stability and repair of DNA adducts formed by food-borne alkenylbenzene liver carcinogens;
consequences for hazards and risks
Shuo Yang

Thesis committee
PromotorProf. Dr I.M.C.M. RietjensProfessor of ToxicologyWageningen University & Research
Co-promotorProf. Dr Chris OostenbrinkInstitute of Molecular Modeling and Simulation (MMS)University of Natural Resources and Life Sciences, Vienna (BOKU)
Other membersProf. Dr Ellen Kampman, Wageningen University & ResearchProf. Dr Nigel Gooderham, Imperial College London, United KingdomDr Daan Geerke, Vrije Universiteit AmsterdamDr Alicia Paini, EU Joint Research Centre, Ranco, Italy
This research was conducted under the auspices of the Graduate School VLAG (Advanced Studies in Food Technology, Agrobiotechnology, Nutrition and Health Sciences)

Stability and repair of DNA adducts formed by food-borne alkenylbenzene liver carcinogens;
consequences for hazards and risks
Shuo Yang
Thesissubmitted in fulfilment of the requirements for the degree of doctor
at Wageningen Universityby the authority of the Rector Magnificus
Prof. Dr A. P. J. Mol,in the presence of the
Thesis Committee appointed by the Academic Boardto be defended in publicon Friday 14 May 2021
at 11.00 a.m. in the Aula.

Shuo Yang
Stability and repair of DNA adducts formed by food-borne alkenylbenzene liver carcinogens; consequences for hazards and risks, 186 pages.
PhD thesis, Wageningen University, Wageningen, the Netherlands (2021)With references, with summary in English
ISBN: 978-94-6395-707-6
DOI: https://doi.org/10.18174/541511

Stability and repair of DNA adducts formed by food-borne alkenylbenzene liver carcinogens;
consequences for hazards and risks
Shuo Yang


Table of contents
Chapter 1 General introduction, aim, outline of thesis 9
Chapter 2 Cellular levels and molecular dynamics simulations of estragole DNA adducts point at inefficient repair resulting from limited distortion of the double stranded DNA helix 35
Chapter 3 Molecular dynamics and in vitro quantification of safrole DNA adducts reveal DNA adduct persistence due to limited DNA distortion resulting in inefficient repair 65
Chapter 4 Estragole DNA adduct accumulation in human liver HepaRG cells upon repeated in vitro exposure 91
Chapter 5 In vitro and in silico study on consequences of combined exposure to the food-borne alkenylbenzenes estragole and safrole 107
Chapter 6 General discussion 123
Chapter 7 Summary 151
Appendix Acknowledgements 156
Lists of Publications 158
Curriculum Vitae 159
Overview of Completed Training Activities 160


Chapter 1General introduction, aim, outline of thesis

1. Short introduction and aim of the thesis
DNA adduct formation upon exposure to genotoxic carcinogens is often referred to as a biomarker of exposure rather than as a biomarker of effect. In spite of this, increased levels of DNA adducts of a specific genotoxic carcinogen are generally assumed to increase the tumor incidences. However, the relation between the levels of DNA adducts formed and the levels of mutations or tumor formation is by no means well defined and may vary from one compound to another. This may in part be related to the fact that cells have quite efficient DNA repair systems, which may prevent the conversion of DNA lesions into mutations. At the present state-of-the-art DNA adduct persistence was found to be substantial for different genotoxic carcinogens including for example, DNA adducts derived from a pyrrolizidine alkaloid, aflatoxin B1 and some polycyclic aromatic hydrocarbons (Croy and Wogan 1981; Geacintov and Broyde 2017; Zhu et al. 2017), providing opportunities for adduct accumulation upon chronic exposure. The potential adduct accumulation may increase the chances of mutations and subsequent induction of tumors.
The aim of the present thesis was to obtain better insight in the relative hazards and risks of DNA adducts formed by alkenylbenzenes, a group of compounds naturally occurring in many spices and herbs, by studying their DNA adduct formation, stability, and repair.
The following sections present an overview of the basic principles of importance for the present thesis including an introduction to the model compounds used, estragole and safrole, their bioactivation resulting in DNA adduct formation, DNA repair, molecular dynamics (MD) simulation to study structural perturbations upon DNA adduct formation, and the current state-of-the-art on the risk assessment related to these genotoxic carcinogens.
2. The model compounds of the present thesis: estragole and safrole
Estragole (C10H12O) and safrole (C10H10O2), belong to the group of alkenylbenzenes, which share a similar chemical structure with a benzene ring substituted with a propenyl group. The only difference between the two structures is a methoxy group positioned in the benzene ring for estragole and a dioxolane group present in the benzene ring for safrole (Fig.1). Estragole and safrole naturally occur in different herbs and spices. The dominating dietary sources for estragole are tarragon, sweet basil, sweet fennel and their essential oils, and for safrole these are nutmeg, mace, cinnamon, anise, black pepper and sweet basil (SCF 2001, 2002).
10 CHAPTER 1

In 1965, the Expert Panel of the Flavor and Extract Manufacturers’ Association concluded that estragole was generally recognized as safe (GRAS) at the proposed levels of use (R.L and B.L 1965) and can be used as a food flavour approved by the US Food and Drug Administration (FDA) (21 CFR 121.1164). Estragole was evaluated in 2000 by the Committee of Experts on Flavouring Substances (CEFS) of the Council of Europe considering chronic exposure or limited repeated dose exposure (Demyttenaere and Oils 2015). The evaluation of the CEFS in 2000 (CEFS 2000) presented that estragole is a genotoxic carcinogen but induces weak hepatocarcinogenicity in mice. In 2001 the Scientific Committee for Food (SCF) concluded that estragole has been demonstrated to be carcinogenic via a genotoxic mode of action inducing hepatocarcinogenicity in mice, and that this indicated a need for restrictions in use of estragole (SCF 2001). Before these restrictions in use implemented by EU regulation no 1334/2008 (Regulation (CE)1334/2008), the average daily intake of estragole in human was estimated to amount to 0.7 mg/kg bw based on dietary patterns and levels of use in the respective food categories (SCF 2001), while, using a poundage based method for the intake estimate, the estimated daily intake from flavour use was estimated to amount to 0.01 mg/kg bw (Smith et al. 2002).
Safrole was observed to induce a significant increase in benign and malignant liver tumors upon long term exposure through dietary administration in rats (Long et al. 1963). The carcinogenicity of safrole was evaluated by the International Agency for Research on Cancer (IARC) in 1976 and 1987 and safrole was categorized as group 2B, probably carcinogenic to human. In 1997, the Committee of Experts on Flavouring Substances (CEFS) of the Council of Europe evaluated safrole as a weak hepatocarcinogen in experimental animal studies as well as a genotoxic and a transplacental carcinogen (Council of Europe 1997). Consequently, the restrictions on the use of food containing safrole was indicated by various regulatory bodies globally (Kemprai et al. 2020). The estimated average daily intake of safrole from consumption of foods that contain safrole reported by the SCF was 0.005 mg/kg bw (SCF 2002).
Fig. 1 Chemical structure of estragole and safrole
OCH3
Eestragole
O
O
Safrole
GENERAL INTRODUCTION, AIM, OUTLINE OF THESIS 11
1

2.1 Estragole and safrole metabolism resulting in DNA adduct formationEstragole and safrole are considered to be rapidly absorbed from the gastrointestinal tract and delivered to the liver, which is the main target organ for their activation and detoxification (Anthony et al. 1987; Fritsch et al. 1975a; Fritsch et al. 1975b; Smith et al. 2002). The bioactivation pathway of both compounds proceeds in a similar way through cytochrome P450 mediated 1’-hydroxylation followed by sulfotransferase mediated conjugation as summarized in Fig.2 (Miller et al. 1983; Swanson et al. 1981). Different predominant enzymes for the 1’-hydroxylation were reported by Jeurissen et al. (2004; 2007) with P450 1A2 and 2A6 being the main enzymes for the 1’-hydroxylation of estragole, and P450 2A6 the main enzyme for the 1’-hydroxylation of safrole. Subsequently, 1’-hydroxymetabolites can be transformed by sulfotransferases to the ultimate carcinogenic metabolites, 1’-sulfooxyestragole and 1’-sulfooxysafrole. These metabolites are unstable in an aqueous environment, leading to the formation of a carbocation upon loss of the sulphate group which has the ability to bind to DNA, RNA and proteins, and/or a direct interaction with these macromolecules also resulting in adduct formation (Phillips et al. 1981a; Phillips et al. 1981b; Poirier et al. 2000; Wislocki et al. 1976). Alternatively, 1’-hydroxymetabolites can be detoxified by glucuronidation or oxidation (Iyer et al. 2003; Martati et al. 2012) (Fig.3).
1’-Sulfooxyestragole can bind to either an adenine or guanine base. Reactions with adenine result in the formation of one of the major DNA adducts, namely N6-(trans-isoestragol-3ʹ-yl)-deoxyadenosine (E-3ʹ-N6-dA). Binding with a guanine base yields one of following DNA adducts: N2-(trans-isoestragol-3ʹ-yl)-2ʹ-deoxyguanosine (E-3ʹ-N2-dG), N2-(estragol-1ʹ-yl)-2’-deoxyguanosine (E-1ʹ-N2-dG), 7-(trans-isoestragol-3ʹ-yl)-deoxyguanosine (E-3ʹ-7-dG) and 8-(trans-isoestragol-3ʹ-yl)- deoxyguanosine (E-3ʹ-8-dG) (Fig.2) (Phillips et al. 1981b; Punt et al. 2007). The major DNA adduct is E-3’-N2-dG contributing to the carcinogenicity and genotoxicity induced by estragole (Phillips et al. 1981b; Smith et al. 2002). Similar to estragole, five different types of safrole DNA adducts were detected upon binding of 1’-sulfooxysafrole to either a guanine or adenine base including N2-(safrol-1’-yl)-dG (S-1’-N2-dG), N2-(trans-isosafrol-3’-yl)-dG (S-3’-N2-dG), N6-(trans-isosafrol-3’-yl)-dA (S-3’-N6-dA), 8-(trans-iosafrol-3’-yl)-dG (S-3’-8-dG) and 7-(trans-isosafrol-3’-yl)-dG (S-3’-7-dG) (Wiseman et al. 1985). The major DNA adduct that plays a role in the carcinogenicity and genotoxicity of safrole is S-3’-N2-dG.
2.1.1 Interaction between estragole and safrole in bioactivationHerb-based exposure to combinations of alkenylbenzenes was observed in botanicals and botanical preparations including plant food supplements and medicinal herbal supplements (Prinsloo et al. 2019). In the study of Alajlouni et al. (2016), more than one alkenylbenzene (methyleugenol, estragole, myristicin and/or apiol) were extracted from dry tea samples. As they have a similar mode of action, it is of interest to characterise the
12 CHAPTER 1

potential occurrence of interactions between different alkenylbenzenes upon combined exposure. As mentioned above, P450 2A6 appears to be an important enzyme involved in 1’-hydroxylation of both estragole and safrole pointing at a potential for binding of these compounds to the same active site resulting in competitive inhibition. According to a study by Jeurissen et al. (2007), competitive interaction between estragole and safrole in the formation of 1’-hydroxymetabolites was observed upon equimolar combined exposure. The total 1’-hydroxylation of estragole and safrole at 50-200 μM substrate concentration, being 4.5-18 and 6.25-25-fold above the respective Km value, amounted to 52% of the total 1’-hydroxylation expected without taking competitive interaction into account (Jeurissen et al. 2007). For the sulfotransferase and UDP-glucuronosyltransferase mediated conjugations and the oxidation of the 1’-hydroxymetabolites a similar competitive interaction could be expected to occur. Formation of glucuronidation and oxidation of 1’-hydroxymetabolites occur in parallel to the formation of 1’-sulfooxymetabolites. The balance between the formation of glucuronide conjugate, oxidation and sulfoxidation of the 1’-hydroxy metabolites will influence the ultimate DNA adduct formation. However, so far there is no study on the possible interactions between different alkenylbenzenes in their bioactivation and detoxification, or DNA adduct formation occurring upon combined exposure.
Fig. 2 Metabolic pathways for bioactivation and detoxification of estragole, also relevant for safrole and the formed DNA adducts
OMe
estragole
OH
OMe
1'-hydroxyestragole
OMe
OSO3-
1'-sulfooxyestragole
OMe
[+]
carbocation
OMe
NH
NNH
O
N N(II)
OOH
OHmajor adduct E-3'-N2-dG minor adduct
E-1'-N2-dG
NH
NNH
O
N N(II)
OOH
OH
OMe
CH
CH2
OMe
NH
N
N N
N
HO
OH
OHmajor DNA adduct E-3'-N6-dA
minor adduct E-3'-8-dG
NH2N
NH
N
N(II)
O
OH
OH
O
OMe
NH2N
NH
N
N
O
OH
OH
O CH2
OMe
minor DNA adduct E-3-'7-dG
OMe
CCH O
CH2
1'-oxoestragole
OMe
CHOGlucCH
CH2
1'-hydroxyestragole glucuronide
GENERAL INTRODUCTION, AIM, OUTLINE OF THESIS 13
1
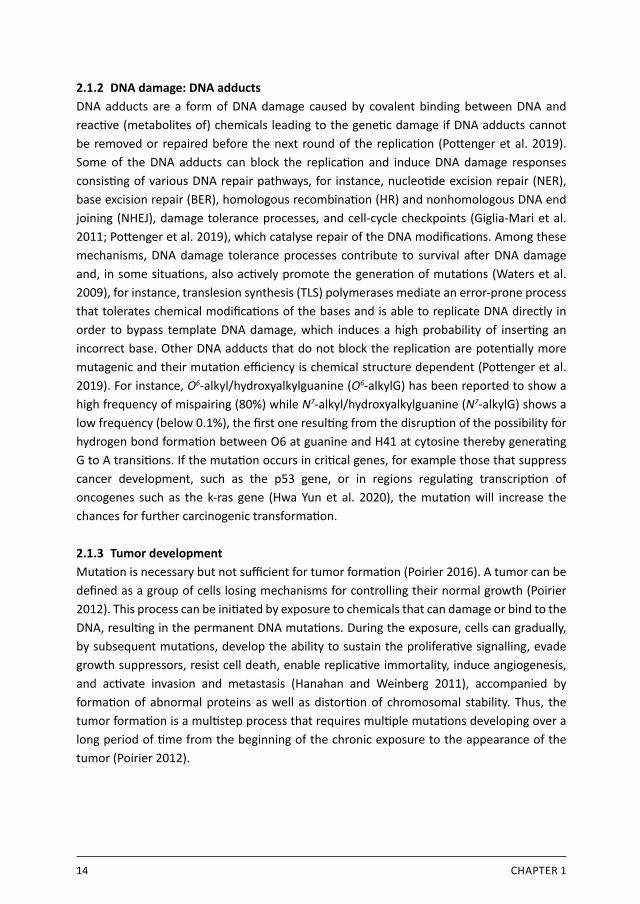
2.1.2 DNA damage: DNA adductsDNA adducts are a form of DNA damage caused by covalent binding between DNA and reactive (metabolites of) chemicals leading to the genetic damage if DNA adducts cannot be removed or repaired before the next round of the replication (Pottenger et al. 2019). Some of the DNA adducts can block the replication and induce DNA damage responses consisting of various DNA repair pathways, for instance, nucleotide excision repair (NER), base excision repair (BER), homologous recombination (HR) and nonhomologous DNA end joining (NHEJ), damage tolerance processes, and cell-cycle checkpoints (Giglia-Mari et al. 2011; Pottenger et al. 2019), which catalyse repair of the DNA modifications. Among these mechanisms, DNA damage tolerance processes contribute to survival after DNA damage and, in some situations, also actively promote the generation of mutations (Waters et al. 2009), for instance, translesion synthesis (TLS) polymerases mediate an error-prone process that tolerates chemical modifications of the bases and is able to replicate DNA directly in order to bypass template DNA damage, which induces a high probability of inserting an incorrect base. Other DNA adducts that do not block the replication are potentially more mutagenic and their mutation efficiency is chemical structure dependent (Pottenger et al. 2019). For instance, O6-alkyl/hydroxyalkylguanine (O6-alkylG) has been reported to show a high frequency of mispairing (80%) while N7-alkyl/hydroxyalkylguanine (N7-alkylG) shows a low frequency (below 0.1%), the first one resulting from the disruption of the possibility for hydrogen bond formation between O6 at guanine and H41 at cytosine thereby generating G to A transitions. If the mutation occurs in critical genes, for example those that suppress cancer development, such as the p53 gene, or in regions regulating transcription of oncogenes such as the k-ras gene (Hwa Yun et al. 2020), the mutation will increase the chances for further carcinogenic transformation.
2.1.3 Tumor developmentMutation is necessary but not sufficient for tumor formation (Poirier 2016). A tumor can be defined as a group of cells losing mechanisms for controlling their normal growth (Poirier 2012). This process can be initiated by exposure to chemicals that can damage or bind to the DNA, resulting in the permanent DNA mutations. During the exposure, cells can gradually, by subsequent mutations, develop the ability to sustain the proliferative signalling, evade growth suppressors, resist cell death, enable replicative immortality, induce angiogenesis, and activate invasion and metastasis (Hanahan and Weinberg 2011), accompanied by formation of abnormal proteins as well as distortion of chromosomal stability. Thus, the tumor formation is a multistep process that requires multiple mutations developing over a long period of time from the beginning of the chronic exposure to the appearance of the tumor (Poirier 2012).
14 CHAPTER 1

2.2 DNA repair
2.2.1 NER mechanismNER is the most versatile repair system involved in the repair of cyclobutane–pyrimidine dimers (CPDs); 6–4 pyrimidine–pyrimidone photoproducts (6–4PPs) induced by UV radiation; various bulky DNA adducts formed from man-made and natural chemicals; drug-mediated intrastrand crosslinks, and ROS-generated cyclopurines (Marteijn et al. 2014). Given that NER is involved in repair of bulky adducts it may also be the system most important for repair of the alkenylbenzene DNA adducts studies in the present thesis.
In general, there are four steps involved in this NER pathway: damage recognition, damage verification, excision, and gap-filling and ligation (Fig.3). The damage recognition is initiated by two different subpathways: global genome repair (GGR) and transcription-coupled repair (TCR). GGR is able to remove bulky damage in the entire genome, whereas TCR performs repair of the lesions located in especially the transcribed strand. In the damage recognition process, different factors are recruited for the two subpathways. In GGR a set of enzymes including the DNA-damage binding proteins UV-DDB (DDB1 and DDB2) and XPC-Rad23B complex constantly scan the genome and are responsible for the detection of the distortion of the DNA helix. In TCR, instead of recruiting the UV-DDB and XPC-Rad23B complex, blocking of RNA polymerase by the lesion provides the damage recognition signal. After recognition, the following steps are identical for both subpathways (Fleck 2004). Transcription factor II (TFIIH) complex is recruited at the lesion site, which is responsible for unwinding the DNA around the damaged site, and the subunit XPD verifies the existence of a lesion (Marteijn et al. 2014). Subsequently, excision repair cross-complementing (ERCC) excision repair 1, DNA repair endonuclease XPF (ERCC-1 XPF), and XPG, which stabilizes the TFIIH (Sugasawa 2010) make the dual incisions at the 5ʹ site and 3ʹ site, respectively, to excise the damaged fragment. In the final step, gap-filling and ligation, the gap is filled by DNA repair synthesis, in which the correct nucleotide information is provided by the template obtained from the intact, complementary, opposite DNA strand (Northrop and Connor 2008).
2.2.2 Persistence of alkenylbenzene DNA adducts
As indicated above the NER mechanism that is responsible for repair of bulky DNA adducts, may also be potentially involved in repair of the DNA adducts of the alkenylbenzenes studied in the present thesis. Interestingly, the persistence of some alkenylbenzene DNA adducts in liver cells in either in vivo or in vitro studies was reported (Gupta et al. 1993; Herrmann et al. 2013; Phillips et al. 1981a; Phillips et al. 1981b). Initial studies on the persistence of alkenylbenzene DNA adducts were performed by Phillips et al. (1981a; 1981b) dosing female CD-1 mice with a single dose of either 1’-hydroxyestragole or 1’-hydroxysafrole. Residual levels of N2-guanine or N6-adenine adducts remained in the
GENERAL INTRODUCTION, AIM, OUTLINE OF THESIS 15
1

Fig. 3 NER pathway, adapted from Marteijn et al. (2014)
16 CHAPTER 1

liver for at least 20 days following dosing. A subsequent study by Randerath et al. (1984) examined the existence of DNA adducts in CD-1 mice liver upon a single dose of safrole at a level of 10 mg. Little change of DNA adduct levels was observed up to 140 days after treatment. Gupta et al. (1993) studied the DNA adduct levels in CD-1 mouse liver upon a single i.p. dose of 0.01, 0.1, 1 or 10 mg safrole. A similar pattern of DNA adduct persistence was observed at all dose levels with only a limited reduction over the entire time (30 days) following exposure. Give these results it is also of interest to note the presence of DNA adducts derived from methyleugenol in human hepatic DNA obtained from surgery of 30 Caucasian subjects (Herrmann et al. 2013). Two types of DNA adducts were detected with a higher level of N2-MIE-dG (0-36 /108 nts) and a lower level of N6-MIE-dA (0-0.56 /108 nts), which is in line with experimental models where N2-MIE-dG adducts appeared to be the dominant DNA adduct (Herrmann et al. 2013). These authors also knocked out the mouse SULT1a1 gene and replaced it with the human SULT1A1/1A2 gene cluster and observed a similar level of formation of two DNA adducts upon single oral exposure to methyleugenol at a dose level estimated to be equal to human daily dietary intake of methyleugenol. The authors concluded that their results indicate that the formation of N2-MIE-dG and N6-MIE-dA in human liver samples originate from dietary exposure (Herrmann et al. 2013).
Since different type of DNA adducts would be formed upon the exposure, the inappreciable loss of adducts for several weeks after treatment may be due to the different repair efficiency of alkenylbenzene DNA adducts with different conformations. Some of the conformations may hinder the repair mechanism leading to the slow repair rate (Phillips et al. 1981b).
2.2.3 Other NER-resistant DNA lesionsNot only the alkenylbenzene DNA adducts are persisted, but other DNA adducts have also been reported to be NER resistant (Geacintov and Broyde 2017). It is well known that NER sensing proteins detect the distortions or destabilizations of the DNA helix rather than the damage itself (Geacintov and Broyde 2017). The NER-resistant or weaker NER substrates might cause minimal distortion or even an increase in the thermal stability of the duplex. This indicates the relevance of the conformational and stereochemical features of the lesions. For instance, the good NER substrate, the cis-B[a]PDE-N2-dG adduct derived from the reaction of benzo(a)pyrene with the guanine in double-stranded DNA, intercalates in the adjacent base pairs resulting in the flipping out of both the modified and partner bases in the double helix. This obvious destabilization can be easily detected by the XPC because of the occurrence of the partner base extrusion on the undamaged strand (Geacintov and Broyde 2017). Once the interaction of XPC is successful, subsequent steps of the NER pathway will be triggered. On the other hand, the trans-B[a]PDE-N2-dG adduct is positioned in the minor groove with minimal perturbations of the base-pairing resulting in 5 times lower NER efficiency than what was observed for the cis-adduct (Geacintov and Broyde
GENERAL INTRODUCTION, AIM, OUTLINE OF THESIS 17
1

2017). This example illustrates that the conformational features of the DNA lesion impact NER efficiency.
Size of the lesions is another factor that can influence the distortion extent. The greater the bulky adducts, the greater the distortion of the DNA structure induced via steric crowding. For example, the diol epoxides of fjord DB[a,l]P, with one additional aromatic ring having bigger size compared to benzo(a)pyrene, react with guanine in double-stranded DNA to produce the aromatic ring system in the 14S (-)-trans-DB[a,l]PDE-N2-dG adduct that needs sufficient space to relieve the crowding resulting in the distortion of the minor groove (Rodríguez et al. 2014). Also, the different level of steric crowding can come from binding at different positions of one type of base (e.g guanine) in the sequence. 35% NER efficiency, relative to the stereoisomeric (+)-cis-B[a]PDE-N2-dG adduct, appeared in the repair of the (+)-trans-B[a]PDE-N2-dG adduct positioned on G2 in the sequence of (......CATGCG1G2CCTAC···) versus 80% efficiency when the (+)-trans-B[a]PDE-N2-dG adduct was positioned on G1 (Geacintov and Broyde 2017; Kropachev et al. 2009). Moreover, NER can be completely ineffective in case of the absence of the partner base opposite the modified base (Del) or creation of an abasic site, since in these situations there is no extrudable nucleotide that interacts with the XPC protein initiating the NER process. Furthermore, successful recognition of the damaged site alone cannot guarantee the success of the following steps of NER. Weak or NER resistant substrates can enhance the stability of the DNA structure by inducing strong π−π base stacking interactions between adduct residues and neighbouring base pairs thereby especially hampering the double-strand separation, as reported for the aristolochic acid-derived N6-adenine adducts (Lukin et al. 2012). A summary of weak or NER-resistant lesions reported in the literature as well as their characterizations is shown in table 1.
2.3 Molecular dynamics (MD) simulationConsidering that the adduct conformational features represent one of the factors that impact the NER efficiency, for some DNA adducts their conformational properties and the extent of distortion of the double-stranded DNA helix upon their formation have been investigated through molecular dynamics (MD) simulation (Fountain and Krugh 1995; Lukin et al. 2012). MD simulation is a computer technique to investigate the movement and interactions of each atom in a molecular system over time (Karplus and McCammon 2002). It facilitates understanding of the biomolecular functions especially when experiments are inaccessible. In addition, MD simulation also connects theory and real-life experiments by enabling checking theory by performing simulations and validating results obtained by real-life experiments (Gupta and Varadwaj 2018). From the late 1950s, MD simulation was applied in simple gasses and used to study research topics in protein and drug development (Hollingsworth and Dror 2018). In the following section, the basic principles of MD, shown in Fig.4, are introduced in some more detail.
18 CHAPTER 1

2.3.1 General information of MD simulationsMD simulations typically start from a defined molecular structure. This molecular structure is defined based on existing structural information provided by for example NMR analysis, an existing crystal structure, or built by software, like Molecular Operating Environment if no experimental data are available. Once the starting structure has been selected, its
Table 1. Summary of the weak or NER-resistant DNA lesions. * indicates the modified base. This table is adapted from Geacintov and Broyde (2017)
Duplex DNA sequence DNA conformation and thermal DNA duplex stability
NER- resistant G*: N2-dGA*: N6-dA
B[a]PDE-N2-dG (10R cis and 10S trans)
DeletionDuplex
G*: Del G* opposite base C is missing; the deletion duplex is stabilized with ΔTm= +19 °C
B[c]PhDE-N6-dA;14R-DB[a,l]PDE-N6-dA
Full duplex …CA*C… Intercalative conformation, all base pairs intact. No destabilization (1R- B[c]PhDE-N6-dA, ΔTm= 0 °C), or strong destabilization (14R-DB[a,l]PDE-N6-dA, ΔTm= 11 °C
UV CPD photoproduct Full duplex …GT^TG… Intrastrand crosslink, minimal distor-tion
3-nitrobenzanthrone dG-N2-ABA
Native DNA - Positioned in minor groove; A DNA stabilizing adduct with ΔTm= +7.5 °C
Aflatoxin B1-Gua Native DNA AFB1-FAPY adducts are persistent in rat liver and human fibroblast DNA, ΔTm= +15 °C (AFB1-FAPY)
Aristolochic Acid (ALL--dA adduct)
Full duplex & Native DNA
CA*G & TA*G The Watson−Crick hydrogen bonding with the dT base is fully disrupted and loss of hydrogen bonding is com-pensated by stabilizing π−π stacking interactions between the aromatic ring system of the ALII residue and the flanking guanine residues in the CA*C sequence context. Moderate destabili-zation, ΔTm= -3 to -6.4 °C
Weak NER response
10S-trans-B[a]PDE-N-2-dG
Full duplex …CG*C… Positioned in minor groove, duplex destabilizing ΔTm=-8 to -11 °C
10S(R)-trans-B[a]PDE-N6-dA
Full duplex …CA*C… Intercalative conformation, all base pairs intact. The thermal stability is strongly related to the sequence (10S).
10 S-trans-DB[a,l] PDE-N2-dG
Full duplex …CG*C… Minimal destabilization ΔTm=-2 °C
GENERAL INTRODUCTION, AIM, OUTLINE OF THESIS 19
1

coordinates are created or downloaded from an existing database to describe the position of each atom in the structure. As the crucial factor for the stability and validity of MD simulations for all macromolecules, the potential energy experienced by atoms over time should be described accurately by a force field (Adcock and McCammon 2006). The force field functions and parameters are derived either from experimental data or by fitting high-level quantum mechanical calculations (Gupta and Varadwaj 2018). As the atom consists of nuclei and electrons, the behavior of electrons needs to be described which can be done by quantum chemistry. Since the quantum mechanical calculations are computer intensive, unless the research objective is related to a chemical reaction or chemical bonding of metal ions, the electron motion is neglected to reduce degrees of freedom. Only nuclear motion is considered in the classical MD simulation (Gupta and Varadwaj 2018). Currently, there are many popular force fields applied in MD simulation, for instance, CHARMM, AMBER, GROMOS, OPLS, and COMPASS (Cornell et al. 1996; MacKerell Jr et al. 1998; Oostenbrink et al. 2004; Sun 1998). In the present work, GROMOS was used. The total potential energy derived from a force field is the sum of the various contributions including bonded interactions and non-bonded interactions. Bonded interactions are further described by bond stretching, angle bending, torsional dihedral angle and improper dihedral angle terms. And non-bonded interactions comprise van der Waals interactions and electrostatic interactions (González 2011). For each of the elements, the parameters involved in the calculation can be set appropriately by fitting against high-precision quantum-mechanical calculations, or against experimental data.
After the force field is applied, solvent is added with additional counter ions to neutralize the system (Gupta and Varadwaj 2018). Once the system is defined the MD simulation is first initialized for a short time period to reach equilibrium. The initial velocities are sampled from a Maxwell-Boltzmann distribution at a low temperature (GROMACS 2020). As force field and initial velocity are given in the system, the velocity iteration, acceleration and position can be calculated for the subsequent steps using classical mechanics. After equilibrium, the ensemble, represented as the collection of the points in phase space satisfying the conditions of a particular thermodynamic state, is generated. Selection of the appropriate ensemble, like the microcanonical ensemble (NVE), the canonical ensemble (NVT), or the isothermal-isobaric ensemble (NPT) is based on the thermodynamic boundary conditions. The NVE ensemble describes an isolated system with constant number of particles (N) and constant energy (E) in a constant volume (V), i.e. a system that can neither exchange particles nor energy with the surroundings (Satoh 2003). In this case, the energy in the system, particles and volume remains exactly constant over time. The NVT ensemble represents the system with the fixed N, V and temperature (T). In this ensemble, the energy in the system can be exchanged with the fixed T from a heat bath (Jean-Pierr and Ian 2013). NPT is the statistical ensemble with a constant N, pressure (P) and T (Owicki and Scheraga 1977), which plays an important role when comparing to experiments that are
20 CHAPTER 1

mostly performed under the constant pressure. Normally, this ensemble is also chosen for DNA adduct simulation (Cai et al. 2011; Mu et al. 2013; Mu et al. 2012). The production MD simulation runs under selected ensemble conditions with prolonged simulation time (Gupta and Varadwaj 2018).
2.3.2 MD simulation to study structural perturbations upon DNA adduct formationThe distortion of the DNA structure upon insertion of DNA adducts derived from different substrates has been investigated in previous studies (Cai et al. 2011; Mu et al. 2013; Mu et al. 2012). In the study of Cai et al. (2011), the structural characteristics of the intercalative adduct conformations induced by14R (+)- and 14S (-)-trans-anti-DB[a,l]P-N6-dA adducts were characterised by molecular modelling and MD simulation. Authors indicated that the 14 R (+)-adduct presented greater van der Waals stacking interactions with flanking base pairs, and less perturbations of the DNA structure reflected by less incomplete hydrogen bonding, less local groove enlargement, less unwinding, and a lower solvent exposure than the 14S (-)-adduct. In an MD study of the N-(2ʹ-deoxyguanosin-8-yl)-2-aminofluorene adduct and N-(2ʹ-deoxyguanosin-8-yl)-2-acetylaminofluorene adduct, derived from the carcinogens 2-aminofluorene and 2-acetylaminofluorene respectively, it was shown that both adducts displayed the base-displaced conformations with energetic distortions in the modified DNA duplexes, which cause Watson-Crick hydrogen bonding disruption, stacking
Fig. 4 General protocol of MD simulation
GENERAL INTRODUCTION, AIM, OUTLINE OF THESIS 21
1

destabilization, untwisting and minor groove enlargement (Mu et al. 2012). Distortion of the DNA structure was also observed upon MD simulation studies on the cis-B[a]P-dG adduct insertion (Mu et al. 2013). The dC base opposite the modified dG was extruded into the major groove and hydrogen bonding was lost for 15% of the time during the simulation. These examples showed that MD simulation can be considered a useful tool to characterise the level of distortion as a result of DNA adduct formation.
2.4 DNA adducts upon chronic exposureDNA adduct persistence resulting from resistance towards DNA repair mechanisms, may result in DNA adduct accumulation upon chronic exposure that may occur in real-life situations. Upon chronic exposure, the type of DNA adducts detected may change comparing was compared to acute exposure due to differences in the repair efficiency, half-life time of the different adducts or cell apoptosis induction. Richardson et al. (1985) reported that upon single-dose exposure to 1,2-dimethylhydrazine and diethylnitrosamine the induced concentration of the major adduct (O6-ethylguanine) appeared to be 100-fold higher than the formation of the minor adduct (O4-ethylguanine), whereas after additional 2-4 weeks exposure, a similar level of both adducts was observed due to the lower repair rate of O4-ethylguanine. In addition, Fedtke et al. (1990) showed that the slow loss of N2 ,3-ethenoguanine adducts resulting from vinyl chloride exposure in the liver of rats had a half-life of more than 30 days longer compared with that of 7-(2’-oxo-ethyl)guanine adducts with 62 hours half-life under the same exposure regimen. Upon prolonged exposure relative levels of N2 ,3-ethenoguanine adducts gradually increased so that the ratio between the N2 ,3-ethenoguanine and 7-(2’-oxo-ethyl)guanine adducts changed from 1:100 after immediate exposure to 1:14 at the end of 1 week exposure. Exposure duration dependent differences in the type of adducts detected was also observed for estragole DNA adducts, with the ratio between the major E-3’-N6-dA and E-3’-N2-dG DNA adducts being 1:10 upon the single exposure whereas after 4 weeks repeated exposure, E-3’-N6-dA became the dominant one (Suzuki et al. 2012). These examples illustrate that the nature of the major or minor adduct can be dependent on the time of exposure as well as their half-life.
2.5 Risk assessment
2.5.1 General informationAs genotoxic and carcinogenic properties of alkenylbenzenes have been detected in animal studies, the risks associated with the levels of alkenylbenzenes present in food need to be evaluated. In general, risk assessment consists of four steps: hazard identification, hazard characterization, exposure assessment, and risk characterization. One of the important steps in hazard characterisation is to establish the dose-response relationship, from which the No Observed Adverse Effect Level (NOAEL), Lowest Observed Adverse Effect Level (LOAEL) or a lower confidence limit of the Benchmark Dose (BMDL) can be derived as the
22 CHAPTER 1

point of departure (EPA 2012). NOAEL or BMDL10 values can be used for the definition of so-called health-based guidance values that define safe levels of human exposure without an appreciable risk of deleterious effects during a lifetime such as for example an acceptable daily intake (ADI). An ADI is the safe exposure threshold for a non-genotoxic compound that can be intentionally added to food such as for example a food additive. When the estimated daily intake (EDI) remains below the ADI there is no health concern (Alger et al. 2013; FDA 2000; Nohmi 2018). For genotoxic carcinogens, current risk assessment practice assumes that there is no safe exposure threshold. Compounds that test positive for genotoxicity will not be allowed for use as a food additive, pesticide or veterinary drug (Nohmi 2018). However, the presence of genotoxic carcinogens in food cannot be completely avoided since such compounds may become part of our food as for example environmental contaminants, as processing contaminants and/or because they are natural constituents of food ingredients. Examples are the mycotoxin aflatoxin B1, produced by fungi upon improper storage conditions of food, or the model compounds of the present study, the alkenylbenzenes which are natural constituents of many herbs and spices (Negera and Washe 2019; Rietjens et al. 2005).
To evaluate whether the presence of these genotoxic carcinogens in our food raises a concern the so-called margin of exposure (MOE) approach has been defined (EFSA 2005). The MOE can facilitate the identification of the genotoxic carcinogens of highest concern that require priority in risk management actions, and it is calculated as the ratio between the BMDL10 , derived from tumor data in most cases obtained in studies in experimental animals, and the estimated daily human intake (EFSA 2012a). The MOE does not quantify the risk. If the MOE that is based on a BMDL10 derived from an animal study, is higher than 10000, it indicates a low concern for public health and consequently it is considered as a low priority for risk management action (Benford 2016). The magnitude of threshold (10000) includes the 100-fold uncertainty factor for inter- or intra- species differences and another factor of 100 for interindividual differences in the factors impacting the carcinogenic process (eg. cell cycle or DNA repair) and the fact that the BMDL10 used for calculating the MOE represents an effect level (Benford 2016).
2.5.2 Potential application of DNA adducts in risk assessmentIn a previous study by La and Swenberg (1996), the potential application of DNA adducts in risk assessment especially in risk estimation involved in the risk characterization step was illustrated. Many risk assessments extrapolate the data from a high dose exposure level in animal experiments to the low dose human exposure by fitting the data to a linear, non-threshold model with zero risk at zero dose, to predict the tumor incidence at a certain level of exposure (National Research Council 1987). However, the nature of the dose-response relationship at the low dose range is not clear. The assumption of a linear non-threshold dose-response curve may not always be correct. It can be argued for example that when
GENERAL INTRODUCTION, AIM, OUTLINE OF THESIS 23
1

the metabolism resulting in detoxification or DNA repair pathways is efficient at low dose levels, but can be saturated at higher dose levels, that the dose-response curve for tumor incidence may become sublinear at low dose levels (Scheller et al. 1995). Quantification of the DNA adduct levels at the target site at different dose levels is a better point of focus than the relationship between the tumor incidence and external exposure since use of DNA adduct levels as a measure of internal exposure is including the absorption, distribution, metabolism, and DNA repair. The molecular dosimetry, as a way of integrating the process from exposure to effect, can facilitate detection of the saturations in bioactivation, detoxification and DNA repair. Therefore, application of molecular dosimetry on data on dose dependent DNA adduct formation could give a better insight in the nature of the dose-response relationship for tumor incidence and can help to extend the observation range of data to dose levels that are several orders of magnitude lower than the administration dose used in the animal study (La and Swenberg 1996). Although, the debate of using DNA adduct data in risk assessment is ongoing, these data can be integrated with other information including dosimetry, toxicity, mutagenicity, genotoxicity and tumor incidence to provide the characterization information for mode of action-based hazard and risk characterization (Carmichael et al. 2011; Jarabek et al. 2009).
2.5.3 Combination exposure in risk assessmentAt the present state-of-the-art there is no generally accepted method to evaluate the risk induced by combined exposure to different or even related genotoxic and carcinogenic compounds (Nohmi 2018). In 2011, the EU Scientific Committees on Health and Environmental Risks (SCHER), on Emerging and Newly Identified Health Risks (SCENIHR), and on Consumer Safety (SCCS), indicated that the effect from combination exposure could be greater than the effect from individual compound exposure (SCCS, SCHER, SCENIHR, 2012). Depending on the mode of action, different assumptions are applied. For substances sharing a similar mode of action, dose/concentration addition can be applied. Interactions (including antagonism, potentiation, and synergy) between compounds could occur at medium or high exposure levels. For substances with a different mode of action, independent action is assumed since substances elicit effects based on a different mechanism of action without interaction with each other (Drescher and Boedeker 1995; Finney 1942; Medlock Kakaley et al. 2019). Under this situation, the response addition model can be used and there is no need for a combined risk assessment. When the mode of action information is not available, preferably dose/concentration addition should be considered (Staal and van der Ven 2016). For this dose additivity approach, the hazard index (HI) and toxic equivalency factor (TEF) are commonly used to facilitate the combined risk assessment (Alajlouni et al. 2017; Staal and van der Ven 2016). The HI is the sum of the hazard quotients (HQs) for toxins that affect the same target organ or organ system. HQs are defined as the ratio of the exposure concentration (like EDI) and a safe dose (like a reference dose (RfD), an acceptable or tolerable daily intake (ADI or TDI), BMDL.
24 CHAPTER 1

etc) (OECD 2018). If the HI is lower than 1, it means the toxins are not likely to induce the adverse effect during a lifetime exposure, whereas a HI higher than 1, indicates that the effects should be evaluated case by case to see which exposure adds most to exceedance of relevant health based guidance values and to direct potential risk management actions. For evaluation of combined exposure by dose addition also the so-called toxic equivalency (TEQ) approach using toxic equivalency factors (TEFs) has been developed, to evaluate the combined exposure to structurally related compounds with a similar mode of action but different potency (Delistraty 1997). The TEQ approach takes into account differences in toxic potency between congeners. The TEF for each individual congener can be expressed as the ratio of the concentration or dose inducing a defined level of toxicity, such as for example the EC50, from the compound of interest and from the reference compound; TEF = EC50compound 1 / EC50 reference compound. The total value called the toxic equivalency (TEQ) value for a mixture is calculated by the sum of each compounds dose or concentrations multiplied by its corresponding TEF value. This method has been used to evaluate combined exposure to alkenylbenzenes where the EDI for combined alkenylbenzene exposure was calculated based on the TEQ approach as Σ(EDI X TEF)i (i=different compounds). As a reference compound the alkenylbenzene detected at the highest level in the samples analysed was chosen being methyleugenol (Alajlouni et al. 2017). In addition, it should be noticed that the TEQ approach uses dose addition based on the default assumption of additive effects of the mixtures (Meek et al. 2011). Although the alkenylbenzenes of interest act on the same target tissue (liver) and share a similar mode of action, at the current state-of-the-art, further evidence to support the assumed dose addition has not been provided.
Objective and outline of this thesisThe aim of the present thesis was to obtain better insight in the relative hazards and risks of DNA adducts formed by the selected alkenylbenzenes estragole and safrole, by studying their DNA adduct formation, stability and repair. DNA adduct formation was measured in different liver cell models and the mechanism of potential resistance towards repair of the DNA adducts formed was investigated, from the perspective of conformation-dependent (in)efficiency of repair of the major DNA adducts, using MD simulation. In addition, the impact of combined exposure to alkenylbenzenes known to simultaneously occur in our diet as well as the chances that the accumulation of DNA adducts might reach levels that raise a concern was also investigated.
The work of the present thesis is presented in 6 chapters:
Chapter 1 presents an overview of the basic principles of importance for the present thesis including an introduction to the model compounds used, estragole and safrole, their bioactivation, DNA adduct formation, DNA repair, MD simulation, and the current state-of-the-art related to risk assessment of compounds that are genotoxic and carcinogenic.
GENERAL INTRODUCTION, AIM, OUTLINE OF THESIS 25
1

Chapter 2 and Chapter 3 describe studies on the formation and repair of the major DNA adducts of estragole and safrole including studies on the role of NER in the repair of the DNA adducts. The chapters also describe MD simulations to characterise the level of structural distortion upon DNA adduct formation in order to characterise the conformation-dependent (in)efficiency of the DNA adduct repair.
In Chapter 4 the consequences of repeated exposure to estragole were evaluated in order to characterise the effect of repeated daily dietary exposure. To this end, the DNA adduct accumulation was quantified in HepaRG cells exposed to estragole concentrations predicted to occur in the liver at realistic levels of dietary intake. The accumulation rate thus obtained was used to estimate the number of daily exposures required to reach DNA adduct levels at the BMD10 for tumor formation in experimental animals by the related alkenylbenzene methyleugenol.
In Chapter 5 the effects of combined exposure to estragole and safrole on cytotoxicity and DNA adduct formation in liver cells were investigated to a further extent. It was investigated whether combined exposure would result in dose (concentration) addition by measuring the cellular toxicity of equipotent mixtures of 1’-hydroxyestragole and 1’-hydroxysafrole. It was also investigated whether combined exposure to estragole and safrole would result in competitive inhibition of DNA adduct formation at relatively high concentrations of the test compounds and at the dose level of dietary daily intake.
Chapter 6 summarizes the results obtained and provides the overall discussion and further recommendations for future research.
26 CHAPTER 1

Reference
Adcock SA, McCammon JA (2006) Molecular dynamics: survey of methods for simulating the activity of proteins. Chemical reviews 106(5):1589-1615
Alajlouni AM, Isnaeni FN, Wesseling S, Vervoort J, Rietjens IM (2016) Level of alkenylbenzenes in parsley and dill based teas and associated risk assessment using the margin of exposure approach. Journal of agricultural food chemistry 64(45):8640-8646
Alajlouni AM, Ning J, Wesseling S, Vervoort J, Rietjens IM (2017) Determination and risk assessment of naturally occurring genotoxic and carcinogenic alkenylbenzenes in nutmeg-based plant food supplements. Journal of Applied Toxicology 37(10):1254-1264
Alger H, Maffini M, Kulkarni N, Bongard E, Nelter T (2013) Perspectives on how FDA assesses exposure to food additives when evaluating their safety: workshop proceedings. Compr Rev Food Sci Food Safety 12:90-119
Anthony A, Caldwell J, Hutt A, Smith R (1987) Metabolism of estragole in rat and mouse and influence of dose size on excretion of the proximate carcinogen 1ʹ-hydroxyestragole. Food Chemical Toxicology 25(11):799-806
Benford DJ (2016) The use of dose-response data in a margin of exposure approach to carcinogenic risk assessment for genotoxic chemicals in food. Mutagenesis 31(3):329-331
Cai Y, Ding S, Geacintov NE, Broyde S (2011) Intercalative Conformations of the 14 R (+)-and 14 S (−)-trans-anti-DB [a, l] P-N 6-dA Adducts: Molecular Modeling and MD Simulations. Chemical research in toxicology 24(4):522-531
Carmichael N, Bausen M, Boobis AR, et al. (2011) Using mode of action information to improve regulatory decision-making: an ECETOC/ILSI RF/HESI workshop overview. Critical reviews in toxicology 41(3):175-186
CEFS (2000) Final version of the publication datasheet on estragole. Document RD 4.5/1-47 submitted by Italy for the 47th meeting in Strasbourg.
Cornell WD, Cieplak P, Bayly CI, et al. (1996) A second generation force field for the simulation of proteins, nucleic acids, and organic molecules J. Am. Chem. Soc. 1995, 117, 5179− 5197. Journal of the American Chemical Society 118(9):2309-2309
Council of Europe (1997) Committee of Experts on Flavouring Substances 41st meeting –RD 4.2/10-41. Revised datasheet on safrole.
Croy RG, Wogan GN (1981) Temporal patterns of covalent DNA adducts in rat liver after single and multiple doses of aflatoxin B1. Cancer research 41(1):197-203
Delistraty D (1997) Toxic equivalency factor approach for risk assessment of polycyclic aromatic hydrocarbons. Toxicological environmental chemistry 64(1-4):81-108
Demyttenaere J, Oils E (2015) The European Flavouring regulation and how to deal with â Restricted Substancesâ. Natural Volatiles 2(1):1-10
Drescher K, Boedeker W (1995) Assessment of the combined effects of substances: the relationship between concentration addition and independent action. Biometrics:716-730
GENERAL INTRODUCTION, AIM, OUTLINE OF THESIS 27
1

EFSA (2005) Opinion of the Scientific Committee on a request from EFSA related to a harmonised approach for risk assessment of substances which are both genotoxic and carcinogenic. EFSA Journal 3(10):282
EFSA (2012a) Guidance on selected default values to be used by the EFSA Scientific Committee, Scientific Panels and Units in the absence of actual measured data. EFSA journal 10(3):2579
EPA (2012) Quantitative risk assessment calculations. Sustainable futures/P2 framework manual 2012 EPA-748-B12-001 13. Quantitative Risk Assessment Calculations 13:1-11
FDA USFaDA (2000) Guidance for Industry and Other Stakeholders Toxicological Principles for the Safety Assessment of Food Ingredients. Redbook:1-285
Fedtke N, Boucheron J, Walker V, Swenberg J (1990) Vinyl chloride-induced DNA adducts II: Formating and persistence of 7-(2’oxoethyl) guanine and N 2, 3 ethenoguanine in rat tissue DNA. Carcinogenesis 11(8):1287-1292
Finney D (1942) The analysis of toxicity tests on mixtures of poisons. Annals of Applied Biology 29(1):82-94
Fleck O (2004) DNA repair. Journal of Cell Science 117(4):515–517 doi:10.1242/jcs.00952Fountain MA, Krugh TR (1995) Structural characterization of a (+)-trans-anti-benzo [a] pyrene-DNA
adduct using NMR, restrained energy minimization, and molecular dynamics. Biochemistry 34(10):3152-3161
Fritsch P, De Saint Blanquat G, Derache R (1975a) Absorption gastro-intestinale, chez le rat, de l’anisole, du trans-anéthole, du butylhydroxyanisole et du safrole. Food Cosmetics Toxicology 13(3):359-363
Fritsch P, Lamboeuf Y, de Saint Blanquat G (1975b) Effect of anisole, anethole, butylhydroxyanisole and safrole on intestinal absorption in the rat (author’s transl). Toxicology 4(3):341
Geacintov NE, Broyde S (2017) Repair-resistant DNA lesions. Chemical research in toxicology 30(8):1517-1548
Giglia-Mari G, Zotter A, Vermeulen W (2011) DNA damage response. Cold Spring Harbor perspectives in biology 3(1):a000745
González M (2011) Force fields and molecular dynamics simulations. École thématique de la Société Française de la Neutronique 12:169-200
GROMACS (2020) “THE GLOBAL MD ALGORITHM”. In: Available via GROMACS development team.Gupta KP, van Golen KL, Putman KL, Randerath K (1993) Formation and persistence of safrole-DNA
adducts over a 10 000-fold dose range in mouse liver. Carcinogenesis 14(8):1517-1521Gupta S, Varadwaj PK (2018) A BRIEF OVERVIEW ON MOLECULAR DYNAMICS SIMULATION OF
BIOMOLECULAR SYSTEM: PROCEDURE, ALGORITHMS AND APPLICATIONS. INTERNATIONAL JOURNAL OF PHARMACEUTICAL SCIENCES RESEARCH 9(4):1333-1350
Hanahan D, Weinberg RA (2011) Hallmarks of cancer: the next generation. cell 144(5):646-674Herrmann K, Schumacher F, Engst W, et al. (2013) Abundance of DNA adducts of methyleugenol, a
rodent hepatocarcinogen, in human liver samples. Carcinogenesis 34(5):1025-1030Hollingsworth SA, Dror RO (2018) Molecular dynamics simulation for all. Neuron 99(6):1129-1143
28 CHAPTER 1

Hwa Yun B, Guo J, Bellamri M, Turesky R (2020) DNA adducts: Formation, biological effects, and new biospecimens for mass spectrometric measurements in humans. Mass spectrometry reviews 39(1-2):55-82
Iyer LV, Ho MN, Shinn WM, et al. (2003) Glucuronidation of 1ʹ-hydroxyestragole (1ʹ-HE) by human UDP-glucuronosyltransferases UGT2B7 and UGT1A9. Toxicological sciences 73(1):36-43
Jarabek AM, Pottenger LH, Andrews LS, et al. (2009) Creating context for the use of DNA adduct data in cancer risk assessment: I. Data organization. Critical reviews in toxicology 39(8):659-678
Jean-Pierr H, Ian RM (2013) Chapter 2–Statistical Mechanics, Theory of Simple Liquids (Fourth Edition)Jeurissen SM, Bogaards JJ, Awad HM, et al. (2004) Human cytochrome P450 enzyme specificity for
bioactivation of safrole to the proximate carcinogen 1 ‘-hydroxysafrole. Chemical research in toxicology 17(9):1245-1250
Jeurissen SM, Punt A, Boersma MG, et al. (2007) Human cytochrome P450 enzyme specificity for the bioactivation of estragole and related alkenylbenzenes. Chemical research in toxicology 20(5):798-806
Karplus M, McCammon JA (2002) Molecular dynamics simulations of biomolecules. Nature structural biology 9(9):646-652
Kemprai P, Protim Mahanta B, Sut D, et al. (2020) Review on safrole: identity shift of the ‘candy shop’aroma to a carcinogen and deforester. Flavour Fragrance Journal 35(1):5-23
Kropachev K, Kolbanovskii M, Cai Y, et al. (2009) The sequence dependence of human nucleotide excision repair efficiencies of benzo [a] pyrene-derived DNA lesions: insights into the structural factors that favor dual incisions. Journal of molecular biology 386(5):1193-1203
La DK, Swenberg JA (1996) DNA adducts: biological markers of exposure and potential applications to risk assessment. Mutation Research/Reviews in Genetic Toxicology 365(1-3):129-146
Long E, Nelson A, Fitzhugh O, Hansen W (1963) Liver tumours produced in rats by feeding safrole. Arch Pathol 75:595-604
Lukin M, Zaliznyak T, Johnson F, de los Santos C (2012) Structure and stability of DNA containing an aristolactam II-dA lesion: implications for the NER recognition of bulky adducts. Nucleic acids research 40(6):2759-2770
MacKerell Jr AD, Bashford D, Bellott M, et al. (1998) All-atom empirical potential for molecular modeling and dynamics studies of proteins. The journal of physical chemistry B 102(18):3586-3616
Martati E, Boersma MG, Spenkelink A, et al. (2012) Physiologically based biokinetic (PBBK) modeling of safrole bioactivation and detoxification in humans as compared with rats. Toxicological sciences 128(2):301-316
Marteijn JA, Lans H, Vermeulen W, Hoeijmakers JH (2014) Understanding nucleotide excision repair and its roles in cancer and ageing. Nature reviews Molecular cell biology 15(7):465-481
Medlock Kakaley E, Cardon MC, Gray LE, Hartig PC, Wilson VS (2019) Generalized concentration addition model predicts glucocorticoid activity bioassay responses to environmentally detected receptor-ligand mixtures. Toxicological Sciences 168(1):252-263
GENERAL INTRODUCTION, AIM, OUTLINE OF THESIS 29
1

Meek M, Boobis AR, Crofton KM, Heinemeyer G, Van Raaij M, Vickers C (2011) Risk assessment of combined exposure to multiple chemicals: a WHO/IPCS framework. Regul Toxicol Pharmacol 60(2 suppl 1):S1-S14
Miller EC, Swanson AB, Phillips DH, Fletcher L, Liem A, Miller JA (1983) Structure-activity studies of the carcinogenicities in the mouse and rat of some naturally occurring and synthetic alkenylbenzene derivatives related to safrole and estragole. Cancer research 43(3):1124-1134
Mu H, Kropachev K, Chen Y, et al. (2013) Role of structural and energetic factors in regulating repair of a bulky DNA lesion with different opposite partner bases. Biochemistry 52(33):5517-5521
Mu H, Kropachev K, Wang L, et al. (2012) Nucleotide excision repair of 2-acetylaminofluorene-and 2-aminofluorene-(C8)-guanine adducts: molecular dynamics simulations elucidate how lesion structure and base sequence context impact repair efficiencies. Nucleic acids research 40(19):9675-9690
National Research Council (1987) Dose, Species, and Route Extrapolation Using Physiologically Based Pharmacokinetic Models Drinking Water and Health, Volume 8: Pharmacokinetics in Risk Assessment. National Academies Press (US)
Negera M, Washe AP (2019) Use of natural dietary spices for reclamation of food quality impairment by aflatoxin. Journal of Food Quality 2019
Nohmi T (2018) Thresholds of genotoxic and non-genotoxic carcinogens. Toxicological Research 34(4):281-290
Northrop RB, Connor AN (2008) Introduction to molecular biology, genomics and proteomics for biomedical engineers. CRC Press
OECD (2018) Considerations for assessing the risks of combined exposure to multiple chemicals. Series on Testing and Assessment No. 296. Paris Cedex 16, France
Oostenbrink C, Villa A, Mark AE, Van Gunsteren WF (2004) A biomolecular force field based on the free enthalpy of hydration and solvation: the GROMOS force-field parameter sets 53A5 and 53A6. Journal of computational chemistry 25(13):1656-1676
Owicki JC, Scheraga HA (1977) Monte Carlo calculations in the isothermal-isobaric ensemble. 1. Liquid water. Journal of the American Chemical Society 99(23):7403-7412
Phillips DH, Miller JA, Miller EC, Adams B (1981a) N2 atom of guanine and N6 atom of adenine residues as sites for covalent binding of metabolically activated 1ʹ-hydroxysafrole to mouse liver DNA in vivo. Cancer research 41(7):2664-2671
Phillips DH, Miller JA, Miller EC, Adams B (1981b) Structures of the DNA adducts formed in mouse liver after administration of the proximate hepatocarcinogen 1ʹ-hydroxyestragole. Cancer Research 41(1):176-186
Poirier MC (2012) Chemical-induced DNA damage and human cancer risk. Discovery medicine 14(77):283-288
Poirier MC (2016) Linking DNA adduct formation and human cancer risk in chemical carcinogenesis. Environmental molecular mutagenesis 57(7):499-507
Poirier MC, Santella RM, Weston A (2000) Carcinogen macromolecular adducts and their measurement. Carcinogenesis 21(3):353-359
30 CHAPTER 1

Pottenger L, Boysen G, Brown K, et al. (2019) Understanding the importance of low-molecular weight (ethylene oxide-and propylene oxide-induced) DNA adducts and mutations in risk assessment: Insights from 15 years of research and collaborative discussions. Environmental Molecular Mutagenesis 60(2):100-121
Prinsloo G, Steffens F, Vervoort J, Rietjens IM (2019) Risk assessment of herbal supplements containing ingredients that are genotoxic and carcinogenic. Critical Reviews in Toxicology 49(7):567-579
Punt A, Delatour T, Scholz G, Schilter B, van Bladeren PJ, Rietjens IMCM (2007) Tandem Mass Spectrometry Analysis of N 2-(trans-Isoestragol-3 ‘-yl)-2 ‘-deoxyguanosine as a Strategy to Study Species Differences in Sulfotransferase Conversion of the Proximate Carcinogen 1 ‘-Hydroxyestragole. Chemical research in toxicology 20(7):991-998
R.L H, B.L O (1965) Recent progress in the consideration of flavoring ingredients under the food additives amendment III. GRAS substances. Food Technology 253:151-197
Randerath K, Haglund RE, Phillips DH, Reddy MV (1984) 32 P-post-labelling analysis of DNA adducts formed in the livers of animals treated with safrole, estragole and other naturally-occurring alkenylbenzenes. I. Adult female CD-1 mice. Carcinogenesis 5(12):1613-1622
Regulation (CE)1334/2008 Regulation (EC)1334/2008 of the European Parliament and of the Council of 16 December 2008 on Flavourings and Certain Food Ingredients with Flavouring Properties for Use in and on Foods and Amending Council Regulation (EEC) No 1601/91, Regulations (EC) No 2232/96 and (EC) No 110/2008 and Directive 2000/13/EC.
Richardson FC, Dyroff MC, Joyce AB, Swenberg JA (1985) Differential repair of O 4-alkylthymidine following exposure to methylating and ethylating hepatocarcinogens. Carcinogenesis 6(4):625-629
Rietjens IM, Boersma MG, van der Woude H, Jeurissen SM, Schutte ME, Alink GM (2005) Flavonoids and alkenylbenzenes: mechanisms of mutagenic action and carcinogenic risk. Mutation Research/Fundamental Molecular Mechanisms of Mutagenesis 574(1-2):124-138
Rodríguez FA, Liu Z, Lin CH, et al. (2014) Nuclear magnetic resonance studies of an N 2-guanine adduct derived from the tumorigen dibenzo [a, l] pyrene in DNA: Impact of adduct stereochemistry, size, and local DNA sequence on solution conformations. Biochemistry 53(11):1827-1841
Satoh A (2003) Introduction to Molecular-Microsimulation of Colloidal Dispersions ElsevierSCCS (Scientific Committees Consumer Safety), SCENIHR (Scientific Committees Emerging and Newly
Identified Health Risks), Risks) SSCoHaE (2012) Toxicity and Assessment of Chemical Mixtures, European Union.50 pp
SCF (2001) Opinion of the Scientific Committee on Food on Estragole (1-Allyl-4-methoxybenzene).SCF (2002) Opinion of the Scientific Committee on Food on the safety of the presence of safrole (1-
allyl-3, 4-methylene dioxy benzene) in flavourings and other food ingredients with flavouring properties.
Scheller N, Ranasinghe A, Kim AH, Holt S, Bogdanffy MS, Swenberg JA (1995) High resolution GC/MS detection of N2,3-ethenoguanine in livers of control and vinyl fluoride exposed B6C3FI mice. Int Toxicologist 7, S-P-21
Smith R, Adams T, Doull J, et al. (2002) Safety assessment of allylalkoxybenzene derivatives used as flavouring substances—methyl eugenol and estragole. Food chemical Toxicology 40(7):851-870
GENERAL INTRODUCTION, AIM, OUTLINE OF THESIS 31
1

Staal Y, van der Ven L (2016) Risk assessment of substances in combined exposures (mixtures).Sugasawa K (2010) Regulation of damage recognition in mammalian global genomic nucleotide excision
repair. Mutation Research/Fundamental Molecular Mechanisms of Mutagenesis 685(1-2):29-37Sun H (1998) COMPASS: an ab initio force-field optimized for condensed-phase applications overview
with details on alkane and benzene compounds. The Journal of Physical Chemistry B 102(38):7338-7364
Suzuki Y, Umemura T, Hibi D, et al. (2012) Possible involvement of genotoxic mechanisms in estragole-induced hepatocarcinogenesis in rats. Archives of toxicology 86(10):1593-1601
Swanson AB, Miller EC, Miller JA (1981) The side-chain epoxidation and hydroxylation of the hepatocarcinogens safrole and estragole and some related compounds by rat and mouse liver microsomes. Biochimica et Biophysica Acta -General Subjects 673:504-516
Waters LS, Minesinger BK, Wiltrout ME, D’Souza S, Woodruff RV, Walker GC (2009) Eukaryotic translesion polymerases and their roles and regulation in DNA damage tolerance. Microbiology Molecular Biology Reviews 73(1):134-154
Wiseman RW, Fennell TR, Miller JA, Miller EC (1985) Further characterization of the DNA adducts formed by electrophilic esters of the hepatocarcinogens 1ʹ-hydroxysafrole and 1ʹ-hydroxyestragole in vitro and in mouse liver in vivo, including new adducts at C-8 and N-7 of guanine residues. Cancer research 45(7):3096-3105
Wislocki P, Borchert P, Miller J, Miller E (1976) The metabolic activation of the carcinogen 1ʹ-hydroxysafrole in vivo and in vitro and the electrophilic reactivities of possible ultimate carcinogens. Cancer research 36(5):1686-1695
Zhu L, Xue J, Xia Q, Fu PP, Lin G (2017) The long persistence of pyrrolizidine alkaloid-derived DNA adducts in vivo: kinetic study following single and multiple exposures in male ICR mice. Archives of toxicology 91(2):949-965
32 CHAPTER 1

GENERAL INTRODUCTION, AIM, OUTLINE OF THESIS 33
1


Chapter 2Cellular levels and molecular dynamics simulations of estragole DNA adducts point at inefficient repair resulting from limited distortion of the double stranded DNA helixShuo Yang, Matthias Diem, Jakob D.H. Liu, Sebastiaan Wesseling, Jacques Vervoort, Chris Oostenbrink, Ivonne M.C.M. Rietjens
Published in Archives of Toxicology. 2020; 94(4): 1349–1365.

Abstract
Estragole, naturally occurring in a variety of herbs and spices, can form DNA adducts after bioactivation. Estragole DNA adduct formation and repair was studied in in vitro liver cell models, and a molecular dynamics simulation was used to investigate the conformation dependent (in)efficiency of N2-(trans-isoestragol-3’-yl)-2’-deoxyguanosine (E-3’-N2-dG) DNA adduct repair.
HepG2, HepaRG cells, primary rat hepatocytes and CHO cells (including CHO wild type and three NER deficient mutants) were exposed to 50 μM estragole or 1’-hydroxyestragole and DNA adduct formation was quantified by LC-MS immediately following exposure and after a period of repair. Results obtained from CHO cell lines indicated that NER plays a role in repair of E-3’-N2-dG adducts however with limited efficiency since in the CHO wt cells 80% DNA adducts remained upon 24 h repair. Inefficiency of DNA repair was also found in HepaRG cells and primary rat hepatocytes. Changes in DNA structure resulting from E-3’-N2-dG adduct formation were investigated by molecular dynamics simulations. Results from molecular dynamics simulations revealed that conformational changes in double stranded DNA by E-3’-N2-dG adduct formation are small, providing a possible explanation for the restrained repair, which may require larger distortions in the DNA structure.
NER mediated enzymatic repair of E-3’-N2-dG DNA adducts upon exposure to estragole will be limited, providing opportunities for accumulation of damage upon repeated daily exposure. The inability of this enzymatic repair is likely due to a limited distortion of the DNA double stranded helix resulting in inefficient activation of nucleotide excision repair.
Keywords: Estragole, DNA adduct, DNA repair efficiency, molecular modelling and simulation

1. Introduction
Estragole, one of the food-borne alkenylbenzenes, can naturally occur in a variety of herbs and spices such as sweet basil, fennel, star anise and essential oils (Rietjens et al. 2014). Upon dietary intake, estragole can be rapidly absorbed by the gastrointestinal tract and bioactivated in the liver (Smith et al. 2002). An overview of the bioactivation pathway of estragole is presented in Fig. 1. Briefly, the bioactivation proceeds by cytochrome P450 catalyzed formation of the proximate carcinogen 1’-hydroxyestragole (1’-OH estragole), upon which 1’-OH estragole is sulfonated by sulfotransferases (SULTs) to produce the ultimate carcinogenic metabolite 1’-sulfoxyestragole that can result in DNA adduct formation and contributes to the induction of hepatocarcinogenicity (Paini et al. 2010). The major DNA adduct formed is N2-(trans-isoestragol-3’-yl)-2’-deoxyguanosine (E-3’-N2-dG) (Fig.1) (Phillips et al. 1981b; Punt et al. 2007).
When considering estragole DNA adduct formation it is important to note that the level of DNA adducts depends on not only their formation via the reactive 1’-sulfooxy metabolite but also on the efficiency of their possible repair. In mammalian cells, bulky DNA lesions can be repaired by the nucleotide excision repair (NER) mechanism. In this mechanism a set of enzymes including XPC-RAD23B recognizes the local distortion and continues to recruit other factors like TFIIH, XPB, XPD etc. to initiate the process of repair (Schärer 2013). Some bulky DNA adducts, such as adducts formed by aristolochic acids, aflatoxin B1 and benzo(a)-pyrene have however been reported to merge with the DNA double stranded helix in such a way that they do not result in a significant disturbance of the overall DNA structure, resulting in these adducts being relatively resistant to NER (Geacintov and Broyde 2017). A recent study did report the detection of N6-(methylisoeugenol-3’-yl)-2’-deoxyadenosine (ME-dA) in the urine of rats exposed to different plant extractions containing the related alkenylbenzene methyleugenol for 12 h (Feng et al. 2018). The occurrence of this DNA
Fig. 1 Metabolic pathway for bioactivation of estragole and N2-(trans-isoestragol-3’-yl)-2’-deoxyguanosine (E-3’-N2-dG) adduct formation
OMe OMe
OH
OMe OMe OMe
NH N
NH
O
N
N
O
OH OH
estragole 1'-hydroxyestragole 1'-sulfooxyestragole carbocation E-3'-N2-dG
P450 SULTs
(+)
-O3SO
CELLULAR LEVELS AND MOLECULAR DYNAMICS SIMULATIONS OF ESTRAGOLE DNA ADDUCTS 37
2

adduct in the urine may reflect direct interaction of the reactive intermediate with free dA but may also in part result from NER mediated repair of ME DNA adducts as suggested by Feng et al. (2018). On the other hand, Herrmann et al. (2013) reported detection of methyleugenol DNA adducts in the livers of Caucasian subjects. This revealed that repair may be not fully efficient and/or that the DNA repair is not sufficient to balance DNA formation as a result of exposure to methyleugenol from a regular diet, resulting in detectable levels of adducts. The efficiency of repair of alkenylbenzene DNA adducts has, however, not been studied in detail so far. Therefore, the aim of the present paper is to quantify DNA adduct formation and repair of the alkenylbenzene estragole in different in vitro cell models, and study how this adduct formation impacts the conformation of the double strand DNA helix using molecular modelling.
2. Material and method
2.1 Chemicals and reagentsEstragole, human insulin, ammonium bicarbonate, dexamethasone (DEX), bovine spleen phosphodiesterase II (SPDE II), venom phosphodiesterase I (VPDE I), nuclease P1, phosphatase alkaline (AP), 3-(4,5-dimethyl-2-thiazolyl)-2,5-diphenyl-2H-tetrazolium bromide (MTT), tris(hydroxymethyl)aminomethane (Tris), ethylenediaminetetraacetic acid (EDTA), and 2’-deoxyguanosine were obtained from Sigma (St. Louis, Missouri, USA). Minimum Essential Medium (MEM), L-glutamine, Dulbecco’s Modified Eagle Medium: Nutrient Mixture F-12 (DMEM/F-12), alpha minimum essential media (αMEM), trypsin and phosphate buffered saline (PBS) (pH 7.4) were purchased from Gibco (Paisley, UK). Non-Essential Amino Acids (NEAA), Williams’ E Medium, and penicillin-streptomycin (P/S) were purchased from Gibco (Grand Island, New York, USA). CM3000 and 4000 kits were purchased from Gibco (Frederick, Maryland, USA). Fetal Bovine Serum (FBS) was purchased from Bodinco BV (Alkmaar, Netherlands). Hydrocortisone 21-hemisuccinate was purchased from Cayman Chemical (Ann Arbor, Michigan, USA). Dimethylsulfoxide (DMSO), hydrochloric acid (HCl), zinc sulfate (ZnSO4), sodium acetate, and acetic anhydride were purchased from Merck (Darmstadt, Germany). 4-[3-(4-Iodophenyl)-2-(4-nitrophenyl)-2H-5-tetrazolio]-1,3-benzene disulfonate (WST-1) was obtained from Roche (Mannheim, Germany). Acetonitrile (ACN) was purchased from Biosolve (Dieuze, France). RLT lysis buffer was purchased from QIAGEN (Hilden, Germany). Formic acid was purchased from VMR (Fontenay-sous-Bois, France). Beta-naphthoflavone (BNF) was purchased from Fluka Chemie GmbH (Buchs, Switzerland). 1’-OH estragole was synthesized as described previously (Paini et al. 2010).
2.2 Cellular modelsThe human hepatoma cell line HepG2 cells were obtained from the American Type Culture Collection (Manassas, Virginia, USA). Cells were cultured in MEM containing Earle’s Salts,
38 CHAPTER 2
supplemented with 10 % (v/v) FBS, 1 % (v/v) P/S, 1 % (v/v) NEAA and 2 mM L- glutamine. Cells were incubated at 37 °C with 5 % CO2 and subcultured every three or four days.
The human hepatoma cell line HepaRG (undifferentiated cells) was purchased from Biopredic International (Saint Grégoire, France). The cells were first incubated in growth medium containing Williams’ E Medium containing 10 % FBS (Sigma, St. Louis, Missouri, USA), 100 IU/mL of P/S, 5×10⁻⁵ M hydrocortisone 21-hemisuccinate and 5 μg/mL of human insulin for 2 weeks. In the following 2 weeks, differentiation medium was used to facilitate the differentiation of the cells into cells with hepatocyte-like morphology after which the cells were cultured for another 2 weeks in the same medium supplemented with 1.7 % DMSO to obtain maximum differentiation. HepaRG cells plated in 96-well plates (Greiner Bio-One, Frickenhausen, Germany) and T-25 flasks (Greiner Bio-One, Frickenhausen, Germany) were used for the cytotoxicity tests and in vitro DNA adduct formation experiments respectively.
Rat (Wistar) primary hepatocytes in suspension (cryopreserved, male) were purchased from Thermo Fisher Scientific (Bleiswijk, Netherlands). The CM3000 kit was used for thawing the cells and the CM4000 kit was used for cell maintenance. All the kits were dissolved in Williams’ E Medium without phenol red according to the protocol provided by Thermo Fisher Scientific.
Chinese Hamster Ovary (CHO) wild type and UV mutated types (UV5, UV41 and UV24), in which NER activity is absent, were obtained from ATCC (Manassas, Virginia, USA). Wild type cells were grown in DMEM/F-12 containing 10 % (v/v) FBS and 1 % (v/v) P/S. Mutant cells were grown in αMEM with 10 % (v/v) FBS. All cells were incubated at 37 °C with 5 % (v/v) CO2 until reaching 80 % confluence.
2.3 Cytotoxicity testCytotoxicity was tested by the MTT assay (HepG2 and HepaRG cells) or the WST assay (hepatocytes). To this end, HepG2 cells, HepaRG cells and rat hepatocytes were seeded in 96 well plates at the concentration of 2×10⁵ cells/mL, 0.9×10⁵ cells/mL, and 5×10⁵ cells/mL respectively. The cells were exposed to serum-free medium containing (final concentration) 50 μM estragole or 1’-OH estragole with 0.1 % DMSO for 2 h. Each compound was tested in three independent experiments. After exposure, 10 μL of 5 mg/mL MTT for HepG2 and HepaRG cells, or 10 μL of WST-1 reagent for rat hepatocytes were added to each well followed by incubation for another hour. For the MTT assay, the medium was removed and 100 μL of DMSO were added to the wells to dissolve the MTT formazan crystals. For the WST-1 assay, no additional handlings were required. The absorbance was measured at 562 nm for the MTT assay and at 440 nm for the WST assay using a SpectraMax M2 (Molecular
CELLULAR LEVELS AND MOLECULAR DYNAMICS SIMULATIONS OF ESTRAGOLE DNA ADDUCTS 39
2

Devices, USA). The cell viability was expressed as % of the control, with the solvent control set at 100 % viability.
2.4 In vitro DNA adduct formation2.4.1 Induction of cytochromes P450To increase cellular levels of cytochromes P450 required for estragole bioactivation to 1’-OH estragole, HepG2 cells and HepaRG cells were cultured in 25cm2 flasks and incubated at 37 °C and 5 % (v/v) CO2 in a humidified atmosphere in the presence of inducers of cytochrome P450 1A2 and 2A6 the isoenzymes previously shown to be involved in estragole 1’-hydroxylation (Jeurissen et al. 2007). Once 60-70 % confluence was reached, HepG2 cells were maintained in medium with reduced FBS (2 %) for 2 h after which the cells were incubated with the CYP1A2 inducer BNF (final concentration 5 μM) or the CYP2A6 inducer DEX (final concentration 50 μM) in the same medium for three days, with medium renewal every 24 h.
Induction for differentiated HepaRG cells was started in the first week after full differentiation. To this end the differentiation medium was changed to growth medium and cells were cultured in this medium for another 3 days. After that, the induction medium (Biopredic) with 2 % FBS containing BNF (final concentration 5 or 25 μM) or DEX (final concentration 50 μM) was applied for another three days with medium renewal every 24 h.
Stock solutions of inducers were prepared in DMSO and further diluted with induction medium to give a final concentration of DMSO of 0.1 %. Control cells (non-induced) were exposed to 0.1 % (v/v) DMSO during the induction period.
2.4.2 Exposure of cellular models to estragole and 1’-OH estragoleHepG2 cells and HepaRG cells including induced and non-induced cells, and non-induced primary rat hepatocytes were exposed to estragole or 1’-OH estragole at a final concentration of 50 μM for 2 h. The test compounds were dissolved in DMSO and then diluted in exposure medium, with 0.1% final concentration of DMSO. After 2 h of incubation, cells were washed with PBS. HepG2 cells and HepaRG cells were detached by using trypsin and collected in PBS. For primary rat hepatocytes, cells were kept in suspension in 6-well plates (Corning, Kennebunk, USA) by gentle shaking at a density of 1×10⁶ cells/well. After exposure, the cells were centrifuged at 500 rpm (Hermle Z400K Refrigerated Centrifuge, Germany) for 5 minutes to discard the exposure medium and the cell pellet was washed with PBS. All cells were collected in 1 mL of PBS in the Eppendorf tube and centrifuged at 1500 rpm for 5 minutes. The washing and centrifugation step was repeated one more time, and the pellet was lysed into 200 μL of RLT lysis buffer before DNA isolation.
40 CHAPTER 2

2.4.3 DNA isolation and digestionDNA was isolated using the QIAamp DNA Mini Kit protocol for cultured cells (Hilden, Germany). The number of cells for each sample was between 2×10⁶ and 5×10⁶ cells. The yield and purity of the isolated DNA were determined by Nanodrop 2000 technology (Thermo Scientific, Wilmington, Delaware USA) measuring the absorbance ratio A260/280 nm. DNA samples with a ratio of 1.8-2.0 were considered sufficiently pure. After quantifying the DNA, samples were evaporated to dryness and nanopure water was added to the samples to obtain the final amount of 50 μg DNA in 30 μL of water. DNA digestion was applied as previously described by Paini et al. (2010) with minor adjustments. In short, 40 μL of PI-buffer (300 mM sodium acetate, 1 mM ZnSO4, pH 5.3), 20 μL of SPDE II solution (0.0004 U/μL in water), and 10 μL of nuclease P1 (0.5 μg/μL in water) were added to DNA samples and then the samples were incubated at 37 °C for 4 h. Then the samples were incubated with a mixture of 40 μL of PA-buffer (500 mM Tris–HCl, 1 mM EDTA, pH 8.0), 20 μL of VPDE I solution (0.00026 U/μL in water), and 1.6 μL of AP (200 units) for another 2 h. After incubation, samples were freeze-dried and stored at -80 °C until LC-MS/MS analysis. Before analysis the dry digested samples were dissolved in 25 μL of ultrapure water for E-3’-N2-dG detection.
2.5 DNA repair assayThe role of NER in the repair of E-3’-N2-dG DNA adducts was investigated in CHO wild type cells and three NER deficient mutants. Although the CHO cells are ovary instead of liver cells, the set of wildtype and NER deficient mutants presents a representative model to study the role of human NER since the CHO cells have been shown to contain the human genes involved in NER (Rolig et al. 1998). Given that CHO cells do not contain cytochromes P450 needed for bioactivation of estragole, estragole DNA adduct repair in these cells was studied upon generation of the DNA adducts via exposure of the cells to 1’-OH estragole. The concentration of 1’-OH estragole used was adapted to result in DNA adduct levels that amounted to levels comparable to what was observed in primary hepatocytes and HepaRG cells in order not to overload the NER system. To this end CHO wild type and UV mutated CHO cells were exposed to 50 μM 1’-OH estragole for 2 h at 37 °C to generate DNA adducts at levels <50/108 nts. The DNA repair assay was additionally performed in non-induced HepaRG cells and rat hepatocytes which were exposed to 50 μM estragole for 2 h. After exposure, the cells were washed with PBS once, the medium was replaced with fresh medium without the test compound and cells were incubated for 0, 2, 4, 24, 48 and 72 h before they were harvested for measurement of (residual) DNA adduct levels.
2.6 Synthesis of E-3’-N2-dG adductDNA adducts were synthesized via the reaction of 1’-acetoxyestragole with 2’-deoxyguanosine following the protocol described by Punt et al. (2007). Synthesis of 1’-acetoxyestragole was based on Paini et al. (2010) with the slight modification of using
CELLULAR LEVELS AND MOLECULAR DYNAMICS SIMULATIONS OF ESTRAGOLE DNA ADDUCTS 41
2

110 μL of acetic anhydride instead of 35 μL. For E-3’-N2-dG adduct synthesis, in short, 250 μL of 1’-acetoxyestragole in DMSO (0.01 g/mL) was mixed with 2250 μL of 2.5 mM 2’-deoxyguanosine in 2.5 mM ammonium bicarbonate (pH 7.4). The incubation was stirred over the weekend at 37 °C. The DNA adducts were purified using a Waters Agilent HPLC (Etten-Leur, Netherlands) on an Alltima C18 5 μm column, 150×4.6 mm (Alltech, Breda, Netherlands). The gradients were made with nanopure water as solvent A and ACN as solvent B. The flow rate was 1 mL/minute. The start condition was 80/20 (A/B), changing to 70/30 (A/B) from 0-40 min after which the percentage of ACN increased to 100 % over 2 minutes, and was kept at 100 % for one minute. Then the gradient changed back to the start condition in 2 minutes and was kept at that condition for 15 minutes. Detection was carried out using a photodiode array detector (Waters, Milford, MA, USA) at 260 nm. E-3’-N2-dG eluted at 16.80 minutes. Peaks of several injections were collected and combined and freeze dried. The purified adduct thus obtained was weighted and then used in LC-MS/MS to establish calibration curves for the quantification of DNA adducts isolated from exposed cells.
2.7 LC-MS/MS method for detection and quantification of E-3’-N2-dG adductsThe LC-MS/MS method for detection of the E-3’-N2-dG adducts was adapted from Paini et al. (2010). The analysis was performed on a Shimadzu Nexera XR LC-20AD SR UPLC system coupled with a Shimadzu LCMS-8040 mass spectrometer (Kyoto, Japan). 5 μL of the sample from digested HepG2 cell DNA, HepaRG cell DNA, rat hepatocyte DNA or CHO cell DNA were injected into the 1.7 μm 50×2.1 mm column (Phenomenex, California, USA) at 40 °C. The gradient was made with ultra-pure water (solvent A) and ACN (solvent B). Both solvents contained 0.1 % (v/v) formic acid. The flow rate was 0.3 mL/min and each run was 10 min in total. The initial condition was 95/5 (A/B) for 1 minute, a linear gradient was applied from 5 % to 100 % acetonitrile over 8 minutes and maintained for 0.5 minutes. Then the gradient returned to the start condition in 0.1 minute and was kept for the remaining time. E-3-N2-dG eluted at 5.99 minutes. The MS-MS analysis was carried out using a Shimadzu LCMS-8040 triple quadrupole with electrospray ionization (ESI) interface. The instrument was operated in positive mode in the multiple reaction monitoring (MRM) mode with a spray voltage of 4.5 KV. The transitions (m/z) used for obtaining the daughter fragments were 414.2 →298.2, 414.2 →164.1, and 414.2 →147 for E-3’-N2-dG. Calibration curves were established by plotting the peak area of a known concentration of the synthesized DNA adduct against the corresponding DNA adduct concentrations. The amount of the DNA adducts detected in the samples was related to the total amount of digested DNA detected in each sample and expressed as the number of E-3’-N2-dG adducts per 108 nucleotides (nts) based on the assumption of 1.98×10¹⁵ nts / μg DNA.
42 CHAPTER 2

2.8 Molecular modelling
2.8.1 Starting structure and force fieldSince no experimentally determined structure of E-3’-N2-dG is available, the Molecular Operating Environment (MOE) software (version 2018.0101, Chemical Computing Group, Montreal) was employed to build an initial model for E-3’-N2-dG directly on the G6* of a 11-mer base sequence of B-type form DNA (Fig. 2a). The DNA sequence chosen in the present study is the same as the one used previously to study (+)-cis-B[a]PDE-N2-dG or (-)-trans-B[a] PDE-N2-dG enabling comparison of the results (Mocquet et al. 2007). All molecular interactions were described by the GROMOS force field, parameter set 45A4 (Soares et al. 2005). Corresponding parameters were assigned to the modified base, as described in the Supplementary information Fig. S1. Both reference DNA and modified DNA (with adduct) were solvated in a periodic rectangular box with a 1.4 nm minimum distance for solutes to box edges and a 0.23 nm minimum distance for the solute to solvent, containing explicit simple point charge (SPC) water and neutralized with 20 Na+ counterions. The concentration of additional sodium chloride was 0.2 M. Before the simulation, the models were energy minimized by the steepest descent algorithm to optimize the geometry. A systematic
Fig. 2 (a) Base sequence context in which the adduct is embedded. G6* represents the modified guanine base and (b) chemical structure of the E-3’-N2-dG adduct with dihedral angles α, β, γ and δ
CELLULAR LEVELS AND MOLECULAR DYNAMICS SIMULATIONS OF ESTRAGOLE DNA ADDUCTS 43
2

search was performed on the dihedral angles α, β, γ and δ (Fig. 2b) and diverse low energy conformations were selected. The additional information of selected conformations was detailed described in Results section. For the unmodified reference simulations, four independent simulations were performed.
2.8.2 Molecular dynamics simulationsAll the simulations were performed using the GROMOS11 molecular simulation package (Version 1.5.0; Biomos B.V.) (Schmid et al. 2012). Bond-length constraints of solute and solvent were imposed by the SHAKE algorithm with a 2-fs time step. A pairlist was generated every 5 steps by using a grid algorithm (Heinz and Hünenberger 2004). The short-range cut-off interactions up to a distance of 0.8 nm were computed at every timestep and intermediate-range interactions up to 1.4 nm were computed at pairlist construction and kept constant in between. Long-range interactions were approximated by a reaction-field contribution, assuming a homogenous medium with a dielectric permittivity of 61 beyond a distance of 1.4 nm (Heinz et al. 2001; Tironi et al. 1995). Prior to equilibration, initial velocities were sampled from a Maxwell-Boltzmann distribution at 60 K. The system was gradually heated up to 300 K in 5 equidistant steps. In order to restrain the solute position during equilibration, a harmonic potential-energy term was used. The force constant for solute position restraints was decreased by a factor of 10 at each equilibration step with an initial value of 2.5.104 kJ/mol/nm2. In addition, the first and last GC base pairs were kept together, by applying half harmonic attractive distance restraints on the hydrogen bonds to avoid the disruption of the initial conformation during the molecular dynamics (MD) simulation. After equilibration of 0.5 ns, constant temperature and pressure were imposed for the subsequent simulation. The temperature remained at 300 K via weak coupling, employing two separate temperature baths for solute and solvent with 0.1 ps coupling time. Additionally, the pressure was set to 1 atm with an isothermal compressibility of 4.575.10-4 (kJ mol-1 nm-3)-1 and a coupling time of 0.5 ps (Berendsen et al. 1984). Overall center of mass motion was removed every 2 ps. The simulations were performed for 20 ns.
2.8.3 Structural analysisThe GROMOS++ programs were employed for structural analysis (Eichenberger et al. 2011). A conformational clustering was conducted on the conformation of the adduct, after a superposition of the DNA backbones. For this, structures, separated by 5 ps were collected from all four adduct simulations and the atom-positional-root-mean-square deviations (RMSDs) was calculated between all pairs of structures. Structures within 0.2 nm of each other were considered structural neighbors and the clustering algorithm described by Daura et al. (1999) was used. For each of the clusters, the central member structure was selected as a representative structure. The stability of the MD simulation for the reference double stranded DNA helix and the modified DNA helix (with DNA adduct) was tested by monitoring RMSDs, which represent the deviations in each trajectory snapshot relative to
44 CHAPTER 2

the respective starting structure. The form of the DNA helix was classified by the DISICL algorithm (Nagy and Oostenbrink 2014). The hydrogen bonding occupancy was analyzed using a geometric criterion. A hydrogen bond was considered to be formed when the hydrogen-acceptor distance was within 0.25 nm and the donor-hydrogen-acceptor angle was larger than 135°. The total non-bonded interaction energy for the whole DNA structure and van der Waals interactions between the adduct and the rest of the residues without solvent were calculated. DNA duplex helicoidal parameters and groove dimensions were analyzed over the whole trajectories by X3DNA (Lu and Olson 2003). For this GROMOS trajectories were converted to PDB files and parsed individually. PyMOL was used to make molecular images and movies (DeLano 2002), (Version 2.3, 2019).
2.9 Statistical analysisDurnnett’s Multiple Comparison Test was performed using GraphPad Prism 5 (Version 5.04, 2010; GraphPad Software, Inc).
3. Results
3.1 Cytotoxicity testThe test compounds estragole and 1’-OH estragole were not cytotoxic to the HepG2 cells, HepaRG cells or primary rat hepatocytes at concentrations applied in the experiments as detected in the MTT or WST-1 assay (data not shown).
3.2 DNA adduct formation in non-induced liver cell modelsIn order to select the most suitable liver cell model for subsequent DNA repair experiments, studies of E-3’-N2-dG formation in HepG2 cells, HepaRG cells and primary rat hepatocytes were performed. To this end cells were exposed to both the parent compound estragole and the proximate carcinogenic metabolite 1’-OH-estragole. The number of adducts measured after exposure to 50 μM estragole or 1’-OH estragole in the different cell models is shown in Fig. 3. The data reveal that in all cell models DNA adduct formation is readily detectable upon exposure to 1’-OH estragole with the amount increasing in the order HepG2 cells < HepaRG cells < primary rat hepatocytes (Fig. 3b). Upon exposure of the cells to estragole, DNA adduct formation was only detected in HepaRG and rat hepatocytes albeit at levels that were respectively 33- and 40-fold lower than observed upon incubation with the same concentration of 1’-OH estragole. In HepG2 cells exposed to estragole E-3’-N2-dG was below the limit of detection (Fig. 3a).
3.3 DNA adduct formation in induced liver cell modelsGiven that HepG2 and HepaRG models are easier to handle than rat hepatocytes it was investigated whether E-3’-N2-dG formation in these models could be increased to the level
CELLULAR LEVELS AND MOLECULAR DYNAMICS SIMULATIONS OF ESTRAGOLE DNA ADDUCTS 45
2

observed in the primary rat hepatocytes upon induction of CYP2A6 or CYP1A2, known to convert estragole to 1’-OH estragole (Jeurissen et al. 2007). Thus, E-3’-N2-dG formation was studied in HepG2 cells and HepaRG cells pretreated with DEX or BNF in order to induce CYP2A6 or CYP1A2 respectively. Fig. 4 presents the E-3’-N2-dG formation in induced HepG2 cells and induced HepaRG cells exposed to 50 μM estragole and 1’-OH estragole for 2 h. After 2 h incubation with the parent compound estragole, E-3’-N2-dG formation was detected in HepaRG cells but not in HepG2 cells, and DNA adduct formation in HepaRG cells was similar upon treatment with DEX or BNF as compared to non-induced control cells (Fig. 4a). In HepG2 cells, the DNA adduct levels formed upon 1’-OH estragole exposure were similar among the different treatments and also similar to the non-induced control. It is of interest to note that the results obtained upon exposure of the HepaRG cells to 1’-OH estragole revealed that pretreatment with BNF resulted in a reduction of the E-3’-N2-dG formation while DEX treatment had no effect (Fig. 4b). Comparison of the DNA adduct levels formed upon exposure of the HepaRG cells to estragole or 1’-OH estragole revealed that E-3’-N2-dG formation upon exposure to 1’-OH-estragole was again 15- to 37-fold higher than upon exposure to estragole. Based on these results it was concluded that the best cell models to study the formation and subsequent repair of E-3’-N2-dG adducts would be non-induced HepaRG cells and rat hepatocytes exposed to estragole.
3.4 DNA repairFig. 5 shows the time-dependent change in DNA adduct levels in both HepaRG and rat hepatocytes after removal of estragole from the culture medium. In HepaRG cells (Fig. 5a), the level of E-3’-N2-dG gradually declined during the subsequent 72 h although the reduction did not reach statistical significance. After 72 h the repair was not complete and there was a substantial level of E-3’-N2-dG (77 % of the original amount) remaining. In rat
Fig. 3 E-3’-N2-dG formation in non-induced HepG2 cells, HepaRG cells and primary rat hepatocytes exposed to (a) 50 μM estragole and (b) 50 μM 1’-OH estragole for 2 h. Data represent the mean (+SD) from three independent experiments. Note the 50- fold different scale of the Y-axis in figure a and b
46 CHAPTER 2

hepatocytes which can be kept in suspension for a limited amount of time only, DNA adduct levels upon 4 h repair were not reduced compared to the amount detected immediately upon the removal of estragole (Fig. 5b). The limited reduction in E-3’-N2-dG adducts upon periods of repair may be in part due to the NER mechanism but could also be due to apoptosis removing cells with high levels of adducts from the population. These results
Fig. 4 E-3’-N2-dG formation in HepG2 cells and HepaRG cells exposed to (a) 50 μM estragole or (b) 50 μM 1’-OH estragole for 2 h upon pretreatment with the CYP1A2 inducer BNF (final concentration 5 μM or 25 μM) or the CYP2A6 inducer DEX (final concentration 50 μM). Data represent the mean (+SD) from three independent experiments. Note the 50- fold different scale of the Y-axis in figure a and b
Fig. 5 Time-dependent E-3’-N2-dG DNA adduct repair in (a) HepaRG cells and (b) primary rat hepatocytes. Raw data are available in the supplementary information Table S1. Repair is expressed as the level of E-3’-N2-dG adducts remaining expressed as the percentage of the DNA adduct levels detected at 0h, set at 100 %. The level of DNA adducts at 0h was 38 ± 5 / 108 nts and 102 ± 28 / 108 nts in HepaRG cells and rat hepatocytes respectively. Data represent the average and SD from three independent experiments
CELLULAR LEVELS AND MOLECULAR DYNAMICS SIMULATIONS OF ESTRAGOLE DNA ADDUCTS 47
2

indicate that in these liver cell models over the time span of the repair periods the E-3’-N2-dG adducts were repaired to only a limited extent, if at all.
3.5 Role of NER in the repair of E-3’-N2-dG DNA adductsIn order to investigate the possible role of NER in the repair of E-3’-N2-dG DNA adducts the repair of E-3’-N2-dG DNA adducts was studied in CHO wild type cells, and three NER-deficient mutants. Given that these cells do not contain substantial levels of cytochromes P450, E-3’-N2-dG levels were induced by incubating the cells with 1’-OH estragole. The concentration of 1’-OH estragole was chosen such that levels of the E-3’-N2-dG DNA adducts formed were comparable to what was detected in the HepaRG cells exposed to estragole. At 50 μM 1’-OH estragole the E-3’-N2-dG DNA adduct levels at 0 h amounted to 46 ± 6 / 108 nts in wild type cells, 34 ± 6 / 108 nts in UV 5 cells, 30 ± 3 / 108 nts in UV 24 cells and 32 ± 4 / 108 nts in UV 41 cells.
The results in Fig. 6 reveal that in CHO wild type cells, there was a significant, albeit again limited, reduction in E-3’-N2-dG levels in the first 4 h after removal of the 1’-OH-estragole, with no further decrease up to 24 h recovery at which time around 80% of the DNA adducts (36 ± 2 / 108 nts) remained in the cells. In corresponding NER-deficient cells, no significant NER repair was observed (Fig. 6). This indicates that NER might be involved in the E-3’-N2-dG adduct repair but that this process is eliminating the adducts over a 24 h time span to a limited extent only.
Fig. 6 Time-dependent E-3’-N2-dG DNA adduct repair in CHO wild type and NER-defective UV cells (UV 5, UV 24 and UV 41). Raw data are available in the supplementary information Table S2. Repair is expressed as the level of E-3’-N2-dG adducts remaining expressed as the percentage of the DNA adduct levels detected at 0h, set at 100%. Durnnett’s Multiple Comparison Test was used to test for significant difference in the DNA adduct levels between the 0h repair sample and the samples with a certain number of hours repair for each cell line ( * indicates P<0.05); The level of DNA adducts at 0h amounted to 46 ± 6 / 10^8 nts in wild type cells, 34 ± 6/ 10^8 nts in UV 5, 30 ± 3/ 10^8 nts in UV 24 and 32 ± 4 /10^8 nts in UV 41 based on four independent experiments
48 CHAPTER 2

3.6 Molecular modelling and MD simulationsTo obtain further insight in the apparent inefficient repair of E-3’-N2-dG adducts, molecular modelling and MD simulations were performed.
3.6.1 DNA-adduct structureA conformational clustering was performed on the conformations of the E-3’-N2-dG adduct that were observed in each of the four simulations, starting from initial conformations E_1, E_2, E_3 and E_4. A total of 92 clusters were observed, of which the first 10 clusters contained 88 % of the sampled conformations. Fig. 7a shows the representative structures of these 10 clusters. The E-3’-N2-dG adduct incorporated into the selected base sequence resulted in the representative DNA adduct structures that shared similar binding features with the adduct residue remaining in the minor groove of the helix, aligned in 3’-direction. No intercalation of the adduct between the nucleobases was observed. Only one of the ten structures (NO.8) showed base pair displacements with bases C7 and C17 flipped out into the major groove of the helix respectively, and with the T8 base sandwiched between C7 and A15 (Fig. 7a). No base extrusion was found in the other structures. The number of structures in each cluster are shown in Fig. 7b. With 413 occurrences, cluster 8 represent 2.5 % of all 16000 analyzed conformations. It is interesting to note that except for cluster 8, all the clusters contained structures that originate from all four simulations, as indicated by the different colors. These results indicate that all the representative structures are sampled by the four simulations and that the simulations are not dependent on the initial structures. For cluster 8, 99.5 % of the structures come from the simulations that started from the E_1 conformation. Apparently, a distortion of the DNA structure occurred in this simulation. The initial and final conformations of the individual simulations are shown in the supplementary information Fig. S2 and S3. Supplementary information Table S3 presents the initial values of the dihedral angles α, β, and δ, and the interaction energy in the starting conformations E_1 to E_4. Table S3 presents the average values for each dihedral angle and the interaction energy along the whole simulation. The population distributions of the dihedral angles are shown in Supplementary information, Fig. S4. In agreement with the observation that all major clusters were sampled by each of the four simulations, the population distribution of the dihedral angle α, β, and δ are very similar for all simulations, with the possible exception of the simulation starting from conformation E_1.
3.6.2 RMSD analysisAn RMSD analysis was performed in order to quantify the structural differences between the DNA adduct conformations and reference DNA conformations. Time-dependent RMSD patterns for the different E-3’-N2-dG conformations, as well as for four replicates of the unmodified reference duplex were calculated along the MD trajectories for all the base pairs excluding the first and last one. Results obtained are presented in Fig. 8. For the reference duplex, the RMSD overall converged with values fluctuating around 0.15 nm.
CELLULAR LEVELS AND MOLECULAR DYNAMICS SIMULATIONS OF ESTRAGOLE DNA ADDUCTS 49
2

The relatively small increase of fluctuation in RMSD of the simulation E_1 occurred first at about 12ns, which reflected the perturbation at T8:A15. The obvious fluctuation of the RMSD in the E_1 simulation occurred from 14 ns onwards until the end of the simulation and reflected the gradual displacement of the base pairs resulting in the final displacement (Supplementary information, Fig. S3 and movie 1). On the contrary, the RMSD for the other simulations starting from E_2 to E_4 revealed no differences with the reference duplex with overall RMSD values amounting to 0.15 nm-0.2 nm on average.
Fig. 7 Ten representative E-3’-N2-dG adduct structures obtained from conformational clustering showing the central 3-mer (C5-G6*-C7) or the central 4-mer (C5-G6*-C7-T8) from the minor groove side (a), and the number of different conformations observed in the first 10 clusters (b). Colors indicate the number of structures originating from the individual simulations
50 CHAPTER 2

3.6.3 Non-bonded interaction energyTotal non-bonded interaction energy, including Van der Waals interactions and electrostatic interactions, of the DNA helix, as well as the Van der Waals interaction between adduct residues and its surroundings (excluding solvent) are shown in Fig. 9. Except for the simulation starting from conformation E_1, the other simulations presented similar energies in both analyses. It is interesting to notice that the simulation starting from the E_1 conformation shows more favorable Van der Waals interaction energy (Fig. 9b) but an overall less favorable non-bonded interaction energy for the entire structure (Fig. 9a). This indicates that although higher Van der Waals interaction energy may contribute to the stabilization of the DNA structure to some extent, the overall stability of DNA structure was impaired to a much larger extent. In Fig. S5, the population distributions for this simulation are split up into the initial (part I: 0-14 ns) and final (part II: 14-20 ns) parts, because according to Fig. 8, this is where the distortion of the structure appears. It is clear that the shifts that are seen in Fig. 9 originate from this distortion.
Fig. 8 Time-dependent RMSDs for four simulations of modified DNA duplex starting from different conformations of the E-3’-N2-dG adduct (colors) as well as the unmodified control duplex (grey scales) along the 20 ns simulation resulting in the final conformations depicted in Fig. S3
CELLULAR LEVELS AND MOLECULAR DYNAMICS SIMULATIONS OF ESTRAGOLE DNA ADDUCTS 51
2

3.6.4 Hydrogen bondingTable 1 shows the average occupancies of canonical (Watson-Crick) hydrogen bonds through the whole simulations in the middle 4-mer base pairs in both the modified and unmodified DNA duplex. The data obtained from the simulation E_1 reflect the distortion in hydrogen bonding from G6:C17 to T8: A15 with occupancies amounting to 38-80 %. The most striking perturbation was found at T8:A15 rather than at the lesion site G6:C17, mainly resulting from the displacement of the base pair after approximately 12 ns, resulting in decreased average occupancies. Other simulations displayed only limited changes in the hydrogen bonding characteristics for all sites analyzed with the overall hydrogen bond occupancies within one base pair being similar in reference DNA and in modified DNA. In these conformations the decreases in hydrogen bond occupancies at N4-O6 were balanced by the increase at N2-O2. Overall, the results indicate that upon E-3’-N2-dG adduct formation the hydrogen bonding was somewhat disturbed but only to a limited extent.
3.6.5 Structure classificationTo further investigate if the structure classification changes in modified DNA as compared to reference DNA, the DISICL (DIhedral-based Segment Identification and Classification) algorithm was used to analyze the conformations. The two strands of the DNA duplex were classified separately (Table 2). In the first strand of the DNA duplex, the simulation starting from the E_1 conformation showed obvious changes with respect to the reference DNA simulations, where the sharp turn (ST) type gave a 3.5 % increase at the expense of the AB transition class. The ST type defines segments where the backbone turns more than 90° (Nagy and Oostenbrink 2014), which is consistent with the observation of the DNA backbone connecting C17 and G18 bases, accompanied by the base extrusion (Fig. 7). A slight rise of the BL class (B-Loop) occupancy was observed in both simulations starting from
Fig. 9 Population distribution of the non-bonded interaction energy (including Van der Waals interactions and electrostatic interactions) for the overall DNA helix excluding counter ions and solvent (a). Population distribution of total van der Waals interaction energy between estragole adduct residue and its surroundings (including ions) without solvent (b)
52 CHAPTER 2

the E_1 and E_3 conformations. Although the B-Loop cannot form the perfect B-helix, the increased percentage of B-Loop induces the structure shifting to become more like B-type helix (Nagy and Oostenbrink 2014). In the second strand, values of the unclassified (UC) and ST fractions in the simulation starting from the E_1 conformation increased with 5.2 % and 0.9 % respectively compared to the unmodified DNA, followed by a slight increase of the UC class (2.6 %) in the E_2 simulation. Considering the two strands together, except for the E_1 simulation, there were no big changes in the structure classification of the other simulations.
3.6.6 Helicoidal parameters and groove widthHelicoidal parameters, including six local base pair parameters (shear, stretch, stagger, buckle, propeller and opening) and six step parameters (rise, roll, shift, slide, tilt and twist) (Lu and Olson 2003), were measured at the center 3-mer for each conformation of modified DNA, reference DNA and for a classical B-type DNA. The definition of base pair step is shown in Fig. S6. The simulation starting from conformation was not included since the lack of base pairing information resulting from the base extrusion cannot provide the base-pair geometric position, consequently X3DNA cannot characterize the helicoidal parameters and groove width (Lu and Olson 2003). Among the local base pair parameters, an obvious
Table 1 Hydrogen bond occupancies (%) for the central 4-mer of the duplex DNA in different initial conformation simulations. Yellow highlighted values represent values higher than the average of Ref plus standard deviation (SD; calculated over the four replicas of the simulations). Blue highlighted values represent values lower than the average of Ref minus SD. The hydrogen bonds for all the base pairs are shown in Supplementary information, Table S4
Ref SD Simulation E_1
Simulation E_2
Simulation E_3
Simulation E_4
C5...G18 N4..H41..O6 93.1 1.7 93.1 94.0 93.9 91.9
N1..H1..N3 97.0 0.5 95.0 96.4 96.6 96.0
N2..H21..O2 72.4 1.8 62.5 70.6 72.0 72.4
G6...C17 N4..H41..O6 92.6 0.7 64.9 83.6 85.8 84.5
N1..H1..N3 98.7 0.1 76.0 94.6 95.5 95.0
N2..H21..O2 88.2 0.7 80.0 98.4 97.9 98.2
C7...G16 N4..H42..O6 93.9 0.4 65.5 91.3 91.8 91.9
N1..H1..N3 95.6 0.4 71.8 96.9 97.2 96.7
N2..H21..O2 75.9 0.7 61.3 80.8 80.7 79.3
T8...A15 N6..H61..O4 92.5 0.6 38.5 94.6 93.2 93.4
N3..H3..N1 96.3 0.2 38.6 94.3 94.9 94.9
CELLULAR LEVELS AND MOLECULAR DYNAMICS SIMULATIONS OF ESTRAGOLE DNA ADDUCTS 53
2

enlargement of the shear distance compared to the reference DNA only occurred at the lesion site in all the simulations (Fig. 10). Shear is one of the critical parameters characterizing the hydrogen bonding features (Lu and Olson 2003), which is in agreement with the observed loss of hydrogen bonds at the G6:C17 base pair in all simulations (Table 1). Except shear, small differences were also observed in buckle (all the center base pairs) and stagger (G6 and C7 base pairs), see Fig. S7. For the step parameters small differences were seen in rise, shift (C5-G6 step), slide and tilt (G6-C7 step). Interestingly, these parameters showed the structure of modified DNA were slightly more like the classical B-type form DNA (Supplementary information, Table S6).
Groove widths were measured as the smallest phosphorus-phosphorus separation between the two strands through minor and major groove. Both major and minor groove widths were comparable with the reference DNA simulations in all modified DNA simulations. The simulation starting from conformation E_1 is excluded based on the same reason as presented for the helicoidal parameters measurement (Supplementary information, Fig. S8).
Table 2 DNA structure classification of E-3’-N2-dG adduct and reference DNA conformations. The percentage of six structure classifications are shown in the table. The complete classification is given in Table S5, Supplementary information. Data are presented as the average (standard deviation; SD) based on the middle 9 residues. For the reference DNA, four replicates were performed. Values, higher than the average of Ref plus SD, shown in yellow; lower than the average of Ref minus SD, shown in blue
Strand 1a BIb BLc AHd STe ABf UCg
Ref 21.7 (7.1) 17.9 (1.7) 8.3 (5.5) 0.6 (0.72) 40.1 (6.5) 4.2 (1.3)
Simulation E_1 26.4 21.3 3.8 4.1 29.3 5.4
Simulation E_2 28.2 18.0 5.8 0.5 38.2 3.7
Simulation E_3 20.5 21.4 7.3 0.5 35.9 5.1
Simulation E_4 22.9 18.8 7.5 0.4 35.9 4.4
Strand 2 BI BL AH ST AB UC
Ref 20.7 (11.9) 12.6 (3.7) 11.7 (8.3) 0.4 (0.3) 43.5 (8.38) 3.9 (2.0)
Simulation E_1 18.8 14.4 9.9 1.5 37.4 9.1
Simulation E_2 23.3 16.1 8.9 0.4 38.6 6.5
Simulation E_3 22.0 10.3 11.4 0.3 46.8 3.3
Simulation E_4 20.2 13.8 10.6 0.3 43.1 4.1a.Strand 1 contains the DNA adduct. b. BI: Classical B form DNA. c. BL: B-loop. d. AH: A-helix. e. ST: sharpturn. f. AB: AB transition g. UC: unclassified.
54 CHAPTER 2

4. Discussion
Insight in formation and repair of estragole DNA adducts is essential to better understand the consequences of daily dietary exposure to this food-borne genotoxic carcinogen present in herbs and spices and products derived from them. Earlier in vitro studies on DNA adduct formation by alkenylbenzenes were performed with primary rat hepatocytes or HepG2 cells (Alhusainy et al. 2013a; Cartus et al. 2012; Jeurissen et al. 2008; Paini et al. 2010). In the present study, on estragole DNA adduct formation and repair also HepaRG cells were included since these cells can differentiate into cells with hepatocyte-like morphology when treated with DMSO and are reported to express cytochrome P450 and phase II enzymes at levels more comparable to liver hepatocytes than HepG2 cells (Kanebratt and Andersson 2008; Nelson et al. 2017). Data obtained revealed that formation of E-3’-N2-dG DNA adducts is increasing in the order HepG2 cells < HepaRG cells < primary rat hepatocytes upon exposure to either estragole or 1’-OH estragole. In all cell models, DNA adduct formation was readily detectable upon exposure to 1’-OH estragole, indicating the cells contain the SULT activity required for conversion of 1’-OH estragole to the DNA reactive 1’-sulfooxy metabolite. In HepaRG cells and primary rat hepatocytes, DNA adduct formation was also readily observed upon estragole exposure with levels formed in hepatocytes being only 2.5-fold higher than those in the HepaRG cells. The lack of formation of detectable E-3’-N2-dG levels in HepG2 cells likely reflects the relatively low CYP activity in these cells (Westerink
Fig. 10 Distribution of observed Shear distances (in Å) at the G6:C17 base pair for the reference DNA simulations and the simulations starting from conformations E_2, E_3 and E_4
CELLULAR LEVELS AND MOLECULAR DYNAMICS SIMULATIONS OF ESTRAGOLE DNA ADDUCTS 55
2

and Schoonen 2007) hampering the efficient conversion of the parent compound to the 1’-OH-metabolite.
Pretreatment of the HepG2 or HepaRG cells with BNF and DEX to induce CYP1A2 and CYP2A6 (Gerets et al. 2012; Meunier et al. 2000), the enzymes shown previously to be involved in estragole 1’-hydroxylation (Jeurissen et al. 2007) did not result in increased levels of E-3’-N2-dG formation. Pretreatment of HepaRG cells with BNF even resulted in a decrease in the E-3’-N2-dG formation upon exposure to 1’-OH estragole, likely resulting from induction of uridine diphosphate-glucuronosyl transferase (UDPGT) or glutathione S-transferases (GST) which is able to support detoxification pathways (Takahashi et al. 1996), but this was not further investigated. Based on the induction results, the non-induced HepaRG cells and rat hepatocytes were used in the DNA repair assays instead of further developing or investigating the actual level of the respective CYPs in the induced cell models.
Based on these results subsequent studies on repair of E-3’-N2-dG adducts were performed in HepaRG and primary hepatocytes exposed to estragole. Repair of the alkenylbenzene DNA adducts is expected to proceed via nucleotide excision repair (NER), and the role of NER in the repair of E-3’-N2-dG DNA adducts was investigated using NER-proficient CHO wild type and NER-deficient CHO UV cell lines. The results obtained with these cell models reveal that NER contributes to repair of the E-3’-N2-dG DNA adducts, which might be induced especially during cell check point (Barnum and O’Connell 2014), but that it was only reducing the E-3’-N2-dG DNA adduct levels in the CHO wild type cells to about 70 to 80 % of the original adduct levels, in the 24 h following their formation. The same result was obtained for the HepaRG cells exposed to estragole, in which upon 48 and 72 h repair 84 and 78 % of the E-3’-N2-dG DNA adducts persisted. Also in primary hepatocytes, the DNA adduct level was not reduced after 4 h repair. This observation in the in vitro cell models is in line with in vivo data reporting DNA adducts in the liver of CD-1 mice exposed to the related alkenylbenzene safrole to be persisted up to 30 days (Gupta et al. 1993). For estragole, Phillips et al. (1981b) reported that N2-guanine adducts, including E-3’-N2-dG DNA, formed in the liver of mice exposed intravenously to 1’-OH estragole, can be removed, although a significant fraction of the adducts persisted up to at least 20 days after treatment. These authors already suggested that the relatively inefficient repair of the E-3’-N2-dG DNA adducts could be the consequence of the conformation of the DNA adducts (Phillips et al. 1981b). Also for other DNA adducts, including for example 10S-(-)-trans-B[a]PDE-N2-dG, it has been suggested that efficient binding of XPC-Hhr23B at the site of the DNA lesion is hampered when the DNA adducts formed do not result in substantial base displacement (Min and Pavletich 2007; Mu et al. 2015).
To further investigate the possible conformation dependent (in)efficiency of E-3’-N2-dG DNA adduct repair, molecular modelling and MD simulations were applied to characterize
56 CHAPTER 2
the structural changes resulting from formation of these adducts in the double stranded DNA helix.
The results from molecular simulations indicated that the E-3’-N2-dG DNA adduct is likely to insert sideways in the DNA duplex and protrudes out of the minor groove with the estragole moiety orienting towards to 3’-side direction. Most of the representative structures seen in the first 10 clusters, correspond to stable DNA double helices. One simulation (starting from conformation E_1) displays obvious structure distortion emerging during the last 6 ns of the 20 ns simulation. This distortion is accompanied by displacement of T8:A15 with T8 intercalating between C7 and A15 bases. At the same time, part of the phenyl ring of the estragole moiety gets closer to the base opposite the modified site, resulting in disturbance of the G6*:C17 base pair, and extrusion of the C17 base out of the helix towards the minor groove. The other part of the phenyl ring of estragole gets closer to the C7 base, causing extrusion of C7 to the major groove (Supplementary information, movie 2). This whole process is correlated with severe hydrogen bond disruption and with a greater extent of unwinding.
It is interesting to notice that NER can recognize different lesions without the need for a common chemical motif, because the critical factor for recognition, XPC-Hhr23B, is triggered by destabilization of the DNA helix instead of by the damage itself (Nasheuer 2009). The term destabilization emphasizes the structural distortion of the secondary structure of the DNA, mainly caused by loss of the Watson-Crick hydrogen bonding and the local instability induced by the lesions (Mocquet et al. 2007). In the present study, comparing the modified DNA and reference DNA, RMSDs, structure classification, and non-bonded interaction energy reflecting the overall stability or changes of the DNA structure, all point at a severe distortion occurring in only one out of four simulations. At the local lesion site, this simulation shows flipped bases on both the damaged and undamaged strands. Similar to the (+)-cis-B[a]PDE-N2-dG adduct, a good NER substrate, it results in disruption of the Watson-Crick base pair, and extrusion of the flipped partner base of the modified guanine into the major groove (Mu et al. 2017). This flipped base on the undamaged strand is a key conformational property for XPC-Hhr23B binding and recruits later NER factors including TFIIH, XPA and XPG to the lesion site (Buterin et al. 2005). Therefore, the character of bases extrusion in conformations obtained from simulation E_1 could assist XPC- Hhr23B protein capture in an efficient way and induce NER response. On the contrary, for (-)-trans-B[a]PDE-N2-dG, which is repaired by NER with 5 to 10 times lower efficiency than (+)-cis-B[a]PDE-N2-dG (Hess et al. 1997; Mocquet et al. 2007), a structural conformation was obtained in which the adduct residue is positioned in the minor groove, aligned in 3’-direction without base displacement, with the Watson-Crick hydrogen bonding of all base pairs remaining intact (Andreas 2005; Mocquet et al. 2007). These observations are very similar to the structures observed in 9 of the first 10 clusters in Fig. 7. for the E-3’-N2-dG DNA adducts. For these
CELLULAR LEVELS AND MOLECULAR DYNAMICS SIMULATIONS OF ESTRAGOLE DNA ADDUCTS 57
2

conformations, no base extrusion appeared and all Watson-Crick hydrogen bonds remained in place. Data from the central 3-mer helicoidal parameters reveal that the adduct insertion even impacts the DNA structure to more closely resemble the canonical B-type DNA. Therefore, the NER responses towards these conformations are likely weaker than towards the conformations observed in the simulation starting from conformation E_1. Together, our MD simulation data do show that the distortion of the DNA structure is limited because only in the simulation starting from conformation E_1 a distortion was observed for 8 ns of the 20 ns. Given that distortion of the DNA double helix is the trigger for NER mediated repair, the limited distortion of the DNA helix in terms of both conformational changes and time during which they were observed in the MD simulations, provides a qualitative explanation for the limited DNA repair. In line with what was previously shown for other NER resistant DNA adducts (Mocquet et al. 2007; Mu et al. 2017) the current MD simulations provide an initial analysis of the adducted state in terms of conformational changes, hydrogen-bond disruptions, non-bonded interaction energy and structure classification at a 20 ns simulation time scale. Our observations support a qualitative link between the limited NER mediated repair and the DNA distortion by E-3’-N2-dG adduct formation. Linking the outcomes of the MD simulation in a quantitative way to the experimental data is not possible based on the current simulation data. First of all, the relative occurrence of the different conformations of the E-3’-N2-dG DNA adduct or quantification of which one is the dominant one is not revealed in this study, and would require a significantly increased computational effort. Significantly more and longer simulations would be required. Second, it is not known exactly what extent of distortion is needed to activate NER mediated repair, further hampering a quantitative comparison. Moreover, other factors than limited NER mediated repair, like apoptosis and/or DNA/cell replication, may have an influence on the adduct level, again hampering a quantitative comparison.
Except conformational aspects, other factors may also impact the potential efficiency of NER repair, including the base sequence context where the lesion is located (Cai et al. 2010; Liu et al. 2015; Ruan et al. 2007) and steric crowding that occurs if more than one guanine is modified in the same strand (Kropachev et al. 2009). Since it can be expected that adduct formation is a stochastic process it can also be foreseen that E-3’-N2-dG adducts in reality will be present within a large variety of DNA backgrounds. Thus, the results of the present study obtained using the 11-mer provides a first indication on structural conformational changes to be expected upon E-3’-N2-dG adduct formation. Studying the consequences of variability in this 11-mer for the structural changes upon E-3’-N2-dG formation, and the resulting chances on DNA repair, remains an interesting topic for future research. Using the now defined 11-mer provides the advantage of enabling comparison of the outcomes to similar studies performed previously for benzo[a]pyrene DNA adducts (Mocquet et al. 2007; Mu et al. 2017). The local thermodynamic stability of the DNA helix (Cai et al.
58 CHAPTER 2

2012; Reeves et al. 2011), and steps in the NER pathway following recognitions of the DNA damage are possible factors that can be involved in the NER repair efficiency in general.
Finally, it is of importance to note that inefficient repair of the DNA damage caused by estragole is likely to contribute to the ultimate hazards and risks of this food-borne dietary ingredient. It implies that repair will not be complete before a subsequent dietary exposure, or before cell division occurs, providing possibilities for accumulation of the damage and increasing the chances on the DNA damage turning into a mutation.
Acknowledgements
The authors gratefully acknowledge the mentoring help of prof. Wilfred van Gunsteren who facilitated the collaboration that resulted in this combined research effort of the Division of Toxicology, Wageningen University, The Netherlands and the Institute of Molecular Modeling and Simulation, Department of Material Sciences and Process Engineering, University of Natural Resources and Life Science, Vienna. This work was funded by a grant from the China Scholarship Council (no. 201607720009) to Shuo Yang.
Compliance with ethical standards
Conflict of interest: The authors declare that they have no conflict of interest.
Supplementary information
For convince, supplementary information can be found in https://edepot.wur.nl/523126
CELLULAR LEVELS AND MOLECULAR DYNAMICS SIMULATIONS OF ESTRAGOLE DNA ADDUCTS 59
2

Reference
Alhusainy W, Paini A, Punt A, Vervoort J, van Bladeren PJ, Rietjens IM (2013a) Inhibition of methyleugenol bioactivation by the herb-based constituent nevadensin and prediction of possible in vivo consequences using physiologically based kinetic modeling. Food chemical toxicology 59:564-571
Andreas L (2005) The Carcinogenic Effects Of Polycyclic Aromatic Hydrocarbons. World Scientific Publishing Company
Barnum KJ, O’Connell MJ (2014) Cell cycle regulation by checkpoints Cell Cycle Control. Springer, p 29-40Berendsen HJ, Postma Jv, van Gunsteren WF, DiNola A, Haak J (1984) Molecular dynamics with coupling
to an external bath. The Journal of chemical physics 81(8):3684-3690Buterin T, Meyer C, Giese B, Naegeli H (2005) DNA quality control by conformational readout on the
undamaged strand of the double helix. Chemistry & biology 12(8):913-922Cai Y, Geacintov NE, Broyde S (2012) Nucleotide excision repair efficiencies of bulky carcinogen–DNA
adducts are governed by a balance between stabilizing and destabilizing interactions. Biochemistry 51(7):1486-1499
Cai Y, Patel DJ, Broyde S, Geacintov NE (2010) Base sequence context effects on nucleotide excision repair. Journal of nucleic acids 2010
Cartus AT, Herrmann K, Weishaupt LW, et al. (2012) Metabolism of methyleugenol in liver microsomes and primary hepatocytes: pattern of metabolites, cytotoxicity, and DNA-adduct formation. Toxicological Sciences 129(1):21-34
Daura X, van Gunsteren WF, Mark AE (1999) Folding–unfolding thermodynamics of a β-heptapeptide from equilibrium simulations. Proteins: structure, function,bioinformatics 34(3):269-280
DeLano WL (2002) The PyMOL molecular graphics system. http://www pymol orgEichenberger AP, Allison JR, Dolenc J, et al. (2011) GROMOS++ software for the analysis of biomolecular
simulation trajectories. Journal of chemical theory and computation 7(10):3379-3390Feng Y, Wang S, Wang H, Peng Y, Zheng J (2018) Urinary Methyleugenol-deoxyadenosine Adduct as a
Potential Biomarker of Methyleugenol Exposure in Rats. Journal of agricultural and food chemistry 66(5):1258-1263
Geacintov NE, Broyde S (2017) Repair-resistant DNA lesions. Chemical research in toxicology 30(8):1517-1548
Gerets H, Tilmant K, Gerin B, et al. (2012) Characterization of primary human hepatocytes, HepG2 cells, and HepaRG cells at the mRNA level and CYP activity in response to inducers and their predictivity for the detection of human hepatotoxins. Cell biology 28(2):69-87
Gupta KP, van Golen KL, Putman KL, Randerath K (1993) Formation and persistence of safrole-DNA adducts over a 10 000-fold dose range in mouse liver. Carcinogenesis 14(8):1517-1521
Heinz TN, Hünenberger PH (2004) A fast pairlist-construction algorithm for molecular simulations under periodic boundary conditions. Journal of computational chemistry 25(12):1474-1486
Heinz TN, van Gunsteren WF, Hünenberger PH (2001) Comparison of four methods to compute the dielectric permittivity of liquids from molecular dynamics simulations. The Journal of chemical physics 115(3):1125-1136
60 CHAPTER 2

Herrmann K, Schumacher F, Engst W, et al. (2013) Abundance of DNA adducts of methyleugenol, a rodent hepatocarcinogen, in human liver samples. Carcinogenesis 34(5):1025-1030
Hess MT, Gunz D, Luneva N, Geacintov NE, Naegeli H (1997) Base pair conformation-dependent excision of benzo [a] pyrene diol epoxide-guanine adducts by human nucleotide excision repair enzymes. Molecular and cellular biology 17(12):7069-7076
Jeurissen SM, Punt A, Boersma MG, et al. (2007) Human cytochrome P450 enzyme specificity for the bioactivation of estragole and related alkenylbenzenes. Chemical research in toxicology 20(5):798-806
Jeurissen SM, Punt A, Delatour T, Rietjens IM (2008) Basil extract inhibits the sulfotransferase mediated formation of DNA adducts of the procarcinogen 1ʹ-hydroxyestragole by rat and human liver S9 homogenates and in HepG2 human hepatoma cells. Food and Chemical Toxicology 46(6):2296-2302
Kanebratt KP, Andersson TB (2008) Evaluation of HepaRG cells as an in vitro model for human drug metabolism studies. Drug metabolism and disposition 36(7):1444-1452
Kropachev K, Kolbanovskii M, Cai Y, et al. (2009) The sequence dependence of human nucleotide excision repair efficiencies of benzo [a] pyrene-derived DNA lesions: insights into the structural factors that favor dual incisions. Journal of molecular biology 386(5):1193-1203
Liu Z, Ding S, Kropachev K, et al. (2015) Resistance to nucleotide excision repair of bulky guanine adducts opposite abasic sites in DNA duplexes and relationships between structure and function. PloS one 10(9):e0137124
Lu XJ, Olson WK (2003) 3DNA: a software package for the analysis, rebuilding and visualization of three-dimensional nucleic acid structures. Nucleic acids research 31(17):5108-5121
Meunier V, Bourrie M, Julian B, et al. (2000) Expression and induction of CYP1A1/1A2, CYP2A6 and CYP3A4 in primary cultures of human hepatocytes: a 10-year follow-up. Xenobiotica 30(6):589-607
Min J-H, Pavletich NP (2007) Recognition of DNA damage by the Rad4 nucleotide excision repair protein. Nature 449(7162):570
Mocquet V, Kropachev K, Kolbanovskiy M, et al. (2007) The human DNA repair factor XPC-HR23B distinguishes stereoisomeric benzo [a] pyrenyl-DNA lesions. The EMBO journal 26(12):2923-2932
Mu H, Geacintov NE, Min J-H, Zhang Y, Broyde S (2017) Nucleotide excision repair lesion-recognition protein Rad4 captures a pre-flipped partner base in a benzo [a] pyrene-derived DNA lesion: how structure impacts the binding pathway. Chemical research in toxicology 30(6):1344-1354
Mu H, Geacintov NE, Zhang Y, Broyde S (2015) Recognition of damaged DNA for nucleotide excision repair: a correlated motion mechanism with a mismatched cis-syn thymine dimer lesion. Biochemistry 54(34):5263-5267
Nagy G, Oostenbrink C (2014) Dihedral-based segment identification and classification of biopolymers II: Polynucleotides. Journal of chemical information and modeling 54(1):278-288
Nasheuer HP (2009) Genome Stability and Human Diseases. Springer NetherlandsNelson LJ, Morgan K, Treskes P, et al. (2017) Human Hepatic Hepa RG Cells Maintain an Organotypic
Phenotype with High Intrinsic CYP 450 Activity/Metabolism and Significantly Outperform Standard HepG2/C3A Cells for Pharmaceutical and Therapeutic Applications. Basic & clinical pharmacology & toxicology 120(1):30-37
CELLULAR LEVELS AND MOLECULAR DYNAMICS SIMULATIONS OF ESTRAGOLE DNA ADDUCTS 61
2

Paini A, Punt A, Viton F, et al. (2010) A physiologically based biodynamic (PBBD) model for estragole DNA binding in rat liver based on in vitro kinetic data and estragole DNA adduct formation in primary hepatocytes. Toxicology and applied pharmacology 245(1):57-66
Phillips DH, Miller JA, Miller EC, Adams B (1981b) Structures of the DNA adducts formed in mouse liver after administration of the proximate hepatocarcinogen 1ʹ-hydroxyestragole. Cancer Research 41(1):176-186
Punt A, Delatour T, Scholz G, Schilter B, van Bladeren PJ, Rietjens IMCM (2007) Tandem Mass Spectrometry Analysis of N 2-(trans-Isoestragol-3 ‘-yl)-2 ‘-deoxyguanosine as a Strategy to Study Species Differences in Sulfotransferase Conversion of the Proximate Carcinogen 1 ‘-Hydroxyestragole. Chemical research in toxicology 20(7):991-998
Reeves DA, Mu H, Kropachev K, et al. (2011) Resistance of bulky DNA lesions to nucleotide excision repair can result from extensive aromatic lesion–base stacking interactions. Nucleic acids research 39(20):8752-8764
Rietjens I, Cohen SM, Fukushima S, et al. (2014) Impact of structural and metabolic variations on the toxicity and carcinogenicity of hydroxy-and alkoxy-substituted allyl-and propenylbenzenes. Chemical research in toxicology 27(7):1092-1103
Rolig RL, Lowery MP, Adair GM, Nairn RS (1998) Characterization and analysis of Chinese hamster ovary cell ERCC1 mutant alleles. Mutagenesis 13(4):357-365
Ruan Q, Liu T, Kolbanovskiy A, et al. (2007) Sequence Context-and Temperature-Dependent Nucleotide Excision Repair of a Benzo [a] pyrene Diol Epoxide-Guanine DNA Adduct Catalyzed by Thermophilic U vr ABC Proteins. Biochemistry 46(23):7006-7015
Schärer OD (2013) Nucleotide excision repair in eukaryotes. Cold Spring Harbor perspectives in biology 5(10):a012609
Schmid N, Christ CD, Christen M, Eichenberger AP, van Gunsteren WF (2012) Architecture, implementation and parallelisation of the GROMOS software for biomolecular simulation. Computer Physics Communications 183(4):890-903
Smith R, Adams T, Doull J, et al. (2002) Safety assessment of allylalkoxybenzene derivatives used as flavouring substances—methyl eugenol and estragole. Food chemical Toxicology 40(7):851-870
Soares TA, Hünenberger PH, Kastenholz MA, et al. (2005) An improved nucleic acid parameter set for the GROMOS force field. Journal of computational chemistry 26(7):725-737
Takahashi N, Harttig U, Williams DE, Bailey GS (1996) The model Ah-receptor agonist β-naphthoflavone inhibits aflatoxin B1—DNA binding in vivo in rainbow trout at dietary levels that do not induce CYP1A enzymes. Carcinogenesis 17(1):79-88
Tironi IG, Sperb R, Smith PE, van Gunsteren WF (1995) A generalized reaction field method for molecular dynamics simulations. The Journal of chemical physics 102(13):5451-5459
Westerink WM, Schoonen WG (2007) Cytochrome P450 enzyme levels in HepG2 cells and cryopreserved primary human hepatocytes and their induction in HepG2 cells. Toxicology in vitro 21(8):1581-1591
62 CHAPTER 2

CELLULAR LEVELS AND MOLECULAR DYNAMICS SIMULATIONS OF ESTRAGOLE DNA ADDUCTS 63
2


Chapter 3Molecular dynamics and in vitro quantification of safrole DNA adducts reveal DNA adduct persistence due to limited DNA distortion resulting in inefficient repairShuo Yang*, Jakob D.H. Liu*, Matthias Diem, Sebastiaan Wesseling, Jacques Vervoort, Chris Oostenbrink, Ivonne M.C.M. Rietjens(* shared first authors)
Published in Chemical Research in Toxicology. 2020, 33, 9, 2298–2309

Abstract
The formation and repair of N2-(trans-isosafrol-3’-yl)-2’-deoxyguanosine (S-3’-N2-dG) DNA adducts derived from the spice and herbal alkenylbenzene constituent safrole were investigated. DNA adduct formation and repair were studied in vitro and using molecular dynamics (MD) simulations. DNA adduct formation was quantified using liquid chromatography mass spectrometry (LCMS) in wild type and NER (nucleotide excision repair) deficient CHO cells and also in HepaRG cells and primary rat hepatocytes after different periods of repair following exposure to safrole or 1’-hydroxysafrole (1’-OH safrole). The slower repair of the DNA adducts found in NER deficient cells compared to that in CHO wild type cells indicates a role for NER in repair of S-3’-N2-dG DNA adducts. However, DNA repair in liver cell models appeared to be limited, with over 90% of the adducts remaining even after 24 or 48 h recovery. In our further studies, MD simulations indicated that S-3’-N2-dG adduct formation causes only subtle changes in the DNA structure, potentially explaining inefficient activation of NER. Inefficiency of NER mediated repair of S-3’-N2-dG adducts points at persistence and potential bioaccumulation of safrole DNA adducts upon daily dietary exposure.
Keywords: Safrole, DNA adduct stability, NER repair, molecular dynamics simulations

1. Introduction
Safrole, one of the food-borne alkenylbenzenes, is a major constituent of various herbs and spices including sweet basil, sweet fennel, anise star and cinnamon (Rietjens et al. 2014). Safrole is of concern because of its carcinogenicity, leading to tumor induction and liver changes, shown in in vivo studies where rodents were exposed to high doses of safrole for over 12 months (Abbott et al. 1961; Hagan et al. 1965; Homburger et al. 1961). Carcinogenicity of safrole requires its bioactivation to 1’-sulfooxysafrole which results in the formation of DNA adducts pointing at a genotoxic mode of action (Martati et al. 2014). The major safrole DNA adduct is N2-(trans-isosafrol-3’-yl)-2’-deoxyguanosine (S-3’-N2-dG) (Martati et al. 2014). An overview of the bioactivation pathway of safrole is presented in Scheme 1.
Although increased levels of DNA adducts are generally assumed to increase the tumor incidence, the relation between the levels of DNA adducts formed and the levels of mutations or tumor formation is by no means well-defined (Paini et al. 2011). This may partly be related to the fact that cells have efficient DNA repair systems, of which in particular, the nucleotide excision repair (NER) is responsible for removing bulky adducts that significantly distort the DNA helix (Gillet and Schärer 2006; Hoeijmakers 2009; Nouspikel 2009). Four phases are included in the NER mediated repair. In a first step the damage leading to DNA structure distortion or alteration of its stability is the signal for the initial recognition (Petruseva et al. 2014). Following damage recognition, transcription factor II (TFIIH) complex is recruited at the lesion site, which is responsible for unwinding
Scheme 1. Metabolic pathway for bioactivation of safrole resulting in N2-(trans-isosafrol-3′-yl)-2′-deoxyguanosine (S-3′-N2-dG) adduct formation.
aP450 = cytochrome P450, SULTs = sulfotransferases
O
OO
O
OH
O
O
OSO3-
O
O
[+]
safrole 1'-hydroxysafrole 1'-sulfooxysafrole carbocation
SULTsP450
S-3'-N2-dG
major adduct
aP450 = cytochrome P450, SULTs = sulfotransferases
MOLECULAR DYNAMICS AND IN VITRO QUANTIFICATION OF SAFROLE DNA ADDUCTS 67
3

the DNA around the damaged site (Melis et al. 2013). Subsequently, ERCC excision repair 1, DNA repair endonuclease XPF (ERCC-1 XPF) and XPG that stabilizes the TFIIH (Ito et al. 2007) make the dual incisions at the 5’ site and 3’ site respectively to excise the damaged fragment. In the final step, the gap is filled by DNA repair synthesis, in which the correct nucleotide information is provided by the template obtained from the intact, complementary opposite DNA strand (Northrop and Connor 2008).
Previous studies have reported that, in female CD-1 mice treated with a single dose of safrole, the safrole DNA adducts formed in the liver appeared to be persistent with only a slight decrease observed 2 days after dosing (Gupta et al. 1993). In line with this observation, we previously demonstrated that when HepaRG cells and primary rat hepatocytes were exposed to the related alkenylbenzene estragole for 2 h, they appeared to contain still more than 70% of the formed DNA adducts upon a subsequent 72 h recovery period in the absence of the alkenylbenzene. This pointed at limited repair and resistance toward NER mediated DNA adduct elimination (Yang et al. 2020a). Resistance toward NER mediated DNA adduct repair has also been reported for DNA adducts of some other genotoxic carcinogens including AFB1 FAPY adducts derived from aflatoxin (Croy and Wogan 1981), ALII-N6-dA adducts derived from aristolochic acids (Sidorenko et al. 2012), and the polycyclic aromatic hydrocarbon (PAH) diol epoxide-N6-adenine DNA adducts formed upon exposure to fjord-type PAHs (Geacintov and Broyde 2017).
The resistance of these DNA adducts to NER mediated repair was proposed to be related to limited conformational changes upon DNA adduct formation in double-stranded DNA (ds DNA), leaving the base pairs intact, thereby hampering the first step of NER mediated DNA repair because of limited signaling and subsequent Xeroderma pigmentosum, complementation group C (XPC) insertion, and recruitment of repair enzymes (Geacintov and Broyde 2017; Yang et al. 2020a). The present study aims to quantify the DNA adduct formation and repair of the alkenylbenzene safrole in HepaRG cells and rat hepatocytes, study the role of NER in the repair of S-3’-N2-dG DNA adducts in CHO wild type cells and NER deficient UV cells, and investigate by molecular dynamics (MD) simulation the extent of distortion of the ds DNA helix upon formation of the S-3’-N2-dG DNA adduct. Resistance toward DNA repair would imply that, upon dietary intake, DNA adducts might not be fully repaired before the next dietary intake thus providing an opportunity for bioaccumulation of the adducts formed.
68 CHAPTER 3

2. Material and method
2.1 Chemicals and reagentsSafrole, human insulin, ammonium bicarbonate, bovine spleen phosphodiesterase II (SPDE II), venom phosphodiesterase I (VPDE I), nuclease P1, phosphatase alkaline (AP), 3-(4,5-dimethyl-2-thiazolyl)-2,5-diphenyl-2H-tetrazolium bromide (MTT), Tris, EDTA and 2’-deoxyguanosine were obtained from Sigma (St. Louis, Missouri, USA). L-glutamine, Dulbecco’s modified Eagle medium: nutrient mixture F-12 (DMEM/F-12), alpha minimum essential media (αMEM) and phosphate buffered saline (PBS) were purchased from Gibco (Paisley, UK). Williams’ E medium, and penicillin/streptomycin (P/S) were purchased from Gibco (Grand Island, New York, USA). Fetal bovine serum (FBS) was purchased from Bodinco BV (Alkmaar, Netherlands). Hydrocortisone 21-hemisuccinate was purchased from Cayman Chemical (Ann Arbor, Michigan, USA). CM 3000 and 4000 kits were purchased from Gibco (Frederick, Maryland, USA). DMSO, hydrochloric acid (HCl), zinc sulfate (ZnSO4), sodium acetate, and acetic anhydride were purchased from Merck (Darmstadt, Germany). 4-[3-(4-Iodophenyl)-2-(4-nitrophenyl)-2H-5-tetrazolio]-1,3-benzene disulfonate (WST-1) was obtained from Roche (Mannheim, Germany). ACN was purchased from Biosolve (Dieuze, France). RLT lysis buffer was purchased from QIAGEN (Hilden, Germany). Formic acid was purchased from VMR (Fontenay-sous-Bois, France). 1’-OH safrole was synthesized as described previously (Paini et al. 2010).
2.2 Cellular modelsThe undifferentiated human hepatoma cell line HepaRG (Biopredic International, Saint Grégoire, France) was cultured in growth medium containing Williams’ E medium containing 10% (v/v) FBS, 100 IU/mL of P/S, 0.01% (v/v) L-glutamine, 5×10⁻⁵ M hydrocortisone 21-hemisuccinate, and 5 μg/mL of human insulin. The medium was refreshed three times a week. After 2 weeks of growth, cell differentiation was initiated by incubating the cells with the same medium supplemented with 1.7% (v/v) DMSO for another 2 weeks to obtain full differentiation. The medium was refreshed three times a week. All experiments were conducted in the first week after full differentiation.
Cryopreserved primary rat hepatocyte suspensions were purchased from Thermo Fisher Scientific (Bleiswijk, Netherlands). Cells were incubated in Williams’ E medium without phenol red using the CM3000 kit for thawing or the CM4000 kit for cell maintenance according to the manufacturer’s protocol.
Chinese hamster ovary (CHO) wild type and NER defective CHO UV cells (UV5, UV41 and UV24) were purchased from ATCC (Manassas, Virginia, USA). Wild type cells were grown in DMEM/F-12 supplemented with 10% (v/v) FBS and 100 IU/mL of P/S. CHO UV cells were cultured in αMEM with 10% (v/v) FBS.
MOLECULAR DYNAMICS AND IN VITRO QUANTIFICATION OF SAFROLE DNA ADDUCTS 69
3

All the cells were incubated at 37°C with 5% CO2 and seeded in 96-well plates (Greiner Bio-One, Frickenhausen, Germany) for cytotoxicity assays and T-25 flasks (Greiner Bio-One, Frickenhausen, Germany) or 6-well plates (Greiner Bio-One, Frickenhausen, Germany) for measurement of DNA adduct formation.
2.3 Cytotoxicity testCells were seeded in 96-well plates at a concentration of 2×10⁴ cells/well (CHO cells), 9×10⁴ cells/well (HepaRG cells), and 5×10⁵ cells/well (rat hepatocytes), respectively. Cytotoxicity was tested by the MTT assay (HepaRG cells and CHO cells) or the WST-1 assay (rat hepatocytes) after exposing the cells for 2 h to serum-free medium containing safrole or 1’-OH safrole, added from 1000 times concentrated stock solutions in DMSO. The final concentration of DMSO in exposure medium was 0.1% (v/v). Each combination of compound and cell type was tested in three independent experiments. After exposure, HepaRG cells and CHO cells were incubated with 10 μL of 5 mg/mL MTT, and rat hepatocytes were incubated with 10 μL of WST-1 reagent for another hour. For the MTT assay, the medium was removed and 100 μL of DMSO was added to all wells to dissolve the MTT formazan crystals. The absorbance was measured at 562 and 620 nm for the MTT assay and 440 and 620 nm for the WST-1 assay using a SpectraMax M2 (Molecular Devices, USA). Background absorption measured at 562 or 440 nm was subtracted from the absorption at 620 nm during the analysis. The cell viability was expressed as % of control, with the solvent control set at 100% viability.
2.4 DNA adduct formation and DNA repairDNA adduct formation was quantified in HepaRG cells grown at a density of 0.5×10⁶ cells/flask in T-25 flasks or in rat hepatocytes incubated in suspension at 1×10⁶ cells/well in a 6-well plate, upon exposure for 2 h to safrole, or in CHO cells (wild type and UV cells) grown at 80% confluency in T-25 flasks upon 2 h of exposure to 1’-OH safrole. The final concentrations used in these incubations were 50 μM safrole for HepaRG cells and rat hepatocyte suspensions and 50 μM 1’-OH safrole for CHO wild type and UV5 cells or 75 μM 1’-OH safrole for UV24 and UV41 cells. The final concentration of DMSO was 0.1%. After exposure, the exposure medium was removed, and cells were washed twice with PBS. The cells were either lysed directly by RLT buffer (0 h of repair) or incubated for additional time periods in the presence of fresh medium without test compound to allow DNA repair for 2, 4, 24, and 48 h before harvesting the cells for measurement of (residual) DNA adduct levels. The harvested cells were collected in PBS followed by centrifugation and resuspension in PBS twice before lysis. Cell lysis was performed by adding 200 μL of RLT lysis buffer per pellet before DNA isolation.
70 CHAPTER 3

2.5 DNA isolation and digestionDNA was isolated from lysed cells using the QIAamp DNA Mini Kit protocol for cultured cells (Hilden, Germany). The number of cells for each sample was not beyond 5×10⁶ cells. Nanodrop 2000 technology (Thermo Scientific, Wilmington, Delaware, USA) was used for measuring DNA concentration and purity based on the absorbance ratio A260/280 nm. DNA samples with an A260/280 nm ratio of 1.8-2.0 were considered sufficiently pure. After quantification of the DNA levels, the DNA samples were freeze-dried and the concentration of DNA was adjusted to 50 μg /30 μL by adding nanopure water before DNA digestion. DNA digestion was performed as previously described (Paini et al. 2010) with the minor modification that 1.6 μL of AP solution was used instead of 5 μL. The detailed procedure is presented in the Supplementary information. After digestion, samples were evaporated to dryness and dissolved in 25 μL of ultrapure water before the detection of S-3’-N2-dG by LC-MS/MS.
2.6 Synthesis of S-3’-N2-dG adductS-3’-N2-dG was synthesized by the reaction of 1’-acetoxysafrole with 2’-deoxyguanosine following the protocol described previously (Punt et al. 2007). Synthesis of 1’-acetoxysafrole was based on a reported protocol (Paini et al. 2010) using 1’-OH safrole instead of 1’-OH estragole and 110 μL of acetic anhydride instead of 35 μL. The detailed procedure of S-3’-N2-dG adduct synthesis is presented in the Supplementary information.
2.7 LC-MS/MS method for detection and quantification of S-3’-N2-dG adductsThe LC-MS/MS method for detection of S-3’-N2-dG adducts was adapted from a method reported before (Paini et al. 2010). The analysis was performed on a Shimadzu Nexera XR LC-20AD SR UPLC system coupled with a Shimadzu LCMS-8040 mass spectrometer (Kyoto, Japan). Each digested DNA sample was injected onto the 1.7 μm 50×2.1 mm column (Phenomenex, California, USA) with a 5 μL injection volume and running at a flow rate of 0.3 mL/min for 10 min. Detailed information on the elution protocol is provided in the supplementary information. The concentration of DNA adducts present in the cell samples was calculated based on a calibration curve quantifying the peak area of a known concentration of the synthesized DNA adduct against the corresponding DNA adduct concentrations. The amount of the DNA adducts detected in the samples was related to the total amount of digested DNA detected in each sample and expressed as the number of adducts per 108 nucleotides (nts).
MOLECULAR DYNAMICS AND IN VITRO QUANTIFICATION OF SAFROLE DNA ADDUCTS 71
3

2.8 Molecular modelling and MD simulation
2.8.1 Starting structure and force fieldThe initial structure of S-3’-N2-dG was built using Molecular Operating Environment (MOE) software (version 2018.0101, Chemical Computing Group, Montreal), because no experimentally determined structure is available. The safrole adduct was added on the G6* of the B-type form DNA 11-mer base sequence used previously to study distortion of the ds DNA helix structure upon formation of the E-3’-N2-dG estragole adduct and the B[a]PDE-N2-dG adduct (Fig.1a) (Mocquet et al. 2007; Yang et al. 2020a). The GROMOS force field 45A4 parameter set was used to describe molecular interactions (Soares et al. 2005). In a recent study, using AMBER force fields, including the bsc1 and OL15 modifications, simulations with longer simulation time could not provide a satisfactory description of the A/B equilibrium of the DNA, with a too strong emphasis on the B type and hardly any occurrence of the A type. The transition between A-DNA and B-DNA is a basic element of DNA’s conformational repertoire (Zgarbová et al. 2018), and it is important to investigate how the safrole adduct formation would affect the DNA structure in terms of the conformational equilibrium of the DNA. The GROMOS 45A4 force field allows for this flexibility and has previously successfully been used in a number of works in the literature (Dolenc et al. 2006; Németh et al. 2014; Oostenbrink and van Gunsteren 2005). In particular, we have also used this parameter set in our previous work on estragole adduct formation (Yang et al. 2020a). The force-field parameters for S-3’-N2-dG were derived based on analogy of similar functional groups in this force field and is supplied in the supplementary information Fig. S1. Detailed system settings before the simulation are available in the Supplementary information. A systematic search was performed on the dihedral angles α, β, γ, and δ (Fig.1b), and four diverse low energy conformations were selected. Preliminary 20 ns molecular dynamics simulations were performed to study the influence of the initial structure.
2.8.2 Molecular dynamics simulationsThe GROMOS11 (version 1.5.0; Biomos B.V.) (Schmid et al. 2012) and Gromacs (release 2020) (Abraham et al. 2015) packages for molecular simulations were used for the molecular dynamics simulations. Prior to simulation, 0.5 ns of equilibration was performed from randomly generated initial velocities. Constant temperature and pressure were reached after equilibration and applied in the following. Analysis of the preliminary 20 ns simulations of the four selected initial conformations of the adducted DNA revealed that the same safrole conformations were sampled, independent of the initial structure (see Fig. S2 in the supplementary material). Subsequently, twelve independent 100 ns simulations were performed: 6 of the unmodified reference DNA and 6 of the adducted form of Fig. 1(b). The simulations were started from the same initial structures as those of the preliminary ones, with different random seeds to assign initial velocities. No significant differences between individual simulations were observed. Unless stated differently, analyses are reported as
72 CHAPTER 3

averages and standard deviations over the six independent simulations. Details of the equilibration and simulation protocols are given in the Supplementary information.
2.8.3 Structural analysisThe GROMOS++ programs were employed for structural analysis (Eichenberger et al. 2011). The clustering algorithm described previously (Daura et al. 1999) was used for conformational clustering analysis of the adduct, after a conformational fit of the DNA backbone. The structures were collected every 30 ps from six independent adduct simulations and calculated between all pairs of structures based on the atom-positional root-mean-square deviation (RMSD). Structures between which the safrole conformation differed less than 0.2 nm after a rotational fit of DNA backbone were considered structural neighbors, and for each of the clusters, the central member structure was chosen as the representative structure. RMSD differences along the trajectories relative to the respective starting structure were calculated for reference DNA without adduct and for modified DNA with the safrole adduct. The form of the DNA helix was classified by the DISICL (dihedral-based segment identification and classification) algorithm (Nagy and Oostenbrink 2014). Hydrogen bonding is defined by a minimum donor-hydrogen-acceptor angle of 135° and a maximum hydrogen-acceptor distance of 0.25 nm (Oostenbrink et al. 2005). DNA duplex
Fig.1 (a) Base sequence context in which the lesion is embedded. G6* represents the modified guanine base. (b) Chemical structure of the S-3’-N2-dG adduct with different dihedral angles.
(b)
MOLECULAR DYNAMICS AND IN VITRO QUANTIFICATION OF SAFROLE DNA ADDUCTS 73
3

helicoidal parameters were analyzed in the same way as described previously (Yang et al. 2020a). The parameters evaluated in the analysis include six local base pair parameters (buckle, propeller, opening, shear, stretch, and stagger) and six base pair step parameters (rise, roll, shift, slide, and tilt). These parameters, together with the groove dimensions, were analyzed over the whole trajectories using X3DNA (Lu and Olson 2003). The GROMOS trajectories were converted to PDB files and parsed individually. PyMOL was used to make molecular images and movies (version 2.3, 2019) (DeLano 2002).
2.9 Statistical analysisDurnnett’s multiple comparison test was performed using GraphPad Prism 5 (version 5.04, 2010; GraphPad Software, Inc.).
3. Results
3.1 Cytotoxicity testThe test compounds safrole and 1’-OH safrole were not cytotoxic to the HepaRG cells, CHO cells, or primary rat hepatocytes at the concentrations tested upon 2 h of exposure, as shown by the results of the MTT and WST-1 assays (data not shown).
3.2 Role of NER in the repair of S-3’-N2-dG DNA adductThe role of NER in the possible repair of S-3’-N2-dG adducts was investigated in CHO wild type cells and three NER defective mutants. The CHO (mutant) cells were used for these studies because the human genes related to NER are contained in CHO cells (Rolig et al. 1998). Upon 24 h of repair, a significant reduction in cellular S-3’-N2-dG adduct levels was only observed in the CHO wild type cells but with still 35 ± 13% of the original S-3’-N2-dG adduct level remaining in the cells after 24 h of repair (Fig. 2a). Although attenuation of DNA adduct levels was observed in NER deficient cells, in these cells the reduction did not reach statistical significance. Fig. 2b presents the reduction in the level of DNA adducts in the different cells expressed in the number of DNA adducts per 108 nt. Also, this presentation of the data as absolute change in the number of S-3’-N2-dG adducts per 108 nts compared to the level detected at t-0 h of repair reveals that the reduction in DNA adduct levels was most substantial and only significant in the CHO wild type cells. Taken together, the data support a role for NER in the repair of the S-3’-N2-dG DNA adduct.
3.3 DNA repair in liver cell modelsFig. 3 presents S-3’-N2-dG DNA adduct level changes over time of repairing in HepaRG cells and rat hepatocytes. In HepaRG cells (Fig. 3a), the level of the DNA adducts appeared to be persistent without a clear reduction during the 48 h of recovery. In rat hepatocytes, time to follow the repair was restricted to 4 h after the exposure due to the limited viability of
74 CHAPTER 3

the primary hepatocytes upon prolonged incubation. After 4 h of repair, the DNA adduct levels were not reduced compared to the amount detected immediately upon the removal of safrole (Fig. 3b). These data indicate that in the liver cell models S-3’-N2-dG adducts were persistent and were not efficiently removed by the repair system within the 48 h following their formation.
3.4 Molecular modeling and MD simulationTo obtain insight into potential reasons underlying the inefficient repair of the S-3’-N2-dG DNA adducts MD simulations were performed. To this end, first molecular modeling was
Fig. 2 Time-dependent DNA repair in CHO wild type and CHO NER defective cells (UV5, UV41, and UV24). DNA adducts are expressed as (a) the percentage of remaining S-3’-N2-dG adducts compared to the corresponding value at 0 h of repair setting at 100% and as (b) the numerical change in the actual number of S-3’-N2-dG adducts per 108 nts compared to the level detected at t-0 h of repair. The level of DNA adducts at 0 h of repair amounted to 49 ± 19 / 108 nts in wild type cells, 26 ± 7 / 108 nts in UV5, 15 ± 1 /108 nts in UV24, and 20 ± 5 /108 nts in UV41. A T-test was used to test for significant differences in DNA adduct levels compared to the level at 0 h of repair in the respective cell line (*p<0.05, ** p<0.01); data represent the average and SD for four independent experiments.
0h 2h 4h
24h 0h 2h 4h
24
h 0h 2h 4h
24h 0h 2h 4h
24
h0
50
100
150
200 wtuv5uv41uv24
*
a
repair time (h)
% o
f 0h
repa
ir
0h 2h 4h24h 0h 2h 4h24
h 0h 2h 4h24h 0h 2h 4h24
h-10
0
10
20
30
40
50
60wtuv5uv24uv41
*
b
repair time (h)
Num
ber o
f red
uced
DNA
add
uct /
10^8
nts
MOLECULAR DYNAMICS AND IN VITRO QUANTIFICATION OF SAFROLE DNA ADDUCTS 75
3

performed based on the structure built by the MOE software. Fig. S2 in the supplementary information shows the conformation of the adduct in the initial structures. Four 20 ns MD simulations were initially analyzed to investigate the influence of the initial structure, followed by six independent 100 ns simulations to study the structural effects on ds DNA upon S-3’-N2-dG DNA adduct insertion.
3.4.1 Preliminary simulationsSupplementary Table S3 compares the values of the dihedral angles along the adduct, highlighted in Fig. 1 for the initial structures and averaged over the simulations. Even though the initial structures differed significantly, the averages of the dihedral angles in these simulations were strikingly similar. Also, the distributions in Fig. S3 suggest that similar conformations are sampled. Similarly, the nonbonded interaction energies between the safrole adduct and the rest of the DNA molecule is indistinguishable between the simulations (Table S3). A joint conformational clustering of the four simulations was performed based on snapshots extracted every 5 ps of these simulations. A total of 34 clusters were obtained. The number of structures in the first 5 clusters, which cover 92% of all sampled conformations contained in 34 clusters, is shown in Fig. S4. As indicated with different colors in this figure, the first 5 clusters contained structures that originated from each of the four simulations, which illustrates that simulations are independent of the initial structure.
3.4.2 Representative conformations of the adductA conformational clustering was subsequently performed on the conformations of the S-3’-N2-dG adduct that were observed in each of the six 100 ns simulations. A total of 51 clusters were obtained. The representative structures of the first 6 clusters, which cover 90% of all sampled conformations contained in 51 clusters, are shown in Fig. 4a. As indicated with
Fig. 3 Time-dependent S-3’-N2-dG DNA adduct repair in (a) HepaRG cells and (b) primary rat hepatocytes. DNA adducts are expressed as the percentage of the level at the end of the 2 h of exposure and t=0 for the repair set at 100%. The number of DNA adducts at 0 h of repair (100%) in HepaRG cells and rat hepatocytes amounted to 18 ± 3 / 108 nts and 75 ± 36 /108 nts, respectively.
0h 2h 4h 24h
48h
0
50
100
150
200HepaRG cells
a
repair time (h)
riaper h0 fo %
0h 4h0
50
100
150
200Rat hepatocytes
b
repair time (h)
riaper h0 fo %
76 CHAPTER 3

different colors in Fig. 4a, the first 6 clusters contained structures that originated from all six simulations, which illustrates that the most relevant conformations were observed in each of the independent simulations. The representative structures (Fig. 4b) show a similar pattern with the S-3’-N2-dG adduct residue being placed in the minor groove of the helix. No intercalated conformations of S-3’-N2-dG adduct in ds DNA were found at the lesion site.
3.4.3 RMSD analysisIn order to illustrate the structural differences between the modified DNA helix containing the S-3’-N2-dG DNA adduct and six simulations of a reference DNA helix, the RMSD was
Fig. 4. a) Occurrence of the first 6 conformational clusters in 6 independent 100 ns simulations of the S-3’-N2-dG conformations. The different colors refer to 6 different simulations. (b) Corresponding representative structures for these first 6 clusters showing the S-3’-N2-dG adduct in the central 3-mer (C5-G6*-C7).
MOLECULAR DYNAMICS AND IN VITRO QUANTIFICATION OF SAFROLE DNA ADDUCTS 77
3

calculated for all the atoms excluding the first and last base pairs along the MD simulation (Fig. 5). The average RMSD values vary between 0.15 and 0.22 nm in both the reference DNA and the modified DNA. Overall, the average RMSD amounted to 0.17 ± 0.03 nm (standard deviation over the six simulations) for the unmodified DNA and 0.19 ± 0.01 nm for the simulations of the adducted DNA. No major conformational changes were observed, suggesting that only limited changes upon the formation of the S-3’-N2-dG DNA adduct occur. The transient peak of the green curve around 60 ns for the adducted DNA corresponds to a minor, reversible base opening (see Fig. 5).
3.4.4 Structure classificationThe changes in DNA structure classification caused by DNA adduct formation was further analyzed by DISICL. DISICL was used to calculate and classify the structure based on the central 9-mer of each strand of the helix (Table 1). In general, the structure classification changes are subtle and limited. While for all simulations a transition from the modeled B-DNA to the AB transition region is observed, this seems slightly less for the DNA strand with the safrole adduct. For the opposing strand no significant differences between the unmodified DNA and the adducted DNA are observed at all.
3.4.5 Helicoidal parameters and groove widthFurther analysis of any distortions in the successive DNA base pairs was performed by evaluation of helicoidal parameters, including step parameters and local parameters, using the X3DNA software for different simulations of unmodified DNA and for modified DNA. The step parameters are measured between adjacent base pairs (Supplementary information,
Fig. 5 RMSD of all atoms in the central 9-mer DNA duplex for unmodified DNA (top panel) and modified DNA (lower panel) as a function of the 100 ns of the six independent simulations. Different colors match the colors in Fig. 4 and represent individual simulations.
78 CHAPTER 3

Table 1. DNA structure classification of modified DNA and unmodified DNA. Four independent simulations were performed in reference DNA with the standard deviation (over six simulations). All the data are presented as the average values from the central 9-mer of each strand, and subsequently averaged over the six independent simulations (with standard deviations). Significant differences (differences between averages are larger than the uncertainty on this difference) are indicated with an asterisk (*)
Strand 1 a Strand 2
type unmodified DNA
adducted DNA
unmodified DNA
adducted DNA
BI b 22.8 ± 1.5 24.8 ± 1.2 (*) 18.3 ± 1.6 18.1 ± 1.5
BL c 15.9 ± 0.7 17.6 ± 1.0 (*) 13.1 ± 0.3 13.0 ± 1.5
AH d 8.5 ± 0.2 7.1 ± 0.4 (*) 13.0 ± 1.0 13.1 ± 1.7
AB e 41.7 ± 0.7 38.8 ± 1.0 (*) 42.9 ± 0.8 43.3 ± 2.0
AB2 f 2.9 ± 0.5 2.8 ± 0.3 3.4 ± 0.3 3.3 ± 0.4
UC g 4.5 ± 0.6 4.6 ± 0.5 5.6 ± 0.8 5.7 ± 0.8
a) Strand 1 contains the DNA adduct. b) BI: classical B form DNA c) BL: B-loop. d) AH: A-helix. e) AB: AB transition. f) AB2: AB transition region 2 g) UC: unclassified.
Table 2. Average values of helicoidal parameters at step 5 and step 6. The data present as average with standard deviations over the six independent simulations. Significant differences between the unmodified DNA and adducted DNA are indicated with an asterisk (*)
Unmodified DNA Adducted DNA
Step 5
Rise (Å) 3.76 ± 0.06 3.62 ± 0.04 *
Roll (°) 15.4 ± 0.4 15.6 ± 0.6
Shift (Å) 0.13 ± 0.06 0.12 ± 0.21
Slide (Å) -1.96 ± 0.03 -1.85 ± 0.03 *
Tilt (°) -1.4 ± 0.4 -2.1 ± 0.7
Twist (°) 27.2 ± 0.3 25.9 ± 0.5 *
Step 6
Rise (Å) 3.20 ± 0.04 3.16 ± 0.03
Roll (°) 5.1 ± 0.1 6.6 ± 0.4 *
Shift (Å) -0.25 ± 0.02 -0.18 ± 0.01 *
Slide (Å) -0.98 ± 0.15 -0.82 ± 0.14
Tilt (°) -3.2 ± 0.2 -2.1 ± 0.1 *
Twist (°) 35.6 ± 0.2 34.7 ± 0.4 *
MOLECULAR DYNAMICS AND IN VITRO QUANTIFICATION OF SAFROLE DNA ADDUCTS 79
3

Fig. S5), while the local parameters are measured between two pairing nucleobases (Rodriguez-Oquendo 2015).
For the data obtained from local base pair parameters, small shifts were found in the buckle, shear, and stretch of the modified base pair (base pair 6) as well as the buckle of the neighboring base pairs (5 and 7) and the stagger of base pair 7 (Supplementary information, Fig. S6). The rest of the structural parameters in modified DNA displayed almost the same values as those for the reference DNA (data not shown). For the step parameter analysis, small but significant changes were identified at steps 5 and 6 (Table 2). At step 6 (between base pairs 6 and 7), a slight increase of approximately 1.5° was observed in the roll, which is considered to be still in line with a commonly observed 10 to 15° variation in DNA crystal structures (Rice and Correll 2008). Changes in the tilt and twist were smaller with 1.1 and 0.9°, respectively. At step 5, the change in the twist amounts to 1.3°. The values are still very comparable to the values for ideal B-DNA (Cai et al. 2011). The changes in rise and slide (step 5) and shift (step 6) are of the order of 0.1 Å and seem negligible.
The major and minor groove widths are calculated from the distances between adjacent phosphorus atoms (Supplementary information, Fig. S7). Both the major groove and the minor groove are about 3 Å larger than typical B-DNA, in accordance with the relatively low occurrence of pure B-DNA conformations seen in Table 1. Significant increases of about 0.6 Å between unmodified and adducted DNA are only observed in the minor groove at base pairs 7 and 8, corresponding to the position of the safrole adduct (Fig. 4).
3.4.6 Hydrogen bondingExcept by structural modifications, the conformational changes and stability of the DNA helix are also reflected by the hydrogen bonding. Overall, the Watson-Crick hydrogen bonds are stable throughout the simulations. A complete loss of hydrogen bonds at a specific base pair is only observed rarely, and reversibly. Fig. S8 shows two exemplary time series of the occurrence of all Watson-Crick hydrogen bonds. Fig. S8B corresponds to the dark green curve in the lower panel of Fig. 5; note the reversible loss of hydrogen bonds at the seventh base pair around 60 ns, corresponding to the increased RMSD in Fig. 5. Table 3 describes hydrogen bonding occupancies (%) for the central 3-mer for unmodified DNA and adducted DNA. The Watson-Crick hydrogen bonding remained stable at all base pairs, but a shift in the hydrogen bond strengths occurred at the modified base pair G6*:C17. In G6*: C17, the presence of the S-3’-N2-dG adduct at the N2 site of guanine gives a 10% increase in hydrogen bonding occupancies at N2-O2; however, this is balanced by a decrease at N4-O6 and N1-N3. This correlates with the slight shift of the shear property at this base pair (Fig. S6). The S-3’-N2-dG DNA adduct insertion influences the hydrogen bonding in C7:G16 in a similar way but to a lesser extent.
80 CHAPTER 3

4. Discussion
It is well-known that NER is involved in the repair of bulky DNA adducts (Gillet and Schärer 2006; Gunz et al. 1996; Hoeijmakers 2009; Nouspikel 2009). In this study, the role of NER in repair of the major DNA adduct formed upon exposure to the food-borne alkenylbenzene safrole, S-3’-N2-dG, was illustrated by the data derived from CHO wild type and CHO UV cells, which are mutated in different genes coding for proteins involved in NER (Balajee et al. 1998). In more details, XPD (deletion in UV5) and ERCC3 (XPB) (mutation in UV24) are the core components of TFIIH participating in the unwinding of DNA at the site of the lesion and verifying the damage (Fuss and Tainer 2011; O’brien et al. 2005). The ERCC-XPF (deletion in UV 41) is responsible for the incision of the lesion site (Lee et al. 2015; O’brien et al. 2005). The deficiency in these genes leads to the greater resistance of DNA adducts in the CHO UV cells when compared with the CHO wild type although some of the adducts were removed by 24 h, indicating that there may either be some repair or a reduction in DNA adducts due to DNA adduct dilution caused by the DNA/cell replication, or by apoptosis of cells containing high level of DNA adducts. The lower removal rates of DNA adducts in CHO UV cells as compared to the CHO wild type cells were also reported for N-OH-2-NA DNA adducts (Thompson et al. 1983). In addition, the standard deviations in Fig. 2a are generally high, an observation that it is likely related to the relatively low level of DNA adducts formed upon exposure to 1’-hydroxysafrole at 50 μM concentration. Use of higher concentrations was considered but not considered adequate because based on our pretest (data not shown) exposure concentrations higher than 50 μM did not induce DNA adduct increase obviously. This is probably caused by the common production of sulfonation that may inefficiently penetrate cell membrane and be hard to reach to DNA, or inhibit the SULT-mediated bioactivation by producing the secondary reactive species by
Table 3. Hydrogen bonding occupancies (%) for the center 3-mer for unmodified DNA and adducted DNA with standard deviations over the six simulations. Significant differences are indicated with an asterisk (*). Example time series of occurrences for all base pairs are given in Fig. S8.
Unmodified DNA Adducted DNA
C5...G18 N4..H41..O6 91.1 ± 1.5 91.0 ± 1.0
N1..H1..N3 97.4 ± 0.4 96.8 ± 1.7
N2..H21..O2 77.5 ± 4.2 76.8 ± 5.6
G6...C17 N4..H41..O6 91.3 ± 0.9 86.8 ± 2.3 *
N1..H1..N3 98.6 ± 0.1 96.5 ± 1.6 *
N2..H21..O2 88.6 ± 0.9 98.2 ± 0.1 *
C7...G16 N4..H41..O6 92.7 ± 0.9 91.4 ± 0.4 *
N1..H1..N3 96.5 ± 0.8 97.3 ± 0.2
N2..H21..O2 77.2 ± 1.8 82.0 ± 0.6 *
MOLECULAR DYNAMICS AND IN VITRO QUANTIFICATION OF SAFROLE DNA ADDUCTS 81
3

reacted with media components (Glatt et al. 1998). The concentration of 50 μM enables comparison to our previous study on DNA adduct formation and repair upon exposure to 50 μM 1’-hydroxyestragole (Yang et al. 2020a) where higher levels of estragole DNA adducts were formed with relatively lower standard deviations.
Given that the liver is the target organ for safrole induced tumor formation, the repair of the S-3’-N2-dG adduct was also investigated in HepaRG cells and rat hepatocytes. Limited or even no attenuation in the S-3’-N2-dG adducts level was found in both HepaRG cells and rat hepatocytes during the whole recovery time, illustrating persistence of the S-3’-N2-dG adducts in these cells. Although given the bulky nature of the adducts focus in the study was on nucleotide excision repair (NER), known to be the major type of repair for bulky adducts, other types of DNA repair may be considered as well including for example base pair excision repair (BER). The results obtained for the primary hepatocytes and HepaRG cells demonstrate that, whatever the mode of action, the repair of the S-3’-N2-dG adducts is limited. Thus, independent of the mechanisms contributing to the small reduction in the level of the adducts, including repair, apoptosis, and/or cell replication, the removal appears to be inefficient and incomplete within the 24 h following exposure, this points at the potential for bioaccumulation upon repeated daily exposure. The persistence of S-3’-N2-dG adducts was also reported in previous in vivo studies upon exposure of CD-1 mice to 10 mg of safrole via intraperitoneal injection (Gupta et al. 1993; Randerath et al. 1984). Randerath et al. (1984) detected the DNA adduct levels at 1, 7, 28, 58, 98, and 140 days after treatment with safrole reporting a reduction by 75% in the first 7 days but persistence of the adducts upon prolonged time intervals. In a later study, Gupta et al. (1993) also found the S-3’-N2-dG adducts to be persistent, but immediately following exposure, there was limited reduction observed at all time points following safrole dosing (1, 2, 3, 7, 15, and 30 days). In particular, this more recent study is in line with the observations in the present study using in vitro liver models, where the repair in both the human HepaRG cell line as well as in the primary rat hepatocytes was limited if not absent. It is also of interest to note that the limited repair reported by Gupta et al. (1993) was observed at all safrole dose levels tested including 0.01, 0.1, 1, and 10 mg / mouse. The reason underlying the initial decrease in the study reported by Randerath et al. (1984) remains to be elucidated. The limited repair or even absence of repair of DNA adducts of alkenylbenzenes in the liver was also reported before. In 1984, Phillips et al. (1984) found that DNA adducts detected upon estragole, methyleugenol, safrole exposure of B6C3F1 mice were still present 22 days after the final treatment. We recently corroborated the persistence of the major estragole DNA adduct (E-3’-N2-dG) with over 80% of the adduct level remaining in rat hepatocytes and human HepaRG cells after 72 h of repair (Yang et al. 2020a).
In 1981, Phillips et al. proposed that the inefficient repair of estragole DNA adducts may be the consequence of the conformation of the DNA adducts (Phillips et al. 1981b). In our
82 CHAPTER 3

previous molecular modeling and simulation study (Yang et al. 2020a), this hypothesis was investigated to a further extent using MD simulation of the structure of an estragole DNA adduct (E-3’-N2-dG) embedded within a theoretical 11-mer ds DNA structure. The majority of simulations with different initial conformations of the E-3’-N2-dG DNA adduct located in the minor groove of the DNA helix showed limited distortion of the DNA structure as compared to that of DNA without the estragole adduct. The limited repair of the DNA adducts that bind to the amino group of guanine and reside in the B-DNA minor groove where they cause little distortion is in line with what has been observed for other adducts including N2 -AAF-dG, N2 -anti-BP-diol epoxide-dG (Beland 1978), and N2-ABA-dG (Lukin et al. 2011). These results and the fact that recognition and subsequent repair by the NER mediated repair process requires a substantial structural disturbance leads to the conclusion that the limited disturbance of the DNA upon adduct formation may explain the inefficient repair and persistence of the DNA adducts formed. In the current study, we applied the same molecular modeling and simulation strategy to characterize the structural changes of ds DNA caused by formation of the S-3’-N2-dG adduct.
Similar to E-3’-N2-dG adduct (Yang et al. 2020a), the MD simulation of the S-3’-N2-dG adducts show conformations in which safrole is located in the minor groove of the DNA helix. In representative structures of the S-3’-N2-dG DNA adduct, the base pairs remain intact and in their original positions. This holds for the base pairs next to the lesion site. In six independent 100 ns simulations of unmodified and of adducted DNA, the overall DNA structure was well maintained. The structure moves from an initially modelled B-DNA structure towards the AB transition conformations, and shows slightly larger groove dimensions. Overall, the results from the molecular modeling and MD simulation indicate that the modified DNA is highly comparable to the reference DNA. All parameters point at very little deformation of the DNA structure. This could explain why, in liver cell models, the repair of S-3’-N2-dG is inefficient. This further corroborates results reported previously for the related alkenylbenzene estragole (Yang et al. 2020a). In line with some other studies the stability of the duplex DNA upon E-3’-N2-dG formation could be further investigated using melting temperature studies (Buterin et al. 2000; Laryea et al. 1995; Ruan et al. 2002), although it should be kept in mind that the relationship between DNA structure and the Tm may not always be straightforward (Geacintov and Broyde 2017), making this a study in itself.
So far, our studies have tested the DNA adduct formation and DNA repair upon exposure to estragole and safrole, which are two major food-borne alkenylbenzenes. Previous data on the formation of the DNA adducts by these two alkenylbenzenes revealed a higher catalytic efficiency, defined as Vmax/KM, for bioactivation to the DNA reactive 1’-sulfooxymetabolite for estragole than for safrole, reflected by an 8-fold higher catalytic efficiency for 1’-hydroxylation and a 2.5-fold higher catalytic efficiency for sulfonation (Martati et al.
MOLECULAR DYNAMICS AND IN VITRO QUANTIFICATION OF SAFROLE DNA ADDUCTS 83
3

2012; Punt et al. 2007; Punt et al. 2009). These results are in line with our findings that, at a 50 μM concentration of the parent alkenylbenzenes, 2-fold higher DNA adduct levels were formed in HepaRG cells or rat hepatocytes exposed to estragole than those exposed to safrole (Supplementary information, Tables S1 and S2; Yang et al. (2020a), Supplementary information, Tables S1 and S2). The limited repair of the DNA adducts raises the concern of a possible accumulation of DNA adducts upon regular exposure to low dietary levels. Whether such accumulation would ultimately reach the levels occurring at dose levels that cause increased tumor incidences in rodent studies remains an interesting topic for future study.
Acknowledgement
The authors gratefully acknowledge the mentoring help of Prof. Wilfred van Gunsteren who facilitated the collaboration that resulted in this combined research effort of the Division of Toxicology, Wageningen University, The Netherlands and the Institute of Molecular Modeling and Simulation, Department of Material Sciences and Process Engineering, University of Natural Resources and Life Sciences, Vienna
Funding
This work was funded by a grant from the China Scholarship Council (no. 201607720009) to Shuo Yang.
Notes
The authors declare no competing financial interest.
Supplementary information
For convince, supplementary information can be found in 10.1021/acs.chemrestox.0c00097.
84 CHAPTER 3

Reference
Abbott D, Packman E, Wagner B, Harrisson J (1961) Chronic oral toxicity of oil of sassafras and safrole. Pharmacologist 3(2):62
Abraham MJ, Murtola T, Schulz R, et al. (2015) GROMACS: High performance molecular simulations through multi-level parallelism from laptops to supercomputers. SoftwareX 1:19-25
Balajee AS, May A, Dianova I, Bohr VA (1998) Efficient PCNA complex formation is dependent upon both transcription coupled repair and genome overall repair. Mutation Research/DNA Repair 409(3):135-146
Beland F (1978) Computer-generated graphic models of the N2-substituted deoxyguanosine adducts of 2-acetylaminofluorene and benzo [a] pyrene and the O6-substituted deoxyguanosine adduct of 1-naphthylamine in the DNA double helix. Chemico-biological interactions 22(2-3):329-339
Buterin T, Hess MT, Luneva N, et al. (2000) Unrepaired fjord region polycyclic aromatic hydrocarbon-DNA adducts in ras codon 61 mutational hot spots. Cancer research 60(7):1849-1856
Cai Y, Ding S, Geacintov NE, Broyde S (2011) Intercalative Conformations of the 14 R (+)-and 14 S (−)-trans-anti-DB [a, l] P-N 6-dA Adducts: Molecular Modeling and MD Simulations. Chemical research in toxicology 24(4):522-531
Croy RG, Wogan GN (1981) Temporal patterns of covalent DNA adducts in rat liver after single and multiple doses of aflatoxin B1. Cancer research 41(1):197-203
Daura X, van Gunsteren WF, Mark AE (1999) Folding–unfolding thermodynamics of a β-heptapeptide from equilibrium simulations. Proteins: structure, function,bioinformatics 34(3):269-280
DeLano WL (2002) The PyMOL molecular graphics system. http://www pymol orgDolenc J, Baron R, Oostenbrink C, Koller J, van Gunsteren WF (2006) Configurational entropy change of
netropsin and distamycin upon DNA minor-groove binding. Biophysical journal 91(4):1460-1470Eichenberger AP, Allison JR, Dolenc J, et al. (2011) GROMOS++ software for the analysis of biomolecular
simulation trajectories. Journal of chemical theory and computation 7(10):3379-3390Fuss JO, Tainer JA (2011) XPB and XPD helicases in TFIIH orchestrate DNA duplex opening and damage
verification to coordinate repair with transcription and cell cycle via CAK kinase. DNA repair 10(7):697-713
Geacintov NE, Broyde S (2017) Repair-resistant DNA lesions. Chemical research in toxicology 30(8):1517-1548
Gillet LC, Schärer OD (2006) Molecular mechanisms of mammalian global genome nucleotide excision repair. Chemical reviews 106(2):253-276
Glatt H, Bartsch I, Christoph S, et al. (1998) Sulfotransferase-mediated activation of mutagens studied using heterologous expression systems. Chemico-biological interactions 109(1-3):195-219
Gunz D, Hess MT, Naegeli H (1996) Recognition of DNA adducts by human nucleotide excision repair Evidence for a thermodynamic probing mechanism. Journal of Biological Chemistry 271(41):25089-25098
Gupta KP, van Golen KL, Putman KL, Randerath K (1993) Formation and persistence of safrole-DNA adducts over a 10 000-fold dose range in mouse liver. Carcinogenesis 14(8):1517-1521
MOLECULAR DYNAMICS AND IN VITRO QUANTIFICATION OF SAFROLE DNA ADDUCTS 85
3

Hagan EC, Jenner PM, Jones WI, et al. (1965) Toxic properties of compounds related to safrole. Toxicology applied pharmacology 7(1):18-24
Hoeijmakers JH (2009) DNA damage, aging, and cancer. New England Journal of Medicine 361(15):1475-1485
Homburger F, Kelley Jr T, Friedler G, Russfield A (1961) Toxic and Possible Carcinogenic Effects of 4-AlIyl-1, 2-Methylenedioxybenzene (Safrole) in Rats on Deficient Diets. Pharmacology 4(1):1-11
Ito S, Kuraoka I, Chymkowitch P, et al. (2007) XPG stabilizes TFIIH, allowing transactivation of nuclear receptors: implications for Cockayne syndrome in XP-G/CS patients. Molecular cell 26(2):231-243
Laryea A, Cosman M, Lin J-M, et al. (1995) Direct synthesis and characterization of site-specific adenosyl adducts derived from the binding of a 3, 4-dihydroxy-1, 2-epoxybenzo [c] phenanthrene stereoisomer to an 11-mer oligodeoxyribonucleotide. Chemical research in toxicology 8(3):444-454
Lee M-S, Liu C-y, Su L, Christiani DC (2015) Polymorphisms in ERCC1 and ERCC2/XPD genes and carcinogen DNA adducts in human lung. Lung Cancer 89(1):8-12
Lu XJ, Olson WK (2003) 3DNA: a software package for the analysis, rebuilding and visualization of three-dimensional nucleic acid structures. Nucleic acids research 31(17):5108-5121
Lukin M, Zaliznyak T, Johnson F, de los Santos CR (2011) Incorporation of 3-aminobenzanthrone into 2ʹ-deoxyoligonucleotides and its impact on duplex stability. Journal of nucleic acids 2011
Martati E, Boersma MG, Spenkelink A, et al. (2012) Physiologically based biokinetic (PBBK) modeling of safrole bioactivation and detoxification in humans as compared with rats. Toxicological sciences 128(2):301-316
Martati E, Boonpawa R, van den Berg JH, et al. (2014) Malabaricone C-containing mace extract inhibits safrole bioactivation and DNA adduct formation both in vitro and in vivo. Food chemical toxicology 66:373-384
Melis JP, van Steeg H, Luijten M (2013) Oxidative DNA damage and nucleotide excision repair. Antioxidants redox signaling 18(18):2409-2419
Mocquet V, Kropachev K, Kolbanovskiy M, et al. (2007) The human DNA repair factor XPC-HR23B distinguishes stereoisomeric benzo [a] pyrenyl-DNA lesions. The EMBO journal 26(12):2923-2932
Nagy G, Oostenbrink C (2014) Dihedral-based segment identification and classification of biopolymers II: Polynucleotides. Journal of chemical information and modeling 54(1):278-288
Németh E, Schilli GK, Nagy G, Hasenhindl C, Gyurcsik B, Oostenbrink C (2014) Design of a colicin E7 based chimeric zinc-finger nuclease. Journal of computer-aided molecular design 28(8):841-850
Northrop RB, Connor AN (2008) Introduction to molecular biology, genomics and proteomics for biomedical engineers. CRC Press
Nouspikel T (2009) DNA repair in mammalian cells. Cellular Molecular Life Sciences 66(6):994-1009O’brien TJ, Brooks BR, Patierno SR (2005) Nucleotide excision repair functions in the removal of
chromium-induced DNA damage in mammalian cells. Molecular cellular biochemistry 279(1-2):85-95
Oostenbrink C, Soares TA, Van der Vegt NF, Van Gunsteren WF (2005) Validation of the 53A6 GROMOS force field. European Biophysics Journal 34(4):273-284
86 CHAPTER 3

Oostenbrink C, van Gunsteren WF (2005) Efficient calculation of many stacking and pairing free energies in DNA from a few molecular dynamics simulations. Chemistry–A European Journal 11(15):4340-4348
Paini A, Punt A, Viton F, et al. (2010) A physiologically based biodynamic (PBBD) model for estragole DNA binding in rat liver based on in vitro kinetic data and estragole DNA adduct formation in primary hepatocytes. Toxicology and applied pharmacology 245(1):57-66
Paini A, Scholz G, Marin-Kuan M, et al. (2011) Quantitative comparison between in vivo DNA adduct formation from exposure to selected DNA-reactive carcinogens, natural background levels of DNA adduct formation and tumour incidence in rodent bioassays. Mutagenesis 26(5):605-618
Petruseva I, Evdokimov A, Lavrik O (2014) Molecular mechanism of global genome nucleotide excision repair. Acta Naturae 6(1 (20))
Phillips DH, Miller JA, Miller EC, Adams B (1981b) Structures of the DNA adducts formed in mouse liver after administration of the proximate hepatocarcinogen 1ʹ-hydroxyestragole. Cancer Research 41(1):176-186
Phillips DH, Reddy MV, Randerath K (1984) 32 P-post-labelling analysis of DNA adducts formed in the livers of animals treated with safrole, estragole and other naturally-occurring alkenylbenzenes. II. Newborn male B6C3F 1 mice. Carcinogenesis 5(12):1623-1628
Punt A, Delatour T, Scholz G, Schilter B, van Bladeren PJ, Rietjens IMCM (2007) Tandem Mass Spectrometry Analysis of N 2-(trans-Isoestragol-3 ‘-yl)-2 ‘-deoxyguanosine as a Strategy to Study Species Differences in Sulfotransferase Conversion of the Proximate Carcinogen 1 ‘-Hydroxyestragole. Chemical research in toxicology 20(7):991-998
Punt A, Paini A, Boersma MG, et al. (2009) Use of physiologically based biokinetic (PBBK) modeling to study estragole bioactivation and detoxification in humans as compared with male rats. Toxicological sciences 110(2):255-269
Randerath K, Haglund RE, Phillips DH, Reddy MV (1984) 32 P-post-labelling analysis of DNA adducts formed in the livers of animals treated with safrole, estragole and other naturally-occurring alkenylbenzenes. I. Adult female CD-1 mice. Carcinogenesis 5(12):1613-1622
Rice PA, Correll CC (2008) Protein-nucleic acid interactions: structural biology, vol 11. Royal society of chemistry
Rietjens I, Cohen SM, Fukushima S, et al. (2014) Impact of structural and metabolic variations on the toxicity and carcinogenicity of hydroxy-and alkoxy-substituted allyl-and propenylbenzenes. Chemical research in toxicology 27(7):1092-1103
Rodriguez-Oquendo A (2015) Translational Cardiometabolic Genomic Medicine. Academic PressRolig RL, Lowery MP, Adair GM, Nairn RS (1998) Characterization and analysis of Chinese hamster ovary
cell ERCC1 mutant alleles. Mutagenesis 13(4):357-365Ruan Q, Kolbanovskiy A, Zhuang P, et al. (2002) Synthesis and Characterization of Site-Specific and
Stereoisomeric Fjord Dibenzo [a, l] pyrene Diol Epoxide− N 6-Adenine Adducts: Unusual Thermal Stabilization of Modified DNA Duplexes. Chemical research in toxicology 15(2):249-261
MOLECULAR DYNAMICS AND IN VITRO QUANTIFICATION OF SAFROLE DNA ADDUCTS 87
3

Schmid N, Christ CD, Christen M, Eichenberger AP, van Gunsteren WF (2012) Architecture, implementation and parallelisation of the GROMOS software for biomolecular simulation. Computer Physics Communications 183(4):890-903
Sidorenko VS, Yeo J-E, Bonala RR, Johnson F, Schärer OD, Grollman AP (2012) Lack of recognition by global-genome nucleotide excision repair accounts for the high mutagenicity and persistence of aristolactam-DNA adducts. Nucleic acids research 40(6):2494-2505
Soares TA, Hünenberger PH, Kastenholz MA, et al. (2005) An improved nucleic acid parameter set for the GROMOS force field. Journal of computational chemistry 26(7):725-737
Thompson L, Salazar E, Brookman K, Hoy C (1983) Hypersensitivity to cell killing and mutation induction by chemical carcinogens in an excision repair-deficient mutant of CHO cells. Mutation Research/DNA Repair Reports 112(6):329-344
Yang S, Diem M, Liu JD, et al. (2020a) Cellular levels and molecular dynamics simulations of estragole DNA adducts point at inefficient repair resulting from limited distortion of the double-stranded DNA helix. Archives of Toxicology:1-17
Zgarbová M, Jurecka P, Sponer Jí, Otyepka M (2018) A-to B-DNA transition in AMBER force fields and its coupling to sugar pucker. Journal of Chemical Theory Computation 14(1):319-328
88 CHAPTER 3

MOLECULAR DYNAMICS AND IN VITRO QUANTIFICATION OF SAFROLE DNA ADDUCTS 89
3


Chapter 4Estragole DNA adduct accumulation in human liver HepaRG cells upon repeated in vitro exposure
Shuo Yang, Sebastiaan Wesseling, Ivonne M.C.M. RietjensPublished in Toxicology Letters. 2020; 337, 1-6

Abstract
Accumulation of N2-(trans-isoestragol-3’-yl)-2’-deoxyguanosine (E-3’-N2-dG) DNA adducts derived from the alkenylbenzene estragole upon repeated dose exposure was investigated since the repair of this adduct was previously shown to be inefficient. To this end human HepaRG cells were exposed to repeating cycles of 2 h exposure to 50 μM estragole followed by 22 h repair to mimic daily exposure. The E-3’-N2-dG DNA adduct levels were quantified by LC-MS/MS after each cycle. The results show accumulation of E-3’-N2-dG DNA adducts at a rate of 17.53 adducts / 108 nts / cycle. This rate at the dose level calculated by physiologically based kinetic (PBK) modeling to result in 50 μM was converted to a rate expected at average human daily intake of estragole. The predicted time estimated to reach adduct levels reported at the BMD10 of the related alkenylbenzene methyleugenol of 10-100 adducts /108 nts upon average human daily intake of estragole amounted to 8-80 (in rat) or 6-57 years (in human). It is concluded that the persistent nature of the E-3’-N2-dG DNA adducts may contribute to accumulation of substantial levels of DNA adducts upon prolonged dietary exposure.
Key words: Estragole, DNA adduct accumulation, repeated exposure

1. Introduction
The group of food-borne alkenylbenzenes includes the compounds estragole, safrole and methyleugenol, generally present in herbs and spices like tarragon, nutmeg, basil and/or anise (EFSA 2012; Van Den Berg et al. 2011). These compounds raise a health concern because of their DNA adduct formation and carcinogenicity (Miller et al. 1983), inducing hepatic tumors at high dose repeated exposure in rodents (Jamuna 2010; Miller et al. 1983; SCF 2001). The mode of action underlying tumor formation includes metabolism of the parent alkenylbenzene by cytochromes P450 and sulfotransferases to 1’-sulfoxy metabolites that are able to form DNA adducts (Phillips et al. 1981b; Randerath et al. 1984; Wiseman et al. 1985). Although formation of DNA adducts may result in mutations and increase the risk of developing cancer, the DNA adduct formation may also induce DNA repair and be a reversible process (Klaunig and Kamendulis 2010). The ultimate hazard and risk posed by DNA adduct formation will thus depend on the efficiency of repair during the time before subsequent exposures. Our previous studies on cellular repair of the major estragole and safrole DNA adducts (E-3’-N2-dG and S-3’-N2-dG respectively) showed the repair of these DNA adducts to be inefficient with 80-90% of the adducts still remaining in HepaRG cells or primary hepatocytes after 48 h and/or 4 h repair (Yang et al. 2020a; Yang et al. 2020b). These observations are in line with in vivo studies where the DNA adducts of safrole were reported to persist in the liver of orally exposed CD-1 mice with only limited amounts being removed 30 days after a single dose (Gupta et al. 1993). This implies that DNA adduct levels are not only likely to increase with increasing dose levels, but also upon repeated exposure. Upon repeated exposure with insufficient repair between subsequent exposures, accumulation of DNA adduct levels with increasing days of exposure would be expected. The aim of the present study was to characterize this potential accumulation of DNA adduct levels upon repeated exposure to estragole. To mimic daily exposure HepaRG cells were exposed to estragole in a repeated 2 h exposure 22 h repair regimen, and the levels of the major E-3’-N2-dG adduct were quantified using LC-MS/MS. The estragole concentration used for these experiments was selected based on outcomes of a physiologically based kinetic (PBK) model based evaluation of the dose dependent liver blood concentrations using the models described by Punt et al. (2008; 2009). From the results obtained, the rate of bioaccumulation of the DNA adducts upon daily exposure could be estimated. This result was used to estimate the time required, at normal human dietary intake levels of estragole, to accumulate levels of E-3’-N2-dG DNA adducts in the range of the estimated level of liver DNA adducts of the related alkenylbenzene methyleugenol at its BMD10 (Paini et al. 2011).
ESTRAGOLE DNA ADDUCT ACCUMULATION UPON REPEATED EXPOSURE 93
4

2. Material and Method
2.1 Chemical and reagentsEstragole, human insulin, bovine spleen phosphodiesterase II (SPDE II), venom phosphodiesterase I (VPDE I), nuclease P1, phosphatase alkaline (AP), Tris(hydroxymethyl)aminomethane (Tris), and ethylenediaminetetraacetic acid (EDTA) were obtained from Sigma (St. Louis, Missouri, USA). Phosphate buffered saline (PBS) (pH 7.4) was purchased from Gibco (Paisley, UK). Williams’ E Medium, and penicillin-streptomycin (P/S) were purchased from Gibco (Grand Island, New York, USA). Fetal Bovine Serum (FBS) was purchased from Bodinco BV (Alkmaar, Netherlands). Hydrocortisone 21-hemisuccinate was purchased from Cayman Chemical (Ann Arbor, Michigan, USA). Dimethylsulfoxide (DMSO), hydrochloric acid (HCl), zinc sulfate (ZnSO4), and sodium acetate were purchased from Merck (Darmstadt, Germany). Acetonitrile (ACN) was purchased from Biosolve (Dieuze, France). RNeasy Lysis buffer (RLT) was purchased from QIAGEN (Hilden, Germany). Formic acid was purchased from VMR (Fontenay-sous-Bois, France).
2.2 Cellular modelHepaRG cells provide a frequently used model for studying hepatotoxicity of especially compounds that require cytochrome P450 mediated bioactivation (Szabo et al. 2013). The HepaRG cell line is derived from human hepatocellular carcinoma cells (Gripon et al. 2002) and can differentiate into hepatocyte-like morphology when treated with DMSO (Marion et al. 2010). In our previous study (Yang et al. 2020a), it was already shown that upon exposure of the HepaRG cells to estragole detectable levels of estragole derived DNA adducts can be formed. The undifferentiated HepaRG cell line was purchased from Biopredic international (Saint Grégoire, France) and cultured in growth medium consisting of William E Medium supplemented with 10% FBS (Sigma, St. Louis, MI, USA), 100 IU/mL of P/S, 5 × 10⁻⁵ M hydrocortisone 21-hemisuccinate and 5 μg/mL of human insulin at the density of 2×10⁵ cells/flask for 2 weeks at 37 °C and 5% (v/v) CO2 in a humidified atmosphere. After 2 weeks growth, differentiation medium was used to facilitate cell differentiation into cells with hepatocyte-like morphology with extra 1.7 % DMSO added to the growth medium for the following 2 weeks. All media were refreshed every other day. HepaRG cells were cultured in T-25 flasks (Greiner Bio-One, Frickenhausen, Germany) and maintained until the first week after full differentiation before being used for detection of DNA adduct formation upon repeated exposure.
2.3 PBK modelingIn order to find a suitable concentration of estragole that will result in formation of detectable levels of E-3’-N2-dG DNA adducts and has biological meaning, PBK model-based evaluation of the dose dependent liver blood concentrations were undertaken using the models described by Punt et al. (2008; 2009) predicting the bioactivation and detoxification
94 CHAPTER 4

of estragole in rat and in human respectively. Both models were used to calculate the dose-dependent maximum liver blood concentration of estragole, and from these data a suitable concentration used for the in vitro repeated exposure experiments was derived.
2.4 DNA adduct formation upon repeated exposureBased on the PBK model results the concentration of estragole selected for the experiments was 50 μM. Detailed information underlying this selection is shown in the result section. For repeated exposure, eight T-25 flasks of differentiated HepaRG cells were exposed to 50 μM estragole for 2 h. All the test compounds were added to exposure medium from a 1000 times concentrated stock solution in DMSO (final DMSO concentration amounting to 0.1%). After 2 h incubation, cells were washed by PBS once and the exposure medium was changed back to the differentiation medium without test compound for 22 h to facilitate DNA repair. This 2 h exposure and 22 h repair is considered as one cycle. The same process was repeated for another three cycles and after each time of repair, two flasks of HepaRG cells were randomly chosen and collected for quantification of the E-3’-N2-dG adduct levels. Fig. 1 presents a schematic overview of the repeated exposure experimental design. Since the differentiated HepaRG cells did not proliferate during the repair period (data not shown), no correction for DNA adduct dilution due to cell proliferation was required. Upon harvesting, cells were washed twice by resuspending in PBS and centrifugation at 211g for 5 minutes twice. After the second centrifugation, the supernatant was removed and the cells were lysed via the addition of 200 μL of RNeasy Lysis Buffer (RLT buffer) before DNA isolation.
Fig. 1 Schematic presentation of the repeated exposure experiment
ESTRAGOLE DNA ADDUCT ACCUMULATION UPON REPEATED EXPOSURE 95
4

2.5 DNA isolation and digestionDNA isolation was performed using the QIAamp DNA Mini Kit protocol for cultured cells (Hilden, Germany). The range of the cell number for DNA isolation was between 2×10⁶ and 5×10⁶ cells. The isolated DNA concentration was determined through NanodropTM
One (Thermo scientific, Waltham, MA, USA) and purity of the isolated DNA was measured based on the absorbance ratio A260/A280 with a value of 1.8-2.0 considered as sufficiently pure. After isolation, DNA samples were freeze-dried overnight and stored at -80 oC until digestion. Dried samples were dissolved in nanopure water, adjusted to 50 μg per 30 μL before digestion. DNA digestion was performed as previously described (Yang et al. 2020a). Briefly, samples were incubated with 40 μL of PI-buffer (300 mM sodium acetate, 1 mM ZnSO4, pH 5.3), 20 μL of SPDE II solution (0.0004 U/μL in water), and 10 μL of nuclease P1 (0.5 μg/μL in water) at 37 °C for 4 h. After 4 h incubation, 40 μL of PA-buffer (500 mM Tris–HCl, 1 mM EDTA, pH 8.0), 20 μL of VPDE I solution (0.00026 U/μL in water), and 1.6 μL of AP (200 units) were added and samples were incubated at 37 oC for another 2 h.
2.6 Synthesis of E-3’-N2-dG adduct and LC-MS/MS method for detection and quantification of E-3’-N2-dG adductsE-3’-N2-dG adduct synthesis was performed as previously reported(Yang et al. 2020a). LC-MS/MS detection and quantification of the E-3’-N2-dG adducts was adapted from Paini et al. (2010) using a Shimadzu Nexera XR LC-20AD SR UPLC system coupled with a Shimadzu LCMS-8040 mass spectrometer (Kyoto, Japan). The samples (5 µL) were loaded onto a reverse phase C18 column (1.7 µm 2.1 × 50 mm) with a flow rate of 0.3 mL/min and the column temperature set at 40 °C. The mobile phase consisted of ultrapure water with 0.1% (v/v) formic acid and acetonitrile containing 0.1% (v/v) formic acid. The initial condition was 5% acetonitrile for 1 minute, followed by a linear gradient to 100% acetonitrile in 8 minutes which was maintained for 0.5 minutes, after which the gradient went back to the initial conditions in 0.1 minute and remained at this condition for the rest of the running time. The total running time of each sample was 10 minutes. E-3-N2-dG eluted at 5.99 minutes. The MS-MS analysis was carried out using a Shimadzu LCMS-8040 triple quadrupole with electrospray ionization (ESI) interface. The instrument was operated in positive mode in the multiple reaction monitoring (MRM) mode with a spray voltage of 4.5 KV. E-3’-N2-dG was monitored at the [M + H]+ of precursor to product 414.2→298.2, 414.2→164.1, and 414.2→147 m/z. The level of DNA adducts was quantified using a calibration curve where the peak area of a known concentration of the synthesized DNA adduct was plotted against the corresponding DNA adduct concentrations. Calibration curves in buffer and cellular matrix were similar. The limits of detection and quantification of the E-3’-N2-dG DNA adducts were 0.0025 pmol and 0.008 pmol respectively. The amount of the DNA adducts detected in the samples was related to the total amount of digested DNA in each sample and calculated from the Nanodrop output in ng/mL using a molar extinction coefficient for double stranded DNA of 50 μg×mL−1 cm−1. E-3’-N2-dG DNA adduct levels were expressed
96 CHAPTER 4

as the number of E-3’-N2-dG adducts per 108 nucleotides (nts) based on the assumption of 1.98×10¹⁵ nucleotides / μg DNA.
2.7 Estimation of the number of daily cycles required to reach the estimated level of DNA adducts at the BMD10 for the related alkenylbenzene methyleugenol upon repeated daily exposure at realistic human dietary exposure levelsFrom the repeated exposure experiment a linear equation describing the cycle dependent increase in E-3’-N2-dG adduct levels in the HepaRG cells could be derived. The slope of the linear equation represents the increase in the E-3’-N2-dG adduct level / 108nts / cycle upon exposure of the cells to 50 μM estragole. The slope thus obtained was used to estimate the rate of E-3’-N2-dG DNA adduct accumulation per cycle upon exposure to the dose at normal dietary levels using linear extrapolation from the dose level that is predicted by the PBK model to result in an estragole liver blood concentration of 50 μM. This linear extrapolation is supported by previous studies that revealed i) that the level of 1’-sulfooxyestragole responsible for the DNA adduct formation increased linear with the dose from dose levels as low as dietary human intake levels up to the BMDL10 for tumor formation in rats (Rietjens et al. 2010), ii) a linear E-3’-N2-dG adduct formation in primary rat hepatocytes with increasing concentration of 1’-hydroxyestragole and also linear dose-dependent E-3’-N2-dG adduct formation in rats in vivo predicted by physiologically based translation of these in vitro data to the in vivo situation (Paini et al. 2010) and iii) a linear dose dependent increase in E-3’-N2-dG adduct formation in estragole exposed rats (Paini et al. 2012). Except estragole, another alkenylbenzene methyleugenol also showed an increased linear relation between the level of 1‘-sulfooxymethyleugenol that contributes to the DNA adduct formation and the dose of methyleugenol from the low level of human dietary intake up to the BMDL10 for tumor formation in both in vivo and in vitro (Al-Subeihi et al. 2012). The value thus obtained for the increase in the E-3’-N2-dG adduct level /108nts / cycle was used to calculate the number of days required to reach 10-100 adducts /108nts, the estimated level of methyleugenol liver DNA adduct formation at its BMD10 for liver tumor formation (Paini et al. 2011).
3. Results
3.1 PBK modeling based selection of the in vitro exposure concentrationFig. 2 presents the human and rat PBK model-based prediction of the dose dependent concentration of estragole in venous blood of the liver for dose levels up to 100 mg/kg bw. The graph reveals an increase in the estragole liver venous blood concentration with the dose of estragole. From this curve it was derived that at the BMD10 value for rat, the dose level causing 10% tumor incidence, reported to amount to 47 mg/kg bw/day (Paini et al. 2010), the liver venous blood concentration of estragole is predicted to amount to 71 μM
ESTRAGOLE DNA ADDUCT ACCUMULATION UPON REPEATED EXPOSURE 97
4

in human and 44 μM in rat respectively. Based on these results the estragole concentration selected for the repeated exposure experiment was chosen at 50 μM corresponding to a dose level of 52 mg/kg bw in rat and 36 mg/kg bw in human.
3.2 DNA adduct formation upon repeated exposureHepaRG cells were exposed to 50 μM estragole repeatedly for 4 cycles with each cycle consisting of 2 h of exposure and 22 h of repair (Fig. 3) after which the level of E-3’-N2-dG DNA adducts was quantified. Fig. 3 shows the results obtained revealing a gradual increase in the level of E-3’-N2-dG DNA adducts with increasing number of cycles reflecting E-3’-N2-
Fig. 2 The PBK model based prediction of the dose dependent venous liver blood concentration of estragole in human (straight line) and rat (dotted line). The CVE values at the BMD10 of 47 mg/kg bw/day (Paini et al. 2010) are also indicated.
Fig. 3 Relation between the number of E-3’-N2-dG DNA adducts/108 nucleotides detected in the HepaRG cells upon increasing number of daily cycles of 2 h exposure to 50 μM estragole and 22 h repair.
98 CHAPTER 4

dG DNA adduct accumulation upon repeated exposure. The data can adequately (R2=0.94) be described by a linear increase with the number of cycles described by equation (1):
Number of E-3’-N2-dG DNA adducts /108 nts = 17.53x Number of cycles. Equation (1)
The slope of this relationship reflects the accumulation rate expressed in the number of E-3’-N2-dG DNA adducts /108 nts/cycle at 50 μM estragole and amounts to 17.53 E-3’-N2-dG DNA adducts /108nts/ cycle.
3.3 Estimation of the number of daily cycles of estragole exposure required to reach adduct levels at the BMD10 for liver tumor incidence of the related alkenylbenzene methyleugenol at the estimated human daily intake of estragoleThe estimated level of DNA adducts reported to occur at the BMD10, the dose level causing 10% tumor incidence above background values (EFSA et al. 2017) of the related alkenylbenzene methyleugenol was used for comparison. This value was reported to amount to of 10-100 adducts /108nts (Paini et al. 2011). According to the data presented in Fig. 3 obtained at a concentration of 50 μM estagole indicating a rate of E-3’-N2-dG DNA adduct accumulation of 17.53 adducts /108nts/ cycle it would take 5 to 6 cycles to reach a E-3’-N2-dG DNA adduct levels amounting to 100 /108 nts, while at this level of exposure a level of 10 /108 nts would already be achieved within the first cycle. The PBK modeling indicated this concentration of 50 μM to be reached in venous liver blood at a dose level of 52 mg/kg bw in rat and 36 mg/kg bw in human, which implies exposure in the range of the BMD10 and substantially higher than normal human dietary intake. The human daily dietary intake of estragole was estimated by the EU Scientific Committee on Food (SCF) and the US Flavor and Extract Manufacturers Association (FEMA) to amount to values of 0.07 and 0.01 mg/kg bw/day, respectively (SCF 2001; Smith et al. 2002). This relatively high level of intake estimated by the SCF was based on the theoretical maximum use levels of estragole in 28 food categories and consumption data for these food categories based on 7-day dietary records of adult individuals, which also included pure compound addition. However, since estragole has been demonstrated to be genotoxic and carcinogenic, in the EU the addition of estragole as a pure compound to food has been regulated (SCF 2001). Therefore, the value of 0.07 reported by the SCF likely overestimates current exposure levels (Punt et al. 2016). Therefore, a human daily dietary estragole exposure of 0.01 mg/kg bw/day was considered to provide a realistic estimate.
Assuming a linear relationship between the rate of DNA adduct accumulation per cycle and the dose level, the rate of accumulation at 0.01mg/kg bw/day would amount to 0.0034 and 0.0048 E-3’-N2-dG DNA adducts /108nts/ cycle in rat and in human, respectively. These rates for formation of E-3’-N2-dG DNA adducts estimated to occur at realistic human dietary
ESTRAGOLE DNA ADDUCT ACCUMULATION UPON REPEATED EXPOSURE 99
4

intake levels imply that a level of 10-100 adducts /108 nts would be reached in 8-80 and 6-57 years in rat and in human respectively.
4. Discussion
In present study, the potential accumulation of E-3’-N2-dG DNA adduct levels upon repeated exposure of human liver cells to estragole in vitro was characterized in order to obtain insight in the consequences of the limited efficiency of the repair of this major estragole DNA adduct (Yang et al. 2020a). To this end first a rat or human PBK model-based estimation of the venous liver blood concentration at dose levels in the range of the BMD10 for tumor formation in rat was obtained to define the experimental estragole concentration to which the HepaRG cells were exposed. In line with what was reported before (Punt et al. 2009) the species difference in the kinetics of estragole was limited. For the repeated exposure experiment HepaRG cells were used instead of primary hepatocytes, although primary human hepatocytes are considered as “gold standard model” for xenobiotic metabolism and hepatoxicity (Choi et al. 2015; Gerets et al. 2012; Hart et al. 2010). However, the short lifespan of human hepatocytes (Hart et al. 2010) hampers their application in repeated exposure scenario’s. Upon full differentiation, HepaRG cell cultures have been reported to be comparable to primary human hepatocytes in terms of drug metabolism capacity (Gerets et al. 2012), and E-3’-N2-dG DNA adduct formation upon exposure to estragole was recently shown to be only 2-fold less efficient in differentiated HepaRG cells than in primary rat hepatocytes (Yang et al. 2020a). Moreover, in both cell lines the E-3’-N2-dG DNA adducts were shown to be not efficiently repair (Yang et al. 2020a). This supports the use of HepaRG cells as an adequate model to study the E-3’-N2-dG DNA adduct accumulation upon repeated exposure, also because they show less batch-to-batch variability than primary hepatocytes (Gerets et al. 2012). Furthermore, they do not proliferate within the timeframe of the repeated dose experiment so that DNA adduct levels are not diluted by DNA replication.
Upon repeated exposure to estragole, in the HepaRG cells accumulation of E-3’-N2-dG DNA adducts was readily observed. The accumulation of E-3’-N2-dG DNA adducts showed a linear increase with the number of cycles allowing calculation of a rate of E-3’-N2-dG DNA adduct accumulation per cycle. This rate amounted to 17.53 adducts / 108nts/ cycle at 50 μM estragole. At this rate of accumulation, levels of 10-100 adducts /108nts, would be reached in 5–6 cycles (days). This level of 10-100 adducts /108nts was chosen as a reference value given that exposure to the structurally related alkenylbenzene methyleugenol at its BMD10 for liver tumor formation was estimated to result in this level of DNA adducts (Paini et al. 2011). Given that the comparable value estimated for the alkenylbenzene safrole was one order of magnitude higher (Paini et al. 2011) using the value of 10-100 adducts /108nts
100 CHAPTER 4

provides a conservative reference value. Converting the rate observed in the present study for estragole induced DNA adduct formation at 50 μM estragole, predicted by PBK modeling to be achieved in liver venous blood at dose levels of 52 mg/kg bw in rat and 36 mg /kg bw in human, to a rate at a human daily dietary intake of 0.01 mg/kg bw in a linear way, results in a rate for adduct accumulation of 0.0034 and 0.0048 E-3’-N2-dG DNA adducts /108nts/ cycle in rat and human respectively. Assuming such a linear relationship between the estragole concentration or dose and DNA adduct formation is supported by studies in the literature reporting a linear concentration or dose response relationship for DNA adduct formation in primary rat hepatocytes exposed to 1’-hydroxyestragole (Paini et al. 2010) and also in rats exposed to estragole (Paini et al. 2012). It is also supported by the linear dose-dependent formation shown for the DNA reactive 1’-sulfooxymetabolite from dose levels in the low range of the virtual safe dose up to dose levels as high as the BMDL10 for tumor formation (Rietjens et al. 2010). At an accumulation rate of 0.0034 to 0.0048 E-3’-N2-dG DNA adducts /108nts/ cycle it would take 8–80 or 6–57 years to reach E-3’-N2-dG DNA adduct levels in the range of 10-100 adducts /108nts in rat and in human respectively. Furthermore, it is of importance to note that in a recent study, the concentration dependent E-3’-N2-dG DNA adduct formation in rat hepatocytes was measured at low concentrations of estragole (0-1 μM) (Schulte-Hubbert et al. 2020). The PBK model predicts these concentrations to be present in liver blood at oral dose levels of 0-1.5 mg/kg bw. The authors reported that at exposure concentrations increasing up to 1 μM E-3’-N2-dG DNA adduct formation increases in a sublinear way with an apparent threshold at 0.5 μM. This implies that the number of days likely required to reach the level of 10-100 adducts /108 may take longer than what has been estimated based on linear extrapolation. This because the PBK model predicts that at estimated dietary daily intakes of 0.01-0.07 mg/kg bw/day the liver blood concentrations of estragole amount to value of 0.01 to 0.04 μM and are thus likely below this apparent threshold of 0.5 μM for adduct formation. In the study reported by Herrmann et al. (2013) methyleugenol DNA adducts have been detected in human liver samples. Methyleugenol DNA adducts (N2-MIE-dG and N6-MIE-dA) were present at detectable levels in non-tumorous liver tissue samples of 28 out of 30 subjects (age 19–69 years). The median methyleugenol DNA adduct levels (13 / 108nts for N2-MIE-dG and N6-MIE-dA combined) detected in human non-tumorous liver tissue samples was also in the range of the 10-100 adducts /108nts. These human experimental data on adduct levels of this related alkenylbenzene in human liver likely resulting from dietary exposure, are thus in line with the results obtained in the present study for estragole via repeated exposure of HepaRG cells in vitro.
ESTRAGOLE DNA ADDUCT ACCUMULATION UPON REPEATED EXPOSURE 101
4

5. Conclusion
In this study, the rate of accumulation of E-3’-N2-dG DNA adducts in HepaRG cells repeatedly exposed to estragole in vitro was quantified. The rate of E-3’-N2-dG adduct accumulation amounted to 17.53 E-3’-N2-dG DNA adducts/ 108nts/ cycle at 50 μM estragole from which the rate at realistic human dietary intakes levels was estimated to amount to 0.0034 and 0.0048 E-3’-N2-dG DNA adducts/ 108nts/ cycle in rat and in human respectively. At this rate of accumulation adduct levels estimated to occur at the BMD10 value of the related alkenylbenzene methyleugenol of 10-100 adducts /108nts were predicted to be reached upon prolonged dietary exposure. It is concluded that the persistent nature of the E-3’-N2-dG DNA adducts may contribute to accumulation of substantial levels of DNA adducts upon prolonged dietary exposure.
Acknowledgement
This work was supported by a grant from the China Scholarship Council (No. 201607720009) to Shuo Yang.
Declaration of conflicting interest
The authors declared no potential conflicts of interest with respect to the research, authorship, and/or publication of this article.
102 CHAPTER 4

Reference
Al-Subeihi AA, Spenkelink B, Punt A, Boersma MG, van Bladeren PJ, Rietjens IM (2012) Physiologically based kinetic modeling of bioactivation and detoxification of the alkenylbenzene methyleugenol in human as compared with rat. Toxicology applied pharmacology 260(3):271-284
Choi JM, Oh SJ, Lee SY, et al. (2015) HepG2 cells as an in vitro model for evaluation of cytochrome P450 induction by xenobiotics. Archives of pharmacal research 38(5):691-704
EFSA EFSA (2012) Compendium of botanicals reported to contain naturally occuring substances of possible concern for human health when used in food and food supplements. EFSA Journal 10(5):2663
EFSA SC, Hardy A, Benford D, et al. (2017) Update: use of the benchmark dose approach in risk assessment. EFSA Journal 15(1):e04658
Gerets H, Tilmant K, Gerin B, et al. (2012) Characterization of primary human hepatocytes, HepG2 cells, and HepaRG cells at the mRNA level and CYP activity in response to inducers and their predictivity for the detection of human hepatotoxins. Cell biology 28(2):69-87
Gripon P, Rumin S, Urban S, et al. (2002) Infection of a human hepatoma cell line by hepatitis B virus. Proceedings of the National Academy of Sciences 99(24):15655-15660
Gupta KP, van Golen KL, Putman KL, Randerath K (1993) Formation and persistence of safrole-DNA adducts over a 10 000-fold dose range in mouse liver. Carcinogenesis 14(8):1517-1521
Hart SN, Li Y, Nakamoto K, et al. (2010) A comparison of whole genome gene expression profiles of HepaRG cells and HepG2 cells to primary human hepatocytes and human liver tissues. Drug metabolism and disposition 38(6):988-994
Herrmann K, Schumacher F, Engst W, et al. (2013) Abundance of DNA adducts of methyleugenol, a rodent hepatocarcinogen, in human liver samples. Carcinogenesis 34(5):1025-1030
Jamuna P (2010) Evaluation of certain food additives. Sixty-ninth report of the Joint FAO/WHO Expert Committee on Food Additives (JECFA). WHO Technical Report Series No. 952. 2009. World Health Organization. Geneva, pages 208. Journal of food science technology 47(4):465
Klaunig JE, Kamendulis LM (2010) Comprehensive toxicology, second ed. Elsevier:117-138Marion M-J, Hantz O, Durantel D (2010) The HepaRG cell line: biological properties and relevance as
a tool for cell biology, drug metabolism, and virology studies Hepatocytes. Springer, p 261-272Miller EC, Swanson AB, Phillips DH, Fletcher L, Liem A, Miller JA (1983) Structure-activity studies of the
carcinogenicities in the mouse and rat of some naturally occurring and synthetic alkenylbenzene derivatives related to safrole and estragole. Cancer research 43(3):1124-1134
Paini A, Punt A, Scholz G, et al. (2012) In vivo validation of DNA adduct formation by estragole in rats predicted by physiologically based biodynamic modelling. Mutagenesis 27(6):653-663
Paini A, Punt A, Viton F, et al. (2010) A physiologically based biodynamic (PBBD) model for estragole DNA binding in rat liver based on in vitro kinetic data and estragole DNA adduct formation in primary hepatocytes. Toxicology and applied pharmacology 245(1):57-66
ESTRAGOLE DNA ADDUCT ACCUMULATION UPON REPEATED EXPOSURE 103
4

Paini A, Scholz G, Marin-Kuan M, et al. (2011) Quantitative comparison between in vivo DNA adduct formation from exposure to selected DNA-reactive carcinogens, natural background levels of DNA adduct formation and tumour incidence in rodent bioassays. Mutagenesis 26(5):605-618
Phillips DH, Miller JA, Miller EC, Adams B (1981b) Structures of the DNA adducts formed in mouse liver after administration of the proximate hepatocarcinogen 1ʹ-hydroxyestragole. Cancer Research 41(1):176-186
Punt A, Freidig AP, Delatour T, et al. (2008) A physiologically based biokinetic (PBBK) model for estragole bioactivation and detoxification in rat. Toxicology applied pharmacology 231(2):248-259
Punt A, Paini A, Boersma MG, et al. (2009) Use of physiologically based biokinetic (PBBK) modeling to study estragole bioactivation and detoxification in humans as compared with male rats. Toxicological sciences 110(2):255-269
Punt A, Paini A, Spenkelink A, et al. (2016) Evaluation of interindividual human variation in bioactivation and DNA adduct formation of estragole in liver predicted by physiologically based kinetic/dynamic and monte carlo modeling. Chemical research in toxicology 29(4):659-668
Randerath K, Haglund RE, Phillips DH, Reddy MV (1984) 32 P-post-labelling analysis of DNA adducts formed in the livers of animals treated with safrole, estragole and other naturally-occurring alkenylbenzenes. I. Adult female CD-1 mice. Carcinogenesis 5(12):1613-1622
Rietjens IM, Punt A, Schilter B, Scholz G, Delatour T, van Bladeren PJ (2010) In silico methods for physiologically based biokinetic models describing bioactivation and detoxification of coumarin and estragole: implications for risk assessment. Molecular nutrition food research 54(2):195-207
SCF (2001) Opinion of the Scientific Committee on Food on Estragole (1-Allyl-4-methoxybenzene).Schulte-Hubbert R, Küpper J-H, Thomas AD, Schrenk D (2020) Estragole: DNA adduct formation in
primary rat hepatocytes and genotoxic potential in HepG2-CYP1A2 cells. Toxicology 444:152566Smith R, Adams T, Doull J, et al. (2002) Safety assessment of allylalkoxybenzene derivatives used as
flavouring substances—methyl eugenol and estragole. Food chemical Toxicology 40(7):851-870Szabo M, Veres Z, Baranyai Z, Jakab F, Jemnitz K (2013) Comparison of human hepatoma HepaRG cells
with human and rat hepatocytes in uptake transport assays in order to predict a risk of drug induced hepatotoxicity. PloS one 8(3):e59432
Van Den Berg SJ, Restani P, Boersma MG, Delmulle L, Rietjens IM (2011) Levels of genotoxic and carcinogenic ingredients in plant food supplements and associated risk assessment. Food and Nutrition Sciences 2(9):22
Wiseman RW, Fennell TR, Miller JA, Miller EC (1985) Further characterization of the DNA adducts formed by electrophilic esters of the hepatocarcinogens 1ʹ-hydroxysafrole and 1ʹ-hydroxyestragole in vitro and in mouse liver in vivo, including new adducts at C-8 and N-7 of guanine residues. Cancer research 45(7):3096-3105
Yang S, Diem M, Liu JD, et al. (2020a) Cellular levels and molecular dynamics simulations of estragole DNA adducts point at inefficient repair resulting from limited distortion of the double-stranded DNA helix. Archives of Toxicology:1-17
104 CHAPTER 4

Yang S, Liu JD, Diem M, et al. (2020b) Molecular Dynamics and In Vitro Quantification of Safrole DNA Adducts Reveal DNA Adduct Persistence Due to Limited DNA Distortion Resulting in Inefficient Repair. Chemical Research in Toxicology 33(9):2298-2309
ESTRAGOLE DNA ADDUCT ACCUMULATION UPON REPEATED EXPOSURE 105
4


Chapter 5In vitro and in silico study on consequences of combined exposure to the food-borne alkenylbenzenes estragole and safrole
Shuo Yang, Tomoyuki Kawai, Sebastiaan Wesseling, Ivonne M.C.M. RietjensSubmitted for publication

Abstract
Potential consequences of combined exposure to the proximate carcinogenic metabolites of the selected food-borne alkenylbenzenes safrole and estragole were evaluated in vitro and in silico. HepG2 cells were exposed to 1’-hydroxyestragole and 1’-hydroxysafrole individually or in equipotent combination subsequently detecting cytotoxicity and DNA adduct formation. Results indicate that concentration addition adequately describes the cytotoxic effects and no statistically significant differences were shown in the level of formation of the major DNA adducts. Furthermore, physiologically based kinetic modelling revealed that at normal dietary intake the concentration of the parent compounds and their 1’-hydroxymetabolites remain substantially below the Km values for the respective bioactivation and detoxification reactions providing further support for the fact that the simultaneous presence of the two proximate carcinogens does not affect their DNA adduct formation. Overall, these results point at the absence of interactions upon combined exposure to selected food-borne alkenylbenzenes at dietary levels of intake.
Key words: Combination exposure, dose addition, interactions, DNA adduct formation, cytotoxicity, alkenylbenzenes

1. Introduction
Via the diet, humans can be exposed to combinations of numerous substrates that may act individually, additively or interactively (synergism and antagonism) with respect to biological effects (Dale and Garner 1996). In 2012, the EU Scientific Committees on Health and Environmental Risks (SCHER), on Emerging and Newly Identified Health Risks (SCENIHR), and on Consumer Safety (SCCS), emphasized that effects induced by combined exposure could be greater than those induced by the individual compound exposure (SCHER, SCCS, SCENIHR, 2012). Based on the underlying mode of action, combined exposure may result in i) dose (concentration) addition in case of a similar mode of action at the same target site, ii) response addition for different modes of action, or iii) interaction among compounds resulting in synergism or antagonism, where the total effect of combined exposure to these compounds differs from what is predicted by either response addition or dose (concentration) addition (Bliss 1939; Howard and Webster 2009; Staal et al. 2007). However, additional aspects may have to be considered, for instance, compounds with a similar mode of action can also interact with each other via influences on metabolism or induction of metabolic enzymes leading to outcomes different from dose addition (Lévay and Bodell 1992; Staal et al. 2007).
The current study focuses on the combined effects of two selected model compounds of the group of food-borne alkenylbenzenes. Alkenylbenzenes are substances naturally occurring, often in combination, in different herbs and species. The compounds are of concern because they are genotoxic carcinogens (Miller et al. 1983) and risk assessment can therefore be based on the so-called margin of exposure (MOE) approach (EFSA 2012b). In previous risk assessments by the MOE approach combined exposure to alkenylbenzenes was taken into account assuming dose addition (Al-Malahmeh et al. 2017; Alajlouni et al. 2016; Alajlouni et al. 2017). This assumption was based on the fact that the alkenylbenzenes of interest act on the same target tissue (liver) and via a similar mode of action. Their bioactivation is initiated by cytochromes P450 resulting in conversion of the parent compound to the proximate carcinogenic 1’-hydroxymetabolite, which is subsequently sulfonated by sulfotransferases to produce the ultimate carcinogenic 1’-sulfooxymetabolite responsible for the DNA adduct formation. However, further evidence to support the assumed dose addition has not been available. Therefore, the aim of the present study was to study the effects of combined exposure to two model alkenylbenzenes, estragole and safrole. Studies were performed with the 1’-hydroxy metabolites since these were proven to result in measurable cytotoxicity and DNA adduct formation in the HepG2 cells used for the studies (Yang et al. 2020a). Potential interactions at the level of the cytochrome P450 mediated 1’-hydroxylation of the parent alkenylbenzenes were evaluated by comparing physiologically based kinetic model-based predictions of liver concentrations at realistic dietary dose levels to know kinetic constants for these conversions.
COMBINED EXPOSURE TO THE FOOD-BORNE ALKENYLBENZENES ESTRAGOLE AND SAFROLE 109
5

2. Material and method
2.1 Chemicals and reagentsBovine spleen phosphodiesterase II (SPDE II), venom phosphodiesterase I (VPDE I), nuclease P1, phosphatase alkaline (AP), tris(hydroxymethyl)aminomethane (Tris), 3-(4,5-dimethyl-2-thiazolyl)-2,5-diphenyl-2H-tetrazolium bromide (MTT), and ethylenediaminetetraacetic acid (EDTA) were obtained from Sigma (St. Louis, Missouri, USA). Phosphate buffered saline (PBS) (pH 7.4) and Non-Essential Amino Acids (NEAA) were purchased from Gibco (Paisley, UK). Minimum Essential Medium (MEM), L-glutamine, and penicillin-streptomycin (P/S) were purchased from Gibco (Grand Island, New York, USA). Fetal Bovine Serum (FBS) was purchased from Bodinco BV (Alkmaar, Netherlands). Dimethylsulfoxide (DMSO), hydrochloric acid (HCl), zinc sulfate (ZnSO4), and sodium acetate were purchased from Merck (Darmstadt, Germany). Acetonitrile (ACN) was purchased from Biosolve (Dieuze, France). RNeasy Lysis buffer (RLT) was purchased from QIAGEN (Hilden, Germany). Formic acid was purchased from VMR (Fontenay-sous-Bois, France). 1’-hydroxyestragole (1’-OH estragole) and 1’-hydroxysafrole (1’-OH safrole) were synthesized as described previously (Paini et al. 2010).
2.2 Cell modelHepG2 cells were obtained from the American Type Culture Collection (Manassas, Virginia, USA) and cultured with MEM supplemented with 10% (v/v) FBS, 1% (v/v) P/S mixture with L-glutamine and 1% (v/v) NEAA and incubated at 37 °C in a humidified 5% CO2 atmosphere. The culture medium was refreshed every two or three days until the cell density reached 80%. The cultured cells were either seeded in 96-well plates (Greiner Bio-One, Frickenhausen, Germany) for cytotoxicity experiments or in T-25 flasks (Greiner Bio-One, Frickenhausen, Germany) for experiments on DNA adduct formation.
2.3 Cytotoxicity testHepG2 cells were seeded in 96-well plates at the concentration of 2×10⁴ cells/well for one day growth and exposed to 1’-OH estragole or 1’-OH safrole individually or in combination in serum-free medium for 24 h. For the individual exposure, the concentrations were 0, 30, 50, 70, 100, and 150 μM for 1’-OH estragole, and 0, 100, 200, 400, 800 and 1,000 μM for 1’-OH safrole. For the combined exposure, 1’-OH estragole was chosen as the reference compound. Therefore, the relative potency factor (RPF) was defined as 1.00 for 1’-OH estragole. The RPF for 1’-OH safrole was derived from the cytotoxicity experiments with the individual compounds and used to define equipotent mixtures for the combined exposure experiments. A series of mixture concentrations in the range between 0 μM and 150 μM 1’-OH estragole equivalents was tested. The final concentration of DMSO was 0.5% in all cases. Cytotoxicity was quantified by the MTT assay. To this end, after exposure 10 μL of 5 mg/mL MTT were added to each well followed by incubation for another hour. The medium was
110 CHAPTER 5

then removed and 100 μL of DMSO were added to the wells to dissolve the MTT formazan crystals. The absorbance was measured at 562 nm using a SpectraMax M2 (Molecular Devices, USA). The cell viability was expressed as % of the control, with the solvent control set at 100 % viability.
2.4 DNA adduct formationFirst, concentration dependent DNA adduct formation was measured in HepG2 cells for individual exposure to 0, 30,60, 90, 120, and 150 μM for 1’-OH estragole or 0, 80, 160, 200, 240 μM 1’-OH safrole. The results obtained were used to define the combined exposure regimens selecting concentrations resulting in comparable DNA adduct levels to obtain equipotent mixtures.
Secondly, to examine the interaction between the two compounds, quantification of DNA adducts was performed in HepG2 cells exposed to the individual concentrations and a mixture of 32 μM 1’-OH estragole and 200 μM 1’-OH safrole, both causing a comparable level of adduct formation from upon individual exposure.
The final concentration of DMSO in all assays was 0.1% and exposure time was 2 h. After exposure, cells from 2 T-25 flasks were harvested and collected by centrifugation at 211g for 5 minutes. The supernatant was discarded and cells were washed by resolving the pellet in 0.5 -1 mL of PBS followed by another centrifugation step. After final centrifugation, the final cell pellets were dissolved in 200 μL of RNeasy Lysis Buffer (RLT buffer) to lyse the cells before DNA isolation.
2.5 DNA isolation and digestionDNA isolation was performed using the QIAamp DNA Mini Kit protocol for cultured cells (Hilden, Germany). The suitable number of cells for DNA isolation was within the range of 2×10⁶ to 5×10⁶. After isolation, 1.5 μL of each sample was dissolved in NanodropTM One (Thermo scientific, Waltham, MA, USA) to check the concentration and purity of the isolated DNA. The purity of the isolated DNA was measured based on the absorbance ratio A260/A280 with a value of 1.8-2.0 considered as sufficiently pure. The concentration was calculated from the Nanodrop output in ng/mL using a molar extinction coefficient for double stranded DNA of 50 μg×mL−1 cm−1. After isolation, DNA samples were freeze-dried overnight and stored at -80 oC until digestion. Dried samples were dissolved in nanopure water and adjusted to 50 μg per 30 μL before digestion. DNA digestion was performed as previously described (Yang et al. 2020a; Yang et al. 2020b). Briefly, samples were incubated with 40 μL of PI-buffer (300 mM sodium acetate, 1 mM ZnSO4, pH 5.3), 20 μL of SPDE II solution (0.0004 U/μL in water), and 10 μL of nuclease P1 (0.5 μg/μL in water) at 37 °C for 4 h. After 4 h incubation, 40 μL of PA-buffer (500 mM Tris–HCl, 1 mM EDTA, pH 8.0), 20 μL
COMBINED EXPOSURE TO THE FOOD-BORNE ALKENYLBENZENES ESTRAGOLE AND SAFROLE 111
5

of VPDE I solution (0.00026 U/μL in water), and 1.6 μL of AP (200 units) were added and samples were incubated at 37 oC for another 2 h.
2.6 Synthesis of major DNA adducts, and LC-MS/MS method for detection and quantificationThe major DNA adducts of 1’-OH estragole N2-(trans-isoestragol-3’-yl)-2’-deoxyguanosine (E-3’-N2-dG) and 1’-OH safrole N2-(trans-isosafrol-3’-yl)-2’-deoxyguanosine (S-3’-N2-dG) were synthesized according to protocols described previously (Yang et al. 2020a; Yang et al. 2020b). LC-MS/MS detection and quantification of these two major DNA adducts were performed also as previously described (Yang et al. 2020a; Yang et al. 2020b). In brief, LC-MS/MS analysis was performed on a Shimadzu Nexera XR LC-20AD SR UPLC system coupled with a Shimadzu LCMS-8040 mass spectrometer (Kyoto, Japan). Samples (5 μL each) were injected onto a reverse phase C18 1.7 μm C18 100 Å, 50 × 2.1 mm column (Phenomenex, California, USA) with a column temperature at 40 °C. The gradient was made with Milli-Q water and acetonitrile both containing 0.1% (v/v) formic acid. The flow rate was set at 0.3 mL/min. The mobile phase was first kept at 5% acetonitrile for 1 min, and then a linear gradient was applied up to 100 % acetonitrile over 5 min. The acetonitrile in the mobile phase was subsequently kept at 100% for 0.5 min, lowered to 5 % in 0.1 min, and kept at the starting condition for 4.4 min. Thus, the measurement of each sample took approximately 12 min in total. Under these conditions, E-3’-N2-dG and S-3’-N2-dG eluted at 5.99 and 5.40 minutes respectively. The MS-MS analysis was carried out using a Shimadzu LCMS-8040 triple quadrupole with electrospray ionization (ESI) interface. The instrument was operated in positive mode in the multiple reaction monitoring (MRM) mode with a spray voltage of 4.5 KV. E-3’-N2-dG was monitored at the [M + H]+ of precursor to product 414.2 →298.2, 414.2→164.1, and 414.2→147 m/z at collision energy (CE) settings of 10 eV, 25 eV, and 28 eV respectively. Identification and quantification of S-3-N2-dG was achieved at the [M+H]+ of the precursor and the transitions (m/z) used for obtaining the daughter fragments which were 428.1→312.0, 428.1→164.05, and 428.1→161.05 m/z at collision energy (CE) settings of 10 eV, 25 eV and 28 eV. The level of DNA adducts was quantified using a calibration curve where the peak area of a known concentration of the synthesized DNA adduct was plotted against the corresponding DNA adduct concentration. The amount of the DNA adducts detected in the samples was related to the total amount of digested DNA in each sample, and DNA adduct levels were expressed as the number of adducts per 108 nucleotides (nts) based on the assumption of 1.98×10¹⁵ nucleotides / μg DNA.
2.7 Physiologically based kinetic modellingIn order to evaluate the potential interaction in cytochrome P450 and sulfotransferase mediated bioactivation upon combined exposure to estragole and safrole at estimated human daily intake (0.01mg/kg bw for estragole and 0.005 mg/kg bw for safrole) (Rietjens et al. 2015; Smith et al. 2002), the maximum concentrations of estragole and safrole or
112 CHAPTER 5

their 1’-hydroxymetabolites occurring in the liver were predicted by physiologically based kinetic (PBK) model in humans. These concentrations were compared to the Km values for the enzymes involved in catalysing the conversion of both parent compounds to corresponding 1’-hydroxymetabolites followed by 1’-sulfooxymetabolite formation. Given that the inhibitor could also be a substrate and converted through enzyme to product P2 , therefore the k3 and k-3 can also be considered as the k1 and k-1 for this compound (Fig. 1). As Km equals (k-1+k2)/k1 and Ki equals k-1/k1 it can be assumed that when the substrate concentration remains far below Km it is also likely below Ki, pointing at the absence of efficient inhibition and, thus, competitive interactions.
2.8 Data analysisTo analyze whether the response of combined exposure can be predicted by concentration addition, the cytotoxicity data were evaluated by comparison of the concentration-response curves of the individual compounds to the curve for the equivalent potency mixture expressed in 1’-OH estragole equivalents. At IC10 and IC25, the 95% confidence interval of 1’-OH estragole concentrations were calculated by GraphPad Prism 5.
The additivity for the level of DNA adduct formation was analyzed using a t-test to detect statistically significant differences between the added response resulting from isolated exposure and the result obtained upon combined exposure, performed by Microsoft Excel 2013 while GraphPad Prism 5 was used for plotting the data.
3. Results
3.1 Cytotoxicity upon individual and combined exposureCell viability of HepG2 cells was quantified by the MTT assay after 24 h of exposure to either 1’-OH estragole or 1’-OH safrole (Fig. 2). The IC50 values derived from these data amounted to 102 μM for 1’-OH estragole and 288 μΜ for 1’-OH safrole. Based on these results, an
Fig. 1 kinetic scheme for combined conversion of estragole and safrole by cytochromes P450 or combined conversion of 1’-OH estragole and 1’-OH safrole by sulfotransferases
COMBINED EXPOSURE TO THE FOOD-BORNE ALKENYLBENZENES ESTRAGOLE AND SAFROLE 113
5

equipotent mixture containing 1’-OH estragole and 1’-OH safrole at a ratio of 1:3 was also tested for cytotoxicity and the result obtained, presenting cell viability as a function of the concentration expressed in 1’-OH estragole equivalents, are also present in Fig. 2. The results thus obtained show that the concentration-response curve for the combined exposure matches that of 1’-OH estragole with an IC50 value of 99 μM. Only slight deviation occurred at the lower concentrations where effects on cell viability were less than 20%. 95% interval limits for the IC10 and IC25 concentrations of the curves obtained for the combined exposure and the reference compound 1’-OH estragole revealed non statistically significant difference (data not shown). Taken together these results imply that the effects of the two compounds on cytotoxicity are additive.
3.2 DNA adduct formation upon individual and combined exposureFig. 3 presents the concentration dependent DNA adduct formation as detected in HepG2 cells exposed to 1’-OH-estragole or 1’-OH safrole for 2 h. In contrast to the results obtained upon 24 h exposure (Fig. 2) the concentrations tested were not cytotoxic upon 2 h exposure (data not shown). A positive linear correlation between concentration and the number of DNA adducts formed was found for both compounds (R2=0.98 for 1’-OH estragole exposure and R2=0.94 for 1’-OH safrole exposure). The slope of the curves reflects the ability of the respective 1’-OH metabolites to form DNA adducts and indicate DNA adduct formation upon exposure to an equimolar concentration of 1’-OH estragole to be higher than what is observed upon exposure of the cells to 1’OH- safrole.
To assess the DNA adduct formation upon combined exposure to these two compounds, HepG2 cells were exposed to individual concentrations and a mixture of 32 μM 1’-OH
Fig. 2 Cell viability of HepG2 cells evaluated by the MTT assay after 24 h exposure to individual compounds or an equipotent mixture of 1’-OH estragole and 1’-OH safrole. Data points represent mean ± SD of three independent experiments
114 CHAPTER 5

estragole and 200 μM 1’-OH safrole for 2 h, both causing a comparable level of adduct formation upon individual exposure (Fig. 4). Upon combined exposure the formation of both E-3’-N2-dG and S-3’-N2-dG were not statistically significantly different from the levels observed upon exposure to the compounds in isolation.
Fig. 3 DNA adduct (E-3’-N2-dG or S-3’-N2-dG) formation in HepG2 cells after 2 h exposure to increasing concentrations of 1’-OH estragole or 1’-OH safrole
Fig. 4 DNA adduct (E-3’-N2-dG and/or S-3’-N2-dG) formation in HepG2 cells 2 h after individual or combined exposure to 200 μM 1’-OH safrole and/or 32 μM 1’-OH estragole. Data represent mean ± SD of three independent experiments
COMBINED EXPOSURE TO THE FOOD-BORNE ALKENYLBENZENES ESTRAGOLE AND SAFROLE 115
5

3.3 PBK modelingThe concentrations of estragole, safrole, and their 1’-hydroxymetabolites present in the liver were predicted by PBK modelling (Martati et al. 2012; Punt et al. 2009) upon exposure to estimated daily intake of 0.01 mg/kg bw for estragole (Smith et al. 2002) or 0.005 mg/kg bw for safrole (Rietjens et al. 2015). The corresponding liver concentrations were 0.017 μM and 0.016 μM for estragole and safrole respectively (Table 1). In cytochrome P450 (CYP) mediated bioactivation, estragole and safrole share CYP2A6 as a major enzyme involved in 1’-hydroxymetabolite formation (Jeurissen et al. 2007), providing a potential target for interaction upon combination exposure. In Table 1, the PBK model calculated liver concentrations are compared to the Km for this CYP2A6 mediated 1’-hydroxylation of estragole and safrole. This comparison reveals that the PBK modeling based predicted concentrations were 2 to 3 orders of magnitude below the Km for both compounds. Given that Km equals (k-1+k2)/k1 and Ki equals k-1/k1 or (k-3+k4)/k3 and k-3/k3 respectively (Fig. 1) it is likely that these substrate liver concentrations are also substantially below the Ki, pointing at the absence of efficient inhibition and competitive interactions. Similar considerations hold for the sulfotransferase mediated sulfonation of the 1’-OH metabolites considering the Km value and PBK model predicted liver concentrations also presented in Table 1, providing an explanation for the absence of significant interactions at the level of the DNA adduct formation in the HepG2 cells upon combined exposure to 1’-OH estragole and 1’-OH-safrole. The PBK model predicted liver concentrations of 1’-OH estragole and 1’-OH safrole amounted to 0.04 μM and 0.005 μM respectively, being also several orders of magnitude below the respective kinetic constants. Overall, these results indicate that at dietary levels of intake, interactions at the level of cytochrome P450 or sulfotransferase mediated bioactivation of estragole and safrole are unlikely to occur.
Table 1. PBK model predicted concentrations of estragole, safrole, 1’-OH estragole and 1’-OH safrole in human liver upon exposure to the estimated daily dietary intake of estragole and safrole as well as the Km values for their conversion by CYP2A6 and sulfotransferases respectively.
Estragole Safrole 1’-OH Estragole 1’-OH Safrole
Concentration (μM)
0.017 0.016 0.04 0.005
Km (μM) 8a 12a 727c 3828b
a. Jeurissen et al., 2007 (Jeurissen et al. 2007)b. Martati et al., 2012 (Martati et al. 2012)c. Punt et al., 2007 (Punt et al. 2007)
116 CHAPTER 5

4. Discussion
In this study, the consequences of combined exposure to estragole and safrole were characterized based on in vitro and in silico models. Combined effects of the proximate carcinogenic metabolites 1’-OH estragole and 1’-OH safrole for the endpoints cytotoxicity and DNA adduct formation were quantified in an in vitro cell model. Studies were performed in HepG2 cells since these cells were shown before to allow detection of the respective endpoints upon exposure to the proximate 1’-hydroxy alkenylbenzene metabolites (Yang et al. 2020a; Yang et al. 2020b). The 1’-hydroxy metabolites of estragole and safrole were selected for this study, because estragole and safrole represent important food borne alkenylbenzene constituents which cause similar adverse effects (toxicity and carcinogenicity) at the same target organ (the liver) by a similar mode of action proceeding via formation of the proximate carcinogenic 1’-hydroxylated metabolites (Borchert et al. 1973; EPA 2000; Kobets et al. 2016; Wiseman et al. 1985). Estragole and safrole can naturally occur in many herbs and spices, and some botanical products and plant food supplements (PFSs) contain more than one alkenylbenzene (Alajlouni et al. 2017) reflecting the importance to obtain insight in potential consequences of combined exposure. The study was performed with the proximate 1’-hydroxymetabolites instead of the parent compounds because the HepG2 cells lack sufficient activity of cytochromes P450 for the first step in bioactivation of the alkenylbenzenes to form the proximate carcinogenic 1’-hydroxy metabolites. The studies performed provide insight in potential interaction upon combined exposure at the level of the sulfotransferase mediated bioactivation and subsequent DNA adduct formation. Experimental studies on the potential interactions at the level of the CYP mediated conversion of the parent alkenylbenzenes to the 1’-hydroxy metabolites would require use of primary hepatocytes exposed to the parent compounds. Recent studies have shown that in primary hepatocytes cytotoxicity and also DNA adduct formation of the parent alkenybenzenes can be detected (Hasheminejad et al. 1994; Yang et al. 2020a) providing a suitable model system for future studies. Given the relatively unrealistic high amount of human hepatocytes that would be required for such studies in the current study this interaction was studied in silico using previously developed PBK models.
The data obtained in the present study on cytotoxicity indicate that binary mixtures of the two selected alkenylbenzene 1’-hydroxymetabolites showed concentration (dose)-addition. Interesting to observe is that the relative difference in potency between the two 1’-hydroxymetabolites for cytotoxicity was different (3-fold) from the difference observed in potency for DNA adduct formation (8-fold). This may imply that the sulfotransferase mediated bioactivation, which is a determinant factor in causing 1’-OH alkenylbenzene derived DNA adduct formation, may not be the rate limiting factor in the mode of action underlying the cytotoxicity.
COMBINED EXPOSURE TO THE FOOD-BORNE ALKENYLBENZENES ESTRAGOLE AND SAFROLE 117
5

With respect to DNA adduct formation, also no significant interactions between 1’-OH estragole and 1’-OH safrole were observed. Such interactions could have resulted from mutual competition at the active site of the sulfotransferase catalyzing the conversion the DNA reactive metabolites. The lack of such an interaction results probably from the fact that the concentrations tested for both compounds of 32 μM for 1’-OH-estragole and 200 μM for 1’-OH-safrole were substantially below the Km for their sulfotransferase mediated conversion reported to amount to 727 μM for 1’-OH-estragole and 3828 μM for 1’-OH-safrole and in incubations with human liver S9 (Martati et al. 2012; Punt et al. 2007). It should be noted that potentially interactions at the level of DNA adduct formation could also have originated from interactions at the level of repair of these adducts. However, previous studies revealed this repair to be limited and therefore unlikely to be a dominant factor for interactions (Yang et al. 2020a; Yang et al. 2020b). Furthermore, interactions at the level of detoxification of the proximate carcinogenic 1’-OH metabolites by glucuronidation and/or oxidation may also potentially play a role. However, given the results of the present study it can be concluded that also these processes do not result in detectable interactions upon combined exposure. This result is in line with the fact that the concentrations of both compounds tested were also below the Km for their glucuronidation and oxidation mediated conversions in incubations with human liver fractions reported to amount to respectively 1.32 mM and 0.55 mM for 1’-OH estragole (Punt et al. 2007), and 0.71 mM and 0.35 mM for 1’-OH safrole (Martati et al. 2012).
Finally, as already indicated above, upon dietary combined exposure to estragole and safrole, potential interactions may originate at the level of the CYP mediated bioactivation of the alkenylbenzenes. A previous PBK study on the potential inhibition of the SULT mediated bioactivation of estragole by the CYP inhibitor nevadensin already elucidated that, while inhibition was observed at dose levels used in rodent bioassays, the interaction was no longer observed at realistic human dietary intake levels. This is because at realistic human dietary intake systemic concentrations of the inhibitor did not reach its Ki value of 4 nM (Rietjens et al. 2015). In the present study the potential interactions at the level of both CYP and SULT mediated bioactivation were studied in silico using the previously developed PBK models in humans for estragole (Punt et al. 2009) and safrole (Martati et al. 2012). The concentrations of the parent compounds in the liver of humans upon dietary intake of the alkenylbenzenes were predicted to be orders of magnitude below the Km for the CYP mediated 1’-hydroxylation. Given that Km equals (k-1+k2)/k1 and Ki equals k-1/k1 or (k-3+k4)/k3 and k-3/k3 respectively (Fig. 1), it is likely that these substrate liver concentrations are also substantially below the Ki, pointing at the absence of efficient inhibition and, thus, competitive interactions. Similar results were obtained for the predicted concentrations of the 1’-OH metabolites and the kinetic constants for their conversion by the sulfotransferase or their detoxification by glucuronosyltranferases or via their further oxidation. This explains why in the DNA adduct experiments no interaction was observed. This result is
118 CHAPTER 5

in line with the previous conclusion that interactions upon combined exposure generally mainly happen at moderate or high dose levels (Könemann et al. 1996).
In summary, the results of the present study provide support for the absence of interaction effects upon combined exposure to two selected food-borne alkenylbenzenes at dietary levels of intake. This result provides a first line of evidence to support the use of dose addition in risk assessment of their combined dietary exposure.
Funding
This work was supported by a grant from the China Scholarship Council (No. 201607720009) to Shuo Yang.
Notes
The authors declare no competing financial interest
COMBINED EXPOSURE TO THE FOOD-BORNE ALKENYLBENZENES ESTRAGOLE AND SAFROLE 119
5

Reference
Al-Malahmeh AJ, Al-Ajlouni AM, Wesseling S, Vervoort J, Rietjens IM (2017) Determination and risk assessment of naturally occurring genotoxic and carcinogenic alkenylbenzenes in basil-containing sauce of pesto. Toxicology reports 4:1-8
Alajlouni AM, Isnaeni FN, Wesseling S, Vervoort J, Rietjens IM (2016) Level of alkenylbenzenes in parsley and dill based teas and associated risk assessment using the margin of exposure approach. Journal of agricultural food chemistry 64(45):8640-8646
Alajlouni AM, Wesseling S, Kalli M, Vervoort J, Rietjens IM (2017) Risk assessment of combined exposure to alkenylbenzenes through consumption of plant food supplements containing parsley and dill. Food Additives Contaminants: Part A 34(12):2201-2211
Bliss CI (1939) The toxicity of poisons applied jointly 1. Annals of applied biology 26(3):585-615Borchert P, Miller JA, Miller EC, Shires TK (1973) 1ʹ-Hydroxysafrole, a proximate carcinogenic metabolite
of safrole in the rat and mouse. Cancer research 33(3):590-600Dale C, Garner R (1996) Measurement of DNA adducts in humans after complex mixture exposure.
Food chemical toxicology 34(9):905-919EFSA (2012b) Statement on the applicability of the Margin of Exposure approach for the safety
assessment of impurities which are both genotoxic and carcinogenic in substances added to food/feed. EFSA Journal 10(3):2578
EPA U (2000) Supplementary guidance for conducting health risk assessment of chemical mixtures. Series Supplementary Guidance for Conducting Health Risk Assessment of Chemical Mixtures
Hasheminejad G, Caldwell JJF, toxicology c (1994) Genotoxicity of the alkenylbenzenes α− and β-asarone, myristicin and elemicin as determined by the UDS assay in cultured rat hepatocytes. Food chemical toxicology 32(3):223-231
Howard GJ, Webster TF (2009) Generalized concentration addition: a method for examining mixtures containing partial agonists. Journal of theoretical biology 259(3):469-477
Jeurissen SM, Punt A, Boersma MG, et al. (2007) Human cytochrome P450 enzyme specificity for the bioactivation of estragole and related alkenylbenzenes. Chemical research in toxicology 20(5):798-806
Kobets T, Duan J-D, Brunnemann KD, Etter S, Smith B, Williams GM (2016) Structure-activity relationships for DNA damage by alkenylbenzenes in turkey egg fetal liver. Toxicological Sciences 150(2):301-311
Könemann W, Pieters MJF, Toxicology C (1996) Confusion of concepts in mixture toxicology. Food Chemical Toxicology 34(11-12):1025-1031
Lévay G, Bodell WJ (1992) Potentiation of DNA adduct formation in HL-60 cells by combinations of benzene metabolites. Proceedings of the National Academy of Sciences 89(15):7105-7109
Martati E, Boersma MG, Spenkelink A, et al. (2012) Physiologically based biokinetic (PBBK) modeling of safrole bioactivation and detoxification in humans as compared with rats. Toxicological sciences 128(2):301-316
120 CHAPTER 5

Miller EC, Swanson AB, Phillips DH, Fletcher L, Liem A, Miller JA (1983) Structure-activity studies of the carcinogenicities in the mouse and rat of some naturally occurring and synthetic alkenylbenzene derivatives related to safrole and estragole. Cancer research 43(3):1124-1134
Paini A, Punt A, Viton F, et al. (2010) A physiologically based biodynamic (PBBD) model for estragole DNA binding in rat liver based on in vitro kinetic data and estragole DNA adduct formation in primary hepatocytes. Toxicology and applied pharmacology 245(1):57-66
Punt A, Delatour T, Scholz G, Schilter B, van Bladeren PJ, Rietjens IMCM (2007) Tandem Mass Spectrometry Analysis of N 2-(trans-Isoestragol-3 ‘-yl)-2 ‘-deoxyguanosine as a Strategy to Study Species Differences in Sulfotransferase Conversion of the Proximate Carcinogen 1 ‘-Hydroxyestragole. Chemical research in toxicology 20(7):991-998
Punt A, Paini A, Boersma MG, et al. (2009) Use of physiologically based biokinetic (PBBK) modeling to study estragole bioactivation and detoxification in humans as compared with male rats. Toxicological sciences 110(2):255-269
Rietjens IM, Tyrakowska B, van den Berg SJ, Soffers AE, Punt A (2015) Matrix-derived combination effects influencing absorption, distribution, metabolism and excretion (ADME) of food-borne toxic compounds: implications for risk assessment. Toxicology Research 4(1):23-35
SCCS (Scientific Committees Consumer Safety), SCENIHR (Scientific Committees Emerging and Newly Identified Health Risks), Risks) SSCoHaE (2012) Toxicity and Assessment of Chemical Mixtures, European Union.50 pp
Smith R, Adams T, Doull J, et al. (2002) Safety assessment of allylalkoxybenzene derivatives used as flavouring substances—methyl eugenol and estragole. Food chemical Toxicology 40(7):851-870
Staal YC, Hebels DG, Van Herwijnen MH, Gottschalk RW, Van Schooten FJ, van Delft JH (2007) Binary PAH mixtures cause additive or antagonistic effects on gene expression but synergistic effects on DNA adduct formation. Carcinogenesis 28(12):2632-2640
Wiseman RW, Fennell TR, Miller JA, Miller EC (1985) Further characterization of the DNA adducts formed by electrophilic esters of the hepatocarcinogens 1ʹ-hydroxysafrole and 1ʹ-hydroxyestragole in vitro and in mouse liver in vivo, including new adducts at C-8 and N-7 of guanine residues. Cancer research 45(7):3096-3105
Yang S, Diem M, Liu JD, et al. (2020a) Cellular levels and molecular dynamics simulations of estragole DNA adducts point at inefficient repair resulting from limited distortion of the double-stranded DNA helix. Archives of Toxicology:1-17
Yang S, Liu JD, Diem M, et al. (2020b) Molecular Dynamics and In Vitro Quantification of Safrole DNA Adducts Reveal DNA Adduct Persistence Due to Limited DNA Distortion Resulting in Inefficient Repair. Chemical Research in Toxicology 33(9):2298-2309
COMBINED EXPOSURE TO THE FOOD-BORNE ALKENYLBENZENES ESTRAGOLE AND SAFROLE 121
5


Chapter 6General discussion

Major findings
The aim of the current thesis was to investigate the relative hazards and risks of DNA adducts formed by alkenylbenzenes via studying the DNA adduct formation, stability, and repair, as well as the effects of combined and repeated dose exposure on their formation. Alkenylbenzenes (estragole and safrole) were selected as test compounds because of their genotoxic mode of action and their widespread occurrence in food. DNA adducts induced by alkenylbenzenes can be persistent in human liver tissue (Herrmann et al. 2013) increasing the chances on mutations (Pottenger et al. 2019). Previous studies have reported the stability of estragole and safrole DNA adducts since these adducts remained in mice liver for up to at least 20 days following exposure (Gupta et al. 1993; Phillips et al. 1981b). So far, there is no adequate explanation for their repair-resistance. A hypothesis was proposed linking the resistance of the DNA adducts to inefficient repair mechanisms due to the nature of the DNA adduct conformations (Phillips et al. 1981b). This hypothesis was proven for DNA adducts induced by PAHs for which DNA adduct repair efficiency was related to the extent of DNA helix structure distortion caused by conformational changes upon formation of the DNA adduct (Geacintov and Broyde 2017). In order to better understand the mode of action underlying the repair-resistance of the alkenylbenzenes DNA adducts, knowledge on the DNA repair efficiency of the major estragole and safrole DNA adducts and the level of distortion of the DNA structure caused upon formation of the DNA adducts are required. The formation of persistent DNA adducts would lead to the potential bioaccumulation of these DNA adducts. As exposure time is prolonged, the DNA adduct level would gradually increase and may reach levels of adducts reported at the BMD10 for rodent liver tumor formation in studies in experimental animals (Paini et al. 2011), even upon low dose exposure levels. Thus, in the present thesis DNA adduct accumulation upon repeated exposure to estragole was studied in order to investigate whether accumulation of DNA adducts upon repeated exposure is indeed observed and to estimate how many cycles of exposure and subsequent (limited) repair would be required to reach adduct levels of concern. In addition, because several alkenylbenzenes can be present in botanicals and botanical preparations (Prinsloo et al. 2019) at the same time effects of combined exposure were also investigated. In current risk assessment of combined exposure to alkenylbenzenes, dose addition is assumed because of their similar mode of action, similar target organ and similar critical effect (Alajlouni et al. 2016). However, at the present state-of-the art experimental evidence to support this assumption is limited. Therefore, it was of interest to characterize the potential occurrence of interactions between different alkenylbenzenes upon combined exposure. In the following section, the major findings obtained in the present thesis to fill the scientific gaps are presented and discussed in more detail.
By studying the formation and repair of E-3-N2-dG and S-3-N2-dG DNA adducts derived from estragole and safrole in different in vitro liver cell models (Chapter 2 and 3) it was
124 CHAPTER 6

shown that exposure of HepaRG cells and primary rat hepatocytes to estragole and safrole results in the formation of detectable DNA adduct levels. Thus, it was concluded that these cells provide adequate in vitro models to study DNA adduct formation and repair upon exposure to the parent alkenylbenzenes. HepG2 cells appeared to form detectable levels of E-3-N2-dG DNA adducts only when exposed to the proximate carcinogen 1’-OH estragole, most likely because of their low level of cytochromes P450 required to convert the parent alkenylbenzene to its proximate carcinogenic 1’OH metabolite. Exposure to 1’-OH estragole and 1’-OH safrole induced detectable E-3-N2-dG and S-3-N2-dG DNA adducts levels also in CHO cells enabling use of CHO wild-type and three NER-deficient mutants to investigate the DNA repair and the role of the NER system in this repair. Results obtained in all these in vitro models illustrated that repair of the E-3-N2-dG DNA adducts was limited, with 77% of the original amount of adducts remaining in the cells, in HepaRG cells and primary hepatocytes after 72 h and 4 h repair respectively. Persistence of S-3’-N2-dG adducts was observed in HepaRG cells as well rat hepatocytes in which no substantial reduction of DNA adduct levels was displayed during the 48 h and 4 h recovery. The role of NER in the limited repair of E-3-N2-dG adducts was studied in the CHO cells, in which repair appeared to be limited as well, showing a statistically significant decrease in DNA adduct levels in the first 4 h after removal of the 1’-OH estragole exposure, with no further decrease up to 24 h recovery at which time around 80% of the DNA adducts (36 ± 2/108 nts) remained in the CHO wild type cells. In corresponding NER-deficient cells, no significant NER repair was observed. For S-3’-N2-dG adducts, a statistically significant reduction in adduct levels occurred in the CHO wild type cells after 24 h repair with 35 ± 13% of the original adduct level remaining. In contrast, a limited extent of repair of the S-3’-N2-dG adduct was observed in NER deficient cells. These data indicated the likelihood of involvement of the NER system in the repair, albeit limited, of both adducts. To further evaluate the possible underlying mechanism of the apparent inefficient repair of the E-3-N2-dG and S-3’-N2-dG adduct, molecular modelling and MD simulation were performed. The results from molecular simulation indicated that the most representative E-3-N2-dG and S-3-N2-dG adduct conformations shared similar binding features, with the adduct residue remaining in the minor groove of the helix, distorting the DNA structure to only a limited extent with all base pairs remaining intact (Fig. 1). Only one simulation starting with the E1 conformation of the E-3-N2-dG adduct showed the extrusion of the base out of the helix resulting in a more prominent distortion of DNA structure for a limited percentage of the 20 ns simulation time. These data provided a possible explanation for the restrained repair, since activation of the DNA repair systems may require larger distortions in the DNA structure. Overall, these results showed the persistence of E-3-N2-dG and S-3-N2-dG adducts in the liver cell models and provided evidence to support the conclusion that the inefficient enzymatic repair is likely due to a limited distortion of the DNA double-stranded helix resulting in inefficient activation of NER.
GENERAL DISCUSSION 125
6

The results obtained in our in vitro and in silico studies on the persistence and inefficient repair of the major estragole and safrole DNA adducts are in line with data in literature also pointing at the persistence of these DNA adducts in vitro and in vivo. The persistence of estragole DNA adducts was observed in V79 cells treated with increasing estragole concentrations of 0.5, 0.75 and 1 mM for 2 h followed by 25 h of repair. DNA adducts were still present after the recovery time indicating the repair inefficiency (Martins et al. 2012b). Estragole DNA adducts were also present in the liver of mice for 21 days after the last treatments with estragole (Phillips et al. 1984). While, safrole DNA adducts were persistent in liver tissue of mice without detectable changes either over a short period of time (3 weeks) (Nath et al. 1992) or a long period of time (20 weeks) (Randerath et al.
Fig. 1 Representative structures of E-3’-N2-dG (a) and S-3’-N2-dG (b) as obtained in the molecular modeling studies (for further details see Chapter 2 and 3)
126 CHAPTER 6

1984) following a single dose of safrole. For S-3-N2-dG adducts, it has been found that the adducts can be detected in the liver tissue for 2 days with only a slight decrease of adduct levels, after dosing of safrole to female CD-1 mice (Gupta et al. 1993). Integrating what has been found in the current thesis and the findings observed in the in vivo studies, the limited repair of the alkenylbenzene adducts, for both estragole and safrole, points at the potential for bioaccumulation upon repeated daily dietary exposure.
In order to investigate this potential bioaccumulation of alkenylbenzene DNA adducts to a further extent, the accumulation of the major estragole DNA adduct of estragole (E-3-N2-dG) was investigated in human HepaRG cells that were exposed to repeating cycles of 2 h exposure to estragole followed by 22 h repair to mimic daily exposure (Chapter 4). The same process was repeated for another three cycles and after each cycle at the end of the 22 h repair, the level of E-3-N2-dG was quantified. In contrast to primary hepatocytes, HepaRG cells can be maintained in culture for longer periods of time enabling the repeated exposure regimen. Results showed a linear increase (R2=0.94) in the level of E-3’-N2-dG DNA adducts with an increasing number of cycles reflecting E-3’-N2-dG DNA adduct accumulation upon repeated exposure. From the results obtained the accumulation of E-3’-N2-dG DNA adducts was estimated to occur at a rate of 17.53 adducts / 108 nts / cycle. The concentration of estragole used in this experiment with the HepaRG cells was selected based on data from physiologically based kinetic modelling to reflect the liver concentration of estragole that would correspond to the dose level of 52 mg/kg bw (for rats) and 36 mg/kg bw (for humans). These dose level reflects dose levels in the range of doses that would induce liver tumors in experimental animals (Paini et al. 2010). In a next step, assuming linearity in the dose dependent DNA adduct formation, the rate of DNA adduct accumulation obtained was converted to a rate that would occur at the level of dietary daily intake of estragole of 0.01 mg/kg bw/day (Smith et al. 2002). This resulted in values amounting to 0.0034 and 0.0048 E-3’-N2-dG DNA adducts/ 108nts/ cycle at a dose of 0.01 mg/kg bw/day in rat and human respectively. These rates for formation of E-3’-N2-dG DNA adducts imply that a level of 10-100 adducts /108 nts, reported to occur at the BMD10 of the related alkenylbenzene methyleugenol (Paini et al. 2011), would be reached in 8-80 (in rat) and 6-57 years (in human). This implies that the results in Chapter 4 indicate that due to the persistent nature of adducts, at prolonged dietary exposure, the major estragole DNA adducts, may accumulate to reach substantial levels at normal dietary intake levels of estragole.
Accumulation of E-3’-N2-dG DNA adducts obtained in our in vitro study was also in line with results from an in vivo rat study where the formed E-3’-N2-dG adduct level showed to be significant higher at 48 h after treatment with a single dose of estragole than at 24 h indicating that full conversion of estragole takes longer than 22 h (Paini et al. 2012) further supporting continued accumulation upon repeated daily exposure. Moreover,
GENERAL DISCUSSION 127
6

Herrmann et al. (2013) reported detection of methyleugenol DNA adducts in the livers of Caucasian subjects. The detected DNA adduct level were within the range of 10-100 /108 nts and were most likely the result of regular dietary exposure. This is in line with what we observed in HepaRG cells upon repeated exposure. It is of interest to note that recently, Schulte-Hubbert et al. (2020) reported a sublinear increase of DNA adduct formation at the concentration below 1 μM. The threshold of 0.5 μM for DNA adduct formation is higher than the concentrations predicted by PBK modeling to result from dietary exposure (0.01–0.04 μM at a dose of 0.01-0.07 mg/kg) indicating that the number of days likely required to reach the level of 10-100 adducts /108 may take longer than what has been estimated based on linear extrapolation of the adduct accumulation rate. More detailed information and considerations on this topic are presented below in the general discussion section.
Given that alkenylbenzene producing botanicals may contain more than one alkenylbenzene (Prinsloo et al. 2019) combined exposure to alkenylbenzenes via food may occur. To obtain further insight in the consequences of such combined exposure, in final experiments of the present thesis the consequences of combined exposure to estragole and safrole for cytotoxicity and DNA adduct formation was investigated using the in vitro and in silico models developed (Chapter 5). For cytotoxicity, concentration-viability curves were established upon exposing HepG2 cells to 1’-OH estragole and 1’-OH safrole individually or in combination. Obtained results showed that the concentration-response curve for the combined exposure adequately matched that of 1’-OH estragole with comparable IC50 values expressed in estragole equivalents. These results indicate that the two compounds show an additive effect for cytotoxicity of their proximate carcinogenic metabolites, which were in previous studies already shown to be more toxic than their respective parent compounds. For studies on DNA adduct formation upon combined exposure, HepG2 cells were exposed to 1’-OH safrole or an equipotent concentration of 1’-OH estragole individually or in combination. Results obtained illustrated the comparable level of E-3’-N2-dG adducts formed upon individual and combination exposure, indicating the absence of interactions at the level of the sulfotransferase mediated bioactivation and the subsequent DNA adduct formation. Similar results were obtained for the S-3’-N2-dG formation. To also include the cytochrome P450 mediated first step in the bioactivation in this analysis an in silico approach was applied. To this end the concentration of the alkenylbenzenes in the liver expected at dietary intake levels of estragole and safrole were predicted using PBK modeling. These liver concentrations of estragole and safrole at the estimated dietary intake levels were predicted by the human PBK models (Martati et al. 2012; Punt et al. 2009) to amount to 0.017 μM and 0.016 μM respectively. Comparing these values to the Km values for CYP2A6, the major P450 enzyme involved in 1’-hydroxylation of estragole and safrole (Jeurissen et al. 2007), revealed that the PBK modeling based predicted concentrations were 2 to 3 orders of magnitude below the Km for both compounds indicating an unlikely occurrence of interaction at the level of P450 mediated 1’-hydroxy metabolite formation.
128 CHAPTER 6

A similar analysis could also be made for the sulfotransferase mediated sulfonation of the 1’-OH metabolites where the predicted liver concentration of 1’-OH estragole (0.04 μM) and 1’-OH safrole (0.005 μM) were far below the Km values for sulfotransferases of both compounds of 1’-OH estragole and 1’-OH safrole respectively (Martati et al. 2012; Punt et al. 2009) corroborating the absence of competitive interactions, as also observed in the in vitro cellular model. Overall, these results indicate that at dietary levels of intake, interactions at the level of DNA adduct formation resulting from cytochrome P450 or sulfotransferase mediated bioactivation of estragole and safrole are unlikely to occur.
Based on these experiments and considerations the present thesis provides further insight in the relative hazards and risks of DNA adduct formation upon human exposure to selected alkenylbenzenes (estragole and safrole) at realistic dietary exposure levels. These insights were obtained by studying formation of alkenylbenzene adducts, as well as their repair, potential accumulation, and interactions upon single and also combined exposure in different liver cell models combined with in silico PBK modelling and molecular dynamics. The obtained results show that the limited extent of DNA repair may result in the accumulation of DNA adducts, that, even at realistic dietary human intake, may reach levels that raise a potential concern upon chronic exposure. Although more than one alkenylbenzene may occur simultaneously in herbal products, the results also revealed that potential interactions are unlikely to happen, since internal concentrations at realistic dietary exposure remain too low to result in such interactions, so that effects obtained are additive. The current thesis provides an example of combined use of in vitro and in silico test strategies for evaluating the potential hazards and risks of these DNA adducts induced by food borne genotoxic carcinogens. It provides novel insights in the pathways underlying their mode of action. Use of computer modeling facilitated generation of data in in vitro experiments at concentrations that can be linked or extrapolated to realistic low dose dietary human exposure levels.
General discussion
Although a better understanding of relative hazards and risks of DNA adducts derived from estragole and safrole was provided in the present thesis, several items of interest for some further discussion and future experiments can be identified and include the following topics:
1. Considerations on the use of MD simulations to investigate the potential underlying mechanisms for the NER resistance of alkenylbenzene DNA adducts2. Impact of the base sequence within which DNA adduct binding occurs, and the consequences for DNA structure distortion and the efficiency of NER mediated repair
GENERAL DISCUSSION 129
6

3. The consequences of DNA damage caused by estragole and safrole DNA adduct formation when not repaired4. Accumulation of the persistent estragole DNA adducts5. Potential combination effects affecting the DNA adduct formation6. Implications for risk assessment
1. Considerations on the use of MD simulations to investigate the potential underlying mechanisms for the NER resistance of alkenylbenzene DNA adducts
MD simulations were performed to investigate the structural changes in the double-stranded (ds) DNA occurring upon DNA adduct formation. This was of interest because the NER system repair requires distortion of the ds DNA helix to initiate repair, and previous studies on other NER resistant DNA adducts indicated that the resistance could be due to the limited DNA distortion (Geacintov and Broyde 2017). This was reported for instance, for the bulky DNA adducts derived from some polycyclic aromatic hydrocarbons (PAH) (Cai et al. 2012). In the current thesis MD simulation was applied to detect the changes in the ds DNA structure caused by the major estragole and safrole adducts (Chapter 2 and 3). The simulations revealed an only limited distortion, providing a potential explanation for the persistence of the E-3’-N2-dG and S-3’-N2-dG adducts. These results illustrate the use of computer modeling to better understand the NER mediated response. In the following section, two elements that can influence the results of the MD simulation and useful additions to future MD studies are discussed in some more detail.
• Why using GROMOS 45A4 nucleic acid force fieldAs the MD simulation is strongly dependent on the quality and nature of the force field, based on which the movement of the respective atoms in the structure is described. The choice of a force field can always be debated. There are three force fields for nucleic acids that are frequently applied: the AMBER ff9x, CHARMM c36, and GROMOS force fields (Galindo-Murillo et al. 2014). In a recent study, using the AMBER force field, including the bsc1 and OL15 modifications, simulations with longer simulation time could not provide a satisfactory description of the transitions of double-stranded DNA between the A- and B-forms, resulting in too many states of the DNA in B type geometry and basically the absence of the A type geometry (Zgarbová et al. 2018). The transition between A-DNA and B-DNA is a basic element of DNA’s conformational repertoire (Zgarbová et al. 2018). Since DNA adduct formation can also modify the type of DNA helix, it is important to investigate how the estragole and safrole adduct formation would affect the DNA structure using a force field that provides an adequate A/B equilibrium of the DNA. In contrast to the results of the AMBER simulations with predominantly B-type DNA, simulations conducted using
130 CHAPTER 6

the CHARMM 36 force field enabled modeling of the A-to-B transition without energy barrier. However, when applying the CHARMM 36 force field, A-like structures sometimes persist in the specific regions for up to 10 ns more, and a slow transition was observed in the sequence containing less A-phobic sequences (Waters et al. 2016). In the current thesis, the GROMOS force field was used. Different from the AMBER and CHARMM force fields, this force field can provide more flexibility of the DNA due to the limited Watson-Crick hydrogen bonding (Galindo-Murillo et al. 2014). The limited Watson-Crick hydrogen bonding also induces issues with terminal base pair fraying followed by distortion of the whole structure (Ricci et al. 2010; Setz 2018). In order to avoid opening events, half harmonic attractive distance restraints on the hydrogen bonds of the terminal base pairs were applied in the present simulations conducted using the GROMOS 45A4 force field. When these restraints were included the stability of the simulation vastly improved without irreversible hydrogen bonds broken in the unmodified DNA simulation (Chapter 2, Table1; Chapter 3, Table 3, Fig. S8). Besides, as compared with a previous GROMOS 45A3 version, the GROMOS 45A4 force field resulted in a lower atom-positional RMSD for the canonical DNA structures and reduced fluctuations of atom positions in the terminal regions leading to more stable hydrogen bonds between complementary base pairs (Soares et al. 2005). The distance restraints on terminal base pairs with the improved force field provide a stable and flexible DNA providing an adequate basis to facilitate investigation of the structural modifications caused by estragole and safrole DNA adduct formation. Still, as simulations become longer and more extensive (see below) new limitations in force-field accuracy come to mind. Efforts to improve the force fields further are continuously under way, such that distance restrains on the terminal base pairs may no longer be necessary. A major challenge is the lack of accurate primary structural data to parameterize force fields against, without biasing towards specific DNA structures. The crucial question is not the average structure that may be derived from X-ray crystallography or NMR spectroscopy, but the dynamic equilibrium between multiple conformations of DNA, which need to be sampled in MD simulations.
• Simulation timeIn the present thesis MD simulations were performed for 20 ns as well as 100 ns durations. The simulations conducting for the shorter timescale, 20 ns, indicated that the conformations of the major estragole and safrole DNA adducts were independent of the initial structure and did not reveal significant distortions of the ds DNA helix (Chapter 2, 3). In the safrole study (Chapter 3) a further extension of the simulation time (to 100 ns) was included in order to ascertain that also upon longer simulation times the damaged DNA would not undergo a conformation change and the modification would not disturb the DNA environment. The 100 ns simulation carried out for the 11 mer containing the S-3’-N2-dG DNA adduct (Chapter 3) confirmed the results of the MD simulation during the shorter timescale. This result is in line with a simulation for the Dickerson dodecamer
GENERAL DISCUSSION 131
6

(CGCGAATTCGCG) using the AMBER parmbsco force field, that revealed that convergence of internal properties of the DNA helix can be reached within the 250-300 ns timescale simulation (Drsata et al. 2013).
So far, for MD simulations on DNA structures a wide range of simulation times varying from picosecond to millisecond regimes were explored. However, the setting of the simulation time for sampling the dominant structural and dynamics features of DNA is always a challenging question (Galindo-Murillo et al. 2015). Although there is no uniform standard for the simulation time, it has been proposed that longer MD simulation time will provide a more rigorous test of the force-field parameters for nucleic acids and expose the potential issues in the force fields (Galindo-Murillo et al. 2015). As an example, Zgarbová et al. (2014) found the formation of multiple noncanonical structures at the ends of the DNA (end effects) in the first tens to hundreds of nanoseconds of the MD simulations. These end effects, also named base pairing opening events, were related to the inaccurate force field description of glycosidic (χ) torsion potentials for DNA molecules, which overstabilizes the syn region and allows for rapid anti to syn transition. This issue induces unachievable convergence of the DNA structural parameters within several microseconds of the timescales. Based on these findings, longer simulation time can be considered as the strategy for checking the accuracy of the force field.
Before prolonging the simulation to the long timescale, it is still suggested to perform an initial MD simulation with a relatively shorter timescale. The short simulation time will reveal any obvious mistakes or issues occurring in the force field. Further extension of the simulation time will facilitate to confirm the convergence and reproducibility of the simulation. In the present work, small conformational distortions in the safrole simulations were observed within 20 ns, which were then revealed to be reversible in the longer simulations.
These two considerations together form a certain tension for simulations of DNA. On the one hand, longer simulation times may be required to ensure convergence of conformational preferences, while on the other hand longer simulations may reveal additional inaccuracies in the force fields. One approach, is to perform multiple similar simulations in parallel, such that it can be determined if any conformational changes are intrinsic to the system, or just the effect of a random fluctuation. This emphasizes the need for accurate force field descriptions that allow for sufficient flexibility and yet stable simulations of ds DNA. Future research should focus on the characterization of dynamic equilibrium for ds DNA conformations, including effects of the sequence. Both experimental work and long-time simulations need to be brought in agreement to further improve the quality of MD simulations for DNA.
132 CHAPTER 6

2. Impact of the base sequence within which DNA adduct binding occurs, and the consequences for DNA structure distortion and the efficiency of NER mediated repair
The 11-mer ds DNA sequence used in the current thesis was chosen to be similar to the one used in the previous study reported by Cai et al. (2011) who studied the conformational changes upon formation of 14R (+)- and 14S (-)-trans-anti-DB[a,l]P-N6-dA adducts in a CCATCA*CTACC ds DNA sequence. In our studies a small modification of the 11-mer ds DNA sequence was made by changing the adenine at position 6 to a guanine to allow formation of the E-3’-N2-dG and S-3’-N2-dG adducts. This sequence has been used before to investigate the structural DNA modifications caused by insertion of different PAH DNA adducts (Cai et al. 2011; Cai et al. 2012; Mocquet et al. 2007). When considering the structural changes in the ds DNA helix upon adduct formation, the potential impact of the used base sequence requires further consideration. The changes of the base sequence may perform variations in adduct distribution. Eventually differences in distortion of DNA structure for adducts in a different base sequence environment would also provide a basis for differences in NER repair efficiency. Therefore, it would be interesting to know how the alkenylbenzenes DNA adducts distribute in the sequence with one guanine flanking with different bases and in a guanine-rich sequence. And their subsequent influence on the NER repair efficiency caused by the DNA structure perturbation.
So far, there is no study focusing on the influence of base sequence on alkenylbenzene DNA adducts binding or conformational consequences of the adduct formation, but the potential influence of the surrounding DNA base sequence on the adduct formation has been studied to some extent in related research on other DNA adducts. From these studies, the distribution of dG DNA adducts in DNA has showed a sequence-dependent preference for DNA adduct formation (Richardson and Richardson 1990). In a single guanine sequence, for instance, the O6-methyldeoxyguanosine adduct generated by N-methyl-N-nitrosourea (MNU) showed sequence-dependent preference for binding in the sequence 5’-TATACTAGTATA-3’ with 2.1-fold higher than in the sequence 5’-TATACATGTATA-3’ where the adenine replaced by thymine nearby the guanine for the lesion site presented in the preceding 5’ (Dolan et al. 1988). This study also found same preference for binding in 5’-TATACTAGTATA-3’with 1.5-fold greater occurred in N7-alkylguanine (N7-alkylG) DNA adducts formation induced by MNU. The potential mechanism involves the formation of a tetrahedral precursor intermediate on the purine preceding the guanine in 5’-flanking regions. Although it is not clear whether this mechanism could apply for alkenylbenzenes DNA adducts, these findings implied that the DNA adduct distribution can be influenced by the base nearby the guanine residue. Moreover, in a guanine-rich sequence, O6-methyldeoxyguanosine adduct showed sequence-dependent preference in sequence of 5’-CCG1TG2G3G4ATATGGGTC-3’ with 5-6 fold greater binding at G3 and G4 than at G1,
GENERAL DISCUSSION 133
6

and a 3-fold greater binding at G3 and G4 compared with G2 (Richardson and Richardson 1990). N7-alkylG DNA adducts derived from nitrogen mustards showed a preferable binding sequence with consecutive guanine sequences or GC clusters. The reactive moiety of nitrogen mustards is the aziridinium group with positive charge that can be attracted by either consecutive guanine sequences (like GGG) or GC clusters in DNA, which provide greater negative molecular electrostatic potential in the DNA sequence and consequently generate the preference for DNA adduct formation in these specific sequences (Kohn et al. 1987). Since a positively charged reactive carbocation can also be produced during the alkenylbenzene DNA adduct formation, alkenylbenzene DNA adducts may also likely be generated in the regions where the guanine is flanked by G’s or C. If that is the case, subsequent MD studies may focus on investigating the structural changes upon the preferential formation of alkenylbenzene DNA adducts at different G positions in a guanine-rich sequence.
The preferential adduct formation at guanine in different base environments may also influence the NER repair efficiency. For instance, when 10S (+)-trans-anti-B[a]P-N2-dG adduct binds to the single G surrounding with different bases, the various NER repair efficiency was found (Cai et al. 2010). 1.5-fold higher repair efficiency was observed in the sequence of 5’…CACATG6TACAC-3’ (TG6T-II) when (+)-trans-B[a]PDE-N2−dG adduct bonded to the guanine (G6) than bonded to the same sequence with replacing the two thymines flanking G6 by cytosines (CG6C-II). This is because that 5’-TG6T-II duplex showed much more dynamics than 5’-CG6C-II duplex due to 1) weaker hydrogen bonding present in T:A pair, with only two hydrogen bonds, than in G:C pairs, with three hydrogen bonds; 2) weaker stacking of T-G compared to C-G steps enhancing the mobility. These result in the enhanced bending and untwisting of the DNA structure, which gives the stronger signal of DNA distortion for NER (Cai et al. 2010). An influence of the DNA sequence has also been observed for the (+)-trans-B[a]PDE-N2−dG adduct positioned at different guanines in the sequence of 5’- ….CATGC5G6G7CCTAC…-3’. More than 2-fold higher NER efficiency was observed when the (+)-trans-B[a]PDE-N2−dG adduct was located at the G6 position of this sequence than at the G7 position (Kropachev et al. 2009). In this study it was shown that when the adduct binds to the G6 position, the guanine amino group from G6 crowds the BP benzylic ring leading to the rotation of the BP moiety that intrudes into the hydrogen bonding of C5: G base pairs. This results in a significant distortion of the DNA structure. Whereas when the adduct binds to the G7 position, untwisting of the DNA helix and an enlarged roll between theC5:G/G6:C base pair was observed due to the steric hindrance between the G6 guanine amino group and the BP aromatic ring system. However, all the base pairs remained intact. Less distortion of the DNA helix was displayed when the adduct binds at G7 than at G6 (Kropachev et al. 2009) providing an explanation for the lower NER activity for the G7 than the G6 adduct. Based on these findings, it would be of interest for future studies to check the consequences of the surrounding DNA basis for the effect
134 CHAPTER 6

of the adduct formation on the structural changes. The UvrABC nuclease incision method would be available for detecting the location of the DNA adducts in the DNA of in vitro or in vivo alkenylbenzene exposed liver cells, since the UvrABC nuclease only produces specific incision bonds in the modified DNA fragments (Arakawa et al. 2006). Based on the information of alkenylbenzene DNA adduct location, MD simulations similar to the ones presented in this thesis, can be carried out for identifying the corresponding DNA structure distortion.
3. The consequences of DNA damage caused by estragole and safrole DNA adduct formation when not repaired
In Chapter 2 and 3, the studies with the CHO wildtype and NER deficient cells pointed at a potential role for the NER system in the limited repair of the E-3’-N2-dG and S-3’-N2-dG DNA adducts. And although the repair is limited it is also of interest to consider whether potentially also other than NER mediated DNA repair pathways could be involved. Furthermore, as in theory DNA adduct formation could result in different types of DNA damage and thus activation of different types of repair, it would be interesting to obtain further insight into what kind of DNA damage is induced by the DNA adduct formation and whether other repair pathways may also contribute to the processes following estragole and safrole DNA adduct formation.
In the following content, different types of DNA damage including DNA strand-breaks, sister chromatid exchange (SCE), chromosomal aberrations (CA) and base transitions, which have been reported to result from estragole and safrole DNA adduct formation (Daimon et al. 1997; Kobets et al. 2016; Martins et al. 2012b; Suzuki et al. 2012), and corresponding repair mechanisms are discussed (Fig. 2).
• DNA strand-breaksDNA strand-breaks were evaluated in turkey eggs fetal livers by the alkaline comet assay (Kobets et al. 2016). Significant dose-related increases in DNA strands breaks were observed at both low dose (5 and 10 mg/egg) and high dose (20 and 40 mg/egg) levels of estragole exposure with 2-3.5-fold increase compared to control. High level of estragole DNA adduct formation (1886/ 108 nts) was detected at dose level of 40 mg/egg by using a 32P-postlabeling assay. In contrast, the same study reported negative results in the assay for DNA strand breaks upon safrole exposure at a dose level of 1 and 2 mg/egg, while a low level of DNA adduct formation (3/108 nts) was detected at the highest dose (2 mg/egg). The negative results of DNA strand breaks may be caused by undetectable level of DNA adduct formation induced from low dose level of safrole exposure. These findings for estragole and safrole, points at a possible relation between DNA adduct formation and DNA strand-
GENERAL DISCUSSION 135
6

breaks. When DNA adduct levels are low, there may even be a practical threshold and/or insufficient sensitivity for the comet assay detection of breaks resulting from DNA adducts.
As the comet assay can detect both single-and double-stranded DNA breaks under alkaline conditions and no detailed information was mentioned in the study reported by Kobets et al. (2016), both types of DNA strand breaks could be induced. Single-stranded DNA breaks (SSB), can be repaired by SSB repair (SSBR) or homologous recombination (HR) (Hossain et al. 2018). It is widely known that SSB represent the intermediate products of base excision repair (BER). Therefore, it is likely that BER also participates in the repair of DNA damage caused by estragole and safrole. Double-stranded DNA breaks (DSB), can be repaired by HR and nonhomologous DNA end joining (NHEJ) (Lieber 2010).
• SCEsAdduct-forming compounds are considered as a good inducer of SCE (Daimon et al. 1997). Some studies have reported that the SCEs formation can be appeared upon estragole and safrole exposure (Daimon et al. 1997; Martins et al. 2012a). A dose dependent increase in estragole DNA adducts and SCE formation with a strong correlation between SCE and estragole DNA adduct formation (R2=0.962) was observed in V79 cells treated with 0-1 mM of estragole for 2 h (Martins et al. 2012a). Significant levels of SCE can also be induced
Fig. 2 Summary of potential lesions induced by estragole and safrole DNA adduct formation.SCE: sister chromatid exchange, CA: chromosomal aberrations, SSB: single-stranded DNA breaks, DSB: double-stranded DNA breaks, MMR: mismatch repair, BER: base excision repair, SSBR: SSB repair, HR: homologous recombination, NHEJ: nonhomologous DNA end joining, TLS: translesion synthesis polymerasesLesions are marked by yellow and corresponding repair mechanisms are marked by red. The black dash arrows present the lesions induced by other damages but not directly induced by DNA adduct formation.
136 CHAPTER 6

in rats upon single oral exposure to 1000 mg/kg bw of safrole possibly resulting from the 1’-sulfoxy metabolites binding to DNA, although no correlation study between SCE and safrole DNA adduct formation was performed (Daimon et al. 1997). During the process of SCE, SSB can be produced. Therefore, the repair of SSB may facilitate to suppress SCE events (Wilson III and Thompson 2007).
• CAAnother type of DNA damage, induction of CA, was evaluated in the same study of Daimon et al. (1997) upon exposing rats repeatedly at a dose level of 500 mg/kg bw safrole for 5 times. Similar to what was concluded for the SCE induction, the induction of CA in the rat liver was ascribed to the formation of the 1’-sulfooxy metabolite that can bind to DNA. As it is widely accepted that CA induction also can be due to unrepaired or misrepaired DSB (Iliakis et al. 2004), repair mechanisms for unrepaired DSB, HR or NHEJ, may facilitate to suppress the CA formation.
• Base transitionBase transition could be induced by exposing to estragole resulting in GC:AT transition. This base transition was found upon prolonged exposure to estragole at a dose level of 200 mg/kg bw for 4 weeks in rats (Suzuki et al. 2012). A predominant increase of GC:AT base transition was in line with the formation of ES-3’-N6-dA or 3’-8-dG adducts, and this point mutation can be repaired by DNA mismatch repair (MMR) (Belfield et al. 2018).
• TLS mediated error-prone processIn addition, in early studies the persistence of the E-3’-N2-dG adduct was observed to be related to the TLS mediated error-prone process (Paini et al.). Rat hepatocytes were treated with 50 μM 1’-OH estragole for 24 h which was shown to induce the increase of mRNA expression of polymerases involved in translesion synthesis. This may trigger the tolerant response to favor survival.
Overall, it can be concluded that formation of the reactive 1’-sulfooxymetabolites may result in not only DNA adducts but also in several other types of genetic damage. As a result, in addition to NER, many other repair pathways including SSBR, BER, HR, NHEJ, and MMR may be involved in the repair of estragole and safrole induced DNA damage, or bypass the DNA adduct to allow the replication on damaged DNA-substrates. This may imply that the mutation incidence following the DNA adduct formation is likely related to the DNA damage accompanied by additional lesions resulting from the DNA adducts.
GENERAL DISCUSSION 137
6

4. Accumulation of the persistent estragole DNA adducts
• The role of other estragole DNA adduct than E-3’-N2-dG adducts upon prolonged exposureThe limited repair of the E-3’-N2-dG adducts observed in Chapter 2 pointed at potential adduct accumulation. This was investigated to a further extent in Chapter 5 where a gradual linear increase in the level of E-3’-N2-dG DNA adducts with an increasing number of cycles of daily exposure and repair was found. In the present thesis E-3’-N2-dG appeared to be the major adduct formed in estragole exposed liver cells. This is in line with literature data reporting the E-3’-N2-dG adducts to be the major adduct detected in cells in vitro (Schulte-Hubbert et al. 2020) or in the liver of exposed rodents (Randerath et al. 1984). The E-3’-N2-dG adduct was shown to be the dominant one being detected at 10 times higher amounts than the E-3’-N6-dA adduct, another type of estragole DNA adduct formed by binding of the reactive estragole metabolite to the N6 in adenine, upon single exposure to estragole of primary rat hepatocytes in the concentration range of 0-300 μM (Schulte-Hubbert et al. 2020). However, the major estragole DNA adduct E-3’-N2-dG adduct may switch to E-3’-N6-dA adduct upon repeated exposure observed from in vivo study. In an in vivo study, in which rats were treated with 0, 22, 66 or 200 mg/kg bw estragole for 4 weeks, E-3’-N2-dG adducts were the major ones at the dose level of 22 mg/kg bw estragole exposure while in this study this adduct level did not change obviously at higher doses levels. Whereas, the level of E-3’-N6-dA adducts increased significantly along with the dose and E-3’-N6-dA became the predominant type of adduct upon exposure to 66 or 200 mg/kg bw estragole (Suzuki et al. 2012). These findings imply that at high dose level, there appears to be no longer a balance between E-3’-N6-dA adduct formation and repair. The slower decrease/repair of the E-3’-N6-dA adduct than of the E-3’-N2-dG adduct may facilitate a continuous increase in adduct levels resulting in their accumulation overtime upon prolonged exposure at a higher rate than that of the E-3’-N2-dG adduct, switching the dominant DNA adduct from E-3’-N2-dG to E-3’-N6-dA. However, upon exposure to relatively low levels (like 50 μM used in current thesis), E-3’-N2-dG adduct might be still predominant, because the difference in the rate of formation may dominate the accumulation of the levels.
• Accumulation of DNA adducts at different conditions1) Sublinear increase of DNA adducts at low dose levelsThe relation between E-3’-N2-dG adduct formation and concentration/ dose has been shown to be linear both in vitro and in vivo in experimental animals (Paini et al. 2012; Paini et al. 2010). However, a recent study demonstrated that the E-3’-N2-dG adduct levels were not significantly increasing when substrate concentrations to which rat hepatocytes were exposed was below 1 μM resulting in a hypolinear relationship between concentration of estragole and DNA adduct levels detected in the cells (Schulte-Hubbert et al. 2020). The predicted threshold for E-3’-N2-dG adduct level increase derived from these data was 0.47
138 CHAPTER 6

μM estragole. In the studies reported by Paini et al. (2010) the lowest concentration in rat hepatocytes exposure was 0.5 μM 1’-OH estragole estimated by PBK modeling (Paini et al. 2012) to amount to estragole liver concentration of 2 μM and the lowest dose in the in vivo rat study was 5 mg/kg bw estragole estimated by PBK modeling to amount to a liver concentration of 2.8 μM (Paini et al. 2012). Thus, in neither of these studies reporting a linear concentration or dose dependent increase in estragole DNA adduct levels the liver cells were exposed to estragole concentrations below 1 μM, the region where the sublinear behavior was observed. Therefore, it is possible that the linear model adequately describes the data at relatively high exposure levels. However, at the low concentration range, that is below 1μM, linear extrapolation of the concentration response data obtained at high levels may lead to the overestimation of the DNA adduct formation at extremely low exposure conditions. PBK modeling performed in the present thesis revealed that the concentration range below 1μM estragole, however is representative for dose levels that match realistic dietary intake levels. In the repeated exposure experiment performed in the current thesis (Chapter 4), only one concentration (50 μM) was tested. The slope used to estimate the rate of E-3’-N2-dG DNA adduct accumulation at normal dietary levels was obtained using linear extrapolation from the dose level that is predicted by the PBK model to result in an estragole liver blood concentration of 50 μM. This linear extrapolation of the rate of adduct accumulation to lower concentrations may therefore also results in an overestimation and thus worst-case estimate of the accumulation rate of the DNA adducts. For a future study, it is suggested to define concentration-response and corresponding dose-response behavior at low dose levels to confirm the potential sublinear behavior.
2) Accumulation of DNA adducts under long exposure timeBesides sublinear accumulation of DNA adducts at low dose level, another factor that may influence the levels of DNA adducts achieved upon repeated dose exposure is whether steady state levels can be achieved. Many studies found that the accumulated DNA adducts can reach a plateau (steady state) upon continuous treatment. For instance, N7-GA-Gua adducts derived from acrylamide exposure upon repeated dosing at 1 mg/kg/day in both rats and mouse was gradually increased and reached to steady state after 14 days treatment (Doerge et al. 2005). It has been also found that reaching the plateau level is faster under higher concentration exposure than under lower concentration exposure (Boucheron et al. 1987). In the current repeated exposure in vitro study, no plateau of adduct accumulation was observed after 4 cycles, probably because the balance between DNA adduct formation and loss was not yet reached. Also in in vivo repeated dose studies, the steady state of DNA adduct formation was not observed after 5 days exposure of safrole to doses up to 250 mg/kg bw (Daimon et al. 1998). Therefore, it would be interesting to find out that whether such a steady state would be obtained either in vitro or in vivo and if so at what dose and time exposure regimens and at what levels of DNA adduct.
GENERAL DISCUSSION 139
6
In addition, in order to better understand the balance of DNA adduct level, the different ways of DNA adduct loss applied in estragole DNA adduct are suggested to investigate in the future. The main sources of loss of DNA adduct formation includes removing DNA adducts by repair mechanism, cell apoptosis / death and DNA adduct chemical instability. Since the results of the present thesis showed the limited DNA repair of E-3’-N2-dG DNA adduct, the loss of DNA adducts may to a substantial extent be achieved by cell apoptosis or chemical instability. For cell apoptosis, Schulte-Hubbert et al. (2020) found that a decrease of the E-3’-N2-dG DNA adduct level was observed in rat hepatocytes upon longer exposure time (>24 h) to estragole due to increased cell apoptosis and/or an increase in DNA repair. Conflicted result revealed that no detectable cell apoptosis was observed in HepG2 cells upon exposure to estragole for shorter treated time (4 h) (Villarini et al. 2014). This is probably due to the low bioactivation activity mediated by CYP enzymes of the estragole in HepG2 cells (Chapter 2). Thus, it is still suspected that cell apoptosis could be induced at the later time points upon prolonged exposure for shorter exposure time. Moreover, until now there is no study reported the half-life of E-3’-N2-dG DNA adduct, which cannot provide the insight in how stable the adduct is. Investigating this question can also be helpful to offer the explanation on the change of the major type of estragole DNA adducts upon prolonged exposure.
5. Potential combination effects affecting the DNA adduct formation
In Chapter 5, interaction effects on DNA adduct formation were not observed probably due to the low exposure concentrations that cannot induce the inhibition effects. The dose dependency of combination effects on alkenylbenzene dependent DNA adduct formation has been observed before when studying the inhibition on estragole DNA adduct formation by nevadensin (Alhusainy et al. 2013a; Alhusainy et al. 2013b). The natural basil flavone nevadensin showed significant suppression of E-3’-N2-dG adducts formation both in in vitro studies as well as in rats at high dose levels in vivo (Alhusainy et al. 2013a; Alhusainy et al. 2013b). However, PBK based modeling of this interaction at 100-1000-fold lower dose levels of estragole and nevadensin revealed that the inhibition effect on E-3’-N2-dG adducts formation would no longer be observed at realistic human exposure levels of estragole and nevadensin resulting from co-exposure from use of basil in which both compounds occur simultaneously (Alhusainy et al. 2013a; Alhusainy et al. 2013b; Rietjens et al. 2015). This is due to the fact that upon low dose exposure the concentration in the liver is lower than the Ki values for the inhibition of SULT triggered by nevadensin leading to ineffective inhibition. So far, there are no Ki vales for inhibition of P450 2A6 and SULT mediated conversion of estragole and 1’-OH-estragole by safrole or 1’-OH safrole respectively. In Chapter 5 of the thesis these potential interactions at the level of the bioactivation reactions were
140 CHAPTER 6
evaluated based on the respective Km values. A previous study showed that the total activity of estragole and safrole 1’-hydroxylation was inhibited by 52 % upon simultaneous exposure to estragole and safrole at equimolar (50, 100, and 200 μΜ) (Jeurissen et al. 2007). Comparing the concentrations used in this study with the Km values of 8 and 12 μΜ for CYP2A6 mediated 1’-hydroxylation of estragole and safrole, corroborates that at the concentrations of 50 to 200 μΜ, which are substantially higher than the Km values, substantial inhibition can be observed. At concentrations far below the Km the competitive inhibition of the bioactivation enzymes involved in formation of the ultimate carcinogenic 1’-sulfooxymetabolite that results in DNA adduct formation would no longer occur. This could be further explained by mathematics equation of reaction velocity when inhibitor is involved. According to the equation of competitive inhibition (Equation 1), when Km and Ki are in the same order of magnitude and these values are much higher than the [S] or [I], the value of I/Ki is extremely low, and the interaction induced by inhibitor could be neglected. Under this situation, comparing Km value with used concentration of S or I can give the primarily estimation of potential interaction effects. However, when Ki and [I] are in the same order of magnitude and no matter which one is higher, the participation of inhibitor increases Km value and subsequently decreases the velocity of the reaction resulting in the interaction effects. Under this scenario, if the magnitude of Km and Ki is unknown, comparing Km value with concentration of S or I is not accurate enough. Similarly, in noncompetitive inhibition (equation 2), the interaction effect is observed when Ki and [I] are in the same order of magnitude. Therefore, in the case of absence of Ki values, comparison used concentrations to Km values could only give the rough estimation of potential interaction effects when Km and Ki are much higher than [S] and [I]. Therefore, in future studies the actual Ki values for both CYP2A6 and SULT inhibition induced by safrole or 1’-OH safrole should be defined.
…………………… Equation 1
…………………… Equation 2
Another topic to consider in such future studies on potential interactions upon combined exposure is the P450 enzyme most likely to be involved Jeurissen et al. (2007) pointed out that at safrole concentrations below 500 μM P450 2A6 appeared to be the dominant enzyme for safrole 1’-hydroxylation, while at higher concentrations P450 2C9 will become more dominant. In addition, the isoforms of SULT contributing to sulfonation of 1’-OH estragole and 1’-OH safrole are not defined yet. Only one study proposed that the human SULT1A1 and SULT1C2 are involved in conversion of the 1’-hydroxymetabolite of methyleugenol to DNA reactive metabolites (Herrmann et al. 2012). Therefore, further
v= ∗[ ]
[ ] …………………… Equation 1
v=∗[ ]/( )
[ ] …………………… Equation 2
v= ∗[ ]
[ ] …………………… Equation 1
v=∗[ ]/( )
[ ] …………………… Equation 2
GENERAL DISCUSSION 141
6

kinetic studies may also be directed at investigating the SULT enzymes involved in the bioactivation of 1’-hydroxymetabolites of estragole and safrole to 1’-sulfooxymetabolites.
6. Implication of risk assessment
Risks resulting from bioaccumulation of DNA adduct upon repeated exposure to the food-born carcinogen estragole may be evaluated in some more detail taking the results of the present thesis into account. According to the bioaccumulation rate estimated at dietary exposure levels, it would take 6-80 years to reach to the level of 10-100 adducts /108 nts estimated in other studies to be the range of DNA adducts of the related alkenylbenzene methyleugenol DNA adduct levels at the BMDL10 for tumor formation (Paini et al. 2011) and also in line with the level of methyleugenol DNA adducts detected in human liver tissue samples showing a level of 13 /108 nts, as the median level from 30 liver samples (range 0-37 / 108 nts) (Herrmann et al. 2013). These human experimental data on adduct levels of this related alkenylbenzene in human liver likely resulting from dietary exposure, are consistent with the results obtained in the present study for estragole via repeated exposure of HepaRG cells in vitro. According to Herrmann et al. (2013), the level of methyleugenol DNA adducts detected in the human liver samples were close to the DNA adduct levels induced by repeated 2 years exposure of mice or rats at the TD50 dose (the dose level can induce 50% tumor incidence) of some other liver carcinogens. Herrmann et al. (2013) indicated that the substantial level of hepatic methyleugenol DNA adducts detected may pose a significant carcinogenic risk. Altogether these literature data combined with the results of the present thesis indicate that also the current dietary exposure to estragole may potentially result within a lifetime in levels of estragole DNA adducts in human liver that raise a concern. This increases the concern about human dietary alkenylbenzene exposure. Given that so far, only for methyleugenol DNA adduct levels were detected in human liver tissues, future studies should focus on whether human liver samples also contain detectable levels of estragole or safrole DNA adducts.
The results of the present study pointed at accumulated estragole DNA adduct levels that could reach levels of 10-100 /108nts within a lifetime, which may be a level of concern given it matches the levels detected for methyleugenol at the BMD10 for rat liver tumor formation (Paini et al. 2011). This accumulated level of estragole DNA adducts may also be substantial in comparison to the background DNA adduct levels, since the steady state level of adducts induced by low molecular weight alkylating agents is estimated to be in the range of 10-100 adducts /108 nts (Farmer 2008), thus adding to chances on mutations and the resulting tumor incidences.
142 CHAPTER 6

Moreover, it is of interest to note that the rate of accumulation of the DNA adduct levels defined in Chapter 4 was obtained with HepaRG cells, because liver hepatocytes are not viable for the time needed for such longer-term exposure scenarios. Therefore, it is of interest to consider whether the rate of bioaccumulation in hepatocytes would be comparable to that detected in HepaRG cells. Results obtained in Chapter 2 and 3 showed that the limited efficiency in the repair of estragole and safrole DNA adducts, and thus the potential for DNA adduct accumulation, was observed in both rat hepatocytes and HepaRG cells. The actual level of DNA adduct formation in the hepatocytes was even 2-4 time higher than that in HepaRG at similar exposure concentrations. Therefore, it is likely that bioaccumulation will occur in hepatocytes cells with even higher accumulation rates compared to that quantified in HepaRG cells. This would imply that even a lower number of exposures would be required to reach the level of 10-100 adducts /108 nts and a higher chance that the dietary levels would pose a risk upon prolonged exposure.5 Since due to their short life span hepatocytes cannot be used for such repeated dose in vitro studies, as an alternative model, 3D human liver microtissues generated from human hepatocytes may be considered (Kermanizadeh et al. 2014). These 3D human liver microtissues can be maintained for 21 days enabling prolonged exposure. It is also preferable to mimic the in vivo environment with multi-cell types to perform more like liver response (Messner et al. 2013). Therefore, when one does not want to perform such studies in vivo, it is of interest to use new ex vivo cell models to investigate the characterization of alkenylbenzene DNA adduct accumulation upon prolonged exposure. These studies should also include the potential sub-linear increase in DNA adduct levels at low levels of exposure.
To conclude, potential risks for alkenylbenzenes DNA adducts still need to be studies to a further extent integrating more studies related to sublinear increase of adduct formation at low dose levels and repeated exposure for longer periods of time.
Conclusion
In conclusion, the present thesis showed novel insights into the relative hazards and risks of DNA adducts formed by the selected alkenylbenzenes estragole and safrole, by studying their DNA adduct formation, stability and repair. The present thesis demonstrated that persistence of the DNA adducts provides a chance for DNA adduct accumulation resulting in the gradual production of substantial DNA adduct levels upon prolonged exposure. Moreover, combined exposure to the alkenylbenzenes themselves at realistic human daily intake levels, was shown to not result in interactions that affect the level of DNA adduct formation by the individual alkenylbenzenes. It is important to further define the concentration-response and corresponding dose-response behavior at low dose levels to confirm a potential sublinear behavior and thus lower risks than estimated when assuming
GENERAL DISCUSSION 143
6

linear behavior. The in vitro and in silico methods of the present thesis provide a way forward to study such effects at low exposure levels, since in vitro studies allow measurement of DNA adduct formation at well-defined low concentrations, while PBK modeling can be used to translate these concentrations to actual in vivo dose levels, as illustrated by the results of the present thesis. Furthermore, given the persistent nature of the adducts it is also essential to extent these single dose studies at low exposure levels to repeated dose or repeated concentration exposure studies.
144 CHAPTER 6

Reference
Alajlouni AM, Isnaeni FN, Wesseling S, Vervoort J, Rietjens IM (2016) Level of alkenylbenzenes in parsley and dill based teas and associated risk assessment using the margin of exposure approach. Journal of agricultural food chemistry 64(45):8640-8646
Alhusainy W, Paini A, Punt A, Vervoort J, van Bladeren PJ, Rietjens IM (2013a) Inhibition of methyleugenol bioactivation by the herb-based constituent nevadensin and prediction of possible in vivo consequences using physiologically based kinetic modeling. Food chemical toxicology 59:564-571
Alhusainy W, Paini A, van den Berg JH, et al. (2013b) In vivo validation and physiologically based biokinetic modeling of the inhibition of SULT-mediated estragole DNA adduct formation in the liver of male S prague-D awley rats by the basil flavonoid nevadensin. Molecular nutrition food research 57(11):1969-1978
Arakawa H, Wu F, Costa M, Rom W, Tang M-s (2006) Sequence specificity of Cr (III)–DNA adduct formation in the p53 gene: NGG sequences are preferential adduct-forming sites. Carcinogenesis 27(3):639-645
Belfield EJ, Ding ZJ, Jamieson FJ, et al. (2018) DNA mismatch repair preferentially protects genes from mutation. Genome research 28(1):66-74
Boucheron JA, Richardson FC, Morgan PH, Swenberg JA (1987) Molecular dosimetry of O4-ethyldeoxythymidine in rats continuously exposed to diethylnitrosamine. Cancer research 47(6):1577-1581
Cai Y, Ding S, Geacintov NE, Broyde S (2011) Intercalative Conformations of the 14 R (+)-and 14 S (−)-trans-anti-DB [a, l] P-N 6-dA Adducts: Molecular Modeling and MD Simulations. Chemical research in toxicology 24(4):522-531
Cai Y, Geacintov NE, Broyde S (2012) Nucleotide excision repair efficiencies of bulky carcinogen–DNA adducts are governed by a balance between stabilizing and destabilizing interactions. Biochemistry 51(7):1486-1499
Cai Y, Patel DJ, Broyde S, Geacintov NE (2010) Base sequence context effects on nucleotide excision repair. Journal of nucleic acids 2010
Daimon H, Sawada S, Asakura S, Sagami F (1997) Inhibition of sulfotransferase affecting in vivo genotoxicity and DNA adducts induced by safrole in rat liver. Teratogenesis, carcinogenesis, mutagenesis 17(6):327-337
Daimon H, Sawada S, Asakura S, Sagami F (1998) In vivo genotoxicity and DNA adduct levels in the liver of rats treated with safrole. Carcinogenesis 19(1):141-146
Doerge DR, da Costa GG, McDaniel LP, Churchwell MI, Twaddle NC, Beland FA (2005) DNA adducts derived from administration of acrylamide and glycidamide to mice and rats. Mutation Research/Genetic Toxicology Environmental Mutagenesis 580(1-2):131-141
Dolan ME, Oplinger M, Pegg AE (1988) Sequence specificity of guanine alkylation and repair. Carcinogenesis 9(11):2139-2143
Drsata Ts, Pérez A, Orozco M, Morozov AV, Sponer J, Lankas F (2013) Structure, stiffness and substates of the Dickerson-Drew dodecamer. Journal of chemical theory computation 9(1):707-721
GENERAL DISCUSSION 145
6

Farmer P (2008) Significance for risk assessment of increases in background levels of carcinogen-derived protein and DNA Aadducts. Toxicology Letters(180):S24
Galindo-Murillo R, Roe DR, Cheatham III TE (2015) Convergence and reproducibility in molecular dynamics simulations of the DNA duplex d (GCACGAACGAACGAACGC). Biochimica et Biophysica Acta -General Subjects 1850(5):1041-1058
Galindo-Murillo R, Bergonzo C, Cheatham III TE (2014) Molecular modeling of nucleic acid structure: Setup and analysis. Current protocols in nucleic acid chemistry 56(1):7.10. 1-7.10. 21
Geacintov NE, Broyde S (2017) Repair-resistant DNA lesions. Chemical research in toxicology 30(8):1517-1548
Gupta KP, van Golen KL, Putman KL, Randerath K (1993) Formation and persistence of safrole-DNA adducts over a 10 000-fold dose range in mouse liver. Carcinogenesis 14(8):1517-1521
Herrmann K, Engst W, Appel KE, Monien BH, Glatt H (2012) Identification of human and murine sulfotransferases able to activate hydroxylated metabolites of methyleugenol to mutagens in Salmonella typhimurium and detection of associated DNA adducts using UPLC–MS/MS methods. Mutagenesis 27(4):453-462
Herrmann K, Schumacher F, Engst W, et al. (2013) Abundance of DNA adducts of methyleugenol, a rodent hepatocarcinogen, in human liver samples. Carcinogenesis 34(5):1025-1030
Hossain M, Lin Y, Yan S (2018) Single-strand break end resection in genome integrity: mechanism and regulation by APE2. International journal of molecular sciences 19(8):2389
Iliakis G, Wang H, Perrault A, et al. (2004) Mechanisms of DNA double strand break repair and chromosome aberration formation. Cytogenetic genome research 104(1-4):14-20
Jeurissen SM, Punt A, Boersma MG, et al. (2007) Human cytochrome P450 enzyme specificity for the bioactivation of estragole and related alkenylbenzenes. Chemical research in toxicology 20(5):798-806
Kermanizadeh A, Roursgaard M, Messner S, et al. (2014) Hepatic toxicology following single and multiple exposure of engineered nanomaterials utilising a novel primary human 3D liver microtissue model. Particle Fibre Toxicology 11(1):1-15
Kobets T, Duan J-D, Brunnemann KD, Etter S, Smith B, Williams GM (2016) Structure-activity relationships for DNA damage by alkenylbenzenes in turkey egg fetal liver. Toxicological Sciences 150(2):301-311
Kohn KW, Hartley JA, Mattes WB (1987) Mechanisms of DNA sequence selective alkylation of guanine-N7 positions by nitrogen mustards. Nucleic acids research 15(24):10531-10549
Kropachev K, Kolbanovskii M, Cai Y, et al. (2009) The sequence dependence of human nucleotide excision repair efficiencies of benzo [a] pyrene-derived DNA lesions: insights into the structural factors that favor dual incisions. Journal of molecular biology 386(5):1193-1203
Lieber MR (2010) The mechanism of double-strand DNA break repair by the nonhomologous DNA end-joining pathway. Annual review of biochemistry 79:181-211
Martati E, Boersma MG, Spenkelink A, et al. (2012) Physiologically based biokinetic (PBBK) modeling of safrole bioactivation and detoxification in humans as compared with rats. Toxicological sciences 128(2):301-316
146 CHAPTER 6

Martins C, Cação R, Cole KJ, et al. (2012a) Adapted from: Estragole: a weak direct-acting food-borne genotoxin and potential carcinogen. Mutation Research/Genetic Toxicology Environmental Mutagenesis 747(1):86-92. https://run.unl.pt/bitstream/10362/20115/1/Martins%20C%C3%A9lia%20TD%202016.pdf
Martins C, Cação R, Cole KJ, et al. (2012b) Estragole: a weak direct-acting food-borne genotoxin and potential carcinogen. Mutation Research/Genetic Toxicology Environmental Mutagenesis 747(1):86-92
Messner S, Agarkova I, Moritz W, Kelm J (2013) Multi-cell type human liver microtissues for hepatotoxicity testing. Archives of toxicology 87(1):209-213
Mocquet V, Kropachev K, Kolbanovskiy M, et al. (2007) The human DNA repair factor XPC-HR23B distinguishes stereoisomeric benzo [a] pyrenyl-DNA lesions. The EMBO journal 26(12):2923-2932
Nath RG, Vulimiri SV, Randerath KJB, communications br (1992) Circadian rhythm of covalent modifications in liver DNA. Biochemical biophysical research communications 189(1):545-550
Paini A, Punt A, Scholz G, et al. (2012) In vivo validation of DNA adduct formation by estragole in rats predicted by physiologically based biodynamic modelling. Mutagenesis 27(6):653-663
Paini A, Punt A, Viton F, et al. (2010) A physiologically based biodynamic (PBBD) model for estragole DNA binding in rat liver based on in vitro kinetic data and estragole DNA adduct formation in primary hepatocytes. Toxicology and applied pharmacology 245(1):57-66
Paini A, Scholz G, Guignard G, et al. DNA damage response induced by 1’-hydroxyestragole in rat primary hepatocytes Submitted DNA repair
Paini A, Scholz G, Marin-Kuan M, et al. (2011) Quantitative comparison between in vivo DNA adduct formation from exposure to selected DNA-reactive carcinogens, natural background levels of DNA adduct formation and tumour incidence in rodent bioassays. Mutagenesis 26(5):605-618
Phillips DH, Miller JA, Miller EC, Adams B (1981b) Structures of the DNA adducts formed in mouse liver after administration of the proximate hepatocarcinogen 1ʹ-hydroxyestragole. Cancer Research 41(1):176-186
Phillips DH, Reddy MV, Randerath K (1984) 32 P-post-labelling analysis of DNA adducts formed in the livers of animals treated with safrole, estragole and other naturally-occurring alkenylbenzenes. II. Newborn male B6C3F 1 mice. Carcinogenesis 5(12):1623-1628
Pottenger L, Boysen G, Brown K, et al. (2019) Understanding the importance of low-molecular weight (ethylene oxide-and propylene oxide-induced) DNA adducts and mutations in risk assessment: Insights from 15 years of research and collaborative discussions. Environmental Molecular Mutagenesis 60(2):100-121
Prinsloo G, Steffens F, Vervoort J, Rietjens IM (2019) Risk assessment of herbal supplements containing ingredients that are genotoxic and carcinogenic. Critical Reviews in Toxicology 49(7):567-579
Punt A, Paini A, Boersma MG, et al. (2009) Use of physiologically based biokinetic (PBBK) modeling to study estragole bioactivation and detoxification in humans as compared with male rats. Toxicological sciences 110(2):255-269
GENERAL DISCUSSION 147
6

Randerath K, Haglund RE, Phillips DH, Reddy MV (1984) 32 P-post-labelling analysis of DNA adducts formed in the livers of animals treated with safrole, estragole and other naturally-occurring alkenylbenzenes. I. Adult female CD-1 mice. Carcinogenesis 5(12):1613-1622
Ricci CG, de Andrade AS, Mottin M, Netz PA (2010) Molecular dynamics of DNA: comparison of force fields and terminal nucleotide definitions. The Journal of Physical Chemistry B 114(30):9882-9893
Richardson FC, Richardson KK (1990) Sequence-dependent formation of alkyl DNA adducts: a review of methods, results, and biological correlates. Mutation Research/Fundamental Molecular Mechanisms of Mutagenesis 233(1-2):127-138
Rietjens IM, Tyrakowska B, van den Berg SJ, Soffers AE, Punt A (2015) Matrix-derived combination effects influencing absorption, distribution, metabolism and excretion (ADME) of food-borne toxic compounds: implications for risk assessment. Toxicology Research 4(1):23-35
Schulte-Hubbert R, Küpper J-H, Thomas AD, Schrenk D (2020) Estragole: DNA adduct formation in primary rat hepatocytes and genotoxic potential in HepG2-CYP1A2 cells. Toxicology 444:152566
Setz M (2018) Molecular Dynamics Simulations of Biomolecules from Validation to Application. Ph. D. Thesis, University of Natural Resources and Life Sciences: Vienna …
Smith R, Adams T, Doull J, et al. (2002) Safety assessment of allylalkoxybenzene derivatives used as flavouring substances—methyl eugenol and estragole. Food chemical Toxicology 40(7):851-870
Soares TA, Hünenberger PH, Kastenholz MA, et al. (2005) An improved nucleic acid parameter set for the GROMOS force field. Journal of computational chemistry 26(7):725-737
Suzuki Y, Umemura T, Hibi D, et al. (2012) Possible involvement of genotoxic mechanisms in estragole-induced hepatocarcinogenesis in rats. Archives of toxicology 86(10):1593-1601
Villarini M, Pagiotti R, Dominici L, et al. (2014) Investigation of the cytotoxic, genotoxic, and apoptosis-inducing effects of estragole isolated from fennel (Foeniculum vulgare). Journal of natural products 77(4):773-778
Waters JT, Lu X-J, Galindo-Murillo R, et al. (2016) Transitions of double-stranded DNA between the A-and B-forms. The Journal of Physical Chemistry B 120(33):8449-8456
Wilson III DM, Thompson LH (2007) Molecular mechanisms of sister-chromatid exchange. Mutation Research/Fundamental Molecular Mechanisms of Mutagenesis 616(1-2):11-23
Zgarbová M, Jurecka P, Sponer Jí, Otyepka M (2018) A-to B-DNA transition in AMBER force fields and its coupling to sugar pucker. Journal of Chemical Theory Computation 14(1):319-328
Zgarbová M, Otyepka M, Sponer J, Lankas F, Jurecka P (2014) Base pair fraying in molecular dynamics simulations of DNA and RNA. Journal of chemical theory computation 10(8):3177-3189
148 CHAPTER 6

GENERAL DISCUSSION 149
6


Chapter 7Summary

Estragole and safrole are members of the group of alkenylbenzenes that are naturally present in different herbs and spices. These compounds can be bioactivated and form DNA adducts that play a role in their carcinogenicity. At the current state-of-the-art, the relation between the levels of DNA adducts formed and the levels of mutations or tumor formation is by no means well defined. This may in part be related to the fact that cells have quite efficient DNA repair systems, which may prevent the conversion of DNA lesions into mutations. The aim of the present thesis was to investigate the alkenylbenzene DNA adduct formation, stability, and repair. Based on these findings, the relative hazards and risks of DNA adducts were evaluated considering realistic exposure scenario’s, like combined and repeated dose exposure at dietary levels of intake.
Chapter 1 provided general information on estragole and safrole, their bioactivation resulting in DNA adduct formation, DNA repair, molecular dynamics (MD) simulations to study structural perturbations upon DNA adduct formation, and the current state-of-the-art on the risk assessment related to these genotoxic carcinogens. In Chapter 2 and 3, formation and repair of the major DNA adducts of estragole and safrole was quantified in different cell models. Results showed a limited DNA repair efficiency for both DNA adducts. Molecular dynamics simulations were used to investigate the potential conformation dependent (in)efficiency of repair of the major estragole and safrole DNA adducts. Results from molecular dynamics simulations revealed that conformational changes in double-stranded DNA upon formation of these adducts were small, providing a possible explanation for the restrained repair, which may require larger distortions in the DNA structure to activate recognition and subsequent repair. In Chapter 4, accumulation of the major DNA adducts derived from the alkenylbenzene estragole upon repeated exposure was investigated in HepaRG cells treated in repeated cycles of 2 h exposure and 22 hours repair. The results obtained showed accumulation of adducts at a rate of 17.53 adducts / 108 nts / cycle. This rate was converted to a rate expected at average human daily intake of estragole. Based on these data it was estimated that it would take 6-57 years intake at the estimated daily intake to reach levels of 10-100 adducts /108 nts, a level of DNA adducts reported at the BMD10 of the related alkenylbenzene methyleugenol. These findings revealed that the persistent nature of the major estragole DNA adducts may contribute to accumulation of substantial levels of DNA adducts upon prolonged dietary exposure. In Chapter 5, potential consequences of combined exposure to the proximate carcinogenic metabolites of the selected food-borne alkenylbenzenes safrole and estragole were evaluated in vitro and in silico. Results indicate that concentration addition adequately described the cytotoxic effects and no statistically significant differences were shown in the level of formation of the major DNA adducts upon combined as compared to single exposures. The absence of any interaction on DNA adduct formation was also predicted for combined exposure to estragole and safrole at normal dietary intake. The prediction revealed that the simultaneous presence of the two proximate carcinogens does not affect their DNA adduct formation. Chapter
152 CHAPTER 7

6 presented a summary of the results obtained in this thesis and an overall discussion regarding to 1) considerations on the use of MD simulations to investigate the potential underlying mechanisms for the NER resistance of alkenylbenzene DNA adducts, 2) impact of the base sequence within which DNA adduct binding occurs, and the consequences for DNA structure distortion and the efficiency of NER mediated repair, 3) the consequences of DNA damage caused by estragole and safrole DNA adduct formation when not repaired, 4) accumulation of the persistent estragole DNA adducts, 5) potential combination effects affecting the DNA adduct formation, 6) implications for risk assessment.
Altogether, the present thesis provides further insight in the relative hazards and risks of DNA adduct formation by elucidating the mode of action of estragole and safrole DNA adduct formation and repair in more details via combined use of in vitro and in silico novel testing strategies. The in vitro and in silico methods of the present thesis provide a way forward to study the accumulation of the DNA adducts at low repeated dose exposure levels to a further extent.
SUMMARY 153
7


AppendixAcknowledgements
Lists of Publications
Curriculum Vitae
Overview of Completed Training Activities

Acknowledgements
This is the moment to finalize my PhD project. And I would like to express my sincere gratitude to all people who supervised, supported and encouraged me for completing the PhD journey.
First of all, I would like to thank my promotor Prof. Dr. Ivonne Rietjens for providing me with the invitation letter for the application of the scholarship from China Scholarship Council (CSC), taking the first step of my PhD journey. I am grateful for your guidance and wise advice. We often brainstorm during meetings and your inspiration always makes the difficulty turn around. I learned a lot from you and still remembered that you told me to ask for help in the early stage. Only let people know what you need, then they could provide what you want.
Then I would like to thank my copromotor Prof. Dr. Chris Oostenbrink for your patient supervision, from which I learned a lot of new knowledge that is completely different from toxicology. I really enjoyed the exchange time and appreciated all your kind support for the project.
I would like to highly thank CSC for affirming the value of the project and providing the financial support for living expenses.
I would also like to thank Dr. Ir. JJM (Jacques) Vervoort, who organized the exchange study opportunity for me and encouraged me to go deeper in a scientific field. I would like to thank Sebas Wesseling for helping me solve the technical problems and comforting me when I was in the difficulties of the experiments. I would like to appreciate all help and support to my project by other technicians, LHJ (Laura) de Haan, Bert Spenkelink, Wouter Bakker and Hans van den Berg.
I would like to express my special thanks to Jakob who inspirated me and encouraged me a lot. We had a really good time for the cooperation.
Now it is the time to say thank to all my lovely colleagues especially my officemates Diana, Miaoying, Weijia, Merel, Qiuhui and former PhD Mebra. I was so lucky to become your officemate, and through your encouragement, I gained endless power and energy. Also, I would like to thank my paranymphs, Shensheng and Yiming, for the things you have done for me; thank you Nacho, Lenny, Danlei, Miaoying and Biyao for good memory of our music band; thank you Aziza, Artem, Marta, Suparmi, Ashraf, Kornphimol, Diego, Mengying, Jia,
156 APPENDIX

Jing (Jin), Georgia, Ixchel, Katja, Annelies, Felicia, Isaac, Qianrui, Bohan, Chen, Menno, Maartje, Jingxuan, Frances, Veronique, Jing (Fang), Nina, Akanksha and Tessa for the good time of my PhD life.
Finally, I would like to thank my family, dad and mom, for all the things they have done for me. Their respect and care always support me to go through a hard time and to get where I am today.
APPENDIX 157

Lists of Publications
Yang, S., Diem, M., Liu, J. D., Wesseling, S., Vervoort, J., Oostenbrink, C., & Rietjens, I. M. (2020). Cellular levels and molecular dynamics simulations of estragole DNA adducts point at inefficient repair resulting from limited distortion of the double-stranded DNA helix. Archives of Toxicology, 1-17.
Yang, S., Liu, J. D., Diem, M., Wesseling, S., Vervoort, J., Oostenbrink, C., & Rietjens, I. M. (2020). Molecular Dynamics and In Vitro Quantification of Safrole DNA Adducts Reveal DNA Adduct Persistence Due to Limited DNA Distortion Resulting in Inefficient Repair. Chemical Research in Toxicology, 33(9), 2298-2309.
Yang, S., Wesseling, S., Rietjens, I. M. (2020). Estragole DNA adduct accumulation in human liver HepaRG cells upon repeated in vitro exposure. Toxicology Letters, ISSN 0378-4274, https://doi.org/10.1016/j.toxlet.2020.11.009.
Yang, S., Kawai, T., Wesseling, S., Rietjens, I. M. (2020). In vitro and in silico study on consequences of combined exposure to the food-borne alkenylbenzenes estragole and safrole. Journal of agricultural and food chemistry, Submitted.
158 APPENDIX

Curriculum Vitae
Shuo Yang was born on 17th of January 1992 in Shandong province, China. In 2014, Shuo obtained bachelor degree in Shandong Agricultural University in the major of food quality and safety. After that she decided to go to Wageningen University and Research to continue the master program. In here she followed a MSc program in Food safety (2014-2016) and did a master thesis in the department of Toxicology under the supervision of Lenny Kamelia. The project was to investigate the role of benzo(a)pyrene and its metabolites in developmental toxicity. During master studies, she also did an internship in Merieux Nutrisciences to verify and validate moulds, yeasts and spores by using different standards. After graduation from master, she initiated the PhD project entitled “Stability and repair of DNA adducts formed by food-borne alkenylbenzene liver carcinogens; consequences for hazards and risks”. During this PhD, Shuo took the PET courses to gain more knowledge in toxicology. The supervision of master students as well as lecturing the laboratory course improved the ability of communication and leadership. After completing her doctoral study, she would like to work in the field related to toxicology in China.
APPENDIX 159

Overview of Completed Training Activities
Discipline specific activitiesMolecular toxicology (postgraduate education in toxicology (PET)), 2017Introduction Laboratory Animal science (PET), 2017Toxicogenomics (PET), 2017Cell Toxicology (PET),Pathobiology (PET), 2018Organ toxicology (PET), 2018Epidemiology (PET), 2018Mutagenesis and Carcinogenesis (PET), 2018
ConferencesDutch Society for Toxicology (poster) NVT, 2019Federation of European Toxicologists & European Societies of Toxicology (poster) EUROTOX, 2019
General CourseVLAG PhD week (VLAG), 2017Mobilizing your scientific network (WGS), 2017Project and time management (WGS), 2017Philosophy and ethics of food science and technology (WGS), 2017PhD peer consultation (WGS), 2017
Other activitiesPreparation for research proposal (Research Group), 2016Follow the lecture of TOX (Research Group), 2016-2018Weekly group meetings (Research Group), 20116-2020PhD trip (Research Group), 2018
Approved by Graduate School VLAGThe research described in this thesis was financially supported by China Scholarship Council, China and Toxicology Group of Wageningen University, the Netherlands.Financial support from Wageningen University for printing this thesis is gratefully acknowledged.
160 APPENDIX

The research described in this thesis was financially supported by China Scholarship Council, China and Toxicology Group of Wageningen University, the Netherlands.
Financial support from Wageningen University for printing this thesis is gratefully acknowledged.
Printing: Digiforce, Proefschriftmaken.nl, De Limiet 24c, 4131 NR Vianen
Cover design: Shuo Yang and Fenna Schaap


Shuo Yang
Stability and repair of DNA adducts formed by food-borne
alkenylbenzene liver carcinogens; consequences for hazards and risks
Stability and repair of D
NA
adducts formed by food-borne alkenylbenzene liver carcinogens; consequences for hazards and risks S
huo Yang
INVITATION
To attend the public defence of the dissertation
“Stability and repair of DNA adducts formed
by food-borne alkenylbenzene liver carcinogens;
consequences for hazards and risks”
byShuo Yang
onFriday, 14th of May, 2021
At 11:00 hrs
in an online defence ceremony
You are welcome to join via wurTV
https://weblectures.wur.nl/P2G/Player/Player.aspx?id=C226