stability analysis of diode bridge rectifier-loaded ... · stability analysis of diode bridge...
TRANSCRIPT
Stability Analysis of Diode Bridge Rectifier-Loaded Synchronous Generators Characterized with High Values of Reactances
Torunn Husevåg Helland
Master of Energy Use and Energy Planning
Supervisor: Trond Toftevaag, ELKRAFT
Department of Electric Power Engineering
Submission date: June 2015
Norwegian University of Science and Technology


Problem Description
This thesis concerns the stability of diode bridge rectifier-loaded synchronous generators with thepossibility for an attached battery-bank, characterized by large values of generator reactances.A particular system onboard ships with diesel-electric, variable speed propulsion DC-systemdelivered by Siemens is under study.
The thesis should contain a literature study concerning the stability of synchronous generators,possibly connected to diode-bridge rectifiers and with high reactances. It should also include acollection of operating experience, including analysis of existing measurements/registrations ofthe system under operation. If time allows, new measurements should be planned, conductedand analyzed. The work from the specialization project conducted fall 2014 should be continuedwith the introduction of a rectifier into the model already established.
A computer-based model of the system is to be established in a suitable simulation tool, whereappropriate simulations is to be conducted and the stability is to be analyzed and discussed. Thesimulations should try to recreate the observations on the ships. Among others is a sensitivityanalysis for variations in parameter values and component analysis to be conducted. The thesisshould contain an discussion of the results obtained, recommendations and a final conclusion.
Project time-period: January-June 2015
Supervisor: Trond Toftevaag
Collaborating company: Siemens AS
i

ii

Preface
This thesis was written in the spring semester of 2015 and is the final work of the 2-year masterprogram "Energy use and energy planning" with orientation energy supply at the NorwegianUniversity of Science and Technology NTNU in Trondheim. The thesis is written at the Facultyof Information Technology, Mathematics and Electrical Engineering IME for the Department ofElectric Power Engineering.
The problem addressed in this thesis is the instability of diode-bridge rectifier-loaded synchronousgenerators with high values of reactances, and was proposed by Siemens as a part of theirassessment of the new diesel-electric, variable speed propulsion DC-system developed for ships.
I would like to thank my supervisor Trond Toftevaag for his valuable help, advice and motivatingconversations when planning the simulations. I could also thank my co-supervisor Espen Hauganin Siemens for taking time to meet up with us to discuss the problems experienced on the ships,for helping me to understand the researched system, and for providing the model of the systemin MatLab/SimPowerSystems.
Torunn Husevåg Helland
Trondheim, June 2015
iii

iv

Abstract
This thesis concerns the stability of diode bridge rectifier-loaded synchronous generators char-acterized by large values of synchronous, transient and subtransient reactances in the d- andq-axis, with the possibility of connecting a battery-bank. The synchronous reactances are in therange 2.5-5.5pu.
The electrical system studied is installed in two tug-ships using two di�erent types of generators,with di�erent ranges of generator reactances and performance. One of the tugships studieduses generators with a capacity of 3333kVA that has synchronous reactances in the lower layerof 2.5-5.5 pu and is characterized as stable during operation. The other ship uses generatorswith a capacity of 1940kVA, has synchronous reactances in the upper layer of 2.5-5.5 pu and ischaracterized as unstable during normal operation. The observed oscillations in this ship have afrequency of approximately 2Hz.
The diesel-electric, variable speed propulsion DC-system used in the two ships is delivered bySiemens. The synchronous generators deliver power to a dc-bus through six-pulse diode bridgerectifiers. The thrusters are supplied by the dc-bus through inverters, and a battery can beattached to the dc-bus for redundancy. The object of this thesis is to find the reason whyrectifier-loaded synchronous generators with high reactances become unstable, and what can bedone to prevent the observed instability.
The same system was under study for a specialization project conducted at the Department ofElectrical Power Engineering during the fall 2014. The main findings in this project are includedin the present thesis, where simulations indicate that the studied generators become unstablewhen the gain of the voltage regulator is increased, and no rectifier is included in the model. Thishappens faster for the 1940kVA generator than for the 3333kVA generator, and when reactivepower is consumed.
A literature study of articles and other work concerning the stability of similar systems is alsoconducted. It is in literature found that local mode problems often is associated with rotorangle oscillations, and usually has a frequency of 0.7-2Hz. Stability criteria is found in litera-ture concerning diode bridge rectifier-loaded synchronous generators in [1] and [2], given below,
v

respectively:
Xq
X‘dÆ 2 (1)
X‘2dI‘2d + X‘2qI‘2q Æ 2X‘dI‘dUp (2)
The stability criteria have requirements for the synchronous and transient reactance, but notfor the subtransient reactance. [1] claims that small-frequency oscillations starts in the rectifiercausing instability of rectifier-loaded synchronous generators. It is also found a criterion in [3]developed from the criterion in [1] in Eq. 1, saying that stability is easier achieved by adding ashort-circuited q-axis winding on the rotor. The criterion is shown below [3]:
1Xq
+ 1X‘q
Ø 1X‘d
(3)
The work of the specialization project is continued, and a rectifier is added to the model estab-lished in DIgSILENT PowerFactory in the fall of 2014. The battery is modeled as a constantDC-voltage source, and the rectifier is modeled as a PWM rectifier with no modulation and afiring angle set to zero. The generator stability is studied when the gain of the voltage regulatoris increased from 50-500. The simulation is made for both producing and consuming reactivepower, both cases of which the generator produces active power.
The gain directly a�ects the nature of the linearization constant K5
, making it negative resultingin a negative feedback when the external impedances is high. The hypothesis is that this alsohappens when the internal reactances in the generator is high. This is shown through simulationsto be true. It was expected that the 1940kVA generator reaches instability faster than the3333kVA generator, as was the result in the specialization project, but this was not the case. Itis believed that the rectifier chosen does not imitate the real system well enough.
By using the parameters of the 3333kVA and 1940kVA generators, as well as knowledge of the shipcomponents, simplified models are established in the simulation tool MatLab/SimPowerSystems.
The battery in MatLab/SimPowerSystems is modeled as an infinitely large capacitor and a seriesresistance, and the rectifier is a diode-bridge rectifier. A sensitivity analysis for parameter valuesis conducted, by varying parameter values of the main components such as the synchronousgenerator, battery, rectifier, load and voltage regulator, and the stability is studied. The impactof the presence of the main components on the stability is studied as well. Neither of thecriteria found in [1] and [2] has requirements for the subtransient reactance, and the impactof the subtransient reactance on the stability is studied through sensitivity analysis. Di�erentload-situations are simulated and generator stability is examined.
vi

The main phenomena observed on the ship are successfully recreated through simulations, andthe model established in the simulation tool is verified due to this. It is through simulations foundthat the presence of the diode-bridge rectifier is crucial to detect stability problems, and that theload-situation impacts the stability. When the 1940kVA generator supplies a load of 1.9MVA, itbecomes stable, but is unstable during no-load and for all other loads less than 1.9MVA.
It is also found that the transient and subtransient reactances play an equally important role asthe synchronous reactances when it comes to generator stability in this context. The sensitivityanalysis conducted is used as a basis for the development of stability limits. The results foundthrough simulations are compared with stability criterions and theories presented in articlesfound in the literature study concerning the same problems as addressed in this thesis.
The stability criteria found for the 1940kVA generator with emphasis on the transient and sub-transient reactance is given as:
X‘qX‘d
Æ 5.41 X“q
X“dÆ 0.46 (4)
By combining the stability criterion for transient reactance in Eq. 4 with the equation foundin Eq.3 by [3], it is found that the stability criterion obtained in this thesis is fulfilled and thatstability can be achieved by adding a short-circuited q-axis winding to the generator rotor.
Recommendations for further work is to replace the PWM rectifier with a diode-bridge rectifierin the DIgSILENT PowerFactory model and redo the varying of the gain in the voltage regulatorto study the stability of the 3333kVA and 1940kVA generators. It is also suggested that theinteraction between the synchronous generator and diode-bridge rectifier is further investigated.Last, but not least should simulation be conducted, where a short-circuited q-axis winding isadded to the generator rotor, to verify the results found in this thesis from the stability criteriaobtained.
vii

viii

Sammendrag
Dette diplomarbeidet omhandler stabiliteten til diode-bro likeretter-tilkoblede synkrongenera-torer kjennetegnet ved høye verdier av synkrone, transiente og subtransiente reaktanser i d- ogq-aksen, med mulighet for tilkobling av batteribank. Synkronreaktansene er i størrelsesordenen2.5-5.5 pu.
Det elektriske systemet som er studert er installert i to slepebåter som bruker to ulike typergeneratorer, med ulik størrelsesorden av generatorreaktanser og ytelse. En av slepebåtene somer studert bruker generatorer med ytelsen 3333kVA, har synkronreaktanser i det nedre sjiktet avstørrelsesordenen 2.5-5.5 pu og er karakterisert som stabil ved drift. Den andre slepebåten brukergeneratorer med ytelsen 1940kVA, har synkronreaktanser i det øvre sjiktet av størrelsesordenen2.5-5.5 pu og er karakterisert som ustabil ved normal drift. De observerte pendlingene på detteskipet har en frekvens på omtrent 2Hz.
Det diesel-elektriske, turtalls-variable framdrifts DC-systemet brukt på de to skipene er levert avSiemens. Synkrongeneratorene leverer e�ekt til en dc-samleskinne gjennom seks-puls diode-brolikerettere. Hovedmotorene og propellene forsynes av dc-samleskinnen gjennom vekselrettere, oget batteri kan kobles til dc-samleskinnen for å oppnå redundans. Formålet med dette arbeideter å finne bakgrunnen til hvordan likeretter-tilkoblede synkrongeneratorer med høye reaktanserblir ustabile, og finne ut hva som kan gjøres for å unngå den observerte ustabiliteten.
Det samme systemet ble studert i spesialiseringsprosjektet gjennomført ved Institutt for Elkraft-teknikk høsten 2014. Hovedfunnene i dette prosjektet er inkludert i dette arbeidet, hvor simu-leringer indikerer at de studerte generatorene blir ustabile ved økning av forsterkningen til spen-ningsregulatoren, når likeretteren ikke er tilkoblet til modellen. Dette skjer raskere for 1940kVAgeneratoren enn for 3333kVA generatoren, og når det konsumeres reaktiv e�ekt.
En litteraturstudie av artikler og annet arbeid som omhandler samme problemstilling er ogsåpresentert. Det er i litteraturen funnet at lokale mode-problemer ofte er assosiert med pol-hjulspendlinger, og har ofte en frekvens mellom 0.7-2Hz. Det er funnet stabilitetskriterier somomhandler diode-bro likeretter-tilkoblede synkrongeneratorer i [1] og [2], og de er gjengitt ne-denfor:
ix
Xq
X‘dÆ 2 (5)
X‘2dI‘2d + X‘2qI‘2q Æ 2X‘dI‘dUp (6)
Stabilitetskriteriene har krav for de synkrone og transiente reaktansene, men ikke for de subtran-siente reaktansene. [1] påstår at lav-frekvente pendlinger kan starte i likeretteren, og forårsakeustabil drift av diode-bro likeretter-tilkoblede synkrongeneratorer. Det er også funnet et sta-bilitetskriterie i [3] utarbeidet fra stabilitetskravet i [1] i Likn. 5, som sier at stabilitet er lettereå oppnå ved å legge til en kortsluttet q-akse vikling på rotoren. Kriteriet er vist under [3]:
1Xq
+ 1X‘q
Ø 1X‘d
(7)
Arbeidet fra spesialiseringsprosjektet er videreført, og en likeretter er lagt til modellen op-prettet i DIgSILENT PowerFactory høsten 2014. Batteriet er modellert som en konstant dc-spenningskilde, og likeretteren er modellert som en PWM likeretter med ingen modulering og enskuddvinkel lik null. Generatorstabiliteten studeres når forsterkningen til spenningsregulatorenøkes fra 50-500. Simuleringen er gjennomført for når generatoren produserer og konsumererreaktiv e�ekt, hvor den i begge tilfeller produserer aktiv e�ekt.
Forsterkningen påvirker oppførselen til lineariseringskonstanten K5
direkte, da den kan bli neg-ativ, noe som fører til negativ tilbakekobling når de eksterne impedansene er høye. Hypotesener at dette også skjer når de interne reaktansene i generatoren er høye. Dette har gjennomsimuleringer vist seg å vœre sant. Det var forventet at 1940kVA generatoren skulle nå ustabilitetraskere enn 3333kVA generatoren, som var resultatet i spesialiseringsprosjektet, men dette varikke tilfelle. Det er antatt at typen likeretter valgt ikke speiler det reelle systemet godt nok.
Ved å bruke parametere fra 3333kVA generatoren og 1940kVA generatoren samt kunnskapom komponentene på skipet, er det opprettet forenklede modeller simuleringsverktøyet Mat-Lab/SimPowerSystems.
Batteriet i MatLab/SimPowerSystems er modellert som en uendelig stor kapasitans og en mot-stand i serie, og likeretteren er en diode-bro likeretter. En sensitivitets-analyse for parameterverdier er gjennomført, ved å variere parameterverdiene i hovedkomponentene slik som synkro-ngeneratoren, batteriet, lasten, likeretteren og spenningsregulatoren, og stabiliteten er studert.Innvirkningen av tilstedevœrelsen av hovedkomponentene på stabiliteten er også studert. Ingenav kriteriene funnet i [1] og [2] inneholder krav for den subtransiente reaktansen, og påvirkningenav denne er studert gjennom sensitivitets-analyse. Ulike lastsituasjoner er simulert og genera-torstabiliteten er undersøkt.
x

Gjennom simuleringer er det vellykket klart å gjenskape hovedfenomenene observert på skipene,og modellen etablert i simuleringsverktøyet er dermed verifisert. Det er ved hjelp av simuleringerfunnet at tilstedevœrelsen av diode-bro likeretteren er viktig for å detektere ustabilitetsproblemer,og at lastsituasjonen påvirker stabiliteten. Når 1940kVA generatoren forsyner en last på 1.9MVAer den stabil, men er ustabil ved ingen last og for alle andre laster mindre enn 1.9MVA.
Det er også funnet at de transiente og subtransiente reaktansene spiller en like viktig rolle somsynkronreaktansene når det kommer til generatorstabilitet i denne sammenhengen. Resultatenefra sensitivitets-analysen er lagt til grunnlag ved utviklingen av stabilitetsgrenser. Resultatenefunnet gjennom simuleringer er sammenliknet med stabilitetskriteriene og teoriene presenterti artiklene funnet gjennom litteraturstudien som omhandler samme problemstilling som er ad-dressert i dette arbeidet.
Stabilitetskriteriene funnet for 1940kVA generatoren med vekt på de transiente og subtransientereaktansene er gjengitt nedenfor:
X‘qX‘d
Æ 5.41 X“q
X“dÆ 0.46 (8)
Ved å kombinere stabilitetskriteriet for transiente reaktanser i Likn. 8, med kriteriet funnet iLikn. 7 av [3], er det funnet at stabilitetskriteriet framarbeidet i dette arbeidet er oppfylt, og atstabilitet kan oppnås ved å legge til en kortsluttet q-akse vikling på rotoren til generatoren.
Anbefalinger for videre arbeid er å bytte ut PWM-likeretteren med en diode-bro likeretter iDIgSILENT PowerFactory modellen, og å gjenta forsøket med varieringen av forsterkningen ispenningsregulatoren for så å studere stabiliteten av 3333kVA generatoren og 1940kVA genera-toren. Det er også foreslått å videre studere samspillet mellom synkrongeneratoren og diode-brolikeretteren. Sist, men ikke minst, burde simuleringer hvor en kortsluttet q-akse vikling er lagttil generator-rotoren gjennomføres, for å verifisere resultatene funnet fra stabilitetskriterieneutviklet i dette diplomarbeidet.
xi

xii

Contents
List of Figures xvii
List of Tables xxiii
1 Introduction 11.1 Objective . . . . . . . . . . . . . . . . . . . . . . . . . . . . . . . . . . . . . . . . 11.2 Scope of Work . . . . . . . . . . . . . . . . . . . . . . . . . . . . . . . . . . . . . 11.3 Limitations . . . . . . . . . . . . . . . . . . . . . . . . . . . . . . . . . . . . . . . 21.4 Simplifications and Assumptions . . . . . . . . . . . . . . . . . . . . . . . . . . . 21.5 Software . . . . . . . . . . . . . . . . . . . . . . . . . . . . . . . . . . . . . . . . . 31.6 Report Structure . . . . . . . . . . . . . . . . . . . . . . . . . . . . . . . . . . . . 3
2 System Description 5
3 Summary of Specialization Project During Fall 2014 93.1 Measurements Taken Onboard the Unstable Ship . . . . . . . . . . . . . . . . . . 93.2 Simulations Using DIgSILENT PowerFactory . . . . . . . . . . . . . . . . . . . . 11
4 Stability of Rectifier-Loaded Synchronous Generators 154.1 Six-Pulse Diode Bridge Rectifier Characteristics . . . . . . . . . . . . . . . . . . . 164.2 Undamped Oscillations in Synchronous Generators Feeding Load in Isolated System 184.3 Synchronous Generator Reactances . . . . . . . . . . . . . . . . . . . . . . . . . . 194.4 Synchronous Generator with Variable Speed . . . . . . . . . . . . . . . . . . . . . 204.5 Stability Criteria for Rectifier-Loaded Synchronous Generators . . . . . . . . . . 224.6 Modified Stability Criterion by Siemens . . . . . . . . . . . . . . . . . . . . . . . 27
4.6.1 Evaluation of the stability criterion . . . . . . . . . . . . . . . . . . . . . . 294.6.2 Stability criterion evaluated for three di�erent operations . . . . . . . . . 32
5 Description of DIgSILENT PowerFactory Model 35
6 Simulations in DIgSILENT PowerFactory 37
xiii

Table of contents
7 Description of MatLab/SimPowerSystems Model 417.1 Model Verification . . . . . . . . . . . . . . . . . . . . . . . . . . . . . . . . . . . 44
8 Investigation of 3333 kVA Generator System 478.1 Load Step on DC-Side of the Rectifier . . . . . . . . . . . . . . . . . . . . . . . . 518.2 Influence of Terminal Voltage Value on AVR behavior . . . . . . . . . . . . . . . 538.3 Without AVR Attached to the Generator . . . . . . . . . . . . . . . . . . . . . . 568.4 Parameter Analysis; Generator Reactances . . . . . . . . . . . . . . . . . . . . . 58
8.4.1 Study of Subtransient Reactances on Generator Stability . . . . . . . . . 588.4.2 Study of Synchronous and Transient Reactances on Generator Stability . 60
9 Investigation of 1940 kVA Generator With Salient Pole 639.1 Parameter Study: Generator Reactances . . . . . . . . . . . . . . . . . . . . . . . 67
9.1.1 Impact of Subtransient Reactances on Commutation Interval and Stability 679.2 RMS Values of Voltage and Current . . . . . . . . . . . . . . . . . . . . . . . . . 709.3 Battery Internal Resistance . . . . . . . . . . . . . . . . . . . . . . . . . . . . . . 739.4 Influence of Terminal Voltage Value . . . . . . . . . . . . . . . . . . . . . . . . . 749.5 Changing the Gain of the Voltage Regulator . . . . . . . . . . . . . . . . . . . . . 789.6 Load on DC-side of the Rectifier . . . . . . . . . . . . . . . . . . . . . . . . . . . 80
10 Investigation of 1940 kVA Generator System, Round Rotor 8510.1 1.6 < X‘q < Xq, Xq = Xq . . . . . . . . . . . . . . . . . . . . . . . . . . . . . . . 8710.2 1.6 < X‘q < Xq, Xq = Xd . . . . . . . . . . . . . . . . . . . . . . . . . . . . . . . 8910.3 Simulation Results of G2 with Round Rotor . . . . . . . . . . . . . . . . . . . . . 91
10.3.1 No load at the DC-side . . . . . . . . . . . . . . . . . . . . . . . . . . . . 9110.3.2 Reference value of the AVR at no load . . . . . . . . . . . . . . . . . . . . 9410.3.3 Load attached to the DC-side . . . . . . . . . . . . . . . . . . . . . . . . . 9510.3.4 Infinitely large inertia . . . . . . . . . . . . . . . . . . . . . . . . . . . . . 99
10.4 G2 with Round Rotor without AVR . . . . . . . . . . . . . . . . . . . . . . . . . 10010.4.1 Simulation results . . . . . . . . . . . . . . . . . . . . . . . . . . . . . . . 10010.4.2 Parameter analysis of battery on the DC-side of the rectifier . . . . . . . 10710.4.3 DC load step and battery parameter analysis . . . . . . . . . . . . . . . . 10810.4.4 Without the battery . . . . . . . . . . . . . . . . . . . . . . . . . . . . . . 110
10.5 AC5A Voltage Regulator . . . . . . . . . . . . . . . . . . . . . . . . . . . . . . . . 11010.5.1 Reference value of AC5A . . . . . . . . . . . . . . . . . . . . . . . . . . . 110
10.6 Simulink Battery . . . . . . . . . . . . . . . . . . . . . . . . . . . . . . . . . . . . 11510.6.1 AVR type A . . . . . . . . . . . . . . . . . . . . . . . . . . . . . . . . . . 11510.6.2 AVR type AC5A . . . . . . . . . . . . . . . . . . . . . . . . . . . . . . . . 125
10.7 Without the Rectifier . . . . . . . . . . . . . . . . . . . . . . . . . . . . . . . . . 12810.7.1 AVR type A . . . . . . . . . . . . . . . . . . . . . . . . . . . . . . . . . . 129
xiv

Table of contents
10.7.2 AVR type AC5A . . . . . . . . . . . . . . . . . . . . . . . . . . . . . . . . 13010.8 Excitation of the Generator Field . . . . . . . . . . . . . . . . . . . . . . . . . . . 13110.9 Impact of Subtransient Reactances on Stability . . . . . . . . . . . . . . . . . . . 133
10.9.1 No load . . . . . . . . . . . . . . . . . . . . . . . . . . . . . . . . . . . . . 13310.9.2 Load on dc-side . . . . . . . . . . . . . . . . . . . . . . . . . . . . . . . . . 135
11 Discussion 13711.1 Model Reliability - Assumptions and Simplifications . . . . . . . . . . . . . . . . 13711.2 Simulations Obtained from PowerFactory . . . . . . . . . . . . . . . . . . . . . . 13811.3 Simulations Obtained from MatLab/SimPowerSystems . . . . . . . . . . . . . . . 13911.4 Uncertainty Regarding Simulation Results . . . . . . . . . . . . . . . . . . . . . . 14411.5 Comparative Analysis . . . . . . . . . . . . . . . . . . . . . . . . . . . . . . . . . 145
11.5.1 Stability criteria obtained in this thesis regarding generator reactances . . 14511.5.2 Stability enhancement of 1940kVA generator . . . . . . . . . . . . . . . . 147
12 Conclusion 14912.1 Recommendations . . . . . . . . . . . . . . . . . . . . . . . . . . . . . . . . . . . 150
13 Further Work 151
14 Bibliography 153
A Specialization Project During Fall 2014 155A.1 Transient Voltage Increase . . . . . . . . . . . . . . . . . . . . . . . . . . . . . . . 155
B Simulations in PowerFactory 157B.1 External System Parameters used in PowerFactory Model [4] . . . . . . . . . . . 157B.2 Modal Analysis in PowerFactory, Participation Factors . . . . . . . . . . . . . . . 158
C 3333 kVA Generator MatLab/SimPowerSystems Model 161C.1 Components and Parameters . . . . . . . . . . . . . . . . . . . . . . . . . . . . . 161C.2 Simulation Results from the Governor, Voltage Regulator and Exciter . . . . . . 165
D 1940 kVA Generator MatLab/SimPowerSystems Model 169D.1 Components and Parameters . . . . . . . . . . . . . . . . . . . . . . . . . . . . . 169D.2 Simulation Results Measured from the Voltage Regulator, Exciter and Governor 173
E Voltage Regulator ESAC8B used in PowerFactory 177E.1 Block Diagram of AVR ESAC8B . . . . . . . . . . . . . . . . . . . . . . . . . . . 178E.2 Parameter Setting of AVR ESAC8B . . . . . . . . . . . . . . . . . . . . . . . . . 179
xv

Table of contents
F System Component Parameters 181F.1 Rectifier . . . . . . . . . . . . . . . . . . . . . . . . . . . . . . . . . . . . . . . . . 181F.2 Battery-Arrangement C1 . . . . . . . . . . . . . . . . . . . . . . . . . . . . . . . . 181F.3 Resistance . . . . . . . . . . . . . . . . . . . . . . . . . . . . . . . . . . . . . . . . 181
G SimScape Lithium-Ion Battery Model 183G.1 Equivalent Circuit . . . . . . . . . . . . . . . . . . . . . . . . . . . . . . . . . . . 183G.2 Lithium-Ion Battery Model . . . . . . . . . . . . . . . . . . . . . . . . . . . . . . 184G.3 Rated Capacity=300Ah, Vinitial = 1030V . . . . . . . . . . . . . . . . . . . . . . 185G.4 Rated Capacity=300Ah, Vinitial = 950V . . . . . . . . . . . . . . . . . . . . . . . 186G.5 Rated Capacity=150Ah, Vinitial = 950V . . . . . . . . . . . . . . . . . . . . . . . 187
H Voltage Regulator AC5A in MatLab/SimPowerSystems 189H.1 One-Line Diagram of AVR AC5A . . . . . . . . . . . . . . . . . . . . . . . . . . . 189H.2 Parameter Settings of AVR AC5A . . . . . . . . . . . . . . . . . . . . . . . . . . 190H.3 G2 Output Parameters when AC5A is Added, and Vref = 1.0 at No-Load. The
Battery Arrangement is Included . . . . . . . . . . . . . . . . . . . . . . . . . . . 191H.4 G2 Output Parameters when AC5A is Added, and Vref = 1.2 at No-Load. The
150Ah Battery Model is Included. . . . . . . . . . . . . . . . . . . . . . . . . . . 192
I Generator Data 193I.1 Data for 3333 kVA Generator . . . . . . . . . . . . . . . . . . . . . . . . . . . . . 194I.2 Data for 1940 kVA Generator . . . . . . . . . . . . . . . . . . . . . . . . . . . . . 195
I.2.1 Parameter analysis with 1940kVA generator reactances . . . . . . . . . . . 195
xvi

List of Figures
2.1 One-line diagram of BlueDrive+C system . . . . . . . . . . . . . . . . . . . . . . 6
3.1 Measurements taken onboard the ship using 1940 kVA generators . . . . . . . . . 103.2 PowerFactory-model without rectifier . . . . . . . . . . . . . . . . . . . . . . . . . 123.3 Root locus plot for G1 and G2 without rectifier . . . . . . . . . . . . . . . . . . . 13
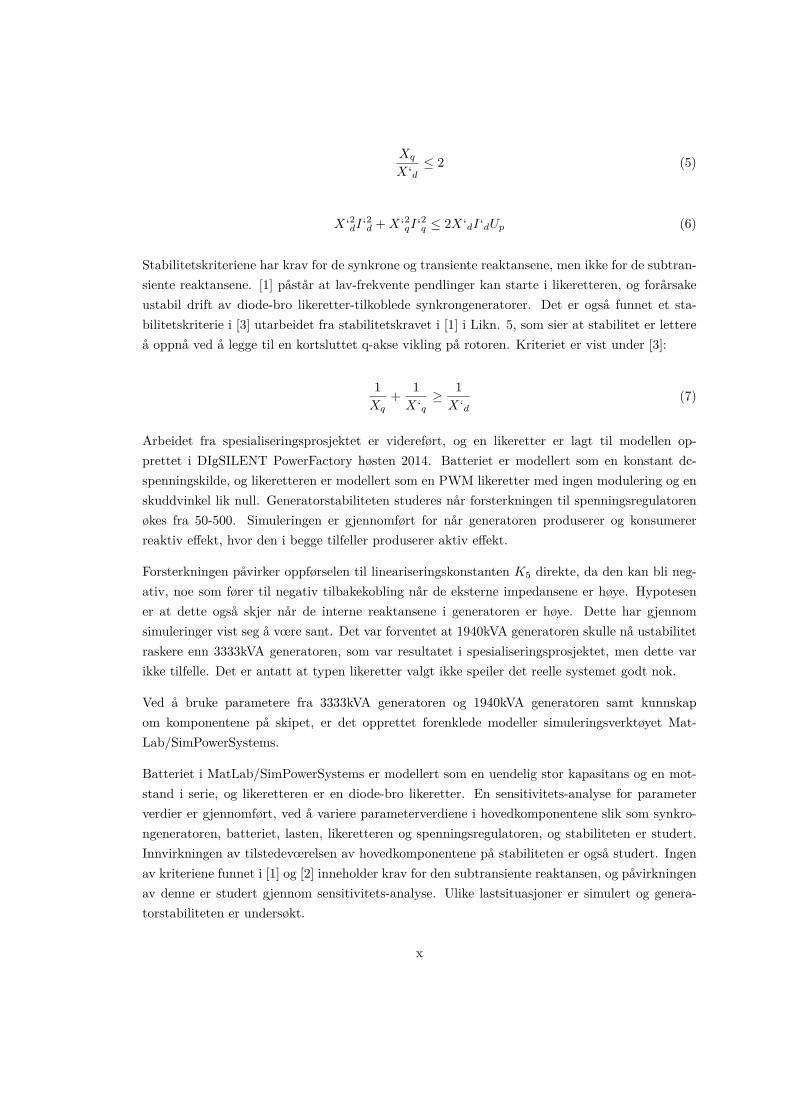
4.1 Synchronous generator feeding load through diode-bridge rectifier . . . . . . . . . 154.2 Current and voltage waveforms from diode-bridge rectifier . . . . . . . . . . . . . 164.3 Pulsed AC PWM drive input current . . . . . . . . . . . . . . . . . . . . . . . . . 174.4 Generator output voltage and current feeding rectifier . . . . . . . . . . . . . . . 184.5 Space-vector diagram of generator-rectifier system . . . . . . . . . . . . . . . . . 214.6 Voltage and current from rectifier-loaded SG . . . . . . . . . . . . . . . . . . . . 254.7 Simplified equivalent circuit of the studied system . . . . . . . . . . . . . . . . . 274.8 Vector diagram of the studied system . . . . . . . . . . . . . . . . . . . . . . . . . 284.9 The vector diagram of the studied system in steady state . . . . . . . . . . . . . 304.10 The vector diagram of the studied system in the transient state . . . . . . . . . . 31
5.1 PowerFactory-model with rectifier . . . . . . . . . . . . . . . . . . . . . . . . . . 36
6.1 Root locus plot for G1 and G2 with rectifier . . . . . . . . . . . . . . . . . . . . . 39
7.1 The SimPowerSystems model . . . . . . . . . . . . . . . . . . . . . . . . . . . . . 427.2 The SimPowerSystems model, generator-battery configuration . . . . . . . . . . . 437.3 The mean dc-voltage for the SimPowerSystems model with constant voltage source
and PLoad = 0.41MW . . . . . . . . . . . . . . . . . . . . . . . . . . . . . . . . . 447.4 The current and voltage for the SimPowerSystems model with constant voltage
source and PLoad = 0.41MW . . . . . . . . . . . . . . . . . . . . . . . . . . . . . 457.5 The dc-voltage for the SimPowerSystems model with constant voltage source and
PLoad = 0.41MW and battery connected on the dc-side . . . . . . . . . . . . . . 45
xvii

List of Figures
7.6 The current and voltage for the SimPowerSystems model with constant voltagesource and PLoad = 0.41MW and battery connected on the dc-side . . . . . . . . 46
7.7 The current from the battery to the load in the SimPowerSystems model withconstant voltage source and PLoad = 0.41MW and battery connected on the dc-side 46
8.1 3333kVA gen. output parameters . . . . . . . . . . . . . . . . . . . . . . . . . . . 488.2 3333kVA gen. exciter field voltage . . . . . . . . . . . . . . . . . . . . . . . . . . 498.3 3333kVA gen. DC-bus voltage . . . . . . . . . . . . . . . . . . . . . . . . . . . . . 508.4 One-line diagram of 3333kVA-battery-load configuration . . . . . . . . . . . . . . 518.5 3333kVA gen. output values with PLoad = 0.5MW on dc-side of rectifier . . . . . 518.6 3333kVA gen. output values with PLoad = 1.0MW on dc-side of rectifier . . . . . 528.7 3333kVA gen. output values with PLoad = 1.5MW on dc-side of rectifier . . . . . 528.8 3333kVA gen. output values with PLoad = 3MW on dc-side of rectifier . . . . . . 538.9 3333kVA gen. output values with no load on dc-side of rectifier, and Vref = 1.2
in the AVR . . . . . . . . . . . . . . . . . . . . . . . . . . . . . . . . . . . . . . . 548.10 dc-voltage after rectifier when no load is attached and Vref = 1.2 in the AVR . . 548.11 3333kVA gen. output values with Pload = 1.5MW on dc-side of rectifier, and
Vref = 1.0 in the AVR . . . . . . . . . . . . . . . . . . . . . . . . . . . . . . . . . 558.12 3333kVA gen. output values with Pload = 3MW on dc-side of rectifier, and
Vref = 1.0 in the AVR . . . . . . . . . . . . . . . . . . . . . . . . . . . . . . . . . 558.13 3333kVA gen. output values with no AVR and no load on dc-side of rectifier . . . 568.14 3333kVA gen. output values with no AVR and Pload = 1.5MW on dc-side of rectifier 578.15 3333kVA gen. output values with no AVR and Pload = 3MW on dc-side of rectifier 57
9.1 1940kVA salient pole gen. output parameters . . . . . . . . . . . . . . . . . . . . 649.2 1940kVA salient pole gen. output voltage and current . . . . . . . . . . . . . . . 659.3 1940 kVA generator system current pulse in phase c . . . . . . . . . . . . . . . . 669.4 1940 kVA generator system voltage in phase c. . . . . . . . . . . . . . . . . . . . 679.5 Impact of X“q on commutation intervals . . . . . . . . . . . . . . . . . . . . . . . 689.6 1940 kVA gen. RMS values of voltage and current in phase a . . . . . . . . . . . 719.7 1940 kVA gen. field voltage . . . . . . . . . . . . . . . . . . . . . . . . . . . . . . 729.8 1940 kVA gen. dc-bus voltage . . . . . . . . . . . . . . . . . . . . . . . . . . . . . 739.9 1940kVA gen. output when Vref = 1.2 in the AVR . . . . . . . . . . . . . . . . . 759.10 1940kVA gen. output when Vref = 1.4 in the AVR . . . . . . . . . . . . . . . . . 769.11 1940kVA gen. voltage when Vref = 1.4 in the AVR, 50s long simulation . . . . . 779.12 1940kVA gen. voltage when Vref = 1.4 and gain=200 in the AVR . . . . . . . . . 779.13 1940kVA gen. voltage when Vref = 1.0 in the AVR . . . . . . . . . . . . . . . . . 789.14 1940kVA gen. output when gain=200 in the AVR . . . . . . . . . . . . . . . . . . 799.15 1940kVA gen. output values with PLoad = 0.2MW on dc-side of rectifier . . . . . 809.16 1940kVA gen. output values with PLoad = 0.5MW on dc-side of rectifier . . . . . 81
xviii

List of Figures
9.17 1940kVA gen. output values with PLoad = 1MW on dc-side of rectifier . . . . . . 819.18 1940kVA gen. output values with PLoad = 1.5MW on dc-side of rectifier . . . . . 829.19 1940kVA gen. output values with PLoad = 1.9MW on dc-side of rectifier . . . . . 82
10.1 Rotor velocity of 1940 kVA gen. modeled as round rotor and X‘q = 10 . . . . . . 8810.2 1940kVA round rotor gen. outputs, no load on dc-side of rectifier . . . . . . . . . 9210.3 1940kVA round rotor gen. exciter field voltage . . . . . . . . . . . . . . . . . . . 9310.4 1940kVA round rotor gen. dc-bus voltage . . . . . . . . . . . . . . . . . . . . . . 9310.5 1940kVA round rotor gen. voltage when Vref = 1.0 in AVR, no load on dc-side of
rectifier . . . . . . . . . . . . . . . . . . . . . . . . . . . . . . . . . . . . . . . . . 9410.6 1940kVA round rotor gen. voltage when Vref = 1.4 in AVR, no load on dc-side of
rectifier . . . . . . . . . . . . . . . . . . . . . . . . . . . . . . . . . . . . . . . . . 9410.7 1940kVA round rotor gen. voltage when Vref = 1.4 in AVR, no load on dc-side of
rectifier, 50s long simulation . . . . . . . . . . . . . . . . . . . . . . . . . . . . . . 9510.8 1940kVA round rotor gen. output when PLoad = 0.2MW is attached to DC-side
of rectifier . . . . . . . . . . . . . . . . . . . . . . . . . . . . . . . . . . . . . . . . 9610.9 1940kVA round rotor gen. output when PLoad = 0.5MW is attached to DC-side
of rectifier . . . . . . . . . . . . . . . . . . . . . . . . . . . . . . . . . . . . . . . . 9710.101940kVA round rotor gen. output when PLoad = 1MW is attached to DC-side of
rectifier . . . . . . . . . . . . . . . . . . . . . . . . . . . . . . . . . . . . . . . . . 9710.111940kVA round rotor gen. output when PLoad = 1.5MW is attached to DC-side
of rectifier . . . . . . . . . . . . . . . . . . . . . . . . . . . . . . . . . . . . . . . . 9810.121940kVA round rotor gen. output when PLoad = 1.9MW is attached to DC-side
of rectifier . . . . . . . . . . . . . . . . . . . . . . . . . . . . . . . . . . . . . . . . 9810.131940kVA round rotor gen. output values, AVR not connected . . . . . . . . . . . 10110.141940kVA round rotor gen. exciter field voltage, when no AVR is attached . . . . 10210.151940kVA round rotor gen. output values with PLoad = 0.2MW on dc-side of
rectifier, no AVR . . . . . . . . . . . . . . . . . . . . . . . . . . . . . . . . . . . . 10310.161940kVA round rotor gen. output values with PLoad = 0.5MW on dc-side of
rectifier, no AVR . . . . . . . . . . . . . . . . . . . . . . . . . . . . . . . . . . . . 10410.171940kVA round rotor gen. output values with PLoad = 1.0MW on dc-side of
rectifier, no AVR . . . . . . . . . . . . . . . . . . . . . . . . . . . . . . . . . . . . 10410.181940kVA round rotor gen. output values with PLoad = 1.5MW on dc-side of
rectifier, no AVR . . . . . . . . . . . . . . . . . . . . . . . . . . . . . . . . . . . . 10510.191940kVA round rotor gen. output values with PLoad = 1.9MW on dc-side of
rectifier, no AVR . . . . . . . . . . . . . . . . . . . . . . . . . . . . . . . . . . . . 10510.20One line-diagram of generator-rectifier-battery-load arrangement . . . . . . . . . 10710.21Voltage of G2 round rotor with Vref = 1.0 in AVR AC5A . . . . . . . . . . . . . 11110.22Voltage of G2 round rotor with Vref = 1.2 in AVR AC5A . . . . . . . . . . . . . 111
xix

List of Figures
10.23Dc-voltage from the rectifier connected to G2 round rotor with Vref = 1.2 in AVRAC5A . . . . . . . . . . . . . . . . . . . . . . . . . . . . . . . . . . . . . . . . . . 112
10.24Voltage of G2 round rotor with Vref = 1.4 in AVR AC5A . . . . . . . . . . . . . 11210.25Voltage of G2 round rotor with Vref = 1.2 in AVR AC5A and PLoad = 0.5MW . 11410.26Voltage of G2 round rotor with Vref = 1.2 in AVR AC5A and PLoad = 1.5MW . 11410.27Voltage of G2 round rotor with Vref = 1.2 in AVR AC5A and PLoad = 1.9MW . 11410.28One-line diagram of G2-rectifier-battery-load arrangement . . . . . . . . . . . . . 11510.29The nominal current discharge characteristics of the battery . . . . . . . . . . . . 11610.30The battery profile . . . . . . . . . . . . . . . . . . . . . . . . . . . . . . . . . . . 11710.31150Ah battery output without load . . . . . . . . . . . . . . . . . . . . . . . . . . 11810.32The 1940kVA gen. terminal voltage with 150Ah battery and no load . . . . . . . 11910.33150Ah battery output when RLoad = 2.122� is connected . . . . . . . . . . . . . 12010.34The 1940kVA gen. terminal voltage with 150Ah battery and PLoad = 0.5MW . . 12010.35Power from the battery and generator when RLoad = 2.122� is connected . . . . 12110.36Power from the battery and generator when PLoad = 0.5MW is connected and
the SoC is 80% . . . . . . . . . . . . . . . . . . . . . . . . . . . . . . . . . . . . . 12210.37Power from the generator when RLoad = 2.122� is connected and the battery is
not included . . . . . . . . . . . . . . . . . . . . . . . . . . . . . . . . . . . . . . . 12310.38Power from the battery and generator when PLoad = 1.5MW is connected and
the SoC is 80% . . . . . . . . . . . . . . . . . . . . . . . . . . . . . . . . . . . . . 12410.39Power from the battery and generator when PLoad = 1.83MW is connected and
the SoC is 80% . . . . . . . . . . . . . . . . . . . . . . . . . . . . . . . . . . . . . 12510.40Power from the battery and generator when AC5A is applied during no-load . . 12610.41The 1940kVA gen. terminal voltage with 150Ah battery at no load . . . . . . . . 12610.42Power from the battery and generator when PLoad = 0.5MW is connected AC5A
is applied . . . . . . . . . . . . . . . . . . . . . . . . . . . . . . . . . . . . . . . . 12710.43Power from the battery and generator when PLoad = 1.9MW is connected AC5A
is applied . . . . . . . . . . . . . . . . . . . . . . . . . . . . . . . . . . . . . . . . 12810.44PLoad = 1.5MV A connected to the 1940kVA gen. with AVR type A and no rectifier12910.45PLoad = 1.9MV A connected to the 1940kVA gen. with AVR type A and no rectifier12910.46PLoad = 1.0MV A connected to the 1940kVA gen. with AVR type AC5A and no
rectifier . . . . . . . . . . . . . . . . . . . . . . . . . . . . . . . . . . . . . . . . . 13010.47PLoad = 1.9MV A connected to the 1940kVA gen. with AVR type AC5A and no
rectifier . . . . . . . . . . . . . . . . . . . . . . . . . . . . . . . . . . . . . . . . . 130
B.1 Variables accessible for eigenvalue calculation . . . . . . . . . . . . . . . . . . . . 158B.2 Participations G1 . . . . . . . . . . . . . . . . . . . . . . . . . . . . . . . . . . . . 158B.3 Participations G2 . . . . . . . . . . . . . . . . . . . . . . . . . . . . . . . . . . . . 159B.4 PWM converter equivalent circuit . . . . . . . . . . . . . . . . . . . . . . . . . . . 159
xx

List of Figures
C.1 One line diagram of governor . . . . . . . . . . . . . . . . . . . . . . . . . . . . . 161C.2 One line diagram of AVR and exciter . . . . . . . . . . . . . . . . . . . . . . . . . 162C.3 One line diagram of AVR . . . . . . . . . . . . . . . . . . . . . . . . . . . . . . . 163C.4 One-line diagram of governor . . . . . . . . . . . . . . . . . . . . . . . . . . . . . 164C.5 Output values from the governor attached to 3333 kVA gen. . . . . . . . . . . . . 165C.6 Output values from AVR connected to 3333kVA gen. . . . . . . . . . . . . . . . . 166C.7 Output values from exciter connected to 3333kVA gen. . . . . . . . . . . . . . . . 167
D.1 One line diagram of governor . . . . . . . . . . . . . . . . . . . . . . . . . . . . . 169D.2 One line diagram of AVR and exciter . . . . . . . . . . . . . . . . . . . . . . . . . 170D.3 One-line diagram of AVR . . . . . . . . . . . . . . . . . . . . . . . . . . . . . . . 171D.4 One-line diagram of governor . . . . . . . . . . . . . . . . . . . . . . . . . . . . . 172D.5 Output values from governor . . . . . . . . . . . . . . . . . . . . . . . . . . . . . 173D.6 Output values from AVR . . . . . . . . . . . . . . . . . . . . . . . . . . . . . . . 174D.7 Output values from exciter . . . . . . . . . . . . . . . . . . . . . . . . . . . . . . 175
E.1 The block diagram of the AVR ESAC8B . . . . . . . . . . . . . . . . . . . . . . . 178
G.1 Equivalent circuit of SimScape lithium-ion battery . . . . . . . . . . . . . . . . . 183G.2 Nominal current discharge characteristics of the li-ion battery with C=300Ah,
Vinitial = 1030V . . . . . . . . . . . . . . . . . . . . . . . . . . . . . . . . . . . . 185G.3 The nominal current discharge characteristics of the battery with C=300Ah, Vinitial =
950V . . . . . . . . . . . . . . . . . . . . . . . . . . . . . . . . . . . . . . . . . . . 186G.4 The nominal current discharge characteristics of the battery with C=150Ah, Vinitial =
950V . . . . . . . . . . . . . . . . . . . . . . . . . . . . . . . . . . . . . . . . . . . 187
H.1 The line diagram of the AVR AC5A . . . . . . . . . . . . . . . . . . . . . . . . . 189H.2 1940kVA round rotor gen. outputs when Vref = 1.0 in AVR AC5A . . . . . . . . 191H.3 1940kVA round rotor gen. outputs when Vref = 1.2 in AVR AC5A . . . . . . . . 192
xxi

xxii

List of Tables
4.1 Typical parameter values for salient pole and round rotor SG . . . . . . . . . . . 194.2 Typical parameter values for a hydropower generator with round rotor and com-
plete damper winding/(damper cage) (54MVA; cos„ = 0.95, 10.5kV; 600U/min,50Hz) [5]. . . . . . . . . . . . . . . . . . . . . . . . . . . . . . . . . . . . . . . . . 20
8.1 Parameter analysis, impact of X“q, on G1 stability . . . . . . . . . . . . . . . . . 588.2 Parameter analysis, impact of X“d, on G1 stability . . . . . . . . . . . . . . . . . 598.3 Parameter analysis, impact of the ratio X“
q
X“
d
, on G1 stability . . . . . . . . . . . . 608.4 Parameter analysis, fulfilling of stability criterion in [1] . . . . . . . . . . . . . . . 608.5 Parameter analysis of 3333kVA generator reactances, breaking the stability crite-
rion in [1] . . . . . . . . . . . . . . . . . . . . . . . . . . . . . . . . . . . . . . . . 618.6 Parameter analysis, impact of Xq, on G1 stability . . . . . . . . . . . . . . . . . . 618.7 Parameter analysis, impact of Xd, on G1 stability . . . . . . . . . . . . . . . . . . 62
9.1 Impact of X“q on commutation intervals . . . . . . . . . . . . . . . . . . . . . . . 689.2 Parameter analysis, impact of X“q, on G2 stability . . . . . . . . . . . . . . . . . 699.3 Parameter analysis, impact of the ratio X“
q
X“
d
, on G2 stability . . . . . . . . . . . . 709.4 Parameter analysis; internal resistance of the battery . . . . . . . . . . . . . . . . 749.5 Parameter analysis with G2: load on dc-side of rectifier . . . . . . . . . . . . . . 82
10.1 Parameter analysis: varying X‘q and Xq . . . . . . . . . . . . . . . . . . . . . . . 8610.2 Parameter analysis, with 1.6 < X‘q < Xq and Xq = Xq . . . . . . . . . . . . . . . 8710.3 Parameter analysis, with 1.6 < X‘q < Xq and Xq = Xq, without AVR and exciter 8810.4 Parameter analysis, with 1.6 < X‘q < Xq and Xq = Xd . . . . . . . . . . . . . . 8910.5 Parameter analysis, with 1.6 < X‘q < Xq and Xq = Xd, no AVR included . . . . 9010.6 G2 round rotor parameter analysis: varied load on dc-side of rectifier . . . . . . . 9910.7 Varying rotor intertia to detect oscillations in rotor angle . . . . . . . . . . . . . 9910.8 Parameter analysis: DC-side load step when no AVR is included. . . . . . . . . . 10510.9 Parameter analysis: DC-side load step. Comparison between AVR connected/not
connected. . . . . . . . . . . . . . . . . . . . . . . . . . . . . . . . . . . . . . . . . 106
xxiii

List of Tables
10.10Parameter analysis: varying Rbattery and Cbattery. AVR not included . . . . . . . 10810.11Parameter analysis: varying Rbattery, Cbattery and PLoad. AVR not included . . . 10910.12Parameter analysis: varying Rbattery, Cbattery and RLoad. AVR not included . . . 10910.13DC-side load step without battery. . . . . . . . . . . . . . . . . . . . . . . . . . . 11010.14G2 characteristics when changing the reference value of two di�erent types of AVR
when no load is attached . . . . . . . . . . . . . . . . . . . . . . . . . . . . . . . . 11310.15Excitation voltage. PLoad = 0.5MW . . . . . . . . . . . . . . . . . . . . . . . . . 13110.16Excitation voltage. PLoad = 1.5MW . . . . . . . . . . . . . . . . . . . . . . . . . 13110.17Excitation voltage. PLoad = 1.9MW . . . . . . . . . . . . . . . . . . . . . . . . . 13210.18Criterion for exciter-voltage value for a stable operation at di�erent loads. . . . . 13310.19Parameter analysis, impact of X“q, on G2 stability with Xq = Xq . . . . . . . . 13410.20Parameter analysis, impact of X“q, on G2 stability, with Xq = Xd . . . . . . . . 13410.21Parameter analysis, impact of the ratio X“
q
X“
d
, on G2 stability . . . . . . . . . . . . 13510.22Parameter analysis, impact of X“q, on G2 stability, with Xq = Xd and PLoad =
0.5MW . . . . . . . . . . . . . . . . . . . . . . . . . . . . . . . . . . . . . . . . . 13610.23Parameter analysis, impact of the ratio X“
q
X“
d
, on G2 stability . . . . . . . . . . . . 136
B.1 External parameters used in PowerFactory-model . . . . . . . . . . . . . . . . . . 157
C.1 Parameter settings for 17.1 kVA exciter generator used in G1-model . . . . . . . 162C.2 Parameter settings for AVR . . . . . . . . . . . . . . . . . . . . . . . . . . . . . . 163C.3 Parameter settings for governor used in G1-model . . . . . . . . . . . . . . . . . 164
D.1 Parameter settings in 27.3 kVA exciter generator used in G2-model . . . . . . . . 170D.2 Parameter settings for AVR . . . . . . . . . . . . . . . . . . . . . . . . . . . . . . 171D.3 Parameter settings for governor used in G2-model . . . . . . . . . . . . . . . . . 172
E.1 Voltage regulator ESAC8B parameters settings . . . . . . . . . . . . . . . . . . . 179
F.1 Parameter settings in the rectifier block . . . . . . . . . . . . . . . . . . . . . . . 181F.2 Parameter settings in the battery-arrangement . . . . . . . . . . . . . . . . . . . 181F.3 Parameter settings in the resistor . . . . . . . . . . . . . . . . . . . . . . . . . . . 181
H.1 Parameter settings for AVR type AC5A . . . . . . . . . . . . . . . . . . . . . . . 190
I.1 Parameter settings in 3333 kVA generator model . . . . . . . . . . . . . . . . . . 194I.2 Parameter settings in 1940 kVA generator model . . . . . . . . . . . . . . . . . . 195I.3 Parameter analysis: varying X‘q and Xq . . . . . . . . . . . . . . . . . . . . . . . 196I.4 Parameter analysis, with 1.6 < X‘q < 4.79 and Xq = 4.79 . . . . . . . . . . . . . 196I.5 Parameter analysis, with 1.6 < X‘q < 4.79 and Xq = 4.79 . . . . . . . . . . . . . 197I.6 Parameter analysis, with 1.6 < X‘q < 4.79 and Xq = 5.36 . . . . . . . . . . . . . 197I.7 Parameter analysis, with 1.6 < X‘q < 4.79 and Xq = 5.36, no AVR included . . . 197
xxiv

Nomenclature
AbbreviationsSG Synchronous Generator
DC Direct Current
AC Alternating Current
AVR Automatic Voltage Regulator
PWM Pulse Width Modulation
IGBT Insulated-Gate Bipolar Transistor
THD Total Harmonic Distortion
RMS Root Mean Square
DG Distributed Generatorion
AVM Average Value Modulation
pu Per unit
PID Proportional Integration Derivation
VT Voltage Transformer
CT Current Transformer
RPM Rotations Per Minute
THD Total Harmonic Distortion
Symbols
First mentioned in Chapter 1
Xd,q Synchronous reactance in d- and q-axis
X‘d,q Transient reactance in d- and q-axis
X“d,q Subtransient reactance in d- and q-axis
First mentioned in Chapter 3
K5 Linearization constant
Kp PID gain
Kg PID gain
First mentioned in Chapter 4
idc Dc current
vdc Dc voltage
vd Voltage in d-axis
vq Voltage in q-axis
id Current in d-axis
iq Current in q-axis
vfd Field winding terminal voltage
ifd Field winding terminal current
ikd d-axis damper winding current
ikq q-axis damper winding current
vkd d-axis damper winding voltage
vkq q-axis damper winding voltage
Êr rotor velocity
Ll Leakage inductance
Lls Stator leakage inductance
Rl Load resistance
Rs Stator resistance
Lm Mutual inductance
Lmq q-axis mutual inductance
Lmd d-axis mutual inductance
Ls Self inductance
Rfd Field winding resistance
Llfd Leakage inductance in field winding
Rkd d-axis damper winding resistance
Llkd Leakage inductance in d-axis damper winding
Llkq Leakage inductance in q-axis damper winding
xxv

Nomenclature
ki, lv Current and voltage constants
Vd Constant dc voltage
In RMS value of the harmonic n
IF RMS value of the fundamental current
IH Harmonic content of IF
Ishortcircuit The short circuit current
Id Constant dc current
VLL Line-to-line voltage
Vdc Dc line-to-line voltage
” Rotor angle
Sm Stability index
fl(M) Spectral radius of the Jacobian matrix of the pe-riodic orbit
X(T0) State vector of the researched system at time T0when s mall disturbance occurs
◊2 Position of SG rotor changes with in the period aftersmall disturbance
„ Flux
X(0) state vector of the researched system at time zerowhen s mall disturbance occurs
◊1 rotor position of SG at the time a small disturbanceoccurs
Xt commutation reactance
” phase lag of the armature voltage at on-load, Eq. 4.11
– controlled delay time
u overlapping angle of the commutation
n revolutions per minute
Ig Current through the rectifier
Up Stationary source voltage
U ‘p Transient source voltage
I‘ Transient current
I‘d Transient current in the d-axis
I‘q Transient current in the q-axis
ULM Steady state terminal voltage
I Steady state phase current
Ua Steady state voltage in phase a
Ub Steady state voltage in phase b
Uc Steady state voltage in phase c
fn Nominal frequency
‘ Angle between „ and ”
First mentioned in Chapter 7
theta load angle/rotor angle
uabc Terminal voltage
iabc Terminal current
First mentioned in Chapter 8
w Rotor velocity
ui Field voltage
udq Stator voltage in the d-and q-axis
idq Stator current in the d-and q-axis
deltay Signal output from governor
ef Field voltage
if Field current
is Line current
us Line voltage
If Current output from rectifier
First mentioned in Chapter 10
J Inertia
H Inertia constant
Srated Machine rated apparent power
Frated Machine rated el. frequency
N Number of machine pole pairs
First mentioned in Appendix
uact Filter output voltage from voltage regulator
uref,reg Reference value signal into voltage regulator
error Error signal into the PID controller in voltageregulator
regout Output signal from voltage regulator
xxvi

Chapter 1
Introduction
This thesis concerns the stability of diode-bridge rectifier-loaded synchronous generators withboth salient pole and round rotor, characterized with high values of synchronous, transient andsub-transient reactances i the direct- and quadrature-axis (Xd, X‘d, X“d, Xq, X‘q, X“q). Twosynchronous generators types with high values of reactances used in the industry is under study.They are operating onboard ships where the electric system is delivered by Siemens, as a part oftheir new diesel-electric, variable speed propulsion DC-system for ships. One of the generatorsis characterized as unstable, and the other one as stable.
1.1 Objective
The objective of this thesis is to understand why diode-bridge rectifier-loaded synchronous gener-ators with high values of reactances operated in isolated systems both with and without batterybecomes unstable, and to find what could be done to prevent this type of unstable situations.
1.2 Scope of Work
The work should comprise:
• Literature studies on:
– Instability of SG possibly with high reactances in per-unit values
– Instability of rectifier-loaded SG possibly with connection of battery
• Continue the work from the specialization project of fall 2014
1

CHAPTER 1. INTRODUCTION
– Simulations on DIgSILENT PowerFactory model of SG with rectifier connected
• Simulations using MatLab/SimPowerSystems
– Analysis and further development of the received model from Siemens
– Recreate the phenomena observed on the ships in the simulation model
– Parameter sensitivity analysis of main system components and investigation of stabil-ity
– Component analysis, investigating stability from the presence/absence of main com-ponents
• Discussion, final conclusion, recommendations and suggestions for further work
1.3 Limitations
The studied system is the generator-rectifier-battery configuration. An additional load is con-nected in parallel with the battery to model the rest of the system onboard the ship. In the realsystem, the thrusters are connected to the dc-bus through inverters. Two generators feed thedc-bus through rectifiers. These components (converters and thrusters) are not included in thestudied system in this thesis, but modeled as an active load.
The system is an isolated system and is not connected to any other grid. Only simulations ofthe ship are included in this thesis, no measurements onboard the ship is made.
1.4 Simplifications and Assumptions
Several simplifications and assumptions is made during the work on this thesis, and is listedbelow:
• The system is modeled as ideal, ie. no losses is considered
• When the stability is to be examined, the first 20 seconds of the machine start-up issimulated. If no oscillations are found during this time, the system is considered stable.Sometimes the generateor start-up is simulated for a longer time range to observe thevoltage regulator response time, but the algorithms in the simulation tool can make thesystem go unstable if the simulation is too long.
• An infinitely large capacitor with a series resistance is used to model the battery in thesimulation model in MatLab/SimPowerSystems.
2

1.5. SOFTWARE
• A constant dc-voltage source is chosen to model the battery on the DC-side of the rectifierusing the simulation model in DIgSILENT/PowerFactory.
• The thrusters connected to the dc-bus after the converter, as well as the converter itselfis not considered. In addition to the battery, only an active load is modeled after thediode-bridge rectifier.
• Only situations linked to the observed problems are simulated.
• Only one generator is studied at a time, even through the generator has the option tooperate with another generator in parallel on the ship.
• An exciter generator excites the field of the main generator, instead of a diesel engine
1.5 Software
The simulation models applied in this thesis is built in two di�erent simulation tools; Mat-Lab/SimPowerSystems and DIgSILENT PowerFactory. The models build in SimPowerSystemsis parameterized by using Matlab, the control systems used in these SimPowerSystems-modelsis designed in Simulink and mechanical components is added to the model using Simscape. In-formation about these softwares can be found on the software web side on www.mathworks.comand www.DIgSILENT.de
The thesis is written in the typesetting system LATEX
1.6 Report Structure
Chapter 2 presents a description of the system under consideration in this thesis. In Chapter 3is the highlights of the specialization project conducted in the fall semester in 2014 presented,where the same system was under investigation, considering the same objectives as in this thesis.Chapter 4 contains the relevant theory for the system considered, and summarizes the literaturestudy. The fundamental theory of synchronous generator design and stability is expected knownand is not provided. A continuation of the work done in the specialization project in fall of 2014is conducted, and the model description is shown in chapter 5 and the simulation results is givenin Chapter 6.
The model used in MatLab/SimPowerSystems is described and presented in chapter 7. Chapter8 contains the simulations done using the data from the 3333kVA generator that is consideredstable. In chapter 9 is the data from the unstable 1940kVA generator used in the simulationmodel, and the generator is modeled as salient pole. In chapter 10 is the unstable generator
3

CHAPTER 1. INTRODUCTION
designed as round rotor. The discussion is found in chapter 11 and the conclusion and recom-mendations is presented in Chapter 12. Ideas for further work is presented in Chapter 13 andthe Appendices is found after the Bibliography.
4

Chapter 2
System Description
This chapter presents a description of the system under study in this thesis, where the mostimportant components are of interest.
This thesis concerns the stability of synchronous generators characterized with high values of syn-chronous, transient and subtransient reactances in the direct- and quadrature axis (Xd, X‘d, X“d, Xq, X‘q, X“q),with the possibility of connecting a battery-bank. The synchronous generators supply a loadthrough a 6-pulse diode-bridge rectifier. The synchronous reactances is in the range 2.5-5.5 pu.
The system under research is two particular types of synchronous generators used onboard twodi�erent tugships with diesel-electric, variable speed propulsion DC-system, where the electricalinstallation is called BlueDrive +C and is delivered by Siemens. The generators di�ers in bothrange of generator parameters and performance.
One of the tugships studied uses generators with a capacitance of 3333kVA, and has synchronousreactances is the lower layer of 2.5-5.5 pu, and is characterized as stable during operation. Theother ship uses generators with a capacitance of 1940kVA, and has synchronous reactances is theupper layer of 2.5-5.5 pu, and is characterized as unstable during operation.
The system consists of two generator sets, with two synchronous generators in each set. A bus-tieswitch separates the two generator sets. The generators is run by diesel engines that has thepossibility to run at variable speed to obtain an e�cient operation of the system. Using thistechnology, the system losses, costs and emissions is reduced significantly.
With the opportunity to work in both parallel and in singular operation, the generator set feedsa DC-bus through diode-bridge rectifiers. The DC-bus has the ability for battery connection toachieve redundancy. The thrusters is supplied by the DC-bus through inverters. The BlueDrive+C system is shown in a one-line diagram in Fig. 2.1 below.
5

CHAPTER 2. SYSTEM DESCRIPTION
Figure 2.1: One-line diagram of the studied electric system delivered by Siemens, called BlueDrive+C. Theelectric system is used in tug-ships with diesel-electric propulsion systems. A bus-tie switch separates the twogenerator-sets, that feed the dc-bus through diode-bridge rectifiers. A battery is connected to the DC-bus toachieve redundancy. The main motors are supplies by the dc-bus through inverters.
The two synchronous generators under study in this thesis is used in two separate tug-ships.Both ships have the same design what matters the electrical system shown in Fig 2.1 above. Thegenerators themselves however, are unique. They di�er in both design, rated power and valuesof reactances, as well as in behavior during operation.
A stable operation of the ship using the 1940kVA generator type in the BlueDrive +C system isnot possible at this time, without doing some enhancements of the electric system. Oscillationsis found in the output voltage, current and power, indicating oscillations also in rotor angle, inthe synchronous generator, as analyzed in [6]. The oscillations have a frequency of around 2Hz. A transient voltage increase is also detected in the generators on the ship where instabilityis detected, which has been seen in measurements taken onboard the ship, conducted by thevoltage regulator supplier [6].
The use of thyristor-rectifiers has been shown to be an e�ective, but temporary, solution toprevent instability for this particular ship using the 1940kVA generators. As mentioned earlier, a
6

diode-bridge rectifier is originally the type of rectifier used in the electric system on the ship. Thegenerators used on this ship where instabilities is observed, has the highest values of reactancesof the two generator types studied in this thesis, in the upper range of 2.5-5.5 pu. The generatorsused in this unstable operating ship, have an apparent power of 1940 kVA and will be referredto as G2 throughout this thesis.
On the ship where the other synchronous generator type is used, oscillations is also detected involtage, current and power output from the generators, but the oscillations is regulated down toa manageable level by the voltage regulators. However, this happens extremely slowly, which isundesirable. The oscillations have a frequency of around 2 Hz as well. This stable generatorsused on the ship has an apparent power of 3333 kVA, is of the salient-pole type and will bereferred to as G1 throughout this thesis.
The stability problems observed on the two ships increases in strength when the battery inattached to the DC-bus, powered from the generator-sets through the diode-bridge rectifier.When the battery is removed from the dc-bus, the output of the rectifier still oscillates. Thebattery used on the ship is of the lithium-ion type, and has a capacitance of 150A and a capacitorvoltage of 1030V, with a 9V voltage drop. Instability is detected on the ship that uses thegenerator G2 even when the ship operates with low load.
The 6-pulse diode-bridge rectifier-loaded synchronous generator system is strongly nonlinear andhas time-varying characteristics, which makes the problem deeply complex. This makes it harderto understand why the mentioned problem rises, as well as to evaluate it [7] [2].
7

CHAPTER 2. SYSTEM DESCRIPTION
8

Chapter 3
Summary of SpecializationProject During Fall 2014
The specialization project was conducted during the fall of 2014, as a result of the course TET4510at the Department of Electric Power Engineering at NTNU. The objective was the same as inthis thesis and a summary is presented here. The same system as presented in Chapter 2 wasunder study, and the system description is not repeated here. Measurements from the unstableship conducted by the AVR supplier is presented, as well as simulations done in DIgSILENTPowerFactory.
3.1 Measurements Taken Onboard the Unstable Ship
The supplier of the voltage regulator installed on the ship using the 1940 kVA generators, didmeasurements on the unstable ship in August 2014, at the time when the instability problemswere detected. The measurements were taken while one generator-set was operating in parallelon a fixed frequency, and the bus-tie switch was open, isolating the two generator-sets from eachother, looking at only one generator-set. A one-line diagram of the system is shown in Fig 2.1in Chapter 2, describing the electrical system.
The battery was not connected to the DC-bus, and the load during measurements was a mainlyactive test-impedance connected on the AC-side of the converter, due to the 6-pulse diode-bridgerectifier. In addition is a resistance of 3.3 � connected in series with the exciter field windingof the generators during the test. A brushless exciter supplies the DC field current of thegenerators. The VT is connected between phase C-B and the CT is connected on phase B forboth the generators in the generator-set [6].
9

CHAPTER 3. SUMMARY OF SPECIALIZATION PROJECT DURING FALL 2014
The voltage measurement used by the voltage regulator attached to the generator is retrievedfrom an extern winding coupled in parallel with the main winding on the stator inside thesynchronous machine. This is done to prevent the voltage measurements going to the voltageregulator to contain disturbances from an eventual pulsating load current. The voltage from thevoltage regulator is retrieved from a separate voltage transformer.
The test is conducted with three parameters in mind; the PID gain Kg in the AVR, the speed[RPM] and the setting of the voltage regulator [auto/manual].
The conclusion of the test is that the frequency and amplitude of the oscillations in voltage andcurrent measured from the generator-sets increases as the PID gain and speed is increased. Thesetting of the regulator also impacts the oscillations, in a decreasing manner, as shown in Fig3.1 below.
Figure 3.1: The measurement of current and voltage recordings of the two generators in the generator setunder operation at 1000 RPM with Kg = 40, with change of AVR mode from automatic to manual in one of thegenerators.
The graphs shown in Fig 3.1 shows, from the top: the RMS voltage measured through the VT,the current measured through the CT and the direct voltage measured over the exciter fieldresistance, for the two 1940kVA generators in the generator-set, respectively.
10

3.2. SIMULATIONS USING DIGSILENT POWERFACTORY
The graphs show that the frequency and amplitude of the oscillations in current and voltagedecreases as the setting of the AVR is changes from auto to manual mode for one of the generators.The AVR clearly impacts the stability of the generators. The amplitude of the power is notstudied, and the origin of the oscillations is not known. The measuring voltage to the regulatoris delivered from an auxiliary winding and the feeding voltage of the regulator is delivered froma separately VT.
The frequency of the oscillations when the generator runs at 750rpm (high load) is in the rangeof 1.756-2.366Hz, and when the generator runs at 1000rpm (low load) the oscillations has a widerfrequency-range than during high load, namely 1.171-2.68Hz [6].
Transient voltage increase in the terminal voltage of the synchronous generators on the shipusing the generator type G2 is experienced immediately after a load increase is introduced. Toexplain this, an analytical approach is provided in [6] and is found in Appendix A.1.
3.2 Simulations Using DIgSILENT PowerFactory
The system shown in Fig 3.2 below is based on the system found in [4], where the aim of thearticle was to decide whether or not high internal impedances in the generator can have the samee�ect of the stability of the synchronous generator as high external impedances have, such astransformer impedances and lines.
When high external impedances is present, the linearization constant K5
may become negative,which leads to a negative damping, resulting in an unstable operation of the synchronous gener-ator. The article showed that high internal impedances in the generator also can have this e�ecton the linearization constant K
5
, in the same way as high external impedances do.
The simulations in the specialization project conducted during the fall of 2014 had the same ap-proach as the article [4], and was motivated by the need to see how the large generator reactancesin the studied system on the ship impacts the stability, with the same external impedances as in[4]. The parameters of the lines and transformers is given in Table B.1 in Appendix B, and theparameters for the generator is given in Table I.1 and Table I.2 in Appendix I. An external gridis connected to the system to model the battery in the ship.
11

CHAPTER 3. SUMMARY OF SPECIALIZATION PROJECT DURING FALL 2014
Figure 3.2: The model established in DIgSILENT PowerFactory is based on the system in [4] and simulationswhere the gain of the AVR, Kp was varied, was conducted in the specialization project during the fall of 2014[6]. The simulations was motivated by the need to study how high generator reactances impacts the generatorstability.
In [6], it is shown that the stability of the generators is a�ected by several factors; the operationof the generator in the system shown in Fig 3.2, meaning the consumption and production ofactive power/reactive power, the reactances of the generator and the value of the PID gain Kp
in the voltage regulator that directly impacts the linearization constant K5
.
The movement of the critical eigenvalues of the 1940kVA and 3333kVA generators as a results ofvarying the gain, is shown graphically in the root locus plot in Fig 3.3 below.
12

3.2. SIMULATIONS USING DIGSILENT POWERFACTORY
Figure 3.3: This root locus plot shows the eigenvalues of G1 and G2 as a function of the gain in the AVR,directly a�ecting the linearization constant K5. The simulations is conducted for two di�erent types of operation;consumption and production of reactive power. In both cases G1 and G2 produces active power. When theeigenvalues move over in the positive half plane of real eigenvalues, the generators are considered unstable.
The root locus plot in Fig 3.3 above shows the eigenvalues of G1 and G2 as a function of thelinearization constant K
5
for two di�erent types of operation; consumption and production ofreactive power. In both cases G1 and G2 produces active power. The mode that oscillates witharound 2Hz is the mode of interest. When the eigenvalues move over in the positive half planeof the real eigenvalues, the generators is defined as unstable.
Fig 3.3 shows that when the gain Kp is increased in its value from 50 to 500, the generators G1and G2 gradually moves over to the positive half plane and becomes unstable. It is observed thatwhen the generators are consuming reactive power, this instability happens faster. G2 is moresensitive to the change in Kp both when producing and consuming reactive power, which is aninteresting observation due to the fact that G2 has higher reactances than G1. [6] concludes thathigh reactances, consumption of reactive power and high values of gain impacts the generatorstability in a negative manner.
13

CHAPTER 3. SUMMARY OF SPECIALIZATION PROJECT DURING FALL 2014
14

Chapter 4
Stability of Rectifier-LoadedSynchronous Generators
This chapter includes theory, literature studies, and relevant background information needed toconduct simulations and to evaluate them, with emphasis on stability of the system studied.Basic theory of stability and synchronous generator design is expected known.
The studied system in this thesis is a synchronous generator with high values of reactancesfeeding load through a diode-bridge rectifier, as shown in the simplified line diagram Fig 4.1below [8].
Figure 4.1: Synchronous generator feeding load through diode-bridge rectifier [8].
The theory presented in this chapter concerns the main components of the presented system.
15

CHAPTER 4. STABILITY OF RECTIFIER-LOADED SYNCHRONOUS GENERATORS
4.1 Six-Pulse Diode Bridge Rectifier Characteristics
The six-pulse diode bridge rectifier is calles "six-pulse" because the resultant voltage output fromthe input bridge is in the form of DC voltage with six peaks; one peak for each of the positive andnegative half cycles of the rectified three-phase input waveform, thus the term "6-pulse drive" [9].
On the ship under study, the battery connected to the dc- bus is supplied through the threephases, six-pulse diode bridge rectifier. The battery can be modeled as a large capacitor. Anapproximation to this system is shown in Fig 4.2a where the assumptions is that the dc-voltageis a constant dc. For simplicity, another assumption is made; the current id on the dc side ofthe rectifier flows discontinuously, so that only two diodes (one from the top three and one fromthe bottom three diodes) conducts at any given time. This results in the input voltage beingmade up by the line-to-line voltages seen in the top graph in Fig 4.2b, giving the resulting phasecurrent waveform in the bottom graph of Fig 4.2b [10].
(a) (b)
Figure 4.2: (a) Six-pulse diode bridge rectifier with a finite Ls and a constant dc voltage Vd. (b) The currentand voltage waveforms from the rectifier [10].
Power electronic equipment is a source of harmonic distortion in the current, as can be seen inthe current waveform in Fig 4.2b. The total harmonic distortion (THD) is defined as [10]:
THD = IH
IF=
I2
2
+ I2
3
+ ... + I2
n
IF=
ÛŒq
h=2
I2
h
IF(4.1)
for currents, where In is the RMS value of the harmonic n, and IF is the RMS value of thefundamental current. IH denotes the harmonic content of the fundamental current IF . Whenthe voltage or current is purely sinusoidal, there is no harmonic distortion and the value of THDis zero. The THD increases in value as the ratio [10]:
16

4.1. SIX-PULSE DIODE BRIDGE RECTIFIER CHARACTERISTICS
Ishort≠circuit
Id(4.2)
increases, where Id is the constant dc current and Ishort≠circuit is the short circuit current givenas [10]:
Ishortcircuit = VLL/Ô
3Ê
1
Ls(4.3)
An example of a distorted current with harmonic content is shown in Fig 4.3 below, where thecurrent has a pulsed nature is shown in Fig 4.3a from a three-phase diode rectifier in Fig 4.3b[9].
(a) (b)
Figure 4.3: (a) The typical pulsed nature of AC PWM drive input current waveform. (b) The three-phase diodebridge rectifier block diagram [9].
The pulsed nature of the input current is caused by the fact that the power only is drawn fromthe generator when the voltage in the DC-bus drops below the rectified voltage level [9].
Such waveforms in current can also be caused by a high degree of commutation angle in therectifier, which can be a result of a large generator inductance and heavy load current. Thiscauses three diodes to conduct at each time, resulting in interval series of the operating generator,where one generator line to line generator is zero, leaving the other two generator line to linevoltages being Vdc and ≠Vdc. The result is a square-shape in the voltage, and the current ischaracterized by "humps" in the waveform. This can be shown in Fig 4.4 below [8].
17

CHAPTER 4. STABILITY OF RECTIFIER-LOADED SYNCHRONOUS GENERATORS
Figure 4.4: The voltage can be characterized by a square-shaped waveform and "humps" can be spotted in thecurrent from the output of the generator feeding a diode-bridge rectifier, caused by high degrees of commutationangle in the rectifier [8].
The characteristics of these waveforms are also load-dependent; meaning that as the operatingpoint changes, the commutation angle varies and the waveforms obtain another shape. Morespecifically, the commutation angle decreases as the load decreases due to the decreasing outputcurrent and frequency. This results in a more sinusoidal waveform in both the current andvoltage, where the square-shape in the voltage waveform and the "bumps" in the current waveformdiminishes [8].
The average ideal dc voltage from the three-phase, full-bridge rectifier with zero commutationLs = 0, is calculated by Eq. 4.4 below [10];
Vd = 3Ô
2VLL
fi= 1.35VLL (4.4)
where:
Vd is the average dc voltage
VLL is the rms value of the line-to-line voltage
4.2 Undamped Oscillations in Synchronous Generators Feed-ing Load in Isolated System
Problems with small-signal stability can be a result of a machine with poorly damping propertiesof oscillations in the system. Small-signal rotor angle stability is often refried to a machines abilityto maintain stability when subjected to small disturbances, such as introducing a load or loss of
18

4.3. SYNCHRONOUS GENERATOR REACTANCES
load. When a machine is is connected to an infinite bus, the oscillations that occur in the systemcan be related to local or global modes. They di�er in range; local plant oscillation problems arerestricted to a small part of the system, for instance rotor angle oscillations in only one generator,while global problems reaches over large groups of generators.
The frequency of the oscillations in local oscillations is larger than the frequency of oscillationslinked to global problems. Usually, the local plant mode oscillations have frequencies in therange 0.7-2Hz, and may be related to rotor angle oscillations. The global stability problemsoften include inter area mode oscillations in the range 0.1-0.4Hz if the generators in large groupsoscillate each other, and 0.4-0.7Hz if only generators in one group oscillate each other [11] [4][12].
The system under study in this thesis is a generator that feeds load through rectifier, with theopportunity for battery-connection. This can be seen as a machine-infinite bus system, where thebattery models an infinite bus. Due to the fact that the frequency of the oscillations observed onthe ship is around 2Hz, a theory can be stated that local plant mode oscillations related to therotor angle is, or is a part of the problem, on the ship using the 1940kVA generators. Simulationson the system must be done to further investigate this statement.
4.3 Synchronous Generator Reactances
Table 4.1 below shows typical parameters for SG for both salient pole (hydraulic machines) andround rotor (thermal machines) design [13].
Table 4.1: Typical parameter values for salient pole and round rotor SG
Description Symbol Hydraulic Units [pu] Thermal Units [pu]
Synchronous reactance in d-axis Xd 0.6-1.5 1.0-2.3Synchronous reactance in q-axis Xq 0.4-1.0 1.0-2.3Transient reactance in d-axis X‘d 0.2-0.5 0.15-0.4Transient reactance in q-axis X‘q - 0.3-1.0Subtransient reactance in d-axis X“d 0.15-0.35 0.12-0.25Subtransient reactance in q-axis X“q 0.2-0.45 0.12-0.25
Table 4.1 can be used for finding missing parameters in the simulation models [13].
For typical generators used in hydropower, the generators can be modeled with complete damperwinding or with a damper cage. When the generator is modeled with a complete damper winding,the subtransient reactances has approximately the same value: X“d ¥ X“q, giving a ratiobetween them X“
q
X“
d
= 1. However, when the generator is modeled as a damper cage, there is abig di�erence between the subtransient reactances [5].
19

CHAPTER 4. STABILITY OF RECTIFIER-LOADED SYNCHRONOUS GENERATORS
An example is given in [5] for a hydropower generator (54MVA; cos„ = 0.95, 10.5kV; 600U/min,50Hz) where typical parameters is found in Table 4.2 below [5].
Table 4.2: Typical parameter values for a hydropower generator with round rotor and completedamper winding/(damper cage) (54MVA; cos„ = 0.95, 10.5kV; 600U/min, 50Hz) [5].
Description Symbol Value [pu]
Synchronous reactance in d-axis Xd 1.04 (1.04)Synchronous reactance in q-axis Xq 0.57 (0.57)Transient reactance in d-axis X‘d 0.23 (0.23)Transient reactance in q-axis X‘q 0.57 (0.57)Subtransient reactance in d-axis X“d 0.15 (0.15)Subtransient reactance in q-axis X“q 0.16 (0.44)
where it can be seen that X“d ¥ X“q when the generator is modeled with complete damperwinding, and that X“d << X“q when the generator is modeled with damper cage. X‘q = Xq
for the salient pole generator because the laminated rotor construction prevents eddy currentsfrom flowing in the rotor body, making the screening e�ect in the q-axis negligible [5] [12].
When oscillations occur in normally dimensioned synchronous generators, is the e�ect of theq-axis damper winding much more important than the d-axis damper winding. That is, thedamping cage only contributes to a small rotor angle oscillation [5].
By adding a quadrature-axis damper winding, a damping power is added that produces aninduced current in the damper windings that introduces a toque which tries to restore thesynchronous speed which of the rotor when the rotor speed di�ers from the synchronous speed,according to Lenz‘s law. Explicit damper windings is often mostly used for SG with salient poledesign, because round rotor designed SG have solid steel rotor bodies that provides paths foreddy current, that works in the same way as damper windings [12].
When damper windings is introduced on the q-axis, the screening e�ect in both the d- andq-axis becomes similar, resulting in a smaller q-axis reactance and that X“d ¥ X“q. This isthe reason why the subtransient q-axis reactance is larger for damper cage-designed generatorsthan for complete damper winding-designed generators, where the screening e�ect in the d-axisis stronger than in the q-axis, and we have that X“d < X“q [12].
4.4 Synchronous Generator with Variable Speed
When the diode-bridge rectifier loaded synchronous generator operates at variable speed, asis the case for the studied system on the ship, conventional methods for modeling the systemcannot be used. The frequency is not constant, but shifts to achieve optimal operation, and thus
20
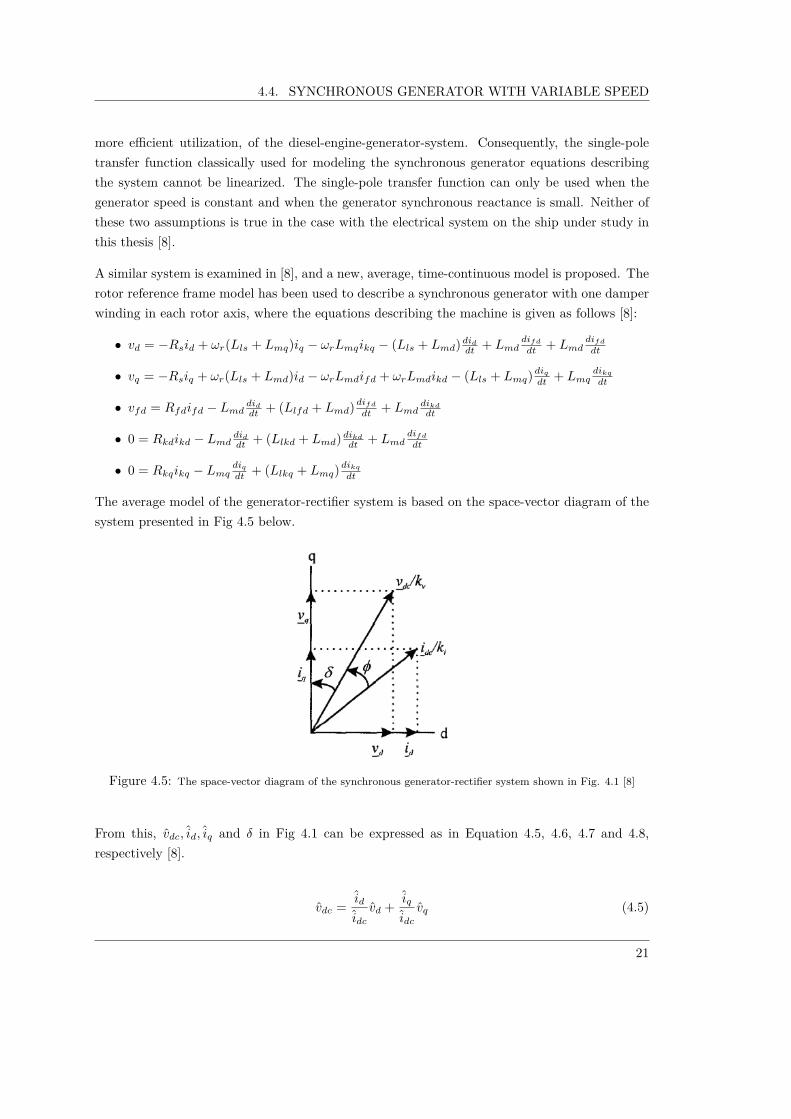
4.4. SYNCHRONOUS GENERATOR WITH VARIABLE SPEED
more e�cient utilization, of the diesel-engine-generator-system. Consequently, the single-poletransfer function classically used for modeling the synchronous generator equations describingthe system cannot be linearized. The single-pole transfer function can only be used when thegenerator speed is constant and when the generator synchronous reactance is small. Neither ofthese two assumptions is true in the case with the electrical system on the ship under study inthis thesis [8].
A similar system is examined in [8], and a new, average, time-continuous model is proposed. Therotor reference frame model has been used to describe a synchronous generator with one damperwinding in each rotor axis, where the equations describing the machine is given as follows [8]:
• vd = ≠Rsid + Êr(Lls + Lmq)iq ≠ ÊrLmqikq ≠ (Lls + Lmd) did
dt + Lmddi
fd
dt + Lmddi
fd
dt
• vq = ≠Rsiq + Êr(Lls + Lmd)id ≠ ÊrLmdifd + ÊrLmdikd ≠ (Lls + Lmq) diq
dt + Lmqdi
kq
dt
• vfd = Rfdifd ≠ Lmddi
d
dt + (Llfd + Lmd) difd
dt + Lmddi
kd
dt
• 0 = Rkdikd ≠ Lmddi
d
dt + (Llkd + Lmd) dikd
dt + Lmddi
fd
dt
• 0 = Rkqikq ≠ Lmqdi
q
dt + (Llkq + Lmq) dikq
dt
The average model of the generator-rectifier system is based on the space-vector diagram of thesystem presented in Fig 4.5 below.
Figure 4.5: The space-vector diagram of the synchronous generator-rectifier system shown in Fig. 4.1 [8]
From this, vdc, id, iq and ” in Fig 4.1 can be expressed as in Equation 4.5, 4.6, 4.7 and 4.8,respectively [8].
vdc = id
idc
vd + iq
idc
vq (4.5)
21

CHAPTER 4. STABILITY OF RECTIFIER-LOADED SYNCHRONOUS GENERATORS
id = idc
kisin(” + „) (4.6)
iq = idc
kicos(” + „) (4.7)
” = tan≠1
vd
vq(4.8)
Where the x denotes the average value of the variable x. The average model is shown to describethe reality well, and simulations using this model matches measured results from experiments. Itis found that when the load at the dc side of the rectifier is disconnected during experiments, thedc link voltage rises almost three times due to the large reactances of the synchronous generator.Due to some assumptions and simplifications done when producing the average model, someconditions must be satisfied if the model is to be used validly [8]:
• Generator harmonics other than fundamental deliver negligible power,
• losses in the diode rectifier are negligible,
• diode rectifier output is well filtered (large L or C or both)
The average model is based on the assumption that a complete power transfer happens at thefundamental frequency. The model is nonlinear, and can be linearized around a particularoperating point and the system transfer functions can be found, due to the fact that the modelis time-continuous [8].
4.5 Stability Criteria for Rectifier-Loaded Synchronous Gen-erators
An isolated power system denotes an independent system used in airplanes, oil drilling platforms,DG systems, electric vehicles and, focused on in this paper, ships. These examples are similar inthe fact that they all have restrictions in volume, space and weight. DC power supply consistingof synchronous generators and rectifiers is often used in such isolated power system because ofits e�ciency and high power density. Diode rectifiers is often used in stead of PWM rectifiersbecause they are more economic, have smaller volumes, has better electromagnetic compatibilityand has a high reliability [7].
The speed and torque of a propulsion load is regulated as constant by the variable-frequencyspeed regulation system, because the propulsion load generally behaves as a constant power
22

4.5. STABILITY CRITERIA FOR RECTIFIER-LOADED SYNCHRONOUS GENERATORS
load. This is however not always the case. This regulation can cause the isolated power systemto be unstable when the propulsion load does not behaves as a constant power load [7].
Several models for rectifier-synchronous machine systems is found in the literature. The studieddiode rectifiers-synchronous machine system in [7] experiences low-frequency oscillations whencritical parameters is applied. Parameters is denoted critical when a small change in value makesthe system unstable. [7] proposes equations of a periodic orbit model by using the trapezoidalintegration method. The model is established to increase the accuracy in the analysis of smallsignal stability of diode rectifier-synchronous machine systems. By using theoretical analysis andsimulation tests in PSCAD, the proposed model is shown to contribute to modeling and analyzeisolated power systems [7].
A stability margin index of the periodic orbit model describing the isolated system consisting ofa diode-rectifier-loaded synchronous generator studied in [7], is presented below [7];
Sm = 1 ≠ fl(M) (4.9)
where Sm is the stability index, giving a higher stability level the higher the stability index is.fl(M) is the spectral radius of the M matrix, given by: M = ˆZ2
ˆZ1which describes the Jacobian
matrix of the Poincar� mapping of the periodic orbit given as [7];
[X(T0
), ◊2
]T = „([X(0), ◊1
]T ) (4.10)
where [7]:
X(T0
) : state vector of the researched system at time T0
when s mall disturbance occurs
◊2
: position of SG rotor changes with in the period after small disturbance
„ : flux
X(0) : state vector of the researched system at time zero when s mall disturbance occurs
◊1
: rotor position of SG at the time a small disturbance occurs
where the discrete periodic orbit equations in found from the ParkÒs equations. It is showsthrough load-analysis that the stability index can reflect the level of stability of the systemstudied [14] [7].
[14] puts forth a model of a bridge rectifier-loaded synchronous machine connected to a d.c.-linkwith emphasis on the line-to-line short circuit in the commutation period of the rectifier, thatseparates the system from a regular synchronous machine. Basic equations are established and
23

CHAPTER 4. STABILITY OF RECTIFIER-LOADED SYNCHRONOUS GENERATORS
studies on the system is done, with emphasis on commutation reactance, phasor diagram, phasordiagram and basic characteristics. The analysis is based on Park‘s equations [14].
By dividing the two periods of the rectifier into commutation period and the normal conductingperiod, a commutation reactance is found for the SG during load. This reactance changes duringcommutation. If the reactance is assumed constant, it can be approximated by the equation [14]:
Xt = X“d + X“q
2 + X“d ≠ X“q
2 cos(2” + 2– + u) (4.11)
where [14]:
Xt : commutation reactance
X“d : subtransient d-axis reactance
X“q : subtransient q-axis reactance
” : phase lag of the armature voltage at on-load
– : controlled delay time
u : overlapping angle of the commutation
The first expression in Eq 4.11 is the classical expression for the commuation reactance, but thisdoes not take the the change in commutation into account. The second expression in Eq 4.11 istherefore added. Since the delay angle – is zero when the bridge rectifier consists of diodes, thecommutation angle Xt is approximately the same value as X“d in the middle of the commutationperiod, Xt ¥ X“d [14] [3].
Park‘s equations also forms the basis of the parametric average-value method of a rectifier cir-cuit in a synchronous-machine-fed rectifier system, presented in [15]. The method focuses oncontrollers based on frequency-domain characteristics and can be linearized around a workingpoint. To assume that the parameters in the AVM of a rectifier is independent of the operatingsituation can lead to great errors [15].
The averaging method is continuous and valid for large-signal time-domain studies, linearizationand small-signal impedance characterization for several operation conditions for the studiedsystem. Detailed simulations is done in MatLab/SimuLink and data is measured to verify theproposed model in both time and frequency domain [15].
[1] claims that for rectifier-loaded synchronous generators is not only the synchronous reactancesimportant as it is for regulator synchronous machines, but also the transient, subtransient reac-tances and the stationary operation influences the stationary operation, unlike a SG with a sti�AC-bus. For each period through the rectifier, a repeative starting process is created, that is
24
4.5. STABILITY CRITERIA FOR RECTIFIER-LOADED SYNCHRONOUS GENERATORS
the result from the subtransient behavior in the machine. A consequence of these non-sinusoidalcurrent- and voltage profiles can be large losses in the laminated core and windings inside themachine, which can cause oscillations in the torque in pace with the oscillations in the rectifier[1].
For these reasons can the operation of the rectifier-loaded synchronous machine even duringlow-speed operations be determined from the subtransient reactance [1].
When an active load is introduced, transient oscillations can occur as a consequent to the repet-itive process in the rectifier. The result is a periodic, impulse behaved current flow with largespeed-oscillations, that makes it impossible to have a normal operation of the system. A casewhere the introduction of a rectifier to a synchronous generator makes the voltage and currentoscillate, is investigated. [1]
Fig 4.6 shows an oscillating behavior in the voltage U and current I on the ac-side, the rotationsper minute n and the current through the rectifier Ig. Ut marks the time, where each time-distance represents 0.1s [1].
Figure 4.6: The voltage U≥ and current I≥ of a generator when a rectifier is introduced in the system, whereIg is the current through the rectifier and n is the rotations per minute [1].
Fig 4.6 shows that when a current Ig is conducted through the rectifier, the voltage and thecurrent starts to oscillate. These processes vary with the nature of the load, i.e., whether itis active or passive. The transient current also impacts the stability of the generator. Thewithstanding load has an impact on the transient current, and therefore also on the stability [1].
[1] proposes a stability criterion given by the equation:
25

CHAPTER 4. STABILITY OF RECTIFIER-LOADED SYNCHRONOUS GENERATORS
X‘qX‘d
Æ 2 (4.12)
and is built on the assumption that under certain conditions during the transient period, superpositioning, or an voltage increase can occur in the synchronous machine. This happens eventhough the excitation of the machine is constant, and both when the current is constant orincreasing. The result of this voltage increase is that the generator must be assigned an internal,negative resistance, and the operation becomes unstable [2] [1].
[1] proposes that oscillations that occur in the output voltage of a rectifier-synchronous machine-system is associated with physical oscillations on the rotor angle ”. By performing several testson the system, it is found that a field damping on the q-axis can reliably and seamlessly preventthe experienced transient oscillatory behavior of a synchronous generator with rectifier [16].
It is claimed by [3] that serious low-frequency current oscillations can occur in rectifier-loadedsynchronous generators, resulting in an unstable operation of the generator, although the gener-ator can operate stably without the rectifier.
A new stability criterion is presented in [3], which proposes that system stability is easier achievedwhen a short-circuited quadrature-axis winding is added to the rotor of a machine with diode-bridge rectifier and back-emf load. The criterion in [3] is obtained for small disturbances and isbuilt on the criterion given in [1] in Eq. 4.12. The stability criterion for round-rotor generatorswith a short-circuited q-axis rotor winding is given in the following equation: [3]
1Xq
+ 1X‘q
Ø 1X‘d
(4.13)
with the assumption that usually X“q << Xq, X“d < Xd is true. By assuming that X‘q < Xq,the stability criterion in Equation 4.13 can be compared with the stability criterion in [1], givenin Equation 4.12, where [3] concludes that the criterion given in Equation 4.13 is easier to fulfill.The assumption made to obtain this criterion, is that the commutation angle µ = 0, rotor velocityÊ = constant, a short-circuited q-axis winding exists on the rotor and that the disturbance issmall. In a practical meaning, when a short-circuited q-axis winding is added to the rotor,the value of the sub-transient reactance in the q-axis reduces significantly. The problems withlow-frequency current oscillations can be solved [3].
This is shown through experimental results, where the required critical resistance is less for whenthe q-axis winding is open-circuited than when the q-axis winding is closed on an inductor, butif the q-axis winding is short-circuited, the system can meet the stability criterion for the wholeload range, even if the dc-side series resistance is zero [3].
[8] presents a simplified model of a three-phase, variable-speed synchronous generator-diodebridge
26

4.6. MODIFIED STABILITY CRITERION BY SIEMENS
rectifier system. The studied system experiences non-sinusoidal voltages and currents in the ac-output from the generator due to the fact that in variable-speed stand-alone generators is theoutput impedance in the generator comparable to the load. The model presented is based onthe assumption that the generator can not be modeled with a single-pole transfer function whenthe synchronous reactance is large and the generator-speed is not constant. [8]
4.6 Modified Stability Criterion by Siemens
Siemens in Hamburg, [2], proposes three di�erent modifications to a stability criterion originallypresented in [1] and [16]. With the use of vector diagrams of both the stable and transientoperation of the system, is the stability criterion solved for three di�erent situations of operation.The stability criterion found in [1] is given in Equation 4.12 and is based on the assumption thatoscillations in generator output origins in oscillations in the rotor angle.
Such oscillations in the rotor angle is di�cult to discover in a practical meaning. Attempts todetect this rotor angle oscillations is been made by simulations [17], using various values forrotor inertia. Even when the value of the inertia is infinitely high, the voltage oscillations on thegenerator output is still present. Based on this, the assumption can be made, that the voltageoscillations is created through the transient currents [2].
To investigate the presented assumption, an equivalent circuit of the rectifier-synchronous ma-chine system, and is shown in Fig 4.7 below.
Figure 4.7: Simplified equivalent circuit of the studied system [2].
where [2];
X‘ is the ohmic, transient resistance representing the essential neglected impact, given in d- andq-components
Up is the stationary source voltage
U ‘p is the transient voltage
I‘ is the transient current given in d- and q-components
27

CHAPTER 4. STABILITY OF RECTIFIER-LOADED SYNCHRONOUS GENERATORS
By using this circuit as a basis, it can be examined if the transient voltage U ‘p, with respectto the stationary source voltage Up, is changed when a transient current I‘ occurs. The vectordiagram of this equivalent circuit can be made, and is shown in Fig 4.8 [2].
Figure 4.8: The vector diagram given from the simplified equivalent circuit of the studied system [2].
From Fig 4.8 it can be seen that the start of the transient period depend on X‘(Xd, X‘q), I‘(I‘d, I‘q)and Up, and if U ‘p is bigger or equal to Up. From this, we can say that stability appears when[2]:
| U ‘p |Æ| Up | (4.14)
Which is the case when the transient current I‘ does not increase the voltage Up. When thetransient current increases the voltage Up, instability appears: [2]:
| U ‘p |>| Up | (4.15)
By combining Eq. 4.14 and the equation
28

4.6. MODIFIED STABILITY CRITERION BY SIEMENS
U ‘p =Ò
(Up ≠ X‘dI‘d)2 + (X‘qI‘q)2 =ııÙU2
p ≠2X‘dI‘dUp + X‘2dI‘2d + X‘2qI‘2q¸ ˚˙ ˝Must be Æ0 to avoid voltage increase
(4.16)
a general stability criterion is given by:
X‘2dI‘2d + X‘2qI‘2q ≠ 2X‘dI‘dUp Æ 0 (4.17)
As Eq. 4.17 shows that the stability of the rectifier-synchronous generator system depends notonly on the transient reactance X‘ and the transient current I‘, but also on the stationaryoperating point. The value of Up depends on the excitation of the generator.
The conclusion can be drawn, that the stability criterion is equally dependent on both thetransient current I‘ and the change made in generator excitation. Because of di�erences in timeconstants, will the transient current I‘ change faster than the excitation current. Experiencesfrom the ships in operation shows that the oscillations that leads to instability problems in thesystem can not be eliminated or dampened by controlling the excitation current [2] [17].
This implies that, to improve the stability of the system, an option is to control the transientcurrent I‘. Another option is to use controlled rectifiers like thyristor- or IGBT-rectifiers, becauseof their low deadtime, that is lower or equal to the transient time constants of the generator,which also has shown to be true in praxis [2].
Even though the generators under study is characterized with high values of reactances, the sta-bility criterion in Eq. 4.17 shows that there is not only these reactances, Xd, Xq, that influencesthe stability of the rectifier-synchronous machine system. Also the stationary operating pointinfluences the stability [2] [17].
4.6.1 Evaluation of the stability criterion
To evaluate the stability criterion in Eq. 4.17, two vector diagrams for both steady state (Fig.4.9) and transient operation (Fig. 4.10), is used.
The steady state operation is studied to estimate the terminal voltage Up and the rotor angle ”.It is important to estimate the rotor angle to decide the location of the rotor (in d-q coordinates)relative to the stator winding (in a-b coordinates). To do so, the assumption cos„ = constant =0.9...0.95 is made. This is a reasonable assumption because the angle is only weakly dependenton the load because of the diode rectifier. The steady state operation can be found through thesteady state terminal voltage ULM and the steady state phase current I [2].
29

CHAPTER 4. STABILITY OF RECTIFIER-LOADED SYNCHRONOUS GENERATORS
Figure 4.9: The vector diagram of the studied system in steady state [2].
To estimate the steady state voltage Up, the following evaluations from the steady state vectordiagram in Fig 4.9 is made:
• cos„ = cos„ú and „ú = cos≠1„
• Ua = ULM cos„ = ULM cos„ú
Ub = ULM sin„ú = ULM sin(cos≠1„)
• Xd,q = 2fifLd,q, where
Ld,q = Xd,q
2fifn
= xd,q
Zn
2fifn
• ‘ = ” + „ = ” + „ú = tan≠1( Xd
I+Ub
Ua
)
30
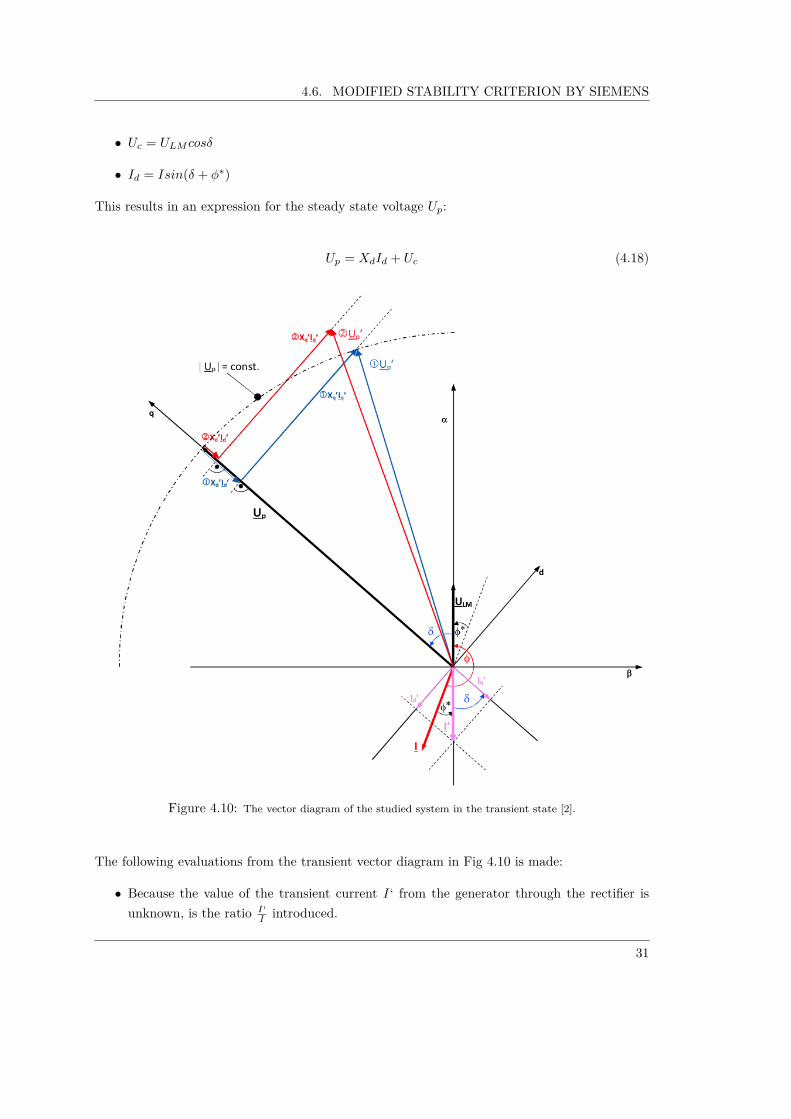
4.6. MODIFIED STABILITY CRITERION BY SIEMENS
• Uc = ULM cos”
• Id = Isin(” + „ú)
This results in an expression for the steady state voltage Up:
Up = XdId + Uc (4.18)
Figure 4.10: The vector diagram of the studied system in the transient state [2].
The following evaluations from the transient vector diagram in Fig 4.10 is made:
• Because the value of the transient current I‘ from the generator through the rectifier isunknown, is the ratio I‘
I introduced.
31

CHAPTER 4. STABILITY OF RECTIFIER-LOADED SYNCHRONOUS GENERATORS
The assumption that I‘ Ø I must be made, because the steady state current follows thetransient current through the rectifier
• The transient current I‘ is in phase with the assumed terminal voltage ULM , which impliesthat the transient current only flows in the a-axis.
• The transient currents I‘d and I‘q has the following ratio:
I‘d = I‘sin”
I‘q = I‘cos”
The stability criterion given in Eq. 4.14 can now be tested, now that all the components isknown.
4.6.2 Stability criterion evaluated for three di�erent operations
The stability criterion in Eq. 4.17 is evaluated to investigate three di�erent types of operation.In the following evaluations, the assumptions X‘q = X‘d and that X‘
q
X‘
d
= Xq
Xd
> 1 is used, becausethis is true for most synchronous machines. The assumption that I
I‘
= 1 is also used [2].
Both sides of Eq. 4.17 is multiplied with the expression 1
x2d
I2d
and solved by using the expressionsfor Up, Id, Iq, I‘d, I‘q, Xd, Xq, X‘d and X‘q found using the vector diagrams for steady state (Fig.4.9) and transient state (Fig. 4.10), we have that [2]:
X‘qX‘d
Æ I
I‘
AXd
Xq
sin(” + „ú)sin”
cos2”
B±
ııÙA
I
I‘
AXd
Xq
sin(” + „ú)sin”
cos2”+ cos(” + „ú)
cos”
B2
≠ tan2”
B
(4.19)
That forms the base for the three cases presented next.
Case A
With the assumption II‘
= 1, cos„ = cos„ú = 1, („ú = 0) :
X‘qX‘d
= Xq
X‘dÆ 1 + Xd
Xqtan2” +
Û11 + Xd
Xqtan2”
22
≠ tan2” (4.20)
With the assumptions in this case, it is obvious that the ratioship X‘
q
X‘
d
is not only dependent onthe machine parameters for stable operation of the diode rectifier-synchronous generator-system,
32
4.6. MODIFIED STABILITY CRITERION BY SIEMENS
but depends also on the rotor angle ” [2].
Case B
If in this case, ” ≠æ 0 in Eq. 4.20 and II‘
= 1:
X‘qX‘d
= Xq
X‘dÆ 2 cos„ú
¸ ˚˙ ˝cos„ = cos„ú
= 1
Æ 2 (4.21)
This is the expression that [1] and [3] also proposes. The di�erence between the expressionproposed in [1] and [2] is that [1] assumes an arbitrarily, small load. This is the opposite of whatis experienced in praxis with the generators with BlueDrive+C system, which all have the valueX‘
q
X‘
d
Æ 2 and is stable under operation, except from the non-salient pole generators [2].
Case C
With the assumptions cos„ = cos„ú = 1, II‘
= 1 and ” = 45:
X‘qX‘d
= Xq
X‘dÆ 1 + Xd
Xq+
Û1Xd
Xq
22
+ 2Xd
Xq(4.22)
With the assumptions presented in this case, it can be observed that the ratio Xq
X‘
d
only dependson the machine parameters. This may require an evaluation of generators with BlueDrive+Csystem with critical parameters.
Generators with non-salient poles ( Xd
Xq
¥ 1...1, 2) with the ratio X‘
q
X‘
d
= Xq
X‘
d
must be consideredcritical. This implies a smaller value of the ratio X‘
q
X‘
d
= Xq
X‘
d
for a non-salient pole generator thanfor salient-pole generators ( X
d
Xq
¥ 1, 5....2) [2].
33

CHAPTER 4. STABILITY OF RECTIFIER-LOADED SYNCHRONOUS GENERATORS
34

Chapter 5
Description of DIgSILENTPowerFactory Model
The models based on the model established in [6], and this work is a continuation on the studydone of the impact of the rectifier in the system. The model is based on the model found in [4]as explained and shown in Fig 3.2 in Chapter 3. By implementing a rectifier in the model is itpossible to study how the rectifier impacts the same system, with the same internal and externalimpedances as in Fig 3.2, to compare the stability of the two systems.
The parameters of the lines and transformers is given in Table B.1 in Appendix B, and theparameters for the generators are given in Table I.1 and I.2 in Appendix I. The voltage regulatorused is called ESAC8B and the block diagram and the parameter settings is shown in Fig E.1and Table E.1 in Appendix E. There is no governor added to the generator model.
A voltage source is connected to the system to model the battery in the ship. The rectifier chosenis of the rectangular PWM converter type, and is located in the end of the system, right beforethe position of the DC voltage source - the battery. This position is chosen to have a better basisfor comparison, due to the fact that the impedances is similar in this system as the one shownand described in Fig 3.2 in Chapter 3. The PWM converter model represents a self-commutated,voltage sourced AC/DC converter. The equivalent circuit of the converter is shown in Fig B.4in Appendix B. [18]
Two loads draws active power from the ac-bus, supplied by the generator. The loads have themagnitudes of 0.6MW and 0.01MW, respectively [4]. No reactive power is delivered through therectifier, the amount of reactive power produced by the generator is consumed by the rectifier.The system is shown in Fig 5.1 below.
35

CHAPTER 5. DESCRIPTION OF DIGSILENT POWERFACTORY MODEL
Figure 5.1: This one-line diagram shows the system considered in this K5-analysis, and is based on the systemin [4]. This study is a continuation of the work done in the specialization project conducted in the fall of 2014.
36
Chapter 6
Simulations in DIgSILENTPowerFactory
The simulations presented in this chapter is based on the model presented in Chapter 5, and isa continuation of the work in [6] presented in Chapter 3.
The same linear analysis as presented in Chapter 3 is made, where the PID proportional gain Kp
that directly impacts the linearization constant K5
is varied from 50 to 1000 for both generatorsG1 and G2. The mode of interest is the critical mode that oscillates at about 2Hz, and is foundusing the QR-method. The eigenvalues come in pairs, and are mirrored about the real axis. Onlythe eigenvalues in the positive half plane is considered. The system is defined as unstable whenthe real part of the eigenvalues becomes positive (Re[ 1
s ] > 0).
A K5
- analysis is done and shown in a mode-plot for G1 and G2 in Figure 6.1 below. Thesimulations is done when the system is in two di�erent operating scenarios, one where the gener-ators are consuming and the other when the generators are producing reactive power of 2Mvar.In both cases, they produce active power of 14MW. The PID gain Kp of the voltage regulatorused called ESAC8B is varied in value from 50-500, and the eigenvalues oscillating around 2Hzis analyzed. When Kp is varied, the linearization constant K
5
is directly a�ected, The methodused for modal analysis is the selective modal analysis type.
The critical modes found in the systems in this simulation oscillated with a frequency of approx-imately 1Hz. The modes associated with the rotor angle phi oscillates usually with a frequencyof around 2Hz. To see what parameter the modes found in this simulation is associated with, areport for the eigenvalues in the system is made and the participation factors for the modes isexamined. The report, that is shown for both generators in Appendix B.2, shows what parame-ters the modes is associated with, and the participation factors. It also provides a bar chart in
37

CHAPTER 6. SIMULATIONS IN DIGSILENT POWERFACTORY
addition to the numerical values.
The eigenvalue-report from the modal analysis of the system is created when the gain Kp in thevoltage regulator connected to G1 and G2 is at a value of 500. Fig B.1 describes some of themost usual participation factors, and is found in Appendix B.2. The report shows two criticalmodes. Mode 8 oscillates with 1Hz and mode 10 oscillates with 0.05Hz.
The numerical values for mode number 10 shows that the parameters "avr ESAC8B; xi" and "G1;psie"/"G2; psie" (excitation-flux [pu]) is the parameters with the biggest impact. The numericalvalues for mode number 8 shows that the parameters "G1; phi"/"G2; phi" (rotor angle [rad]) and"G1; speed"/"G2; speed" (speed [pu]) is the parameters with the biggest impact.
It can be concluded that mode 10 oscillates due to faults in the voltage regulator and in theexcitation in the generator, but only with a very small frequency and is not of interest for theobject in this thesis. Mode 8 oscillates due to faults in the generator exclusively. Due to this,mode 8 is the mode of interest, and is chosen to represent the oscillations in the rotor angle, withthe speed as a participation factor as a consequence to the oscillations in the rotor angle.
The rotor locus plot in Fig 6.1 below shows the displacements of the eigenvalues associated tothe critical mode number 8, that oscillates at a frequency of 1Hz, as a result of the varying ofthe voltage regulator gain Kp.
38

Figure 6.1: This root locus plot shows the eigenvalues of G1 and G2 of critical modes oscillating with approxi-mately 1Hz. Two situations is considered, for the generators producing and consuming reactive power of 2Mvar.In both cases, the generator produces an active power of 14MW.
The root locus plot above shows that the eigenvalues of the critical mode will move to the rightin the plane due to a decreasing value in the real part of the eigenvalues, when the gain Kp inthe voltage regulator is increased in its value from 50 to 500. The varying of the gain Kp has adirect impact on the linearization constant K
5
, as explained in Chapter project. When the realpart of the eigenvalues become positive, the generators are considered unstable.
It can be seen that the generators moves faster towards instability when the generator consumereactive power rather than when they produce reactive power. It is remarkable that the generatorwith the smallest generator reactances (G1) moves faster towards instability than the generatorwith largest generator reactances (G2) does. This is the case for both operations. This was notthe case for when the rectifier is not included in the system, shown in Fig 3.3.
39

CHAPTER 6. SIMULATIONS IN DIGSILENT POWERFACTORY
40
Chapter 7
Description ofMatLab/SimPowerSystems Model
Siemens in Trondheim, [17] has through simulations in the simulation tool MatLab/SimPowerSystemsmade successful attempts to imitate the problem experienced. The model developed is a instan-taneous value model, and is the same model mentioned in section 4.6 in Chapter 4.
Two models is created from this model developed by Siemens Trondheim, one with the values forthe synchronous generator reactances from G1 and one with the reactances from G2, respectively.The SG with the highest values of reactances, G2, is unstable in the simulations and has anapparent power of 1940 kVA. The other generator, G1 is stable and has an apparent power of3333 kVA.
The test circuit shows the SM being used as a generator, the terminal voltage is controlled usinga simple PID voltage regulator, and the speed is controlled using a simple PI governor. Theoverall model has been initialized to start in periodic steady state to supply a load increasingup to about 1720kW. The generator have rotating field that operates towards an infinite largecapacitor with an inner resistance that represents the battery connected to the DC-bus in theelectric system on the ships [17].
The model used for the simulations in SimPowerSystems MatLab is shown in Fig. 7.1 below,where the SM is used as a generator, and the terminal voltage is controlled by an PID AVR andthe speed of the generator is controlled by a PI governor. The PID AVR type initially used inthe received model from Siemens is throughout the thesis called "AVR type A" to distinguishbetween this type and other voltage regulators investigated or discussed. The initial setting ofthe reference voltage value is set to 1.2, meaning that the regulator is to increase the terminalvoltage to 20% higher than the nominal voltage of the generator. A rectifier is connected to the
41

CHAPTER 7. DESCRIPTION OF MATLAB/SIMPOWERSYSTEMS MODEL
terminals of the generator, and is designed as a six-pulse three-phase rectifier consisting of threebridge arms each with two diodes.
The simulation shows the start-up characteristics of the generators, where the only event exceptfrom the generator start-up is in form of the voltage regulator adjusting up the voltage. Thisup-adjusting of the voltage results in an increasing current into the infinite capacitor with sti�DC-voltage that represents the battery.
Figure 7.1: The model used in the simulation tool SimPowerSystems
The block diagrams for the governor, exciter and regulator can be found in the Appendix, inFig C.1, C.2, C.3 and C.4, for G1, and in Fig D.1, D.2, D.3 and D.4, for G2, respectively. Theparameters for the exciter generators is found in Table C.1 for G1 and in Table D.1 for G2. Thedata for the generators are found in Appendix I. The generator parameters for the 3333kVAgenerator 1940kVA generator is shown in Table I.1 and Table I.2, respectively. The parametersfor the components rectifier, battery-arrangement and Resistor4 is found in Appendix F. Theparameters for the two generators G1 and G2, as well as the other components used in the originSimPowerSystems model are obtained from the model received from Siemens in Trondheim, [17].
The generator-block is from SimScape and the machine equations is based on Park’s transfor-mation to the rotating reference frame with respect to the electrical angle [19].
The generator feeds a battery C1 through the rectifier, and the connection between the system inFig. 7.1 and this battery is shown in Fig. 7.2 below, where the system in Fig. 7.1 is representedby the box named "Gen1" to the left. The two connection ports "P" and "N" shown in Fig 7.1 isthe same ones that is shown to the left in Fig 7.2 below.
42

Figure 7.2: One line diagram showing how the generator is connected to the battery C1 and an active load inthe model in SimPowerSystems
The battery C1 is the infinite capacitor and is connected in series with a resistor, and theopportunity for connecting load resistance in parallel through a circuit breaker is shown to theright. The load can be added to the model after an optional number of seconds, by setting thedesired number of seconds in the circuit breaker.
The solver function used throughout the simulations in this thesis is the ode45-solver, which isa non-sti� problem type, with a medium order of accuracy. This solver is the solver that canbe used in most situations according to the help-function in SimPowerSystems [20], and should,quote: "be the first solver you try".
If the problem simulated is sti� and not non-sti�, this solver can still be used, but will be slow.Another solver can then be used, and it is suggested by [20] to switch solver from ode45 to ode15.
The simulation of the generator start-up can be of optional length, but is usually limited to 20seconds, to examine the stability of the generator. Some simulations is extended to 50 secondsto observe the voltage regulator response time, but this is an absolute maximum simulation timefor the dynamic, non-sti� solver used.
Simulations that exceeds this time limitation should not be implemented, because numericalinstability might occur, which means that the mathematical equations which the simulation toolis based upon can not handle long time aspects. The algorithms in the system can go unstable ifthe simulation is set too long. Simulations used for stability analysis is for this reason not longerthan 20 seconds.
When the generator stability is analyzed, several parameters is available from the generatoroutput. The load angle theta measured from the generator is given in rad and is calculated by:theta = tan≠1( E
d
Eq
). The load angle is also known as the rotor angle.
43

CHAPTER 7. DESCRIPTION OF MATLAB/SIMPOWERSYSTEMS MODEL
7.1 Model Verification
The model is tested with a constant, ideal voltage source feeding a load through the rectifier.The reason for this is to verify the model when none of the studied generators is applied. Thenominal voltage of the voltage source is set to 690V, and the parameters of the battery, Resistor4and rectifier is found in Appendix F. The voltage after the rectifier should according to theoryfound in Chapter 4.1 be: Vdc = 3
Ô2V
LL
fi = 1.35 ú 690V = 931.5V .
Load attached on dc-side of the rectifier
The generator start-up of the voltage source feeding load through rectifier is first simulated,without battery. The resistance connected to the dc-side of the rectifier is set to be RLoad =2.122� which corresponds to an active load with magnitude PLoad = V
dc
RLoad
= (931.83V )
2
2.122�
=0.41MW . It is connected 3 seconds into the simulation. The mean voltage on the dc-side of therectifier is shown in Fig 7.3 below.
Figure 7.3: The mean dc-voltage for the SimPowerSystems model with constant voltage source and PLoad =0.41MW and no battery connected to the dc-bus.
The mean dc-voltage shows a voltage of 931V after the rectifier, and corresponds to theory foundin Chapter 4.1, as mentioned above. The voltage and current delivered from the terminals of thevoltage source is shown in Fig 7.4 below.
44

7.1. MODEL VERIFICATION
Figure 7.4: The current Iabc and rms voltage V abc for the SimPowerSystems model with constant voltagesource and PLoad = 0.41MW and no battery connected to the dc-bus.
The current is zero until the load is connected 3 seconds into the generator start-up simulation,at that point it raises to approximately 500A. The rms voltage shows 690V.
Battery and load attached on dc-side of the rectifier
The load is kept at the same value, but now the battery-arrangement is connected to the dc-bus.The voltage on the dc-side of the rectifier is shown in Fig 7.5 below.
Figure 7.5: The dc-voltage for the SimPowerSystems model with constant voltage source and PLoad = 0.41MWand a battery connected to the dc-bus.
The dc-voltage shows a voltage of 1030V before the load is connected at 3 seconds, and thedc-voltage drops to a value of 1000V. The nominal voltage of the battery is set to 1030V, andis the reason why the dc-voltage shows this value. The voltage and current delivered from theterminals of the voltage source is shown in Fig 7.6 below.
45
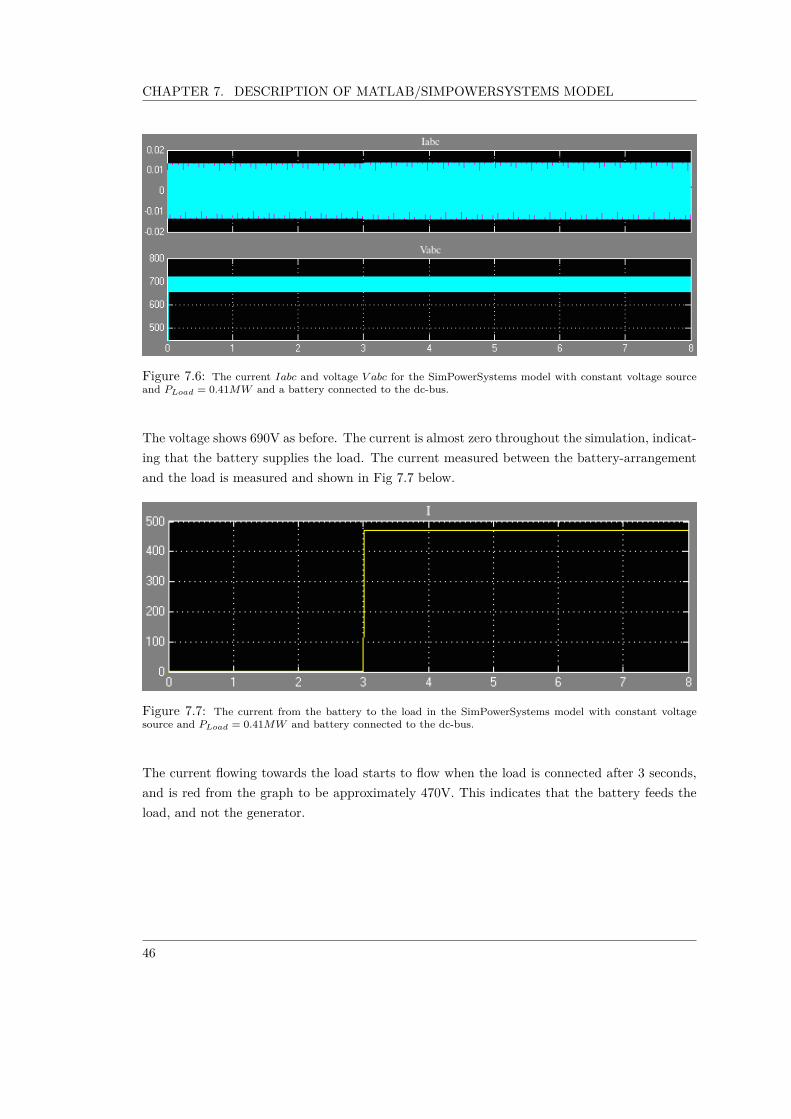
CHAPTER 7. DESCRIPTION OF MATLAB/SIMPOWERSYSTEMS MODEL
Figure 7.6: The current Iabc and voltage V abc for the SimPowerSystems model with constant voltage sourceand PLoad = 0.41MW and a battery connected to the dc-bus.
The voltage shows 690V as before. The current is almost zero throughout the simulation, indicat-ing that the battery supplies the load. The current measured between the battery-arrangementand the load is measured and shown in Fig 7.7 below.
Figure 7.7: The current from the battery to the load in the SimPowerSystems model with constant voltagesource and PLoad = 0.41MW and battery connected to the dc-bus.
The current flowing towards the load starts to flow when the load is connected after 3 seconds,and is red from the graph to be approximately 470V. This indicates that the battery feeds theload, and not the generator.
46

Chapter 8
Investigation of 3333 kVAGenerator System
The 3333kVA generator is characterized as a stable generator. According to the stability criterionpresented in [1], this generator should be unstable: X‘
q
X‘
d
= Xq
X‘
d
= 3.51 > 2. According to [2],this generator should be stable, because it is designed as salient pole, and can have a largervalue of the ratio X‘
q
X‘
d
= Xq
X‘
d
than for round rotor designed machines. The ratio Xd
Xq
for the3333kVA generator ( X
d
Xq
= 1.52) is in the right range compared with most salient pole designedsynchronous generators ( X
d
Xq
= 1.5...2). [2]
The ratio between the subtransient reactances in the q- and d-axis is: X“
q
X“
d
= 1.216. This shouldideally be as close to 1 as possible.
By using SimPowerSystems, the generator start-up is simulated, and the output values of G1,modeled as a salient pole synchronous generator, is shown in Fig 8.1 below. There is no loadconnected to the DC-side of the rectifier except from the battery-arrangement. The voltageregulator and governor is included in the model. The simulation is run for 10 seconds.
47

CHAPTER 8. INVESTIGATION OF 3333 KVA GENERATOR SYSTEM
Figure 8.1: 3333 kVA generator system output values, where: w is the rotor velocity in pu, ui
is the exciter field
voltage in pu, theta is the rotor angle in rad, udq
is the stator voltage in the d- and q-axis in pu, idq
is the stator current
in the d- and q-axis in pu, uabc
and iabc
is the rms terminal voltage in V and the terminal current in A, respectively.
From the top, Fig 8.1 shows the rotor velocity w [pu], the field voltage ui [pu], the rotor angletheta [rad], the stator voltage in the d- and q-axis udq [pu], the stator current in the d- andq-axis idq [pu], the terminal voltage uabc [V] and the terminal current iabc [A] of the 3333 kVAgenerator, respectively. The graph showing the field voltage ui contains of a pink and a yellowcurve, where the pink curve displays the field current and the yellow curve displays the fieldvoltage. The graphs showing udq and idq contains of two curves, one yellow and one pink. Theyellow curve is the d-axis for both voltage and current, and the pink is the q-axis for both voltageand current.
From the graph showing the output values of G1, it is observed that there is no oscillatingparameters, and the system is stable under these conditions. The voltage reference value isset to increase the terminal voltage to 20% above the nominal voltage of the generator. Thenominal voltage of the generator is 690V, so the regulator is supposed to regulate the voltage to1.2 ú 690V = 828V .
From the graph, the rms terminal voltage increases to a around 790V after a few seconds. This
48

is 38V below the theoretical value. The terminal voltage oscillates with a frequency of 62.5Hz.The current starts to flow after 2.5 seconds, indicating that the capacitor charges, because thereis no load attached.
The simulation results from the governor, voltage regulator and the exciter is shown in AppendixC.2.
The dc-voltage from the exciter feeding the generator field is shown in Fig. 8.2 below.
Figure 8.2: ef is the mean dc field voltage from the exciter generator feeding the generator field.
The dc-voltage from the exciter generator feeds the field of the 1940 kVA generator with 21Vwhen the reference value of the AVR is 1.2. The dc-bus voltage is shown in Fig 8.3 below.
49

CHAPTER 8. INVESTIGATION OF 3333 KVA GENERATOR SYSTEM
Figure 8.3: Vdc
is the dc-bus voltage after the rectifier.
The DC-bus voltage shows 1030V, before it increases a bit due to the charging of the largecapacitor. This almost corresponds to theory presented in Chapter 4.1 in Eq. 4.4, Vdc =3
Ô2V
LL
fi = 1.35 ú 790V = 1067V . This is a bit higher than the dc-voltage stated in Chapter 2,1030V. The capacitor voltage in the battery is also set to 1030V.
50

8.1. LOAD STEP ON DC-SIDE OF THE RECTIFIER
8.1 Load Step on DC-Side of the Rectifier
An active load RLoad is introduced 3 seconds into the generator start-up so see how the dynamicsof a stable generator behaves. The equivalent circuit of the system is shown in Fig. 8.4 below.The voltage regulator with a reference value of 1.2 and the governor is included.
Figure 8.4: The system after the generator-rectifier-arrangement consists of a battery modeled by a series resistance
Rbattery
and a capacitor with significant value Cbattery
. A resistance Rload
is placed in parallel with the battery and
is adjustable.
The rms terminal voltage and terminal current is studied, and the RLoad is varied. First, the loadis set to be a step of 0.5MW, which is a load step of 15% of the generator capacity (3.333MW).The resistance load is calculated by Rload = V 2
P . Since the voltage is 1030V after the rectifier,0.5MW corresponds to a load resistance of RLoad = (1030V )
2
0.5MW = 2.122�. It is introduced after 3seconds and the voltage and current is studied.
Figure 8.5: 3333 kVA generator system output values, where uabc
is the rms terminal voltage and iabc
is the terminal
current. A load Rload
= 2.122� which corresponds to an active load of 0.5MW, and is introduced 3s into the generator
start-up.
When a load of 0.5MW is introduced after 3 seconds into the start-up simulation, a current startsto flow. The rms terminal voltage value after 10 seconds is 780V. The frequency of the terminal
51

CHAPTER 8. INVESTIGATION OF 3333 KVA GENERATOR SYSTEM
voltage is 62.5Hz.
The load is increased to 1MW, which is 30% of the total generator capacitance. The resistanceload corresponds to Rload = V 2
P = (1030V )
2
1MW = 1.06�, and the voltage and current is studied.
Figure 8.6: 3333 kVA generator system output values, where uabc
is the rms terminal voltage and iabc
is the terminal
current. A load Rload
= 1.06� which corresponds to an active load of 1.0MW, and is introduced 3s into the generator
start-up.
A swell is observed in the current after 3 seconds, and a corresponding dip in the voltage at thethe time when the load is introduced. The rms terminal voltage value after 10 seconds is 780V.
The load is increased to 1.5MW, which is 45% of the total generator capacitance. This is a largeload step. The resistance load corresponds to Rload = V 2
P = (1030V )
2
1.5MW = 0.707�, and the voltageand current is studied.
Figure 8.7: 3333 kVA generator system output values, where uabc
is the rms terminal voltage and iabc
is the terminal
current. A load Rload
= 0.707� which corresponds to an active load of 1.5MW, and is introduced 3s into the generator
start-up.
The voltage regulator regulates the voltage to 760V after 10 seconds, and a dip is observed inthe voltage and a swell in the current when the load is introduced.
The load is now increased to 3MW, which is 90% of the total generator capacitance. Theresistance load corresponds to Rload = V 2
P = (1030V )
2
3MW = 0.354�, and the voltage and current is
52

8.2. INFLUENCE OF TERMINAL VOLTAGE VALUE ON AVR BEHAVIOR
studied in Fig 8.8 below.
Figure 8.8: 3333 kVA generator system output values, where uabc
is the rms terminal voltage and iabc
is the terminal
current. A load Rload
= 0.354� which corresponds to an active load of 3MW, and is introduced 3s into the generator
start-up.
A large swell is observed in the current and a drop in voltage. The rms terminal voltage valueafter 10 seconds is 720V when the load is 3MW.
The 333kVA generator is stable for loads. When the load is increased, the voltage regulator doesnot adjust the voltage at the required value of 828V. Even when the load is quite small, theregulator does not regulate the voltage at the requested value, but the value di�ers more fromthe requested voltage value when the load increases. The reference value of the AVR is studiednext.
8.2 Influence of Terminal Voltage Value on AVR behavior
The reference value of the regulator is decreased from 1.2 to 1, such that the regulator is toadjust the terminal voltage to the nominal voltage of the generator, instead of to 828V. Theterminal voltage and current is studied both when no load is attached, and when a load step isintroduced.
No load on dc-side of the rectifier
No load is attached on the dc-side of the rectifier, to only study the dynamics of the generatoras a function of the reference value of the voltage regulator, when the battery-arrangement isconnected to the dc-bus. The reference value of the AVR is set to 1.0.
53

CHAPTER 8. INVESTIGATION OF 3333 KVA GENERATOR SYSTEM
Figure 8.9: 3333 kVA generator system output values, where uabc
is the rms terminal voltage and iabc
is the terminal
current. No load is attached to the dc-side of the rectifier, and the reference value of the AVR is set to 1.0.
The voltage regulator regulates the generator voltage to the nominal voltage 690V, as it issupposed to do. The dc-voltage from the rectifier is studied in in Fig 8.10 below.
Figure 8.10: Vdc
is the dc-voltage after the rectifier, supplying the battery-arrangement. The reference value of the
AVR is set to 1.0.
The voltage on the dc.side of the rectifier is equal to the nominal voltage of the battery-arrangement, 1030V.
Load attached to the dc-side of the rectifier
A load is attached 3 seconds into the generator start-up, to study the dynamics of the generatoras a function of the regulator, battery and load, and to see how the voltage regulator adjusts theterminal voltage when the reference value is set to 1.0. The load is 1.5MW.
54

8.2. INFLUENCE OF TERMINAL VOLTAGE VALUE ON AVR BEHAVIOR
Figure 8.11: 3333 kVA generator system output values, where uabc
is the rms terminal voltage and iabc
is the
terminal current. A load Rload
= 0.707�, which corresponds to an active load of 1.5MW is introduced 3s into the
generator start-up, and the reference value of the AVR is set to 1.0.
The voltage settles at 690V when the reference value of the AVR is set to 1.0 and a load of1.5MW is connected 3 seconds into the generator start-up. The battery supplies the load thefirst few seconds, due to the fact that the current from the generator starts to flow first after 5seconds into the start-up. The load is increased to 3MW.
Figure 8.12: 3333 kVA generator system output values, where uabc
is the rms terminal voltage and iabc
is the terminal
current. A load Rload
= 0.354� which corresponds to an active load of 3MW is introduced 3s into the generator start-up,
and the reference value of the AVR is set to 1.0.
The current starts to flow at the moment the load of 3MW is attached, and the battery andgenerator sloth supplies the load. The voltage settles at 690V.
Next, the voltage and current is studied during no-load and during load when the voltage regu-lator is not included, to study the generator dynamics when it is not regulated.
55

CHAPTER 8. INVESTIGATION OF 3333 KVA GENERATOR SYSTEM
8.3 Without AVR Attached to the Generator
A constant DC-source with a voltage VDC = 21V excites the generator field when the voltageregulator and exciter is not present. The generator parameter output is studied both when noload is attached to the dc-side of the rectifier, and when a load is attached and varied.
No load on DC-side of the rectifier
The rms terminal voltage and terminal current is studied, when no load is attached to the dc-sideand no AVR regulated the terminal voltage of the generator.
Figure 8.13: 3333 kVA generator system output value during the generator start-up, where uabc
is the rms terminal
voltage and iabc
is the terminal current. The voltage regulator is not included, and no load is attached to the DC-side
of the rectifier except from the battery-arrangement.
When no voltage regulator is connected to the generator, and no load is attached to the dc-sideof the rectifier, the voltage still rises to a value of approximately 750V. The battery demands avoltage of 1030V, and the generator must raise the terminal voltage up to 800V to supply thebattery. If the dc-voltage must be 1030V, the terminal voltage must be: VLL = V
d
1.35
= 1030V1.35
=763V .
Load on DC-side of the rectifier
The rms terminal voltage and terminal current is studied, and the RLoad is varied. First, anactive load of 1.5MW, corresponding to a resistance of Rload = 0.707� is introduced 3 secondsinto the generator start-up simulation.
56

8.3. WITHOUT AVR ATTACHED TO THE GENERATOR
Figure 8.14: 3333 kVA generator system output value during the generator start-up, where uabc
is the rms terminal
voltage and iabc
is the terminal current. The voltage regulator is not included, and a load Rload
= 0.707� which
corresponds to an active load of 1.5MW is introduced 3s into the generator start-up.
After 4 seconds, the voltage value is 740V, but it decreases to a lower voltage value as the timepasses. The current also decreases. The reason can be that the battery is fully charged andpartly supplies the load in addition to the generator.
The load is increased to 3MW, corresponding to Rload = 0.354�, and is introduced 3 secondsinto the generator start-up simulation.
Figure 8.15: 3333 kVA generator system output value during the generator start-up, where uabc
is the rms terminal
voltage and iabc
is the terminal current. The voltage regulator is not included, and a load Rload
= 0.354� which
corresponds to an active load of 3MW is introduced 3s into the generator start-up.
When the load is increased to 3MW, the voltage decreases faster than when the load was 1.5MW,and the battery partly supplies the load. No instability is detected when the AVR is not attached,implying that the 3333kVA generator is not regulated to a stable operation by the AVR, but isstable on its own as well.
57

CHAPTER 8. INVESTIGATION OF 3333 KVA GENERATOR SYSTEM
8.4 Parameter Analysis; Generator Reactances
It is already mentioned that the ratio between the transient reactances is X‘
q
X‘
d
= Xq
X‘
d
= 3.51. Toassume X‘
q
X‘
d
= Xq
X‘
d
is a normal assumption for generators designed with salient pole. Accordingto the stability criterion presented in [1] this generator should be unstable, because the value ofthe ratio is larger than 2.0.
8.4.1 Study of Subtransient Reactances on Generator Stability
The ratio between the subtransient reactances is X“
q
X“
d
= 1.216. This should be an unstablegenerator according to classical theory, due to the 20% deviation from the ideal value 1.0, butthe 3333kVA generator is in fact stable, as shown both in the simulations in Chapter 8.1 and theobservations obtained on the ship using these type of generators.
However, the 3333 generator are poorly damped, and uses undesirably long time to stabilize aftera load step. For these reasons, the reactances is to be studied. The stability criterion proposedby [2] only take the transient reactances into account. The subtransient reactances is varied andthe impact of the stability will be analyzed.
First, the subtransient reactance in the q-axis is varied, while the other reactances is held con-stant. No load is attached on the dc-side of the rectifier except from the battery-arrangement.The result is shown in Table 8.1 below.
Table 8.1: Parameter analysis, impact of subtransient reactance in the q-axis, X“q, on thestability of the generator G1. The rest of the generator reactances is held constant. Voltageregulator and governor is included. No load is included except from the battery-arrangement.
Parameter Value [pu] Operation Frequency Comment
X“q 0.1 Stable - -X“q 0.3 Stable - -X“q 0.5 Stable - -X“q 0.6 Stable - -X“q 0.7 Stable - -X“q 0.8 Stable - -X“q 1.0 Stable - -X“q 1.5 Stable - -X“q 3.0 Stable - -X“q 4.0 Stable - -X“q 6.0 Stable - -
58

8.4. PARAMETER ANALYSIS; GENERATOR REACTANCES
The 3333kVA generator is stable for all values of X“q.
Now, the subtransient reactance in the d-axis is varied, while the other reactances is held constant.The value of the subtransient reactance in the q-axis is at its initial value. The result is shownin Table 8.2 below.
Table 8.2: Parameter analysis, impact of subtransient reactance in the d-axis, X“d, on thestability of the generator G1. The rest of the generator reactances is held constant. Voltageregulator and governor included. No load is included except from the battery-arrangement.
Parameter Value [pu] Operation Comment Frequency
X“d 0.1 Unstable Decreasing amplitude 1.64HzX“d 0.2 Stable - -X“d 0.05 Unstable Standing 0.75HzX“d 0.3 Stable - -X“d 0.4 Stable - -X“d 0.6 Stable - -X“d 0.8 Stable - -X“d 1.5 Stable High initial currents -X“d 2.0 Stable - -X“d 3.0 Stable - -X“d 4.0 Stable High initial currents -X“d 6.0 Stable High initial currents -
The 3333kVA generator is stable for all values of X“d > 0.1pu. This implies a stability criteriongiven as:
X“q
X“dÆ 5.91 (8.1)
The ratio with the reactances used in the 3333kVA generators is X“
q
X“
d
= 1.216, meaning thatthe generator has a relatively large stability margin. Typical ratios between X“q and X“d insynchronous generators with salient pole is 1.3 pu [13].
Now, the ratio between X“q and X“d is studied. The ratio is held constant X“
q
X“
d
= 1.216, butthe values of X“q and X“d is changed with the same factor. The result is shown in Table 8.3below.
59

CHAPTER 8. INVESTIGATION OF 3333 KVA GENERATOR SYSTEM
Table 8.3: Parameter analysis, impact of the ratio X“
q
X“
d
, on the stability of the generator G1,where the ratio is held constant. but the value of X“q and X“d is varied by a factor f . The voltageregulator and governor is included. No load is connected except from battery-arrangement.
ratio Factor f Operation Comment FrequencyX“
q
X“
d
1 Stable - -X“
q
X“
d
1.25 Stable - -X“
q
X“
d
1.5 Stable - -X“
q
X“
d
1.75 Stable - -X“
q
X“
d
2.0 Stable - -X“
q
X“
d
0.75 Stable - -X“
q
X“
d
0.5 Stable - -X“
q
X“
d
0.25 Stable - -
The generator is stable for all factors of X“q and X“d when the ratio between them is keptconstant X“
q
X“
d
= 1.216.
8.4.2 Study of Synchronous and Transient Reactances on GeneratorStability
The stability criterion presented in [1] and the transient reactances is to be further examined.According to this criterion, the ratio X‘
q
X‘
d
= Xq
X‘
d
should be less than 2.0. This is not the case;X‘
q
X‘
d
= Xq
X‘
d
= 3.51. Despite this, the 3333kVA generator is stable. If the stability criterion is tobe met anyway, either Xq must be decreased, or X‘d must be increased. Both cases is tried, andthe result is shown in Table 8.4 below.
Table 8.4: Parameter analysis, impact of fulfilling the stability criterion presented by [1] byvarying Xq or X‘d, on the stability of the generator G1. Voltage regulator and governor included.No load is connected except from battery-arrangement.
ratio Parameter Operation Comment FrequencyX
q
X‘
d
= 2 Xq constant, X‘d increased Stable - -X
q
X‘
d
= 2 X‘d constant, Xq decreased Stable - -
The generator is stable also when the stability criterion is fulfilled. The ratio Xq
X‘
d
is now increasedto a value higher than 3.51, to intentionally not fulfill the criterion, and to see if there is a stabilitylimit when Xq is increased or X‘d is decreased. The ratio between X
q
X‘
d
for the 3333kVA generatoris first set to be 6.0, and then 8.0. This is three and four times as large as the ideal value shouldbe according to [1], and larger than the real value 3.51. The result is shown in Table 8.5 below.
60

8.4. PARAMETER ANALYSIS; GENERATOR REACTANCES
Table 8.5: Parameter analysis, impact of increasing the ratio Xq
X‘
d
which is the stability criterionpresented by [1] by varying Xq or X‘d, on the stability of the generator G1. Voltage regulatorand governor included. No load is connected except from battery-arrangement.
ratio Value Operation Comment FrequencyX
q
X‘
d
= 6.0 Xq constant, X‘d decreased Stable - -X
q
X‘
d
= 6.0 X‘d constant, Xq increased Unstable after 10s - 1.2HzX
q
X‘
d
= 8.0 Xq constant, X‘d decreased Stable - -X
q
X‘
d
= 8.0 X‘d constant, Xq increased Unstable after 5s - 0.94Hz
By varying the transient reactance in the d-axis, the generator is still stable even though theratio X
q
X‘
d
is increased dramatically from 3.51 to 6.0 and 8.0. However, when Xq is increased,the generator becomes unstable with standing oscillations of frequency 0.94-1.2Hz. This canindicate that the q-axis synchronous reactance is more influential on the G1 stability than thed-axis transient reactance.
This is further examined by increasing the synchronous reactance in the q-axis while the otherconstants is held constant. The result is found in Table 8.7 below.
Table 8.6: Parameter analysis, impact of synchronous reactance in the q-axis, Xq, on the stabilityof the generator G1. Voltage regulator and governor included. No load is included except fromthe battery-arrangement.
Parameter Value [pu] Operation Comment Frequency
Xq 3.0 Stable - -Xq 5.0 Unstable After 10s 1.2HzXq 7.0 Unstable After 5s 0.94HzXq 3.5 Stable - -Xq 4.0 Stable - -Xq 4.5 Stable - -Xq 4.75 Stable Small oscillations -Xq 5.0 Unstable After 11s 1.2HzXq 4.85 Unstable After 12s 1.23Hz
The 3333kVA generator is stable when Xq < 4.85pu. Two stability criteria can be expressed forthe 3333kVA generator with salient pole by looking at the parameters found in Table 8.7:
Xq
X‘d< 5.7 Xd
Xq> 0.94 (8.2)
61

CHAPTER 8. INVESTIGATION OF 3333 KVA GENERATOR SYSTEM
Typical values for these ratios is [13]: Xq
X‘
d
= 2 and Xd
Xq
= 1.5. The actual values for these ratiosusing the actual generator parameters obtained from [17] is X
q
X‘
d
= 3.51 and Xd
Xq
= 1.52. Theratio X
d
Xq
is the same as for typical SG with salient poles.
The synchronous reactance in the q-axis impacts the stability of G1 with salient pole more thanthe transient and subtransient reactances in both q- and d-axis.
The synchronous reactance in the d-axis is now studied.
Table 8.7: Parameter analysis, impact of synchronous reactance in the d-axis, Xd, on the stabilityof the generator G1. Voltage regulator and governor included. No load is included except fromthe battery-arrangement.
Parameter Value [pu] Operation Comment Frequency
Xd 6.0 Stable - -Xd 7.0 Stable - -Xd 8.0 Stable - -Xd 9.0 Stable - -Xd 4.0 Stabil - -Xd 4.5 Stable - -Xd 3.0 Stabil - -Xd 2.0 Stabil - -Xd 1.0 Stabil - -
The generator has a stable start-up for any value of Xd. The operation of the G1 generator doesrely greatly on the synchronous q-axis reactance, but not on the synchronous d-axis reactance.
62

Chapter 9
Investigation of 1940 kVAGenerator With Salient Pole
According to [2] the 1940kVA generator type is unstable. It has round rotor, and a large ratioX‘
q
X‘
d
= Xq
X‘
d
= 9.78, which should have been less than 2.0 if it was to be stable according tothe stability criterion presented in [1]. It should be considered critical. The ratio between thesynchronous reactances is X
d
Xq
= 1.12 for the 1940kVA generator. Machines with salient poledesign is in the range X
d
Xq
1.5 ≠ 2 and round rotor machines is in the range Xd
Xq
= 1 ≠ 1.2. Inthis chapter, the generator is modeled as salient pole, and in that case the ratio X
d
Xq
is below thetypical ratio value for salient pole machines [2].
The generator start-up of the system with the generator G2, modeled as a salient pole syn-chronous generator, is shown in Fig 9.1 below. G2 is in reality a round-rotor machine, but ismodeled as salient pole in this chapter, to later compare the results found from this salient poledesign, to the round rotor design, and to discuss any di�erences. This is because the stabilitycriterions presented by [2] di�er on whether the generators are designed with salient-pole orround-rotor.
The voltage regulator and governor is included in the model, and no load is present at the DC-side of the rectifier except from the battery-arrangement. The reference value of the AVR is setto 1.2.
63

CHAPTER 9. INVESTIGATION OF 1940 KVA GENERATOR WITH SALIENT POLE
Figure 9.1: 1940 kVA generator system output values, where: w is the rotor velocity, ui
is the field voltage, theta is
the rotor angle, udq
is the stator voltage in the d- and q-axis, idq
is the stator current in the d- and q-axis, uabc
and
iabc
is the terminal voltage and current, respectively. No load is attached to the dc-side of the rectifier except from the
battery-arrangement.
From the top, Fig 9.1 shows the rotor velocity w, the field voltage ui, the rotor angle theta,the stator voltage in the d- and q-axis udq, the stator current in the d- and q-axis idq, the rmsterminal voltage uabc and the terminal current iabc of the 1940 kVA generator, respectively. Thegraph showing the field voltage ui contains of a pink and a yellow curve, where the pink curvedisplays the field current and the yellow curve displays the field voltage. The graphs showingudq and idq contains of two curves, one yellow and one pink. The yellow curve is the d-axis forboth voltage and current, and the pink is the q-axis for both voltage and current.
The rotor velocity w drops from 1 by 4% during the generator start-up, but quickly restores itsvalue back to 1 per unit, before the rotor velocity begins to oscillate when the generator getsunstable, around 5 seconds after start-up. The drop in rotor velocity in the first half second canbe caused by the sudden increase in field voltage, and the increase in rotor velocity is due tothe governor, that tries to regulate the velocity back to 1 pu. The rotor velocity continues toincrease, reaching for a value of 1 pu. The field voltage ui, the rotor angle theta, and the statorvoltage and current in the d- and q-axis also starts to oscillate around the same time.
The generator output parameters shown in Fig 9.1 oscillates with the same frequency of 2.3Hz.
64

The rms terminal voltage in the three phases a, b and c is measured from the plot to be around740V rms. It oscillates with a frequency of 66.67Hz, which is the rated frequency of the generator.
The current in the three phases a, b and c starts to oscillate in increasing "pulses". This oscillationis in direct ratio to the oscillation seen in the voltage in the three phases.
The supplier of the voltage regulator only measured the current of phase B and the voltagebetween phases C-B in the measurements done by the onboard the ship where instability isobserved. The reason for this, is given by [21] to be that this measurements are representativefor all three phases because all the phases is oscillating simultaneously, with 120 degrees phaseshift. To take a closer look at the current and voltage, and the ratio between the oscillationsin voltage and current, all the three phases of both the voltage and current is simulated and isshown in Fig 9.2 below.
Figure 9.2: 1940 kVA generator system voltage and current in all three phases a, b and c.
Where the top three graphs shows the voltage in phase a, b and c respectively, and the bottomthree graphs shows the system current in there three phases a, b and c. The pulsation of thecurrent starts at around 5 seconds after the start-up of the generator. This is, as mentionedabove, in direct ratio to what happens in the voltage in the three phases. The voltage in the
65
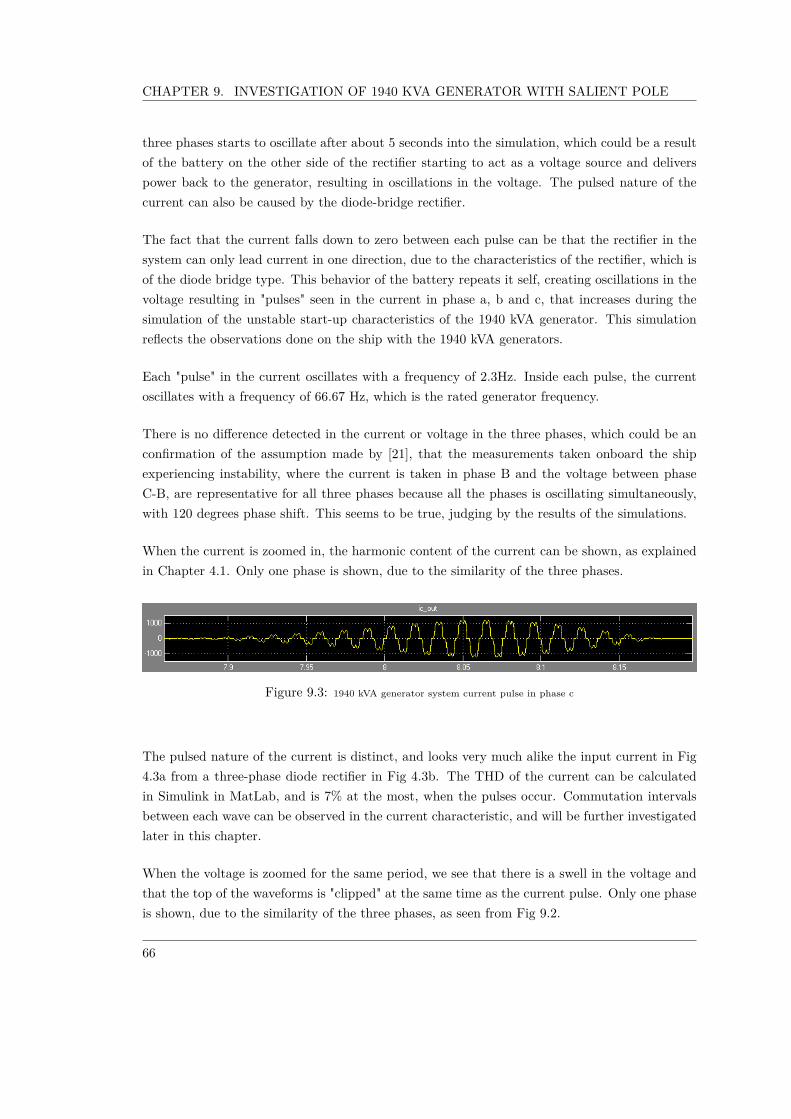
CHAPTER 9. INVESTIGATION OF 1940 KVA GENERATOR WITH SALIENT POLE
three phases starts to oscillate after about 5 seconds into the simulation, which could be a resultof the battery on the other side of the rectifier starting to act as a voltage source and deliverspower back to the generator, resulting in oscillations in the voltage. The pulsed nature of thecurrent can also be caused by the diode-bridge rectifier.
The fact that the current falls down to zero between each pulse can be that the rectifier in thesystem can only lead current in one direction, due to the characteristics of the rectifier, which isof the diode bridge type. This behavior of the battery repeats it self, creating oscillations in thevoltage resulting in "pulses" seen in the current in phase a, b and c, that increases during thesimulation of the unstable start-up characteristics of the 1940 kVA generator. This simulationreflects the observations done on the ship with the 1940 kVA generators.
Each "pulse" in the current oscillates with a frequency of 2.3Hz. Inside each pulse, the currentoscillates with a frequency of 66.67 Hz, which is the rated generator frequency.
There is no di�erence detected in the current or voltage in the three phases, which could be anconfirmation of the assumption made by [21], that the measurements taken onboard the shipexperiencing instability, where the current is taken in phase B and the voltage between phaseC-B, are representative for all three phases because all the phases is oscillating simultaneously,with 120 degrees phase shift. This seems to be true, judging by the results of the simulations.
When the current is zoomed in, the harmonic content of the current can be shown, as explainedin Chapter 4.1. Only one phase is shown, due to the similarity of the three phases.
Figure 9.3: 1940 kVA generator system current pulse in phase c
The pulsed nature of the current is distinct, and looks very much alike the input current in Fig4.3a from a three-phase diode rectifier in Fig 4.3b. The THD of the current can be calculatedin Simulink in MatLab, and is 7% at the most, when the pulses occur. Commutation intervalsbetween each wave can be observed in the current characteristic, and will be further investigatedlater in this chapter.
When the voltage is zoomed for the same period, we see that there is a swell in the voltage andthat the top of the waveforms is "clipped" at the same time as the current pulse. Only one phaseis shown, due to the similarity of the three phases, as seen from Fig 9.2.
66
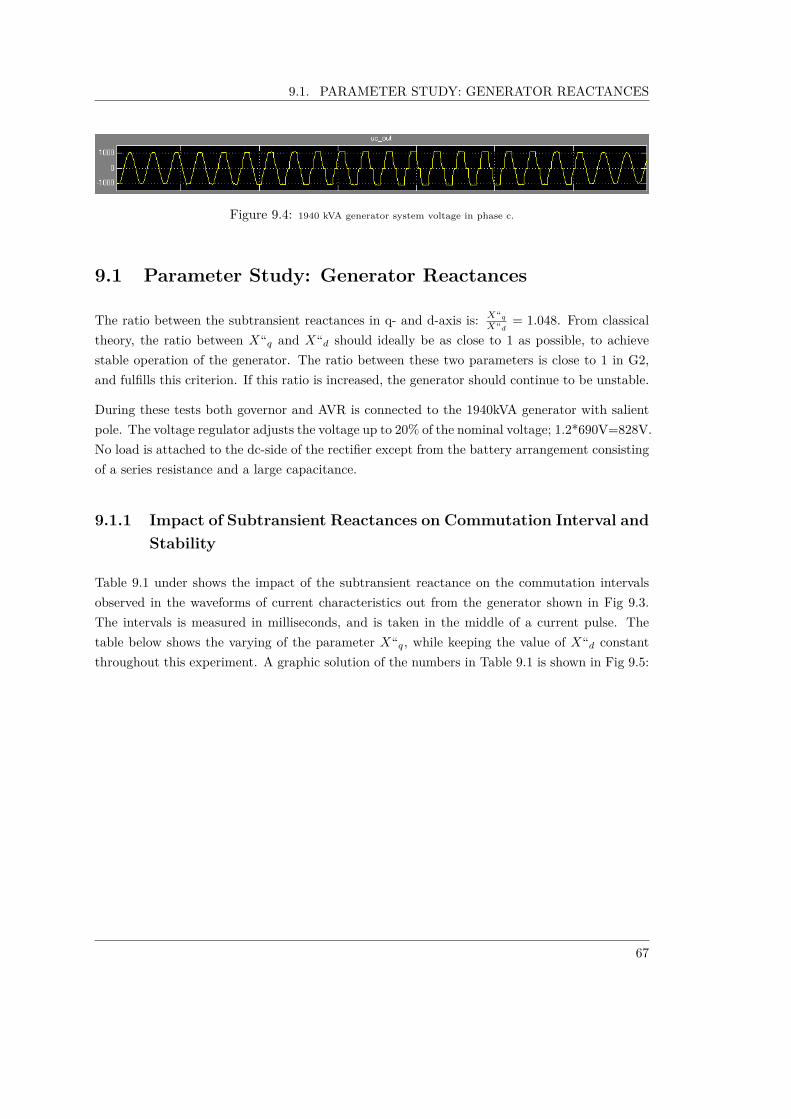
9.1. PARAMETER STUDY: GENERATOR REACTANCES
Figure 9.4: 1940 kVA generator system voltage in phase c.
9.1 Parameter Study: Generator Reactances
The ratio between the subtransient reactances in q- and d-axis is: X“
q
X“
d
= 1.048. From classicaltheory, the ratio between X“q and X“d should ideally be as close to 1 as possible, to achievestable operation of the generator. The ratio between these two parameters is close to 1 in G2,and fulfills this criterion. If this ratio is increased, the generator should continue to be unstable.
During these tests both governor and AVR is connected to the 1940kVA generator with salientpole. The voltage regulator adjusts the voltage up to 20% of the nominal voltage; 1.2*690V=828V.No load is attached to the dc-side of the rectifier except from the battery arrangement consistingof a series resistance and a large capacitance.
9.1.1 Impact of Subtransient Reactances on Commutation Interval andStability
Table 9.1 under shows the impact of the subtransient reactance on the commutation intervalsobserved in the waveforms of current characteristics out from the generator shown in Fig 9.3.The intervals is measured in milliseconds, and is taken in the middle of a current pulse. Thetable below shows the varying of the parameter X“q, while keeping the value of X“d constantthroughout this experiment. A graphic solution of the numbers in Table 9.1 is shown in Fig 9.5:
67

CHAPTER 9. INVESTIGATION OF 1940 KVA GENERATOR WITH SALIENT POLE
Table 9.1: Impact of X“q on the length of the commutation intervals observed in the currentwaveform. The length of the commutation intervals is measured in ms.
Parameter Value [pu] Length of interval
X“q 0.05 2.3 msX“q 0.1 2.19 msX“q 0.2 2.0 msX“q 0.3 1.58 msX“q 0.4 1.57 msX“q 0.5 1.49 msX“q 0.6 1.29 msX“q 0.7 1.21 msX“q 0.8 0.81 msX“q 0.9 0.6 ms
Figure 9.5: The graphic solution of the Table 9.1 shows the impact of X“
q
on the length of the commutation intervals
observed in the current-curve out from the generator G2.
The current-curve moves towards being more sinusoidal when the subtransient reactances in-creases, and the commutation intervals decreases in length. The voltage on the other hand, hasa more square-formed shape. The pulses in current out from the generator finds place later whenthe subtransient reactance is small, than when its value is increased.
When a SM is designed and build, there is usually several degrees of freedom when deciding theparameter value of X“q, but none when deciding X“d. This makes the subtransient reactance inthe q-axis possible to adjust. The ratio between the subtransient reactances in the q- and d-axis
68
9.1. PARAMETER STUDY: GENERATOR REACTANCES
should as mentioned earlier, ideally be as close to 1 as possible. When X“q is increased, but X“d
remains it value, the ratio will exceed this criterion, and the generator can become unstable.
This stability limit is examined by the use of iteration, and Table 9.2 below shows how the systemresponds in terms of unstable/stable, as a consequence to the varying of X“q. When instabilityis reached, the frequency of the oscillations is calculated and shown in the table. Because all theparameters oscillate with the same frequency, it doesn’t matter what parameter is used whenfinding the frequency, and the rotor angle theta is chosen. Only the first 20 seconds is consideredin this simulation, if standing or increasing oscillations in speed, rotor angle, voltage and currentis detected, it is considered unstable.
On the other hand, if small oscillations occur, but the generator stabilizes during the first 20seconds, the generator is considered stable. A comment to the operation of the generator isfound in the table. The curves in the graphs extracted from the simulations must be used as abasis for stability, and stability is decided by using the graphs.
Table 9.2: Parameter analysis, impact of subtransient reactance in the q-axis, X“q, on thestability of the generator G2. Voltage regulator and governor included. No load is includedexcept from the battery-arrangement.
Parameter Value [pu] Operation Comment Frequency
X“q 0.1 Stable - -X“q 0.4 Unstable Standing oscillations after 5s 2.6 HzX“q 0.2 Unstable Standing oscillations after 10s 2 HzX“q 0.15 Stable - -X“q 0.175 Unstable Oscillations after 5s, poorly damped 1.8 HzX“q 0.16 Stable - -X“q 0.165 Stable Poorly damped -X“q 0.17 Stable Very poorly damped -
From the table above, the value of the subtransient reactance in the q-axis must be X“q < 0.175pu
to achieve generator stability. From tho, a stability-criterion that must be fulfilled to achievestable operation of G2 with salient pole can be developed;
X“q
X“d< 0.48 (9.1)
From classical theory, this generator should now be unstable because X“
q
X“
d
<< 1.0, but thegenerator is stable under these conditions. This ratio is typically 1.3 for most synchronousgenerators with salient poles according to [13], and the stability criterion in Eq. 9.1 is very strictand maybe not realistic. In the 1940kVA generator, this ratio is 1.048 at this time.
The ratio X“
q
X“
d
is now studied once more, but this time both reactances is varied by the same factor
69

CHAPTER 9. INVESTIGATION OF 1940 KVA GENERATOR WITH SALIENT POLE
f , such that we can study the impact of varying both subtransient reactances while keeping theratio between them constant. To keep the ratio between the reactances constant, the reactancesis varied by the same factor. The governor and AVR is still attached, and no load is connectedexcept from the battery-arrangement on the dc-bus. The result is shown in Table 9.3 below.
Table 9.3: Parameter analysis, impact of the ratio X“
q
X“
d
, on the stability of the generator G2,where the ratio is kept constant but both reactances is varied with the same factor. Voltageregulator and governor included. No load is connected except from battery-arrangement.
ratio Factor Operation Comment FrequencyX“
q
X“d
1 Unstable - 2.6 HzX“
q
X“d
0.75 Unstable - 2.33 HzX“
q
X“d
0.5 Unstable - 1.86 HzX“
q
X“d
0.25 Unstable - 1.17 HzX“
q
X“d
0.1 Unstable - 0.424 HzX“
q
X“d
1.25 Unstable - 2.9HzX“
q
X“d
1.5 Unstable - 3.17HzX“
q
X“d
1.75 Unstable - 3.3HzX“
q
X“d
2 Unstable - 3.43
When the ratio X“
q
X“
d
is kept constant, but X“q and X“d is varied by the same factor, the generatoris still unstable. The frequency decreases as the parameters decrease in value, and increases asthe parameters increase in value. The oscillations also increases in amplitude as the parametervalues decreases or increases.
It is not accomplished to get a stable operation go G2 when the ratio is held constant and thesubtransient reactances is varied by the same factor.
9.2 RMS Values of Voltage and Current
The RMS values of the voltage and current in the three phases a, b and c is similar, and thevoltage for phase a and current for phase a is shown in Fig 9.6.
70

9.2. RMS VALUES OF VOLTAGE AND CURRENT
Figure 9.6: 1940 kVA generator system RMS values of the voltage and current in phase a.
The RMS value of the voltage is read to be approximately 740V. There is no distinct di�erencein either voltage or current in the three phases.
The simulation results from the governor, voltage regulator and the exciter is shown in AppendixD.2.
71

CHAPTER 9. INVESTIGATION OF 1940 KVA GENERATOR WITH SALIENT POLE
Figure 9.7: 1940 kVA generator system output values from the AVR, where ef
is the mean field voltage.
The mean value of the field voltage supplying the generator field is 21V, before it starts to oscillatewith approximately 2.5Hz. It is observed that the generator outputs and the DC voltage from theexciter starts to oscillate at the same time, and with the same frequency. Whether the generatoror the voltage regulator starts the instability is not known.
The dc-bus voltage on the dc side of the rectifier is shown in Fig 9.8 below.
72
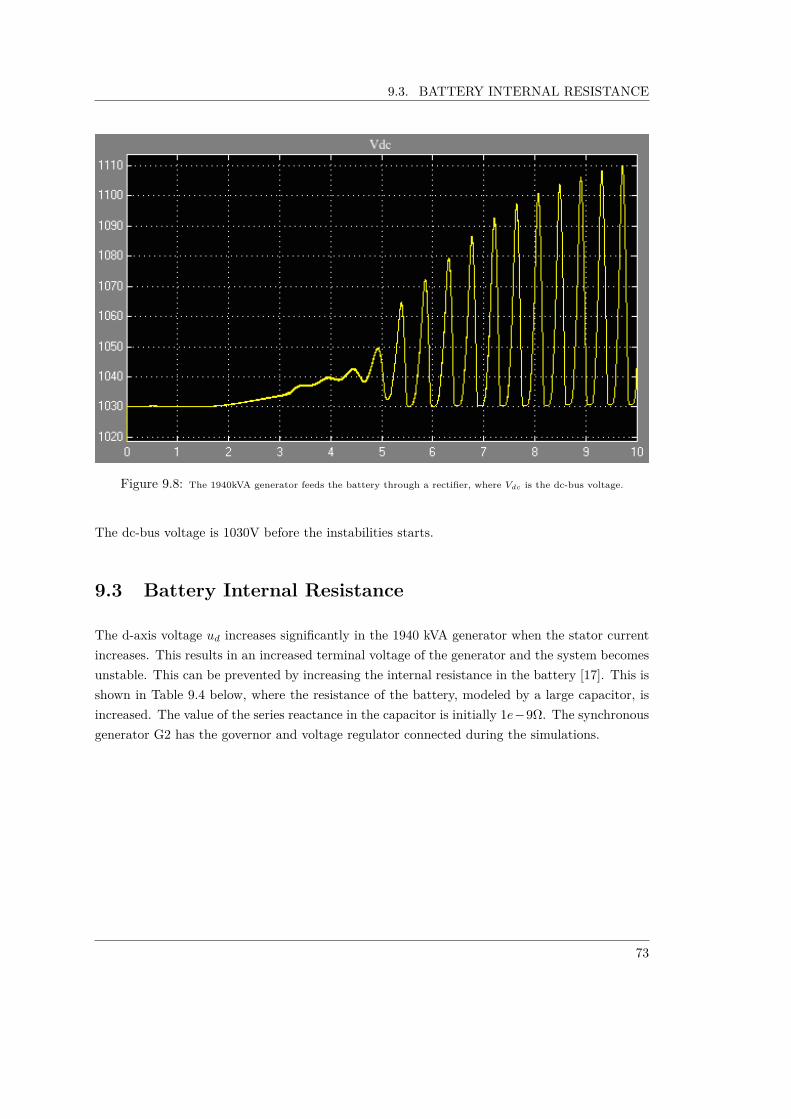
9.3. BATTERY INTERNAL RESISTANCE
Figure 9.8: The 1940kVA generator feeds the battery through a rectifier, where Vdc
is the dc-bus voltage.
The dc-bus voltage is 1030V before the instabilities starts.
9.3 Battery Internal Resistance
The d-axis voltage ud increases significantly in the 1940 kVA generator when the stator currentincreases. This results in an increased terminal voltage of the generator and the system becomesunstable. This can be prevented by increasing the internal resistance in the battery [17]. This isshown in Table 9.4 below, where the resistance of the battery, modeled by a large capacitor, isincreased. The value of the series reactance in the capacitor is initially 1e≠9�. The synchronousgenerator G2 has the governor and voltage regulator connected during the simulations.
73

CHAPTER 9. INVESTIGATION OF 1940 KVA GENERATOR WITH SALIENT POLE
Table 9.4: Parameter analysis; internal resistance of the battery, modeled by a large capacitor.
Parameter value [�] Operation Frequency DC-side Frequency AC-side Comment
r = 1 ú 10≠9 Unstable 2.6Hz 2.6Hz Standing oscillations after 4.5sr = 1 ú 10≠3 Unstable 2.5 Hz 2.5Hz Standing oscillations after 4.5s
r = 1.0 Stable - - -r = 0.1 Unstable 2.3Hz 2.3Hz Standing oscillations after 14sr = 0.25 Stable - - -r = 0.15 Stable - - -r = 0.12 Stable - - -r = 0.11 Stable - - Small oscillations after 16s
It is observed that the generator stabilizes when the internal resistance in the battery of thesystem is increased. The frequency of the output on the DC-side of the diode-rectifier is 2.3-2.6Hz when the system becomes unstable. The generator is stable if the internal resistance of thebattery is r > 0.1�.
The litium-ion battery is infinitely large and acts like a constant voltage source where the voltagedrop across is is considered very low. When the internal resistance in the battery is increasedas is done above, the voltage drop across the battery increased, and the losses thus increases.If the internal resistance is increased, this must be seen in a direct proportion to the increasedlosses over the battery. Such an increase as is done in this simulation may be unrealistic andunpractical in praxis.
9.4 Influence of Terminal Voltage Value
When the reference value of the regulator is changed, the voltage in the d- and q-axis of thegenerator changes characteristics. The initial reference value is 1.2, and the output from thegenerator G2 salient pole with AVR and governor attached is shown in Fig 9.9 below. No loadis attached to the dc-side of the rectifier, except from the battery-arrangement, where both theseries resistance and capacitance is at its initial value, 1e ≠ 9� and 2100F .
74

9.4. INFLUENCE OF TERMINAL VOLTAGE VALUE
Figure 9.9: 1940 kVA generator system voltage and current in d- and q-axis and the rms terminal voltage in phase
a,b and c when the reference value of the regulator is 1.2. The simulation time is 10 seconds and the gain of the avr is
39. Ud and Id is shown in the pink curves, and Uq and Iq is shown in the yellow curves.
The upper graph shows the voltage in the d- and q- axis, the graph in the middle shows thecurrent in the d- and q-axis, and the bottom graph shows the rms terminal voltage in phase a, band c. The yellow curve is the d-axis for both voltage and current, and the pink is the q-axis forboth voltage and current. From the graph, the rms voltage in the three phases is approximately740V before the generator goes unstable after about 5-6 seconds, when the reference value of theregulator is set to 1.2. The generator output value oscillates with a frequency of 2.6Hz.
When the reference value is set to 1.2, the voltage regulator should adjust the voltage out fromthe generator up 20% from the nominal rated voltage 690V. Then the line voltage should be740V
1.2 = 617V . This should ideally be 690V, but it seems as though the generator needs moretime to regulate the voltage up the the desired value.
Now, the reference value of the voltage regulator is increased from 1.2 to 1.4, and the outputfrom the generator G2 salient pole with AVR and governor attached is shown in Fig 9.10 below.
75

CHAPTER 9. INVESTIGATION OF 1940 KVA GENERATOR WITH SALIENT POLE
Figure 9.10: 1940 kVA generator system voltage and current in d- and q-axis and the rms line voltage in phase a,b
and c when the reference value of the regulator is 1.4. The simulation time is 8 seconds, and the gain of the avr is 39.
Ud and Id is shown in the pink curves, and Uq and Iq is shown in the yellow curves.
The upper graph shows the voltage in the d- and q- axis, the graph in the middle shows thecurrent in the d- and q-axis, and the bottom graph shows the rms terminal voltage in phase a.band c. The yellow curve is the d-axis for both voltage and current, and the pink is the q-axis forboth voltage and current. From the graph, the rms voltage in the three phases is approximately900V when the reference value of the regulator is set to 1.4. The voltage regulator should inreality have increased the voltage to 40% above the terminal voltage, 1.4 ú 690V = 966V .
The voltage changes character when this reference parameter is increased from 1.2 to 1.4. Thecharacteristics of the start-up of the generator is unstable, but changes to stable operation afterabout 5-6 seconds. The system oscillates with a frequency of approximately 2.6Hz in these first5-6 seconds. When the system goes stable, the voltage increases, and it might increase up tothe theoretical value 966V, but it has only reached 900V when the start up is simulated for 10seconds.
When the reference value is increased to 1.4, the peak voltage should be 1.4 ú 690V = 966V .This seems to be not the case out from the simulation in Fig 9.10, because the peak voltage isfound in this 10s-long simulation to be 900V. But if the simulation is extended, it is shown thatthe voltage increases slowly, and stabilizes to a value closer to the theoretical value (966V). This
76

9.4. INFLUENCE OF TERMINAL VOLTAGE VALUE
is shown in Fig 9.11 below, where the simulation is run for 50s.
Figure 9.11: 1940 kVA generator rms terminal voltage in phase a, b and c when the reference value of the regulator
is 1.4, the gain is 39 and the simulation is run for 50s.
Even though the voltage uses a really long time to stabilize on a definite value, it almost reachesthe theoretical value of a rms terminal voltage value of 966V. At 50s, the rms line voltage is redfrom the graph to be approximately 950V.
The gain in the voltage regulator is increased to 200 from its initial value 39, to see how longtime it takes before the generator line voltage stabilizes to the theoretical value 966V whenthe reference value is set to 1.4 and the gain is increased. The simulation is run for 50s forcomparison, and is shown in Fig 9.12 below.
Figure 9.12: 1940 kVA generator rms terminal voltage in phase a, b and c when the reference value of the regulator
is 1.4 and the gain is increased from the initial value of 39 to 200. The simulation is run for 50s.
When the gain is increased 200 from 39, the rms terminal voltage still increases at the end of the50s-simulation, and maybe stabilizes at a value close to the theoretical value 966V, but this stillhappens slowly. At 50s, the rms line voltage is red from the graph to be approximately 930V.During the first second of the start-up of the generator, a very large voltage spike is observed,with a value of approximately 1240V rms, before if falls down to about 870V rms, and startsto climb slowly towards 966V rms. This spike indicates high start-currents in the generatorstart-up.
So, by increasing the gain to 200, the voltage does not stabilizes more quickly to a value closeto the theoretical value, than when the AVR-gain was at its initial value 39. It is also observedthat the output from the generator does not oscillate as before. By increasing the gain, theoscillations in the start-up has vanished.
77
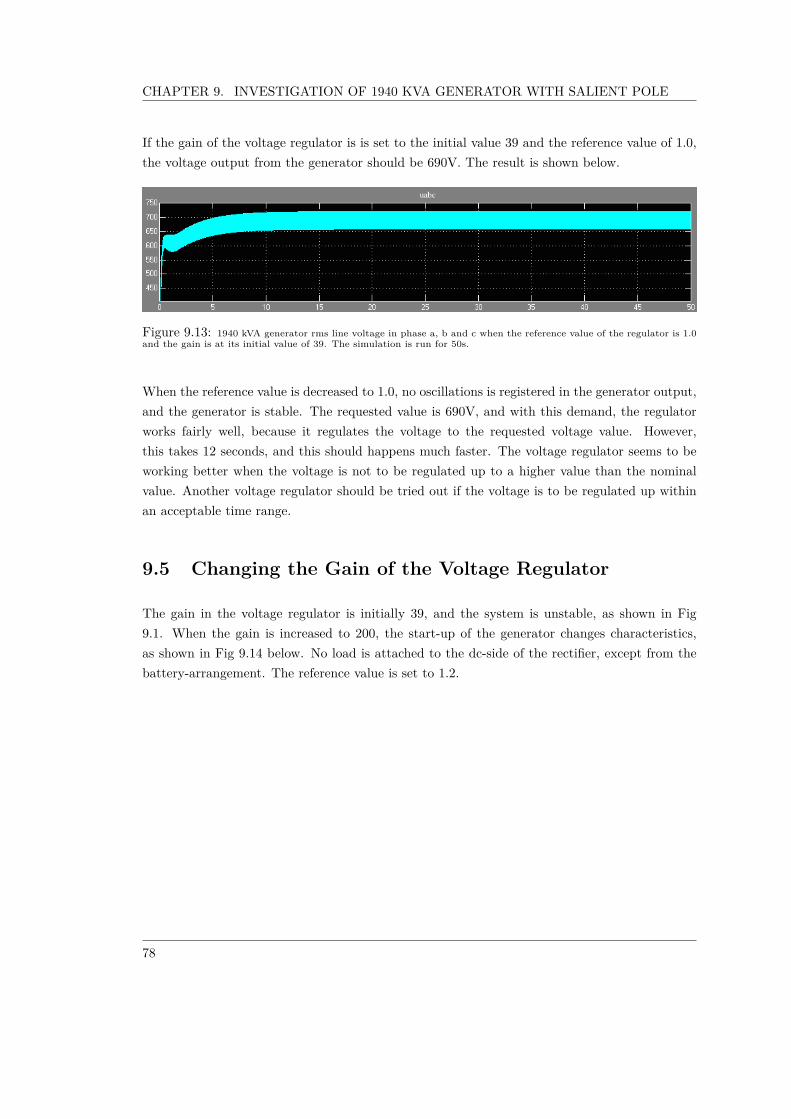
CHAPTER 9. INVESTIGATION OF 1940 KVA GENERATOR WITH SALIENT POLE
If the gain of the voltage regulator is is set to the initial value 39 and the reference value of 1.0,the voltage output from the generator should be 690V. The result is shown below.
Figure 9.13: 1940 kVA generator rms line voltage in phase a, b and c when the reference value of the regulator is 1.0
and the gain is at its initial value of 39. The simulation is run for 50s.
When the reference value is decreased to 1.0, no oscillations is registered in the generator output,and the generator is stable. The requested value is 690V, and with this demand, the regulatorworks fairly well, because it regulates the voltage to the requested voltage value. However,this takes 12 seconds, and this should happens much faster. The voltage regulator seems to beworking better when the voltage is not to be regulated up to a higher value than the nominalvalue. Another voltage regulator should be tried out if the voltage is to be regulated up withinan acceptable time range.
9.5 Changing the Gain of the Voltage Regulator
The gain in the voltage regulator is initially 39, and the system is unstable, as shown in Fig9.1. When the gain is increased to 200, the start-up of the generator changes characteristics,as shown in Fig 9.14 below. No load is attached to the dc-side of the rectifier, except from thebattery-arrangement. The reference value is set to 1.2.
78
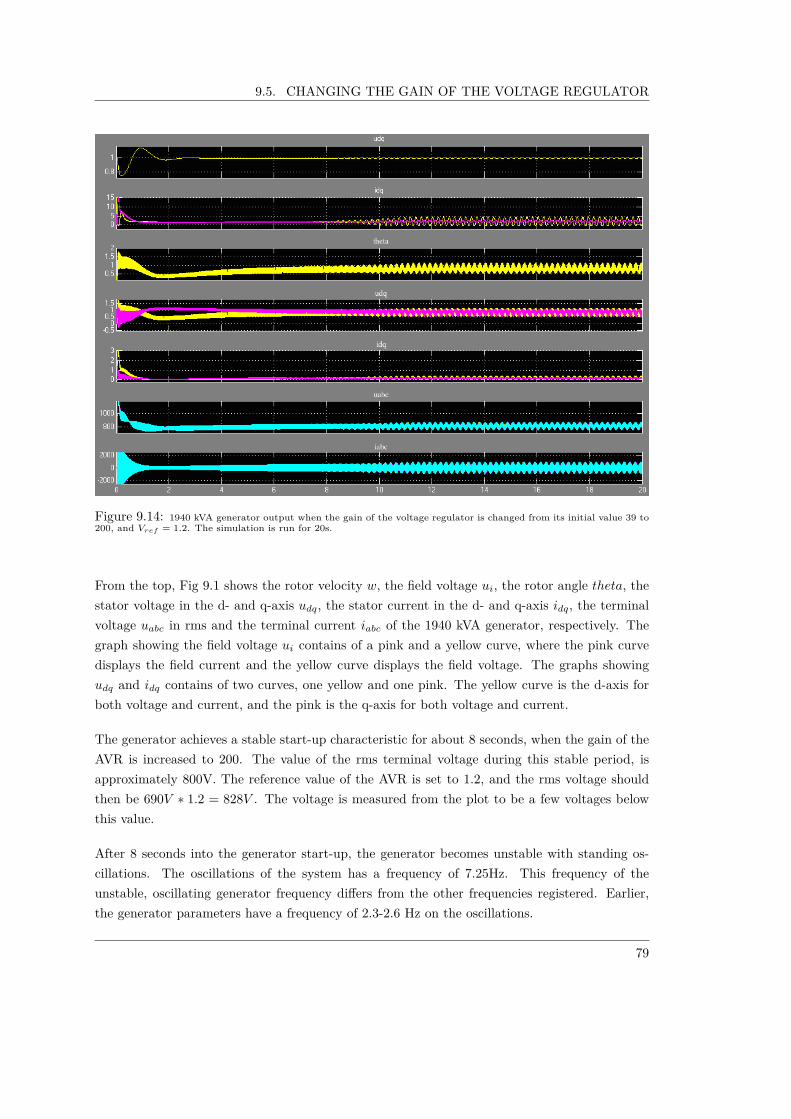
9.5. CHANGING THE GAIN OF THE VOLTAGE REGULATOR
Figure 9.14: 1940 kVA generator output when the gain of the voltage regulator is changed from its initial value 39 to
200, and Vref
= 1.2. The simulation is run for 20s.
From the top, Fig 9.1 shows the rotor velocity w, the field voltage ui, the rotor angle theta, thestator voltage in the d- and q-axis udq, the stator current in the d- and q-axis idq, the terminalvoltage uabc in rms and the terminal current iabc of the 1940 kVA generator, respectively. Thegraph showing the field voltage ui contains of a pink and a yellow curve, where the pink curvedisplays the field current and the yellow curve displays the field voltage. The graphs showingudq and idq contains of two curves, one yellow and one pink. The yellow curve is the d-axis forboth voltage and current, and the pink is the q-axis for both voltage and current.
The generator achieves a stable start-up characteristic for about 8 seconds, when the gain of theAVR is increased to 200. The value of the rms terminal voltage during this stable period, isapproximately 800V. The reference value of the AVR is set to 1.2, and the rms voltage shouldthen be 690V ú 1.2 = 828V . The voltage is measured from the plot to be a few voltages belowthis value.
After 8 seconds into the generator start-up, the generator becomes unstable with standing os-cillations. The oscillations of the system has a frequency of 7.25Hz. This frequency of theunstable, oscillating generator frequency di�ers from the other frequencies registered. Earlier,the generator parameters have a frequency of 2.3-2.6 Hz on the oscillations.
79

CHAPTER 9. INVESTIGATION OF 1940 KVA GENERATOR WITH SALIENT POLE
9.6 Load on DC-side of the Rectifier
A load RLoad is introduced 3 second into the generator start-up, coupled in parallel with thebattery-arrangement. The ability of the voltage regulator to regulate the voltage to a certainvalue is not studied, only the stability of the system as function of load is studied.
A load of 0.2MW is introduced on the dc-side of the rectifier after 3 seconds. This is 10% ofthe capacity of the generator (1.94MW). As was shown in Fig. 9.8, the dc-bus voltage is 1030Vbefore the oscillations starts. To introduce a load of 0.2MW, the load resistance corresponds toRLoad = V 2
P = (1030V )
2
0.2MW = 5.3�.
Figure 9.15: 1940 kVA generator modeled as salient pole output values from generator start-up simulation, where :
w is the rotor velocity, ui
is the field voltage, theta is the rotor angle, udq
is the stator voltage in the d- and q-axis, idq
is the stator current in the d- and q-axis, uabc
and iabc
is the rms terminal voltage and terminal current, respectively.
A load RLoad
= 5.3�, which corresponds to a load of 0.2MW, is introduced 3s into the simulation.
The frequency of the oscillations is 2.5Hz, and the generator output shows unstability after 3seconds, immediately after the load of 0.2MW is introduced. Because all the parameters of the
80

9.6. LOAD ON DC-SIDE OF THE RECTIFIER
generator oscillates similarly, only the rms terminal voltage and terminal current is studied whenthe load is further varied.
The load is increased to 0.5MW, which is 26% of the generator capacitance. This correspondsto a load of RLoad = 2.122�.
Figure 9.16: 1940 kVA generator modeled as salient pole output values from generator start-up simulation, where
uabc
and iabc
is the rms terminal voltage and terminal current, respectively. A load RLoad
= 2.122�, which corresponds
to a load of 0.5MW, is introduced 3s into the simulation.
The generator output shows instability when the load is 0.5MW. The frequency of the oscillationshas increased to 2.6Hz.
The load is increased to 1MW, which is 52% of the generator capacitance. This corresponds toa load of RLoad = 1.06�.
Figure 9.17: 1940 kVA generator modeled as salient pole output values from generator start-up simulation, where
uabc
and iabc
is the rms terminal voltage and terminal current, respectively. A load RLoad
= 1.06�, which corresponds
to a load of 1MW, is introduced 3s into the simulation.
The generator output shows instability when the load is 1.0MW, and the frequency of the oscil-lations has increased further, to 2.7Hz.
The load is increased to 1.5MW, which is 77% of the generator capacitance. This correspondsto a load of RLoad = 0.707�.
81

CHAPTER 9. INVESTIGATION OF 1940 KVA GENERATOR WITH SALIENT POLE
Figure 9.18: 1940 kVA generator modeled as salient pole output values from generator start-up simulation, where
uabc
and iabc
is the rms terminal voltage and terminal current, respectively. A load RLoad
= 0.707�, which corresponds
to a load of 1.5MW, is introduced 3s into the simulation.
The generator output shows instability when the load is 1.5MW, with a frequency of 2.7Hz.
The load is increased to 1.9MW, which is 98% of the generator capacitance. This correspondsto a load of RLoad = 0.56�. This is a very large load. The battery also draws power from thegenerator, so it is assumed that the generator runs at nominal power, at the limit of what it candeliver.
Figure 9.19: 1940 kVA generator modeled as salient pole output values from generator start-up simulation, where
uabc
and iabc
is the rms terminal voltage and terminal current, respectively. A load RLoad
= 0.707�, which corresponds
to a load of 1.5MW, is introduced 3s into the simulation.
The generator output shows stability after 10 seconds when the load is 1.9MW.
Summary of the simulations:
Table 9.5: Generator start-up when G2 is modeled as salient pole, governor and AVR is includedin the model. The load connected at the DC-side of the rectifier is varied.
Parameter Value [pu] Operation Comment Frequency AC-side Frequency DC-side
PLoad 0.2MW Unstable after 3s Increasing 2.5Hz 2.5HzPLoad 0.5MW Unstable - 2.6Hz 2.6HzPLoad 1.0MW Unstable - 2.7Hz 2.7HzPLoad 1.5MW Unstable - 2.7Hz 2.7HzPLoad 1.9MW Stable after 10s - - -
82

9.6. LOAD ON DC-SIDE OF THE RECTIFIER
Table 9.5 shows that when the load is increased up to 1.9MW, at a point where the generatoroperates at the limit of its capacity, the generator becomes stable.
By rewriting the stability criterion given by [2] in Eq. 4.17, we have that:
X‘2dI‘2d + X‘2qI‘2q Æ 2X‘dI‘dUp (9.2)
which claims when the source voltage Up is increased, stability is enhanced. The source voltageis load dependent, meaning that the stability of the 1940kVA generator depends on the load-operation. When the load increases, the source voltage Up increases and stability is reachedaccording to the stability criterion presented by [2] shown in the equation above. The simulationresults presented in Table 9.5 confirms this, saying that the generator becomes stable when theload is increased to 1.9MW. However, instability is observed for all other loads, with an increasingfrequency when the load is increased.
83

CHAPTER 9. INVESTIGATION OF 1940 KVA GENERATOR WITH SALIENT POLE
84

Chapter 10
Investigation of 1940 kVAGenerator System, Round Rotor
In this chapter, the 1940 kVA synchronous generator is modeled in MatLab/SimPowerSystemswith a round rotor design. As mentioned in Chapter 7, the parameters from the generatorsare obtained from the originally received SimPowerSystems-model from Siemens in Trondheim.In this model, the 1940 kVA generator is modeled as salient pole, but from conversations withSiemens Trondheim, it is understood that this generator is modeled as round rotor.
In addition, the parameters Xd and Xq for the 1940 kVA synchronous generator is close invalue, which supports the qualified assumption that the 1940kVA generator in reality is a roundrotor. Because the generator is modeled as a salient pole in the model received from Siemens inTrondheim, the parameter-value of the transient q-axis reactance X‘q is missing. This parametermust be found to model the generator as round rotor.
Table 4.1 in Chapter 4 shows typical parameters for SM for both salient pole and round rotordesign [13]. As seen from this table, SM with a round rotor design often has values of theparameters Xd and Xq that is very close in value, as is the case with the 1940 kVA generator;X
d
Xq
= 1.12.
In order to model the 1940 kVA generator as a round rotor machine and not a salient polemachine, the value of the parameter X‘q must be found, and the assumption that Xd ¥ Xq mustbe made, even though they are already very close in value. The value of the transient q-axisreactance can be found using ratios in the parameters given in the Table 4.1 in Chapter 4. Byusing this table and information about the generator reactances, a qualified guess of the transientq-axis reactance is made: X‘q = 1.6pu. A more detailed explanation of the process finding thisvalue is found in the Appendix I.2.1.
85

CHAPTER 10. INVESTIGATION OF 1940 KVA GENERATOR SYSTEM, ROUND ROTOR
Because there is given di�erent values for Xd and Xq, there must be tried both values for Xq,both the original value for Xq and the value of Xd. The value of Xd must throughout theexperiment be the originally given value, because there is less degrees of freedom in this axis.
A definition for stability must be found, to classify the generator as stable/unstable. BecauseMatLab/SimPowerSystems does not have the same way of analyzing eigenvalues in the sameway as DIgSILENT PowerFactory, the curves in the graphs extracted from the simulations mustbe used as a basis for stability. The simulations runs for 20 seconds, and if no oscillationsis detected, the generator is considered stable. If instability is observed after 20 seconds issimulated, numerical reasons in the simulation tool could be the reason. Table 10.1 below showsthe result of the simulations.
Table 10.1: Parameter analysis, varying X‘q and Xq to investigate generator stability
Parameter analysisParameters Value Generator operation
X‘q 1.6Stable
Xq = Xd
X‘q 1.6Stable
Xq = Xq
X‘q = Xq UnstableXq = Xd
X‘q = Xq UnstableXq = Xq
The table with values in pu-units is given in Appendix I.2.1. From Table 10.1, it can be concludedthat the value of X‘q has a great impact on the stability of the generator when designed as around rotor machine. If the machine is to operate stable, the value of X‘q must be withinthe limits: 1.6 < X‘q < Xq. This limit is further examined in the table below, where onlyX‘d is examined, and the value of Xq is first fixed on Xq = Xq, then on Xq = Xd. Stabilityis classified as explained above. If oscillations occur, they will be defined into the followingcategories: damped, undamped, poorly damped or standing oscillations. The frequency of theoscillations is also calculated. No load is connected to the DC-side of the rectifier, except fromthe battery-arrangement.
86

10.1. 1.6 < X‘Q < XQ, XQ = XQ
10.1 1.6 < X‘q < Xq, Xq = Xq
With AVR and exciter
Table 10.2: Parameter analysis, with 1.6 < X‘q < Xq and Xq = Xq to investigate the generatorstability. Voltage regulator and governor included.
Parameter Value [pu] Operation Comment Frequency
X‘q 1.6 Stable - -X‘q 2.0 Stable - -X‘q 2.5 Stable - -X‘q 3.0 Unstable after 8s Standing oscillations 3 HzX‘q 2.75 Unstable after 12s Increasing oscillations 3 HzX‘q 2.6 Stable - -X‘q 2.65 Stable - -X‘q 2.7 Unstable after 12s Increasing oscillations 2.9 HzX‘q 4.79 Unstable after 4.5s Standing oscillations 2.5 Hz
The table with values in pu-units is given in Appendix I.2.1. When G2 is designed as round rotor,with governor and AVR included and Xq = Xq, the generator becomes stable when X‘q < 2.7pu.A stability criterion for the transient reactances can be obtained:
X‘qX‘d
< 5.51pu (10.1)
The stability criterion presented by [1] claims that to obtain stability, this ratio should be:X‘
q
X‘
d
< 2. When the ratio between the transient reactances is calculated with X‘q = 2.7 applied,the ratio becomes: X‘
q
X‘
d
> 2 under these conditions. This does not fulfill the criterion presentedby [1], but is stable nevertheless.
Without AVR and exciter
The same parameter analysis is done, but now without the voltage regulator connected to the1940 kVA synchronous generator designed with round rotor. The generator is excited by aconstant DC voltage source, providing the generator field with the same voltage as the exciterembedded in the voltage regulator-exciter-block, Vdc = Vexciter = 21V .
The stability is evaluated as before, by simulating 20 seconds of the generator start-up andanalyzing the graphs out from the generator. No load is connected to the DC-side of the rectifier,except from the battery-arrangement. The frequency of the oscillation in the parameters isregistered when the system becomes unstable. The result is shown in the table below.
87

CHAPTER 10. INVESTIGATION OF 1940 KVA GENERATOR SYSTEM, ROUND ROTOR
Table 10.3: Parameter analysis, with 1.6 < X‘q < Xq and Xq = Xq to investigate the generatorstability. Only the governor is included. A constant DC-source excites the generator field.
Parameter Value [pu] Operation Comment Frequency on AC-side
X‘q 1.6 Stable - -X‘q 2.0 Stable - -X‘q 3.0 Stable - -X‘q 4.0 Stable - -X‘q 5.0 Stable - -X‘q 7.0 Stable - -X‘q 9.0 Stable Poorly damped -X‘q 10.0 Unstable - 0.22Hz
The table with values in pu-units is given in Appendix I.2.1
The outputs from the generator modeled without AVR all shows that the system is stable whenX‘q < 10.0 when the AVR is not included and Xq = Xq. When X‘q = 10.0, spikes appear in theparameters with a very low frequency. Fig 10.1 below shows these spikes in the rotor velocity w
during the generator start-up simulation.
Figure 10.1: 1940 kVA generator modeled as round rotor and X‘
q
= 10, no load is attached to the dc-side of the
rectifier and w is the rotor velocity.
88

10.2. 1.6 < X‘Q < XQ, XQ = XD
10.2 1.6 < X‘q < Xq, Xq = Xd
With AVR and exciter
A parameter analysis is conducted, varying the transient reactance in the q-axis when Xq = Xd.The result is shown in Table 10.4 below.
Table 10.4: Parameter analysis, with 1.6 < X‘q < Xq and Xq = Xd to investigate the generatorstability. Voltage regulator and governor included.
Parameter Value [pu] Operation Comment Frequency
X‘q 1.6 Stable - -X‘q 2.0 Stable - -X‘q 2.5 Stable - -X‘q 3.0 Unstable after 8s Standing oscillations 3 HzX‘q 2.75 Unstable after 10s Decreasing oscillations 3 HzX‘q 2.6 Stable - -X‘q 2.65 Unstable after 11s Decreasing oscillations, poorly damped 3 HzX‘q 2.7 Unstable after 11s Standing oscillations 3 Hz
The table with values in pu-units is given in Appendix I.2.1. When G2 is designed as round rotor,with governor and AVR included and Xq = Xd, the generator becomes stable when X‘q < 2.65pu.A stability criterion for the transient reactances can be obtained:
X‘qX‘d
< 5.41pu (10.2)
Using this parameter, the stability criterion presented by [1] will not be fulfilled with this pa-rameters either. When the ratio between the transient reactances is calculated with X‘q = 2.65applied, the ratio becomes: X‘
q
X‘
d
> 2 under these conditions. This does not fulfill the criterionpresented by [1], but is stable nevertheless.
89

CHAPTER 10. INVESTIGATION OF 1940 KVA GENERATOR SYSTEM, ROUND ROTOR
Without AVR and exciter
The same parameter analysis is conducted when the AVR and exciter is not included. A constantDC-source excites the generator field with a constant voltage of 21V. The transient reactance inthe q-axis is varied when Xq = Xd. The result is shown in Table 10.5 below.
Table 10.5: Parameter analysis, with 1.6 < X‘q < Xq and Xq = Xd to investigate the generatorstability. Only the governor included. A constant DC-source excites the generator field.
Parameter Value [pu] Operation Comment Frequency
X‘q 1.6 Stable - -X‘q 2.0 Stable - -X‘q 3.0 Stable - -X‘q 5.0 Stable - -X‘q 7.0 Unstable - 0.22HzX‘q 6.0 Unstable - 0.22HzX‘q 5.5 Stable after 15s Poorly damped -
The table with values in pu-units is given in Appendix I.2.1. The outputs from the generatormodeled without AVR all shows that the system is stable when X‘q < 6.0 when the AVR is notincluded and Xq = Xd.
The generator becomes unstable for a lower value of X‘q when the AVR and exciter is connectedthan when it is not. The stability limit is approximately the same for when Xq = Xq and whenXq = Xd. From the simulations, it is also seen that when the AVR and exciter is removed,the generator becomes unstable for a lower value of X‘q when Xq = Xd than when Xq = Xq,possibly because Xq < Xd.
In general, it is observed that when Xq = Xd, the generator becomes unstable for a lower valueof X‘q, both when the AVR and exciter is included and not, than when Xq = Xq.
It is also observed that when the generator becomes unstable when the AVR and exciter isincluded in the model, the generator outputs oscillate with a frequency of 3Hz for both whenXq = Xq and when Xq = Xd. When the AVR and exciter is not included in the model andthe same parameter analysis is done, the generator outputs oscillate with a frequency of 0.22Hzwhen the system becomes unstable, for both when Xq = Xq and when Xq = Xd.
Despite this, the stability criterions obtained is quite similar in values, indicating that the syn-chronous reactances Xq and Xq is very close in value and the approximation of Xq ¥ Xq can bemade.
90

10.3. SIMULATION RESULTS OF G2 WITH ROUND ROTOR
10.3 Simulation Results of G2 with Round Rotor
The results of the simulations of the generator start-up of the system with G2, modeled as asynchronous generator with round rotor is shown in this chapter. The transient q-axis reactanceX‘q is assumed to be the same value as the q-axis synchronous reactance (X‘q = Xq). The voltageregulator and governor is both included in the model. The generator start-up is simulated bothfor when a load is connected on the dc-side of the rectifier, and when no load is attached.
10.3.1 No load at the DC-side
There is no load connected to the DC-side of the rectifier, except from the battery-arrangementconsisting of the large capacitance and the series resistance. The reference value of the voltageregulator is set to 1.2, which means that the voltage out from the generator is to be increasedfrom the nominal voltage 690V to 1.2 ú 690V = 828V .
91

CHAPTER 10. INVESTIGATION OF 1940 KVA GENERATOR SYSTEM, ROUND ROTOR
Figure 10.2: 1940 kVA generator system output values, where: w is the rotor velocity, ui
is the field voltage, theta is
the rotor angle, udq
is the stator voltage in the d- and q-axis, idq
is the stator current in the d- and q-axis, uabc
in rms
and iabc
is the terminal voltage and current, respectively. No load is connected to the DC-side of the rectifier, except
from the battery-arrangement.
From the top, Fig 10.2 shows the rotor velocity w, the field voltage ui, the rotor angle theta, thestator voltage in the d- and q-axis udq, the stator current in the d- and q-axis idq, the terminalvoltage uabc in rms and the terminal current iabc of the 1940 kVA generator, respectively. Thegraph showing the field voltage ui contains of a pink and a yellow curve, where the pink curvedisplays the field current and the yellow curve displays the field voltage. The graphs showingudq and idq contains of two curves, one yellow and one pink. The yellow curve is the d-axis forboth voltage and current, and the pink is the q-axis for both voltage and current.
The generator outputs shows an unstable start-up of G2, as expected. The rms voltage inthe three phases a, b and c increases up to approximately 740V, before it increases further toabout 800V and the system becomes unstable after 5 seconds. When this instability occurs, thegenerator parameters oscillates with a frequency of 2.5Hz.
92

10.3. SIMULATION RESULTS OF G2 WITH ROUND ROTOR
The voltage output from the exciter is shown in Fig 10.3 below.
Figure 10.3: 1940 kVA generator system output values from the AVR and exciter where ef
is the field voltage.
The plot shows that the exciter feeds the generator field with a constant DC voltage of 21V DC.
Figure 10.4: The 1940 kVA generator feeds the battery through a rectifier, where Vdc
is the dc-bus voltage.
93

CHAPTER 10. INVESTIGATION OF 1940 KVA GENERATOR SYSTEM, ROUND ROTOR
The dc-bus voltage shows a value of 1030V before the oscillations begins.
10.3.2 Reference value of the AVR at no load
When the reference value of the voltage regulator is decreased from 1.2 to 1.0, the characteristicsof the generator changes from unstable to stable, as shown in Fig 10.5 below.
Figure 10.5: The rms terminal voltage uabc in three phases when the generator start-up is simulated, when the
voltage regulator is connected and the reference value is set to 1.0. No load is attached to the DC-side except from the
battery-arrangement in form of a large capacitor and a series resistance.
The voltage settles at a voltage close to the nominal voltage of the generator, 690V, as requestedof the voltage regulator, and the generator output is stable.
The reference value of the voltage regulator is now changed to 1.4, requesting a voltage out fromthe voltage to be 40% larger than the nominal voltage; Vabc = 1.4 ú 690V = 988V .
Figure 10.6: The rms terminal voltage uabc in three phases when the generator start-up is simulated, when the
voltage regulator is connected and the reference value is set to 1.4. No load is attached to the DC-side except from the
battery-arrangement in form of a large capacitor and a series resistance.
The first 6 seconds of the motor-start up is unstable, before the generator output shows a stablecharacteristics after 6 seconds. At the same time, the voltage regulator tries to increase thevoltage up to the requested voltage 966V, but this happens slowly. The simulation is extendedto 50seconds, to see if the voltage regulator manages to increase the voltage up to 966V.
94
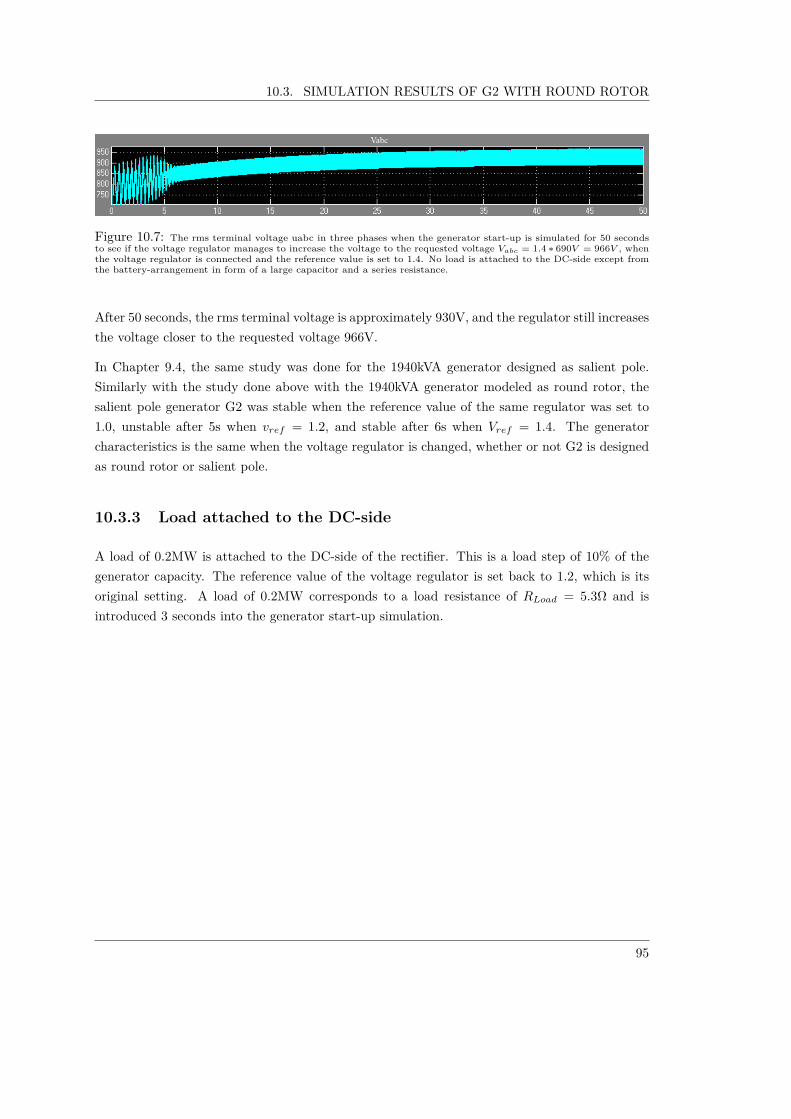
10.3. SIMULATION RESULTS OF G2 WITH ROUND ROTOR
Figure 10.7: The rms terminal voltage uabc in three phases when the generator start-up is simulated for 50 seconds
to see if the voltage regulator manages to increase the voltage to the requested voltage Vabc
= 1.4 ú 690V = 966V , when
the voltage regulator is connected and the reference value is set to 1.4. No load is attached to the DC-side except from
the battery-arrangement in form of a large capacitor and a series resistance.
After 50 seconds, the rms terminal voltage is approximately 930V, and the regulator still increasesthe voltage closer to the requested voltage 966V.
In Chapter 9.4, the same study was done for the 1940kVA generator designed as salient pole.Similarly with the study done above with the 1940kVA generator modeled as round rotor, thesalient pole generator G2 was stable when the reference value of the same regulator was set to1.0, unstable after 5s when vref = 1.2, and stable after 6s when Vref = 1.4. The generatorcharacteristics is the same when the voltage regulator is changed, whether or not G2 is designedas round rotor or salient pole.
10.3.3 Load attached to the DC-side
A load of 0.2MW is attached to the DC-side of the rectifier. This is a load step of 10% of thegenerator capacity. The reference value of the voltage regulator is set back to 1.2, which is itsoriginal setting. A load of 0.2MW corresponds to a load resistance of RLoad = 5.3� and isintroduced 3 seconds into the generator start-up simulation.
95
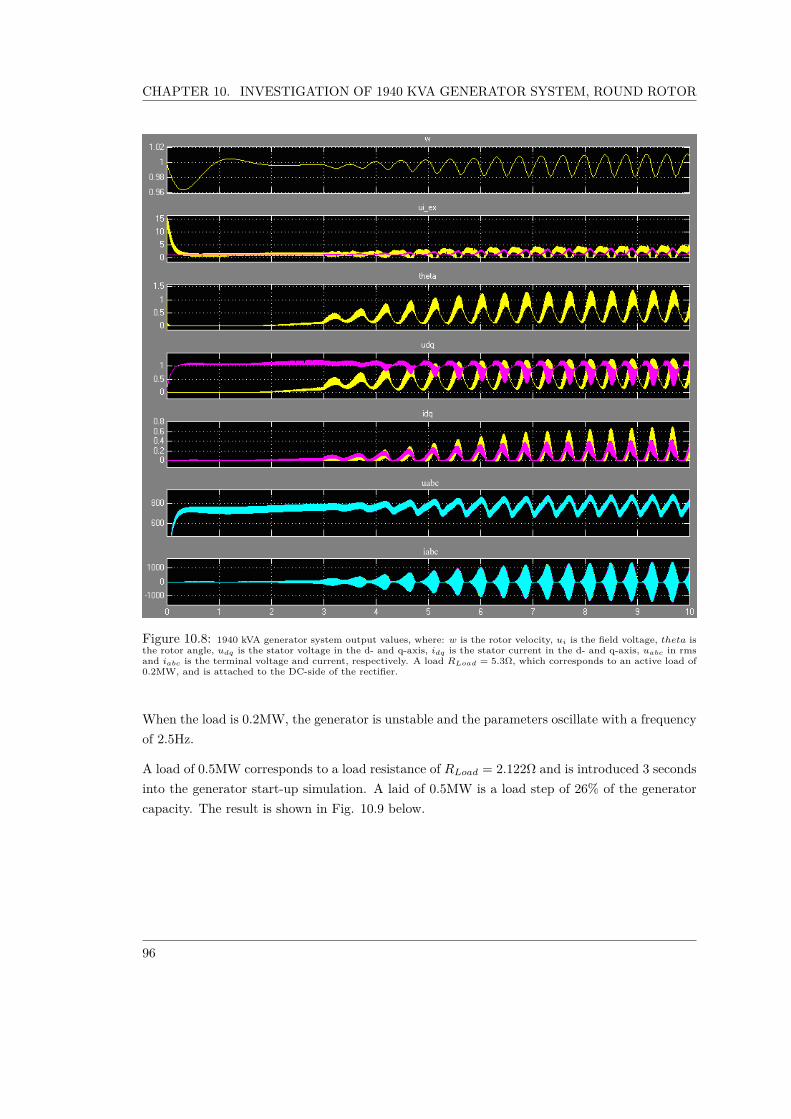
CHAPTER 10. INVESTIGATION OF 1940 KVA GENERATOR SYSTEM, ROUND ROTOR
Figure 10.8: 1940 kVA generator system output values, where: w is the rotor velocity, ui
is the field voltage, theta is
the rotor angle, udq
is the stator voltage in the d- and q-axis, idq
is the stator current in the d- and q-axis, uabc
in rms
and iabc
is the terminal voltage and current, respectively. A load RLoad
= 5.3�, which corresponds to an active load of
0.2MW, and is attached to the DC-side of the rectifier.
When the load is 0.2MW, the generator is unstable and the parameters oscillate with a frequencyof 2.5Hz.
A load of 0.5MW corresponds to a load resistance of RLoad = 2.122� and is introduced 3 secondsinto the generator start-up simulation. A laid of 0.5MW is a load step of 26% of the generatorcapacity. The result is shown in Fig. 10.9 below.
96
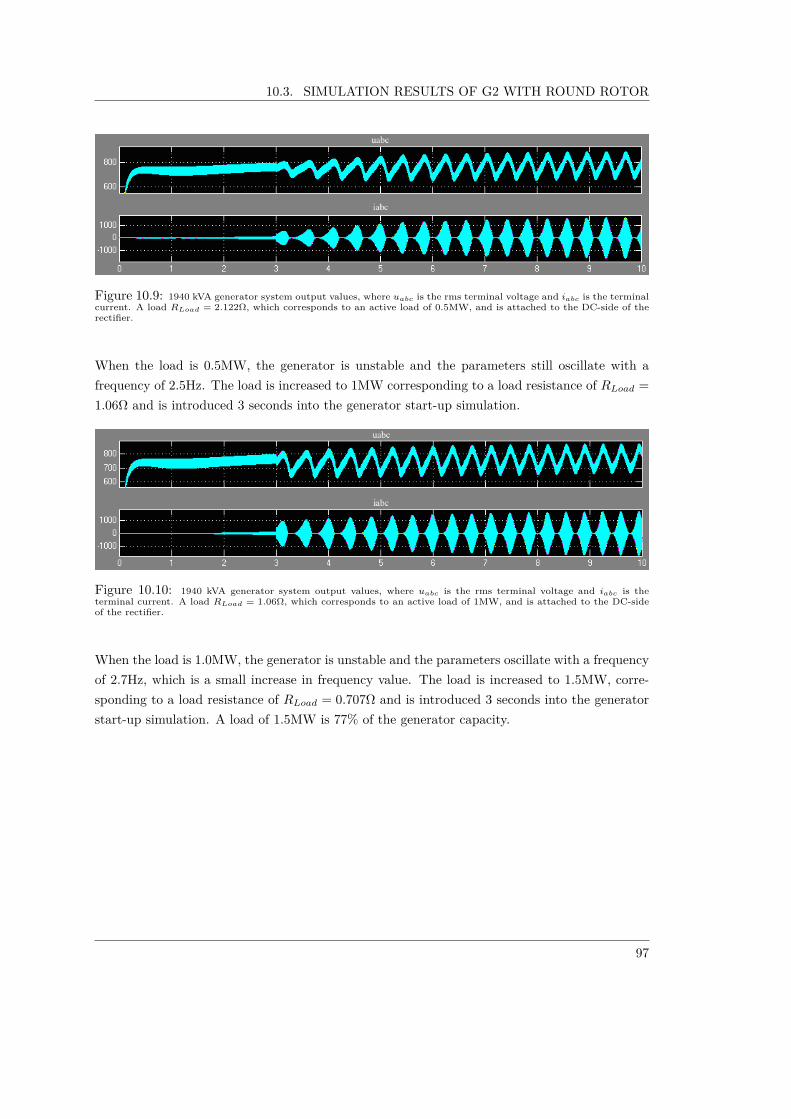
10.3. SIMULATION RESULTS OF G2 WITH ROUND ROTOR
Figure 10.9: 1940 kVA generator system output values, where uabc
is the rms terminal voltage and iabc
is the terminal
current. A load RLoad
= 2.122�, which corresponds to an active load of 0.5MW, and is attached to the DC-side of the
rectifier.
When the load is 0.5MW, the generator is unstable and the parameters still oscillate with afrequency of 2.5Hz. The load is increased to 1MW corresponding to a load resistance of RLoad =1.06� and is introduced 3 seconds into the generator start-up simulation.
Figure 10.10: 1940 kVA generator system output values, where uabc
is the rms terminal voltage and iabc
is the
terminal current. A load RLoad
= 1.06�, which corresponds to an active load of 1MW, and is attached to the DC-side
of the rectifier.
When the load is 1.0MW, the generator is unstable and the parameters oscillate with a frequencyof 2.7Hz, which is a small increase in frequency value. The load is increased to 1.5MW, corre-sponding to a load resistance of RLoad = 0.707� and is introduced 3 seconds into the generatorstart-up simulation. A load of 1.5MW is 77% of the generator capacity.
97

CHAPTER 10. INVESTIGATION OF 1940 KVA GENERATOR SYSTEM, ROUND ROTOR
Figure 10.11: 1940 kVA generator system output values, where uabc
is the rms terminal voltage and iabc
is the
terminal current. A load RLoad
= 0.707�, which corresponds to an active load of 1.5MW, and is attached to the
DC-side of the rectifier.
When the load is 1.5MW, the generator is unstable and the parameters oscillate with a frequencyof 2.8Hz. The load is further increased, to 1.9MW, corresponding to a load resistance of RLoad =0.56� and is introduced 3 seconds into the generator start-up simulation. This is a very largeload, making the generator run at the limit of its capacity.
Figure 10.12: 1940 kVA generator system output values, where uabc
is the rms terminal voltage and iabc
is the
terminal current. A load RLoad
= 0.56�, which corresponds to an active load of 1.9MW, and is attached to the DC-side
of the rectifier.
When the load is increased to 1.9MW, the generator becomes stable after 10 seconds. This wasthe case for the 1940kVA generator modeled as salient pole as well. The observations on the shipalso corresponds to these simulations.
A summary of the load-step simulations is shown in Table 10.6 below.
98

10.3. SIMULATION RESULTS OF G2 WITH ROUND ROTOR
Summary of the simulations:
Table 10.6: Generator start-up when G2 is modeled as round rotor, X‘q = Xq, governor andAVR is included in the model. The load connected at the DC-side of the rectifier is varied.
Parameter Value [pu] Operation Comment Frequency AC-side Frequency DC-side
PLoad 0 Unstable - 2.5Hz 2.5HzPLoad 0.2MW Unstable - 2.5Hz 2.5HzPLoad 0.5MW Unstable - 2.5Hz 2.5HzPLoad 1.0MW Unstable - 2.7Hz 2.7HzPLoad 1.5MW Unstable - 2.8Hz 2.8HzPLoad 1.9MW Stable after 10s -
This results corresponds with the results found with G2 designed as salient pole, shown in Table9.5. The results found in both Table 9.5 for G2 salient pole and Table 10.6 for G2 round rotorconfirms the stability criterion found in Eq. 4.17 by [2], due to the fact that stability is enhancedwhen the load is increased up to a certain value, reaching a high value of the stationary sourcevoltage Up until the stability criterion presented by [2] is fulfilled.
10.3.4 Infinitely large inertia
This simulation is done to detect oscillations in the rotor angle by varying the rotor-inertiaconstant H. This test is done by Siemens in Trondheim as well, but according to [2] oscillationswas not detected. An infinitely large inertia constant was tried, but the oscillations in thegenerator output was still intact.
The inertia J is calculated by using the formula [22]: J = 2úHúNúSrated
2fiúfrated
, where:
J is inertia in kg ú m2, H is the inertia constant in sW/V A, Srated is the machine rated apparentpower in VA, Frated is the machine rated electrical frequency in Hz, and N is the number ofmachine pole pairs. The varying of H is shown in the table below. The inertia constant is indirect proportion to the inertia J, so by increasing the inertia constant, the inertia is increasedwith the same proportion [22].
Table 10.7: Varying rotor intertia to detect oscillations in rotor angle
Parameter Value [ sWV A
] Operation Comment Frequency AC-side Frequency DC-side
H 0.872 Unstable - 2.5Hz 2.5HzH 1000 Unstable - 2.5Hz 2.5HzH 10 000 Unstable - 2.5Hz 2.5HzH 100 000 Unstable - 2.5Hz 2.5HzH 1e6 Unstable - 2.5Hz 2.5Hz
99

CHAPTER 10. INVESTIGATION OF 1940 KVA GENERATOR SYSTEM, ROUND ROTOR
The system is unstable under these conditions, regardless of the increasing of the rotor inertia,and oscillations for the rotor angle was detected for all values of rotor constants.
10.4 G2 with Round Rotor without AVR
It is of great interest to find how the arrangement with the rectifier coupled generator, feedingthe battery on the DC-side, behaves when the voltage regulator, regulating the voltage out fromthe generator, is removed. As shown in Fig 10.3, the DC voltage from the exciter, exciting thegenerator field, oscillates greatly, after about 3-4 seconds. At the same time, after 3-4 secondsin to the motor start-up simulation, the oscillations seen in the generator output starts, as seenin Fig 10.2. It is not known, whether it is inside the voltage regulator or the generator theinstability arises first. This can be further examined if the voltage regulator is removed and thegenerator outputs analyzed.
To remove the AVR, the exciter must be replaced by a constant DC voltage source, exciting thegenerator field with the same DC voltage as the exciter in the voltage regulator did, a constantvoltage of 21V, as found in Fig 10.3.
The load step is generated by using a single phase circuit breaker, which opens 3 seconds into thegenerator start-up. The resistance and capacitance in the battery is set to the initial conditions2100kF and 62.5m�, respectively. The transient q-axis reactance X‘q is assumed to be the samevalue as the q-axis synchronous reactance (X‘q = Xq).
The resistance RLoad on the DC-side of the rectifier, connected in parallel with the battery is tobe varied in value to show the generator response.
10.4.1 Simulation results
The output values of the system with G2, modeled as a synchronous generator with round rotorwith the AVR not included. This is to show how the generator reacts during the motor-start-upwithout a regulator. The transient q-axis reactance X‘q is assumed to be the same value asthe q-axis synchronous reactance (X‘q = Xq). The simulations is first done when the generatoroperates at no-load, and then during load-operation.
No load attached to DC-side
There is no load connected to the DC-side of the rectifier except from the battery.
100

10.4. G2 WITH ROUND ROTOR WITHOUT AVR
Figure 10.13: The output values from the 1940 kVA generator system with round rotor, modeled without the Voltage
regulator, where: w is the rotor velocity, ui
is the field voltage, theta is the rotor angle, udq
is the stator voltage in the
d- and q-axis, idq
is the stator current in the d- and q-axis, uabc
and iabc
is the terminal voltage in rms and the current,
respectively. No load is attached to the DC-side of the rectifier except the battery arrangement.
From the top, Fig 10.13 shows the rotor velocity w, the field voltage ui, the rotor angle theta,the stator voltage in the d- and q-axis udq, the stator current in the d- and q-axis idq, the rmsterminal voltage uabc and the terminal current iabc of the 1940 kVA generator, respectively. Theplot of the generator outputs shows that the generator modeled with round rotor has a stablestart-up when the AVR is not included and no load is connected to the DC-side of the rectifier.
The voltage output is now not regulated by any AVR and the generator has a stable start-up. The rms voltage from the generator is read from the plot to be 770V when no load isattached to the DC-side of the rectifier, approximately. This is almost 12% higher than therated frequency of the generator, that is 690V. This is to deliver the voltage requested by thebattery, Vd = 1.35 ú VLL = 1030V .
The period of the oscillations shown in the rms voltage in all three phases in the plot above isfound to be 15ms, which corresponds to a frequency of 66.67Hz, which is the nominal frequencyof the generator. The mean voltage on the DC-side of the rectifier is shown in Fig 10.14 below.
101

CHAPTER 10. INVESTIGATION OF 1940 KVA GENERATOR SYSTEM, ROUND ROTOR
Figure 10.14: The mean DC voltage after the rectifier, supplied from the 1940 kVA generator system with round
rotor, modeled without the voltage regulator.
The DC voltage from the rectifier starts at 1030V, and stays at this value in 3.5 seconds, beforeit increases to 1035V after 3.5 seconds into the generator start-up.
Load attached to DC-side
A load is now attached to the dc-side of the rectifier, and varied.
An active load of 0.2MW corresponds to a load resistance of RLoad = 5.3� and is introduced 3seconds into the generator start-up simulation.
102

10.4. G2 WITH ROUND ROTOR WITHOUT AVR
Figure 10.15: The output values from the 1940 kVA generator system with round rotor, modeled without the Voltage
regulator, where: w is the rotor velocity, ui
is the field voltage, theta is the rotor angle, udq
is the stator voltage in the
d- and q-axis, idq
is the stator current in the d- and q-axis, uabc
and iabc
is the terminal voltage in rms and the current,
respectively. A load RLoad
= 5.3�, which corresponds to an active power of 0.2MW, is attached to the DC-side of the
rectifier after 3 seconds into the simulation.
The generator is unstable, and the frequency is lower for this load than when the voltage regulatorwas attached, only 1Hz.
The load is increased to 0.5MW, corresponding to a load resistance of RLoad = 2.122� and isintroduced 3 seconds into the generator start-up simulation.
103

CHAPTER 10. INVESTIGATION OF 1940 KVA GENERATOR SYSTEM, ROUND ROTOR
Figure 10.16: The output values from the 1940 kVA generator system with round rotor, modeled without the Voltage
regulator, where uabc
and iabc
is the terminal voltage in rms and the current, respectively. A load RLoad
= 2.122�,
which corresponds to an active power of 0.5MW, is attached to the DC-side of the rectifier after 3 seconds into the
simulation.
The generator is still unstable, but the parameters only oscillate with a frequency of 0.5Hz.
An active load of 1.0MW corresponds to a load resistance of RLoad = 1.06� and is introduced 3seconds into the generator start-up simulation.
Figure 10.17: The output values from the 1940 kVA generator system with round rotor, modeled without the Voltage
regulator, where uabc
and iabc
is the terminal voltage in rms and the current, respectively. A load RLoad
= 1.06�, which
corresponds to an active power of 1.0MW, is attached to the DC-side of the rectifier after 3 seconds into the simulation.
The generator is still unstable, and the parameters still oscillate with a frequency of 0.5Hz.
An active load of 1.5MW corresponds to a load resistance of RLoad = 0.707� and is introduced3 seconds into the generator start-up simulation.
104

10.4. G2 WITH ROUND ROTOR WITHOUT AVR
Figure 10.18: The output values from the 1940 kVA generator system with round rotor, modeled without the Voltage
regulator, where uabc
and iabc
is the terminal voltage in rms and the current, respectively. A load RLoad
= 0.707�,
which corresponds to an active power of 1.5MW, is attached to the DC-side of the rectifier after 3 seconds into the
simulation.
The generator is unstable and has a frequency of 0.6Hz.
The load is increased to 1.9MW, that corresponds to a load resistance of RLoad = 0.56� and isintroduced 3 seconds into the generator start-up simulation.
Figure 10.19: The output values from the 1940 kVA generator system with round rotor, modeled without the Voltage
regulator, where uabc
and iabc
is the terminal voltage in rms and the current, respectively. A load RLoad
= 0.56�, which
corresponds to an active power of 1.9MW, is attached to the DC-side of the rectifier after 3 seconds into the simulation.
When the load is 1.9MW, the generator is still unstable. A summary of the simulations is shownin the table below:
Table 10.8: Parameter analysis: DC-side load step when no AVR is included.
Parameter Value [pu] Operation Comment Frequency AC-side Frequency DC-side
PLoad 0 Stable - - -PLoad 0.2MW Unstable Poorly damped 1Hz 1HzPLoad 0.5MW Unstable - 0.5Hz 0.5HzPLoad 1.0MW Unstable - 0.5Hz 0.5HzPLoad 1.5MW Unstable - 0.6Hz 0.6HzPLoad 1.9MW Unstable - 0.63Hz 0.63Hz
To better compare the simulation results from the two situations AVR connected/not connected,
105
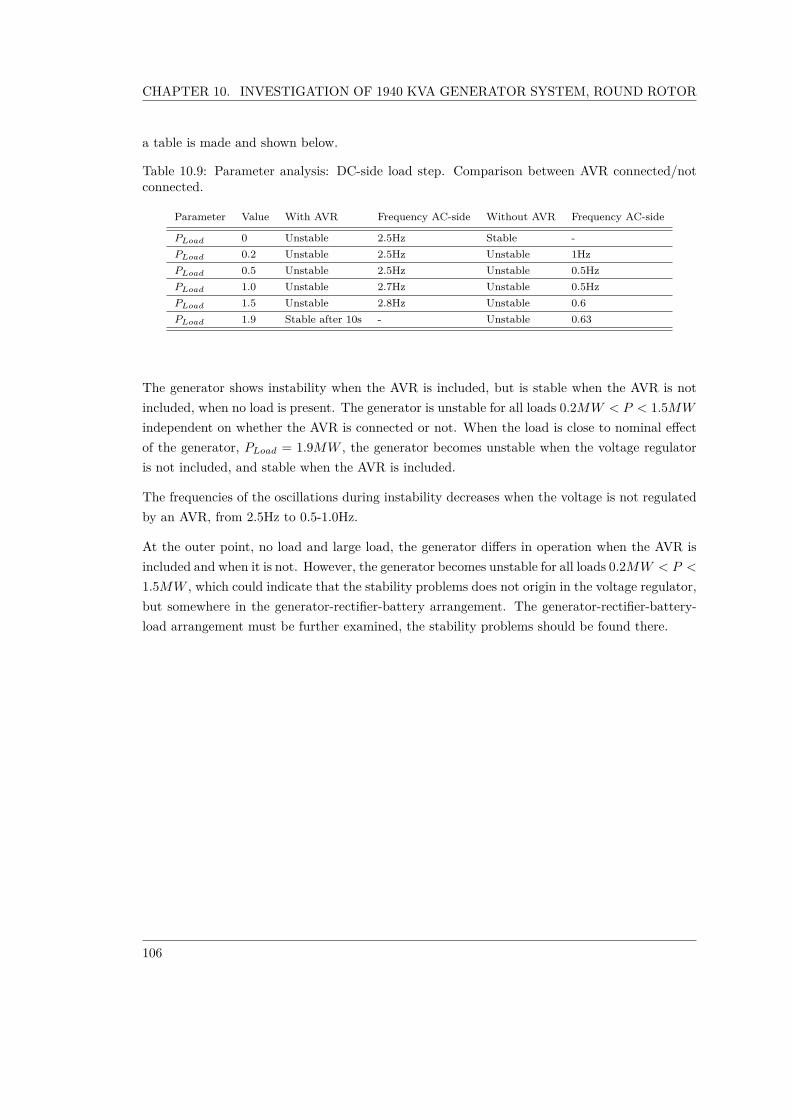
CHAPTER 10. INVESTIGATION OF 1940 KVA GENERATOR SYSTEM, ROUND ROTOR
a table is made and shown below.
Table 10.9: Parameter analysis: DC-side load step. Comparison between AVR connected/notconnected.
Parameter Value With AVR Frequency AC-side Without AVR Frequency AC-side
PLoad 0 Unstable 2.5Hz Stable -PLoad 0.2 Unstable 2.5Hz Unstable 1HzPLoad 0.5 Unstable 2.5Hz Unstable 0.5HzPLoad 1.0 Unstable 2.7Hz Unstable 0.5HzPLoad 1.5 Unstable 2.8Hz Unstable 0.6PLoad 1.9 Stable after 10s - Unstable 0.63
The generator shows instability when the AVR is included, but is stable when the AVR is notincluded, when no load is present. The generator is unstable for all loads 0.2MW < P < 1.5MW
independent on whether the AVR is connected or not. When the load is close to nominal e�ectof the generator, PLoad = 1.9MW , the generator becomes unstable when the voltage regulatoris not included, and stable when the AVR is included.
The frequencies of the oscillations during instability decreases when the voltage is not regulatedby an AVR, from 2.5Hz to 0.5-1.0Hz.
At the outer point, no load and large load, the generator di�ers in operation when the AVR isincluded and when it is not. However, the generator becomes unstable for all loads 0.2MW < P <
1.5MW , which could indicate that the stability problems does not origin in the voltage regulator,but somewhere in the generator-rectifier-battery arrangement. The generator-rectifier-battery-load arrangement must be further examined, the stability problems should be found there.
106

10.4. G2 WITH ROUND ROTOR WITHOUT AVR
10.4.2 Parameter analysis of battery on the DC-side of the rectifier
The capacitor and series resistance modeling the battery in the electrical system on the shipunder study, is shown in the figure below.
Figure 10.20: The system after the generator-rectifier-arrangement consists of a battery modeled by a series resistance
Rbattery
and a capacitor with significant value Cbattery
. A resistance Rload
is placed in parallel with the battery and
is adjustable.
Where xf is the field reactance, If is the field current, Uf is the field voltage, Ea is the terminalvoltage, Ra is the armature resistance, X“d is the d-axis subtransient reactance, D is the diode-bridge rectifier, UR is the DC voltage out from the rectifier, RBattery is the series resistance,CBattery is the capacitance and RLoad is the resistance in parallel to the battery.
To investigate why the frequency of the voltage increases in value after the rectifier, the param-eters of the resistance Rbattery and the capacitor Cbattery must be examined. The generator G2is still modeled with a round rotor, with X‘q = Xq, and with only the governor connected tothe generator-model. The voltage regulator is not included. A constant DC-source excites thegenerator-field with 21V, as shown in Fig 10.20.
The table below summarize the parameter analysis where the value of resistance Rbattery and thecapacitor Cbattery is varied. The load resistance RLoad is not included yet, to analyze only howthe battery a�ects the stability of the system. It will be included later, and analyzed separately,before both the parameters of the battery and the load resistance is analyzed together.
107
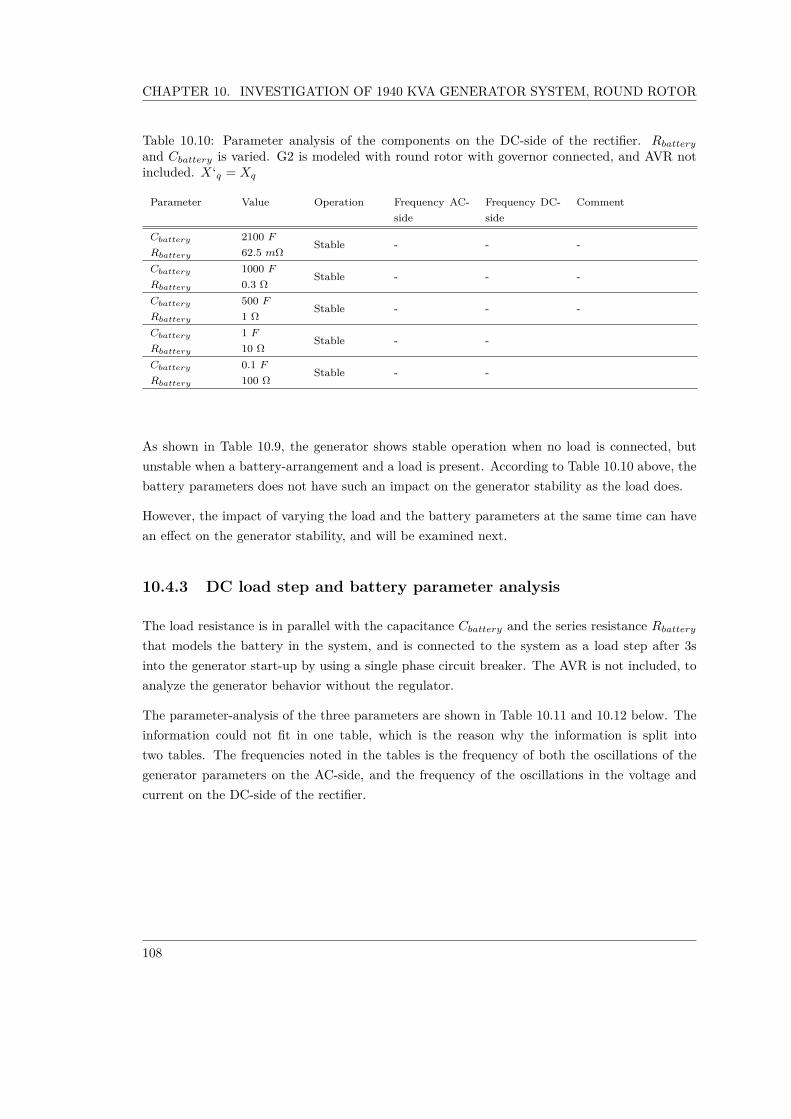
CHAPTER 10. INVESTIGATION OF 1940 KVA GENERATOR SYSTEM, ROUND ROTOR
Table 10.10: Parameter analysis of the components on the DC-side of the rectifier. Rbattery
and Cbattery is varied. G2 is modeled with round rotor with governor connected, and AVR notincluded. X‘q = Xq
Parameter Value Operation Frequency AC-side
Frequency DC-side
Comment
Cbattery 2100 FStable - - -
Rbattery 62.5 m�Cbattery 1000 F
Stable - - -Rbattery 0.3 �Cbattery 500 F
Stable - - -Rbattery 1 �Cbattery 1 F
Stable - -Rbattery 10 �Cbattery 0.1 F
Stable - -Rbattery 100 �
As shown in Table 10.9, the generator shows stable operation when no load is connected, butunstable when a battery-arrangement and a load is present. According to Table 10.10 above, thebattery parameters does not have such an impact on the generator stability as the load does.
However, the impact of varying the load and the battery parameters at the same time can havean e�ect on the generator stability, and will be examined next.
10.4.3 DC load step and battery parameter analysis
The load resistance is in parallel with the capacitance Cbattery and the series resistance Rbattery
that models the battery in the system, and is connected to the system as a load step after 3sinto the generator start-up by using a single phase circuit breaker. The AVR is not included, toanalyze the generator behavior without the regulator.
The parameter-analysis of the three parameters are shown in Table 10.11 and 10.12 below. Theinformation could not fit in one table, which is the reason why the information is split intotwo tables. The frequencies noted in the tables is the frequency of both the oscillations of thegenerator parameters on the AC-side, and the frequency of the oscillations in the voltage andcurrent on the DC-side of the rectifier.
108

10.4. G2 WITH ROUND ROTOR WITHOUT AVR
Table 10.11: Parameter analysis of the components Rbattery and Cbattery on the DC-side of the rectifier, whilea load step in the parallel resistance PLoad is simulated. G2 is modeled with round rotor with governor connected,and AVR not included. X‘q = Xq
Parameter Value Operation Frequency AC-side Frequency DC-side Comment
Cbattery 2100F
Unstable 1.0Hz 1.0Hz Small oscillationsRbattery 0.0625�PLoad 0.2MW
Cbattery 3000F
Unstable 1.0Hz 1.0Hz Small oscillationsRbattery 0.0625�PLoad 0.2MW
Cbattery 1000F
Unstable 1.0Hz 1.0Hz Small oscillationsRbattery 0.0625�PLoad 0.2MW
Cbattery 500F
Unstable 1.0Hz 1.0Hz Small oscillationsRbattery 0.0625�PLoad 0.2MW
Cbattery 5F
Unstable 0.8Hz 0.8HzRbattery 0.0625�PLoad 0.2MW
Table 10.12: Continuation of Table 10.11: Parameter analysis of the components Rbattery and Cbattery on theDC-side of the rectifier, while a load step in the parallel resistance RLoad is simulated. G2 is modeled with roundrotor with governor connected, and AVR not included. X‘q = Xq
Parameter Value Operation Frequency AC-side Frequency DC-side Comment
Cbattery 2100F
Stable - -Rbattery 0.625�PLoad 0.2MW
Cbattery 2100F
Stable - -Rbattery 6.25�PLoad 0.2MW
Cbattery 2100F
Unstable 0.3Hz 0.3HzRbattery 0.00625�PLoad 0.2MW
Cbattery 500F
Unstable 0.5Hz 0.5Hz -Rbattery 0.0625�PLoad 0.5MW
Cbattery 3000F
Unstable 0.5Hz 0.5Hz -Rbattery 0.0625�PLoad 0.5MW
Cbattery 500F
Unstable 0.37Hz 0.37Hz -Rbattery 0.00625�PLoad 1.5MW
From the tables above, it is noticed that when a low value of the capacitance is applied to the
109

CHAPTER 10. INVESTIGATION OF 1940 KVA GENERATOR SYSTEM, ROUND ROTOR
model, the frequency of the oscillations decreases, meaning that the period of one oscillationincreases. It is also observed that when the resistance in the battery is increased, the systembecomes stable, which is shown in earlier simulations. It is also already noted from earliersimulations, that a high load makes the period of the oscillations increases as the load increases,meaning that the frequency decreases.
10.4.4 Without the battery
Table 10.13: DC-side load step without battery.
Parameter Value Operation Comment Frequency AC-side Frequency DC-side
PLoad 0 Stable - -PLoad 0.2MW Stable - -PLoad 0.5MW Stable - -PLoad 1.0MW Stable - -PLoad 1.5MW Stable - -PLoad 1.9MW Stable - -
When the battery is not included, the generator is stable for all values of the load resistance whenthe AVR is not included. The observations done on the ship says that the stability problemsincreases by connecting a battery to the dc-bus, but exists still when the battery is not connected.This observations is however done while the voltage regulator is connected. It is still interestingto note that the simulations shows a stable generator start-up when the battery is not connectedwhen the AVR is not included in the model.
10.5 AC5A Voltage Regulator
Another voltage regulator, named AC5A, is now attached to the generator. The AVR AC5Ais typically used in brushless excitation systems, and di�ers from other ac models in the waythat the model uses loaded rather than open circuit exciter saturation data. It is widely used inthe industry. The one-line diagram and parameter settings is found in Appendix H, where theparameter settings is found from [23].
10.5.1 Reference value of AC5A
In subchapter 9.4 for salient pole G2 and in subchapter 10.3 for round rotor G2, the referencevalue of the voltage regulator was changed, and the rms terminal voltage of the generator wasstudied. When the AVR type A was applied, the response to a change the reference value was
110
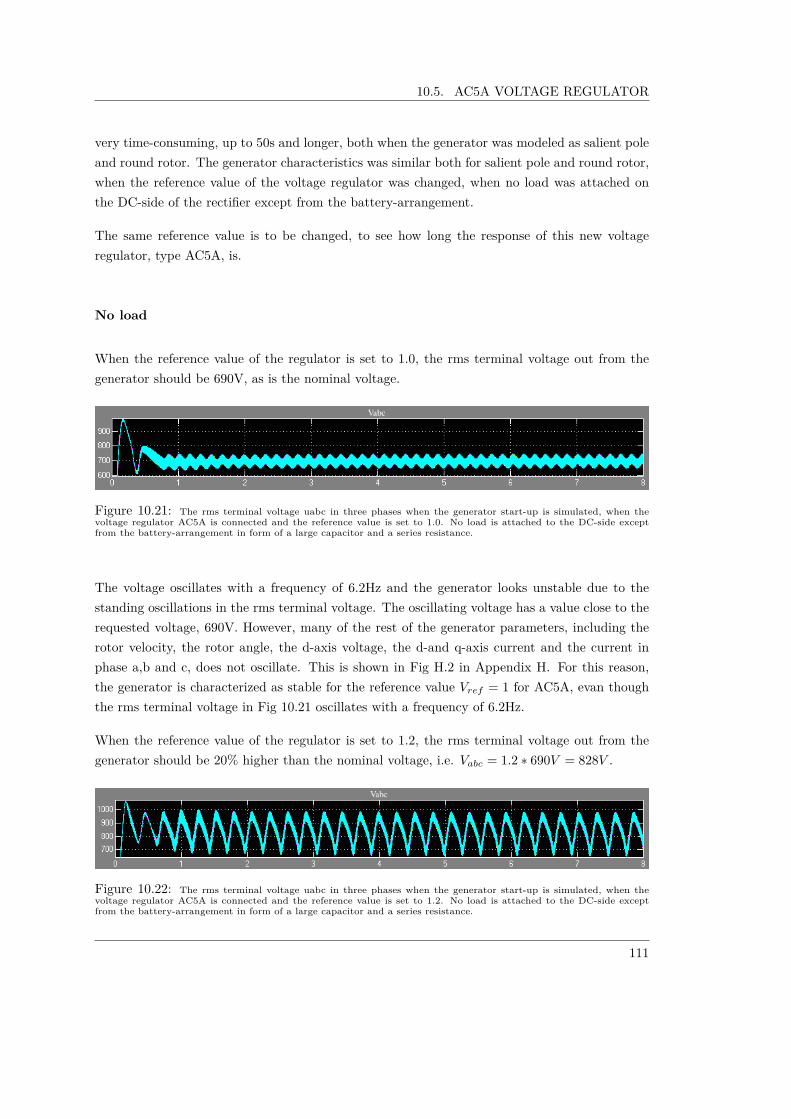
10.5. AC5A VOLTAGE REGULATOR
very time-consuming, up to 50s and longer, both when the generator was modeled as salient poleand round rotor. The generator characteristics was similar both for salient pole and round rotor,when the reference value of the voltage regulator was changed, when no load was attached onthe DC-side of the rectifier except from the battery-arrangement.
The same reference value is to be changed, to see how long the response of this new voltageregulator, type AC5A, is.
No load
When the reference value of the regulator is set to 1.0, the rms terminal voltage out from thegenerator should be 690V, as is the nominal voltage.
Figure 10.21: The rms terminal voltage uabc in three phases when the generator start-up is simulated, when the
voltage regulator AC5A is connected and the reference value is set to 1.0. No load is attached to the DC-side except
from the battery-arrangement in form of a large capacitor and a series resistance.
The voltage oscillates with a frequency of 6.2Hz and the generator looks unstable due to thestanding oscillations in the rms terminal voltage. The oscillating voltage has a value close to therequested voltage, 690V. However, many of the rest of the generator parameters, including therotor velocity, the rotor angle, the d-axis voltage, the d-and q-axis current and the current inphase a,b and c, does not oscillate. This is shown in Fig H.2 in Appendix H. For this reason,the generator is characterized as stable for the reference value Vref = 1 for AC5A, evan thoughthe rms terminal voltage in Fig 10.21 oscillates with a frequency of 6.2Hz.
When the reference value of the regulator is set to 1.2, the rms terminal voltage out from thegenerator should be 20% higher than the nominal voltage, i.e. Vabc = 1.2 ú 690V = 828V .
Figure 10.22: The rms terminal voltage uabc in three phases when the generator start-up is simulated, when the
voltage regulator AC5A is connected and the reference value is set to 1.2. No load is attached to the DC-side except
from the battery-arrangement in form of a large capacitor and a series resistance.
111

CHAPTER 10. INVESTIGATION OF 1940 KVA GENERATOR SYSTEM, ROUND ROTOR
The voltage oscillates with a frequency of 3.7Hz and the generator output shows standing oscil-lations, indicating instability. The oscillating voltage has a value close to the requested voltage,828V.
The voltage of the dc-side of the rectifier is shown below.
Figure 10.23: The voltage on the dc-side of the rectifier Vdc
when the generator start-up is simulated, the voltage
regulator AC5A is connected and the reference value is set to 1.2. No load is attached to the DC-side except from the
battery-arrangement in form of a large capacitor and a series resistance.
The dc-voltage oscillates around the value 1120V. This is higher than the dc-voltage after therectifier observed for the AVR type A (1030V) when the same battery-arrangement and no loadis connected.
When the reference value of the regulator is set to 1.4, the rms terminal voltage out from thegenerator should be 40% higher than the nominal voltage, i.e. Vabc = 1.4 ú 690V = 966V .
Figure 10.24: The rms terminal voltage uabc in three phases when the generator start-up is simulated, when the
voltage regulator AC5A is connected and the reference value is set to 1.4. No load is attached to the DC-side except
from the battery-arrangement in form of a large capacitor and a series resistance.
The voltage oscillates with a frequency of 66.67Hz and the generator is stable. The voltage has
112
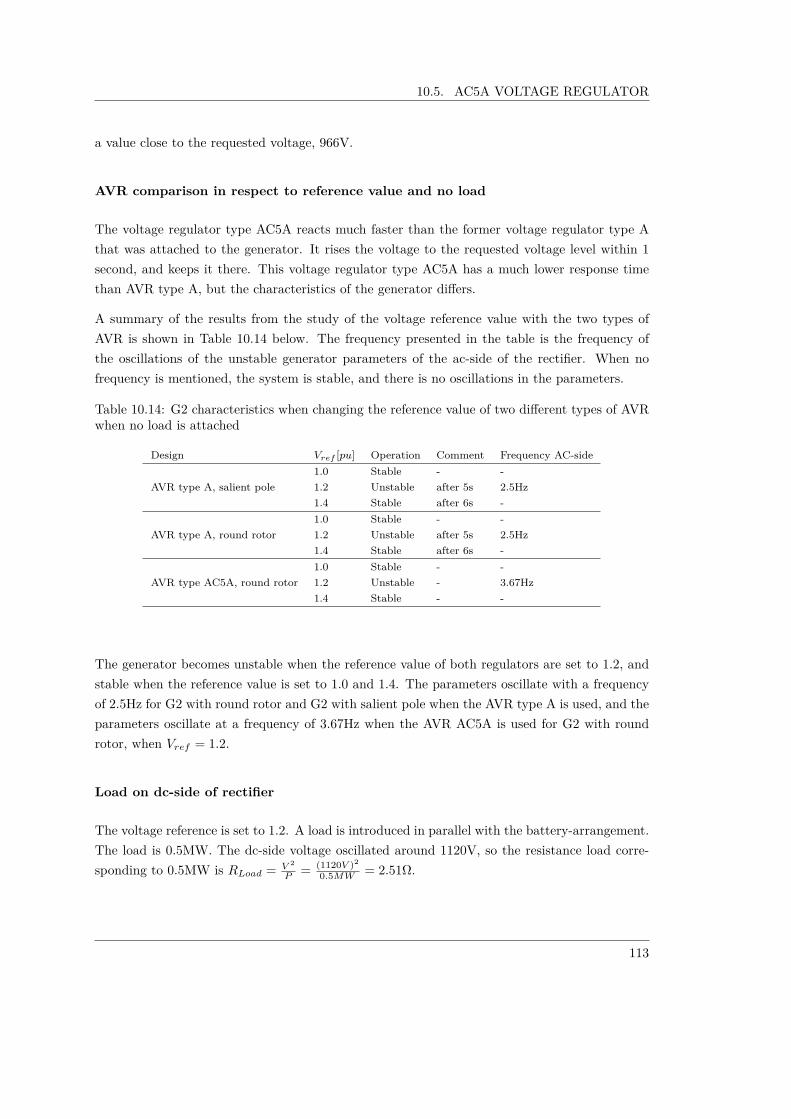
10.5. AC5A VOLTAGE REGULATOR
a value close to the requested voltage, 966V.
AVR comparison in respect to reference value and no load
The voltage regulator type AC5A reacts much faster than the former voltage regulator type Athat was attached to the generator. It rises the voltage to the requested voltage level within 1second, and keeps it there. This voltage regulator type AC5A has a much lower response timethan AVR type A, but the characteristics of the generator di�ers.
A summary of the results from the study of the voltage reference value with the two types ofAVR is shown in Table 10.14 below. The frequency presented in the table is the frequency ofthe oscillations of the unstable generator parameters of the ac-side of the rectifier. When nofrequency is mentioned, the system is stable, and there is no oscillations in the parameters.
Table 10.14: G2 characteristics when changing the reference value of two di�erent types of AVRwhen no load is attached
Design Vref [pu] Operation Comment Frequency AC-side
AVR type A, salient pole1.0 Stable - -1.2 Unstable after 5s 2.5Hz1.4 Stable after 6s -
AVR type A, round rotor1.0 Stable - -1.2 Unstable after 5s 2.5Hz1.4 Stable after 6s -
AVR type AC5A, round rotor1.0 Stable - -1.2 Unstable - 3.67Hz1.4 Stable - -
The generator becomes unstable when the reference value of both regulators are set to 1.2, andstable when the reference value is set to 1.0 and 1.4. The parameters oscillate with a frequencyof 2.5Hz for G2 with round rotor and G2 with salient pole when the AVR type A is used, and theparameters oscillate at a frequency of 3.67Hz when the AVR AC5A is used for G2 with roundrotor, when Vref = 1.2.
Load on dc-side of rectifier
The voltage reference is set to 1.2. A load is introduced in parallel with the battery-arrangement.The load is 0.5MW. The dc-side voltage oscillated around 1120V, so the resistance load corre-sponding to 0.5MW is RLoad = V 2
P = (1120V )
2
0.5MW = 2.51�.
113

CHAPTER 10. INVESTIGATION OF 1940 KVA GENERATOR SYSTEM, ROUND ROTOR
Figure 10.25: The rms terminal voltage uabc in three phases when the generator start-up is simulated, when the
voltage regulator AC5A is connected and the reference value is set to 1.2. A load of RLoad
= 2.51� is attached after 2
seconds in parallel with the battery.arrangement, corresponding to 0.5MW.
The rms terminal voltage oscillates with a frequency of 3.75Hz. The load is increased to 1.5MW,corresponding to RLoad = V 2
P = (1120V )
2
1.5MW = 0.836�.
Figure 10.26: The rms terminal voltage uabc in three phases when the generator start-up is simulated, when the
voltage regulator AC5A is connected and the reference value is set to 1.2. A load of RLoad
= 0.836� is attached after 2
seconds in parallel with the battery-arrangement, corresponding to 1.5MW.
The oscillations decreases in amplitude when the load is introduced 3 seconds into the simulation.The frequency of the oscillations increases to 5.5Hz. The load is increased further, to 1.9MW.
Figure 10.27: The rms terminal voltage uabc in three phases when the generator start-up is simulated, when the
voltage regulator AC5A is connected and the reference value is set to 1.2. A load of RLoad
= 0.66� is attached after 2
seconds in parallel with the battery-arrangement, corresponding to 1.9MW.
The oscillations in the rms terminal voltage out from the generator decreases and vanishedcompletely when the load is increased to 1.9MW. This corresponds to earlier observations donewhen the AVR type A was used and the generator operates at the limit of its capacity.
114

10.6. SIMULINK BATTERY
10.6 Simulink Battery
A new, more complex version of the battery than the large capacitor-series resistance is addedto the model. This new battery-model makes it easier to study what happens inside the battery,and how much the battery can deliver to the load in ratio to the generator. The battery ismodeled by a battery-block from the Simscape-library. Both the AVR type AC5A and the AVRtype A is applied.
10.6.1 AVR type A
As mentioned earlier, the stability problems in the synchronous generator is increased when thebattery is connected to the DC-bus in the ship. It is therefore important to study the impactof the battery on the SM in the SimPowerSystems model, both during no-load and when anadjustable load is attached in parallel with the battery and is supplied from both the generatorand battery. The AVR type A is first applied. The reference value of the AVR is set to 1.2.
Earlier, the battery was modeled as a large capacitor and a series resistance, as shown in Fig10.20. Now, this configuration is replaced by a battery-block from the Simscape-library, as shownin the one-line diagram in Fig 10.28 below. The battery is of the lithium-ion type, similar to thetype used on the ship.
Figure 10.28: The system after the generator-rectifier-arrangement consists of a battery block B. D represents the
diode-bridge rectifier. A resistance Rload
is placed in parallel with the battery and is adjustable.
The size of the battery can be adjusted, but as a first presumption, the battery can be assumedto be 150Ah. Some evaluation of this battery capacity is needed. If it is assumed that the batterycan operate in 1h, the current is 150A since C = h ú A. The voltage that the battery receives
115

CHAPTER 10. INVESTIGATION OF 1940 KVA GENERATOR SYSTEM, ROUND ROTOR
from the generator trough the rectifier is approximately 1000V. This makes the power of thebattery Pbattery = 150A ú 1000V = 150kW . The nominal power of the generator is 1940kVA,which makes the size of the battery approximately 7-8% of the size of the generator.
With this battery capacity, the battery can take some spikes of the load characteristics whenneeded. It can support the generator, delivering about 8% of the power needed in one hour, or itcan support a larger percentage of the load supplied for shorter periods if redundancy is needed.A battery capacitance of 150Ah seems for these reasons appropriate.
500Ah: P=500A*1000V=500kW –> 26%
The nominal voltage of the battery is set to be 1030V and the initial state of charge is setto 100%. The equivalent circuit, discharge model and charging model of the lithium-ion typebattery is shown in Appendix G. The voltage regulator type A and governor is included andconnected to the generator, and the reference value of the AVR is set to 1.2.
The discharge characteristics of the battery is shown in Fig 10.29 and Fig 10.30 below.
Figure 10.29: The nominal current discharge characteristics of the battery.
116

10.6. SIMULINK BATTERY
Figure 10.30: The battery profile.
The nominal current discharge characteristic taken from the battery shows the nominal and theexponential area and the discharge current. It can be red from the graph that if the currentdrawn from the battery is 50A, the battery can deliver 1115V for one hour. If the current drawnis 100A, the battery can deliver 1115V for two hours.
The constant voltage E0
is 1115V, which is 85V higher than the nominal voltage. If the ratedcapacity is increased to 300Ah, but the initial voltage is kept to 1030V, the constant voltage isstill 1115V, as shown in Appendix G.3. If the initial voltage is decreased to 950V, and the ratedcapacity is kept at 300Ah, the constant voltage is decreased to 1029V, as shown in AppendixG.4. This is a di�erence of +80V from the initial voltage. It seems that the constant voltageis increased by some 8% from the initial voltage inserted, and that the capacity (Ah) does notimpact the constant voltage.
Because the bus voltage is 1030V dc, the initial voltage of the battery is decreased from 1030to 950V to get a constant voltage of ¥1030V. The discharge characteristics for the battery with150Ah and nominal voltage of 950V is shown in Appendix G.5.
No load
The voltage, current and state of charge out from the battery measured during the simulationof the generator start-up is shown in Fig 10.31 below. The load is not yet attached, to see howthe charging current and voltage of the battery is, without any load to supply. The initial stateof charge is 100%.
117

CHAPTER 10. INVESTIGATION OF 1940 KVA GENERATOR SYSTEM, ROUND ROTOR
Figure 10.31: From the top: the voltage (yellow), rms voltage (pink), current (yellow), mean current (pink), and
state of charge of the battery during the generator start-up, when no load is attached. The battery has a capacity of
150Ah and a nominal voltage of 950V.
From the bottom, it is observed that the state of charge starts at the initial charge of 100%,before it drops 0.8%. The voltage increases as the SoC drops, and the current is positive anddecreases. Because there is no load attached, the battery starts to charge after 4 seconds, causingthe voltage to increase up to a value of 1100V. The current is defined as positive when the batteryis discharging, and negative when the battery charges, and has a value of -100A after 5 seconds.The generator supplies the battery with a power of P = V ú |I| = 1100V ú100A = 110kW (¥ 6%of the generator size, 1.94MW).
It is observed no oscillations from the outputs from the battery. The rms terminal voltage andterminal current from the generator is shown in Fig 10.32 below.
118

10.6. SIMULINK BATTERY
Figure 10.32: From the top: the rms terminal voltage uabc from the 1940kVA generator with round rotor, when a
SimScape battery-block of 150Ah and no load is attached after the rectifier. The governor and AVR with Vref
= 1.2 is
attached.
No instabilities are observed from the terminal voltage of the generator when no load is at-tached at the dc-side of the rectifier except form the 150Ah battery. This coincides with earlierobservations when simulating the generator start-up of the 1940kVA generator with no load ex-cept from a battery-arrangement, and AVR type A attached. The terminal voltage adjusts toapproximately 828V, as the regulator is programmed to do.
Next, a load is attached and the stability is studied while the load is varied.
Load at dc-side of rectifier
A load is now introduced after 3 seconds into the simulation. The load is active and have amagnitude of 0.5MW. This is almost 26% of the generator size (1.94MW). The bus voltage is1030V. Therefore is a load of RLoad = U2
P = (1030V )
2
500kW = 2.122� attached after 3 seconds into thegenerator start-up simulation. The voltage, current and state of charge out from the battery inthis situation is shown in Fig 10.33.
119

CHAPTER 10. INVESTIGATION OF 1940 KVA GENERATOR SYSTEM, ROUND ROTOR
Figure 10.33: From the top: the voltage (yellow), rms voltage (pink), current (yellow), mean current (pink), and state
of charge of the battery during the generator start-up, when a load of RLoad
= 2.122� which corresponds to 500kW,
is connected to the dc-side of the rectifier 3 seconds into the simulation. The battery has a capacity of 150Ah and a
nominal voltage of 950V.
After 10 seconds, the current is negative, indicating that the battery charges, and that thegenerator supplies both the battery and load after 10 seconds. This is also shown in the graphat the bottom of Fig 10.33, showing SoC; after 10 seconds the state of charge increases.
The rms terminal voltage and terminal current from the generator is shown in Fig 10.34 below.
Figure 10.34: From the top: the rms terminal voltage uabc from the 1940kVA generator with round rotor, when
a SimScape battery-block of 150Ah and a load of 0.5MW is attached after the rectifier. The governor and AVR with
Vref
= 1.2 is attached.
120
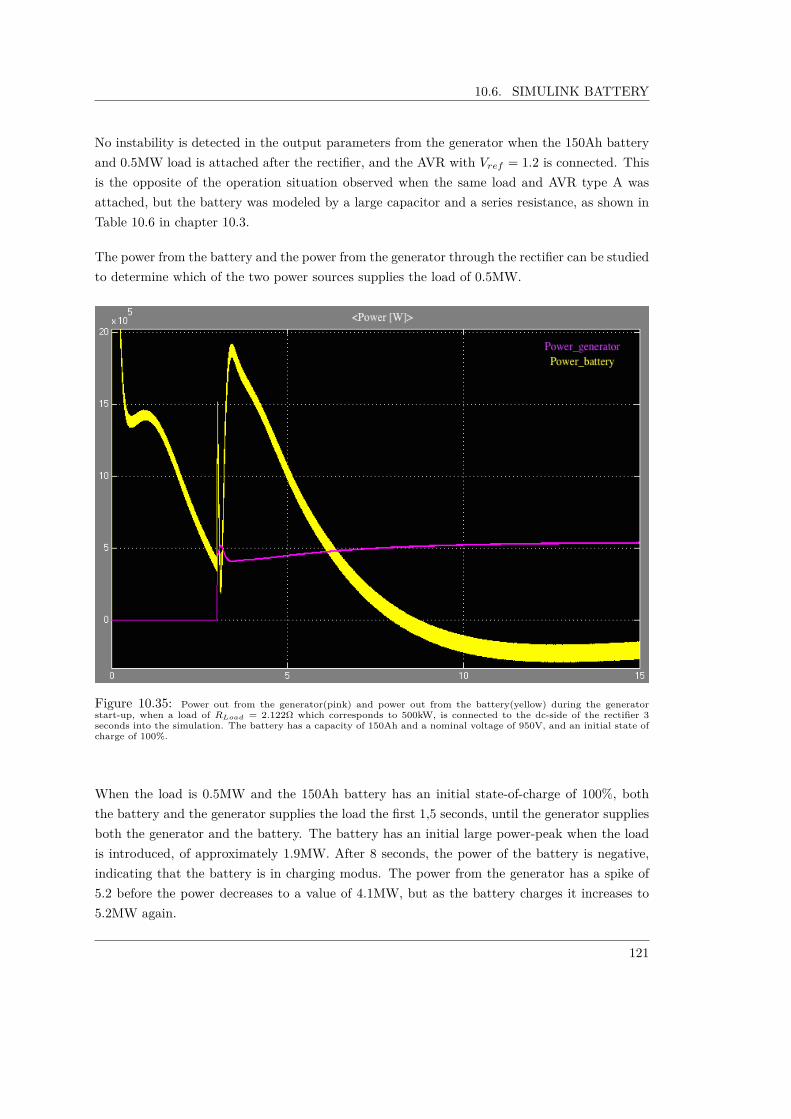
10.6. SIMULINK BATTERY
No instability is detected in the output parameters from the generator when the 150Ah batteryand 0.5MW load is attached after the rectifier, and the AVR with Vref = 1.2 is connected. Thisis the opposite of the operation situation observed when the same load and AVR type A wasattached, but the battery was modeled by a large capacitor and a series resistance, as shown inTable 10.6 in chapter 10.3.
The power from the battery and the power from the generator through the rectifier can be studiedto determine which of the two power sources supplies the load of 0.5MW.
Figure 10.35: Power out from the generator(pink) and power out from the battery(yellow) during the generator
start-up, when a load of RLoad
= 2.122� which corresponds to 500kW, is connected to the dc-side of the rectifier 3
seconds into the simulation. The battery has a capacity of 150Ah and a nominal voltage of 950V, and an initial state of
charge of 100%.
When the load is 0.5MW and the 150Ah battery has an initial state-of-charge of 100%, boththe battery and the generator supplies the load the first 1,5 seconds, until the generator suppliesboth the generator and the battery. The battery has an initial large power-peak when the loadis introduced, of approximately 1.9MW. After 8 seconds, the power of the battery is negative,indicating that the battery is in charging modus. The power from the generator has a spike of5.2 before the power decreases to a value of 4.1MW, but as the battery charges it increases to5.2MW again.
121

CHAPTER 10. INVESTIGATION OF 1940 KVA GENERATOR SYSTEM, ROUND ROTOR
When the same load is introduced after 3 seconds, but the 150Ah battery starts with an initialstate-of-charge of 80% instead of 100%, the distribution of the load-supply changes characteris-tics, as shown from the power-graph below.
Figure 10.36: Power out from the generator(pink) and power out from the battery(yellow) during the generator
start-up, when a load of RLoad
= 2.122� which corresponds to 500kW, is connected to the dc-side of the rectifier 3
seconds into the simulation. The battery has a capacity of 150Ah and a nominal voltage of 950V, and an initial state of
charge of 80%.
The spike of the power delivered from the battery has decreased to approximately 1.35MW, butthis is still very high. The spike of the power delivered by the generator is 1.1MW high, goingfrom 4.1MW to 5.2MW. This is the same as before. The generator delivers all the power to theload after 2.3 seconds after it was introduced, i.e 5.3 seconds into the simulation. The batterystarts charging after 6.5 seconds into the simulation, and the power from the generator startsto increase towards 6MW, indicating that is supplies both the battery (110kW) and the load(0.5MW).
It is interesting to see how the generator behaves when the battery is not connected at all, butthe same load is introduced after 3 seconds.
122

10.6. SIMULINK BATTERY
Figure 10.37: Power out from the generator during the generator start-up, when a load of RLoad
= 2.122� which
corresponds to 500kW, is connected to the dc-side of the rectifier 3 seconds into the simulation. The battery is not
included.
The spike is 1.1MW high, going from 4.1MW to 5.2MW when the battery is removed. Thisis the same as it was before, when the battery was included. The generator seem to not havechanged behavior when the battery is removed.
The load is increased, to see if the load-supply distribution between the generator and batterychanges, and to see if any instability is to be detected, like in earlier simulation including AVR,battery and load. The load is increased to 1.5MW.
123

CHAPTER 10. INVESTIGATION OF 1940 KVA GENERATOR SYSTEM, ROUND ROTOR
Figure 10.38: Power out from the generator(pink) and power out from the battery(yellow) during the generator
start-up, when a load of RLoad
= 0.707� which corresponds to 1.5MW, is connected to the dc-side of the rectifier 3
seconds into the simulation. The battery has a capacity of 150Ah and a nominal voltage of 950V, and an initial state of
charge of 80%.
No instability is detected as a result of the attachment of an increased load. The spike of thepower delivered from the generator reaches 1.45MW when the load is introduced after 3 seconds,then it falls down to 0.77MW, before it starts to climb towards 1.26MW. It supplies load aloneafter 7.8seconds. The spike of the battery reaches 3.3MW before it decharges.
To study the generator stability when the generator operates at the limit of its capacity, the loadis increased. The battery draws 110kW. If the generator is to operate at the limit of its capacity,1.94MW, the load must be 1.94MW-0.11MW=1.83MW. This corresponds to a resistance loadof RLoad = (1030V )
2
1.83MW = 0.58�. The load is attached 3 seconds into the start-up simulation of themotor.
124
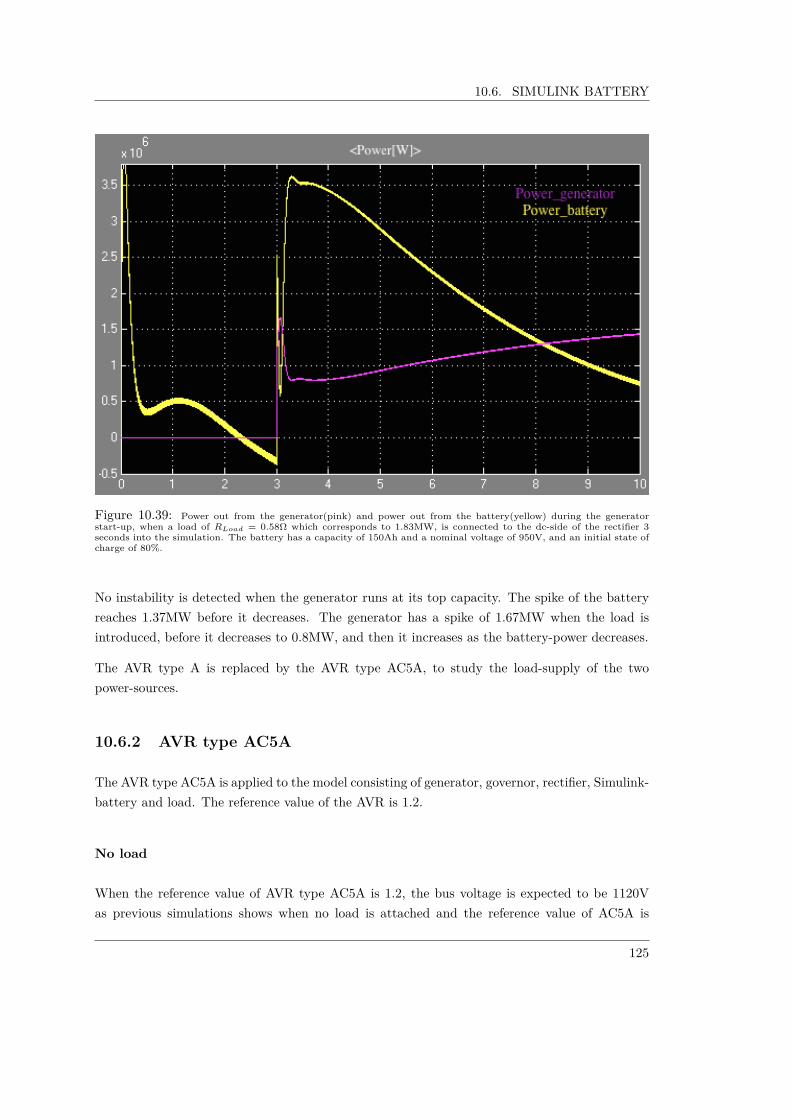
10.6. SIMULINK BATTERY
Figure 10.39: Power out from the generator(pink) and power out from the battery(yellow) during the generator
start-up, when a load of RLoad
= 0.58� which corresponds to 1.83MW, is connected to the dc-side of the rectifier 3
seconds into the simulation. The battery has a capacity of 150Ah and a nominal voltage of 950V, and an initial state of
charge of 80%.
No instability is detected when the generator runs at its top capacity. The spike of the batteryreaches 1.37MW before it decreases. The generator has a spike of 1.67MW when the load isintroduced, before it decreases to 0.8MW, and then it increases as the battery-power decreases.
The AVR type A is replaced by the AVR type AC5A, to study the load-supply of the twopower-sources.
10.6.2 AVR type AC5A
The AVR type AC5A is applied to the model consisting of generator, governor, rectifier, Simulink-battery and load. The reference value of the AVR is 1.2.
No load
When the reference value of AVR type AC5A is 1.2, the bus voltage is expected to be 1120Vas previous simulations shows when no load is attached and the reference value of AC5A is
125
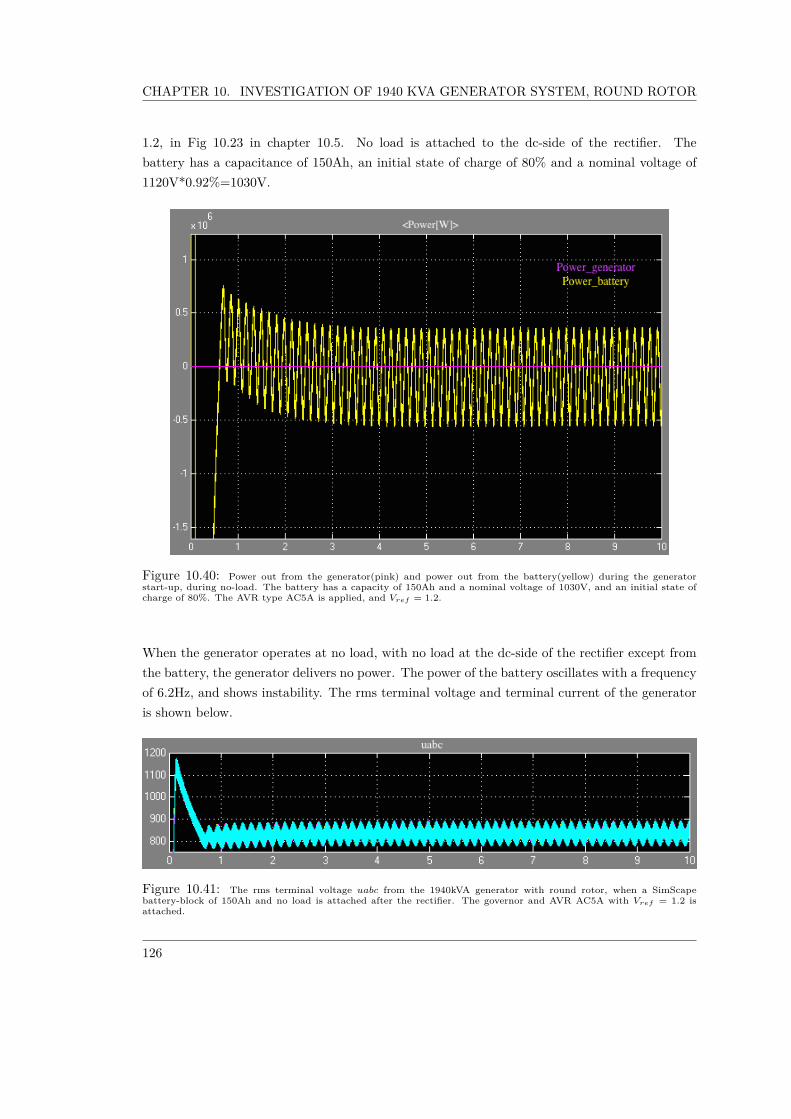
CHAPTER 10. INVESTIGATION OF 1940 KVA GENERATOR SYSTEM, ROUND ROTOR
1.2, in Fig 10.23 in chapter 10.5. No load is attached to the dc-side of the rectifier. Thebattery has a capacitance of 150Ah, an initial state of charge of 80% and a nominal voltage of1120V*0.92%=1030V.
Figure 10.40: Power out from the generator(pink) and power out from the battery(yellow) during the generator
start-up, during no-load. The battery has a capacity of 150Ah and a nominal voltage of 1030V, and an initial state of
charge of 80%. The AVR type AC5A is applied, and Vref
= 1.2.
When the generator operates at no load, with no load at the dc-side of the rectifier except fromthe battery, the generator delivers no power. The power of the battery oscillates with a frequencyof 6.2Hz, and shows instability. The rms terminal voltage and terminal current of the generatoris shown below.
Figure 10.41: The rms terminal voltage uabc from the 1940kVA generator with round rotor, when a SimScape
battery-block of 150Ah and no load is attached after the rectifier. The governor and AVR AC5A with Vref
= 1.2 is
attached.
126

10.6. SIMULINK BATTERY
The voltage oscillates with a frequency of 6.2Hz and the generator seems to be unstable dueto the standing oscillations in the rms terminal voltage. The rms voltage oscillates around therequested voltage, 828V. However, many of the rest of the generator parameters, including therotor velocity, the rotor angle, the d-axis voltage, the d-and q-axis current and the current inphase a,b and c, does not oscillate. This is shown in Fig H.3 in Appendix H. For this reason, thegenerator will be classified as stable for the reference value Vref = 1.2 for AVR type AC5A whenthe 150Ah battery is connected, even though the rms terminal voltage in Fig 10.41 oscillateswith a frequency of 6.2Hz. This was also the case for Vref = 1.0 and no load with AVR typeAC5A attached in Chapter 10.5.
Load on dc-side
A load of 0.5MW corresponds to a load resistance of RLoad = V 2
P = (1120V )
2)
0.5MW = 2.51� and isattached 3 seconds into the simulation. The battery has a capacitance of 150Ah, an initial stateof charge of 80% and a nominal voltage of 1030V.
Figure 10.42: Power out from the generator(pink) and power out from the battery(yellow) during the generator
start-up, when a load of RLoad
= 2.51� which corresponds to 0.5MW, is connected to the dc-side of the rectifier 3
seconds into the simulation. The battery has a capacity of 150Ah and a nominal voltage of 1030V, and an initial state
of charge of 80%. The AVR type AC5A is applied, and Vref
= 1.2.
127

CHAPTER 10. INVESTIGATION OF 1940 KVA GENERATOR SYSTEM, ROUND ROTOR
The power from the generator and battery oscillates with a frequency of 6Hz. The power oscillatesaround the value 0.5MW, the size of the load. The load is increased to 1.9MW corresponding toa resistance load of 0.66�.
Figure 10.43: Power out from the generator(pink) and power out from the battery(yellow) during the generator
start-up, when a load of RLoad
= 0.66� which corresponds to 1.9MW, is connected to the dc-side of the rectifier 3
seconds into the simulation. The battery has a capacity of 150Ah and a nominal voltage of 1030V, and an initial state
of charge of 80%. The AVR type AC5A is applied, and Vref
= 1.2.
The generator does not show stability when it runs at its capacity limit. This di�ers fromprevious simulations. The amplitudes increases in size and the frequency is 5Hz. The power ofthe generator oscillates around the load size, 1.9Mw.
10.7 Without the Rectifier
The rectifier and battery is replaced by a delta-connected load. The synchronous generator hasthe initial parameter settings and X‘q = Xq, and the load can be varied. Both voltage regulatorsis tried out, and the reference value of both regulators is set to 1.2.
128
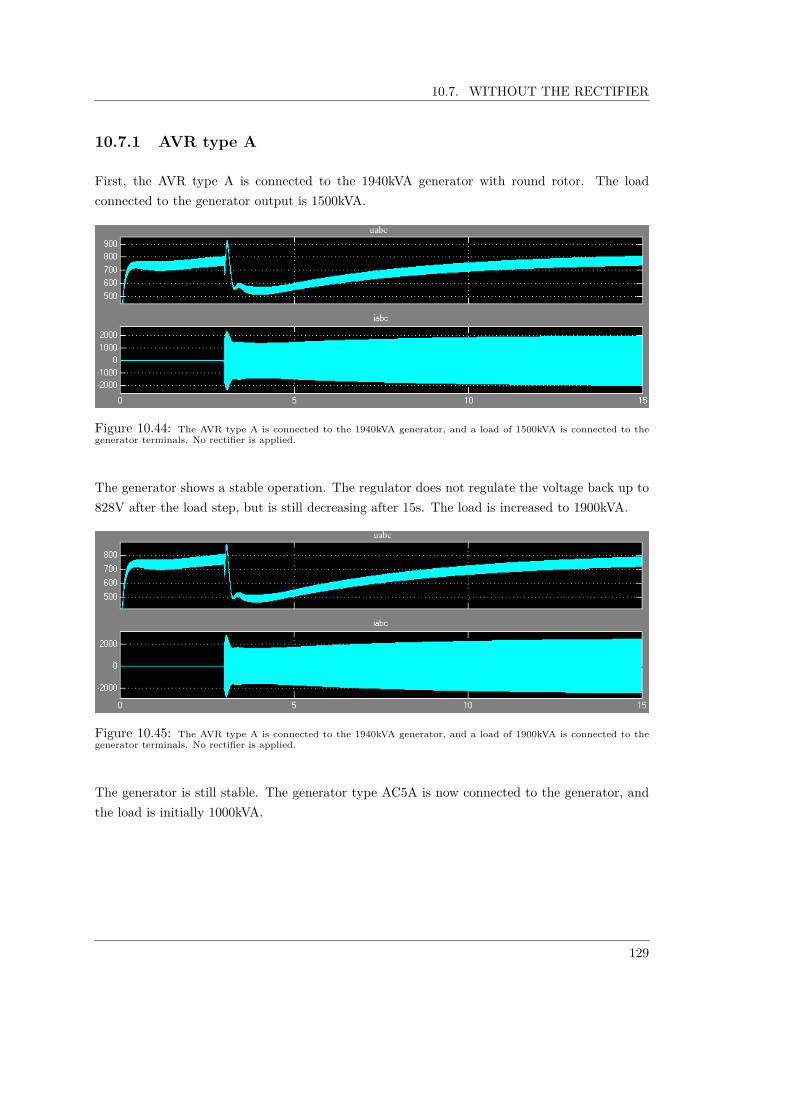
10.7. WITHOUT THE RECTIFIER
10.7.1 AVR type A
First, the AVR type A is connected to the 1940kVA generator with round rotor. The loadconnected to the generator output is 1500kVA.
Figure 10.44: The AVR type A is connected to the 1940kVA generator, and a load of 1500kVA is connected to the
generator terminals. No rectifier is applied.
The generator shows a stable operation. The regulator does not regulate the voltage back up to828V after the load step, but is still decreasing after 15s. The load is increased to 1900kVA.
Figure 10.45: The AVR type A is connected to the 1940kVA generator, and a load of 1900kVA is connected to the
generator terminals. No rectifier is applied.
The generator is still stable. The generator type AC5A is now connected to the generator, andthe load is initially 1000kVA.
129

CHAPTER 10. INVESTIGATION OF 1940 KVA GENERATOR SYSTEM, ROUND ROTOR
10.7.2 AVR type AC5A
The AVR AC5A is applied, with the reference value set to 1.2.
Figure 10.46: The AVR type AC5A is connected to the 1940kVA generator, and a load of 1000kVA is connected to
the generator terminals. No rectifier is applied.
The generator is unstable when the AVR type AC5A is applied with no rectifier and a load of1000kVA. The frequency of the oscillations is of 4.125Hz. The pulsed nature of the current isgone. The load is increased to 1900kVA.
Figure 10.47: The AVR type AC5A is connected to the 1940kVA generator, and a load of 1900kVA is connected to
the generator terminals. No rectifier is applied.
The generator is unstable when the AVR type AC5A is applied with no rectifier and a load of1900kVA. The frequency of the oscillations is of 4.75Hz.
130

10.8. EXCITATION OF THE GENERATOR FIELD
10.8 Excitation of the Generator Field
In the general stability criterion presented by [2], it is suggested that Ud depends on the excitationof the generator. The load is set to 0.5MW, and the voltage of the constant voltage source excitingthe generator field is increased. The load resistance corresponds to RLoad = V 2
P = (1030V )
2
0.5MW =2.122�.
Table 10.15: Excitation voltage. PLoad = 0.5MW
Vexciter Operation Frequency Comment
21V Unstable 0.5Hz -50V Stable - -40V Unstable 1.78Hz -45V Unstable 2.2Hz Decreasing amplitude47.5V Stable after 6s - -46.5V Stable after 5s - -46.0V Stable - -45.5V Stable after 18s - -
The stability is clearly a�ected by the value of the dc-voltage exciting the generate field. Thegenerator is stable when the value of the exciter-voltage is Vexciter > 45V . The load is increased,to see how the operating point a�ects the stability when the exciter-voltage is varied. Thegenerator is expected to reach instability for a lower value of Vexciter for a higher load.
Table 10.16: Excitation voltage. PLoad = 1.5MW
Vexciter Operation Frequency Comment
21V Unstable 0.56Hz -50V Stable - -40V Unstable 1.8Hz -45V Stable after 6s - -42.5V Unstable 2.9Hz -44V Stable after 12s - -43V Unstable 2.17Hz Decreasing43.5V Stable after 19s - -
The generator is stable when the value of the exciter-voltage is 43.5V < Vexciter. This is a lowerstability-limit than when the load was 0.5MW. This was expected, due to the stability criterionpresented by [2]:
131

CHAPTER 10. INVESTIGATION OF 1940 KVA GENERATOR SYSTEM, ROUND ROTOR
X‘2dI‘2d + X‘2qI‘2q Æ 2X‘dI‘dUp (10.3)
that shows that the stability is dependent on the transient current I‘d and the stationary sourcevoltage Up. Up depends on the excitation of the generator. The simulations summarized inTable 10.15 and 10.16 coincides with this theory, by the fact that the stability is enhanced whenthe exciter-voltage increases, which directly a�ects Up in an increasing manner, and that thegenerator reaches instability faster when the load is increased, which directly a�ects I‘d and I‘q.
The load increase a�ects both sides of the equation, but because I‘d and I‘q on the left side ofthe equation is squared, and I‘d on the right side is not, the load increase a�ects the left sideof the equation the most. This a�ects the stability in a negative manner. Based on experiencefrom the ship has [2] concluded that the stability problems can not be eliminated or damped bycontrolling the excitation current, because the transient current I‘ changes much faster than theexcitation current.
However, the di�erence between the stable value of exciter-voltage when the load is 0.5MW andwhen the load is 1.5MW is not as large as would be expected.
As simulations done in this thesis has shown, reaches the generator stability when it operatesat its capacity limit, meaning at high load. The load is increased even further, to 1.9MW. Thiscorresponds to a resistance load of RLoad = (1030V )
2
1.9MW = 0.56�.
Table 10.17: Excitation voltage. PLoad = 1.9MW
Vexciter Operation Frequency Comment
21V Unstable 0.625Hz -50V Stable - -40V Unstable 1.85Hz -45V Stable - -42.5V Stable after 19s - -41.5V Unstable 1.88Hz -42V Unstable 2Hz Decreasing
The generator is stable when the value of the exciter-voltage is 42.5V < Vexciter, which is a lowervalue than when the load was 0.5MW and 1.5MW, but the di�erence between the stable valueof exciter-voltage when the load is 1.9MW compared to when the load is 0.5MW and 1.5MW, issmaller than expected. This can indicate that the load is not as influential on generator stabilityas the exciter current is. Meaning that increasing Ud a�ects the stability in a more positivemanner, than the increasing of I‘ a�ects the stability in a negative manner. The results fromthe exciter-voltage varying experiment is shown in Table 10.18 below.
132

10.9. IMPACT OF SUBTRANSIENT REACTANCES ON STABILITY
Table 10.18: Criterion for exciter-voltage value for a stable operation at di�erent loads.
PLoad Exciter voltage to secure stable operation
0.5MW Vexciter > 45V
1.5MW Vexciter > 43.5V
1.9MW Vexciter > 42.5V
When the load is increased, the value for the exciter-voltage criterion decreases, to keep thegenerator stable.
10.9 Impact of Subtransient Reactances on Stability
The stability criterion presented by both [1] and [2] only contains requirements for the transientreactances in d-and q-axis, the subtransient reactances is not mentioned in this criteria.
As found in 9.1 for G2 with salient pole does the subtransient reactance in the q-axis impactthe stability greatly. The generator behaves unstable when the ratio between the subtransientreactances has the value X“
q
X“
d
= 1.048. Usually, a ratio of 1.048 between the subtransient reac-tances X“q and X“d would describe a stable generator, but this is not the case for the 1940kVAgenerator. When the factor between the ratio X“
q
X“
d
is varied, but the ratio held constant a thevalue 1.048, the generator is unstable for all factors. The subtransient q-axis reactance is alsovaried while other parameters is held constant, and it is found that the generator becomes stablewhen X“q < 0.175pu.
In Chapter 10.1 and 10.2 the value of the transient q-axis reactance is studied for two scenarios;Xq = Xq and Xq = Xd. When Xq = Xq, the generator is stable when X‘q < 2.7pu. WhenXq = Xd, the generator is stable when X‘q < 2.65pu.
The subtransient, transient and synchronous reactances for G1 was studied in Chapter 8.4. Itwas found, that the synchronous reactance in the q-axis impaced the stability of G1 with salientpole more than the transient and subtransient reactances in the d-and q-axis.
10.9.1 No load
The impact of the subtransient reactances on the stability is to be studied for a round rotormachine. The 1940kVA generator has the AVR type A attached, with a reference value of 1.2.The generator the battery-arrangement through the rectifier, with no other load attached. Thebattery arrangement consists of the large capacitor-series resistance is connected to the dc-bus.
133

CHAPTER 10. INVESTIGATION OF 1940 KVA GENERATOR SYSTEM, ROUND ROTOR
First, the subtransient q-axis reactance X“q is varied while the other constants is held constantand the transient q-axis reactance has the value Xq = Xq.
Table 10.19: Parameter analysis, impact of subtransient reactance in the q-axis, X“q, on thestability of the generator G2. The other reactances is held constant. Voltage regulator andgovernor included. No load is included except from the battery-arrangement. The transientq-axis reactance has the value Xq = Xq
Parameter Value [pu] Operation Frequency Comment
X“q 0.4 Unstable 2.6Hz -X“q 0.1 Stable - -X“q 0.2 Unstable 1.95Hz -X“q 0.15 Stable - -X“q 0.175 Stable - Poorly dampedX“q 0.185 Unstable - -X“q 0.18 Unstable 1.77Hz -
The generator is stable when X“q < 0.18pu when G2 is modeled as round rotor and Xq = Xq.From this, a stability criterion can be obtained for the 1940kVA generator modeled as roundrotor during no-load:
X“q
X“d< 0.48 (10.4)
Now, the subtransient q-axis reactance X“q is varied while the other constants is held constantand the transient q-axis reactance has the value Xq = Xd.
Table 10.20: Parameter analysis, impact of subtransient reactance in the q-axis, X“q, on thestability of the generator G2. The other reactances is held constant. Voltage regulator andgovernor included. No load is included except from the battery-arrangement. The transientq-axis reactance has the value Xq = Xd
Parameter Value [pu] Operation Frequency Comment
X“q 0.4 Unstable 2.67Hz -X“q 0.1 Stable - -X“q 0.2 Unstable 1.88Hz -X“q 0.15 Stable - -X“q 0.175 Unstable 1.75Hz Decreasing oscillationsX“q 0.17 Stable - Very poorly damped
The generator is stable when X“q < 0.17pu when G2 is modeled as round rotor and Xq = Xd.
134

10.9. IMPACT OF SUBTRANSIENT REACTANCES ON STABILITY
From this, a stability criterion can be obtained for the 1940kVA generator modeled as roundrotor during no-load:
X“q
X“d< 0.46 (10.5)
Now, the ratio between X“q and X“d is studied. The ratio is held constant, but the valuesof X“q and X“d is changed with the same factor. Because there is not much di�erence in thestability criterions found for the round rotor G2 for X“q when Xq = Xq and when Xq = Xd,and simulation is simulated with Xq = Xd. The result of the simulation is shown in Table 10.21below.
Table 10.21: Parameter analysis, impact of the ratio X“
q
X“
d
, on the stability of the generator G2,where the ratio is varied by a factor. Voltage regulator and governor included. No load isconnected except from battery-arrangement.
ratio Factor Operation Comment FrequencyX“
q
X“
d
1 Unstable - 2.67HzX“
q
X“
d
1.25 Unstable - 2.88HzX“
q
X“
d
1.5 Unstable - 3.57HzX“
q
X“
d
2.0 Unstable - 3.4HzX“
q
X“
d
0.5 Unstable - 1.83HzX“
q
X“
d
0.25 Unstable - 1.13Hz
The generator is unstable for all factors of X“q and X“d when the ratio between them, X“
q
X“
d
, isheld constant.
10.9.2 Load on dc-side
The impact of the subtransient reactances on the stability is to be studied for a round rotormachine. The 1940kVA generator has the AVR type A attached, with a reference value of1.2. The generator feeds a load of 0.5MW through the rectifier. The battery arrangementconsisting of the large capacitor-series resistance is connected to the dc-bus. The series resistanceis Rseries = 0.0625�, the capacitor is Cbattery = 2100F , and the load resistance correspondingto 0.5MW is RLoad = 2.122�.
Because there is not much di�erence in the stability criteria found for the round rotor G2 forX“q when Xq = Xq and when Xq = Xd, and the load-situation is only simulated when Xq = Xd,because this creates the strictest criterion, X“q < 0.17pu. The result of the simulation is shownin Table 10.22 below.
135

CHAPTER 10. INVESTIGATION OF 1940 KVA GENERATOR SYSTEM, ROUND ROTOR
Table 10.22: Parameter analysis, impact of subtransient reactance in the q-axis, X“q, on thestability of the generator G2. The other reactances is held constant. Voltage regulator andgovernor included. A load of PLoad = 0.5MW is included after 3 seconds into the simulation, onthe dc-side of the rectifier. The transient q-axis reactance has the value Xq = Xd
Parameter Value [pu] Operation Frequency Comment
X“q 0.4 Unstable 2.8Hz -X“q 0.1 Stable -X“q 0.2 Stable after 15s -X“q 0.3 Unstable 2.42Hz Decreasing amplitudeX“q 0.25 Stable after 19s Very poorly damped
When a load of 0.5MW is connected to the dc-side of the rectifier, the generator is stable whenX“q < 0.25pu when G2 is modeled as round rotor and Xq = Xd. From this, a stability criterioncan be obtained for the 1940kVA generator modeled as round rotor supplying a load of 0.5MWthrough diode-bridge rectifier:
X“q
X“d< 0.67 (10.6)
Now, the ratio between X“q and X“d is studied. The ratio is held constant, but the values ofX“q and X“d is changed with the same factor. The result is shown in Table 10.23 below.
Table 10.23: Parameter analysis, impact of the ratio X“
q
X“
d
, on the stability of the generator G2,where the ratio is varied by a factor. Voltage regulator and governor included. No load isconnected except from battery-arrangement.
ratio Factor Operation Comment FrequencyX“
q
X“
d
1 Unstable - 2.86HzX“
q
X“
d
1.5 Unstable - 3.33HzX“
q
X“
d
2.0 Unstable - 3.67HzX“
q
X“
d
0.5 Stable after 19s - -X“
q
X“
d
0.25 Stable after 17s - -X“
q
X“
d
0.75 Unstable - 2.5Hz
The generator is stable when the factor of X“q and X“d is below 0.75 when the ratio betweenthem, X“
q
X“
d
, is kept constant, and a load of 0.5MW is connected on the dc-side of the rectifier.
136

Chapter 11
Discussion
11.1 Model Reliability - Assumptions and Simplifications
It is established several models of the isolated system in the two simulation tools DIgSILENTPowerFactory and MatLab/SimPowerSystems. The models are used to study the presence ofdi�erent system components and parameters on the stability of the two studied generator types.
Some assumptions and simplifications are made when modeling the isolated system. The gen-erators are modeled in single operation, even if the generators has the possibility to work inparallel onboard the ship. As shown in the measurements taken on the unstable ship by theAVR delivering company, described in Chapter 3.1, is the generators a�ected by the other whenthe setting of the AVR is changed from automatic to manual in one of them. However, eachgenerator delivers power to the dc-bus through rectifiers, and no interaction that can a�ect thestability of the generators is created by this parallel operation due to the one-direction feedingproperty of diodes. Supporting this theory is that instability is detected during single operationas well, and the simplification is valid.
No losses are taken into account, and the converter and thrusters connected to the dc-bus aremodeled as an active load. Because only active power is let through the rectifier, the loadconsisting of the converters and thrusters connected to the dc-bus is seen as an active load bythe rectifier. This simplification is therefore a good assumption.
A large capacitor and a series resistance models the battery connected to the dc-bus in theMatLab/SimPowerSystems model. A capacitor acts as a battery due to the charging- and dis-charging characteristics, and is able to store energy. Some losses are found in a battery due tosome internal resistance, and the series resistance symbolizes this internal resistance. The largecapacitor and series resistance mirrors the main properties of a battery in a good way. In the
137

CHAPTER 11. DISCUSSION
system modeled in DIgSILENT PowerFactory, the battery is modeled using a voltage source.This is also an assumption used deliberately due to the charging/discharging property of thebattery that also can be found in a voltage source, as well as the ability to supply a load.
The rectifier used in DIgSILENT PowerFactory is modeled as a voltage sourced PWM rectifier,consisting of transistors instead of diodes. The reason for this is that it was quite challengingto compute load flow when the diode-rectifier was obtained, and a compromise was made whenapplying the PWM rectifier by setting the firing angle – = 0 and forbid any modulation. Despitethis, does a PWM rectifier does not possess the same features as a diode-bridge rectifier, and theresults from this model must be interpreted with care.
11.2 Simulations Obtained from PowerFactory
First, the work from the specialization project from the fall 2014 is continued in DIgSILENTPowerFactory, and the impact of the introduction of a rectifier is studied. The rectifier is of thevoltage-sourced PWM type. By varying the gain of the AVR, the linearization constant K
5
isdirectly e�ected according to [4]. The eigenvalues of the critical modes associated with the rotorangle of the two generators moves towards instability with increasing gain. This study was donefor two situations; producing active power of 14MW and producing/consuming reactive powerof 2MVar.
From the specialization project conducted during the fall 2014, it was found that the 1940kVAgenerator becomes unstable faster than the 3333kVA generator. The critical mode oscillatesaround 2Hz when the rectifier is not included in the model. However, when the rectifier is addedto the model and the gain of the AVR is increased, the critical mode associated with the rotorangle oscillates with only 1Hz. As mentioned in Chapter 4, the frequency of the rotor angleoscillations for isolated modes is in the range 0.7-2Hz according to [11]. An oscillation of therotor angle as a result of the gain increase with a frequency of 1Hz is therefore likely.
The generator moves faster towards instability when reactive power is consumed. In contrast tothe result found in the specialization project, does the 3333kVA generator moves faster towardsinstability than the 1940kVA generator. This was not expected. The PWM converter used inthe model uses transistors and are voltage-sourced, but has a firing angle of – = 0 and nomodulation. The diode-bridge rectifier used on the ship does not have the same properties as thetransistor-based PWM converter. The result could have been di�erent if a diode-bridge rectifierwas applied.
138
11.3. SIMULATIONS OBTAINED FROM MATLAB/SIMPOWERSYSTEMS
11.3 Simulations Obtained from MatLab/SimPowerSystems
A simplified model of the system has successfully been established in MatLab/SimPowerSystems.Simple simulations done on the model reflects the observations made on the ship.
3333kVA generator modeled as salient pole
First, the generator that is characterized as stable, was studied in Chapter 8. The system is stablefor both no-load operation and when supplying an active load on the dc-side of the rectifier. Thegenerator is also stable when the reference value of the voltage regulator is varied and when noAVR is connected. The generator is stable even if the generator does not satisfy the stabilitycriterion presented in [1]; X
q
X‘
d
Æ 2.
According to [5] most salient pole generator is build with X“d ¥ X“q, which is not the casefor the 3333kVA generator, where the ratio is X“
q
X“
d
= 1.216. Even though it is classified asstable, poor damping is observed on the ship, and the generator reactances has high values.The stability limit for the subtransient reactances was studied, and it is found that to continue astable operation, the generator must fulfill the criterion X“
q
X“
d
< 5.91, indicating that it has a largestability limit. It is mainly the d-axis subtransient reactance and not the q-axis subtransientreactance that impacts the stability.
The ratio X“
q
X“
d
is held constant while both reactances is varied by a factor f , but the stabilityis not a�ected by this experiment. When the synchronous q-axis reactance is varied, a stabilitycriterion is obtained in this thesis; X
q
X‘
d
< 5.7, which is a lot less strict than the criterion givenby [1]; 2.0. Using the actual parameters in the generator design this ratio becomes; X
q
X‘
d
= 3.51.The criterion presented by [1] is too strict and can not be used for this type of generators.
Another stability criterion obtained in this thesis is that the 3333kVA generator must fulfill thecriterion X
q
Xd
> 0.94. Using the parameters on the ship, this ratio is actually Xq
Xd
= 1.52, and hasa large stability margin. This is a very realistic criterion.
Because X‘q ¥ Xq for salient pole generator, varying Xq means also varying X‘q. This meansthat the synchronous, transient and subtransient reactances impact the stability of the 3333kVAgenerator. This coincide with the theory presented in [1], that not only the synchronous reac-tance, but also the transient and subtransient reactances impacts the stability.
1940kVA generator modeled as salient pole
The 1940kVA generator is characterized as unstable, and is studied as salient pole in Chapter9. At no-load, the generator is unstable with an oscillation frequency of the output parameters
139

CHAPTER 11. DISCUSSION
of 2.3Hz. Prominent "pulses" is observed in the terminal current. The presumption that onephase in voltage or current starts this oscillating behavior due to the rotor angle, is disprovedby a voltage- and current-phase simulation. Similar "pulses" is found in the current profile in[1], where a rectifier-loaded synchronous generator with high synchronous reactances Xq, Xd isstudied.
The pulsed nature of the current can be the result of the battery starting to act as a voltagesource and delivers power back to the generator, in a repetitive manner. The current couldobtain this "pulsed" nature due to the fact that the diode-bridge rectifier only conducts currentin one direction. Another explanation for the pulsed current can be the commutation process inthe diode-bridge rectifier, as suggested by [1]. Oscillations is experienced on the ship even whenthe battery is not concluded as well, which could imply that the stability problems arise from theinteraction between the diode-bridge rectifier and the synchronous generator, where generatorreactances a�ects the stability.
It is found that the commutation interval observed in the current, decreases in length with anincreasing subtransient q-axis reactance. The equation for the commutation reactance in Eq.4.11 found in [14] is dependent on X“q, and may indicate a ratio between the commutationinterval length and the commutation reactance.
Due to the impact of the subtransient q-axis reactance on the commutation interval in the current,a parameter analysis is made, and it is found that the generator becomes stable if X“
q
X“
d
< 0.48.This value is very low and may be unrealistic. A typical value for this ratio is X“
q
X“
d
= 1.3 forsalient pole generators according to [13]. The actual value of this ratio for the generator usingthe parameters received from Siemems, is X“
q
X“
d
= 1.048, which is already very low compared totypical ratio values. The ratio X“
q
X“
d
is tried held constant while varying both reactances is by afactor f , but this does not impact the stability.
It is found that when the inner resistance in the capacitor modeling the battery is increased,the generator becomes stable when r > 0.1�, but this is a large value compared to the initialvalue 1e ≠ 9�, that may cause large losses over the battery and is unrealistic. By increasingthe voltage reference point in the voltage regulator to 1.4, the generator becomes stable. Theterminal voltage becomes 966V, and the oscillations stops after 6-7s. However, the oscillationsis large in the first seconds and a protection system would likely shut down the system beforethe generator becomes stable, to avoid damage to electrical equipment.
It is obvious that the voltage and current plays an important role when it comes to stability, andmaybe especially when the current is high. This is emphasized by the fact that the simulationsshow that when the load connected on the dc-side of the rectifier is large, the generator has astable operation. This phenomenon is also observed on the ship where instabilities is detected,and confirms that the model in MatLab/SimPowerSystems is realistic. The impact of varying thereference value of the AVR also a�ects the transient current and terminal voltage, and coincides
140

11.3. SIMULATIONS OBTAINED FROM MATLAB/SIMPOWERSYSTEMS
with the theory presented in [2] saying that the transient current impacts the generator stability.
The frequencies of the oscillations detected during load are in the range 2.5-2.7Hz. This is abit above the typical frequencies mentioned by [11] for local mode oscillations associated withrotor angle oscillations, which usually is in the range 0.7-2Hz. The reason for this can be thatthe local mode oscillations often is associated with generators oscillating against each other,but in this case, a single generator interacts with a rectifier and not another generator. Thefrequency range between these components can be di�erent but still be associated with rotor angleoscillations. The oscillation frequencies registered by the AVR company was 1.171-2.68Hz, hence,the oscillations frequencies found through simulations is in the same range as the observationson the ship.
1940kVA generator modeled as round rotor
The 1940kVA generator was designed as round rotor and was studied in Chapter 10. Theparameters for a round machine were examined. X‘q was not given in the original salient pole-model of the 1940kVA generator in MatLab/SimPowerSystems from Siemens Trondheim and anestimated value was found using Table 4.1 found from [13]. A stability criterion for the 1940kVAgenerator with round rotor becomes is found when varying the transient q-axis reactance; X‘
q
X‘
d
<
5.41. This is a very high ratio, typical ratios is found in literature to be X‘
q
X‘
d
= 2 ≠ 2.5 [13]. Thestability criterion found in [1] is; X‘
q
X‘
d
< 2. This is too strict and not realistic for this type ofgenerator, due to the high value of this ratio using the original reactances; X
q
X‘
d
= 9.78.
The generator is unstable for both during no-load and load situation, and is unstable for all loadsexcept from when the generator supplies a load close to the maximum of the generators perfor-mance, at 1.9MW. However, the stability is first met after 10 seconds, and the protection systemwould probably shut down the system to protect electrical equipment because of large start-upcurrents. The oscillations detected are in the frequency range 2.5-2.8Hz, which is in the samerange as when the 1940kVA generator was modeled as salient pole. The oscillations measuredfrom the ship experiencing instability is in the range 2.171-2.68Hz at high load, which matchesthe frequencies simulated. For local mode oscillations associated with rotor angle oscillationsin the frequency range 0.7-2Hz. Both the frequencies measured on the ship and obtained fromsimulations is a bit lower in value than this.
The generator becomes stable when the terminal voltage is increased to 40% above the nominalvoltage, and when the terminal voltage is set equal to the nominal voltage. When varying thereference value of the AVR in this way, the size and behavior of the transient current is a�ected,which according to [2] is of major importance to the generator stability.
When the AVR is removed, the generator shows stability during no-load, but unstable for allloads. The parameters oscillate with a frequency range of 0.5-1Hz. When the battery is removed,
141

CHAPTER 11. DISCUSSION
the generator becomes stable during no-load and for all loads. Observations on the ship showsthat the oscillations increases when the battery is connected to the dc-bus, but then the AVR isconnected and this simulation results can not be compared. The simulations without AVR wereconducted to see how the unregulated generator behaves to load and component analysis.
The influence of the AVR is further studied and the AVR type A was replaced by the AVRtype AC5A. Also with this regulator the generator became stable when the terminal voltage wasraised by 40% above the nominal voltage and at nominal voltage, and when the load is 1.9MW.However, the frequencies during instability of the generator using AC5A are much higher than forsimulations using AVR type A. They are in the range 3.67-5.5Hz. It is clear that the value of theterminal voltage and load situation impacts the generator stability greatly for both regulators,which can imply that the regulator can be tuned to achieve a stable generator.
The battery is studied due to its importance in the stability-question, where observations statethat the stability worsens when the battery is attached to the dc-bus. The large capacitor isreplaced by a Simulink-model of a battery to better study the power delivered from the batteryto the load. No oscillations is found using this battery-type, neither during no-load or duringload situation. However, when the AVR type is changed from the original type A to AC5A, thegenerator is unstable for both no-load and during load situation. The Simulink-battery does notmodel the battery used on the ship as well as the large capacitor, because it is found that thegenerator is not a�ected by the battery-connection when the graphs of the power from the twopower-sources is studied, and because no instability is found when it is connected and AVR typeA is applied.
The rectifier is removed to study its impact, and to examine the theories presented by [1] sayingthat the rectifier may be the source of stability problems obtained in rectifier-loaded SG. A loadis connected between the terminals of the 1940kVA generator, but no instabilities are found forany load. When the AVR type AC5A is applied, the generator outputs shows instability. Thefrequency of the oscillations is in the range 4.125-4.75Hz, which is higher than the oscillationfrequencies discovered from other simulations using AVR type A. It is also claimed in [3] thatgenerators that are rectifier-loaded can become unstable although they can operate stable withoutthe rectifier connection. The simulations confirm this, and this may be the case for the 1940kVAgenerator type.
It is claimed in [1] that the rectifier is a part of the stability problems discovered in systemsconsisting of rectifier-loaded synchronous generators. The simulations obtained show that whenremoving the rectifier, the generator is only unstable when using the AVR type AC5A. Thepulsed nature of the current is completely gone and may indicate that the rectifier is an importantcomponent when it comes to both evaluating stability and the current profile, but that the AVRalso is of importance.
It is also found that the value of the excitation-voltage has a great impact on the stability. When
142

11.3. SIMULATIONS OBTAINED FROM MATLAB/SIMPOWERSYSTEMS
a load is connected to the dc-side of the rectifier and the voltage of the constant voltage sourceis varied, is it found that the excitation voltage must be lower for high load than for low load toachieve stability; Vexciter > 45V for a 0.5MW load and Vexciter > 42.5V for a 1.9MW load. Thisis due to the general stability criterion presented by [2];
X‘2dI‘2d + X‘2qI‘2q Æ 2X‘dI‘dUp (11.1)
claiming that when the exciter-voltage Vexciter raises, the stationary source voltage Up increasesand the stability is therefore improved. When the transient current is enlarged due to loadincrease, stability is harder to achieve, because I‘d and I‘q is squared on the left side of theequation. This coincides with the simulation because to compensate for a larger load, the exciter-voltage must be greater. This emphasizes the credibility of the given stability criterion in [2].
The stability criterion given in [2] only impose requirements for the transient reactances, not forthe synchronous and subtransient reactances. [5] suggests that the q-axis reactance has a largerimpact on the stability than the d-axis reactance. Due to this, the subtransient q-axis reactanceis examined, and a stability criterion is obtained; X“
q
X“
d
< 0.46 for no load. This is a very strictand maybe unrealistic criterion. Typical values for the same ratio of subtransient reactances isX“
q
X“
d
= 1, and the actual ratio between these reactances in the 1940kVA generator is X“
q
X“
d
= 1.048.
Also during no-load, it is found that by varying the factor of X“q and X“d while keeping theratio X“
q
X“
d
constant, the generator is unstable for all factors f . This emphasizes the theory in [5]that the q-axis reactance is more influential on the stability than the d-axis reactance.
By doing the same parameter analysis when the generator supplies a 0.5MW load, anotherstability criterion for the subtransient reactances is found; X“
q
X“
d
< 0.67. This is a less strictcriterion than during no-load, but it is still far from both the actual ratio-value and typical valueof this ratio. This contradicts with the criterion given by [2], saying that the transient currentis enlarged due to load increase, making stability harder to achieve. The equation given by [2],rendered in Eq. 11.1 above, does however have no criterion for the subtransient values, whichcan indicate that Eq. 11.1 does not capture all causes of instability.
When the ratio X“
q
X“
d
is kept constant, and a factor of X“q and X“d is varied, the factor must bef < 0.75 to achieve stability during load. However, the stability happens after 19s and 17s forf = 0.5 and f = 0.25, respectively, and this is a very long time, but this simulation shows thatthe generator is not unstable for all factors f , as is the case during no-load.
As presented in [1] the simulations confirms that both the transient and subtransient reactances,as well as the operation and the presence of a rectifier has great impact on the generator stability.
143

CHAPTER 11. DISCUSSION
11.4 Uncertainty Regarding Simulation Results
Throughout the simulations done in this thesis is the frequency of the oscillations is in therange 2.3-2.8Hz when applying AVR type A. This corresponds to the frequency ranges observedon the ship; 1.71-2.68Hz. When AVR type AC5A is applied, the frequencies range is 3.67-5.5Hz, and di�ers from other simulation and observations, as well as theory. According to[11] is the frequency range 0.7-2Hz for local modes of machine-infinite bus systems, where theoscillations can be associated with the rotor angle. The di�erence between the frequencies foundin simulation and in [11] can indicate that something else than rotor angle oscillations and poorlydamped machine can be the source of the stability problems experienced. It can also indicatethat the frequency range is di�erent for the interaction between a single generator and rectifierthan generators interacting with each other, and that a poorly damped machine still is the mainsource for the instabilities.
[1] claims that the rectifier can be a source of instability when a rectifier-loaded synchronousgenerator system is studied.Simulations done in DIgSILENT PowerFactory from the Specializa-tion project shows instability when the rectifier is excluded and the gain of the AVR is increased.When it is connected, the generators still becomes unstable when the gain is increased, but theresult di�ers in the way that the 3333kVA generator becomes unstable faster than the 1940kVAgenerator. The reason can be the use of a PWM rectifier instead of a diode-bridge rectifier,even if the firing angle – = 0 and there is no modulation. Due to this, is the simulation resultsstudying the rectifier in DIgSILENT PowerFactory not fully credible.
Simulations performed in MatLab/SimPowerSystems when the rectifier is removed, shows thatthe 1940kVA generator is only unstable when the AVR type AC5A is used, and can indicate thatthe stability problems originates in the diode-bridge rectifier-SG system. The pulsed nature ofthe current in simulations outputs from the 1940kVA generator also indicates that the rectifierhas a major impact on the behavior of the generator terminal values. This conclusion is supportedby the fact that the ship operates stable when the diode-bridge rectifier is replaced by thyristor-controlled rectifiers, and that the same conclusion is drawn by [1].
The simulations using the Simulink-battery does not mirror the behaviors observed on the shipas well as the large capacitor does, and is not as valuable. The reason for this may be that thereis some setting in MatLab/SimPowerSystems deciding which of the two power sources generatoror battery is supposed to supply the load.
144

11.5. COMPARATIVE ANALYSIS
11.5 Comparative Analysis
11.5.1 Stability criteria obtained in this thesis regarding generator re-actances
According to [1] the stability of rectifier-loaded generator systems is a�ected by both transientand subtransient reactances in addition to the synchronous reactance. It is claimed that thestability problems originate in the rectifying-process. The stability criterion presented in [1] isgiven as: X
q
X‘
d
Æ 2.
It is claimed by [2] that the stability of rectifier-loaded generator systems is influenced by thetransient current I‘ and the stationary source voltage Up. I‘ is directly influenced by the load-operation, and Up is directly influenced by the excitation of the generator. A stability criterionis given in Eq. 11.1.
None of the two generators studied in this thesis fulfill the stability criterion given in [1]. The3333kVA generator has a value of X
q
X‘
d
= 3.51, which is much higher than the proposed value in[1], but it is still stable, though poorly damped. The 1940kVA generator which is characterizedas unstable, has a ratio of X
q
X‘
d
= 9.78 and is far from fulfilling the requirement proposed by [1].
From the results in the MatLab/SimPowerSystems model it is found, as also stated in [1], thatthe theory saying that the stability of the diode-bridge rectifier-loaded synchronous generatordepends on the presence of the rectifier, is true. The generator becomes stable during load-operation when the rectifier is disconnected. It is also found that the stability depends on theload-situation of the generator, as proposed by both [1] and [2]. The 1940kVA generator isunstable for both no-load and during most load-scenarios except from when it feeds a load closeto its capacity, for which it will become stable.
Via a parameter analysis of the DC-voltage feeding the excitation field of the 1940kVA generatorthe stability criterion given in [2] is enhanced, saying that by increasing the stationary sourcevoltage Up, the generator becomes more stable. This is found to be true via simulations andparameter-analysis.
Through a sensitivity analysis of the generator reactances the postulate in [1] is confirmed, claim-ing that the transient and subtransient reactances is important in addition to the synchronousreactances. The stability criterion in [2] is only dependent on the transient reactances.
Stability criteria for 1940kVA generator
The stability criterion obtained in this thesis for the unstable, 1940kVA generator during no-loadwith emphasis on the transient reactance is given as:
145

CHAPTER 11. DISCUSSION
X‘qX‘d
Æ 5.41 (11.2)
The stability criterion obtained for this generator during no-load with emphasis on the subtran-sient reactance is given as:
X“q
X“dÆ 0.46 (11.3)
The stability criterion obtained for this generator when supplying load, with emphasis on thesubtransient reactance is given as:
X“q
X“dÆ 0.67 (11.4)
Eq. 11.2 confirms the theory presented in [2] and [1], claiming that the transient reactanceis important for the stability. Typical values for this ratio is X‘
q
X‘
d
= 2 ≠ 2.5 for round rotordesign, according to [13]. The stability criterion presented in [1] is stricter than Eq. 11.2;X‘
q
X‘
d
¥ Xq
X‘
d
Æ 2.0. The actual value of the ratio between this ratio for the 1940kVA generatortypes is X
q
X‘
d
= 9.78 and is far from fulfilling this criterion by [1], but closer to fulfilling thecriterion presented in Eq. 11.2.
Eq. 11.3 and Eq. 11.4 shows that not only requirements for the transient reactances is importantfor a stable operation of the 1940kVA generator type, but also the subtransient reactances. Thevalue of X“q can be larger when a load is connected, than when the generator supplies a load,indicating as also shown via simulations and by [2], that a load can improve the operation ofthe 1940kVA generator. However, both criteria is very strict, on the verge of being unrealistic.Typical values for this ratio is X“
q
X“
d
= 1 for round rotor machines. The actual value is X“
q
X“
d
= 1.048.
Stability criteria for 3333kVA generator
The stability criterion obtained for the stable, 3333kVA generator with salient pole, with em-phasize on the synchronous reactance is given as:
Xd
XqØ 0.94 (11.5)
The stability criterion obtained for this generator with emphasize on the subtransient reactanceis given as:
146

11.5. COMPARATIVE ANALYSIS
X“q
X“dÆ 5.91 (11.6)
The stability criterion obtained for this generator with emphasize on the synchronous and tran-sient reactance is given as:
Xq
X‘dÆ 5.7 (11.7)
Eq. 11.5 confirms the theory presented in [1] claiming that the synchronous reactance is impor-tant for the stability. Typical ratios of these reactances is X
d
Xq
= 1.5 according to [13]. This isvery close to the actual ratio; X
d
Xq
= 1.52, and the generator has a good stability limit.
Eq. 11.6 shows that also the subtransient reactances are important in this context. This ratiois X“
q
X“
d
= 1.216 in this generator, and fulfills the criterion obtained. Typical ratios is X“
q
X“
d
= 1.3[13].
Eq. 11.7 shows that the criterion presented in [1] is too strict; Xq
X‘
d
Æ 2. The actual ratio ofthese reactances in the generator are X
q
X‘
d
= 3.51 and would be characterized as unstable if thecriterion in [1] was used.
11.5.2 Stability enhancement of 1940kVA generator
To fulfill the stability criteria obtained for the unstable 1940kVA generator in Eq. 11.2 or Eq.11.3 either the transient or the subtransient q-axis reactance must be decreased.
According to [3] the stability criterion can be easier fulfilled if a short-circuited q-axis rotorwinding is added to the rotor of a diode bridge rectifier-loaded synchronous generator. Theresult of an added short-circuited q-axis winding on the rotor winding will lead to a decreasedvalue of the transient q-axis reactance, as is a proposal to achieve stability for the 1940kVAgenerator, and to fulfill the stability criterion obtained in this thesis for the transient reactances,given in Eq 11.2.
The stability criterion found in [3] is given by:
1Xq
+ 1X‘q
Ø 1X‘d
(11.8)
This stability criterion only contains requirements for the synchronous and transient reactances.When the design values for Xq and X‘d for the 1940kVA generator are used in Eq. 11.8 and theequation is solved for X‘q, the value of X‘q is:
147

CHAPTER 11. DISCUSSION
X‘q Æ 0.549pu (11.9)
By using this value for the stability criterion developed in this thesis shown in Eq. 11.2, and theoriginal value for X‘d is used, the equation will be as follows:
X‘qX‘d
= 1.12 < 5.41 (11.10)
This implies that adding a short-circuited q-axis rotor winding to the generator rotor will fulfillthe stability criterion found in this thesis. Because 1.12 < 5.41, the stability margin becomesquite large if this short-circuited q-axis winding is added to the rotor.
148

Chapter 12
Conclusion
This thesis concerns the stability of diode-bridge rectifier-loaded synchronous generators char-acterized with high values of synchronous, transient and subtransient reactances in the d- andq-axis. Two generator types used in the industry are investigated. The synchronous reactances ofthese two generator types are in the range 2.5-5.5 pu. Two electrical systems for ships have beenstudied, where one ship uses 3333kVA generator types with synchronous reactances in the lowerrange of 2.5-5.5pu and has a stable operation. The other ship uses 1940kVA generator types withsynchronous reactances in the upper range of 2.5-5.5 pu and is unstable during normal operation.
The generators supplies power to a dc-bus through rectifiers. The thrusters are supplied fromthe dc-bus through inverters. The connection of a battery bank to the dc-bus is a possibility toachieve redundancy. This electrical system is delivered by Siemens and is a part of their newdiesel-electric, variable speed propulsion dc-system. The objective of this thesis was to under-stand why diode-bridge rectifier-loaded synchronous generators with high values of reactancesbecome unstable, and to find what could be done to prevent the observed instability.
Simplified models of the electrical system are established in the simulation tool MatLab/SimPowerSystems,and suitable simulations and parameter-analysis of the synchronous generators, battery, voltageregulator and load is conducted. The simulation results are compared to theories found in liter-ature concerning the same problems as addressed in this thesis.
It is found through simulations that the interaction between the synchronous generator anddiode-bridge rectifier is the reason for the instabilities observed in the studied system. Thiswas a theory presented in [1], and is verified through simulations conducted in this thesis. The1940kVA generator becomes unstable only when the rectifier is connected. The operation ofthe generators regarding load also impacts the stability greatly; it is found that the 1940kVAgenerator can obtain stable operation when the load is close to the generator capacity, 1.9MVA,
149

CHAPTER 12. CONCLUSION
but is unstable for all other loads as well as during no-load.
It is claimed by [2] that the transient current a�ects the stability in a negative manner, and thata high amplitude of the stationary source voltage a�ects the stability in a positive manner. Theload situation directly a�ects the transient current and the excitation voltage directly a�ects thestationary source voltage. Through simulations it is found that high load worsen the stabilityand that high excitation voltage enhances the stability. The statements found in [2] is thusverified.
By conducting a sensitivity analysis of the reactances of the synchronous generators it is foundthat the values of the synchronous and subtransient reactances is as important as the values ofthe synchronous reactances to achieve stability. The following stability criteria for the transientand subtransient reactances are obtained for the 1940kVA generator with round rotor duringno-load:
X‘qX‘d
Æ 5.41 X“q
X“dÆ 0.46 (12.1)
By introducing the stability criterion for the transient reactances to a stability criterion found inliterature, it is found in chapter 11.5.2 that by adding a short-circuited q-axis rotor winding onthe generator rotor this stability criterion can be fulfilled and a stable operation can be achieved.
Suggestions for further work is found in Chapter 13.
12.1 Recommendations
A recommended solution to prevent unstable situations in electrical systems on ships using the1940kVA generator type is to add a short-circuited q-axis rotor winding on the generator rotor.This is recommended due to the fulfillment of the stability criterion of the transient reactancegiven in Eq. 12.1 and was investigated in Chapter 11.5.2.
150

Chapter 13
Further Work
1. Diode-bridge rectifier type in PowerFactory model instead of PWM rectifier
2. Further examine the dynamic interaction between the synchronous generator and diodebridge rectifier
3. Simulate the impact of an added short-circuited q-axis rotor winding on the stability
4. Simulate two generators working in parallel to capture any interactions between them
5. Study the impact of AVR parameters and investigate if the unstable generator can beregulated to run with stable operation
6. Development of a power system stabilzer (PSS) solution for a diode bridge rectifier-loadedsynchronous generator system
7. Study the di�erence in instability when the battery is connected compared to when it isremoved, for the unstable 1940kVA generator
8. Study the tuning of the AVR to possibly obtain a stable operation of the 1940kVA generator
151

CHAPTER 13. FURTHER WORK
152
Chapter 14
Bibliography
[1] H. Auinger and G. Nagel. Vom transienten Betriebsverhalten herrührende Schwingungen beieinem uber Gleichrichter belasteten Synchrongenerator. Teil 1. Theoretische Untersuchun-gen. 1980.
[2] Dr. Reinhard Vogel. Einfaches modell zur erklärung des instabilen verhaltens von bes-timmten generatoren bei bludrive+c - anlagen. Siemens, Hamburg, Germany, (PD OM DMNC TI), 2015.
[3] Ma Weiming, Hu An, Liu Dezhi, and Zhang Gaifan. Stability of a synchronous generatorwith diode-bridge rectifier and back-emf load. IEEE Transactions on Energy Conversion,15(4):458–463, 2000.
[4] Trond Toftevaag, Emil Johansson, and Astrid Petterteig. The influence of impedance val-ues and excitation system tuning on synchronous generator stability in distribution grids.SINTEF Energy Research, 2008.
[5] Kurt Bonfert. Betriebsverhalten der Synchronmaschine. Springer-Verlag, 1962.
[6] Torunn Helland. Dynamic analysis of the stability of a diode bridge rectifier connectedsynchronous generator with high synchronous reactances. 2014.
[7] Gang Wang, LiJun Fu, XueXin Fan, ZhiHao Ye, and Fan Ma. Periodic orbit model of dioderectifiers-synchronous machine system. Science China Technological Sciences, 56(1):245–252, 2012.
[8] Ivan Jadric, D. Borojevic, and Martin Jadric. A simplified model of a variable speed syn-chronous generator loaded with diode rectifier, pages 497–502. IEEE, 1997.
153

CHAPTER 14. BIBLIOGRAPHY
[9] ABS American Bureau Shipping. Guidance notes on control of harmonics in electrical powersystems. Houston, USA, 2006.
[10] Ned Mohan, Tore M Undeland, and William P Robbins. Power electronics. Wiley, 1995.
[11] P Kundur, Neal J Balu, and Mark G Lauby. Power system stability and control. McGraw-Hill, 1994.
[12] Jan Machowski, Janusz W Bialek, and J. R Bumby. Power system dynamics. Wiley, 2008.
[13] P Kundur, Neal J Balu, and Mark G Lauby. Power system stability and control, table 4.2p. 153. McGraw-Hill, 1994.
[14] S. Moriyasu and C. Uenosono. An analysis on the characteristics of a synchronous machineconnected to a d.c.-link. Archiv f. Elektrotechnik, 69(2):111–120, 1986.
[15] J. Jatskevich, S.D. Pekarek, and A. Davoudi. Parametric average-value model of synchronousmachine-rectifier systems. IEEE Trans. On Energy Conversion, 21(1):9–18, 2006.
[16] H. Auinger and G. Nagel. Vom transienten Betriebsverhalten herrührende Schwingungen beieinem uber Gleichrichter belasteten Synchrongenerator. Teil 2. Abhilfemassnahmen. 1980.
[17] Espen Haugan. SimPowerSystems Model. Siemens, Trondheim, 2014.
[18] DIgSILENT PowerFactory. User-manual, "pwm converter".
[19] SimPowerSystems The MathWorks, Inc. User-manual, "synchronous machine round rotor(standard)".
[20] Inc. SimPowerSystems The MathWorks. User-manual, "solver".
[21] Espen Haugan. Conversation 2/3-2014. Siemens.
[22] SimPowerSystems The MathWorks, Inc. User-manual, "machine inertia.
[23] IEEE. IEEE recommended practice for excitation system models for power system stabilitystudies. IEEE Power Engineering Society, Sponsored by the Energy Development and PowerGeneration Committee, 2006.
154

Appendix A
Specialization Project During Fall2014
A.1 Transient Voltage Increase
If a synchronous generator with salient poles is considered first to be in no load, i.e. open circuit,we have that Id = Iq = 0, Vq = E‘q0
= 1 and Vd = 0. In t = t0
, equation A.1 and A.2 describesthe system [12]:
E‘q0
= Vq + RaIq ≠ X‘dId (A.1)
0 = Vd + RaId + XqIq (A.2)
When a resistive load R is connected to the terminals of the generator, we have that at the timet = t
0t:
Vq = RIq (A.3)
Vd = RId (A.4)
If equation A.3 and A.4 is introduced into equation A.1 and A.2, we have that:
155

APPENDIX A. SPECIALIZATION PROJECT DURING FALL 2014
E‘q = E‘q0
= (R + Ra)Iq ≠ X‘dId (A.5)
0 = (R + Ra)Id + XqIq (A.6)
Equation A.5 and A.6 is solved for Id and Iq:
Id = ≠ Xq
(R + Ra)2 + X‘dXqE‘q0
(A.7)
Iq = R + Ra
(R + Ra)2 + X‘dXqE‘q0
(A.8)
If this is introduced in to equation A.3 and A.4, we get that
Vd = ≠ RXq
(R + Ra)2 + X‘dXqE‘q0
¥ ≠Xq
RE‘q0
(A.9)
Vq = ≠ R(R + Ra)(R + Ra)2 + X‘dXq
E‘q0
¥ ≠ R2
R2 + X‘dXqE‘q0
(A.10)
with the assumption that R >> Ra. This shows that the contribution from Vd > 0 and that
Vg =Ò
V 2
d + V 2
q > 1 (A.11)
which means that the voltage increases after the load is introduced.
156

Appendix B
Simulations in PowerFactory
B.1 External System Parameters used in PowerFactoryModel [4]
Table B.1: Summary of external impedances in pu, ref. UB = 6.6kV and SB = 16MV A [4]
Component R [pu] X [pu]
Transformer (22/6.6kV) 0.00469 0.08Cable (22kV) 0.0023 0.0051Line (22kV) 0.0304 0.1433Transformer (132/22kV) 0.0038 0.1042Line 132kV 0.0001 0.007Transformer (300/132kV) 0.0001 0.007Sum without generator 0.0391 0.3353
157
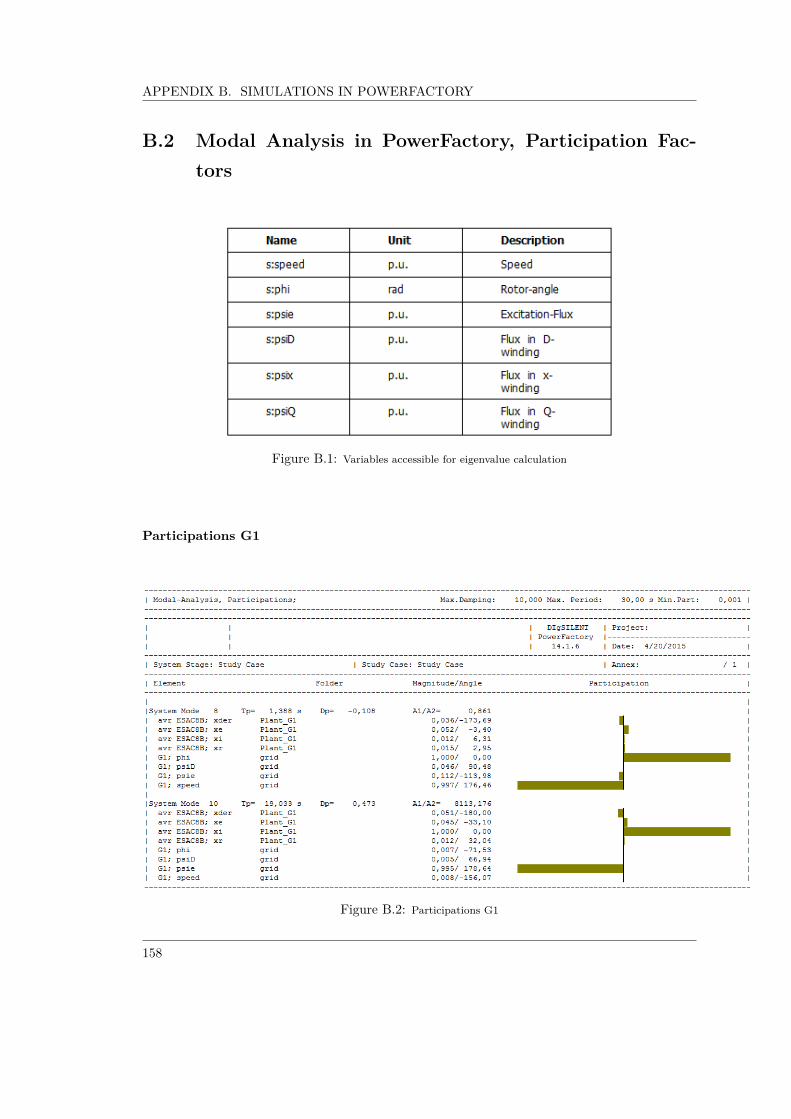
APPENDIX B. SIMULATIONS IN POWERFACTORY
B.2 Modal Analysis in PowerFactory, Participation Fac-tors
Figure B.1: Variables accessible for eigenvalue calculation
Participations G1
Figure B.2: Participations G1
158

B.2. MODAL ANALYSIS IN POWERFACTORY, PARTICIPATION FACTORS
Participations G2
Figure B.3: Participations G2
PWM model
Figure B.4: PWM converter equivalent circuit [18].
For values [Pm] < 1 [18]:
UACr = K0
PmrUDCUACi = K0
PmiUDC (B.1)
Where:
159

APPENDIX B. SIMULATIONS IN POWERFACTORY
• UACr: Real part of AC-voltage (RMS value)
• UACi: Imaginary part og AC-voltage (RMS-value)
• K0
: Constant depending on the modulation method
• Pmr: Real part of modulation index
• Pmi: Imaginary part of modulation index
• UDC : DC-voltage
"The fundamental frequency equations are completed by the active-power conservation betweenAC- and DC-side" [18]:
PAC = Re(UacIúAC) = UDCIDC = PDC (B.2)
Where:
• UAC : AC-voltage phasor (RMS-vaue)
• IúAC : Conjugate complex value of AC-current phasor (RMS-value)
• UDC : DC-voltage
• IDC : DC-current
• PDC : DC-power
160

Appendix C
3333 kVA GeneratorMatLab/SimPowerSystems Model
C.1 Components and Parameters
Figure C.1: One line diagram of the governor used in the 3333 kVA generator model in SimPowerSystems
161

APPENDIX C. 3333 KVA GENERATOR MATLAB/SIMPOWERSYSTEMS MODEL
Figure C.2: One line diagram of the AVR and exciter used in the 3333 kVA generator model in SimPowerSystems
Table C.1: Parameter settings for 17.1 kVA exciter generator used in G1-model
Symbol Unit Parameter Descriptionf [Hz] 88 Rated electrical frequencyS [VA] 17.1e3 Rated apparent powerV [V] 194 Rated voltagen [-] 6 Number of pole pairsI [A] 3.15 Field circuit currentRa [pu] 0.015 Stator resistanceXl [pu] 0.15 Stator leakage reactanceXd [pu] 0.591 d-axis synchronous reactanceXq [pu] 0.315 q-axis synchronous reactanceX
0
[pu] 0.225 Zero-sequence reactanceX‘d [pu] 0.135 d-axis transient reactanceX“d [pu] 0.134 d-axis subtransient reactanceX“q [pu] 0.314 q-axis subtransient reactanceT ‘d0
[s] 0.229 d-axis transient open circuitT“d [s] 0.0001 d-axis subtransient short circuitT“q [s] 0.0001 q-axis subtransient schort circuitV [V] 1 Terminal voltage magnitude
162

C.1. COMPONENTS AND PARAMETERS
Figure C.3: One line diagram of the voltage regulator used in the 3333 kVA generator model in SimPowerSystems
Table C.2: Parameter settings for voltage regulator used in 3333 kVA generator model
Symbol Unit Parameter DescriptionConstantConstant [-] 1.2 Referance valueFilter 20ms1/T [-] 50 PS gain1/S [-] 0 PS Integratordroopd [-] 0.05 GainDiscrete PID controllerP [-] 1.19 ProportionalI [-] 0.43 IntegralD [-] 0.57 DerivativeN [-] 10000 Filter coe�cient
163

APPENDIX C. 3333 KVA GENERATOR MATLAB/SIMPOWERSYSTEMS MODEL
Figure C.4: One line diagram of the governor used to control the speed from the 3333 kVA generator used inthe SimPowerSystems model. The ideal Torque Source converts the torque into the two ports R and C.
Table C.3: Parameter settings for governor used in G1-model
Symbol Unit Parameter Descriptionsref [pu] 0.998 Speed referencep [%] 5 percentage droopL [pu] 0.5 Load reference setpointTgov [s] 0.002 Time constant of governorT [s] 0.003 Time constant of main inlet volumes and steam chest·b [kNm] 16.615 Base torque·i [pu] 0.451061 Initial torque
164

C.2. SIMULATION RESULTS FROM THE GOVERNOR, VOLTAGE REGULATOR ANDEXCITER
C.2 Simulation Results from the Governor, Voltage Reg-ulator and Exciter
Figure C.5: 3333 kVA generator system output values from the governor, where deltay
is the signal output from the
governor.
165

APPENDIX C. 3333 KVA GENERATOR MATLAB/SIMPOWERSYSTEMS MODEL
Figure C.6: 3333 kVA generator system output values from the voltage regulator, where ua
ct is the result of the
filtered terminal voltage from the 3333kVA generator, urefk
reg is the reference value signal, error is the signal before
the PID-controller in the voltage regulator, and regout
is the output signal from the voltage regulator.
166

C.2. SIMULATION RESULTS FROM THE GOVERNOR, VOLTAGE REGULATOR ANDEXCITER
Figure C.7: 3333 kVA generator system output values from the exciter, where: ef
is the field voltage that excites the
exciter-generator modeled as a salient pole, if
is the field current that excites the exciter-generator modeled as a salient
pole, is
is the line current from the exciter generator output, us
is the line voltage from the exciter generator output,
and If
is the current output from the rectifier after the exciter generator.
167

APPENDIX C. 3333 KVA GENERATOR MATLAB/SIMPOWERSYSTEMS MODEL
168
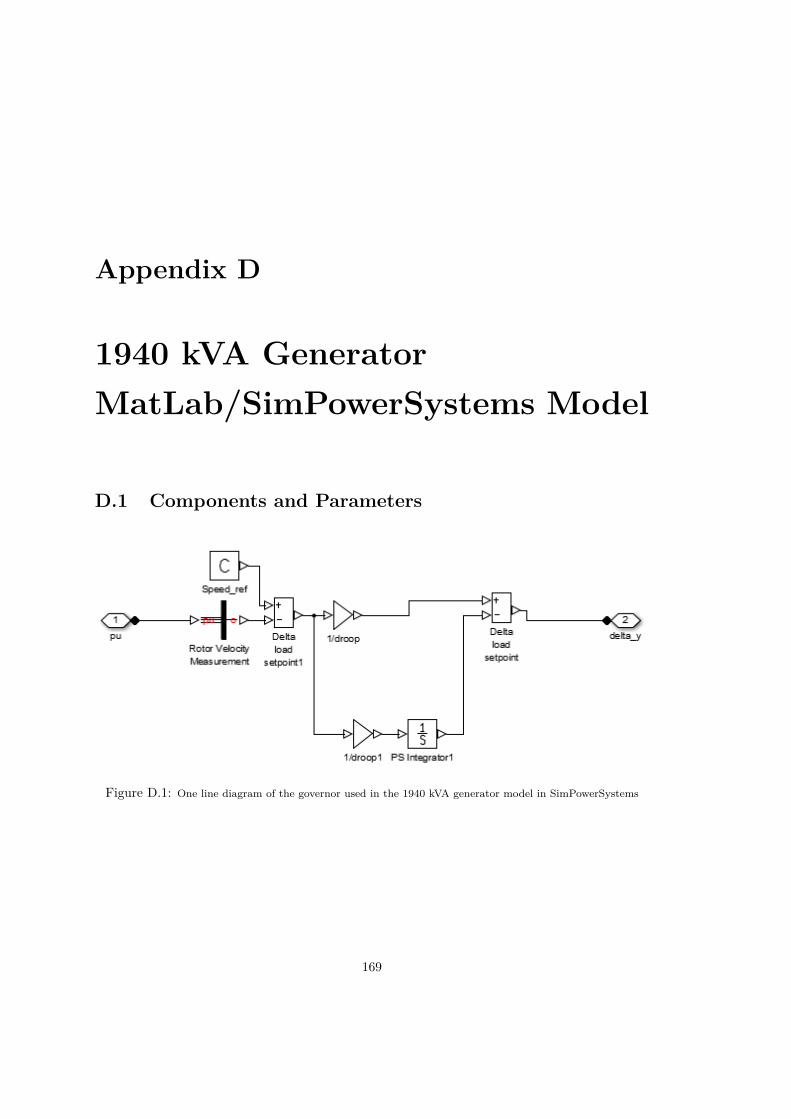
Appendix D
1940 kVA GeneratorMatLab/SimPowerSystems Model
D.1 Components and Parameters
Figure D.1: One line diagram of the governor used in the 1940 kVA generator model in SimPowerSystems
169

APPENDIX D. 1940 KVA GENERATOR MATLAB/SIMPOWERSYSTEMS MODEL
Figure D.2: One line diagram of the AVR and exciter used in the 1940 kVA generator model in SimPowerSystems
Table D.1: Parameter settings in 27.3 kVA exciter generator used in G2-model
Symbol Unit Parameter Descriptionf [Hz] 100 Rated electrical frequencyS [VA] 27.3e3 Rated apparent powerV [V] 128 Rated voltagen [-] 6 Number of pole pairsI [A] 3.15 Field circuit currentRa [pu] 0.015 Stator resistanceXl [pu] 0.15 Stator leakage reactanceXd [pu] 1.049 d-axis synchronous reactanceXq [pu] 0.543 q-axis synchronous reactanceX
0
[pu] 0.371 Zero-sequence reactanceX‘d [pu] 0.199 d-axis transient reactanceX“d [pu] 0.199 d-axis subtransient reactanceX“q [pu] 0.54 q-axis subtransient reactanceT ‘d0
[s] 0.509 d-axis transient open circuitT“d [s] 0.0001 d-axis subtransient short circuitT“q [s] 0.0001 q-axis subtransient schort circuitV [V] 1 Terminal voltage magnitude
170

D.1. COMPONENTS AND PARAMETERS
Figure D.3: One line diagram of the voltage regulator used in the 1940 kVA generator model in SimPowerSystems
Table D.2: Parameter settings for voltage regulator used in 1940 kVA generator model
Symbol Unit Parameter DescriptionConstantConstant [-] 1.2 Referance valueFilter 20ms1/T [-] 50 PS gain1/S [-] 0 PS Integratordroopd [-] 0.05 GainDiscrete PID controllerP [-] 1.19 ProportionalI [-] 0.43 IntegralD [-] 0.57 DerivativeN [-] 10000 Filter coe�cient
171

APPENDIX D. 1940 KVA GENERATOR MATLAB/SIMPOWERSYSTEMS MODEL
Figure D.4: One line diagram of the governor used to control the speed from the 1940 kVA generator used inthe SimPowerSystems model.
Table D.3: Parameter settings for governor used in G2-model
Symbol Unit Parameter Descriptionsref [pu] 0.998 Speed referencep [%] 5 percentage droopL [pu] 0.5 Load reference setpointTgov [s] 0.002 Time constant of governorT [s] 0.003 Time constant of main inlet volumes and steam chest·b [kNm] 16.615 Base torque·i [pu] 0.451061 Initial torque
172

D.2. SIMULATION RESULTS MEASURED FROM THE VOLTAGE REGULATOR,EXCITER AND GOVERNOR
D.2 Simulation Results Measured from the Voltage Regu-lator, Exciter and Governor
Figure D.5: 1940 kVA generator system output values from the governor, where deltay
is the signal output from the
governor.
173
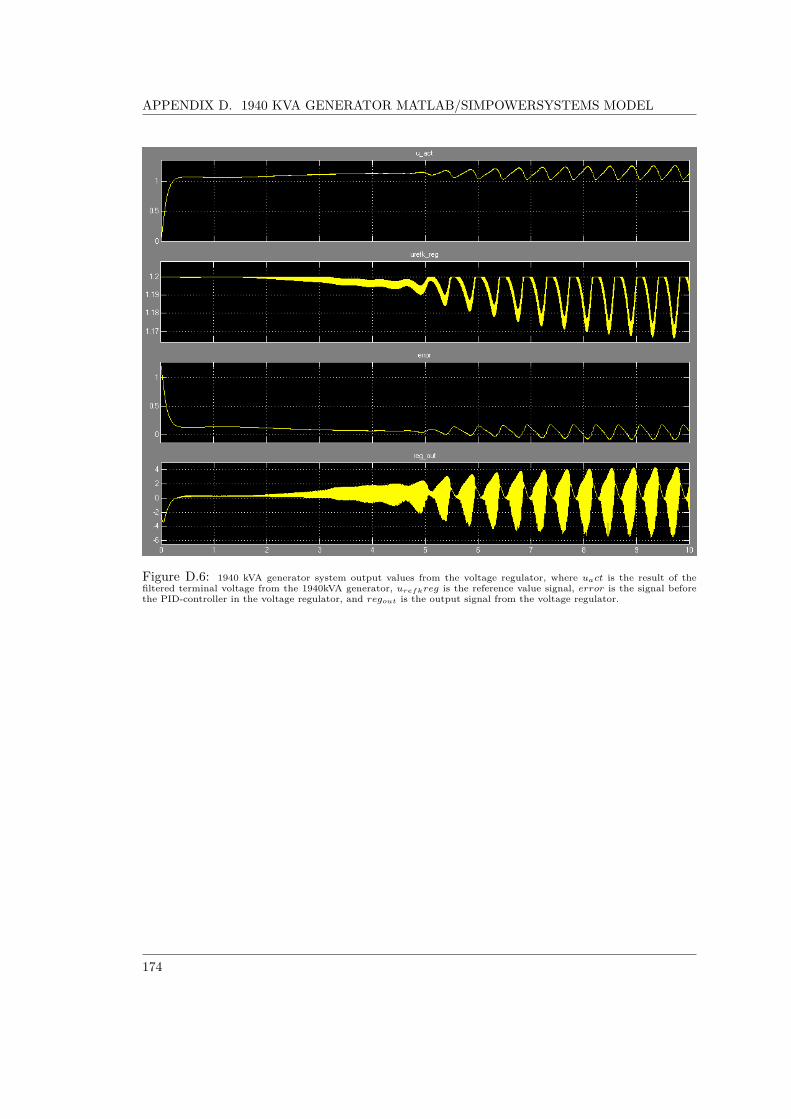
APPENDIX D. 1940 KVA GENERATOR MATLAB/SIMPOWERSYSTEMS MODEL
Figure D.6: 1940 kVA generator system output values from the voltage regulator, where ua
ct is the result of the
filtered terminal voltage from the 1940kVA generator, urefk
reg is the reference value signal, error is the signal before
the PID-controller in the voltage regulator, and regout
is the output signal from the voltage regulator.
174

D.2. SIMULATION RESULTS MEASURED FROM THE VOLTAGE REGULATOR,EXCITER AND GOVERNOR
Figure D.7: 1940 kVA generator system output values from the exciter, where: ef
is the field voltage that excites the
exciter-generator modeled as a salient pole, if
is the field current that excites the exciter-generator modeled as a salient
pole, is
is the line current from the exciter generator output, us
is the line voltage from the exciter generator output,
and If
is the current output from the rectifier after the exciter generator
175

APPENDIX D. 1940 KVA GENERATOR MATLAB/SIMPOWERSYSTEMS MODEL
176

177
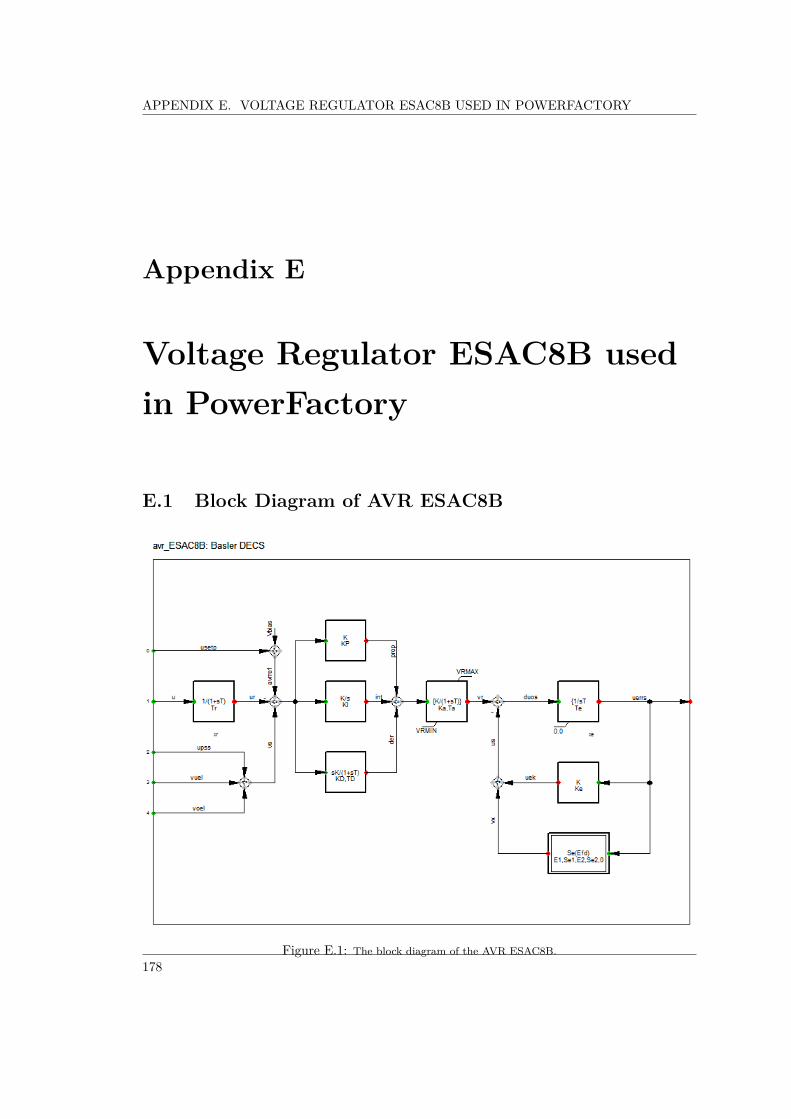
APPENDIX E. VOLTAGE REGULATOR ESAC8B USED IN POWERFACTORY
Appendix E
Voltage Regulator ESAC8B usedin PowerFactory
E.1 Block Diagram of AVR ESAC8B
Figure E.1: The block diagram of the AVR ESAC8B.178

E.2. PARAMETER SETTING OF AVR ESAC8B
E.2 Parameter Setting of AVR ESAC8B
Table E.1: Voltage regulator ESAC8B parameters settings
Symbol Unit Parameter Description
Kp [pu] 120.5 PID proportional gainKI [pu] 165.5 PID integral gainTI [s] 1 PID integral time constantKD [pu] 25 PID derivative gainTD [s] 0.01 PID derivative time constantKA [pu] 1 Voltage regulator gainTA [s] 0 Regulator time constantVRmax [pu] 35 Maximium regulator outputVRmin [pu] 0 Minimum regulator outputKE [pu] 1.0 Exciter constantTE [s] 0.5 Exciter time constantSE1
[pu] 1.346 Saturation curve value at point 1E
1
[pu] 2.222 Voltage value at point 1SE2
[pu] 1.9 Saturation curve value at point 2E
2
[pu] 2.962 Voltage value at point 2
179

APPENDIX E. VOLTAGE REGULATOR ESAC8B USED IN POWERFACTORY
180
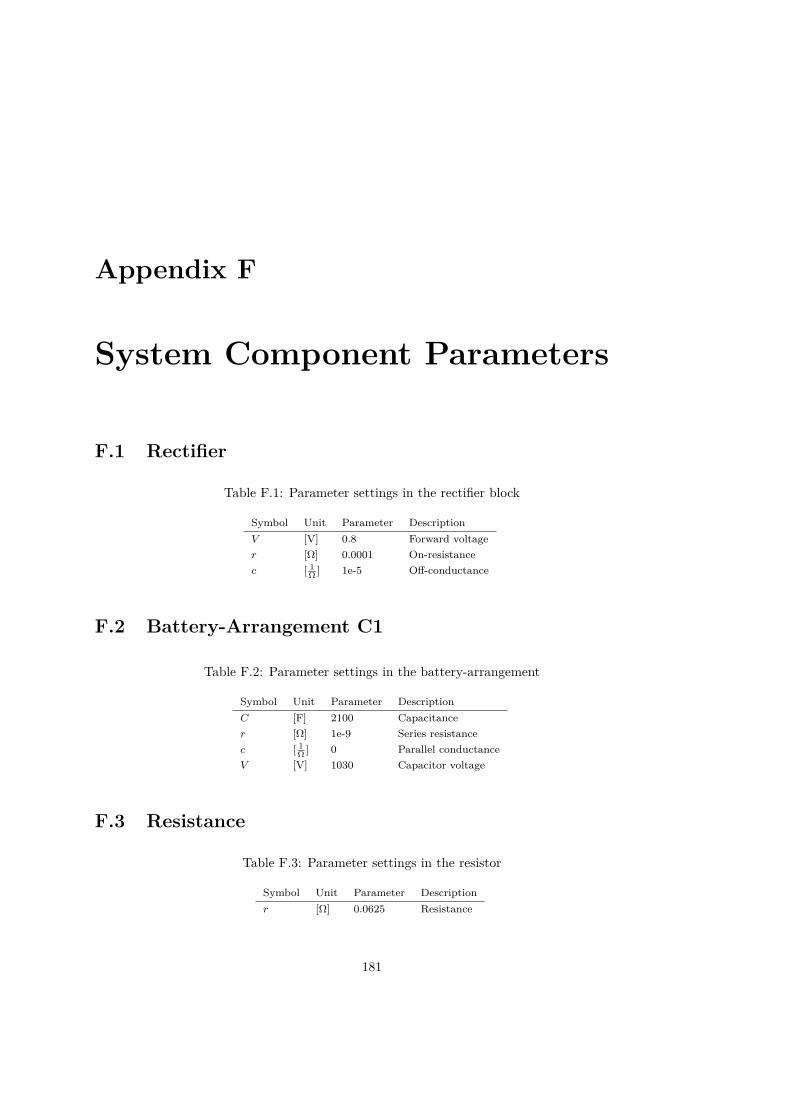
Appendix F
System Component Parameters
F.1 Rectifier
Table F.1: Parameter settings in the rectifier block
Symbol Unit Parameter DescriptionV [V] 0.8 Forward voltager [�] 0.0001 On-resistancec [ 1
� ] 1e-5 O�-conductance
F.2 Battery-Arrangement C1
Table F.2: Parameter settings in the battery-arrangement
Symbol Unit Parameter DescriptionC [F] 2100 Capacitancer [�] 1e-9 Series resistancec [ 1
� ] 0 Parallel conductanceV [V] 1030 Capacitor voltage
F.3 Resistance
Table F.3: Parameter settings in the resistor
Symbol Unit Parameter Descriptionr [�] 0.0625 Resistance
181
APPENDIX F. SYSTEM COMPONENT PARAMETERS
182

Appendix G
SimScape Lithium-Ion BatteryModel
G.1 Equivalent Circuit
Figure G.1: The equivalent circuit of the SimScape-block lithium-ion type battery used in the SimPowerSystemsmodel.
183

APPENDIX G. SIMSCAPE LITHIUM-ION BATTERY MODEL
G.2 Lithium-Ion Battery Model
Discharge model (i*>0)
f1
(it, iú, i) = E0
≠ K ú Q
Q ≠ itú i ú ≠KK ú Q
Q ≠ itú it + A ú exp(≠B ú it) (G.1)
Charge model (i*<0)
f2
(it, iú, i) = E0
≠ K ú Q
it + 0.1 ú Qú i ú ≠KK ú Q
Q ≠ itú it + A ú exp(≠B ú it) (G.2)
Where:
• E0
= Constant voltage
• K = Polarization constant (Ah≠1) or polarization resistance (Ohms)
• iú = Low frequency current dynamics (A)
• i = Battery current (A)
• it = Extracted capacity (Ah)
• Q = Maximum battery capacity (Ah)
• A = Exponential voltage (V)
• B = Exponential capacity (Ah)( ≠ 1)
184
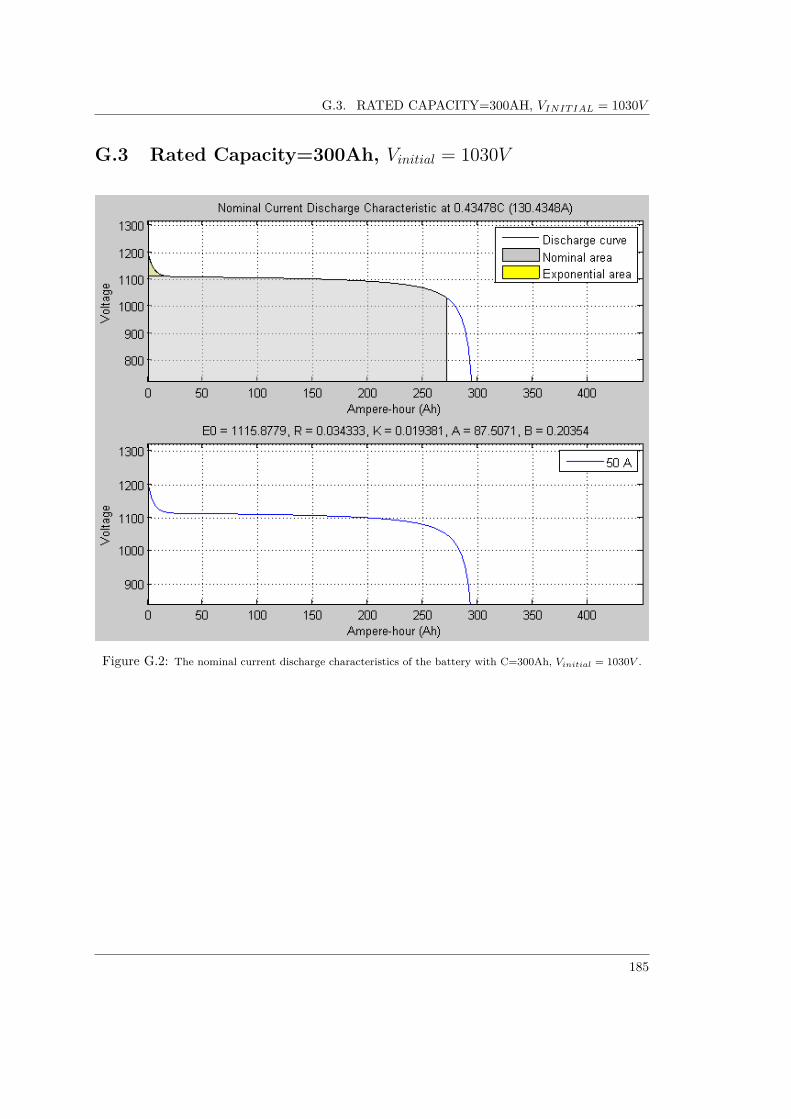
G.3. RATED CAPACITY=300AH, VINIT IAL = 1030V
G.3 Rated Capacity=300Ah, Vinitial = 1030V
Figure G.2: The nominal current discharge characteristics of the battery with C=300Ah, Vinitial = 1030V .
185

APPENDIX G. SIMSCAPE LITHIUM-ION BATTERY MODEL
G.4 Rated Capacity=300Ah, Vinitial = 950V
Figure G.3: The nominal current discharge characteristics of the battery with C=300Ah, Vinitial = 950V .
186

G.5. RATED CAPACITY=150AH, VINIT IAL = 950V
G.5 Rated Capacity=150Ah, Vinitial = 950V
Figure G.4: The nominal current discharge characteristics of the battery with C=150Ah, Vinitial = 950V .
187

APPENDIX G. SIMSCAPE LITHIUM-ION BATTERY MODEL
188

Appendix H
Voltage Regulator AC5A inMatLab/SimPowerSystems
H.1 One-Line Diagram of AVR AC5A
Figure H.1: The line diagram of the AVR AC5A.
189

APPENDIX H. VOLTAGE REGULATOR AC5A IN MATLAB/SIMPOWERSYSTEMS
H.2 Parameter Settings of AVR AC5A
Table H.1: Parameter settings for AVR type AC5A. Terminal voltage transducer: TR = 0, RC =0; XC = 0 [23]
Symbol Unit Parameter DescriptionKA [pu] 400 Regulator output gainTA [s] 0.02 Regulator output time constantVRMAX [pu] 7.3 Maximum controller output voltageVRMIN [pu] -7.3 Minimum controller output voltageTE [s] 0.8 Exciter field time constantKE [pu] 1.0 Exciter field proportional constantSE [EF D1
] [pu] 0.86 Saturation factor at EF D1
EF D1
[pu] 5.6 Exciter flux at SE [EF D1
]SE [EF D2
] [pu] 0.5 Saturation factor at EF D2
EF D2
[pu] 0.75 ú EF D1
Exciter flux at SE [EF D2
]KF [pu] 0.03 Rate feedback gainTF 1
[pu] 1.0 Rate feedback time constantTF 2
[pu] 0 Rate feedback time constantTF 3
[pu] 0 Rate feedback time constant
190

H.3. G2 OUTPUT PARAMETERS WHEN AC5A IS ADDED, AND VREF = 1.0 ATNO-LOAD. THE BATTERY ARRANGEMENT IS INCLUDED
H.3 G2 Output Parameters when AC5A is Added, andVref = 1.0 at No-Load. The Battery Arrangement isIncluded
Figure H.2: The 1940kVA round rotor generator outputs when the AVR AC5A is added to the model, no loadis attached to the dc-side of the rectifier, and the reference value of the regulator is 1.0. w is the rotor velocity,uiex is the field voltage of the exciter, theta is the rotor angle, udq is the stator voltage in the d- and q-axis, idq isthe stator current in the d- and q-axis, uabc and iabc is the terminal voltage in rms and the current, respectively.
191

APPENDIX H. VOLTAGE REGULATOR AC5A IN MATLAB/SIMPOWERSYSTEMS
H.4 G2 Output Parameters when AC5A is Added, andVref = 1.2 at No-Load. The 150Ah Battery Model isIncluded.
Figure H.3: The 1940kVA round rotor generator outputs when the AVR AC5A is added to the model, no loadis attached to the dc-side of the rectifier, and the reference value of the regulator is 1.2. w is the rotor velocity,uiex is the field voltage of the exciter, theta is the rotor angle, udq is the stator voltage in the d- and q-axis, idq isthe stator current in the d- and q-axis, uabc and iabc is the terminal voltage in rms and the current, respectively.
192