st. joseph s healthcare system, inc. and affiliates
TRANSCRIPT
St. Joseph’s Healthcare
System, Inc. and Affiliates Consolidated Financial Statements and Additional Consolidating Information as of and for the Years Ended December 31, 2013 and 2012, and Independent Auditors’ Report

ST. JOSEPH’S HEALTHCARE SYSTEM, INC. AND AFFILIATES
TABLE OF CONTENTS
Page
INDEPENDENT AUDITORS’ REPORT 1–2
CONSOLIDATED FINANCIAL STATEMENTS AS OF AND FOR
THE YEARS ENDED DECEMBER 31, 2013 AND 2012:
Balance Sheets 3
Statements of Operations 4
Statements of Changes in Net Assets 5
Statements of Cash Flows 6–7
Notes to Consolidated Financial Statements 8–36
ADDITIONAL CONSOLIDATING INFORMATION AS OF AND FOR
THE YEARS ENDED DECEMBER 31, 2013 AND 2012: 37
Consolidating Schedules — Balance Sheet Information 38–41
Consolidating Schedules — Operating Results Information 42–43
Consolidating Schedules — Changes in Net Assets Information 44–45

INDEPENDENT AUDITORS’ REPORT
To the Board of Trustees of
St. Joseph’s Healthcare System, Inc.
Paterson, New Jersey
We have audited the accompanying consolidated financial statements of St. Joseph’s Healthcare
System, Inc. and its affiliates (the “System”), which comprise the consolidated balance sheets as of
December 31, 2013 and 2012, and the related consolidated statements of operations, changes in net assets,
and cash flows for the years then ended, and the related notes to the consolidated financial statements.
Management’s Responsibility for the Consolidated Financial Statements
Management is responsible for the preparation and fair presentation of these consolidated financial
statements in accordance with accounting principles generally accepted in the United States of America;
this includes the design, implementation, and maintenance of internal control relevant to the preparation
and fair presentation of consolidated financial statements that are free from material misstatement,
whether due to fraud or error.
Auditors’ Responsibility
Our responsibility is to express an opinion on these consolidated financial statements based on our audits.
We did not audit the financial statements of St. Joseph’s Hospital and Medical Center Foundation, Inc.,
and St. Joseph’s Wayne Hospital Foundation, Inc. (“consolidated affiliates”), which statements reflect
total assets constituting 3.5% of consolidated total assets at December 31, 2013 and 2012, and revenues
constituting 0.7% and 1.1%, respectively, of consolidated total revenues for the years then ended. Those
statements were audited by other auditors, whose reports have been furnished to us, and our opinion,
insofar as it relates to the amounts included for the consolidated affiliates, is based solely on the report of
the other auditors. We conducted our audits in accordance with auditing standards generally accepted in
the United States of America. Those standards require that we plan and perform the audit to obtain
reasonable assurance about whether the consolidated financial statements are free from material
misstatement.
An audit involves performing procedures to obtain audit evidence about the amounts and disclosures in
the consolidated financial statements. The procedures selected depend on the auditor’s judgment,
including the assessment of the risks of material misstatement of the consolidated financial statements,
whether due to fraud or error. In making those risk assessments, the auditor considers internal control
relevant to the System’s preparation and fair presentation of the consolidated financial statements in order
to design audit procedures that are appropriate in the circumstances, but not for the purpose of expressing
an opinion on the effectiveness of the System’s internal control. Accordingly, we express no such
opinion. An audit also includes evaluating the appropriateness of accounting policies used and the
reasonableness of significant accounting estimates made by management, as well as evaluating the overall
presentation of the consolidated financial statements.

- 2 -
We believe that the audit evidence we have obtained is sufficient and appropriate to provide a basis for
our audit opinion.
Opinion
In our opinion, based on our audits and the reports of the other auditors, the consolidated financial
statements referred to above present fairly, in all material respects, the consolidated financial position of
the System as of December 31, 2013 and 2012, and the consolidated results of its operations, changes in
its net assets, and its cash flows for the years then ended in accordance with accounting principles
generally accepted in the United States of America.
Report on Additional Consolidating Information
Our audits were conducted for the purpose of forming an opinion on the consolidated financial statements
as a whole. The additional consolidating information on pages 37–45 is presented for the purpose of
additional analysis of the consolidated financial statements rather than to present the financial position,
results of operations, and cash flows of the individual entities, and are not a required part of the
consolidated financial statements. This additional consolidating information is the responsibility of the
System’s management and was derived from and relates directly to the underlying accounting and other
records used to prepare the consolidated financial statements. Such information has been subjected to the
auditing procedures applied in our audits of the consolidated financial statements and (as to the amounts
included for the consolidated affiliates mentioned above) the reports of other auditors, and certain
additional procedures, including comparing and reconciling such information directly to the underlying
accounting and other records used to prepare the consolidated financial statements or to the consolidated
financial statements themselves, and other additional procedures in accordance with auditing standards
generally accepted in the United States of America. In our opinion, based on our audits and the reports of
other auditors, such additional consolidating information is fairly stated, in all material respects, in
relation to the consolidated financial statements as a whole
May 23, 2014

- 3 -
ST. JOSEPH’S HEALTHCARE SYSTEM, INC. AND AFFILIATES
CONSOLIDATED BALANCE SHEETS
AS OF DECEMBER 31, 2013 AND 2012
(In thousands)
2013 2012 2013 2012
ASSETS LIABILITIES
CURRENT ASSETS: CURRENT LIABILITIES:
Cash and cash equivalents 87,243$ 64,179$ Current portion of long-term debt 6,692$ 5,905$
Investments 80,451 81,462 Accounts payable 38,433 44,079
Current portion of assets whose use is limited 20,397 18,299 Accrued salaries and expenses 57,654 54,278
Patient accounts receivable — less allowance for doubtful Accrued interest payable 7,783 7,895
accounts of $82,636 in 2013 and $83,010 in 2012 64,768 63,065 Deferred revenue 523 3,121 Grants, notes, and other receivables 14,687 9,019 Estimated third-party payer settlements 4,330 14,531
Unconditional promises to give — net 3,002 3,033
Supplies 7,637 7,866 Total current liabilities 115,415 129,809 Prepaid expenses and other current assets 3,173 3,487
LONG-TERM DEBT — Net of current portion 254,194 256,302
Total current assets 281,358 250,410 ESTIMATED THIRD-PARTY PAYER SETTLEMENTS — Net
ASSETS WHOSE USE IS LIMITED — Less current portion 67,436 78,627 of current portion 6,068 3,126
UNCONDITIONAL PROMISES TO GIVE — Net 4,952 5,984 ACCRUED PENSION LIABILITY 107,398 169,861
NOTES RECEIVABLE 1,513 1,618 ESTIMATED PROFESSIONAL LIABILITY CLAIMS PAYABLE 20,467 21,523 PROPERTY AND EQUIPMENT — Net 340,202 344,007 OTHER LIABILITIES 4,514 3,856
BENEFICIAL INTEREST IN PERPETUAL TRUSTS 2,973 2,792 Total liabilities 508,056 584,477
INVESTMENTS IN JOINT VENTURES 23,458 26,813 COMMITMENTS AND CONTINGENCIES (Note 17)
OTHER ASSETS 15,187 14,628 NET ASSETS — Unrestricted:
St. Joseph’s Healthcare System, Inc. and affiliates 201,341 111,606 Noncontrolling interests in joint ventures 2,032 3,120
Total unrestricted net assets 203,373 114,726
Temporarily restricted 22,317 22,524 Permanently restricted 3,333 3,152
Total net assets 229,023 140,402
TOTAL 737,079$ 724,879$ TOTAL 737,079$ 724,879$
See notes to consolidated financial statements.
- 4 -
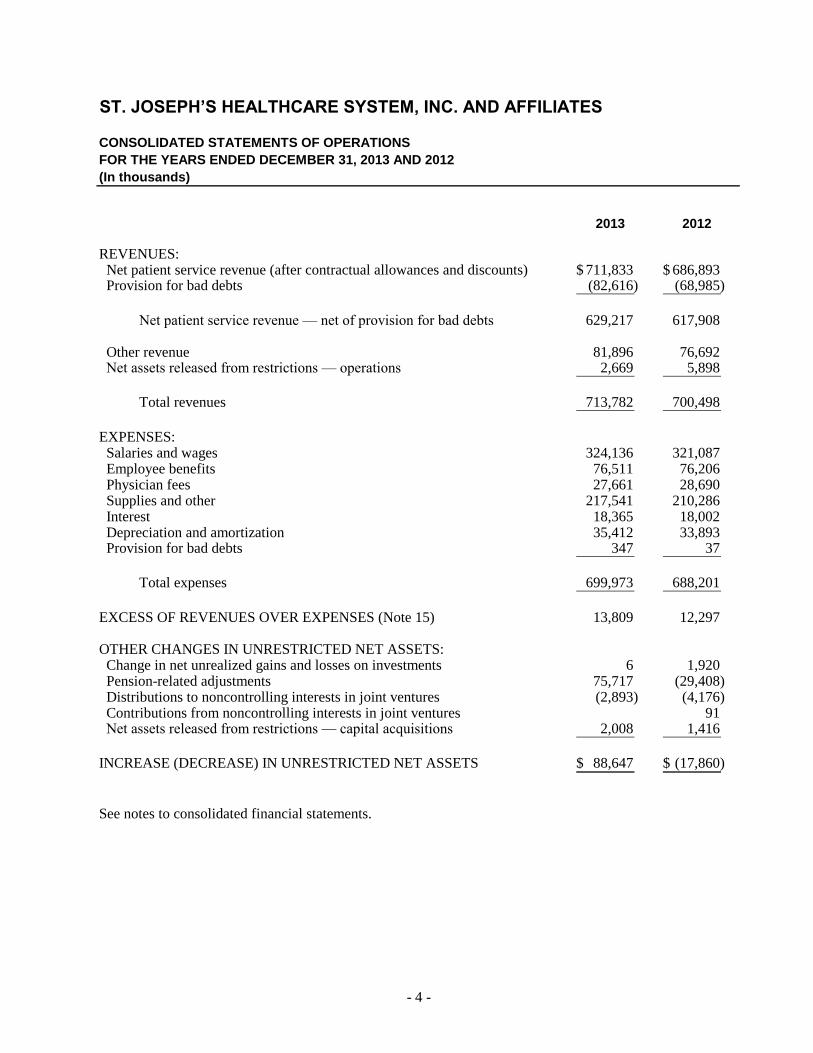
ST. JOSEPH’S HEALTHCARE SYSTEM, INC. AND AFFILIATES
CONSOLIDATED STATEMENTS OF OPERATIONS
FOR THE YEARS ENDED DECEMBER 31, 2013 AND 2012
(In thousands)
2013 2012
REVENUES: Net patient service revenue (after contractual allowances and discounts) 711,833$ 686,893$ Provision for bad debts (82,616) (68,985)
Net patient service revenue — net of provision for bad debts 629,217 617,908
Other revenue 81,896 76,692 Net assets released from restrictions — operations 2,669 5,898
Total revenues 713,782 700,498
EXPENSES: Salaries and wages 324,136 321,087 Employee benefits 76,511 76,206 Physician fees 27,661 28,690 Supplies and other 217,541 210,286 Interest 18,365 18,002 Depreciation and amortization 35,412 33,893 Provision for bad debts 347 37
Total expenses 699,973 688,201
EXCESS OF REVENUES OVER EXPENSES (Note 15) 13,809 12,297
OTHER CHANGES IN UNRESTRICTED NET ASSETS: Change in net unrealized gains and losses on investments 6 1,920 Pension-related adjustments 75,717 (29,408) Distributions to noncontrolling interests in joint ventures (2,893) (4,176) Contributions from noncontrolling interests in joint ventures 91 Net assets released from restrictions — capital acquisitions 2,008 1,416
INCREASE (DECREASE) IN UNRESTRICTED NET ASSETS 88,647$ (17,860)$
See notes to consolidated financial statements.
- 5 -
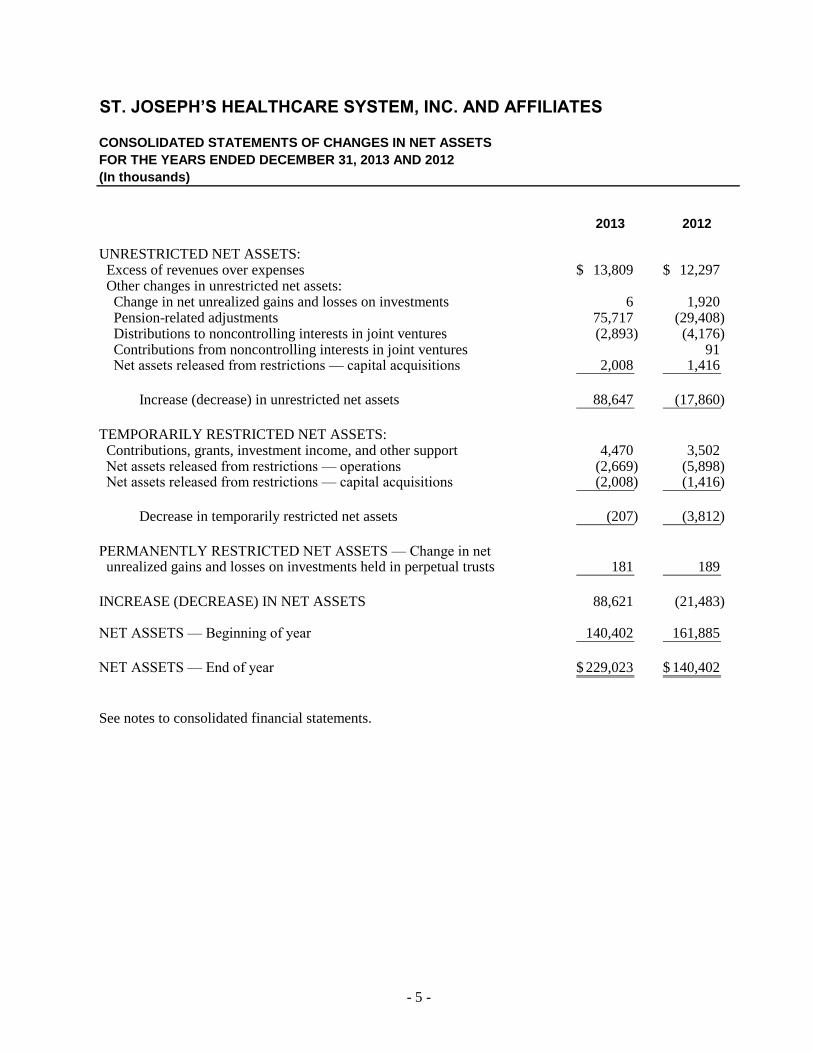
ST. JOSEPH’S HEALTHCARE SYSTEM, INC. AND AFFILIATES
CONSOLIDATED STATEMENTS OF CHANGES IN NET ASSETS
FOR THE YEARS ENDED DECEMBER 31, 2013 AND 2012
(In thousands)
2013 2012
UNRESTRICTED NET ASSETS: Excess of revenues over expenses 13,809$ 12,297$ Other changes in unrestricted net assets: Change in net unrealized gains and losses on investments 6 1,920 Pension-related adjustments 75,717 (29,408) Distributions to noncontrolling interests in joint ventures (2,893) (4,176) Contributions from noncontrolling interests in joint ventures 91 Net assets released from restrictions — capital acquisitions 2,008 1,416
Increase (decrease) in unrestricted net assets 88,647 (17,860)
TEMPORARILY RESTRICTED NET ASSETS: Contributions, grants, investment income, and other support 4,470 3,502 Net assets released from restrictions — operations (2,669) (5,898) Net assets released from restrictions — capital acquisitions (2,008) (1,416)
Decrease in temporarily restricted net assets (207) (3,812)
PERMANENTLY RESTRICTED NET ASSETS — Change in net unrealized gains and losses on investments held in perpetual trusts 181 189
INCREASE (DECREASE) IN NET ASSETS 88,621 (21,483)
NET ASSETS — Beginning of year 140,402 161,885
NET ASSETS — End of year 229,023$ 140,402$
See notes to consolidated financial statements.

- 6 -
ST. JOSEPH’S HEALTHCARE SYSTEM, INC. AND AFFILIATES
CONSOLIDATED STATEMENTS OF CASH FLOWS
FOR THE YEARS ENDED DECEMBER 31, 2013 AND 2012
(In thousands)
2013 2012
CASH FLOWS FROM OPERATING ACTIVITIES:
Increase (decrease) in net assets 88,621$ (21,483)$
Adjustments to reconcile increase (decrease) in net assets to net cash provided by
operating activities:
Depreciation and amortization 34,769 33,266
Provision for bad debts 83,595 69,022
Change in net unrealized gains and losses on investments 6 (1,920)
Realized (gains) losses on sales of investments (669) 393
Change in unrealized gains and losses on investments in perpetual trusts 181 (189)
Temporarily restricted contributions, grants, investment income, and other support (4,470) (3,502)
Pension-related adjustments (75,717) 29,408
Change in asset retirement obligations 300 49
Amortization of deferred financing costs 32 394
Amortization of bond discount 714 759
Amortization of debt premium (32) (37)
Amortization of noncompete agreement 611 580
Distributions to noncontrolling interest in joint ventures 2,893 4,176
Equity contributions from noncontrolling interest in joint ventures (91)
Equity in earnings of joint ventures (2,184) (1,862)
Gain on sale of property (652)
Changes in operating assets and liabilities:
Patient accounts receivable (84,951) (71,375)
Grants, notes, and other receivables (4,952) 5,714
Supplies 229 (418)
Prepaid expenses and other current assets 314 (1,516)
Other assets (1,202) 633
Accounts payable (5,514) (306)
Accrued salaries and expenses 3,376 3,451
Accrued interest payable (112) (102)
Deferred revenue (2,598) (2,537)
Estimated third-party payer settlements (7,259) (2,078)
Accrued pension liability 13,254 9,745 Estimated professional liability claims payable and other noncurrent liabilities (698) 4,268
Net cash provided by operating activities 38,537 53,790
CASH FLOWS FROM INVESTING ACTIVITIES:
Acquisition of property and equipment (31,097) (40,075)
Proceeds from sale of property 652
Return of investment in joint venture 5,539
Purchases of investments (83,004) (120,859)
Proceeds from sales of investments 93,733 126,383 Net change in restricted cash and cash equivalents (323) (1,258)
Net cash used in investing activities (15,152) (35,157)
(Continued)

- 7 -
ST. JOSEPH’S HEALTHCARE SYSTEM, INC. AND AFFILIATES
CONSOLIDATED STATEMENTS OF CASH FLOWS
FOR THE YEARS ENDED DECEMBER 31, 2013 AND 2012
(In thousands)
2013 2012
CASH FLOWS FROM FINANCING ACTIVITIES:
Repayment of long-term debt (5,803)$ (6,077)$
Proceeds from long-term debt 3,800
Repayment of notes receivable 105 103
Equity contributions from noncontrolling interests 91
Distributions paid to noncontrolling interests in joint ventures (2,893) (4,176) Temporarily restricted contributions, investment income, and other support 4,470 3,502
Net cash used in financing activities (321) (6,557)
NET INCREASE IN CASH AND CASH EQUIVALENTS 23,064 12,076
CASH AND CASH EQUIVALENTS: Beginning of year 64,179 52,103
End of year 87,243$ 64,179$
SUPPLEMENTAL DISCLOSURE OF CASH FLOW INFORMATION — Cash paid for interest (including capitalized interest of $264 and $671 in 2013 and 2012, respectively) 16,581$ 18,104$
SUPPLEMENTAL SCHEDULE OF NONCASH INVESTING AND FINANCING ACTIVITIES — Accruals for the acquisition on property and equipment 132$ 3,152$
See notes to consolidated financial statements. (Concluded)

- 8 -
ST. JOSEPH’S HEALTHCARE SYSTEM, INC. AND AFFILIATES
NOTES TO CONSOLIDATED FINANCIAL STATEMENTS AS OF AND FOR THE YEARS ENDED DECEMBER 31, 2013 AND 2012
1. ORGANIZATION AND SUMMARY OF SIGNIFICANT ACCOUNTING POLICIES
Organization — The accompanying consolidated financial statements include the accounts of
St. Joseph’s Healthcare System, Inc. (the “Parent”), a not-for-profit holding corporation sponsored by
the Sisters of Charity of Saint Elizabeth, and its affiliates (collectively, the “System”). Affiliated
members of the Parent include St. Joseph’s Hospital and Medical Center and subsidiaries (the “Medical
Center”), St. Joseph’s Hospital and Medical Center Foundation, Inc. (the “Medical Center Foundation”),
St. Joseph’s Wayne Hospital Foundation, Inc. (the “Wayne Foundation”), 200 Hospital Plaza
Corporation (“200 Hospital Plaza”), SJHS Insurance Limited (the “Insurance Captive”), and VHS
Management, Inc. and subsidiary (VHS).
St. Joseph’s Hospital and Medical Center d/b/a St. Joseph’s Regional Medical Center (the “Regional
Medical Center”) was founded in 1867 and is located in Paterson, New Jersey. It is an acute-care
hospital with 651 licensed beds and 30 newborn bassinets. The Medical Center is a state-designated
trauma center and provides a full range of health care services. Effective January 1, 2010, St. Joseph’s
Wayne Hospital, Inc., and subsidiary (“Wayne Hospital”) was merged with the Regional Medical Center
and is referred to herein as the Medical Center. Wayne Hospital is located in Wayne, New Jersey, and is
an acute-care hospital with 229 licensed beds. Wayne Hospital provides comprehensive medical and
surgical care and emergency and diagnostic services for its community.
In addition, the Medical Center includes the following wholly owned subsidiaries:
St. Vincent’s Nursing Home operates a 151-bed skilled nursing facility.
St. Joseph’s Hospital Housing Corp. (the “Housing Corp.”) and its subsidiaries Genesis Property
Development Holding, LLC and Genesis Property Development, LLC (“Genesis”) provide property
management services for nonhospital-related real estate holdings. The Housing Corp. ceased its
operations in 2009.
St. Joseph’s Healthcare, Inc., St. Joseph’s Emergency Physicians, Inc., St. Joseph’s Faculty
Physicians, Inc., and St. Joseph’s Physician’s, Inc., manage the Medical Center’s faculty staff billing
services.
Harbor House, Inc. and its subsidiaries Harborside Apartments, Inc. and Harborview
Apartments, Inc., provide housing and services to individuals with mental illnesses.
The Medical Center is also the majority member of the following consolidated subsidiaries: St. Joseph’s
Regional Cardiology, LLC (“Paterson Cardiology”), St. Joseph’s Wayne Cardiology, LLC (“Wayne
Cardiology”), Blue Moon Properties, LLC (“Blue Moon”), and St. Joseph’s Ambulatory Surgical
Associates, LLC (“Ambulatory Surgical”). Paterson Cardiology and Wayne Cardiology are limited
liability corporations that each operate a cardiac catheterization laboratory. Blue Moon is a limited
liability corporation that provides radiology management services. Ambulatory Surgical is a limited
liability corporation that invests in ambulatory surgical centers.

- 9 -
The Medical Center Foundation and the Wayne Foundation are public charities whose primary purpose
is to raise funds for the Medical Center and Wayne Hospital, respectively, and their affiliated
organizations, and other area charitable organizations.
200 Hospital Plaza is a not-for-profit organization whose purpose is to further the operations of the
Medical Center by owning, managing, and operating parking facilities and any other facilities that may
be deemed useful or necessary for employees, patients, visitors, doctors, and other persons affiliated
with the Medical Center.
The Insurance Captive, which is a wholly owned captive insurance company domiciled in Bermuda, was
established in 2007 to provide the System with general liability and professional medical liability
insurance.
VHS is a not-for-profit corporation incorporated in the state of New Jersey and is the holding company
of Visiting Health Services of New Jersey, Inc. (the “Agency”). The Agency is located in Totowa, New
Jersey, and is a not-for-profit home health agency serving Passaic, Bergen, and Morris counties in New
Jersey.
In connection with the issuance of the New Jersey Healthcare Facilities Financing Authority (the
“Authority”) St. Joseph’s Healthcare System Obligated Group Issue, Series 2008 Revenue Bonds in
2008, the System formed an “Obligated Group,” which includes all of the System’s members, except for
200 Hospital Plaza, the Insurance Captive, and the Parent.
A summary of the System’s significant accounting policies is as follows:
Principles of Consolidation — The consolidated financial statements include the accounts of the Parent
and its affiliated members. The Parent accounts for its interests in entities in which it has significant
influence on the equity basis of accounting. Such controlled affiliates are disclosed in the additional
consolidating information using the cost method of accounting. All intercompany balances and
transactions have been eliminated in consolidation.
Basis of Accounting — The consolidated financial statements have been prepared on the accrual basis of
accounting in conformity with accounting principles generally accepted in the United States of America
(GAAP) consistent with the Financial Accounting Standards Board Accounting Standards
Codification 954, Health Care Entities, and the American Institute of Certified Public Accountants’
Audit and Accounting Guide, Health Care Entities, and other pronouncements applicable to health care
organizations.
Use of Estimates — The preparation of consolidated financial statements in conformity with GAAP
requires management to make estimates and assumptions that affect the reported amounts of assets and
liabilities and disclosure of contingent assets and liabilities as of the date of the consolidated financial
statements. Estimates also affect the reported amounts of revenues and expenses during the reporting
period. Actual results could differ from those estimates. Significant estimates include the allowance for
doubtful accounts, contractual allowances, estimated third-party payer settlements, valuation of
goodwill, accrued pension liability, estimated professional liability claims payable, and other self-
insurance liabilities.
Cash and Cash Equivalents — Cash and cash equivalents include highly liquid investments with an
original maturity of three months or less, except for amounts recorded in assets whose use is limited.

- 10 -
Investments and Investment Income — Investments in equity securities with readily determinable fair
values, all investments in debt securities, and repurchase investment contracts are reported at fair value.
Fair value is based on quoted market prices of the investment or similar investments. Investment income
or loss (including realized gains and losses on investments, interest, and dividends) is included in other
revenue in the accompanying consolidated statements of operations, unless the income or loss is
restricted by donor or law. Net unrealized gains and losses on investments are excluded from the excess
of revenues over expenses, except that declines in fair value that are determined by management to be
other than temporary are reported as realized losses. Donated investments are recorded at the fair value
on the date of receipt.
Investments, in general, are exposed to various risks, such as interest rate, credit, and overall market
volatility. As such, it is reasonably possible that changes in the values of investments will occur in the
near term and that such changes could materially affect the amounts reported in the consolidated
financial statements.
Other-than-Temporary Impairment of Investments — The System reviews its investments to identify
those for which fair value is below cost. The System then makes a determination as to whether the
investment should be considered other-than-temporarily impaired. No such losses were recorded in 2013
or 2012.
Assets Whose Use is Limited — Assets whose use is limited include assets held by trustees under bond
indenture agreements, professional liability funds, investments held by the Insurance Captive,
designated assets set aside by the Board of Trustees over which the board retains control and may at its
discretion subsequently use for other purposes, and donor-restricted assets. Amounts available to meet
current liabilities of the System have been classified as current assets in the consolidated balance sheets.
Investment in Consolidated Subsidiaries — The Medical Center is a majority member of Paterson
Cardiology, Wayne Cardiology, Blue Moon, and Ambulatory Surgical, and maintains a 51% interest in
each of the entities at December 31, 2013 and 2012. The accounts of these consolidated subsidiaries are
consolidated with those of the Medical Center. All intercompany transactions and account balances have
been eliminated in consolidation.
Supplies — Supplies are stated at the lower of cost (first-in, first-out) or market.
Property and Equipment — Property and equipment acquisitions are recorded at cost, except donated
assets, which are recorded at fair value at the date of donation. Depreciation expense is provided over
the estimated useful life of each class of depreciable asset and is computed using the straight-line
method. Equipment under capital lease obligations is amortized on the straight-line method over the
shorter period of the lease term or the estimated useful life of the equipment. Such amortization is
included in depreciation and amortization in the consolidated statements of operations.
Construction in progress represents amounts expended or incurred toward property and equipment
projects, which have not been completed. No depreciation or amortization has been recorded for these
items. Interest costs incurred or imputed on borrowed funds during the period of construction of capital
assets are capitalized as a component of the cost of acquiring those assets.
Estimated useful lives for the assets are as follows:
Land improvements 15–20 yearsBuildings and improvements 5–40 yearsFixed and major movable equipment 5–12 years

- 11 -
Gifts of long-lived assets, such as land, buildings, or equipment, are reported as unrestricted support,
unless explicit donor stipulations specify how the donated assets must be used. Gifts of long-lived assets
with explicit restrictions that specify how the assets are to be used and gifts of cash or other assets that
must be used to acquire long-lived assets are reported as restricted support. Absent explicit donor
stipulations about how long those long-lived assets must be maintained, expirations of donor restrictions
are reported when the donated or acquired long-lived assets are placed in service.
Goodwill and Other Intangible Assets — Goodwill is recorded when the purchase price paid for an
acquisition exceeds the estimated fair value of the net identified tangible and intangible assets acquired.
Goodwill is not amortized, but instead is tested for impairment at the reporting unit level annually or
more frequently if the presence of certain circumstances indicates that impairment may have occurred.
The impairment review process compares the fair value of the reporting unit in which goodwill resides
to the carrying value. If the carrying amount of a reporting unit exceeds its fair value, then the amount of
the impairment loss must be measured. The System has selected December 31 as its annual testing date.
Acquired identified intangible assets (other than goodwill) are amortized on a straight-line basis over the
period of benefit, which is five years. The System evaluates the recoverability of identifiable intangible
assets whenever events or changes in circumstances indicate that an intangible asset’s carrying amount
may not be recoverable. Goodwill and other intangible assets are included in other assets in the
consolidated balance sheets at December 31, 2013 and 2012.
Impairment of Long-Lived Assets — Long-lived assets are reviewed for impairment whenever events or
changes in circumstances indicate that the carrying amount of an asset may not be recoverable. If long-
lived assets are deemed to be impaired, the impairment to be recognized is measured by the amount by
which the carrying amount of the assets exceeds the fair value. Assets to be disposed of are reported at
the lower of the carrying amount or the fair value less costs to sell.
Deferred Financing Costs — Deferred financing costs represent costs incurred to obtain financing for
various construction and renovation projects at the Medical Center, Wayne Hospital, and 200 Hospital
Plaza. These costs are amortized over the remaining term of the applicable indebtedness using the
effective interest method. At December 31, 2013 and 2012, deferred financing costs, net of accumulated
amortization, of approximately $3.5 million and $3.9 million, respectively, are included in other assets
in the consolidated balance sheets. Total accumulated amortization at December 31, 2013 and 2012, was
approximately $2.2 million and $1.8 million, respectively.
Beneficial Interest in Perpetual Trusts — Perpetual trusts are arrangements in which a donor establishes
and funds a perpetual trust administrated by a third party. The perpetual trusts consist of life estate gifts.
Under the terms of the trusts, the Medical Center Foundation and the Wayne Foundation have an
irrevocable right to receive the income earned on the trust assets in perpetuity. Income earned is
unrestricted and included in other revenue in the consolidated statements of operations. The Medical
Center Foundation and the Wayne Foundation do not control the assets held by an outside trust. The
Medical Center Foundation and the Wayne Foundation recognize their respective interests in the trusts
as a permanently restricted contribution based on the fair value of the trust assets. Changes in the fair
value of the trusts are recorded as a change in the net unrealized gains and losses on investments held in
perpetual trusts in the consolidated statements of changes in net assets.
Investments in Joint Ventures — The System’s investments in joint ventures are accounted for using the
equity method and cost method of accounting.
Other Assets — Other assets consist primarily of goodwill, other intangible assets, deferred financing
costs, investments held by trustee, security deposits, and physician loan receivables.

- 12 -
Other Liabilities — Capital project obligations related to grant agreements with the State of New Jersey
Department of Health and Human Services, Division of Mental Health Services in the amount of
$945,000 at both December 31, 2013 and 2012, are included in other noncurrent liabilities in the
consolidated balance sheets.
Deferred Revenue — Advances received from third-party payers for future services to be provided to
patients are recorded as deferred revenue in the consolidated balance sheets. The System is the recipient
of various awards and contracts from governmental agencies. Unearned revenue is recorded as deferred
revenue in the consolidated balance sheets upon receipt. Revenues are recognized only to the extent of
expenditures incurred, and are recorded in other revenue in the consolidated statements of operations.
Net Patient Service Revenue — Net patient service revenue is reported at the estimated net realizable
amount from patients, third-party payers, and others for services rendered and includes estimated
retroactive adjustments due to future audits, reviews, and investigations. Retroactive adjustments are
considered in the recognition of revenue on an estimated basis in the period the related services are
rendered, and such amounts are adjusted in future periods as adjustments become known or as years are
no longer subject to such audits, reviews, and investigations. As a result, there is at least a reasonable
possibility that recorded estimates will change by a material amount in the near term.
Contributions and Pledges Receivable — Unconditional promises to give that are expected to be
collected within one year are recorded at net realizable value. Unconditional promises to give that are
expected to be collected in future years are recorded at the present value of their estimated future cash
flows. The discounts on those amounts are computed using a risk-free discount rate of 3.68% at both
December 31, 2013 and 2012. Conditional promises to give are not included as support until the
conditions are substantially met. Amortization of the discount is recorded as other revenue or as
increases in temporarily or permanently restricted net assets in accordance with the donor-imposed
restrictions, if any, on the contributions.
Tax Status — The System, including all of its affiliates, except as noted below, are not-for-profit
corporations as described in Section 501(c)(3) of the Internal Revenue Code (“Code”) and are exempt
from federal income taxes on related income pursuant to Section 501(a) of the Code. The not-for-profit
affiliates of the System are also exempt from state income taxes. The Insurance Captive, Genesis,
Paterson Cardiology, Wayne Cardiology, and Blue Moon are for-profit corporations. Genesis, Paterson
Cardiology, Wayne Cardiology, and Blue Moon are limited liability corporations, which are treated as
partnerships, and do not require a provision for income taxes. The Insurance Captive is exempt from
taxes through March 2016.
Self-Insurance — The Medical Center offers medical insurance to its employees through a health
maintenance organization and a preferred provider organization (PPO). The PPO provides third-party
administrative services for employees who are enrolled in the program. The Medical Center remains
self-insured for health insurance claims associated with the employees that select the PPO option. The
Medical Center is also self-insured for workers’ compensation. An estimated liability for employee
medical benefits incurred, but not reported, and workers’ compensation is included within accrued
salaries and expenses in the accompanying consolidated balance sheets. The System recognizes a
receivable for insurance recoveries at the time a liability is recorded, and records a valuation allowance
for uncollectible receivables.
Estimated Professional Liability Claims Payable — The System is insured for medical malpractice
claims on a claims-made basis. An estimated liability for medical malpractice costs related to reported
claims that exceed or are not subject to insurance coverage, if any, and incurred claims that have not
been reported to the Insurance Captive or claims-made insurance carrier is recorded in the consolidated

- 13 -
balance sheets. The Insurance Captive maintains a self-insurance reserve trust as the funding vehicle for
the self-insurance program. The System recognizes a receivable for insurance recoveries at the time a
liability is recorded, and records a valuation allowance for uncollectible receivables.
Asset Retirement Obligations — The System recognizes a liability for the fair value of a conditional
asset retirement obligation if the fair value of the liability can be reasonably estimated. Uncertainty
about the timing and/or method of settlement of a conditional asset retirement obligation is factored into
the measurement of the liability when sufficient information exists. The types of asset retirement
obligations that the System considers are those for which it has a legal obligation to perform an asset
retirement activity; however, the timing and/or method of settling the obligation are conditional on a
future event that may or may not be within its control. The fair value of a liability for the legal obligation
associated with an asset retirement is recorded in the period in which the obligation is incurred. When
the liability is initially recorded, the cost of the asset retirement is capitalized.
The System evaluated its properties for potential asset retirement obligations and identified obligations
primarily related to the removal of certain materials previously utilized in the construction process.
Asset retirement obligations are $2.6 million and $2.3 million, respectively, at December 31, 2013 and
2012. Such amounts are included in other noncurrent liabilities in the consolidated balance sheets. The
adjustments to the carrying amount of the asset retirement obligation in 2013 and 2012 were primarily
attributable to accretion expense, renovation costs incurred, and changes in the valuation of the
remediation costs. Such amounts were not significant.
Accounting for Pension Plans — The Medical Center maintains a noncontributory defined benefit
pension plan (the “Plan”) covering substantially all employees of the Medical Center. The Agency
maintains a tax-deferred annuity plan and a noncontributory defined contribution employee benefit plan.
The System recognizes the overfunded or underfunded status of the Plan in the consolidated balance
sheets. Changes in the funded status of the Plan are reported in the year in which the changes occur as a
change in unrestricted net assets presented below the excess of revenues over expenses in the
consolidated statements of operations and changes in net assets.
Performance Indicator — The consolidated statements of operations include excess of revenues over
expenses as the performance indicator. Changes in unrestricted net assets, which are excluded from the
performance indicator, include pension-related adjustments, contributions of long-lived assets,
permanent transfers of assets to and from affiliates for other than goods and services, contributions from
and distributions to noncontrolling interests in joint ventures, and net changes in unrealized gains and
losses on investments (except for declines in fair value that are determined by management to be other
than temporary which are reported as realized losses).
Classification of Net Assets — The System separately accounts for donor-restricted and unrestricted net
assets. Unrestricted net assets are not externally restricted for identified purposes by donors or grantors.
Unrestricted net assets include resources that the governing board may use for any designated purpose
and resources whose use is limited by agreement between the System and an outside party other than the
donor or grantor. The noncontrolling interest in joint ventures is also included in unrestricted net assets.
Temporarily restricted net assets are those whose use is temporarily limited to a specific time period or
purpose by the donor. Permanently restricted assets are to be held in perpetuity.
Donor-Restricted Gifts — Donor-restricted gifts are reported as temporarily restricted support if they are
received with donor stipulations that limit the use of the donated assets. When a donor restriction
expires, that is, when a stipulated time restriction ends or the purpose of the restriction is accomplished,
temporarily restricted net assets are reclassified as unrestricted net assets and reported in the

- 14 -
consolidated statements of operations and changes in net assets as net assets released from restrictions.
Donor-restricted contributions whose restrictions are met within the same year as received are reflected
as unrestricted contributions in the consolidated statements of operations. In the absence of donor
specification that income and gains on donated funds are restricted, such income and gains are reported
as income of unrestricted net assets.
Other Revenue — Other revenue consists primarily of grant income, physician billing revenue,
investment income, equity in earnings of joint ventures, rental income, and income from Meaningful
Use.
Meaningful Use — Under the Health Information Technology for Economic and Clinical Health Act,
acute care hospitals are eligible for incentive payments for achieving Meaningful Use of electronic
health records from both Medicare and Medicaid. The System reports amounts awarded to it under the
Meaningful Use of Electronic Medical Records program as other revenue when the System has met the
compliance requirements as set forth by Medicare and Medicaid. The System has recorded
approximately $3.2 million and $4.9 million as other revenue in the consolidated statements of
operations for the years ended December 31, 2013 and 2012, respectively.
2. CHARITY CARE
The Medical Center provides care to patients who meet certain eligibility criteria defined by New Jersey
Department of Health and Senior Services charity care program guidelines. The Medical Center receives
partial payment for the charity care they provide based upon the approved submission of patient claims
once they are qualified for the program (see Note 3).
The estimated cost, net of state subsidies (see Note 3), incurred by the System to provide services to
patients who are unable to pay was approximately $9.2 million and $4.1 million for the years ended
December 31, 2013 and 2012, respectively. The estimated cost of these charity care services was
determined using a ratio of cost to gross charges and applying that ratio to the gross charges associated
with providing care to charity patients for the period. Gross charges associated with providing care to
charity patients include only the related charges for those patients who are financially unable to pay and
qualify under the System’s charity care policy and that do not otherwise qualify for reimbursement from
a governmental program. Because the collection of amounts determined to qualify as charity care is not
pursued, it is not reported as revenue.
3. NET PATIENT SERVICE REVENUE
The Medical Center and the Agency provide care to patients under Medicare, Medicaid, and other third-
party contractual arrangements. Payment arrangements for the Medical Center include prospectively
determined rates per discharge, reimbursed costs, discounted charges, and per-diem payments. The
Medicare program pays for most services at predetermined rates. However, certain services and
specified expenses are reimbursed on a reasonable-cost basis. The Medicaid program reimburses the
Medical Center at predetermined rates for inpatient services. Medicaid outpatient services are
reimbursed on a reasonable cost basis. The Agency is reimbursed by Medicare on a prospective payment
system under which services are reimbursed based on predetermined rates.
Revenue Recognition — Patient accounts receivable are reduced by an allowance for doubtful
accounts. In evaluating the collectability of accounts receivable, the System analyzes its past history and
identifies trends for each of its major payer sources of revenue to estimate the appropriate allowance for
doubtful accounts and provision for bad debts. Management regularly reviews data about these major
payer sources of revenue in evaluating the sufficiency of the allowance for doubtful accounts. For
- 15 -
receivables associated with services provided to patients who have third-party coverage, the System
analyzes contractually due amounts and provides an allowance for doubtful accounts and a provision for
bad debts, if necessary. For receivables associated with self-pay patients, the System records a
significant provision for bad debts in the period of service on the basis of its past experience, which
indicates that many patients are unable or unwilling to pay the portion of their bill for which they are
financially responsible. The difference between the standard rates and the amounts actually collected
after all reasonable collection efforts have been exhausted is charged off against the allowance for
doubtful accounts.
The System’s allowance for doubtful accounts for self-pay patients decreased from 78.8% of self-pay
accounts receivable at December 31, 2012, to 74.1% of self-pay accounts receivable at December 31,
2013. In addition, the System’s self-pay write-offs net of recoveries increased $20.5 million from
$62.6 million for fiscal year 2012 to $83.1 million for fiscal year 2013. The increase in write-offs is the
result of negative trends experienced in the collection of amounts from self-pay patients in fiscal year
2013. The System has not changed its charity care or uninsured discount policies during fiscal years
2013 or 2012. The System does not maintain a material allowance for doubtful accounts from third-party
payers, nor did it have significant write-offs from third-party payers. The System recognizes patient
service revenue associated with services provided to patients who have third-party payer coverage on the
basis of contractual rates for the services rendered. For uninsured patients that do not qualify for charity
care, the System recognizes revenue on the basis of its standard rates for services provided (or on the
basis of discounted rates, if negotiated or provided by policy).
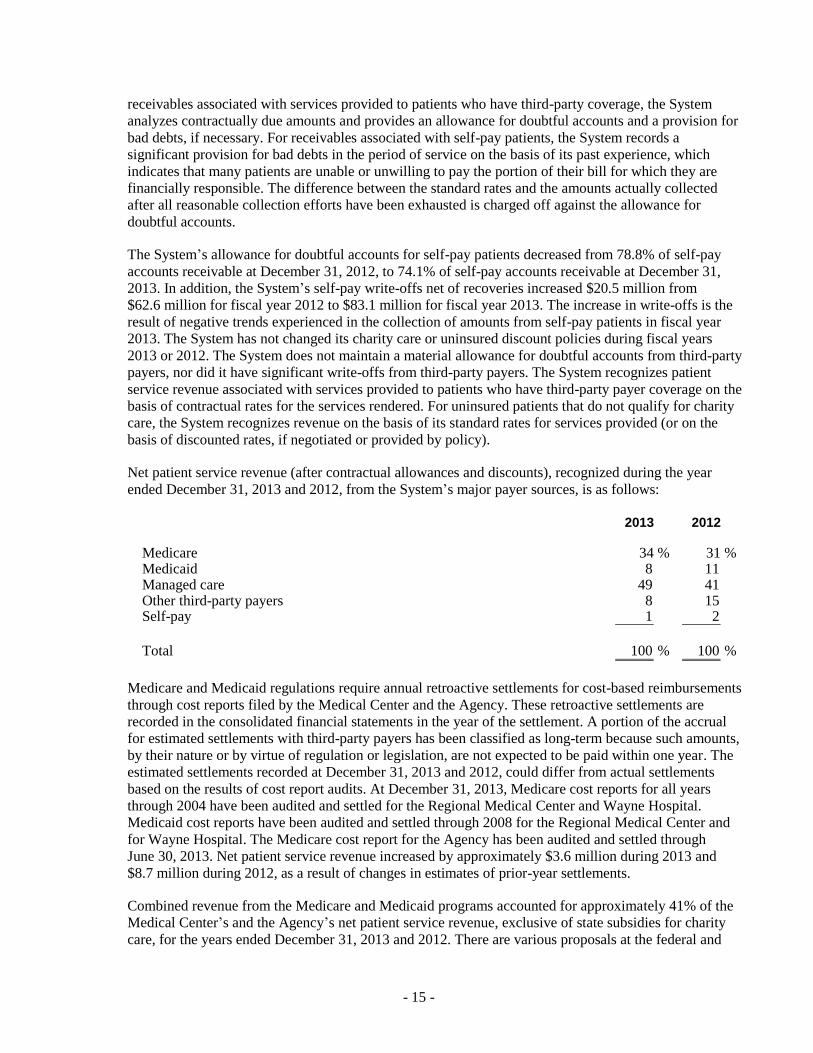
Net patient service revenue (after contractual allowances and discounts), recognized during the year
ended December 31, 2013 and 2012, from the System’s major payer sources, is as follows:
2013 2012
Medicare 34 % 31 %Medicaid 8 11 Managed care 49 41 Other third-party payers 8 15 Self-pay 1 2
Total 100 % 100 %
Medicare and Medicaid regulations require annual retroactive settlements for cost-based reimbursements
through cost reports filed by the Medical Center and the Agency. These retroactive settlements are
recorded in the consolidated financial statements in the year of the settlement. A portion of the accrual
for estimated settlements with third-party payers has been classified as long-term because such amounts,
by their nature or by virtue of regulation or legislation, are not expected to be paid within one year. The
estimated settlements recorded at December 31, 2013 and 2012, could differ from actual settlements
based on the results of cost report audits. At December 31, 2013, Medicare cost reports for all years
through 2004 have been audited and settled for the Regional Medical Center and Wayne Hospital.
Medicaid cost reports have been audited and settled through 2008 for the Regional Medical Center and
for Wayne Hospital. The Medicare cost report for the Agency has been audited and settled through
June 30, 2013. Net patient service revenue increased by approximately $3.6 million during 2013 and
$8.7 million during 2012, as a result of changes in estimates of prior-year settlements.
Combined revenue from the Medicare and Medicaid programs accounted for approximately 41% of the
Medical Center’s and the Agency’s net patient service revenue, exclusive of state subsidies for charity
care, for the years ended December 31, 2013 and 2012. There are various proposals at the federal and

- 16 -
state levels that could, among other things, significantly reduce reimbursement rates or modify
reimbursement methods. The ultimate outcome of these proposals and other market changes cannot
presently be determined. Future changes in the Medicare and Medicaid programs and any reduction of
funding could have an adverse impact on the Medical Center and the Agency.
Laws and regulations governing the Medicare and Medicaid programs are extremely complex and
subject to interpretation. The System is not aware of any pending or threatened investigations involving
allegations of potential wrongdoing, which could have a material adverse effect on the accompanying
consolidated financial statements. Action for noncompliance may include repayment of amounts
improperly reimbursed, fines, penalties, and exclusion from the Medicare and Medicaid programs.
The Medical Center has also entered into payment agreements with certain commercial insurance
carriers, health maintenance organizations, and PPOs. The basis for payment to the Medical Center
under these agreements includes prospectively determined rates per discharge, discounts from
established charges, and prospectively determined daily rates.
State Subsidy Funds — The New Jersey Health Care Subsidy Fund was established for various purposes
including the distribution of charity care payments to hospitals statewide. The amount of state subsidy
funds included in net patient service revenue for the years ended December 31, 2013 and 2012, are as
follows (in thousands):
2013 2012
Charity care payments 73,678$ 74,095$ Special subsidy 10,862 10,870
84,540$ 84,965$
The System expects to receive approximately $37 million in charity care payments and $5.4 million in
special subsidies from the state for the period from January 1, 2014 to June 30, 2014.

- 17 -
4. INVESTMENTS AND ASSETS WHOSE USE IS LIMITED
Investments and assets whose use is limited, stated at fair value as of December 31, 2013 and 2012,
consist of the following (in thousands):
2013 2012
Investments 80,451$ 81,462$
Assets whose use is limited: By bond indenture agreements 39,134 44,856 Under Board of Trustees designation 3,373 2,691 Assets held for captive insurance program 29,130 25,781 Restricted cash 825 Temporarily restricted assets 15,940 22,519 Permanently restricted assets 256 254
Total assets whose use is limited 87,833 96,926
Less assets whose use is limited that are available for current operations 20,397 18,299
Noncurrent assets whose use is limited 67,436 78,627
Total investments and assets whose use is limited 168,284 178,388
Beneficial interest in perpetual trusts 2,973 2,792
Other assets — investments held by trustee 1,736 1,667
Total 172,993$ 182,847$
The composition of investments and assets whose use is limited as of December 31, 2013 and 2012, is as
follows:
2013 2012
Cash and cash equivalents 46,558$ 36,481$ Repurchase investment contracts 14,354 U.S. government securities and agency obligations 27,112 42,653 Corporate and foreign debt securities 77,710 72,593 Asset-backed securities and mortgage-backed securities 1,773 4,078 Marketable equity securities 7,264 5,437 Municipal bonds 4,927 1,018 Mutual funds: Fixed income 1,477 Equity 1,463 1,774
Total 168,284$ 178,388$

- 18 -
Return on investments for the years ended December 31, 2013 and 2012, is as follows (in thousands):
2013 2012
Return on investments: Unrestricted net assets: Other revenue: Investment income 5,551$ 4,354$ Realized losses on sales of investments (729) (456) Change in net unrealized gains and losses on investments 6 1,920
Total 4,828 5,818
Temporarily restricted net assets: Investment income 287 81 Realized gains on sales of investments 60 63
Total 347 144
Permanently restricted net assets — change in net unrealized gains and losses on investments in perpetual trusts 181 189
Total return on investments 5,356$ 6,151$
Unrestricted investment income and realized gains and losses on sales of investments are included in
other revenues in the consolidated statements of operations. The change in net unrealized gains and
losses on investments is excluded from the performance indicator, and is included in the change in
unrestricted net assets in the consolidated statements of operations and changes in net assets, except for
declines in value that are deemed to be other than temporary.
5. FAIR-VALUE OF FINANCIAL INSTRUMENTS
Fair Value Measurements — The System classifies its investments into Level 1, which refers to
securities valued using quoted prices from active markets for identical assets; Level 2, which refers to
securities not traded on an active market, but for which observable market inputs are readily available;
and Level 3, which refers to securities valued based on significant unobservable inputs. Assets and
liabilities are classified in their entirety based on the lowest level of input that is significant to the fair
value measurement.
Asset Valuation Techniques — Valuation techniques maximize the use of relevant observable inputs
and minimize the use of unobservable inputs. The following is a description of the valuation
methodologies used for assets measured at fair value. There have been no changes in the methodologies
used at December 31, 2013 and 2012.
The following is a description of the valuation methodologies used for assets and liabilities measured at
fair value:
Cash and Cash Equivalents — The carrying value of cash and cash equivalents approximates fair value
as maturities are less than three months and/or include money market funds that are based on quoted
prices and actively traded.

- 19 -
Corporate and Foreign Debt Securities — The estimated fair values of corporate and foreign debt
securities are based on quoted market prices and/or other market data for the same or comparable
instruments and transactions in establishing the prices. Fair values of debt securities that do not trade on
a regular basis in active markets are classified as Level 2.
U.S. Government Securities and Agency Obligations — The estimated fair value of these debt securities
is based on quoted market prices and/or other data for the same or comparable instruments and
transactions. U.S. government securities are classified as Level 1. The fair value of the U.S. government
agency obligations is determined using techniques similar to the income approach and are reported as
Level 2.
Municipal Bonds — The fair value of municipal bonds is valued under a discounted cash flow approach
that maximizes observable inputs, such as current yields of similar instruments, but includes adjustments
for certain risks that may not be observable, such as credit and liquidity risks. Fair values of such bonds
are classified as Level 2.
Asset-Backed Securities and Mortgage-Backed Securities — The fair values of asset-backed securities
and mortgage-backed securities classified as Level 2 were primarily determined using techniques
consistent with the income approach, such as a discounted cash flow model. Significant observable
inputs include prepayment speeds and spreads, benchmark yield curves, volatility measures, actual pool
and collateral information, and quotes.
Marketable Equity Securities — Fair value estimates for publicly traded equity securities are based on
quoted market prices and/or other market data for the same or comparable instruments and transactions
in establishing the prices.
Mutual Funds — Fair value estimates for publicly traded mutual funds are based on quoted market
prices and/or other market data for the same or comparable instruments and transactions in establishing
the prices. Such mutual funds are actively traded and are classified as Level 1. The fair value of private
placement funds reported as Level 2 has been determined using the net asset value (NAV) of the funds
as provided by the respective fund managers. The NAV is used as a practical expedient to estimate fair
value. The underlying investments of these funds consist of securities with readily determinable market
values.
Repurchase Investment Contracts — Fair value estimates for the repurchase investment contracts are
based on quoted market prices and/or other market data available for comparable investments underlying
the agreements. The repurchase investment contracts are classified as Level 2.
Limited Liability Partnership — Investments in limited partnerships do not have readily determinable
market values. The estimated fair value of the limited partnerships, for which no quoted market prices is
readily available, is determined based upon information provided by the fund managers. Such
information is generally based on NAV of the fund, which is used as a practical expedient to estimate
fair value. Investments in limited liability partnerships are classified as Level 3.
Beneficial Interest in Perpetual Trusts — The estimated fair value of the beneficial interest in perpetual
trusts is determined based upon information provided by the trustees. Such information is based on the
pro rata interest in the net assets of the trusts and is classified as Level 3.
Investment Held by Trustee — The estimated fair value of the investment held by trustee is determined
based upon information provided by the trustee and is classified as Level 2 based upon quotable market
prices for similar investments.

- 20 -
The information as of December 31, 2013 and 2012, about the System’s financial assets that are
measured at fair value on a recurring basis is as follows (in thousands):
Quoted
Prices Other
in Active Observable Unobservable
Markets Inputs Inputs
(Level 1) (Level 2) (Level 3) Fair Value
Investments, assets whose use is limited and other assets: Cash and cash equivalents 46,558$ - $ - $ 46,558$ Marketable equity securities 7,264 7,264 U.S. government securities and agency obligations 10,199 16,913 27,112 Asset-backed and mortgaged-backed securities 1,773 1,773 Corporate and foreign debt securities 77,710 77,710 Municipal bonds 4,927 4,927 Mutual funds Fixed income 1,477 1,477 Equity 1,463 1,463 Investments held by trustee 1,736 1,736 Beneficial interest in perpetual trusts 2,973 2,973
Total 65,484$ 104,536$ 2,973$ 172,993$
Assets held in pension plan: Cash and cash equivalents 5,752$ - $ - $ 5,752$ Marketable equity securities 106,970 106,970 Mutual funds 53,753 53,753 U.S. government securities 16,970 8,355 25,325 Corporate bonds 7,907 7,907 Foreign obligations 1,060 1,060 Limited liability partnership 4,546 4,546
Total 183,445$ 17,322$ 4,546$ 205,313$
2013

- 21 -
Quoted
Prices Other
in Active Observable Unobservable
Markets Inputs Inputs
(Level 1) (Level 2) (Level 3) Fair Value
Investments, assets whose use is limited and other assets: Cash and cash equivalents 36,481$ - $ - $ 36,481$ Marketable equity securities 5,437 5,437 U.S. government securities and agency obligations 29,632 13,021 42,653 Asset-backed and mortgaged-backed securities 4,078 4,078 Repurchase investment contracts 14,354 14,354 Corporate and foreign debt securities 72,593 72,593 Municipal bonds 1,018 1,018 Fixed-income mutual funds 1,774 1,774 Investments held by trustee 1,667 1,667 Beneficial interest in perpetual trusts 2,792 2,792
Total 71,550$ 108,505$ 2,792$ 182,847$
Assets held in pension plan: Cash and cash equivalents 7,389$ - $ - $ 7,389$ Marketable equity securities 83,701 83,701 Mutual funds 41,067 41,067 U.S. government securities 26,928 26,928 Corporate bonds 6,864 6,864 Foreign obligations 994 994 Limited liability partnership 8,058 8,058
Total 159,085$ 7,858$ 8,058$ 175,001$
2012
Included within the assets above are investments in certain mutual funds that report fair value using a
calculated NAV or its equivalent. Attributes relating to the nature and risk of such investments as of
December 31, 2013 and 2012, are as follows (in thousands):
Other Redemption
Unfunded Redemption Redemption Notice
Fair Value Commitment Frequency Restrictions Period
Investments — mutual fund:
Fixed income
Money market fund (a) 6$ None Immediate None Daily
Assets held in pension plan —
limited liability partnership — Discretion Discretion
Endowment TEI Fund (b) 4,546$ None Illiquid of Fund of Fund
Fair Value Estimated Using NAV per Share 2013

- 22 -
Other Redemption
Unfunded Redemption Redemption Notice
Fair Value Commitment Frequency Restrictions Period
Investments — mutual fund:
Fixed income
Money market fund (a) 6$ None Immediate None Daily
Assets held in pension plan —
limited liability partnership — Discretion Discretion
Endowment TEI Fund (b) 8,058$ None Illiquid of Fund of Fund
Fair Value Estimated Using NAV per Share 2012
(a) This separate account fund invests in a fixed-income mutual fund and seeks the realization of
current income to the extent consistent with the maintenance of liquidity, investment quality, and
stability of capital. The underlying fund invests only in money market instruments and other short-
term securities. Neither the Federal Deposit Insurance Corporation nor any other U.S. government
agency insures or guarantees the separate account’s investments in shares of the money market
fund. Although the fund seeks current income and preservation of capital within its guidelines,
low market interest rates can result in risk to both of these objectives, particularly after fees and
expenses of the separate account, the investment company, its adviser, and distributor are taken
into account.
(b) The Endowment TEI Fund seeks to preserve capital and to generate consistent long-term
appreciation and returns. To achieve its objective, the fund provides its partners with access to
asset classes, investment managers, and overall asset allocation services typically available on a
collective basis to larger institutions. The fund generally pursues its investment objective by
allocating assets to investment funds, including private partnerships, limited liability companies,
registered investment companies, and other investment vehicles, which are managed by a group of
investment managers identified by the adviser to have investments that are allocated broadly
across markets, asset classes, and risk profile.
Transfers between Levels — The availability of observable market data is monitored to assess the
appropriate classification of financial instruments within the fair value hierarchy. Changes in economic
conditions or model-based valuation techniques may require the transfer of financial instruments from
one fair value level to another. In such instances, the transfer is reported at the beginning of the reporting
period. There were no other transfers between levels of the System’s or the Plan’s investments for the
years ended December 31, 2013 and 2012.

- 23 -
The change in fair value measurements for the beneficial interest in perpetual trusts and the investment
in limited partnerships included in assets held in the pension plan with unobservable inputs at
December 31, 2013 and 2012, are presented as follows (in thousands):
2013 2012
Beneficial Interest in Perpetual Trusts
Balance — January 1 2,792$ 2,603$ Net unrealized gains 181 189
Balance — December 31 2,973$ 2,792$
2013 2012
Assets Held in Pension Plan
Balance — January 1 8,058$ 4,975$ Purchases 3,146 Sales (3,666) Net unrealized gains 154 (63)
Balance — December 31 4,546$ 8,058$
The following methods and assumptions were used by the System in estimating the fair value of the
System’s financial instruments that are not measured at fair value on a recurring basis for disclosures in
the consolidated financial statements:
Unconditional Promises to Give — The carrying amount reported in the consolidated balance sheets for
contributions and pledges receivable is at its estimated fair value. Pledges received during 2013 were
approximately $1.3 million.
Long-Term Debt — The fair value of the System’s outstanding revenue bonds is based on quoted market
prices. The fair value of the System’s other long-term debt and capital lease obligations is estimated to
approximate the carrying value and is classified as Level 2 (see Note 10). The carrying amounts and fair
values of the System’s long-term debt as of December 31, 2013 and 2012, are as follows (in thousands):
2013 2012
Carrying amount 260,866$ 262,207$
Estimated fair value 263,663$ 307,219$

- 24 -
6. UNCONDITIONAL PROMISES TO GIVE
The unconditional promises to give as of December 31, 2013 and 2012, included in the consolidated
balance sheets are as follows (in thousands):
2013 2012
Amounts expected to be collected in: Less than one year 3,002$ 3,033$ One to five years 4,934 5,662 More than five years 2,068 2,369
10,004 11,064
Discount to present value of future cash flows (1,045) (1,042) Allowance for uncollectibles (1,005) (1,005)
Total 7,954 9,017
Less unconditional promises to give — current portion 3,002 3,033
Unconditional promises to give — noncurrent portion 4,952$ 5,984$
7. PROPERTY AND EQUIPMENT
Property and equipment as of December 31, 2013 and 2012, consist of the following (in thousands):
2013 2012
Land 11,563$ 11,271$ Land improvements 4,162 3,988 Buildings and improvements 443,902 429,632 Fixed and major movable equipment 218,396 202,446
Total property and equipment 678,023 647,337
Less accumulated depreciation and amortization (357,195) (323,067)
320,828 324,270
Construction in progress 19,374 19,737
Property and equipment — net 340,202$ 344,007$
At December 31, 2013 and 2012, accounts payable and accrued expenses include approximately
$.1 million and $3.2 million, respectively, related to construction costs.
Substantially, all property of the Medical Center serves as collateral under the debt agreement (see
Note 10).

- 25 -
Total equipment under capital leases included in the table above are approximately $7.5 million as of
December 31, 2013 and 2012. Accumulated amortization relating to the equipment under capital leases
was approximately $6.8 million and $6.2 million at December 31, 2013 and 2012, respectively, and is
included in accumulated depreciation and amortization.
8. GOODWILL AND OTHER INTANGIBLE ASSET
In 2010, the System recorded goodwill and an intangible asset in connection with the acquisition of two
radiology practices. At December 31, 2013 and 2012, goodwill was approximately $2.1 million. The
intangible asset in the amount of $2.9 million, which is a noncompete agreement, is estimated to have a
useful life of five years with amortization computed using the straight-line method for financial
reporting purposes. Accumulated amortization related to the intangible asset is $2,078,000 and
$1,498,000 at December 31, 2013 and 2012, respectively. Amortization expense of $580,000 was
recorded each for the years ended December 31, 2013 and 2012. Goodwill and the intangible asset are
included in other assets in the consolidated balance sheets.
Based on the current estimated useful lives, the System expects to record amortization expense for each
of the years ending December 31, 2014 through 2015, as follows:
Years Ending
December 31
2014 580,000$ 2015 241,700
9. EQUITY INVESTMENTS
Equity investments in joint ventures as of December 31, 2013 and 2012, consist of the following (in
thousands):
Ownership Total Total Total Net Equity Share of
Name of Joint Venture Percentage Assets Liabilities Revenue Income Investment Earnings
Simeon Dialysis, LLC 35 % 67,913$ 1,310$ 29,073$ 6,267$ 23,311$ 2,193$ Wayne Valley Imaging, LLC 50 1,303 1,056 2,111 767 162 275
69,216$ 2,366$ 31,184$ 7,034$ 23,473$ 2,468$
Ownership Total Total Total Net Equity Share of
Name of Joint Venture Percentage Assets Liabilities Revenue Income Investment Earnings
Simeon Dialysis, LLC 35 % 75,177$ 692$ 30,433$ 4,683$ 26,165$ 1,639$
St. Joseph’s Dialysis, LLC 50 10 1 38 (110) 369 (55) Wayne Valley Imaging, LLC 50 1,377 1,240 2,041 556 103 278
76,564$ 1,933$ 32,512$ 5,129$ 26,637$ 1,862$
2013
2012
- 26 -
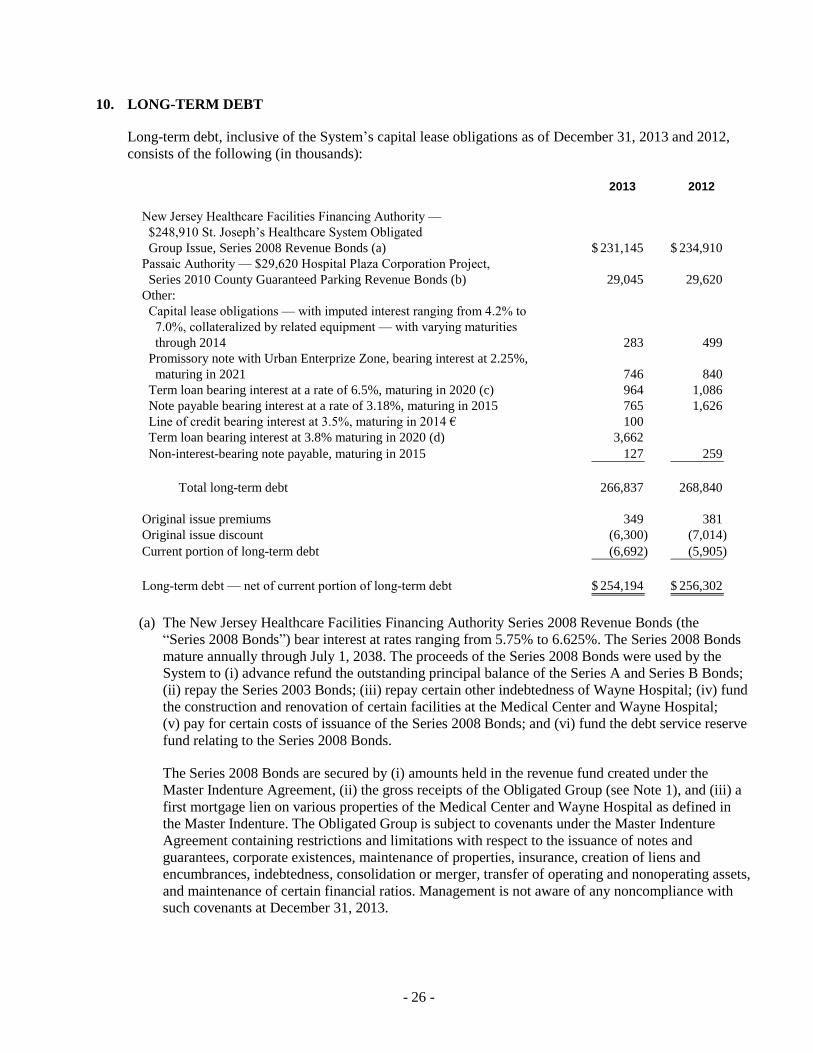
10. LONG-TERM DEBT
Long-term debt, inclusive of the System’s capital lease obligations as of December 31, 2013 and 2012,
consists of the following (in thousands):
2013 2012
New Jersey Healthcare Facilities Financing Authority —
$248,910 St. Joseph’s Healthcare System Obligated
Group Issue, Series 2008 Revenue Bonds (a) 231,145$ 234,910$
Passaic Authority — $29,620 Hospital Plaza Corporation Project,
Series 2010 County Guaranteed Parking Revenue Bonds (b) 29,045 29,620
Other:
Capital lease obligations — with imputed interest ranging from 4.2% to
7.0%, collateralized by related equipment — with varying maturities
through 2014 283 499
Promissory note with Urban Enterprize Zone, bearing interest at 2.25%,
maturing in 2021 746 840
Term loan bearing interest at a rate of 6.5%, maturing in 2020 (c) 964 1,086
Note payable bearing interest at a rate of 3.18%, maturing in 2015 765 1,626
Line of credit bearing interest at 3.5%, maturing in 2014 € 100
Term loan bearing interest at 3.8% maturing in 2020 (d) 3,662
Non-interest-bearing note payable, maturing in 2015 127 259
Total long-term debt 266,837 268,840
Original issue premiums 349 381
Original issue discount (6,300) (7,014)
Current portion of long-term debt (6,692) (5,905)
Long-term debt — net of current portion of long-term debt 254,194$ 256,302$
(a) The New Jersey Healthcare Facilities Financing Authority Series 2008 Revenue Bonds (the
“Series 2008 Bonds”) bear interest at rates ranging from 5.75% to 6.625%. The Series 2008 Bonds
mature annually through July 1, 2038. The proceeds of the Series 2008 Bonds were used by the
System to (i) advance refund the outstanding principal balance of the Series A and Series B Bonds;
(ii) repay the Series 2003 Bonds; (iii) repay certain other indebtedness of Wayne Hospital; (iv) fund
the construction and renovation of certain facilities at the Medical Center and Wayne Hospital;
(v) pay for certain costs of issuance of the Series 2008 Bonds; and (vi) fund the debt service reserve
fund relating to the Series 2008 Bonds.
The Series 2008 Bonds are secured by (i) amounts held in the revenue fund created under the
Master Indenture Agreement, (ii) the gross receipts of the Obligated Group (see Note 1), and (iii) a
first mortgage lien on various properties of the Medical Center and Wayne Hospital as defined in
the Master Indenture. The Obligated Group is subject to covenants under the Master Indenture
Agreement containing restrictions and limitations with respect to the issuance of notes and
guarantees, corporate existences, maintenance of properties, insurance, creation of liens and
encumbrances, indebtedness, consolidation or merger, transfer of operating and nonoperating assets,
and maintenance of certain financial ratios. Management is not aware of any noncompliance with
such covenants at December 31, 2013.

- 27 -
(b) The Passaic Authority Series 2010 County Guaranteed Parking Revenue Bonds (the
“Series 2010 Bonds”) bear interest at rates ranging from 2% to 5%. The Series 2010 Bonds mature
between 2014 and 2042. The proceeds of the Series 2010 Bonds were used by 200 Hospital Plaza to
(i) finance a portion of project costs associated with the design and construction of a mixed-use
parking/retail seven-level structure consisting of approximately 1,120 parking spaces and
approximately 20,400 square feet of retail space located on the deck site adjacent to the Medical
Center; (ii) pay capitalized interest on the Series 2010 Bonds from the date of issuance through
May 1, 2012; (iii) fund the debt service reserve fund in an amount equal to the Series 2010 Bonds
Reserve Requirement; and (iv) pay certain costs of issuance relating to the Series 2010 Bonds.
200 Hospital Plaza is subject to covenants under the Master Indenture Agreement containing
restrictions and limitations with respect to the issuance of guarantees, corporate existences, creation
of liens and encumbrances, indebtedness, consolidation, or merger and maintenance of certain
financial ratios. Management is not aware of any noncompliance with such covenants at
December 31, 2013.
(c) Blue Moon has a term loan with a financial institution bearing interest at a fixed rate of 6.5% and
maturing in March 2020. The proceeds of the loan were used to provide leasehold improvements for
a new medical condominium located in Wayne, New Jersey. Blue Moon is subject to a minimum
debt service coverage ratio requirement, which is tested annually. Management is not aware of any
noncompliance with this ratio as of December 31, 2013.
(d) Ambulatory Surgical has a term loan with a financial institution bearing interest at a fixed rate of
3.825% and maturing in December 2020. The proceeds of the loan will be used to fund construction
of a pediatric surgery center and the acquisition of medical equipment. There is also a minimum
debt service coverage ratio requirement which is tested annually. Management is not aware of any
noncompliance with this ratio as of December 31, 2013.
(e) Ambulatory Surgical has a line of credit of $500,000, of which $100,000 is outstanding at
December 31, 2013.

- 28 -
Required principal payments on long-term debt and future minimum payments on the capital lease
obligations for the next five years and thereafter as of December 31, 2013, are as follows (in thousands):
Obligations
Under
Years Ending Long-Term Capital
December 31 Debt Lease Total
2014 6,461$ 231$ 6,692$ 2015 5,521 27 5,548 2016 5,797 19 5,816 2017 6,099 9 6,108 2018 6,422 6,422 Thereafter 236,253 236,253
266,553 286 266,839
Less amount representing interest on obligations under capital leases 2 2
266,553$ 284$ 266,837$
At December 31, 2013, the System has unused letters of credit of $1.8 million, expiring in January 2015;
$1.6 million, expiring in February 2015; $1.0 million, expiring in April 2015; and $1.5 million, expiring
in August 2014.
In March 2014, the Medical Center entered into a line of credit agreement for $23.5 million with
Morgan Stanley Bank, expiring in February 2015. The line of credit may be used for the completion of
capital facility renovation projects, if needed. If the line of credit is drawn upon the interest rate will be
equal to London InterBank Offered Rate, plus 1%. The System is also subject to certain covenants under
the line of credit agreement.
A summary of interest cost on long-term debt and investment income on borrowed funds held by the
trustee under the terms of the master indenture agreement pertaining to the Series 2008 and 2010 Bond
issuances during the years ended December 31, 2013 and 2012, is as follows (in thousands):
2013 2012
Interest cost: Capitalized 264$ 671$ Charged to operations 16,317 16,186
Total interest cost 16,581$ 16,857$
Investment income: Capitalized 5$ 37$ Credited to other revenue 268 1,609
Total investment income 273$ 1,646$

- 29 -
11. PENSION PLANS
The Medical Center maintains a noncontributory defined benefit pension plan (the “Plan”) covering
substantially all of the employees of the Medical Center. The Plan provides benefits based on the
participant’s years of service and compensation. The Plan is operated as a church plan under the Code.
Under church plan status, the Plan is not subject to the minimum funding or other requirements of the
Employee Retirement Income Security Act of 1974. In addition, benefits under the Plan are not covered
by the Pension Benefit Guaranty Corporation. The Medical Center determines the amount of the annual
contribution to the Plan based on the funded status of the Plan and its financial ability to make
contributions. The Medical Center contributed approximately $12.6 million to the Plan in 2013 and
expects to contribute approximately $12.6 million to the Plan in 2014.
The funded status of the Plan as of December 31, 2013 and 2012, is set forth as follows (in thousands):
2013 2012
Change in benefit obligation: Projected benefit obligation — beginning of year 343,445$ 284,437$ Service cost 15,184 12,935 Interest cost 14,396 14,355 Actuarial (gain) loss (52,991) 40,366 Benefit payments (9,410) (8,648)
Projected benefit obligation — end of year 310,624$ 343,445$
Accumulated benefit obligation 289,307$ 317,137$
Change in Plan assets: Fair value of Plan assets — beginning of year 175,001$ 154,728$ Actual return on Plan assets 27,437 16,366 Employer contributions 12,600 12,600 Benefit payments (9,501) (7,591) Administrative expenses (224) (1,102)
Fair value of Plan assets — end of year 205,313$ 175,001$
Funded status/accrued benefit liability 105,311$ 168,444$
At December 31, 2013 and 2012, unrestricted net assets include unrecognized losses of $52.5 million
and $129.8 million, respectively, and unrecognized prior service costs of $695,000 and $783,000,
respectively, for the Plan. Of these amounts, $1.9 million of the unrecognized losses and $87,000 of
unrecognized prior service cost are expected to be recognized in net periodic benefit costs in 2014.
Weighted-average assumptions used in determining the benefit obligation as of December 31, 2013 and
2012, were as follows:
2013 2012
Discount rate 5.34 % 4.22 % Rate of compensation increase 3.00 3.00

- 30 -
Net periodic pension costs for the years ended December 31, 2013 and 2012, are as follows (in
thousands):
2013 2012
Service cost 15,184$ 12,934$ Interest cost 14,396 14,355 Expected return on Plan assets (13,600) (12,469) Amortization of prior service cost 87 149 Amortization of net loss 9,117 6,957
Net periodic pension costs 25,184$ 21,926$
Weighted-average assumptions used in determining the net periodic pension costs for the years ended
December 31, 2013 and 2012, were as follows:
2013 2012
Discount rate 4.22 % 5.08 % Expected long-term return on Plan assets 7.75 8.00 Rate of compensation increase 3.00 3.50
The discount rate was determined using the hypothetical portfolio method at December 31, 2013 and
2012.
To develop the expected long-term rate of return on Plan assets, the System considered the historical
returns and the future expectations for returns for each asset class, as well as the target asset allocation of
the pension portfolio. This approach resulted in the selection of the 7.75% long-term rate of return on
Plan assets’ assumption.
The date used to determine the Plan’s measurements is December 31.
The Plan’s weighted-average asset allocation as of December 31, 2013 and 2012, by asset category, is as
follows:
Asset Category 2013 2012
Equity securities 63 % 58 % Debt securities 33 37 Alternative investments 4 5
100 % 100 %

- 31 -
The Plan’s investment policy includes the following asset allocation guidelines:
Asset Category Target Range
Domestic equity: Large to midcapitalization growth 22.0 % 18%–28% Large to midcapitalization value 22.0 18–28 Small capitalization 4.0 0–8International equity: Core 7.5 2–14 Emerging 2.0 0–6Fixed income 37.5 30–50Alternative investments 5.0 0–10
The asset allocation policy was developed in consideration of the long-term financial objectives of the
Plan, which include ensuring that there is an adequate level of assets to support benefit obligations and
maintaining liquidity sufficient to cover current benefit obligations.
In addition to the broad asset allocation described above, the following policies apply to individual asset
classes:
Fixed-income investments are oriented toward risk-adverse, investment-grade securities with an
average quality of “A” or higher. Up to 10% of the portfolio may be invested in bonds rated below
investment grade. With the exception of U.S. government securities, fixed-income investments are
diversified among individual securities and sectors.
Equity investments are diversified among industries and economic sectors. International equity
holdings are also diversified by country. Limitations are placed on the overall allocation to any
individual security.
Pension benefit payments, which reflect expected future service and salary, as appropriate, are expected
to be paid as follows (in thousands):
Years Ending
December 31
2014 10,256$ 2015 11,442 2016 12,681 2017 13,978 2018 15,243 2019–2023 98,098
In addition to the Plan, the Medical Center maintains a deferred employee benefit plan. At December 31,
2013 and 2012, the accrued pension liability for this plan was approximately $2,036,974 and
$1,363,000, respectively. The corresponding assets to the deferred employee benefit plan are included in
the noncurrent portion of assets whose use is limited at December 31, 2013 and 2012.
Defined Contribution Plan — VHS maintains a tax-deferred annuity plan and a noncontributory
defined contribution employee benefit plan. Under the terms of the tax-deferred annuity plan, VHS
contributes to the accounts of each eligible employee a percentage of salaries ($0.25 of each dollar up to
the lesser of $13,000 or 4% of the participant’s salary). Under the terms of the noncontributory defined

- 32 -
contribution employee benefit plan, VHS contributes 2% of each participant’s gross salary. For the years
ended December 31, 2013 and 2012, pension expense related to the two plans was approximately
$128,300 and $129,000, respectively.
12. PROFESSIONAL LIABILITY INSURANCE
Effective February 1, 2007, the Insurance Captive began providing the Regional Medical Center with
“claims-made” professional and general liability insurance. The Insurance Captive policy provides
coverage of $1 million per occurrence and $3 million annual aggregate. The Insurance Captive has a
self-insurance program for a first excess layer above the primary layer. The first excess layer is on a
claims-made basis with retentions of $4 million for individual claims and $17 million in the aggregate.
The Insurance Captive maintains a self-insurance reserve trust as the funding vehicle for the self-
insurance program (see Note 4). The Insurance Captive has a second excess layer of insurance of
$10 million annual aggregate, a third excess layer of insurance of $20 million annual aggregate, and a
fourth layer of $15 million annual aggregate each maintained with separate commercial carriers.
The Insurance Captive is registered under the Bermuda Insurance Act of 1978 and the Related
Regulations (the “Insurance Act”) and is obliged to comply with various provisions of the Insurance Act
regarding solvency and liquidity. The minimum statutory capital and surplus, at December 31, 2013 and
2012, was $2.1 million and $1.9 million, respectively, and the actual statutory capital and surplus was
$7.8 million and $6.4 million, respectively. In addition, a minimum liquidity ratio must be maintained
whereby relevant assets, as defined by the Insurance Act, must exceed 75% of relevant liabilities. As of
December 31, 2013 and 2012, the liquidity ratio was met.
Prior to the inception of the Insurance Captive, the Regional Medical Center maintained its primary
professional liability insurance coverage of $1 million for individual claims and $3 million in the
aggregate on a claims-made basis with a commercial carrier. The first excess layer was on a claims-
made basis with retentions of $4 million for individual claims and $7 million in the aggregate. A second
excess layer of coverage was maintained with a commercial carrier.
Effective March 1, 2009, the Insurance Captive began providing Wayne Hospital with “claims-made”
professional and general liability insurance, and Wayne Hospital began participating in the self-
insurance program for a first excess layer above the primary layer. Prior to March 1, 2009, Wayne
Hospital maintained primary professional liability insurance coverage on a claims-made basis with a
commercial carrier.
VHS maintains primary professional liability insurance coverage on an occurrence basis with a
commercial carrier. The policy is to accrue an estimate each year of the ultimate cost of malpractice
claims incurred, but not reported, under the claims-made insurance policy.
The estimated undiscounted professional liabilities for asserted claims and for incidents that have been
incurred, but not reported, included in the consolidated balance sheets as of December 31, 2013 and
2012, are as follows (in thousands):
2013 2012
Estimated professional liability claims payable included in accrued expenses 6,207$ 3,675$ Noncurrent estimated professional liability claims payable 20,467 21,523
Total estimated professional liability claims payable 26,674$ 25,198$

- 33 -
The activity in the liability for claims reported and claims incurred, but not reported, for the years ended
December 31, 2013 and 2012, is summarized as follows (in thousands):
2013 2012
Balance — beginning of year 25,198$ 23,382$
Incurred related to: Current year 5,444 5,654 Prior years (777) (1,783)
Total incurred 4,667 3,871
Paid related to: Current year 18 96 Prior years 3,173 1,959
Total paid 3,191 2,055
Balance — end of year 26,674$ 25,198$
The System’s estimates for professional liability for asserted claims and for incidents that have been
incurred, but not reported, are based upon complex actuarial calculations, which utilize factors, such as
historical claim experience for the System and related industry factors, trending models, estimates for
the payment patterns of future claims, and present value discounting factors. As a result, there is at least
a reasonable possibility that recorded estimates will change by a material amount in the near term.
Revisions to estimated amounts resulting from actual experience differing from project expectations are
recorded in the period the information becomes known.
13. CONCENTRATIONS OF CREDIT RISK
The System grants credit without collateral to its patients, most of who are insured under third-party
payer agreements. Major concentrations of net accounts receivable from patients and third-party payers
as of December 31, 2013 and 2012, are as follows:
2013 2012
Medicare 27 % 27 % Medicaid 11 14 Horizon Blue Cross Blue Shield of New Jersey 9 11 AmeriChoice 7 10 Amerigroup 8 5 Aetna 6 6 Health Maintenance Organizations and other third-party payers 24 19 Self-pay patients 8 8
100 % 100 %
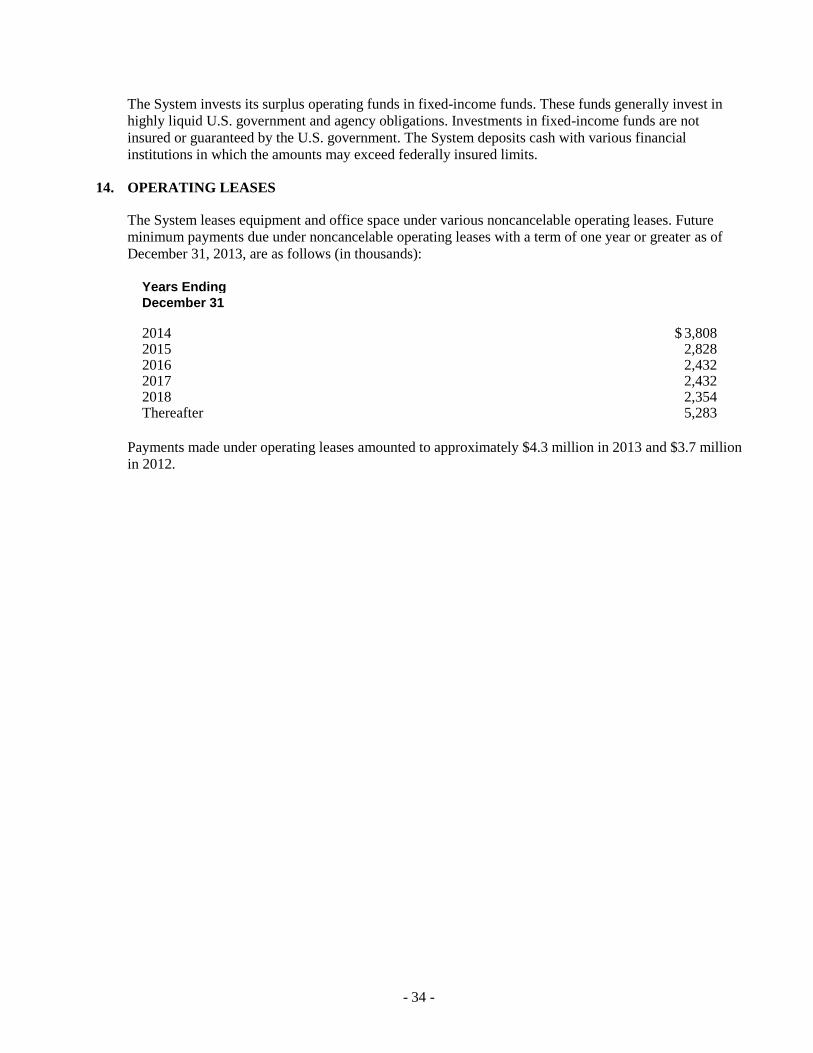
- 34 -
The System invests its surplus operating funds in fixed-income funds. These funds generally invest in
highly liquid U.S. government and agency obligations. Investments in fixed-income funds are not
insured or guaranteed by the U.S. government. The System deposits cash with various financial
institutions in which the amounts may exceed federally insured limits.
14. OPERATING LEASES
The System leases equipment and office space under various noncancelable operating leases. Future
minimum payments due under noncancelable operating leases with a term of one year or greater as of
December 31, 2013, are as follows (in thousands):
Years Ending
December 31
2014 3,808$ 2015 2,828 2016 2,432 2017 2,432 2018 2,354 Thereafter 5,283
Payments made under operating leases amounted to approximately $4.3 million in 2013 and $3.7 million
in 2012.

- 35 -
15. NET ASSETS
Unrestricted Net Assets — Changes in consolidated unrestricted net assets attributable to the System
and the noncontrolling interest in joint ventures for the years ended December 31, 2013 and 2012, are as
follows (in thousands):
St. Joseph’s Noncontrolling
Healthcare Interests
System, Inc. in Joint
and Affiliates Ventures Total
Unrestricted net assets — January 1, 2012 128,960$ 3,626$ 132,586$
Excess of revenues over expenses 8,718 3,579 12,297
Other changes in unrestricted net assets:
Change in net unrealized gains and losses on investments 1,920 1,920
Pension-related adjustments (29,408) (29,408)
Distributions to noncontrolling interests in joint ventures (4,176) (4,176)
Contributions from noncontrolling interests in joint ventures 91 91
Net assets released from restrictions — capital acquisitions 1,416 1,416
Decrease in unrestricted net assets (17,354) (506) (17,860)
Unrestricted net assets — December 31, 2012 111,606 3,120 114,726
Excess of revenues over expenses 12,004 1,805 13,809
Other changes in unrestricted net assets:
Change in net unrealized gains and losses on investments 6 6
Pension-related adjustments 75,717 75,717
Distributions to noncontrolling interests in joint ventures (2,893) (2,893)
Net assets released from restrictions — capital acquisitions 2,008 2,008
Increase (decrease) in unrestricted net assets 89,735 (1,088) 88,647
Unrestricted net assets — December 31, 2013 201,341$ 2,032$ 203,373$
Temporarily Restricted Net Assets — Temporarily restricted net assets are available for future periods
or for specific purposes. Net assets during the year were released from donor restrictions by incurring
expenditures satisfying the restricted purpose.
Temporarily restricted net assets as of December 31, 2013 and 2012, are available for the following
purposes (in thousands):
2013 2012
Capital acquisitions and improvements 11,814$ 12,616$ Scholarship fund 585 123 Research 904 752 Other healthcare programs 9,014 9,033
22,317$ 22,524$
Permanently Restricted Net Assets — At December 31, 2013 and 2012, permanently restricted net
assets in the amount of $3.3 million and $3.1 million, respectively, consist of endowment funds to be
held in perpetuity, and the beneficial interest in perpetual trusts. The assets in the perpetual trusts are

- 36 -
held and managed by an independent trustee. The income earned on the beneficial interest in the
perpetual trust is unrestricted. The income from the endowment funds is expendable to support health
care services.
The Board of Trustees (the “Board”) classifies donor-restricted assets based upon the explicit directions
of the donor and the provisions of the New Jersey Uniform Prudent Management of Institutional Funds
Act (UPMIFA) adopted by the State of New Jersey in June 2009. The Board has determined that, absent
donor stipulations to the contrary, the provisions of New Jersey State law do not impose either a
permanent or temporary restriction on the income or capital appreciation derived from the original gift.
From time to time, the fair value of assets associated with individual donor-restricted endowment funds
may fall below the level that the donor requires the System to retain as a fund of perpetual duration. In
accordance with GAAP, deficiencies of this nature are to be reported in unrestricted net assets as of
year-end. There are no such deficiencies at December 31, 2013 and 2012.
16. FUNCTIONAL EXPENSES
The System’s functional expenses for the years ended December 31, 2013 and 2012, are as follows (in
thousands):
2013 2012
Health care services 623,886$ 609,947$ General and administrative 76,087 78,416
Total 699,973$ 688,363$
17. COMMITMENTS AND CONTINGENCIES
Litigation — Various suits and claims arising in the normal course of operations are pending or are in
progress against the System. Such suits and claims are either specifically covered by insurance, provided
for through estimated self-insurance liabilities, or are not material. While the outcome of these other
suits cannot be determined at this time, management believes that any loss which may arise from these
actions will not have a material adverse effect on the consolidated financial position or results of
operations of the System.
18. SUBSEQUENT EVENTS
The System has evaluated subsequent events through May 23, 2014, the date the consolidated financial
statements were available to be issued
* * * * * *
- 37 -
ADDITIONAL CONSOLIDATING INFORMATION

- 38 -
ST. JOSEPH’S HEALTHCARE SYSTEM, INC. AND AFFILIATES
CONSOLIDATING SCHEDULE — BALANCE SHEET INFORMATION
AS OF DECEMBER 31, 2013
(In thousands)
St. Joseph’s
St. Joseph’s Hospital
Hospital and St. Joseph’s
and Medical Wayne VHS 200 St. Joseph’s
Medical Center Hospital Management, Total Hospital Healthcare SJHS
Center and Foundation, Foundation, Inc. and Obligated Plaza System, Insurance
Subsidiaries Inc. Inc. Subsidiary Eliminations Group Corp. Inc. Limited Eliminations Total
ASSETS
CURRENT ASSETS: Cash and cash equivalents 79,375$ 5,740$ 999$ 1,022$ - $ 87,136$ 107$ - $ - $ - $ 87,243$ Investments 73,628 1,215 5,608 80,451 80,451 Current portion of assets whose use is limited 12,398 12,398 1,823 6,176 20,397 Patient accounts receivable — net 64,001 767 64,768 64,768 Grants, notes, and other receivables 14,388 105 2 14,495 169 762 (739) 14,687 Unconditional promises to give — net 2,727 275 3,002 3,002 Supplies 7,614 23 7,637 7,637 Prepaid expenses and other current assets 2,947 45 25 (95) 2,922 251 3,173 Due from affiliates 253 (112) 141 (141) -
Total current assets 254,604 8,617 2,491 7,445 (207) 272,950 2,099 - 7,189 (880) 281,358 ASSETS WHOSE USE IS LIMITED — Less current portion 36,139 1,374 1,672 39,185 5,297 22,954 67,436 UNCONDITIONAL PROMISES TO GIVE — Net 4,695 257 4,952 4,952 NOTES RECEIVABLE 1,513 1,513 1,513 PROPERTY AND EQUIPMENT — Net 310,897 487 311,384 28,818 340,202 BENEFICIAL INTEREST IN PERPETUAL
TRUSTS 2,073 900 2,973 2,973 INTEREST IN NET ASSETS OF ST. JOSEPH’S HOSPITAL AND MEDICAL CENTER FOUNDATION, INC. 20,301 (20,301) - - INTEREST IN NET ASSETS OF ST. JOSEPH’S WAYNE HOSPITAL FOUNDATION, INC. 5,142 (5,142) - - ESTIMATED INSURANCE RECOVERIES 6,554 6,554 (6,554) - INVESTMENT IN JOINT VENTURES 23,458 23,458 23,458 OTHER ASSETS 12,766 1,736 45 14,547 640 3,178 (3,178) 15,187
TOTAL 669,861$ 20,495$ 5,320$ 7,490$ (25,650)$ 677,516$ 36,854$ 3,178$ 30,143$ (10,612)$ 737,079$
The System discloses its interest in its controlled affiliates using the cost method of accounting. (Continued)

- 39 -
ST. JOSEPH’S HEALTHCARE SYSTEM, INC. AND AFFILIATES
CONSOLIDATING SCHEDULE — BALANCE SHEET INFORMATION
AS OF DECEMBER 31, 2013
(In thousands)
St. Joseph’s St. Joseph’s
Hospital Hospital
and and St. Joseph’s
Medical Medical Wayne VHS 200 St. Joseph’s
Center Center Hospital Management, Total Hospital Healthcare SJHS
and Foundation, Foundation, Inc. and Obligated Plaza System, Insurance
Subsidiaries Inc. Inc. Subsidiary Eliminations Group Corp. Inc. Limited Eliminations Total
LIABILITIES AND NET ASSETS
CURRENT LIABILITIES: Current portion of long-term debt 6,102$ - $ - $ - $ - $ 6,102$ 590$ - $ - $ - $ 6,692$ Accounts payable 37,765 80 40 117 38,002 1,170 (739) 38,433 Accrued salaries and expenses 50,724 754 51,478 6,176 57,654 Accrued interest payable 7,576 7,576 207 7,783 Due to affiliates 95 74 38 (207) - 141 (141) - Deferred revenue 162 361 523 523 Estimated third-party payer settlements 4,330 4,330 4,330
Total current liabilities 106,754 154 78 1,232 (207) 108,011 938 - 7,346 (880) 115,415
LONG-TERM DEBT — Net of current portion 225,409 225,409 28,785 254,194 ESTIMATED THIRD-PARTY PAYER SETTLEMENTS 6,068 6,068 6,068 ACCRUED PENSION LIABILITY 107,349 49 107,398 107,398 ESTIMATED PROFESSIONAL LIABILITY CLAIMS PAYABLE 12,053 12,053 14,968 (6,554) 20,467 OTHER LIABILITIES 4,460 40 4,500 14 4,514
Total liabilities 462,093 194 78 1,281 (207) 463,439 29,737 - 22,314 (7,434) 508,056
NET ASSETS — Unrestricted: St. Joseph’s Healthcare System, Inc. and Affiliates 180,185 4,743 1,848 6,209 (6,590) 186,395 7,117 3,178 7,829 (3,178) 201,341 Noncontrolling interests in joint ventures 2,032 2,032 2,032
Total unrestricted net assets 182,217 4,743 1,848 6,209 (6,590) 188,427 7,117 3,178 7,829 (3,178) 203,373
Temporarily restricted 22,218 13,485 2,367 (15,753) 22,317 22,317 Permanently restricted 3,333 2,073 1,027 (3,100) 3,333 3,333
Total net assets 207,768 20,301 5,242 6,209 (25,443) 214,077 7,117 3,178 7,829 (3,178) 229,023
TOTAL 669,861$ 20,495$ 5,320$ 7,490$ (25,650)$ 677,516$ 36,854$ 3,178$ 30,143$ (10,612)$ 737,079$
The System discloses its interests in its controlled affiliates using the cost method of accounting. (Concluded)

- 40 -
ST. JOSEPH’S HEALTHCARE SYSTEM, INC. AND AFFILIATES
CONSOLIDATING SCHEDULE — BALANCE SHEET INFORMATION
AS OF DECEMBER 31, 2012
(In thousands)
St. Joseph’s
St. Joseph’s Hospital
Hospital and St. Joseph’s
and Medical Wayne VHS 200 St. Joseph’s
Medical Center Hospital Management, Total Hospital Healthcare SJHS
Center and Foundation, Foundation, Inc. and Obligated Plaza System, Insurance
Subsidiaries Inc. Inc. Subsidiary Eliminations Group Corp. Inc. Limited Eliminations Total
ASSETS
CURRENT ASSETS: Cash and cash equivalents 57,252$ 4,538$ 1,005$ 1,277$ - $ 64,072$ 107$ - $ - $ - $ 64,179$ Investments 74,400 874 6,188 81,462 81,462 Current portion of assets whose use is limited 12,802 12,802 1,853 3,644 18,299 Patient accounts receivable — net 62,191 874 63,065 63,065 Grants, notes, and other receivables 8,871 101 2 8,974 45 379 (379) 9,019 Unconditional promises to give — net 2,763 270 3,033 3,033 Supplies 7,847 19 7,866 7,866 Prepaid expenses and other current assets 3,275 25 9 3,309 178 3,487 Due from affiliates 192 (192) - -
Total current assets 226,830 7,427 2,151 8,367 (192) 244,583 2,005 - 4,201 (379) 250,410
ASSETS WHOSE USE IS LIMITED — Less current portion 48,302 1,382 1,684 51,368 5,122 22,137 78,627 UNCONDITIONAL PROMISES TO GIVE — Net 5,772 212 5,984 5,984 NOTES RECEIVABLE 1,618 1,618 1,618 PROPERTY AND EQUIPMENT — Net 312,827 509 313,336 30,671 344,007 BENEFICIAL INTEREST IN PERPETUAL
TRUSTS 1,945 847 2,792 2,792 INTEREST IN NET ASSETS OF ST. JOSEPH’S HOSPITAL AND MEDICAL CENTER FOUNDATION, INC. 19,982 (19,982) - - INTEREST IN NET ASSETS OF ST. JOSEPH’S WAYNE HOSPITAL FOUNDATION, INC. 4,755 (4,755) - - ESTIMATED INSURANCE RECOVERIES 7,268 7,268 (7,268) -
INVESTMENT IN JOINT VENTURES 26,813 26,813 26,813
OTHER ASSETS 12,245 1,667 45 13,957 671 3,178 (3,178) 14,628
TOTAL 659,022$ 20,320$ 4,894$ 8,412$ (24,929)$ 667,719$ 38,469$ 3,178$ 26,338$ (10,825)$ 724,879$
The System discloses its interest in its controlled affiliates using the cost method of accounting. (Continued)
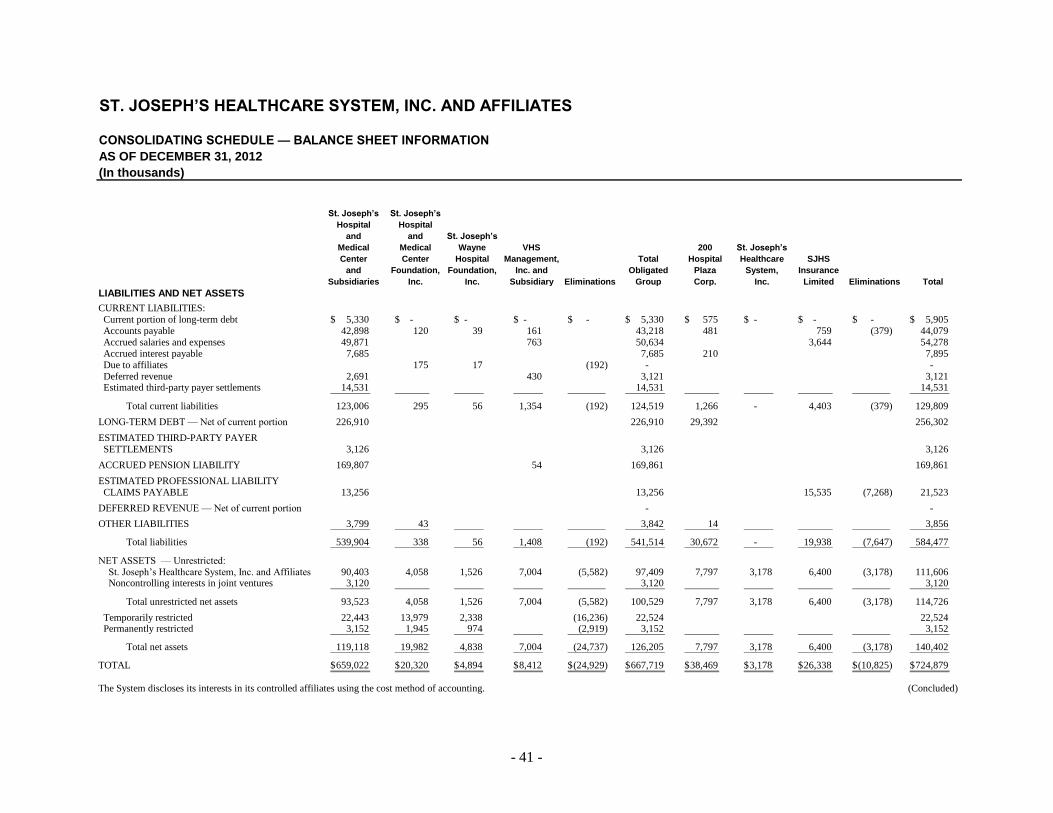
- 41 -
ST. JOSEPH’S HEALTHCARE SYSTEM, INC. AND AFFILIATES
CONSOLIDATING SCHEDULE — BALANCE SHEET INFORMATION
AS OF DECEMBER 31, 2012
(In thousands)
St. Joseph’s St. Joseph’s
Hospital Hospital
and and St. Joseph’s
Medical Medical Wayne VHS 200 St. Joseph’s
Center Center Hospital Management, Total Hospital Healthcare SJHS
and Foundation, Foundation, Inc. and Obligated Plaza System, Insurance
Subsidiaries Inc. Inc. Subsidiary Eliminations Group Corp. Inc. Limited Eliminations Total
LIABILITIES AND NET ASSETS
CURRENT LIABILITIES: Current portion of long-term debt 5,330$ - $ - $ - $ - $ 5,330$ 575$ - $ - $ - $ 5,905$ Accounts payable 42,898 120 39 161 43,218 481 759 (379) 44,079 Accrued salaries and expenses 49,871 763 50,634 3,644 54,278 Accrued interest payable 7,685 7,685 210 7,895 Due to affiliates 175 17 (192) - - Deferred revenue 2,691 430 3,121 3,121 Estimated third-party payer settlements 14,531 14,531 14,531
Total current liabilities 123,006 295 56 1,354 (192) 124,519 1,266 - 4,403 (379) 129,809
LONG-TERM DEBT — Net of current portion 226,910 226,910 29,392 256,302 ESTIMATED THIRD-PARTY PAYER SETTLEMENTS 3,126 3,126 3,126 ACCRUED PENSION LIABILITY 169,807 54 169,861 169,861 ESTIMATED PROFESSIONAL LIABILITY CLAIMS PAYABLE 13,256 13,256 15,535 (7,268) 21,523 DEFERRED REVENUE — Net of current portion - -
OTHER LIABILITIES 3,799 43 3,842 14 3,856
Total liabilities 539,904 338 56 1,408 (192) 541,514 30,672 - 19,938 (7,647) 584,477
NET ASSETS — Unrestricted: St. Joseph’s Healthcare System, Inc. and Affiliates 90,403 4,058 1,526 7,004 (5,582) 97,409 7,797 3,178 6,400 (3,178) 111,606 Noncontrolling interests in joint ventures 3,120 3,120 3,120
Total unrestricted net assets 93,523 4,058 1,526 7,004 (5,582) 100,529 7,797 3,178 6,400 (3,178) 114,726
Temporarily restricted 22,443 13,979 2,338 (16,236) 22,524 22,524 Permanently restricted 3,152 1,945 974 (2,919) 3,152 3,152
Total net assets 119,118 19,982 4,838 7,004 (24,737) 126,205 7,797 3,178 6,400 (3,178) 140,402
TOTAL 659,022$ 20,320$ 4,894$ 8,412$ (24,929)$ 667,719$ 38,469$ 3,178$ 26,338$ (10,825)$ 724,879$
The System discloses its interests in its controlled affiliates using the cost method of accounting. (Concluded)

- 42 -
ST. JOSEPH’S HEALTHCARE SYSTEM, INC. AND AFFILIATES
CONSOLIDATING SCHEDULE — OPERATING RESULTS INFORMATION
FOR THE YEAR ENDED DECEMBER 31, 2013
(In thousands)
St. Joseph’s St. Joseph’s St. Joseph’s
Hospital and Hospital and Wayne VHS 200 St. Joseph’s
Medical Medical Center Hospital Management, Total Hospital Healthcare SJHS
Center and Foundation, Foundation, Inc. and Obligated Plaza System, Insurance
Subsidiaries Inc. Inc. Subsidiary Eliminations Group Corp. Inc. Limited Eliminations Total
REVENUES: Net patient service revenue (after contractual allowances
and discounts) 703,373$ - $ - $ 8,460$ - $ 711,833$ - $ - $ - $ - $ 711,833$ Provision for bad debts (82,418) (198) (82,616) (82,616)
Net patient service revenue — net of provision for bad debts) 620,955 - - 8,262 - 629,217 - - - - 629,217
Other revenue 76,989 1,796 818 217 (1,468) 78,352 3,326 5,447 (5,229) 81,896 Net assets released from restrictions — operations 2,403 266 2,669 2,669
Total revenues 697,944 4,199 1,084 8,479 (1,468) 710,238 3,326 - 5,447 (5,229) 713,782
EXPENSES: Salaries and wages 318,270 748 177 5,866 (925) 324,136 324,136 Employee benefits 75,321 187 44 1,190 (231) 76,511 76,511
Physician fees 27,661 27,661 27,661 Supplies and other 211,632 3,024 695 2,112 (312) 217,151 1,198 4,421 (5,229) 217,541 Interest 17,087 31 17,118 1,247 18,365 Depreciation and amortization 33,829 22 33,851 1,561 35,412 Provision for bad debts 347 347 347
Total expenses 683,800 4,328 916 9,199 (1,468) 696,775 4,006 - 4,421 (5,229) 699,973
EXCESS (DEFICIENCY) OF REVENUES OVER EXPENSES 14,144 (129) 168 (720) - 13,463 (680) - 1,026 - 13,809
OTHER CHANGES IN UNRESTRICTED NET ASSETS: Change in net unrealized gains and losses on investments (440) (36) 154 (75) (397) 403 6 Pension-related adjustments 75,717 75,717 75,717
Change in interest in unrestricted net assets of St. Joseph’s Hospital and Medical Center Foundation, Inc. 685 (685) - - Change in interest in unrestricted net assets of St. Joseph’s Wayne Hospital Foundation, Inc. 323 (323) - - Transfers (to) from affiliates (850) 850 - - Contribution for capital acquisitions - - Distributions to noncontrolling interests in joint ventures (2,893) (2,893) (2,893) Net assets released from restrictions — capital acquisitions 2,008 2,008 2,008
INCREASE (DECREASE) IN UNRESTRICTED NET ASSETS 88,694$ 685$ 322$ (795)$ (1,008)$ 87,898$ (680)$ - $ 1,429$ - $ 88,647$
The System discloses its interests in its controlled affiliates using the cost method of accounting.

- 43 -
ST. JOSEPH’S HEALTHCARE SYSTEM, INC. AND AFFILIATES
CONSOLIDATING SCHEDULE — OPERATING RESULTS INFORMATION
FOR THE YEAR ENDED DECEMBER 31, 2012
(In thousands)
St. Joseph’s St. Joseph’s St. Joseph’s
Hospital and Hospital and Wayne VHS 200 St. Joseph’s
Medical Medical Center Hospital Management, Total Hospital Healthcare SJHS
Center and Foundation, Foundation, Inc. and Obligated Plaza System, Insurance
Subsidiaries Inc. Inc. Subsidiary Eliminations Group Corp. Inc. Limited Eliminations Total
REVENUES: Net patient service revenue (after contractual allowances and discounts) 678,312$ - $ - $ 8,581$ - $ 686,893$ - $ - $ - $ - $ 686,893$ Provision for bad debts (68,724) (261) (68,985) (68,985)
Net patient service revenue — net of provision for bad debts) 609,588 - - 8,320 - 617,908 - - - - 617,908
Other revenue 70,119 1,769 823 289 (1,695) 71,305 2,838 7,099 (4,550) 76,692 Net assets released from restrictions — operations 846 4,761 291 5,898 5,898
Total revenues 680,553 6,530 1,114 8,609 (1,695) 695,111 2,838 - 7,099 (4,550) 700,498
EXPENSES: Salaries and wages 315,040 891 193 6,045 (1,082) 321,087 321,087 Employee benefits 74,937 220 47 1,266 (264) 76,206 76,206 Physician fees 28,690 28,690 28,690 Supplies and other 203,335 5,538 708 2,316 (4,099) 207,798 1,005 6,033 (4,550) 210,286 Interest 16,714 29 16,743 1,259 18,002 Depreciation and amortization 32,230 22 1 32,253 1,640 33,893 Provision for bad debts 13 24 37 37
Total expenses 670,946 6,684 972 9,657 (5,445) 682,814 3,904 - 6,033 (4,550) 688,201
EXCESS (DEFICIENCY) OF REVENUES OVER EXPENSES 9,607 (154) 142 (1,048) 3,750 12,297 (1,066) - 1,066 - 12,297
OTHER CHANGES IN UNRESTRICTED NET ASSETS: Change in net unrealized gains and losses on investments 1,192 (11) 86 (26) 1,241 679 1,920 Pension-related adjustments (29,408) (29,408) (29,408) Change in interest in unrestricted net assets of St. Joseph’s Hospital and Medical Center Foundation, Inc. 785 (785) - - Change in interest in unrestricted net assets of St. Joseph’s Wayne Hospital Foundation, Inc. 228 (228) - - Transfers (to) from affiliates (950) 950 - - Contribution for capital acquisitions 3,749 (3,749) - - Distributions to noncontrolling interests in joint ventures (4,176) (4,176) (4,176)
Contributions from noncontrolling interests in joint ventures 91 91 91 Net assets released from restrictions — capital acquisitions 1,416 1,416 1,416
(DECREASE) INCREASE IN UNRESTRICTED NET ASSETS (17,466)$ 785$ 228$ (1,074)$ (1,012)$ (18,539)$ (1,066)$ - $ 1,745$ - $ (17,860)$
The System discloses its interests in its controlled affiliates using the cost method of accounting.

- 44 -
ST. JOSEPH’S HEALTHCARE SYSTEM, INC. AND AFFILIATES
CONSOLIDATING SCHEDULE — CHANGES IN NET ASSETS INFORMATION
FOR THE YEAR ENDED DECEMBER 31, 2013
(In thousands)
St. Joseph’s St. Joseph’s
Hospital Hospital
and and St. Joseph’s
Medical Medical Wayne VHS 200 St. Joseph’s
Center Center Hospital Management, Total Hospital Healthcare SJHS
and Foundation, Foundation, Inc. and Obligated Plaza System, Insurance
Subsidiaries Inc. Inc. Subsidiary Eliminations Group Corp. Inc. Limited Eliminations Total
UNRESTRICTED NET ASSETS: Excess (deficiency) of revenues over expenses 14,144$ (129)$ 168$ (720)$ - $ 13,463$ (680)$ - $ 1,026$ - $ 13,809$ Change in net unrealized gains and losses on investments (440) (36) 154 (75) (397) 403 6 Pension-related adjustments 75,717 75,717 75,717 Change in interest in unrestricted net assets of St. Joseph’s Hospital and Medical Foundation, Inc. 685 (685) - - Change in interest in unrestricted net assets of St. Joseph’s Wayne Hospital Foundation, Inc. 323 (323) - -
Transfer (to) from affiliates (850) 850 - - Distributions to noncontrolling interests in joint ventures (2,893) (2,893) (2,893) Net assets released from restrictions — capital acquisitions 2,008 2,008 2,008
Increase (decrease) in unrestricted net assets 88,694 685 322 (795) (1,008) 87,898 (680) - 1,429 - 88,647
TEMPORARILY RESTRICTED NET ASSETS: Contributions, grants, investment income, and other support 2,266 1,909 295 4,470 4,470 Change in interest in temporarily restricted net assets of St. Joseph’s Hospital and Medical Foundation, Inc. (493) 493 - - Change in interest in temporarily restricted net assets of
St. Joseph’s Wayne Hospital Foundation, Inc. 10 (10) - - Net assets released from restrictions — operations (2,403) (266) (2,669) (2,669) Net assets released from restrictions — capital acquisitions (2,008) (2,008) (2,008)
(Decrease) increase in temporarily restricted net assets (225) (494) 29 - 483 (207) - - - - (207)
PERMANENTLY RESTRICTED NET ASSETS: Change in net unrealized gains and losses on investments held in perpetual trusts 128 53 181 181 Change in interest in permanently restricted net assets of St. Joseph’s Hospital and Medical Foundation, Inc. 128 (128) - - Change in interest in permanently restricted net assets of St. Joseph’s Wayne Hospital Foundation, Inc. 53 (53) - -
Increase (decrease) in permanently restricted net assets 181 128 53 - (181) 181 - - - - 181
INCREASE (DECREASE) IN NET ASSETS 88,650 319 404 (795) (706) 87,872 (680) - 1,429 - 88,621 NET ASSETS — Beginning of year 119,118 19,982 4,838 7,004 (24,737) 126,205 7,797 3,178 6,400 (3,178) 140,402
NET ASSETS — End of year 207,768$ 20,301$ 5,242$ 6,209$ (25,443)$ 214,077$ 7,117$ 3,178$ 7,829$ (3,178)$ 229,023$ .
The System discloses its interest in its controlled affiliates using the cost method of accounting.

- 45 -
ST. JOSEPH’S HEALTHCARE SYSTEM, INC. AND AFFILIATES
CONSOLIDATING SCHEDULE — CHANGES IN NET ASSETS INFORMATION
FOR THE YEAR ENDED DECEMBER 31, 2012
(In thousands)
St. Joseph’s St. Joseph’s
Hospital Hospital
and and St. Joseph’s
Medical Medical Wayne VHS 200 St. Joseph’s
Center Center Hospital Management, Total Hospital Healthcare SJHS
and Foundation, Foundation, Inc. and Obligated Plaza System, Insurance
Subsidiaries Inc. Inc. Subsidiary Eliminations Group Corp. Inc. Limited Eliminations Total
UNRESTRICTED NET ASSETS: Excess (deficiency) of revenues over expenses 9,607$ (154)$ 142$ (1,048)$ 3,750$ 12,297$ (1,066)$ - $ 1,066$ - $ 12,297$ Change in net unrealized gains and losses on investments 1,192 (11) 86 (26) 1,241 679 1,920 Pension-related adjustments (29,408) (29,408) (29,408) Change in interest in unrestricted net assets of St. Joseph’s Hospital and Medical Foundation, Inc. 785 (785) - - Change in interest in unrestricted net assets of St. Joseph’s Wayne Hospital Foundation, Inc. 228 (228) - - Transfer (to) from affiliates (950) 950 - - Contribution for capital acquisitions 3,749 (3,749) - - Distributions to noncontrolling interests in joint ventures (4,176) (4,176) (4,176) Contributions from noncontrolling interests in joint ventures 91 91 91 Net assets released from restrictions — capital acquisitions 1,416 1,416 1,416
(Decrease) increase in unrestricted net assets (17,466) 785 228 (1,074) (1,012) (18,539) (1,066) - 1,745 - (17,860)
TEMPORARILY RESTRICTED NET ASSETS: Contributions, grants, investment income, and other support 1,635 1,667 200 3,502 3,502 Change in interest in temporarily restricted net assets of St. Joseph’s Hospital and Medical Foundation, Inc. (3,094) 3,094 - - Change in interest in temporarily restricted net assets of St. Joseph’s Wayne Hospital Foundation, Inc. (95) 95 - - Net assets released from restrictions — operations (846) (4,761) (291) (5,898) (5,898) Net assets released from restrictions — capital acquisitions (1,416) (1,416) (1,416)
(Decrease) increase in temporarily restricted net assets (3,816) (3,094) (91) - 3,189 (3,812) - - - - (3,812)
PERMANENTLY RESTRICTED NET ASSETS: Change in net unrealized gains and losses on investments held in perpetual trusts 132 57 189 189 Change in interest in permanently restricted net assets of St. Joseph’s Hospital and Medical Foundation, Inc. 132 (132) - - Change in interest in permanently restricted net assets of St. Joseph’s Wayne Hospital Foundation, Inc. 57 (57) - -
Increase (decrease) in permanently restricted net assets 189 132 57 - (189) 189 - - - - 189
(DECREASE) INCREASE IN NET ASSETS (21,093) (2,177) 194 (1,074) 1,988 (22,162) (1,066) - 1,745 - (21,483) NET ASSETS — Beginning of year 140,211 22,159 4,644 8,078 (26,725) 148,367 8,863 3,178 4,655 (3,178) 161,885
NET ASSETS — End of year 119,118$ 19,982$ 4,838$ 7,004$ (24,737)$ 126,205$ 7,797$ 3,178$ 6,400$ (3,178)$ 140,402$ .
The System discloses its interest in its controlled affiliates using the cost method of accounting.