st. joseph river st. joseph and elkhart counties 2006 fish management report … · ·...
TRANSCRIPT

St. Joseph River
St. Joseph and Elkhart Counties
2006 Fish Management Report
Rod A. Edgell
Assistant Biologist
Fisheries Section
Indiana Department of Natural Resources
Division of Fish and Wildlife
I.G.C.-South, Room W273
402 W. Washington Street
Indianapolis, IN 46204
2006

ii
EXECUTIVE SUMMARY
• Smallmouth bass and rock bass data were collected at seven sites in July and August 2006 on
the St. Joseph River, St Joseph and Elkhart Counties.
• When compared to past surveys, smallmouth bass catch rates declined at five of the seven
sites sampled in 2006.
• The catch rates of rock bass increased at five of the seven sites compared to past surveys.
• While largemouth bass and walleye are less abundant than some game species, they are still
providing good fishing opportunities for anglers.
• A diverse size range of smallmouth bass exist within the river, including several quality and
memorable size fish.
iii
TABLE OF CONTENTS
Page
LIST OF TABLES......................................................................................................................... iv
LIST OF FIGURES ....................................................................................................................... iv
INTRODUCTION .......................................................................................................................... 1
METHODS ..................................................................................................................................... 2
RESULTS ....................................................................................................................................... 2
DISCUSSION................................................................................................................................. 4
RECOMMENDATIONS................................................................................................................ 6
LITERATURE CITED ................................................................................................................... 6
APPENDICIES ............................................................................................................................. 13

iv
LIST OF TABLES
Table Page
1. Water temperature, dissolved oxygen, and pH collected at
fish sampling locations on the St. Joseph River. .................................................................8
2. Species and relative abundance of fish collected by number
and weight on the St. Joseph River, 2006............................................................................9
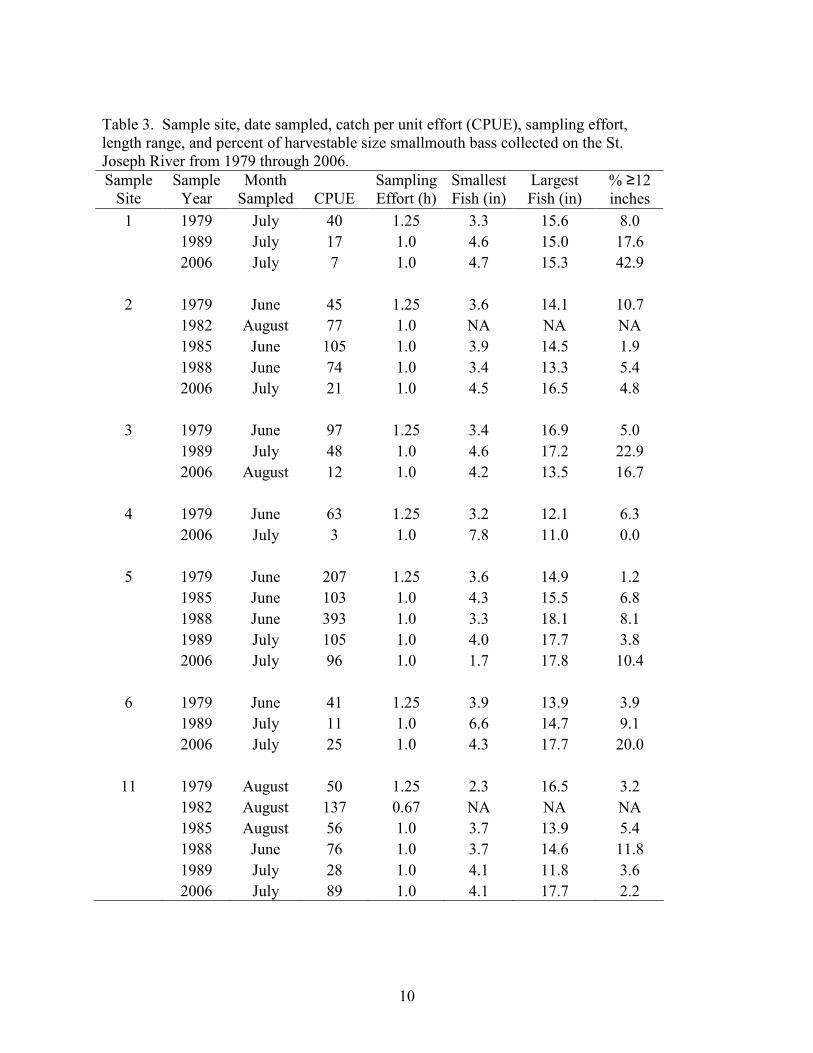
3. Sample site, date sampled, catch per unit effort (CPUE),
sampling effort, length range, and percent of harvestable
size smallmouth bass collected on the St. Joseph River from
1979 through 2006. ............................................................................................................10
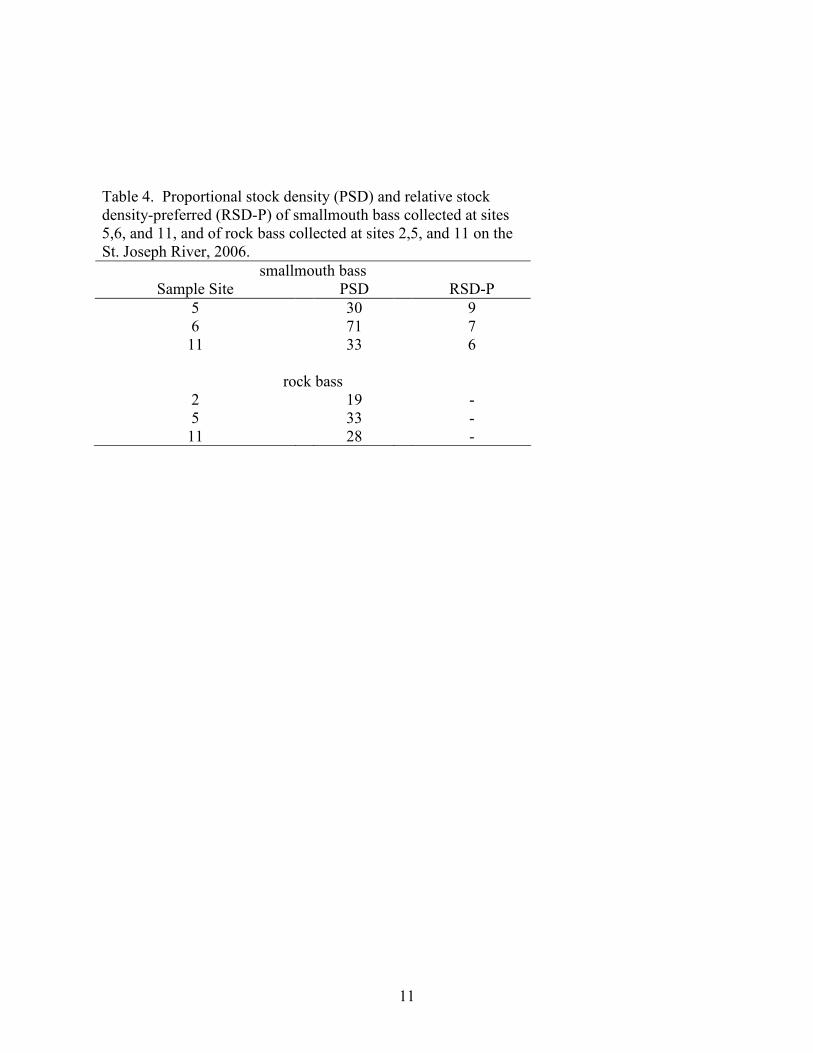
4. Proportional stock density (PSD) and relative stock density-
preferred (RSD-P) of smallmouth bass collected at sites 5,6,
and 11, and of rock bass collected at sites 2,5, and 11 on the
St. Joseph River, 2006.. .....................................................................................................11
5. Sample site, date sampled, catch per unit effort (CPUE),
sampling effort, length range, and percent of rock bass
greater than or equal to 7 inches collected on the St. Joseph
River from 1979 through 2006. .........................................................................................12
LIST OF FIGURES
Figure Page
1. Upstream and downstream locations of St. Joseph River
historical sampling sites. ......................................................................................................8

1
INTRODUCTION
The St. Joseph River originates in Hillsdale County, Michigan, and flows through
Calhoun, Branch and St. Joseph Counties before entering Indiana. In Indiana the river flows
through Elkhart and St. Joseph Counties, before reentering Michigan just north of South Bend,
and eventually draining into Lake Michigan. The river drains approximately 2,600 square miles
of southwestern Michigan and 1,685 square miles of north central Indiana (Ledet 1979). The
Indiana portion of the watershed encompasses all of Lagrange and portions of Elkhart, Dekalb,
Kosciusko, Noble, St. Joseph, and Steuben Counties. The St. Joseph River is considered
navigable throughout Indiana for 39.57 river miles.
There is good public access available all along Indiana’s portion of the St. Joseph River.
There are twelve public accessible boat ramps located along the river, with all but four located in
St. Joseph County. Due to the number of county parks, city parks, and state access sites, there is
extensive shore access available to anglers as well. Bank fishing is prohibited by South Bend in
portions of the city; however wading is not restricted.
There are twelve dams located on the river, four of which are located in Indiana; South
Bend Dam, Mishawaka (Uniroyal) Dam, Twin Branch Dam, and Elkhart Dam. As expected,
these dams have significantly altered the river’s flow regime and habitat from its original state.
The St. Joseph River has been host to introduced salmonids from Lake Michigan since the late
1960’s. Beginning in 1977, plans were developed to construct four fish ladders, facilitating
spawning runs of trout and salmon to migrate from Lake Michigan 63 miles upstream to
Mishawaka, Indiana (Wesley and Duffy 1999). In 1992 construction of fish ladders at the South
Bend and Mishawaka Dams were completed. Due to a combined effort by both Indiana and
Michigan DNR, Indiana’s portion of the St. Joseph River, up to Twin Branch Dam, receives
annual spawning runs of steelhead trout, Chinook salmon, coho salmon, and brown trout.
Previous general fish surveys were conducted by the Indiana Department of Natural
Resources in 1979 and 1989. Smaller surveys focusing on smallmouth bass were also conducted
in 1982, 1985, and 1988. The objective of this survey was to evaluate the current smallmouth
bass fishery and to assess any changes to the fishery following the introduction of trout and
salmon in 1992.

2
METHODS
This survey of the St. Joseph River was conducted from July 5 to August 1, 2006 as part
of DFW Work Plan 204027 that covers general fisheries surveys of rivers and streams. The
timeframe for this survey was chosen based on historic sampling events, as well as the timing of
the fall steelhead migration. Sampling sites were chosen based on previous surveys (Ledet
1979), and consisted of seven sites (sites 1,2,3,4,5,6, and 11; Figure 1, Appendix 1).
Dissolved oxygen, and pH were determined at each station using a Hach kit. Surface
water temperature was measured using a thermometer.
Fish were collected at each site by pulsed D.C. electrofishing both shorelines in a general
downstream direction with two dippers for a total of 1 hour (h) (30 minutes per shoreline). All
fish collected were measured to the nearest 0.1 inches total length (TL) and weighed in the field
to the nearest 0.01 lb.
Fish scale samples were taken from smallmouth bass, rock bass, largemouth bass, and
walleye for age and growth analysis. Due to a low sample size of smallmouth bass and rock bass
at certain sites, sites were combined based on location of dams for age and growth analysis.
Combined sites included sites below South Bend dam (1, 2, and 3) and sites below Mishawaka
dam (4 and 5). Due to an even lower sample size of largemouth bass and walleye, all sites were
combined for analysis. Low sample size also prohibited the calculation of stock density indices
at certain sites. Proportional stock density (PSD) and relative stock density (RSD) was
calculated for smallmouth bass at sites 5, 6, and 11, while only PSD was calculated for rock bass
at sites 2, 5, and 11 (Anderson and Neumann 1996).
RESULTS
Water Chemistry
During the survey period the temperature ranged from 72 to 79ºF (Table 1). The
dissolved oxygen content ranged from 8.0 to 10.0ppm, and the pH was consistently 7.5 at each
site. The temperature ranges during past surveys in 1979 and 1989 were 61 to 66ºF and 73 to
78ºF, respectively (Ledet 1979 and 1990).

3
Fish Survey Data
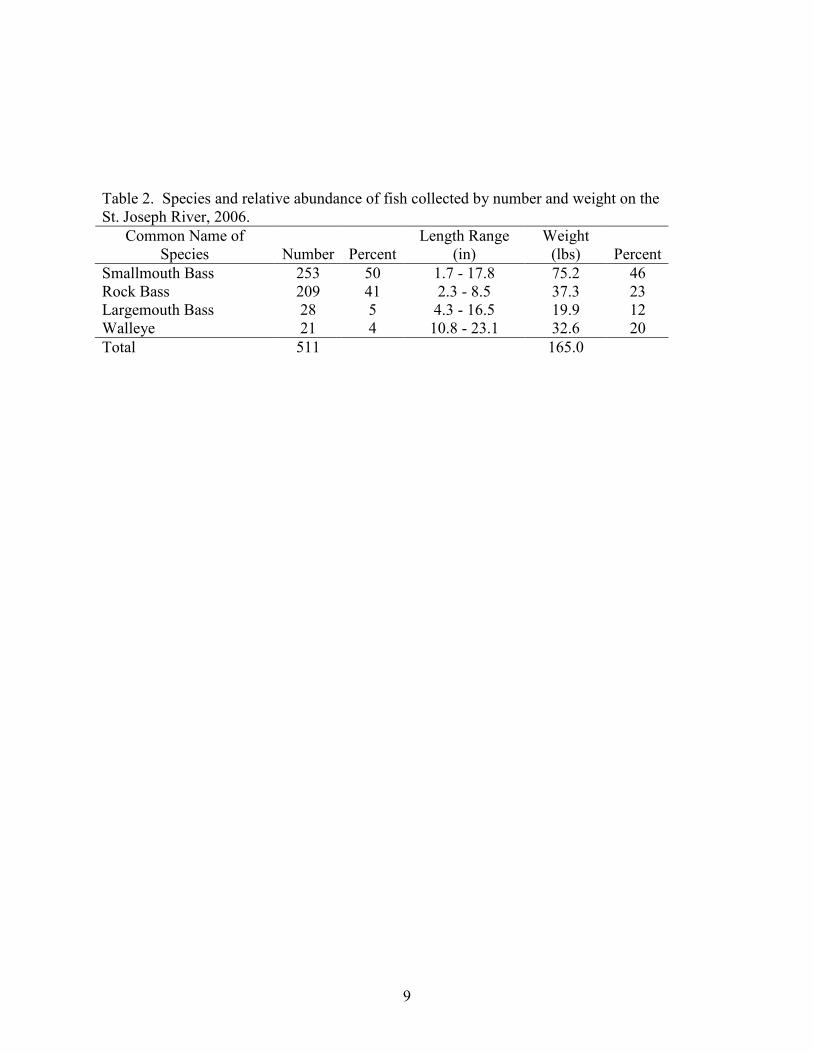
A total of 511 fish, weighing 144.1 lbs were collected during this survey. Smallmouth
bass were the most abundant species collected by number (50%), followed by rock bass (41%),
largemouth bass (5%), and walleye (4%). Smallmouth bass were also the most abundant species
collected by weight (46%), followed by rock bass (23%), walleye (20%), and largemouth (12%)
(Table 2).
A total of 253 smallmouth bass weighing 75.2 lbs were collected during this survey
(Table 2). Catch rates of smallmouth bass collected at each site ranged from 3 to 96 fish/h
(Table 3). Site 5 exhibited the greatest catch rate, followed by site 11 (89 fish/h). The lowest
catch rate was collected at site 4, followed by site 1 (7 fish/h). Catch rates of smallmouth bass
during past surveys have ranged from 11 to 393 fish/h (Ledet 1990). Smallmouth bass ranged in
length from 1.7 to 17.8 inches. Calculated PSD indices ranged from 30 to 71, while RSD-P
ranged from 6 to 9 (Table 4). The largest percentage of fish greater than 12 inches was collected
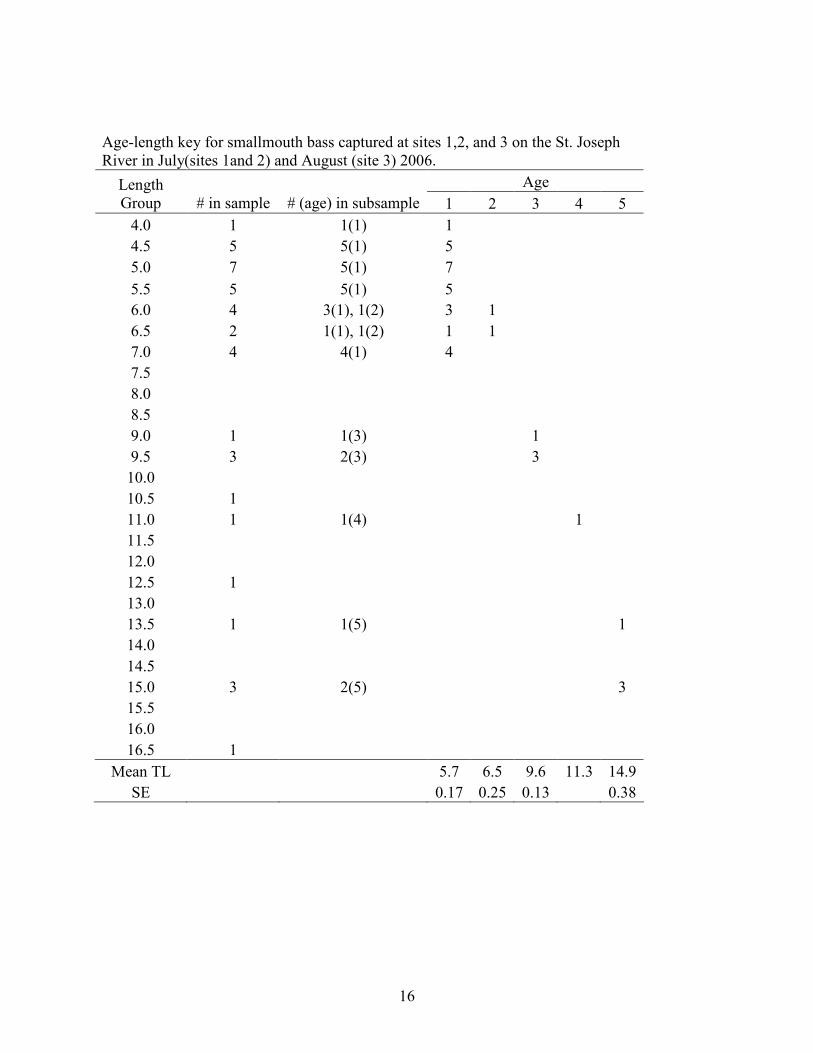
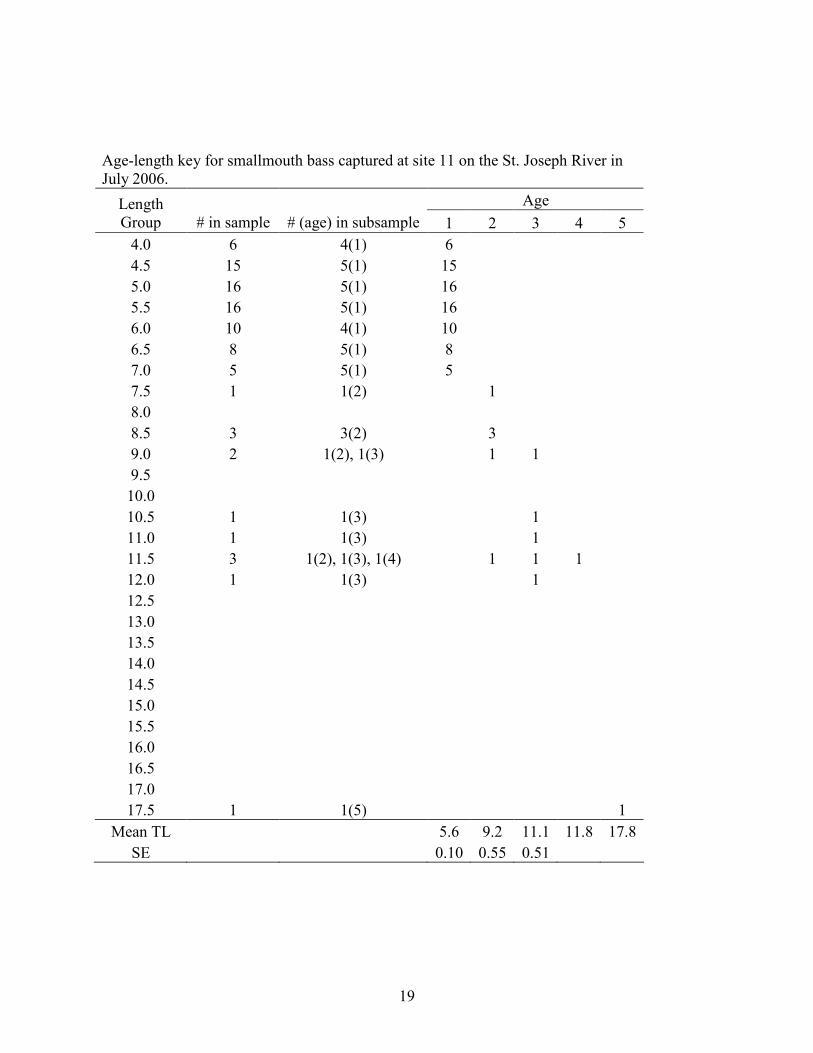
at site 1 (43%). No smallmouth bass greater than 12 inches were collected at site 4. Age-length
keys indicated that smallmouth bass reach 12 inches at age 3 or age 4 (Appendix 2).
A total of 209 rock bass were collected during this survey (Table 2). Rock bass catch
rates ranged from 2 to 75 fish/h. The greatest catch rate was collected at site 5, while site 3
exhibited the lowest catch rate. Catch rates of rock bass during past surveys ranged from 0 to 27
fish/h (Ledet 1979, 1985, 1989, and 1990). The length of rock bass during this survey ranged
from 2.3 to 8.5 inches. Site 6 demonstrated the greatest percentage of rock bass greater than or
equal to 7 inches (60%), followed by site 3 (50%) (Table 5). Calculated PSD indices ranged
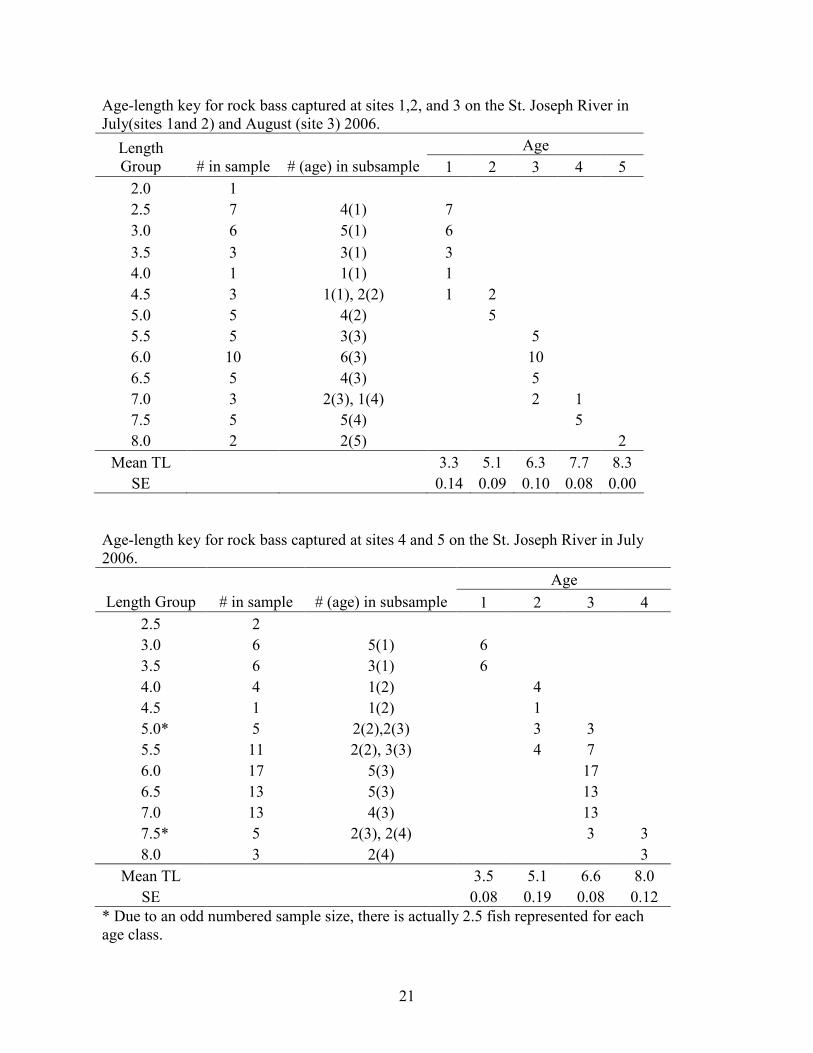
from 19 to 33 (Table 4). Age-length keys indicated that rock bass reach 7 inches at age 3 or age
4 (Appendix 3).
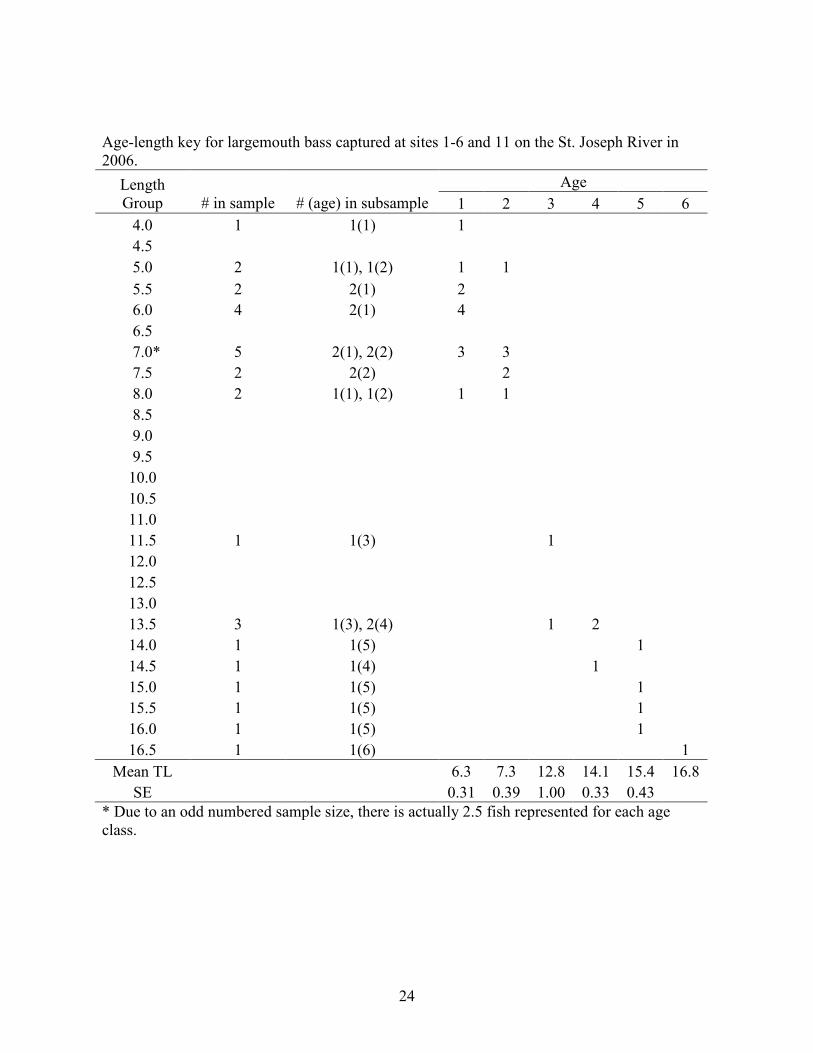
During this survey largemouth bass and walleye were collected in low numbers. The
greatest number of largemouth bass were collected at site 6 (8), while the fewest were collected
at sites 3 and 4 (1). Largemouth bass ranged in size from 4.3 to 16.5 inches. Walleye were
collected at four of the seven sites sampled. The greatest number of walleye were collected at
site 5 (9). Three of the four age-1 walleye sampled were collected at site 5. Walleye ranged in
size from 10.8 to 23.1 inches (Table 2).

4
DISCUSSION
Although smallmouth bass catch rates declined when compared to past surveys, the St.
Joseph River continues to support a quality smallmouth bass fishery. When compared to past
surveys, catch rates declined at five of the seven sites sampled in 2006 (Table 3). Only sites 6
and 11 demonstrated increases in catch rates from some past studies. While site 11 exhibited the
second highest catch rate ever recorded for that site, 85% of the bass were age 1 (4.1 - 7.1 in).
The catch rate at site 6 was higher than the previous survey in 1989; however it was still lower
than the catch rate observed at that site in 1979. Differences in catch rates from single samples
can often be variable; however there are other possible reasons behind the decline. Much of the
decline in catch rates compared to past surveys can be attributed to differences in time of
sampling and water temperatures. Due to spawning activities smallmouth bass may be more
vulnerable to sampling during the month of June, and the best catch rates generally occur when
water temperatures are in the mid 60’s (Ledet 1990). However, the time of sampling and water
temperature during the 1989 and present survey were very similar, while catch rates for
smallmouth were generally lower.
The introduction of trout and salmon, primarily steelhead, into Indiana portions of the
river could also be responsible for the decline in smallmouth catch rates. Site 11 was one of only
two sites that demonstrated an increase in smallmouth bass catch rate from past studies. Site 11
also happens to be the only site sampled that is excluded from the section of river open to
salmonid migrations. Steelhead predation on juvenile bass, along with competition for food and
overwintering habitat could be detrimental to smallmouth abundance. However, the most likely
cause behind the decline in smallmouth bass is increased development and water quality impacts
within the watershed. The increase of impervious surfaces as well as the removal of riparian
vegetation can have serious impacts to fish communities. Impervious surfaces increase runoff
and erosion, which in turn increases sediment loading into streams and rivers within the
watershed. Riparian vegetation, including trees and woody debris, provides valuable habitat and
shade for many species including the smallmouth bass (Angermeier and Karr 1984, Lobb III and
Orth 1991). As more development continues along the river and elsewhere within the watershed,
a certain degree of decline in the fish community can be expected.
5
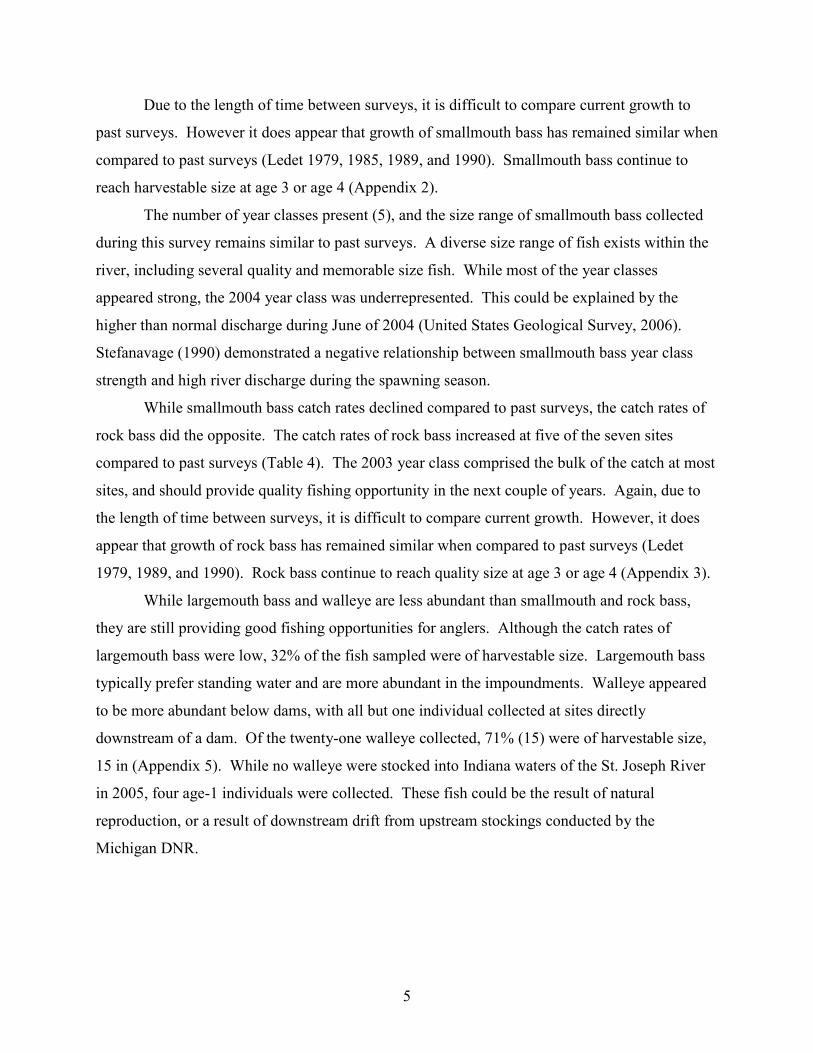
Due to the length of time between surveys, it is difficult to compare current growth to
past surveys. However it does appear that growth of smallmouth bass has remained similar when
compared to past surveys (Ledet 1979, 1985, 1989, and 1990). Smallmouth bass continue to
reach harvestable size at age 3 or age 4 (Appendix 2).
The number of year classes present (5), and the size range of smallmouth bass collected
during this survey remains similar to past surveys. A diverse size range of fish exists within the
river, including several quality and memorable size fish. While most of the year classes
appeared strong, the 2004 year class was underrepresented. This could be explained by the
higher than normal discharge during June of 2004 (United States Geological Survey, 2006).
Stefanavage (1990) demonstrated a negative relationship between smallmouth bass year class
strength and high river discharge during the spawning season.
While smallmouth bass catch rates declined compared to past surveys, the catch rates of
rock bass did the opposite. The catch rates of rock bass increased at five of the seven sites
compared to past surveys (Table 4). The 2003 year class comprised the bulk of the catch at most
sites, and should provide quality fishing opportunity in the next couple of years. Again, due to
the length of time between surveys, it is difficult to compare current growth. However, it does
appear that growth of rock bass has remained similar when compared to past surveys (Ledet
1979, 1989, and 1990). Rock bass continue to reach quality size at age 3 or age 4 (Appendix 3).
While largemouth bass and walleye are less abundant than smallmouth and rock bass,
they are still providing good fishing opportunities for anglers. Although the catch rates of
largemouth bass were low, 32% of the fish sampled were of harvestable size. Largemouth bass
typically prefer standing water and are more abundant in the impoundments. Walleye appeared
to be more abundant below dams, with all but one individual collected at sites directly
downstream of a dam. Of the twenty-one walleye collected, 71% (15) were of harvestable size,
15 in (Appendix 5). While no walleye were stocked into Indiana waters of the St. Joseph River
in 2005, four age-1 individuals were collected. These fish could be the result of natural
reproduction, or a result of downstream drift from upstream stockings conducted by the
Michigan DNR.
6
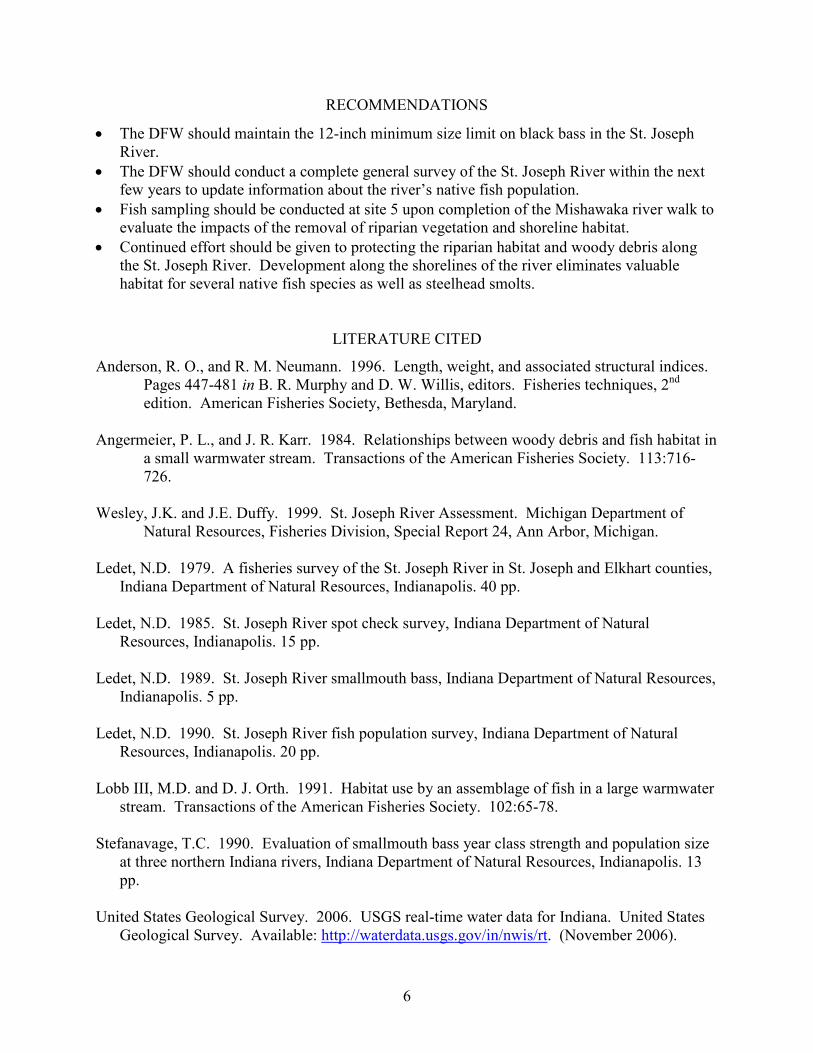
RECOMMENDATIONS
• The DFW should maintain the 12-inch minimum size limit on black bass in the St. Joseph
River.
• The DFW should conduct a complete general survey of the St. Joseph River within the next
few years to update information about the river’s native fish population.
• Fish sampling should be conducted at site 5 upon completion of the Mishawaka river walk to
evaluate the impacts of the removal of riparian vegetation and shoreline habitat.
• Continued effort should be given to protecting the riparian habitat and woody debris along
the St. Joseph River. Development along the shorelines of the river eliminates valuable
habitat for several native fish species as well as steelhead smolts.
LITERATURE CITED
Anderson, R. O., and R. M. Neumann. 1996. Length, weight, and associated structural indices.
Pages 447-481 in B. R. Murphy and D. W. Willis, editors. Fisheries techniques, 2nd
edition. American Fisheries Society, Bethesda, Maryland.
Angermeier, P. L., and J. R. Karr. 1984. Relationships between woody debris and fish habitat in
a small warmwater stream. Transactions of the American Fisheries Society. 113:716-
726.
Wesley, J.K. and J.E. Duffy. 1999. St. Joseph River Assessment. Michigan Department of
Natural Resources, Fisheries Division, Special Report 24, Ann Arbor, Michigan.
Ledet, N.D. 1979. A fisheries survey of the St. Joseph River in St. Joseph and Elkhart counties,
Indiana Department of Natural Resources, Indianapolis. 40 pp.
Ledet, N.D. 1985. St. Joseph River spot check survey, Indiana Department of Natural
Resources, Indianapolis. 15 pp.
Ledet, N.D. 1989. St. Joseph River smallmouth bass, Indiana Department of Natural Resources,
Indianapolis. 5 pp.
Ledet, N.D. 1990. St. Joseph River fish population survey, Indiana Department of Natural
Resources, Indianapolis. 20 pp.
Lobb III, M.D. and D. J. Orth. 1991. Habitat use by an assemblage of fish in a large warmwater
stream. Transactions of the American Fisheries Society. 102:65-78.
Stefanavage, T.C. 1990. Evaluation of smallmouth bass year class strength and population size
at three northern Indiana rivers, Indiana Department of Natural Resources, Indianapolis. 13
pp.
United States Geological Survey. 2006. USGS real-time water data for Indiana. United States
Geological Survey. Available: http://waterdata.usgs.gov/in/nwis/rt. (November 2006).

7
Submitted by: Rod A Edgell, Assistant Fisheries Biologist
Date: November 19, 2006
Approved by: Brian Breidert
Approved by: Stuart Shipman
Date: 3/6/07

8
St. Joseph River Historical Fish
Sampling Sites 1-6 and 11 from 2006 (Ledet 1979)
#*
Elkhart Dam
Bodine Fish Hatchery
ST6UPST6DNST5UP
ST5DN
ST4UPST4DN
ST3UP ST3DN
ST2UPST2DN
ST1UP
ST1DN
ST11UPST11DN
´0 5 102.5 Miles
Figure 1. Upstream and downstream locations of St. Joseph River historical sampling sites.
Table 1. Water temperature, dissolved oxygen, and pH collected at
fish sampling locations on the St. Joseph River.
Site Date
Water
Temperature (°F)
D.O.
(ppm) pH
1 7/5/2006 72 10.0 7.5
2 7/5/2006 73 9.0 7.5
3 8/1/2006 79 8.0 7.5
4 7/10/2006 76 9.5 7.5
5 7/27/2006 76 8.0 7.5
6 7/10/2006 76 9.0 7.5
11 7/14/2006 75 8.0 7.5
9
Table 2. Species and relative abundance of fish collected by number and weight on the
St. Joseph River, 2006.
Common Name of
Species Number Percent
Length Range
(in)
Weight
(lbs) Percent
Smallmouth Bass 253 50 1.7 - 17.8 75.2 46
Rock Bass 209 41 2.3 - 8.5 37.3 23
Largemouth Bass 28 5 4.3 - 16.5 19.9 12
Walleye 21 4 10.8 - 23.1 32.6 20
Total 511 165.0
10
Table 3. Sample site, date sampled, catch per unit effort (CPUE), sampling effort,
length range, and percent of harvestable size smallmouth bass collected on the St.
Joseph River from 1979 through 2006.
Sample
Site
Sample
Year
Month
Sampled CPUE
Sampling
Effort (h)
Smallest
Fish (in)
Largest
Fish (in)
% ≥12
inches
1 1979 July 40 1.25 3.3 15.6 8.0
1989 July 17 1.0 4.6 15.0 17.6
2006 July 7 1.0 4.7 15.3 42.9
2 1979 June 45 1.25 3.6 14.1 10.7
1982 August 77 1.0 NA NA NA
1985 June 105 1.0 3.9 14.5 1.9
1988 June 74 1.0 3.4 13.3 5.4
2006 July 21 1.0 4.5 16.5 4.8
3 1979 June 97 1.25 3.4 16.9 5.0
1989 July 48 1.0 4.6 17.2 22.9
2006 August 12 1.0 4.2 13.5 16.7
4 1979 June 63 1.25 3.2 12.1 6.3
2006 July 3 1.0 7.8 11.0 0.0
5 1979 June 207 1.25 3.6 14.9 1.2
1985 June 103 1.0 4.3 15.5 6.8
1988 June 393 1.0 3.3 18.1 8.1
1989 July 105 1.0 4.0 17.7 3.8
2006 July 96 1.0 1.7 17.8 10.4
6 1979 June 41 1.25 3.9 13.9 3.9
1989 July 11 1.0 6.6 14.7 9.1
2006 July 25 1.0 4.3 17.7 20.0
11 1979 August 50 1.25 2.3 16.5 3.2
1982 August 137 0.67 NA NA NA
1985 August 56 1.0 3.7 13.9 5.4
1988 June 76 1.0 3.7 14.6 11.8
1989 July 28 1.0 4.1 11.8 3.6
2006 July 89 1.0 4.1 17.7 2.2
11
Table 4. Proportional stock density (PSD) and relative stock
density-preferred (RSD-P) of smallmouth bass collected at sites
5,6, and 11, and of rock bass collected at sites 2,5, and 11 on the
St. Joseph River, 2006.
smallmouth bass
Sample Site PSD RSD-P
5 30 9
6 71 7
11 33 6
rock bass
2 19 -
5 33 -
11 28 -

12
Table 5. Sample site, date sampled, catch per unit effort (CPUE), sampling effort,
length range, and percent of rock bass greater than or equal to 7 inches collected on
the St. Joseph River from 1979 through 2006.
Sample
Site
Sample
Year
Month
Sampled CPUE
Sampling
Effort (h)
Smallest
Fish (in)
Largest
Fish (in)
% ≥7
inches
1 1979 July 19 1.25 4.2 9.1 NA
1989 July 5 1.0 4.6 7.6 NA
2006 July 23 1.0 2.5 8.0 21.7
2 1979 June 2 1.25 5.7 5.8 NA
1985 June 21 1.0 4.3 9.2 NA
1988 June 12 1.0 4.9 9.5 58.3
2006 July 31 1.0 2.3 8.3 12.9
3 1979 June 0 1.25 NA NA NA
1989 July 14 1.0 5.9 9.4 NA
2006 July 2 1.0 6.7 7.5 50.0
4 1979 June 13 1.25 2.3 8.6 NA
2006 July 11 1.0 5.1 7.0 9.1
5 1979 June 11 1.25 3.6 6.7 NA
1985 June 1 1.0 5.3 5.3 NA
1989 July 9 1.0 3.5 8.0 NA
2006 July 75 1.0 2.8 8.1 26.7
6 1979 June 4 1.25 4.1 8.9 NA
1989 July 4 1.0 3.3 8.5 NA
2006 July 20 1.0 5.7 8.5 60.0
11 1979 August 2 1.25 3.4 7.1 NA
1985 August 9 1.0 4.1 8.7 NA
1988 June 27 1.0 4.3 9.5 55.6
1989 July 9 1.0 5.7 9.1 NA
2006 July 47 1.0 3.9 8.3 27.7

13
Appendix 1 Locations of fish sampling sites on the St. Joseph River.

14
Locations of fish sampling sites on the St. Joseph
River, 2006
Site Location Latitude Longitude
1 Downstream 41.761812 -86.272012
1 Upstream 41.753063 -86.271956
2 Downstream 41.730688 -86.269039
2 Upstream 41.723345 -86.267113
3 Downstream 41.684193 -86.246245
3 Upstream 41.676972 -86.247013
4 Downstream 41.675280 -86.245029
4 Upstream 41.671014 -86.238363
5 Downstream 41.660717 -86.196300
5 Upstream 41.665233 -86.181417
6 Downstream 41.666373 -86.143939
6 Upstream 41.666233 -86.134067
11 Downstream 41.722025 -85.829038
11 Upstream 41.724398 -85.822242

15
Appendix 2 Age-length keys and mean lengths-at-age for smallmouth bass.
16
Age-length key for smallmouth bass captured at sites 1,2, and 3 on the St. Joseph
River in July(sites 1and 2) and August (site 3) 2006.
Age Length
Group # in sample # (age) in subsample 1 2 3 4 5
4.0 1 1(1) 1
4.5 5 5(1) 5
5.0 7 5(1) 7
5.5 5 5(1) 5
6.0 4 3(1), 1(2) 3 1
6.5 2 1(1), 1(2) 1 1
7.0 4 4(1) 4
7.5
8.0
8.5
9.0 1 1(3) 1
9.5 3 2(3) 3
10.0
10.5 1
11.0 1 1(4) 1
11.5
12.0
12.5 1
13.0
13.5 1 1(5) 1
14.0
14.5
15.0 3 2(5) 3
15.5
16.0
16.5 1
Mean TL 5.7 6.5 9.6 11.3 14.9
SE 0.17 0.25 0.13 0.38

17
Age-length key for smallmouth bass captured at sites 4 and 5 on the St. Joseph
River in July 2006.
Age Length
Group # in sample # (age) in subsample 1 2 3 4 5
1.5 1
2.0
2.5 1
3.0
3.5 2 1(1) 2
4.0 2
4.5 10 6(1) 10
5.0 7 3(1) 7
5.5 11 5(1) 11
6.0 12 3(1), 1(2) 9 3
6.5 7 4(1) 7
7.0 7 6(1) 7
7.5 5 3(1), 1(2) 4 1
8.0 5 3(1), 2(2) 3 2
8.5 1 1(3) 1
9.0 4 2(2), 2(3) 2 2
9.5 1 1(4) 1
10.0 6 5(3) 6
10.5 3 1(3), 2(4) 1 2
11.0 4 2(3), 1(4) 3 1
11.5
12.0 1
12.5 2 2(4) 2
13.0 2 2(3) 2
13.5 1 1(3) 1
14.0 1 1(4) 1
14.5 1
15.0
15.5 1 1(5) 1
16.0
16.5
17.0
17.5 1
Mean TL 6.1 7.7 10.8 11.7 15.8
SE 0.14 0.44 0.37 0.56

18
Age-length key for smallmouth bass captured at site 6 on the St. Joseph River in
July 2006.
Age Length
Group # in sample # (age) in subsample 1 2 3 4 5
4.0 3 3(1) 3
4.5 1 1(1) 1
5.0
5.5 2 2(1) 2
6.0 1 1(1) 1
6.5 4 4(1) 4
7.0 2 2(1) 2
7.5
8.0
8.5
9.0
9.5
10.0 1 1(3) 1
10.5 1 1(3) 1
11.0 2 2(4) 2
11.5 3 3(3) 3
12.0 1 1(4) 1
12.5 2 1(3), 1(4) 1 1
13.0 1
13.5
14.0
14.5
15.0
15.5
16.0
16.5
17.0
17.5 1 1(5) 1
Mean TL 5.9 11.5 11.9 17.8
SE 0.32 0.36 0.38
19
Age-length key for smallmouth bass captured at site 11 on the St. Joseph River in
July 2006.
Age Length
Group # in sample # (age) in subsample 1 2 3 4 5
4.0 6 4(1) 6
4.5 15 5(1) 15
5.0 16 5(1) 16
5.5 16 5(1) 16
6.0 10 4(1) 10
6.5 8 5(1) 8
7.0 5 5(1) 5
7.5 1 1(2) 1
8.0
8.5 3 3(2) 3
9.0 2 1(2), 1(3) 1 1
9.5
10.0
10.5 1 1(3) 1
11.0 1 1(3) 1
11.5 3 1(2), 1(3), 1(4) 1 1 1
12.0 1 1(3) 1
12.5
13.0
13.5
14.0
14.5
15.0
15.5
16.0
16.5
17.0
17.5 1 1(5) 1
Mean TL 5.6 9.2 11.1 11.8 17.8
SE 0.10 0.55 0.51

20
Appendix 3 Age-length keys and mean lengths-at-age for rock bass.
21
Age-length key for rock bass captured at sites 1,2, and 3 on the St. Joseph River in
July(sites 1and 2) and August (site 3) 2006.
Age Length
Group # in sample # (age) in subsample 1 2 3 4 5
2.0 1
2.5 7 4(1) 7
3.0 6 5(1) 6
3.5 3 3(1) 3
4.0 1 1(1) 1
4.5 3 1(1), 2(2) 1 2
5.0 5 4(2) 5
5.5 5 3(3) 5
6.0 10 6(3) 10
6.5 5 4(3) 5
7.0 3 2(3), 1(4) 2 1
7.5 5 5(4) 5
8.0 2 2(5) 2
Mean TL 3.3 5.1 6.3 7.7 8.3
SE 0.14 0.09 0.10 0.08 0.00
Age-length key for rock bass captured at sites 4 and 5 on the St. Joseph River in July
2006.
Age
Length Group # in sample # (age) in subsample 1 2 3 4
2.5 2
3.0 6 5(1) 6
3.5 6 3(1) 6
4.0 4 1(2) 4
4.5 1 1(2) 1
5.0* 5 2(2),2(3) 3 3
5.5 11 2(2), 3(3) 4 7
6.0 17 5(3) 17
6.5 13 5(3) 13
7.0 13 4(3) 13
7.5* 5 2(3), 2(4) 3 3
8.0 3 2(4) 3
Mean TL 3.5 5.1 6.6 8.0
SE 0.08 0.19 0.08 0.12
* Due to an odd numbered sample size, there is actually 2.5 fish represented for each
age class.

22
Age-length key for rock bass captured at site 6 on the St. Joseph River in
July 2006.
Age Length
Group # in sample # (age) in subsample 1 2 3 4
5.5 2 2(3) 2
6.0 1 1(3) 1
6.5 5 4(3) 5
7.0 9 3(2), 2(4) 5 4
7.5 2 1(4) 2
8.0
8.5 1 1(4) 1
Mean TL 6.8 7.6
SE 0.15 0.22
Age-length key for rock bass captured at site 11 on the St. Joseph River in
July 2006.
Age Length
Group # in sample # (age) in subsample 1 2 3 4
3.5 1 1(2) 1
4.0 10 4(2) 10
4.5 12 3(2), 2(3) 7 5
5.0 2 1(2), 1(3) 1 1
5.5 1 1(3) 1
6.0 3 1(3) 3
6.5 5 3(3), 2(4) 3 2
7.0 8 4(3), 1(4) 6 2
7.5 2 2(4) 2
8.0 3 3(4) 3
Mean TL 4.5 6.2 7.6
SE 0.08 0.23 0.21

23
Appendix 4 Age-length keys and mean lengths-at-age for largemouth bass and walleye.
24
Age-length key for largemouth bass captured at sites 1-6 and 11 on the St. Joseph River in
2006.
Age Length
Group # in sample # (age) in subsample 1 2 3 4 5 6
4.0 1 1(1) 1
4.5
5.0 2 1(1), 1(2) 1 1
5.5 2 2(1) 2
6.0 4 2(1) 4
6.5
7.0* 5 2(1), 2(2) 3 3
7.5 2 2(2) 2
8.0 2 1(1), 1(2) 1 1
8.5
9.0
9.5
10.0
10.5
11.0
11.5 1 1(3) 1
12.0
12.5
13.0
13.5 3 1(3), 2(4) 1 2
14.0 1 1(5) 1
14.5 1 1(4) 1
15.0 1 1(5) 1
15.5 1 1(5) 1
16.0 1 1(5) 1
16.5 1 1(6) 1
Mean TL 6.3 7.3 12.8 14.1 15.4 16.8
SE 0.31 0.39 1.00 0.33 0.43
* Due to an odd numbered sample size, there is actually 2.5 fish represented for each age
class.

25
Age-length key for walleye captured at sites 1-6 and 11 on the St. Joseph River in
2006.
Age Length
Group # in sample # (age) in subsample 1 2 3 4 5
10.5 2 2(1) 2
11.0 1 1(1) 1
11.5 1 1(1) 1
12.0
12.5
13.0
13.5
14.0
14.5 2 2(2) 2
15.0 1 1(2) 1
15.5 4 4(2) 4
16.0 1 1(2) 1
16.5 1 1(3) 1
17.0 1 1(3) 1
17.5 3 1(3), 2(4) 1 2
18.0 1 1(4) 1
18.5
19.0 1 1(5) 1
19.5
20.0
20.5
21.0
21.5
22.0 1 1(5) 1
22.5
23.0 1 1(5) 1
Mean TL 11.1 15.5 17.3 17.9 21.6
SE 0.24 0.19 0.29 0.17 1.20