st. john’s cma housing market...
TRANSCRIPT

Housing market intelligence you can count on
CANADA MORTGAGE AND HOUSING CORPORATION
St. John’s CMA Housing Market Today
Chris Janes, Senior Market Analyst
September 9th, 2015

CANADA MORTGAGE AND HOUSING CORPORATION - 2
Main drivers of today’s housing market...
Population
Employment
Income

CANADA MORTGAGE AND HOUSING CORPORATION - 3
+1.3% labour force growth
95
100
105
110
115
120
125
130Labour Force, 15-64 yrs, St. John's Area, (000's)
124,500
Source: Statistics Canada Labour Force Survey
CANADA MORTGAGE AND HOUSING CORPORATION - 4
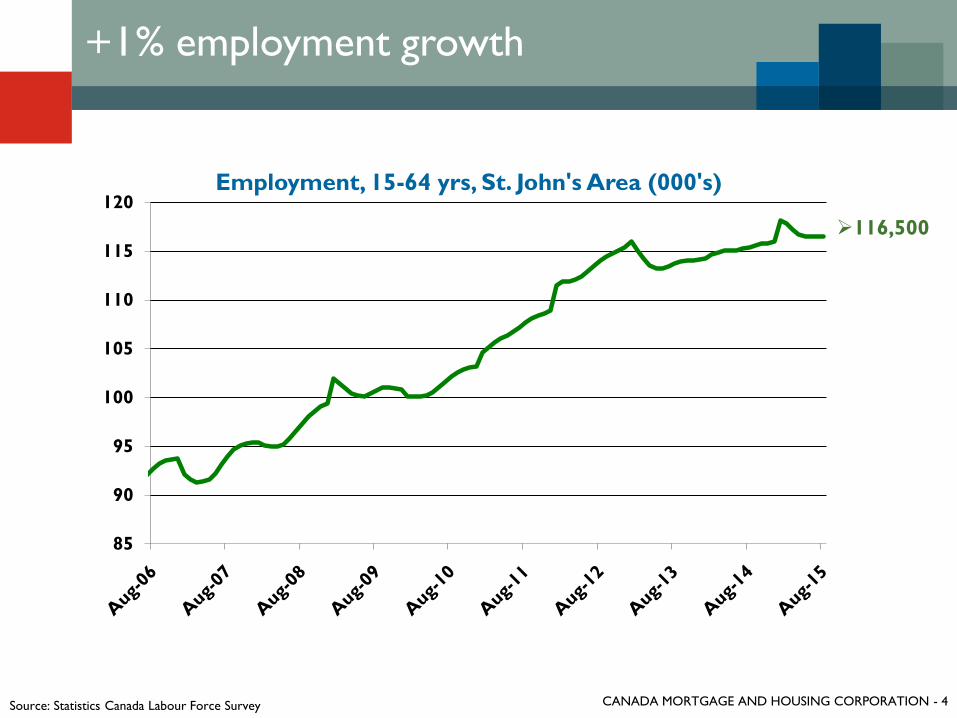
+1% employment growth
85
90
95
100
105
110
115
120Employment, 15-64 yrs, St. John's Area (000's)
116,500
Source: Statistics Canada Labour Force Survey
CANADA MORTGAGE AND HOUSING CORPORATION - 5
5.0%
5.5%
6.0%
6.5%
7.0%
7.5%
8.0%
8.5%
9.0%
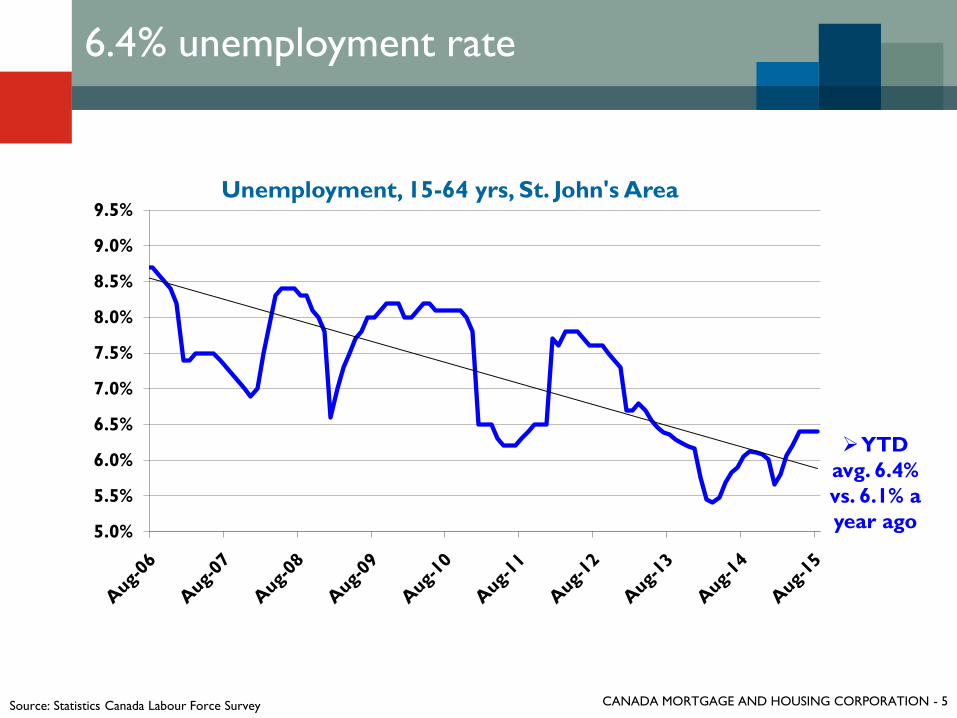
9.5%Unemployment, 15-64 yrs, St. John's Area
YTD
avg. 6.4%
vs. 6.1% a
year ago
6.4% unemployment rate
Source: Statistics Canada Labour Force Survey

CANADA MORTGAGE AND HOUSING CORPORATION - 6
$600
$650
$700
$750
$800
$850
$900
$950
$1,000
$1,050Average Weekly Earnings ($), St. John's CMA
Source: Statistics Canada Labour Force Survey
Weekly earnings -2.7% to $987 vs. $1,014
-2.7%
YTD
First
yr/yr
decline
since
2006

CANADA MORTGAGE AND HOUSING CORPORATION - 7
150
155
160
165
170
175
180
Working age population growth continues
Source: Statistics Canada
CANADA MORTGAGE AND HOUSING CORPORATION - 8
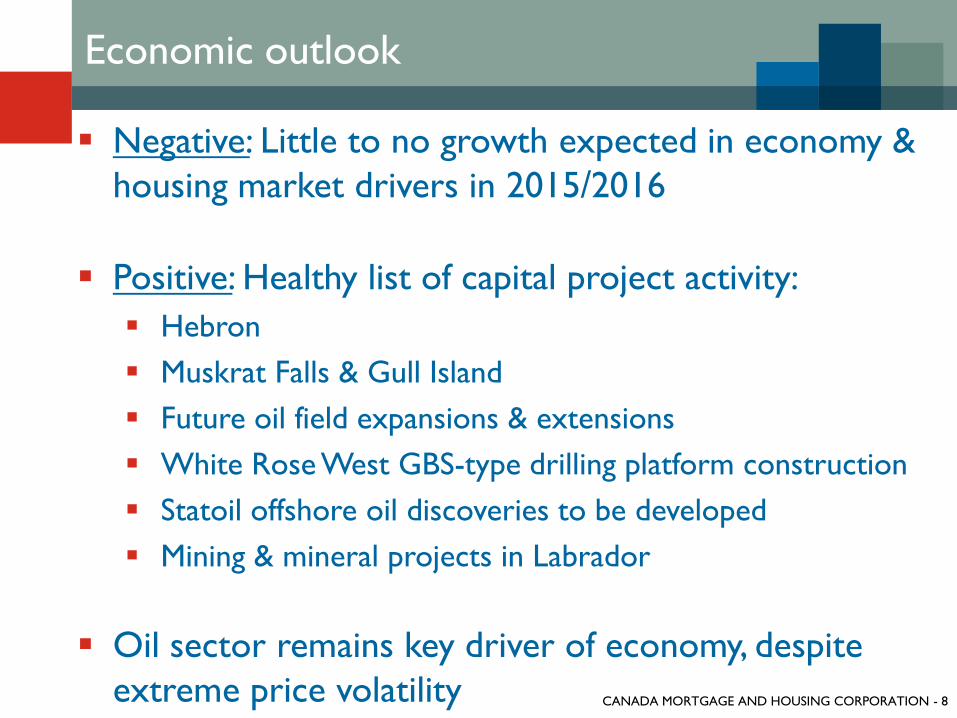
Negative: Little to no growth expected in economy &
housing market drivers in 2015/2016
Positive: Healthy list of capital project activity:
Hebron
Muskrat Falls & Gull Island
Future oil field expansions & extensions
White Rose West GBS-type drilling platform construction
Statoil offshore oil discoveries to be developed
Mining & mineral projects in Labrador
Oil sector remains key driver of economy, despite
extreme price volatility
Economic outlook

CANADA MORTGAGE AND HOUSING CORPORATION - 9

CANADA MORTGAGE AND HOUSING CORPORATION - 10
Are housing starts really this bad?
CANADA MORTGAGE AND HOUSING CORPORATION - 11
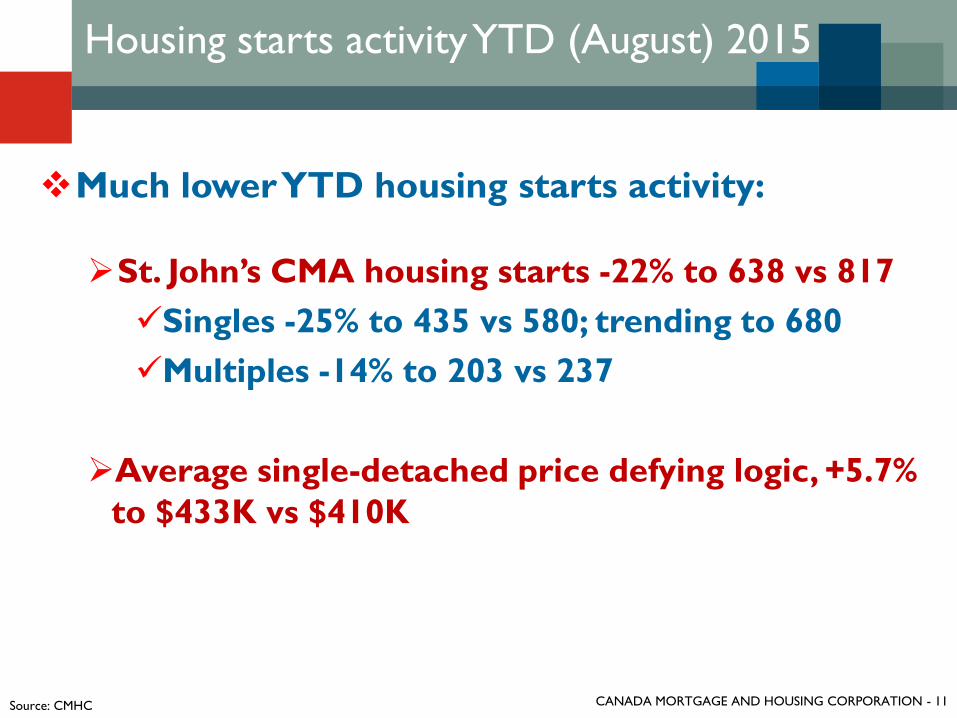
Much lower YTD housing starts activity:
St. John’s CMA housing starts -22% to 638 vs 817
Singles -25% to 435 vs 580; trending to 680
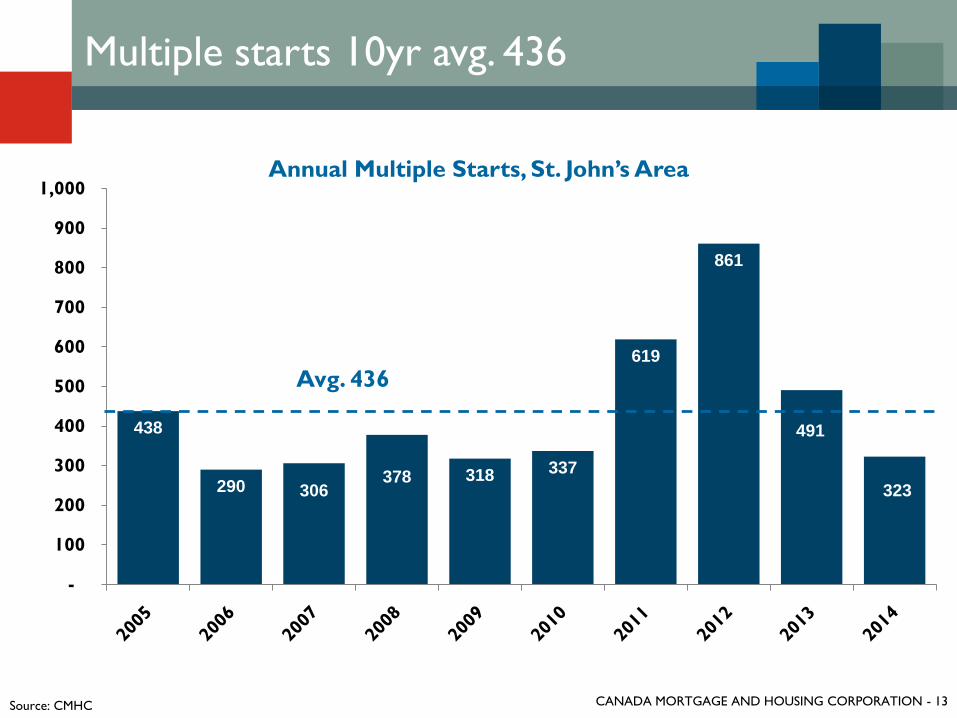
Multiples -14% to 203 vs 237
Average single-detached price defying logic, +5.7%
to $433K vs $410K
Housing starts activity YTD (August) 2015
Source: CMHC

CANADA MORTGAGE AND HOUSING CORPORATION - 12
1,096
985
1,174
1,485
1,382
1,479
1,304 1,292 1,243
907
-
200
400
600
800
1,000
1,200
1,400
1,600
Single-detached starts 10yr avg. 1,235
Avg. 1,235
Annual Single-Detached Starts, St. John’s Area
Source: CMHC
CANADA MORTGAGE AND HOUSING CORPORATION - 13
438
290 306378 318 337
619
861
491
323
-
100
200
300
400
500
600
700
800
900
1,000
Multiple starts 10yr avg. 436
Annual Multiple Starts, St. John’s Area
Avg. 436
Source: CMHC

CANADA MORTGAGE AND HOUSING CORPORATION - 14
St. John’s CMA total housing starts trend
Source: CMHC

CANADA MORTGAGE AND HOUSING CORPORATION - 15
St. John’s CMA single-detached starts trend
Source: CMHC

CANADA MORTGAGE AND HOUSING CORPORATION - 16
$196,4
37
$202,6
98
$211,1
23
$230,4
73
$281,8
03
$325,4
36
$351,3
05
$38
7,4
39
$395,3
88
$415,4
35
$43
3,2
25
$0
$50,000
$100,000
$150,000
$200,000
$250,000
$300,000
$350,000
$400,000
$450,000
$500,000
Actual new single-detached home prices
Average New Single-Detached House Price, St. John’s Area
Source: CMHC
CANADA MORTGAGE AND HOUSING CORPORATION - 17
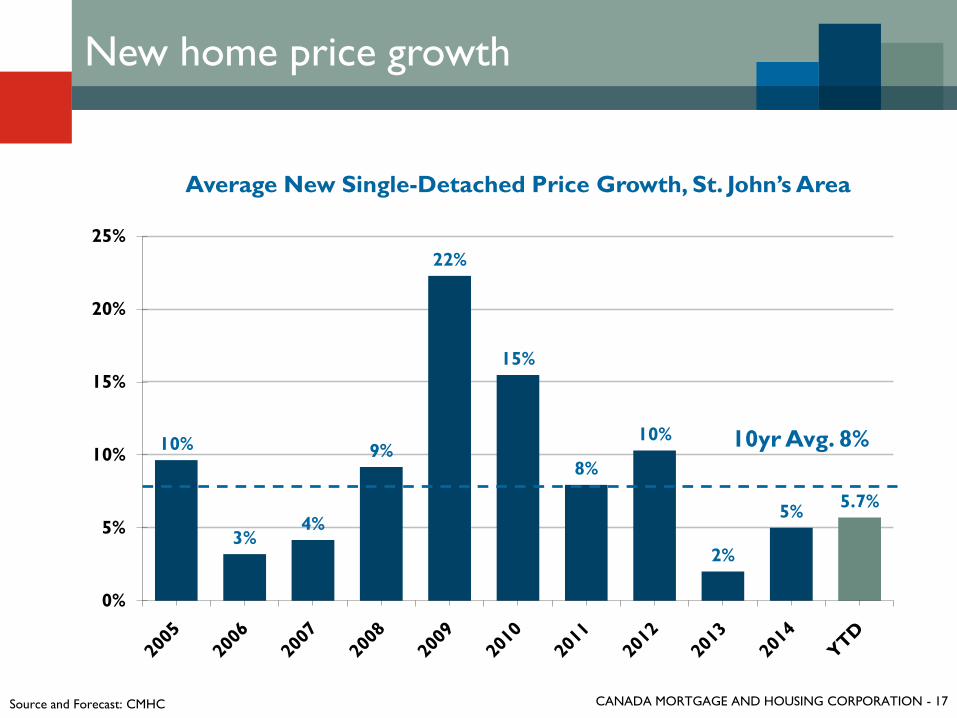
10%
3%4%
9%
22%
15%
8%
10%
2%
5%5.7%
0%
5%
10%
15%
20%
25%
New home price growth
Average New Single-Detached Price Growth, St. John’s Area
Source and Forecast: CMHC
10yr Avg. 8%

CANADA MORTGAGE AND HOUSING CORPORATION - 18Source: CMHC
New home market today summary...
Housing starts driven by demand, not speculation
Single-detached activity inline with demographics
Multiples driven by multi-unit apartment construction
Prices remain high, despite considerable slowdown

CANADA MORTGAGE AND HOUSING CORPORATION - 19
Mixed MLS® activity:
Eastern Region sales +1% to 2,126
Avg. MLS® price -4.2% to $300,440
518 MLS® residential construction listings (-6%); 245
classified as “Exists” (spec homes)
319 single family detached (137 Exist)
99 condo (76 Exist)
58 two apartment (32 Exist)
375 vacant lots
MLS® activity YTD (August)
Source: CMHC; NL Association of REALTORS®
MLS® is a registered trademark of the Canadian Real Estate Association

CANADA MORTGAGE AND HOUSING CORPORATION - 20
2,429 2,1832,291
2,235
2,572
2,3062,102 2,126
-
500
1,000
1,500
2,000
2,500
3,000
MLS® Sales, Eastern Region, Jan - Aug
Source: NL Association of REALTORS®
MLS® is a registered trademark of the Canadian Real Estate Association
Jan to Aug MLS® sales average 2,281
Avg. 2,281

CANADA MORTGAGE AND HOUSING CORPORATION - 21
Existing average MLS® price by submarket
Source: NL Association of REALTORS®
MLS® is a registered trademark of the Canadian Real Estate Association

CANADA MORTGAGE AND HOUSING CORPORATION - 22
New average MLS® price by submarket
Source: NL Association of REALTORS®
MLS® is a registered trademark of the Canadian Real Estate Association
New/Existing Price
Differential:
St. John’s City: $129,604
East Extern: $93,593
Mt. Pearl: $81,819
Paradise: $32,807
CBS: -$7,125
Bay Bulls: $33,615

CANADA MORTGAGE AND HOUSING CORPORATION - 23
16.7%14.8%
6.9% 6.3%5.5%
1.7% -4.2%
-10%
-5%
0%
5%
10%
15%
20%
Average MLS® price growth
Eastern Region
9% average annual
growth ‘08 – ‘14
Growth slowing:
YTD: $300,440
-4.2%
Source: NL Association of REALTORS®; Forecast: CMHC
MLS® is a registered trademark of the Canadian Real Estate Association
Avg. 9%

CANADA MORTGAGE AND HOUSING CORPORATION - 24
0
500
1,000
1,500
2,000
2,500
3,000
Monthly active listings averaging 2,600, up 9%
MLS® Active Listings, Eastern Region
Source: NL Association of REALTORS®
MLS® is a registered trademark of the Canadian Real Estate Association

CANADA MORTGAGE AND HOUSING CORPORATION - 25
Current MLS® market conditions
Buyers’ Market:
Avg. MLS® price holding steady around $300K
Unit sales flat year/year (+1%)
Housing supply exceeds demand (10 months of supply)
Days on market averaging 70 days
Sale-to-list price ratio of 97% (average accepted offers)
Sale-to-active list ratio of 10% (1 in 10 listings have sold)Source: NL Association of REALTORS®
MLS® is a registered trademark of the Canadian Real Estate Association

CANADA MORTGAGE AND HOUSING CORPORATION - 26
St. John’s area MLS® market today...
Sales remain steady despite weaker economy
Average prices down, but holding steady since Q2
Buyers’ resale market classification
Low mortgage rates have supported market prices
Source: NL Association of REALTORS®
MLS® is a registered trademark of the Canadian Real Estate Association

CANADA MORTGAGE AND HOUSING CORPORATION - 27
Fewer single-detached starts due to weak demand, high
prices and weak economic growth
Growth opportunities for new homes in suburban areas
targeted at first-time buyers
No-to-little growth expected in sales & prices in
2015/2016
Housing market final insight...

CANADA MORTGAGE AND HOUSING CORPORATION - 28
Housing market final insight...
Multi-unit construction driven by demand for condo quality
rentals, with no material change in vacancy rate
Growth opportunities for well-priced new apartments &
condos in established neighbourhoods
Volatile commodity prices, especially oil, have created
additional downside risk to the current housing forecast

CANADA MORTGAGE AND HOUSING CORPORATION - 29
Thank You!
29

CANADA MORTGAGE AND HOUSING CORPORATION - 30
Contact Information
Chris Janes
Senior Market Analyst
CMHC
709-772-2403
CANADA MORTGAGE AND HOUSING CORPORATION