ssoocciiaall ddiiaaggnnoossiiss 22000077 - …©the council for social monitoring ssoocciiaall...
TRANSCRIPT
© The Council for Social Monitoring
SSOOCCIIAALL DDIIAAGGNNOOSSIISS 22000077
OBJECTIVE AND SUBJECTIVE QUALITY OF LIFE IN POLAND
edited by
Janusz Czapiński &
Tomasz Panek
APPENDIX 2
Frequency and mean value distribution of answers to questions in the individual
questionnaire (part II) in a weighted sample
Only for items concerning computer and Internet the data are based on the whole sample of respondents (16+ years
old). For the rest of questions the data are based on the subsample of respondents aged 18+.
Council for Social Monitoring

Social Diagnosis 2007 Appendix 2 2
© The Council for Social Monitoring
Primary management of the research project THE COUNCIL FOR SOCIAL MONITORING:
Dominik Batorski, Ph.D., Tertiary of Warsaw
Janusz Czapiński, Ph. D., professor, Tertiary of Warsaw & the Tertiary of Finance and Management (chairman)
Janusz Grzelak, Ph. D., professor, Tertiary of Warsaw
Teresa Kamińska, M. Sc., PRO PUBLICO BONO Institute
Irena E. Kotowska, Ph. D., professor, Warsaw School of Economics
Wiesław Łagodziński, M.Sc., Central Statistical Office (secretary)
Tomasz Panek, Ph. D., professor, Warsaw School of Economics (vice-chairman)
Antoni Sułek, Ph. D., professor, Tertiary of Warsaw
Tadeusz Szumlicz, Ph. D., professor, Warsaw School of Economics SGH
Katarzyna Tymowska, Ph. D., Tertiary of Warsaw
Authors of the report: Dominik Batorski
Magda Bober
Janusz Czapiński
Izabela Grabowska
Janusz Grzelak
Irena E. Kotowska
Tomasz Panek
Paweł Strzelecki
Antoni Sułek
Tadeusz Szumlicz
Katarzyna Tymowska
Dorota Węziak
Principal sponsors of the project
Ministry of Labor and Social Policy Commercial Union Poland
Other sponsors Prokom Software SA
Telekomunikacja Polska SA
Media patronage
Tygodnik
Research conducted by: The Polish Statistical Association
Organizational and financial management of research: Office for Statistical Analyses and Research of the Polish Statistical
Association and the Tertiary of Finance and Management in Warsaw
Interviewers: Central Statistical Office
Devising of result tables (appendices 1, 2, 3 and 4 ): Tomasz Jerzyński, Janusz Czapiński and Elżbieta Panek
Copyright © 2007 by The Council for Social Monitoring
The Social Diagnosis research project, although it is mainly financed through private means, is of a public character. All
those who are interested may download all tables with the frequency distribution of responses* and the database containing
the accumulated data from four waves (in the years 2000, 2003, 2005 and 2007) free of charge from the website
www.diagnoza.com.
* In all sets of tables with frequency distribution of responses, the order of variables from the questionnaires has been maintained.

Social Diagnosis 2007 Appendix 2 3
© The Council for Social Monitoring
List of tables
Table P2_1. The most important prerequisites for happy, successful life (it was possible to indicate up to three choices) . 7 Table P2_2. The most important prerequisites for happy, successful life (it was possible to indicate up to three choices) . 8 Table P2_3. The most important prerequisites for happy, successful life (it was possible to indicate up to three choices) . 9 Table P3. How do you feel about your life so far as a whole? ........................................................................................... 10 Table P4 When was your life easier – before year 1989 or at present? .............................................................................. 11 Table P5 The expectations of your wife toward you were so great you were unable to meet them ................................... 12 Table P6. Your wife was too extravagant in spending money that were your common property...................................... 13 Table P 7. The problems of your wife added to your troubles and made your life difficult ............................................... 14 Table P 8. You had doubts about your children being hard-working and tough enough to cope in life ............................. 15 Table P9. You had to listen to complaints about your children (at school, from neighbors, from other parents) ............... 16 Table P10. You had to bear some expenses because of something that your children did ................................................. 17 Table P11. Your children disregarded and rejected your help, advice and guidance ......................................................... 18 Table P12. You felt that you were losing influence on your children ................................................................................ 19 Table P13. You did not have enough time for your child ................................................................................................... 20 Table. P14. You felt responsible for caring for and ensuring well-being of your parents or older relatives ...................... 21 Table P15. You were worried about the health or state of mind of one of your parents or older relatives ......................... 22 Table P16 Problems and worries of your parents, parents-in-law or other older relatives added to your troubles and made
your life difficult ................................................................................................................................................ 23 Table P17. You felt that your source of income was unstable and uncertain ..................................................................... 24 Table P18. Financial problems added to your troubles and made your life difficult .......................................................... 25 Table P19. You felt that your work was too tiresome, dirty or dangerous ......................................................................... 26 Table P20. You felt you had too many work responsibilities that you were not able to cope with .................................... 27 Table P21. You were treated unjustly by others at work .................................................................................................... 28 Table P22. You had a feeling that the place you live in was overcrowded, for instance, too many people live in your
apartment, neighboring apartments, the whole building .................................................................................... 29 Table P23. You were afraid of crime, drug addiction, hooliganism within your district, housing estate, vicinity ............. 30 Table P25. You suffered from a physical indisposition, such as bones aching, shortness of breath, which made it difficult to
walk out, climb the stairs etc.............................................................................................................................. 32 Table P26. Health problems made it difficult for you to perform everyday tasks or participate in other activities ........... 33 Table P27. You had to deal with some formal matters ....................................................................................................... 34 Table P28. You were not able to deal with a formal matter efficiently, quickly and easily ............................................... 35 Table P29. You had to search for friends or other ways in order to deal with a formal matter .......................................... 36 Table P30. You felt completely helpless and humiliated when dealing with a formal matter ............................................ 37 Table P31. Does the place where you lived when being 14 ................................................................................................ 38 Table P32 Did you vote in the last self-government election in 2006? .............................................................................. 39 Table P33. Do you use a mobile phone?............................................................................................................................. 40 Table P34. You began a better paid or additional job ......................................................................................................... 41 Table P35. You invested money in production, trade or services ....................................................................................... 42 Table P36. You earned money on shares, bonds or participation units in a fund ............................................................... 43 Table P37. You obtained new qualifications or skills with an aim of getting better payments .......................................... 44 Table P38. How do you assess the material level of your present life: ............................................................................... 45 Table P39. Taking everything into account, how would you assess your life – can you say that you are: ......................... 46 Table P 40. During the last year did you take advantage of services rendered by health units: ......................................... 47 Table P 41. How often during the last few months you felt so depressed that you thought about suicide?........................ 48 Table P 42. Do you feel loved and trusted? ........................................................................................................................ 49 Table P43. How often during a month do you participate in masses or other religious meetings? .................................... 50 Table P44_1. How many people would you call your friends? .......................................................................................... 51 Table P44_2. How many people would you call your friends? .......................................................................................... 52 Table P45. How strong is your willingness to live these days? .......................................................................................... 53 Table P45. How strong is your willingness to live these days? .......................................................................................... 54 Table P 46_1. Please specify, how you usually react to troubles and difficult situations in your life? .............................. 55 Table P 46_2. Please specify, how you usually react to troubles and difficult situations in your life? .............................. 56 Table P 47. Do you feel lonely although you don’t want to? ............................................................................................. 57 Table P 48. What was your FATHER’s education (or main guardian) when you were 14? .............................................. 58 Table P49n. Scale of symptoms of psychological depression – N...................................................................................... 59 Table P49o. Scale of symptoms of psychological depression – O...................................................................................... 60 Table P49p. Scale of symptoms of psychological depression – P ...................................................................................... 61 Table P49q. Scale of symptoms of psychological depression – Q...................................................................................... 62 Table P49r. Scale of symptoms of psychological depression – R ..................................................................................... 63 Table P49t. Scale of symptoms of psychological depression – T ...................................................................................... 64 Table P49t. Scale of symptoms of psychological depression – U ..................................................................................... 65 Table P50.1. I admire people who have expensive houses, cars and clothes ...................................................................... 66

Social Diagnosis 2007 Appendix 2 4
© The Council for Social Monitoring
Table P50.2. Success in life is assessed through the possession of various material goods ............................................... 67 Table P50.3. I like to have things which others would envy .............................................................................................. 68 Table P50.4. I like to buy things which are not practicable ................................................................................................ 69 Table P50.5. Shopping itself is a great pleasure to me ....................................................................................................... 70 Table P50.6. I am very energetic ........................................................................................................................................ 71 Table P50.7. I get impatient when waiting to see what the next day brings ....................................................................... 72 Table P50.8. Some people are more worthy than others..................................................................................................... 73 Table P50.9. I would like to look good, be attractive ......................................................................................................... 74 Table P50.10. In an ideal world all nations would be equal ............................................................................................... 75 Table P50.11. I think that material goods are very important ............................................................................................. 76 Table P50.12. I would like to make more friends ............................................................................................................... 77 Table P50.13. Some groups of people do not deserve respect ............................................................................................ 78 Table P50.14. We should strive to make the income of all people quite equal .................................................................. 79 Table P51. In your opinion, were the reforms conducted in Poland after year 1989 successful in general or rather
unsuccessful? ..................................................................................................................................................... 80 Table P52. Have you engaged within the last two years in activity on behalf of the local community (commune, housing
estate, town)? ..................................................................................................................................................... 81 Table 53.1. Frequency of psychosomatic symptoms within the last month – strong headaches ........................................ 82 Table 53.2. Frequency of psychosomatic symptoms within the last month – stomach pains or flatulence ........................ 83 Table 53.3. Frequency of psychosomatic symptoms within the last month – pain or tension of neck or arm muscles ...... 84 Table 53.4. Frequency of psychosomatic symptoms within the last month – chest or heart pains ..................................... 85 Table 53.5. Frequency of psychosomatic symptoms within the last month – dry mouth or throat ..................................... 86 Table 53.6. Frequency of psychosomatic symptoms within the last month – sweating ..................................................... 87 Table 53.7. Frequency of psychosomatic symptoms within the last month – shortness of breath ...................................... 88 Table 53.8. Frequency of psychosomatic symptoms within the last month – aching and pains all over the body ............. 89 Table 53.9. Frequency of psychosomatic symptoms within the last month – accelerated heartbeat (palpitation) .............. 90 Table 53.10. Frequency of psychosomatic symptoms within the last month – shivers or convulsions .............................. 91 Table 53.11. Frequency of psychosomatic symptoms within the last month – pressure on the bladder and more frequent
urinating ............................................................................................................................................................. 92 Table 53.12. Frequency of psychosomatic symptoms within the last month – feeling tiredness not associated with work 93 Table 53.13. Frequency of psychosomatic symptoms within the last month – constipation .............................................. 94 Table 53.14. Frequency of psychosomatic symptoms within the last month – nosebleeds ................................................ 95 Table 53.15. Frequency of psychosomatic symptoms within the last month – sudden changes of blood pressure ............ 96 Table P 54. Did the changes that took place in Poland after year 1989 have any influence upon your life? ...................... 97 Table P 55. - if YES, then, in general, was that influence positive or negative? ................................................................ 98 Table P 56. Do you smoke cigarettes? ................................................................................................................................ 99 Table P 57_1. - if YES, how many cigarettes per day do you smoke? ............................................................................. 100 Table P 57_2. - if YES, how many cigarettes per day do you smoke? ............................................................................. 101 Table P58. - if NO, have you ever smoked cigarettes in your life? .................................................................................. 102 Table P59. In general, was the previous year a good one in your life? ............................................................................ 103 Table P60. Who or what was the cause that the previous year was a good one or a bad one in your life? ....................... 104 Table 61.1. To what extent are you satisfied with your relations with close family members ......................................... 105 Table 61.2. To what extent are you satisfied with the financial situation of your family ................................................. 106 Table 61.3. To what extent are you satisfied with your relations with colleagues (a group of friends)............................ 107 Table 61.4. To what extent are you satisfied with the present income of your family ..................................................... 108 Table 61.5. To what extent are you satisfied with your ability to fulfill food needs ........................................................ 109 Table 61.6. To what extent are you satisfied with your health ......................................................................................... 110 Table 61.7. To what extent are you satisfied with what you are accomplishing in life .................................................... 111 Table 61.8. To what extent are you satisfied with situation in the country....................................................................... 112 Table 61.9. To what extent are you satisfied with housing conditions ............................................................................. 113 Table 61.10. To what extent are you satisfied with your place of residence .................................................................... 114 Table 61.11. To what extent are you satisfied with goods and services you can get ........................................................ 115 Table 61.12. To what extent are you satisfied with what the future seems to hold for you .............................................. 116 Table 61.13. To what extent are you satisfied with your sex life ..................................................................................... 117 Table 61.14. To what extent are you satisfied with education .......................................................................................... 118 Table 61.15. To what extent are you satisfied with your ways of spending leisure time .................................................. 119 Table 61.16. To what extent are you satisfied with moral standards in you community .................................................. 120 Table 61.17. To what extent are you satisfied with your work ......................................................................................... 121 Table 61.18. To what extent are you satisfied with children ............................................................................................ 122 Table 61.19. To what extent are you satisfied with marriage ........................................................................................... 123 Table 61.20. To what extent are you satisfied with safety in the place of residence ........................................................ 124 Table 61.21. To what extent are you satisfied with health care near your place of residence .......................................... 125 Table 61.22. To what extent are you satisfied with your participation in culture ............................................................. 126 Table P 62. Did you attend a public meeting last year (but not at work)? ........................................................................ 127
Social Diagnosis 2007 Appendix 2 5
© The Council for Social Monitoring
Table P 63. - if yes, did you participate in a discussion during the meeting? ................................................................... 128 Table P 64. Did you participate in preparing or conducting a meeting last year (not at work)? ....................................... 129 Table P 65. Generally speaking, would you say that most people can be trusted or that you can't be too careful in dealing
with people? ..................................................................................................................................................... 130 Table 66.1. How much good was done to you by other people in your whole life? ......................................................... 131 Table 66.2. How much evil was done to you by other people in your whole life? ........................................................... 132 Table 66.3. How much you did good to other people in your whole life? ........................................................................ 133 Table 66.4. How much you did evil to other people in your whole life? .......................................................................... 134 Table P67. Do you use a computer at work, at home or any other place at least from time to time? ............................... 135 Table P68. Are you a member of any organizations, associations, parties, councils, unions, committees or religious groups?
......................................................................................................................................................................... 136 Table P69. - if YES, then have you ever performed a function in any of these organizations? ........................................ 137 Table P70.1. Someone pays lower taxes than he/she owes ............................................................................................... 138 Table P70.2. Someone avoids paying for public transport (buses, trains) ........................................................................ 139 Table P70.3. Someone does not pay for electricity ........................................................................................................... 140 Table P70.4. Someone wrongly obtains unemployment benefit ....................................................................................... 141 Table P70.5. Someone does not pay rent for his/her flat (although it’s possible) ............................................................. 142 Table P70.6. someone imports goods from abroad and does not pay the customs fees .................................................... 143 Table P71. Which of these statements regarding democracy do you find the most convincing? ..................................... 144 Table P72. Your own (personal) average monthly net income for the last three months amounted to (in PLN) ............. 145 Table P73. What average monthly net income do you expect to get in two years? (in PLN) ........................................... 146 Table P74. How much time did you spend watching TV per day last week (on average)? .............................................. 147 Table P75-78 In the previous year: ................................................................................................................................... 148 Table P79-82 In the previous year: ................................................................................................................................... 149 Table P83-86 In the previous year: ................................................................................................................................... 150 Table P87-90 In the previous year: ................................................................................................................................... 151 Table P91-94 In the previous year: ................................................................................................................................... 152 Table P95-98 In the previous year: ................................................................................................................................... 153 Table P99 Did you sign any collective letter, petition, protest etc. (for example to local or general authorities, management
of the work place, labor union, newspaper, TV…) last year? .......................................................................... 154 Table P100. In the years 2000-2007 have you been unemployed for some time? ............................................................ 155 Table P101_1 - if YES, what was the main reason for being unemployed? ..................................................................... 156 Table P101_2 - if YES, what was the main reason for being unemployed? ..................................................................... 157 Table P102. In the next two years are you planning to go abroad to work? ..................................................................... 158 Table P102_n1_1 To a country in the EU ........................................................................................................................ 159 Table P102_n1_2 To a country in the EU ........................................................................................................................ 160 Table P102_n1_3 To a country in the EU and other ......................................................................................................... 161 Table P106_1. In your opinion, what of the following is the most important at work? .................................................... 162 Table P106_2. In your opinion, what of the following is the most important at work? .................................................... 163 Table P107.1. In your opinion, what solutions would facilitate combining work and private life, including looking after
children? 1: proper work organization (for example part time, shift work, flexible work time, working at home,
more free days during the week) ...................................................................................................................... 164 Table P107.2. In your opinion, what solutions would facilitate combining work and private life, including looking after
children? 2: longer paid leave (for example maternity, custody etc.) .............................................................. 165 Table P107.3. In your opinion, what solutions would facilitate combining work and private life, including looking after
children? 3: higher benefits (for example child benefit) .................................................................................. 166 Table P107.4. In your opinion, what solutions would facilitate combining work and private life, including looking after
children? 4: l better possibilities of child custody outside home (more nursery schools, adaptation of nurseries
work time to the work time of the parents, more activities in schools etc.) ..................................................... 167 Table P108.1. Do you trust banks? ................................................................................................................................... 168 Table P108.2. Do you trust life insurance associations? ................................................................................................... 169 Table P108.3. Do you trust property insurance associations? .......................................................................................... 170 Table P108.4. Do you trust investment funds? ................................................................................................................. 171 Table P108.5. Do you trust pension funds? ...................................................................................................................... 172 Table P108.6. Do you trust the stock exchange? .............................................................................................................. 173 Table P108.7. Do you trust Social Insurance Institution (ZUS) ....................................................................................... 174 Table P 109_1. What type of work did you mainly perform in 2000-2007? .................................................................... 175 Table P 109_2. What type of work did you mainly perform in 2000-2007? .................................................................... 176 Table P 109_3. What type of work did you mainly perform in 2000-2007? .................................................................... 177 Table P110. Did the work you performed in 2000-2007 enable you to use your qualifications? ..................................... 178 Table P111. How many times did you change your position in the work place between 2000-2007? ............................. 179 Table P112. How many times were you promoted between 2000-2007? ......................................................................... 180 Table P113. Were you moved to a lower position at work between 2000-2007? ............................................................. 181 Table P114. How long does it take you to travel from home to work? ............................................................................ 182

Social Diagnosis 2007 Appendix 2 6
© The Council for Social Monitoring
Table P115. What is the distance from your home to your work? .................................................................................... 183 Table P116. Do you take advantage of any group insurance provided by the employer? ................................................ 184 Table P117. Are the following things possible at your work? .......................................................................................... 185 Table P118. On what conditions would you be willing to work abroad? ......................................................................... 186 Table P119. Do you participate in any additional pension insurance? ............................................................................. 187 Table P120. - if YES, which one? .................................................................................................................................... 188 Table P121. - if NO, are you going to participate in any additional pension insurance? .................................................. 189 Table P122. Does your participation depend on any of the following conditions? .......................................................... 190 Table P 123. How many times did you change your job between 2000-2007? ................................................................ 191 Table P 123_2. How many times did you change your job between 2000-2007? ............................................................ 192 Table P124. Why did you change your job in these years (2000-2007)? ......................................................................... 193 Table P125. Was the change of job combined with a change of the learned occupation? ................................................ 194 Table P126. Was the change of job combined with a change of your place of residence? ............................................... 195 Table P127_1. Why you did not work between 2000-2007? ............................................................................................ 196 Table P127_2. Why you did not work between 2000-2007? ............................................................................................ 197 Table P127_3. Why you did not work between 2000-2007? ............................................................................................ 198 Table P128_1. On what conditions would you be willing to work in Poland? ................................................................. 199 Table P128_2. On what conditions would you be willing to work in Poland? ................................................................. 200 Table P129_1. How many hours did you spend using a computer last week? ................................................................. 201 Table P129_2. How many hours did you spend using a computer last week? ................................................................. 202 Table P130. Where do you use a computer? ..................................................................................................................... 203 Table P131_1. Do you perform the following actions while using the computer? ........................................................... 204 Table P131_2. Do you perform the following actions while using the computer? ........................................................... 205 Table P131_3. Do you perform the following actions while using the computer? ........................................................... 206 Table P132. What do you mainly do when using the computer? ...................................................................................... 207 Table P133. When did you start using the Internet? ......................................................................................................... 208 Table P134_1. How many hours did you spend last week using the Internet? ................................................................. 209 Table P134_2. How many hours did you spend last week using the Internet? ................................................................. 210 Table P135k. Who are the people you have ever contacted through Internet? ................................................................. 211 Table P135o. Who are the people you contacted through Internet last week? ................................................................. 212 Table P 136. Have you ever personally met people you got acquainted with through the Internet? ................................ 213 Table P137k_1. While using the Internet have you ever performed the following activities? ......................................... 214 Table P137k_2. While using the Internet have you ever performed the following activities? ......................................... 215 Table P137k_3. While using the Internet have you ever performed the following activities? ......................................... 216 Table P137k_4. While using the Internet have you ever performed the following activities? ......................................... 217 Table P137k_5. While using the Internet have you ever performed the following activities? ......................................... 218 Table P137o_1. While using the Internet last week did you perform the following activities? ....................................... 219 Table P137o_2. While using the Internet last week did you perform the following activities? ....................................... 220 Table P137o_3. While using the Internet last week did you perform the following activities? ....................................... 221 Table P137o_4. While using the Internet last week did you perform the following activities? ....................................... 222 Table P137o_5. While using the Internet last week did you perform the following activities? ....................................... 223 Table P137. Please specify how many times on average you made a call or sent an SMS/MMS from your mobile phone to
other people during one day last week? ........................................................................................................... 224 Table 139.1. How many times during the last week did you make a call or send an SMS/MMS from your mobile phone to:
family members ............................................................................................................................................... 225 Table 139.2. How many times during the last week did you make a call or send an SMS/MMS from your mobile phone to:
your colleagues ................................................................................................................................................ 226 Table 139.3. How many times during the last week did you make a call or send an SMS/MMS from your mobile phone to:
friends .............................................................................................................................................................. 227 Table 139.5. How many times during the last week did you make a call or send an SMS/MMS from your mobile phone to:
other people ..................................................................................................................................................... 228

Social Diagnosis 2007 Appendix 2 7
© The Council for Social Monitoring
Table P2_1. The most important prerequisites for happy, successful life (it was possible to indicate up to three
choices)
Social-demografic group Money Children
Successful
marriage Work Friends
Total 30,71 45,93 55,78 30,22 8,58
Gender
Men 37,63 38,02 55,08 35,81 8,96
Women 24,98 52,47 56,35 25,60 8,27
Age
up to 24 years old 40,75 16,78 41,86 38,90 22,61
25-34 years old 33,25 45,88 60,91 36,21 10,95
35-44 years old 28,05 56,90 63,72 33,94 5,70
45-59 years old 29,77 53,06 59,15 31,23 4,07
60-64 years old 27,74 46,51 56,75 20,50 4,22
65+ years old 23,19 50,74 49,19 12,37 4,16
Place of residence
Cities > 500k 24,29 44,63 57,97 27,27 14,02
Towns 200-500k 26,91 43,51 59,98 27,51 10,38
Towns 100-200k 27,49 43,51 57,08 31,33 10,24
Towns 20-100k 31,01 46,65 54,46 30,53 7,73
Towns < 20k 30,61 45,67 57,27 32,63 8,89
Rural areas 34,45 47,32 53,69 30,74 6,34
Voivodship
Dolnośląskie 29,37 43,13 59,00 32,63 6,83
Kujawsko-pomorskie 30,24 46,54 54,88 31,21 9,51
Lubelskie 31,07 44,46 55,28 27,30 6,59
Lubuskie 31,81 44,58 56,68 29,65 9,11
Łódzkie 32,29 51,79 54,14 29,02 7,26
Małopolskie 29,08 44,78 55,91 29,69 8,93
Mazowieckie 29,77 49,94 58,09 27,83 9,07
Opolskie 26,51 39,66 58,99 29,77 7,41
Podkarpackie 26,17 44,47 52,58 29,04 8,21
Podlaskie 29,81 46,42 57,68 30,36 6,27
Pomorskie 26,12 42,00 59,25 30,78 10,67
Śląskie 33,17 43,96 55,59 29,54 8,24
Świętokrzyskie 31,48 46,12 52,32 27,83 7,57
Warmińsko-mazurskie 31,07 46,18 46,29 33,20 12,74
Wielkopolskie 30,95 46,50 57,40 32,60 9,67
Zachodniopomorskie 41,75 48,58 50,69 36,20 8,95
Education
Primary and below 33,60 50,99 45,56 21,05 3,67
Vocational 37,05 44,61 53,99 35,49 9,10
Secondary 29,39 44,73 59,05 31,37 9,41
Tertiary/post-secondary 20,14 45,32 62,70 28,45 10,94
Income per capita
First quartile 38,22 48,61 48,66 38,21 7,61
Middle 50% 32,25 45,93 55,11 29,37 7,61
Fourth quartile 23,61 44,26 60,68 26,75 10,77
Social-professional status
Public sector employees 22,91 51,25 63,66 36,34 7,30
Private sector employees 34,64 44,00 59,32 41,79 8,92
Self-employed 30,33 50,11 66,32 33,23 9,81
Farmers 33,90 57,97 63,39 23,82 3,04
Disability pensioners 31,11 45,65 43,66 19,12 7,72
Retirees 24,59 50,69 53,53 15,22 3,89
Students 36,51 13,54 37,71 32,73 26,28
Unemployed 39,04 46,42 49,11 41,55 7,81
Other professionally inactive 34,15 54,95 64,46 24,33 7,49
Social Diagnosis 2007 Appendix 2 8
© The Council for Social Monitoring
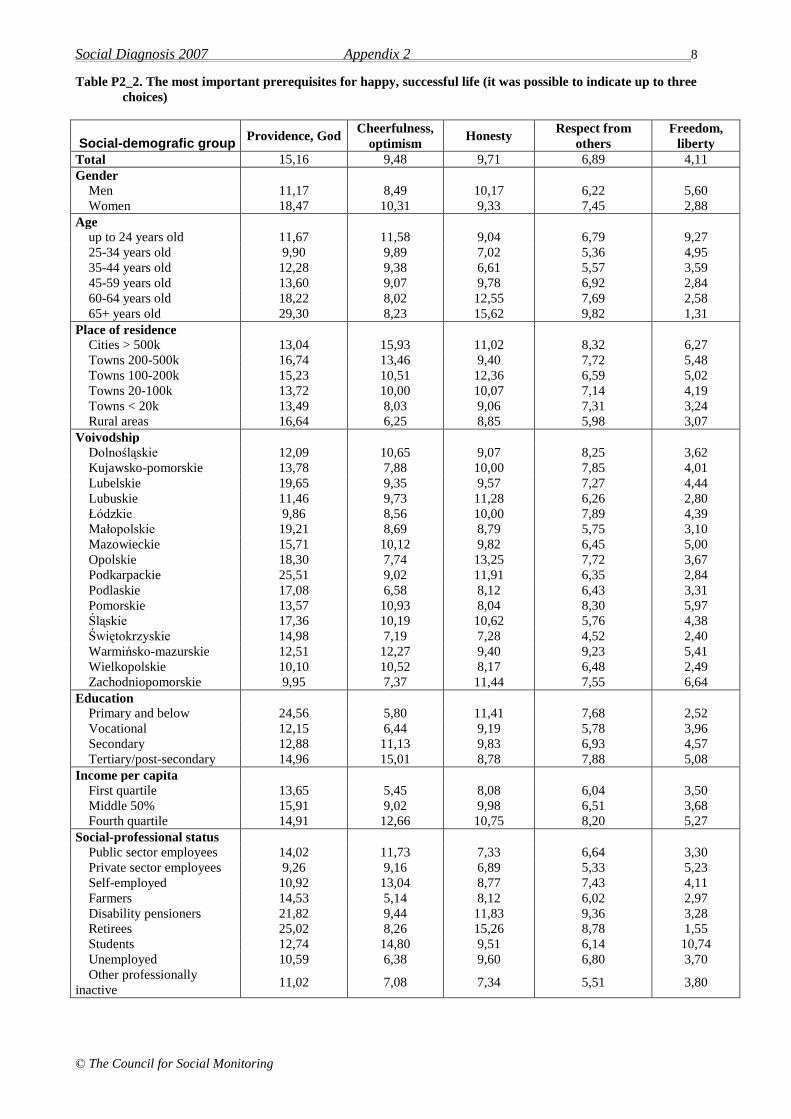
Table P2_2. The most important prerequisites for happy, successful life (it was possible to indicate up to three
choices)
Social-demografic group Providence, God
Cheerfulness,
optimism Honesty
Respect from
others
Freedom,
liberty
Total 15,16 9,48 9,71 6,89 4,11
Gender
Men 11,17 8,49 10,17 6,22 5,60
Women 18,47 10,31 9,33 7,45 2,88
Age
up to 24 years old 11,67 11,58 9,04 6,79 9,27
25-34 years old 9,90 9,89 7,02 5,36 4,95
35-44 years old 12,28 9,38 6,61 5,57 3,59
45-59 years old 13,60 9,07 9,78 6,92 2,84
60-64 years old 18,22 8,02 12,55 7,69 2,58
65+ years old 29,30 8,23 15,62 9,82 1,31
Place of residence
Cities > 500k 13,04 15,93 11,02 8,32 6,27
Towns 200-500k 16,74 13,46 9,40 7,72 5,48
Towns 100-200k 15,23 10,51 12,36 6,59 5,02
Towns 20-100k 13,72 10,00 10,07 7,14 4,19
Towns < 20k 13,49 8,03 9,06 7,31 3,24
Rural areas 16,64 6,25 8,85 5,98 3,07
Voivodship
Dolnośląskie 12,09 10,65 9,07 8,25 3,62
Kujawsko-pomorskie 13,78 7,88 10,00 7,85 4,01
Lubelskie 19,65 9,35 9,57 7,27 4,44
Lubuskie 11,46 9,73 11,28 6,26 2,80
Łódzkie 9,86 8,56 10,00 7,89 4,39
Małopolskie 19,21 8,69 8,79 5,75 3,10
Mazowieckie 15,71 10,12 9,82 6,45 5,00
Opolskie 18,30 7,74 13,25 7,72 3,67
Podkarpackie 25,51 9,02 11,91 6,35 2,84
Podlaskie 17,08 6,58 8,12 6,43 3,31
Pomorskie 13,57 10,93 8,04 8,30 5,97
Śląskie 17,36 10,19 10,62 5,76 4,38
Świętokrzyskie 14,98 7,19 7,28 4,52 2,40
Warmińsko-mazurskie 12,51 12,27 9,40 9,23 5,41
Wielkopolskie 10,10 10,52 8,17 6,48 2,49
Zachodniopomorskie 9,95 7,37 11,44 7,55 6,64
Education
Primary and below 24,56 5,80 11,41 7,68 2,52
Vocational 12,15 6,44 9,19 5,78 3,96
Secondary 12,88 11,13 9,83 6,93 4,57
Tertiary/post-secondary 14,96 15,01 8,78 7,88 5,08
Income per capita
First quartile 13,65 5,45 8,08 6,04 3,50
Middle 50% 15,91 9,02 9,98 6,51 3,68
Fourth quartile 14,91 12,66 10,75 8,20 5,27
Social-professional status
Public sector employees 14,02 11,73 7,33 6,64 3,30
Private sector employees 9,26 9,16 6,89 5,33 5,23
Self-employed 10,92 13,04 8,77 7,43 4,11
Farmers 14,53 5,14 8,12 6,02 2,97
Disability pensioners 21,82 9,44 11,83 9,36 3,28
Retirees 25,02 8,26 15,26 8,78 1,55
Students 12,74 14,80 9,51 6,14 10,74
Unemployed 10,59 6,38 9,60 6,80 3,70
Other professionally
inactive 11,02 7,08 7,34 5,51 3,80

Social Diagnosis 2007 Appendix 2 9
© The Council for Social Monitoring
Table P2_3. The most important prerequisites for happy, successful life (it was possible to indicate up to three
choices)
Social-demografic group Health Education Strong personality Other
Total 65,05 6,20 4,99 1,00
Gender
Men 61,35 6,37 6,56 1,19
Women 68,12 6,05 3,70 0,84
Age
up to 24 years old 56,98 20,09 8,36 2,01
25-34 years old 60,71 5,91 5,20 0,94
35-44 years old 62,22 2,59 4,90 1,19
45-59 years old 66,44 3,11 4,43 0,75
60-64 years old 74,28 3,21 3,65 0,42
65+ years old 75,59 2,94 2,99 0,52
Place of residence
Cities > 500k 61,56 5,67 3,53 1,28
Towns 200-500k 64,30 6,82 5,05 1,85
Towns 100-200k 65,62 6,43 6,87 1,46
Towns 20-100k 65,09 6,59 5,84 1,03
Towns < 20k 64,50 6,03 5,86 0,68
Rural areas 66,40 5,95 4,25 0,64
Voivodship
Dolnośląskie 68,31 5,47 4,59 0,85
Kujawsko-pomorskie 61,72 5,49 5,23 0,43
Lubelskie 63,60 6,75 4,83 1,70
Lubuskie 65,99 6,12 4,81 1,40
Łódzkie 68,99 6,89 4,50 0,59
Małopolskie 62,30 6,37 4,76 1,07
Mazowieckie 61,71 5,18 4,55 0,65
Opolskie 67,70 4,64 5,26 2,04
Podkarpackie 67,82 5,57 4,11 1,35
Podlaskie 66,91 6,43 5,44 0,75
Pomorskie 62,47 6,39 3,86 1,00
Śląskie 69,06 5,98 4,48 1,03
Świętokrzyskie 72,13 7,67 4,96 0,52
Warmińsko-mazurskie 59,78 8,59 11,45 0,24
Wielkopolskie 66,39 6,50 4,76 1,62
Zachodniopomorskie 56,13 7,47 6,57 1,11
Education
Primary and below 73,17 1,87 3,53 0,70
Vocational 62,36 6,48 5,32 0,93
Secondary 63,44 7,52 5,88 1,05
Tertiary/post-secondary 64,46 7,57 4,37 1,30
Income per capita
First quartile 61,70 7,11 4,74 1,15
Middle 50% 65,66 5,67 5,40 0,74
Fourth quartile 65,74 5,69 4,53 1,27
Social-professional status
Public sector employees 62,36 4,48 4,59 0,85
Private sector employees 59,92 4,34 5,13 0,90
Self-employed 60,43 3,47 5,30 1,49
Farmers 65,36 3,13 6,40 0,11
Disability pensioners 75,85 4,61 4,35 0,66
Retirees 74,57 3,50 3,11 0,61
Students 58,16 27,41 8,19 2,75
Unemployed 58,68 5,86 6,56 1,33
Other professionally inactive 64,74 4,27 4,99 1,08
Social Diagnosis 2007 Appendix 2 10
© The Council for Social Monitoring
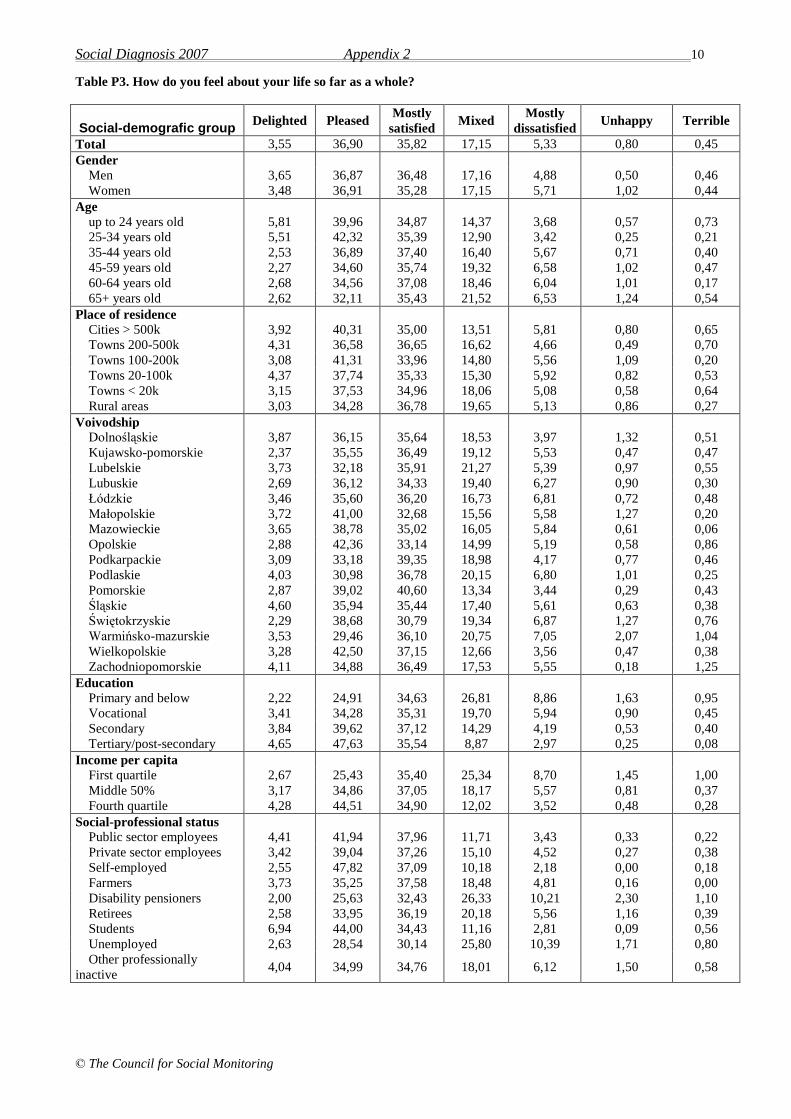
Table P3. How do you feel about your life so far as a whole?
Social-demografic group Delighted Pleased
Mostly
satisfied Mixed
Mostly
dissatisfied Unhappy Terrible
Total 3,55 36,90 35,82 17,15 5,33 0,80 0,45
Gender
Men 3,65 36,87 36,48 17,16 4,88 0,50 0,46
Women 3,48 36,91 35,28 17,15 5,71 1,02 0,44
Age
up to 24 years old 5,81 39,96 34,87 14,37 3,68 0,57 0,73
25-34 years old 5,51 42,32 35,39 12,90 3,42 0,25 0,21
35-44 years old 2,53 36,89 37,40 16,40 5,67 0,71 0,40
45-59 years old 2,27 34,60 35,74 19,32 6,58 1,02 0,47
60-64 years old 2,68 34,56 37,08 18,46 6,04 1,01 0,17
65+ years old 2,62 32,11 35,43 21,52 6,53 1,24 0,54
Place of residence
Cities > 500k 3,92 40,31 35,00 13,51 5,81 0,80 0,65
Towns 200-500k 4,31 36,58 36,65 16,62 4,66 0,49 0,70
Towns 100-200k 3,08 41,31 33,96 14,80 5,56 1,09 0,20
Towns 20-100k 4,37 37,74 35,33 15,30 5,92 0,82 0,53
Towns < 20k 3,15 37,53 34,96 18,06 5,08 0,58 0,64
Rural areas 3,03 34,28 36,78 19,65 5,13 0,86 0,27
Voivodship
Dolnośląskie 3,87 36,15 35,64 18,53 3,97 1,32 0,51
Kujawsko-pomorskie 2,37 35,55 36,49 19,12 5,53 0,47 0,47
Lubelskie 3,73 32,18 35,91 21,27 5,39 0,97 0,55
Lubuskie 2,69 36,12 34,33 19,40 6,27 0,90 0,30
Łódzkie 3,46 35,60 36,20 16,73 6,81 0,72 0,48
Małopolskie 3,72 41,00 32,68 15,56 5,58 1,27 0,20
Mazowieckie 3,65 38,78 35,02 16,05 5,84 0,61 0,06
Opolskie 2,88 42,36 33,14 14,99 5,19 0,58 0,86
Podkarpackie 3,09 33,18 39,35 18,98 4,17 0,77 0,46
Podlaskie 4,03 30,98 36,78 20,15 6,80 1,01 0,25
Pomorskie 2,87 39,02 40,60 13,34 3,44 0,29 0,43
Śląskie 4,60 35,94 35,44 17,40 5,61 0,63 0,38
Świętokrzyskie 2,29 38,68 30,79 19,34 6,87 1,27 0,76
Warmińsko-mazurskie 3,53 29,46 36,10 20,75 7,05 2,07 1,04
Wielkopolskie 3,28 42,50 37,15 12,66 3,56 0,47 0,38
Zachodniopomorskie 4,11 34,88 36,49 17,53 5,55 0,18 1,25
Education
Primary and below 2,22 24,91 34,63 26,81 8,86 1,63 0,95
Vocational 3,41 34,28 35,31 19,70 5,94 0,90 0,45
Secondary 3,84 39,62 37,12 14,29 4,19 0,53 0,40
Tertiary/post-secondary 4,65 47,63 35,54 8,87 2,97 0,25 0,08
Income per capita
First quartile 2,67 25,43 35,40 25,34 8,70 1,45 1,00
Middle 50% 3,17 34,86 37,05 18,17 5,57 0,81 0,37
Fourth quartile 4,28 44,51 34,90 12,02 3,52 0,48 0,28
Social-professional status
Public sector employees 4,41 41,94 37,96 11,71 3,43 0,33 0,22
Private sector employees 3,42 39,04 37,26 15,10 4,52 0,27 0,38
Self-employed 2,55 47,82 37,09 10,18 2,18 0,00 0,18
Farmers 3,73 35,25 37,58 18,48 4,81 0,16 0,00
Disability pensioners 2,00 25,63 32,43 26,33 10,21 2,30 1,10
Retirees 2,58 33,95 36,19 20,18 5,56 1,16 0,39
Students 6,94 44,00 34,43 11,16 2,81 0,09 0,56
Unemployed 2,63 28,54 30,14 25,80 10,39 1,71 0,80
Other professionally
inactive 4,04 34,99 34,76 18,01 6,12 1,50 0,58
Social Diagnosis 2007 Appendix 2 11
© The Council for Social Monitoring
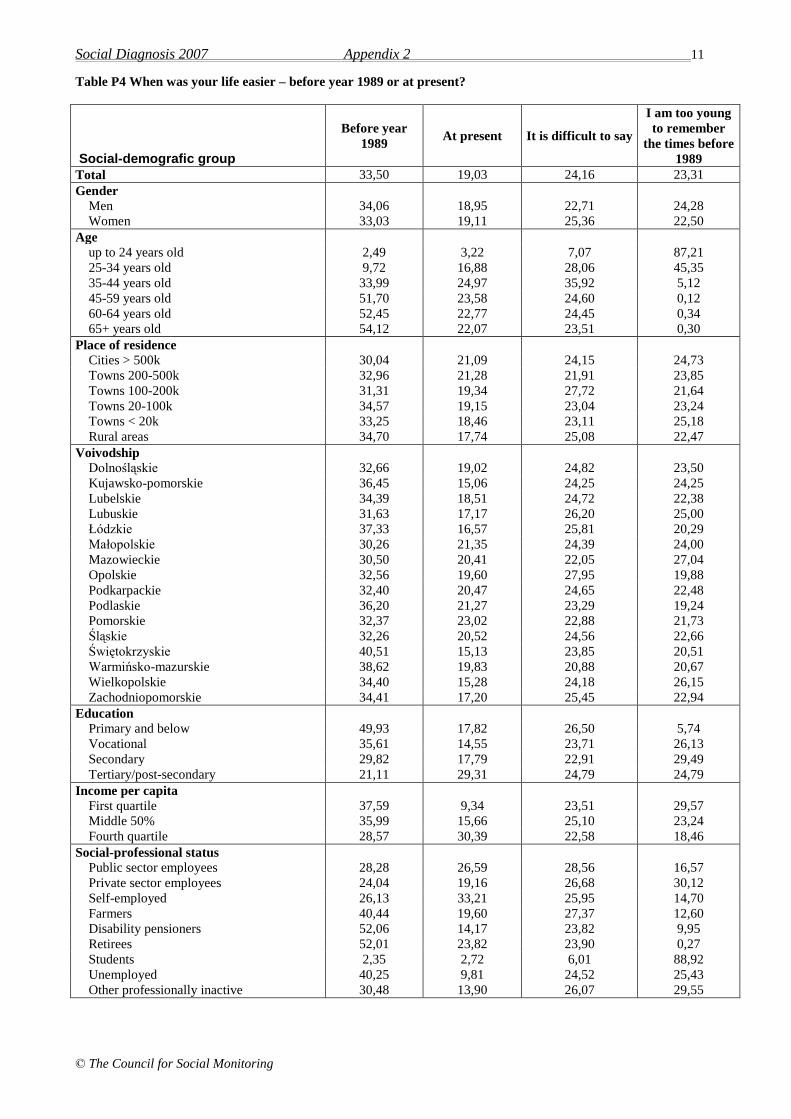
Table P4 When was your life easier – before year 1989 or at present?
Social-demografic group
Before year
1989 At present It is difficult to say
I am too young
to remember
the times before
1989
Total 33,50 19,03 24,16 23,31
Gender
Men 34,06 18,95 22,71 24,28
Women 33,03 19,11 25,36 22,50
Age
up to 24 years old 2,49 3,22 7,07 87,21
25-34 years old 9,72 16,88 28,06 45,35
35-44 years old 33,99 24,97 35,92 5,12
45-59 years old 51,70 23,58 24,60 0,12
60-64 years old 52,45 22,77 24,45 0,34
65+ years old 54,12 22,07 23,51 0,30
Place of residence
Cities > 500k 30,04 21,09 24,15 24,73
Towns 200-500k 32,96 21,28 21,91 23,85
Towns 100-200k 31,31 19,34 27,72 21,64
Towns 20-100k 34,57 19,15 23,04 23,24
Towns < 20k 33,25 18,46 23,11 25,18
Rural areas 34,70 17,74 25,08 22,47
Voivodship
Dolnośląskie 32,66 19,02 24,82 23,50
Kujawsko-pomorskie 36,45 15,06 24,25 24,25
Lubelskie 34,39 18,51 24,72 22,38
Lubuskie 31,63 17,17 26,20 25,00
Łódzkie 37,33 16,57 25,81 20,29
Małopolskie 30,26 21,35 24,39 24,00
Mazowieckie 30,50 20,41 22,05 27,04
Opolskie 32,56 19,60 27,95 19,88
Podkarpackie 32,40 20,47 24,65 22,48
Podlaskie 36,20 21,27 23,29 19,24
Pomorskie 32,37 23,02 22,88 21,73
Śląskie 32,26 20,52 24,56 22,66
Świętokrzyskie 40,51 15,13 23,85 20,51
Warmińsko-mazurskie 38,62 19,83 20,88 20,67
Wielkopolskie 34,40 15,28 24,18 26,15
Zachodniopomorskie 34,41 17,20 25,45 22,94
Education
Primary and below 49,93 17,82 26,50 5,74
Vocational 35,61 14,55 23,71 26,13
Secondary 29,82 17,79 22,91 29,49
Tertiary/post-secondary 21,11 29,31 24,79 24,79
Income per capita
First quartile 37,59 9,34 23,51 29,57
Middle 50% 35,99 15,66 25,10 23,24
Fourth quartile 28,57 30,39 22,58 18,46
Social-professional status
Public sector employees 28,28 26,59 28,56 16,57
Private sector employees 24,04 19,16 26,68 30,12
Self-employed 26,13 33,21 25,95 14,70
Farmers 40,44 19,60 27,37 12,60
Disability pensioners 52,06 14,17 23,82 9,95
Retirees 52,01 23,82 23,90 0,27
Students 2,35 2,72 6,01 88,92
Unemployed 40,25 9,81 24,52 25,43
Other professionally inactive 30,48 13,90 26,07 29,55
Social Diagnosis 2007 Appendix 2 12
© The Council for Social Monitoring
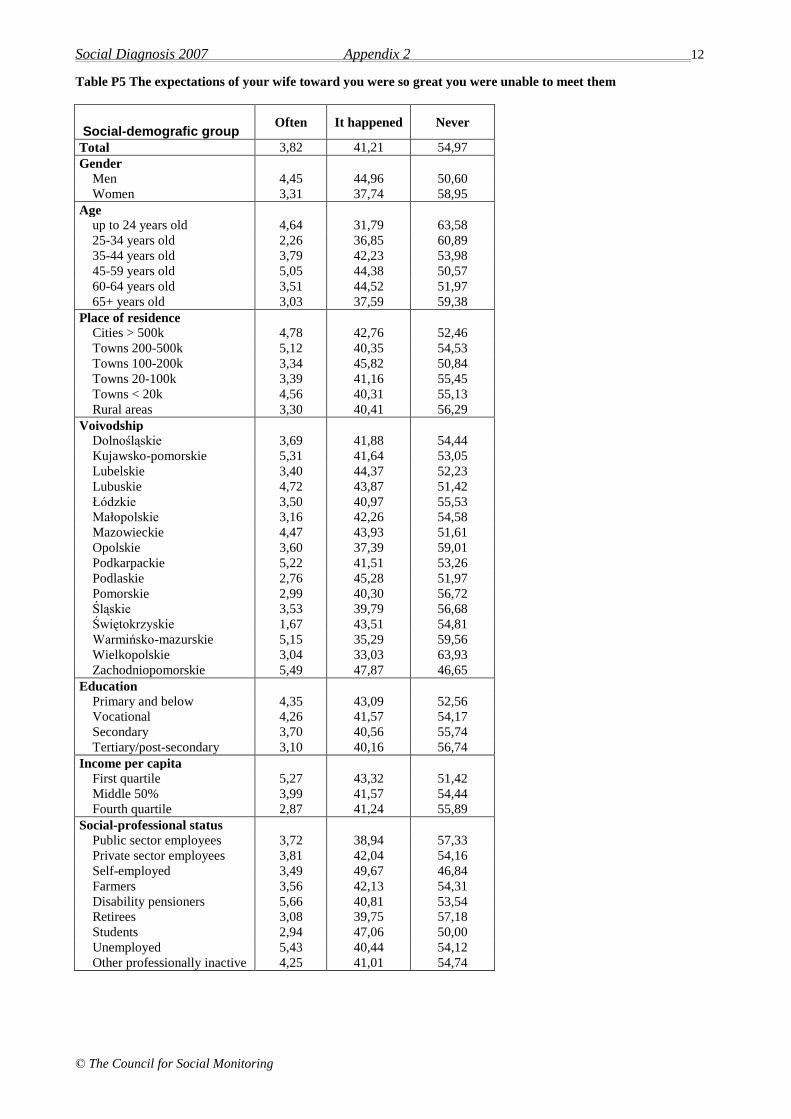
Table P5 The expectations of your wife toward you were so great you were unable to meet them
Social-demografic group Often It happened Never
Total 3,82 41,21 54,97
Gender
Men 4,45 44,96 50,60
Women 3,31 37,74 58,95
Age
up to 24 years old 4,64 31,79 63,58
25-34 years old 2,26 36,85 60,89
35-44 years old 3,79 42,23 53,98
45-59 years old 5,05 44,38 50,57
60-64 years old 3,51 44,52 51,97
65+ years old 3,03 37,59 59,38
Place of residence
Cities > 500k 4,78 42,76 52,46
Towns 200-500k 5,12 40,35 54,53
Towns 100-200k 3,34 45,82 50,84
Towns 20-100k 3,39 41,16 55,45
Towns < 20k 4,56 40,31 55,13
Rural areas 3,30 40,41 56,29
Voivodship
Dolnośląskie 3,69 41,88 54,44
Kujawsko-pomorskie 5,31 41,64 53,05
Lubelskie 3,40 44,37 52,23
Lubuskie 4,72 43,87 51,42
Łódzkie 3,50 40,97 55,53
Małopolskie 3,16 42,26 54,58
Mazowieckie 4,47 43,93 51,61
Opolskie 3,60 37,39 59,01
Podkarpackie 5,22 41,51 53,26
Podlaskie 2,76 45,28 51,97
Pomorskie 2,99 40,30 56,72
Śląskie 3,53 39,79 56,68
Świętokrzyskie 1,67 43,51 54,81
Warmińsko-mazurskie 5,15 35,29 59,56
Wielkopolskie 3,04 33,03 63,93
Zachodniopomorskie 5,49 47,87 46,65
Education
Primary and below 4,35 43,09 52,56
Vocational 4,26 41,57 54,17
Secondary 3,70 40,56 55,74
Tertiary/post-secondary 3,10 40,16 56,74
Income per capita
First quartile 5,27 43,32 51,42
Middle 50% 3,99 41,57 54,44
Fourth quartile 2,87 41,24 55,89
Social-professional status
Public sector employees 3,72 38,94 57,33
Private sector employees 3,81 42,04 54,16
Self-employed 3,49 49,67 46,84
Farmers 3,56 42,13 54,31
Disability pensioners 5,66 40,81 53,54
Retirees 3,08 39,75 57,18
Students 2,94 47,06 50,00
Unemployed 5,43 40,44 54,12
Other professionally inactive 4,25 41,01 54,74

Social Diagnosis 2007 Appendix 2 13
© The Council for Social Monitoring
Table P6. Your wife was too extravagant in spending money that were your common property
Social-demografic group Often It happened Never
Total 2,85 26,03 71,13
Gender
Men 2,38 27,03 70,58
Women 3,27 25,13 71,60
Age
up to 24 years old 3,92 24,18 71,90
25-34 years old 2,53 26,76 70,72
35-44 years old 2,24 28,70 69,07
45-59 years old 3,84 27,44 68,72
60-64 years old 2,84 24,29 72,87
65+ years old 1,55 18,70 79,74
Place of residence
Cities > 500k 4,19 26,05 69,76
Towns 200-500k 4,19 28,06 67,75
Towns 100-200k 3,18 30,94 65,89
Towns 20-100k 2,51 24,85 72,64
Towns < 20k 3,20 27,22 69,59
Rural areas 2,06 24,64 73,30
Voivodship
Dolnośląskie 2,68 23,12 74,20
Kujawsko-pomorskie 2,12 26,53 71,35
Lubelskie 3,38 31,71 64,90
Lubuskie 2,83 29,72 67,45
Łódzkie 1,93 30,06 68,02
Małopolskie 2,32 22,02 75,66
Mazowieckie 3,61 25,67 70,72
Opolskie 4,00 25,33 70,67
Podkarpackie 2,87 24,28 72,85
Podlaskie 2,77 28,06 69,17
Pomorskie 3,17 22,62 74,21
Śląskie 2,80 27,53 69,68
Świętokrzyskie 2,51 25,10 72,38
Warmińsko-mazurskie 3,68 25,37 70,96
Wielkopolskie 2,27 21,48 76,25
Zachodniopomorskie 3,02 34,14 62,84
Education
Primary and below 3,16 24,13 72,71
Vocational 2,95 26,77 70,28
Secondary 2,58 25,98 71,45
Tertiary/post-secondary 2,78 26,69 70,54
Income per capita
First quartile 3,99 29,50 66,51
Middle 50% 2,79 25,30 71,92
Fourth quartile 2,50 25,42 72,08
Social-professional status
Public sector employees 3,70 25,26 71,04
Private sector employees 2,73 28,67 68,60
Self-employed 2,40 35,37 62,23
Farmers 1,13 26,08 72,80
Disability pensioners 3,43 23,59 72,98
Retirees 2,51 21,38 76,11
Students 0,00 18,18 81,82
Unemployed 3,80 29,80 66,40
Other professionally inactive 2,94 24,80 72,27
Social Diagnosis 2007 Appendix 2 14
© The Council for Social Monitoring
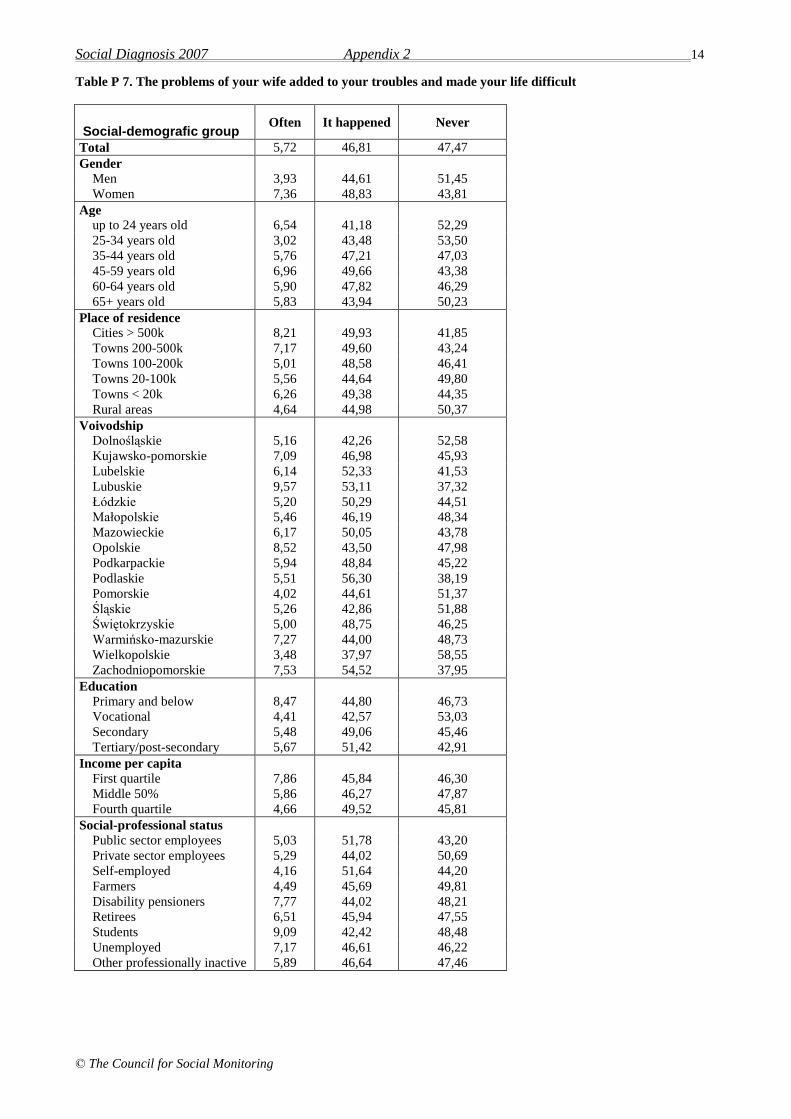
Table P 7. The problems of your wife added to your troubles and made your life difficult
Social-demografic group Often It happened Never
Total 5,72 46,81 47,47
Gender
Men 3,93 44,61 51,45
Women 7,36 48,83 43,81
Age
up to 24 years old 6,54 41,18 52,29
25-34 years old 3,02 43,48 53,50
35-44 years old 5,76 47,21 47,03
45-59 years old 6,96 49,66 43,38
60-64 years old 5,90 47,82 46,29
65+ years old 5,83 43,94 50,23
Place of residence
Cities > 500k 8,21 49,93 41,85
Towns 200-500k 7,17 49,60 43,24
Towns 100-200k 5,01 48,58 46,41
Towns 20-100k 5,56 44,64 49,80
Towns < 20k 6,26 49,38 44,35
Rural areas 4,64 44,98 50,37
Voivodship
Dolnośląskie 5,16 42,26 52,58
Kujawsko-pomorskie 7,09 46,98 45,93
Lubelskie 6,14 52,33 41,53
Lubuskie 9,57 53,11 37,32
Łódzkie 5,20 50,29 44,51
Małopolskie 5,46 46,19 48,34
Mazowieckie 6,17 50,05 43,78
Opolskie 8,52 43,50 47,98
Podkarpackie 5,94 48,84 45,22
Podlaskie 5,51 56,30 38,19
Pomorskie 4,02 44,61 51,37
Śląskie 5,26 42,86 51,88
Świętokrzyskie 5,00 48,75 46,25
Warmińsko-mazurskie 7,27 44,00 48,73
Wielkopolskie 3,48 37,97 58,55
Zachodniopomorskie 7,53 54,52 37,95
Education
Primary and below 8,47 44,80 46,73
Vocational 4,41 42,57 53,03
Secondary 5,48 49,06 45,46
Tertiary/post-secondary 5,67 51,42 42,91
Income per capita
First quartile 7,86 45,84 46,30
Middle 50% 5,86 46,27 47,87
Fourth quartile 4,66 49,52 45,81
Social-professional status
Public sector employees 5,03 51,78 43,20
Private sector employees 5,29 44,02 50,69
Self-employed 4,16 51,64 44,20
Farmers 4,49 45,69 49,81
Disability pensioners 7,77 44,02 48,21
Retirees 6,51 45,94 47,55
Students 9,09 42,42 48,48
Unemployed 7,17 46,61 46,22
Other professionally inactive 5,89 46,64 47,46

Social Diagnosis 2007 Appendix 2 15
© The Council for Social Monitoring
Table P 8. You had doubts about your children being hard-working and tough enough to cope in life
Social-demografic group Often It happened Never
Total 5,76 42,11 52,13
Gender
Men 5,32 39,65 55,03
Women 6,13 44,05 49,82
Age
up to 24 years old 2,90 11,59 85,51
25-34 years old 3,17 24,23 72,60
35-44 years old 6,91 48,60 44,49
45-59 years old 6,67 49,50 43,83
60-64 years old 5,63 38,75 55,63
65+ years old 5,29 43,92 50,79
Place of residence
Cities > 500k 4,62 44,23 51,15
Towns 200-500k 5,30 47,20 47,51
Towns 100-200k 8,57 42,18 49,25
Towns 20-100k 6,18 41,75 52,07
Towns < 20k 6,34 41,79 51,87
Rural areas 5,29 40,14 54,58
Voivodship
Dolnośląskie 5,83 40,53 53,64
Kujawsko-pomorskie 8,28 38,97 52,76
Lubelskie 7,25 41,74 51,01
Lubuskie 11,64 42,47 45,89
Łódzkie 3,93 44,10 51,97
Małopolskie 3,19 44,87 51,94
Mazowieckie 6,51 42,61 50,88
Opolskie 5,26 36,18 58,55
Podkarpackie 5,81 38,71 55,48
Podlaskie 4,47 42,46 53,07
Pomorskie 4,83 40,79 54,38
Śląskie 7,10 42,76 50,14
Świętokrzyskie 5,33 47,34 47,34
Warmińsko-mazurskie 5,85 39,02 55,12
Wielkopolskie 2,47 41,86 55,67
Zachodniopomorskie 7,41 47,22 45,37
Education
Primary and below 7,80 43,48 48,73
Vocational 5,74 41,39 52,87
Secondary 5,07 42,22 52,71
Tertiary/post-secondary 5,81 42,27 51,92
Income per capita
First quartile 6,78 43,99 49,23
Middle 50% 6,08 41,22 52,71
Fourth quartile 4,49 43,61 51,90
Social-professional status
Public sector employees 5,52 46,08 48,39
Private sector employees 5,45 40,04 54,52
Self-employed 4,57 46,19 49,24
Farmers 4,84 44,18 50,99
Disability pensioners 9,18 45,25 45,57
Retirees 6,57 43,86 49,58
Students 0,00 15,15 84,85
Unemployed 7,64 35,59 56,77
Other professionally inactive 5,21 38,55 56,24
Social Diagnosis 2007 Appendix 2 16
© The Council for Social Monitoring
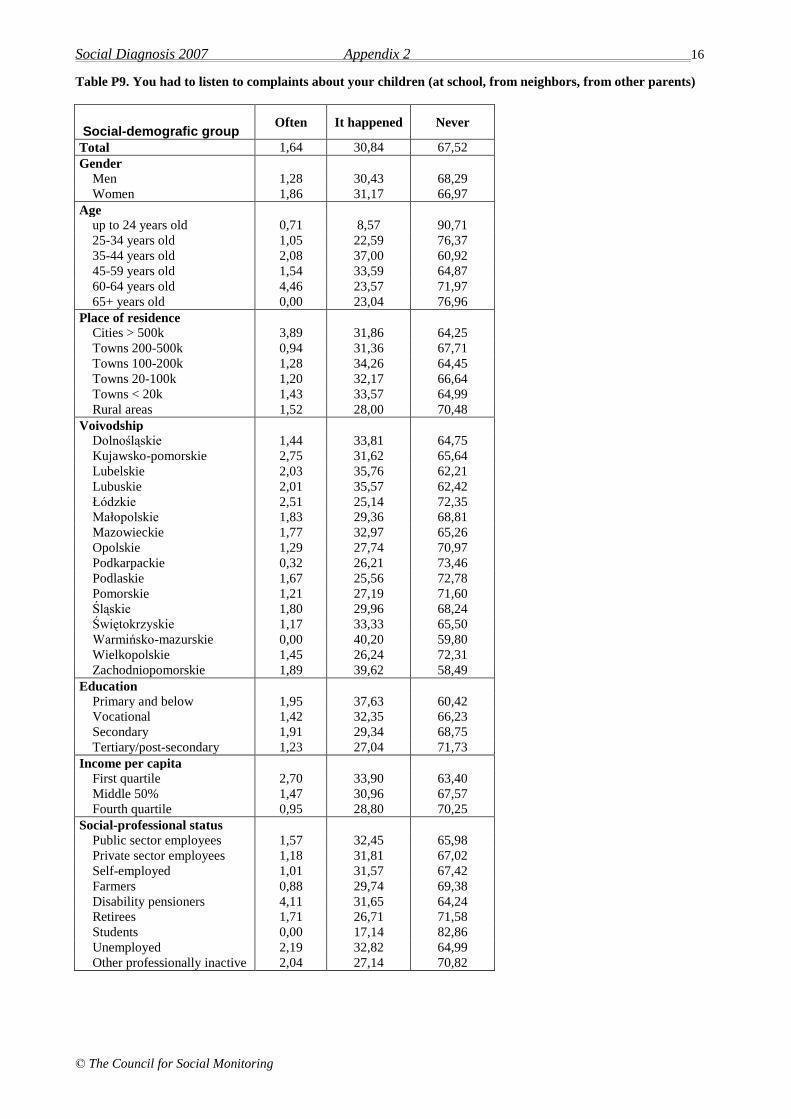
Table P9. You had to listen to complaints about your children (at school, from neighbors, from other parents)
Social-demografic group Often It happened Never
Total 1,64 30,84 67,52
Gender
Men 1,28 30,43 68,29
Women 1,86 31,17 66,97
Age
up to 24 years old 0,71 8,57 90,71
25-34 years old 1,05 22,59 76,37
35-44 years old 2,08 37,00 60,92
45-59 years old 1,54 33,59 64,87
60-64 years old 4,46 23,57 71,97
65+ years old 0,00 23,04 76,96
Place of residence
Cities > 500k 3,89 31,86 64,25
Towns 200-500k 0,94 31,36 67,71
Towns 100-200k 1,28 34,26 64,45
Towns 20-100k 1,20 32,17 66,64
Towns < 20k 1,43 33,57 64,99
Rural areas 1,52 28,00 70,48
Voivodship
Dolnośląskie 1,44 33,81 64,75
Kujawsko-pomorskie 2,75 31,62 65,64
Lubelskie 2,03 35,76 62,21
Lubuskie 2,01 35,57 62,42
Łódzkie 2,51 25,14 72,35
Małopolskie 1,83 29,36 68,81
Mazowieckie 1,77 32,97 65,26
Opolskie 1,29 27,74 70,97
Podkarpackie 0,32 26,21 73,46
Podlaskie 1,67 25,56 72,78
Pomorskie 1,21 27,19 71,60
Śląskie 1,80 29,96 68,24
Świętokrzyskie 1,17 33,33 65,50
Warmińsko-mazurskie 0,00 40,20 59,80
Wielkopolskie 1,45 26,24 72,31
Zachodniopomorskie 1,89 39,62 58,49
Education
Primary and below 1,95 37,63 60,42
Vocational 1,42 32,35 66,23
Secondary 1,91 29,34 68,75
Tertiary/post-secondary 1,23 27,04 71,73
Income per capita
First quartile 2,70 33,90 63,40
Middle 50% 1,47 30,96 67,57
Fourth quartile 0,95 28,80 70,25
Social-professional status
Public sector employees 1,57 32,45 65,98
Private sector employees 1,18 31,81 67,02
Self-employed 1,01 31,57 67,42
Farmers 0,88 29,74 69,38
Disability pensioners 4,11 31,65 64,24
Retirees 1,71 26,71 71,58
Students 0,00 17,14 82,86
Unemployed 2,19 32,82 64,99
Other professionally inactive 2,04 27,14 70,82

Social Diagnosis 2007 Appendix 2 17
© The Council for Social Monitoring
Table P10. You had to bear some expenses because of something that your children did
Social-demografic group Often It happened Never
Total 0,49 12,85 86,65
Gender
Men 0,58 13,72 85,70
Women 0,42 12,21 87,37
Age
up to 24 years old 0,72 3,60 95,68
25-34 years old 0,16 5,63 94,21
35-44 years old 0,54 12,23 87,23
45-59 years old 0,43 18,12 81,45
60-64 years old 1,31 16,34 82,35
65+ years old 1,58 12,63 85,79
Place of residence
Cities > 500k 0,71 17,73 81,56
Towns 200-500k 0,63 15,18 84,19
Towns 100-200k 0,65 12,50 86,85
Towns 20-100k 0,55 12,42 87,03
Towns < 20k 0,58 13,11 86,31
Rural areas 0,30 11,00 88,70
Voivodship
Dolnośląskie 0,48 12,95 86,57
Kujawsko-pomorskie 0,35 11,54 88,11
Lubelskie 0,88 17,40 81,71
Lubuskie 0,00 16,22 83,78
Łódzkie 0,28 12,92 86,80
Małopolskie 0,69 9,15 90,16
Mazowieckie 0,27 15,22 84,51
Opolskie 1,30 10,39 88,31
Podkarpackie 0,00 11,33 88,67
Podlaskie 0,00 11,05 88,95
Pomorskie 0,30 10,88 88,82
Śląskie 0,70 13,53 85,77
Świętokrzyskie 1,19 13,10 85,71
Warmińsko-mazurskie 0,00 13,79 86,21
Wielkopolskie 0,41 11,98 87,60
Zachodniopomorskie 1,42 11,37 87,20
Education
Primary and below 0,92 15,75 83,33
Vocational 0,38 11,69 87,92
Secondary 0,40 12,78 86,83
Tertiary/post-secondary 0,49 13,16 86,35
Income per capita
First quartile 1,01 13,74 85,25
Middle 50% 0,27 12,80 86,93
Fourth quartile 0,43 13,40 86,17
Social-professional status
Public sector employees 0,83 12,75 86,42
Private sector employees 0,37 12,30 87,33
Self-employed 0,25 14,76 84,99
Farmers 0,00 9,78 90,22
Disability pensioners 0,64 19,81 79,55
Retirees 0,86 15,88 83,26
Students 0,00 2,94 97,06
Unemployed 0,66 12,56 86,78
Other professionally inactive 0,00 10,20 89,80

Social Diagnosis 2007 Appendix 2 18
© The Council for Social Monitoring
Table P11. Your children disregarded and rejected your help, advice and guidance
Social-demografic group Often It happened Never
Total 3,70 46,37 49,94
Gender
Men 4,01 46,43 49,57
Women 3,42 46,32 50,26
Age
up to 24 years old 0,71 18,57 80,71
25-34 years old 1,79 33,20 65,02
35-44 years old 4,29 51,43 44,28
45-59 years old 4,54 52,13 43,33
60-64 years old 4,46 49,04 46,50
65+ years old 2,58 42,27 55,15
Place of residence
Cities > 500k 7,09 46,63 46,28
Towns 200-500k 3,76 52,11 44,13
Towns 100-200k 6,61 48,19 45,20
Towns 20-100k 3,60 46,35 50,05
Towns < 20k 3,44 47,49 49,07
Rural areas 2,16 43,70 54,14
Voivodship
Dolnośląskie 5,30 50,84 43,86
Kujawsko-pomorskie 3,05 45,76 51,19
Lubelskie 3,55 48,52 47,93
Lubuskie 5,37 46,31 48,32
Łódzkie 2,51 46,52 50,97
Małopolskie 2,07 49,20 48,74
Mazowieckie 3,80 47,55 48,64
Opolskie 4,55 44,16 51,30
Podkarpackie 2,27 46,10 51,62
Podlaskie 3,83 45,36 50,82
Pomorskie 3,31 47,59 49,10
Śląskie 5,97 45,00 49,03
Świętokrzyskie 2,98 50,00 47,02
Warmińsko-mazurskie 4,43 43,35 52,22
Wielkopolskie 1,86 37,73 60,41
Zachodniopomorskie 3,76 50,23 46,01
Education
Primary and below 3,91 47,07 49,02
Vocational 3,28 44,02 52,70
Secondary 3,78 47,10 49,13
Tertiary/post-secondary 4,00 48,45 47,55
Income per capita
First quartile 4,03 45,12 50,85
Middle 50% 3,91 45,27 50,81
Fourth quartile 3,08 51,54 45,38
Social-professional status
Public sector employees 4,64 49,59 45,78
Private sector employees 3,41 45,53 51,05
Self-employed 3,79 53,28 42,93
Farmers 1,32 46,58 52,10
Disability pensioners 6,27 48,90 44,83
Retirees 4,87 47,03 48,09
Students 0,00 31,43 68,57
Unemployed 3,70 41,39 54,90
Other professionally inactive 1,85 39,63 58,52

Social Diagnosis 2007 Appendix 2 19
© The Council for Social Monitoring
Table P12. You felt that you were losing influence on your children
Social-demografic group Often It happened Never
Total 3,78 37,62 58,61
Gender
Men 3,79 36,86 59,35
Women 3,70 38,24 58,06
Age
up to 24 years old 0,70 21,83 77,46
25-34 years old 1,92 24,44 73,64
35-44 years old 3,34 39,03 57,63
45-59 years old 5,37 44,80 49,83
60-64 years old 3,18 42,68 54,14
65+ years old 4,59 40,82 54,59
Place of residence
Cities > 500k 6,36 40,28 53,36
Towns 200-500k 3,57 44,96 51,47
Towns 100-200k 3,40 43,19 53,40
Towns 20-100k 3,76 37,80 58,44
Towns < 20k 4,59 36,87 58,54
Rural areas 2,89 33,48 63,63
Voivodship
Dolnośląskie 4,78 38,28 56,94
Kujawsko-pomorskie 3,73 37,29 58,98
Lubelskie 2,97 44,81 52,23
Lubuskie 6,04 39,60 54,36
Łódzkie 3,34 35,93 60,72
Małopolskie 2,29 39,59 58,12
Mazowieckie 3,64 40,70 55,66
Opolskie 4,55 30,52 64,94
Podkarpackie 3,56 34,30 62,14
Podlaskie 2,20 35,16 62,64
Pomorskie 3,64 36,97 59,39
Śląskie 4,69 37,38 57,93
Świętokrzyskie 2,96 37,28 59,76
Warmińsko-mazurskie 4,39 39,51 56,10
Wielkopolskie 3,53 31,12 65,35
Zachodniopomorskie 4,65 39,07 56,28
Education
Primary and below 5,10 38,38 56,52
Vocational 3,28 35,12 61,61
Secondary 3,88 38,02 58,10
Tertiary/post-secondary 3,50 40,44 56,06
Income per capita
First quartile 3,78 35,85 60,37
Middle 50% 4,25 37,25 58,50
Fourth quartile 3,25 41,57 55,18
Social-professional status
Public sector employees 3,89 39,12 56,99
Private sector employees 3,57 35,84 60,59
Self-employed 4,03 42,57 53,40
Farmers 1,77 32,37 65,85
Disability pensioners 5,64 44,51 49,84
Retirees 5,72 41,31 52,97
Students 0,00 22,86 77,14
Unemployed 5,01 34,42 60,57
Other professionally inactive 1,85 36,78 61,37

Social Diagnosis 2007 Appendix 2 20
© The Council for Social Monitoring
Table P13. You did not have enough time for your child
Social-demografic group Often It happened Never
Total 10,15 53,90 35,94
Gender
Men 14,34 58,25 27,41
Women 6,85 50,45 42,70
Age
up to 24 years old 3,47 36,81 59,72
25-34 years old 9,62 51,97 38,41
35-44 years old 12,44 57,17 30,39
45-59 years old 9,57 54,55 35,89
60-64 years old 10,90 50,64 38,46
65+ years old 5,08 46,19 48,73
Place of residence
Cities > 500k 13,66 56,04 30,30
Towns 200-500k 13,36 59,29 27,34
Towns 100-200k 10,19 56,26 33,55
Towns 20-100k 9,32 52,51 38,17
Towns < 20k 9,70 55,06 35,24
Rural areas 8,72 51,46 39,81
Voivodship
Dolnośląskie 7,19 56,59 36,21
Kujawsko-pomorskie 6,67 54,33 39,00
Lubelskie 9,88 58,43 31,69
Lubuskie 8,67 52,67 38,67
Łódzkie 11,67 59,17 29,17
Małopolskie 8,35 53,50 38,15
Mazowieckie 12,20 54,29 33,51
Opolskie 7,84 60,13 32,03
Podkarpackie 9,09 48,05 42,86
Podlaskie 10,27 58,38 31,35
Pomorskie 10,54 56,63 32,83
Śląskie 11,32 51,16 37,52
Świętokrzyskie 11,18 53,53 35,29
Warmińsko-mazurskie 11,54 51,44 37,02
Wielkopolskie 9,88 51,23 38,89
Zachodniopomorskie 13,33 46,19 40,48
Education
Primary and below 6,04 51,51 42,45
Vocational 9,82 51,60 38,58
Secondary 9,97 53,98 36,04
Tertiary/post-secondary 13,06 58,47 28,47
Income per capita
First quartile 7,37 51,65 40,98
Middle 50% 10,23 53,62 36,15
Fourth quartile 13,43 57,09 29,48
Social-professional status
Public sector employees 10,35 59,90 29,75
Private sector employees 13,45 59,90 26,65
Self-employed 19,75 60,75 19,50
Farmers 7,24 53,51 39,25
Disability pensioners 6,67 48,57 44,76
Retirees 6,74 47,58 45,68
Students 8,33 44,44 47,22
Unemployed 4,55 41,13 54,33
Other professionally inactive 5,13 37,91 56,96

Social Diagnosis 2007 Appendix 2 21
© The Council for Social Monitoring
Table. P14. You felt responsible for caring for and ensuring well-being of your parents or older relatives
Social-demografic group Often It happened Never
Total 22,79 54,90 22,31
Gender
Men 19,16 56,36 24,48
Women 25,98 53,60 20,42
Age
up to 24 years old 12,37 57,18 30,45
25-34 years old 16,72 56,22 27,06
35-44 years old 24,07 55,03 20,90
45-59 years old 33,11 53,04 13,85
60-64 years old 33,46 53,99 12,55
65+ years old 20,10 49,87 30,03
Place of residence
Cities > 500k 25,48 54,96 19,56
Towns 200-500k 24,42 53,29 22,29
Towns 100-200k 26,63 52,01 21,36
Towns 20-100k 23,53 53,54 22,92
Towns < 20k 20,79 57,07 22,14
Rural areas 20,83 56,03 23,13
Voivodship
Dolnośląskie 22,53 52,33 25,15
Kujawsko-pomorskie 21,72 54,07 24,21
Lubelskie 23,46 54,67 21,87
Lubuskie 21,11 57,04 21,85
Łódzkie 23,44 54,13 22,43
Małopolskie 23,87 57,82 18,30
Mazowieckie 23,14 58,31 18,56
Opolskie 24,11 53,75 22,13
Podkarpackie 20,78 57,82 21,40
Podlaskie 24,81 56,49 18,70
Pomorskie 22,76 54,29 22,95
Śląskie 24,66 51,21 24,13
Świętokrzyskie 20,95 51,78 27,27
Warmińsko-mazurskie 17,02 62,01 20,97
Wielkopolskie 22,50 51,42 26,08
Zachodniopomorskie 22,20 55,12 22,68
Education
Primary and below 19,17 56,14 24,68
Vocational 19,92 54,54 25,55
Secondary 23,29 55,18 21,53
Tertiary/post-secondary 28,06 54,37 17,57
Income per capita
First quartile 18,06 54,64 27,29
Middle 50% 22,38 55,89 21,73
Fourth quartile 27,23 53,31 19,46
Social-professional status
Public sector employees 27,74 54,55 17,71
Private sector employees 19,97 56,19 23,84
Self-employed 25,32 55,74 18,94
Farmers 29,64 53,64 16,73
Disability pensioners 25,85 55,83 18,31
Retirees 30,79 48,69 20,53
Students 9,98 57,68 32,35
Unemployed 24,20 53,57 22,24
Other professionally inactive 18,35 55,32 26,33

Social Diagnosis 2007 Appendix 2 22
© The Council for Social Monitoring
Table P15. You were worried about the health or state of mind of one of your parents or older relatives
Social-demografic group Often It happened Never
Total 23,07 56,36 20,57
Gender
Men 19,20 57,95 22,86
Women 26,44 55,01 18,55
Age
up to 24 years old 15,02 53,86 31,12
25-34 years old 18,32 57,89 23,79
35-44 years old 23,78 58,09 18,13
45-59 years old 31,73 55,60 12,67
60-64 years old 31,70 54,72 13,58
65+ years old 17,94 57,00 25,06
Place of residence
Cities > 500k 29,14 54,49 16,37
Towns 200-500k 25,96 55,36 18,68
Towns 100-200k 26,99 53,42 19,59
Towns 20-100k 23,57 54,13 22,30
Towns < 20k 21,18 58,98 19,84
Rural areas 19,72 58,30 21,98
Voivodship
Dolnośląskie 23,35 56,02 20,63
Kujawsko-pomorskie 23,23 57,40 19,36
Lubelskie 25,30 55,78 18,92
Lubuskie 21,48 58,52 20,00
Łódzkie 23,83 57,21 18,96
Małopolskie 23,34 59,42 17,24
Mazowieckie 25,17 56,23 18,60
Opolskie 24,42 56,59 18,99
Podkarpackie 24,54 54,23 21,24
Podlaskie 22,73 62,50 14,77
Pomorskie 23,38 58,44 18,18
Śląskie 23,33 52,82 23,86
Świętokrzyskie 21,18 50,98 27,84
Warmińsko-mazurskie 16,97 66,97 16,06
Wielkopolskie 20,17 52,89 26,94
Zachodniopomorskie 21,39 55,77 22,84
Education
Primary and below 18,31 60,46 21,23
Vocational 20,47 55,65 23,88
Secondary 24,17 55,30 20,53
Tertiary/post-secondary 27,58 57,20 15,22
Income per capita
First quartile 19,36 55,28 25,36
Middle 50% 23,13 56,84 20,02
Fourth quartile 26,58 56,01 17,41
Social-professional status
Public sector employees 27,14 57,35 15,51
Private sector employees 20,31 58,95 20,74
Self-employed 26,92 57,69 15,38
Farmers 22,87 59,53 17,60
Disability pensioners 27,53 54,35 18,12
Retirees 27,94 53,55 18,50
Students 13,43 52,62 33,95
Unemployed 24,16 55,31 20,53
Other professionally inactive 23,59 52,41 24,00

Social Diagnosis 2007 Appendix 2 23
© The Council for Social Monitoring
Table P16 Problems and worries of your parents, parents-in-law or other older relatives added to your troubles and
made your life difficult
Social-demografic group Often It happened Never
Total 11,38 53,49 35,12
Gender
Men 9,09 53,68 37,24
Women 13,41 53,36 33,23
Age
up to 24 years old 7,37 45,78 46,85
25-34 years old 7,47 52,44 40,09
35-44 years old 11,74 55,20 33,06
45-59 years old 15,90 57,66 26,44
60-64 years old 20,07 58,39 21,53
65+ years old 12,92 53,59 33,49
Place of residence
Cities > 500k 12,49 54,41 33,10
Towns 200-500k 12,42 51,48 36,10
Towns 100-200k 11,82 52,17 36,01
Towns 20-100k 11,17 52,76 36,07
Towns < 20k 10,07 53,21 36,72
Rural areas 11,19 54,70 34,11
Voivodship
Dolnośląskie 10,24 50,92 38,83
Kujawsko-pomorskie 8,76 54,83 36,40
Lubelskie 13,24 54,94 31,82
Lubuskie 14,44 51,85 33,70
Łódzkie 11,28 54,71 34,01
Małopolskie 10,54 56,79 32,67
Mazowieckie 13,27 54,58 32,16
Opolskie 10,00 52,31 37,69
Podkarpackie 11,36 56,40 32,23
Podlaskie 13,74 57,25 29,01
Pomorskie 11,28 52,68 36,04
Śląskie 12,96 50,61 36,43
Świętokrzyskie 11,33 53,52 35,16
Warmińsko-mazurskie 6,97 63,64 29,39
Wielkopolskie 9,99 45,68 44,34
Zachodniopomorskie 9,69 56,17 34,14
Education
Primary and below 12,16 55,09 32,74
Vocational 9,99 50,39 39,62
Secondary 11,73 54,05 34,22
Tertiary/post-secondary 12,56 56,69 30,75
Income per capita
First quartile 10,71 49,83 39,46
Middle 50% 11,30 54,04 34,67
Fourth quartile 12,63 55,29 32,08
Social-professional status
Public sector employees 13,56 55,58 30,86
Private sector employees 8,49 54,56 36,95
Self-employed 10,62 58,17 31,21
Farmers 12,34 55,72 31,94
Disability pensioners 15,85 54,23 29,93
Retirees 16,91 54,32 28,78
Students 5,49 44,57 49,95
Unemployed 14,09 51,60 34,31
Other professionally inactive 11,31 52,14 36,55
Social Diagnosis 2007 Appendix 2 24
© The Council for Social Monitoring
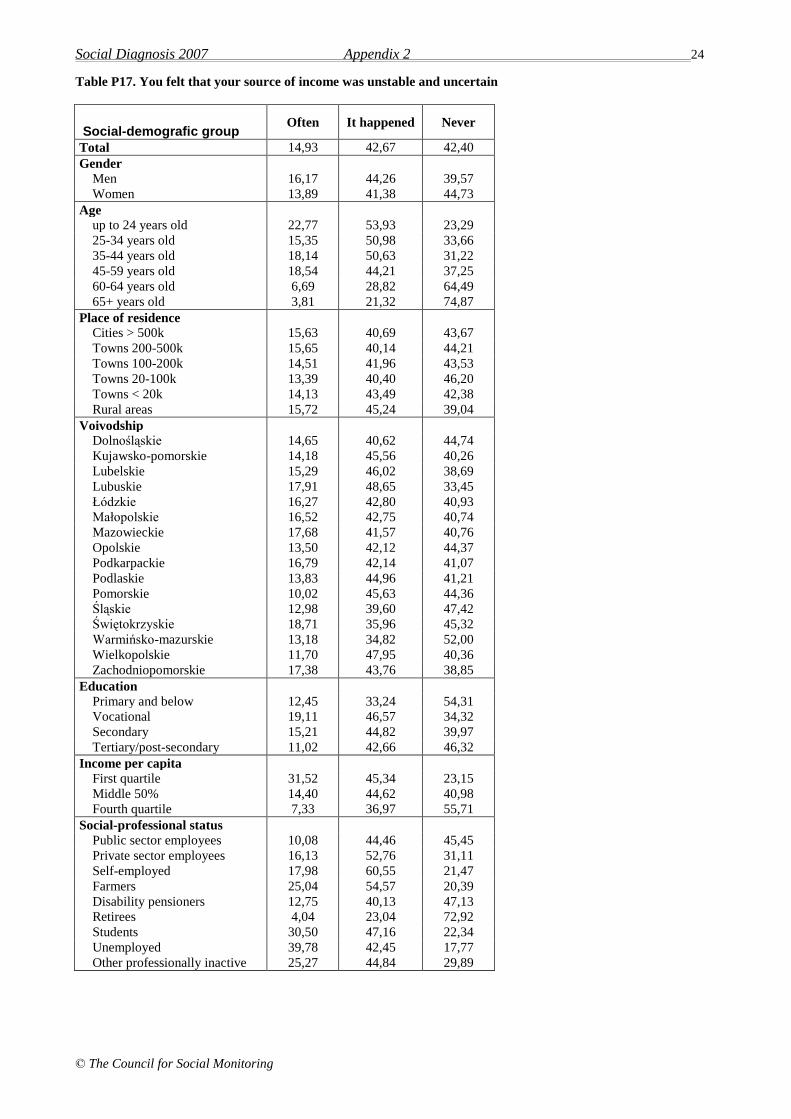
Table P17. You felt that your source of income was unstable and uncertain
Social-demografic group Often It happened Never
Total 14,93 42,67 42,40
Gender
Men 16,17 44,26 39,57
Women 13,89 41,38 44,73
Age
up to 24 years old 22,77 53,93 23,29
25-34 years old 15,35 50,98 33,66
35-44 years old 18,14 50,63 31,22
45-59 years old 18,54 44,21 37,25
60-64 years old 6,69 28,82 64,49
65+ years old 3,81 21,32 74,87
Place of residence
Cities > 500k 15,63 40,69 43,67
Towns 200-500k 15,65 40,14 44,21
Towns 100-200k 14,51 41,96 43,53
Towns 20-100k 13,39 40,40 46,20
Towns < 20k 14,13 43,49 42,38
Rural areas 15,72 45,24 39,04
Voivodship
Dolnośląskie 14,65 40,62 44,74
Kujawsko-pomorskie 14,18 45,56 40,26
Lubelskie 15,29 46,02 38,69
Lubuskie 17,91 48,65 33,45
Łódzkie 16,27 42,80 40,93
Małopolskie 16,52 42,75 40,74
Mazowieckie 17,68 41,57 40,76
Opolskie 13,50 42,12 44,37
Podkarpackie 16,79 42,14 41,07
Podlaskie 13,83 44,96 41,21
Pomorskie 10,02 45,63 44,36
Śląskie 12,98 39,60 47,42
Świętokrzyskie 18,71 35,96 45,32
Warmińsko-mazurskie 13,18 34,82 52,00
Wielkopolskie 11,70 47,95 40,36
Zachodniopomorskie 17,38 43,76 38,85
Education
Primary and below 12,45 33,24 54,31
Vocational 19,11 46,57 34,32
Secondary 15,21 44,82 39,97
Tertiary/post-secondary 11,02 42,66 46,32
Income per capita
First quartile 31,52 45,34 23,15
Middle 50% 14,40 44,62 40,98
Fourth quartile 7,33 36,97 55,71
Social-professional status
Public sector employees 10,08 44,46 45,45
Private sector employees 16,13 52,76 31,11
Self-employed 17,98 60,55 21,47
Farmers 25,04 54,57 20,39
Disability pensioners 12,75 40,13 47,13
Retirees 4,04 23,04 72,92
Students 30,50 47,16 22,34
Unemployed 39,78 42,45 17,77
Other professionally inactive 25,27 44,84 29,89

Social Diagnosis 2007 Appendix 2 25
© The Council for Social Monitoring
Table P18. Financial problems added to your troubles and made your life difficult
Social-demografic group Often It happened Never
Total 23,84 53,62 22,55
Gender
Men 22,54 54,21 23,25
Women 24,92 53,14 21,95
Age
up to 24 years old 20,37 51,34 28,29
25-34 years old 21,10 53,98 24,92
35-44 years old 28,58 54,57 16,85
45-59 years old 29,95 53,97 16,08
60-64 years old 20,84 57,48 21,68
65+ years old 16,13 52,66 31,21
Place of residence
Cities > 500k 22,12 54,36 23,52
Towns 200-500k 22,86 52,95 24,19
Towns 100-200k 22,40 55,80 21,80
Towns 20-100k 24,77 50,41 24,82
Towns < 20k 24,51 52,27 23,22
Rural areas 24,24 55,34 20,41
Voivodship
Dolnośląskie 24,51 49,74 25,75
Kujawsko-pomorskie 23,54 55,36 21,10
Lubelskie 24,65 55,96 19,39
Lubuskie 30,63 52,25 17,12
Łódzkie 25,42 54,72 19,85
Małopolskie 24,68 55,77 19,55
Mazowieckie 25,81 50,28 23,91
Opolskie 23,55 54,65 21,80
Podkarpackie 26,55 53,88 19,57
Podlaskie 22,96 56,63 20,41
Pomorskie 16,09 55,89 28,02
Śląskie 21,65 52,25 26,10
Świętokrzyskie 26,17 56,99 16,84
Warmińsko-mazurskie 23,59 50,94 25,47
Wielkopolskie 18,97 57,56 23,47
Zachodniopomorskie 29,62 50,81 19,57
Education
Primary and below 27,84 52,18 19,98
Vocational 27,83 52,80 19,37
Secondary 22,45 54,99 22,55
Tertiary/post-secondary 16,10 54,00 29,90
Income per capita
First quartile 43,10 45,75 11,15
Middle 50% 25,88 56,00 18,13
Fourth quartile 10,63 53,88 35,48
Social-professional status
Public sector employees 19,09 56,62 24,29
Private sector employees 22,49 57,25 20,26
Self-employed 17,24 61,89 20,87
Farmers 29,28 55,45 15,26
Disability pensioners 30,89 50,91 18,21
Retirees 16,31 54,14 29,55
Students 17,01 47,61 35,39
Unemployed 49,88 41,67 8,45
Other professionally inactive 35,04 49,13 15,83
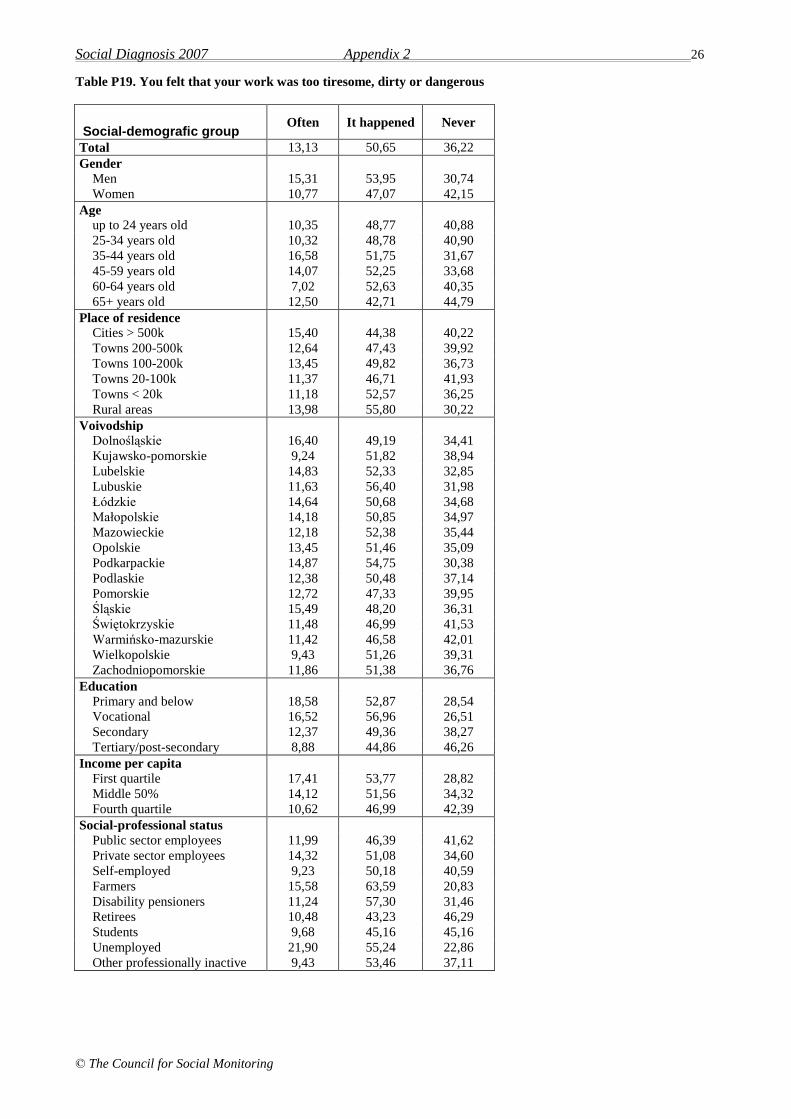
Social Diagnosis 2007 Appendix 2 26
© The Council for Social Monitoring
Table P19. You felt that your work was too tiresome, dirty or dangerous
Social-demografic group Often It happened Never
Total 13,13 50,65 36,22
Gender
Men 15,31 53,95 30,74
Women 10,77 47,07 42,15
Age
up to 24 years old 10,35 48,77 40,88
25-34 years old 10,32 48,78 40,90
35-44 years old 16,58 51,75 31,67
45-59 years old 14,07 52,25 33,68
60-64 years old 7,02 52,63 40,35
65+ years old 12,50 42,71 44,79
Place of residence
Cities > 500k 15,40 44,38 40,22
Towns 200-500k 12,64 47,43 39,92
Towns 100-200k 13,45 49,82 36,73
Towns 20-100k 11,37 46,71 41,93
Towns < 20k 11,18 52,57 36,25
Rural areas 13,98 55,80 30,22
Voivodship
Dolnośląskie 16,40 49,19 34,41
Kujawsko-pomorskie 9,24 51,82 38,94
Lubelskie 14,83 52,33 32,85
Lubuskie 11,63 56,40 31,98
Łódzkie 14,64 50,68 34,68
Małopolskie 14,18 50,85 34,97
Mazowieckie 12,18 52,38 35,44
Opolskie 13,45 51,46 35,09
Podkarpackie 14,87 54,75 30,38
Podlaskie 12,38 50,48 37,14
Pomorskie 12,72 47,33 39,95
Śląskie 15,49 48,20 36,31
Świętokrzyskie 11,48 46,99 41,53
Warmińsko-mazurskie 11,42 46,58 42,01
Wielkopolskie 9,43 51,26 39,31
Zachodniopomorskie 11,86 51,38 36,76
Education
Primary and below 18,58 52,87 28,54
Vocational 16,52 56,96 26,51
Secondary 12,37 49,36 38,27
Tertiary/post-secondary 8,88 44,86 46,26
Income per capita
First quartile 17,41 53,77 28,82
Middle 50% 14,12 51,56 34,32
Fourth quartile 10,62 46,99 42,39
Social-professional status
Public sector employees 11,99 46,39 41,62
Private sector employees 14,32 51,08 34,60
Self-employed 9,23 50,18 40,59
Farmers 15,58 63,59 20,83
Disability pensioners 11,24 57,30 31,46
Retirees 10,48 43,23 46,29
Students 9,68 45,16 45,16
Unemployed 21,90 55,24 22,86
Other professionally inactive 9,43 53,46 37,11
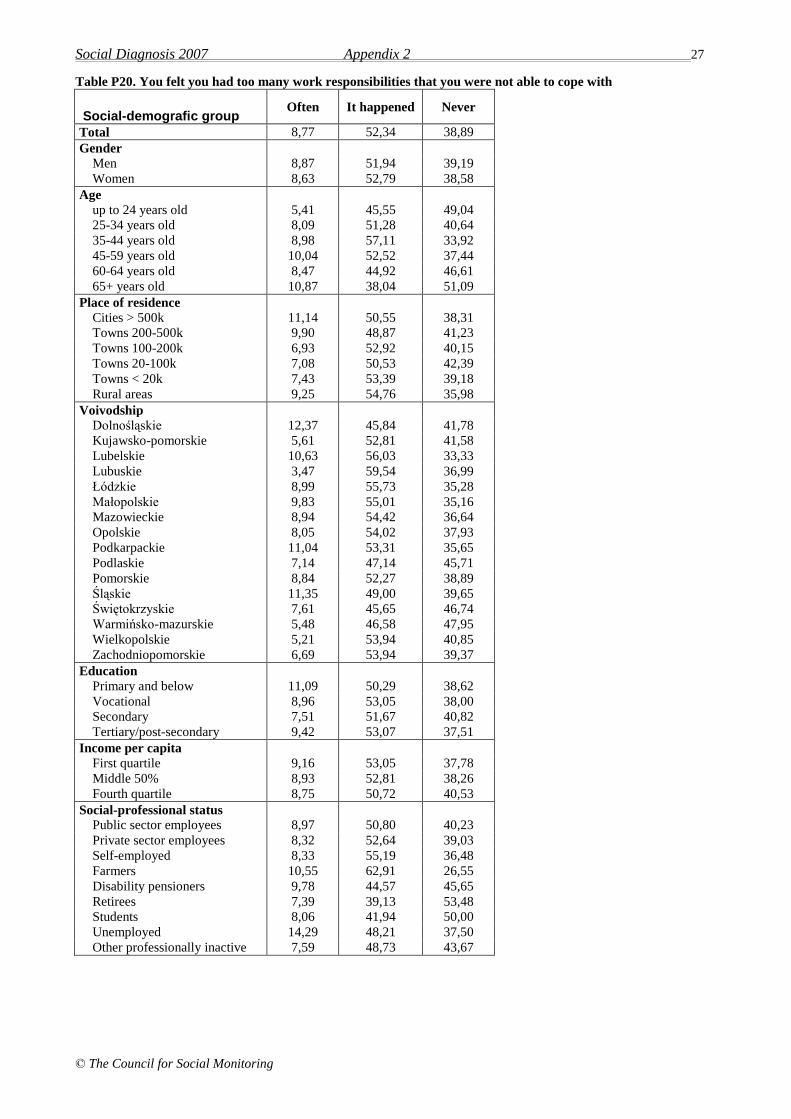
Social Diagnosis 2007 Appendix 2 27
© The Council for Social Monitoring
Table P20. You felt you had too many work responsibilities that you were not able to cope with
Social-demografic group Often It happened Never
Total 8,77 52,34 38,89
Gender
Men 8,87 51,94 39,19
Women 8,63 52,79 38,58
Age
up to 24 years old 5,41 45,55 49,04
25-34 years old 8,09 51,28 40,64
35-44 years old 8,98 57,11 33,92
45-59 years old 10,04 52,52 37,44
60-64 years old 8,47 44,92 46,61
65+ years old 10,87 38,04 51,09
Place of residence
Cities > 500k 11,14 50,55 38,31
Towns 200-500k 9,90 48,87 41,23
Towns 100-200k 6,93 52,92 40,15
Towns 20-100k 7,08 50,53 42,39
Towns < 20k 7,43 53,39 39,18
Rural areas 9,25 54,76 35,98
Voivodship
Dolnośląskie 12,37 45,84 41,78
Kujawsko-pomorskie 5,61 52,81 41,58
Lubelskie 10,63 56,03 33,33
Lubuskie 3,47 59,54 36,99
Łódzkie 8,99 55,73 35,28
Małopolskie 9,83 55,01 35,16
Mazowieckie 8,94 54,42 36,64
Opolskie 8,05 54,02 37,93
Podkarpackie 11,04 53,31 35,65
Podlaskie 7,14 47,14 45,71
Pomorskie 8,84 52,27 38,89
Śląskie 11,35 49,00 39,65
Świętokrzyskie 7,61 45,65 46,74
Warmińsko-mazurskie 5,48 46,58 47,95
Wielkopolskie 5,21 53,94 40,85
Zachodniopomorskie 6,69 53,94 39,37
Education
Primary and below 11,09 50,29 38,62
Vocational 8,96 53,05 38,00
Secondary 7,51 51,67 40,82
Tertiary/post-secondary 9,42 53,07 37,51
Income per capita
First quartile 9,16 53,05 37,78
Middle 50% 8,93 52,81 38,26
Fourth quartile 8,75 50,72 40,53
Social-professional status
Public sector employees 8,97 50,80 40,23
Private sector employees 8,32 52,64 39,03
Self-employed 8,33 55,19 36,48
Farmers 10,55 62,91 26,55
Disability pensioners 9,78 44,57 45,65
Retirees 7,39 39,13 53,48
Students 8,06 41,94 50,00
Unemployed 14,29 48,21 37,50
Other professionally inactive 7,59 48,73 43,67
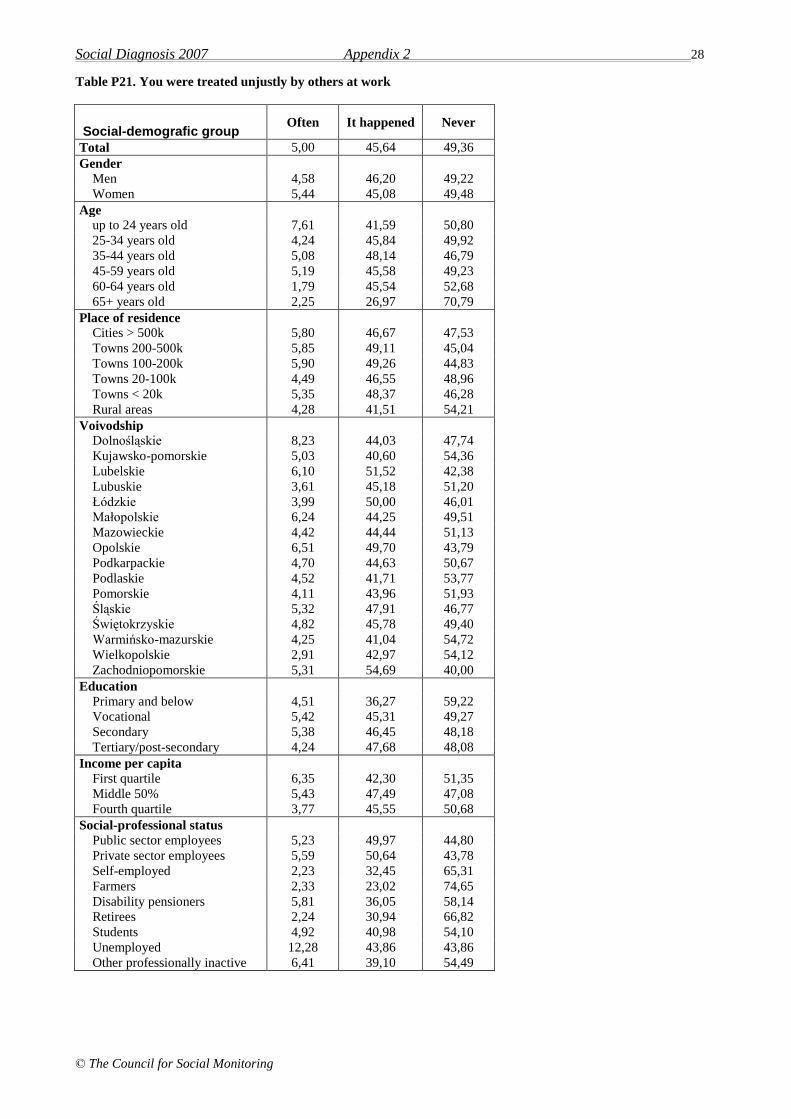
Social Diagnosis 2007 Appendix 2 28
© The Council for Social Monitoring
Table P21. You were treated unjustly by others at work
Social-demografic group Often It happened Never
Total 5,00 45,64 49,36
Gender
Men 4,58 46,20 49,22
Women 5,44 45,08 49,48
Age
up to 24 years old 7,61 41,59 50,80
25-34 years old 4,24 45,84 49,92
35-44 years old 5,08 48,14 46,79
45-59 years old 5,19 45,58 49,23
60-64 years old 1,79 45,54 52,68
65+ years old 2,25 26,97 70,79
Place of residence
Cities > 500k 5,80 46,67 47,53
Towns 200-500k 5,85 49,11 45,04
Towns 100-200k 5,90 49,26 44,83
Towns 20-100k 4,49 46,55 48,96
Towns < 20k 5,35 48,37 46,28
Rural areas 4,28 41,51 54,21
Voivodship
Dolnośląskie 8,23 44,03 47,74
Kujawsko-pomorskie 5,03 40,60 54,36
Lubelskie 6,10 51,52 42,38
Lubuskie 3,61 45,18 51,20
Łódzkie 3,99 50,00 46,01
Małopolskie 6,24 44,25 49,51
Mazowieckie 4,42 44,44 51,13
Opolskie 6,51 49,70 43,79
Podkarpackie 4,70 44,63 50,67
Podlaskie 4,52 41,71 53,77
Pomorskie 4,11 43,96 51,93
Śląskie 5,32 47,91 46,77
Świętokrzyskie 4,82 45,78 49,40
Warmińsko-mazurskie 4,25 41,04 54,72
Wielkopolskie 2,91 42,97 54,12
Zachodniopomorskie 5,31 54,69 40,00
Education
Primary and below 4,51 36,27 59,22
Vocational 5,42 45,31 49,27
Secondary 5,38 46,45 48,18
Tertiary/post-secondary 4,24 47,68 48,08
Income per capita
First quartile 6,35 42,30 51,35
Middle 50% 5,43 47,49 47,08
Fourth quartile 3,77 45,55 50,68
Social-professional status
Public sector employees 5,23 49,97 44,80
Private sector employees 5,59 50,64 43,78
Self-employed 2,23 32,45 65,31
Farmers 2,33 23,02 74,65
Disability pensioners 5,81 36,05 58,14
Retirees 2,24 30,94 66,82
Students 4,92 40,98 54,10
Unemployed 12,28 43,86 43,86
Other professionally inactive 6,41 39,10 54,49

Social Diagnosis 2007 Appendix 2 29
© The Council for Social Monitoring
Table P22. You had a feeling that the place you live in was overcrowded, for instance, too many people live in your
apartment, neighboring apartments, the whole building
Social-demografic group Often It happened Never
Total 5,03 19,54 75,43
Gender
Men 4,67 19,42 75,91
Women 5,31 19,63 75,07
Age
up to 24 years old 7,27 23,88 68,85
25-34 years old 6,61 23,41 69,98
35-44 years old 6,59 22,70 70,72
45-59 years old 4,11 17,33 78,56
60-64 years old 2,52 15,10 82,38
65+ years old 1,78 12,78 85,43
Place of residence
Cities > 500k 7,28 21,92 70,79
Towns 200-500k 5,09 23,28 71,64
Towns 100-200k 6,57 25,90 67,53
Towns 20-100k 4,70 20,42 74,89
Towns < 20k 5,47 20,40 74,13
Rural areas 3,98 15,40 80,62
Voivodship
Dolnośląskie 6,32 20,90 72,78
Kujawsko-pomorskie 6,05 23,41 70,54
Lubelskie 3,31 18,90 77,79
Lubuskie 5,72 28,61 65,66
Łódzkie 4,19 15,91 79,90
Małopolskie 5,48 19,86 74,66
Mazowieckie 5,04 18,47 76,49
Opolskie 2,59 21,04 76,37
Podkarpackie 2,79 21,52 75,70
Podlaskie 5,57 13,92 80,51
Pomorskie 5,32 20,83 73,85
Śląskie 5,55 20,35 74,10
Świętokrzyskie 5,36 16,58 78,06
Warmińsko-mazurskie 3,96 16,25 79,79
Wielkopolskie 4,31 17,81 77,88
Zachodniopomorskie 7,86 21,25 70,89
Education
Primary and below 4,49 15,87 79,65
Vocational 5,24 20,66 74,10
Secondary 5,13 20,32 74,55
Tertiary/post-secondary 5,03 19,81 75,17
Income per capita
First quartile 8,32 23,91 67,77
Middle 50% 4,72 19,68 75,60
Fourth quartile 3,55 16,42 80,03
Social-professional status
Public sector employees 6,22 20,56 73,23
Private sector employees 6,41 22,79 70,80
Self-employed 3,80 19,20 76,99
Farmers 2,96 15,73 81,31
Disability pensioners 5,11 17,72 77,18
Retirees 1,89 12,89 85,22
Students 5,73 22,54 71,74
Unemployed 5,83 24,00 70,17
Other professionally inactive 7,88 23,17 68,95
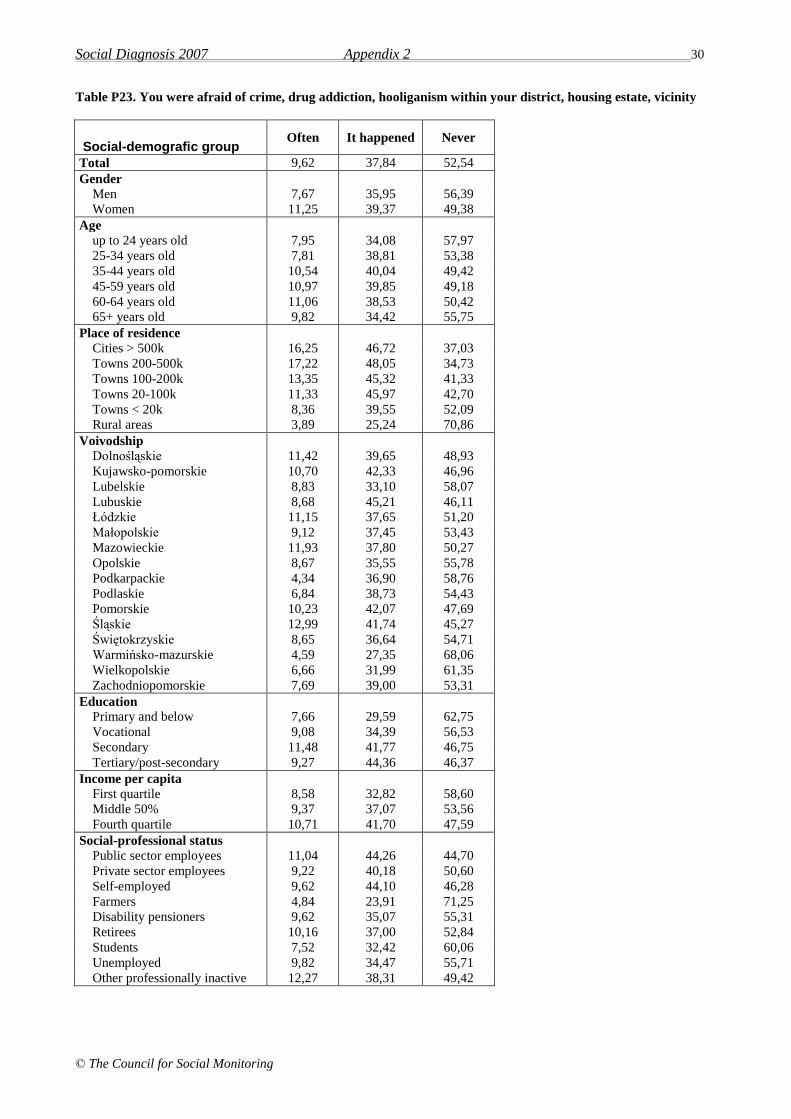
Social Diagnosis 2007 Appendix 2 30
© The Council for Social Monitoring
Table P23. You were afraid of crime, drug addiction, hooliganism within your district, housing estate, vicinity
Social-demografic group Often It happened Never
Total 9,62 37,84 52,54
Gender
Men 7,67 35,95 56,39
Women 11,25 39,37 49,38
Age
up to 24 years old 7,95 34,08 57,97
25-34 years old 7,81 38,81 53,38
35-44 years old 10,54 40,04 49,42
45-59 years old 10,97 39,85 49,18
60-64 years old 11,06 38,53 50,42
65+ years old 9,82 34,42 55,75
Place of residence
Cities > 500k 16,25 46,72 37,03
Towns 200-500k 17,22 48,05 34,73
Towns 100-200k 13,35 45,32 41,33
Towns 20-100k 11,33 45,97 42,70
Towns < 20k 8,36 39,55 52,09
Rural areas 3,89 25,24 70,86
Voivodship
Dolnośląskie 11,42 39,65 48,93
Kujawsko-pomorskie 10,70 42,33 46,96
Lubelskie 8,83 33,10 58,07
Lubuskie 8,68 45,21 46,11
Łódzkie 11,15 37,65 51,20
Małopolskie 9,12 37,45 53,43
Mazowieckie 11,93 37,80 50,27
Opolskie 8,67 35,55 55,78
Podkarpackie 4,34 36,90 58,76
Podlaskie 6,84 38,73 54,43
Pomorskie 10,23 42,07 47,69
Śląskie 12,99 41,74 45,27
Świętokrzyskie 8,65 36,64 54,71
Warmińsko-mazurskie 4,59 27,35 68,06
Wielkopolskie 6,66 31,99 61,35
Zachodniopomorskie 7,69 39,00 53,31
Education
Primary and below 7,66 29,59 62,75
Vocational 9,08 34,39 56,53
Secondary 11,48 41,77 46,75
Tertiary/post-secondary 9,27 44,36 46,37
Income per capita
First quartile 8,58 32,82 58,60
Middle 50% 9,37 37,07 53,56
Fourth quartile 10,71 41,70 47,59
Social-professional status
Public sector employees 11,04 44,26 44,70
Private sector employees 9,22 40,18 50,60
Self-employed 9,62 44,10 46,28
Farmers 4,84 23,91 71,25
Disability pensioners 9,62 35,07 55,31
Retirees 10,16 37,00 52,84
Students 7,52 32,42 60,06
Unemployed 9,82 34,47 55,71
Other professionally inactive 12,27 38,31 49,42
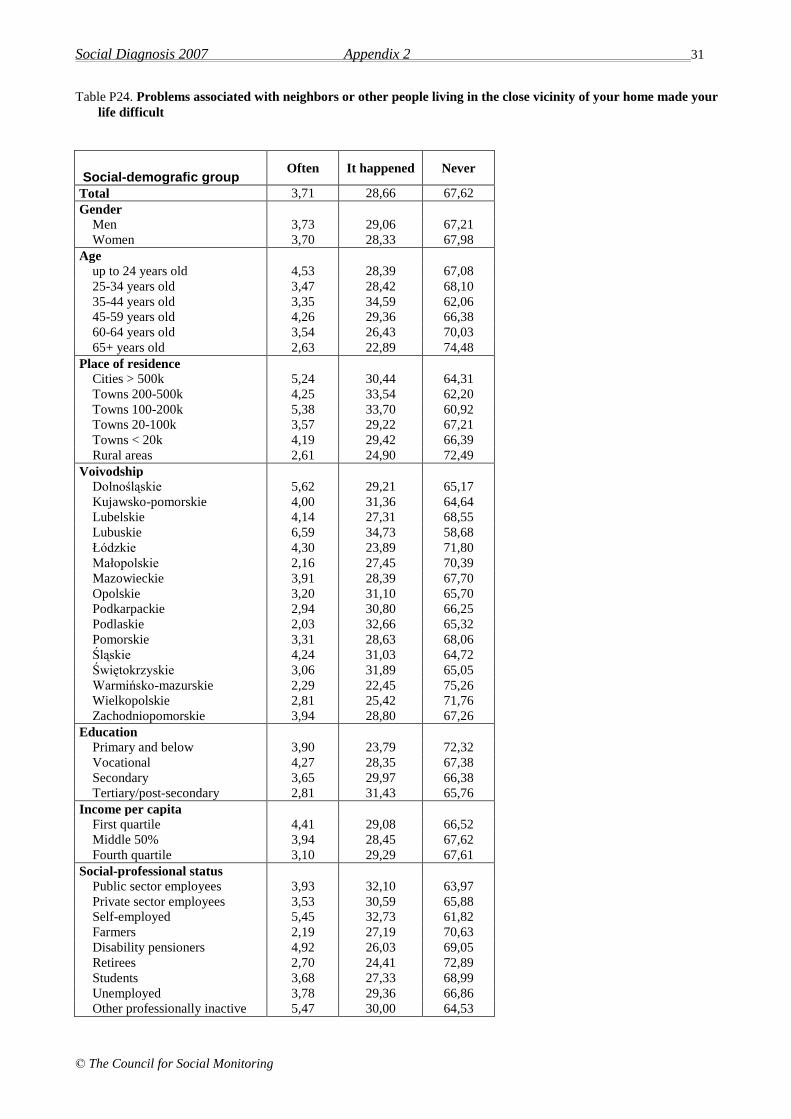
Social Diagnosis 2007 Appendix 2 31
© The Council for Social Monitoring
Table P24. Problems associated with neighbors or other people living in the close vicinity of your home made your
life difficult
Social-demografic group Often It happened Never
Total 3,71 28,66 67,62
Gender
Men 3,73 29,06 67,21
Women 3,70 28,33 67,98
Age
up to 24 years old 4,53 28,39 67,08
25-34 years old 3,47 28,42 68,10
35-44 years old 3,35 34,59 62,06
45-59 years old 4,26 29,36 66,38
60-64 years old 3,54 26,43 70,03
65+ years old 2,63 22,89 74,48
Place of residence
Cities > 500k 5,24 30,44 64,31
Towns 200-500k 4,25 33,54 62,20
Towns 100-200k 5,38 33,70 60,92
Towns 20-100k 3,57 29,22 67,21
Towns < 20k 4,19 29,42 66,39
Rural areas 2,61 24,90 72,49
Voivodship
Dolnośląskie 5,62 29,21 65,17
Kujawsko-pomorskie 4,00 31,36 64,64
Lubelskie 4,14 27,31 68,55
Lubuskie 6,59 34,73 58,68
Łódzkie 4,30 23,89 71,80
Małopolskie 2,16 27,45 70,39
Mazowieckie 3,91 28,39 67,70
Opolskie 3,20 31,10 65,70
Podkarpackie 2,94 30,80 66,25
Podlaskie 2,03 32,66 65,32
Pomorskie 3,31 28,63 68,06
Śląskie 4,24 31,03 64,72
Świętokrzyskie 3,06 31,89 65,05
Warmińsko-mazurskie 2,29 22,45 75,26
Wielkopolskie 2,81 25,42 71,76
Zachodniopomorskie 3,94 28,80 67,26
Education
Primary and below 3,90 23,79 72,32
Vocational 4,27 28,35 67,38
Secondary 3,65 29,97 66,38
Tertiary/post-secondary 2,81 31,43 65,76
Income per capita
First quartile 4,41 29,08 66,52
Middle 50% 3,94 28,45 67,62
Fourth quartile 3,10 29,29 67,61
Social-professional status
Public sector employees 3,93 32,10 63,97
Private sector employees 3,53 30,59 65,88
Self-employed 5,45 32,73 61,82
Farmers 2,19 27,19 70,63
Disability pensioners 4,92 26,03 69,05
Retirees 2,70 24,41 72,89
Students 3,68 27,33 68,99
Unemployed 3,78 29,36 66,86
Other professionally inactive 5,47 30,00 64,53
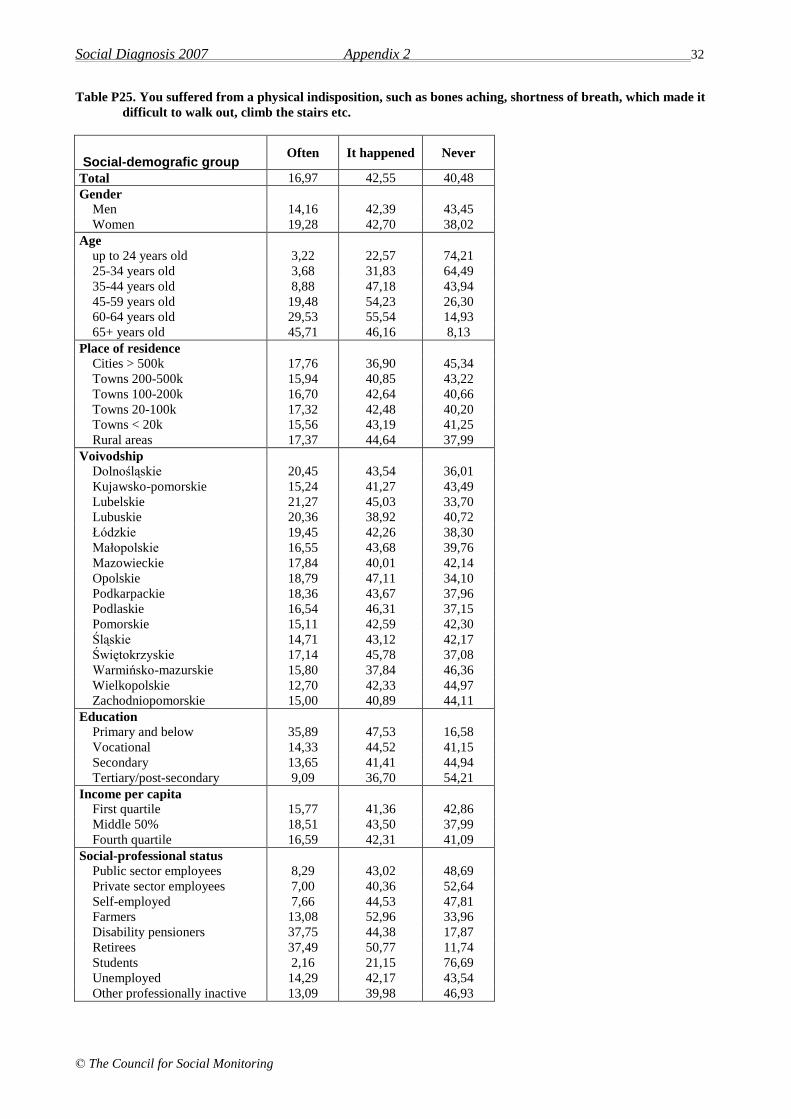
Social Diagnosis 2007 Appendix 2 32
© The Council for Social Monitoring
Table P25. You suffered from a physical indisposition, such as bones aching, shortness of breath, which made it
difficult to walk out, climb the stairs etc.
Social-demografic group Often It happened Never
Total 16,97 42,55 40,48
Gender
Men 14,16 42,39 43,45
Women 19,28 42,70 38,02
Age
up to 24 years old 3,22 22,57 74,21
25-34 years old 3,68 31,83 64,49
35-44 years old 8,88 47,18 43,94
45-59 years old 19,48 54,23 26,30
60-64 years old 29,53 55,54 14,93
65+ years old 45,71 46,16 8,13
Place of residence
Cities > 500k 17,76 36,90 45,34
Towns 200-500k 15,94 40,85 43,22
Towns 100-200k 16,70 42,64 40,66
Towns 20-100k 17,32 42,48 40,20
Towns < 20k 15,56 43,19 41,25
Rural areas 17,37 44,64 37,99
Voivodship
Dolnośląskie 20,45 43,54 36,01
Kujawsko-pomorskie 15,24 41,27 43,49
Lubelskie 21,27 45,03 33,70
Lubuskie 20,36 38,92 40,72
Łódzkie 19,45 42,26 38,30
Małopolskie 16,55 43,68 39,76
Mazowieckie 17,84 40,01 42,14
Opolskie 18,79 47,11 34,10
Podkarpackie 18,36 43,67 37,96
Podlaskie 16,54 46,31 37,15
Pomorskie 15,11 42,59 42,30
Śląskie 14,71 43,12 42,17
Świętokrzyskie 17,14 45,78 37,08
Warmińsko-mazurskie 15,80 37,84 46,36
Wielkopolskie 12,70 42,33 44,97
Zachodniopomorskie 15,00 40,89 44,11
Education
Primary and below 35,89 47,53 16,58
Vocational 14,33 44,52 41,15
Secondary 13,65 41,41 44,94
Tertiary/post-secondary 9,09 36,70 54,21
Income per capita
First quartile 15,77 41,36 42,86
Middle 50% 18,51 43,50 37,99
Fourth quartile 16,59 42,31 41,09
Social-professional status
Public sector employees 8,29 43,02 48,69
Private sector employees 7,00 40,36 52,64
Self-employed 7,66 44,53 47,81
Farmers 13,08 52,96 33,96
Disability pensioners 37,75 44,38 17,87
Retirees 37,49 50,77 11,74
Students 2,16 21,15 76,69
Unemployed 14,29 42,17 43,54
Other professionally inactive 13,09 39,98 46,93

Social Diagnosis 2007 Appendix 2 33
© The Council for Social Monitoring
Table P26. Health problems made it difficult for you to perform everyday tasks or participate in other activities
Social-demografic group Often It happened Never
Total 13,87 44,03 42,09
Gender
Men 11,32 42,81 45,87
Women 15,97 45,06 38,96
Age
up to 24 years old 3,38 26,29 70,33
25-34 years old 3,31 33,93 62,76
35-44 years old 6,93 47,52 45,55
45-59 years old 15,53 53,93 30,54
60-64 years old 22,22 54,38 23,40
65+ years old 37,93 49,63 12,44
Place of residence
Cities > 500k 14,30 39,31 46,39
Towns 200-500k 12,88 45,82 41,30
Towns 100-200k 13,23 44,68 42,09
Towns 20-100k 14,31 43,11 42,58
Towns < 20k 12,24 46,13 41,62
Rural areas 14,49 44,57 40,94
Voivodship
Dolnośląskie 16,72 43,32 39,96
Kujawsko-pomorskie 11,57 44,53 43,90
Lubelskie 17,27 47,79 34,94
Lubuskie 19,46 41,02 39,52
Łódzkie 16,79 44,72 38,49
Małopolskie 14,69 44,07 41,23
Mazowieckie 13,53 42,29 44,18
Opolskie 14,20 49,57 36,23
Podkarpackie 13,93 47,68 38,39
Podlaskie 13,42 48,61 37,97
Pomorskie 12,21 42,24 45,55
Śląskie 11,68 43,75 44,57
Świętokrzyskie 15,60 47,06 37,34
Warmińsko-mazurskie 14,61 39,67 45,72
Wielkopolskie 9,88 42,62 47,51
Zachodniopomorskie 13,04 42,14 44,82
Education
Primary and below 30,88 48,53 20,59
Vocational 11,68 44,79 43,52
Secondary 10,68 42,98 46,34
Tertiary/post-secondary 6,99 40,33 52,68
Income per capita
First quartile 12,96 42,06 44,97
Middle 50% 15,71 44,72 39,58
Fourth quartile 12,83 44,72 42,45
Social-professional status
Public sector employees 6,27 43,97 49,75
Private sector employees 4,98 41,04 53,98
Self-employed 5,99 46,82 47,19
Farmers 8,26 51,87 39,88
Disability pensioners 36,41 45,14 18,46
Retirees 29,84 53,03 17,12
Students 2,35 26,06 71,59
Unemployed 10,30 43,71 46,00
Other professionally inactive 13,08 40,97 45,95

Social Diagnosis 2007 Appendix 2 34
© The Council for Social Monitoring
Table P27. You had to deal with some formal matters
Social-demografic group Often It happened Never
Total 38,71 61,28 0,01
Gender
Men 40,57 59,41 0,02
Women 37,17 62,83 0,00
Age
up to 24 years old 32,58 67,42 0,00
25-34 years old 51,56 48,44 0,00
35-44 years old 47,09 52,91 0,00
45-59 years old 42,58 57,39 0,03
60-64 years old 29,30 70,70 0,00
65+ years old 17,32 82,68 0,00
Place of residence
Cities > 500k 46,06 53,94 0,00
Towns 200-500k 40,65 59,28 0,07
Towns 100-200k 43,39 56,61 0,00
Towns 20-100k 38,12 61,88 0,00
Towns < 20k 36,25 63,75 0,00
Rural areas 36,02 63,98 0,00
Voivodship
Dolnośląskie 38,18 61,82 0,00
Kujawsko-pomorskie 34,30 65,53 0,16
Lubelskie 36,57 63,43 0,00
Lubuskie 43,77 56,23 0,00
Łódzkie 36,30 63,70 0,00
Małopolskie 40,49 59,51 0,00
Mazowieckie 42,20 57,80 0,00
Opolskie 39,18 60,82 0,00
Podkarpackie 37,42 62,58 0,00
Podlaskie 37,91 62,09 0,00
Pomorskie 38,51 61,49 0,00
Śląskie 40,23 59,77 0,00
Świętokrzyskie 33,33 66,67 0,00
Warmińsko-mazurskie 36,06 63,94 0,00
Wielkopolskie 38,71 61,29 0,00
Zachodniopomorskie 38,24 61,76 0,00
Education
Primary and below 19,95 80,05 0,00
Vocational 35,66 64,34 0,00
Secondary 43,50 56,50 0,00
Tertiary/post-secondary 53,09 46,87 0,04
Income per capita
First quartile 37,84 62,16 0,00
Middle 50% 37,17 62,83 0,00
Fourth quartile 41,21 58,77 0,03
Social-professional status
Public sector employees 47,25 52,70 0,06
Private sector employees 43,54 56,46 0,00
Self-employed 69,51 30,49 0,00
Farmers 53,27 46,73 0,00
Disability pensioners 31,12 68,88 0,00
Retirees 22,19 77,81 0,00
Students 27,05 72,95 0,00
Unemployed 47,93 52,07 0,00
Other professionally inactive 36,78 63,22 0,00
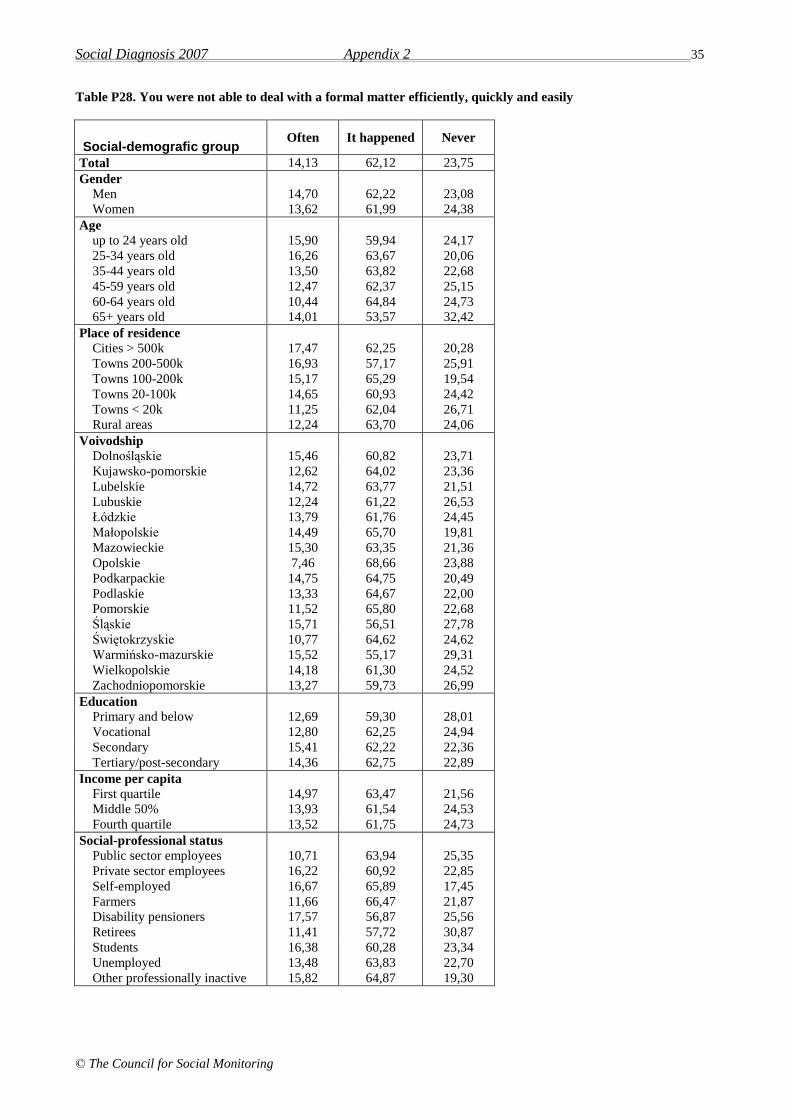
Social Diagnosis 2007 Appendix 2 35
© The Council for Social Monitoring
Table P28. You were not able to deal with a formal matter efficiently, quickly and easily
Social-demografic group Often It happened Never
Total 14,13 62,12 23,75
Gender
Men 14,70 62,22 23,08
Women 13,62 61,99 24,38
Age
up to 24 years old 15,90 59,94 24,17
25-34 years old 16,26 63,67 20,06
35-44 years old 13,50 63,82 22,68
45-59 years old 12,47 62,37 25,15
60-64 years old 10,44 64,84 24,73
65+ years old 14,01 53,57 32,42
Place of residence
Cities > 500k 17,47 62,25 20,28
Towns 200-500k 16,93 57,17 25,91
Towns 100-200k 15,17 65,29 19,54
Towns 20-100k 14,65 60,93 24,42
Towns < 20k 11,25 62,04 26,71
Rural areas 12,24 63,70 24,06
Voivodship
Dolnośląskie 15,46 60,82 23,71
Kujawsko-pomorskie 12,62 64,02 23,36
Lubelskie 14,72 63,77 21,51
Lubuskie 12,24 61,22 26,53
Łódzkie 13,79 61,76 24,45
Małopolskie 14,49 65,70 19,81
Mazowieckie 15,30 63,35 21,36
Opolskie 7,46 68,66 23,88
Podkarpackie 14,75 64,75 20,49
Podlaskie 13,33 64,67 22,00
Pomorskie 11,52 65,80 22,68
Śląskie 15,71 56,51 27,78
Świętokrzyskie 10,77 64,62 24,62
Warmińsko-mazurskie 15,52 55,17 29,31
Wielkopolskie 14,18 61,30 24,52
Zachodniopomorskie 13,27 59,73 26,99
Education
Primary and below 12,69 59,30 28,01
Vocational 12,80 62,25 24,94
Secondary 15,41 62,22 22,36
Tertiary/post-secondary 14,36 62,75 22,89
Income per capita
First quartile 14,97 63,47 21,56
Middle 50% 13,93 61,54 24,53
Fourth quartile 13,52 61,75 24,73
Social-professional status
Public sector employees 10,71 63,94 25,35
Private sector employees 16,22 60,92 22,85
Self-employed 16,67 65,89 17,45
Farmers 11,66 66,47 21,87
Disability pensioners 17,57 56,87 25,56
Retirees 11,41 57,72 30,87
Students 16,38 60,28 23,34
Unemployed 13,48 63,83 22,70
Other professionally inactive 15,82 64,87 19,30
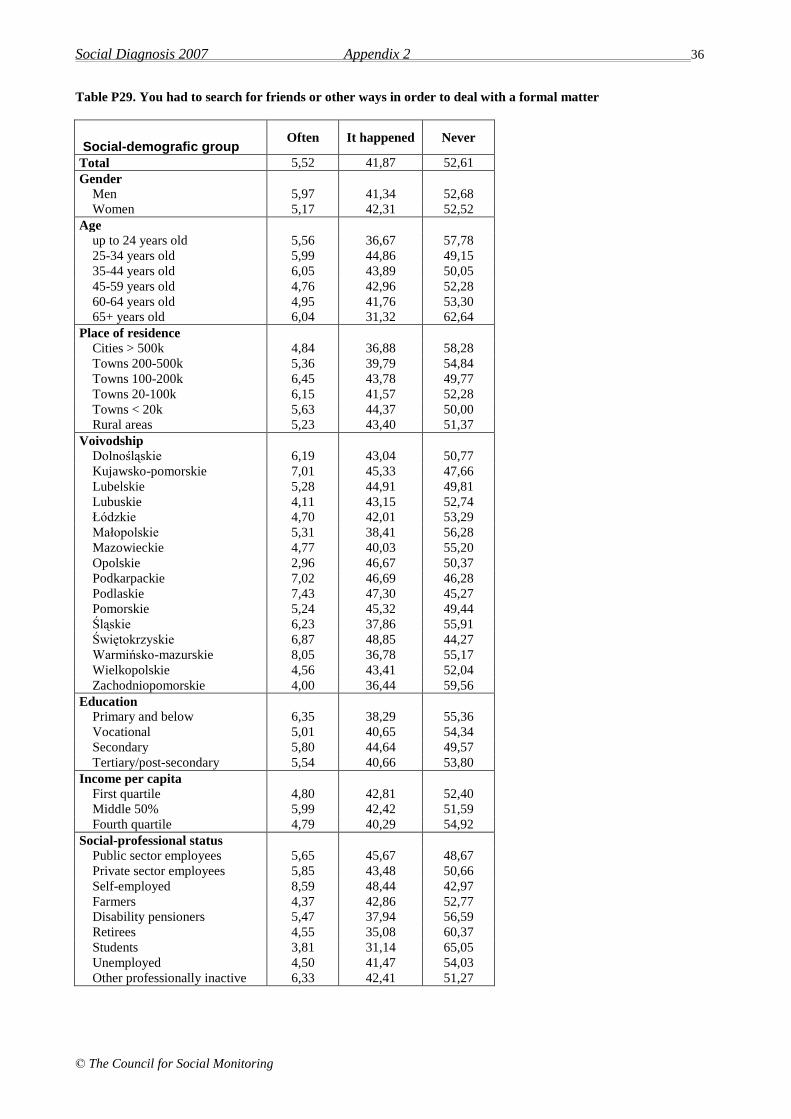
Social Diagnosis 2007 Appendix 2 36
© The Council for Social Monitoring
Table P29. You had to search for friends or other ways in order to deal with a formal matter
Social-demografic group Often It happened Never
Total 5,52 41,87 52,61
Gender
Men 5,97 41,34 52,68
Women 5,17 42,31 52,52
Age
up to 24 years old 5,56 36,67 57,78
25-34 years old 5,99 44,86 49,15
35-44 years old 6,05 43,89 50,05
45-59 years old 4,76 42,96 52,28
60-64 years old 4,95 41,76 53,30
65+ years old 6,04 31,32 62,64
Place of residence
Cities > 500k 4,84 36,88 58,28
Towns 200-500k 5,36 39,79 54,84
Towns 100-200k 6,45 43,78 49,77
Towns 20-100k 6,15 41,57 52,28
Towns < 20k 5,63 44,37 50,00
Rural areas 5,23 43,40 51,37
Voivodship
Dolnośląskie 6,19 43,04 50,77
Kujawsko-pomorskie 7,01 45,33 47,66
Lubelskie 5,28 44,91 49,81
Lubuskie 4,11 43,15 52,74
Łódzkie 4,70 42,01 53,29
Małopolskie 5,31 38,41 56,28
Mazowieckie 4,77 40,03 55,20
Opolskie 2,96 46,67 50,37
Podkarpackie 7,02 46,69 46,28
Podlaskie 7,43 47,30 45,27
Pomorskie 5,24 45,32 49,44
Śląskie 6,23 37,86 55,91
Świętokrzyskie 6,87 48,85 44,27
Warmińsko-mazurskie 8,05 36,78 55,17
Wielkopolskie 4,56 43,41 52,04
Zachodniopomorskie 4,00 36,44 59,56
Education
Primary and below 6,35 38,29 55,36
Vocational 5,01 40,65 54,34
Secondary 5,80 44,64 49,57
Tertiary/post-secondary 5,54 40,66 53,80
Income per capita
First quartile 4,80 42,81 52,40
Middle 50% 5,99 42,42 51,59
Fourth quartile 4,79 40,29 54,92
Social-professional status
Public sector employees 5,65 45,67 48,67
Private sector employees 5,85 43,48 50,66
Self-employed 8,59 48,44 42,97
Farmers 4,37 42,86 52,77
Disability pensioners 5,47 37,94 56,59
Retirees 4,55 35,08 60,37
Students 3,81 31,14 65,05
Unemployed 4,50 41,47 54,03
Other professionally inactive 6,33 42,41 51,27

Social Diagnosis 2007 Appendix 2 37
© The Council for Social Monitoring
Table P30. You felt completely helpless and humiliated when dealing with a formal matter
Social-demografic group Often It happened Never
Total 5,63 41,21 53,16
Gender
Men 5,75 39,71 54,53
Women 5,56 42,47 51,97
Age
up to 24 years old 4,60 33,02 62,38
25-34 years old 4,70 41,05 54,25
35-44 years old 5,72 45,79 48,49
45-59 years old 6,24 42,78 50,98
60-64 years old 6,56 45,90 47,54
65+ years old 7,48 34,90 57,62
Place of residence
Cities > 500k 6,71 42,12 51,17
Towns 200-500k 6,03 38,62 55,34
Towns 100-200k 5,72 43,25 51,03
Towns 20-100k 5,52 42,04 52,44
Towns < 20k 4,05 42,43 53,52
Rural areas 5,78 40,15 54,08
Voivodship
Dolnośląskie 6,20 41,60 52,20
Kujawsko-pomorskie 4,23 41,78 53,99
Lubelskie 6,79 43,02 50,19
Lubuskie 5,44 33,33 61,22
Łódzkie 5,33 37,30 57,37
Małopolskie 6,27 41,20 52,53
Mazowieckie 5,32 44,25 50,43
Opolskie 2,96 50,37 46,67
Podkarpackie 7,82 39,09 53,09
Podlaskie 4,73 42,57 52,70
Pomorskie 4,10 42,16 53,73
Śląskie 6,07 40,58 53,35
Świętokrzyskie 4,58 45,80 49,62
Warmińsko-mazurskie 6,90 39,08 54,02
Wielkopolskie 5,77 39,90 54,33
Zachodniopomorskie 4,85 37,00 58,15
Education
Primary and below 6,58 39,25 54,17
Vocational 5,29 42,10 52,61
Secondary 6,66 39,66 53,68
Tertiary/post-secondary 4,35 42,92 52,73
Income per capita
First quartile 6,60 44,54 48,86
Middle 50% 6,22 40,85 52,92
Fourth quartile 4,37 39,04 56,59
Social-professional status
Public sector employees 4,59 41,33 54,08
Private sector employees 5,07 40,05 54,88
Self-employed 5,99 44,01 50,00
Farmers 4,96 39,36 55,69
Disability pensioners 8,65 43,59 47,76
Retirees 7,07 39,06 53,87
Students 3,11 30,80 66,09
Unemployed 5,92 47,16 46,92
Other professionally inactive 7,62 46,67 45,71
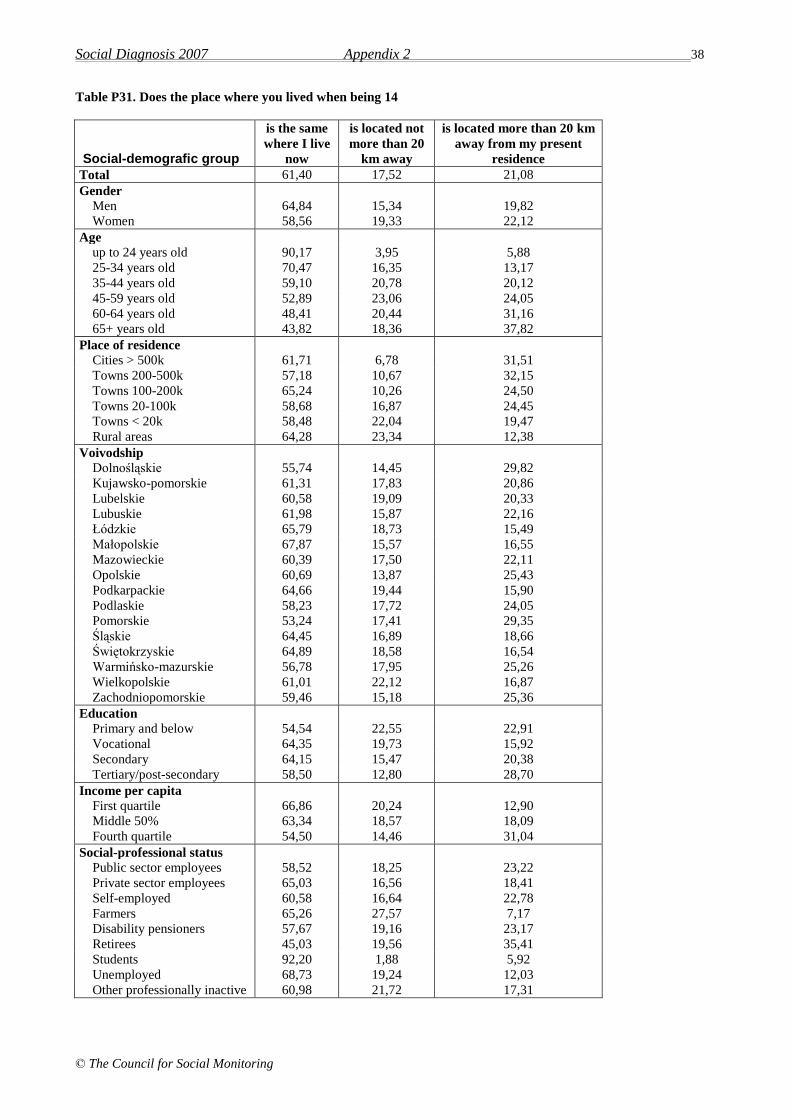
Social Diagnosis 2007 Appendix 2 38
© The Council for Social Monitoring
Table P31. Does the place where you lived when being 14
Social-demografic group
is the same
where I live
now
is located not
more than 20
km away
is located more than 20 km
away from my present
residence
Total 61,40 17,52 21,08
Gender
Men 64,84 15,34 19,82
Women 58,56 19,33 22,12
Age
up to 24 years old 90,17 3,95 5,88
25-34 years old 70,47 16,35 13,17
35-44 years old 59,10 20,78 20,12
45-59 years old 52,89 23,06 24,05
60-64 years old 48,41 20,44 31,16
65+ years old 43,82 18,36 37,82
Place of residence
Cities > 500k 61,71 6,78 31,51
Towns 200-500k 57,18 10,67 32,15
Towns 100-200k 65,24 10,26 24,50
Towns 20-100k 58,68 16,87 24,45
Towns < 20k 58,48 22,04 19,47
Rural areas 64,28 23,34 12,38
Voivodship
Dolnośląskie 55,74 14,45 29,82
Kujawsko-pomorskie 61,31 17,83 20,86
Lubelskie 60,58 19,09 20,33
Lubuskie 61,98 15,87 22,16
Łódzkie 65,79 18,73 15,49
Małopolskie 67,87 15,57 16,55
Mazowieckie 60,39 17,50 22,11
Opolskie 60,69 13,87 25,43
Podkarpackie 64,66 19,44 15,90
Podlaskie 58,23 17,72 24,05
Pomorskie 53,24 17,41 29,35
Śląskie 64,45 16,89 18,66
Świętokrzyskie 64,89 18,58 16,54
Warmińsko-mazurskie 56,78 17,95 25,26
Wielkopolskie 61,01 22,12 16,87
Zachodniopomorskie 59,46 15,18 25,36
Education
Primary and below 54,54 22,55 22,91
Vocational 64,35 19,73 15,92
Secondary 64,15 15,47 20,38
Tertiary/post-secondary 58,50 12,80 28,70
Income per capita
First quartile 66,86 20,24 12,90
Middle 50% 63,34 18,57 18,09
Fourth quartile 54,50 14,46 31,04
Social-professional status
Public sector employees 58,52 18,25 23,22
Private sector employees 65,03 16,56 18,41
Self-employed 60,58 16,64 22,78
Farmers 65,26 27,57 7,17
Disability pensioners 57,67 19,16 23,17
Retirees 45,03 19,56 35,41
Students 92,20 1,88 5,92
Unemployed 68,73 19,24 12,03
Other professionally inactive 60,98 21,72 17,31
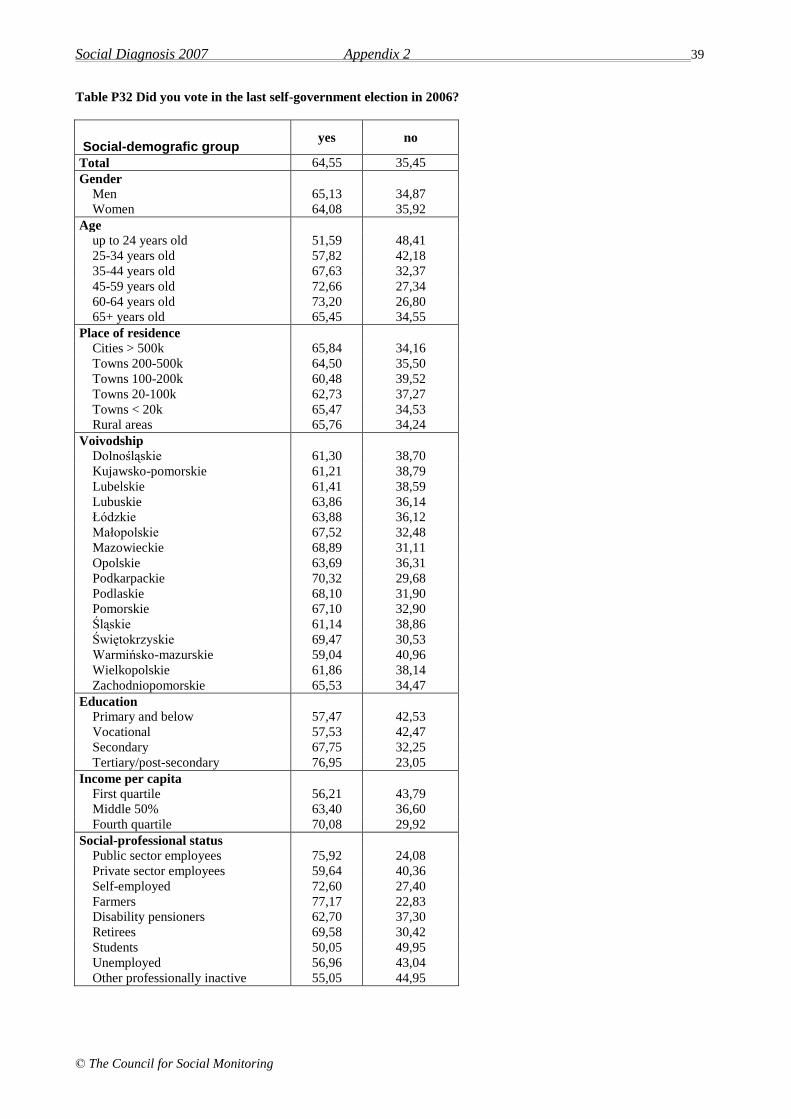
Social Diagnosis 2007 Appendix 2 39
© The Council for Social Monitoring
Table P32 Did you vote in the last self-government election in 2006?
Social-demografic group yes no
Total 64,55 35,45
Gender
Men 65,13 34,87
Women 64,08 35,92
Age
up to 24 years old 51,59 48,41
25-34 years old 57,82 42,18
35-44 years old 67,63 32,37
45-59 years old 72,66 27,34
60-64 years old 73,20 26,80
65+ years old 65,45 34,55
Place of residence
Cities > 500k 65,84 34,16
Towns 200-500k 64,50 35,50
Towns 100-200k 60,48 39,52
Towns 20-100k 62,73 37,27
Towns < 20k 65,47 34,53
Rural areas 65,76 34,24
Voivodship
Dolnośląskie 61,30 38,70
Kujawsko-pomorskie 61,21 38,79
Lubelskie 61,41 38,59
Lubuskie 63,86 36,14
Łódzkie 63,88 36,12
Małopolskie 67,52 32,48
Mazowieckie 68,89 31,11
Opolskie 63,69 36,31
Podkarpackie 70,32 29,68
Podlaskie 68,10 31,90
Pomorskie 67,10 32,90
Śląskie 61,14 38,86
Świętokrzyskie 69,47 30,53
Warmińsko-mazurskie 59,04 40,96
Wielkopolskie 61,86 38,14
Zachodniopomorskie 65,53 34,47
Education
Primary and below 57,47 42,53
Vocational 57,53 42,47
Secondary 67,75 32,25
Tertiary/post-secondary 76,95 23,05
Income per capita
First quartile 56,21 43,79
Middle 50% 63,40 36,60
Fourth quartile 70,08 29,92
Social-professional status
Public sector employees 75,92 24,08
Private sector employees 59,64 40,36
Self-employed 72,60 27,40
Farmers 77,17 22,83
Disability pensioners 62,70 37,30
Retirees 69,58 30,42
Students 50,05 49,95
Unemployed 56,96 43,04
Other professionally inactive 55,05 44,95
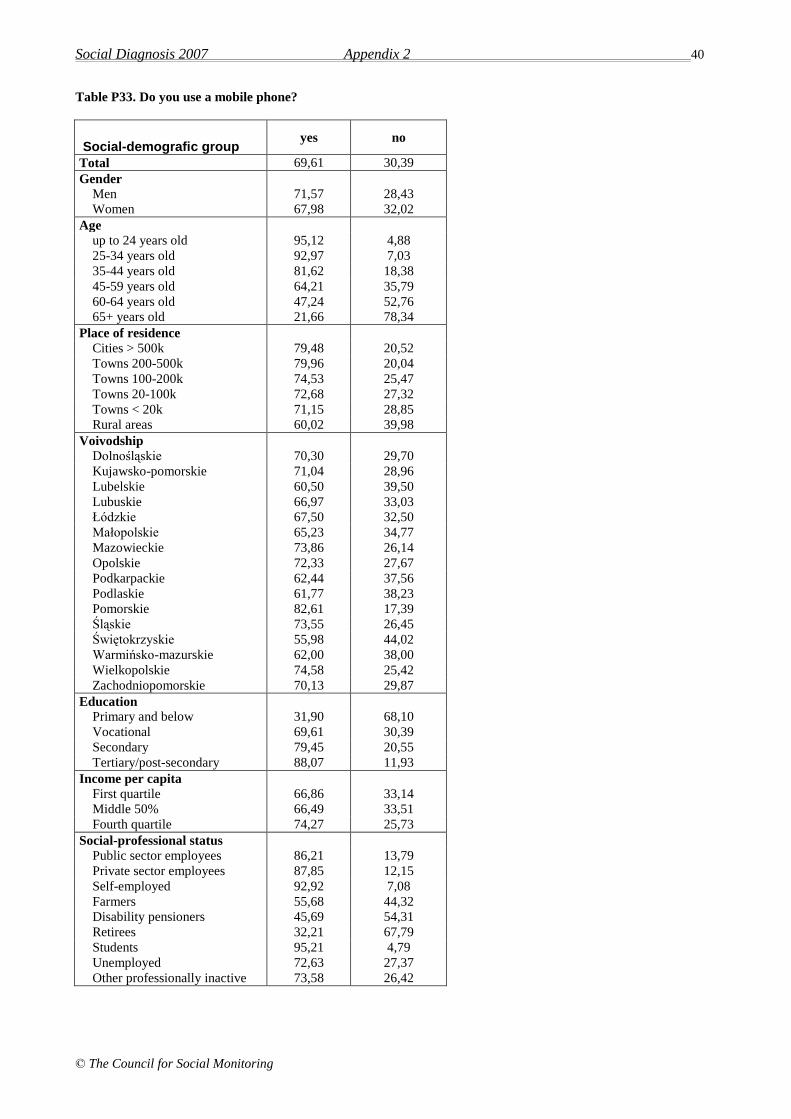
Social Diagnosis 2007 Appendix 2 40
© The Council for Social Monitoring
Table P33. Do you use a mobile phone?
Social-demografic group yes no
Total 69,61 30,39
Gender
Men 71,57 28,43
Women 67,98 32,02
Age
up to 24 years old 95,12 4,88
25-34 years old 92,97 7,03
35-44 years old 81,62 18,38
45-59 years old 64,21 35,79
60-64 years old 47,24 52,76
65+ years old 21,66 78,34
Place of residence
Cities > 500k 79,48 20,52
Towns 200-500k 79,96 20,04
Towns 100-200k 74,53 25,47
Towns 20-100k 72,68 27,32
Towns < 20k 71,15 28,85
Rural areas 60,02 39,98
Voivodship
Dolnośląskie 70,30 29,70
Kujawsko-pomorskie 71,04 28,96
Lubelskie 60,50 39,50
Lubuskie 66,97 33,03
Łódzkie 67,50 32,50
Małopolskie 65,23 34,77
Mazowieckie 73,86 26,14
Opolskie 72,33 27,67
Podkarpackie 62,44 37,56
Podlaskie 61,77 38,23
Pomorskie 82,61 17,39
Śląskie 73,55 26,45
Świętokrzyskie 55,98 44,02
Warmińsko-mazurskie 62,00 38,00
Wielkopolskie 74,58 25,42
Zachodniopomorskie 70,13 29,87
Education
Primary and below 31,90 68,10
Vocational 69,61 30,39
Secondary 79,45 20,55
Tertiary/post-secondary 88,07 11,93
Income per capita
First quartile 66,86 33,14
Middle 50% 66,49 33,51
Fourth quartile 74,27 25,73
Social-professional status
Public sector employees 86,21 13,79
Private sector employees 87,85 12,15
Self-employed 92,92 7,08
Farmers 55,68 44,32
Disability pensioners 45,69 54,31
Retirees 32,21 67,79
Students 95,21 4,79
Unemployed 72,63 27,37
Other professionally inactive 73,58 26,42

Social Diagnosis 2007 Appendix 2 41
© The Council for Social Monitoring
Table P34. You began a better paid or additional job
Social-demografic group yes no
Total 11,62 88,38
Gender
Men 14,11 85,89
Women 9,57 90,43
Age
up to 24 years old 16,66 83,34
25-34 years old 22,00 78,00
35-44 years old 12,99 87,01
45-59 years old 8,37 91,63
60-64 years old 4,71 95,29
65+ years old 0,75 99,25
Place of residence
Cities > 500k 16,18 83,82
Towns 200-500k 15,72 84,28
Towns 100-200k 14,10 85,90
Towns 20-100k 10,21 89,79
Towns < 20k 12,95 87,05
Rural areas 8,70 91,30
Voivodship
Dolnośląskie 12,36 87,64
Kujawsko-pomorskie 11,16 88,84
Lubelskie 7,88 92,12
Lubuskie 12,28 87,72
Łódzkie 9,95 90,05
Małopolskie 10,51 89,49
Mazowieckie 13,99 86,01
Opolskie 13,33 86,67
Podkarpackie 10,25 89,75
Podlaskie 11,39 88,61
Pomorskie 14,51 85,49
Śląskie 11,27 88,73
Świętokrzyskie 9,18 90,82
Warmińsko-mazurskie 10,60 89,40
Wielkopolskie 11,26 88,74
Zachodniopomorskie 14,11 85,89
Education
Primary and below 4,30 95,70
Vocational 10,91 89,09
Secondary 12,60 87,40
Tertiary/post-secondary 17,87 82,13
Income per capita
First quartile 10,84 89,16
Middle 50% 10,60 89,40
Fourth quartile 14,08 85,92
Social-professional status
Public sector employees 15,80 84,20
Private sector employees 23,67 76,33
Self-employed 19,42 80,58
Farmers 5,60 94,40
Disability pensioners 2,01 97,99
Retirees 2,98 97,02
Students 9,09 90,91
Unemployed 7,08 92,92
Other professionally inactive 6,29 93,71
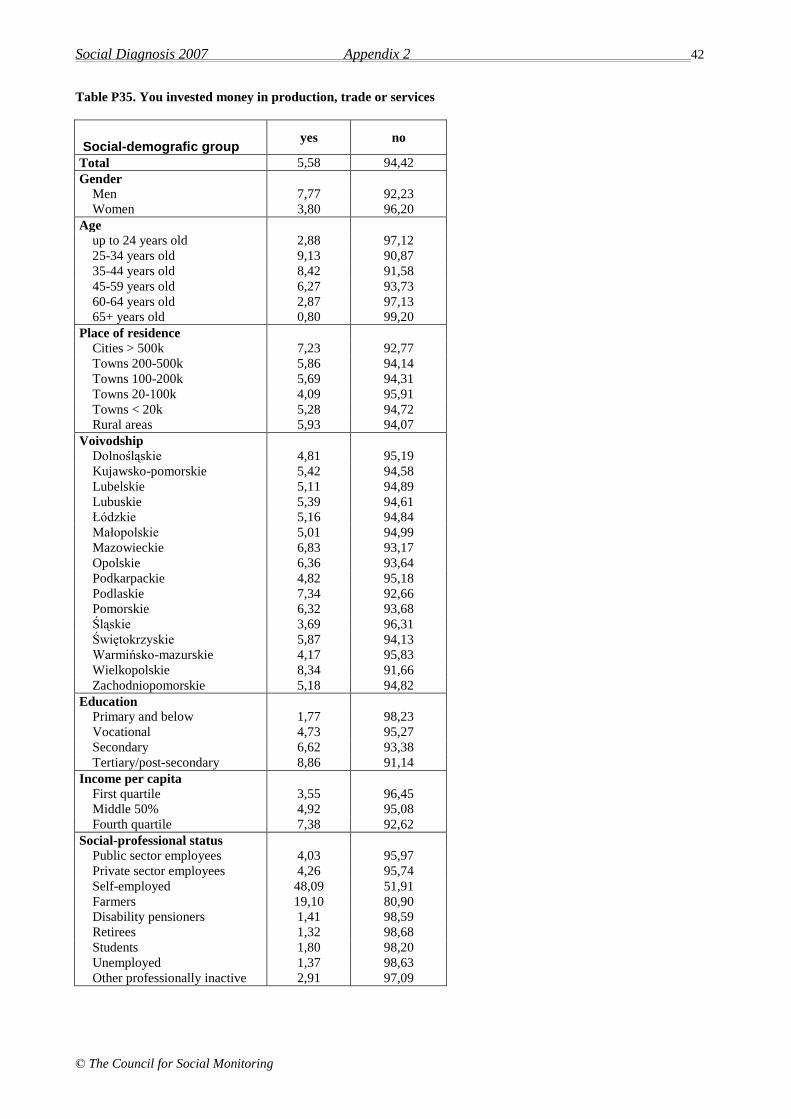
Social Diagnosis 2007 Appendix 2 42
© The Council for Social Monitoring
Table P35. You invested money in production, trade or services
Social-demografic group yes no
Total 5,58 94,42
Gender
Men 7,77 92,23
Women 3,80 96,20
Age
up to 24 years old 2,88 97,12
25-34 years old 9,13 90,87
35-44 years old 8,42 91,58
45-59 years old 6,27 93,73
60-64 years old 2,87 97,13
65+ years old 0,80 99,20
Place of residence
Cities > 500k 7,23 92,77
Towns 200-500k 5,86 94,14
Towns 100-200k 5,69 94,31
Towns 20-100k 4,09 95,91
Towns < 20k 5,28 94,72
Rural areas 5,93 94,07
Voivodship
Dolnośląskie 4,81 95,19
Kujawsko-pomorskie 5,42 94,58
Lubelskie 5,11 94,89
Lubuskie 5,39 94,61
Łódzkie 5,16 94,84
Małopolskie 5,01 94,99
Mazowieckie 6,83 93,17
Opolskie 6,36 93,64
Podkarpackie 4,82 95,18
Podlaskie 7,34 92,66
Pomorskie 6,32 93,68
Śląskie 3,69 96,31
Świętokrzyskie 5,87 94,13
Warmińsko-mazurskie 4,17 95,83
Wielkopolskie 8,34 91,66
Zachodniopomorskie 5,18 94,82
Education
Primary and below 1,77 98,23
Vocational 4,73 95,27
Secondary 6,62 93,38
Tertiary/post-secondary 8,86 91,14
Income per capita
First quartile 3,55 96,45
Middle 50% 4,92 95,08
Fourth quartile 7,38 92,62
Social-professional status
Public sector employees 4,03 95,97
Private sector employees 4,26 95,74
Self-employed 48,09 51,91
Farmers 19,10 80,90
Disability pensioners 1,41 98,59
Retirees 1,32 98,68
Students 1,80 98,20
Unemployed 1,37 98,63
Other professionally inactive 2,91 97,09

Social Diagnosis 2007 Appendix 2 43
© The Council for Social Monitoring
Table P36. You earned money on shares, bonds or participation units in a fund
Social-demografic group yes no
Total 3,54 96,46
Gender
Men 4,07 95,93
Women 3,10 96,90
Age
up to 24 years old 2,19 97,81
25-34 years old 4,43 95,57
35-44 years old 4,52 95,48
45-59 years old 4,35 95,65
60-64 years old 3,37 96,63
65+ years old 1,54 98,46
Place of residence
Cities > 500k 5,97 94,03
Towns 200-500k 6,35 93,65
Towns 100-200k 4,20 95,80
Towns 20-100k 4,53 95,47
Towns < 20k 2,83 97,17
Rural areas 1,44 98,56
Voivodship
Dolnośląskie 3,07 96,93
Kujawsko-pomorskie 2,23 97,77
Lubelskie 3,59 96,41
Lubuskie 4,49 95,51
Łódzkie 2,52 97,48
Małopolskie 3,83 96,17
Mazowieckie 5,17 94,83
Opolskie 2,88 97,12
Podkarpackie 4,81 95,19
Podlaskie 3,80 96,20
Pomorskie 4,02 95,98
Śląskie 2,29 97,71
Świętokrzyskie 3,82 96,18
Warmińsko-mazurskie 2,07 97,93
Wielkopolskie 3,94 96,06
Zachodniopomorskie 3,39 96,61
Education
Primary and below 0,41 99,59
Vocational 1,14 98,86
Secondary 3,37 96,63
Tertiary/post-secondary 10,43 89,57
Income per capita
First quartile 0,68 99,32
Middle 50% 1,95 98,05
Fourth quartile 7,34 92,66
Social-professional status
Public sector employees 6,21 93,79
Private sector employees 4,91 95,09
Self-employed 8,53 91,47
Farmers 0,47 99,53
Disability pensioners 1,21 98,79
Retirees 2,13 97,87
Students 2,37 97,63
Unemployed 1,94 98,06
Other professionally inactive 2,33 97,67

Social Diagnosis 2007 Appendix 2 44
© The Council for Social Monitoring
Table P37. You obtained new qualifications or skills with an aim of getting better payments
Social-demografic group yes no
Total 14,44 85,56
Gender
Men 15,45 84,55
Women 13,57 86,43
Age
up to 24 years old 24,09 75,91
25-34 years old 27,42 72,58
35-44 years old 18,18 81,82
45-59 years old 8,28 91,72
60-64 years old 1,52 98,48
65+ years old 0,35 99,65
Place of residence
Cities > 500k 25,44 74,56
Towns 200-500k 21,05 78,95
Towns 100-200k 15,90 84,10
Towns 20-100k 13,72 86,28
Towns < 20k 13,45 86,55
Rural areas 9,37 90,63
Voivodship
Dolnośląskie 14,83 85,17
Kujawsko-pomorskie 12,92 87,08
Lubelskie 12,74 87,26
Lubuskie 14,97 85,03
Łódzkie 14,39 85,61
Małopolskie 16,22 83,78
Mazowieckie 17,30 82,70
Opolskie 15,56 84,44
Podkarpackie 14,91 85,09
Podlaskie 17,51 82,49
Pomorskie 16,81 83,19
Śląskie 13,22 86,78
Świętokrzyskie 12,98 87,02
Warmińsko-mazurskie 7,07 92,93
Wielkopolskie 13,05 86,95
Zachodniopomorskie 12,86 87,14
Education
Primary and below 2,22 97,78
Vocational 7,70 92,30
Secondary 17,61 82,39
Tertiary/post-secondary 30,99 69,01
Income per capita
First quartile 9,20 90,80
Middle 50% 12,82 87,18
Fourth quartile 19,64 80,36
Social-professional status
Public sector employees 26,88 73,12
Private sector employees 22,69 77,31
Self-employed 24,00 76,00
Farmers 4,98 95,02
Disability pensioners 3,42 96,58
Retirees 0,85 99,15
Students 21,88 78,13
Unemployed 11,77 88,23
Other professionally inactive 7,80 92,20
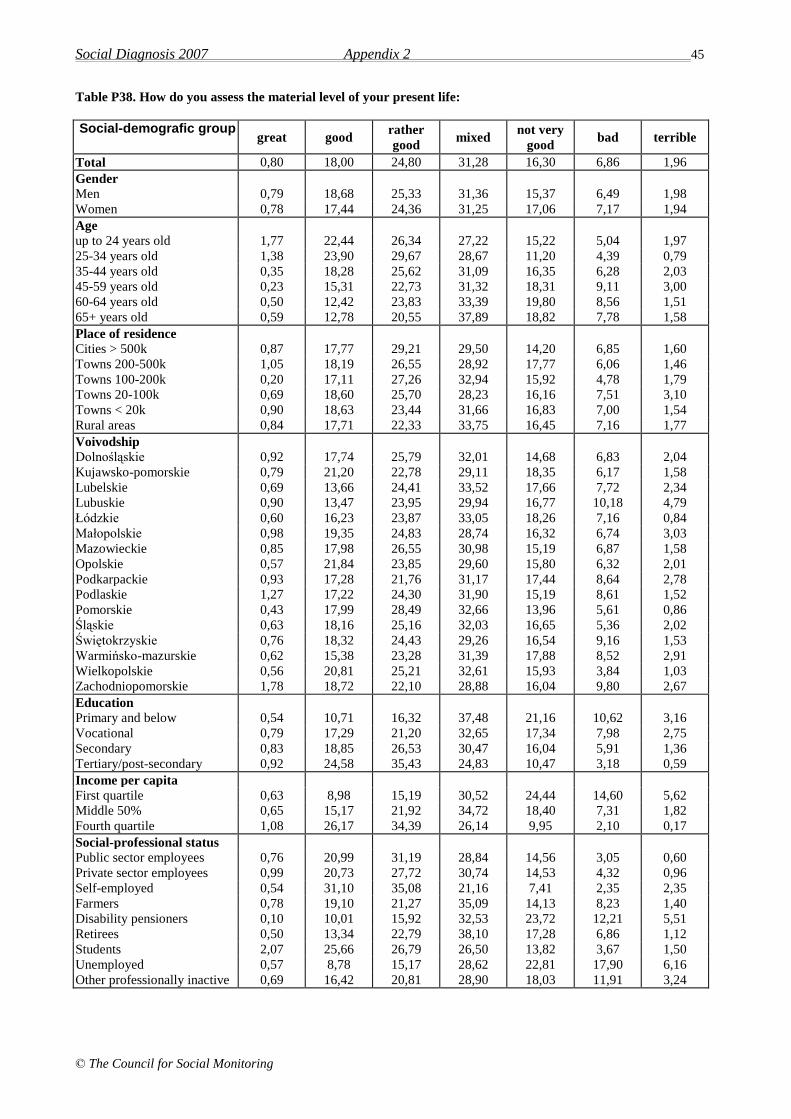
Social Diagnosis 2007 Appendix 2 45
© The Council for Social Monitoring
Table P38. How do you assess the material level of your present life:
Social-demografic group great good
rather
good mixed
not very
good bad terrible
Total 0,80 18,00 24,80 31,28 16,30 6,86 1,96
Gender
Men 0,79 18,68 25,33 31,36 15,37 6,49 1,98
Women 0,78 17,44 24,36 31,25 17,06 7,17 1,94
Age
up to 24 years old 1,77 22,44 26,34 27,22 15,22 5,04 1,97
25-34 years old 1,38 23,90 29,67 28,67 11,20 4,39 0,79
35-44 years old 0,35 18,28 25,62 31,09 16,35 6,28 2,03
45-59 years old 0,23 15,31 22,73 31,32 18,31 9,11 3,00
60-64 years old 0,50 12,42 23,83 33,39 19,80 8,56 1,51
65+ years old 0,59 12,78 20,55 37,89 18,82 7,78 1,58
Place of residence
Cities > 500k 0,87 17,77 29,21 29,50 14,20 6,85 1,60
Towns 200-500k 1,05 18,19 26,55 28,92 17,77 6,06 1,46
Towns 100-200k 0,20 17,11 27,26 32,94 15,92 4,78 1,79
Towns 20-100k 0,69 18,60 25,70 28,23 16,16 7,51 3,10
Towns < 20k 0,90 18,63 23,44 31,66 16,83 7,00 1,54
Rural areas 0,84 17,71 22,33 33,75 16,45 7,16 1,77
Voivodship
Dolnośląskie 0,92 17,74 25,79 32,01 14,68 6,83 2,04
Kujawsko-pomorskie 0,79 21,20 22,78 29,11 18,35 6,17 1,58
Lubelskie 0,69 13,66 24,41 33,52 17,66 7,72 2,34
Lubuskie 0,90 13,47 23,95 29,94 16,77 10,18 4,79
Łódzkie 0,60 16,23 23,87 33,05 18,26 7,16 0,84
Małopolskie 0,98 19,35 24,83 28,74 16,32 6,74 3,03
Mazowieckie 0,85 17,98 26,55 30,98 15,19 6,87 1,58
Opolskie 0,57 21,84 23,85 29,60 15,80 6,32 2,01
Podkarpackie 0,93 17,28 21,76 31,17 17,44 8,64 2,78
Podlaskie 1,27 17,22 24,30 31,90 15,19 8,61 1,52
Pomorskie 0,43 17,99 28,49 32,66 13,96 5,61 0,86
Śląskie 0,63 18,16 25,16 32,03 16,65 5,36 2,02
Świętokrzyskie 0,76 18,32 24,43 29,26 16,54 9,16 1,53
Warmińsko-mazurskie 0,62 15,38 23,28 31,39 17,88 8,52 2,91
Wielkopolskie 0,56 20,81 25,21 32,61 15,93 3,84 1,03
Zachodniopomorskie 1,78 18,72 22,10 28,88 16,04 9,80 2,67
Education
Primary and below 0,54 10,71 16,32 37,48 21,16 10,62 3,16
Vocational 0,79 17,29 21,20 32,65 17,34 7,98 2,75
Secondary 0,83 18,85 26,53 30,47 16,04 5,91 1,36
Tertiary/post-secondary 0,92 24,58 35,43 24,83 10,47 3,18 0,59
Income per capita
First quartile 0,63 8,98 15,19 30,52 24,44 14,60 5,62
Middle 50% 0,65 15,17 21,92 34,72 18,40 7,31 1,82
Fourth quartile 1,08 26,17 34,39 26,14 9,95 2,10 0,17
Social-professional status
Public sector employees 0,76 20,99 31,19 28,84 14,56 3,05 0,60
Private sector employees 0,99 20,73 27,72 30,74 14,53 4,32 0,96
Self-employed 0,54 31,10 35,08 21,16 7,41 2,35 2,35
Farmers 0,78 19,10 21,27 35,09 14,13 8,23 1,40
Disability pensioners 0,10 10,01 15,92 32,53 23,72 12,21 5,51
Retirees 0,50 13,34 22,79 38,10 17,28 6,86 1,12
Students 2,07 25,66 26,79 26,50 13,82 3,67 1,50
Unemployed 0,57 8,78 15,17 28,62 22,81 17,90 6,16
Other professionally inactive 0,69 16,42 20,81 28,90 18,03 11,91 3,24
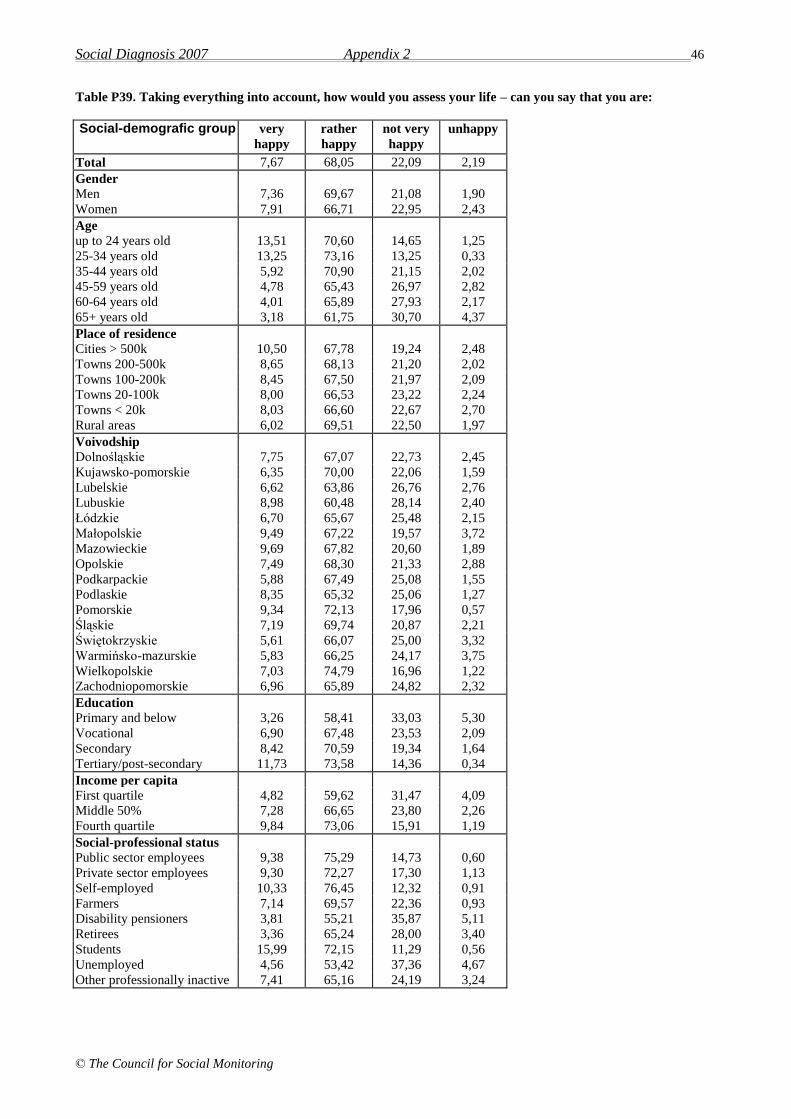
Social Diagnosis 2007 Appendix 2 46
© The Council for Social Monitoring
Table P39. Taking everything into account, how would you assess your life – can you say that you are:
Social-demografic group very
happy
rather
happy
not very
happy
unhappy
Total 7,67 68,05 22,09 2,19
Gender
Men 7,36 69,67 21,08 1,90
Women 7,91 66,71 22,95 2,43
Age
up to 24 years old 13,51 70,60 14,65 1,25
25-34 years old 13,25 73,16 13,25 0,33
35-44 years old 5,92 70,90 21,15 2,02
45-59 years old 4,78 65,43 26,97 2,82
60-64 years old 4,01 65,89 27,93 2,17
65+ years old 3,18 61,75 30,70 4,37
Place of residence
Cities > 500k 10,50 67,78 19,24 2,48
Towns 200-500k 8,65 68,13 21,20 2,02
Towns 100-200k 8,45 67,50 21,97 2,09
Towns 20-100k 8,00 66,53 23,22 2,24
Towns < 20k 8,03 66,60 22,67 2,70
Rural areas 6,02 69,51 22,50 1,97
Voivodship
Dolnośląskie 7,75 67,07 22,73 2,45
Kujawsko-pomorskie 6,35 70,00 22,06 1,59
Lubelskie 6,62 63,86 26,76 2,76
Lubuskie 8,98 60,48 28,14 2,40
Łódzkie 6,70 65,67 25,48 2,15
Małopolskie 9,49 67,22 19,57 3,72
Mazowieckie 9,69 67,82 20,60 1,89
Opolskie 7,49 68,30 21,33 2,88
Podkarpackie 5,88 67,49 25,08 1,55
Podlaskie 8,35 65,32 25,06 1,27
Pomorskie 9,34 72,13 17,96 0,57
Śląskie 7,19 69,74 20,87 2,21
Świętokrzyskie 5,61 66,07 25,00 3,32
Warmińsko-mazurskie 5,83 66,25 24,17 3,75
Wielkopolskie 7,03 74,79 16,96 1,22
Zachodniopomorskie 6,96 65,89 24,82 2,32
Education
Primary and below 3,26 58,41 33,03 5,30
Vocational 6,90 67,48 23,53 2,09
Secondary 8,42 70,59 19,34 1,64
Tertiary/post-secondary 11,73 73,58 14,36 0,34
Income per capita
First quartile 4,82 59,62 31,47 4,09
Middle 50% 7,28 66,65 23,80 2,26
Fourth quartile 9,84 73,06 15,91 1,19
Social-professional status
Public sector employees 9,38 75,29 14,73 0,60
Private sector employees 9,30 72,27 17,30 1,13
Self-employed 10,33 76,45 12,32 0,91
Farmers 7,14 69,57 22,36 0,93
Disability pensioners 3,81 55,21 35,87 5,11
Retirees 3,36 65,24 28,00 3,40
Students 15,99 72,15 11,29 0,56
Unemployed 4,56 53,42 37,36 4,67
Other professionally inactive 7,41 65,16 24,19 3,24

Social Diagnosis 2007 Appendix 2 47
© The Council for Social Monitoring
Table P 40. During the last year did you take advantage of services rendered by health units:
Social-demografic group
paid by the National
Health Fund paid by yourself
paid by the employee
who purchased a
medical service plan
Total 76,18 29,91 3,38
Gender
Men 68,50 24,87 3,46
Women 82,58 34,11 3,31
Age
up to 24 years old 66,86 25,02 2,06
25-34 years old 70,56 36,37 5,63
35-44 years old 72,49 33,52 4,55
45-59 years old 77,62 28,95 4,21
60-64 years old 85,50 30,71 1,06
65+ years old 91,59 25,56 0,37
Place of residence
Cities > 500k 76,85 42,64 9,80
Towns 200-500k 80,06 38,87 4,71
Towns 100-200k 74,58 31,50 3,43
Towns 20-100k 78,99 30,76 2,85
Towns < 20k 74,01 26,62 3,34
Rural areas 74,35 23,64 1,37
Voivodship
Dolnośląskie 75,13 35,94 4,91
Kujawsko-pomorskie 72,47 21,68 1,36
Lubelskie 77,47 28,02 2,32
Lubuskie 78,86 30,78 2,79
Łódzkie 77,09 32,26 3,50
Małopolskie 76,17 32,42 3,68
Mazowieckie 74,71 32,98 5,90
Opolskie 77,33 26,91 2,24
Podkarpackie 79,39 27,91 2,85
Podlaskie 75,32 28,11 1,37
Pomorskie 79,34 34,70 5,87
Śląskie 79,63 27,63 2,43
Świętokrzyskie 79,58 31,25 3,01
Warmińsko-mazurskie 69,12 17,73 1,39
Wielkopolskie 74,21 29,52 2,58
Zachodniopomorskie 71,81 29,57 2,56
Education
Primary and below 82,01 16,82 0,72
Vocational 71,16 20,21 1,62
Secondary 76,57 33,95 3,69
Tertiary/post-secondary 78,54 51,79 8,44
Income per capita
First quartile 70,60 15,26 1,52
Middle 50% 76,91 26,21 2,53
Fourth quartile 79,01 43,49 5,72
Social-professional status
Public sector employees 77,06 38,85 7,53
Private sector employees 68,59 30,11 7,71
Self-employed 64,26 47,82 2,52
Farmers 71,55 24,27 0,31
Disability pensioners 89,60 24,85 0,33
Retirees 89,14 27,88 0,62
Students 68,86 26,81 0,93
Unemployed 69,82 20,61 0,53
Other professionally inactive 74,21 29,30 1,49
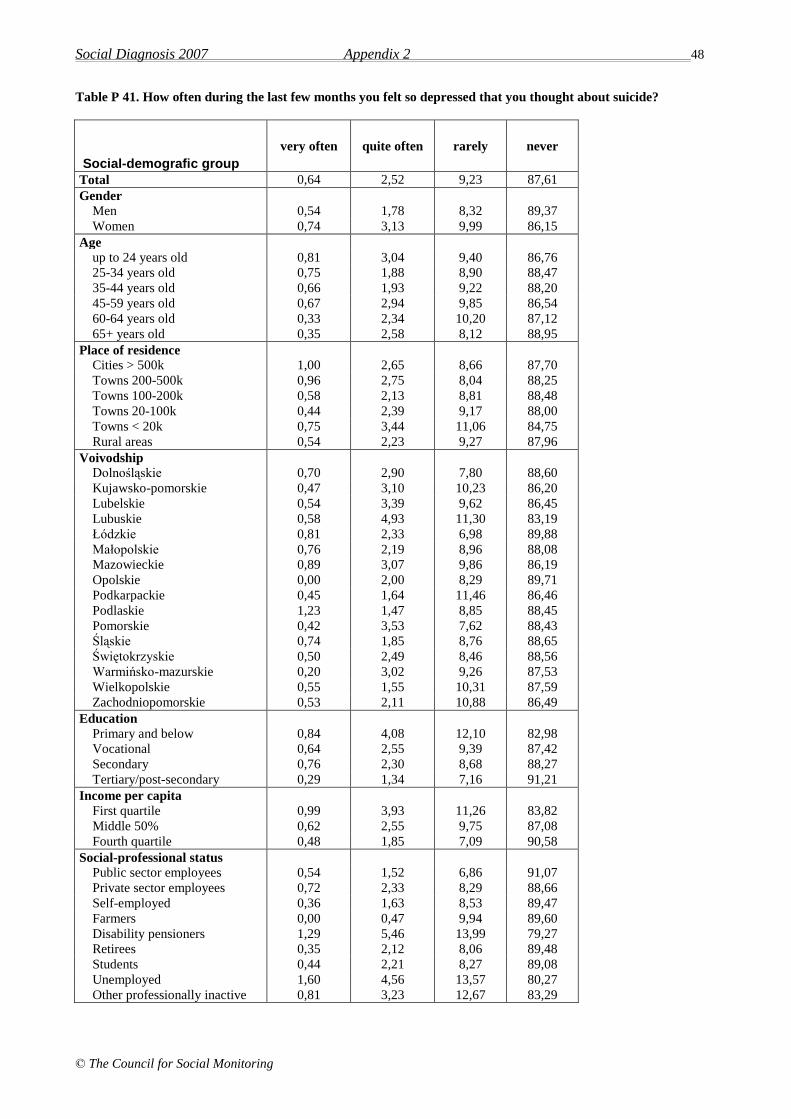
Social Diagnosis 2007 Appendix 2 48
© The Council for Social Monitoring
Table P 41. How often during the last few months you felt so depressed that you thought about suicide?
Social-demografic group
very often quite often rarely never
Total 0,64 2,52 9,23 87,61
Gender
Men 0,54 1,78 8,32 89,37
Women 0,74 3,13 9,99 86,15
Age
up to 24 years old 0,81 3,04 9,40 86,76
25-34 years old 0,75 1,88 8,90 88,47
35-44 years old 0,66 1,93 9,22 88,20
45-59 years old 0,67 2,94 9,85 86,54
60-64 years old 0,33 2,34 10,20 87,12
65+ years old 0,35 2,58 8,12 88,95
Place of residence
Cities > 500k 1,00 2,65 8,66 87,70
Towns 200-500k 0,96 2,75 8,04 88,25
Towns 100-200k 0,58 2,13 8,81 88,48
Towns 20-100k 0,44 2,39 9,17 88,00
Towns < 20k 0,75 3,44 11,06 84,75
Rural areas 0,54 2,23 9,27 87,96
Voivodship
Dolnośląskie 0,70 2,90 7,80 88,60
Kujawsko-pomorskie 0,47 3,10 10,23 86,20
Lubelskie 0,54 3,39 9,62 86,45
Lubuskie 0,58 4,93 11,30 83,19
Łódzkie 0,81 2,33 6,98 89,88
Małopolskie 0,76 2,19 8,96 88,08
Mazowieckie 0,89 3,07 9,86 86,19
Opolskie 0,00 2,00 8,29 89,71
Podkarpackie 0,45 1,64 11,46 86,46
Podlaskie 1,23 1,47 8,85 88,45
Pomorskie 0,42 3,53 7,62 88,43
Śląskie 0,74 1,85 8,76 88,65
Świętokrzyskie 0,50 2,49 8,46 88,56
Warmińsko-mazurskie 0,20 3,02 9,26 87,53
Wielkopolskie 0,55 1,55 10,31 87,59
Zachodniopomorskie 0,53 2,11 10,88 86,49
Education
Primary and below 0,84 4,08 12,10 82,98
Vocational 0,64 2,55 9,39 87,42
Secondary 0,76 2,30 8,68 88,27
Tertiary/post-secondary 0,29 1,34 7,16 91,21
Income per capita
First quartile 0,99 3,93 11,26 83,82
Middle 50% 0,62 2,55 9,75 87,08
Fourth quartile 0,48 1,85 7,09 90,58
Social-professional status
Public sector employees 0,54 1,52 6,86 91,07
Private sector employees 0,72 2,33 8,29 88,66
Self-employed 0,36 1,63 8,53 89,47
Farmers 0,00 0,47 9,94 89,60
Disability pensioners 1,29 5,46 13,99 79,27
Retirees 0,35 2,12 8,06 89,48
Students 0,44 2,21 8,27 89,08
Unemployed 1,60 4,56 13,57 80,27
Other professionally inactive 0,81 3,23 12,67 83,29
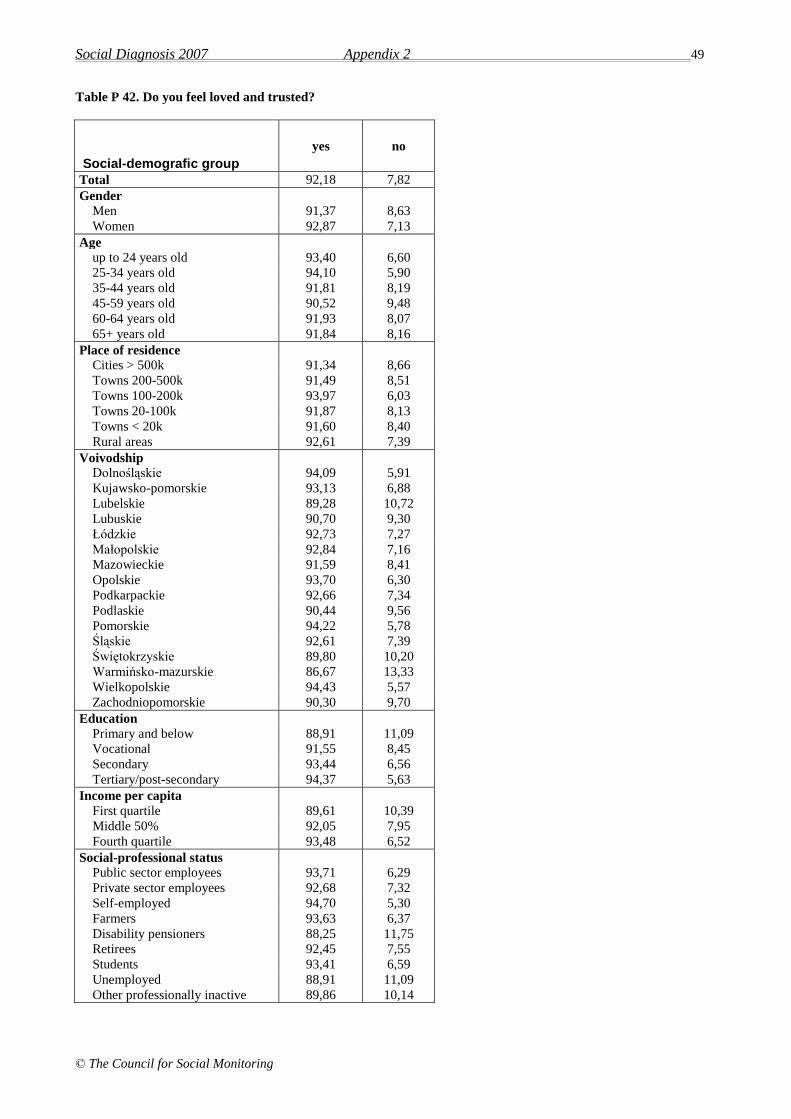
Social Diagnosis 2007 Appendix 2 49
© The Council for Social Monitoring
Table P 42. Do you feel loved and trusted?
Social-demografic group
yes no
Total 92,18 7,82
Gender
Men 91,37 8,63
Women 92,87 7,13
Age
up to 24 years old 93,40 6,60
25-34 years old 94,10 5,90
35-44 years old 91,81 8,19
45-59 years old 90,52 9,48
60-64 years old 91,93 8,07
65+ years old 91,84 8,16
Place of residence
Cities > 500k 91,34 8,66
Towns 200-500k 91,49 8,51
Towns 100-200k 93,97 6,03
Towns 20-100k 91,87 8,13
Towns < 20k 91,60 8,40
Rural areas 92,61 7,39
Voivodship
Dolnośląskie 94,09 5,91
Kujawsko-pomorskie 93,13 6,88
Lubelskie 89,28 10,72
Lubuskie 90,70 9,30
Łódzkie 92,73 7,27
Małopolskie 92,84 7,16
Mazowieckie 91,59 8,41
Opolskie 93,70 6,30
Podkarpackie 92,66 7,34
Podlaskie 90,44 9,56
Pomorskie 94,22 5,78
Śląskie 92,61 7,39
Świętokrzyskie 89,80 10,20
Warmińsko-mazurskie 86,67 13,33
Wielkopolskie 94,43 5,57
Zachodniopomorskie 90,30 9,70
Education
Primary and below 88,91 11,09
Vocational 91,55 8,45
Secondary 93,44 6,56
Tertiary/post-secondary 94,37 5,63
Income per capita
First quartile 89,61 10,39
Middle 50% 92,05 7,95
Fourth quartile 93,48 6,52
Social-professional status
Public sector employees 93,71 6,29
Private sector employees 92,68 7,32
Self-employed 94,70 5,30
Farmers 93,63 6,37
Disability pensioners 88,25 11,75
Retirees 92,45 7,55
Students 93,41 6,59
Unemployed 88,91 11,09
Other professionally inactive 89,86 10,14
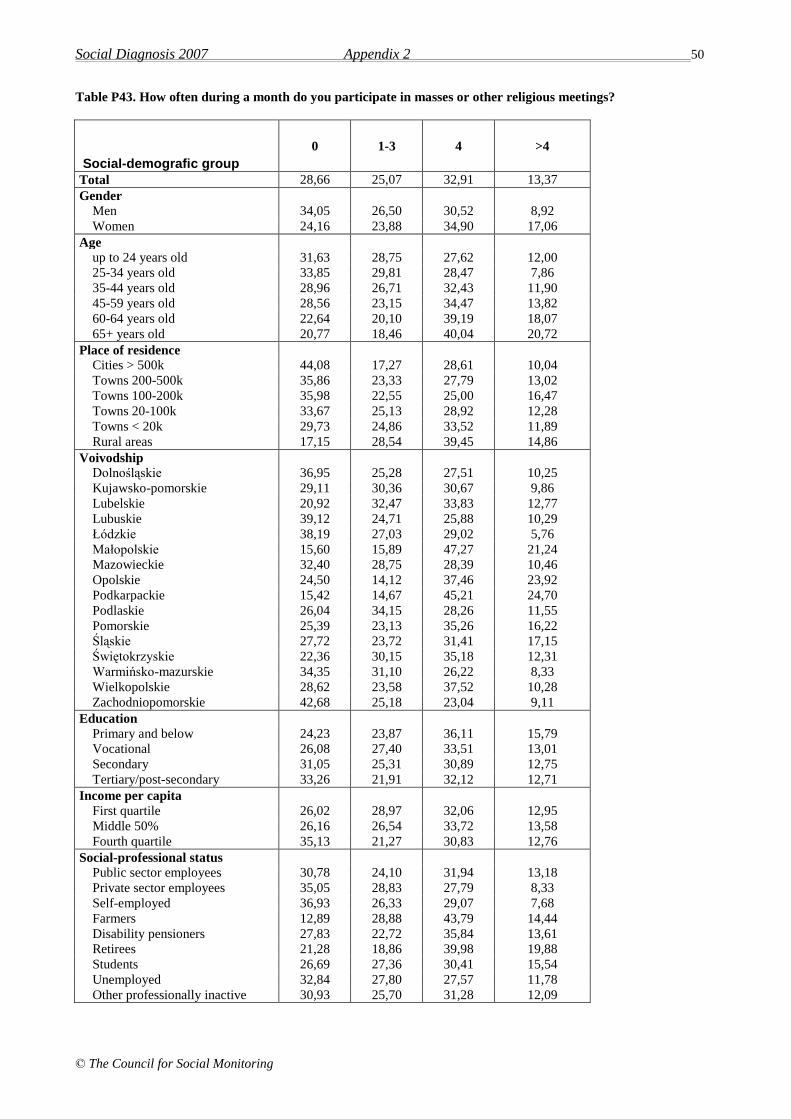
Social Diagnosis 2007 Appendix 2 50
© The Council for Social Monitoring
Table P43. How often during a month do you participate in masses or other religious meetings?
Social-demografic group
0 1-3 4 >4
Total 28,66 25,07 32,91 13,37
Gender
Men 34,05 26,50 30,52 8,92
Women 24,16 23,88 34,90 17,06
Age
up to 24 years old 31,63 28,75 27,62 12,00
25-34 years old 33,85 29,81 28,47 7,86
35-44 years old 28,96 26,71 32,43 11,90
45-59 years old 28,56 23,15 34,47 13,82
60-64 years old 22,64 20,10 39,19 18,07
65+ years old 20,77 18,46 40,04 20,72
Place of residence
Cities > 500k 44,08 17,27 28,61 10,04
Towns 200-500k 35,86 23,33 27,79 13,02
Towns 100-200k 35,98 22,55 25,00 16,47
Towns 20-100k 33,67 25,13 28,92 12,28
Towns < 20k 29,73 24,86 33,52 11,89
Rural areas 17,15 28,54 39,45 14,86
Voivodship
Dolnośląskie 36,95 25,28 27,51 10,25
Kujawsko-pomorskie 29,11 30,36 30,67 9,86
Lubelskie 20,92 32,47 33,83 12,77
Lubuskie 39,12 24,71 25,88 10,29
Łódzkie 38,19 27,03 29,02 5,76
Małopolskie 15,60 15,89 47,27 21,24
Mazowieckie 32,40 28,75 28,39 10,46
Opolskie 24,50 14,12 37,46 23,92
Podkarpackie 15,42 14,67 45,21 24,70
Podlaskie 26,04 34,15 28,26 11,55
Pomorskie 25,39 23,13 35,26 16,22
Śląskie 27,72 23,72 31,41 17,15
Świętokrzyskie 22,36 30,15 35,18 12,31
Warmińsko-mazurskie 34,35 31,10 26,22 8,33
Wielkopolskie 28,62 23,58 37,52 10,28
Zachodniopomorskie 42,68 25,18 23,04 9,11
Education
Primary and below 24,23 23,87 36,11 15,79
Vocational 26,08 27,40 33,51 13,01
Secondary 31,05 25,31 30,89 12,75
Tertiary/post-secondary 33,26 21,91 32,12 12,71
Income per capita
First quartile 26,02 28,97 32,06 12,95
Middle 50% 26,16 26,54 33,72 13,58
Fourth quartile 35,13 21,27 30,83 12,76
Social-professional status
Public sector employees 30,78 24,10 31,94 13,18
Private sector employees 35,05 28,83 27,79 8,33
Self-employed 36,93 26,33 29,07 7,68
Farmers 12,89 28,88 43,79 14,44
Disability pensioners 27,83 22,72 35,84 13,61
Retirees 21,28 18,86 39,98 19,88
Students 26,69 27,36 30,41 15,54
Unemployed 32,84 27,80 27,57 11,78
Other professionally inactive 30,93 25,70 31,28 12,09

Social Diagnosis 2007 Appendix 2 51
© The Council for Social Monitoring
Table P44_1. How many people would you call your friends?
Social-demografic group
0 1-2 3-5 6-8 9-10 11-15 16-20 >20
Total 3,61 16,98 33,90 15,18 16,09 6,56 4,72 2,97
Gender
Men 4,10 16,19 31,85 15,10 16,63 7,29 5,30 3,54
Women 3,22 17,60 35,61 15,24 15,67 5,96 4,22 2,49
Age
up to 24 years old 1,89 12,21 33,83 18,60 16,76 7,48 5,32 3,92
25-34 years old 3,04 17,81 37,22 14,35 15,27 6,37 3,54 2,41
35-44 years old 4,10 18,74 34,36 14,70 15,36 6,04 4,71 2,00
45-59 years old 3,74 17,41 33,18 15,00 17,32 5,88 4,38 3,09
60-64 years old 2,89 13,10 31,63 17,18 18,37 8,50 5,78 2,55
65+ years old 5,81 19,91 31,53 12,48 14,30 6,82 5,66 3,49
Place of residence
Cities > 500k 2,61 15,37 36,84 15,88 16,32 6,02 3,92 3,05
Towns 200-500k 3,84 15,49 35,59 15,84 14,93 6,14 5,09 3,07
Towns 100-200k 6,59 17,70 31,86 15,54 13,77 6,88 4,23 3,44
Towns 20-100k 3,42 16,05 36,93 15,81 16,29 5,75 3,66 2,09
Towns < 20k 3,16 18,09 33,59 15,12 15,94 6,26 5,25 2,59
Rural areas 3,46 17,84 31,42 14,38 16,87 7,30 5,31 3,42
Voivodship
Dolnośląskie 3,32 17,42 32,02 13,80 19,34 6,45 4,23 3,42
Kujawsko-pomorskie 3,94 21,45 32,97 14,04 15,14 5,99 4,10 2,37
Lubelskie 5,03 13,61 31,43 13,61 18,37 7,48 6,53 3,95
Lubuskie 4,66 19,24 36,73 14,87 11,08 7,87 3,21 2,33
Łódzkie 3,31 14,17 33,06 14,17 19,36 8,74 4,49 2,72
Małopolskie 1,91 15,79 37,13 16,56 15,50 6,70 3,83 2,58
Mazowieckie 2,22 14,11 32,97 16,58 17,48 6,73 5,89 4,02
Opolskie 4,64 18,55 33,33 13,33 15,94 6,09 4,93 3,19
Podkarpackie 2,71 13,55 31,93 15,36 17,62 7,83 7,08 3,92
Podlaskie 2,73 13,90 34,49 15,14 17,37 7,20 6,70 2,48
Pomorskie 3,67 19,46 35,83 15,80 13,54 4,94 4,09 2,68
Śląskie 5,67 19,48 34,49 15,01 13,18 5,86 3,78 2,52
Świętokrzyskie 1,51 16,33 32,66 14,82 17,09 11,31 4,27 2,01
Warmińsko-mazurskie 4,11 24,23 35,73 12,53 12,73 3,70 4,11 2,87
Wielkopolskie 3,85 15,57 33,61 17,86 16,85 5,40 4,30 2,56
Zachodniopomorskie 4,78 21,06 35,75 13,98 13,10 5,13 4,07 2,12
Education
Primary and below 6,08 21,92 31,28 11,61 14,58 6,39 5,22 2,93
Vocational 3,50 17,06 32,22 15,08 16,61 6,78 5,33 3,43
Secondary 2,96 15,29 35,61 16,21 16,70 6,64 4,08 2,50
Tertiary/post-secondary 2,53 14,98 36,37 16,92 15,74 6,16 4,26 3,04
Income per capita
First quartile 4,31 18,95 31,32 14,50 15,64 6,84 5,10 3,35
Middle 50% 3,77 16,95 34,53 14,87 16,24 6,13 4,83 2,67
Fourth quartile 2,92 15,56 34,10 16,55 16,38 7,00 4,42 3,06
Social-professional status
Public sector employees 2,75 17,02 36,36 14,82 16,14 5,51 4,41 2,98
Private sector employees 2,98 17,66 35,21 15,17 16,00 6,27 4,12 2,60
Self-employed 2,93 15,75 32,97 17,95 17,77 6,04 4,95 1,65
Farmers 3,60 14,40 27,39 15,34 22,07 8,14 6,10 2,97
Disability pensioners 4,22 21,89 33,94 12,35 13,76 6,83 4,32 2,71
Retirees 4,96 16,68 32,42 14,00 15,81 7,00 5,74 3,38
Students 2,23 10,24 32,27 20,10 17,21 8,31 5,49 4,15
Unemployed 4,01 20,27 34,14 13,86 15,81 6,41 3,67 1,83
Other professionally
inactive 4,99 19,49 36,31 14,39 13,11 4,87 3,36 3,48

Social Diagnosis 2007 Appendix 2 52
© The Council for Social Monitoring
Table P44_2. How many people would you call your friends?
Social-demografic group
Mean Standard deviation
Total 7,24 7,84
Gender 0,00 0,00
Men 7,69 8,87
Women 6,85 6,83
Age
up to 24 years old 8,09 8,69
25-34 years old 6,82 7,29
35-44 years old 6,63 6,34
45-59 years old 7,26 8,19
60-64 years old 7,59 6,57
65+ years old 7,22 8,41
Place of residence
Cities > 500k 7,38 8,78
Towns 200-500k 7,28 8,26
Towns 100-200k 7,00 7,65
Towns 20-100k 6,83 7,39
Towns < 20k 7,11 7,47
Rural areas 7,49 7,79
Voivodship
Dolnośląskie 7,90 10,45
Kujawsko-pomorskie 6,50 6,31
Lubelskie 7,90 8,12
Lubuskie 6,26 5,66
Łódzkie 7,42 6,51
Małopolskie 6,93 6,19
Mazowieckie 8,23 9,44
Opolskie 7,17 7,93
Podkarpackie 8,21 8,19
Podlaskie 7,51 6,46
Pomorskie 6,61 7,09
Śląskie 6,61 8,03
Świętokrzyskie 7,41 6,41
Warmińsko-mazurskie 6,28 6,58
Wielkopolskie 7,11 7,84
Zachodniopomorskie 6,15 5,96
Education
Primary and below 6,85 7,91
Vocational 7,53 8,05
Secondary 7,12 7,52
Tertiary/post-secondary 7,29 7,90
Income per capita
First quartile 7,41 8,75
Middle 50% 7,09 7,43
Fourth quartile 7,38 7,88
Social-professional status
Public sector employees 7,08 7,42
Private sector employees 7,00 7,51
Self-employed 7,02 6,59
Farmers 8,12 8,96
Disability pensioners 6,67 7,24
Retirees 7,42 7,93
Students 8,44 8,99
Unemployed 6,57 7,40
Other professionally inactive 6,74 8,25

Social Diagnosis 2007 Appendix 2 53
© The Council for Social Monitoring
Table P45. How strong is your willingness to live these days?
Social-demografic group
1
I don’t want to live at
all
2 3 4 5 6 7 8 9 10
I want to live very
much
Total 0,48 0,61 1,29 2,09 6,74 6,80 9,70 15,94 14,66 41,70
Gender
Men 0,51 0,56 1,17 1,67 5,61 6,69 9,87 16,51 15,31 42,10
Women 0,48 0,64 1,38 2,46 7,70 6,87 9,55 15,45 14,12 41,35
Age
up to 24 years old 0,13 0,58 1,08 2,47 6,28 6,55 10,31 15,74 16,64 40,22
25-34 years old 0,33 0,17 1,09 1,09 4,90 5,27 7,99 15,24 16,49 47,43
35-44 years old 0,71 0,66 1,01 1,87 5,77 5,32 9,22 16,61 16,15 42,68
45-59 years old 0,55 0,73 1,34 2,33 6,88 7,23 9,76 15,91 12,56 42,72
60-64 years old 0,67 0,34 1,01 2,01 6,53 8,04 10,89 17,25 11,89 41,37
65+ years old 0,70 0,99 2,04 2,83 10,24 9,15 11,03 15,90 13,22 33,90
Place of residence
Cities > 500k 0,43 0,72 1,36 2,23 6,82 6,75 9,91 15,58 14,36 41,85
Towns 200-500k 0,83 0,62 1,17 2,41 5,36 5,43 8,94 15,82 13,34 46,08
Towns 100-200k 0,19 0,68 1,07 2,23 5,81 5,91 8,72 15,12 15,79 44,48
Towns 20-100k 0,56 0,88 1,04 1,96 7,39 6,55 9,50 15,85 12,57 43,71
Towns < 20k 0,44 0,38 1,63 2,13 6,63 7,07 9,51 16,21 16,02 39,99
Rural areas 0,45 0,47 1,38 2,00 7,07 7,46 10,23 16,21 15,56 39,17
Voivodship
Dolnośląskie 0,50 0,70 1,40 1,40 6,71 6,11 7,82 14,13 14,03 47,19
Kujawsko-pomorskie 0,78 0,78 1,09 1,71 5,44 6,53 10,89 15,86 15,24 41,68
Lubelskie 0,41 0,95 1,22 2,85 7,88 6,52 8,56 17,93 13,45 40,22
Lubuskie 0,87 0,29 2,03 3,48 7,83 6,96 10,43 14,49 15,36 38,26
Łódzkie 0,47 0,82 1,40 2,22 10,74 7,93 8,75 15,75 12,95 38,97
Małopolskie 0,76 0,95 1,62 2,19 6,39 8,10 10,58 16,49 14,59 38,32
Mazowieckie 0,41 0,59 1,01 2,49 7,11 6,64 11,32 15,05 14,75 40,64
Opolskie 0,00 0,29 1,16 1,45 4,62 6,07 7,23 12,72 15,90 50,58
Podkarpackie 0,15 0,60 1,49 1,64 8,49 8,79 13,71 18,93 16,24 29,96
Podlaskie 0,49 0,25 2,70 2,45 4,90 5,88 10,05 16,42 14,22 42,65
Pomorskie 0,28 0,28 0,71 1,69 5,93 4,66 8,47 16,95 13,98 47,03
Śląskie 0,56 0,62 1,49 1,92 6,56 6,56 9,53 15,53 15,22 42,02
Świętokrzyskie 1,00 0,75 1,49 1,74 6,47 6,47 8,46 15,92 14,18 43,53
Warmińsko-mazurskie 0,20 0,20 0,81 3,23 3,83 5,04 7,06 14,72 16,33 48,59
Wielkopolskie 0,37 0,18 1,10 1,64 6,39 8,31 11,32 17,63 14,98 38,08
Zachodniopomorskie 0,35 1,05 0,70 2,10 5,07 5,94 6,29 15,21 13,81 49,48
Education
Primary and below 0,89 1,07 1,91 3,34 9,96 9,83 11,34 16,19 13,48 31,98
Vocational 0,50 0,69 1,39 2,03 7,17 7,47 10,07 15,82 13,99 40,87
Secondary 0,45 0,43 1,04 2,17 6,24 5,86 9,27 16,11 15,18 43,26
Tertiary/post-secondary 0,17 0,25 1,01 0,92 3,90 4,27 8,21 15,58 16,09 49,60
Income per capita
First quartile 0,91 0,87 1,64 2,73 9,78 8,05 10,82 15,62 15,40 34,18
Middle 50% 0,46 0,67 1,36 2,28 7,10 7,14 9,38 16,64 14,85 40,12
Fourth quartile 0,31 0,45 1,09 1,66 4,69 5,76 9,66 15,69 14,21 46,49
Social-professional status
Public sector employees 0,22 0,44 0,71 1,42 5,01 4,79 7,35 17,58 15,57 46,92
Private sector employees 0,24 0,21 0,99 2,05 4,52 6,16 9,28 15,41 16,30 44,83
Self-employed 0,73 0,18 1,27 0,54 4,54 4,36 8,53 15,79 13,07 51,00
Farmers 0,31 0,47 1,24 1,24 6,37 7,14 9,63 17,39 15,37 40,84
Disability pensioners 1,19 0,90 2,29 3,68 11,04 8,86 11,24 17,01 11,44 32,34
Retirees 0,62 0,81 1,55 2,47 8,54 8,38 10,63 15,65 12,91 38,45
Students 0,07 0,52 0,96 2,00 5,40 5,55 10,95 15,91 16,58 42,04
Unemployed 1,25 1,48 1,94 3,53 10,49 8,32 9,92 14,71 13,68 34,66
Other professionally
inactive 0,69 1,04 1,50 1,27 7,61 7,61 10,15 13,84 14,76 41,52
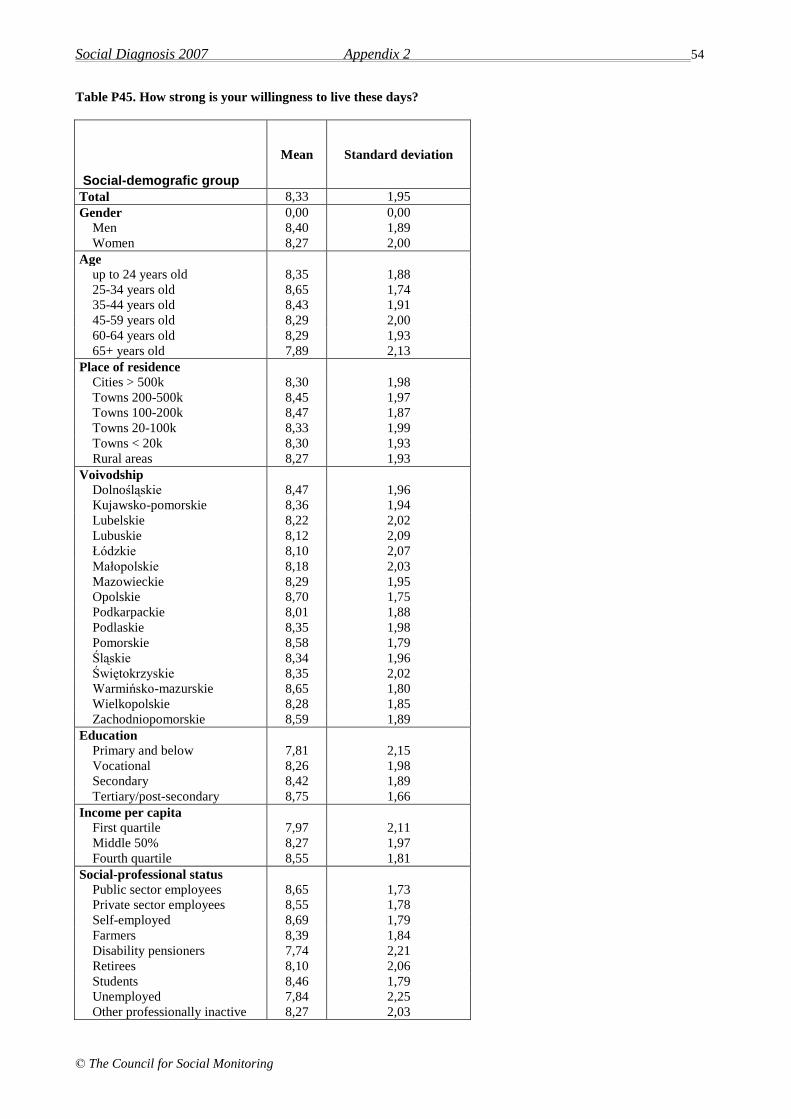
Social Diagnosis 2007 Appendix 2 54
© The Council for Social Monitoring
Table P45. How strong is your willingness to live these days?
Social-demografic group
Mean Standard deviation
Total 8,33 1,95
Gender 0,00 0,00
Men 8,40 1,89
Women 8,27 2,00
Age
up to 24 years old 8,35 1,88
25-34 years old 8,65 1,74
35-44 years old 8,43 1,91
45-59 years old 8,29 2,00
60-64 years old 8,29 1,93
65+ years old 7,89 2,13
Place of residence
Cities > 500k 8,30 1,98
Towns 200-500k 8,45 1,97
Towns 100-200k 8,47 1,87
Towns 20-100k 8,33 1,99
Towns < 20k 8,30 1,93
Rural areas 8,27 1,93
Voivodship
Dolnośląskie 8,47 1,96
Kujawsko-pomorskie 8,36 1,94
Lubelskie 8,22 2,02
Lubuskie 8,12 2,09
Łódzkie 8,10 2,07
Małopolskie 8,18 2,03
Mazowieckie 8,29 1,95
Opolskie 8,70 1,75
Podkarpackie 8,01 1,88
Podlaskie 8,35 1,98
Pomorskie 8,58 1,79
Śląskie 8,34 1,96
Świętokrzyskie 8,35 2,02
Warmińsko-mazurskie 8,65 1,80
Wielkopolskie 8,28 1,85
Zachodniopomorskie 8,59 1,89
Education
Primary and below 7,81 2,15
Vocational 8,26 1,98
Secondary 8,42 1,89
Tertiary/post-secondary 8,75 1,66
Income per capita
First quartile 7,97 2,11
Middle 50% 8,27 1,97
Fourth quartile 8,55 1,81
Social-professional status
Public sector employees 8,65 1,73
Private sector employees 8,55 1,78
Self-employed 8,69 1,79
Farmers 8,39 1,84
Disability pensioners 7,74 2,21
Retirees 8,10 2,06
Students 8,46 1,79
Unemployed 7,84 2,25
Other professionally inactive 8,27 2,03
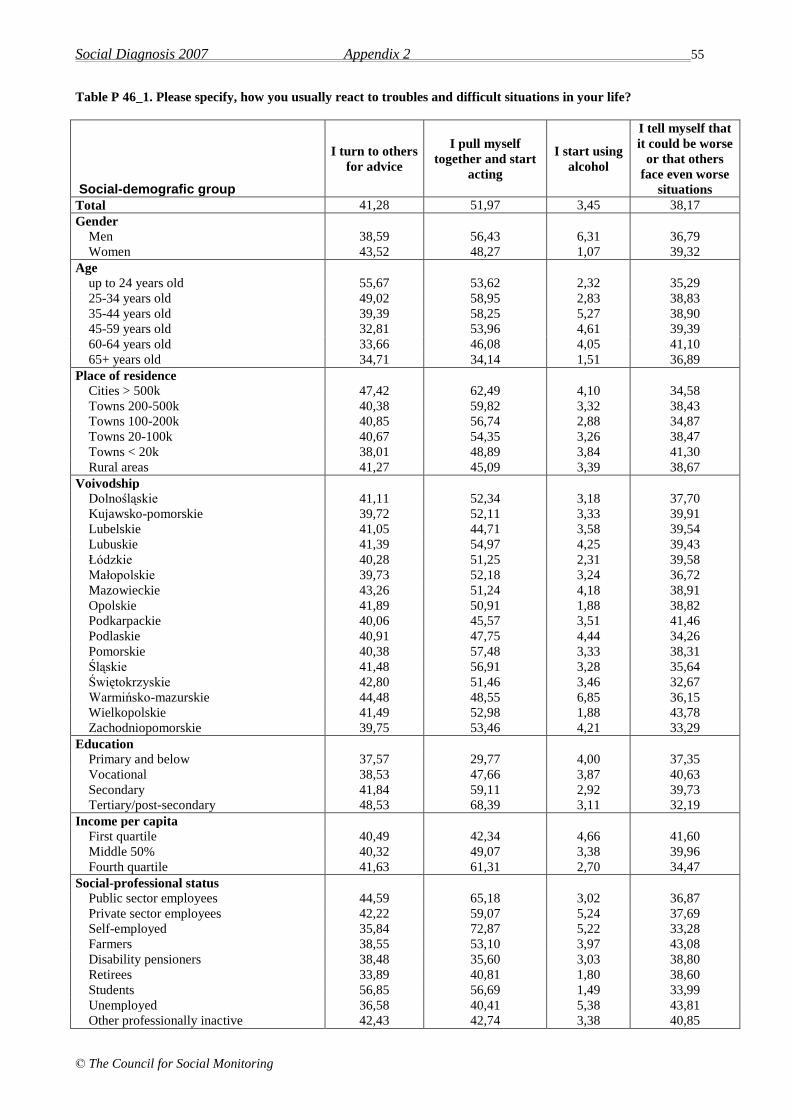
Social Diagnosis 2007 Appendix 2 55
© The Council for Social Monitoring
Table P 46_1. Please specify, how you usually react to troubles and difficult situations in your life?
Social-demografic group
I turn to others
for advice
I pull myself
together and start
acting
I start using
alcohol
I tell myself that
it could be worse
or that others
face even worse
situations
Total 41,28 51,97 3,45 38,17
Gender
Men 38,59 56,43 6,31 36,79
Women 43,52 48,27 1,07 39,32
Age
up to 24 years old 55,67 53,62 2,32 35,29
25-34 years old 49,02 58,95 2,83 38,83
35-44 years old 39,39 58,25 5,27 38,90
45-59 years old 32,81 53,96 4,61 39,39
60-64 years old 33,66 46,08 4,05 41,10
65+ years old 34,71 34,14 1,51 36,89
Place of residence
Cities > 500k 47,42 62,49 4,10 34,58
Towns 200-500k 40,38 59,82 3,32 38,43
Towns 100-200k 40,85 56,74 2,88 34,87
Towns 20-100k 40,67 54,35 3,26 38,47
Towns < 20k 38,01 48,89 3,84 41,30
Rural areas 41,27 45,09 3,39 38,67
Voivodship
Dolnośląskie 41,11 52,34 3,18 37,70
Kujawsko-pomorskie 39,72 52,11 3,33 39,91
Lubelskie 41,05 44,71 3,58 39,54
Lubuskie 41,39 54,97 4,25 39,43
Łódzkie 40,28 51,25 2,31 39,58
Małopolskie 39,73 52,18 3,24 36,72
Mazowieckie 43,26 51,24 4,18 38,91
Opolskie 41,89 50,91 1,88 38,82
Podkarpackie 40,06 45,57 3,51 41,46
Podlaskie 40,91 47,75 4,44 34,26
Pomorskie 40,38 57,48 3,33 38,31
Śląskie 41,48 56,91 3,28 35,64
Świętokrzyskie 42,80 51,46 3,46 32,67
Warmińsko-mazurskie 44,48 48,55 6,85 36,15
Wielkopolskie 41,49 52,98 1,88 43,78
Zachodniopomorskie 39,75 53,46 4,21 33,29
Education
Primary and below 37,57 29,77 4,00 37,35
Vocational 38,53 47,66 3,87 40,63
Secondary 41,84 59,11 2,92 39,73
Tertiary/post-secondary 48,53 68,39 3,11 32,19
Income per capita
First quartile 40,49 42,34 4,66 41,60
Middle 50% 40,32 49,07 3,38 39,96
Fourth quartile 41,63 61,31 2,70 34,47
Social-professional status
Public sector employees 44,59 65,18 3,02 36,87
Private sector employees 42,22 59,07 5,24 37,69
Self-employed 35,84 72,87 5,22 33,28
Farmers 38,55 53,10 3,97 43,08
Disability pensioners 38,48 35,60 3,03 38,80
Retirees 33,89 40,81 1,80 38,60
Students 56,85 56,69 1,49 33,99
Unemployed 36,58 40,41 5,38 43,81
Other professionally inactive 42,43 42,74 3,38 40,85
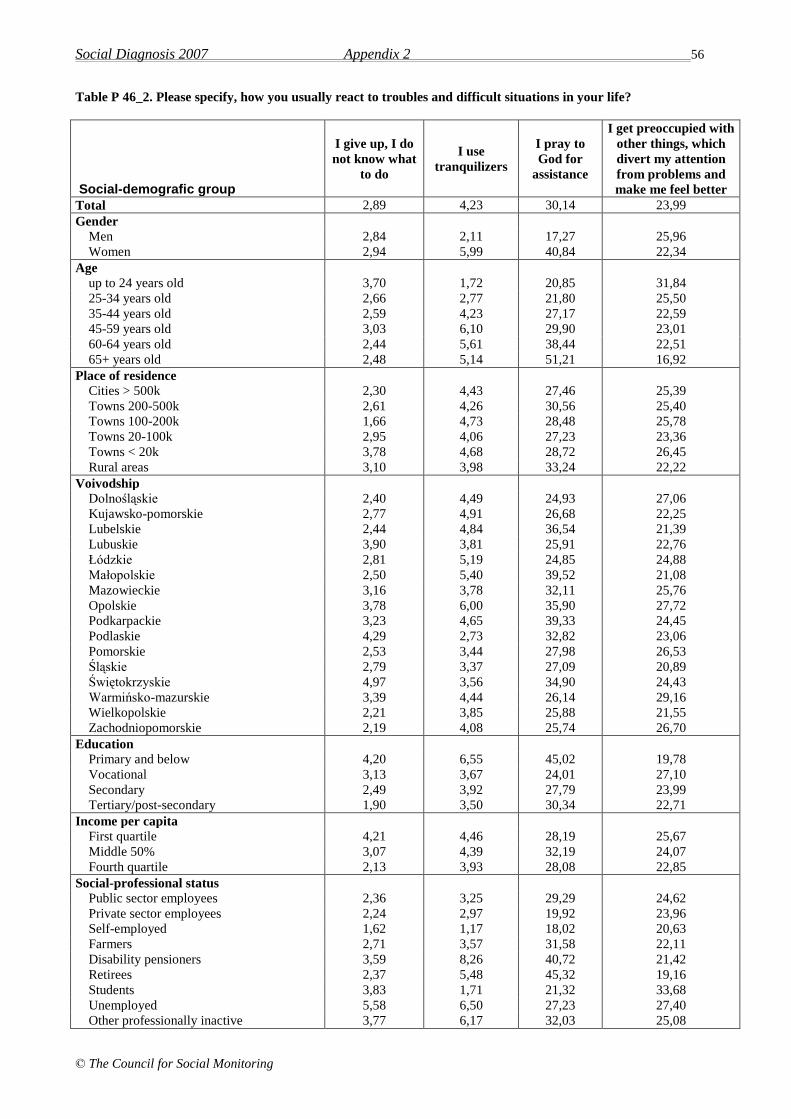
Social Diagnosis 2007 Appendix 2 56
© The Council for Social Monitoring
Table P 46_2. Please specify, how you usually react to troubles and difficult situations in your life?
Social-demografic group
I give up, I do
not know what
to do
I use
tranquilizers
I pray to
God for
assistance
I get preoccupied with
other things, which
divert my attention
from problems and
make me feel better
Total 2,89 4,23 30,14 23,99
Gender
Men 2,84 2,11 17,27 25,96
Women 2,94 5,99 40,84 22,34
Age
up to 24 years old 3,70 1,72 20,85 31,84
25-34 years old 2,66 2,77 21,80 25,50
35-44 years old 2,59 4,23 27,17 22,59
45-59 years old 3,03 6,10 29,90 23,01
60-64 years old 2,44 5,61 38,44 22,51
65+ years old 2,48 5,14 51,21 16,92
Place of residence
Cities > 500k 2,30 4,43 27,46 25,39
Towns 200-500k 2,61 4,26 30,56 25,40
Towns 100-200k 1,66 4,73 28,48 25,78
Towns 20-100k 2,95 4,06 27,23 23,36
Towns < 20k 3,78 4,68 28,72 26,45
Rural areas 3,10 3,98 33,24 22,22
Voivodship
Dolnośląskie 2,40 4,49 24,93 27,06
Kujawsko-pomorskie 2,77 4,91 26,68 22,25
Lubelskie 2,44 4,84 36,54 21,39
Lubuskie 3,90 3,81 25,91 22,76
Łódzkie 2,81 5,19 24,85 24,88
Małopolskie 2,50 5,40 39,52 21,08
Mazowieckie 3,16 3,78 32,11 25,76
Opolskie 3,78 6,00 35,90 27,72
Podkarpackie 3,23 4,65 39,33 24,45
Podlaskie 4,29 2,73 32,82 23,06
Pomorskie 2,53 3,44 27,98 26,53
Śląskie 2,79 3,37 27,09 20,89
Świętokrzyskie 4,97 3,56 34,90 24,43
Warmińsko-mazurskie 3,39 4,44 26,14 29,16
Wielkopolskie 2,21 3,85 25,88 21,55
Zachodniopomorskie 2,19 4,08 25,74 26,70
Education
Primary and below 4,20 6,55 45,02 19,78
Vocational 3,13 3,67 24,01 27,10
Secondary 2,49 3,92 27,79 23,99
Tertiary/post-secondary 1,90 3,50 30,34 22,71
Income per capita
First quartile 4,21 4,46 28,19 25,67
Middle 50% 3,07 4,39 32,19 24,07
Fourth quartile 2,13 3,93 28,08 22,85
Social-professional status
Public sector employees 2,36 3,25 29,29 24,62
Private sector employees 2,24 2,97 19,92 23,96
Self-employed 1,62 1,17 18,02 20,63
Farmers 2,71 3,57 31,58 22,11
Disability pensioners 3,59 8,26 40,72 21,42
Retirees 2,37 5,48 45,32 19,16
Students 3,83 1,71 21,32 33,68
Unemployed 5,58 6,50 27,23 27,40
Other professionally inactive 3,77 6,17 32,03 25,08
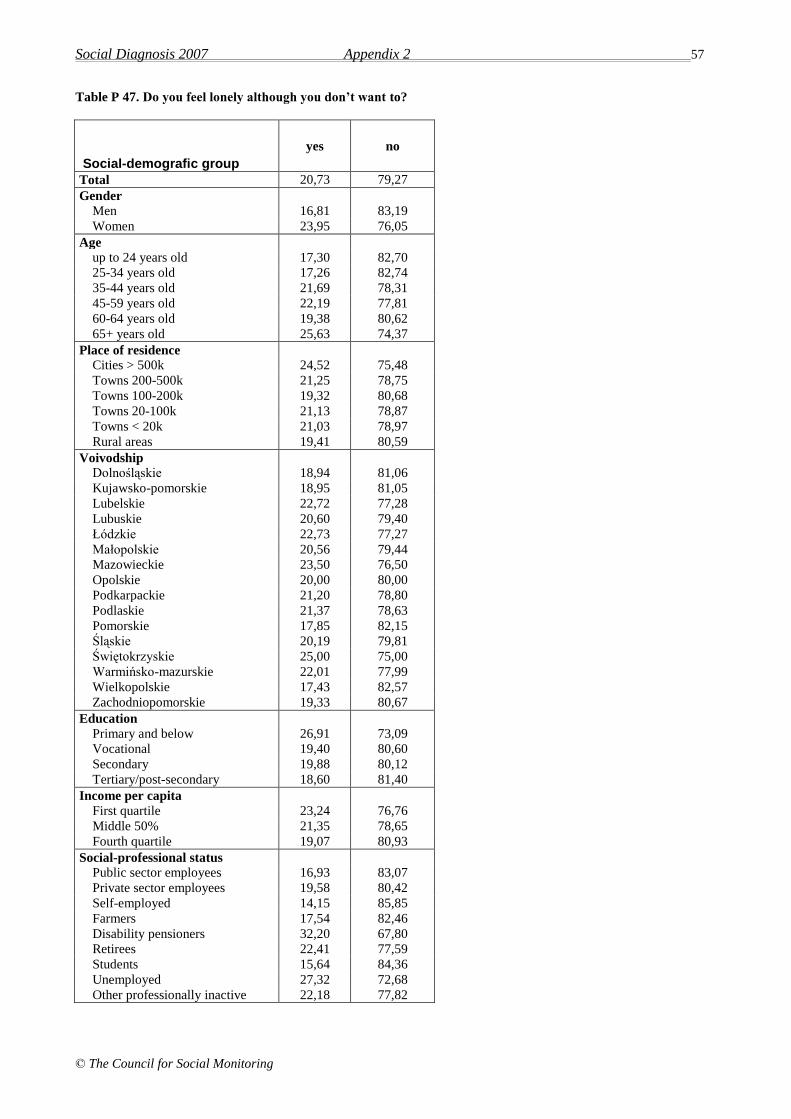
Social Diagnosis 2007 Appendix 2 57
© The Council for Social Monitoring
Table P 47. Do you feel lonely although you don’t want to?
Social-demografic group
yes no
Total 20,73 79,27
Gender
Men 16,81 83,19
Women 23,95 76,05
Age
up to 24 years old 17,30 82,70
25-34 years old 17,26 82,74
35-44 years old 21,69 78,31
45-59 years old 22,19 77,81
60-64 years old 19,38 80,62
65+ years old 25,63 74,37
Place of residence
Cities > 500k 24,52 75,48
Towns 200-500k 21,25 78,75
Towns 100-200k 19,32 80,68
Towns 20-100k 21,13 78,87
Towns < 20k 21,03 78,97
Rural areas 19,41 80,59
Voivodship
Dolnośląskie 18,94 81,06
Kujawsko-pomorskie 18,95 81,05
Lubelskie 22,72 77,28
Lubuskie 20,60 79,40
Łódzkie 22,73 77,27
Małopolskie 20,56 79,44
Mazowieckie 23,50 76,50
Opolskie 20,00 80,00
Podkarpackie 21,20 78,80
Podlaskie 21,37 78,63
Pomorskie 17,85 82,15
Śląskie 20,19 79,81
Świętokrzyskie 25,00 75,00
Warmińsko-mazurskie 22,01 77,99
Wielkopolskie 17,43 82,57
Zachodniopomorskie 19,33 80,67
Education
Primary and below 26,91 73,09
Vocational 19,40 80,60
Secondary 19,88 80,12
Tertiary/post-secondary 18,60 81,40
Income per capita
First quartile 23,24 76,76
Middle 50% 21,35 78,65
Fourth quartile 19,07 80,93
Social-professional status
Public sector employees 16,93 83,07
Private sector employees 19,58 80,42
Self-employed 14,15 85,85
Farmers 17,54 82,46
Disability pensioners 32,20 67,80
Retirees 22,41 77,59
Students 15,64 84,36
Unemployed 27,32 72,68
Other professionally inactive 22,18 77,82
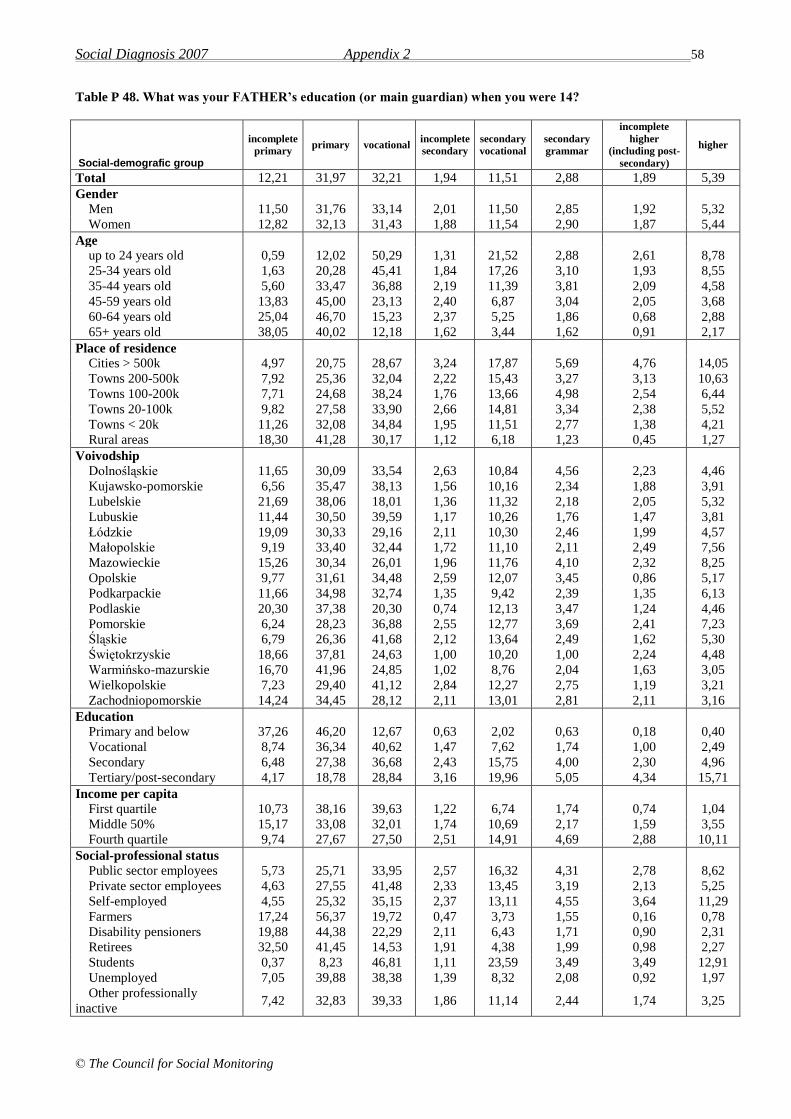
Social Diagnosis 2007 Appendix 2 58
© The Council for Social Monitoring
Table P 48. What was your FATHER’s education (or main guardian) when you were 14?
Social-demografic group
incomplete
primary primary vocational
incomplete
secondary
secondary
vocational
secondary
grammar
incomplete
higher
(including post-
secondary)
higher
Total 12,21 31,97 32,21 1,94 11,51 2,88 1,89 5,39
Gender
Men 11,50 31,76 33,14 2,01 11,50 2,85 1,92 5,32
Women 12,82 32,13 31,43 1,88 11,54 2,90 1,87 5,44
Age
up to 24 years old 0,59 12,02 50,29 1,31 21,52 2,88 2,61 8,78
25-34 years old 1,63 20,28 45,41 1,84 17,26 3,10 1,93 8,55
35-44 years old 5,60 33,47 36,88 2,19 11,39 3,81 2,09 4,58
45-59 years old 13,83 45,00 23,13 2,40 6,87 3,04 2,05 3,68
60-64 years old 25,04 46,70 15,23 2,37 5,25 1,86 0,68 2,88
65+ years old 38,05 40,02 12,18 1,62 3,44 1,62 0,91 2,17
Place of residence
Cities > 500k 4,97 20,75 28,67 3,24 17,87 5,69 4,76 14,05
Towns 200-500k 7,92 25,36 32,04 2,22 15,43 3,27 3,13 10,63
Towns 100-200k 7,71 24,68 38,24 1,76 13,66 4,98 2,54 6,44
Towns 20-100k 9,82 27,58 33,90 2,66 14,81 3,34 2,38 5,52
Towns < 20k 11,26 32,08 34,84 1,95 11,51 2,77 1,38 4,21
Rural areas 18,30 41,28 30,17 1,12 6,18 1,23 0,45 1,27
Voivodship
Dolnośląskie 11,65 30,09 33,54 2,63 10,84 4,56 2,23 4,46
Kujawsko-pomorskie 6,56 35,47 38,13 1,56 10,16 2,34 1,88 3,91
Lubelskie 21,69 38,06 18,01 1,36 11,32 2,18 2,05 5,32
Lubuskie 11,44 30,50 39,59 1,17 10,26 1,76 1,47 3,81
Łódzkie 19,09 30,33 29,16 2,11 10,30 2,46 1,99 4,57
Małopolskie 9,19 33,40 32,44 1,72 11,10 2,11 2,49 7,56
Mazowieckie 15,26 30,34 26,01 1,96 11,76 4,10 2,32 8,25
Opolskie 9,77 31,61 34,48 2,59 12,07 3,45 0,86 5,17
Podkarpackie 11,66 34,98 32,74 1,35 9,42 2,39 1,35 6,13
Podlaskie 20,30 37,38 20,30 0,74 12,13 3,47 1,24 4,46
Pomorskie 6,24 28,23 36,88 2,55 12,77 3,69 2,41 7,23
Śląskie 6,79 26,36 41,68 2,12 13,64 2,49 1,62 5,30
Świętokrzyskie 18,66 37,81 24,63 1,00 10,20 1,00 2,24 4,48
Warmińsko-mazurskie 16,70 41,96 24,85 1,02 8,76 2,04 1,63 3,05
Wielkopolskie 7,23 29,40 41,12 2,84 12,27 2,75 1,19 3,21
Zachodniopomorskie 14,24 34,45 28,12 2,11 13,01 2,81 2,11 3,16
Education
Primary and below 37,26 46,20 12,67 0,63 2,02 0,63 0,18 0,40
Vocational 8,74 36,34 40,62 1,47 7,62 1,74 1,00 2,49
Secondary 6,48 27,38 36,68 2,43 15,75 4,00 2,30 4,96
Tertiary/post-secondary 4,17 18,78 28,84 3,16 19,96 5,05 4,34 15,71
Income per capita
First quartile 10,73 38,16 39,63 1,22 6,74 1,74 0,74 1,04
Middle 50% 15,17 33,08 32,01 1,74 10,69 2,17 1,59 3,55
Fourth quartile 9,74 27,67 27,50 2,51 14,91 4,69 2,88 10,11
Social-professional status
Public sector employees 5,73 25,71 33,95 2,57 16,32 4,31 2,78 8,62
Private sector employees 4,63 27,55 41,48 2,33 13,45 3,19 2,13 5,25
Self-employed 4,55 25,32 35,15 2,37 13,11 4,55 3,64 11,29
Farmers 17,24 56,37 19,72 0,47 3,73 1,55 0,16 0,78
Disability pensioners 19,88 44,38 22,29 2,11 6,43 1,71 0,90 2,31
Retirees 32,50 41,45 14,53 1,91 4,38 1,99 0,98 2,27
Students 0,37 8,23 46,81 1,11 23,59 3,49 3,49 12,91
Unemployed 7,05 39,88 38,38 1,39 8,32 2,08 0,92 1,97
Other professionally
inactive 7,42 32,83 39,33 1,86 11,14 2,44 1,74 3,25
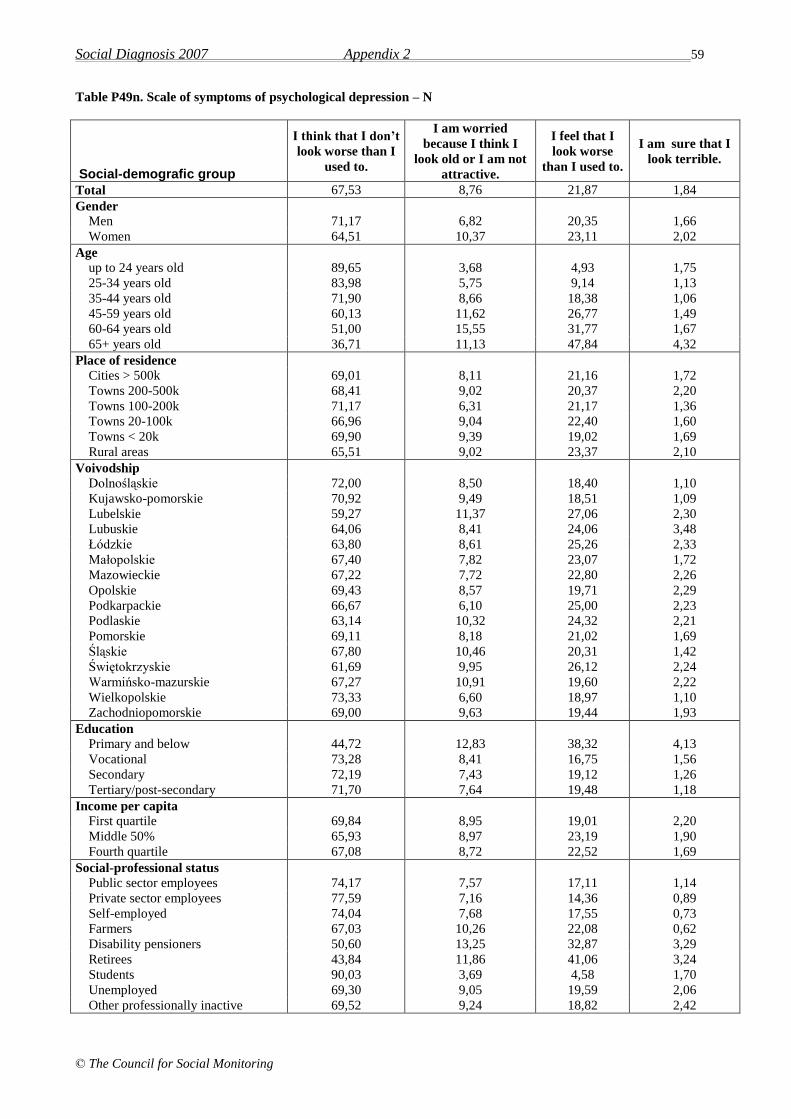
Social Diagnosis 2007 Appendix 2 59
© The Council for Social Monitoring
Table P49n. Scale of symptoms of psychological depression – N
Social-demografic group
I think that I don’t
look worse than I
used to.
I am worried
because I think I
look old or I am not
attractive.
I feel that I
look worse
than I used to.
I am sure that I
look terrible.
Total 67,53 8,76 21,87 1,84
Gender
Men 71,17 6,82 20,35 1,66
Women 64,51 10,37 23,11 2,02
Age
up to 24 years old 89,65 3,68 4,93 1,75
25-34 years old 83,98 5,75 9,14 1,13
35-44 years old 71,90 8,66 18,38 1,06
45-59 years old 60,13 11,62 26,77 1,49
60-64 years old 51,00 15,55 31,77 1,67
65+ years old 36,71 11,13 47,84 4,32
Place of residence
Cities > 500k 69,01 8,11 21,16 1,72
Towns 200-500k 68,41 9,02 20,37 2,20
Towns 100-200k 71,17 6,31 21,17 1,36
Towns 20-100k 66,96 9,04 22,40 1,60
Towns < 20k 69,90 9,39 19,02 1,69
Rural areas 65,51 9,02 23,37 2,10
Voivodship
Dolnośląskie 72,00 8,50 18,40 1,10
Kujawsko-pomorskie 70,92 9,49 18,51 1,09
Lubelskie 59,27 11,37 27,06 2,30
Lubuskie 64,06 8,41 24,06 3,48
Łódzkie 63,80 8,61 25,26 2,33
Małopolskie 67,40 7,82 23,07 1,72
Mazowieckie 67,22 7,72 22,80 2,26
Opolskie 69,43 8,57 19,71 2,29
Podkarpackie 66,67 6,10 25,00 2,23
Podlaskie 63,14 10,32 24,32 2,21
Pomorskie 69,11 8,18 21,02 1,69
Śląskie 67,80 10,46 20,31 1,42
Świętokrzyskie 61,69 9,95 26,12 2,24
Warmińsko-mazurskie 67,27 10,91 19,60 2,22
Wielkopolskie 73,33 6,60 18,97 1,10
Zachodniopomorskie 69,00 9,63 19,44 1,93
Education
Primary and below 44,72 12,83 38,32 4,13
Vocational 73,28 8,41 16,75 1,56
Secondary 72,19 7,43 19,12 1,26
Tertiary/post-secondary 71,70 7,64 19,48 1,18
Income per capita
First quartile 69,84 8,95 19,01 2,20
Middle 50% 65,93 8,97 23,19 1,90
Fourth quartile 67,08 8,72 22,52 1,69
Social-professional status
Public sector employees 74,17 7,57 17,11 1,14
Private sector employees 77,59 7,16 14,36 0,89
Self-employed 74,04 7,68 17,55 0,73
Farmers 67,03 10,26 22,08 0,62
Disability pensioners 50,60 13,25 32,87 3,29
Retirees 43,84 11,86 41,06 3,24
Students 90,03 3,69 4,58 1,70
Unemployed 69,30 9,05 19,59 2,06
Other professionally inactive 69,52 9,24 18,82 2,42
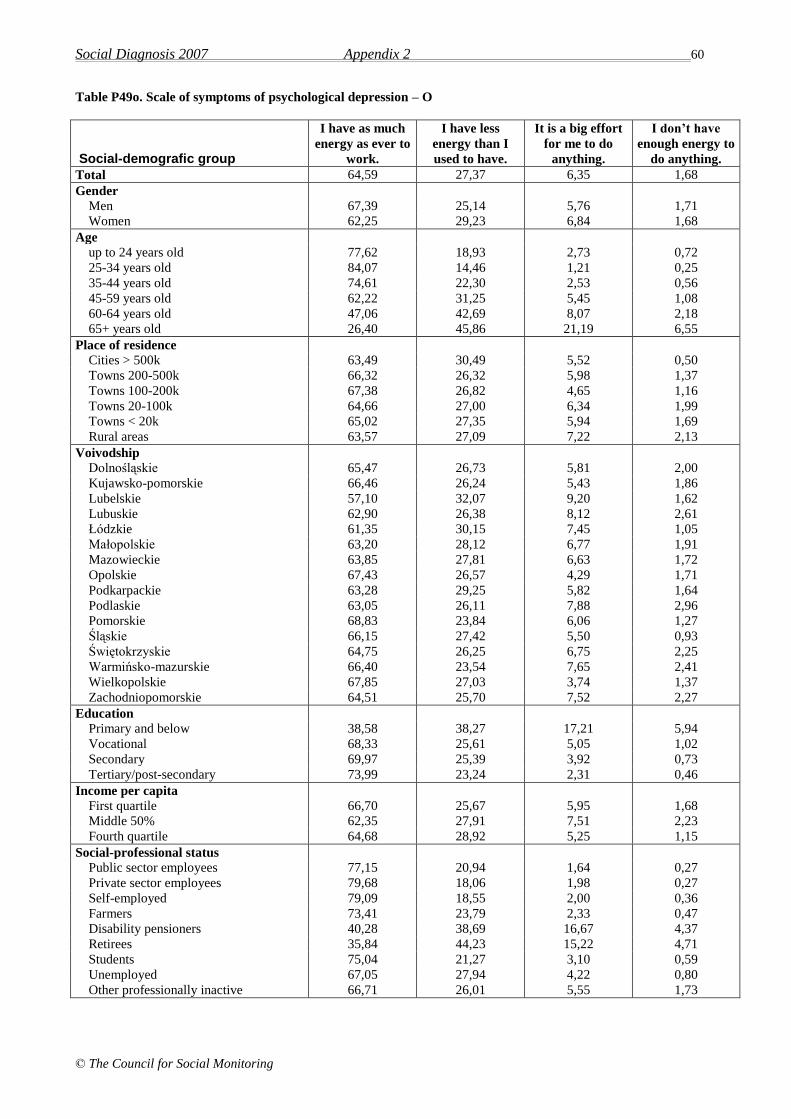
Social Diagnosis 2007 Appendix 2 60
© The Council for Social Monitoring
Table P49o. Scale of symptoms of psychological depression – O
Social-demografic group
I have as much
energy as ever to
work.
I have less
energy than I
used to have.
It is a big effort
for me to do
anything.
I don’t have
enough energy to
do anything.
Total 64,59 27,37 6,35 1,68
Gender
Men 67,39 25,14 5,76 1,71
Women 62,25 29,23 6,84 1,68
Age
up to 24 years old 77,62 18,93 2,73 0,72
25-34 years old 84,07 14,46 1,21 0,25
35-44 years old 74,61 22,30 2,53 0,56
45-59 years old 62,22 31,25 5,45 1,08
60-64 years old 47,06 42,69 8,07 2,18
65+ years old 26,40 45,86 21,19 6,55
Place of residence
Cities > 500k 63,49 30,49 5,52 0,50
Towns 200-500k 66,32 26,32 5,98 1,37
Towns 100-200k 67,38 26,82 4,65 1,16
Towns 20-100k 64,66 27,00 6,34 1,99
Towns < 20k 65,02 27,35 5,94 1,69
Rural areas 63,57 27,09 7,22 2,13
Voivodship
Dolnośląskie 65,47 26,73 5,81 2,00
Kujawsko-pomorskie 66,46 26,24 5,43 1,86
Lubelskie 57,10 32,07 9,20 1,62
Lubuskie 62,90 26,38 8,12 2,61
Łódzkie 61,35 30,15 7,45 1,05
Małopolskie 63,20 28,12 6,77 1,91
Mazowieckie 63,85 27,81 6,63 1,72
Opolskie 67,43 26,57 4,29 1,71
Podkarpackie 63,28 29,25 5,82 1,64
Podlaskie 63,05 26,11 7,88 2,96
Pomorskie 68,83 23,84 6,06 1,27
Śląskie 66,15 27,42 5,50 0,93
Świętokrzyskie 64,75 26,25 6,75 2,25
Warmińsko-mazurskie 66,40 23,54 7,65 2,41
Wielkopolskie 67,85 27,03 3,74 1,37
Zachodniopomorskie 64,51 25,70 7,52 2,27
Education
Primary and below 38,58 38,27 17,21 5,94
Vocational 68,33 25,61 5,05 1,02
Secondary 69,97 25,39 3,92 0,73
Tertiary/post-secondary 73,99 23,24 2,31 0,46
Income per capita
First quartile 66,70 25,67 5,95 1,68
Middle 50% 62,35 27,91 7,51 2,23
Fourth quartile 64,68 28,92 5,25 1,15
Social-professional status
Public sector employees 77,15 20,94 1,64 0,27
Private sector employees 79,68 18,06 1,98 0,27
Self-employed 79,09 18,55 2,00 0,36
Farmers 73,41 23,79 2,33 0,47
Disability pensioners 40,28 38,69 16,67 4,37
Retirees 35,84 44,23 15,22 4,71
Students 75,04 21,27 3,10 0,59
Unemployed 67,05 27,94 4,22 0,80
Other professionally inactive 66,71 26,01 5,55 1,73

Social Diagnosis 2007 Appendix 2 61
© The Council for Social Monitoring
Table P49p. Scale of symptoms of psychological depression – P
Social-demografic group
I have not
experienced any
change in my
sleeping pattern.
I do not
sleep as well
as I used to.
In the morning, I wake
up 1-2 hours earlier
and find it difficult to
fall asleep again.
I wake up
several hours
too early and I
can’t get back
to sleep.
Total 53,80 35,60 6,22 4,39
Gender
Men 58,02 32,93 5,80 3,26
Women 50,32 37,82 6,55 5,32
Age
up to 24 years old 77,66 18,53 2,51 1,30
25-34 years old 73,72 22,11 3,09 1,09
35-44 years old 60,55 33,84 3,69 1,92
45-59 years old 43,31 44,57 7,34 4,78
60-64 years old 31,21 52,18 10,40 6,21
65+ years old 21,65 52,14 13,31 12,91
Place of residence
Cities > 500k 54,52 35,72 5,67 4,09
Towns 200-500k 53,81 36,24 6,59 3,36
Towns 100-200k 54,55 35,01 6,67 3,77
Towns 20-100k 53,13 36,79 5,86 4,22
Towns < 20k 55,19 35,88 5,00 3,94
Rural areas 53,35 34,79 6,73 5,14
Voivodship
Dolnośląskie 52,65 37,26 6,19 3,90
Kujawsko-pomorskie 53,73 35,56 7,61 3,11
Lubelskie 47,43 39,59 8,38 4,59
Lubuskie 52,31 34,68 6,36 6,65
Łódzkie 51,28 37,53 4,78 6,41
Małopolskie 53,77 35,56 5,24 5,43
Mazowieckie 53,31 35,44 6,57 4,67
Opolskie 56,13 31,91 6,55 5,41
Podkarpackie 54,91 33,78 7,59 3,72
Podlaskie 54,90 34,56 5,64 4,90
Pomorskie 55,49 35,21 5,63 3,66
Śląskie 54,42 35,58 6,67 3,34
Świętokrzyskie 47,39 39,70 7,20 5,71
Warmińsko-mazurskie 54,93 32,80 7,65 4,63
Wielkopolskie 58,72 35,16 3,93 2,19
Zachodniopomorskie 57,02 31,75 5,26 5,96
Education
Primary and below 30,24 46,67 12,03 11,06
Vocational 58,27 32,80 5,42 3,51
Secondary 57,56 34,74 4,62 3,08
Tertiary/post-secondary 62,27 31,37 4,69 1,68
Income per capita
First quartile 55,79 33,33 6,00 4,88
Middle 50% 52,48 36,25 6,36 4,92
Fourth quartile 52,47 37,38 6,51 3,65
Social-professional status
Public sector employees 62,85 30,94 4,30 1,91
Private sector employees 64,97 29,73 3,59 1,71
Self-employed 64,48 30,05 4,55 0,91
Farmers 58,07 33,85 5,43 2,64
Disability pensioners 33,86 46,38 10,63 9,14
Retirees 26,33 51,85 11,81 10,00
Students 78,30 18,15 2,44 1,11
Unemployed 52,91 37,29 5,47 4,33
Other professionally inactive 55,07 34,68 5,30 4,95

Social Diagnosis 2007 Appendix 2 62
© The Council for Social Monitoring
Table P49q. Scale of symptoms of psychological depression – Q
Social-demografic group
I am no more
tired or
fatigued than
usual
I get tired or
fatigued more
easily than
usual.
I am too tired or
fatigued to do a lot
of things I used to
do.
I am too tired or
fatigued to do
anything.
Total 41,29 48,95 7,60 2,17
Gender
Men 44,43 47,49 6,25 1,83
Women 38,65 50,19 8,72 2,45
Age
up to 24 years old 79,10 17,86 2,10 0,94
25-34 years old 67,43 29,68 1,96 0,92
35-44 years old 42,99 53,06 3,29 0,66
45-59 years old 23,28 68,21 6,93 1,57
60-64 years old 12,56 75,04 10,55 1,84
65+ years old 5,75 61,77 24,89 7,59
Place of residence
Cities > 500k 42,23 48,53 7,23 2,00
Towns 200-500k 39,41 53,03 6,26 1,31
Towns 100-200k 41,10 50,77 6,77 1,35
Towns 20-100k 40,69 50,30 6,54 2,47
Towns < 20k 43,22 47,22 7,62 1,94
Rural areas 41,28 47,31 8,85 2,56
Voivodship
Dolnośląskie 42,81 47,11 8,18 1,90
Kujawsko-pomorskie 43,93 49,07 5,61 1,40
Lubelskie 34,24 53,04 10,28 2,44
Lubuskie 40,46 45,09 11,27 3,18
Łódzkie 39,58 50,29 8,03 2,10
Małopolskie 41,71 47,52 7,71 3,05
Mazowieckie 40,80 49,14 7,63 2,42
Opolskie 37,71 52,86 8,29 1,14
Podkarpackie 41,28 48,73 7,75 2,24
Podlaskie 41,18 46,32 10,05 2,45
Pomorskie 40,70 50,00 7,46 1,83
Śląskie 40,77 51,51 6,05 1,67
Świętokrzyskie 39,05 49,75 9,20 1,99
Warmińsko-mazurskie 48,69 41,45 6,24 3,62
Wielkopolskie 43,65 48,68 5,94 1,74
Zachodniopomorskie 43,51 46,84 7,54 2,11
Education
Primary and below 18,84 54,52 19,77 6,87
Vocational 46,63 46,21 5,70 1,46
Secondary 45,60 48,79 4,45 1,16
Tertiary/post-secondary 46,33 48,60 4,48 0,59
Income per capita
First quartile 47,06 44,34 6,69 1,90
Middle 50% 40,35 48,10 8,73 2,81
Fourth quartile 37,39 53,56 7,34 1,71
Social-professional status
Public sector employees 44,50 52,02 2,72 0,76
Private sector employees 53,75 42,65 2,54 1,06
Self-employed 45,92 49,91 3,45 0,73
Farmers 37,73 58,70 3,42 0,16
Disability pensioners 18,53 57,19 18,33 5,95
Retirees 9,88 66,41 18,76 4,94
Students 80,06 17,06 2,29 0,59
Unemployed 46,51 47,54 5,03 0,91
Other professionally inactive 46,77 45,51 5,65 2,07

Social Diagnosis 2007 Appendix 2 63
© The Council for Social Monitoring
Table P49r. Scale of symptoms of psychological depression – R
Social-demografic group
I have not
experienced any
change in my
appetite.
My appetite is
somewhat less
than usual.
My appetite is
much less than
before.
I have no
appetite at all.
Total 71,78 21,46 5,43 1,32
Gender
Men 75,32 19,49 4,28 0,91
Women 68,87 23,11 6,37 1,65
Age
up to 24 years old 84,97 11,99 1,92 1,12
25-34 years old 85,50 12,91 1,13 0,46
35-44 years old 79,41 17,70 2,28 0,61
45-59 years old 69,11 24,42 5,13 1,34
60-64 years old 58,86 31,44 7,69 2,01
65+ years old 41,72 37,85 17,41 3,03
Place of residence
Cities > 500k 75,25 18,94 4,16 1,65
Towns 200-500k 75,58 18,86 4,12 1,44
Towns 100-200k 75,34 19,25 4,45 0,97
Towns 20-100k 72,17 21,57 4,82 1,44
Towns < 20k 70,60 23,85 4,37 1,19
Rural areas 68,99 22,67 7,11 1,22
Voivodship
Dolnośląskie 72,65 21,34 4,21 1,80
Kujawsko-pomorskie 73,09 21,31 4,51 1,09
Lubelskie 63,06 26,79 8,66 1,49
Lubuskie 71,22 21,22 6,10 1,45
Łódzkie 67,91 24,88 5,93 1,28
Małopolskie 69,59 22,50 6,77 1,14
Mazowieckie 71,00 21,03 6,50 1,48
Opolskie 78,57 17,43 3,14 0,86
Podkarpackie 71,68 22,50 4,47 1,34
Podlaskie 71,01 20,39 7,37 1,23
Pomorskie 75,07 17,61 6,06 1,27
Śląskie 73,16 22,58 3,08 1,17
Świętokrzyskie 69,48 20,84 7,94 1,74
Warmińsko-mazurskie 71,77 20,97 5,65 1,61
Wielkopolskie 76,69 18,10 3,84 1,37
Zachodniopomorskie 73,38 20,32 5,78 0,53
Education
Primary and below 49,09 33,20 15,00 2,71
Vocational 73,73 20,82 4,16 1,29
Secondary 76,41 19,20 3,18 1,21
Tertiary/post-secondary 82,28 15,25 2,26 0,21
Income per capita
First quartile 71,23 21,53 5,69 1,55
Middle 50% 69,52 22,42 6,56 1,49
Fourth quartile 73,67 21,14 4,21 0,98
Social-professional status
Public sector employees 83,43 14,22 1,53 0,82
Private sector employees 81,21 15,99 2,23 0,58
Self-employed 82,91 15,64 1,27 0,18
Farmers 77,95 18,79 3,26 0,00
Disability pensioners 52,08 31,85 12,30 3,77
Retirees 49,83 35,20 12,74 2,24
Students 85,17 11,81 1,70 1,33
Unemployed 71,23 22,95 4,91 0,91
Other professionally inactive 72,32 21,45 5,07 1,15

Social Diagnosis 2007 Appendix 2 64
© The Council for Social Monitoring
Table P49t. Scale of symptoms of psychological depression – T
Social-demografic group
I am not worried
about my health
any more than I
used to be.
I am worried about
such ailments as:
stomach pains,
upset stomach or
constipation.
I am very worried
about my health;
I think about it
constantly.
I am so worried
about my health
that I cannot
think of anything
else.
Total 59,45 24,89 14,28 1,38
Gender
Men 64,20 23,15 11,66 0,99
Women 55,50 26,34 16,47 1,69
Age
up to 24 years old 85,29 11,36 3,13 0,22
25-34 years old 75,86 18,66 5,15 0,33
35-44 years old 63,58 25,70 10,12 0,61
45-59 years old 51,18 30,84 16,43 1,55
60-64 years old 38,09 38,26 21,64 2,01
65+ years old 27,57 32,49 35,77 4,17
Place of residence
Cities > 500k 62,11 24,73 12,15 1,01
Towns 200-500k 61,88 25,55 11,20 1,37
Towns 100-200k 59,24 27,69 12,49 0,58
Towns 20-100k 59,35 24,99 14,11 1,55
Towns < 20k 60,02 24,30 14,43 1,25
Rural areas 57,78 24,28 16,31 1,63
Voivodship
Dolnośląskie 54,61 29,26 14,93 1,20
Kujawsko-pomorskie 66,51 20,72 11,37 1,40
Lubelskie 50,07 27,06 21,92 0,95
Lubuskie 57,10 26,96 14,78 1,16
Łódzkie 57,48 24,88 15,65 1,99
Małopolskie 57,36 26,10 14,91 1,63
Mazowieckie 60,80 22,73 14,99 1,48
Opolskie 56,29 28,00 14,00 1,71
Podkarpackie 57,44 26,19 15,03 1,34
Podlaskie 56,76 26,29 15,97 0,98
Pomorskie 63,61 23,98 10,86 1,55
Śląskie 60,80 26,42 11,85 0,93
Świętokrzyskie 56,47 23,88 17,66 1,99
Warmińsko-mazurskie 65,39 20,12 12,27 2,21
Wielkopolskie 62,65 24,20 11,96 1,19
Zachodniopomorskie 64,27 20,67 14,01 1,05
Education
Primary and below 35,60 29,16 30,80 4,44
Vocational 63,86 22,53 12,64 0,97
Secondary 63,74 24,96 10,59 0,71
Tertiary/post-secondary 67,43 24,78 7,58 0,21
Income per capita
First quartile 64,22 20,80 13,77 1,21
Middle 50% 56,62 25,62 15,93 1,83
Fourth quartile 59,15 26,71 13,27 0,87
Social-professional status
Public sector employees 66,59 24,97 8,22 0,22
Private sector employees 70,67 22,23 6,85 0,24
Self-employed 70,78 23,05 5,81 0,36
Farmers 58,94 29,55 10,89 0,62
Disability pensioners 34,53 29,55 31,04 4,88
Retirees 33,29 33,87 29,93 2,90
Students 86,21 10,69 2,88 0,22
Unemployed 63,01 21,92 13,36 1,71
Other professionally inactive 61,18 24,42 12,79 1,61
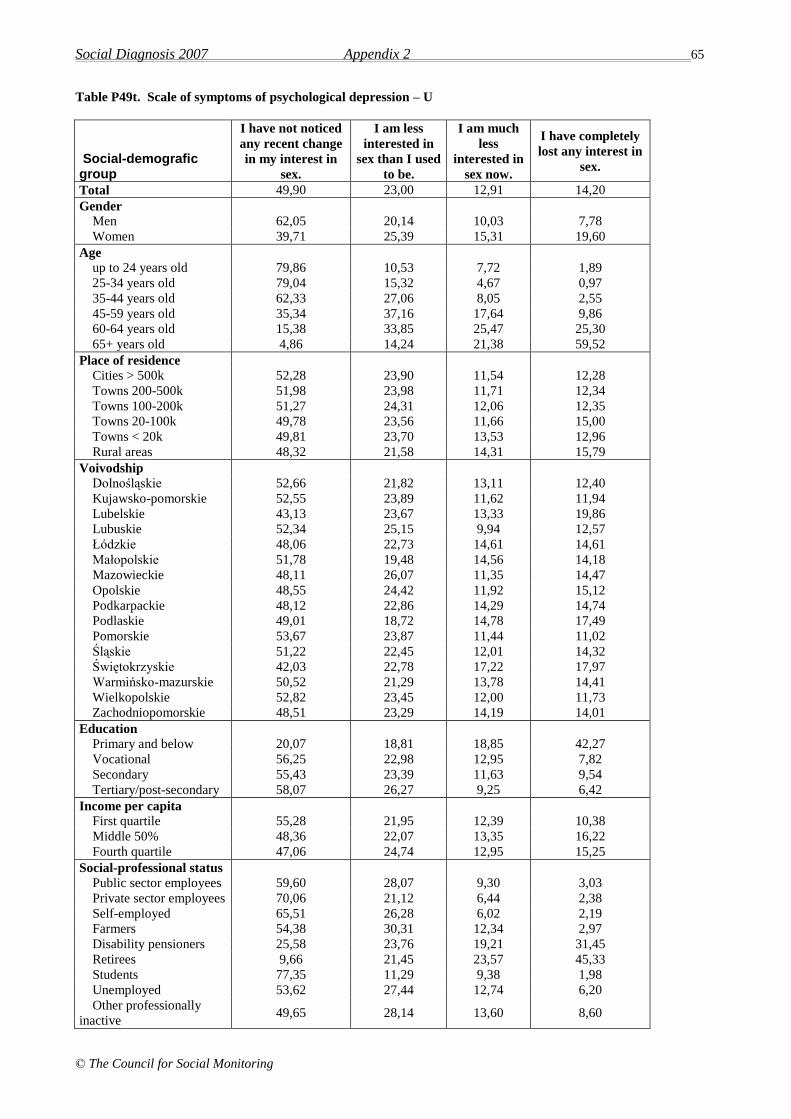
Social Diagnosis 2007 Appendix 2 65
© The Council for Social Monitoring
Table P49t. Scale of symptoms of psychological depression – U
Social-demografic group
I have not noticed
any recent change
in my interest in
sex.
I am less
interested in
sex than I used
to be.
I am much
less
interested in
sex now.
I have completely
lost any interest in
sex.
Total 49,90 23,00 12,91 14,20
Gender
Men 62,05 20,14 10,03 7,78
Women 39,71 25,39 15,31 19,60
Age
up to 24 years old 79,86 10,53 7,72 1,89
25-34 years old 79,04 15,32 4,67 0,97
35-44 years old 62,33 27,06 8,05 2,55
45-59 years old 35,34 37,16 17,64 9,86
60-64 years old 15,38 33,85 25,47 25,30
65+ years old 4,86 14,24 21,38 59,52
Place of residence
Cities > 500k 52,28 23,90 11,54 12,28
Towns 200-500k 51,98 23,98 11,71 12,34
Towns 100-200k 51,27 24,31 12,06 12,35
Towns 20-100k 49,78 23,56 11,66 15,00
Towns < 20k 49,81 23,70 13,53 12,96
Rural areas 48,32 21,58 14,31 15,79
Voivodship
Dolnośląskie 52,66 21,82 13,11 12,40
Kujawsko-pomorskie 52,55 23,89 11,62 11,94
Lubelskie 43,13 23,67 13,33 19,86
Lubuskie 52,34 25,15 9,94 12,57
Łódzkie 48,06 22,73 14,61 14,61
Małopolskie 51,78 19,48 14,56 14,18
Mazowieckie 48,11 26,07 11,35 14,47
Opolskie 48,55 24,42 11,92 15,12
Podkarpackie 48,12 22,86 14,29 14,74
Podlaskie 49,01 18,72 14,78 17,49
Pomorskie 53,67 23,87 11,44 11,02
Śląskie 51,22 22,45 12,01 14,32
Świętokrzyskie 42,03 22,78 17,22 17,97
Warmińsko-mazurskie 50,52 21,29 13,78 14,41
Wielkopolskie 52,82 23,45 12,00 11,73
Zachodniopomorskie 48,51 23,29 14,19 14,01
Education
Primary and below 20,07 18,81 18,85 42,27
Vocational 56,25 22,98 12,95 7,82
Secondary 55,43 23,39 11,63 9,54
Tertiary/post-secondary 58,07 26,27 9,25 6,42
Income per capita
First quartile 55,28 21,95 12,39 10,38
Middle 50% 48,36 22,07 13,35 16,22
Fourth quartile 47,06 24,74 12,95 15,25
Social-professional status
Public sector employees 59,60 28,07 9,30 3,03
Private sector employees 70,06 21,12 6,44 2,38
Self-employed 65,51 26,28 6,02 2,19
Farmers 54,38 30,31 12,34 2,97
Disability pensioners 25,58 23,76 19,21 31,45
Retirees 9,66 21,45 23,57 45,33
Students 77,35 11,29 9,38 1,98
Unemployed 53,62 27,44 12,74 6,20
Other professionally
inactive 49,65 28,14 13,60 8,60

Social Diagnosis 2007 Appendix 2 66
© The Council for Social Monitoring
Table P50.1. I admire people who have expensive houses, cars and clothes
Social-demografic group
certainly
positive positive
somewhat
positive
neither
positive
nor
negative
somewhat
negative negative
certainly
negative
Total 5,78 12,98 11,66 22,27 15,25 24,42 7,64
Gender
Men 6,61 14,55 12,76 22,20 14,97 22,40 6,52
Women 5,09 11,69 10,73 22,35 15,47 26,10 8,56
Age
up to 24 years old 8,16 15,29 15,07 22,33 13,50 16,55 9,10
25-34 years old 6,57 14,49 13,99 22,40 15,95 19,39 7,20
35-44 years old 4,83 11,50 11,14 25,84 16,53 23,50 6,66
45-59 years old 5,25 13,17 10,35 22,11 14,81 27,10 7,21
60-64 years old 5,58 11,17 10,66 20,30 17,26 28,93 6,09
65+ years old 4,02 10,29 7,98 19,53 15,21 34,29 8,68
Place of residence
Cities > 500k 2,94 9,62 10,12 28,36 13,57 25,63 9,76
Towns 200-500k 3,20 7,65 12,39 23,80 15,66 26,86 10,44
Towns 100-200k 4,30 10,64 10,55 22,85 15,53 26,76 9,38
Towns 20-100k 5,98 11,64 9,95 22,63 15,81 27,05 6,94
Towns < 20k 6,17 13,53 11,83 20,83 15,80 23,98 7,87
Rural areas 7,51 16,68 12,98 20,19 15,06 21,54 6,05
Voivodship
Dolnośląskie 4,31 12,63 9,12 22,55 13,53 29,66 8,22
Kujawsko-pomorskie 7,32 15,26 11,53 20,40 13,55 25,55 6,39
Lubelskie 9,80 13,74 11,29 20,41 16,19 21,77 6,80
Lubuskie 5,81 13,95 11,34 20,64 15,70 23,84 8,72
Łódzkie 4,68 11,93 9,47 25,85 15,09 27,02 5,96
Małopolskie 6,39 12,96 10,96 20,21 16,68 25,17 7,63
Mazowieckie 5,73 13,42 11,04 25,12 12,95 23,03 8,71
Opolskie 6,96 12,17 12,17 23,19 17,39 21,16 6,96
Podkarpackie 5,37 11,04 11,19 22,39 16,72 24,78 8,51
Podlaskie 5,94 12,38 13,86 21,29 15,10 24,50 6,93
Pomorskie 2,82 11,44 11,16 23,16 17,94 26,55 6,92
Śląskie 4,11 11,10 13,47 23,13 15,15 23,63 9,41
Świętokrzyskie 7,52 16,54 14,29 19,55 17,04 21,30 3,76
Warmińsko-mazurskie 7,30 14,60 15,42 21,70 11,76 21,50 7,71
Wielkopolskie 5,66 13,41 10,22 20,89 17,15 25,27 7,39
Zachodniopomorskie 7,92 15,49 15,14 18,84 15,14 20,60 6,87
Education
Primary and below 7,33 15,65 10,78 19,81 14,49 25,22 6,71
Vocational 7,50 15,35 13,03 20,33 14,70 22,65 6,45
Secondary 4,74 12,51 11,16 23,22 15,76 25,27 7,33
Tertiary/post-secondary 3,10 7,21 10,94 26,40 16,01 25,31 11,02
Income per capita
First quartile 7,21 17,04 13,17 20,38 13,56 21,99 6,65
Middle 50% 6,36 12,90 12,00 22,34 15,33 23,67 7,41
Fourth quartile 3,83 10,40 10,01 23,20 16,46 27,21 8,88
Social-professional status
Public sector employees 4,49 9,36 10,13 25,01 17,68 24,85 8,48
Private sector employees 5,57 14,05 12,99 23,44 15,12 21,58 7,25
Self-employed 4,36 12,18 14,00 26,73 14,73 21,64 6,36
Farmers 9,52 17,00 13,88 20,44 13,57 19,81 5,77
Disability pensioners 6,30 11,80 10,00 22,10 15,70 27,20 6,90
Retirees 4,02 11,04 8,62 19,89 15,83 32,33 8,27
Students 7,74 14,90 15,04 22,20 14,01 16,81 9,29
Unemployed 7,92 16,99 12,51 19,06 13,55 23,77 6,20
Other professionally
inactive 6,70 14,55 11,89 22,06 13,51 24,13 7,16

Social Diagnosis 2007 Appendix 2 67
© The Council for Social Monitoring
Table P50.2. Success in life is assessed through the possession of various material goods
Social-demografic group
certainly
positive positive
somewhat
positive
neither
positive
nor
negative
somewhat
negative negative
certainly
negative
Total 3,16 12,66 18,38 17,60 17,00 23,71 7,47
Gender
Men 4,12 15,37 19,79 17,76 16,11 21,03 5,82
Women 2,37 10,41 17,21 17,48 17,73 25,95 8,84
Age
up to 24 years old 4,89 14,86 21,64 19,40 15,13 15,85 8,22
25-34 years old 3,31 13,91 18,52 18,52 16,93 21,46 7,33
35-44 years old 2,64 11,90 18,20 17,29 18,71 24,35 6,91
45-59 years old 2,70 12,35 18,80 16,69 16,25 25,28 7,95
60-64 years old 2,88 12,71 17,46 16,95 18,31 26,27 5,42
65+ years old 2,51 10,02 14,38 16,53 18,29 31,06 7,21
Place of residence
Cities > 500k 1,72 9,76 18,23 17,66 16,44 24,34 11,84
Towns 200-500k 2,02 8,85 17,28 17,56 15,54 28,50 10,24
Towns 100-200k 2,14 11,21 17,35 17,35 17,64 26,61 7,70
Towns 20-100k 3,61 12,24 16,97 16,21 17,82 25,52 7,62
Towns < 20k 3,33 11,70 19,87 18,24 17,55 21,82 7,48
Rural areas 3,85 15,62 19,24 18,21 16,83 21,05 5,21
Voivodship
Dolnośląskie 2,01 13,25 15,06 15,16 16,97 29,62 7,93
Kujawsko-pomorskie 4,85 13,77 18,31 18,62 14,55 24,57 5,32
Lubelskie 4,76 12,11 19,18 16,60 21,63 18,50 7,21
Lubuskie 4,64 12,75 19,13 18,55 15,36 22,32 7,25
Łódzkie 1,64 13,72 14,65 17,70 20,28 24,85 7,15
Małopolskie 3,05 13,44 15,92 19,26 15,35 25,45 7,53
Mazowieckie 3,34 13,25 19,69 18,08 16,65 21,00 8,00
Opolskie 2,91 10,17 20,06 19,77 20,35 19,19 7,56
Podkarpackie 2,09 13,41 17,14 16,24 19,82 23,99 7,30
Podlaskie 2,72 12,10 21,23 15,56 16,54 25,19 6,67
Pomorskie 1,41 9,58 17,18 20,70 17,89 24,79 8,45
Śląskie 2,25 11,10 18,90 17,16 16,78 24,70 9,11
Świętokrzyskie 4,26 15,04 22,56 16,54 18,05 19,55 4,01
Warmińsko-mazurskie 5,69 11,99 17,48 20,93 14,63 22,15 7,11
Wielkopolskie 3,29 13,16 20,38 16,54 13,53 25,96 7,13
Zachodniopomorskie 5,63 13,56 21,48 15,85 16,55 20,25 6,69
Education
Primary and below 4,38 13,60 16,95 19,32 16,64 23,48 5,64
Vocational 4,04 16,21 20,35 17,88 15,69 20,27 5,56
Secondary 2,66 11,69 19,50 16,43 17,14 24,93 7,63
Tertiary/post-secondary 1,43 7,46 14,51 17,44 19,29 27,76 12,12
Income per capita
First quartile 4,17 15,52 19,83 17,74 16,48 20,57 5,70
Middle 50% 3,36 13,00 17,91 18,01 16,91 24,01 6,80
Fourth quartile 2,28 9,75 17,65 16,86 17,82 25,74 9,90
Social-professional status
Public sector employees 2,19 9,08 15,26 17,12 20,19 26,70 9,46
Private sector employees 3,06 14,03 19,11 18,39 16,36 21,97 7,08
Self-employed 3,64 12,02 17,67 21,13 15,30 22,22 8,01
Farmers 4,99 18,25 23,71 15,60 14,51 17,32 5,62
Disability pensioners 3,10 12,20 17,00 19,90 15,40 27,00 5,40
Retirees 2,61 10,63 15,93 16,52 18,74 28,40 7,17
Students 4,73 14,84 21,42 18,61 14,84 16,54 9,01
Unemployed 2,99 15,52 20,80 16,32 16,67 20,80 6,90
Other professionally
inactive 3,47 12,14 20,81 15,26 15,72 25,32 7,28

Social Diagnosis 2007 Appendix 2 68
© The Council for Social Monitoring
Table P50.3. I like to have things which others would envy
Social-demografic group
certainly
positive positive
somewhat
positive
neither
positive
nor
negative
somewhat
negative negative
certainly
negative
Total 2,67 8,40 9,51 15,65 19,55 35,69 8,53
Gender
Men 3,35 9,25 10,82 16,94 19,18 33,47 7,01
Women 2,11 7,70 8,41 14,58 19,84 37,56 9,81
Age
up to 24 years old 6,01 14,59 16,20 19,34 17,24 19,75 6,87
25-34 years old 3,14 9,93 12,48 17,47 21,20 28,40 7,37
35-44 years old 1,88 6,96 9,30 16,57 21,35 35,74 8,19
45-59 years old 1,67 6,83 6,65 14,98 19,28 41,53 9,06
60-64 years old 1,35 5,08 6,43 12,86 22,17 45,69 6,43
65+ years old 1,20 4,71 4,41 10,43 18,05 49,25 11,94
Place of residence
Cities > 500k 1,72 5,74 9,26 18,23 19,02 34,75 11,27
Towns 200-500k 1,88 5,71 7,53 15,54 19,51 38,12 11,71
Towns 100-200k 2,53 7,50 8,67 13,65 18,52 39,28 9,84
Towns 20-100k 2,65 8,38 9,07 16,25 18,77 36,46 8,42
Towns < 20k 3,08 8,06 9,06 17,18 18,75 34,55 9,31
Rural areas 3,10 10,35 10,76 14,50 20,62 34,43 6,24
Voivodship
Dolnośląskie 1,40 8,82 8,82 15,03 14,53 41,88 9,52
Kujawsko-pomorskie 2,98 7,68 7,05 13,48 18,50 43,89 6,43
Lubelskie 3,81 11,31 11,72 16,49 18,94 29,56 8,17
Lubuskie 3,78 9,30 11,05 12,50 22,09 32,27 9,01
Łódzkie 1,52 9,82 7,49 15,44 22,34 35,79 7,60
Małopolskie 3,05 8,95 9,05 13,81 18,29 37,90 8,95
Mazowieckie 3,46 10,20 10,55 18,19 17,77 32,26 7,57
Opolskie 2,90 6,96 9,57 14,20 24,64 33,04 8,70
Podkarpackie 3,27 9,97 9,97 13,69 20,09 35,12 7,89
Podlaskie 2,48 7,43 10,15 16,83 19,55 36,63 6,93
Pomorskie 1,13 5,65 8,05 16,53 21,33 37,15 10,17
Śląskie 1,93 6,04 9,78 17,13 21,99 32,83 10,28
Świętokrzyskie 1,51 9,55 9,55 16,83 24,12 35,68 2,76
Warmińsko-mazurskie 3,85 8,72 13,39 14,60 17,44 33,06 8,92
Wielkopolskie 2,37 6,39 8,22 13,79 18,90 41,00 9,32
Zachodniopomorskie 4,77 8,30 9,54 16,96 19,26 31,45 9,72
Education
Primary and below 3,22 7,87 6,71 11,85 19,31 41,75 9,30
Vocational 3,61 10,54 10,72 15,95 18,77 33,67 6,73
Secondary 2,16 7,97 9,97 16,21 20,02 35,45 8,22
Tertiary/post-secondary 1,38 5,99 9,30 17,80 20,32 33,85 11,35
Income per capita
First quartile 3,35 11,60 9,43 15,56 19,30 33,55 7,21
Middle 50% 2,95 8,34 9,37 16,07 19,00 35,93 8,34
Fourth quartile 1,55 6,63 9,42 14,97 20,07 37,38 9,98
Social-professional status
Public sector employees 1,48 5,86 8,98 16,37 21,96 36,14 9,20
Private sector employees 2,48 8,97 11,21 17,43 19,66 32,14 8,11
Self-employed 2,55 9,47 11,48 16,58 22,04 31,33 6,56
Farmers 3,74 10,90 9,35 16,36 21,34 32,87 5,45
Disability pensioners 2,30 7,41 7,11 13,61 18,32 42,44 8,81
Retirees 1,33 4,91 4,91 11,26 19,13 47,90 10,56
Students 6,58 15,46 16,42 19,67 15,53 19,23 7,10
Unemployed 2,88 9,90 8,75 16,11 19,68 34,29 8,40
Other professionally
inactive 3,00 8,43 10,05 15,47 19,98 34,99 8,08

Social Diagnosis 2007 Appendix 2 69
© The Council for Social Monitoring
Table P50.4. I like to buy things which are not practicable
Social-demografic group
certainly
positive positive
somewhat
positive
neither
positive
nor
negative
somewhat
negative negative
certainly
negative
Total 0,89 3,38 3,37 6,87 14,87 49,51 21,10
Gender
Men 0,88 2,89 3,01 6,18 13,89 50,94 22,21
Women 0,89 3,80 3,69 7,47 15,66 48,32 20,17
Age
up to 24 years old 1,52 5,56 5,74 10,58 19,28 39,37 17,94
25-34 years old 1,05 4,27 4,69 8,38 18,43 44,89 18,30
35-44 years old 0,66 2,85 3,10 6,86 15,40 51,19 19,93
45-59 years old 0,70 2,64 2,44 5,11 12,85 53,96 22,30
60-64 years old 0,68 3,72 2,53 5,74 14,19 52,53 20,61
65+ years old 0,50 1,51 1,40 4,32 8,78 56,25 27,25
Place of residence
Cities > 500k 1,94 2,94 5,38 9,76 15,87 42,07 22,04
Towns 200-500k 0,63 4,17 3,48 6,82 13,63 48,26 23,02
Towns 100-200k 0,49 2,64 3,81 7,23 16,70 49,22 19,92
Towns 20-100k 0,60 3,65 3,33 7,38 15,16 47,65 22,22
Towns < 20k 1,01 3,78 3,15 8,06 15,80 46,88 21,33
Rural areas 0,84 3,14 2,78 5,29 14,06 54,11 19,78
Voivodship
Dolnośląskie 1,20 4,81 3,21 5,01 10,92 50,40 24,45
Kujawsko-pomorskie 1,09 3,91 2,19 4,69 15,94 52,97 19,22
Lubelskie 0,82 3,54 3,41 7,22 14,71 48,37 21,93
Lubuskie 0,87 2,33 2,92 7,58 18,66 46,36 21,28
Łódzkie 1,05 3,86 2,11 6,32 16,61 49,82 20,23
Małopolskie 1,62 2,29 3,43 7,63 12,68 49,86 22,50
Mazowieckie 1,07 3,76 4,29 6,86 15,15 49,97 18,90
Opolskie 0,29 2,32 2,61 4,06 17,39 48,99 24,35
Podkarpackie 0,60 2,98 2,68 5,81 16,10 49,33 22,50
Podlaskie 0,50 3,22 2,48 9,41 11,39 51,73 21,29
Pomorskie 0,71 3,25 3,81 8,19 17,37 46,05 20,62
Śląskie 0,50 3,55 4,05 8,48 14,71 45,51 23,19
Świętokrzyskie 0,25 4,00 3,25 6,25 15,25 55,50 15,50
Warmińsko-mazurskie 0,40 1,82 3,03 7,07 15,15 50,30 22,22
Wielkopolskie 1,00 3,47 3,38 7,03 14,89 52,15 18,08
Zachodniopomorskie 1,06 2,64 4,05 6,16 15,49 49,47 21,13
Education
Primary and below 1,21 2,42 1,88 5,24 10,61 54,77 23,87
Vocational 0,75 3,89 3,74 6,25 14,10 52,78 18,51
Secondary 0,96 3,22 3,12 7,08 15,99 48,77 20,86
Tertiary/post-secondary 0,71 3,65 4,61 9,09 18,32 40,32 23,30
Income per capita
First quartile 0,91 4,43 3,22 6,09 13,00 53,04 19,30
Middle 50% 0,93 2,75 2,86 6,58 14,46 50,24 22,18
Fourth quartile 0,70 3,44 4,40 7,70 16,30 46,69 20,78
Social-professional status
Public sector employees 0,77 3,28 3,39 8,37 17,41 46,80 19,98
Private sector employees 0,96 3,40 3,85 7,11 15,97 48,76 19,95
Self-employed 0,36 3,46 4,55 7,83 18,21 47,18 18,40
Farmers 1,25 2,96 2,03 5,77 10,76 57,41 19,81
Disability pensioners 0,50 1,90 2,20 4,21 12,22 53,51 25,45
Retirees 0,51 2,22 1,79 4,79 10,09 55,20 25,40
Students 1,55 5,46 6,86 11,59 20,44 36,46 17,64
Unemployed 1,49 4,60 3,22 6,90 14,48 50,69 18,62
Other professionally
inactive 0,81 4,50 2,77 5,08 15,47 51,27 20,09
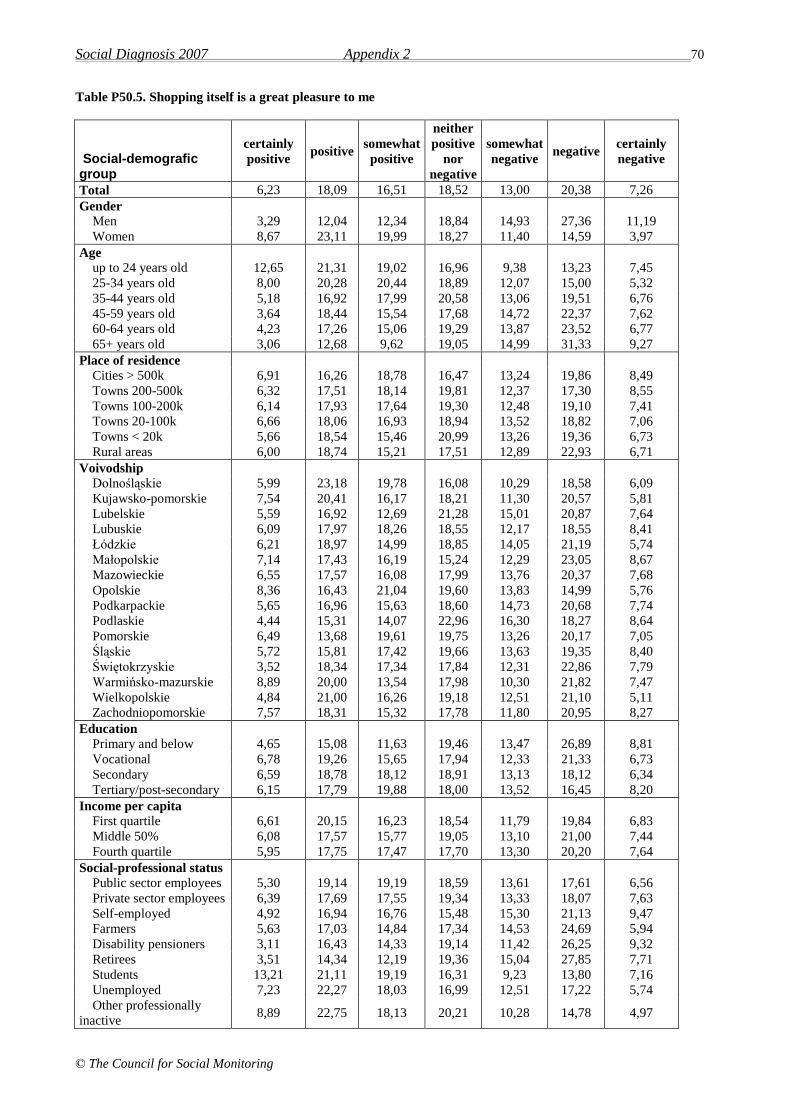
Social Diagnosis 2007 Appendix 2 70
© The Council for Social Monitoring
Table P50.5. Shopping itself is a great pleasure to me
Social-demografic group
certainly
positive positive
somewhat
positive
neither
positive
nor
negative
somewhat
negative negative
certainly
negative
Total 6,23 18,09 16,51 18,52 13,00 20,38 7,26
Gender
Men 3,29 12,04 12,34 18,84 14,93 27,36 11,19
Women 8,67 23,11 19,99 18,27 11,40 14,59 3,97
Age
up to 24 years old 12,65 21,31 19,02 16,96 9,38 13,23 7,45
25-34 years old 8,00 20,28 20,44 18,89 12,07 15,00 5,32
35-44 years old 5,18 16,92 17,99 20,58 13,06 19,51 6,76
45-59 years old 3,64 18,44 15,54 17,68 14,72 22,37 7,62
60-64 years old 4,23 17,26 15,06 19,29 13,87 23,52 6,77
65+ years old 3,06 12,68 9,62 19,05 14,99 31,33 9,27
Place of residence
Cities > 500k 6,91 16,26 18,78 16,47 13,24 19,86 8,49
Towns 200-500k 6,32 17,51 18,14 19,81 12,37 17,30 8,55
Towns 100-200k 6,14 17,93 17,64 19,30 12,48 19,10 7,41
Towns 20-100k 6,66 18,06 16,93 18,94 13,52 18,82 7,06
Towns < 20k 5,66 18,54 15,46 20,99 13,26 19,36 6,73
Rural areas 6,00 18,74 15,21 17,51 12,89 22,93 6,71
Voivodship
Dolnośląskie 5,99 23,18 19,78 16,08 10,29 18,58 6,09
Kujawsko-pomorskie 7,54 20,41 16,17 18,21 11,30 20,57 5,81
Lubelskie 5,59 16,92 12,69 21,28 15,01 20,87 7,64
Lubuskie 6,09 17,97 18,26 18,55 12,17 18,55 8,41
Łódzkie 6,21 18,97 14,99 18,85 14,05 21,19 5,74
Małopolskie 7,14 17,43 16,19 15,24 12,29 23,05 8,67
Mazowieckie 6,55 17,57 16,08 17,99 13,76 20,37 7,68
Opolskie 8,36 16,43 21,04 19,60 13,83 14,99 5,76
Podkarpackie 5,65 16,96 15,63 18,60 14,73 20,68 7,74
Podlaskie 4,44 15,31 14,07 22,96 16,30 18,27 8,64
Pomorskie 6,49 13,68 19,61 19,75 13,26 20,17 7,05
Śląskie 5,72 15,81 17,42 19,66 13,63 19,35 8,40
Świętokrzyskie 3,52 18,34 17,34 17,84 12,31 22,86 7,79
Warmińsko-mazurskie 8,89 20,00 13,54 17,98 10,30 21,82 7,47
Wielkopolskie 4,84 21,00 16,26 19,18 12,51 21,10 5,11
Zachodniopomorskie 7,57 18,31 15,32 17,78 11,80 20,95 8,27
Education
Primary and below 4,65 15,08 11,63 19,46 13,47 26,89 8,81
Vocational 6,78 19,26 15,65 17,94 12,33 21,33 6,73
Secondary 6,59 18,78 18,12 18,91 13,13 18,12 6,34
Tertiary/post-secondary 6,15 17,79 19,88 18,00 13,52 16,45 8,20
Income per capita
First quartile 6,61 20,15 16,23 18,54 11,79 19,84 6,83
Middle 50% 6,08 17,57 15,77 19,05 13,10 21,00 7,44
Fourth quartile 5,95 17,75 17,47 17,70 13,30 20,20 7,64
Social-professional status
Public sector employees 5,30 19,14 19,19 18,59 13,61 17,61 6,56
Private sector employees 6,39 17,69 17,55 19,34 13,33 18,07 7,63
Self-employed 4,92 16,94 16,76 15,48 15,30 21,13 9,47
Farmers 5,63 17,03 14,84 17,34 14,53 24,69 5,94
Disability pensioners 3,11 16,43 14,33 19,14 11,42 26,25 9,32
Retirees 3,51 14,34 12,19 19,36 15,04 27,85 7,71
Students 13,21 21,11 19,19 16,31 9,23 13,80 7,16
Unemployed 7,23 22,27 18,03 16,99 12,51 17,22 5,74
Other professionally
inactive 8,89 22,75 18,13 20,21 10,28 14,78 4,97

Social Diagnosis 2007 Appendix 2 71
© The Council for Social Monitoring
Table P50.6. I am very energetic
Social-demografic group
certainly
positive positive
somewhat
positive
neither
positive
nor
negative
somewhat
negative negative
certainly
negative
Total 11,01 24,97 26,88 16,69 10,53 7,14 2,78
Gender
Men 12,58 26,62 27,27 16,33 9,23 5,87 2,10
Women 9,71 23,62 26,54 16,97 11,61 8,21 3,34
Age
up to 24 years old 25,62 34,81 24,54 9,87 3,10 1,30 0,76
25-34 years old 15,49 33,91 30,64 12,22 5,19 1,93 0,63
35-44 years old 7,63 25,88 34,62 18,66 8,29 3,97 0,97
45-59 years old 6,48 20,82 29,43 21,17 12,52 7,48 2,11
60-64 years old 3,54 20,91 21,42 22,09 18,55 10,29 3,20
65+ years old 2,66 10,72 14,68 18,34 21,64 21,54 10,42
Place of residence
Cities > 500k 10,55 24,48 28,14 17,95 10,77 6,03 2,08
Towns 200-500k 10,30 24,63 28,25 18,72 9,88 5,98 2,23
Towns 100-200k 12,10 24,10 29,66 18,63 7,71 6,15 1,66
Towns 20-100k 10,11 26,61 27,53 14,65 11,08 6,70 3,33
Towns < 20k 10,62 25,50 27,20 15,89 10,49 7,60 2,70
Rural areas 11,74 24,39 25,02 16,58 10,99 8,13 3,14
Voivodship
Dolnośląskie 12,32 26,15 27,96 16,23 8,82 5,61 2,91
Kujawsko-pomorskie 10,94 29,22 26,09 15,16 9,69 6,56 2,34
Lubelskie 8,72 21,12 25,07 17,57 14,71 9,67 3,13
Lubuskie 13,33 20,87 25,22 16,81 11,59 8,70 3,48
Łódzkie 8,43 23,89 26,23 18,03 12,18 8,55 2,69
Małopolskie 14,59 24,98 24,59 14,01 10,96 7,72 3,15
Mazowieckie 9,90 25,82 28,44 15,80 10,32 6,68 3,04
Opolskie 9,51 23,34 32,28 13,26 11,24 7,49 2,88
Podkarpackie 9,25 24,93 26,12 18,36 11,79 7,46 2,09
Podlaskie 7,65 22,72 27,16 17,78 10,12 10,62 3,95
Pomorskie 9,87 25,67 31,31 16,78 9,17 5,08 2,12
Śląskie 12,91 24,81 26,50 18,27 8,92 6,48 2,12
Świętokrzyskie 8,52 24,06 25,81 16,54 11,28 9,27 4,51
Warmińsko-mazurskie 14,40 25,96 22,72 17,04 10,55 5,68 3,65
Wielkopolskie 9,95 26,85 29,22 16,26 9,50 6,03 2,19
Zachodniopomorskie 13,18 23,02 22,67 18,98 11,78 7,73 2,64
Education
Primary and below 4,79 15,39 17,45 17,90 18,52 17,09 8,86
Vocational 13,60 27,70 26,25 16,69 9,02 5,21 1,54
Secondary 12,18 27,02 29,17 15,83 9,11 5,10 1,60
Tertiary/post-secondary 10,52 26,06 33,05 16,93 7,88 4,44 1,13
Income per capita
First quartile 11,13 27,74 26,30 16,48 9,57 6,48 2,30
Middle 50% 11,23 24,33 25,15 16,79 11,00 8,01 3,50
Fourth quartile 10,01 23,90 28,78 16,80 11,25 6,91 2,37
Social-professional status
Public sector employees 9,74 27,09 34,70 16,69 7,06 3,45 1,26
Private sector employees 13,16 30,88 30,71 15,53 6,90 2,34 0,48
Self-employed 12,00 30,18 32,36 15,82 5,27 3,64 0,73
Farmers 9,38 25,94 31,25 18,44 8,75 5,00 1,25
Disability pensioners 4,20 15,90 18,50 19,00 19,10 16,10 7,20
Retirees 3,54 14,04 18,86 19,06 20,19 16,80 7,51
Students 27,25 32,27 25,70 9,68 3,25 1,18 0,66
Unemployed 10,45 28,24 27,21 18,83 8,73 5,40 1,15
Other professionally
inactive 12,24 24,83 25,75 18,82 9,35 7,04 1,96
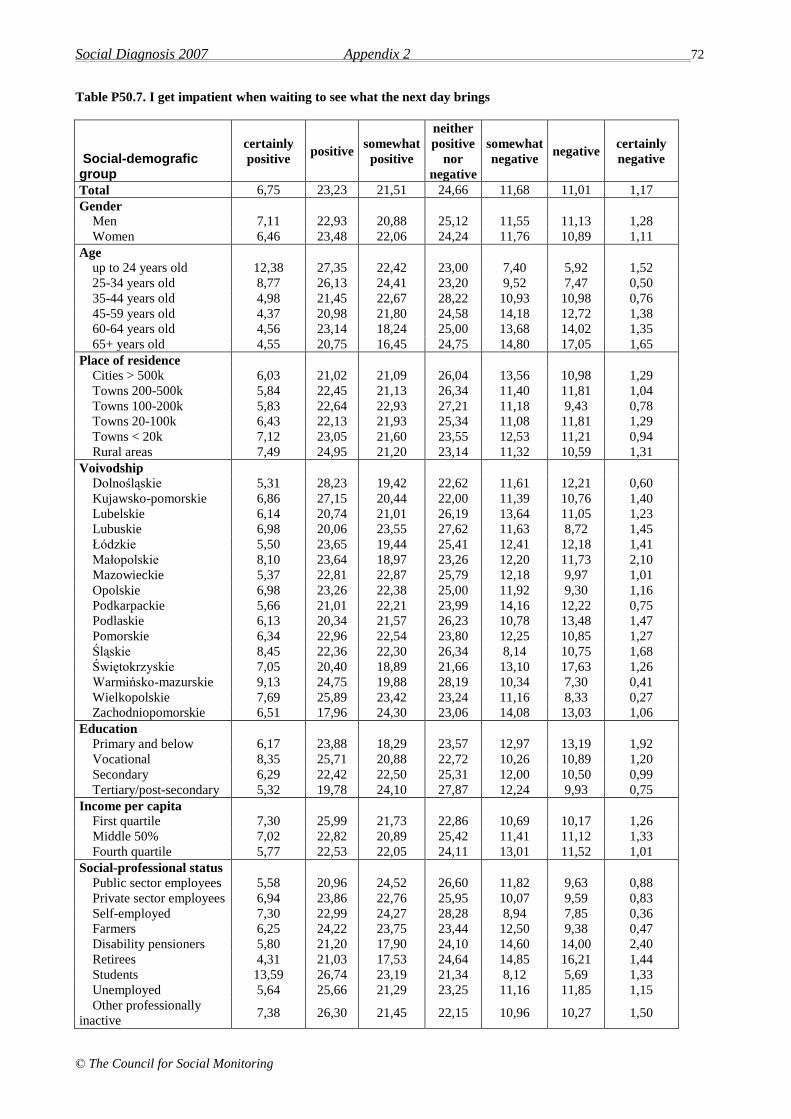
Social Diagnosis 2007 Appendix 2 72
© The Council for Social Monitoring
Table P50.7. I get impatient when waiting to see what the next day brings
Social-demografic group
certainly
positive positive
somewhat
positive
neither
positive
nor
negative
somewhat
negative negative
certainly
negative
Total 6,75 23,23 21,51 24,66 11,68 11,01 1,17
Gender
Men 7,11 22,93 20,88 25,12 11,55 11,13 1,28
Women 6,46 23,48 22,06 24,24 11,76 10,89 1,11
Age
up to 24 years old 12,38 27,35 22,42 23,00 7,40 5,92 1,52
25-34 years old 8,77 26,13 24,41 23,20 9,52 7,47 0,50
35-44 years old 4,98 21,45 22,67 28,22 10,93 10,98 0,76
45-59 years old 4,37 20,98 21,80 24,58 14,18 12,72 1,38
60-64 years old 4,56 23,14 18,24 25,00 13,68 14,02 1,35
65+ years old 4,55 20,75 16,45 24,75 14,80 17,05 1,65
Place of residence
Cities > 500k 6,03 21,02 21,09 26,04 13,56 10,98 1,29
Towns 200-500k 5,84 22,45 21,13 26,34 11,40 11,81 1,04
Towns 100-200k 5,83 22,64 22,93 27,21 11,18 9,43 0,78
Towns 20-100k 6,43 22,13 21,93 25,34 11,08 11,81 1,29
Towns < 20k 7,12 23,05 21,60 23,55 12,53 11,21 0,94
Rural areas 7,49 24,95 21,20 23,14 11,32 10,59 1,31
Voivodship
Dolnośląskie 5,31 28,23 19,42 22,62 11,61 12,21 0,60
Kujawsko-pomorskie 6,86 27,15 20,44 22,00 11,39 10,76 1,40
Lubelskie 6,14 20,74 21,01 26,19 13,64 11,05 1,23
Lubuskie 6,98 20,06 23,55 27,62 11,63 8,72 1,45
Łódzkie 5,50 23,65 19,44 25,41 12,41 12,18 1,41
Małopolskie 8,10 23,64 18,97 23,26 12,20 11,73 2,10
Mazowieckie 5,37 22,81 22,87 25,79 12,18 9,97 1,01
Opolskie 6,98 23,26 22,38 25,00 11,92 9,30 1,16
Podkarpackie 5,66 21,01 22,21 23,99 14,16 12,22 0,75
Podlaskie 6,13 20,34 21,57 26,23 10,78 13,48 1,47
Pomorskie 6,34 22,96 22,54 23,80 12,25 10,85 1,27
Śląskie 8,45 22,36 22,30 26,34 8,14 10,75 1,68
Świętokrzyskie 7,05 20,40 18,89 21,66 13,10 17,63 1,26
Warmińsko-mazurskie 9,13 24,75 19,88 28,19 10,34 7,30 0,41
Wielkopolskie 7,69 25,89 23,42 23,24 11,16 8,33 0,27
Zachodniopomorskie 6,51 17,96 24,30 23,06 14,08 13,03 1,06
Education
Primary and below 6,17 23,88 18,29 23,57 12,97 13,19 1,92
Vocational 8,35 25,71 20,88 22,72 10,26 10,89 1,20
Secondary 6,29 22,42 22,50 25,31 12,00 10,50 0,99
Tertiary/post-secondary 5,32 19,78 24,10 27,87 12,24 9,93 0,75
Income per capita
First quartile 7,30 25,99 21,73 22,86 10,69 10,17 1,26
Middle 50% 7,02 22,82 20,89 25,42 11,41 11,12 1,33
Fourth quartile 5,77 22,53 22,05 24,11 13,01 11,52 1,01
Social-professional status
Public sector employees 5,58 20,96 24,52 26,60 11,82 9,63 0,88
Private sector employees 6,94 23,86 22,76 25,95 10,07 9,59 0,83
Self-employed 7,30 22,99 24,27 28,28 8,94 7,85 0,36
Farmers 6,25 24,22 23,75 23,44 12,50 9,38 0,47
Disability pensioners 5,80 21,20 17,90 24,10 14,60 14,00 2,40
Retirees 4,31 21,03 17,53 24,64 14,85 16,21 1,44
Students 13,59 26,74 23,19 21,34 8,12 5,69 1,33
Unemployed 5,64 25,66 21,29 23,25 11,16 11,85 1,15
Other professionally
inactive 7,38 26,30 21,45 22,15 10,96 10,27 1,50
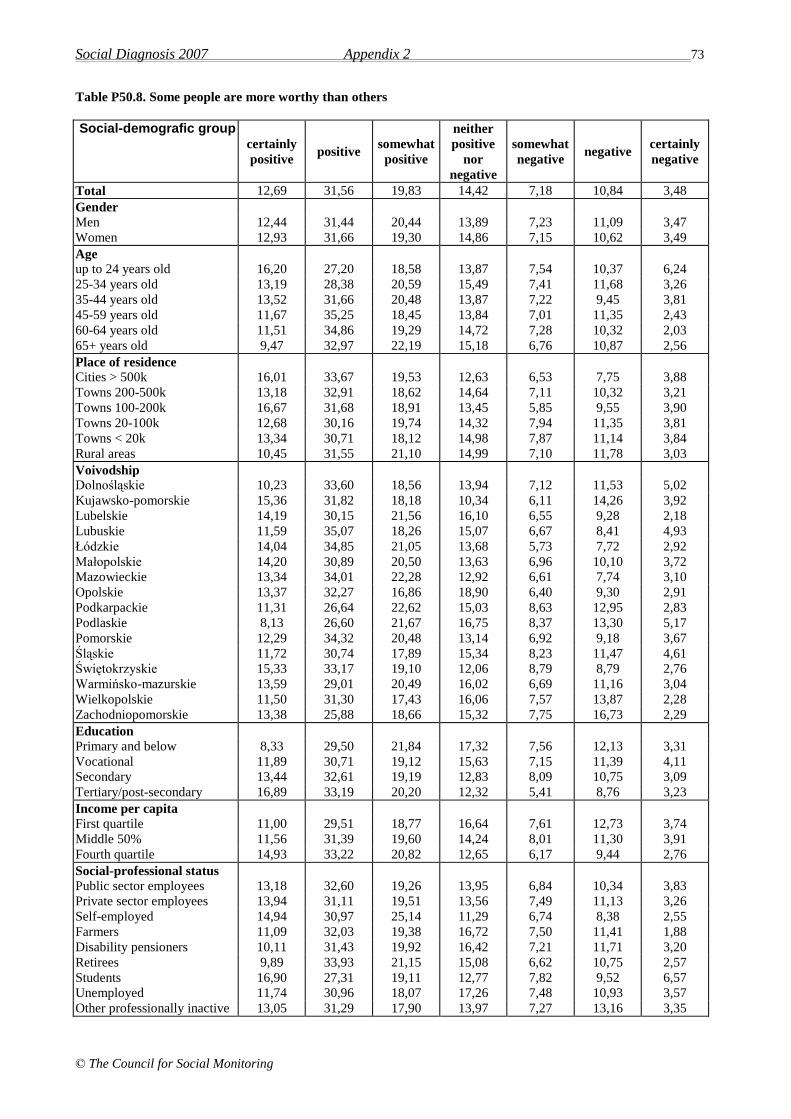
Social Diagnosis 2007 Appendix 2 73
© The Council for Social Monitoring
Table P50.8. Some people are more worthy than others
Social-demografic group certainly
positive positive
somewhat
positive
neither
positive
nor
negative
somewhat
negative negative
certainly
negative
Total 12,69 31,56 19,83 14,42 7,18 10,84 3,48
Gender
Men 12,44 31,44 20,44 13,89 7,23 11,09 3,47
Women 12,93 31,66 19,30 14,86 7,15 10,62 3,49
Age
up to 24 years old 16,20 27,20 18,58 13,87 7,54 10,37 6,24
25-34 years old 13,19 28,38 20,59 15,49 7,41 11,68 3,26
35-44 years old 13,52 31,66 20,48 13,87 7,22 9,45 3,81
45-59 years old 11,67 35,25 18,45 13,84 7,01 11,35 2,43
60-64 years old 11,51 34,86 19,29 14,72 7,28 10,32 2,03
65+ years old 9,47 32,97 22,19 15,18 6,76 10,87 2,56
Place of residence
Cities > 500k 16,01 33,67 19,53 12,63 6,53 7,75 3,88
Towns 200-500k 13,18 32,91 18,62 14,64 7,11 10,32 3,21
Towns 100-200k 16,67 31,68 18,91 13,45 5,85 9,55 3,90
Towns 20-100k 12,68 30,16 19,74 14,32 7,94 11,35 3,81
Towns < 20k 13,34 30,71 18,12 14,98 7,87 11,14 3,84
Rural areas 10,45 31,55 21,10 14,99 7,10 11,78 3,03
Voivodship
Dolnośląskie 10,23 33,60 18,56 13,94 7,12 11,53 5,02
Kujawsko-pomorskie 15,36 31,82 18,18 10,34 6,11 14,26 3,92
Lubelskie 14,19 30,15 21,56 16,10 6,55 9,28 2,18
Lubuskie 11,59 35,07 18,26 15,07 6,67 8,41 4,93
Łódzkie 14,04 34,85 21,05 13,68 5,73 7,72 2,92
Małopolskie 14,20 30,89 20,50 13,63 6,96 10,10 3,72
Mazowieckie 13,34 34,01 22,28 12,92 6,61 7,74 3,10
Opolskie 13,37 32,27 16,86 18,90 6,40 9,30 2,91
Podkarpackie 11,31 26,64 22,62 15,03 8,63 12,95 2,83
Podlaskie 8,13 26,60 21,67 16,75 8,37 13,30 5,17
Pomorskie 12,29 34,32 20,48 13,14 6,92 9,18 3,67
Śląskie 11,72 30,74 17,89 15,34 8,23 11,47 4,61
Świętokrzyskie 15,33 33,17 19,10 12,06 8,79 8,79 2,76
Warmińsko-mazurskie 13,59 29,01 20,49 16,02 6,69 11,16 3,04
Wielkopolskie 11,50 31,30 17,43 16,06 7,57 13,87 2,28
Zachodniopomorskie 13,38 25,88 18,66 15,32 7,75 16,73 2,29
Education
Primary and below 8,33 29,50 21,84 17,32 7,56 12,13 3,31
Vocational 11,89 30,71 19,12 15,63 7,15 11,39 4,11
Secondary 13,44 32,61 19,19 12,83 8,09 10,75 3,09
Tertiary/post-secondary 16,89 33,19 20,20 12,32 5,41 8,76 3,23
Income per capita
First quartile 11,00 29,51 18,77 16,64 7,61 12,73 3,74
Middle 50% 11,56 31,39 19,60 14,24 8,01 11,30 3,91
Fourth quartile 14,93 33,22 20,82 12,65 6,17 9,44 2,76
Social-professional status
Public sector employees 13,18 32,60 19,26 13,95 6,84 10,34 3,83
Private sector employees 13,94 31,11 19,51 13,56 7,49 11,13 3,26
Self-employed 14,94 30,97 25,14 11,29 6,74 8,38 2,55
Farmers 11,09 32,03 19,38 16,72 7,50 11,41 1,88
Disability pensioners 10,11 31,43 19,92 16,42 7,21 11,71 3,20
Retirees 9,89 33,93 21,15 15,08 6,62 10,75 2,57
Students 16,90 27,31 19,11 12,77 7,82 9,52 6,57
Unemployed 11,74 30,96 18,07 17,26 7,48 10,93 3,57
Other professionally inactive 13,05 31,29 17,90 13,97 7,27 13,16 3,35

Social Diagnosis 2007 Appendix 2 74
© The Council for Social Monitoring
Table P50.9. I would like to look good, be attractive
Social-demografic group
certainly
positive positive
somewhat
positive
neither
positive nor
negative
somewhat
negative negative
certainly
negative
Total 23,63 38,90 22,20 10,72 1,78 2,30 0,47
Gender
Men 18,02 36,89 25,32 14,24 2,05 2,82 0,67
Women 28,31 40,55 19,60 7,79 1,57 1,87 0,31
Age
up to 24 years old 42,72 36,53 13,90 4,98 0,45 0,94 0,49
25-34 years old 32,31 42,37 18,15 5,20 0,92 0,75 0,29
35-44 years old 23,83 41,89 23,83 7,86 1,22 0,96 0,41
45-59 years old 16,83 42,48 25,51 11,23 1,47 2,02 0,47
60-64 years old 10,79 39,46 30,35 14,00 2,53 2,70 0,17
65+ years old 7,22 28,12 26,62 24,71 5,21 7,37 0,75
Place of residence
Cities > 500k 25,13 39,41 22,47 10,27 0,72 1,51 0,50
Towns 200-500k 23,80 39,97 22,83 9,09 1,11 2,98 0,21
Towns 100-200k 23,01 40,68 22,91 9,61 1,65 1,55 0,58
Towns 20-100k 22,98 40,26 21,45 10,67 1,80 2,29 0,56
Towns < 20k 23,95 38,53 22,12 10,50 2,33 2,20 0,38
Rural areas 23,52 37,36 22,16 11,71 2,17 2,56 0,52
Voivodship
Dolnośląskie 20,82 43,24 22,12 9,91 1,10 2,30 0,50
Kujawsko-pomorskie 20,59 38,22 24,02 11,54 2,03 3,28 0,31
Lubelskie 21,96 34,92 24,15 12,69 2,32 3,00 0,95
Lubuskie 22,09 40,12 25,58 8,43 1,74 1,74 0,29
Łódzkie 22,95 39,93 23,89 10,54 1,41 1,17 0,12
Małopolskie 27,43 34,48 22,29 10,76 2,48 2,19 0,38
Mazowieckie 26,89 40,37 19,32 9,24 1,79 2,09 0,30
Opolskie 19,77 42,73 25,87 7,85 1,45 2,03 0,29
Podkarpackie 19,37 38,15 24,29 12,52 2,24 2,98 0,45
Podlaskie 22,41 37,93 21,67 11,82 2,22 3,20 0,74
Pomorskie 24,44 41,81 20,34 10,17 1,13 1,69 0,42
Śląskie 24,75 36,26 22,70 10,88 1,74 2,86 0,81
Świętokrzyskie 22,25 36,75 23,50 11,25 2,25 3,50 0,50
Warmińsko-mazurskie 26,72 36,23 21,26 11,94 2,23 1,21 0,40
Wielkopolskie 21,39 42,78 20,84 11,88 1,10 1,37 0,64
Zachodniopomorskie 26,19 38,14 20,74 10,02 2,11 2,81 0,00
Education
Primary and below 13,09 32,04 24,08 19,97 4,16 6,08 0,58
Vocational 24,02 38,95 21,93 11,25 1,49 1,84 0,52
Secondary 26,38 41,65 21,18 7,71 1,32 1,40 0,36
Tertiary/post-secondary 28,32 40,68 22,58 6,03 0,84 1,09 0,46
Income per capita
First quartile 24,34 39,48 20,74 10,20 2,30 2,43 0,52
Middle 50% 23,22 38,50 21,91 11,69 1,86 2,25 0,57
Fourth quartile 23,25 38,78 24,07 9,58 1,52 2,45 0,34
Social-professional status
Public sector employees 25,70 41,12 24,82 6,23 0,71 1,04 0,38
Private sector employees 27,28 42,08 20,51 7,90 1,10 0,86 0,27
Self-employed 24,77 41,35 23,13 7,83 1,09 1,82 0,00
Farmers 20,47 41,41 24,53 9,53 2,03 1,09 0,94
Disability pensioners 15,70 36,80 24,80 15,10 2,70 4,60 0,30
Retirees 8,57 33,64 26,71 20,64 4,13 5,65 0,66
Students 43,80 35,97 13,66 5,02 0,07 0,96 0,52
Unemployed 26,44 41,15 19,20 9,31 1,95 1,38 0,57
Other professionally inactive 28,32 40,35 20,12 7,98 1,04 1,62 0,58

Social Diagnosis 2007 Appendix 2 75
© The Council for Social Monitoring
Table P50.10. In an ideal world all nations would be equal
Social-demografic group certainly
positive positive
somewhat
positive
neither
positive
nor
negative
somewhat
negative negative
certainly
negative
Total 24,81 40,14 18,46 9,64 3,02 3,00 0,94
Gender
Men 23,60 38,60 19,38 10,41 3,12 3,55 1,35
Women 25,80 41,42 17,73 8,99 2,92 2,55 0,60
Age
up to 24 years old 32,78 35,16 15,00 10,28 2,96 2,83 0,99
25-34 years old 28,73 38,90 17,42 8,84 2,68 2,72 0,71
35-44 years old 23,78 41,67 18,45 9,10 3,00 3,05 0,97
45-59 years old 22,19 43,14 18,26 9,20 3,08 2,99 1,14
60-64 years old 18,78 41,62 23,01 8,12 3,21 4,06 1,18
65+ years old 18,58 40,06 22,48 11,64 3,30 3,25 0,70
Place of residence
Cities > 500k 28,83 38,25 17,18 9,35 2,23 3,02 1,15
Towns 200-500k 27,68 38,53 16,34 9,39 4,45 2,92 0,70
Towns 100-200k 25,39 38,33 15,86 10,99 2,92 5,06 1,46
Towns 20-100k 24,19 40,39 19,05 9,35 2,93 3,01 1,08
Towns < 20k 26,87 37,51 19,07 9,19 3,15 2,77 1,45
Rural areas 22,19 42,38 19,57 9,80 2,84 2,64 0,58
Voivodship
Dolnośląskie 24,45 42,99 18,94 9,12 1,70 2,40 0,40
Kujawsko-pomorskie 24,92 39,81 20,06 7,84 3,45 3,29 0,63
Lubelskie 22,92 40,79 19,51 8,32 3,27 3,96 1,23
Lubuskie 24,78 41,69 16,62 9,91 2,04 2,92 2,04
Łódzkie 24,91 43,39 16,26 9,94 2,22 1,99 1,29
Małopolskie 24,95 40,92 20,27 8,51 1,91 2,96 0,48
Mazowieckie 26,89 40,99 17,73 8,21 2,68 2,20 1,31
Opolskie 23,92 40,06 17,29 11,24 4,32 2,59 0,58
Podkarpackie 23,25 40,98 20,42 8,20 3,13 3,13 0,89
Podlaskie 27,23 40,35 18,32 10,64 1,73 1,24 0,50
Pomorskie 23,45 38,28 17,23 13,14 3,53 3,39 0,99
Śląskie 24,41 35,87 19,74 11,27 3,11 4,17 1,43
Świętokrzyskie 21,75 36,50 20,75 10,25 7,50 2,50 0,75
Warmińsko-mazurskie 24,75 35,50 22,52 12,58 1,22 3,04 0,41
Wielkopolskie 25,02 43,29 14,06 9,50 3,65 3,93 0,55
Zachodniopomorskie 26,54 38,84 17,40 8,26 5,62 2,46 0,88
Education
Primary and below 20,02 39,77 21,89 11,97 2,82 2,77 0,76
Vocational 24,67 40,95 18,67 9,53 2,54 2,69 0,95
Secondary 24,71 40,54 17,86 8,83 3,70 3,45 0,91
Tertiary/post-secondary 29,64 38,45 15,93 9,01 2,85 2,98 1,13
Income per capita
First quartile 24,30 41,52 18,48 9,20 3,04 2,56 0,91
Middle 50% 24,55 39,97 19,07 9,77 2,86 2,83 0,96
Fourth quartile 25,78 40,56 17,20 8,95 3,07 3,63 0,82
Social-professional status
Public sector employees 27,38 38,17 18,07 8,49 3,50 3,12 1,26
Private sector employees 26,36 40,48 16,98 9,45 2,58 3,09 1,07
Self-employed 24,64 39,67 16,67 10,69 3,99 3,80 0,54
Farmers 19,91 49,77 17,26 8,71 2,02 2,02 0,31
Disability pensioners 20,30 39,60 21,20 11,00 4,00 3,00 0,90
Retirees 18,86 41,56 21,97 10,65 2,92 3,38 0,66
Students 33,60 33,75 15,25 9,99 2,89 3,18 1,33
Unemployed 25,66 40,05 17,61 9,21 3,57 2,88 1,04
Other professionally inactive 26,13 42,66 18,84 8,09 2,20 1,39 0,69
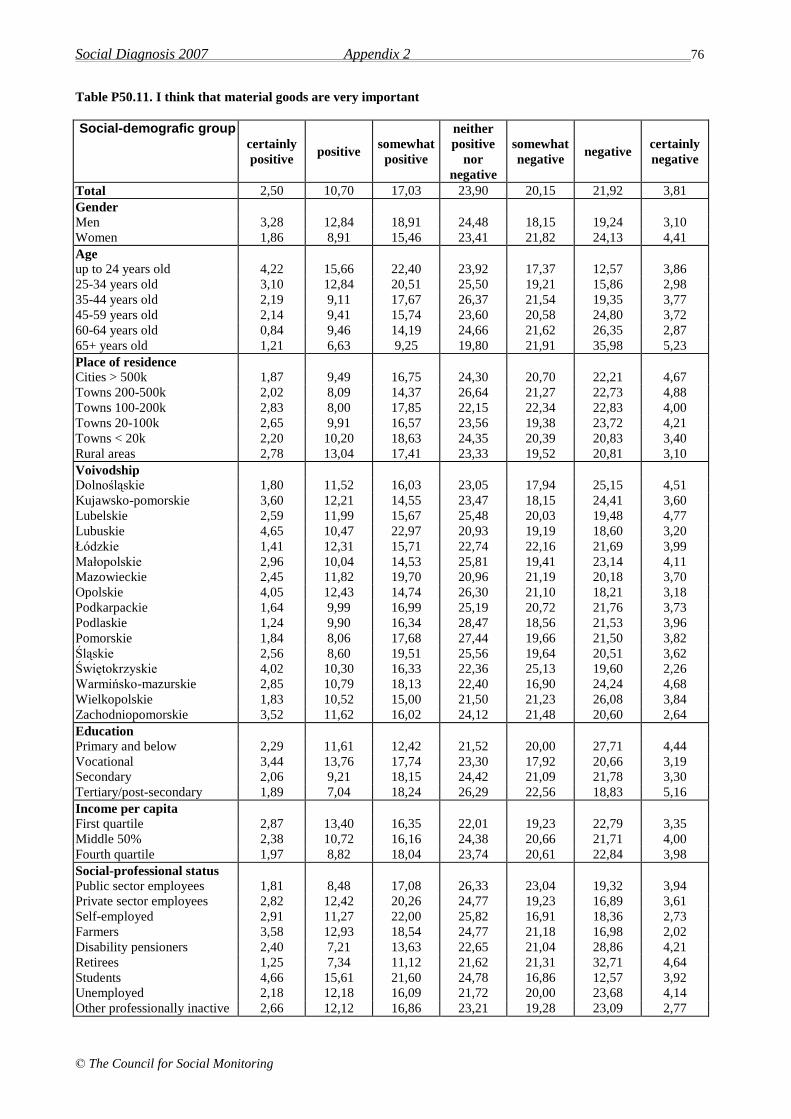
Social Diagnosis 2007 Appendix 2 76
© The Council for Social Monitoring
Table P50.11. I think that material goods are very important
Social-demografic group certainly
positive positive
somewhat
positive
neither
positive
nor
negative
somewhat
negative negative
certainly
negative
Total 2,50 10,70 17,03 23,90 20,15 21,92 3,81
Gender
Men 3,28 12,84 18,91 24,48 18,15 19,24 3,10
Women 1,86 8,91 15,46 23,41 21,82 24,13 4,41
Age
up to 24 years old 4,22 15,66 22,40 23,92 17,37 12,57 3,86
25-34 years old 3,10 12,84 20,51 25,50 19,21 15,86 2,98
35-44 years old 2,19 9,11 17,67 26,37 21,54 19,35 3,77
45-59 years old 2,14 9,41 15,74 23,60 20,58 24,80 3,72
60-64 years old 0,84 9,46 14,19 24,66 21,62 26,35 2,87
65+ years old 1,21 6,63 9,25 19,80 21,91 35,98 5,23
Place of residence
Cities > 500k 1,87 9,49 16,75 24,30 20,70 22,21 4,67
Towns 200-500k 2,02 8,09 14,37 26,64 21,27 22,73 4,88
Towns 100-200k 2,83 8,00 17,85 22,15 22,34 22,83 4,00
Towns 20-100k 2,65 9,91 16,57 23,56 19,38 23,72 4,21
Towns < 20k 2,20 10,20 18,63 24,35 20,39 20,83 3,40
Rural areas 2,78 13,04 17,41 23,33 19,52 20,81 3,10
Voivodship
Dolnośląskie 1,80 11,52 16,03 23,05 17,94 25,15 4,51
Kujawsko-pomorskie 3,60 12,21 14,55 23,47 18,15 24,41 3,60
Lubelskie 2,59 11,99 15,67 25,48 20,03 19,48 4,77
Lubuskie 4,65 10,47 22,97 20,93 19,19 18,60 3,20
Łódzkie 1,41 12,31 15,71 22,74 22,16 21,69 3,99
Małopolskie 2,96 10,04 14,53 25,81 19,41 23,14 4,11
Mazowieckie 2,45 11,82 19,70 20,96 21,19 20,18 3,70
Opolskie 4,05 12,43 14,74 26,30 21,10 18,21 3,18
Podkarpackie 1,64 9,99 16,99 25,19 20,72 21,76 3,73
Podlaskie 1,24 9,90 16,34 28,47 18,56 21,53 3,96
Pomorskie 1,84 8,06 17,68 27,44 19,66 21,50 3,82
Śląskie 2,56 8,60 19,51 25,56 19,64 20,51 3,62
Świętokrzyskie 4,02 10,30 16,33 22,36 25,13 19,60 2,26
Warmińsko-mazurskie 2,85 10,79 18,13 22,40 16,90 24,24 4,68
Wielkopolskie 1,83 10,52 15,00 21,50 21,23 26,08 3,84
Zachodniopomorskie 3,52 11,62 16,02 24,12 21,48 20,60 2,64
Education
Primary and below 2,29 11,61 12,42 21,52 20,00 27,71 4,44
Vocational 3,44 13,76 17,74 23,30 17,92 20,66 3,19
Secondary 2,06 9,21 18,15 24,42 21,09 21,78 3,30
Tertiary/post-secondary 1,89 7,04 18,24 26,29 22,56 18,83 5,16
Income per capita
First quartile 2,87 13,40 16,35 22,01 19,23 22,79 3,35
Middle 50% 2,38 10,72 16,16 24,38 20,66 21,71 4,00
Fourth quartile 1,97 8,82 18,04 23,74 20,61 22,84 3,98
Social-professional status
Public sector employees 1,81 8,48 17,08 26,33 23,04 19,32 3,94
Private sector employees 2,82 12,42 20,26 24,77 19,23 16,89 3,61
Self-employed 2,91 11,27 22,00 25,82 16,91 18,36 2,73
Farmers 3,58 12,93 18,54 24,77 21,18 16,98 2,02
Disability pensioners 2,40 7,21 13,63 22,65 21,04 28,86 4,21
Retirees 1,25 7,34 11,12 21,62 21,31 32,71 4,64
Students 4,66 15,61 21,60 24,78 16,86 12,57 3,92
Unemployed 2,18 12,18 16,09 21,72 20,00 23,68 4,14
Other professionally inactive 2,66 12,12 16,86 23,21 19,28 23,09 2,77

Social Diagnosis 2007 Appendix 2 77
© The Council for Social Monitoring
Table P50.12. I would like to make more friends
Social-demografic group certainly
positive positive
somewhat
positive
neither
positive
nor
negative
somewhat
negative negative
certainly
negative
Total 11,66 36,97 23,48 16,62 5,19 5,55 0,53
Gender
Men 11,08 36,80 24,08 16,88 5,31 5,29 0,56
Women 12,14 37,09 22,99 16,41 5,11 5,73 0,52
Age
up to 24 years old 23,96 42,08 20,23 9,11 2,02 2,24 0,36
25-34 years old 14,51 40,17 24,65 13,50 3,73 3,23 0,21
35-44 years old 10,59 36,90 26,11 16,54 5,39 3,92 0,56
45-59 years old 7,33 36,08 24,49 19,39 6,04 6,04 0,62
60-64 years old 4,90 35,98 25,17 19,76 6,93 6,76 0,51
65+ years old 4,97 29,28 20,94 23,25 8,34 12,36 0,85
Place of residence
Cities > 500k 12,45 37,12 25,54 16,33 4,60 3,81 0,14
Towns 200-500k 11,49 34,68 25,56 16,99 4,94 5,50 0,84
Towns 100-200k 11,43 33,59 24,02 17,09 6,45 6,45 0,98
Towns 20-100k 11,32 37,29 23,08 17,78 4,86 5,14 0,52
Towns < 20k 12,69 38,51 22,93 15,08 4,46 5,97 0,38
Rural areas 11,37 37,63 22,54 16,43 5,60 5,92 0,52
Voivodship
Dolnośląskie 9,51 42,04 20,02 16,22 5,91 5,81 0,50
Kujawsko-pomorskie 10,31 33,13 22,81 17,66 5,94 9,53 0,63
Lubelskie 11,22 36,39 24,90 16,01 4,79 6,43 0,27
Lubuskie 10,43 33,33 25,80 18,55 6,38 5,22 0,29
Łódzkie 9,73 42,67 23,09 15,36 5,16 3,63 0,35
Małopolskie 15,42 40,71 21,93 14,08 3,45 4,41 0,00
Mazowieckie 11,63 38,96 24,64 15,16 4,83 4,30 0,48
Opolskie 9,88 35,47 27,62 18,31 3,78 4,36 0,58
Podkarpackie 11,77 40,54 23,70 12,97 5,37 5,07 0,60
Podlaskie 9,36 32,76 24,38 21,18 6,40 5,42 0,49
Pomorskie 11,16 32,77 25,56 20,48 3,81 5,79 0,42
Śląskie 12,91 30,44 23,08 18,78 6,18 7,42 1,19
Świętokrzyskie 14,18 38,31 24,38 14,93 5,22 2,74 0,25
Warmińsko-mazurskie 13,82 35,16 21,34 19,72 4,47 4,67 0,81
Wielkopolskie 11,15 40,59 24,31 13,44 5,03 5,12 0,37
Zachodniopomorskie 11,23 31,05 21,75 20,53 6,84 7,72 0,88
Education
Primary and below 7,43 30,80 20,86 22,38 7,70 9,76 1,07
Vocational 13,81 37,82 22,44 15,78 4,89 4,79 0,47
Secondary 11,12 38,80 24,43 15,24 4,55 5,31 0,56
Tertiary/post-secondary 12,92 38,21 26,09 14,97 4,45 3,27 0,08
Income per capita
First quartile 11,68 40,76 22,40 14,54 4,64 5,21 0,78
Middle 50% 11,29 36,21 23,13 18,05 5,29 5,60 0,43
Fourth quartile 11,08 36,80 24,73 15,71 5,33 5,84 0,51
Social-professional status
Public sector employees 11,39 36,42 26,94 15,99 5,26 3,45 0,55
Private sector employees 12,83 40,03 24,28 14,58 4,09 3,78 0,41
Self-employed 11,27 36,73 23,82 20,00 3,45 4,55 0,18
Farmers 9,81 40,81 25,08 14,64 5,45 3,89 0,31
Disability pensioners 7,71 33,33 24,92 19,02 6,91 7,21 0,90
Retirees 5,39 31,73 21,31 22,33 7,88 10,85 0,51
Students 26,13 39,93 20,81 8,41 2,07 2,44 0,22
Unemployed 11,15 40,11 21,61 16,21 4,83 5,17 0,92
Other professionally inactive 10,66 37,08 23,06 17,84 5,10 5,33 0,93

Social Diagnosis 2007 Appendix 2 78
© The Council for Social Monitoring
Table P50.13. Some groups of people do not deserve respect
Social-demografic group certainly
positive positive
somewhat
positive
neither
positive
nor
negative
somewhat
negative negative
certainly
negative
Total 11,35 27,30 16,40 17,53 9,95 12,70 4,75
Gender
Men 12,14 28,63 17,36 16,62 9,33 11,54 4,38
Women 10,70 26,20 15,62 18,29 10,46 13,67 5,06
Age
up to 24 years old 13,11 23,97 15,84 19,66 9,47 11,71 6,24
25-34 years old 11,45 23,82 16,02 18,66 10,44 14,26 5,37
35-44 years old 10,48 27,26 16,63 18,06 10,48 12,41 4,68
45-59 years old 10,61 28,58 16,41 15,77 10,40 13,69 4,54
60-64 years old 14,02 30,91 15,54 14,36 10,47 11,82 2,87
65+ years old 10,57 32,06 17,54 17,28 8,37 10,82 3,36
Place of residence
Cities > 500k 12,15 24,01 15,46 19,27 10,28 13,44 5,39
Towns 200-500k 12,69 25,66 14,57 17,36 11,65 12,48 5,58
Towns 100-200k 12,07 26,78 14,90 16,65 8,76 14,61 6,23
Towns 20-100k 10,91 27,93 16,37 18,22 9,71 12,48 4,37
Towns < 20k 9,63 26,87 18,06 18,31 10,07 11,20 5,85
Rural areas 11,36 28,74 17,02 16,65 9,66 12,78 3,79
Voivodship
Dolnośląskie 10,64 30,32 15,76 16,16 8,94 13,45 4,72
Kujawsko-pomorskie 13,81 28,73 14,13 14,91 9,58 13,81 5,02
Lubelskie 10,64 28,65 16,92 17,87 10,78 11,87 3,27
Lubuskie 9,91 25,07 20,41 14,58 9,04 13,99 7,00
Łódzkie 9,25 31,62 15,46 16,51 11,24 11,36 4,57
Małopolskie 13,09 28,08 17,67 15,19 8,02 13,94 4,01
Mazowieckie 12,92 26,74 17,87 15,60 10,72 10,30 5,84
Opolskie 12,46 25,51 15,07 21,16 11,01 9,28 5,51
Podkarpackie 9,40 27,76 17,01 18,81 11,64 12,24 3,13
Podlaskie 5,68 23,95 15,56 22,96 13,58 11,60 6,67
Pomorskie 11,03 24,33 15,42 21,07 8,49 13,86 5,80
Śląskie 11,58 23,47 15,01 20,42 9,15 15,01 5,35
Świętokrzyskie 16,54 27,57 18,30 16,29 10,28 8,52 2,51
Warmińsko-mazurskie 15,21 30,83 15,82 15,01 6,69 12,78 3,65
Wielkopolskie 9,13 28,04 16,44 18,08 10,96 13,24 4,11
Zachodniopomorskie 9,67 26,54 16,70 17,57 10,54 14,59 4,39
Education
Primary and below 10,51 30,93 17,21 16,72 9,88 11,18 3,58
Vocational 11,51 28,41 16,77 17,29 9,10 11,84 5,08
Secondary 11,24 27,18 15,89 18,05 9,85 13,30 4,49
Tertiary/post-secondary 11,95 22,22 15,89 17,95 11,57 14,68 5,74
Income per capita
First quartile 10,47 28,19 16,81 17,55 9,51 12,81 4,65
Middle 50% 10,85 28,12 15,64 17,92 10,60 12,28 4,58
Fourth quartile 12,07 25,71 17,06 17,31 9,28 13,48 5,10
Social-professional status
Public sector employees 10,42 23,90 16,61 17,49 11,40 15,35 4,82
Private sector employees 11,61 26,97 16,35 17,59 9,21 12,95 5,32
Self-employed 12,18 24,36 16,00 17,45 12,00 13,45 4,55
Farmers 11,37 30,06 16,82 14,95 11,84 11,68 3,27
Disability pensioners 11,19 27,67 17,08 16,58 11,69 12,19 3,60
Retirees 10,72 31,54 16,76 16,92 8,69 11,73 3,63
Students 13,52 23,49 15,29 19,20 10,27 11,82 6,43
Unemployed 11,15 30,00 16,67 15,86 8,85 11,38 6,09
Other professionally inactive 10,87 25,66 15,84 21,50 8,90 12,72 4,51
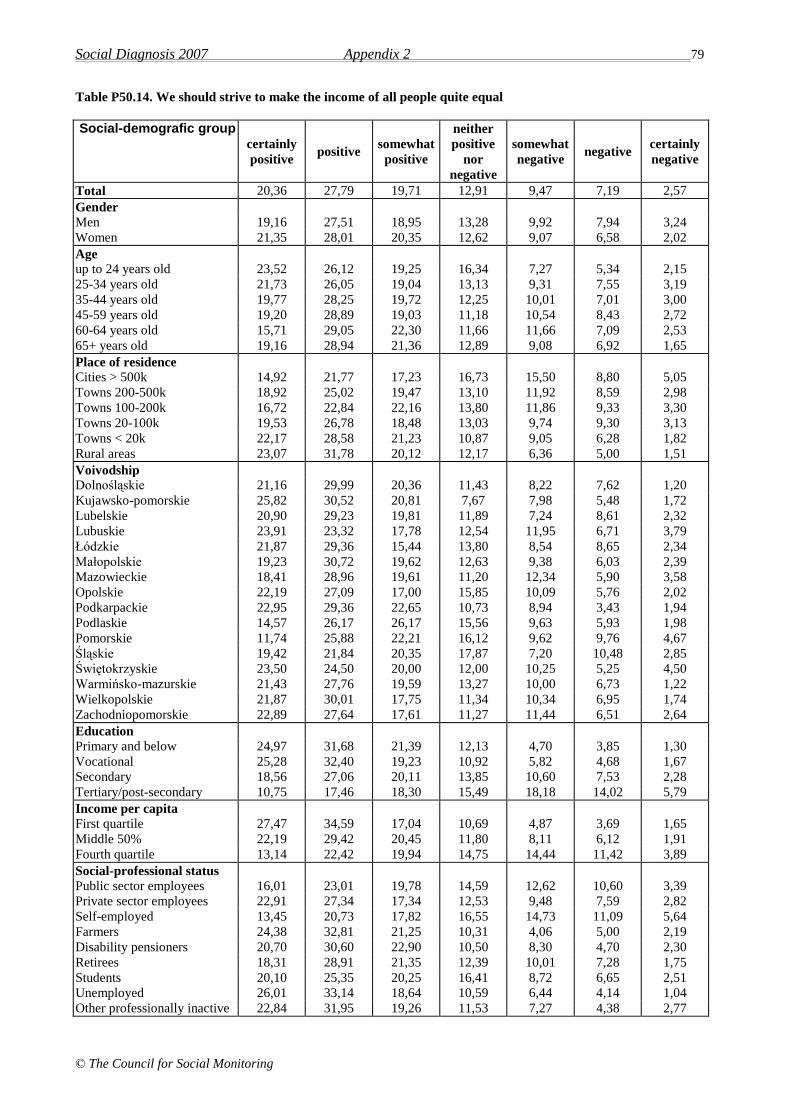
Social Diagnosis 2007 Appendix 2 79
© The Council for Social Monitoring
Table P50.14. We should strive to make the income of all people quite equal
Social-demografic group certainly
positive positive
somewhat
positive
neither
positive
nor
negative
somewhat
negative negative
certainly
negative
Total 20,36 27,79 19,71 12,91 9,47 7,19 2,57
Gender
Men 19,16 27,51 18,95 13,28 9,92 7,94 3,24
Women 21,35 28,01 20,35 12,62 9,07 6,58 2,02
Age
up to 24 years old 23,52 26,12 19,25 16,34 7,27 5,34 2,15
25-34 years old 21,73 26,05 19,04 13,13 9,31 7,55 3,19
35-44 years old 19,77 28,25 19,72 12,25 10,01 7,01 3,00
45-59 years old 19,20 28,89 19,03 11,18 10,54 8,43 2,72
60-64 years old 15,71 29,05 22,30 11,66 11,66 7,09 2,53
65+ years old 19,16 28,94 21,36 12,89 9,08 6,92 1,65
Place of residence
Cities > 500k 14,92 21,77 17,23 16,73 15,50 8,80 5,05
Towns 200-500k 18,92 25,02 19,47 13,10 11,92 8,59 2,98
Towns 100-200k 16,72 22,84 22,16 13,80 11,86 9,33 3,30
Towns 20-100k 19,53 26,78 18,48 13,03 9,74 9,30 3,13
Towns < 20k 22,17 28,58 21,23 10,87 9,05 6,28 1,82
Rural areas 23,07 31,78 20,12 12,17 6,36 5,00 1,51
Voivodship
Dolnośląskie 21,16 29,99 20,36 11,43 8,22 7,62 1,20
Kujawsko-pomorskie 25,82 30,52 20,81 7,67 7,98 5,48 1,72
Lubelskie 20,90 29,23 19,81 11,89 7,24 8,61 2,32
Lubuskie 23,91 23,32 17,78 12,54 11,95 6,71 3,79
Łódzkie 21,87 29,36 15,44 13,80 8,54 8,65 2,34
Małopolskie 19,23 30,72 19,62 12,63 9,38 6,03 2,39
Mazowieckie 18,41 28,96 19,61 11,20 12,34 5,90 3,58
Opolskie 22,19 27,09 17,00 15,85 10,09 5,76 2,02
Podkarpackie 22,95 29,36 22,65 10,73 8,94 3,43 1,94
Podlaskie 14,57 26,17 26,17 15,56 9,63 5,93 1,98
Pomorskie 11,74 25,88 22,21 16,12 9,62 9,76 4,67
Śląskie 19,42 21,84 20,35 17,87 7,20 10,48 2,85
Świętokrzyskie 23,50 24,50 20,00 12,00 10,25 5,25 4,50
Warmińsko-mazurskie 21,43 27,76 19,59 13,27 10,00 6,73 1,22
Wielkopolskie 21,87 30,01 17,75 11,34 10,34 6,95 1,74
Zachodniopomorskie 22,89 27,64 17,61 11,27 11,44 6,51 2,64
Education
Primary and below 24,97 31,68 21,39 12,13 4,70 3,85 1,30
Vocational 25,28 32,40 19,23 10,92 5,82 4,68 1,67
Secondary 18,56 27,06 20,11 13,85 10,60 7,53 2,28
Tertiary/post-secondary 10,75 17,46 18,30 15,49 18,18 14,02 5,79
Income per capita
First quartile 27,47 34,59 17,04 10,69 4,87 3,69 1,65
Middle 50% 22,19 29,42 20,45 11,80 8,11 6,12 1,91
Fourth quartile 13,14 22,42 19,94 14,75 14,44 11,42 3,89
Social-professional status
Public sector employees 16,01 23,01 19,78 14,59 12,62 10,60 3,39
Private sector employees 22,91 27,34 17,34 12,53 9,48 7,59 2,82
Self-employed 13,45 20,73 17,82 16,55 14,73 11,09 5,64
Farmers 24,38 32,81 21,25 10,31 4,06 5,00 2,19
Disability pensioners 20,70 30,60 22,90 10,50 8,30 4,70 2,30
Retirees 18,31 28,91 21,35 12,39 10,01 7,28 1,75
Students 20,10 25,35 20,25 16,41 8,72 6,65 2,51
Unemployed 26,01 33,14 18,64 10,59 6,44 4,14 1,04
Other professionally inactive 22,84 31,95 19,26 11,53 7,27 4,38 2,77

Social Diagnosis 2007 Appendix 2 80
© The Council for Social Monitoring
Table P51. In your opinion, were the reforms conducted in Poland after year 1989 successful in general or rather
unsuccessful?
Social-demografic group
successful not
successful
it is
difficult to
say
Total 10,27 39,42 50,31
Gender
Men 12,10 41,01 46,88
Women 8,75 38,12 53,13
Age
up to 24 years old 7,81 16,52 75,67
25-34 years old 12,01 27,08 60,90
35-44 years old 11,49 43,47 45,04
45-59 years old 10,81 51,62 37,58
60-64 years old 8,39 52,85 38,76
65+ years old 9,46 50,69 39,85
Place of residence
Cities > 500k 16,80 41,13 42,07
Towns 200-500k 10,78 39,97 49,24
Towns 100-200k 12,60 38,37 49,03
Towns 20-100k 10,73 40,46 48,80
Towns < 20k 9,43 39,48 51,09
Rural areas 7,67 38,43 53,90
Voivodship
Dolnośląskie 12,01 41,64 46,35
Kujawsko-pomorskie 9,32 44,25 46,43
Lubelskie 8,11 42,97 48,92
Lubuskie 10,79 39,94 49,27
Łódzkie 8,51 40,79 50,70
Małopolskie 12,13 35,15 52,72
Mazowieckie 11,07 38,05 50,89
Opolskie 6,86 36,00 57,14
Podkarpackie 8,79 36,21 54,99
Podlaskie 10,76 40,83 48,41
Pomorskie 11,97 38,17 49,86
Śląskie 12,11 39,12 48,76
Świętokrzyskie 5,46 43,67 50,87
Warmińsko-mazurskie 8,67 42,14 49,19
Wielkopolskie 10,78 38,08 51,14
Zachodniopomorskie 7,71 39,40 52,89
Education
Primary and below 6,21 45,45 48,34
Vocational 6,44 39,45 54,10
Secondary 9,59 39,61 50,80
Tertiary/post-secondary 21,71 33,45 44,84
Income per capita
First quartile 5,45 37,92 56,64
Middle 50% 8,35 40,93 50,72
Fourth quartile 16,23 39,59 44,18
Social-professional status
Public sector employees 14,45 40,19 45,37
Private sector employees 10,11 37,23 52,66
Self-employed 19,93 35,87 44,20
Farmers 8,88 44,39 46,73
Disability pensioners 6,66 47,81 45,53
Retirees 9,67 51,35 38,98
Students 9,33 15,03 75,65
Unemployed 5,69 42,48 51,82
Other professionally inactive 9,09 33,26 57,65
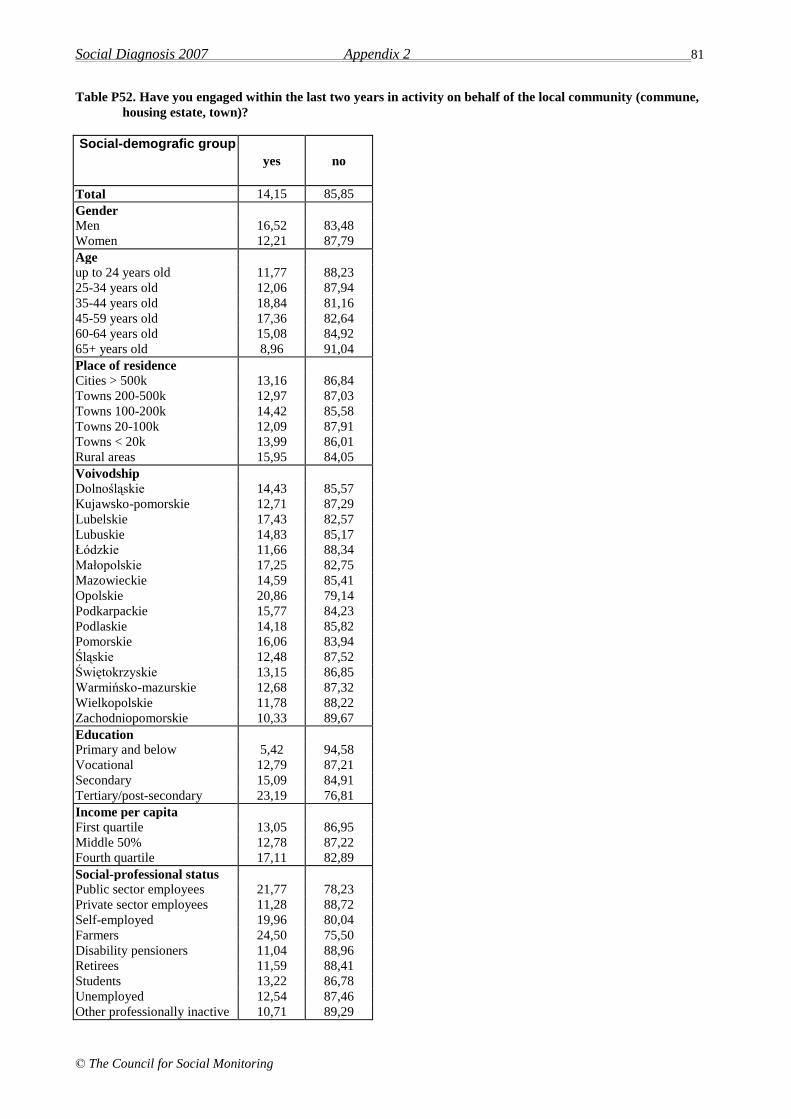
Social Diagnosis 2007 Appendix 2 81
© The Council for Social Monitoring
Table P52. Have you engaged within the last two years in activity on behalf of the local community (commune,
housing estate, town)?
Social-demografic group
yes no
Total 14,15 85,85
Gender
Men 16,52 83,48
Women 12,21 87,79
Age
up to 24 years old 11,77 88,23
25-34 years old 12,06 87,94
35-44 years old 18,84 81,16
45-59 years old 17,36 82,64
60-64 years old 15,08 84,92
65+ years old 8,96 91,04
Place of residence
Cities > 500k 13,16 86,84
Towns 200-500k 12,97 87,03
Towns 100-200k 14,42 85,58
Towns 20-100k 12,09 87,91
Towns < 20k 13,99 86,01
Rural areas 15,95 84,05
Voivodship
Dolnośląskie 14,43 85,57
Kujawsko-pomorskie 12,71 87,29
Lubelskie 17,43 82,57
Lubuskie 14,83 85,17
Łódzkie 11,66 88,34
Małopolskie 17,25 82,75
Mazowieckie 14,59 85,41
Opolskie 20,86 79,14
Podkarpackie 15,77 84,23
Podlaskie 14,18 85,82
Pomorskie 16,06 83,94
Śląskie 12,48 87,52
Świętokrzyskie 13,15 86,85
Warmińsko-mazurskie 12,68 87,32
Wielkopolskie 11,78 88,22
Zachodniopomorskie 10,33 89,67
Education
Primary and below 5,42 94,58
Vocational 12,79 87,21
Secondary 15,09 84,91
Tertiary/post-secondary 23,19 76,81
Income per capita
First quartile 13,05 86,95
Middle 50% 12,78 87,22
Fourth quartile 17,11 82,89
Social-professional status
Public sector employees 21,77 78,23
Private sector employees 11,28 88,72
Self-employed 19,96 80,04
Farmers 24,50 75,50
Disability pensioners 11,04 88,96
Retirees 11,59 88,41
Students 13,22 86,78
Unemployed 12,54 87,46
Other professionally inactive 10,71 89,29

Social Diagnosis 2007 Appendix 2 82
© The Council for Social Monitoring
Table 53.1. Frequency of psychosomatic symptoms within the last month – strong headaches
Social-demografic group I did not suffer I suffered less than
15 days
I suffered at least
for half do the
month
Total 55,49 37,39 7,12
Gender
Men 65,46 29,87 4,68
Women 47,20 43,65 9,15
Age
up to 24 years old 65,10 30,38 4,53
25-34 years old 56,96 37,35 5,69
35-44 years old 53,58 40,32 6,10
45-59 years old 53,28 39,13 7,59
60-64 years old 53,28 38,82 7,90
65+ years old 49,35 38,92 11,73
Place of residence
Cities > 500k 56,94 37,31 5,75
Towns 200-500k 56,76 37,03 6,21
Towns 100-200k 58,04 34,98 6,98
Towns 20-100k 55,70 37,25 7,04
Towns < 20k 54,29 39,00 6,71
Rural areas 54,41 37,58 8,01
Voivodship
Dolnośląskie 54,72 37,05 8,23
Kujawsko-pomorskie 53,44 37,19 9,38
Lubelskie 47,97 42,01 10,03
Lubuskie 50,43 40,87 8,70
Łódzkie 52,51 38,95 8,54
Małopolskie 57,65 37,48 4,88
Mazowieckie 55,04 37,60 7,35
Opolskie 59,77 32,76 7,47
Podkarpackie 51,94 39,25 8,81
Podlaskie 51,83 39,85 8,31
Pomorskie 58,96 36,95 4,09
Śląskie 57,48 36,93 5,59
Świętokrzyskie 56,86 36,66 6,48
Warmińsko-mazurskie 61,01 31,72 7,27
Wielkopolskie 57,08 35,98 6,94
Zachodniopomorskie 59,19 35,90 4,90
Education
Primary and below 42,94 44,05 13,01
Vocational 58,51 34,49 7,00
Secondary 58,13 36,20 5,67
Tertiary/post-secondary 57,88 37,92 4,20
Income per capita
First quartile 53,33 38,10 8,57
Middle 50% 54,06 38,20 7,73
Fourth quartile 59,43 35,14 5,43
Social-professional status
Public sector employees 54,32 40,15 5,53
Private sector employees 60,00 35,41 4,59
Self-employed 59,27 35,82 4,91
Farmers 54,81 38,20 6,99
Disability pensioners 44,27 41,87 13,86
Retirees 52,27 38,24 9,49
Students 65,61 30,40 3,99
Unemployed 53,67 37,61 8,72
Other professionally inactive 49,54 41,55 8,91

Social Diagnosis 2007 Appendix 2 83
© The Council for Social Monitoring
Table 53.2. Frequency of psychosomatic symptoms within the last month – stomach pains or flatulence
Social-demografic group I did not suffer I suffered less than
15 days
I suffered at least
for half do the
month
Total 62,88 31,16 5,97
Gender
Men 71,49 24,05 4,46
Women 55,72 37,06 7,22
Age
up to 24 years old 66,23 29,77 4,00
25-34 years old 64,88 30,26 4,86
35-44 years old 63,67 31,45 4,88
45-59 years old 63,51 29,76 6,73
60-64 years old 61,34 32,44 6,22
65+ years old 55,38 35,46 9,16
Place of residence
Cities > 500k 56,23 36,65 7,13
Towns 200-500k 59,32 33,29 7,39
Towns 100-200k 62,43 31,21 6,36
Towns 20-100k 62,46 31,57 5,97
Towns < 20k 63,68 30,30 6,02
Rural areas 66,06 28,88 5,07
Voivodship
Dolnośląskie 58,85 32,39 8,75
Kujawsko-pomorskie 66,67 26,76 6,57
Lubelskie 59,86 33,38 6,76
Lubuskie 56,98 36,34 6,69
Łódzkie 57,86 36,38 5,75
Małopolskie 63,84 31,30 4,87
Mazowieckie 59,54 33,73 6,73
Opolskie 60,87 34,20 4,93
Podkarpackie 60,54 33,93 5,53
Podlaskie 54,41 37,75 7,84
Pomorskie 64,32 29,62 6,06
Śląskie 68,31 26,59 5,11
Świętokrzyskie 65,42 29,10 5,47
Warmińsko-mazurskie 70,00 23,06 6,94
Wielkopolskie 65,78 30,01 4,21
Zachodniopomorskie 68,13 27,85 4,03
Education
Primary and below 57,80 33,26 8,94
Vocational 67,09 27,72 5,20
Secondary 63,07 31,58 5,35
Tertiary/post-secondary 60,17 34,36 5,47
Income per capita
First quartile 66,09 28,53 5,38
Middle 50% 62,25 31,17 6,58
Fourth quartile 61,47 32,91 5,62
Social-professional status
Public sector employees 61,82 33,35 4,83
Private sector employees 66,70 29,14 4,16
Self-employed 69,33 25,77 4,90
Farmers 65,16 29,53 5,31
Disability pensioners 57,52 33,07 9,42
Retirees 58,39 33,67 7,94
Students 66,27 29,51 4,22
Unemployed 63,27 29,41 7,32
Other professionally inactive 60,39 32,40 7,20

Social Diagnosis 2007 Appendix 2 84
© The Council for Social Monitoring
Table 53.3. Frequency of psychosomatic symptoms within the last month – pain or tension of neck or arm muscles
Social-demografic group I did not suffer I suffered less than
15 days
I suffered at least
for half do the
month
Total 54,03 36,40 9,57
Gender
Men 57,14 35,65 7,21
Women 51,42 37,05 11,53
Age
up to 24 years old 72,74 23,17 4,09
25-34 years old 65,06 29,11 5,84
35-44 years old 54,79 37,36 7,85
45-59 years old 46,63 41,19 12,17
60-64 years old 42,64 44,67 12,69
65+ years old 35,16 48,35 16,48
Place of residence
Cities > 500k 51,30 36,65 12,05
Towns 200-500k 51,83 35,98 12,20
Towns 100-200k 53,81 36,62 9,57
Towns 20-100k 53,48 36,44 10,08
Towns < 20k 56,32 34,51 9,18
Rural areas 55,10 37,02 7,87
Voivodship
Dolnośląskie 51,56 37,36 11,08
Kujawsko-pomorskie 58,03 33,07 8,89
Lubelskie 49,80 38,67 11,53
Lubuskie 50,00 36,55 13,45
Łódzkie 49,59 38,99 11,43
Małopolskie 55,12 36,27 8,61
Mazowieckie 52,27 38,11 9,62
Opolskie 50,58 40,75 8,67
Podkarpackie 53,09 37,41 9,50
Podlaskie 53,43 37,01 9,56
Pomorskie 55,77 34,37 9,86
Śląskie 52,96 37,90 9,15
Świętokrzyskie 54,75 35,00 10,25
Warmińsko-mazurskie 63,49 26,57 9,94
Wielkopolskie 57,89 34,40 7,71
Zachodniopomorskie 59,86 34,15 5,99
Education
Primary and below 40,65 44,33 15,02
Vocational 58,08 34,15 7,77
Secondary 56,18 34,96 8,86
Tertiary/post-secondary 56,17 35,15 8,68
Income per capita
First quartile 59,15 33,64 7,21
Middle 50% 52,65 37,02 10,34
Fourth quartile 51,74 37,82 10,44
Social-professional status
Public sector employees 56,11 35,18 8,71
Private sector employees 58,77 34,04 7,19
Self-employed 54,66 37,11 8,23
Farmers 54,70 38,71 6,58
Disability pensioners 41,52 41,52 16,95
Retirees 37,17 47,78 15,05
Students 74,35 22,46 3,19
Unemployed 58,03 33,37 8,60
Other professionally inactive 61,54 29,95 8,51

Social Diagnosis 2007 Appendix 2 85
© The Council for Social Monitoring
Table 53.4. Frequency of psychosomatic symptoms within the last month – chest or heart pains
Social-demografic group I did not suffer I suffered less than
15 days
I suffered at least
for half do the
month
Total 70,27 24,28 5,45
Gender
Men 73,23 22,21 4,56
Women 67,80 26,01 6,20
Age
up to 24 years old 84,27 13,58 2,15
25-34 years old 82,73 15,21 2,05
35-44 years old 77,23 20,17 2,60
45-59 years old 67,53 26,01 6,46
60-64 years old 51,86 41,89 6,25
65+ years old 43,18 42,83 13,99
Place of residence
Cities > 500k 70,89 23,05 6,05
Towns 200-500k 71,51 23,72 4,77
Towns 100-200k 69,48 24,88 5,64
Towns 20-100k 68,47 25,47 6,06
Towns < 20k 71,76 22,89 5,35
Rural areas 70,34 24,51 5,15
Voivodship
Dolnośląskie 67,14 25,33 7,54
Kujawsko-pomorskie 71,29 22,31 6,40
Lubelskie 63,96 29,13 6,91
Lubuskie 69,19 22,67 8,14
Łódzkie 67,60 24,91 7,49
Małopolskie 69,44 25,79 4,78
Mazowieckie 68,04 26,77 5,19
Opolskie 67,34 27,17 5,49
Podkarpackie 69,30 25,04 5,66
Podlaskie 72,91 21,92 5,17
Pomorskie 72,11 23,38 4,51
Śląskie 73,61 22,89 3,49
Świętokrzyskie 71,00 24,50 4,50
Warmińsko-mazurskie 70,26 23,01 6,72
Wielkopolskie 74,29 20,86 4,85
Zachodniopomorskie 76,58 19,89 3,52
Education
Primary and below 51,43 36,95 11,62
Vocational 73,49 21,96 4,55
Secondary 73,84 21,70 4,47
Tertiary/post-secondary 76,81 20,37 2,82
Income per capita
First quartile 72,37 22,00 5,63
Middle 50% 69,00 25,16 5,84
Fourth quartile 69,92 25,06 5,02
Social-professional status
Public sector employees 78,31 19,06 2,63
Private sector employees 80,61 16,82 2,58
Self-employed 77,01 19,16 3,83
Farmers 76,09 20,78 3,13
Disability pensioners 49,45 37,44 13,11
Retirees 49,13 40,47 10,40
Students 84,41 13,90 1,70
Unemployed 70,79 22,68 6,53
Other professionally inactive 74,33 20,56 5,11

Social Diagnosis 2007 Appendix 2 86
© The Council for Social Monitoring
Table 53.5. Frequency of psychosomatic symptoms within the last month – dry mouth or throat
Social-demografic group I did not suffer I suffered less than
15 days
I suffered at least
for half do the
month
Total 71,79 22,95 5,26
Gender
Men 74,32 21,37 4,31
Women 69,70 24,27 6,03
Age
up to 24 years old 78,02 18,62 3,36
25-34 years old 79,14 18,42 2,43
35-44 years old 77,15 19,33 3,52
45-59 years old 70,67 23,57 5,77
60-64 years old 64,08 29,01 6,91
65+ years old 55,03 33,85 11,12
Place of residence
Cities > 500k 68,44 25,07 6,48
Towns 200-500k 68,61 24,26 7,14
Towns 100-200k 73,41 21,02 5,57
Towns 20-100k 70,97 23,26 5,77
Towns < 20k 74,25 21,55 4,21
Rural areas 73,02 22,66 4,32
Voivodship
Dolnośląskie 67,54 25,50 6,96
Kujawsko-pomorskie 69,17 24,73 6,10
Lubelskie 69,06 24,69 6,24
Lubuskie 72,67 22,09 5,23
Łódzkie 70,66 23,12 6,22
Małopolskie 71,67 23,73 4,59
Mazowieckie 69,09 25,43 5,48
Opolskie 65,13 29,39 5,48
Podkarpackie 70,66 23,95 5,39
Podlaskie 68,87 23,53 7,60
Pomorskie 71,33 24,44 4,24
Śląskie 76,59 18,54 4,87
Świętokrzyskie 76,75 19,75 3,50
Warmińsko-mazurskie 69,39 25,10 5,51
Wielkopolskie 77,73 19,34 2,93
Zachodniopomorskie 76,80 18,10 5,10
Education
Primary and below 60,57 30,47 8,96
Vocational 74,68 20,54 4,77
Secondary 73,15 22,43 4,42
Tertiary/post-secondary 75,18 20,86 3,96
Income per capita
First quartile 73,91 21,44 4,64
Middle 50% 70,87 23,25 5,88
Fourth quartile 70,54 24,65 4,81
Social-professional status
Public sector employees 74,78 21,65 3,57
Private sector employees 77,18 19,90 2,92
Self-employed 79,56 16,24 4,20
Farmers 78,56 18,47 2,97
Disability pensioners 57,76 31,05 11,19
Retirees 61,15 30,26 8,59
Students 78,18 18,93 2,88
Unemployed 72,43 21,40 6,18
Other professionally inactive 74,65 20,35 5,00

Social Diagnosis 2007 Appendix 2 87
© The Council for Social Monitoring
Table 53.6. Frequency of psychosomatic symptoms within the last month – sweating
Social-demografic group I did not suffer I suffered less than
15 days
I suffered at least
for half do the
month
Total 74,73 19,83 5,44
Gender
Men 80,11 16,01 3,89
Women 70,26 22,99 6,75
Age
up to 24 years old 86,91 10,49 2,60
25-34 years old 84,38 12,85 2,77
35-44 years old 80,05 16,54 3,41
45-59 years old 64,47 26,91 8,62
60-64 years old 62,39 30,69 6,91
65+ years old 65,53 26,51 7,95
Place of residence
Cities > 500k 75,85 18,15 6,00
Towns 200-500k 75,12 19,56 5,32
Towns 100-200k 74,44 20,99 4,57
Towns 20-100k 73,64 19,63 6,73
Towns < 20k 73,81 20,85 5,34
Rural areas 75,20 19,91 4,90
Voivodship
Dolnośląskie 72,78 20,87 6,35
Kujawsko-pomorskie 72,26 22,57 5,17
Lubelskie 69,73 24,59 5,68
Lubuskie 70,64 22,09 7,27
Łódzkie 75,47 17,92 6,60
Małopolskie 74,55 21,34 4,11
Mazowieckie 73,38 20,08 6,54
Opolskie 68,00 25,71 6,29
Podkarpackie 71,90 21,67 6,43
Podlaskie 74,94 19,16 5,90
Pomorskie 74,61 20,59 4,80
Śląskie 78,57 16,88 4,55
Świętokrzyskie 78,30 17,96 3,74
Warmińsko-mazurskie 74,04 19,68 6,29
Wielkopolskie 79,63 16,06 4,31
Zachodniopomorskie 78,46 17,34 4,20
Education
Primary and below 65,34 26,97 7,69
Vocational 76,57 17,91 5,52
Secondary 76,52 18,57 4,91
Tertiary/post-secondary 77,46 18,41 4,13
Income per capita
First quartile 74,89 19,12 5,98
Middle 50% 73,88 20,22 5,89
Fourth quartile 74,48 20,72 4,80
Social-professional status
Public sector employees 76,89 19,00 4,11
Private sector employees 80,58 15,50 3,92
Self-employed 79,85 16,88 3,27
Farmers 74,10 21,06 4,84
Disability pensioners 64,29 25,55 10,16
Retirees 64,56 27,45 8,00
Students 87,66 9,98 2,37
Unemployed 72,20 21,05 6,75
Other professionally inactive 72,13 21,95 5,92

Social Diagnosis 2007 Appendix 2 88
© The Council for Social Monitoring
Table 53.7. Frequency of psychosomatic symptoms within the last month – shortness of breath
Social-demografic group I did not suffer I suffered less than
15 days
I suffered at least
for half do the
month
Total 76,55 19,06 4,39
Gender
Men 81,04 15,49 3,47
Women 72,80 22,04 5,16
Age
up to 24 years old 89,42 8,74 1,84
25-34 years old 88,33 10,20 1,47
35-44 years old 84,40 14,02 1,58
45-59 years old 72,43 22,62 4,95
60-64 years old 61,49 32,09 6,42
65+ years old 51,87 36,20 11,93
Place of residence
Cities > 500k 75,69 19,34 4,98
Towns 200-500k 77,16 18,96 3,88
Towns 100-200k 77,73 16,99 5,27
Towns 20-100k 76,90 18,49 4,61
Towns < 20k 76,59 19,32 4,09
Rural areas 76,15 19,68 4,17
Voivodship
Dolnośląskie 73,39 20,06 6,55
Kujawsko-pomorskie 75,90 19,09 5,01
Lubelskie 71,91 23,88 4,21
Lubuskie 74,34 20,41 5,25
Łódzkie 75,82 18,31 5,87
Małopolskie 75,41 19,90 4,69
Mazowieckie 76,55 18,85 4,59
Opolskie 75,57 19,25 5,17
Podkarpackie 72,71 23,39 3,90
Podlaskie 77,40 18,67 3,93
Pomorskie 79,97 16,64 3,39
Śląskie 79,48 16,84 3,68
Świętokrzyskie 77,00 20,25 2,75
Warmińsko-mazurskie 73,82 22,09 4,09
Wielkopolskie 80,26 16,07 3,67
Zachodniopomorskie 80,18 17,02 2,81
Education
Primary and below 58,40 31,97 9,63
Vocational 79,47 16,92 3,61
Secondary 79,45 17,20 3,36
Tertiary/post-secondary 83,87 13,64 2,48
Income per capita
First quartile 78,21 17,81 3,99
Middle 50% 75,13 19,80 5,07
Fourth quartile 76,59 19,62 3,79
Social-professional status
Public sector employees 83,56 14,08 2,36
Private sector employees 86,18 12,00 1,82
Self-employed 85,04 13,32 1,64
Farmers 80,28 17,19 2,52
Disability pensioners 56,28 33,77 9,95
Retirees 57,68 33,19 9,13
Students 89,42 9,03 1,55
Unemployed 77,98 16,97 5,05
Other professionally inactive 78,93 17,23 3,84
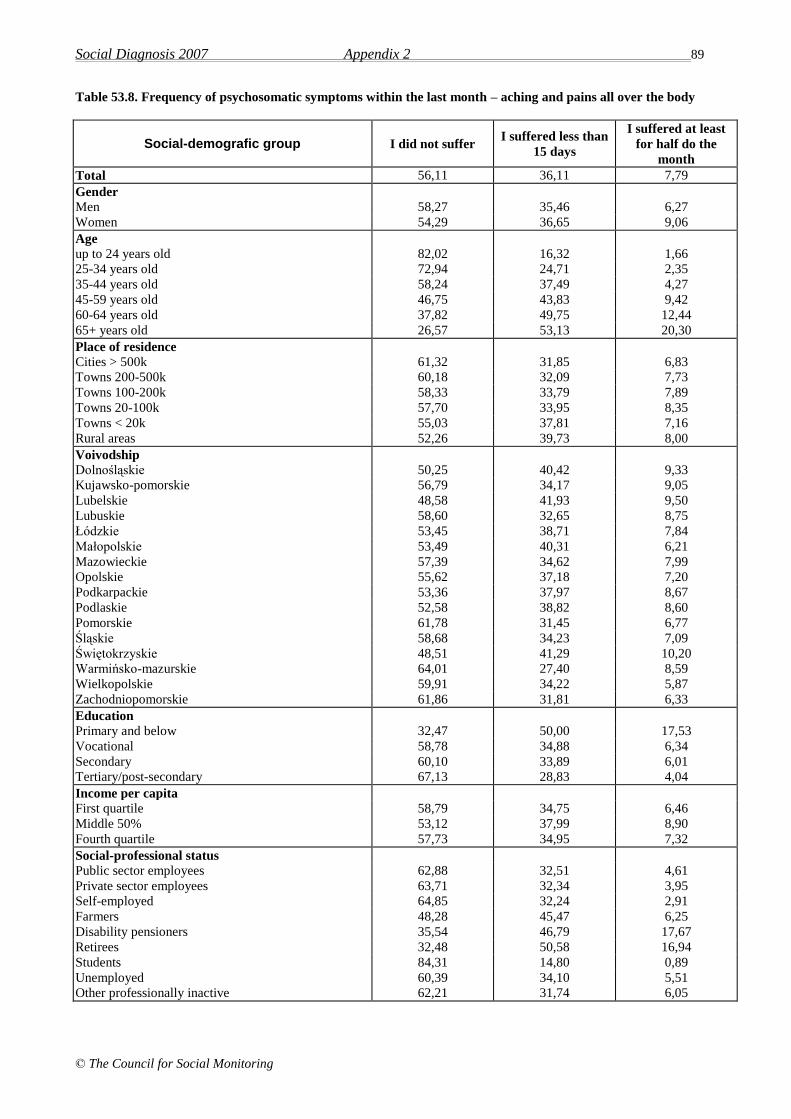
Social Diagnosis 2007 Appendix 2 89
© The Council for Social Monitoring
Table 53.8. Frequency of psychosomatic symptoms within the last month – aching and pains all over the body
Social-demografic group I did not suffer I suffered less than
15 days
I suffered at least
for half do the
month
Total 56,11 36,11 7,79
Gender
Men 58,27 35,46 6,27
Women 54,29 36,65 9,06
Age
up to 24 years old 82,02 16,32 1,66
25-34 years old 72,94 24,71 2,35
35-44 years old 58,24 37,49 4,27
45-59 years old 46,75 43,83 9,42
60-64 years old 37,82 49,75 12,44
65+ years old 26,57 53,13 20,30
Place of residence
Cities > 500k 61,32 31,85 6,83
Towns 200-500k 60,18 32,09 7,73
Towns 100-200k 58,33 33,79 7,89
Towns 20-100k 57,70 33,95 8,35
Towns < 20k 55,03 37,81 7,16
Rural areas 52,26 39,73 8,00
Voivodship
Dolnośląskie 50,25 40,42 9,33
Kujawsko-pomorskie 56,79 34,17 9,05
Lubelskie 48,58 41,93 9,50
Lubuskie 58,60 32,65 8,75
Łódzkie 53,45 38,71 7,84
Małopolskie 53,49 40,31 6,21
Mazowieckie 57,39 34,62 7,99
Opolskie 55,62 37,18 7,20
Podkarpackie 53,36 37,97 8,67
Podlaskie 52,58 38,82 8,60
Pomorskie 61,78 31,45 6,77
Śląskie 58,68 34,23 7,09
Świętokrzyskie 48,51 41,29 10,20
Warmińsko-mazurskie 64,01 27,40 8,59
Wielkopolskie 59,91 34,22 5,87
Zachodniopomorskie 61,86 31,81 6,33
Education
Primary and below 32,47 50,00 17,53
Vocational 58,78 34,88 6,34
Secondary 60,10 33,89 6,01
Tertiary/post-secondary 67,13 28,83 4,04
Income per capita
First quartile 58,79 34,75 6,46
Middle 50% 53,12 37,99 8,90
Fourth quartile 57,73 34,95 7,32
Social-professional status
Public sector employees 62,88 32,51 4,61
Private sector employees 63,71 32,34 3,95
Self-employed 64,85 32,24 2,91
Farmers 48,28 45,47 6,25
Disability pensioners 35,54 46,79 17,67
Retirees 32,48 50,58 16,94
Students 84,31 14,80 0,89
Unemployed 60,39 34,10 5,51
Other professionally inactive 62,21 31,74 6,05
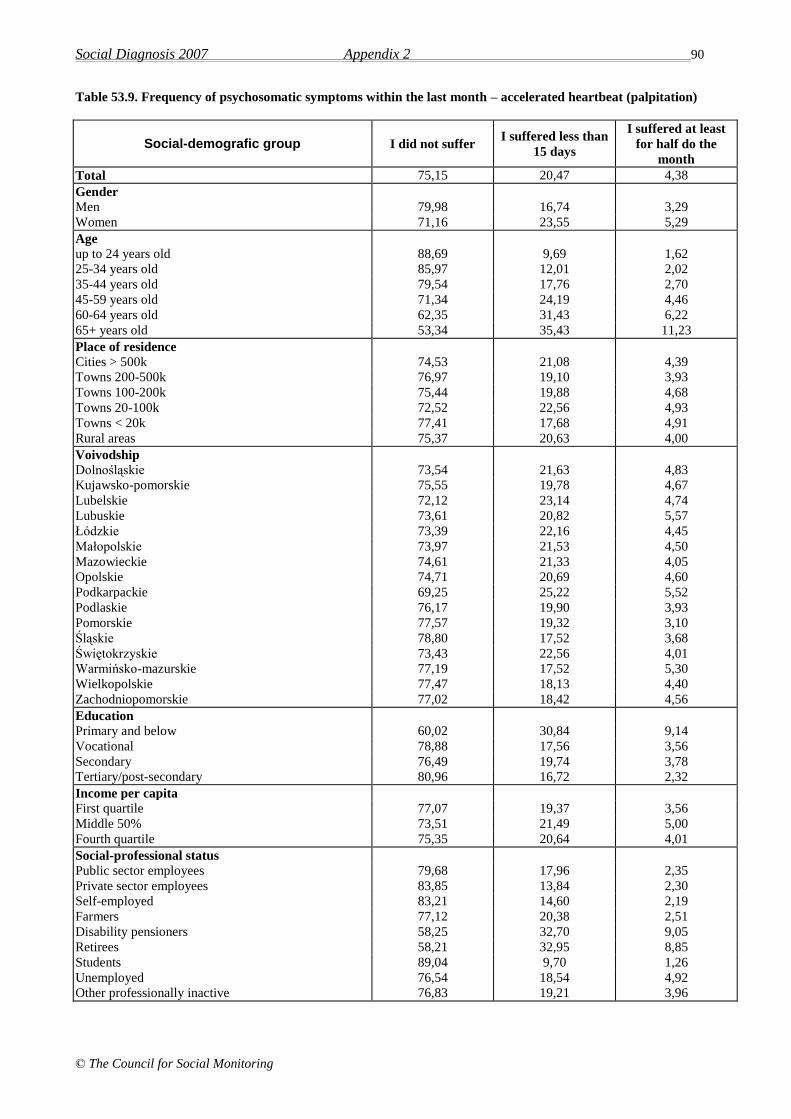
Social Diagnosis 2007 Appendix 2 90
© The Council for Social Monitoring
Table 53.9. Frequency of psychosomatic symptoms within the last month – accelerated heartbeat (palpitation)
Social-demografic group I did not suffer I suffered less than
15 days
I suffered at least
for half do the
month
Total 75,15 20,47 4,38
Gender
Men 79,98 16,74 3,29
Women 71,16 23,55 5,29
Age
up to 24 years old 88,69 9,69 1,62
25-34 years old 85,97 12,01 2,02
35-44 years old 79,54 17,76 2,70
45-59 years old 71,34 24,19 4,46
60-64 years old 62,35 31,43 6,22
65+ years old 53,34 35,43 11,23
Place of residence
Cities > 500k 74,53 21,08 4,39
Towns 200-500k 76,97 19,10 3,93
Towns 100-200k 75,44 19,88 4,68
Towns 20-100k 72,52 22,56 4,93
Towns < 20k 77,41 17,68 4,91
Rural areas 75,37 20,63 4,00
Voivodship
Dolnośląskie 73,54 21,63 4,83
Kujawsko-pomorskie 75,55 19,78 4,67
Lubelskie 72,12 23,14 4,74
Lubuskie 73,61 20,82 5,57
Łódzkie 73,39 22,16 4,45
Małopolskie 73,97 21,53 4,50
Mazowieckie 74,61 21,33 4,05
Opolskie 74,71 20,69 4,60
Podkarpackie 69,25 25,22 5,52
Podlaskie 76,17 19,90 3,93
Pomorskie 77,57 19,32 3,10
Śląskie 78,80 17,52 3,68
Świętokrzyskie 73,43 22,56 4,01
Warmińsko-mazurskie 77,19 17,52 5,30
Wielkopolskie 77,47 18,13 4,40
Zachodniopomorskie 77,02 18,42 4,56
Education
Primary and below 60,02 30,84 9,14
Vocational 78,88 17,56 3,56
Secondary 76,49 19,74 3,78
Tertiary/post-secondary 80,96 16,72 2,32
Income per capita
First quartile 77,07 19,37 3,56
Middle 50% 73,51 21,49 5,00
Fourth quartile 75,35 20,64 4,01
Social-professional status
Public sector employees 79,68 17,96 2,35
Private sector employees 83,85 13,84 2,30
Self-employed 83,21 14,60 2,19
Farmers 77,12 20,38 2,51
Disability pensioners 58,25 32,70 9,05
Retirees 58,21 32,95 8,85
Students 89,04 9,70 1,26
Unemployed 76,54 18,54 4,92
Other professionally inactive 76,83 19,21 3,96

Social Diagnosis 2007 Appendix 2 91
© The Council for Social Monitoring
Table 53.10. Frequency of psychosomatic symptoms within the last month – shivers or convulsions
Social-demografic group I did not suffer I suffered less than
15 days
I suffered at least
for half do the
month
Total 91,29 7,40 1,31
Gender
Men 92,49 6,44 1,07
Women 90,30 8,19 1,50
Age
up to 24 years old 92,32 6,87 0,81
25-34 years old 93,75 5,50 0,76
35-44 years old 92,29 6,89 0,82
45-59 years old 91,32 7,24 1,44
60-64 years old 91,55 7,26 1,18
65+ years old 86,09 11,11 2,80
Place of residence
Cities > 500k 90,61 8,45 0,94
Towns 200-500k 92,02 6,80 1,18
Towns 100-200k 90,55 8,28 1,17
Towns 20-100k 91,50 6,70 1,80
Towns < 20k 91,31 7,62 1,07
Rural areas 91,35 7,37 1,28
Voivodship
Dolnośląskie 89,00 9,28 1,72
Kujawsko-pomorskie 90,16 7,66 2,19
Lubelskie 89,69 8,82 1,49
Lubuskie 90,38 8,45 1,17
Łódzkie 93,42 5,99 0,59
Małopolskie 87,85 11,29 0,86
Mazowieckie 91,94 6,69 1,37
Opolskie 90,12 9,01 0,87
Podkarpackie 90,72 7,34 1,95
Podlaskie 90,86 7,41 1,73
Pomorskie 91,82 7,33 0,85
Śląskie 92,58 5,74 1,68
Świętokrzyskie 92,00 6,75 1,25
Warmińsko-mazurskie 92,84 5,73 1,43
Wielkopolskie 92,75 6,42 0,83
Zachodniopomorskie 93,17 6,13 0,70
Education
Primary and below 85,43 11,97 2,60
Vocational 92,44 6,41 1,15
Secondary 92,18 6,70 1,12
Tertiary/post-secondary 93,34 5,98 0,67
Income per capita
First quartile 90,71 8,08 1,22
Middle 50% 90,80 7,68 1,52
Fourth quartile 91,63 7,19 1,19
Social-professional status
Public sector employees 93,54 5,70 0,77
Private sector employees 92,57 6,47 0,96
Self-employed 94,53 4,93 0,55
Farmers 93,08 5,82 1,10
Disability pensioners 85,61 11,57 2,82
Retirees 89,07 8,87 2,06
Students 92,14 7,12 0,74
Unemployed 91,41 7,22 1,37
Other professionally inactive 90,55 8,17 1,28

Social Diagnosis 2007 Appendix 2 92
© The Council for Social Monitoring
Table 53.11. Frequency of psychosomatic symptoms within the last month – pressure on the bladder and more
frequent urinating
Social-demografic group I did not suffer I suffered less than
15 days
I suffered at least
for half do the
month
Total 77,31 17,22 5,46
Gender
Men 80,45 14,61 4,93
Women 74,71 19,40 5,89
Age
up to 24 years old 85,85 11,19 2,96
25-34 years old 86,03 11,62 2,35
35-44 years old 84,06 13,44 2,50
45-59 years old 76,27 18,44 5,29
60-64 years old 66,22 26,52 7,26
65+ years old 56,00 29,45 14,55
Place of residence
Cities > 500k 76,28 17,16 6,56
Towns 200-500k 74,67 18,41 6,92
Towns 100-200k 75,90 18,63 5,46
Towns 20-100k 75,89 17,65 6,46
Towns < 20k 79,13 15,89 4,98
Rural areas 78,96 16,77 4,27
Voivodship
Dolnośląskie 73,54 20,00 6,46
Kujawsko-pomorskie 77,97 15,47 6,56
Lubelskie 76,89 17,43 5,68
Lubuskie 74,64 17,78 7,58
Łódzkie 76,44 18,64 4,92
Małopolskie 79,75 15,83 4,41
Mazowieckie 75,78 18,20 6,03
Opolskie 72,91 20,46 6,63
Podkarpackie 73,84 20,78 5,38
Podlaskie 76,47 17,40 6,13
Pomorskie 77,29 17,07 5,64
Śląskie 79,30 15,40 5,30
Świętokrzyskie 81,25 14,25 4,50
Warmińsko-mazurskie 77,96 16,94 5,10
Wielkopolskie 81,04 14,93 4,03
Zachodniopomorskie 78,03 17,05 4,92
Education
Primary and below 66,74 23,99 9,27
Vocational 80,76 15,06 4,18
Secondary 79,13 16,26 4,62
Tertiary/post-secondary 78,32 16,20 5,48
Income per capita
First quartile 79,32 16,51 4,17
Middle 50% 77,15 17,35 5,50
Fourth quartile 75,35 18,27 6,38
Social-professional status
Public sector employees 82,73 13,38 3,89
Private sector employees 83,82 13,88 2,31
Self-employed 83,61 13,66 2,73
Farmers 80,03 17,32 2,65
Disability pensioners 67,40 21,63 10,97
Retirees 60,95 27,53 11,52
Students 86,75 10,51 2,74
Unemployed 79,08 16,67 4,25
Other professionally inactive 81,96 13,85 4,19
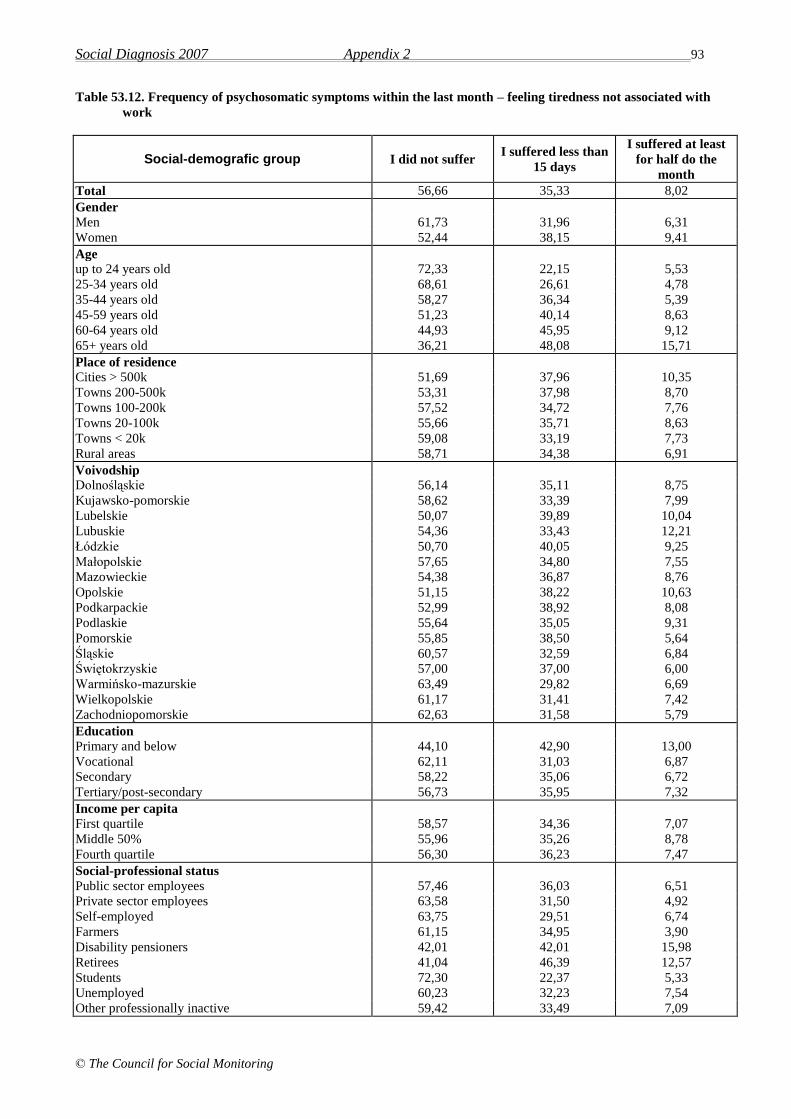
Social Diagnosis 2007 Appendix 2 93
© The Council for Social Monitoring
Table 53.12. Frequency of psychosomatic symptoms within the last month – feeling tiredness not associated with
work
Social-demografic group I did not suffer I suffered less than
15 days
I suffered at least
for half do the
month
Total 56,66 35,33 8,02
Gender
Men 61,73 31,96 6,31
Women 52,44 38,15 9,41
Age
up to 24 years old 72,33 22,15 5,53
25-34 years old 68,61 26,61 4,78
35-44 years old 58,27 36,34 5,39
45-59 years old 51,23 40,14 8,63
60-64 years old 44,93 45,95 9,12
65+ years old 36,21 48,08 15,71
Place of residence
Cities > 500k 51,69 37,96 10,35
Towns 200-500k 53,31 37,98 8,70
Towns 100-200k 57,52 34,72 7,76
Towns 20-100k 55,66 35,71 8,63
Towns < 20k 59,08 33,19 7,73
Rural areas 58,71 34,38 6,91
Voivodship
Dolnośląskie 56,14 35,11 8,75
Kujawsko-pomorskie 58,62 33,39 7,99
Lubelskie 50,07 39,89 10,04
Lubuskie 54,36 33,43 12,21
Łódzkie 50,70 40,05 9,25
Małopolskie 57,65 34,80 7,55
Mazowieckie 54,38 36,87 8,76
Opolskie 51,15 38,22 10,63
Podkarpackie 52,99 38,92 8,08
Podlaskie 55,64 35,05 9,31
Pomorskie 55,85 38,50 5,64
Śląskie 60,57 32,59 6,84
Świętokrzyskie 57,00 37,00 6,00
Warmińsko-mazurskie 63,49 29,82 6,69
Wielkopolskie 61,17 31,41 7,42
Zachodniopomorskie 62,63 31,58 5,79
Education
Primary and below 44,10 42,90 13,00
Vocational 62,11 31,03 6,87
Secondary 58,22 35,06 6,72
Tertiary/post-secondary 56,73 35,95 7,32
Income per capita
First quartile 58,57 34,36 7,07
Middle 50% 55,96 35,26 8,78
Fourth quartile 56,30 36,23 7,47
Social-professional status
Public sector employees 57,46 36,03 6,51
Private sector employees 63,58 31,50 4,92
Self-employed 63,75 29,51 6,74
Farmers 61,15 34,95 3,90
Disability pensioners 42,01 42,01 15,98
Retirees 41,04 46,39 12,57
Students 72,30 22,37 5,33
Unemployed 60,23 32,23 7,54
Other professionally inactive 59,42 33,49 7,09
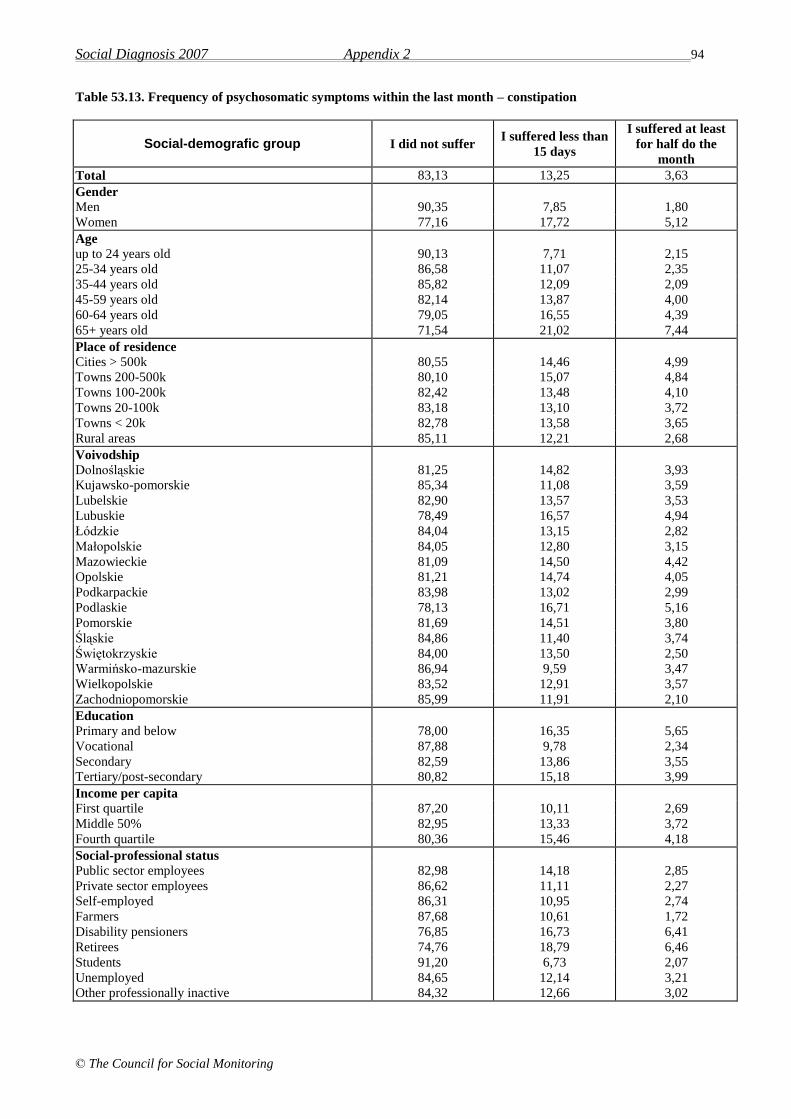
Social Diagnosis 2007 Appendix 2 94
© The Council for Social Monitoring
Table 53.13. Frequency of psychosomatic symptoms within the last month – constipation
Social-demografic group I did not suffer I suffered less than
15 days
I suffered at least
for half do the
month
Total 83,13 13,25 3,63
Gender
Men 90,35 7,85 1,80
Women 77,16 17,72 5,12
Age
up to 24 years old 90,13 7,71 2,15
25-34 years old 86,58 11,07 2,35
35-44 years old 85,82 12,09 2,09
45-59 years old 82,14 13,87 4,00
60-64 years old 79,05 16,55 4,39
65+ years old 71,54 21,02 7,44
Place of residence
Cities > 500k 80,55 14,46 4,99
Towns 200-500k 80,10 15,07 4,84
Towns 100-200k 82,42 13,48 4,10
Towns 20-100k 83,18 13,10 3,72
Towns < 20k 82,78 13,58 3,65
Rural areas 85,11 12,21 2,68
Voivodship
Dolnośląskie 81,25 14,82 3,93
Kujawsko-pomorskie 85,34 11,08 3,59
Lubelskie 82,90 13,57 3,53
Lubuskie 78,49 16,57 4,94
Łódzkie 84,04 13,15 2,82
Małopolskie 84,05 12,80 3,15
Mazowieckie 81,09 14,50 4,42
Opolskie 81,21 14,74 4,05
Podkarpackie 83,98 13,02 2,99
Podlaskie 78,13 16,71 5,16
Pomorskie 81,69 14,51 3,80
Śląskie 84,86 11,40 3,74
Świętokrzyskie 84,00 13,50 2,50
Warmińsko-mazurskie 86,94 9,59 3,47
Wielkopolskie 83,52 12,91 3,57
Zachodniopomorskie 85,99 11,91 2,10
Education
Primary and below 78,00 16,35 5,65
Vocational 87,88 9,78 2,34
Secondary 82,59 13,86 3,55
Tertiary/post-secondary 80,82 15,18 3,99
Income per capita
First quartile 87,20 10,11 2,69
Middle 50% 82,95 13,33 3,72
Fourth quartile 80,36 15,46 4,18
Social-professional status
Public sector employees 82,98 14,18 2,85
Private sector employees 86,62 11,11 2,27
Self-employed 86,31 10,95 2,74
Farmers 87,68 10,61 1,72
Disability pensioners 76,85 16,73 6,41
Retirees 74,76 18,79 6,46
Students 91,20 6,73 2,07
Unemployed 84,65 12,14 3,21
Other professionally inactive 84,32 12,66 3,02
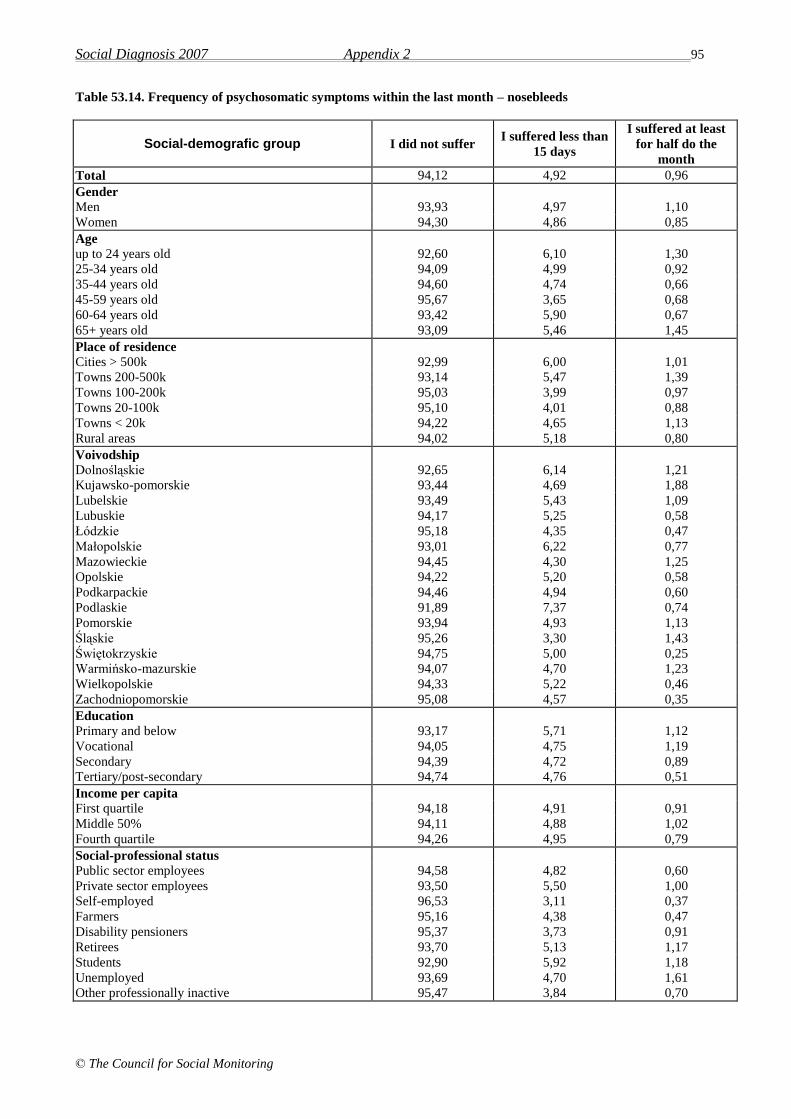
Social Diagnosis 2007 Appendix 2 95
© The Council for Social Monitoring
Table 53.14. Frequency of psychosomatic symptoms within the last month – nosebleeds
Social-demografic group I did not suffer I suffered less than
15 days
I suffered at least
for half do the
month
Total 94,12 4,92 0,96
Gender
Men 93,93 4,97 1,10
Women 94,30 4,86 0,85
Age
up to 24 years old 92,60 6,10 1,30
25-34 years old 94,09 4,99 0,92
35-44 years old 94,60 4,74 0,66
45-59 years old 95,67 3,65 0,68
60-64 years old 93,42 5,90 0,67
65+ years old 93,09 5,46 1,45
Place of residence
Cities > 500k 92,99 6,00 1,01
Towns 200-500k 93,14 5,47 1,39
Towns 100-200k 95,03 3,99 0,97
Towns 20-100k 95,10 4,01 0,88
Towns < 20k 94,22 4,65 1,13
Rural areas 94,02 5,18 0,80
Voivodship
Dolnośląskie 92,65 6,14 1,21
Kujawsko-pomorskie 93,44 4,69 1,88
Lubelskie 93,49 5,43 1,09
Lubuskie 94,17 5,25 0,58
Łódzkie 95,18 4,35 0,47
Małopolskie 93,01 6,22 0,77
Mazowieckie 94,45 4,30 1,25
Opolskie 94,22 5,20 0,58
Podkarpackie 94,46 4,94 0,60
Podlaskie 91,89 7,37 0,74
Pomorskie 93,94 4,93 1,13
Śląskie 95,26 3,30 1,43
Świętokrzyskie 94,75 5,00 0,25
Warmińsko-mazurskie 94,07 4,70 1,23
Wielkopolskie 94,33 5,22 0,46
Zachodniopomorskie 95,08 4,57 0,35
Education
Primary and below 93,17 5,71 1,12
Vocational 94,05 4,75 1,19
Secondary 94,39 4,72 0,89
Tertiary/post-secondary 94,74 4,76 0,51
Income per capita
First quartile 94,18 4,91 0,91
Middle 50% 94,11 4,88 1,02
Fourth quartile 94,26 4,95 0,79
Social-professional status
Public sector employees 94,58 4,82 0,60
Private sector employees 93,50 5,50 1,00
Self-employed 96,53 3,11 0,37
Farmers 95,16 4,38 0,47
Disability pensioners 95,37 3,73 0,91
Retirees 93,70 5,13 1,17
Students 92,90 5,92 1,18
Unemployed 93,69 4,70 1,61
Other professionally inactive 95,47 3,84 0,70

Social Diagnosis 2007 Appendix 2 96
© The Council for Social Monitoring
Table 53.15. Frequency of psychosomatic symptoms within the last month – sudden changes of blood pressure
Social-demografic group I did not suffer I suffered less than
15 days
I suffered at least
for half do the
month
Total 74,52 18,74 6,74
Gender
Men 77,46 17,09 5,45
Women 72,05 20,14 7,80
Age
up to 24 years old 93,58 5,03 1,39
25-34 years old 89,82 8,67 1,51
35-44 years old 84,24 13,07 2,69
45-59 years old 67,55 23,98 8,47
60-64 years old 53,45 33,78 12,77
65+ years old 43,90 38,10 18,01
Place of residence
Cities > 500k 75,84 17,04 7,12
Towns 200-500k 74,71 18,54 6,75
Towns 100-200k 75,56 16,94 7,50
Towns 20-100k 74,47 18,64 6,89
Towns < 20k 75,66 18,46 5,88
Rural areas 73,46 19,89 6,65
Voivodship
Dolnośląskie 72,49 18,57 8,94
Kujawsko-pomorskie 78,63 13,42 7,96
Lubelskie 67,62 24,12 8,27
Lubuskie 75,58 18,02 6,40
Łódzkie 72,35 20,19 7,47
Małopolskie 73,19 20,23 6,58
Mazowieckie 74,42 19,41 6,17
Opolskie 73,20 20,46 6,34
Podkarpackie 71,04 19,85 9,10
Podlaskie 73,53 18,38 8,09
Pomorskie 77,61 16,62 5,77
Śląskie 77,80 16,60 5,60
Świętokrzyskie 72,57 20,70 6,73
Warmińsko-mazurskie 73,98 21,34 4,67
Wielkopolskie 79,09 15,71 5,21
Zachodniopomorskie 73,25 20,45 6,29
Education
Primary and below 53,36 32,07 14,57
Vocational 78,31 15,90 5,79
Secondary 77,52 17,51 4,96
Tertiary/post-secondary 83,15 12,94 3,91
Income per capita
First quartile 78,59 16,04 5,37
Middle 50% 72,83 19,97 7,20
Fourth quartile 73,35 19,42 7,23
Social-professional status
Public sector employees 84,09 12,74 3,17
Private sector employees 84,89 11,95 3,16
Self-employed 82,79 15,04 2,17
Farmers 77,57 17,76 4,67
Disability pensioners 51,45 31,27 17,28
Retirees 49,50 35,59 14,91
Students 94,60 4,52 0,89
Unemployed 78,76 16,65 4,59
Other professionally inactive 77,84 17,05 5,10

Social Diagnosis 2007 Appendix 2 97
© The Council for Social Monitoring
Table P 54. Did the changes that took place in Poland after year 1989 have any influence upon your life?
Social-demografic group
yes no
Total 52,57 47,43
Gender
Men 55,10 44,90
Women 50,49 49,51
Age
up to 24 years old 30,14 69,86
25-34 years old 45,52 54,48
35-44 years old 61,54 38,46
45-59 years old 65,93 34,07
60-64 years old 61,13 38,87
65+ years old 51,40 48,60
Place of residence
Cities > 500k 61,44 38,56
Towns 200-500k 56,99 43,01
Towns 100-200k 54,28 45,72
Towns 20-100k 54,63 45,37
Towns < 20k 51,63 48,37
Rural areas 47,40 52,60
Voivodship
Dolnośląskie 53,47 46,53
Kujawsko-pomorskie 48,55 51,45
Lubelskie 53,56 46,44
Lubuskie 56,80 43,20
Łódzkie 54,92 45,08
Małopolskie 53,45 46,55
Mazowieckie 51,09 48,91
Opolskie 54,91 45,09
Podkarpackie 52,05 47,95
Podlaskie 52,75 47,25
Pomorskie 55,16 44,84
Śląskie 53,11 46,89
Świętokrzyskie 48,97 51,03
Warmińsko-mazurskie 54,87 45,13
Wielkopolskie 48,61 51,39
Zachodniopomorskie 53,43 46,57
Education
Primary and below 47,72 52,28
Vocational 46,69 53,31
Secondary 53,80 46,20
Tertiary/post-secondary 65,03 34,97
Income per capita
First quartile 47,41 52,59
Middle 50% 51,13 48,87
Fourth quartile 57,94 42,06
Social-professional status
Public sector employees 59,05 40,95
Private sector employees 53,02 46,98
Self-employed 66,04 33,96
Farmers 56,83 43,17
Disability pensioners 54,82 45,18
Retirees 55,24 44,76
Students 29,51 70,49
Unemployed 55,39 44,61
Other professionally inactive 47,70 52,30

Social Diagnosis 2007 Appendix 2 98
© The Council for Social Monitoring
Table P 55. - if YES, then, in general, was that influence positive or negative?
Social-demografic group very
negative negative positive
very
positive
it is
difficult to
say
Total 9,73 34,16 31,04 4,68 20,40
Gender
Men 10,02 33,26 33,20 5,87 17,66
Women 9,46 34,99 29,13 3,60 22,81
Age
up to 24 years old 4,02 17,65 34,72 7,89 35,72
25-34 years old 4,40 18,96 40,75 8,15 27,75
35-44 years old 7,88 33,28 34,77 5,23 18,84
45-59 years old 13,48 40,03 28,55 3,19 14,76
60-64 years old 11,96 47,01 24,18 2,45 14,40
65+ years old 12,36 45,17 21,91 2,12 18,44
Place of residence
Cities > 500k 7,57 27,24 37,83 10,24 17,11
Towns 200-500k 9,69 31,17 33,01 6,99 19,14
Towns 100-200k 8,39 31,96 34,29 3,57 21,79
Towns 20-100k 10,28 34,58 32,01 3,30 19,82
Towns < 20k 10,82 33,41 31,75 3,92 20,10
Rural areas 10,19 38,55 26,01 3,07 22,18
Voivodship
Dolnośląskie 9,69 34,55 30,71 3,66 21,39
Kujawsko-pomorskie 12,62 36,28 28,08 4,42 18,61
Lubelskie 12,94 36,80 27,16 3,30 19,80
Lubuskie 12,50 30,50 31,50 3,50 22,00
Łódzkie 8,07 38,72 27,33 3,52 22,36
Małopolskie 10,04 28,65 33,03 9,67 18,61
Mazowieckie 8,72 31,98 31,74 6,40 21,16
Opolskie 9,47 36,32 28,42 6,32 19,47
Podkarpackie 11,17 33,52 30,95 3,72 20,63
Podlaskie 11,16 33,95 28,84 4,19 21,86
Pomorskie 8,82 23,93 39,29 7,05 20,91
Śląskie 9,95 35,19 33,37 3,40 18,08
Świętokrzyskie 9,90 43,23 26,04 1,56 19,27
Warmińsko-mazurskie 8,90 38,43 28,83 1,42 22,42
Wielkopolskie 5,47 36,42 33,77 4,15 20,19
Zachodniopomorskie 11,69 35,38 26,77 4,00 22,15
Education
Primary and below 16,22 45,35 15,48 1,01 21,94
Vocational 11,79 40,44 23,99 2,67 21,11
Secondary 8,41 33,55 32,94 3,88 21,22
Tertiary/post-secondary 4,35 19,29 48,25 10,84 17,27
Income per capita
First quartile 15,18 43,18 16,00 1,64 24,00
Middle 50% 11,17 38,14 26,27 2,15 22,27
Fourth quartile 4,93 25,56 44,83 9,23 15,46
Social-professional status
Public sector employees 5,12 27,19 40,60 6,70 20,39
Private sector employees 7,05 29,49 36,03 5,90 21,54
Self-employed 5,60 18,21 48,46 8,68 19,05
Farmers 11,44 40,33 25,34 3,00 19,89
Disability pensioners 16,61 42,96 18,95 1,81 19,68
Retirees 11,67 44,79 24,95 2,24 16,35
Students 2,97 14,36 39,60 9,41 33,66
Unemployed 18,28 44,15 17,25 2,05 18,28
Other professionally inactive 14,70 37,35 22,89 3,37 21,69

Social Diagnosis 2007 Appendix 2 99
© The Council for Social Monitoring
Table P 56. Do you smoke cigarettes?
Social-demografic group
yes no
Total 29,63 70,37
Gender
Men 37,92 62,08
Women 22,75 77,25
Age
up to 24 years old 22,85 77,15
25-34 years old 31,98 68,02
35-44 years old 39,83 60,17
45-59 years old 37,25 62,75
60-64 years old 26,94 73,06
65+ years old 12,23 87,77
Place of residence
Cities > 500k 32,21 67,79
Towns 200-500k 31,12 68,88
Towns 100-200k 31,43 68,57
Towns 20-100k 29,80 70,20
Towns < 20k 31,64 68,36
Rural areas 27,23 72,77
Voivodship
Dolnośląskie 30,26 69,74
Kujawsko-pomorskie 34,58 65,42
Lubelskie 28,78 71,22
Lubuskie 32,75 67,25
Łódzkie 27,92 72,08
Małopolskie 28,16 71,84
Mazowieckie 29,70 70,30
Opolskie 31,23 68,77
Podkarpackie 25,00 75,00
Podlaskie 29,24 70,76
Pomorskie 30,13 69,87
Śląskie 29,63 70,37
Świętokrzyskie 21,84 78,16
Warmińsko-mazurskie 30,85 69,15
Wielkopolskie 29,32 70,68
Zachodniopomorskie 36,49 63,51
Education
Primary and below 27,95 72,05
Vocational 36,65 63,35
Secondary 29,04 70,96
Tertiary/post-secondary 20,32 79,68
Income per capita
First quartile 37,99 62,01
Middle 50% 30,09 69,91
Fourth quartile 25,01 74,99
Social-professional status
Public sector employees 29,17 70,83
Private sector employees 41,91 58,09
Self-employed 33,70 66,30
Farmers 30,73 69,27
Disability pensioners 27,45 72,55
Retirees 17,27 82,73
Students 13,88 86,12
Unemployed 41,94 58,06
Other professionally inactive 37,70 62,30

Social Diagnosis 2007 Appendix 2 100
© The Council for Social Monitoring
Table P 57_1. - if YES, how many cigarettes per day do you smoke?
Social-demografic group
up to 10 11-19 20 21-30 >30
Total 81,28 5,21 10,30 2,42 0,79
Gender
Men 72,68 6,10 15,56 4,17 1,48
Women 88,40 4,45 5,94 0,97 0,23
Age
up to 24 years old 90,12 4,74 4,34 0,76 0,04
25-34 years old 81,54 6,02 10,32 1,84 0,29
35-44 years old 71,46 7,44 15,94 4,10 1,06
45-59 years old 74,20 5,70 14,49 3,96 1,66
60-64 years old 82,08 3,85 9,88 3,35 0,84
65+ years old 92,58 2,08 4,40 0,45 0,49
Place of residence
Cities > 500k 80,91 6,08 10,22 2,00 0,79
Towns 200-500k 80,44 6,52 9,61 2,47 0,96
Towns 100-200k 80,10 5,51 10,53 3,00 0,87
Towns 20-100k 82,14 6,14 9,25 1,91 0,56
Towns < 20k 79,84 5,56 11,11 2,62 0,87
Rural areas 81,98 3,82 10,79 2,60 0,82
Voivodship
Dolnośląskie 81,34 4,79 11,28 1,70 0,90
Kujawsko-pomorskie 76,78 4,80 13,16 4,02 1,24
Lubelskie 80,81 4,59 10,95 3,11 0,54
Lubuskie 78,84 8,41 8,41 3,48 0,87
Łódzkie 82,31 5,24 9,55 2,33 0,58
Małopolskie 82,29 4,86 10,19 2,48 0,19
Mazowieckie 81,40 4,31 10,45 2,60 1,24
Opolskie 79,49 4,56 12,25 1,99 1,71
Podkarpackie 85,10 4,02 7,75 2,53 0,60
Podlaskie 82,89 2,93 10,27 2,20 1,71
Pomorskie 81,52 7,05 8,60 2,12 0,71
Śląskie 81,18 5,68 10,24 2,04 0,86
Świętokrzyskie 86,60 3,23 7,69 1,99 0,50
Warmińsko-mazurskie 78,92 6,83 12,65 1,20 0,40
Wielkopolskie 82,03 6,48 8,39 2,55 0,55
Zachodniopomorskie 76,88 5,95 14,01 2,80 0,35
Education
Primary and below 80,51 3,90 12,18 2,44 0,97
Vocational 74,97 6,26 13,93 3,64 1,21
Secondary 83,14 5,62 8,77 1,86 0,60
Tertiary/post-secondary 89,50 3,93 5,02 1,30 0,25
Income per capita
First quartile 74,85 6,26 14,41 3,71 0,78
Middle 50% 81,17 5,60 10,20 2,17 0,86
Fourth quartile 84,37 4,28 8,46 2,16 0,73
Social-professional status
Public sector employees 82,19 4,79 9,91 2,34 0,76
Private sector employees 72,68 7,52 14,63 4,14 1,03
Self-employed 75,59 6,33 12,84 3,44 1,81
Farmers 76,28 5,43 12,71 4,03 1,55
Disability pensioners 81,45 4,86 10,81 1,88 0,99
Retirees 88,91 3,12 6,31 1,08 0,58
Students 95,06 2,80 1,62 0,44 0,07
Unemployed 74,80 5,82 15,74 2,96 0,68
Other professionally inactive 77,45 7,02 12,66 2,30 0,58
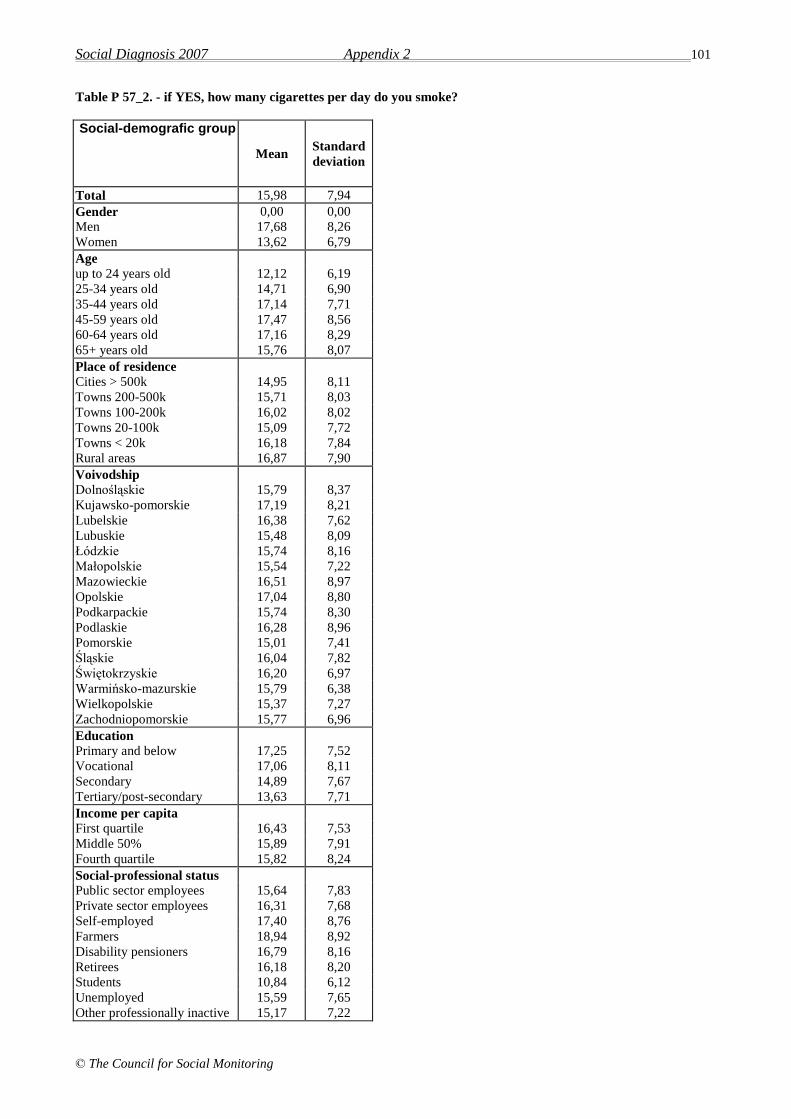
Social Diagnosis 2007 Appendix 2 101
© The Council for Social Monitoring
Table P 57_2. - if YES, how many cigarettes per day do you smoke?
Social-demografic group
Mean Standard
deviation
Total 15,98 7,94
Gender 0,00 0,00
Men 17,68 8,26
Women 13,62 6,79
Age
up to 24 years old 12,12 6,19
25-34 years old 14,71 6,90
35-44 years old 17,14 7,71
45-59 years old 17,47 8,56
60-64 years old 17,16 8,29
65+ years old 15,76 8,07
Place of residence
Cities > 500k 14,95 8,11
Towns 200-500k 15,71 8,03
Towns 100-200k 16,02 8,02
Towns 20-100k 15,09 7,72
Towns < 20k 16,18 7,84
Rural areas 16,87 7,90
Voivodship
Dolnośląskie 15,79 8,37
Kujawsko-pomorskie 17,19 8,21
Lubelskie 16,38 7,62
Lubuskie 15,48 8,09
Łódzkie 15,74 8,16
Małopolskie 15,54 7,22
Mazowieckie 16,51 8,97
Opolskie 17,04 8,80
Podkarpackie 15,74 8,30
Podlaskie 16,28 8,96
Pomorskie 15,01 7,41
Śląskie 16,04 7,82
Świętokrzyskie 16,20 6,97
Warmińsko-mazurskie 15,79 6,38
Wielkopolskie 15,37 7,27
Zachodniopomorskie 15,77 6,96
Education
Primary and below 17,25 7,52
Vocational 17,06 8,11
Secondary 14,89 7,67
Tertiary/post-secondary 13,63 7,71
Income per capita
First quartile 16,43 7,53
Middle 50% 15,89 7,91
Fourth quartile 15,82 8,24
Social-professional status
Public sector employees 15,64 7,83
Private sector employees 16,31 7,68
Self-employed 17,40 8,76
Farmers 18,94 8,92
Disability pensioners 16,79 8,16
Retirees 16,18 8,20
Students 10,84 6,12
Unemployed 15,59 7,65
Other professionally inactive 15,17 7,22
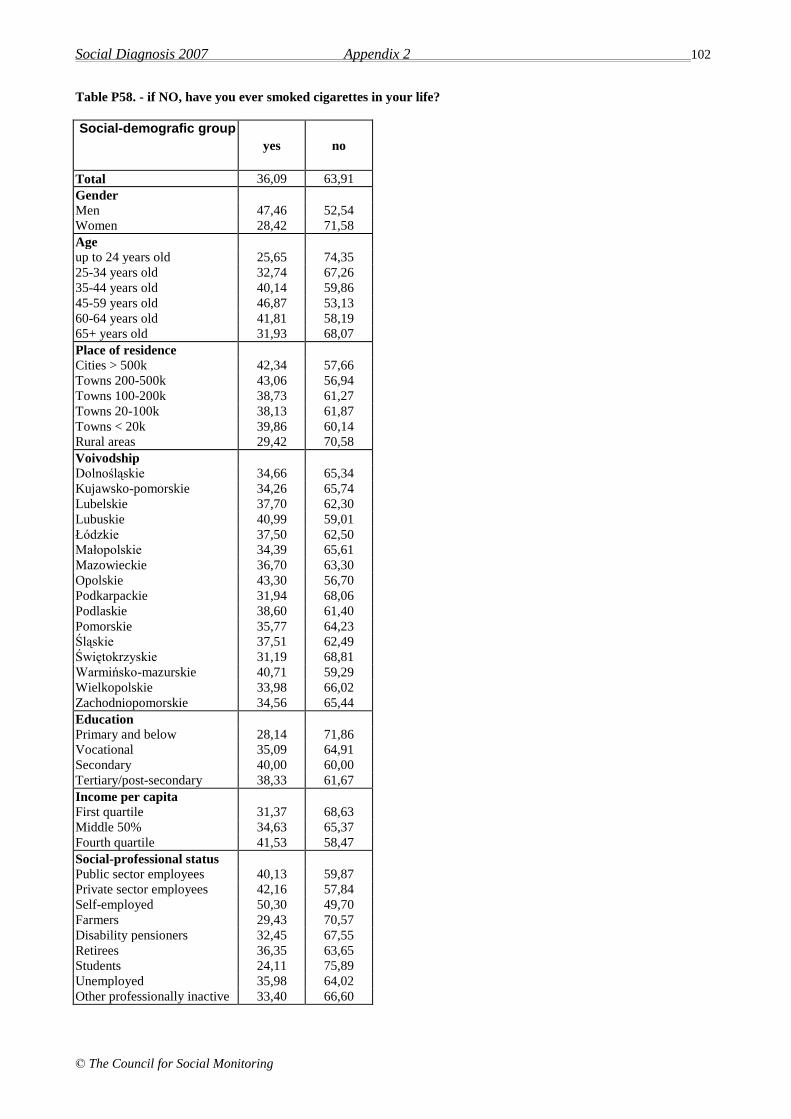
Social Diagnosis 2007 Appendix 2 102
© The Council for Social Monitoring
Table P58. - if NO, have you ever smoked cigarettes in your life?
Social-demografic group
yes no
Total 36,09 63,91
Gender
Men 47,46 52,54
Women 28,42 71,58
Age
up to 24 years old 25,65 74,35
25-34 years old 32,74 67,26
35-44 years old 40,14 59,86
45-59 years old 46,87 53,13
60-64 years old 41,81 58,19
65+ years old 31,93 68,07
Place of residence
Cities > 500k 42,34 57,66
Towns 200-500k 43,06 56,94
Towns 100-200k 38,73 61,27
Towns 20-100k 38,13 61,87
Towns < 20k 39,86 60,14
Rural areas 29,42 70,58
Voivodship
Dolnośląskie 34,66 65,34
Kujawsko-pomorskie 34,26 65,74
Lubelskie 37,70 62,30
Lubuskie 40,99 59,01
Łódzkie 37,50 62,50
Małopolskie 34,39 65,61
Mazowieckie 36,70 63,30
Opolskie 43,30 56,70
Podkarpackie 31,94 68,06
Podlaskie 38,60 61,40
Pomorskie 35,77 64,23
Śląskie 37,51 62,49
Świętokrzyskie 31,19 68,81
Warmińsko-mazurskie 40,71 59,29
Wielkopolskie 33,98 66,02
Zachodniopomorskie 34,56 65,44
Education
Primary and below 28,14 71,86
Vocational 35,09 64,91
Secondary 40,00 60,00
Tertiary/post-secondary 38,33 61,67
Income per capita
First quartile 31,37 68,63
Middle 50% 34,63 65,37
Fourth quartile 41,53 58,47
Social-professional status
Public sector employees 40,13 59,87
Private sector employees 42,16 57,84
Self-employed 50,30 49,70
Farmers 29,43 70,57
Disability pensioners 32,45 67,55
Retirees 36,35 63,65
Students 24,11 75,89
Unemployed 35,98 64,02
Other professionally inactive 33,40 66,60

Social Diagnosis 2007 Appendix 2 103
© The Council for Social Monitoring
Table P59. In general, was the previous year a good one in your life?
Social-demografic group
yes no
Total 78,42 21,58
Gender
Men 78,71 21,29
Women 78,19 21,81
Age
up to 24 years old 84,59 15,41
25-34 years old 86,77 13,23
35-44 years old 78,10 21,90
45-59 years old 73,01 26,99
60-64 years old 74,03 25,97
65+ years old 72,62 27,38
Place of residence
Cities > 500k 79,34 20,66
Towns 200-500k 80,06 19,94
Towns 100-200k 79,88 20,12
Towns 20-100k 78,13 21,87
Towns < 20k 79,31 20,69
Rural areas 77,18 22,82
Voivodship
Dolnośląskie 79,18 20,82
Kujawsko-pomorskie 76,52 23,48
Lubelskie 74,18 25,82
Lubuskie 73,98 26,02
Łódzkie 75,67 24,33
Małopolskie 79,37 20,63
Mazowieckie 79,50 20,50
Opolskie 76,57 23,43
Podkarpackie 80,15 19,85
Podlaskie 76,11 23,89
Pomorskie 83,66 16,34
Śląskie 79,80 20,20
Świętokrzyskie 72,32 27,68
Warmińsko-mazurskie 78,54 21,46
Wielkopolskie 80,93 19,07
Zachodniopomorskie 76,36 23,64
Education
Primary and below 66,76 33,24
Vocational 76,21 23,79
Secondary 81,69 18,31
Tertiary/post-secondary 87,74 12,26
Income per capita
First quartile 67,76 32,24
Middle 50% 76,57 23,43
Fourth quartile 86,13 13,87
Social-professional status
Public sector employees 85,81 14,19
Private sector employees 81,51 18,49
Self-employed 84,88 15,12
Farmers 78,56 21,44
Disability pensioners 63,20 36,80
Retirees 75,33 24,67
Students 88,22 11,78
Unemployed 63,50 36,50
Other professionally inactive 75,12 24,88
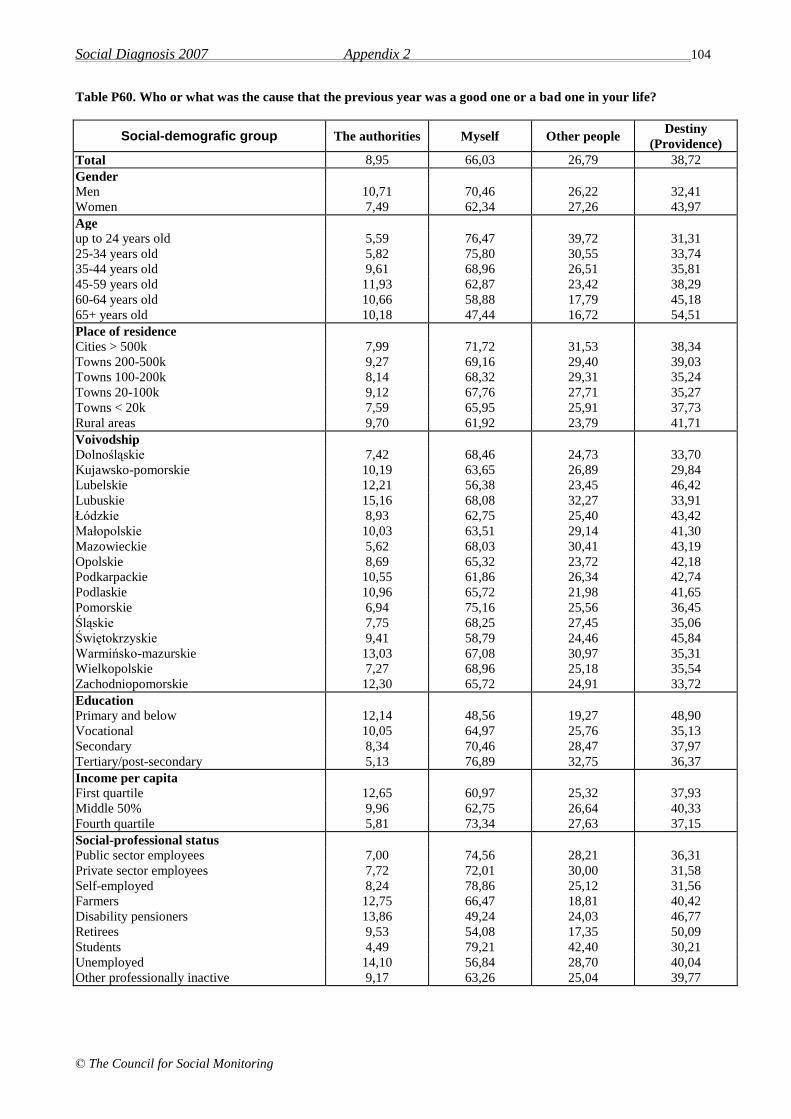
Social Diagnosis 2007 Appendix 2 104
© The Council for Social Monitoring
Table P60. Who or what was the cause that the previous year was a good one or a bad one in your life?
Social-demografic group The authorities Myself Other people Destiny
(Providence)
Total 8,95 66,03 26,79 38,72
Gender
Men 10,71 70,46 26,22 32,41
Women 7,49 62,34 27,26 43,97
Age
up to 24 years old 5,59 76,47 39,72 31,31
25-34 years old 5,82 75,80 30,55 33,74
35-44 years old 9,61 68,96 26,51 35,81
45-59 years old 11,93 62,87 23,42 38,29
60-64 years old 10,66 58,88 17,79 45,18
65+ years old 10,18 47,44 16,72 54,51
Place of residence
Cities > 500k 7,99 71,72 31,53 38,34
Towns 200-500k 9,27 69,16 29,40 39,03
Towns 100-200k 8,14 68,32 29,31 35,24
Towns 20-100k 9,12 67,76 27,71 35,27
Towns < 20k 7,59 65,95 25,91 37,73
Rural areas 9,70 61,92 23,79 41,71
Voivodship
Dolnośląskie 7,42 68,46 24,73 33,70
Kujawsko-pomorskie 10,19 63,65 26,89 29,84
Lubelskie 12,21 56,38 23,45 46,42
Lubuskie 15,16 68,08 32,27 33,91
Łódzkie 8,93 62,75 25,40 43,42
Małopolskie 10,03 63,51 29,14 41,30
Mazowieckie 5,62 68,03 30,41 43,19
Opolskie 8,69 65,32 23,72 42,18
Podkarpackie 10,55 61,86 26,34 42,74
Podlaskie 10,96 65,72 21,98 41,65
Pomorskie 6,94 75,16 25,56 36,45
Śląskie 7,75 68,25 27,45 35,06
Świętokrzyskie 9,41 58,79 24,46 45,84
Warmińsko-mazurskie 13,03 67,08 30,97 35,31
Wielkopolskie 7,27 68,96 25,18 35,54
Zachodniopomorskie 12,30 65,72 24,91 33,72
Education
Primary and below 12,14 48,56 19,27 48,90
Vocational 10,05 64,97 25,76 35,13
Secondary 8,34 70,46 28,47 37,97
Tertiary/post-secondary 5,13 76,89 32,75 36,37
Income per capita
First quartile 12,65 60,97 25,32 37,93
Middle 50% 9,96 62,75 26,64 40,33
Fourth quartile 5,81 73,34 27,63 37,15
Social-professional status
Public sector employees 7,00 74,56 28,21 36,31
Private sector employees 7,72 72,01 30,00 31,58
Self-employed 8,24 78,86 25,12 31,56
Farmers 12,75 66,47 18,81 40,42
Disability pensioners 13,86 49,24 24,03 46,77
Retirees 9,53 54,08 17,35 50,09
Students 4,49 79,21 42,40 30,21
Unemployed 14,10 56,84 28,70 40,04
Other professionally inactive 9,17 63,26 25,04 39,77

Social Diagnosis 2007 Appendix 2 105
© The Council for Social Monitoring
Table 61.1. To what extent are you satisfied with your relations with close family members
Social-demografic group very
satisfied satisfied
quite
satisfied
rather
unsatisfied unsatisfied
very
unsatisfied
Total 2,28 17,03 32,30 21,87 17,62 8,91
Gender
Men 2,26 17,35 33,16 21,02 17,05 9,17
Women 2,35 16,77 31,54 22,55 18,10 8,69
Age
up to 24 years old 4,75 23,29 33,60 19,36 12,89 6,11
25-34 years old 3,69 21,50 35,92 19,24 12,78 6,87
35-44 years old 1,53 13,15 33,40 24,45 18,41 9,05
45-59 years old 1,12 14,48 29,93 23,39 20,54 10,54
60-64 years old 1,04 15,03 31,09 22,63 20,03 10,19
65+ years old 0,99 13,25 29,58 22,41 22,41 11,36
Place of residence
Cities > 500k 3,89 18,27 33,02 22,23 12,84 9,76
Towns 200-500k 2,73 18,78 32,80 20,67 16,68 8,34
Towns 100-200k 1,99 18,67 36,44 20,26 16,39 6,26
Towns 20-100k 2,32 16,21 31,60 22,42 17,95 9,50
Towns < 20k 2,28 16,57 30,74 22,71 19,04 8,67
Rural areas 1,79 16,35 31,86 21,87 18,93 9,20
Voivodship
Dolnośląskie 1,73 18,23 31,47 21,38 18,33 8,86
Kujawsko-pomorskie 4,25 18,11 30,39 21,89 17,01 8,35
Lubelskie 1,51 14,79 29,86 22,47 20,82 10,55
Lubuskie 2,05 14,96 29,03 21,70 21,41 10,85
Łódzkie 2,14 13,64 32,50 24,79 18,39 8,54
Małopolskie 2,82 17,67 31,17 20,87 17,18 10,29
Mazowieckie 3,03 16,75 33,37 20,51 15,84 10,50
Opolskie 1,17 18,13 32,16 23,10 19,59 5,85
Podkarpackie 0,91 15,11 30,51 22,05 20,85 10,57
Podlaskie 2,24 16,42 28,36 23,63 21,14 8,21
Pomorskie 4,40 19,43 35,32 21,42 13,76 5,67
Śląskie 2,04 17,68 37,40 20,61 16,09 6,17
Świętokrzyskie 0,75 12,03 28,57 26,32 19,55 12,78
Warmińsko-mazurskie 1,66 17,18 24,43 23,40 19,25 14,08
Wielkopolskie 1,65 20,50 36,03 21,78 14,43 5,61
Zachodniopomorskie 2,33 16,46 28,80 20,93 20,39 11,09
Education
Primary and below 1,02 11,71 27,27 22,45 23,66 13,89
Vocational 2,16 17,61 31,78 21,50 18,16 8,79
Secondary 2,48 17,42 32,94 22,19 17,08 7,89
Tertiary/post-secondary 3,44 20,31 36,68 21,29 12,04 6,23
Income per capita
First quartile 1,58 13,17 26,25 22,34 23,44 13,21
Middle 50% 1,92 15,25 31,27 23,88 18,11 9,59
Fourth quartile 3,47 20,88 36,58 19,65 13,81 5,61
Social-professional status
Public sector employees 2,42 18,56 36,79 22,68 14,00 5,55
Private sector employees 2,45 18,01 34,75 21,43 16,01 7,35
Self-employed 3,10 22,99 39,60 17,70 11,68 4,93
Farmers 2,03 15,63 30,94 22,81 18,59 10,00
Disability pensioners 1,23 11,44 24,41 23,49 24,41 15,02
Retirees 0,97 14,51 31,45 22,59 20,29 10,19
Students 5,59 24,66 34,43 18,63 11,55 5,14
Unemployed 1,97 11,15 21,25 24,85 24,62 16,14
Other professionally inactive 1,52 15,42 29,79 21,50 20,79 10,98

Social Diagnosis 2007 Appendix 2 106
© The Council for Social Monitoring
Table 61.2. To what extent are you satisfied with the financial situation of your family
Social-demografic group very
satisfied satisfied
quite
satisfied
rather
unsatisfied unsatisfied
very
unsatisfied
Total 3,03 21,91 34,23 15,38 16,87 8,58
Gender
Men 3,18 22,72 34,11 15,17 16,30 8,51
Women 2,91 21,24 34,33 15,56 17,33 8,63
Age
up to 24 years old 3,87 22,65 37,64 14,44 14,11 7,29
25-34 years old 4,43 24,03 38,24 15,05 13,45 4,81
35-44 years old 2,34 20,02 34,39 15,59 16,71 10,95
45-59 years old 2,00 21,14 30,91 15,16 20,34 10,45
60-64 years old 2,90 20,99 34,47 16,72 15,70 9,22
65+ years old 2,86 22,06 31,33 16,59 18,40 8,77
Place of residence
Cities > 500k 1,88 21,13 37,63 15,05 17,08 7,24
Towns 200-500k 2,66 24,18 37,74 13,14 15,09 7,20
Towns 100-200k 2,54 23,39 36,20 15,07 16,14 6,65
Towns 20-100k 3,19 22,36 34,34 14,25 16,55 9,32
Towns < 20k 3,09 22,18 32,64 15,75 17,20 9,14
Rural areas 3,49 20,77 32,17 16,74 17,59 9,24
Voivodship
Dolnośląskie 2,83 19,72 35,79 15,27 16,89 9,50
Kujawsko-pomorskie 2,36 21,86 33,49 12,26 19,81 10,22
Lubelskie 2,47 21,02 33,52 16,90 17,72 8,38
Lubuskie 3,50 17,78 31,20 13,12 21,57 12,83
Łódzkie 1,88 18,80 34,31 15,86 20,80 8,34
Małopolskie 3,85 22,69 31,35 15,58 16,54 10,00
Mazowieckie 3,00 21,48 35,75 14,76 15,48 9,54
Opolskie 2,35 28,74 31,96 14,08 15,84 7,04
Podkarpackie 1,20 22,07 32,28 15,77 20,57 8,11
Podlaskie 3,73 20,90 33,33 17,41 17,91 6,72
Pomorskie 4,84 25,21 36,04 15,67 11,11 7,12
Śląskie 3,13 24,25 36,44 16,19 13,38 6,63
Świętokrzyskie 1,79 20,66 30,87 17,09 18,88 10,71
Warmińsko-mazurskie 2,64 21,54 31,50 14,02 19,11 11,18
Wielkopolskie 3,43 22,91 37,76 15,68 15,12 5,10
Zachodniopomorskie 4,81 18,89 29,59 14,97 21,03 10,70
Education
Primary and below 2,48 16,76 27,31 17,35 21,99 14,11
Vocational 3,14 21,05 30,83 15,92 18,78 10,28
Secondary 2,98 22,26 37,08 15,15 15,66 6,86
Tertiary/post-secondary 3,51 27,53 41,82 12,98 10,82 3,34
Income per capita
First quartile 1,45 9,87 21,98 19,03 27,84 19,82
Middle 50% 2,38 17,76 34,84 17,86 18,37 8,78
Fourth quartile 5,00 33,92 39,73 10,45 8,81 2,09
Social-professional status
Public sector employees 3,19 23,49 39,44 14,85 13,53 5,50
Private sector employees 2,97 22,05 38,08 14,62 15,69 6,60
Self-employed 4,91 33,45 37,64 12,18 7,27 4,55
Farmers 3,62 19,81 33,18 16,35 18,08 8,96
Disability pensioners 1,52 16,82 26,55 15,91 24,21 14,99
Retirees 2,84 22,36 33,54 16,79 16,79 7,67
Students 4,03 25,70 37,11 13,76 13,76 5,63
Unemployed 1,85 13,33 21,44 16,92 25,49 20,97
Other professionally inactive 3,26 19,56 28,29 16,53 21,07 11,29

Social Diagnosis 2007 Appendix 2 107
© The Council for Social Monitoring
Table 61.3. To what extent are you satisfied with your relations with colleagues (a group of friends)
Social-demografic group very
satisfied satisfied
quite
satisfied
rather
unsatisfied unsatisfied
very
unsatisfied
Total 11,29 46,97 33,88 4,85 2,29 0,71
Gender
Men 10,51 46,54 35,08 5,23 2,00 0,64
Women 11,93 47,37 32,87 4,53 2,53 0,77
Age
up to 24 years old 21,98 51,78 21,84 2,97 1,21 0,22
25-34 years old 12,09 51,47 30,71 3,66 1,60 0,46
35-44 years old 8,84 45,73 37,87 5,19 1,85 0,51
45-59 years old 7,46 44,81 38,10 5,48 2,98 1,17
60-64 years old 6,85 47,28 37,43 5,10 2,46 0,88
65+ years old 8,09 40,55 39,78 7,20 3,49 0,89
Place of residence
Cities > 500k 12,29 49,14 31,65 3,80 2,38 0,74
Towns 200-500k 12,54 48,08 32,12 4,34 2,28 0,64
Towns 100-200k 12,21 46,05 34,43 3,90 2,70 0,70
Towns 20-100k 11,88 47,69 32,57 4,83 2,34 0,70
Towns < 20k 11,20 46,59 34,81 4,63 2,32 0,45
Rural areas 10,08 45,96 35,39 5,64 2,13 0,80
Voivodship
Dolnośląskie 11,28 49,69 32,92 3,52 1,45 1,14
Kujawsko-pomorskie 11,63 48,79 31,99 4,68 2,26 0,65
Lubelskie 9,00 45,71 34,46 5,91 3,52 1,41
Lubuskie 9,91 46,85 33,93 4,80 3,60 0,90
Łódzkie 8,19 47,98 36,46 4,16 2,97 0,24
Małopolskie 13,77 47,39 30,19 6,00 1,87 0,79
Mazowieckie 10,99 46,28 35,04 5,19 2,14 0,37
Opolskie 11,64 51,34 29,55 3,88 2,69 0,90
Podkarpackie 10,41 48,70 32,62 4,59 2,76 0,92
Podlaskie 9,80 40,70 40,45 6,28 1,76 1,01
Pomorskie 11,95 51,46 29,15 5,10 2,04 0,29
Śląskie 13,66 44,52 34,70 3,98 2,44 0,71
Świętokrzyskie 9,77 48,07 33,68 5,40 2,31 0,77
Warmińsko-mazurskie 10,95 39,67 40,29 5,37 3,10 0,62
Wielkopolskie 10,50 49,30 34,30 3,84 1,31 0,75
Zachodniopomorskie 13,14 43,98 33,03 7,12 2,19 0,55
Education
Primary and below 7,75 38,93 39,70 8,61 3,66 1,35
Vocational 12,35 47,86 32,03 4,58 2,47 0,71
Secondary 11,80 48,32 33,47 3,95 1,96 0,49
Tertiary/post-secondary 11,73 50,45 32,60 3,44 1,27 0,51
Income per capita
First quartile 11,76 45,35 33,41 6,37 2,32 0,80
Middle 50% 10,98 46,19 34,23 5,12 2,66 0,82
Fourth quartile 11,64 48,79 33,52 3,89 1,73 0,43
Social-professional status
Public sector employees 10,93 50,44 33,74 2,80 1,65 0,44
Private sector employees 10,52 49,36 33,94 3,97 1,62 0,59
Self-employed 12,15 44,01 37,38 4,79 1,10 0,55
Farmers 6,85 44,11 41,08 4,94 2,07 0,96
Disability pensioners 8,06 41,89 34,89 8,80 4,67 1,70
Retirees 7,50 43,28 39,82 5,82 2,82 0,76
Students 25,24 52,40 18,30 3,10 0,89 0,07
Unemployed 10,85 44,22 33,37 7,19 3,42 0,94
Other professionally inactive 9,60 45,86 34,09 5,64 3,72 1,08

Social Diagnosis 2007 Appendix 2 108
© The Council for Social Monitoring
Table 61.4. To what extent are you satisfied with the present income of your family
Social-demografic group very
satisfied satisfied
quite
satisfied
rather
unsatisfied unsatisfied
very
unsatisfied
Total 2,46 18,98 32,75 17,34 17,50 10,96
Gender
Men 2,68 19,25 32,80 17,50 16,88 10,89
Women 2,29 18,75 32,72 17,21 18,02 11,02
Age
up to 24 years old 3,38 21,85 35,74 15,77 13,99 9,28
25-34 years old 3,79 21,96 37,31 15,77 14,80 6,37
35-44 years old 2,14 16,19 32,28 18,58 16,55 14,26
45-59 years old 1,45 17,76 29,45 16,94 21,39 13,01
60-64 years old 1,85 18,38 32,72 20,07 15,51 11,47
65+ years old 2,17 17,23 30,18 19,60 19,55 11,28
Place of residence
Cities > 500k 1,52 17,76 35,23 16,68 18,56 10,25
Towns 200-500k 3,13 20,61 35,86 15,67 15,11 9,61
Towns 100-200k 1,97 20,55 36,09 16,72 16,22 8,46
Towns 20-100k 2,71 19,59 32,88 16,40 16,24 12,20
Towns < 20k 2,36 20,05 31,38 17,76 17,70 10,76
Rural areas 2,56 17,77 30,69 18,57 18,85 11,56
Voivodship
Dolnośląskie 2,63 18,03 31,91 17,33 18,54 11,55
Kujawsko-pomorskie 2,52 17,64 31,34 15,43 19,53 13,54
Lubelskie 1,91 18,69 30,15 20,19 18,96 10,10
Lubuskie 3,51 12,57 28,07 19,01 21,93 14,91
Łódzkie 1,18 16,80 31,84 16,57 20,80 12,81
Małopolskie 2,68 17,97 30,50 18,55 16,54 13,77
Mazowieckie 2,69 19,13 34,73 15,54 17,10 10,82
Opolskie 2,03 24,13 32,85 15,41 15,99 9,59
Podkarpackie 0,60 19,40 30,38 15,19 23,91 10,53
Podlaskie 3,96 16,09 31,68 20,54 17,82 9,90
Pomorskie 4,40 22,44 35,09 16,19 13,35 8,52
Śląskie 2,46 21,30 37,30 17,77 12,67 8,51
Świętokrzyskie 1,51 18,34 28,64 19,60 19,10 12,81
Warmińsko-mazurskie 2,02 17,00 29,96 19,03 18,83 13,16
Wielkopolskie 2,04 20,17 36,15 18,59 15,33 7,71
Zachodniopomorskie 3,92 18,54 28,34 15,33 20,68 13,19
Education
Primary and below 1,89 14,15 25,46 19,02 22,26 17,21
Vocational 2,61 18,25 29,62 17,82 19,00 12,70
Secondary 2,45 19,73 35,12 16,62 16,79 9,29
Tertiary/post-secondary 2,79 23,44 41,05 16,17 11,66 4,90
Income per capita
First quartile 1,05 8,11 19,54 19,50 26,51 25,28
Middle 50% 2,05 15,11 32,53 19,47 19,95 10,90
Fourth quartile 4,02 30,41 39,55 13,64 9,36 3,03
Social-professional status
Public sector employees 2,64 20,21 37,84 17,52 14,61 7,19
Private sector employees 2,17 19,67 35,99 17,08 16,29 8,80
Self-employed 5,13 31,14 37,91 13,37 7,33 5,13
Farmers 2,50 16,12 32,08 18,94 18,62 11,74
Disability pensioners 1,21 13,81 25,20 17,24 25,20 17,34
Retirees 1,83 18,66 31,69 19,40 18,15 10,27
Students 3,93 23,73 35,83 14,97 13,68 7,86
Unemployed 2,21 10,96 20,86 17,37 24,48 24,13
Other professionally inactive 2,58 16,06 27,32 16,88 21,45 15,71
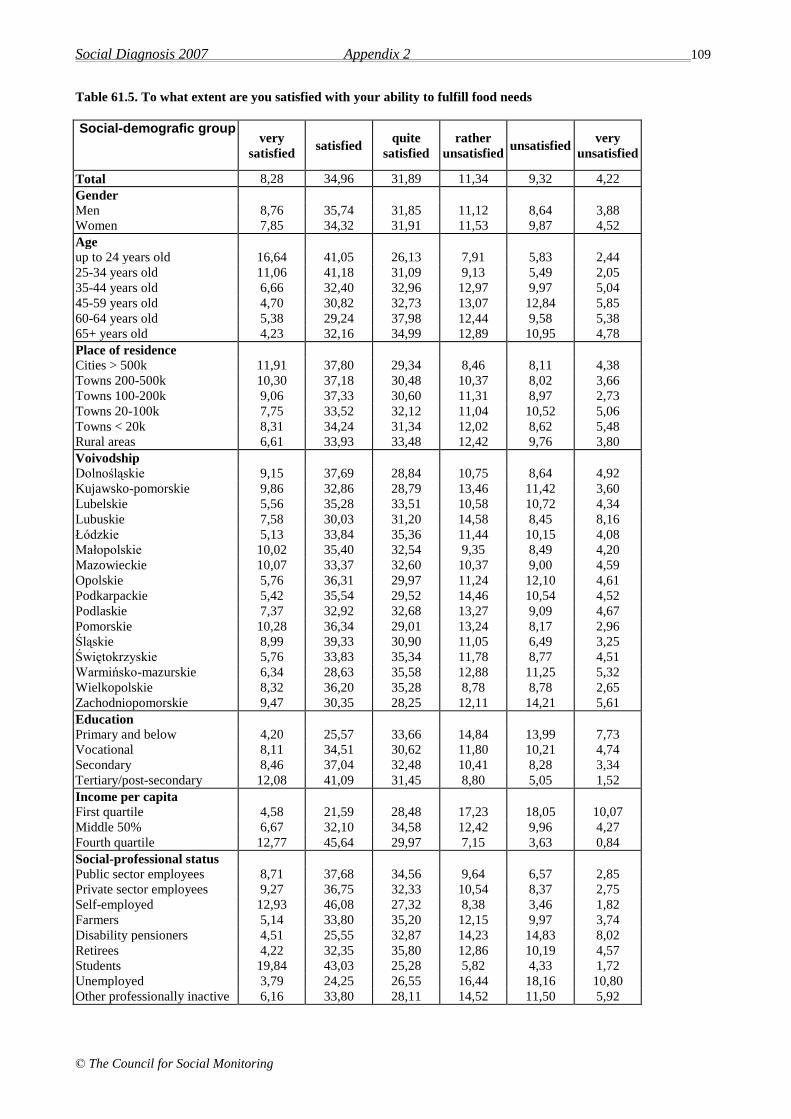
Social Diagnosis 2007 Appendix 2 109
© The Council for Social Monitoring
Table 61.5. To what extent are you satisfied with your ability to fulfill food needs
Social-demografic group very
satisfied satisfied
quite
satisfied
rather
unsatisfied unsatisfied
very
unsatisfied
Total 8,28 34,96 31,89 11,34 9,32 4,22
Gender
Men 8,76 35,74 31,85 11,12 8,64 3,88
Women 7,85 34,32 31,91 11,53 9,87 4,52
Age
up to 24 years old 16,64 41,05 26,13 7,91 5,83 2,44
25-34 years old 11,06 41,18 31,09 9,13 5,49 2,05
35-44 years old 6,66 32,40 32,96 12,97 9,97 5,04
45-59 years old 4,70 30,82 32,73 13,07 12,84 5,85
60-64 years old 5,38 29,24 37,98 12,44 9,58 5,38
65+ years old 4,23 32,16 34,99 12,89 10,95 4,78
Place of residence
Cities > 500k 11,91 37,80 29,34 8,46 8,11 4,38
Towns 200-500k 10,30 37,18 30,48 10,37 8,02 3,66
Towns 100-200k 9,06 37,33 30,60 11,31 8,97 2,73
Towns 20-100k 7,75 33,52 32,12 11,04 10,52 5,06
Towns < 20k 8,31 34,24 31,34 12,02 8,62 5,48
Rural areas 6,61 33,93 33,48 12,42 9,76 3,80
Voivodship
Dolnośląskie 9,15 37,69 28,84 10,75 8,64 4,92
Kujawsko-pomorskie 9,86 32,86 28,79 13,46 11,42 3,60
Lubelskie 5,56 35,28 33,51 10,58 10,72 4,34
Lubuskie 7,58 30,03 31,20 14,58 8,45 8,16
Łódzkie 5,13 33,84 35,36 11,44 10,15 4,08
Małopolskie 10,02 35,40 32,54 9,35 8,49 4,20
Mazowieckie 10,07 33,37 32,60 10,37 9,00 4,59
Opolskie 5,76 36,31 29,97 11,24 12,10 4,61
Podkarpackie 5,42 35,54 29,52 14,46 10,54 4,52
Podlaskie 7,37 32,92 32,68 13,27 9,09 4,67
Pomorskie 10,28 36,34 29,01 13,24 8,17 2,96
Śląskie 8,99 39,33 30,90 11,05 6,49 3,25
Świętokrzyskie 5,76 33,83 35,34 11,78 8,77 4,51
Warmińsko-mazurskie 6,34 28,63 35,58 12,88 11,25 5,32
Wielkopolskie 8,32 36,20 35,28 8,78 8,78 2,65
Zachodniopomorskie 9,47 30,35 28,25 12,11 14,21 5,61
Education
Primary and below 4,20 25,57 33,66 14,84 13,99 7,73
Vocational 8,11 34,51 30,62 11,80 10,21 4,74
Secondary 8,46 37,04 32,48 10,41 8,28 3,34
Tertiary/post-secondary 12,08 41,09 31,45 8,80 5,05 1,52
Income per capita
First quartile 4,58 21,59 28,48 17,23 18,05 10,07
Middle 50% 6,67 32,10 34,58 12,42 9,96 4,27
Fourth quartile 12,77 45,64 29,97 7,15 3,63 0,84
Social-professional status
Public sector employees 8,71 37,68 34,56 9,64 6,57 2,85
Private sector employees 9,27 36,75 32,33 10,54 8,37 2,75
Self-employed 12,93 46,08 27,32 8,38 3,46 1,82
Farmers 5,14 33,80 35,20 12,15 9,97 3,74
Disability pensioners 4,51 25,55 32,87 14,23 14,83 8,02
Retirees 4,22 32,35 35,80 12,86 10,19 4,57
Students 19,84 43,03 25,28 5,82 4,33 1,72
Unemployed 3,79 24,25 26,55 16,44 18,16 10,80
Other professionally inactive 6,16 33,80 28,11 14,52 11,50 5,92
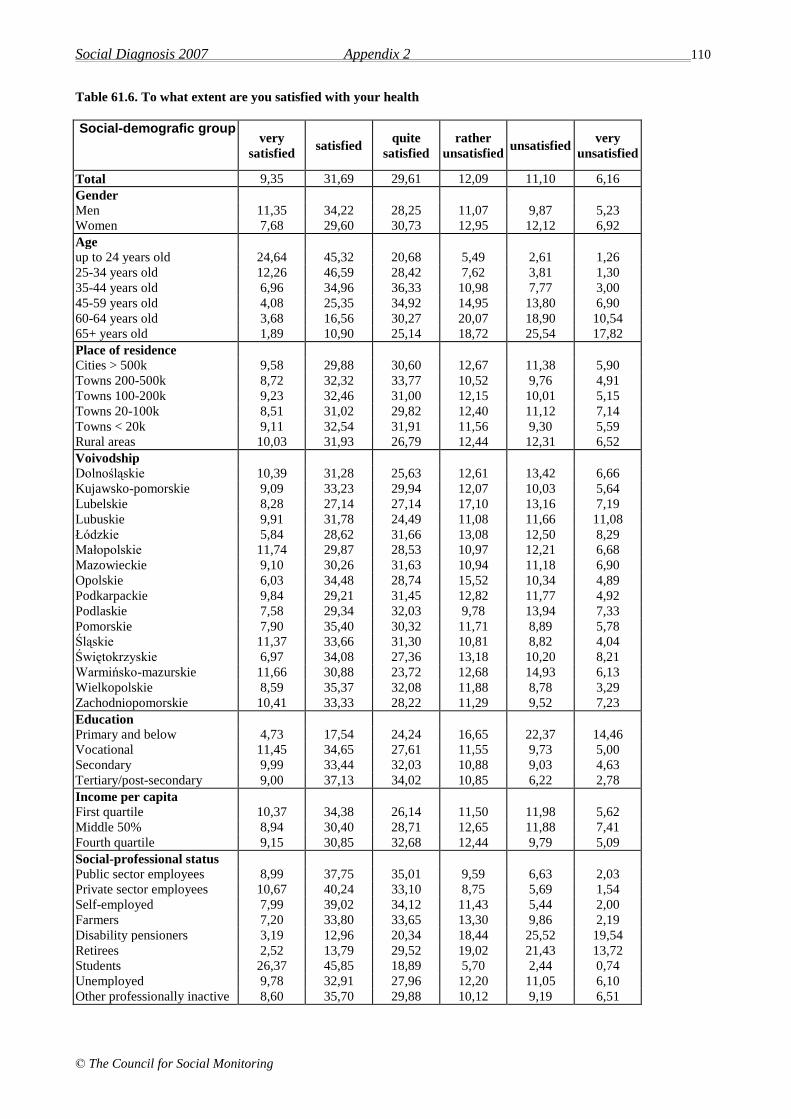
Social Diagnosis 2007 Appendix 2 110
© The Council for Social Monitoring
Table 61.6. To what extent are you satisfied with your health
Social-demografic group very
satisfied satisfied
quite
satisfied
rather
unsatisfied unsatisfied
very
unsatisfied
Total 9,35 31,69 29,61 12,09 11,10 6,16
Gender
Men 11,35 34,22 28,25 11,07 9,87 5,23
Women 7,68 29,60 30,73 12,95 12,12 6,92
Age
up to 24 years old 24,64 45,32 20,68 5,49 2,61 1,26
25-34 years old 12,26 46,59 28,42 7,62 3,81 1,30
35-44 years old 6,96 34,96 36,33 10,98 7,77 3,00
45-59 years old 4,08 25,35 34,92 14,95 13,80 6,90
60-64 years old 3,68 16,56 30,27 20,07 18,90 10,54
65+ years old 1,89 10,90 25,14 18,72 25,54 17,82
Place of residence
Cities > 500k 9,58 29,88 30,60 12,67 11,38 5,90
Towns 200-500k 8,72 32,32 33,77 10,52 9,76 4,91
Towns 100-200k 9,23 32,46 31,00 12,15 10,01 5,15
Towns 20-100k 8,51 31,02 29,82 12,40 11,12 7,14
Towns < 20k 9,11 32,54 31,91 11,56 9,30 5,59
Rural areas 10,03 31,93 26,79 12,44 12,31 6,52
Voivodship
Dolnośląskie 10,39 31,28 25,63 12,61 13,42 6,66
Kujawsko-pomorskie 9,09 33,23 29,94 12,07 10,03 5,64
Lubelskie 8,28 27,14 27,14 17,10 13,16 7,19
Lubuskie 9,91 31,78 24,49 11,08 11,66 11,08
Łódzkie 5,84 28,62 31,66 13,08 12,50 8,29
Małopolskie 11,74 29,87 28,53 10,97 12,21 6,68
Mazowieckie 9,10 30,26 31,63 10,94 11,18 6,90
Opolskie 6,03 34,48 28,74 15,52 10,34 4,89
Podkarpackie 9,84 29,21 31,45 12,82 11,77 4,92
Podlaskie 7,58 29,34 32,03 9,78 13,94 7,33
Pomorskie 7,90 35,40 30,32 11,71 8,89 5,78
Śląskie 11,37 33,66 31,30 10,81 8,82 4,04
Świętokrzyskie 6,97 34,08 27,36 13,18 10,20 8,21
Warmińsko-mazurskie 11,66 30,88 23,72 12,68 14,93 6,13
Wielkopolskie 8,59 35,37 32,08 11,88 8,78 3,29
Zachodniopomorskie 10,41 33,33 28,22 11,29 9,52 7,23
Education
Primary and below 4,73 17,54 24,24 16,65 22,37 14,46
Vocational 11,45 34,65 27,61 11,55 9,73 5,00
Secondary 9,99 33,44 32,03 10,88 9,03 4,63
Tertiary/post-secondary 9,00 37,13 34,02 10,85 6,22 2,78
Income per capita
First quartile 10,37 34,38 26,14 11,50 11,98 5,62
Middle 50% 8,94 30,40 28,71 12,65 11,88 7,41
Fourth quartile 9,15 30,85 32,68 12,44 9,79 5,09
Social-professional status
Public sector employees 8,99 37,75 35,01 9,59 6,63 2,03
Private sector employees 10,67 40,24 33,10 8,75 5,69 1,54
Self-employed 7,99 39,02 34,12 11,43 5,44 2,00
Farmers 7,20 33,80 33,65 13,30 9,86 2,19
Disability pensioners 3,19 12,96 20,34 18,44 25,52 19,54
Retirees 2,52 13,79 29,52 19,02 21,43 13,72
Students 26,37 45,85 18,89 5,70 2,44 0,74
Unemployed 9,78 32,91 27,96 12,20 11,05 6,10
Other professionally inactive 8,60 35,70 29,88 10,12 9,19 6,51
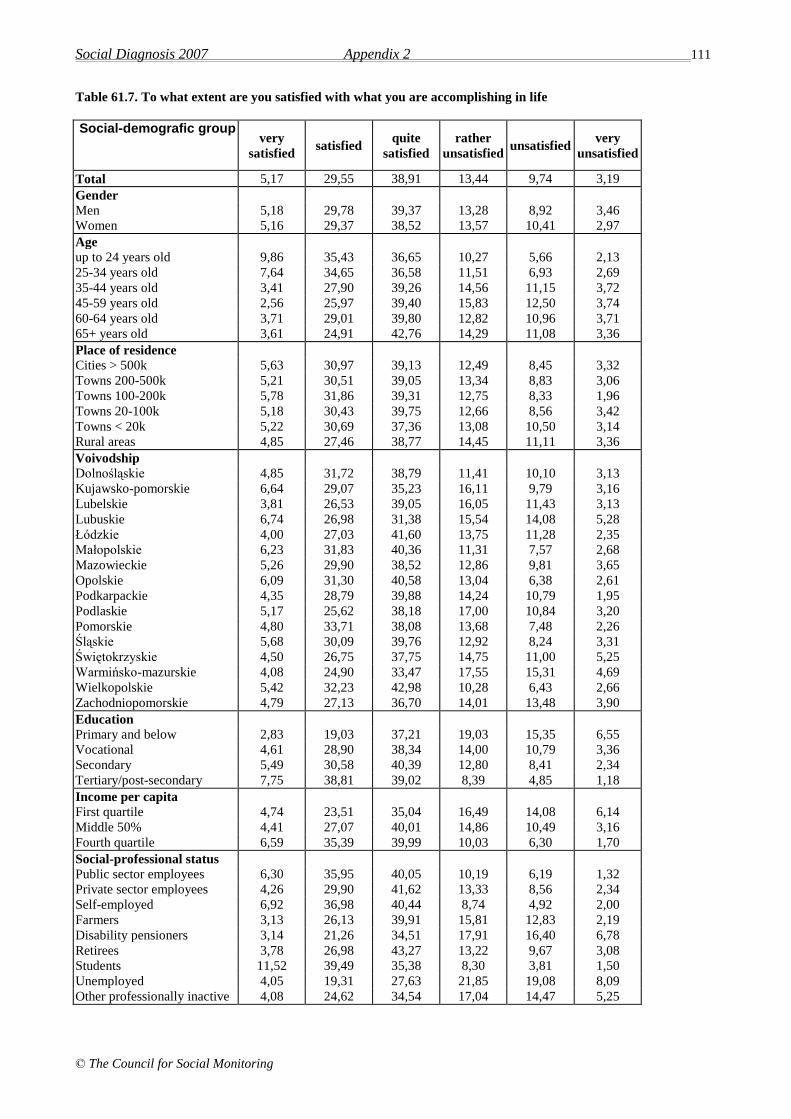
Social Diagnosis 2007 Appendix 2 111
© The Council for Social Monitoring
Table 61.7. To what extent are you satisfied with what you are accomplishing in life
Social-demografic group very
satisfied satisfied
quite
satisfied
rather
unsatisfied unsatisfied
very
unsatisfied
Total 5,17 29,55 38,91 13,44 9,74 3,19
Gender
Men 5,18 29,78 39,37 13,28 8,92 3,46
Women 5,16 29,37 38,52 13,57 10,41 2,97
Age
up to 24 years old 9,86 35,43 36,65 10,27 5,66 2,13
25-34 years old 7,64 34,65 36,58 11,51 6,93 2,69
35-44 years old 3,41 27,90 39,26 14,56 11,15 3,72
45-59 years old 2,56 25,97 39,40 15,83 12,50 3,74
60-64 years old 3,71 29,01 39,80 12,82 10,96 3,71
65+ years old 3,61 24,91 42,76 14,29 11,08 3,36
Place of residence
Cities > 500k 5,63 30,97 39,13 12,49 8,45 3,32
Towns 200-500k 5,21 30,51 39,05 13,34 8,83 3,06
Towns 100-200k 5,78 31,86 39,31 12,75 8,33 1,96
Towns 20-100k 5,18 30,43 39,75 12,66 8,56 3,42
Towns < 20k 5,22 30,69 37,36 13,08 10,50 3,14
Rural areas 4,85 27,46 38,77 14,45 11,11 3,36
Voivodship
Dolnośląskie 4,85 31,72 38,79 11,41 10,10 3,13
Kujawsko-pomorskie 6,64 29,07 35,23 16,11 9,79 3,16
Lubelskie 3,81 26,53 39,05 16,05 11,43 3,13
Lubuskie 6,74 26,98 31,38 15,54 14,08 5,28
Łódzkie 4,00 27,03 41,60 13,75 11,28 2,35
Małopolskie 6,23 31,83 40,36 11,31 7,57 2,68
Mazowieckie 5,26 29,90 38,52 12,86 9,81 3,65
Opolskie 6,09 31,30 40,58 13,04 6,38 2,61
Podkarpackie 4,35 28,79 39,88 14,24 10,79 1,95
Podlaskie 5,17 25,62 38,18 17,00 10,84 3,20
Pomorskie 4,80 33,71 38,08 13,68 7,48 2,26
Śląskie 5,68 30,09 39,76 12,92 8,24 3,31
Świętokrzyskie 4,50 26,75 37,75 14,75 11,00 5,25
Warmińsko-mazurskie 4,08 24,90 33,47 17,55 15,31 4,69
Wielkopolskie 5,42 32,23 42,98 10,28 6,43 2,66
Zachodniopomorskie 4,79 27,13 36,70 14,01 13,48 3,90
Education
Primary and below 2,83 19,03 37,21 19,03 15,35 6,55
Vocational 4,61 28,90 38,34 14,00 10,79 3,36
Secondary 5,49 30,58 40,39 12,80 8,41 2,34
Tertiary/post-secondary 7,75 38,81 39,02 8,39 4,85 1,18
Income per capita
First quartile 4,74 23,51 35,04 16,49 14,08 6,14
Middle 50% 4,41 27,07 40,01 14,86 10,49 3,16
Fourth quartile 6,59 35,39 39,99 10,03 6,30 1,70
Social-professional status
Public sector employees 6,30 35,95 40,05 10,19 6,19 1,32
Private sector employees 4,26 29,90 41,62 13,33 8,56 2,34
Self-employed 6,92 36,98 40,44 8,74 4,92 2,00
Farmers 3,13 26,13 39,91 15,81 12,83 2,19
Disability pensioners 3,14 21,26 34,51 17,91 16,40 6,78
Retirees 3,78 26,98 43,27 13,22 9,67 3,08
Students 11,52 39,49 35,38 8,30 3,81 1,50
Unemployed 4,05 19,31 27,63 21,85 19,08 8,09
Other professionally inactive 4,08 24,62 34,54 17,04 14,47 5,25

Social Diagnosis 2007 Appendix 2 112
© The Council for Social Monitoring
Table 61.8. To what extent are you satisfied with situation in the country
Social-demografic group very
satisfied satisfied
quite
satisfied
rather
unsatisfied unsatisfied
very
unsatisfied
Total 0,82 4,47 13,96 23,30 32,59 24,86
Gender
Men 0,85 4,95 14,75 23,05 31,14 25,27
Women 0,75 4,11 13,33 23,51 33,80 24,51
Age
up to 24 years old 1,10 5,51 17,03 25,48 27,04 23,83
25-34 years old 1,10 4,82 15,10 25,34 31,13 22,50
35-44 years old 0,77 3,99 13,52 24,22 32,67 24,83
45-59 years old 0,59 3,97 11,95 21,88 35,25 26,36
60-64 years old 0,34 4,22 13,01 21,96 35,81 24,66
65+ years old 0,60 4,38 13,44 20,38 34,83 26,37
Place of residence
Cities > 500k 0,66 3,79 12,67 22,87 30,88 29,13
Towns 200-500k 0,63 4,71 13,01 23,56 31,79 26,30
Towns 100-200k 0,50 4,36 15,74 23,56 31,09 24,75
Towns 20-100k 0,97 3,64 12,79 21,49 32,70 28,41
Towns < 20k 0,95 3,98 14,48 26,17 32,30 22,12
Rural areas 0,83 5,29 14,73 23,24 33,73 22,18
Voivodship
Dolnośląskie 0,82 4,18 12,33 22,12 33,23 27,32
Kujawsko-pomorskie 1,43 2,87 16,24 24,04 33,76 21,66
Lubelskie 1,37 4,66 15,09 23,46 31,28 24,14
Lubuskie 0,59 2,06 13,24 20,88 30,29 32,94
Łódzkie 0,94 3,88 10,94 22,24 37,29 24,71
Małopolskie 0,77 4,45 14,31 20,89 33,37 26,21
Mazowieckie 1,20 4,20 14,77 23,36 32,85 23,60
Opolskie 1,17 2,64 9,68 22,87 39,00 24,63
Podkarpackie 0,30 4,65 16,19 23,39 32,38 23,09
Podlaskie 1,24 3,72 13,65 24,81 33,25 23,33
Pomorskie 0,57 3,85 10,41 22,82 36,38 25,96
Śląskie 0,44 6,51 16,42 25,46 26,66 24,51
Świętokrzyskie 1,01 4,03 13,85 24,18 30,73 26,20
Warmińsko-mazurskie 0,82 6,75 11,45 22,70 31,70 26,58
Wielkopolskie 0,28 5,06 14,27 24,68 33,79 21,92
Zachodniopomorskie 0,72 3,41 14,00 22,44 31,60 27,83
Education
Primary and below 0,72 4,06 12,33 21,53 35,98 25,37
Vocational 0,88 5,83 14,28 22,56 33,01 23,44
Secondary 0,74 3,35 14,07 24,55 30,73 26,56
Tertiary/post-secondary 0,85 4,47 14,86 24,22 31,76 23,84
Income per capita
First quartile 0,80 4,64 12,19 22,44 33,83 26,10
Middle 50% 0,92 4,19 13,55 23,59 32,78 24,98
Fourth quartile 0,66 4,65 15,17 23,13 31,99 24,41
Social-professional status
Public sector employees 0,83 4,03 15,25 23,81 31,99 24,09
Private sector employees 0,80 4,52 14,46 24,24 31,57 24,41
Self-employed 0,55 4,98 16,61 24,91 29,15 23,80
Farmers 0,94 5,49 13,95 27,12 31,03 21,47
Disability pensioners 0,41 3,85 12,16 20,36 34,75 28,47
Retirees 0,70 3,99 12,94 20,95 35,57 25,84
Students 0,83 5,61 18,51 25,87 27,39 21,78
Unemployed 1,39 4,64 9,16 20,07 37,47 27,26
Other professionally inactive 0,82 4,55 10,97 24,74 32,44 26,49

Social Diagnosis 2007 Appendix 2 113
© The Council for Social Monitoring
Table 61.9. To what extent are you satisfied with housing conditions
Social-demografic group very
satisfied satisfied
quite
satisfied
rather
unsatisfied unsatisfied
very
unsatisfied
Total 9,32 41,10 29,49 8,52 7,05 4,53
Gender
Men 8,99 40,84 30,14 8,59 6,96 4,49
Women 9,60 41,28 28,97 8,47 7,09 4,59
Age
up to 24 years old 11,03 38,97 29,07 9,32 6,80 4,82
25-34 years old 9,09 36,13 30,09 10,18 8,59 5,91
35-44 years old 7,14 36,19 32,67 10,19 8,77 5,05
45-59 years old 10,06 42,58 29,35 7,54 6,45 4,02
60-64 years old 9,73 49,83 25,84 6,04 5,54 3,02
65+ years old 8,45 48,98 27,47 6,46 5,22 3,43
Place of residence
Cities > 500k 9,26 39,48 29,07 7,39 8,11 6,68
Towns 200-500k 7,25 40,44 31,54 9,80 6,42 4,55
Towns 100-200k 9,61 41,26 31,07 7,86 5,73 4,47
Towns 20-100k 9,68 41,77 29,72 8,67 5,66 4,50
Towns < 20k 10,60 39,81 29,97 8,15 7,27 4,20
Rural areas 9,28 41,79 28,34 8,66 7,86 4,08
Voivodship
Dolnośląskie 10,46 40,85 26,06 8,05 9,05 5,53
Kujawsko-pomorskie 10,57 35,96 31,86 9,31 6,78 5,52
Lubelskie 8,01 40,16 28,63 11,13 7,87 4,21
Lubuskie 7,58 35,57 32,94 8,75 10,20 4,96
Łódzkie 7,35 45,04 28,35 6,30 10,74 2,22
Małopolskie 11,03 42,86 26,94 7,00 7,57 4,60
Mazowieckie 9,72 38,98 31,04 8,35 6,99 4,92
Opolskie 11,21 44,25 28,74 6,61 5,17 4,02
Podkarpackie 8,33 41,22 29,46 11,16 6,40 3,42
Podlaskie 6,90 39,90 30,79 9,61 6,90 5,91
Pomorskie 12,75 41,93 28,90 8,64 4,82 2,97
Śląskie 9,16 42,06 31,21 8,16 4,80 4,61
Świętokrzyskie 7,20 40,45 30,02 8,68 9,18 4,47
Warmińsko-mazurskie 8,35 36,05 31,98 10,59 8,76 4,28
Wielkopolskie 8,97 46,02 28,27 7,87 4,03 4,85
Zachodniopomorskie 8,26 39,37 29,00 8,96 8,44 5,98
Education
Primary and below 6,80 38,39 29,75 9,22 9,04 6,80
Vocational 9,21 40,19 29,44 8,56 7,69 4,90
Secondary 9,97 41,85 30,30 8,13 5,90 3,85
Tertiary/post-secondary 10,84 43,85 27,97 8,44 5,96 2,94
Income per capita
First quartile 5,75 31,01 30,49 12,24 11,72 8,80
Middle 50% 8,55 40,78 30,82 8,62 6,98 4,25
Fourth quartile 11,97 47,72 27,28 6,22 4,25 2,56
Social-professional status
Public sector employees 9,97 41,02 28,81 9,75 6,63 3,83
Private sector employees 7,39 37,48 31,98 9,22 8,22 5,71
Self-employed 14,55 42,91 28,55 7,45 4,00 2,55
Farmers 7,84 37,30 34,95 8,78 7,37 3,76
Disability pensioners 8,18 41,52 30,84 7,39 7,19 4,89
Retirees 9,07 50,02 27,20 6,01 4,77 2,94
Students 13,18 41,08 28,42 8,59 5,18 3,55
Unemployed 8,05 32,76 27,70 11,26 12,53 7,70
Other professionally inactive 9,40 36,43 27,96 10,09 9,51 6,61

Social Diagnosis 2007 Appendix 2 114
© The Council for Social Monitoring
Table 61.10. To what extent are you satisfied with your place of residence
Social-demografic group very
satisfied satisfied
quite
satisfied
rather
unsatisfied unsatisfied
very
unsatisfied
Total 8,77 45,18 32,34 7,50 4,35 1,86
Gender
Men 8,75 44,40 32,87 7,95 4,36 1,68
Women 8,79 45,83 31,91 7,14 4,32 2,00
Age
up to 24 years old 11,73 38,52 32,00 9,98 5,39 2,38
25-34 years old 8,71 39,51 36,71 8,25 4,81 2,01
35-44 years old 5,23 41,31 36,53 9,65 5,23 2,03
45-59 years old 8,11 48,15 30,67 6,80 4,28 1,99
60-64 years old 9,41 51,60 30,25 4,87 2,35 1,51
65+ years old 9,99 56,18 26,88 3,73 2,48 0,75
Place of residence
Cities > 500k 13,85 47,99 26,76 5,31 4,45 1,65
Towns 200-500k 9,10 44,59 32,53 8,06 4,62 1,10
Towns 100-200k 8,86 46,93 31,55 7,11 3,51 2,04
Towns 20-100k 7,21 44,17 35,04 8,21 3,32 2,04
Towns < 20k 8,14 40,49 35,04 8,07 6,07 2,19
Rural areas 8,19 46,32 31,75 7,48 4,35 1,90
Voivodship
Dolnośląskie 11,46 49,55 24,72 7,64 4,72 1,91
Kujawsko-pomorskie 9,36 40,09 35,88 6,86 5,15 2,65
Lubelskie 7,07 43,34 30,84 11,28 5,98 1,49
Lubuskie 5,83 36,73 41,69 9,91 4,08 1,75
Łódzkie 5,48 44,76 34,62 8,39 4,90 1,86
Małopolskie 12,79 50,48 28,82 4,39 2,29 1,24
Mazowieckie 8,19 43,48 32,74 8,60 5,40 1,60
Opolskie 7,76 45,98 32,47 6,90 5,46 1,44
Podkarpackie 7,91 48,81 31,64 6,72 3,88 1,04
Podlaskie 8,60 41,77 34,64 8,35 4,91 1,72
Pomorskie 13,82 48,24 30,32 4,65 2,12 0,85
Śląskie 8,44 43,42 34,74 7,38 3,78 2,23
Świętokrzyskie 7,20 43,67 34,49 7,44 4,71 2,48
Warmińsko-mazurskie 7,54 44,40 31,98 7,33 4,68 4,07
Wielkopolskie 7,76 47,58 33,70 6,94 2,74 1,28
Zachodniopomorskie 7,22 42,61 30,81 8,63 7,04 3,70
Education
Primary and below 8,22 49,51 31,90 5,59 3,40 1,39
Vocational 8,95 45,08 31,83 7,48 4,55 2,11
Secondary 9,13 44,71 31,71 8,22 4,35 1,87
Tertiary/post-secondary 8,45 42,10 34,71 8,11 4,83 1,81
Income per capita
First quartile 7,00 39,59 34,98 9,60 5,82 3,00
Middle 50% 8,21 45,92 32,29 7,46 4,37 1,75
Fourth quartile 10,82 46,85 30,61 6,77 3,60 1,35
Social-professional status
Public sector employees 7,54 44,18 33,81 7,70 5,19 1,58
Private sector employees 7,90 41,07 35,65 8,96 4,77 1,65
Self-employed 9,07 43,38 32,49 8,35 3,45 3,27
Farmers 8,13 44,84 36,09 6,41 3,59 0,94
Disability pensioners 8,47 47,96 32,20 5,38 3,79 2,19
Retirees 9,60 54,99 27,98 4,18 2,28 0,97
Students 13,40 40,19 29,90 9,70 4,66 2,15
Unemployed 6,43 41,22 31,23 10,56 6,89 3,67
Other professionally inactive 7,85 41,69 33,14 8,43 6,00 2,89

Social Diagnosis 2007 Appendix 2 115
© The Council for Social Monitoring
Table 61.11. To what extent are you satisfied with goods and services you can get
Social-demografic group very
satisfied satisfied
quite
satisfied
rather
unsatisfied unsatisfied
very
unsatisfied
Total 4,56 35,78 39,02 11,57 6,81 2,26
Gender
Men 4,62 35,08 39,85 11,76 6,44 2,25
Women 4,53 36,34 38,30 11,43 7,12 2,28
Age
up to 24 years old 7,23 34,73 36,90 12,06 6,73 2,35
25-34 years old 5,32 36,73 40,00 10,27 6,00 1,68
35-44 years old 2,85 29,80 43,00 13,60 8,15 2,60
45-59 years old 3,53 35,32 38,85 12,34 7,30 2,65
60-64 years old 3,55 40,10 37,90 10,49 5,92 2,03
65+ years old 4,48 41,15 36,82 9,66 5,99 1,91
Place of residence
Cities > 500k 9,96 45,27 33,00 6,64 3,97 1,16
Towns 200-500k 5,48 40,94 38,31 9,51 4,44 1,32
Towns 100-200k 4,66 39,84 39,94 8,16 5,25 2,14
Towns 20-100k 4,18 36,07 41,29 10,78 5,31 2,37
Towns < 20k 3,59 32,39 41,65 12,79 7,56 2,02
Rural areas 3,21 31,38 38,66 14,50 9,30 2,95
Voivodship
Dolnośląskie 6,36 39,15 32,49 11,50 7,87 2,62
Kujawsko-pomorskie 5,68 29,65 43,53 11,83 7,57 1,74
Lubelskie 2,59 33,33 39,59 13,47 8,16 2,86
Lubuskie 4,09 28,65 45,32 11,70 7,02 3,22
Łódzkie 3,15 35,05 39,72 12,85 7,13 2,10
Małopolskie 6,70 41,95 36,21 9,00 4,50 1,63
Mazowieckie 5,34 34,63 37,70 12,18 7,44 2,70
Opolskie 2,01 40,23 39,66 8,62 7,18 2,30
Podkarpackie 2,41 35,34 41,20 12,63 7,22 1,20
Podlaskie 3,26 31,83 36,84 17,79 9,02 1,25
Pomorskie 6,52 40,43 39,15 8,37 3,97 1,56
Śląskie 4,81 37,63 41,13 9,56 4,44 2,44
Świętokrzyskie 2,74 31,67 40,65 12,72 8,23 3,99
Warmińsko-mazurskie 2,85 29,53 38,49 15,07 11,41 2,65
Wielkopolskie 4,11 38,26 40,27 9,95 5,84 1,55
Zachodniopomorskie 4,43 30,50 38,12 14,89 9,04 3,01
Education
Primary and below 2,75 32,55 38,60 13,54 9,12 3,43
Vocational 4,12 33,55 39,25 12,44 7,87 2,77
Secondary 5,31 36,89 39,02 11,25 5,76 1,78
Tertiary/post-secondary 5,80 40,58 38,98 8,92 4,67 1,05
Income per capita
First quartile 2,37 25,55 39,61 16,08 11,74 4,65
Middle 50% 4,20 34,48 39,97 12,60 6,63 2,12
Fourth quartile 6,44 42,90 37,31 7,87 4,37 1,10
Social-professional status
Public sector employees 4,05 36,99 40,71 11,84 5,04 1,37
Private sector employees 5,06 34,67 40,87 10,90 6,67 1,82
Self-employed 5,81 38,11 40,47 9,26 4,54 1,81
Farmers 2,69 30,02 38,70 17,06 8,37 3,16
Disability pensioners 3,32 34,34 38,67 10,67 9,47 3,52
Retirees 4,03 40,85 38,31 9,89 5,24 1,68
Students 8,24 36,15 35,49 11,95 5,86 2,30
Unemployed 3,00 28,26 37,25 15,34 11,65 4,50
Other professionally inactive 3,50 33,10 37,88 12,70 9,56 3,26
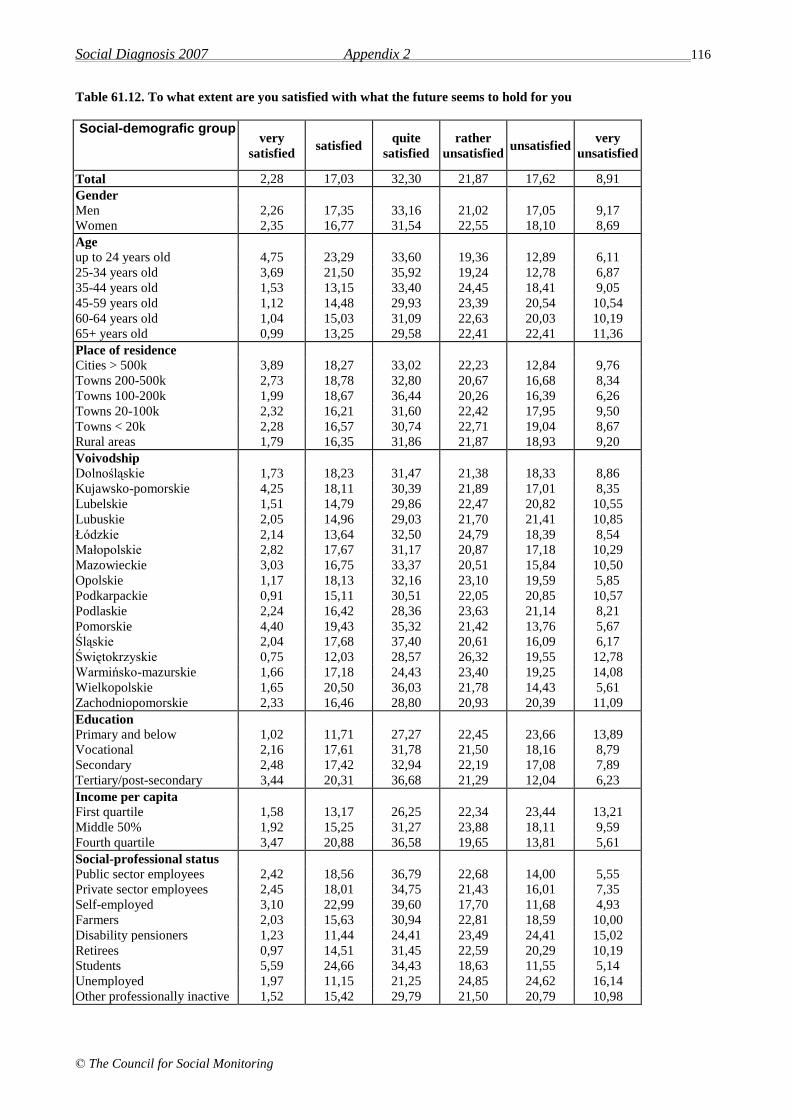
Social Diagnosis 2007 Appendix 2 116
© The Council for Social Monitoring
Table 61.12. To what extent are you satisfied with what the future seems to hold for you
Social-demografic group very
satisfied satisfied
quite
satisfied
rather
unsatisfied unsatisfied
very
unsatisfied
Total 2,28 17,03 32,30 21,87 17,62 8,91
Gender
Men 2,26 17,35 33,16 21,02 17,05 9,17
Women 2,35 16,77 31,54 22,55 18,10 8,69
Age
up to 24 years old 4,75 23,29 33,60 19,36 12,89 6,11
25-34 years old 3,69 21,50 35,92 19,24 12,78 6,87
35-44 years old 1,53 13,15 33,40 24,45 18,41 9,05
45-59 years old 1,12 14,48 29,93 23,39 20,54 10,54
60-64 years old 1,04 15,03 31,09 22,63 20,03 10,19
65+ years old 0,99 13,25 29,58 22,41 22,41 11,36
Place of residence
Cities > 500k 3,89 18,27 33,02 22,23 12,84 9,76
Towns 200-500k 2,73 18,78 32,80 20,67 16,68 8,34
Towns 100-200k 1,99 18,67 36,44 20,26 16,39 6,26
Towns 20-100k 2,32 16,21 31,60 22,42 17,95 9,50
Towns < 20k 2,28 16,57 30,74 22,71 19,04 8,67
Rural areas 1,79 16,35 31,86 21,87 18,93 9,20
Voivodship
Dolnośląskie 1,73 18,23 31,47 21,38 18,33 8,86
Kujawsko-pomorskie 4,25 18,11 30,39 21,89 17,01 8,35
Lubelskie 1,51 14,79 29,86 22,47 20,82 10,55
Lubuskie 2,05 14,96 29,03 21,70 21,41 10,85
Łódzkie 2,14 13,64 32,50 24,79 18,39 8,54
Małopolskie 2,82 17,67 31,17 20,87 17,18 10,29
Mazowieckie 3,03 16,75 33,37 20,51 15,84 10,50
Opolskie 1,17 18,13 32,16 23,10 19,59 5,85
Podkarpackie 0,91 15,11 30,51 22,05 20,85 10,57
Podlaskie 2,24 16,42 28,36 23,63 21,14 8,21
Pomorskie 4,40 19,43 35,32 21,42 13,76 5,67
Śląskie 2,04 17,68 37,40 20,61 16,09 6,17
Świętokrzyskie 0,75 12,03 28,57 26,32 19,55 12,78
Warmińsko-mazurskie 1,66 17,18 24,43 23,40 19,25 14,08
Wielkopolskie 1,65 20,50 36,03 21,78 14,43 5,61
Zachodniopomorskie 2,33 16,46 28,80 20,93 20,39 11,09
Education
Primary and below 1,02 11,71 27,27 22,45 23,66 13,89
Vocational 2,16 17,61 31,78 21,50 18,16 8,79
Secondary 2,48 17,42 32,94 22,19 17,08 7,89
Tertiary/post-secondary 3,44 20,31 36,68 21,29 12,04 6,23
Income per capita
First quartile 1,58 13,17 26,25 22,34 23,44 13,21
Middle 50% 1,92 15,25 31,27 23,88 18,11 9,59
Fourth quartile 3,47 20,88 36,58 19,65 13,81 5,61
Social-professional status
Public sector employees 2,42 18,56 36,79 22,68 14,00 5,55
Private sector employees 2,45 18,01 34,75 21,43 16,01 7,35
Self-employed 3,10 22,99 39,60 17,70 11,68 4,93
Farmers 2,03 15,63 30,94 22,81 18,59 10,00
Disability pensioners 1,23 11,44 24,41 23,49 24,41 15,02
Retirees 0,97 14,51 31,45 22,59 20,29 10,19
Students 5,59 24,66 34,43 18,63 11,55 5,14
Unemployed 1,97 11,15 21,25 24,85 24,62 16,14
Other professionally inactive 1,52 15,42 29,79 21,50 20,79 10,98
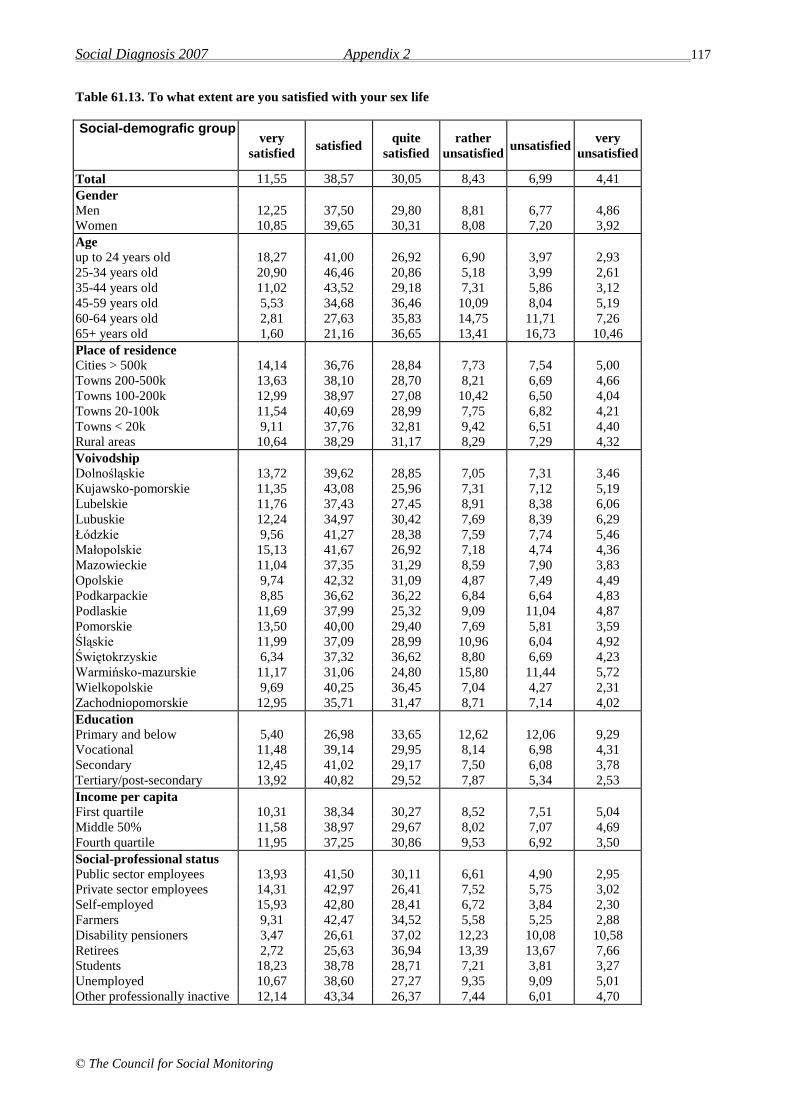
Social Diagnosis 2007 Appendix 2 117
© The Council for Social Monitoring
Table 61.13. To what extent are you satisfied with your sex life
Social-demografic group very
satisfied satisfied
quite
satisfied
rather
unsatisfied unsatisfied
very
unsatisfied
Total 11,55 38,57 30,05 8,43 6,99 4,41
Gender
Men 12,25 37,50 29,80 8,81 6,77 4,86
Women 10,85 39,65 30,31 8,08 7,20 3,92
Age
up to 24 years old 18,27 41,00 26,92 6,90 3,97 2,93
25-34 years old 20,90 46,46 20,86 5,18 3,99 2,61
35-44 years old 11,02 43,52 29,18 7,31 5,86 3,12
45-59 years old 5,53 34,68 36,46 10,09 8,04 5,19
60-64 years old 2,81 27,63 35,83 14,75 11,71 7,26
65+ years old 1,60 21,16 36,65 13,41 16,73 10,46
Place of residence
Cities > 500k 14,14 36,76 28,84 7,73 7,54 5,00
Towns 200-500k 13,63 38,10 28,70 8,21 6,69 4,66
Towns 100-200k 12,99 38,97 27,08 10,42 6,50 4,04
Towns 20-100k 11,54 40,69 28,99 7,75 6,82 4,21
Towns < 20k 9,11 37,76 32,81 9,42 6,51 4,40
Rural areas 10,64 38,29 31,17 8,29 7,29 4,32
Voivodship
Dolnośląskie 13,72 39,62 28,85 7,05 7,31 3,46
Kujawsko-pomorskie 11,35 43,08 25,96 7,31 7,12 5,19
Lubelskie 11,76 37,43 27,45 8,91 8,38 6,06
Lubuskie 12,24 34,97 30,42 7,69 8,39 6,29
Łódzkie 9,56 41,27 28,38 7,59 7,74 5,46
Małopolskie 15,13 41,67 26,92 7,18 4,74 4,36
Mazowieckie 11,04 37,35 31,29 8,59 7,90 3,83
Opolskie 9,74 42,32 31,09 4,87 7,49 4,49
Podkarpackie 8,85 36,62 36,22 6,84 6,64 4,83
Podlaskie 11,69 37,99 25,32 9,09 11,04 4,87
Pomorskie 13,50 40,00 29,40 7,69 5,81 3,59
Śląskie 11,99 37,09 28,99 10,96 6,04 4,92
Świętokrzyskie 6,34 37,32 36,62 8,80 6,69 4,23
Warmińsko-mazurskie 11,17 31,06 24,80 15,80 11,44 5,72
Wielkopolskie 9,69 40,25 36,45 7,04 4,27 2,31
Zachodniopomorskie 12,95 35,71 31,47 8,71 7,14 4,02
Education
Primary and below 5,40 26,98 33,65 12,62 12,06 9,29
Vocational 11,48 39,14 29,95 8,14 6,98 4,31
Secondary 12,45 41,02 29,17 7,50 6,08 3,78
Tertiary/post-secondary 13,92 40,82 29,52 7,87 5,34 2,53
Income per capita
First quartile 10,31 38,34 30,27 8,52 7,51 5,04
Middle 50% 11,58 38,97 29,67 8,02 7,07 4,69
Fourth quartile 11,95 37,25 30,86 9,53 6,92 3,50
Social-professional status
Public sector employees 13,93 41,50 30,11 6,61 4,90 2,95
Private sector employees 14,31 42,97 26,41 7,52 5,75 3,02
Self-employed 15,93 42,80 28,41 6,72 3,84 2,30
Farmers 9,31 42,47 34,52 5,58 5,25 2,88
Disability pensioners 3,47 26,61 37,02 12,23 10,08 10,58
Retirees 2,72 25,63 36,94 13,39 13,67 7,66
Students 18,23 38,78 28,71 7,21 3,81 3,27
Unemployed 10,67 38,60 27,27 9,35 9,09 5,01
Other professionally inactive 12,14 43,34 26,37 7,44 6,01 4,70
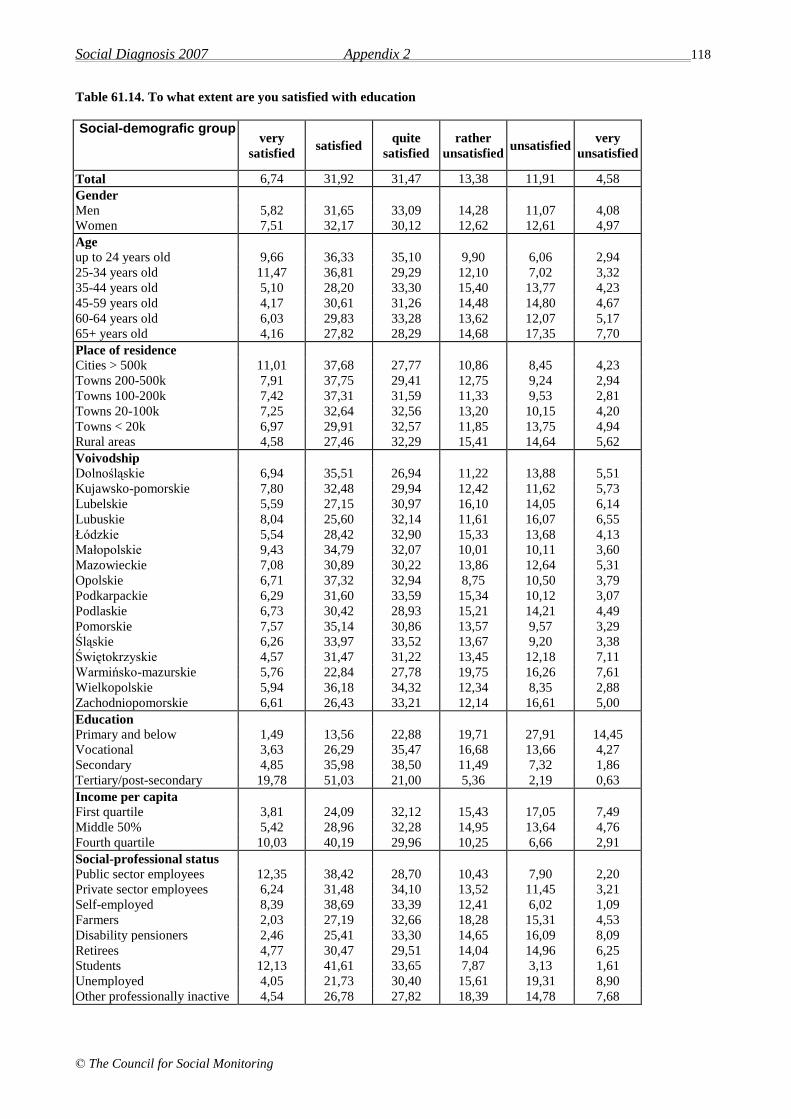
Social Diagnosis 2007 Appendix 2 118
© The Council for Social Monitoring
Table 61.14. To what extent are you satisfied with education
Social-demografic group very
satisfied satisfied
quite
satisfied
rather
unsatisfied unsatisfied
very
unsatisfied
Total 6,74 31,92 31,47 13,38 11,91 4,58
Gender
Men 5,82 31,65 33,09 14,28 11,07 4,08
Women 7,51 32,17 30,12 12,62 12,61 4,97
Age
up to 24 years old 9,66 36,33 35,10 9,90 6,06 2,94
25-34 years old 11,47 36,81 29,29 12,10 7,02 3,32
35-44 years old 5,10 28,20 33,30 15,40 13,77 4,23
45-59 years old 4,17 30,61 31,26 14,48 14,80 4,67
60-64 years old 6,03 29,83 33,28 13,62 12,07 5,17
65+ years old 4,16 27,82 28,29 14,68 17,35 7,70
Place of residence
Cities > 500k 11,01 37,68 27,77 10,86 8,45 4,23
Towns 200-500k 7,91 37,75 29,41 12,75 9,24 2,94
Towns 100-200k 7,42 37,31 31,59 11,33 9,53 2,81
Towns 20-100k 7,25 32,64 32,56 13,20 10,15 4,20
Towns < 20k 6,97 29,91 32,57 11,85 13,75 4,94
Rural areas 4,58 27,46 32,29 15,41 14,64 5,62
Voivodship
Dolnośląskie 6,94 35,51 26,94 11,22 13,88 5,51
Kujawsko-pomorskie 7,80 32,48 29,94 12,42 11,62 5,73
Lubelskie 5,59 27,15 30,97 16,10 14,05 6,14
Lubuskie 8,04 25,60 32,14 11,61 16,07 6,55
Łódzkie 5,54 28,42 32,90 15,33 13,68 4,13
Małopolskie 9,43 34,79 32,07 10,01 10,11 3,60
Mazowieckie 7,08 30,89 30,22 13,86 12,64 5,31
Opolskie 6,71 37,32 32,94 8,75 10,50 3,79
Podkarpackie 6,29 31,60 33,59 15,34 10,12 3,07
Podlaskie 6,73 30,42 28,93 15,21 14,21 4,49
Pomorskie 7,57 35,14 30,86 13,57 9,57 3,29
Śląskie 6,26 33,97 33,52 13,67 9,20 3,38
Świętokrzyskie 4,57 31,47 31,22 13,45 12,18 7,11
Warmińsko-mazurskie 5,76 22,84 27,78 19,75 16,26 7,61
Wielkopolskie 5,94 36,18 34,32 12,34 8,35 2,88
Zachodniopomorskie 6,61 26,43 33,21 12,14 16,61 5,00
Education
Primary and below 1,49 13,56 22,88 19,71 27,91 14,45
Vocational 3,63 26,29 35,47 16,68 13,66 4,27
Secondary 4,85 35,98 38,50 11,49 7,32 1,86
Tertiary/post-secondary 19,78 51,03 21,00 5,36 2,19 0,63
Income per capita
First quartile 3,81 24,09 32,12 15,43 17,05 7,49
Middle 50% 5,42 28,96 32,28 14,95 13,64 4,76
Fourth quartile 10,03 40,19 29,96 10,25 6,66 2,91
Social-professional status
Public sector employees 12,35 38,42 28,70 10,43 7,90 2,20
Private sector employees 6,24 31,48 34,10 13,52 11,45 3,21
Self-employed 8,39 38,69 33,39 12,41 6,02 1,09
Farmers 2,03 27,19 32,66 18,28 15,31 4,53
Disability pensioners 2,46 25,41 33,30 14,65 16,09 8,09
Retirees 4,77 30,47 29,51 14,04 14,96 6,25
Students 12,13 41,61 33,65 7,87 3,13 1,61
Unemployed 4,05 21,73 30,40 15,61 19,31 8,90
Other professionally inactive 4,54 26,78 27,82 18,39 14,78 7,68
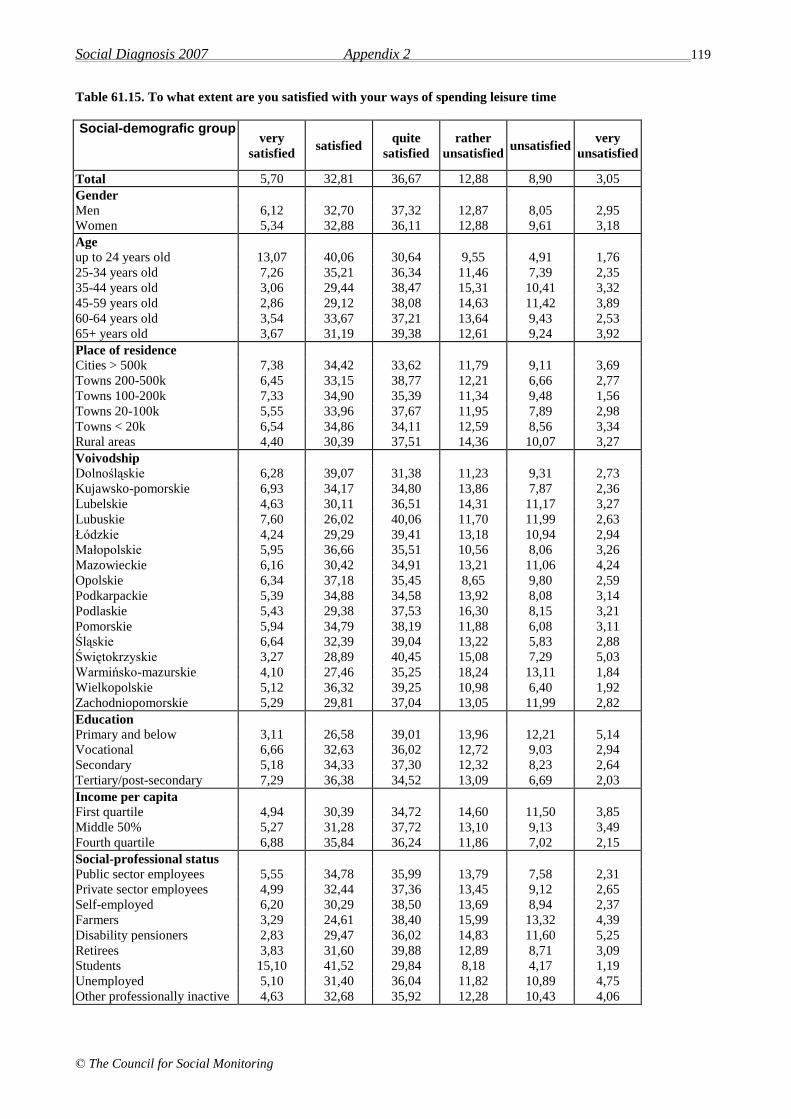
Social Diagnosis 2007 Appendix 2 119
© The Council for Social Monitoring
Table 61.15. To what extent are you satisfied with your ways of spending leisure time
Social-demografic group very
satisfied satisfied
quite
satisfied
rather
unsatisfied unsatisfied
very
unsatisfied
Total 5,70 32,81 36,67 12,88 8,90 3,05
Gender
Men 6,12 32,70 37,32 12,87 8,05 2,95
Women 5,34 32,88 36,11 12,88 9,61 3,18
Age
up to 24 years old 13,07 40,06 30,64 9,55 4,91 1,76
25-34 years old 7,26 35,21 36,34 11,46 7,39 2,35
35-44 years old 3,06 29,44 38,47 15,31 10,41 3,32
45-59 years old 2,86 29,12 38,08 14,63 11,42 3,89
60-64 years old 3,54 33,67 37,21 13,64 9,43 2,53
65+ years old 3,67 31,19 39,38 12,61 9,24 3,92
Place of residence
Cities > 500k 7,38 34,42 33,62 11,79 9,11 3,69
Towns 200-500k 6,45 33,15 38,77 12,21 6,66 2,77
Towns 100-200k 7,33 34,90 35,39 11,34 9,48 1,56
Towns 20-100k 5,55 33,96 37,67 11,95 7,89 2,98
Towns < 20k 6,54 34,86 34,11 12,59 8,56 3,34
Rural areas 4,40 30,39 37,51 14,36 10,07 3,27
Voivodship
Dolnośląskie 6,28 39,07 31,38 11,23 9,31 2,73
Kujawsko-pomorskie 6,93 34,17 34,80 13,86 7,87 2,36
Lubelskie 4,63 30,11 36,51 14,31 11,17 3,27
Lubuskie 7,60 26,02 40,06 11,70 11,99 2,63
Łódzkie 4,24 29,29 39,41 13,18 10,94 2,94
Małopolskie 5,95 36,66 35,51 10,56 8,06 3,26
Mazowieckie 6,16 30,42 34,91 13,21 11,06 4,24
Opolskie 6,34 37,18 35,45 8,65 9,80 2,59
Podkarpackie 5,39 34,88 34,58 13,92 8,08 3,14
Podlaskie 5,43 29,38 37,53 16,30 8,15 3,21
Pomorskie 5,94 34,79 38,19 11,88 6,08 3,11
Śląskie 6,64 32,39 39,04 13,22 5,83 2,88
Świętokrzyskie 3,27 28,89 40,45 15,08 7,29 5,03
Warmińsko-mazurskie 4,10 27,46 35,25 18,24 13,11 1,84
Wielkopolskie 5,12 36,32 39,25 10,98 6,40 1,92
Zachodniopomorskie 5,29 29,81 37,04 13,05 11,99 2,82
Education
Primary and below 3,11 26,58 39,01 13,96 12,21 5,14
Vocational 6,66 32,63 36,02 12,72 9,03 2,94
Secondary 5,18 34,33 37,30 12,32 8,23 2,64
Tertiary/post-secondary 7,29 36,38 34,52 13,09 6,69 2,03
Income per capita
First quartile 4,94 30,39 34,72 14,60 11,50 3,85
Middle 50% 5,27 31,28 37,72 13,10 9,13 3,49
Fourth quartile 6,88 35,84 36,24 11,86 7,02 2,15
Social-professional status
Public sector employees 5,55 34,78 35,99 13,79 7,58 2,31
Private sector employees 4,99 32,44 37,36 13,45 9,12 2,65
Self-employed 6,20 30,29 38,50 13,69 8,94 2,37
Farmers 3,29 24,61 38,40 15,99 13,32 4,39
Disability pensioners 2,83 29,47 36,02 14,83 11,60 5,25
Retirees 3,83 31,60 39,88 12,89 8,71 3,09
Students 15,10 41,52 29,84 8,18 4,17 1,19
Unemployed 5,10 31,40 36,04 11,82 10,89 4,75
Other professionally inactive 4,63 32,68 35,92 12,28 10,43 4,06
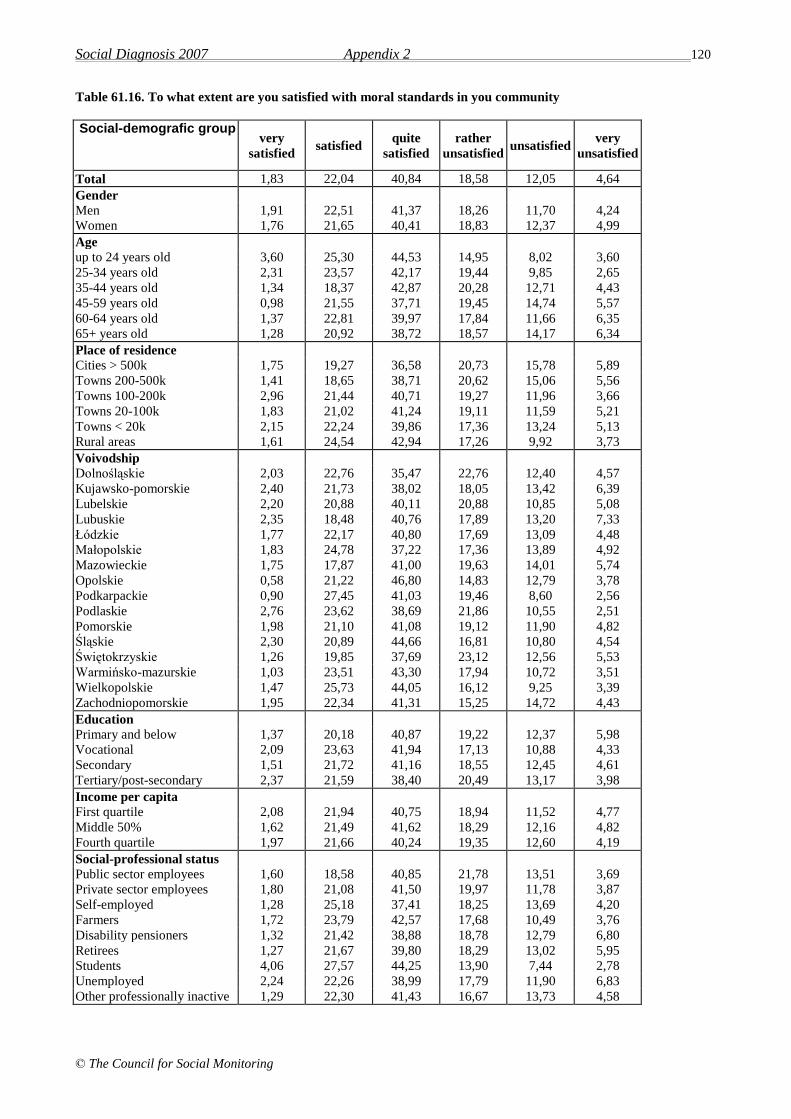
Social Diagnosis 2007 Appendix 2 120
© The Council for Social Monitoring
Table 61.16. To what extent are you satisfied with moral standards in you community
Social-demografic group very
satisfied satisfied
quite
satisfied
rather
unsatisfied unsatisfied
very
unsatisfied
Total 1,83 22,04 40,84 18,58 12,05 4,64
Gender
Men 1,91 22,51 41,37 18,26 11,70 4,24
Women 1,76 21,65 40,41 18,83 12,37 4,99
Age
up to 24 years old 3,60 25,30 44,53 14,95 8,02 3,60
25-34 years old 2,31 23,57 42,17 19,44 9,85 2,65
35-44 years old 1,34 18,37 42,87 20,28 12,71 4,43
45-59 years old 0,98 21,55 37,71 19,45 14,74 5,57
60-64 years old 1,37 22,81 39,97 17,84 11,66 6,35
65+ years old 1,28 20,92 38,72 18,57 14,17 6,34
Place of residence
Cities > 500k 1,75 19,27 36,58 20,73 15,78 5,89
Towns 200-500k 1,41 18,65 38,71 20,62 15,06 5,56
Towns 100-200k 2,96 21,44 40,71 19,27 11,96 3,66
Towns 20-100k 1,83 21,02 41,24 19,11 11,59 5,21
Towns < 20k 2,15 22,24 39,86 17,36 13,24 5,13
Rural areas 1,61 24,54 42,94 17,26 9,92 3,73
Voivodship
Dolnośląskie 2,03 22,76 35,47 22,76 12,40 4,57
Kujawsko-pomorskie 2,40 21,73 38,02 18,05 13,42 6,39
Lubelskie 2,20 20,88 40,11 20,88 10,85 5,08
Lubuskie 2,35 18,48 40,76 17,89 13,20 7,33
Łódzkie 1,77 22,17 40,80 17,69 13,09 4,48
Małopolskie 1,83 24,78 37,22 17,36 13,89 4,92
Mazowieckie 1,75 17,87 41,00 19,63 14,01 5,74
Opolskie 0,58 21,22 46,80 14,83 12,79 3,78
Podkarpackie 0,90 27,45 41,03 19,46 8,60 2,56
Podlaskie 2,76 23,62 38,69 21,86 10,55 2,51
Pomorskie 1,98 21,10 41,08 19,12 11,90 4,82
Śląskie 2,30 20,89 44,66 16,81 10,80 4,54
Świętokrzyskie 1,26 19,85 37,69 23,12 12,56 5,53
Warmińsko-mazurskie 1,03 23,51 43,30 17,94 10,72 3,51
Wielkopolskie 1,47 25,73 44,05 16,12 9,25 3,39
Zachodniopomorskie 1,95 22,34 41,31 15,25 14,72 4,43
Education
Primary and below 1,37 20,18 40,87 19,22 12,37 5,98
Vocational 2,09 23,63 41,94 17,13 10,88 4,33
Secondary 1,51 21,72 41,16 18,55 12,45 4,61
Tertiary/post-secondary 2,37 21,59 38,40 20,49 13,17 3,98
Income per capita
First quartile 2,08 21,94 40,75 18,94 11,52 4,77
Middle 50% 1,62 21,49 41,62 18,29 12,16 4,82
Fourth quartile 1,97 21,66 40,24 19,35 12,60 4,19
Social-professional status
Public sector employees 1,60 18,58 40,85 21,78 13,51 3,69
Private sector employees 1,80 21,08 41,50 19,97 11,78 3,87
Self-employed 1,28 25,18 37,41 18,25 13,69 4,20
Farmers 1,72 23,79 42,57 17,68 10,49 3,76
Disability pensioners 1,32 21,42 38,88 18,78 12,79 6,80
Retirees 1,27 21,67 39,80 18,29 13,02 5,95
Students 4,06 27,57 44,25 13,90 7,44 2,78
Unemployed 2,24 22,26 38,99 17,79 11,90 6,83
Other professionally inactive 1,29 22,30 41,43 16,67 13,73 4,58
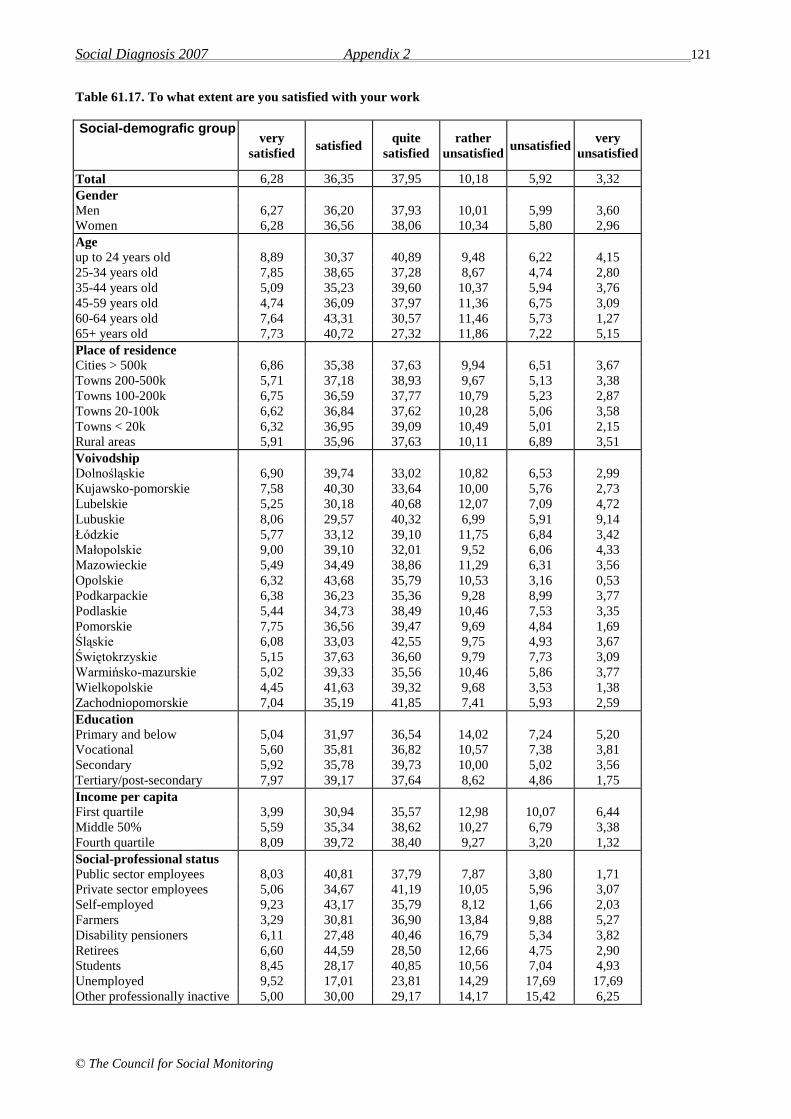
Social Diagnosis 2007 Appendix 2 121
© The Council for Social Monitoring
Table 61.17. To what extent are you satisfied with your work
Social-demografic group very
satisfied satisfied
quite
satisfied
rather
unsatisfied unsatisfied
very
unsatisfied
Total 6,28 36,35 37,95 10,18 5,92 3,32
Gender
Men 6,27 36,20 37,93 10,01 5,99 3,60
Women 6,28 36,56 38,06 10,34 5,80 2,96
Age
up to 24 years old 8,89 30,37 40,89 9,48 6,22 4,15
25-34 years old 7,85 38,65 37,28 8,67 4,74 2,80
35-44 years old 5,09 35,23 39,60 10,37 5,94 3,76
45-59 years old 4,74 36,09 37,97 11,36 6,75 3,09
60-64 years old 7,64 43,31 30,57 11,46 5,73 1,27
65+ years old 7,73 40,72 27,32 11,86 7,22 5,15
Place of residence
Cities > 500k 6,86 35,38 37,63 9,94 6,51 3,67
Towns 200-500k 5,71 37,18 38,93 9,67 5,13 3,38
Towns 100-200k 6,75 36,59 37,77 10,79 5,23 2,87
Towns 20-100k 6,62 36,84 37,62 10,28 5,06 3,58
Towns < 20k 6,32 36,95 39,09 10,49 5,01 2,15
Rural areas 5,91 35,96 37,63 10,11 6,89 3,51
Voivodship
Dolnośląskie 6,90 39,74 33,02 10,82 6,53 2,99
Kujawsko-pomorskie 7,58 40,30 33,64 10,00 5,76 2,73
Lubelskie 5,25 30,18 40,68 12,07 7,09 4,72
Lubuskie 8,06 29,57 40,32 6,99 5,91 9,14
Łódzkie 5,77 33,12 39,10 11,75 6,84 3,42
Małopolskie 9,00 39,10 32,01 9,52 6,06 4,33
Mazowieckie 5,49 34,49 38,86 11,29 6,31 3,56
Opolskie 6,32 43,68 35,79 10,53 3,16 0,53
Podkarpackie 6,38 36,23 35,36 9,28 8,99 3,77
Podlaskie 5,44 34,73 38,49 10,46 7,53 3,35
Pomorskie 7,75 36,56 39,47 9,69 4,84 1,69
Śląskie 6,08 33,03 42,55 9,75 4,93 3,67
Świętokrzyskie 5,15 37,63 36,60 9,79 7,73 3,09
Warmińsko-mazurskie 5,02 39,33 35,56 10,46 5,86 3,77
Wielkopolskie 4,45 41,63 39,32 9,68 3,53 1,38
Zachodniopomorskie 7,04 35,19 41,85 7,41 5,93 2,59
Education
Primary and below 5,04 31,97 36,54 14,02 7,24 5,20
Vocational 5,60 35,81 36,82 10,57 7,38 3,81
Secondary 5,92 35,78 39,73 10,00 5,02 3,56
Tertiary/post-secondary 7,97 39,17 37,64 8,62 4,86 1,75
Income per capita
First quartile 3,99 30,94 35,57 12,98 10,07 6,44
Middle 50% 5,59 35,34 38,62 10,27 6,79 3,38
Fourth quartile 8,09 39,72 38,40 9,27 3,20 1,32
Social-professional status
Public sector employees 8,03 40,81 37,79 7,87 3,80 1,71
Private sector employees 5,06 34,67 41,19 10,05 5,96 3,07
Self-employed 9,23 43,17 35,79 8,12 1,66 2,03
Farmers 3,29 30,81 36,90 13,84 9,88 5,27
Disability pensioners 6,11 27,48 40,46 16,79 5,34 3,82
Retirees 6,60 44,59 28,50 12,66 4,75 2,90
Students 8,45 28,17 40,85 10,56 7,04 4,93
Unemployed 9,52 17,01 23,81 14,29 17,69 17,69
Other professionally inactive 5,00 30,00 29,17 14,17 15,42 6,25
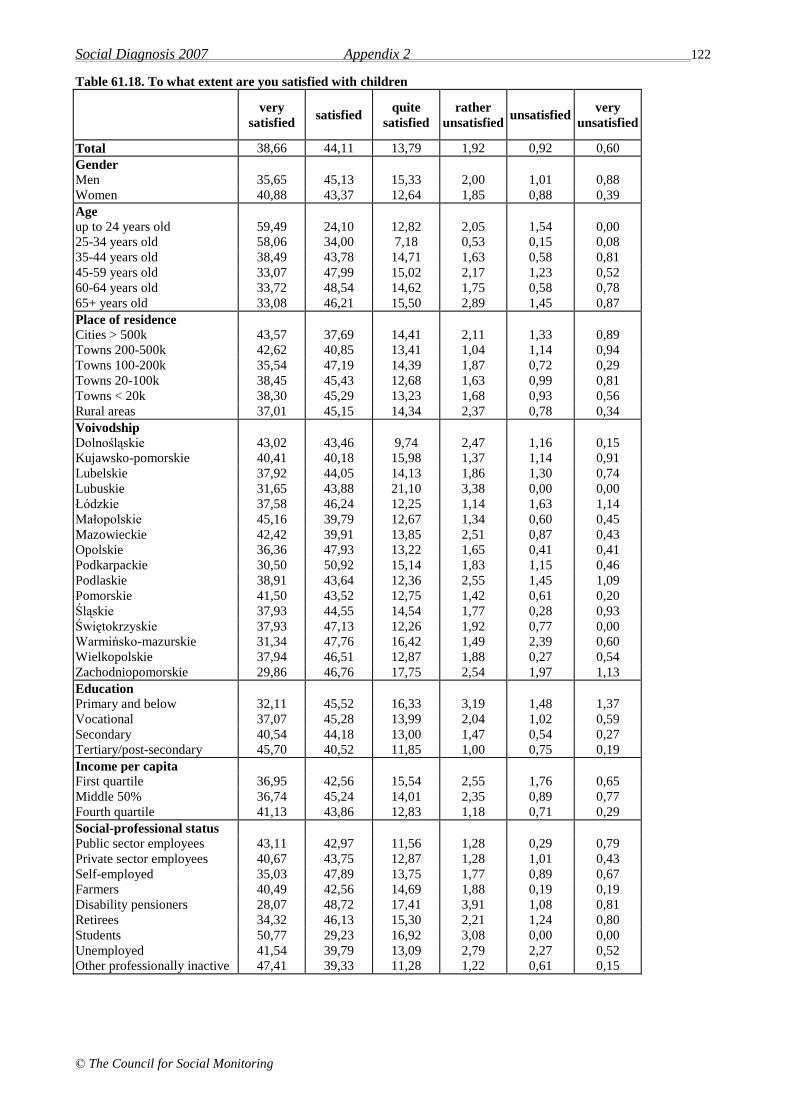
Social Diagnosis 2007 Appendix 2 122
© The Council for Social Monitoring
Table 61.18. To what extent are you satisfied with children
very
satisfied satisfied
quite
satisfied
rather
unsatisfied unsatisfied
very
unsatisfied
Total 38,66 44,11 13,79 1,92 0,92 0,60
Gender
Men 35,65 45,13 15,33 2,00 1,01 0,88
Women 40,88 43,37 12,64 1,85 0,88 0,39
Age
up to 24 years old 59,49 24,10 12,82 2,05 1,54 0,00
25-34 years old 58,06 34,00 7,18 0,53 0,15 0,08
35-44 years old 38,49 43,78 14,71 1,63 0,58 0,81
45-59 years old 33,07 47,99 15,02 2,17 1,23 0,52
60-64 years old 33,72 48,54 14,62 1,75 0,58 0,78
65+ years old 33,08 46,21 15,50 2,89 1,45 0,87
Place of residence
Cities > 500k 43,57 37,69 14,41 2,11 1,33 0,89
Towns 200-500k 42,62 40,85 13,41 1,04 1,14 0,94
Towns 100-200k 35,54 47,19 14,39 1,87 0,72 0,29
Towns 20-100k 38,45 45,43 12,68 1,63 0,99 0,81
Towns < 20k 38,30 45,29 13,23 1,68 0,93 0,56
Rural areas 37,01 45,15 14,34 2,37 0,78 0,34
Voivodship
Dolnośląskie 43,02 43,46 9,74 2,47 1,16 0,15
Kujawsko-pomorskie 40,41 40,18 15,98 1,37 1,14 0,91
Lubelskie 37,92 44,05 14,13 1,86 1,30 0,74
Lubuskie 31,65 43,88 21,10 3,38 0,00 0,00
Łódzkie 37,58 46,24 12,25 1,14 1,63 1,14
Małopolskie 45,16 39,79 12,67 1,34 0,60 0,45
Mazowieckie 42,42 39,91 13,85 2,51 0,87 0,43
Opolskie 36,36 47,93 13,22 1,65 0,41 0,41
Podkarpackie 30,50 50,92 15,14 1,83 1,15 0,46
Podlaskie 38,91 43,64 12,36 2,55 1,45 1,09
Pomorskie 41,50 43,52 12,75 1,42 0,61 0,20
Śląskie 37,93 44,55 14,54 1,77 0,28 0,93
Świętokrzyskie 37,93 47,13 12,26 1,92 0,77 0,00
Warmińsko-mazurskie 31,34 47,76 16,42 1,49 2,39 0,60
Wielkopolskie 37,94 46,51 12,87 1,88 0,27 0,54
Zachodniopomorskie 29,86 46,76 17,75 2,54 1,97 1,13
Education
Primary and below 32,11 45,52 16,33 3,19 1,48 1,37
Vocational 37,07 45,28 13,99 2,04 1,02 0,59
Secondary 40,54 44,18 13,00 1,47 0,54 0,27
Tertiary/post-secondary 45,70 40,52 11,85 1,00 0,75 0,19
Income per capita
First quartile 36,95 42,56 15,54 2,55 1,76 0,65
Middle 50% 36,74 45,24 14,01 2,35 0,89 0,77
Fourth quartile 41,13 43,86 12,83 1,18 0,71 0,29
Social-professional status
Public sector employees 43,11 42,97 11,56 1,28 0,29 0,79
Private sector employees 40,67 43,75 12,87 1,28 1,01 0,43
Self-employed 35,03 47,89 13,75 1,77 0,89 0,67
Farmers 40,49 42,56 14,69 1,88 0,19 0,19
Disability pensioners 28,07 48,72 17,41 3,91 1,08 0,81
Retirees 34,32 46,13 15,30 2,21 1,24 0,80
Students 50,77 29,23 16,92 3,08 0,00 0,00
Unemployed 41,54 39,79 13,09 2,79 2,27 0,52
Other professionally inactive 47,41 39,33 11,28 1,22 0,61 0,15
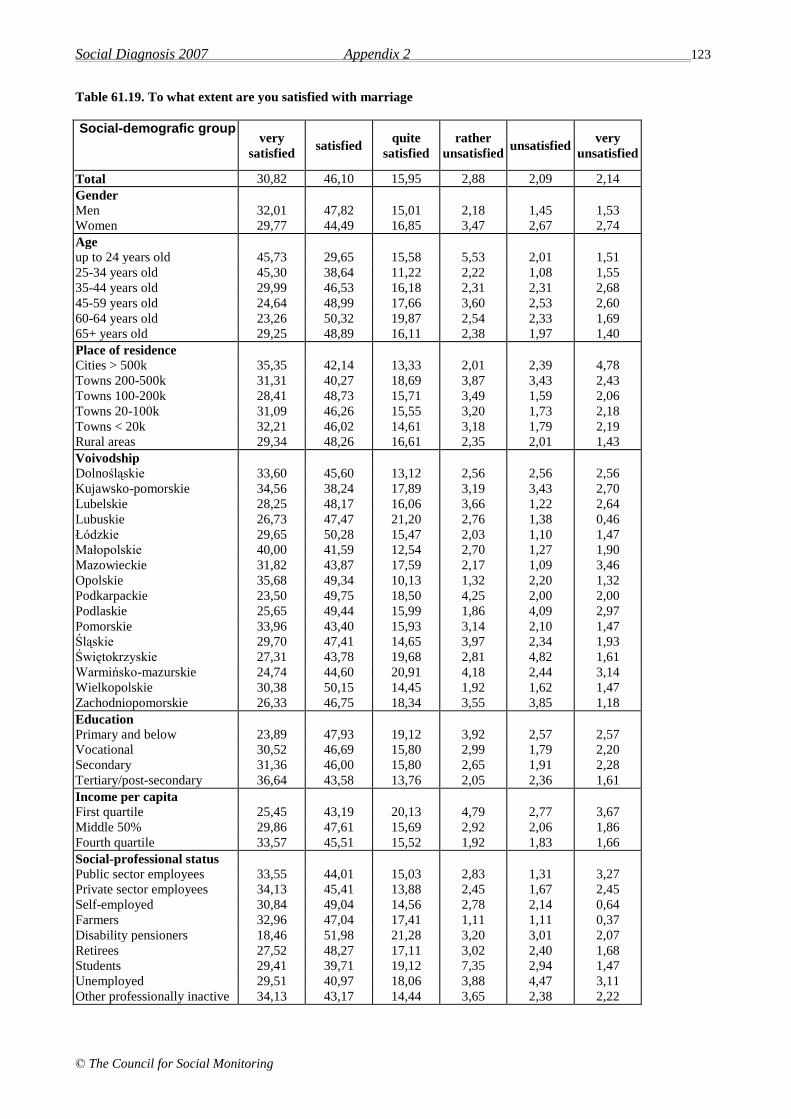
Social Diagnosis 2007 Appendix 2 123
© The Council for Social Monitoring
Table 61.19. To what extent are you satisfied with marriage
Social-demografic group very
satisfied satisfied
quite
satisfied
rather
unsatisfied unsatisfied
very
unsatisfied
Total 30,82 46,10 15,95 2,88 2,09 2,14
Gender
Men 32,01 47,82 15,01 2,18 1,45 1,53
Women 29,77 44,49 16,85 3,47 2,67 2,74
Age
up to 24 years old 45,73 29,65 15,58 5,53 2,01 1,51
25-34 years old 45,30 38,64 11,22 2,22 1,08 1,55
35-44 years old 29,99 46,53 16,18 2,31 2,31 2,68
45-59 years old 24,64 48,99 17,66 3,60 2,53 2,60
60-64 years old 23,26 50,32 19,87 2,54 2,33 1,69
65+ years old 29,25 48,89 16,11 2,38 1,97 1,40
Place of residence
Cities > 500k 35,35 42,14 13,33 2,01 2,39 4,78
Towns 200-500k 31,31 40,27 18,69 3,87 3,43 2,43
Towns 100-200k 28,41 48,73 15,71 3,49 1,59 2,06
Towns 20-100k 31,09 46,26 15,55 3,20 1,73 2,18
Towns < 20k 32,21 46,02 14,61 3,18 1,79 2,19
Rural areas 29,34 48,26 16,61 2,35 2,01 1,43
Voivodship
Dolnośląskie 33,60 45,60 13,12 2,56 2,56 2,56
Kujawsko-pomorskie 34,56 38,24 17,89 3,19 3,43 2,70
Lubelskie 28,25 48,17 16,06 3,66 1,22 2,64
Lubuskie 26,73 47,47 21,20 2,76 1,38 0,46
Łódzkie 29,65 50,28 15,47 2,03 1,10 1,47
Małopolskie 40,00 41,59 12,54 2,70 1,27 1,90
Mazowieckie 31,82 43,87 17,59 2,17 1,09 3,46
Opolskie 35,68 49,34 10,13 1,32 2,20 1,32
Podkarpackie 23,50 49,75 18,50 4,25 2,00 2,00
Podlaskie 25,65 49,44 15,99 1,86 4,09 2,97
Pomorskie 33,96 43,40 15,93 3,14 2,10 1,47
Śląskie 29,70 47,41 14,65 3,97 2,34 1,93
Świętokrzyskie 27,31 43,78 19,68 2,81 4,82 1,61
Warmińsko-mazurskie 24,74 44,60 20,91 4,18 2,44 3,14
Wielkopolskie 30,38 50,15 14,45 1,92 1,62 1,47
Zachodniopomorskie 26,33 46,75 18,34 3,55 3,85 1,18
Education
Primary and below 23,89 47,93 19,12 3,92 2,57 2,57
Vocational 30,52 46,69 15,80 2,99 1,79 2,20
Secondary 31,36 46,00 15,80 2,65 1,91 2,28
Tertiary/post-secondary 36,64 43,58 13,76 2,05 2,36 1,61
Income per capita
First quartile 25,45 43,19 20,13 4,79 2,77 3,67
Middle 50% 29,86 47,61 15,69 2,92 2,06 1,86
Fourth quartile 33,57 45,51 15,52 1,92 1,83 1,66
Social-professional status
Public sector employees 33,55 44,01 15,03 2,83 1,31 3,27
Private sector employees 34,13 45,41 13,88 2,45 1,67 2,45
Self-employed 30,84 49,04 14,56 2,78 2,14 0,64
Farmers 32,96 47,04 17,41 1,11 1,11 0,37
Disability pensioners 18,46 51,98 21,28 3,20 3,01 2,07
Retirees 27,52 48,27 17,11 3,02 2,40 1,68
Students 29,41 39,71 19,12 7,35 2,94 1,47
Unemployed 29,51 40,97 18,06 3,88 4,47 3,11
Other professionally inactive 34,13 43,17 14,44 3,65 2,38 2,22

Social Diagnosis 2007 Appendix 2 124
© The Council for Social Monitoring
Table 61.20. To what extent are you satisfied with safety in the place of residence
Social-demografic group very
satisfied satisfied
quite
satisfied
rather
unsatisfied unsatisfied
very
unsatisfied
Total 4,58 37,00 39,57 10,87 5,55 2,44
Gender
Men 5,02 38,75 38,13 10,59 5,27 2,25
Women 4,21 35,53 40,73 11,13 5,80 2,61
Age
up to 24 years old 6,57 35,78 39,72 10,60 5,07 2,26
25-34 years old 5,24 37,41 39,76 10,98 4,40 2,22
35-44 years old 4,22 35,61 43,95 9,82 4,43 1,98
45-59 years old 3,89 37,92 38,24 10,89 6,65 2,41
60-64 years old 4,20 35,46 39,83 11,43 6,22 2,86
65+ years old 3,24 38,10 36,96 11,97 6,53 3,19
Place of residence
Cities > 500k 3,10 27,79 42,19 15,69 7,20 4,03
Towns 200-500k 3,04 26,99 42,35 15,22 9,07 3,32
Towns 100-200k 4,00 30,05 44,88 12,10 5,76 3,22
Towns 20-100k 2,93 31,42 41,73 13,96 7,14 2,81
Towns < 20k 4,91 35,98 39,89 11,28 5,86 2,08
Rural areas 6,40 47,76 35,39 6,03 2,98 1,43
Voivodship
Dolnośląskie 5,26 35,69 38,32 11,93 6,77 2,02
Kujawsko-pomorskie 4,24 30,93 39,87 12,72 9,26 2,98
Lubelskie 5,05 46,04 31,83 8,06 6,01 3,01
Lubuskie 7,54 31,01 43,19 10,14 5,22 2,90
Łódzkie 3,16 37,54 39,06 10,76 7,37 2,11
Małopolskie 4,78 39,48 37,86 9,94 4,40 3,54
Mazowieckie 3,57 33,10 41,89 13,13 5,47 2,85
Opolskie 4,32 45,82 37,75 8,65 2,02 1,44
Podkarpackie 4,33 46,34 37,97 6,13 4,33 0,90
Podlaskie 6,91 40,49 36,05 11,11 4,44 0,99
Pomorskie 5,25 30,64 44,54 10,92 5,67 2,98
Śląskie 4,37 31,09 42,07 13,92 4,87 3,68
Świętokrzyskie 3,51 34,84 44,36 11,03 4,51 1,75
Warmińsko-mazurskie 5,07 41,58 37,73 9,74 4,26 1,62
Wielkopolskie 3,76 43,80 37,01 8,45 5,60 1,38
Zachodniopomorskie 6,54 34,45 41,70 9,72 6,36 1,24
Education
Primary and below 4,67 41,86 36,79 9,02 5,38 2,29
Vocational 6,39 38,79 37,32 9,55 5,08 2,86
Secondary 3,61 34,35 41,82 11,59 5,87 2,77
Tertiary/post-secondary 3,08 33,68 42,16 13,74 6,03 1,31
Income per capita
First quartile 5,71 40,90 36,24 9,02 5,27 2,87
Middle 50% 4,60 37,47 39,38 10,38 5,76 2,41
Fourth quartile 3,61 33,56 42,11 12,90 5,59 2,23
Social-professional status
Public sector employees 2,97 35,37 43,60 10,82 5,05 2,20
Private sector employees 4,61 35,62 41,02 11,22 5,37 2,17
Self-employed 4,37 38,43 36,43 13,48 6,56 0,73
Farmers 7,18 49,92 34,32 4,84 2,50 1,25
Disability pensioners 3,52 35,48 40,00 11,06 6,93 3,02
Retirees 3,61 37,42 37,97 11,65 6,33 3,03
Students 7,36 35,61 40,67 9,96 4,31 2,08
Unemployed 6,34 35,52 36,22 12,11 6,46 3,34
Other professionally inactive 4,07 38,72 37,79 10,47 5,93 3,02
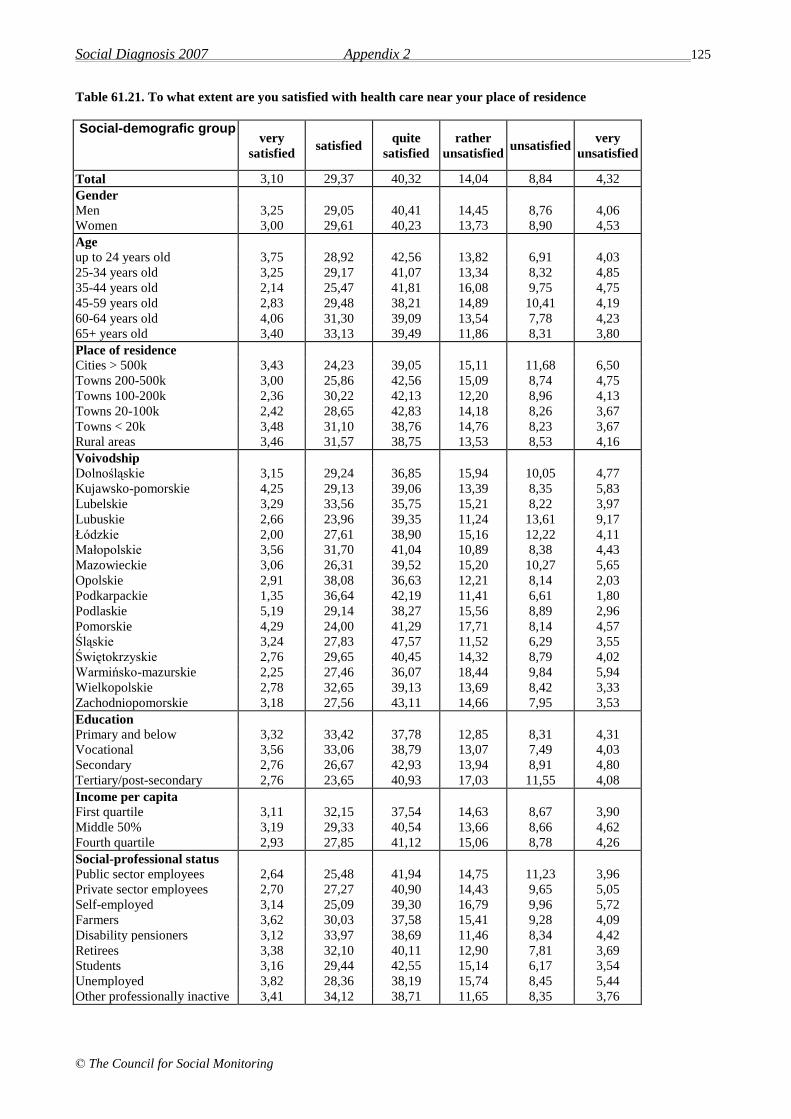
Social Diagnosis 2007 Appendix 2 125
© The Council for Social Monitoring
Table 61.21. To what extent are you satisfied with health care near your place of residence
Social-demografic group very
satisfied satisfied
quite
satisfied
rather
unsatisfied unsatisfied
very
unsatisfied
Total 3,10 29,37 40,32 14,04 8,84 4,32
Gender
Men 3,25 29,05 40,41 14,45 8,76 4,06
Women 3,00 29,61 40,23 13,73 8,90 4,53
Age
up to 24 years old 3,75 28,92 42,56 13,82 6,91 4,03
25-34 years old 3,25 29,17 41,07 13,34 8,32 4,85
35-44 years old 2,14 25,47 41,81 16,08 9,75 4,75
45-59 years old 2,83 29,48 38,21 14,89 10,41 4,19
60-64 years old 4,06 31,30 39,09 13,54 7,78 4,23
65+ years old 3,40 33,13 39,49 11,86 8,31 3,80
Place of residence
Cities > 500k 3,43 24,23 39,05 15,11 11,68 6,50
Towns 200-500k 3,00 25,86 42,56 15,09 8,74 4,75
Towns 100-200k 2,36 30,22 42,13 12,20 8,96 4,13
Towns 20-100k 2,42 28,65 42,83 14,18 8,26 3,67
Towns < 20k 3,48 31,10 38,76 14,76 8,23 3,67
Rural areas 3,46 31,57 38,75 13,53 8,53 4,16
Voivodship
Dolnośląskie 3,15 29,24 36,85 15,94 10,05 4,77
Kujawsko-pomorskie 4,25 29,13 39,06 13,39 8,35 5,83
Lubelskie 3,29 33,56 35,75 15,21 8,22 3,97
Lubuskie 2,66 23,96 39,35 11,24 13,61 9,17
Łódzkie 2,00 27,61 38,90 15,16 12,22 4,11
Małopolskie 3,56 31,70 41,04 10,89 8,38 4,43
Mazowieckie 3,06 26,31 39,52 15,20 10,27 5,65
Opolskie 2,91 38,08 36,63 12,21 8,14 2,03
Podkarpackie 1,35 36,64 42,19 11,41 6,61 1,80
Podlaskie 5,19 29,14 38,27 15,56 8,89 2,96
Pomorskie 4,29 24,00 41,29 17,71 8,14 4,57
Śląskie 3,24 27,83 47,57 11,52 6,29 3,55
Świętokrzyskie 2,76 29,65 40,45 14,32 8,79 4,02
Warmińsko-mazurskie 2,25 27,46 36,07 18,44 9,84 5,94
Wielkopolskie 2,78 32,65 39,13 13,69 8,42 3,33
Zachodniopomorskie 3,18 27,56 43,11 14,66 7,95 3,53
Education
Primary and below 3,32 33,42 37,78 12,85 8,31 4,31
Vocational 3,56 33,06 38,79 13,07 7,49 4,03
Secondary 2,76 26,67 42,93 13,94 8,91 4,80
Tertiary/post-secondary 2,76 23,65 40,93 17,03 11,55 4,08
Income per capita
First quartile 3,11 32,15 37,54 14,63 8,67 3,90
Middle 50% 3,19 29,33 40,54 13,66 8,66 4,62
Fourth quartile 2,93 27,85 41,12 15,06 8,78 4,26
Social-professional status
Public sector employees 2,64 25,48 41,94 14,75 11,23 3,96
Private sector employees 2,70 27,27 40,90 14,43 9,65 5,05
Self-employed 3,14 25,09 39,30 16,79 9,96 5,72
Farmers 3,62 30,03 37,58 15,41 9,28 4,09
Disability pensioners 3,12 33,97 38,69 11,46 8,34 4,42
Retirees 3,38 32,10 40,11 12,90 7,81 3,69
Students 3,16 29,44 42,55 15,14 6,17 3,54
Unemployed 3,82 28,36 38,19 15,74 8,45 5,44
Other professionally inactive 3,41 34,12 38,71 11,65 8,35 3,76

Social Diagnosis 2007 Appendix 2 126
© The Council for Social Monitoring
Table 61.22. To what extent are you satisfied with your participation in culture
Social-demografic group very
satisfied satisfied
quite
satisfied
rather
unsatisfied unsatisfied
very
unsatisfied
Total 2,34 18,79 34,27 20,57 16,34 7,69
Gender
Men 2,39 18,57 34,55 21,39 15,71 7,39
Women 2,32 18,98 34,03 19,85 16,88 7,94
Age
up to 24 years old 4,53 25,42 39,80 17,09 8,62 4,53
25-34 years old 2,75 22,18 38,57 18,04 13,13 5,33
35-44 years old 1,58 16,94 33,12 23,97 16,78 7,63
45-59 years old 1,71 15,21 30,32 22,08 20,60 10,09
60-64 years old 1,70 16,67 33,33 22,54 18,18 7,58
65+ years old 1,31 15,27 30,41 20,97 21,49 10,55
Place of residence
Cities > 500k 2,58 18,35 33,72 20,84 16,47 8,04
Towns 200-500k 2,29 19,18 35,36 19,65 16,81 6,71
Towns 100-200k 3,00 20,13 36,62 19,91 13,49 6,85
Towns 20-100k 2,32 17,92 36,01 21,49 15,64 6,61
Towns < 20k 2,06 18,71 35,56 21,48 14,15 8,04
Rural areas 2,24 19,05 32,15 20,04 17,98 8,54
Voivodship
Dolnośląskie 2,47 19,51 27,73 22,44 17,63 10,22
Kujawsko-pomorskie 2,69 19,93 34,11 20,47 15,98 6,82
Lubelskie 2,02 20,34 31,99 21,27 16,46 7,92
Lubuskie 2,84 11,70 37,23 19,50 21,28 7,45
Łódzkie 1,81 13,08 33,16 24,22 20,47 7,25
Małopolskie 3,07 21,16 34,07 19,37 14,50 7,83
Mazowieckie 2,17 17,52 37,68 17,38 17,92 7,33
Opolskie 2,35 21,81 34,90 15,10 19,13 6,71
Podkarpackie 1,38 24,22 29,93 20,59 16,61 7,27
Podlaskie 2,31 17,29 32,28 21,90 18,44 7,78
Pomorskie 3,36 18,63 36,18 21,07 14,05 6,72
Śląskie 2,68 18,14 36,77 23,36 11,93 7,13
Świętokrzyskie 2,72 18,48 29,08 23,37 15,49 10,87
Warmińsko-mazurskie 1,59 14,55 31,14 24,09 22,50 6,14
Wielkopolskie 1,78 22,88 37,87 17,06 13,71 6,71
Zachodniopomorskie 2,19 17,10 34,59 18,89 16,70 10,54
Education
Primary and below 1,39 14,78 28,46 22,09 20,58 12,70
Vocational 2,69 19,71 33,75 19,37 15,83 8,65
Secondary 2,41 19,10 35,69 20,32 16,28 6,19
Tertiary/post-secondary 2,47 19,91 37,18 21,72 14,05 4,67
Income per capita
First quartile 2,18 17,70 30,07 22,11 17,70 10,24
Middle 50% 2,08 18,18 33,11 20,54 17,22 8,87
Fourth quartile 2,62 19,69 37,18 20,89 14,69 4,94
Social-professional status
Public sector employees 2,91 18,42 37,74 21,55 13,28 6,10
Private sector employees 1,73 18,70 36,73 20,50 15,85 6,50
Self-employed 2,49 17,97 33,65 23,33 14,53 8,03
Farmers 1,40 18,07 29,12 21,05 20,88 9,47
Disability pensioners 1,47 15,23 30,47 22,11 19,66 11,06
Retirees 1,50 15,86 31,04 21,08 21,03 9,48
Students 4,78 27,39 40,05 16,88 7,40 3,50
Unemployed 3,44 18,28 28,48 19,21 19,21 11,39
Other professionally inactive 2,16 19,19 30,95 20,41 18,65 8,65
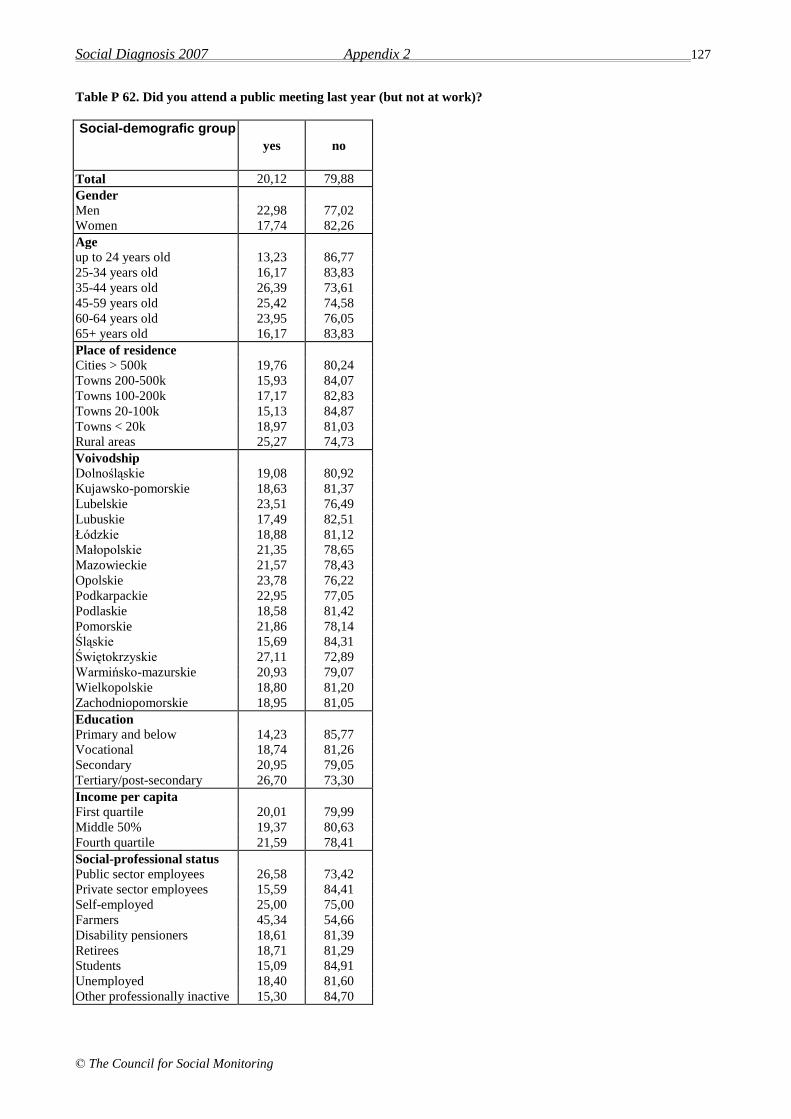
Social Diagnosis 2007 Appendix 2 127
© The Council for Social Monitoring
Table P 62. Did you attend a public meeting last year (but not at work)?
Social-demografic group
yes no
Total 20,12 79,88
Gender
Men 22,98 77,02
Women 17,74 82,26
Age
up to 24 years old 13,23 86,77
25-34 years old 16,17 83,83
35-44 years old 26,39 73,61
45-59 years old 25,42 74,58
60-64 years old 23,95 76,05
65+ years old 16,17 83,83
Place of residence
Cities > 500k 19,76 80,24
Towns 200-500k 15,93 84,07
Towns 100-200k 17,17 82,83
Towns 20-100k 15,13 84,87
Towns < 20k 18,97 81,03
Rural areas 25,27 74,73
Voivodship
Dolnośląskie 19,08 80,92
Kujawsko-pomorskie 18,63 81,37
Lubelskie 23,51 76,49
Lubuskie 17,49 82,51
Łódzkie 18,88 81,12
Małopolskie 21,35 78,65
Mazowieckie 21,57 78,43
Opolskie 23,78 76,22
Podkarpackie 22,95 77,05
Podlaskie 18,58 81,42
Pomorskie 21,86 78,14
Śląskie 15,69 84,31
Świętokrzyskie 27,11 72,89
Warmińsko-mazurskie 20,93 79,07
Wielkopolskie 18,80 81,20
Zachodniopomorskie 18,95 81,05
Education
Primary and below 14,23 85,77
Vocational 18,74 81,26
Secondary 20,95 79,05
Tertiary/post-secondary 26,70 73,30
Income per capita
First quartile 20,01 79,99
Middle 50% 19,37 80,63
Fourth quartile 21,59 78,41
Social-professional status
Public sector employees 26,58 73,42
Private sector employees 15,59 84,41
Self-employed 25,00 75,00
Farmers 45,34 54,66
Disability pensioners 18,61 81,39
Retirees 18,71 81,29
Students 15,09 84,91
Unemployed 18,40 81,60
Other professionally inactive 15,30 84,70
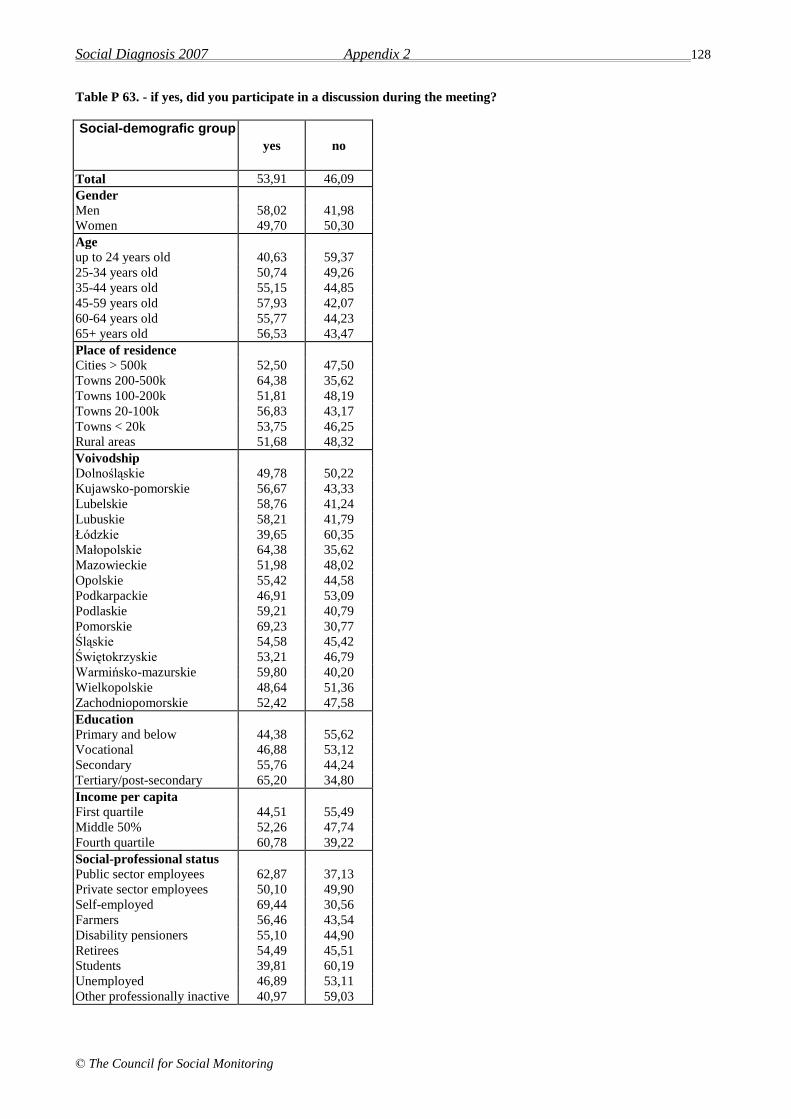
Social Diagnosis 2007 Appendix 2 128
© The Council for Social Monitoring
Table P 63. - if yes, did you participate in a discussion during the meeting?
Social-demografic group
yes no
Total 53,91 46,09
Gender
Men 58,02 41,98
Women 49,70 50,30
Age
up to 24 years old 40,63 59,37
25-34 years old 50,74 49,26
35-44 years old 55,15 44,85
45-59 years old 57,93 42,07
60-64 years old 55,77 44,23
65+ years old 56,53 43,47
Place of residence
Cities > 500k 52,50 47,50
Towns 200-500k 64,38 35,62
Towns 100-200k 51,81 48,19
Towns 20-100k 56,83 43,17
Towns < 20k 53,75 46,25
Rural areas 51,68 48,32
Voivodship
Dolnośląskie 49,78 50,22
Kujawsko-pomorskie 56,67 43,33
Lubelskie 58,76 41,24
Lubuskie 58,21 41,79
Łódzkie 39,65 60,35
Małopolskie 64,38 35,62
Mazowieckie 51,98 48,02
Opolskie 55,42 44,58
Podkarpackie 46,91 53,09
Podlaskie 59,21 40,79
Pomorskie 69,23 30,77
Śląskie 54,58 45,42
Świętokrzyskie 53,21 46,79
Warmińsko-mazurskie 59,80 40,20
Wielkopolskie 48,64 51,36
Zachodniopomorskie 52,42 47,58
Education
Primary and below 44,38 55,62
Vocational 46,88 53,12
Secondary 55,76 44,24
Tertiary/post-secondary 65,20 34,80
Income per capita
First quartile 44,51 55,49
Middle 50% 52,26 47,74
Fourth quartile 60,78 39,22
Social-professional status
Public sector employees 62,87 37,13
Private sector employees 50,10 49,90
Self-employed 69,44 30,56
Farmers 56,46 43,54
Disability pensioners 55,10 44,90
Retirees 54,49 45,51
Students 39,81 60,19
Unemployed 46,89 53,11
Other professionally inactive 40,97 59,03
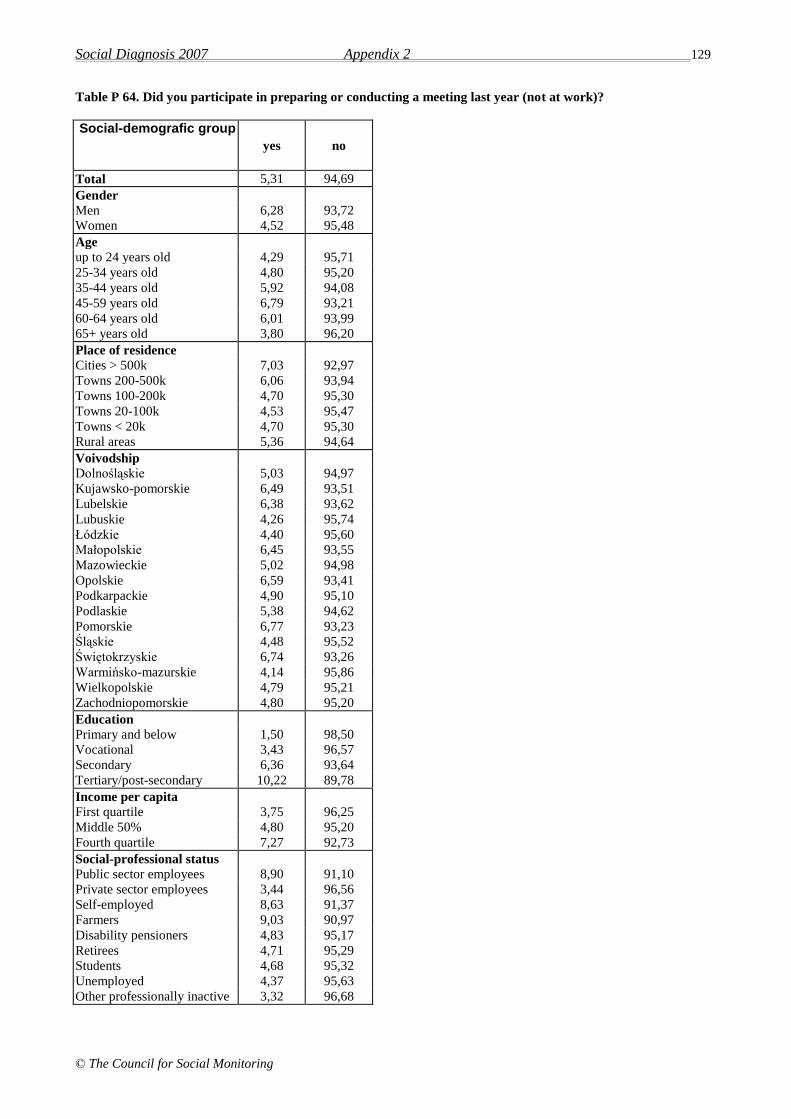
Social Diagnosis 2007 Appendix 2 129
© The Council for Social Monitoring
Table P 64. Did you participate in preparing or conducting a meeting last year (not at work)?
Social-demografic group
yes no
Total 5,31 94,69
Gender
Men 6,28 93,72
Women 4,52 95,48
Age
up to 24 years old 4,29 95,71
25-34 years old 4,80 95,20
35-44 years old 5,92 94,08
45-59 years old 6,79 93,21
60-64 years old 6,01 93,99
65+ years old 3,80 96,20
Place of residence
Cities > 500k 7,03 92,97
Towns 200-500k 6,06 93,94
Towns 100-200k 4,70 95,30
Towns 20-100k 4,53 95,47
Towns < 20k 4,70 95,30
Rural areas 5,36 94,64
Voivodship
Dolnośląskie 5,03 94,97
Kujawsko-pomorskie 6,49 93,51
Lubelskie 6,38 93,62
Lubuskie 4,26 95,74
Łódzkie 4,40 95,60
Małopolskie 6,45 93,55
Mazowieckie 5,02 94,98
Opolskie 6,59 93,41
Podkarpackie 4,90 95,10
Podlaskie 5,38 94,62
Pomorskie 6,77 93,23
Śląskie 4,48 95,52
Świętokrzyskie 6,74 93,26
Warmińsko-mazurskie 4,14 95,86
Wielkopolskie 4,79 95,21
Zachodniopomorskie 4,80 95,20
Education
Primary and below 1,50 98,50
Vocational 3,43 96,57
Secondary 6,36 93,64
Tertiary/post-secondary 10,22 89,78
Income per capita
First quartile 3,75 96,25
Middle 50% 4,80 95,20
Fourth quartile 7,27 92,73
Social-professional status
Public sector employees 8,90 91,10
Private sector employees 3,44 96,56
Self-employed 8,63 91,37
Farmers 9,03 90,97
Disability pensioners 4,83 95,17
Retirees 4,71 95,29
Students 4,68 95,32
Unemployed 4,37 95,63
Other professionally inactive 3,32 96,68

Social Diagnosis 2007 Appendix 2 130
© The Council for Social Monitoring
Table P 65. Generally speaking, would you say that most people can be trusted or that you can't be too careful in
dealing with people?
Social-demografic group Most
people can
be trusted
One can’t be too
careful in dealing
with people
It is difficult to
say
Total 11,55 77,40 11,05
Gender
Men 11,63 76,46 11,91
Women 11,49 78,16 10,35
Age
up to 24 years old 11,83 73,95 14,23
25-34 years old 11,76 77,78 10,46
35-44 years old 10,64 79,02 10,34
45-59 years old 11,89 78,60 9,51
60-64 years old 12,35 76,31 11,34
65+ years old 11,09 77,37 11,54
Place of residence
Cities > 500k 16,52 75,36 8,12
Towns 200-500k 10,24 80,98 8,78
Towns 100-200k 13,55 76,80 9,65
Towns 20-100k 8,94 80,82 10,23
Towns < 20k 10,14 77,88 11,98
Rural areas 11,93 74,97 13,10
Voivodship
Dolnośląskie 9,09 78,89 12,02
Kujawsko-pomorskie 10,25 81,07 8,68
Lubelskie 10,76 76,02 13,22
Lubuskie 9,38 77,13 13,49
Łódzkie 7,90 82,08 10,02
Małopolskie 12,43 76,59 10,98
Mazowieckie 12,93 75,92 11,14
Opolskie 10,69 77,17 12,14
Podkarpackie 12,28 76,80 10,93
Podlaskie 13,30 76,11 10,59
Pomorskie 12,31 79,92 7,78
Śląskie 11,88 78,13 10,00
Świętokrzyskie 10,18 75,57 14,25
Warmińsko-mazurskie 20,00 68,45 11,55
Wielkopolskie 10,69 77,88 11,43
Zachodniopomorskie 11,25 76,10 12,65
Education
Primary and below 9,60 76,40 14,00
Vocational 8,87 78,33 12,80
Secondary 11,02 79,19 9,80
Tertiary/post-secondary 18,78 73,81 7,41
Income per capita
First quartile 8,99 77,16 13,85
Middle 50% 10,81 77,70 11,49
Fourth quartile 14,95 76,97 8,08
Social-professional status
Public sector employees 15,18 76,88 7,95
Private sector employees 9,16 80,57 10,27
Self-employed 16,64 75,32 8,04
Farmers 11,60 77,90 10,50
Disability pensioners 9,15 78,47 12,37
Retirees 12,06 77,35 10,59
Students 13,54 71,43 15,03
Unemployed 7,87 78,59 13,54
Other professionally inactive 10,40 75,82 13,79

Social Diagnosis 2007 Appendix 2 131
© The Council for Social Monitoring
Table 66.1. How much good was done to you by other people in your whole life?
Social-demografic group
nothing not much a little much very much
Total 7,26 14,00 37,73 35,75 5,25
Gender
Men 7,65 15,19 40,62 32,88 3,67
Women 6,94 13,03 35,31 38,16 6,57
Age
up to 24 years old 5,56 10,75 32,83 44,31 6,55
25-34 years old 5,56 12,26 35,48 38,87 7,82
35-44 years old 6,99 13,72 42,03 33,16 4,10
45-59 years old 7,69 16,84 38,81 32,37 4,28
60-64 years old 8,71 16,42 38,19 33,67 3,02
65+ years old 9,98 13,95 38,83 32,82 4,42
Place of residence
Cities > 500k 5,25 7,88 31,66 46,32 8,90
Towns 200-500k 4,75 12,63 36,50 39,92 6,21
Towns 100-200k 5,59 14,19 35,96 38,06 6,19
Towns 20-100k 6,78 14,91 38,11 34,72 5,47
Towns < 20k 7,78 13,24 38,95 34,45 5,59
Rural areas 9,11 16,03 39,67 31,80 3,38
Voivodship
Dolnośląskie 10,38 15,36 35,30 34,79 4,17
Kujawsko-pomorskie 10,27 12,48 37,76 32,70 6,79
Lubelskie 7,44 14,74 39,26 36,09 2,48
Lubuskie 7,78 13,17 44,01 29,94 5,09
Łódzkie 7,16 16,11 37,35 35,32 4,06
Małopolskie 7,55 10,78 36,08 38,33 7,25
Mazowieckie 5,05 13,40 37,70 38,00 5,85
Opolskie 5,49 14,45 36,71 39,88 3,47
Podkarpackie 5,56 12,98 38,49 37,25 5,72
Podlaskie 7,58 16,16 39,90 32,58 3,79
Pomorskie 7,19 12,81 34,53 38,71 6,76
Śląskie 7,10 16,61 36,02 34,05 6,21
Świętokrzyskie 7,40 12,76 38,78 36,48 4,59
Warmińsko-mazurskie 5,65 12,55 41,63 34,52 5,65
Wielkopolskie 6,29 13,13 39,02 37,34 4,22
Zachodniopomorskie 10,52 14,62 40,46 29,77 4,63
Education
Primary and below 12,14 16,80 38,68 28,62 3,76
Vocational 9,36 16,82 40,72 29,48 3,62
Secondary 5,64 13,31 37,83 38,26 4,96
Tertiary/post-secondary 2,06 8,14 31,93 48,22 9,65
Income per capita
First quartile 9,99 17,75 40,94 28,01 3,31
Middle 50% 7,12 15,06 37,72 35,12 4,98
Fourth quartile 5,55 10,84 35,67 41,10 6,85
Social-professional status
Public sector employees 5,46 10,49 36,05 41,18 6,83
Private sector employees 5,86 14,43 39,17 36,12 4,42
Self-employed 5,98 13,77 34,78 38,77 6,70
Farmers 8,86 19,44 44,01 26,13 1,56
Disability pensioners 8,54 16,58 37,39 31,46 6,03
Retirees 8,93 14,37 39,57 33,15 3,98
Students 4,62 8,01 31,86 47,13 8,39
Unemployed 9,81 16,08 40,14 29,99 3,99
Other professionally inactive 9,40 17,52 33,06 33,18 6,84
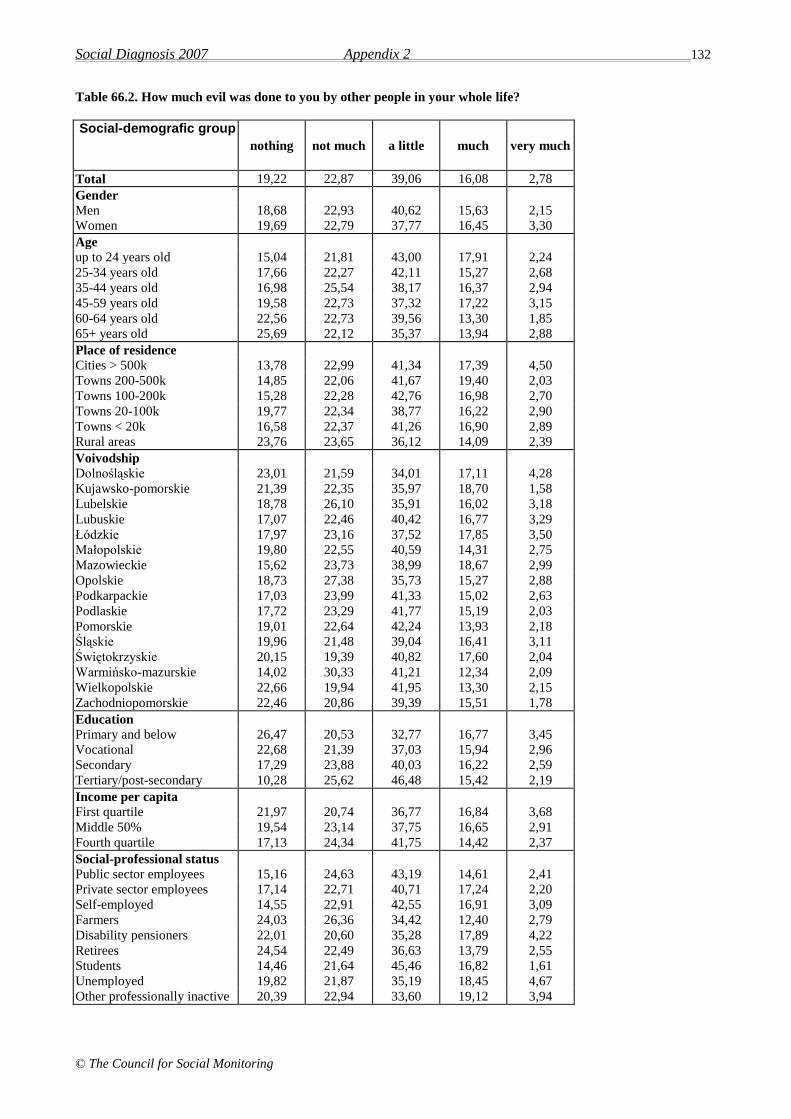
Social Diagnosis 2007 Appendix 2 132
© The Council for Social Monitoring
Table 66.2. How much evil was done to you by other people in your whole life?
Social-demografic group
nothing not much a little much very much
Total 19,22 22,87 39,06 16,08 2,78
Gender
Men 18,68 22,93 40,62 15,63 2,15
Women 19,69 22,79 37,77 16,45 3,30
Age
up to 24 years old 15,04 21,81 43,00 17,91 2,24
25-34 years old 17,66 22,27 42,11 15,27 2,68
35-44 years old 16,98 25,54 38,17 16,37 2,94
45-59 years old 19,58 22,73 37,32 17,22 3,15
60-64 years old 22,56 22,73 39,56 13,30 1,85
65+ years old 25,69 22,12 35,37 13,94 2,88
Place of residence
Cities > 500k 13,78 22,99 41,34 17,39 4,50
Towns 200-500k 14,85 22,06 41,67 19,40 2,03
Towns 100-200k 15,28 22,28 42,76 16,98 2,70
Towns 20-100k 19,77 22,34 38,77 16,22 2,90
Towns < 20k 16,58 22,37 41,26 16,90 2,89
Rural areas 23,76 23,65 36,12 14,09 2,39
Voivodship
Dolnośląskie 23,01 21,59 34,01 17,11 4,28
Kujawsko-pomorskie 21,39 22,35 35,97 18,70 1,58
Lubelskie 18,78 26,10 35,91 16,02 3,18
Lubuskie 17,07 22,46 40,42 16,77 3,29
Łódzkie 17,97 23,16 37,52 17,85 3,50
Małopolskie 19,80 22,55 40,59 14,31 2,75
Mazowieckie 15,62 23,73 38,99 18,67 2,99
Opolskie 18,73 27,38 35,73 15,27 2,88
Podkarpackie 17,03 23,99 41,33 15,02 2,63
Podlaskie 17,72 23,29 41,77 15,19 2,03
Pomorskie 19,01 22,64 42,24 13,93 2,18
Śląskie 19,96 21,48 39,04 16,41 3,11
Świętokrzyskie 20,15 19,39 40,82 17,60 2,04
Warmińsko-mazurskie 14,02 30,33 41,21 12,34 2,09
Wielkopolskie 22,66 19,94 41,95 13,30 2,15
Zachodniopomorskie 22,46 20,86 39,39 15,51 1,78
Education
Primary and below 26,47 20,53 32,77 16,77 3,45
Vocational 22,68 21,39 37,03 15,94 2,96
Secondary 17,29 23,88 40,03 16,22 2,59
Tertiary/post-secondary 10,28 25,62 46,48 15,42 2,19
Income per capita
First quartile 21,97 20,74 36,77 16,84 3,68
Middle 50% 19,54 23,14 37,75 16,65 2,91
Fourth quartile 17,13 24,34 41,75 14,42 2,37
Social-professional status
Public sector employees 15,16 24,63 43,19 14,61 2,41
Private sector employees 17,14 22,71 40,71 17,24 2,20
Self-employed 14,55 22,91 42,55 16,91 3,09
Farmers 24,03 26,36 34,42 12,40 2,79
Disability pensioners 22,01 20,60 35,28 17,89 4,22
Retirees 24,54 22,49 36,63 13,79 2,55
Students 14,46 21,64 45,46 16,82 1,61
Unemployed 19,82 21,87 35,19 18,45 4,67
Other professionally inactive 20,39 22,94 33,60 19,12 3,94
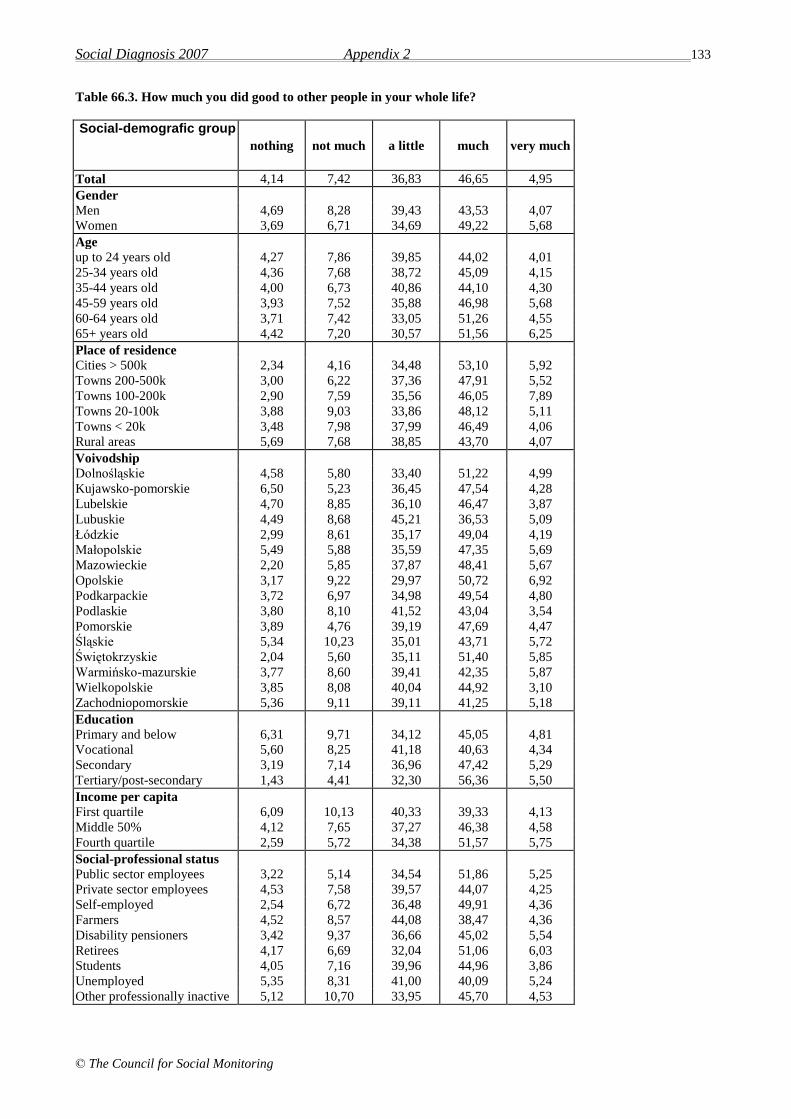
Social Diagnosis 2007 Appendix 2 133
© The Council for Social Monitoring
Table 66.3. How much you did good to other people in your whole life?
Social-demografic group
nothing not much a little much very much
Total 4,14 7,42 36,83 46,65 4,95
Gender
Men 4,69 8,28 39,43 43,53 4,07
Women 3,69 6,71 34,69 49,22 5,68
Age
up to 24 years old 4,27 7,86 39,85 44,02 4,01
25-34 years old 4,36 7,68 38,72 45,09 4,15
35-44 years old 4,00 6,73 40,86 44,10 4,30
45-59 years old 3,93 7,52 35,88 46,98 5,68
60-64 years old 3,71 7,42 33,05 51,26 4,55
65+ years old 4,42 7,20 30,57 51,56 6,25
Place of residence
Cities > 500k 2,34 4,16 34,48 53,10 5,92
Towns 200-500k 3,00 6,22 37,36 47,91 5,52
Towns 100-200k 2,90 7,59 35,56 46,05 7,89
Towns 20-100k 3,88 9,03 33,86 48,12 5,11
Towns < 20k 3,48 7,98 37,99 46,49 4,06
Rural areas 5,69 7,68 38,85 43,70 4,07
Voivodship
Dolnośląskie 4,58 5,80 33,40 51,22 4,99
Kujawsko-pomorskie 6,50 5,23 36,45 47,54 4,28
Lubelskie 4,70 8,85 36,10 46,47 3,87
Lubuskie 4,49 8,68 45,21 36,53 5,09
Łódzkie 2,99 8,61 35,17 49,04 4,19
Małopolskie 5,49 5,88 35,59 47,35 5,69
Mazowieckie 2,20 5,85 37,87 48,41 5,67
Opolskie 3,17 9,22 29,97 50,72 6,92
Podkarpackie 3,72 6,97 34,98 49,54 4,80
Podlaskie 3,80 8,10 41,52 43,04 3,54
Pomorskie 3,89 4,76 39,19 47,69 4,47
Śląskie 5,34 10,23 35,01 43,71 5,72
Świętokrzyskie 2,04 5,60 35,11 51,40 5,85
Warmińsko-mazurskie 3,77 8,60 39,41 42,35 5,87
Wielkopolskie 3,85 8,08 40,04 44,92 3,10
Zachodniopomorskie 5,36 9,11 39,11 41,25 5,18
Education
Primary and below 6,31 9,71 34,12 45,05 4,81
Vocational 5,60 8,25 41,18 40,63 4,34
Secondary 3,19 7,14 36,96 47,42 5,29
Tertiary/post-secondary 1,43 4,41 32,30 56,36 5,50
Income per capita
First quartile 6,09 10,13 40,33 39,33 4,13
Middle 50% 4,12 7,65 37,27 46,38 4,58
Fourth quartile 2,59 5,72 34,38 51,57 5,75
Social-professional status
Public sector employees 3,22 5,14 34,54 51,86 5,25
Private sector employees 4,53 7,58 39,57 44,07 4,25
Self-employed 2,54 6,72 36,48 49,91 4,36
Farmers 4,52 8,57 44,08 38,47 4,36
Disability pensioners 3,42 9,37 36,66 45,02 5,54
Retirees 4,17 6,69 32,04 51,06 6,03
Students 4,05 7,16 39,96 44,96 3,86
Unemployed 5,35 8,31 41,00 40,09 5,24
Other professionally inactive 5,12 10,70 33,95 45,70 4,53
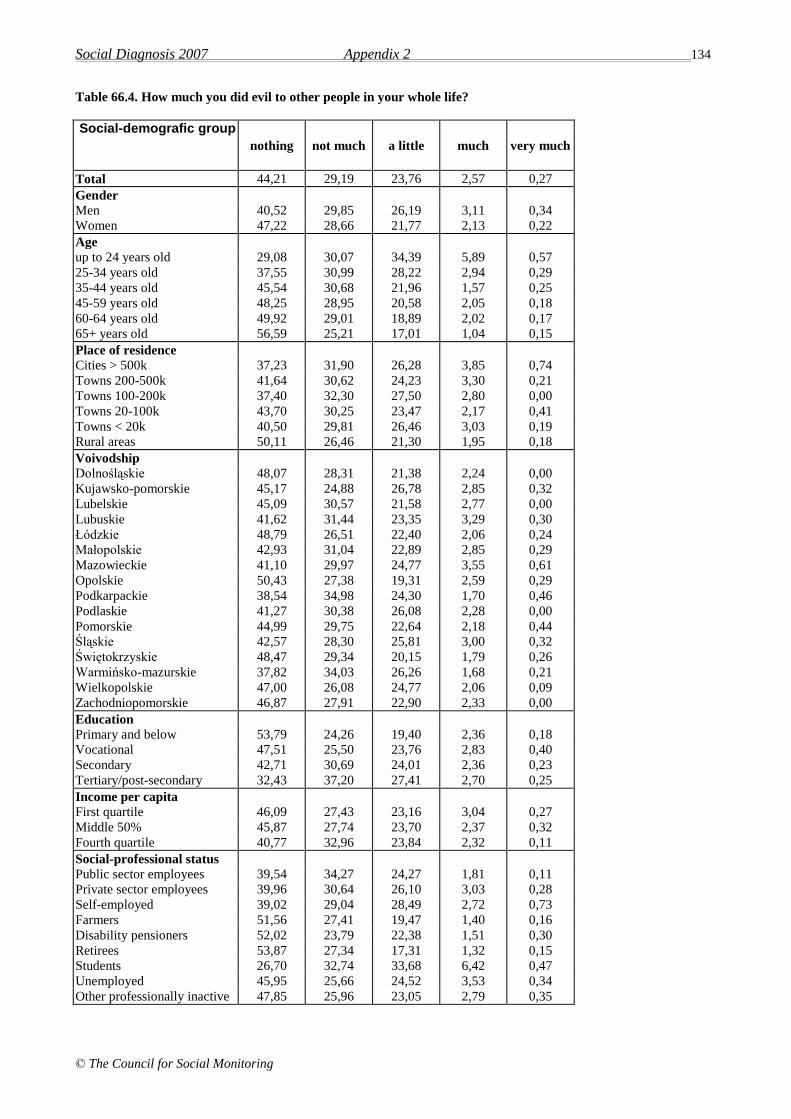
Social Diagnosis 2007 Appendix 2 134
© The Council for Social Monitoring
Table 66.4. How much you did evil to other people in your whole life?
Social-demografic group
nothing not much a little much very much
Total 44,21 29,19 23,76 2,57 0,27
Gender
Men 40,52 29,85 26,19 3,11 0,34
Women 47,22 28,66 21,77 2,13 0,22
Age
up to 24 years old 29,08 30,07 34,39 5,89 0,57
25-34 years old 37,55 30,99 28,22 2,94 0,29
35-44 years old 45,54 30,68 21,96 1,57 0,25
45-59 years old 48,25 28,95 20,58 2,05 0,18
60-64 years old 49,92 29,01 18,89 2,02 0,17
65+ years old 56,59 25,21 17,01 1,04 0,15
Place of residence
Cities > 500k 37,23 31,90 26,28 3,85 0,74
Towns 200-500k 41,64 30,62 24,23 3,30 0,21
Towns 100-200k 37,40 32,30 27,50 2,80 0,00
Towns 20-100k 43,70 30,25 23,47 2,17 0,41
Towns < 20k 40,50 29,81 26,46 3,03 0,19
Rural areas 50,11 26,46 21,30 1,95 0,18
Voivodship
Dolnośląskie 48,07 28,31 21,38 2,24 0,00
Kujawsko-pomorskie 45,17 24,88 26,78 2,85 0,32
Lubelskie 45,09 30,57 21,58 2,77 0,00
Lubuskie 41,62 31,44 23,35 3,29 0,30
Łódzkie 48,79 26,51 22,40 2,06 0,24
Małopolskie 42,93 31,04 22,89 2,85 0,29
Mazowieckie 41,10 29,97 24,77 3,55 0,61
Opolskie 50,43 27,38 19,31 2,59 0,29
Podkarpackie 38,54 34,98 24,30 1,70 0,46
Podlaskie 41,27 30,38 26,08 2,28 0,00
Pomorskie 44,99 29,75 22,64 2,18 0,44
Śląskie 42,57 28,30 25,81 3,00 0,32
Świętokrzyskie 48,47 29,34 20,15 1,79 0,26
Warmińsko-mazurskie 37,82 34,03 26,26 1,68 0,21
Wielkopolskie 47,00 26,08 24,77 2,06 0,09
Zachodniopomorskie 46,87 27,91 22,90 2,33 0,00
Education
Primary and below 53,79 24,26 19,40 2,36 0,18
Vocational 47,51 25,50 23,76 2,83 0,40
Secondary 42,71 30,69 24,01 2,36 0,23
Tertiary/post-secondary 32,43 37,20 27,41 2,70 0,25
Income per capita
First quartile 46,09 27,43 23,16 3,04 0,27
Middle 50% 45,87 27,74 23,70 2,37 0,32
Fourth quartile 40,77 32,96 23,84 2,32 0,11
Social-professional status
Public sector employees 39,54 34,27 24,27 1,81 0,11
Private sector employees 39,96 30,64 26,10 3,03 0,28
Self-employed 39,02 29,04 28,49 2,72 0,73
Farmers 51,56 27,41 19,47 1,40 0,16
Disability pensioners 52,02 23,79 22,38 1,51 0,30
Retirees 53,87 27,34 17,31 1,32 0,15
Students 26,70 32,74 33,68 6,42 0,47
Unemployed 45,95 25,66 24,52 3,53 0,34
Other professionally inactive 47,85 25,96 23,05 2,79 0,35
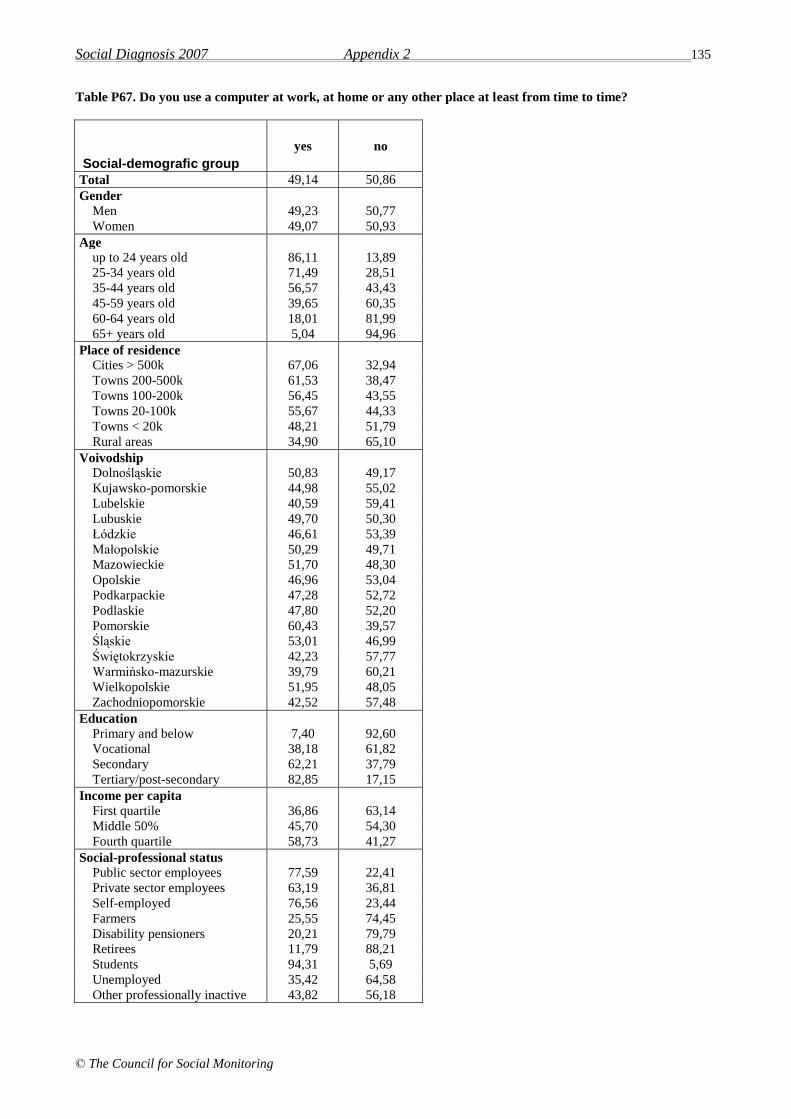
Social Diagnosis 2007 Appendix 2 135
© The Council for Social Monitoring
Table P67. Do you use a computer at work, at home or any other place at least from time to time?
Social-demografic group
yes no
Total 49,14 50,86
Gender
Men 49,23 50,77
Women 49,07 50,93
Age
up to 24 years old 86,11 13,89
25-34 years old 71,49 28,51
35-44 years old 56,57 43,43
45-59 years old 39,65 60,35
60-64 years old 18,01 81,99
65+ years old 5,04 94,96
Place of residence
Cities > 500k 67,06 32,94
Towns 200-500k 61,53 38,47
Towns 100-200k 56,45 43,55
Towns 20-100k 55,67 44,33
Towns < 20k 48,21 51,79
Rural areas 34,90 65,10
Voivodship
Dolnośląskie 50,83 49,17
Kujawsko-pomorskie 44,98 55,02
Lubelskie 40,59 59,41
Lubuskie 49,70 50,30
Łódzkie 46,61 53,39
Małopolskie 50,29 49,71
Mazowieckie 51,70 48,30
Opolskie 46,96 53,04
Podkarpackie 47,28 52,72
Podlaskie 47,80 52,20
Pomorskie 60,43 39,57
Śląskie 53,01 46,99
Świętokrzyskie 42,23 57,77
Warmińsko-mazurskie 39,79 60,21
Wielkopolskie 51,95 48,05
Zachodniopomorskie 42,52 57,48
Education
Primary and below 7,40 92,60
Vocational 38,18 61,82
Secondary 62,21 37,79
Tertiary/post-secondary 82,85 17,15
Income per capita
First quartile 36,86 63,14
Middle 50% 45,70 54,30
Fourth quartile 58,73 41,27
Social-professional status
Public sector employees 77,59 22,41
Private sector employees 63,19 36,81
Self-employed 76,56 23,44
Farmers 25,55 74,45
Disability pensioners 20,21 79,79
Retirees 11,79 88,21
Students 94,31 5,69
Unemployed 35,42 64,58
Other professionally inactive 43,82 56,18
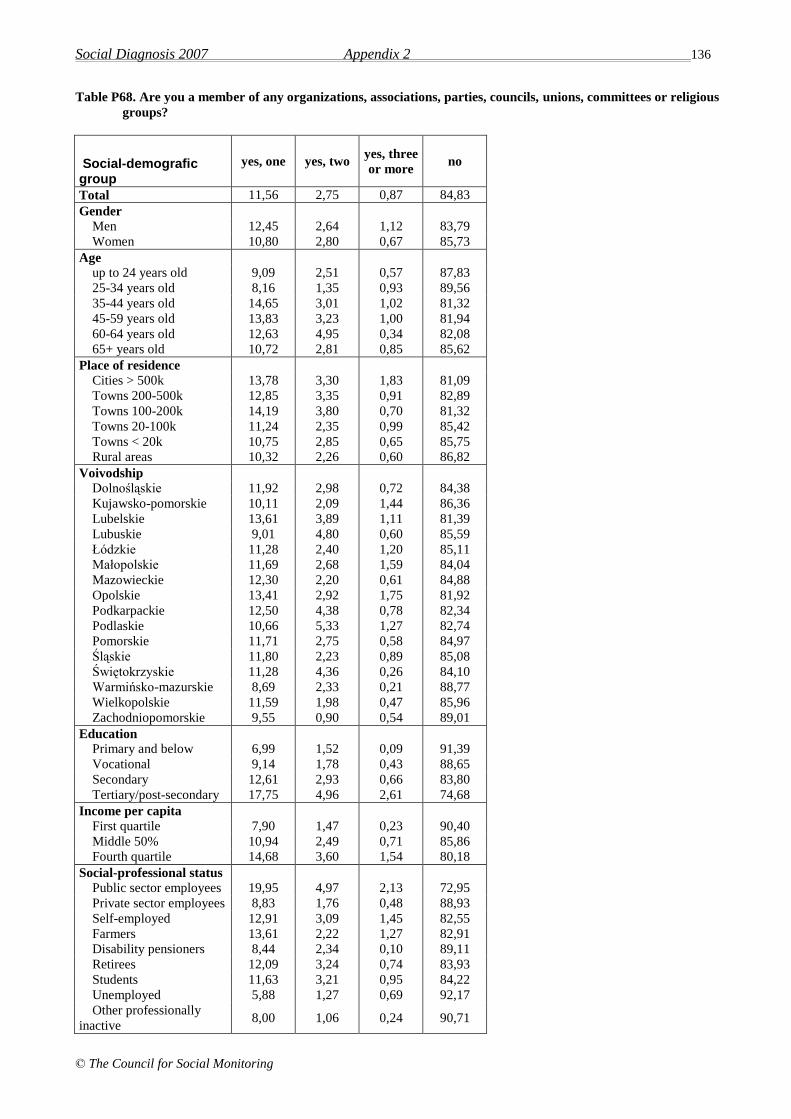
Social Diagnosis 2007 Appendix 2 136
© The Council for Social Monitoring
Table P68. Are you a member of any organizations, associations, parties, councils, unions, committees or religious
groups?
Social-demografic group
yes, one yes, two yes, three
or more no
Total 11,56 2,75 0,87 84,83
Gender
Men 12,45 2,64 1,12 83,79
Women 10,80 2,80 0,67 85,73
Age
up to 24 years old 9,09 2,51 0,57 87,83
25-34 years old 8,16 1,35 0,93 89,56
35-44 years old 14,65 3,01 1,02 81,32
45-59 years old 13,83 3,23 1,00 81,94
60-64 years old 12,63 4,95 0,34 82,08
65+ years old 10,72 2,81 0,85 85,62
Place of residence
Cities > 500k 13,78 3,30 1,83 81,09
Towns 200-500k 12,85 3,35 0,91 82,89
Towns 100-200k 14,19 3,80 0,70 81,32
Towns 20-100k 11,24 2,35 0,99 85,42
Towns < 20k 10,75 2,85 0,65 85,75
Rural areas 10,32 2,26 0,60 86,82
Voivodship
Dolnośląskie 11,92 2,98 0,72 84,38
Kujawsko-pomorskie 10,11 2,09 1,44 86,36
Lubelskie 13,61 3,89 1,11 81,39
Lubuskie 9,01 4,80 0,60 85,59
Łódzkie 11,28 2,40 1,20 85,11
Małopolskie 11,69 2,68 1,59 84,04
Mazowieckie 12,30 2,20 0,61 84,88
Opolskie 13,41 2,92 1,75 81,92
Podkarpackie 12,50 4,38 0,78 82,34
Podlaskie 10,66 5,33 1,27 82,74
Pomorskie 11,71 2,75 0,58 84,97
Śląskie 11,80 2,23 0,89 85,08
Świętokrzyskie 11,28 4,36 0,26 84,10
Warmińsko-mazurskie 8,69 2,33 0,21 88,77
Wielkopolskie 11,59 1,98 0,47 85,96
Zachodniopomorskie 9,55 0,90 0,54 89,01
Education
Primary and below 6,99 1,52 0,09 91,39
Vocational 9,14 1,78 0,43 88,65
Secondary 12,61 2,93 0,66 83,80
Tertiary/post-secondary 17,75 4,96 2,61 74,68
Income per capita
First quartile 7,90 1,47 0,23 90,40
Middle 50% 10,94 2,49 0,71 85,86
Fourth quartile 14,68 3,60 1,54 80,18
Social-professional status
Public sector employees 19,95 4,97 2,13 72,95
Private sector employees 8,83 1,76 0,48 88,93
Self-employed 12,91 3,09 1,45 82,55
Farmers 13,61 2,22 1,27 82,91
Disability pensioners 8,44 2,34 0,10 89,11
Retirees 12,09 3,24 0,74 83,93
Students 11,63 3,21 0,95 84,22
Unemployed 5,88 1,27 0,69 92,17
Other professionally
inactive 8,00 1,06 0,24 90,71
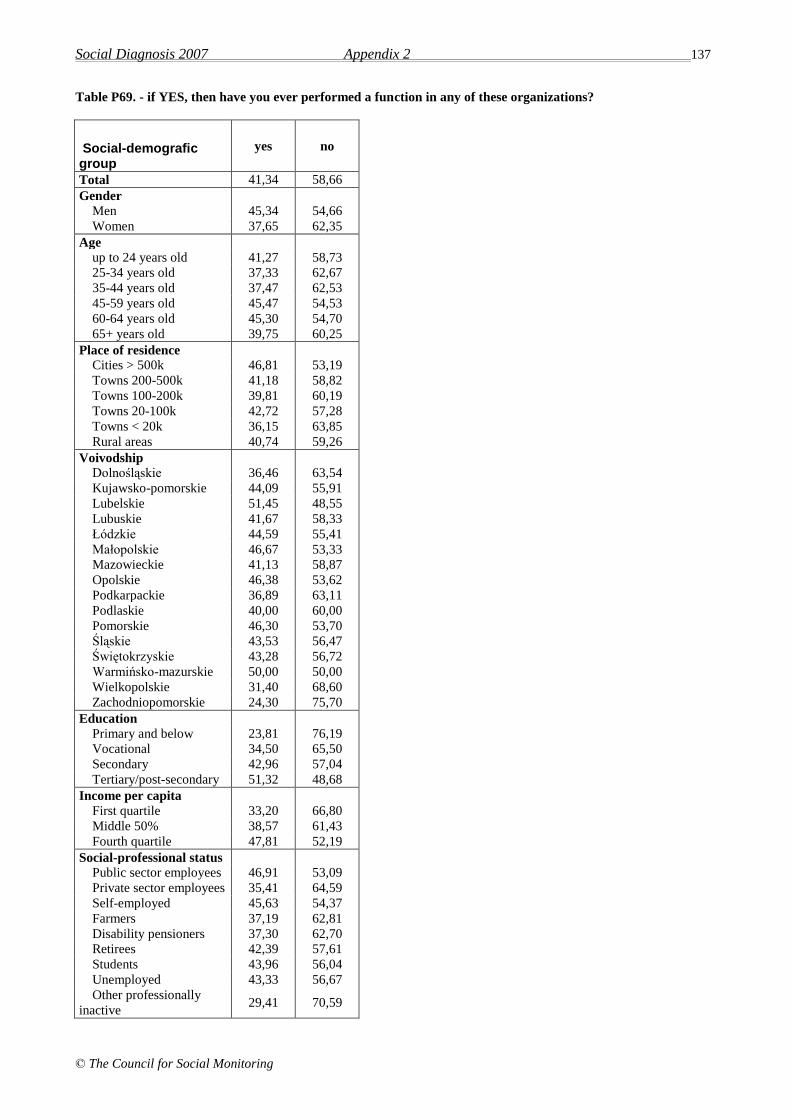
Social Diagnosis 2007 Appendix 2 137
© The Council for Social Monitoring
Table P69. - if YES, then have you ever performed a function in any of these organizations?
Social-demografic group
yes no
Total 41,34 58,66
Gender
Men 45,34 54,66
Women 37,65 62,35
Age
up to 24 years old 41,27 58,73
25-34 years old 37,33 62,67
35-44 years old 37,47 62,53
45-59 years old 45,47 54,53
60-64 years old 45,30 54,70
65+ years old 39,75 60,25
Place of residence
Cities > 500k 46,81 53,19
Towns 200-500k 41,18 58,82
Towns 100-200k 39,81 60,19
Towns 20-100k 42,72 57,28
Towns < 20k 36,15 63,85
Rural areas 40,74 59,26
Voivodship
Dolnośląskie 36,46 63,54
Kujawsko-pomorskie 44,09 55,91
Lubelskie 51,45 48,55
Lubuskie 41,67 58,33
Łódzkie 44,59 55,41
Małopolskie 46,67 53,33
Mazowieckie 41,13 58,87
Opolskie 46,38 53,62
Podkarpackie 36,89 63,11
Podlaskie 40,00 60,00
Pomorskie 46,30 53,70
Śląskie 43,53 56,47
Świętokrzyskie 43,28 56,72
Warmińsko-mazurskie 50,00 50,00
Wielkopolskie 31,40 68,60
Zachodniopomorskie 24,30 75,70
Education
Primary and below 23,81 76,19
Vocational 34,50 65,50
Secondary 42,96 57,04
Tertiary/post-secondary 51,32 48,68
Income per capita
First quartile 33,20 66,80
Middle 50% 38,57 61,43
Fourth quartile 47,81 52,19
Social-professional status
Public sector employees 46,91 53,09
Private sector employees 35,41 64,59
Self-employed 45,63 54,37
Farmers 37,19 62,81
Disability pensioners 37,30 62,70
Retirees 42,39 57,61
Students 43,96 56,04
Unemployed 43,33 56,67
Other professionally
inactive 29,41 70,59

Social Diagnosis 2007 Appendix 2 138
© The Council for Social Monitoring
Table P70.1. Someone pays lower taxes than he/she owes
Social-demografic group
I don’t
care at
all
I
actually
don’t
care
I care a
little
I care a
lot
It is
difficult to
say
Total 27,41 28,36 24,25 13,67 6,30
Gender
Men 27,11 28,03 24,67 14,92 5,27
Women 27,66 28,63 23,92 12,64 7,14
Age
up to 24 years old 33,13 28,55 20,80 9,67 7,85
25-34 years old 26,61 29,80 26,24 12,78 4,57
35-44 years old 23,75 29,82 26,20 13,86 6,37
45-59 years old 24,33 27,08 26,00 16,74 5,86
60-64 years old 26,26 26,09 24,58 16,67 6,40
65+ years old 32,08 27,93 20,22 12,26 7,51
Place of residence
Cities > 500k 23,48 25,68 27,87 17,70 5,27
Towns 200-500k 22,37 27,81 24,98 17,36 7,48
Towns 100-200k 22,33 31,59 21,83 18,01 6,24
Towns 20-100k 27,84 28,17 25,05 13,53 5,41
Towns < 20k 31,09 26,50 23,98 11,89 6,53
Rural areas 29,83 29,41 23,11 11,01 6,64
Voivodship
Dolnośląskie 31,05 25,61 25,10 13,11 5,12
Kujawsko-pomorskie 29,51 31,74 20,41 11,00 7,34
Lubelskie 25,03 29,32 24,48 15,08 6,09
Lubuskie 28,01 26,51 23,80 15,66 6,02
Łódzkie 28,09 29,53 26,77 10,08 5,52
Małopolskie 25,61 27,86 24,14 17,01 5,38
Mazowieckie 25,75 28,39 24,89 15,08 5,89
Opolskie 30,81 27,62 18,60 12,21 10,76
Podkarpackie 26,58 30,91 25,50 9,74 7,26
Podlaskie 25,51 27,04 26,79 12,24 8,42
Pomorskie 27,05 26,76 25,76 14,96 5,47
Śląskie 24,06 30,57 23,80 14,93 6,64
Świętokrzyskie 23,20 27,58 28,09 14,95 6,19
Warmińsko-mazurskie 43,58 22,32 18,95 9,68 5,47
Wielkopolskie 27,34 29,59 22,38 13,39 7,30
Zachodniopomorskie 27,93 25,95 26,67 14,05 5,41
Education
Primary and below 34,81 27,46 19,43 9,95 8,35
Vocational 31,06 28,91 21,93 10,80 7,30
Secondary 24,78 29,54 25,19 15,07 5,41
Tertiary/post-secondary 19,18 26,38 30,88 19,35 4,21
Income per capita
First quartile 31,56 27,28 22,63 10,84 7,70
Middle 50% 28,74 28,83 23,73 12,09 6,61
Fourth quartile 23,33 27,84 26,42 17,58 4,83
Social-professional status
Public sector employees 21,20 28,39 27,95 17,96 4,50
Private sector employees 25,22 30,31 25,70 13,57 5,20
Self-employed 24,00 26,18 27,64 17,64 4,55
Farmers 25,43 26,99 28,08 12,95 6,55
Disability pensioners 32,06 26,01 19,76 13,71 8,47
Retirees 29,38 28,33 22,41 13,27 6,61
Students 31,92 27,78 21,94 10,26 8,10
Unemployed 32,26 26,29 22,39 11,60 7,46
Other professionally
inactive 29,93 29,70 22,04 10,56 7,77

Social Diagnosis 2007 Appendix 2 139
© The Council for Social Monitoring
Table P70.2. Someone avoids paying for public transport (buses, trains)
Social-demografic group
I don’t
care at
all
I
actually
don’t
care
I care a
little
I care a
lot
It is
difficult to
say
Total 26,26 32,28 22,75 13,40 5,31
Gender
Men 26,29 31,91 22,69 14,26 4,85
Women 26,24 32,55 22,81 12,68 5,72
Age
up to 24 years old 33,45 35,54 17,69 7,91 5,41
25-34 years old 27,84 36,44 21,38 10,27 4,07
35-44 years old 22,70 34,95 24,08 13,01 5,26
45-59 years old 23,32 28,89 24,88 17,49 5,42
60-64 years old 23,44 25,97 26,14 19,56 4,89
65+ years old 26,80 29,15 23,35 13,90 6,80
Place of residence
Cities > 500k 25,13 30,83 22,64 16,65 4,75
Towns 200-500k 22,54 30,53 25,44 15,69 5,80
Towns 100-200k 19,05 32,16 25,00 18,55 5,24
Towns 20-100k 27,31 32,39 21,77 14,23 4,31
Towns < 20k 28,73 31,96 22,92 11,75 4,65
Rural areas 27,93 33,34 21,94 10,65 6,14
Voivodship
Dolnośląskie 29,74 29,85 24,41 12,62 3,38
Kujawsko-pomorskie 28,91 36,90 16,61 12,46 5,11
Lubelskie 26,53 32,22 22,08 14,03 5,14
Lubuskie 24,10 36,75 21,08 12,95 5,12
Łódzkie 27,76 34,13 20,91 12,50 4,69
Małopolskie 25,27 29,19 23,70 17,73 4,11
Mazowieckie 24,65 33,21 22,45 14,50 5,20
Opolskie 25,29 28,49 22,38 15,12 8,72
Podkarpackie 25,19 33,54 26,28 9,58 5,41
Podlaskie 21,79 31,03 27,44 12,56 7,18
Pomorskie 27,16 30,03 23,71 14,37 4,74
Śląskie 24,04 32,27 22,90 14,16 6,63
Świętokrzyskie 20,82 31,62 29,31 13,88 4,37
Warmińsko-mazurskie 37,84 29,18 19,66 9,09 4,23
Wielkopolskie 26,64 35,27 19,61 12,01 6,47
Zachodniopomorskie 25,63 30,87 25,81 12,09 5,60
Education
Primary and below 32,86 30,94 18,99 10,09 7,12
Vocational 29,56 33,49 20,03 10,76 6,16
Secondary 23,89 32,60 24,37 14,54 4,60
Tertiary/post-secondary 18,81 31,02 27,86 18,73 3,58
Income per capita
First quartile 31,24 32,97 19,97 10,03 5,79
Middle 50% 27,02 32,99 22,26 11,72 6,01
Fourth quartile 22,17 30,86 25,43 17,89 3,66
Social-professional status
Public sector employees 20,77 31,84 26,03 18,08 3,29
Private sector employees 24,67 35,39 22,54 13,09 4,31
Self-employed 26,36 29,82 24,73 14,91 4,18
Farmers 27,93 30,11 24,34 10,76 6,86
Disability pensioners 29,94 29,94 19,46 13,71 6,96
Retirees 25,20 28,67 24,35 15,32 6,46
Students 32,96 35,03 19,21 8,66 4,14
Unemployed 29,36 34,17 19,84 10,09 6,54
Other professionally
inactive 29,42 33,84 20,58 8,49 7,67
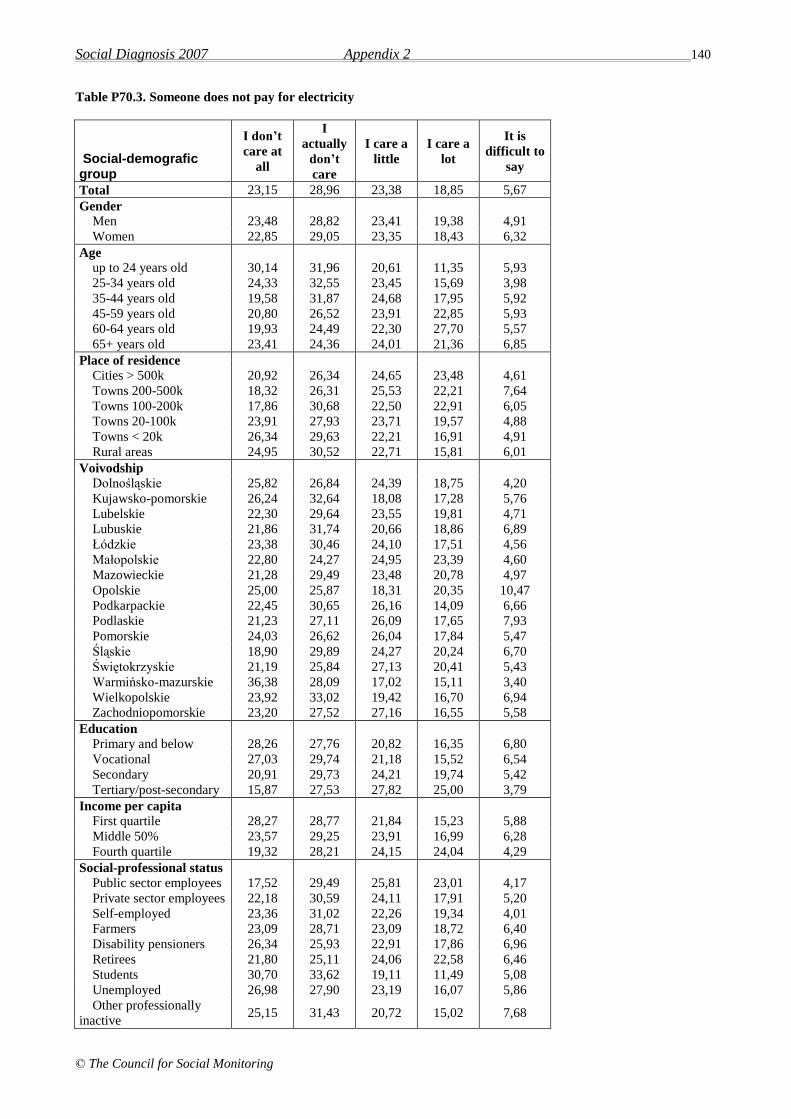
Social Diagnosis 2007 Appendix 2 140
© The Council for Social Monitoring
Table P70.3. Someone does not pay for electricity
Social-demografic group
I don’t
care at
all
I
actually
don’t
care
I care a
little
I care a
lot
It is
difficult to
say
Total 23,15 28,96 23,38 18,85 5,67
Gender
Men 23,48 28,82 23,41 19,38 4,91
Women 22,85 29,05 23,35 18,43 6,32
Age
up to 24 years old 30,14 31,96 20,61 11,35 5,93
25-34 years old 24,33 32,55 23,45 15,69 3,98
35-44 years old 19,58 31,87 24,68 17,95 5,92
45-59 years old 20,80 26,52 23,91 22,85 5,93
60-64 years old 19,93 24,49 22,30 27,70 5,57
65+ years old 23,41 24,36 24,01 21,36 6,85
Place of residence
Cities > 500k 20,92 26,34 24,65 23,48 4,61
Towns 200-500k 18,32 26,31 25,53 22,21 7,64
Towns 100-200k 17,86 30,68 22,50 22,91 6,05
Towns 20-100k 23,91 27,93 23,71 19,57 4,88
Towns < 20k 26,34 29,63 22,21 16,91 4,91
Rural areas 24,95 30,52 22,71 15,81 6,01
Voivodship
Dolnośląskie 25,82 26,84 24,39 18,75 4,20
Kujawsko-pomorskie 26,24 32,64 18,08 17,28 5,76
Lubelskie 22,30 29,64 23,55 19,81 4,71
Lubuskie 21,86 31,74 20,66 18,86 6,89
Łódzkie 23,38 30,46 24,10 17,51 4,56
Małopolskie 22,80 24,27 24,95 23,39 4,60
Mazowieckie 21,28 29,49 23,48 20,78 4,97
Opolskie 25,00 25,87 18,31 20,35 10,47
Podkarpackie 22,45 30,65 26,16 14,09 6,66
Podlaskie 21,23 27,11 26,09 17,65 7,93
Pomorskie 24,03 26,62 26,04 17,84 5,47
Śląskie 18,90 29,89 24,27 20,24 6,70
Świętokrzyskie 21,19 25,84 27,13 20,41 5,43
Warmińsko-mazurskie 36,38 28,09 17,02 15,11 3,40
Wielkopolskie 23,92 33,02 19,42 16,70 6,94
Zachodniopomorskie 23,20 27,52 27,16 16,55 5,58
Education
Primary and below 28,26 27,76 20,82 16,35 6,80
Vocational 27,03 29,74 21,18 15,52 6,54
Secondary 20,91 29,73 24,21 19,74 5,42
Tertiary/post-secondary 15,87 27,53 27,82 25,00 3,79
Income per capita
First quartile 28,27 28,77 21,84 15,23 5,88
Middle 50% 23,57 29,25 23,91 16,99 6,28
Fourth quartile 19,32 28,21 24,15 24,04 4,29
Social-professional status
Public sector employees 17,52 29,49 25,81 23,01 4,17
Private sector employees 22,18 30,59 24,11 17,91 5,20
Self-employed 23,36 31,02 22,26 19,34 4,01
Farmers 23,09 28,71 23,09 18,72 6,40
Disability pensioners 26,34 25,93 22,91 17,86 6,96
Retirees 21,80 25,11 24,06 22,58 6,46
Students 30,70 33,62 19,11 11,49 5,08
Unemployed 26,98 27,90 23,19 16,07 5,86
Other professionally
inactive 25,15 31,43 20,72 15,02 7,68
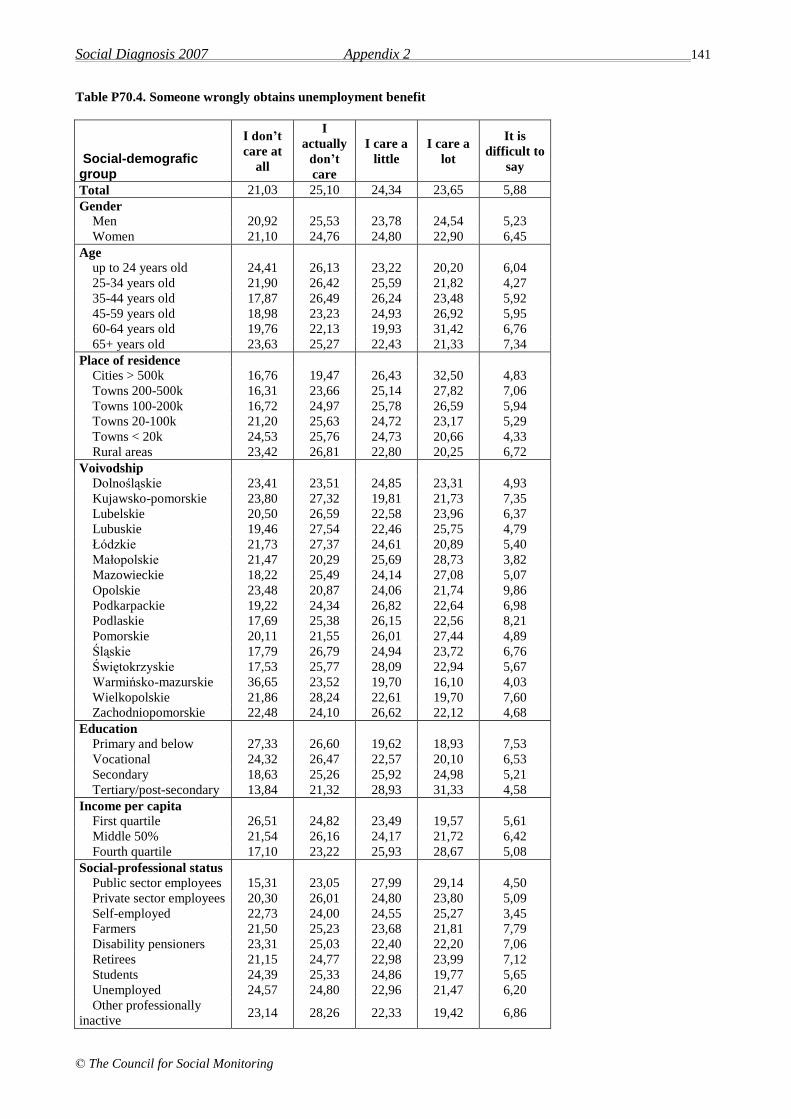
Social Diagnosis 2007 Appendix 2 141
© The Council for Social Monitoring
Table P70.4. Someone wrongly obtains unemployment benefit
Social-demografic group
I don’t
care at
all
I
actually
don’t
care
I care a
little
I care a
lot
It is
difficult to
say
Total 21,03 25,10 24,34 23,65 5,88
Gender
Men 20,92 25,53 23,78 24,54 5,23
Women 21,10 24,76 24,80 22,90 6,45
Age
up to 24 years old 24,41 26,13 23,22 20,20 6,04
25-34 years old 21,90 26,42 25,59 21,82 4,27
35-44 years old 17,87 26,49 26,24 23,48 5,92
45-59 years old 18,98 23,23 24,93 26,92 5,95
60-64 years old 19,76 22,13 19,93 31,42 6,76
65+ years old 23,63 25,27 22,43 21,33 7,34
Place of residence
Cities > 500k 16,76 19,47 26,43 32,50 4,83
Towns 200-500k 16,31 23,66 25,14 27,82 7,06
Towns 100-200k 16,72 24,97 25,78 26,59 5,94
Towns 20-100k 21,20 25,63 24,72 23,17 5,29
Towns < 20k 24,53 25,76 24,73 20,66 4,33
Rural areas 23,42 26,81 22,80 20,25 6,72
Voivodship
Dolnośląskie 23,41 23,51 24,85 23,31 4,93
Kujawsko-pomorskie 23,80 27,32 19,81 21,73 7,35
Lubelskie 20,50 26,59 22,58 23,96 6,37
Lubuskie 19,46 27,54 22,46 25,75 4,79
Łódzkie 21,73 27,37 24,61 20,89 5,40
Małopolskie 21,47 20,29 25,69 28,73 3,82
Mazowieckie 18,22 25,49 24,14 27,08 5,07
Opolskie 23,48 20,87 24,06 21,74 9,86
Podkarpackie 19,22 24,34 26,82 22,64 6,98
Podlaskie 17,69 25,38 26,15 22,56 8,21
Pomorskie 20,11 21,55 26,01 27,44 4,89
Śląskie 17,79 26,79 24,94 23,72 6,76
Świętokrzyskie 17,53 25,77 28,09 22,94 5,67
Warmińsko-mazurskie 36,65 23,52 19,70 16,10 4,03
Wielkopolskie 21,86 28,24 22,61 19,70 7,60
Zachodniopomorskie 22,48 24,10 26,62 22,12 4,68
Education
Primary and below 27,33 26,60 19,62 18,93 7,53
Vocational 24,32 26,47 22,57 20,10 6,53
Secondary 18,63 25,26 25,92 24,98 5,21
Tertiary/post-secondary 13,84 21,32 28,93 31,33 4,58
Income per capita
First quartile 26,51 24,82 23,49 19,57 5,61
Middle 50% 21,54 26,16 24,17 21,72 6,42
Fourth quartile 17,10 23,22 25,93 28,67 5,08
Social-professional status
Public sector employees 15,31 23,05 27,99 29,14 4,50
Private sector employees 20,30 26,01 24,80 23,80 5,09
Self-employed 22,73 24,00 24,55 25,27 3,45
Farmers 21,50 25,23 23,68 21,81 7,79
Disability pensioners 23,31 25,03 22,40 22,20 7,06
Retirees 21,15 24,77 22,98 23,99 7,12
Students 24,39 25,33 24,86 19,77 5,65
Unemployed 24,57 24,80 22,96 21,47 6,20
Other professionally
inactive 23,14 28,26 22,33 19,42 6,86
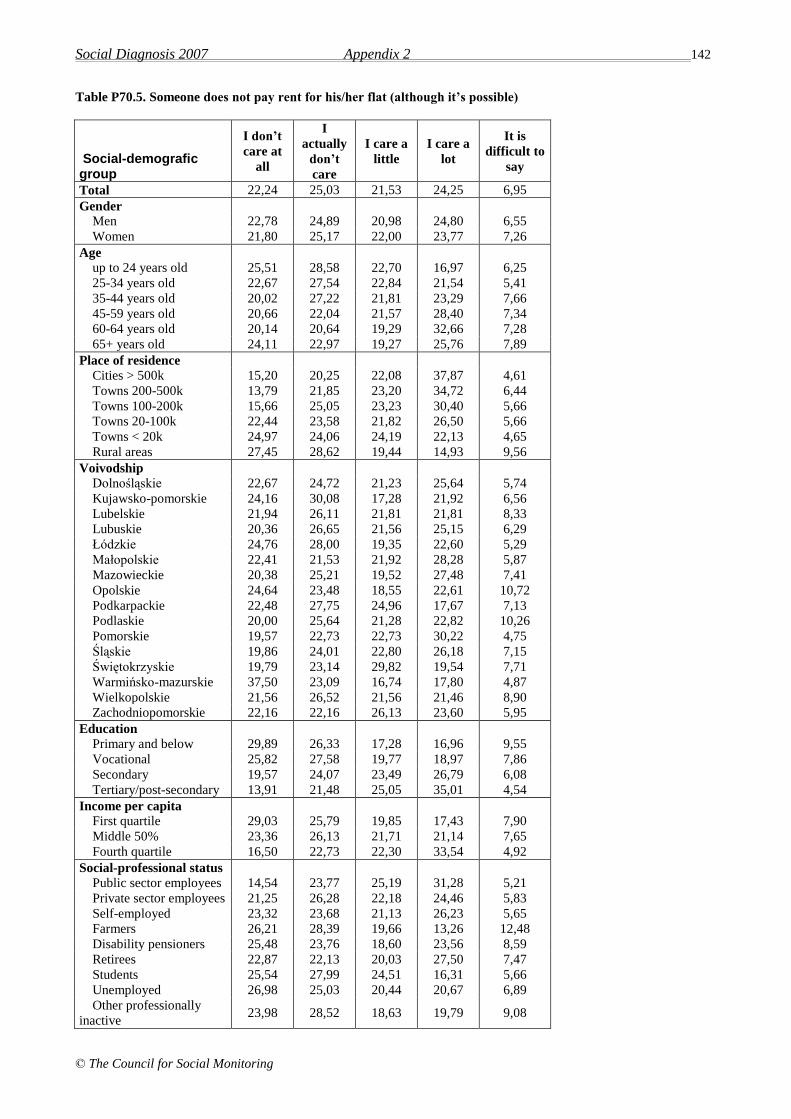
Social Diagnosis 2007 Appendix 2 142
© The Council for Social Monitoring
Table P70.5. Someone does not pay rent for his/her flat (although it’s possible)
Social-demografic group
I don’t
care at
all
I
actually
don’t
care
I care a
little
I care a
lot
It is
difficult to
say
Total 22,24 25,03 21,53 24,25 6,95
Gender
Men 22,78 24,89 20,98 24,80 6,55
Women 21,80 25,17 22,00 23,77 7,26
Age
up to 24 years old 25,51 28,58 22,70 16,97 6,25
25-34 years old 22,67 27,54 22,84 21,54 5,41
35-44 years old 20,02 27,22 21,81 23,29 7,66
45-59 years old 20,66 22,04 21,57 28,40 7,34
60-64 years old 20,14 20,64 19,29 32,66 7,28
65+ years old 24,11 22,97 19,27 25,76 7,89
Place of residence
Cities > 500k 15,20 20,25 22,08 37,87 4,61
Towns 200-500k 13,79 21,85 23,20 34,72 6,44
Towns 100-200k 15,66 25,05 23,23 30,40 5,66
Towns 20-100k 22,44 23,58 21,82 26,50 5,66
Towns < 20k 24,97 24,06 24,19 22,13 4,65
Rural areas 27,45 28,62 19,44 14,93 9,56
Voivodship
Dolnośląskie 22,67 24,72 21,23 25,64 5,74
Kujawsko-pomorskie 24,16 30,08 17,28 21,92 6,56
Lubelskie 21,94 26,11 21,81 21,81 8,33
Lubuskie 20,36 26,65 21,56 25,15 6,29
Łódzkie 24,76 28,00 19,35 22,60 5,29
Małopolskie 22,41 21,53 21,92 28,28 5,87
Mazowieckie 20,38 25,21 19,52 27,48 7,41
Opolskie 24,64 23,48 18,55 22,61 10,72
Podkarpackie 22,48 27,75 24,96 17,67 7,13
Podlaskie 20,00 25,64 21,28 22,82 10,26
Pomorskie 19,57 22,73 22,73 30,22 4,75
Śląskie 19,86 24,01 22,80 26,18 7,15
Świętokrzyskie 19,79 23,14 29,82 19,54 7,71
Warmińsko-mazurskie 37,50 23,09 16,74 17,80 4,87
Wielkopolskie 21,56 26,52 21,56 21,46 8,90
Zachodniopomorskie 22,16 22,16 26,13 23,60 5,95
Education
Primary and below 29,89 26,33 17,28 16,96 9,55
Vocational 25,82 27,58 19,77 18,97 7,86
Secondary 19,57 24,07 23,49 26,79 6,08
Tertiary/post-secondary 13,91 21,48 25,05 35,01 4,54
Income per capita
First quartile 29,03 25,79 19,85 17,43 7,90
Middle 50% 23,36 26,13 21,71 21,14 7,65
Fourth quartile 16,50 22,73 22,30 33,54 4,92
Social-professional status
Public sector employees 14,54 23,77 25,19 31,28 5,21
Private sector employees 21,25 26,28 22,18 24,46 5,83
Self-employed 23,32 23,68 21,13 26,23 5,65
Farmers 26,21 28,39 19,66 13,26 12,48
Disability pensioners 25,48 23,76 18,60 23,56 8,59
Retirees 22,87 22,13 20,03 27,50 7,47
Students 25,54 27,99 24,51 16,31 5,66
Unemployed 26,98 25,03 20,44 20,67 6,89
Other professionally
inactive 23,98 28,52 18,63 19,79 9,08
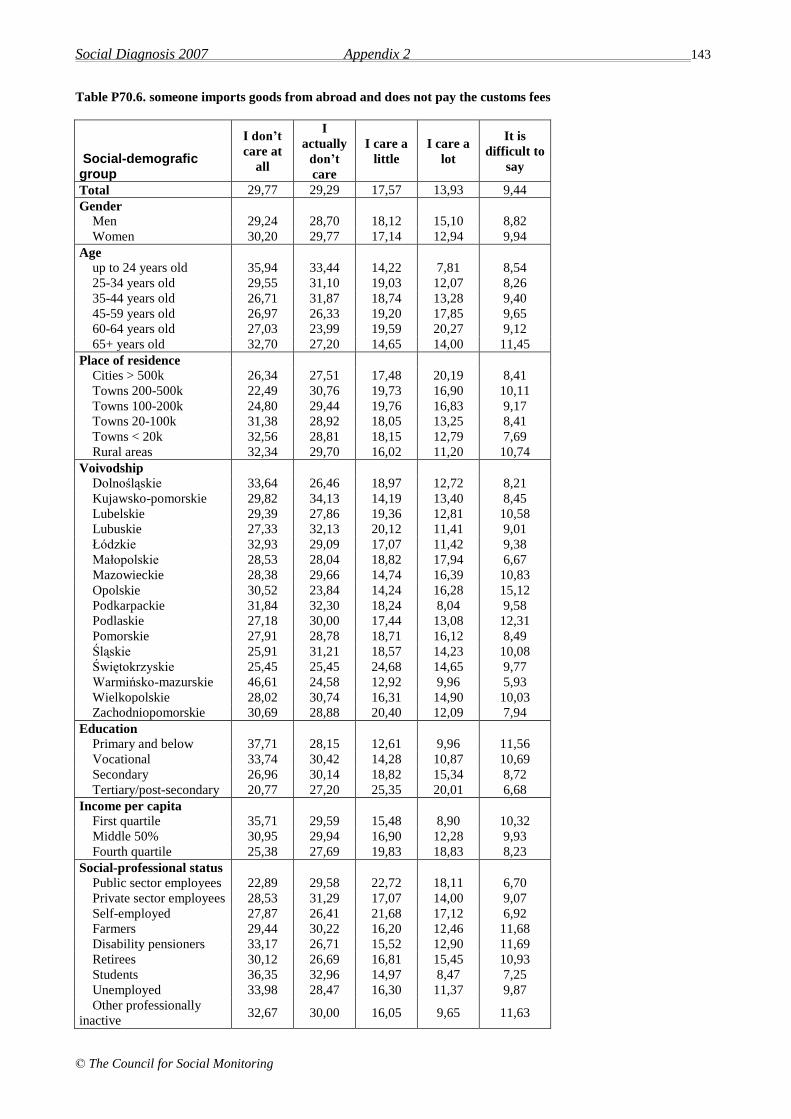
Social Diagnosis 2007 Appendix 2 143
© The Council for Social Monitoring
Table P70.6. someone imports goods from abroad and does not pay the customs fees
Social-demografic group
I don’t
care at
all
I
actually
don’t
care
I care a
little
I care a
lot
It is
difficult to
say
Total 29,77 29,29 17,57 13,93 9,44
Gender
Men 29,24 28,70 18,12 15,10 8,82
Women 30,20 29,77 17,14 12,94 9,94
Age
up to 24 years old 35,94 33,44 14,22 7,81 8,54
25-34 years old 29,55 31,10 19,03 12,07 8,26
35-44 years old 26,71 31,87 18,74 13,28 9,40
45-59 years old 26,97 26,33 19,20 17,85 9,65
60-64 years old 27,03 23,99 19,59 20,27 9,12
65+ years old 32,70 27,20 14,65 14,00 11,45
Place of residence
Cities > 500k 26,34 27,51 17,48 20,19 8,41
Towns 200-500k 22,49 30,76 19,73 16,90 10,11
Towns 100-200k 24,80 29,44 19,76 16,83 9,17
Towns 20-100k 31,38 28,92 18,05 13,25 8,41
Towns < 20k 32,56 28,81 18,15 12,79 7,69
Rural areas 32,34 29,70 16,02 11,20 10,74
Voivodship
Dolnośląskie 33,64 26,46 18,97 12,72 8,21
Kujawsko-pomorskie 29,82 34,13 14,19 13,40 8,45
Lubelskie 29,39 27,86 19,36 12,81 10,58
Lubuskie 27,33 32,13 20,12 11,41 9,01
Łódzkie 32,93 29,09 17,07 11,42 9,38
Małopolskie 28,53 28,04 18,82 17,94 6,67
Mazowieckie 28,38 29,66 14,74 16,39 10,83
Opolskie 30,52 23,84 14,24 16,28 15,12
Podkarpackie 31,84 32,30 18,24 8,04 9,58
Podlaskie 27,18 30,00 17,44 13,08 12,31
Pomorskie 27,91 28,78 18,71 16,12 8,49
Śląskie 25,91 31,21 18,57 14,23 10,08
Świętokrzyskie 25,45 25,45 24,68 14,65 9,77
Warmińsko-mazurskie 46,61 24,58 12,92 9,96 5,93
Wielkopolskie 28,02 30,74 16,31 14,90 10,03
Zachodniopomorskie 30,69 28,88 20,40 12,09 7,94
Education
Primary and below 37,71 28,15 12,61 9,96 11,56
Vocational 33,74 30,42 14,28 10,87 10,69
Secondary 26,96 30,14 18,82 15,34 8,72
Tertiary/post-secondary 20,77 27,20 25,35 20,01 6,68
Income per capita
First quartile 35,71 29,59 15,48 8,90 10,32
Middle 50% 30,95 29,94 16,90 12,28 9,93
Fourth quartile 25,38 27,69 19,83 18,83 8,23
Social-professional status
Public sector employees 22,89 29,58 22,72 18,11 6,70
Private sector employees 28,53 31,29 17,07 14,00 9,07
Self-employed 27,87 26,41 21,68 17,12 6,92
Farmers 29,44 30,22 16,20 12,46 11,68
Disability pensioners 33,17 26,71 15,52 12,90 11,69
Retirees 30,12 26,69 16,81 15,45 10,93
Students 36,35 32,96 14,97 8,47 7,25
Unemployed 33,98 28,47 16,30 11,37 9,87
Other professionally
inactive 32,67 30,00 16,05 9,65 11,63
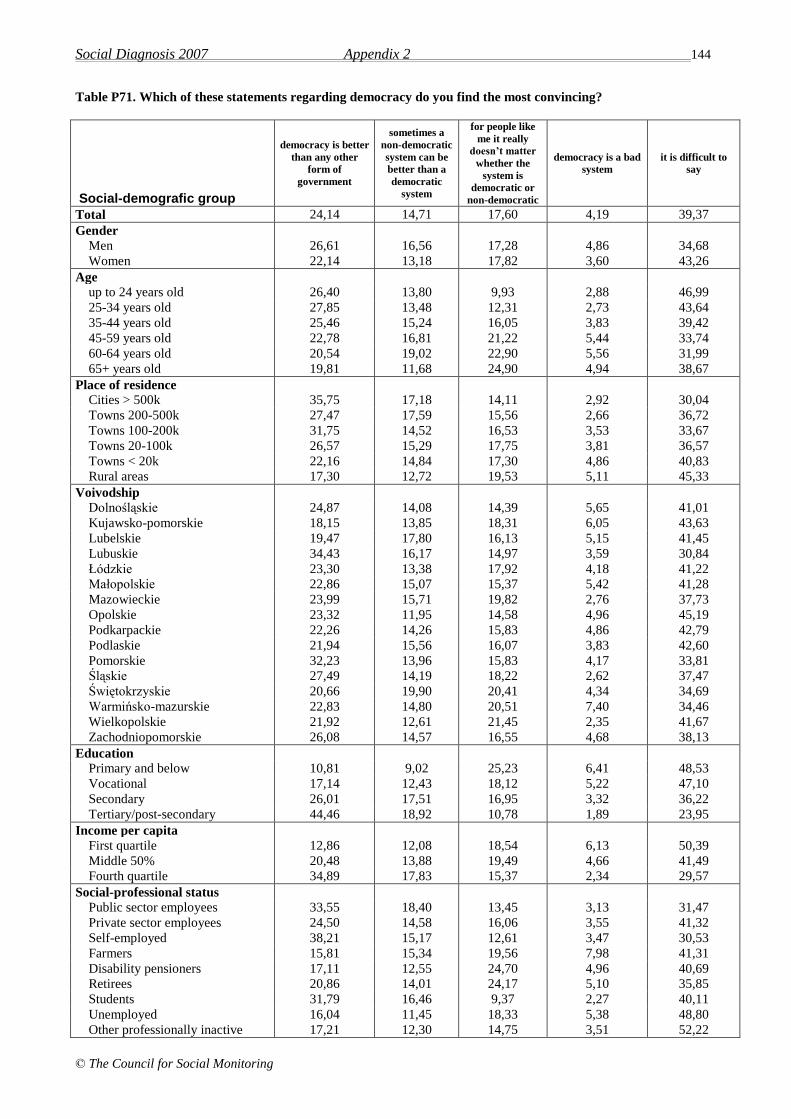
Social Diagnosis 2007 Appendix 2 144
© The Council for Social Monitoring
Table P71. Which of these statements regarding democracy do you find the most convincing?
Social-demografic group
democracy is better
than any other
form of
government
sometimes a
non-democratic
system can be
better than a
democratic
system
for people like
me it really
doesn’t matter
whether the
system is
democratic or
non-democratic
democracy is a bad
system
it is difficult to
say
Total 24,14 14,71 17,60 4,19 39,37
Gender
Men 26,61 16,56 17,28 4,86 34,68
Women 22,14 13,18 17,82 3,60 43,26
Age
up to 24 years old 26,40 13,80 9,93 2,88 46,99
25-34 years old 27,85 13,48 12,31 2,73 43,64
35-44 years old 25,46 15,24 16,05 3,83 39,42
45-59 years old 22,78 16,81 21,22 5,44 33,74
60-64 years old 20,54 19,02 22,90 5,56 31,99
65+ years old 19,81 11,68 24,90 4,94 38,67
Place of residence
Cities > 500k 35,75 17,18 14,11 2,92 30,04
Towns 200-500k 27,47 17,59 15,56 2,66 36,72
Towns 100-200k 31,75 14,52 16,53 3,53 33,67
Towns 20-100k 26,57 15,29 17,75 3,81 36,57
Towns < 20k 22,16 14,84 17,30 4,86 40,83
Rural areas 17,30 12,72 19,53 5,11 45,33
Voivodship
Dolnośląskie 24,87 14,08 14,39 5,65 41,01
Kujawsko-pomorskie 18,15 13,85 18,31 6,05 43,63
Lubelskie 19,47 17,80 16,13 5,15 41,45
Lubuskie 34,43 16,17 14,97 3,59 30,84
Łódzkie 23,30 13,38 17,92 4,18 41,22
Małopolskie 22,86 15,07 15,37 5,42 41,28
Mazowieckie 23,99 15,71 19,82 2,76 37,73
Opolskie 23,32 11,95 14,58 4,96 45,19
Podkarpackie 22,26 14,26 15,83 4,86 42,79
Podlaskie 21,94 15,56 16,07 3,83 42,60
Pomorskie 32,23 13,96 15,83 4,17 33,81
Śląskie 27,49 14,19 18,22 2,62 37,47
Świętokrzyskie 20,66 19,90 20,41 4,34 34,69
Warmińsko-mazurskie 22,83 14,80 20,51 7,40 34,46
Wielkopolskie 21,92 12,61 21,45 2,35 41,67
Zachodniopomorskie 26,08 14,57 16,55 4,68 38,13
Education
Primary and below 10,81 9,02 25,23 6,41 48,53
Vocational 17,14 12,43 18,12 5,22 47,10
Secondary 26,01 17,51 16,95 3,32 36,22
Tertiary/post-secondary 44,46 18,92 10,78 1,89 23,95
Income per capita
First quartile 12,86 12,08 18,54 6,13 50,39
Middle 50% 20,48 13,88 19,49 4,66 41,49
Fourth quartile 34,89 17,83 15,37 2,34 29,57
Social-professional status
Public sector employees 33,55 18,40 13,45 3,13 31,47
Private sector employees 24,50 14,58 16,06 3,55 41,32
Self-employed 38,21 15,17 12,61 3,47 30,53
Farmers 15,81 15,34 19,56 7,98 41,31
Disability pensioners 17,11 12,55 24,70 4,96 40,69
Retirees 20,86 14,01 24,17 5,10 35,85
Students 31,79 16,46 9,37 2,27 40,11
Unemployed 16,04 11,45 18,33 5,38 48,80
Other professionally inactive 17,21 12,30 14,75 3,51 52,22
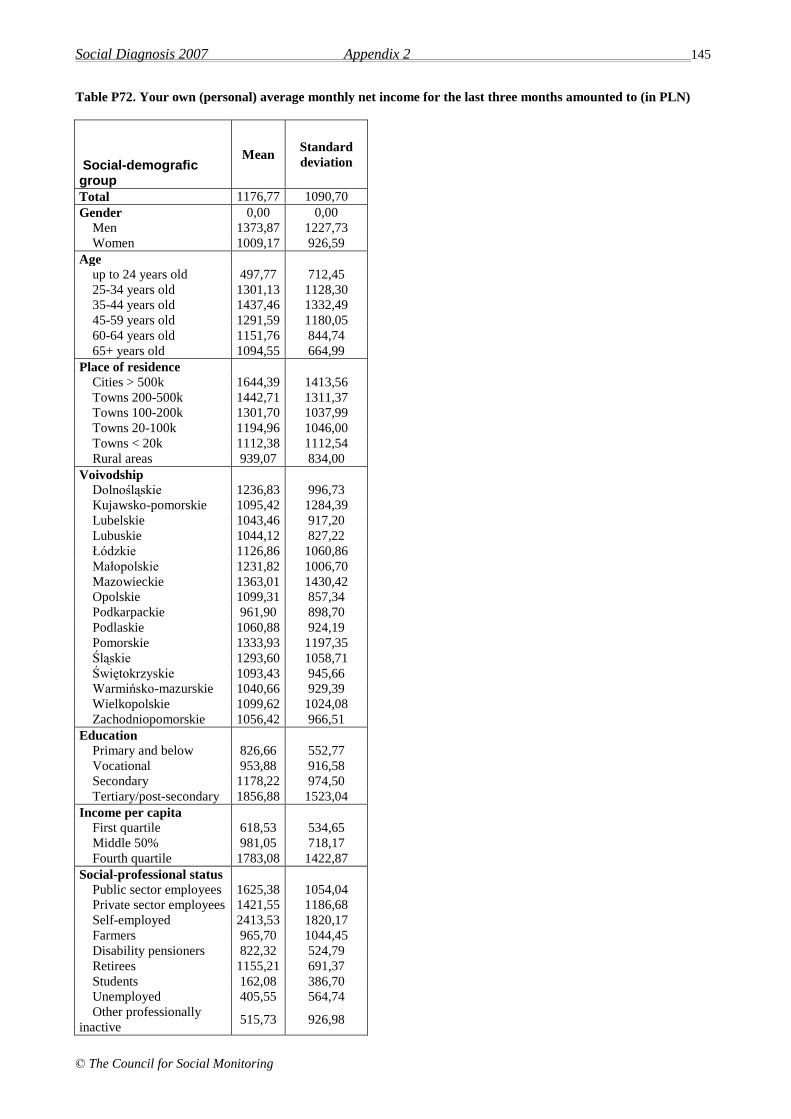
Social Diagnosis 2007 Appendix 2 145
© The Council for Social Monitoring
Table P72. Your own (personal) average monthly net income for the last three months amounted to (in PLN)
Social-demografic group
Mean Standard
deviation
Total 1176,77 1090,70
Gender 0,00 0,00
Men 1373,87 1227,73
Women 1009,17 926,59
Age
up to 24 years old 497,77 712,45
25-34 years old 1301,13 1128,30
35-44 years old 1437,46 1332,49
45-59 years old 1291,59 1180,05
60-64 years old 1151,76 844,74
65+ years old 1094,55 664,99
Place of residence
Cities > 500k 1644,39 1413,56
Towns 200-500k 1442,71 1311,37
Towns 100-200k 1301,70 1037,99
Towns 20-100k 1194,96 1046,00
Towns < 20k 1112,38 1112,54
Rural areas 939,07 834,00
Voivodship
Dolnośląskie 1236,83 996,73
Kujawsko-pomorskie 1095,42 1284,39
Lubelskie 1043,46 917,20
Lubuskie 1044,12 827,22
Łódzkie 1126,86 1060,86
Małopolskie 1231,82 1006,70
Mazowieckie 1363,01 1430,42
Opolskie 1099,31 857,34
Podkarpackie 961,90 898,70
Podlaskie 1060,88 924,19
Pomorskie 1333,93 1197,35
Śląskie 1293,60 1058,71
Świętokrzyskie 1093,43 945,66
Warmińsko-mazurskie 1040,66 929,39
Wielkopolskie 1099,62 1024,08
Zachodniopomorskie 1056,42 966,51
Education
Primary and below 826,66 552,77
Vocational 953,88 916,58
Secondary 1178,22 974,50
Tertiary/post-secondary 1856,88 1523,04
Income per capita
First quartile 618,53 534,65
Middle 50% 981,05 718,17
Fourth quartile 1783,08 1422,87
Social-professional status
Public sector employees 1625,38 1054,04
Private sector employees 1421,55 1186,68
Self-employed 2413,53 1820,17
Farmers 965,70 1044,45
Disability pensioners 822,32 524,79
Retirees 1155,21 691,37
Students 162,08 386,70
Unemployed 405,55 564,74
Other professionally
inactive 515,73 926,98
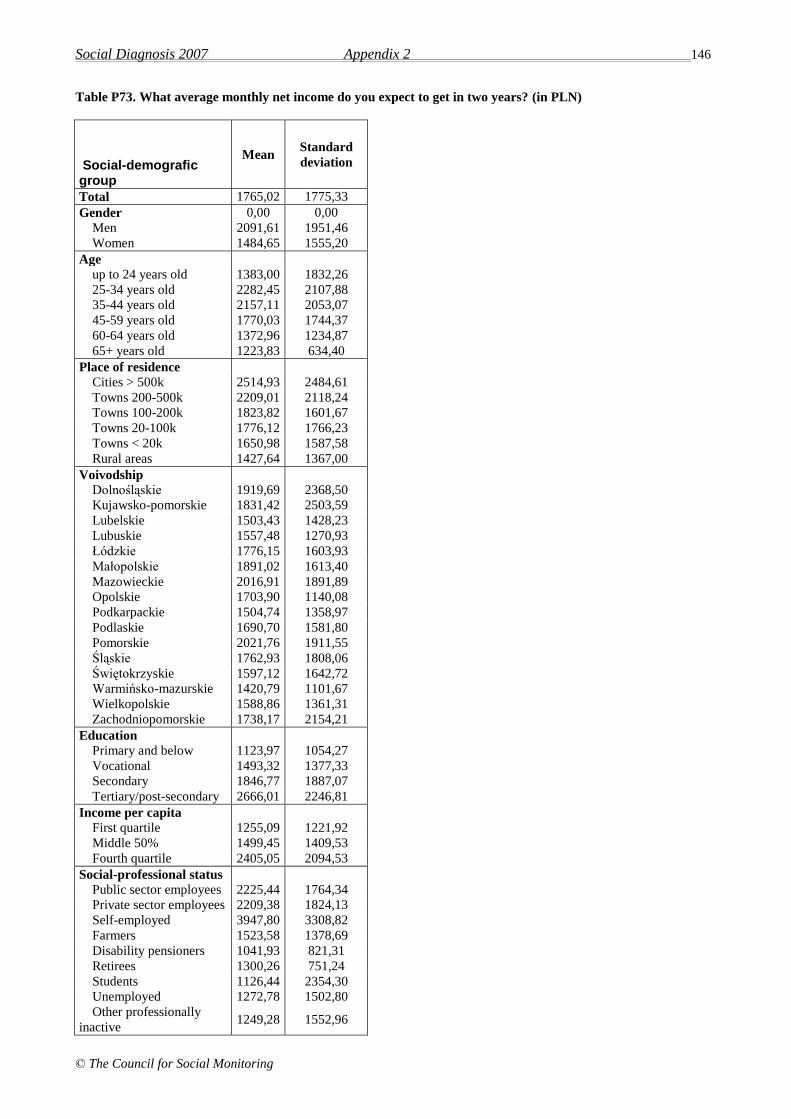
Social Diagnosis 2007 Appendix 2 146
© The Council for Social Monitoring
Table P73. What average monthly net income do you expect to get in two years? (in PLN)
Social-demografic group
Mean Standard
deviation
Total 1765,02 1775,33
Gender 0,00 0,00
Men 2091,61 1951,46
Women 1484,65 1555,20
Age
up to 24 years old 1383,00 1832,26
25-34 years old 2282,45 2107,88
35-44 years old 2157,11 2053,07
45-59 years old 1770,03 1744,37
60-64 years old 1372,96 1234,87
65+ years old 1223,83 634,40
Place of residence
Cities > 500k 2514,93 2484,61
Towns 200-500k 2209,01 2118,24
Towns 100-200k 1823,82 1601,67
Towns 20-100k 1776,12 1766,23
Towns < 20k 1650,98 1587,58
Rural areas 1427,64 1367,00
Voivodship
Dolnośląskie 1919,69 2368,50
Kujawsko-pomorskie 1831,42 2503,59
Lubelskie 1503,43 1428,23
Lubuskie 1557,48 1270,93
Łódzkie 1776,15 1603,93
Małopolskie 1891,02 1613,40
Mazowieckie 2016,91 1891,89
Opolskie 1703,90 1140,08
Podkarpackie 1504,74 1358,97
Podlaskie 1690,70 1581,80
Pomorskie 2021,76 1911,55
Śląskie 1762,93 1808,06
Świętokrzyskie 1597,12 1642,72
Warmińsko-mazurskie 1420,79 1101,67
Wielkopolskie 1588,86 1361,31
Zachodniopomorskie 1738,17 2154,21
Education
Primary and below 1123,97 1054,27
Vocational 1493,32 1377,33
Secondary 1846,77 1887,07
Tertiary/post-secondary 2666,01 2246,81
Income per capita
First quartile 1255,09 1221,92
Middle 50% 1499,45 1409,53
Fourth quartile 2405,05 2094,53
Social-professional status
Public sector employees 2225,44 1764,34
Private sector employees 2209,38 1824,13
Self-employed 3947,80 3308,82
Farmers 1523,58 1378,69
Disability pensioners 1041,93 821,31
Retirees 1300,26 751,24
Students 1126,44 2354,30
Unemployed 1272,78 1502,80
Other professionally
inactive 1249,28 1552,96
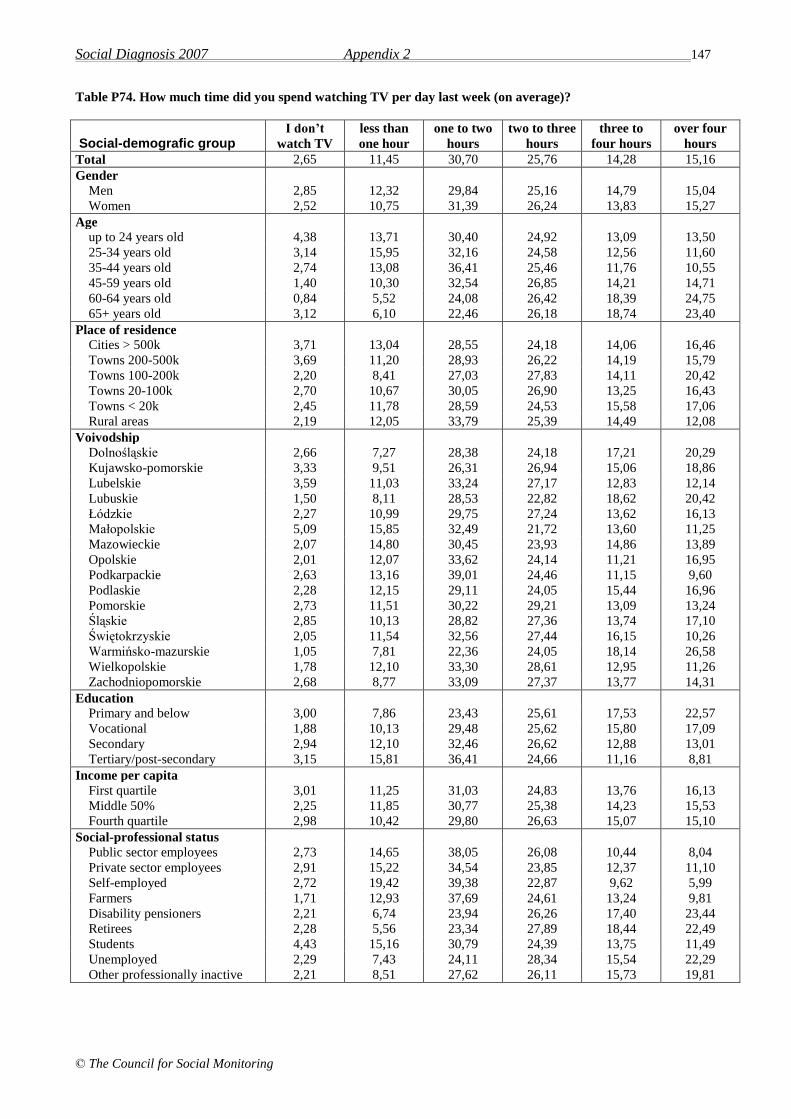
Social Diagnosis 2007 Appendix 2 147
© The Council for Social Monitoring
Table P74. How much time did you spend watching TV per day last week (on average)?
Social-demografic group I don’t
watch TV
less than
one hour
one to two
hours
two to three
hours
three to
four hours
over four
hours
Total 2,65 11,45 30,70 25,76 14,28 15,16
Gender
Men 2,85 12,32 29,84 25,16 14,79 15,04
Women 2,52 10,75 31,39 26,24 13,83 15,27
Age
up to 24 years old 4,38 13,71 30,40 24,92 13,09 13,50
25-34 years old 3,14 15,95 32,16 24,58 12,56 11,60
35-44 years old 2,74 13,08 36,41 25,46 11,76 10,55
45-59 years old 1,40 10,30 32,54 26,85 14,21 14,71
60-64 years old 0,84 5,52 24,08 26,42 18,39 24,75
65+ years old 3,12 6,10 22,46 26,18 18,74 23,40
Place of residence
Cities > 500k 3,71 13,04 28,55 24,18 14,06 16,46
Towns 200-500k 3,69 11,20 28,93 26,22 14,19 15,79
Towns 100-200k 2,20 8,41 27,03 27,83 14,11 20,42
Towns 20-100k 2,70 10,67 30,05 26,90 13,25 16,43
Towns < 20k 2,45 11,78 28,59 24,53 15,58 17,06
Rural areas 2,19 12,05 33,79 25,39 14,49 12,08
Voivodship
Dolnośląskie 2,66 7,27 28,38 24,18 17,21 20,29
Kujawsko-pomorskie 3,33 9,51 26,31 26,94 15,06 18,86
Lubelskie 3,59 11,03 33,24 27,17 12,83 12,14
Lubuskie 1,50 8,11 28,53 22,82 18,62 20,42
Łódzkie 2,27 10,99 29,75 27,24 13,62 16,13
Małopolskie 5,09 15,85 32,49 21,72 13,60 11,25
Mazowieckie 2,07 14,80 30,45 23,93 14,86 13,89
Opolskie 2,01 12,07 33,62 24,14 11,21 16,95
Podkarpackie 2,63 13,16 39,01 24,46 11,15 9,60
Podlaskie 2,28 12,15 29,11 24,05 15,44 16,96
Pomorskie 2,73 11,51 30,22 29,21 13,09 13,24
Śląskie 2,85 10,13 28,82 27,36 13,74 17,10
Świętokrzyskie 2,05 11,54 32,56 27,44 16,15 10,26
Warmińsko-mazurskie 1,05 7,81 22,36 24,05 18,14 26,58
Wielkopolskie 1,78 12,10 33,30 28,61 12,95 11,26
Zachodniopomorskie 2,68 8,77 33,09 27,37 13,77 14,31
Education
Primary and below 3,00 7,86 23,43 25,61 17,53 22,57
Vocational 1,88 10,13 29,48 25,62 15,80 17,09
Secondary 2,94 12,10 32,46 26,62 12,88 13,01
Tertiary/post-secondary 3,15 15,81 36,41 24,66 11,16 8,81
Income per capita
First quartile 3,01 11,25 31,03 24,83 13,76 16,13
Middle 50% 2,25 11,85 30,77 25,38 14,23 15,53
Fourth quartile 2,98 10,42 29,80 26,63 15,07 15,10
Social-professional status
Public sector employees 2,73 14,65 38,05 26,08 10,44 8,04
Private sector employees 2,91 15,22 34,54 23,85 12,37 11,10
Self-employed 2,72 19,42 39,38 22,87 9,62 5,99
Farmers 1,71 12,93 37,69 24,61 13,24 9,81
Disability pensioners 2,21 6,74 23,94 26,26 17,40 23,44
Retirees 2,28 5,56 23,34 27,89 18,44 22,49
Students 4,43 15,16 30,79 24,39 13,75 11,49
Unemployed 2,29 7,43 24,11 28,34 15,54 22,29
Other professionally inactive 2,21 8,51 27,62 26,11 15,73 19,81

Social Diagnosis 2007 Appendix 2 148
© The Council for Social Monitoring
Table P75-78 In the previous year:
Social-demografic group
I visited a
psychologist
(psychiatrist)
I drank too
much alcohol I tried drugs
one of my
relatives or
acquaintances
passed away
Total 4,82 5,75 1,01 21,20
Gender
Men 4,10 10,56 1,63 20,46
Women 5,41 1,77 0,51 21,80
Age
up to 24 years old 4,54 5,70 3,96 18,19
25-34 years old 4,21 5,66 1,53 19,59
35-44 years old 6,26 7,95 0,54 20,83
45-59 years old 6,02 6,91 0,05 22,49
60-64 years old 4,63 5,07 0,00 23,72
65+ years old 2,41 1,96 0,00 23,39
Place of residence
Cities > 500k 6,60 7,08 1,62 25,95
Towns 200-500k 6,18 6,72 1,94 22,63
Towns 100-200k 6,09 5,91 1,16 20,74
Towns 20-100k 4,86 4,88 0,61 22,38
Towns < 20k 4,99 6,54 1,47 19,97
Rural areas 3,49 5,20 0,56 19,18
Voivodship
Dolnośląskie 6,34 5,04 0,94 25,64
Kujawsko-pomorskie 6,52 5,57 1,67 21,29
Lubelskie 5,77 6,21 1,61 20,90
Lubuskie 6,65 6,11 1,22 25,27
Łódzkie 4,06 5,61 0,87 21,45
Małopolskie 5,25 5,51 0,89 20,51
Mazowieckie 4,83 6,07 0,78 21,21
Opolskie 4,00 4,28 1,12 24,19
Podkarpackie 5,36 6,18 0,88 19,07
Podlaskie 3,49 7,73 1,04 19,85
Pomorskie 4,44 6,06 1,57 17,64
Śląskie 3,59 5,21 0,93 22,21
Świętokrzyskie 2,58 3,97 1,03 18,71
Warmińsko-mazurskie 4,30 9,35 0,57 17,35
Wielkopolskie 4,75 4,65 0,73 20,94
Zachodniopomorskie 5,18 6,42 1,10 20,75
Education
Primary and below 4,75 4,91 0,41 22,37
Vocational 5,15 7,16 1,38 22,56
Secondary 4,37 5,18 1,16 19,52
Tertiary/post-secondary 5,12 5,19 0,70 20,79
Income per capita
First quartile 6,51 7,76 1,49 20,62
Middle 50% 4,68 5,27 0,96 21,04
Fourth quartile 4,41 5,46 0,83 22,26
Social-professional status
Public sector employees 4,08 5,00 0,32 20,41
Private sector employees 3,42 8,84 1,58 20,45
Self-employed 5,59 9,77 1,43 19,00
Farmers 2,06 6,34 0,14 18,96
Disability pensioners 12,43 4,99 0,60 25,90
Retirees 2,83 2,25 0,00 23,47
Students 4,79 4,13 3,74 16,90
Unemployed 7,81 8,58 1,05 22,71
Other professionally inactive 6,91 4,36 1,07 19,99
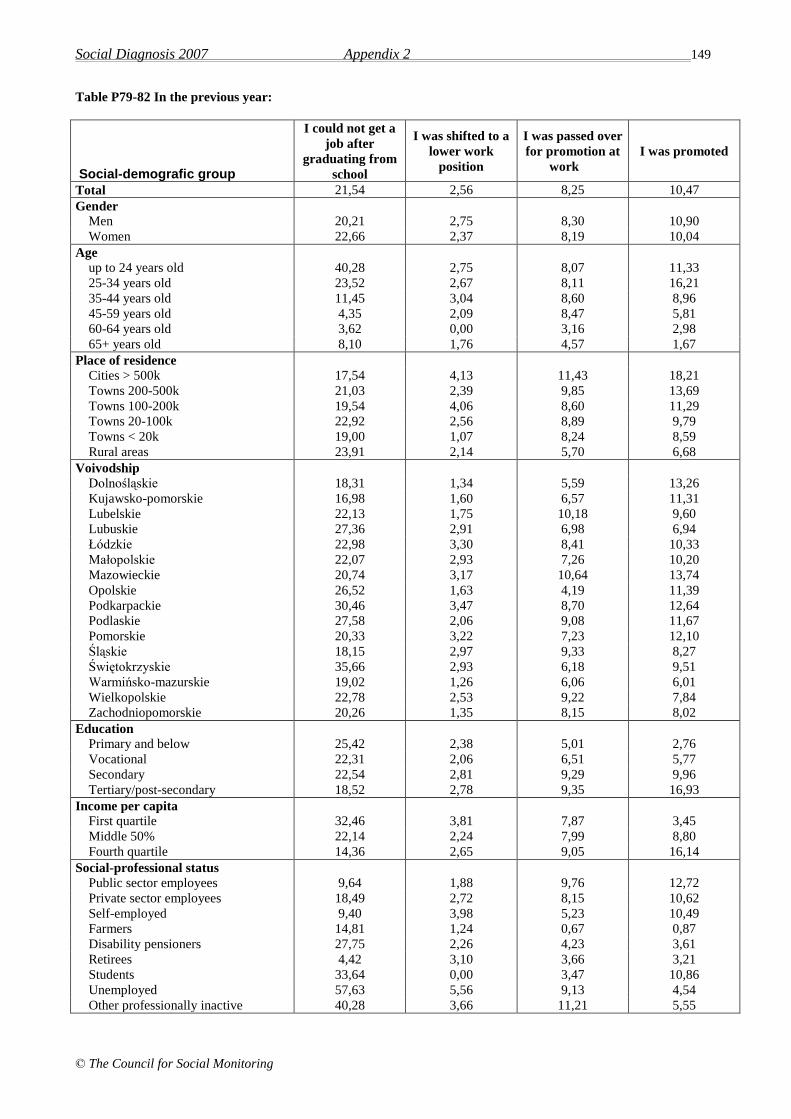
Social Diagnosis 2007 Appendix 2 149
© The Council for Social Monitoring
Table P79-82 In the previous year:
Social-demografic group
I could not get a
job after
graduating from
school
I was shifted to a
lower work
position
I was passed over
for promotion at
work
I was promoted
Total 21,54 2,56 8,25 10,47
Gender
Men 20,21 2,75 8,30 10,90
Women 22,66 2,37 8,19 10,04
Age
up to 24 years old 40,28 2,75 8,07 11,33
25-34 years old 23,52 2,67 8,11 16,21
35-44 years old 11,45 3,04 8,60 8,96
45-59 years old 4,35 2,09 8,47 5,81
60-64 years old 3,62 0,00 3,16 2,98
65+ years old 8,10 1,76 4,57 1,67
Place of residence
Cities > 500k 17,54 4,13 11,43 18,21
Towns 200-500k 21,03 2,39 9,85 13,69
Towns 100-200k 19,54 4,06 8,60 11,29
Towns 20-100k 22,92 2,56 8,89 9,79
Towns < 20k 19,00 1,07 8,24 8,59
Rural areas 23,91 2,14 5,70 6,68
Voivodship
Dolnośląskie 18,31 1,34 5,59 13,26
Kujawsko-pomorskie 16,98 1,60 6,57 11,31
Lubelskie 22,13 1,75 10,18 9,60
Lubuskie 27,36 2,91 6,98 6,94
Łódzkie 22,98 3,30 8,41 10,33
Małopolskie 22,07 2,93 7,26 10,20
Mazowieckie 20,74 3,17 10,64 13,74
Opolskie 26,52 1,63 4,19 11,39
Podkarpackie 30,46 3,47 8,70 12,64
Podlaskie 27,58 2,06 9,08 11,67
Pomorskie 20,33 3,22 7,23 12,10
Śląskie 18,15 2,97 9,33 8,27
Świętokrzyskie 35,66 2,93 6,18 9,51
Warmińsko-mazurskie 19,02 1,26 6,06 6,01
Wielkopolskie 22,78 2,53 9,22 7,84
Zachodniopomorskie 20,26 1,35 8,15 8,02
Education
Primary and below 25,42 2,38 5,01 2,76
Vocational 22,31 2,06 6,51 5,77
Secondary 22,54 2,81 9,29 9,96
Tertiary/post-secondary 18,52 2,78 9,35 16,93
Income per capita
First quartile 32,46 3,81 7,87 3,45
Middle 50% 22,14 2,24 7,99 8,80
Fourth quartile 14,36 2,65 9,05 16,14
Social-professional status
Public sector employees 9,64 1,88 9,76 12,72
Private sector employees 18,49 2,72 8,15 10,62
Self-employed 9,40 3,98 5,23 10,49
Farmers 14,81 1,24 0,67 0,87
Disability pensioners 27,75 2,26 4,23 3,61
Retirees 4,42 3,10 3,66 3,21
Students 33,64 0,00 3,47 10,86
Unemployed 57,63 5,56 9,13 4,54
Other professionally inactive 40,28 3,66 11,21 5,55
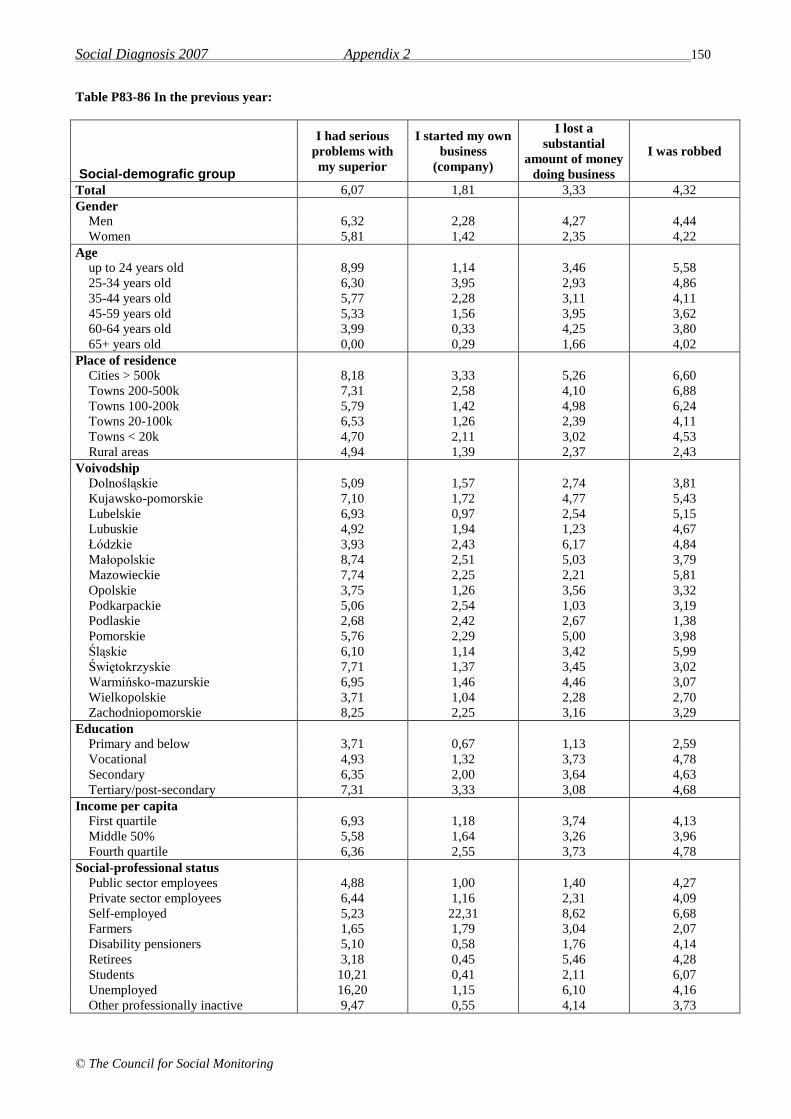
Social Diagnosis 2007 Appendix 2 150
© The Council for Social Monitoring
Table P83-86 In the previous year:
Social-demografic group
I had serious
problems with
my superior
I started my own
business
(company)
I lost a
substantial
amount of money
doing business
I was robbed
Total 6,07 1,81 3,33 4,32
Gender
Men 6,32 2,28 4,27 4,44
Women 5,81 1,42 2,35 4,22
Age
up to 24 years old 8,99 1,14 3,46 5,58
25-34 years old 6,30 3,95 2,93 4,86
35-44 years old 5,77 2,28 3,11 4,11
45-59 years old 5,33 1,56 3,95 3,62
60-64 years old 3,99 0,33 4,25 3,80
65+ years old 0,00 0,29 1,66 4,02
Place of residence
Cities > 500k 8,18 3,33 5,26 6,60
Towns 200-500k 7,31 2,58 4,10 6,88
Towns 100-200k 5,79 1,42 4,98 6,24
Towns 20-100k 6,53 1,26 2,39 4,11
Towns < 20k 4,70 2,11 3,02 4,53
Rural areas 4,94 1,39 2,37 2,43
Voivodship
Dolnośląskie 5,09 1,57 2,74 3,81
Kujawsko-pomorskie 7,10 1,72 4,77 5,43
Lubelskie 6,93 0,97 2,54 5,15
Lubuskie 4,92 1,94 1,23 4,67
Łódzkie 3,93 2,43 6,17 4,84
Małopolskie 8,74 2,51 5,03 3,79
Mazowieckie 7,74 2,25 2,21 5,81
Opolskie 3,75 1,26 3,56 3,32
Podkarpackie 5,06 2,54 1,03 3,19
Podlaskie 2,68 2,42 2,67 1,38
Pomorskie 5,76 2,29 5,00 3,98
Śląskie 6,10 1,14 3,42 5,99
Świętokrzyskie 7,71 1,37 3,45 3,02
Warmińsko-mazurskie 6,95 1,46 4,46 3,07
Wielkopolskie 3,71 1,04 2,28 2,70
Zachodniopomorskie 8,25 2,25 3,16 3,29
Education
Primary and below 3,71 0,67 1,13 2,59
Vocational 4,93 1,32 3,73 4,78
Secondary 6,35 2,00 3,64 4,63
Tertiary/post-secondary 7,31 3,33 3,08 4,68
Income per capita
First quartile 6,93 1,18 3,74 4,13
Middle 50% 5,58 1,64 3,26 3,96
Fourth quartile 6,36 2,55 3,73 4,78
Social-professional status
Public sector employees 4,88 1,00 1,40 4,27
Private sector employees 6,44 1,16 2,31 4,09
Self-employed 5,23 22,31 8,62 6,68
Farmers 1,65 1,79 3,04 2,07
Disability pensioners 5,10 0,58 1,76 4,14
Retirees 3,18 0,45 5,46 4,28
Students 10,21 0,41 2,11 6,07
Unemployed 16,20 1,15 6,10 4,16
Other professionally inactive 9,47 0,55 4,14 3,73

Social Diagnosis 2007 Appendix 2 151
© The Council for Social Monitoring
Table P87-90 In the previous year:
Social-demografic group
I was attacked
and beaten
Someone broke
into my car or
house
I was accused of
an act, for which
I could be liable
to imprisonment
or a fine
I was arrested by
the police
Total 1,08 2,13 1,52 3,18
Gender
Men 1,62 2,64 2,45 5,66
Women 0,63 1,70 0,75 1,12
Age
up to 24 years old 2,18 1,26 2,67 7,87
25-34 years old 0,86 3,30 1,97 4,44
35-44 years old 0,91 2,44 1,58 2,59
45-59 years old 0,68 2,16 1,37 2,18
60-64 years old 1,03 1,60 0,29 0,48
65+ years old 1,15 1,37 0,45 0,27
Place of residence
Cities > 500k 1,25 3,28 2,62 3,84
Towns 200-500k 1,54 3,35 1,00 3,18
Towns 100-200k 1,88 3,37 1,96 2,44
Towns 20-100k 1,01 2,01 1,55 3,11
Towns < 20k 1,43 2,05 1,53 3,83
Rural areas 0,62 1,20 1,23 2,95
Voivodship
Dolnośląskie 1,30 2,54 1,07 3,51
Kujawsko-pomorskie 1,78 3,39 1,62 2,32
Lubelskie 1,36 3,37 1,76 3,14
Lubuskie 0,64 0,92 1,66 4,21
Łódzkie 0,89 3,00 1,53 3,56
Małopolskie 0,76 2,38 1,07 3,34
Mazowieckie 1,21 1,56 2,25 3,57
Opolskie 1,29 0,97 1,46 2,59
Podkarpackie 0,83 1,39 1,13 3,38
Podlaskie 0,71 1,88 0,82 2,63
Pomorskie 0,66 1,58 1,00 3,92
Śląskie 1,38 2,55 1,79 2,38
Świętokrzyskie 0,75 1,74 1,34 2,49
Warmińsko-mazurskie 1,91 0,56 1,97 3,46
Wielkopolskie 0,53 2,24 1,40 3,43
Zachodniopomorskie 0,98 1,59 1,29 2,56
Education
Primary and below 1,39 1,10 1,49 1,95
Vocational 1,29 1,87 2,34 5,09
Secondary 1,02 2,27 1,21 2,66
Tertiary/post-secondary 0,56 3,25 0,73 2,14
Income per capita
First quartile 1,14 1,71 2,60 4,26
Middle 50% 0,84 2,05 1,42 3,05
Fourth quartile 1,37 2,35 1,17 2,70
Social-professional status
Public sector employees 0,40 2,42 1,09 2,43
Private sector employees 1,21 2,66 2,09 4,99
Self-employed 1,19 4,06 1,35 4,34
Farmers 0,32 1,89 1,10 2,31
Disability pensioners 1,10 1,72 1,13 2,08
Retirees 1,10 1,75 0,52 0,39
Students 1,72 1,07 1,26 6,68
Unemployed 1,89 1,37 3,59 4,19
Other professionally inactive 0,90 2,29 2,62 2,83
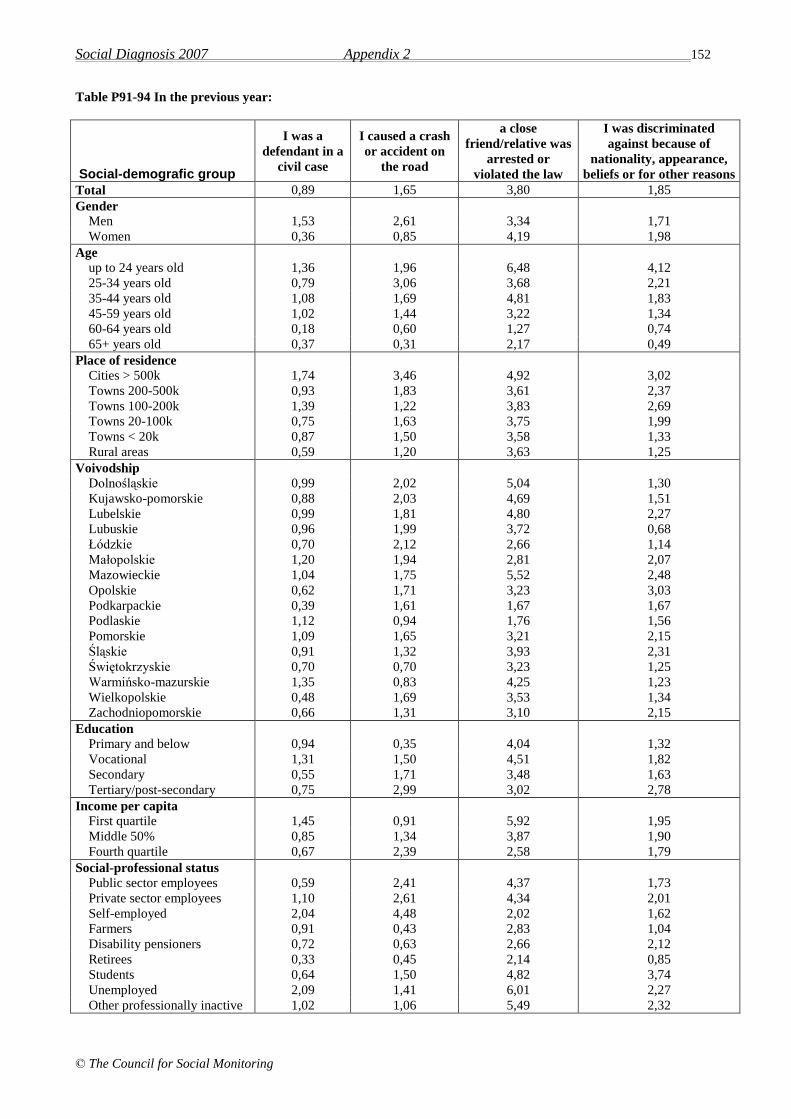
Social Diagnosis 2007 Appendix 2 152
© The Council for Social Monitoring
Table P91-94 In the previous year:
Social-demografic group
I was a
defendant in a
civil case
I caused a crash
or accident on
the road
a close
friend/relative was
arrested or
violated the law
I was discriminated
against because of
nationality, appearance,
beliefs or for other reasons
Total 0,89 1,65 3,80 1,85
Gender
Men 1,53 2,61 3,34 1,71
Women 0,36 0,85 4,19 1,98
Age
up to 24 years old 1,36 1,96 6,48 4,12
25-34 years old 0,79 3,06 3,68 2,21
35-44 years old 1,08 1,69 4,81 1,83
45-59 years old 1,02 1,44 3,22 1,34
60-64 years old 0,18 0,60 1,27 0,74
65+ years old 0,37 0,31 2,17 0,49
Place of residence
Cities > 500k 1,74 3,46 4,92 3,02
Towns 200-500k 0,93 1,83 3,61 2,37
Towns 100-200k 1,39 1,22 3,83 2,69
Towns 20-100k 0,75 1,63 3,75 1,99
Towns < 20k 0,87 1,50 3,58 1,33
Rural areas 0,59 1,20 3,63 1,25
Voivodship
Dolnośląskie 0,99 2,02 5,04 1,30
Kujawsko-pomorskie 0,88 2,03 4,69 1,51
Lubelskie 0,99 1,81 4,80 2,27
Lubuskie 0,96 1,99 3,72 0,68
Łódzkie 0,70 2,12 2,66 1,14
Małopolskie 1,20 1,94 2,81 2,07
Mazowieckie 1,04 1,75 5,52 2,48
Opolskie 0,62 1,71 3,23 3,03
Podkarpackie 0,39 1,61 1,67 1,67
Podlaskie 1,12 0,94 1,76 1,56
Pomorskie 1,09 1,65 3,21 2,15
Śląskie 0,91 1,32 3,93 2,31
Świętokrzyskie 0,70 0,70 3,23 1,25
Warmińsko-mazurskie 1,35 0,83 4,25 1,23
Wielkopolskie 0,48 1,69 3,53 1,34
Zachodniopomorskie 0,66 1,31 3,10 2,15
Education
Primary and below 0,94 0,35 4,04 1,32
Vocational 1,31 1,50 4,51 1,82
Secondary 0,55 1,71 3,48 1,63
Tertiary/post-secondary 0,75 2,99 3,02 2,78
Income per capita
First quartile 1,45 0,91 5,92 1,95
Middle 50% 0,85 1,34 3,87 1,90
Fourth quartile 0,67 2,39 2,58 1,79
Social-professional status
Public sector employees 0,59 2,41 4,37 1,73
Private sector employees 1,10 2,61 4,34 2,01
Self-employed 2,04 4,48 2,02 1,62
Farmers 0,91 0,43 2,83 1,04
Disability pensioners 0,72 0,63 2,66 2,12
Retirees 0,33 0,45 2,14 0,85
Students 0,64 1,50 4,82 3,74
Unemployed 2,09 1,41 6,01 2,27
Other professionally inactive 1,02 1,06 5,49 2,32

Social Diagnosis 2007 Appendix 2 153
© The Council for Social Monitoring
Table P95-98 In the previous year:
Social-demografic group
my apartment
(house) was
seriously
damaged
my apartment
(house) was
renovated
I had problems
with the owner or
manager of the
building in which
I live (lived)
I was seriously ill
Total 0,95 24,29 4,32 15,46
Gender
Men 0,90 24,15 4,51 13,48
Women 0,99 24,40 4,17 17,11
Age
up to 24 years old 1,15 23,18 4,99 4,91
25-34 years old 0,81 27,25 3,82 5,71
35-44 years old 0,66 27,28 5,88 9,16
45-59 years old 1,20 24,70 3,95 17,86
60-64 years old 1,10 22,97 4,28 26,34
65+ years old 0,73 18,61 3,38 36,02
Place of residence
Cities > 500k 1,53 24,68 4,85 16,69
Towns 200-500k 0,84 25,73 4,07 14,34
Towns 100-200k 1,19 25,03 4,29 13,75
Towns 20-100k 0,99 24,36 4,52 16,50
Towns < 20k 0,63 23,42 4,20 14,24
Rural areas 0,85 23,81 3,82 15,69
Voivodship
Dolnośląskie 2,90 30,41 5,67 18,38
Kujawsko-pomorskie 1,13 25,30 3,56 14,55
Lubelskie 0,50 24,15 4,19 20,50
Lubuskie 0,96 20,02 2,34 18,54
Łódzkie 0,73 23,04 2,72 18,51
Małopolskie 1,31 19,30 4,05 17,13
Mazowieckie 0,65 22,10 4,83 15,54
Opolskie 0,20 29,90 4,89 14,05
Podkarpackie 0,17 24,19 4,12 12,63
Podlaskie 0,42 22,29 1,43 17,87
Pomorskie 0,24 31,77 2,74 14,05
Śląskie 1,50 25,33 7,09 12,04
Świętokrzyskie 0,63 16,54 3,37 15,70
Warmińsko-mazurskie 0,14 17,88 4,18 17,19
Wielkopolskie 0,84 27,58 2,90 10,80
Zachodniopomorskie 0,64 23,03 3,45 16,40
Education
Primary and below 1,17 19,65 4,83 29,56
Vocational 1,12 24,70 4,55 13,19
Secondary 0,78 24,60 4,34 12,91
Tertiary/post-secondary 0,75 27,49 3,70 10,30
Income per capita
First quartile 1,33 21,19 6,81 13,78
Middle 50% 0,89 23,47 4,36 17,05
Fourth quartile 0,72 27,71 3,43 15,31
Social-professional status
Public sector employees 0,81 27,52 3,18 8,31
Private sector employees 0,67 25,77 3,84 6,67
Self-employed 1,52 26,48 8,26 6,23
Farmers 1,17 24,67 2,16 11,26
Disability pensioners 1,20 22,32 6,89 40,99
Retirees 0,85 20,76 3,33 29,74
Students 1,11 25,15 4,34 4,09
Unemployed 1,28 21,15 5,49 13,43
Other professionally inactive 1,12 25,78 6,08 13,28
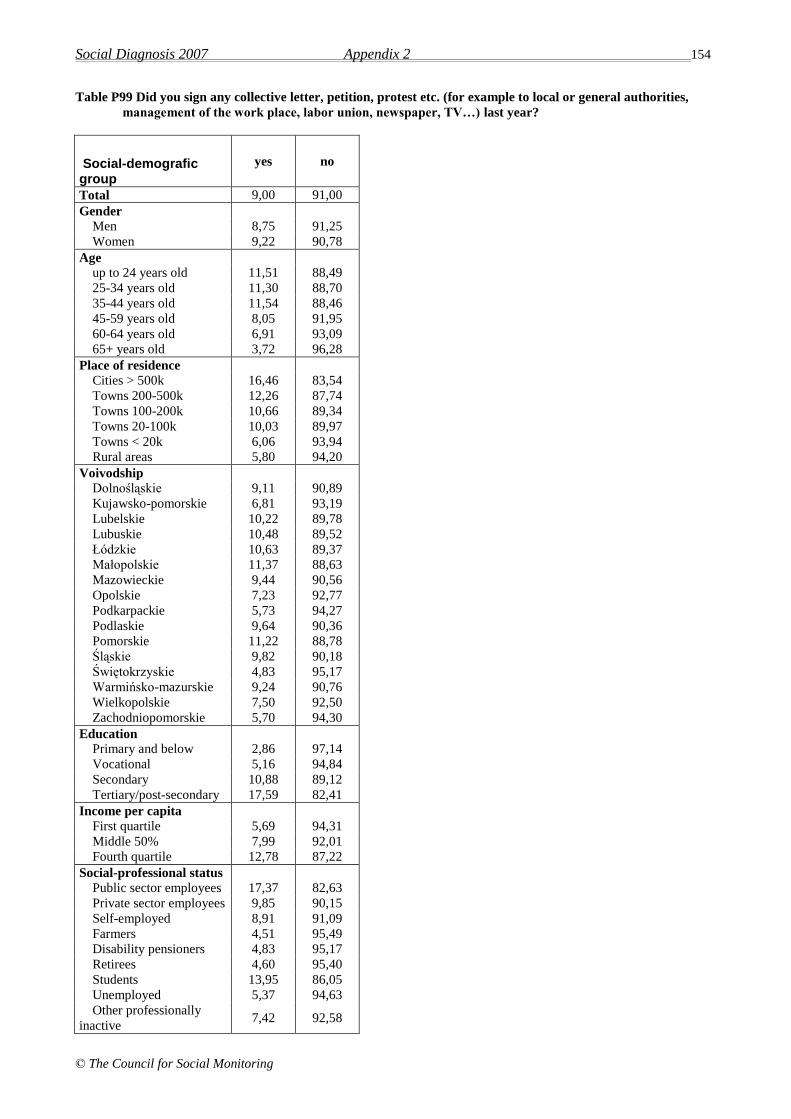
Social Diagnosis 2007 Appendix 2 154
© The Council for Social Monitoring
Table P99 Did you sign any collective letter, petition, protest etc. (for example to local or general authorities,
management of the work place, labor union, newspaper, TV…) last year?
Social-demografic group
yes no
Total 9,00 91,00
Gender
Men 8,75 91,25
Women 9,22 90,78
Age
up to 24 years old 11,51 88,49
25-34 years old 11,30 88,70
35-44 years old 11,54 88,46
45-59 years old 8,05 91,95
60-64 years old 6,91 93,09
65+ years old 3,72 96,28
Place of residence
Cities > 500k 16,46 83,54
Towns 200-500k 12,26 87,74
Towns 100-200k 10,66 89,34
Towns 20-100k 10,03 89,97
Towns < 20k 6,06 93,94
Rural areas 5,80 94,20
Voivodship
Dolnośląskie 9,11 90,89
Kujawsko-pomorskie 6,81 93,19
Lubelskie 10,22 89,78
Lubuskie 10,48 89,52
Łódzkie 10,63 89,37
Małopolskie 11,37 88,63
Mazowieckie 9,44 90,56
Opolskie 7,23 92,77
Podkarpackie 5,73 94,27
Podlaskie 9,64 90,36
Pomorskie 11,22 88,78
Śląskie 9,82 90,18
Świętokrzyskie 4,83 95,17
Warmińsko-mazurskie 9,24 90,76
Wielkopolskie 7,50 92,50
Zachodniopomorskie 5,70 94,30
Education
Primary and below 2,86 97,14
Vocational 5,16 94,84
Secondary 10,88 89,12
Tertiary/post-secondary 17,59 82,41
Income per capita
First quartile 5,69 94,31
Middle 50% 7,99 92,01
Fourth quartile 12,78 87,22
Social-professional status
Public sector employees 17,37 82,63
Private sector employees 9,85 90,15
Self-employed 8,91 91,09
Farmers 4,51 95,49
Disability pensioners 4,83 95,17
Retirees 4,60 95,40
Students 13,95 86,05
Unemployed 5,37 94,63
Other professionally
inactive 7,42 92,58

Social Diagnosis 2007 Appendix 2 155
© The Council for Social Monitoring
Table P100. In the years 2000-2007 have you been unemployed for some time?
Social-demografic group
yes no
Total 25,26 74,74
Gender
Men 24,95 75,05
Women 25,53 74,47
Age
up to 24 years old 29,68 70,32
25-34 years old 47,60 52,40
35-44 years old 31,97 68,03
45-59 years old 21,27 78,73
60-64 years old 4,97 95,03
65+ years old 0,55 99,45
Place of residence
Cities > 500k 25,78 74,22
Towns 200-500k 24,56 75,44
Towns 100-200k 27,13 72,87
Towns 20-100k 26,85 73,15
Towns < 20k 26,81 73,19
Rural areas 23,53 76,47
Voivodship
Dolnośląskie 28,05 71,95
Kujawsko-pomorskie 29,02 70,98
Lubelskie 20,92 79,08
Lubuskie 36,25 63,75
Łódzkie 26,14 73,86
Małopolskie 23,08 76,92
Mazowieckie 26,42 73,58
Opolskie 24,78 75,22
Podkarpackie 28,95 71,05
Podlaskie 21,94 78,06
Pomorskie 23,60 76,40
Śląskie 23,10 76,90
Świętokrzyskie 18,80 81,20
Warmińsko-mazurskie 26,71 73,29
Wielkopolskie 22,86 77,14
Zachodniopomorskie 29,06 70,94
Education
Primary and below 16,54 83,46
Vocational 27,25 72,75
Secondary 28,46 71,54
Tertiary/post-secondary 24,89 75,11
Income per capita
First quartile 39,58 60,42
Middle 50% 24,93 75,07
Fourth quartile 17,87 82,13
Social-professional status
Public sector employees 19,60 80,40
Private sector employees 41,97 58,03
Self-employed 22,22 77,78
Farmers 11,85 88,15
Disability pensioners 7,51 92,49
Retirees 1,80 98,20
Students 9,84 90,16
Unemployed 79,82 20,18
Other professionally
inactive 46,63 53,37
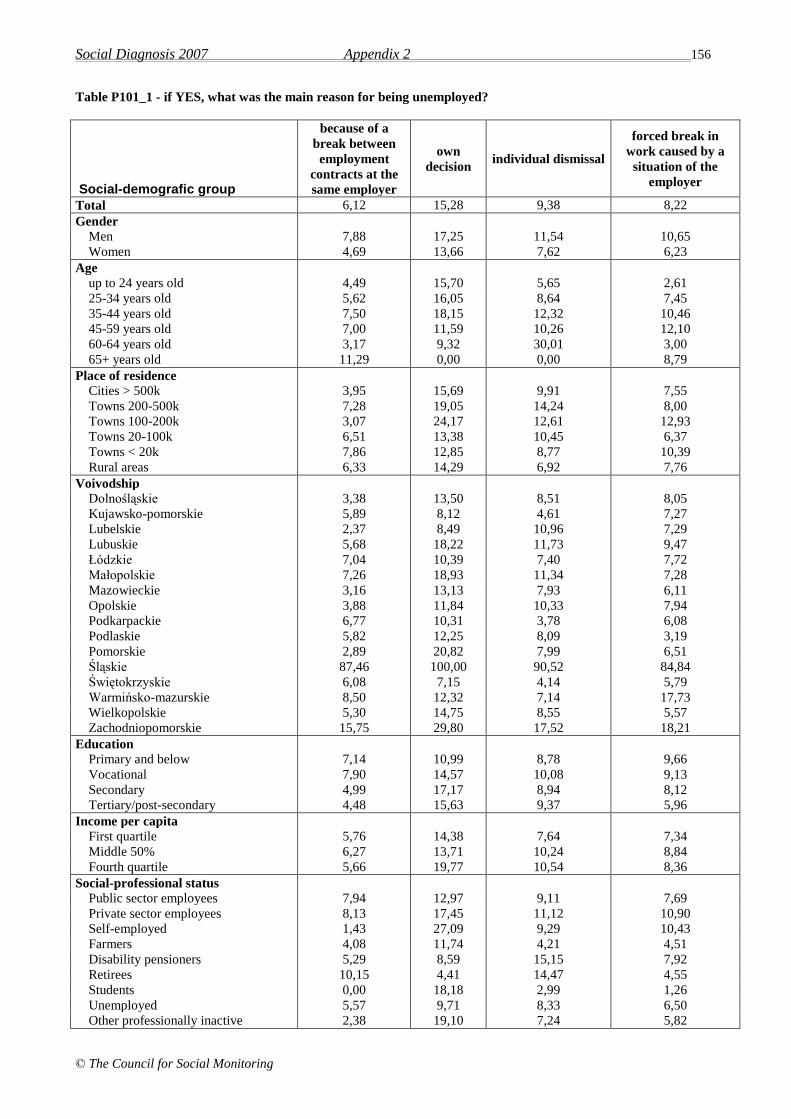
Social Diagnosis 2007 Appendix 2 156
© The Council for Social Monitoring
Table P101_1 - if YES, what was the main reason for being unemployed?
Social-demografic group
because of a
break between
employment
contracts at the
same employer
own
decision individual dismissal
forced break in
work caused by a
situation of the
employer
Total 6,12 15,28 9,38 8,22
Gender
Men 7,88 17,25 11,54 10,65
Women 4,69 13,66 7,62 6,23
Age
up to 24 years old 4,49 15,70 5,65 2,61
25-34 years old 5,62 16,05 8,64 7,45
35-44 years old 7,50 18,15 12,32 10,46
45-59 years old 7,00 11,59 10,26 12,10
60-64 years old 3,17 9,32 30,01 3,00
65+ years old 11,29 0,00 0,00 8,79
Place of residence
Cities > 500k 3,95 15,69 9,91 7,55
Towns 200-500k 7,28 19,05 14,24 8,00
Towns 100-200k 3,07 24,17 12,61 12,93
Towns 20-100k 6,51 13,38 10,45 6,37
Towns < 20k 7,86 12,85 8,77 10,39
Rural areas 6,33 14,29 6,92 7,76
Voivodship
Dolnośląskie 3,38 13,50 8,51 8,05
Kujawsko-pomorskie 5,89 8,12 4,61 7,27
Lubelskie 2,37 8,49 10,96 7,29
Lubuskie 5,68 18,22 11,73 9,47
Łódzkie 7,04 10,39 7,40 7,72
Małopolskie 7,26 18,93 11,34 7,28
Mazowieckie 3,16 13,13 7,93 6,11
Opolskie 3,88 11,84 10,33 7,94
Podkarpackie 6,77 10,31 3,78 6,08
Podlaskie 5,82 12,25 8,09 3,19
Pomorskie 2,89 20,82 7,99 6,51
Śląskie 87,46 100,00 90,52 84,84
Świętokrzyskie 6,08 7,15 4,14 5,79
Warmińsko-mazurskie 8,50 12,32 7,14 17,73
Wielkopolskie 5,30 14,75 8,55 5,57
Zachodniopomorskie 15,75 29,80 17,52 18,21
Education
Primary and below 7,14 10,99 8,78 9,66
Vocational 7,90 14,57 10,08 9,13
Secondary 4,99 17,17 8,94 8,12
Tertiary/post-secondary 4,48 15,63 9,37 5,96
Income per capita
First quartile 5,76 14,38 7,64 7,34
Middle 50% 6,27 13,71 10,24 8,84
Fourth quartile 5,66 19,77 10,54 8,36
Social-professional status
Public sector employees 7,94 12,97 9,11 7,69
Private sector employees 8,13 17,45 11,12 10,90
Self-employed 1,43 27,09 9,29 10,43
Farmers 4,08 11,74 4,21 4,51
Disability pensioners 5,29 8,59 15,15 7,92
Retirees 10,15 4,41 14,47 4,55
Students 0,00 18,18 2,99 1,26
Unemployed 5,57 9,71 8,33 6,50
Other professionally inactive 2,38 19,10 7,24 5,82
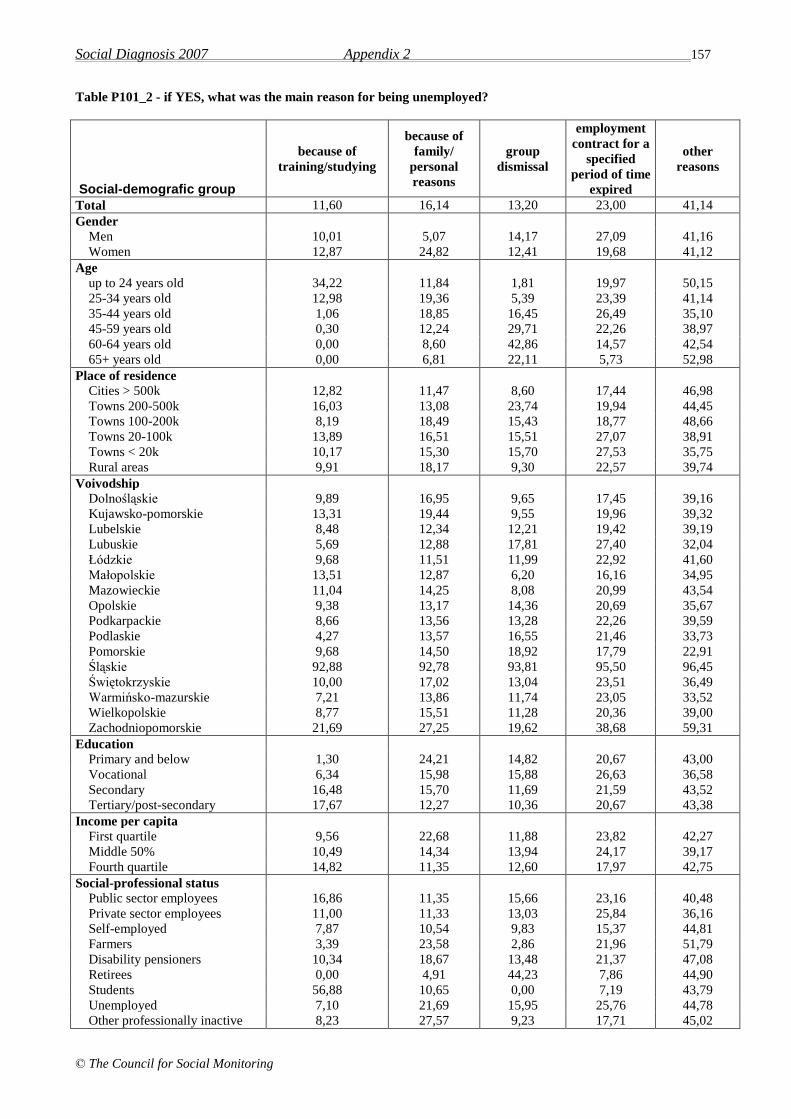
Social Diagnosis 2007 Appendix 2 157
© The Council for Social Monitoring
Table P101_2 - if YES, what was the main reason for being unemployed?
Social-demografic group
because of
training/studying
because of
family/
personal
reasons
group
dismissal
employment
contract for a
specified
period of time
expired
other
reasons
Total 11,60 16,14 13,20 23,00 41,14
Gender
Men 10,01 5,07 14,17 27,09 41,16
Women 12,87 24,82 12,41 19,68 41,12
Age
up to 24 years old 34,22 11,84 1,81 19,97 50,15
25-34 years old 12,98 19,36 5,39 23,39 41,14
35-44 years old 1,06 18,85 16,45 26,49 35,10
45-59 years old 0,30 12,24 29,71 22,26 38,97
60-64 years old 0,00 8,60 42,86 14,57 42,54
65+ years old 0,00 6,81 22,11 5,73 52,98
Place of residence
Cities > 500k 12,82 11,47 8,60 17,44 46,98
Towns 200-500k 16,03 13,08 23,74 19,94 44,45
Towns 100-200k 8,19 18,49 15,43 18,77 48,66
Towns 20-100k 13,89 16,51 15,51 27,07 38,91
Towns < 20k 10,17 15,30 15,70 27,53 35,75
Rural areas 9,91 18,17 9,30 22,57 39,74
Voivodship
Dolnośląskie 9,89 16,95 9,65 17,45 39,16
Kujawsko-pomorskie 13,31 19,44 9,55 19,96 39,32
Lubelskie 8,48 12,34 12,21 19,42 39,19
Lubuskie 5,69 12,88 17,81 27,40 32,04
Łódzkie 9,68 11,51 11,99 22,92 41,60
Małopolskie 13,51 12,87 6,20 16,16 34,95
Mazowieckie 11,04 14,25 8,08 20,99 43,54
Opolskie 9,38 13,17 14,36 20,69 35,67
Podkarpackie 8,66 13,56 13,28 22,26 39,59
Podlaskie 4,27 13,57 16,55 21,46 33,73
Pomorskie 9,68 14,50 18,92 17,79 22,91
Śląskie 92,88 92,78 93,81 95,50 96,45
Świętokrzyskie 10,00 17,02 13,04 23,51 36,49
Warmińsko-mazurskie 7,21 13,86 11,74 23,05 33,52
Wielkopolskie 8,77 15,51 11,28 20,36 39,00
Zachodniopomorskie 21,69 27,25 19,62 38,68 59,31
Education
Primary and below 1,30 24,21 14,82 20,67 43,00
Vocational 6,34 15,98 15,88 26,63 36,58
Secondary 16,48 15,70 11,69 21,59 43,52
Tertiary/post-secondary 17,67 12,27 10,36 20,67 43,38
Income per capita
First quartile 9,56 22,68 11,88 23,82 42,27
Middle 50% 10,49 14,34 13,94 24,17 39,17
Fourth quartile 14,82 11,35 12,60 17,97 42,75
Social-professional status
Public sector employees 16,86 11,35 15,66 23,16 40,48
Private sector employees 11,00 11,33 13,03 25,84 36,16
Self-employed 7,87 10,54 9,83 15,37 44,81
Farmers 3,39 23,58 2,86 21,96 51,79
Disability pensioners 10,34 18,67 13,48 21,37 47,08
Retirees 0,00 4,91 44,23 7,86 44,90
Students 56,88 10,65 0,00 7,19 43,79
Unemployed 7,10 21,69 15,95 25,76 44,78
Other professionally inactive 8,23 27,57 9,23 17,71 45,02
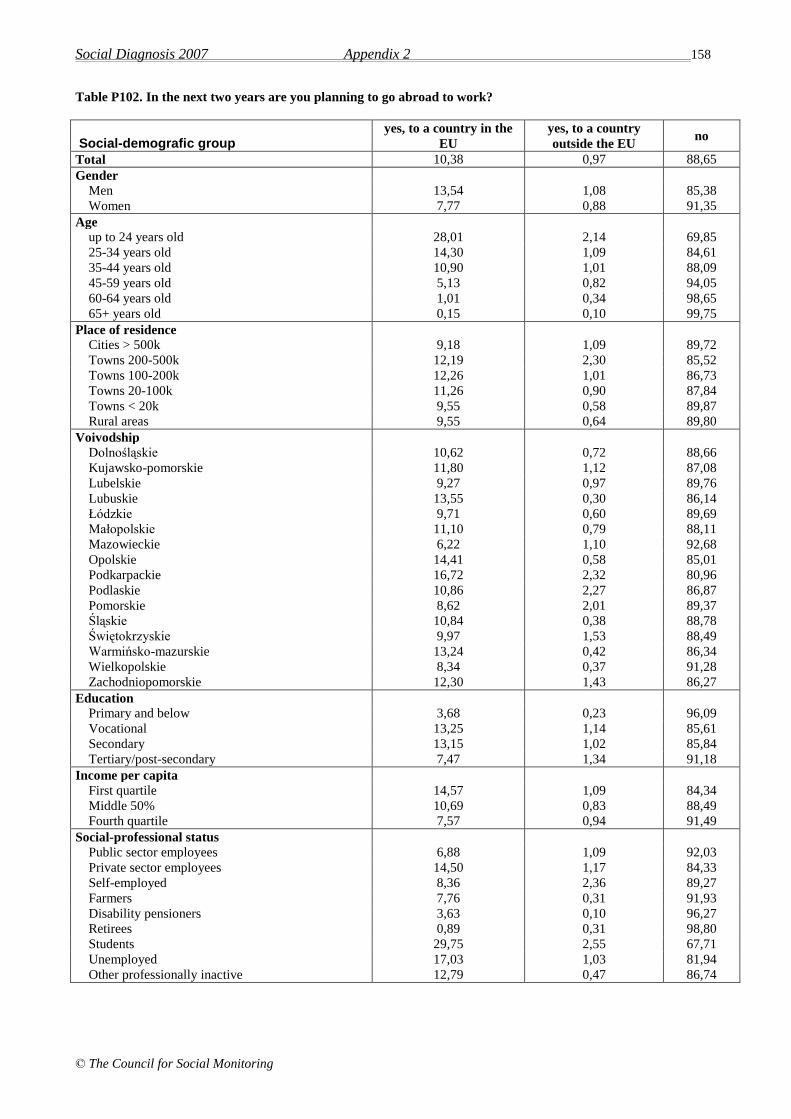
Social Diagnosis 2007 Appendix 2 158
© The Council for Social Monitoring
Table P102. In the next two years are you planning to go abroad to work?
Social-demografic group yes, to a country in the
EU
yes, to a country
outside the EU no
Total 10,38 0,97 88,65
Gender
Men 13,54 1,08 85,38
Women 7,77 0,88 91,35
Age
up to 24 years old 28,01 2,14 69,85
25-34 years old 14,30 1,09 84,61
35-44 years old 10,90 1,01 88,09
45-59 years old 5,13 0,82 94,05
60-64 years old 1,01 0,34 98,65
65+ years old 0,15 0,10 99,75
Place of residence
Cities > 500k 9,18 1,09 89,72
Towns 200-500k 12,19 2,30 85,52
Towns 100-200k 12,26 1,01 86,73
Towns 20-100k 11,26 0,90 87,84
Towns < 20k 9,55 0,58 89,87
Rural areas 9,55 0,64 89,80
Voivodship
Dolnośląskie 10,62 0,72 88,66
Kujawsko-pomorskie 11,80 1,12 87,08
Lubelskie 9,27 0,97 89,76
Lubuskie 13,55 0,30 86,14
Łódzkie 9,71 0,60 89,69
Małopolskie 11,10 0,79 88,11
Mazowieckie 6,22 1,10 92,68
Opolskie 14,41 0,58 85,01
Podkarpackie 16,72 2,32 80,96
Podlaskie 10,86 2,27 86,87
Pomorskie 8,62 2,01 89,37
Śląskie 10,84 0,38 88,78
Świętokrzyskie 9,97 1,53 88,49
Warmińsko-mazurskie 13,24 0,42 86,34
Wielkopolskie 8,34 0,37 91,28
Zachodniopomorskie 12,30 1,43 86,27
Education
Primary and below 3,68 0,23 96,09
Vocational 13,25 1,14 85,61
Secondary 13,15 1,02 85,84
Tertiary/post-secondary 7,47 1,34 91,18
Income per capita
First quartile 14,57 1,09 84,34
Middle 50% 10,69 0,83 88,49
Fourth quartile 7,57 0,94 91,49
Social-professional status
Public sector employees 6,88 1,09 92,03
Private sector employees 14,50 1,17 84,33
Self-employed 8,36 2,36 89,27
Farmers 7,76 0,31 91,93
Disability pensioners 3,63 0,10 96,27
Retirees 0,89 0,31 98,80
Students 29,75 2,55 67,71
Unemployed 17,03 1,03 81,94
Other professionally inactive 12,79 0,47 86,74
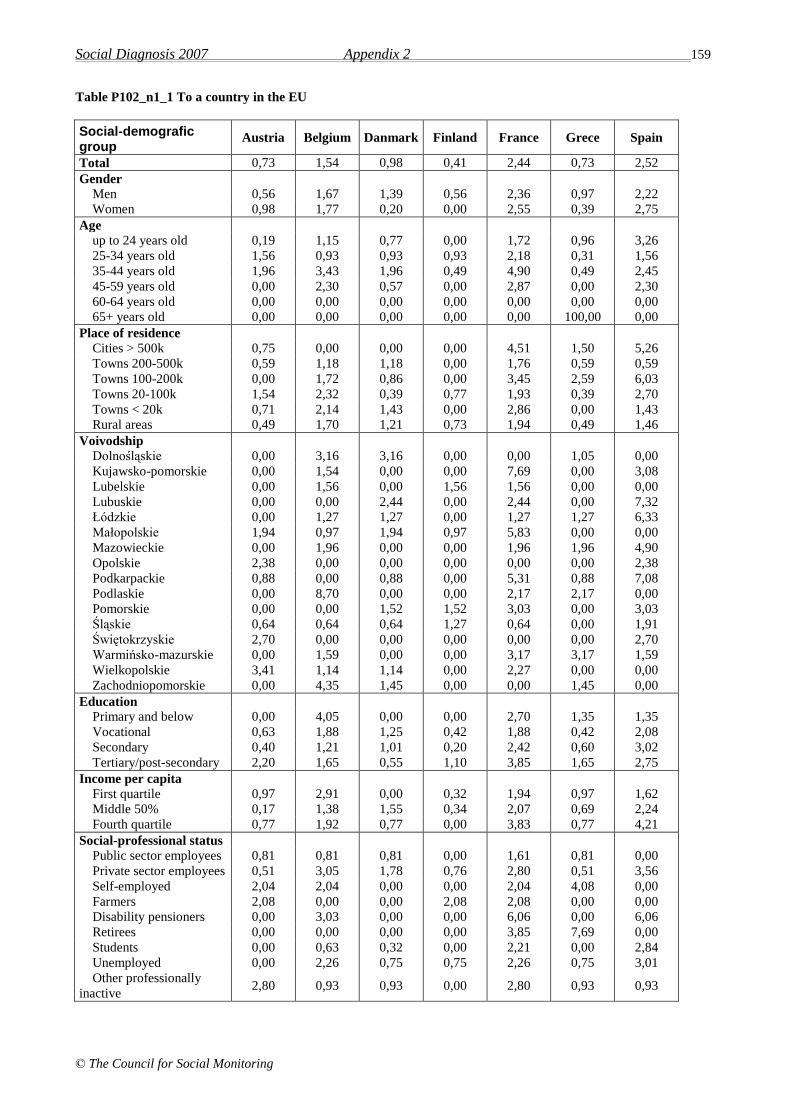
Social Diagnosis 2007 Appendix 2 159
© The Council for Social Monitoring
Table P102_n1_1 To a country in the EU
Social-demografic group
Austria Belgium Danmark Finland France Grece Spain
Total 0,73 1,54 0,98 0,41 2,44 0,73 2,52
Gender
Men 0,56 1,67 1,39 0,56 2,36 0,97 2,22
Women 0,98 1,77 0,20 0,00 2,55 0,39 2,75
Age
up to 24 years old 0,19 1,15 0,77 0,00 1,72 0,96 3,26
25-34 years old 1,56 0,93 0,93 0,93 2,18 0,31 1,56
35-44 years old 1,96 3,43 1,96 0,49 4,90 0,49 2,45
45-59 years old 0,00 2,30 0,57 0,00 2,87 0,00 2,30
60-64 years old 0,00 0,00 0,00 0,00 0,00 0,00 0,00
65+ years old 0,00 0,00 0,00 0,00 0,00 100,00 0,00
Place of residence
Cities > 500k 0,75 0,00 0,00 0,00 4,51 1,50 5,26
Towns 200-500k 0,59 1,18 1,18 0,00 1,76 0,59 0,59
Towns 100-200k 0,00 1,72 0,86 0,00 3,45 2,59 6,03
Towns 20-100k 1,54 2,32 0,39 0,77 1,93 0,39 2,70
Towns < 20k 0,71 2,14 1,43 0,00 2,86 0,00 1,43
Rural areas 0,49 1,70 1,21 0,73 1,94 0,49 1,46
Voivodship
Dolnośląskie 0,00 3,16 3,16 0,00 0,00 1,05 0,00
Kujawsko-pomorskie 0,00 1,54 0,00 0,00 7,69 0,00 3,08
Lubelskie 0,00 1,56 0,00 1,56 1,56 0,00 0,00
Lubuskie 0,00 0,00 2,44 0,00 2,44 0,00 7,32
Łódzkie 0,00 1,27 1,27 0,00 1,27 1,27 6,33
Małopolskie 1,94 0,97 1,94 0,97 5,83 0,00 0,00
Mazowieckie 0,00 1,96 0,00 0,00 1,96 1,96 4,90
Opolskie 2,38 0,00 0,00 0,00 0,00 0,00 2,38
Podkarpackie 0,88 0,00 0,88 0,00 5,31 0,88 7,08
Podlaskie 0,00 8,70 0,00 0,00 2,17 2,17 0,00
Pomorskie 0,00 0,00 1,52 1,52 3,03 0,00 3,03
Śląskie 0,64 0,64 0,64 1,27 0,64 0,00 1,91
Świętokrzyskie 2,70 0,00 0,00 0,00 0,00 0,00 2,70
Warmińsko-mazurskie 0,00 1,59 0,00 0,00 3,17 3,17 1,59
Wielkopolskie 3,41 1,14 1,14 0,00 2,27 0,00 0,00
Zachodniopomorskie 0,00 4,35 1,45 0,00 0,00 1,45 0,00
Education
Primary and below 0,00 4,05 0,00 0,00 2,70 1,35 1,35
Vocational 0,63 1,88 1,25 0,42 1,88 0,42 2,08
Secondary 0,40 1,21 1,01 0,20 2,42 0,60 3,02
Tertiary/post-secondary 2,20 1,65 0,55 1,10 3,85 1,65 2,75
Income per capita
First quartile 0,97 2,91 0,00 0,32 1,94 0,97 1,62
Middle 50% 0,17 1,38 1,55 0,34 2,07 0,69 2,24
Fourth quartile 0,77 1,92 0,77 0,00 3,83 0,77 4,21
Social-professional status
Public sector employees 0,81 0,81 0,81 0,00 1,61 0,81 0,00
Private sector employees 0,51 3,05 1,78 0,76 2,80 0,51 3,56
Self-employed 2,04 2,04 0,00 0,00 2,04 4,08 0,00
Farmers 2,08 0,00 0,00 2,08 2,08 0,00 0,00
Disability pensioners 0,00 3,03 0,00 0,00 6,06 0,00 6,06
Retirees 0,00 0,00 0,00 0,00 3,85 7,69 0,00
Students 0,00 0,63 0,32 0,00 2,21 0,00 2,84
Unemployed 0,00 2,26 0,75 0,75 2,26 0,75 3,01
Other professionally
inactive 2,80 0,93 0,93 0,00 2,80 0,93 0,93

Social Diagnosis 2007 Appendix 2 160
© The Council for Social Monitoring
Table P102_n1_2 To a country in the EU
Social-demografic group
The
Netherlands Ireland Germany Sweden
Great
Britain Italy
Total 4,63 8,94 21,54 1,22 41,63 4,07
Gender
Men 4,58 10,42 22,64 1,25 41,53 1,94
Women 4,72 6,88 20,43 1,18 42,04 6,88
Age
up to 24 years old 4,98 10,73 14,56 0,77 49,81 3,45
25-34 years old 3,12 9,03 21,81 1,87 44,55 4,36
35-44 years old 6,37 8,82 29,41 0,98 29,90 1,96
45-59 years old 4,60 4,02 33,33 1,15 27,01 6,90
60-64 years old 11,11 0,00 22,22 11,11 33,33 0,00
65+ years old 0,00 0,00 0,00 0,00 0,00 0,00
Place of residence
Cities > 500k 4,51 12,03 7,52 2,26 47,37 4,51
Towns 200-500k 2,94 5,88 11,18 4,12 53,53 1,18
Towns 100-200k 5,17 7,76 17,24 0,00 43,97 3,45
Towns 20-100k 3,09 13,13 18,92 0,00 43,63 4,25
Towns < 20k 7,14 5,71 30,71 0,00 37,86 3,57
Rural areas 5,34 7,77 30,58 1,21 34,71 4,85
Voivodship
Dolnośląskie 5,26 9,47 29,47 2,11 34,74 5,26
Kujawsko-pomorskie 3,08 6,15 16,92 3,08 49,23 4,62
Lubelskie 0,00 9,38 12,50 3,13 51,56 7,81
Lubuskie 4,88 7,32 41,46 0,00 26,83 2,44
Łódzkie 5,06 18,99 20,25 0,00 36,71 1,27
Małopolskie 2,91 12,62 11,65 0,00 49,51 4,85
Mazowieckie 1,96 2,94 16,67 2,94 46,08 4,90
Opolskie 21,43 2,38 45,24 0,00 19,05 2,38
Podkarpackie 2,65 7,96 17,70 0,00 34,51 9,73
Podlaskie 0,00 4,35 28,26 0,00 32,61 6,52
Pomorskie 1,52 10,61 13,64 0,00 42,42 1,52
Śląskie 12,10 8,92 11,46 3,82 50,32 2,55
Świętokrzyskie 0,00 10,81 27,03 0,00 40,54 10,81
Warmińsko-mazurskie 1,59 3,17 23,81 0,00 53,97 1,59
Wielkopolskie 6,82 10,23 38,64 0,00 31,82 0,00
Zachodniopomorskie 0,00 13,04 26,09 0,00 43,48 0,00
Education
Primary and below 6,76 9,46 36,49 0,00 31,08 4,05
Vocational 6,25 8,75 27,08 0,63 35,83 4,58
Secondary 3,83 8,47 17,54 1,81 48,19 3,63
Tertiary/post-secondary 1,10 10,44 12,09 1,65 43,96 2,75
Income per capita
First quartile 3,88 10,36 27,83 1,94 38,19 3,88
Middle 50% 5,34 8,97 21,38 0,86 42,93 4,48
Fourth quartile 1,53 6,90 17,24 1,92 44,83 2,30
Social-professional status
Public sector employees 4,84 8,87 22,58 0,00 41,13 4,84
Private sector employees 4,07 9,67 22,39 1,53 38,68 3,56
Self-employed 2,04 4,08 26,53 2,04 26,53 2,04
Farmers 8,33 2,08 47,92 0,00 20,83 10,42
Disability pensioners 0,00 0,00 18,18 0,00 63,64 3,03
Retirees 7,69 3,85 30,77 7,69 19,23 3,85
Students 4,42 9,78 11,04 0,63 54,89 3,79
Unemployed 5,26 13,53 30,08 0,00 31,58 4,51
Other professionally
inactive 6,54 6,54 22,43 3,74 42,06 3,74
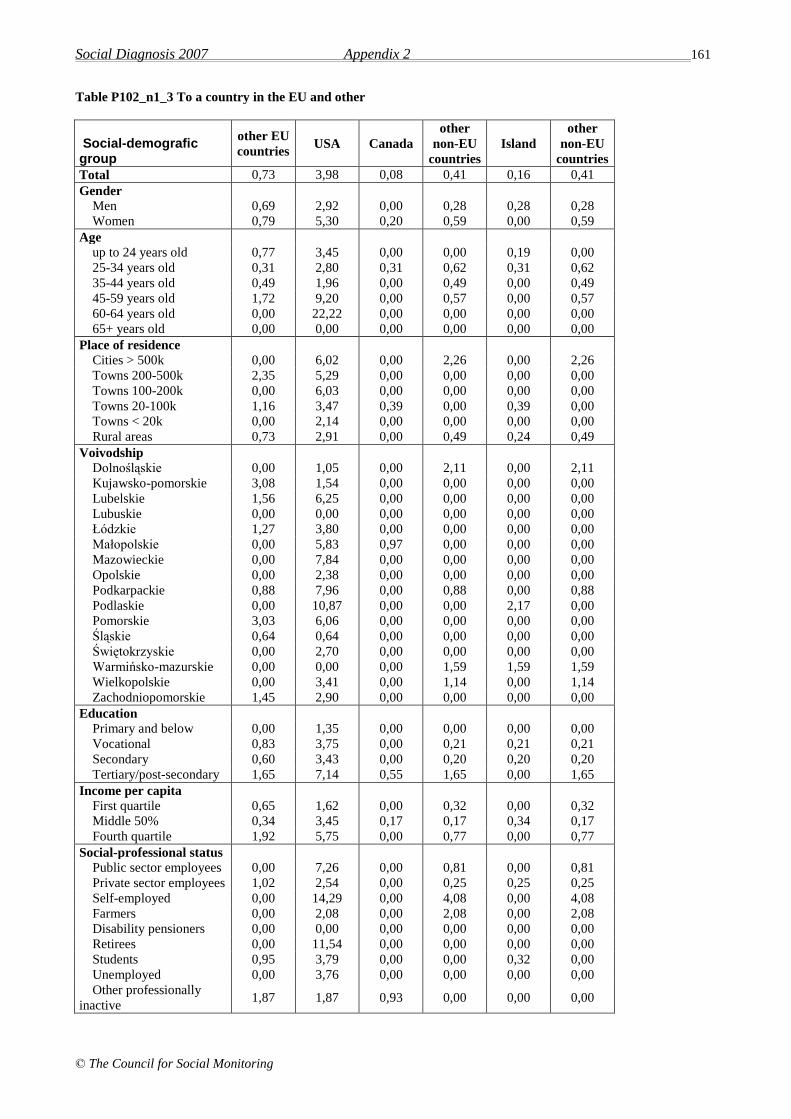
Social Diagnosis 2007 Appendix 2 161
© The Council for Social Monitoring
Table P102_n1_3 To a country in the EU and other
Social-demografic group
other EU
countries USA Canada
other
non-EU
countries
Island
other
non-EU
countries
Total 0,73 3,98 0,08 0,41 0,16 0,41
Gender
Men 0,69 2,92 0,00 0,28 0,28 0,28
Women 0,79 5,30 0,20 0,59 0,00 0,59
Age
up to 24 years old 0,77 3,45 0,00 0,00 0,19 0,00
25-34 years old 0,31 2,80 0,31 0,62 0,31 0,62
35-44 years old 0,49 1,96 0,00 0,49 0,00 0,49
45-59 years old 1,72 9,20 0,00 0,57 0,00 0,57
60-64 years old 0,00 22,22 0,00 0,00 0,00 0,00
65+ years old 0,00 0,00 0,00 0,00 0,00 0,00
Place of residence
Cities > 500k 0,00 6,02 0,00 2,26 0,00 2,26
Towns 200-500k 2,35 5,29 0,00 0,00 0,00 0,00
Towns 100-200k 0,00 6,03 0,00 0,00 0,00 0,00
Towns 20-100k 1,16 3,47 0,39 0,00 0,39 0,00
Towns < 20k 0,00 2,14 0,00 0,00 0,00 0,00
Rural areas 0,73 2,91 0,00 0,49 0,24 0,49
Voivodship
Dolnośląskie 0,00 1,05 0,00 2,11 0,00 2,11
Kujawsko-pomorskie 3,08 1,54 0,00 0,00 0,00 0,00
Lubelskie 1,56 6,25 0,00 0,00 0,00 0,00
Lubuskie 0,00 0,00 0,00 0,00 0,00 0,00
Łódzkie 1,27 3,80 0,00 0,00 0,00 0,00
Małopolskie 0,00 5,83 0,97 0,00 0,00 0,00
Mazowieckie 0,00 7,84 0,00 0,00 0,00 0,00
Opolskie 0,00 2,38 0,00 0,00 0,00 0,00
Podkarpackie 0,88 7,96 0,00 0,88 0,00 0,88
Podlaskie 0,00 10,87 0,00 0,00 2,17 0,00
Pomorskie 3,03 6,06 0,00 0,00 0,00 0,00
Śląskie 0,64 0,64 0,00 0,00 0,00 0,00
Świętokrzyskie 0,00 2,70 0,00 0,00 0,00 0,00
Warmińsko-mazurskie 0,00 0,00 0,00 1,59 1,59 1,59
Wielkopolskie 0,00 3,41 0,00 1,14 0,00 1,14
Zachodniopomorskie 1,45 2,90 0,00 0,00 0,00 0,00
Education
Primary and below 0,00 1,35 0,00 0,00 0,00 0,00
Vocational 0,83 3,75 0,00 0,21 0,21 0,21
Secondary 0,60 3,43 0,00 0,20 0,20 0,20
Tertiary/post-secondary 1,65 7,14 0,55 1,65 0,00 1,65
Income per capita
First quartile 0,65 1,62 0,00 0,32 0,00 0,32
Middle 50% 0,34 3,45 0,17 0,17 0,34 0,17
Fourth quartile 1,92 5,75 0,00 0,77 0,00 0,77
Social-professional status
Public sector employees 0,00 7,26 0,00 0,81 0,00 0,81
Private sector employees 1,02 2,54 0,00 0,25 0,25 0,25
Self-employed 0,00 14,29 0,00 4,08 0,00 4,08
Farmers 0,00 2,08 0,00 2,08 0,00 2,08
Disability pensioners 0,00 0,00 0,00 0,00 0,00 0,00
Retirees 0,00 11,54 0,00 0,00 0,00 0,00
Students 0,95 3,79 0,00 0,00 0,32 0,00
Unemployed 0,00 3,76 0,00 0,00 0,00 0,00
Other professionally
inactive 1,87 1,87 0,93 0,00 0,00 0,00

Social Diagnosis 2007 Appendix 2 162
© The Council for Social Monitoring
Table P106_1. In your opinion, what of the following is the most important at work?
Social-demografic group No
stress Independence
Self-
development
Working in line
with one’s skills
Quick
promotion Stability
Total 48,64 17,98 21,88 32,06 5,05 42,21
Gender
Men 45,38 21,91 20,14 34,15 5,80 42,24
Women 51,34 14,73 23,33 30,33 4,44 42,19
Age
up to 24 years old 47,16 19,27 33,09 29,32 9,75 34,41
25-34 years old 51,81 18,97 32,54 25,00 5,81 40,72
35-44 years old 54,73 17,19 19,45 30,10 2,65 46,66
45-59 years old 50,42 19,69 15,56 36,41 3,55 45,70
60-64 years old 42,87 17,34 16,43 36,85 6,06 42,76
65+ years old 39,02 13,65 13,32 36,16 4,29 40,98
Place of residence
Cities > 500k 45,53 22,19 34,28 30,90 5,20 46,87
Towns 200-500k 51,37 19,05 28,95 33,91 5,16 42,81
Towns 100-200k 49,09 17,86 24,19 34,82 5,45 44,19
Towns 20-100k 49,55 17,41 22,61 34,07 5,84 45,02
Towns < 20k 52,24 18,18 20,26 30,44 4,53 41,75
Rural areas 46,89 16,63 15,53 30,68 4,65 38,81
Voivodship
Dolnośląskie 48,43 17,23 23,06 29,75 5,95 39,16
Kujawsko-pomorskie 46,33 19,45 20,69 31,38 3,70 39,41
Lubelskie 47,26 17,10 23,37 32,43 6,78 38,52
Lubuskie 48,63 16,42 20,62 34,04 4,49 38,17
Łódzkie 53,49 16,30 22,59 33,30 5,06 44,42
Małopolskie 46,25 16,67 23,49 32,45 5,17 44,11
Mazowieckie 48,45 21,27 25,98 32,36 4,67 44,32
Opolskie 49,90 16,50 19,74 34,81 3,31 38,09
Podkarpackie 47,56 14,98 20,73 32,16 6,12 38,96
Podlaskie 48,83 16,32 19,34 32,59 6,08 48,20
Pomorskie 51,08 18,67 22,62 29,76 2,96 43,70
Śląskie 46,91 17,24 20,04 30,99 4,96 44,92
Świętokrzyskie 46,85 13,92 21,06 33,79 4,63 39,09
Warmińsko-mazurskie 46,33 20,82 18,72 28,67 5,98 47,60
Wielkopolskie 52,67 18,86 21,78 34,58 4,17 39,69
Zachodniopomorskie 48,88 20,54 16,26 32,40 7,22 39,92
Education
Primary and below 40,07 10,96 9,27 29,16 3,57 40,43
Vocational 48,62 16,07 13,80 31,41 5,30 40,99
Secondary 53,90 19,96 25,55 31,51 5,97 42,98
Tertiary/post-secondary 47,91 24,24 40,31 36,71 4,54 44,56
Income per capita
First quartile 46,95 13,50 17,18 30,31 4,88 38,34
Middle 50% 49,79 16,07 19,48 31,33 5,39 43,03
Fourth quartile 48,18 23,04 27,94 35,29 4,85 43,18
Social-professional status
Public sector employees 56,43 18,57 26,91 33,67 5,08 50,16
Private sector employees 55,47 17,82 23,89 25,45 5,19 45,64
Self-employed 47,30 43,21 27,12 35,58 2,19 30,45
Farmers 46,10 26,30 14,55 32,72 3,68 32,94
Disability pensioners 43,70 13,41 13,82 34,58 4,54 39,77
Retirees 41,69 14,66 15,09 37,59 4,73 42,44
Students 43,98 18,32 37,14 33,79 9,94 33,60
Unemployed 47,53 13,88 18,51 31,59 4,68 43,72
Other professionally
inactive 45,25 14,03 20,88 27,07 3,30 39,42
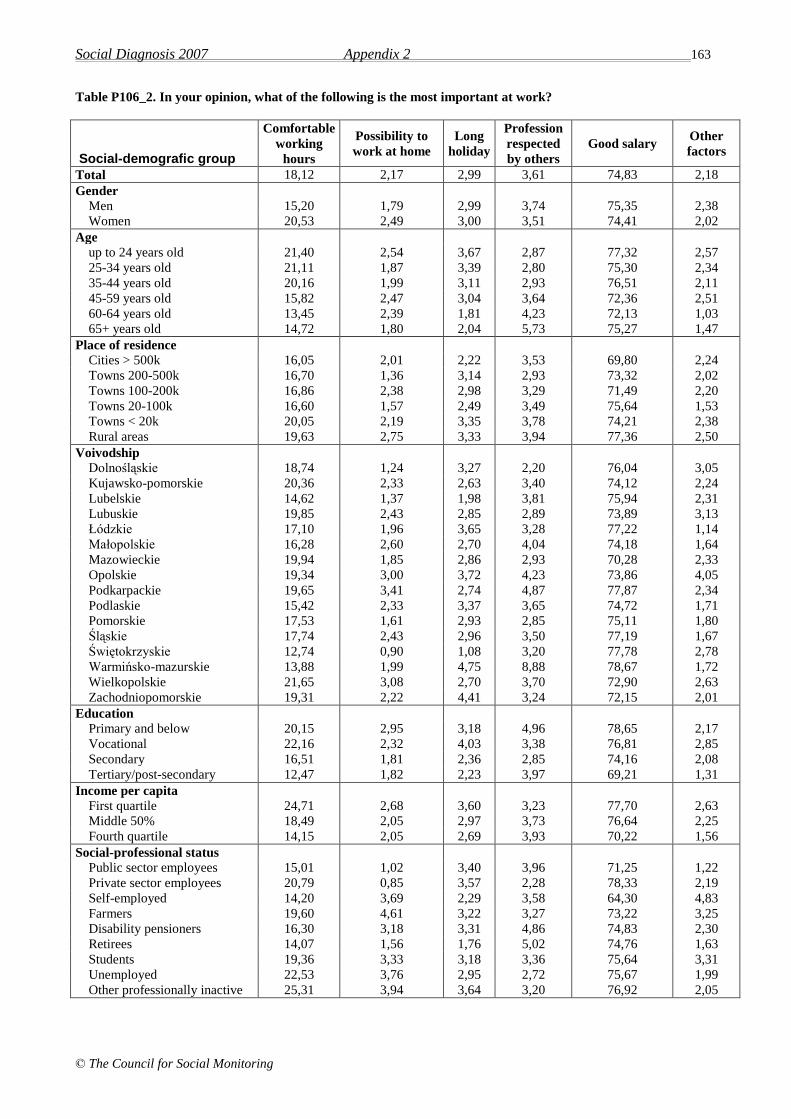
Social Diagnosis 2007 Appendix 2 163
© The Council for Social Monitoring
Table P106_2. In your opinion, what of the following is the most important at work?
Social-demografic group
Comfortable
working
hours
Possibility to
work at home
Long
holiday
Profession
respected
by others
Good salary Other
factors
Total 18,12 2,17 2,99 3,61 74,83 2,18
Gender
Men 15,20 1,79 2,99 3,74 75,35 2,38
Women 20,53 2,49 3,00 3,51 74,41 2,02
Age
up to 24 years old 21,40 2,54 3,67 2,87 77,32 2,57
25-34 years old 21,11 1,87 3,39 2,80 75,30 2,34
35-44 years old 20,16 1,99 3,11 2,93 76,51 2,11
45-59 years old 15,82 2,47 3,04 3,64 72,36 2,51
60-64 years old 13,45 2,39 1,81 4,23 72,13 1,03
65+ years old 14,72 1,80 2,04 5,73 75,27 1,47
Place of residence
Cities > 500k 16,05 2,01 2,22 3,53 69,80 2,24
Towns 200-500k 16,70 1,36 3,14 2,93 73,32 2,02
Towns 100-200k 16,86 2,38 2,98 3,29 71,49 2,20
Towns 20-100k 16,60 1,57 2,49 3,49 75,64 1,53
Towns < 20k 20,05 2,19 3,35 3,78 74,21 2,38
Rural areas 19,63 2,75 3,33 3,94 77,36 2,50
Voivodship
Dolnośląskie 18,74 1,24 3,27 2,20 76,04 3,05
Kujawsko-pomorskie 20,36 2,33 2,63 3,40 74,12 2,24
Lubelskie 14,62 1,37 1,98 3,81 75,94 2,31
Lubuskie 19,85 2,43 2,85 2,89 73,89 3,13
Łódzkie 17,10 1,96 3,65 3,28 77,22 1,14
Małopolskie 16,28 2,60 2,70 4,04 74,18 1,64
Mazowieckie 19,94 1,85 2,86 2,93 70,28 2,33
Opolskie 19,34 3,00 3,72 4,23 73,86 4,05
Podkarpackie 19,65 3,41 2,74 4,87 77,87 2,34
Podlaskie 15,42 2,33 3,37 3,65 74,72 1,71
Pomorskie 17,53 1,61 2,93 2,85 75,11 1,80
Śląskie 17,74 2,43 2,96 3,50 77,19 1,67
Świętokrzyskie 12,74 0,90 1,08 3,20 77,78 2,78
Warmińsko-mazurskie 13,88 1,99 4,75 8,88 78,67 1,72
Wielkopolskie 21,65 3,08 2,70 3,70 72,90 2,63
Zachodniopomorskie 19,31 2,22 4,41 3,24 72,15 2,01
Education
Primary and below 20,15 2,95 3,18 4,96 78,65 2,17
Vocational 22,16 2,32 4,03 3,38 76,81 2,85
Secondary 16,51 1,81 2,36 2,85 74,16 2,08
Tertiary/post-secondary 12,47 1,82 2,23 3,97 69,21 1,31
Income per capita
First quartile 24,71 2,68 3,60 3,23 77,70 2,63
Middle 50% 18,49 2,05 2,97 3,73 76,64 2,25
Fourth quartile 14,15 2,05 2,69 3,93 70,22 1,56
Social-professional status
Public sector employees 15,01 1,02 3,40 3,96 71,25 1,22
Private sector employees 20,79 0,85 3,57 2,28 78,33 2,19
Self-employed 14,20 3,69 2,29 3,58 64,30 4,83
Farmers 19,60 4,61 3,22 3,27 73,22 3,25
Disability pensioners 16,30 3,18 3,31 4,86 74,83 2,30
Retirees 14,07 1,56 1,76 5,02 74,76 1,63
Students 19,36 3,33 3,18 3,36 75,64 3,31
Unemployed 22,53 3,76 2,95 2,72 75,67 1,99
Other professionally inactive 25,31 3,94 3,64 3,20 76,92 2,05

Social Diagnosis 2007 Appendix 2 164
© The Council for Social Monitoring
Table P107.1. In your opinion, what solutions would facilitate combining work and private life, including looking
after children? 1: proper work organization (for example part time, shift work, flexible work time, working
at home, more free days during the week)
Social-demografic group
most
important
second
important
third
important
least
important
Total 52,97 16,50 14,78 15,75
Gender
Men 56,21 15,51 13,18 15,10
Women 50,24 17,34 16,12 16,30
Age
up to 24 years old 56,70 16,05 13,09 14,16
25-34 years old 51,99 17,29 14,99 15,73
35-44 years old 54,78 17,83 12,75 14,64
45-59 years old 53,37 16,31 14,90 15,42
60-64 years old 52,78 14,90 15,62 16,70
65+ years old 47,93 15,47 17,74 18,86
Place of residence
Cities > 500k 60,02 17,04 11,13 11,82
Towns 200-500k 59,90 15,56 11,47 13,08
Towns 100-200k 56,48 16,88 12,63 14,01
Towns 20-100k 52,71 16,83 14,96 15,51
Towns < 20k 52,51 16,70 15,10 15,70
Rural areas 48,15 16,30 17,22 18,33
Voivodship
Dolnośląskie 53,81 18,47 12,78 14,93
Kujawsko-pomorskie 49,75 17,42 16,25 16,58
Lubelskie 50,85 18,61 14,49 16,05
Lubuskie 50,63 17,19 15,00 17,19
Łódzkie 48,89 16,91 18,64 15,56
Małopolskie 51,26 17,72 16,72 14,30
Mazowieckie 55,11 17,30 13,83 13,76
Opolskie 56,62 15,89 11,59 15,89
Podkarpackie 50,63 16,83 14,76 17,78
Podlaskie 53,12 14,63 16,53 15,72
Pomorskie 54,89 12,79 14,37 17,96
Śląskie 59,23 15,81 11,87 13,09
Świętokrzyskie 46,95 17,24 19,10 16,71
Warmińsko-mazurskie 41,48 16,37 17,26 24,89
Wielkopolskie 56,27 14,55 14,64 14,55
Zachodniopomorskie 50,65 14,97 14,60 19,78
Education
Primary and below 42,35 15,78 20,89 20,98
Vocational 51,86 16,62 14,57 16,95
Secondary 55,86 16,37 13,36 14,41
Tertiary/post-secondary 59,44 17,15 12,01 11,40
Income per capita
First quartile 50,97 17,88 14,46 16,69
Middle 50% 50,27 15,76 16,33 17,63
Fourth quartile 57,56 16,74 13,01 12,69
Social-professional status
Public sector employees 55,52 16,88 13,26 14,33
Private sector employees 53,42 17,26 13,63 15,69
Self-employed 61,65 16,54 10,34 11,47
Farmers 48,79 17,07 18,04 16,10
Disability pensioners 48,27 15,53 17,42 18,78
Retirees 50,27 15,63 17,24 16,87
Students 59,79 15,58 11,68 12,95
Unemployed 49,16 18,26 14,32 18,26
Other professionally
inactive 51,70 15,78 16,63 15,90

Social Diagnosis 2007 Appendix 2 165
© The Council for Social Monitoring
Table P107.2. In your opinion, what solutions would facilitate combining work and private life, including looking
after children? 2: longer paid leave (for example maternity, custody etc.)
Social-demografic group most
important
second
important
third
important
least
important
Total 24,24 33,52 26,48 15,76
Gender
Men 20,82 35,16 27,44 16,57
Women 27,10 32,17 25,66 15,07
Age
up to 24 years old 22,90 33,48 27,35 16,28
25-34 years old 26,56 30,94 26,08 16,41
35-44 years old 21,28 31,17 29,57 17,98
45-59 years old 22,84 35,90 25,94 15,32
60-64 years old 26,70 33,52 25,78 14,00
65+ years old 27,47 35,05 24,09 13,39
Place of residence
Cities > 500k 18,76 30,26 32,99 17,98
Towns 200-500k 22,31 34,70 26,72 16,27
Towns 100-200k 22,49 32,10 28,17 17,25
Towns 20-100k 24,82 33,19 26,95 15,04
Towns < 20k 24,95 34,62 23,12 17,31
Rural areas 26,33 34,26 24,98 14,44
Voivodship
Dolnośląskie 22,84 31,82 27,71 17,64
Kujawsko-pomorskie 25,51 35,88 22,45 16,16
Lubelskie 22,75 34,19 25,32 17,74
Lubuskie 21,12 29,50 32,61 16,77
Łódzkie 28,06 29,54 25,96 16,44
Małopolskie 26,04 35,27 23,44 15,25
Mazowieckie 24,94 35,00 26,56 13,51
Opolskie 22,52 35,43 26,49 15,56
Podkarpackie 25,32 36,22 26,60 11,86
Podlaskie 23,29 33,15 30,14 13,42
Pomorskie 21,73 37,70 25,47 15,11
Śląskie 19,31 31,81 29,71 19,17
Świętokrzyskie 32,98 31,10 21,72 14,21
Warmińsko-mazurskie 31,15 33,41 20,09 15,35
Wielkopolskie 23,26 32,63 29,25 14,86
Zachodniopomorskie 25,00 32,65 25,93 16,42
Education
Primary and below 28,85 34,36 22,61 14,18
Vocational 23,26 34,36 26,07 16,31
Secondary 23,32 34,45 26,69 15,54
Tertiary/post-secondary 23,24 30,06 30,06 16,64
Income per capita
First quartile 22,32 34,58 25,64 17,46
Middle 50% 25,60 33,98 24,99 15,44
Fourth quartile 23,15 31,87 28,86 16,12
Social-professional status
Public sector employees 25,09 32,36 27,84 14,72
Private sector employees 23,13 32,61 27,19 17,06
Self-employed 20,08 30,78 30,59 18,55
Farmers 27,57 32,95 23,98 15,50
Disability pensioners 25,48 33,86 24,84 15,82
Retirees 26,37 35,16 24,70 13,77
Students 21,06 33,99 29,48 15,48
Unemployed 23,22 33,74 26,24 16,81
Other professionally inactive 24,09 35,26 23,84 16,81
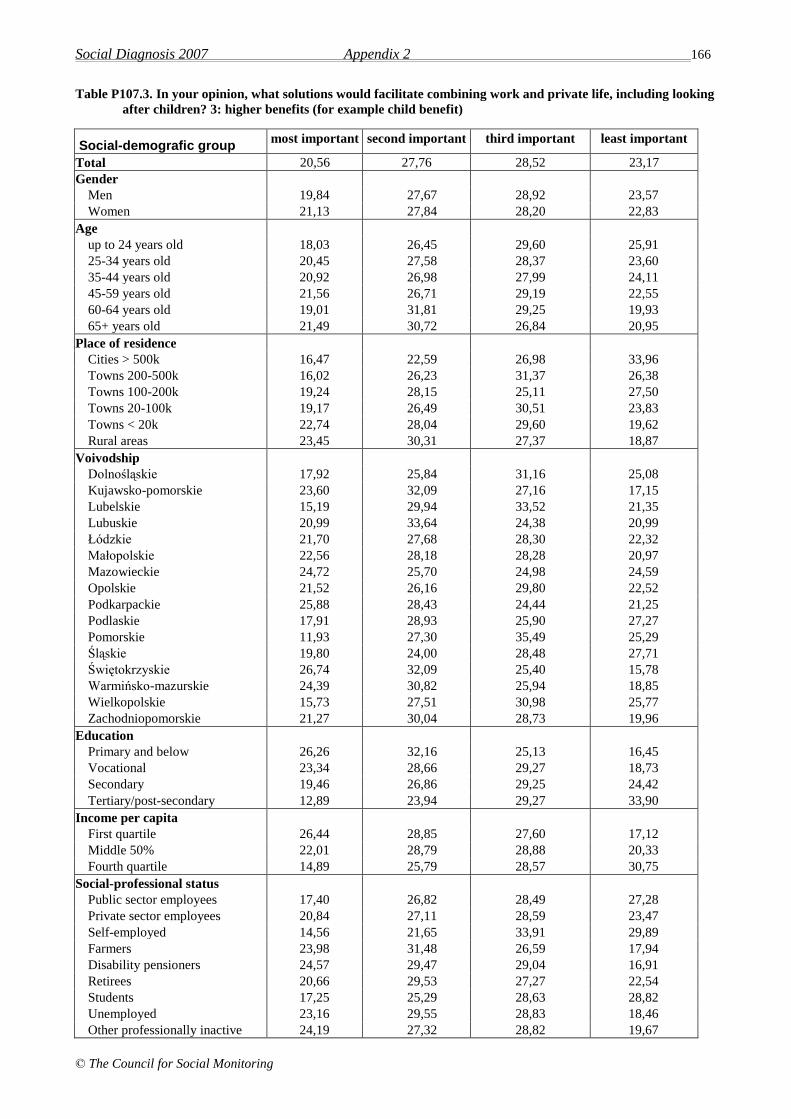
Social Diagnosis 2007 Appendix 2 166
© The Council for Social Monitoring
Table P107.3. In your opinion, what solutions would facilitate combining work and private life, including looking
after children? 3: higher benefits (for example child benefit)
Social-demografic group most important second important third important least important
Total 20,56 27,76 28,52 23,17
Gender
Men 19,84 27,67 28,92 23,57
Women 21,13 27,84 28,20 22,83
Age
up to 24 years old 18,03 26,45 29,60 25,91
25-34 years old 20,45 27,58 28,37 23,60
35-44 years old 20,92 26,98 27,99 24,11
45-59 years old 21,56 26,71 29,19 22,55
60-64 years old 19,01 31,81 29,25 19,93
65+ years old 21,49 30,72 26,84 20,95
Place of residence
Cities > 500k 16,47 22,59 26,98 33,96
Towns 200-500k 16,02 26,23 31,37 26,38
Towns 100-200k 19,24 28,15 25,11 27,50
Towns 20-100k 19,17 26,49 30,51 23,83
Towns < 20k 22,74 28,04 29,60 19,62
Rural areas 23,45 30,31 27,37 18,87
Voivodship
Dolnośląskie 17,92 25,84 31,16 25,08
Kujawsko-pomorskie 23,60 32,09 27,16 17,15
Lubelskie 15,19 29,94 33,52 21,35
Lubuskie 20,99 33,64 24,38 20,99
Łódzkie 21,70 27,68 28,30 22,32
Małopolskie 22,56 28,18 28,28 20,97
Mazowieckie 24,72 25,70 24,98 24,59
Opolskie 21,52 26,16 29,80 22,52
Podkarpackie 25,88 28,43 24,44 21,25
Podlaskie 17,91 28,93 25,90 27,27
Pomorskie 11,93 27,30 35,49 25,29
Śląskie 19,80 24,00 28,48 27,71
Świętokrzyskie 26,74 32,09 25,40 15,78
Warmińsko-mazurskie 24,39 30,82 25,94 18,85
Wielkopolskie 15,73 27,51 30,98 25,77
Zachodniopomorskie 21,27 30,04 28,73 19,96
Education
Primary and below 26,26 32,16 25,13 16,45
Vocational 23,34 28,66 29,27 18,73
Secondary 19,46 26,86 29,25 24,42
Tertiary/post-secondary 12,89 23,94 29,27 33,90
Income per capita
First quartile 26,44 28,85 27,60 17,12
Middle 50% 22,01 28,79 28,88 20,33
Fourth quartile 14,89 25,79 28,57 30,75
Social-professional status
Public sector employees 17,40 26,82 28,49 27,28
Private sector employees 20,84 27,11 28,59 23,47
Self-employed 14,56 21,65 33,91 29,89
Farmers 23,98 31,48 26,59 17,94
Disability pensioners 24,57 29,47 29,04 16,91
Retirees 20,66 29,53 27,27 22,54
Students 17,25 25,29 28,63 28,82
Unemployed 23,16 29,55 28,83 18,46
Other professionally inactive 24,19 27,32 28,82 19,67

Social Diagnosis 2007 Appendix 2 167
© The Council for Social Monitoring
Table P107.4. In your opinion, what solutions would facilitate combining work and private life, including looking
after children? 4: l better possibilities of child custody outside home (more nursery schools, adaptation of
nurseries work time to the work time of the parents, more activities in schools etc.)
Social-demografic group most
important
second
important
third
important
least
important
Total 19,04 23,78 21,85 35,34
Gender
Men 18,76 23,65 22,51 35,09
Women 19,25 23,90 21,29 35,56
Age
up to 24 years old 17,08 24,35 22,89 35,68
25-34 years old 19,72 26,24 21,08 32,97
35-44 years old 19,72 25,64 21,22 33,42
45-59 years old 18,75 22,31 21,41 37,53
60-64 years old 20,48 22,49 21,21 35,83
65+ years old 19,52 21,23 23,27 35,98
Place of residence
Cities > 500k 18,34 31,58 22,10 27,98
Towns 200-500k 19,58 26,73 21,22 32,46
Towns 100-200k 21,42 25,40 22,82 30,36
Towns 20-100k 19,16 25,10 20,27 35,47
Towns < 20k 21,39 21,39 20,58 36,63
Rural areas 17,65 20,26 23,04 39,05
Voivodship
Dolnośląskie 23,20 23,85 21,05 31,90
Kujawsko-pomorskie 23,39 17,97 22,20 36,44
Lubelskie 19,97 24,43 18,97 36,64
Lubuskie 20,92 24,62 18,15 36,31
Łódzkie 18,80 24,91 20,55 35,74
Małopolskie 13,83 22,60 23,13 40,44
Mazowieckie 17,99 24,77 24,97 32,27
Opolskie 28,99 22,48 15,96 32,57
Podkarpackie 19,30 22,81 22,17 35,73
Podlaskie 14,56 27,75 21,43 36,26
Pomorskie 11,51 22,45 24,46 41,58
Śląskie 21,60 27,25 21,32 29,83
Świętokrzyskie 19,09 20,43 21,24 39,25
Warmińsko-mazurskie 18,93 23,16 25,39 32,52
Wielkopolskie 15,35 24,81 20,27 39,58
Zachodniopomorskie 24,30 18,74 21,34 35,62
Education
Primary and below 18,78 19,22 22,87 39,12
Vocational 19,99 20,94 21,17 37,90
Secondary 19,30 24,89 21,68 34,13
Tertiary/post-secondary 17,23 30,50 22,21 30,06
Income per capita
First quartile 20,91 20,47 20,95 37,67
Middle 50% 18,31 23,34 21,76 36,59
Fourth quartile 18,90 27,52 22,40 31,17
Social-professional status
Public sector employees 17,82 26,67 22,07 33,45
Private sector employees 20,24 24,48 21,11 34,17
Self-employed 20,23 29,20 19,66 30,92
Farmers 15,82 19,09 24,31 40,78
Disability pensioners 17,71 23,33 21,31 37,65
Retirees 19,50 21,92 22,92 35,66
Students 15,95 25,15 23,78 35,13
Unemployed 21,67 21,55 19,13 37,65
Other professionally inactive 20,60 21,72 20,97 36,70

Social Diagnosis 2007 Appendix 2 168
© The Council for Social Monitoring
Table P108.1. Do you trust banks?
Social-demografic group yes no
I have no
opinion
Total 53,84 15,93 30,24
Gender
Men 54,29 17,88 27,84
Women 53,46 14,33 32,22
Age
up to 24 years old 44,79 10,68 44,53
25-34 years old 59,21 16,44 24,35
35-44 years old 55,40 19,31 25,29
45-59 years old 56,52 17,77 25,71
60-64 years old 59,25 13,58 27,16
65+ years old 48,38 14,59 37,03
Place of residence
Cities > 500k 57,56 16,14 26,30
Towns 200-500k 53,62 16,09 30,29
Towns 100-200k 55,21 18,84 25,95
Towns 20-100k 53,58 16,28 30,14
Towns < 20k 54,77 14,39 30,84
Rural areas 52,26 15,54 32,19
Voivodship
Dolnośląskie 55,33 16,91 27,77
Kujawsko-pomorskie 47,61 19,75 32,64
Lubelskie 53,39 16,74 29,88
Lubuskie 49,40 15,36 35,24
Łódzkie 55,33 15,33 29,34
Małopolskie 54,32 18,66 27,01
Mazowieckie 54,09 15,32 30,59
Opolskie 57,85 12,79 29,36
Podkarpackie 52,71 14,42 32,87
Podlaskie 55,70 13,42 30,89
Pomorskie 56,40 14,96 28,63
Śląskie 49,94 18,91 31,15
Świętokrzyskie 54,22 15,35 30,43
Warmińsko-mazurskie 59,33 12,37 28,30
Wielkopolskie 55,20 14,06 30,74
Zachodniopomorskie 55,36 12,14 32,50
Education
Primary and below 46,55 15,21 38,24
Vocational 47,34 17,33 35,33
Secondary 57,09 15,68 27,23
Tertiary/post-secondary 65,43 14,78 19,78
Income per capita
First quartile 45,74 15,52 38,73
Middle 50% 51,36 16,96 31,68
Fourth quartile 62,84 14,16 23,00
Social-professional status
Public sector employees 62,95 16,39 20,66
Private sector employees 56,85 18,85 24,30
Self-employed 64,79 17,60 17,60
Farmers 60,12 14,49 25,39
Disability pensioners 48,89 16,53 34,58
Retirees 52,76 14,70 32,54
Students 42,20 7,80 50,00
Unemployed 43,49 17,81 38,70
Other professionally inactive 46,10 16,41 37,49
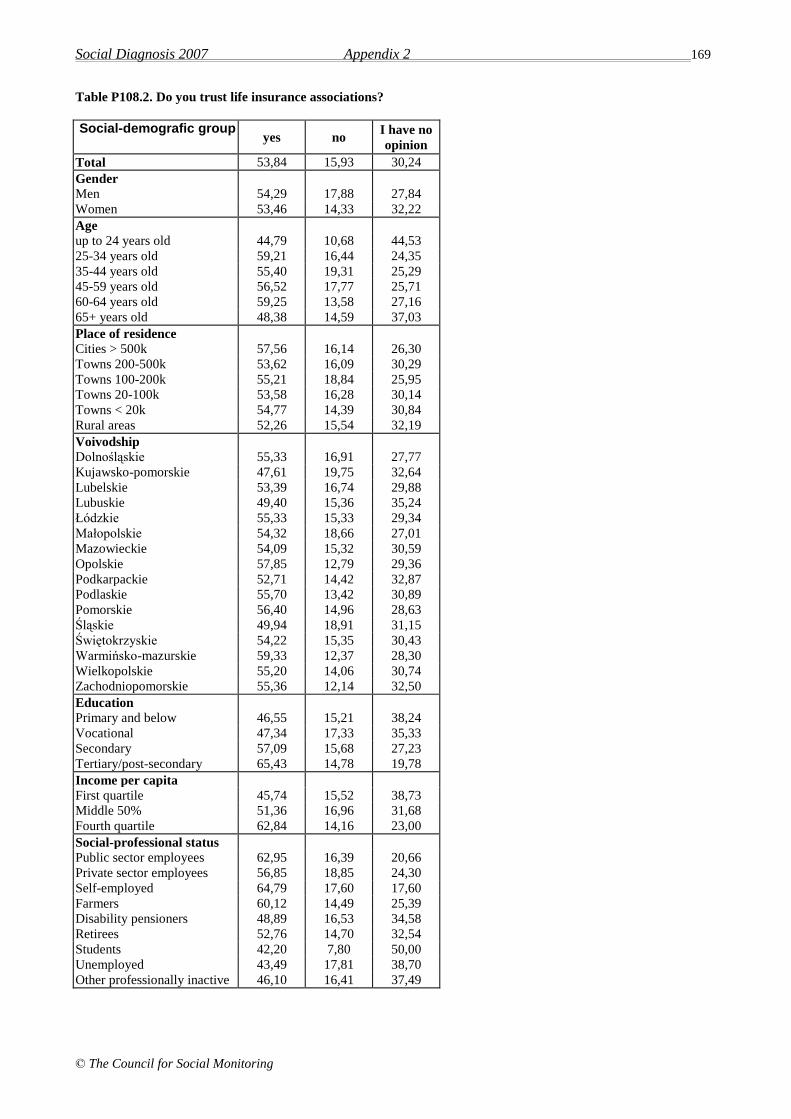
Social Diagnosis 2007 Appendix 2 169
© The Council for Social Monitoring
Table P108.2. Do you trust life insurance associations?
Social-demografic group yes no
I have no
opinion
Total 53,84 15,93 30,24
Gender
Men 54,29 17,88 27,84
Women 53,46 14,33 32,22
Age
up to 24 years old 44,79 10,68 44,53
25-34 years old 59,21 16,44 24,35
35-44 years old 55,40 19,31 25,29
45-59 years old 56,52 17,77 25,71
60-64 years old 59,25 13,58 27,16
65+ years old 48,38 14,59 37,03
Place of residence
Cities > 500k 57,56 16,14 26,30
Towns 200-500k 53,62 16,09 30,29
Towns 100-200k 55,21 18,84 25,95
Towns 20-100k 53,58 16,28 30,14
Towns < 20k 54,77 14,39 30,84
Rural areas 52,26 15,54 32,19
Voivodship
Dolnośląskie 55,33 16,91 27,77
Kujawsko-pomorskie 47,61 19,75 32,64
Lubelskie 53,39 16,74 29,88
Lubuskie 49,40 15,36 35,24
Łódzkie 55,33 15,33 29,34
Małopolskie 54,32 18,66 27,01
Mazowieckie 54,09 15,32 30,59
Opolskie 57,85 12,79 29,36
Podkarpackie 52,71 14,42 32,87
Podlaskie 55,70 13,42 30,89
Pomorskie 56,40 14,96 28,63
Śląskie 49,94 18,91 31,15
Świętokrzyskie 54,22 15,35 30,43
Warmińsko-mazurskie 59,33 12,37 28,30
Wielkopolskie 55,20 14,06 30,74
Zachodniopomorskie 55,36 12,14 32,50
Education
Primary and below 46,55 15,21 38,24
Vocational 47,34 17,33 35,33
Secondary 57,09 15,68 27,23
Tertiary/post-secondary 65,43 14,78 19,78
Income per capita
First quartile 45,74 15,52 38,73
Middle 50% 51,36 16,96 31,68
Fourth quartile 62,84 14,16 23,00
Social-professional status
Public sector employees 62,95 16,39 20,66
Private sector employees 56,85 18,85 24,30
Self-employed 64,79 17,60 17,60
Farmers 60,12 14,49 25,39
Disability pensioners 48,89 16,53 34,58
Retirees 52,76 14,70 32,54
Students 42,20 7,80 50,00
Unemployed 43,49 17,81 38,70
Other professionally inactive 46,10 16,41 37,49

Social Diagnosis 2007 Appendix 2 170
© The Council for Social Monitoring
Table P108.3. Do you trust property insurance associations?
Social-demografic group yes no
I have no
opinion
Total 25,65 27,13 47,22
Gender
Men 26,63 29,40 43,97
Women 24,82 25,25 49,93
Age
up to 24 years old 21,26 19,59 59,15
25-34 years old 30,90 27,60 41,50
35-44 years old 26,95 31,73 41,32
45-59 years old 25,65 30,59 43,76
60-64 years old 25,13 27,67 47,20
65+ years old 22,47 23,22 54,32
Place of residence
Cities > 500k 29,58 29,07 41,34
Towns 200-500k 25,63 28,06 46,31
Towns 100-200k 31,33 27,11 41,57
Towns 20-100k 26,31 28,31 45,38
Towns < 20k 26,44 27,02 46,54
Rural areas 22,55 25,64 51,81
Voivodship
Dolnośląskie 27,78 26,54 45,68
Kujawsko-pomorskie 25,84 27,11 47,05
Lubelskie 18,45 27,74 53,81
Lubuskie 26,43 27,03 46,55
Łódzkie 24,22 27,46 48,32
Małopolskie 20,28 32,78 46,95
Mazowieckie 26,45 26,81 46,74
Opolskie 32,85 25,29 41,86
Podkarpackie 24,84 24,53 50,62
Podlaskie 24,37 24,37 51,27
Pomorskie 26,76 28,92 44,32
Śląskie 26,02 28,87 45,11
Świętokrzyskie 23,53 24,30 52,17
Warmińsko-mazurskie 27,88 22,43 49,69
Wielkopolskie 30,80 25,35 43,85
Zachodniopomorskie 24,91 25,99 49,10
Education
Primary and below 19,86 22,15 57,99
Vocational 22,90 26,18 50,91
Secondary 26,60 28,19 45,21
Tertiary/post-secondary 33,74 31,38 34,88
Income per capita
First quartile 19,98 24,22 55,79
Middle 50% 23,87 27,29 48,84
Fourth quartile 31,39 28,31 40,31
Social-professional status
Public sector employees 31,02 32,17 36,82
Private sector employees 30,45 30,72 38,83
Self-employed 34,79 32,42 32,79
Farmers 19,66 29,02 51,33
Disability pensioners 20,40 26,16 53,43
Retirees 24,57 24,38 51,05
Students 17,97 15,99 66,04
Unemployed 19,18 25,57 55,25
Other professionally inactive 21,94 24,04 54,03
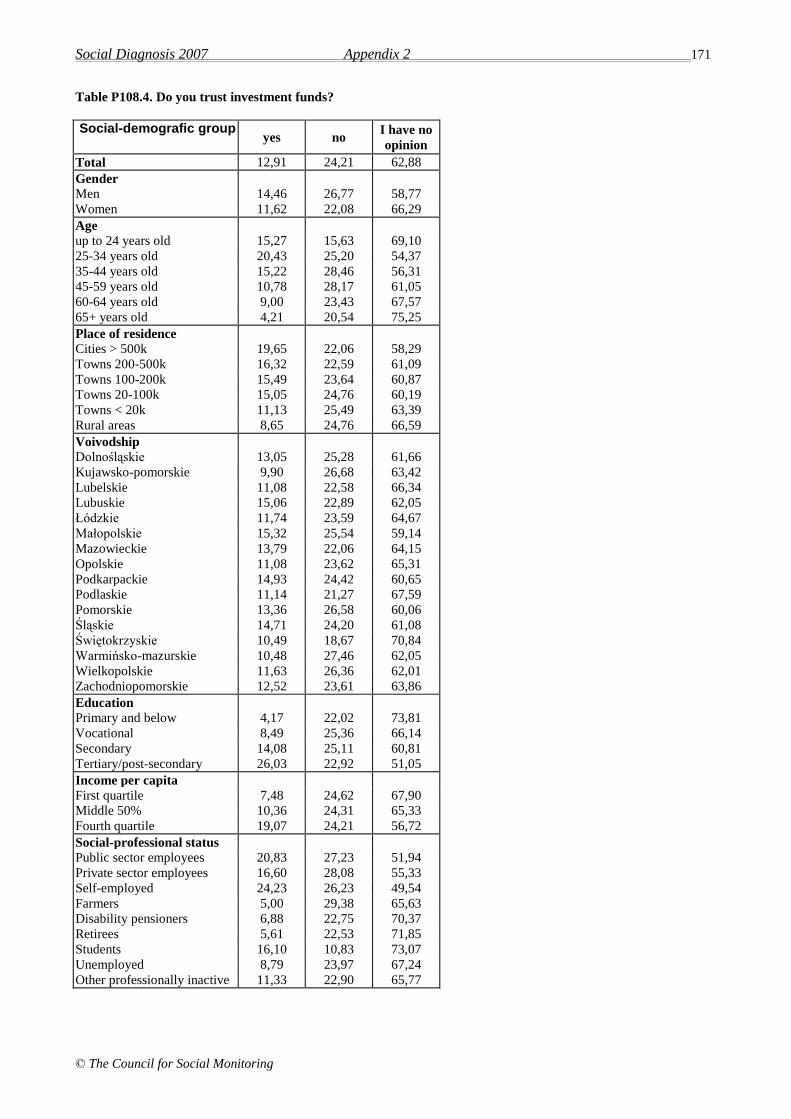
Social Diagnosis 2007 Appendix 2 171
© The Council for Social Monitoring
Table P108.4. Do you trust investment funds?
Social-demografic group yes no
I have no
opinion
Total 12,91 24,21 62,88
Gender
Men 14,46 26,77 58,77
Women 11,62 22,08 66,29
Age
up to 24 years old 15,27 15,63 69,10
25-34 years old 20,43 25,20 54,37
35-44 years old 15,22 28,46 56,31
45-59 years old 10,78 28,17 61,05
60-64 years old 9,00 23,43 67,57
65+ years old 4,21 20,54 75,25
Place of residence
Cities > 500k 19,65 22,06 58,29
Towns 200-500k 16,32 22,59 61,09
Towns 100-200k 15,49 23,64 60,87
Towns 20-100k 15,05 24,76 60,19
Towns < 20k 11,13 25,49 63,39
Rural areas 8,65 24,76 66,59
Voivodship
Dolnośląskie 13,05 25,28 61,66
Kujawsko-pomorskie 9,90 26,68 63,42
Lubelskie 11,08 22,58 66,34
Lubuskie 15,06 22,89 62,05
Łódzkie 11,74 23,59 64,67
Małopolskie 15,32 25,54 59,14
Mazowieckie 13,79 22,06 64,15
Opolskie 11,08 23,62 65,31
Podkarpackie 14,93 24,42 60,65
Podlaskie 11,14 21,27 67,59
Pomorskie 13,36 26,58 60,06
Śląskie 14,71 24,20 61,08
Świętokrzyskie 10,49 18,67 70,84
Warmińsko-mazurskie 10,48 27,46 62,05
Wielkopolskie 11,63 26,36 62,01
Zachodniopomorskie 12,52 23,61 63,86
Education
Primary and below 4,17 22,02 73,81
Vocational 8,49 25,36 66,14
Secondary 14,08 25,11 60,81
Tertiary/post-secondary 26,03 22,92 51,05
Income per capita
First quartile 7,48 24,62 67,90
Middle 50% 10,36 24,31 65,33
Fourth quartile 19,07 24,21 56,72
Social-professional status
Public sector employees 20,83 27,23 51,94
Private sector employees 16,60 28,08 55,33
Self-employed 24,23 26,23 49,54
Farmers 5,00 29,38 65,63
Disability pensioners 6,88 22,75 70,37
Retirees 5,61 22,53 71,85
Students 16,10 10,83 73,07
Unemployed 8,79 23,97 67,24
Other professionally inactive 11,33 22,90 65,77

Social Diagnosis 2007 Appendix 2 172
© The Council for Social Monitoring
Table P108.5. Do you trust pension funds?
Social-demografic group yes no
I have no
opinion
Total 15,46 29,02 55,52
Gender
Men 16,07 31,18 52,75
Women 14,93 27,23 57,84
Age
up to 24 years old 14,32 18,65 67,03
25-34 years old 21,21 31,06 47,74
35-44 years old 17,88 34,54 47,59
45-59 years old 15,20 33,69 51,11
60-64 years old 10,20 28,74 61,05
65+ years old 9,27 23,20 67,54
Place of residence
Cities > 500k 18,77 31,04 50,18
Towns 200-500k 16,11 31,45 52,44
Towns 100-200k 17,77 32,53 49,70
Towns 20-100k 16,52 30,00 53,48
Towns < 20k 14,49 29,50 56,02
Rural areas 13,48 26,16 60,36
Voivodship
Dolnośląskie 15,91 28,85 55,24
Kujawsko-pomorskie 15,36 29,28 55,36
Lubelskie 13,95 26,38 59,67
Lubuskie 16,22 30,63 53,15
Łódzkie 14,30 28,85 56,85
Małopolskie 14,33 29,64 56,04
Mazowieckie 17,50 26,50 56,00
Opolskie 19,01 29,82 51,17
Podkarpackie 14,60 27,48 57,92
Podlaskie 14,39 27,78 57,83
Pomorskie 16,24 33,62 50,14
Śląskie 15,12 31,77 53,11
Świętokrzyskie 14,32 22,76 62,92
Warmińsko-mazurskie 13,66 29,62 56,72
Wielkopolskie 16,89 29,36 53,75
Zachodniopomorskie 13,29 29,98 56,73
Education
Primary and below 11,26 23,48 65,26
Vocational 13,93 26,88 59,19
Secondary 15,70 30,42 53,88
Tertiary/post-secondary 21,26 35,17 43,57
Income per capita
First quartile 13,01 25,19 61,80
Middle 50% 13,62 28,78 57,60
Fourth quartile 19,02 31,11 49,87
Social-professional status
Public sector employees 21,48 37,49 41,04
Private sector employees 20,21 33,23 46,56
Self-employed 21,09 35,64 43,27
Farmers 11,21 28,35 60,44
Disability pensioners 10,01 25,28 64,71
Retirees 10,44 25,79 63,77
Students 12,12 14,00 73,87
Unemployed 13,24 26,60 60,16
Other professionally inactive 13,79 28,15 58,06

Social Diagnosis 2007 Appendix 2 173
© The Council for Social Monitoring
Table P108.6. Do you trust the stock exchange?
Social-demografic group yes no
I have no
opinion
Total 7,84 28,03 64,13
Gender
Men 10,00 29,50 60,50
Women 6,04 26,81 67,15
Age
up to 24 years old 11,15 21,83 67,01
25-34 years old 11,98 30,83 57,18
35-44 years old 8,33 32,25 59,42
45-59 years old 6,31 30,80 62,89
60-64 years old 3,91 27,21 68,88
65+ years old 2,95 21,97 75,08
Place of residence
Cities > 500k 10,75 28,82 60,42
Towns 200-500k 8,15 27,39 64,46
Towns 100-200k 10,87 30,38 58,75
Towns 20-100k 9,91 29,02 61,07
Towns < 20k 7,12 27,30 65,59
Rural areas 5,29 27,17 67,53
Voivodship
Dolnośląskie 7,28 29,44 63,28
Kujawsko-pomorskie 6,24 26,88 66,88
Lubelskie 6,50 28,35 65,15
Lubuskie 10,18 26,35 63,47
Łódzkie 6,60 27,85 65,55
Małopolskie 7,37 31,04 61,59
Mazowieckie 8,87 27,65 63,49
Opolskie 9,59 24,42 65,99
Podkarpackie 7,92 27,02 65,06
Podlaskie 7,34 23,29 69,37
Pomorskie 10,07 28,20 61,73
Śląskie 9,41 30,28 60,31
Świętokrzyskie 6,65 21,48 71,87
Warmińsko-mazurskie 6,09 28,57 65,34
Wielkopolskie 6,84 29,71 63,45
Zachodniopomorskie 6,80 24,51 68,69
Education
Primary and below 2,02 23,77 74,21
Vocational 5,30 28,52 66,18
Secondary 9,10 28,99 61,91
Tertiary/post-secondary 15,09 29,55 55,36
Income per capita
First quartile 4,74 26,39 68,87
Middle 50% 6,09 28,32 65,59
Fourth quartile 11,87 28,41 59,73
Social-professional status
Public sector employees 10,59 33,35 56,06
Private sector employees 10,10 32,54 57,35
Self-employed 14,75 30,42 54,83
Farmers 4,05 29,75 66,20
Disability pensioners 5,26 24,87 69,87
Retirees 3,35 24,59 72,06
Students 11,39 17,70 70,90
Unemployed 6,16 25,57 68,26
Other professionally inactive 6,41 27,74 65,85

Social Diagnosis 2007 Appendix 2 174
© The Council for Social Monitoring
Table P108.7. Do you trust Social Insurance Institution (ZUS)
Social-demografic group yes no
I have no
opinion
Total 24,88 39,45 35,67
Gender
Men 23,32 43,01 33,67
Women 26,18 36,50 37,32
Age
up to 24 years old 12,88 31,04 56,08
25-34 years old 17,59 46,69 35,72
35-44 years old 18,64 50,63 30,73
45-59 years old 27,47 42,45 30,07
60-64 years old 39,86 29,90 30,24
65+ years old 42,41 25,52 32,07
Place of residence
Cities > 500k 20,95 50,00 29,05
Towns 200-500k 18,80 48,47 32,73
Towns 100-200k 22,97 43,73 33,30
Towns 20-100k 25,81 40,42 33,77
Towns < 20k 25,37 40,41 34,22
Rural areas 27,80 31,53 40,66
Voivodship
Dolnośląskie 22,56 42,46 34,97
Kujawsko-pomorskie 26,91 36,78 36,31
Lubelskie 27,07 36,74 36,19
Lubuskie 17,12 41,14 41,74
Łódzkie 26,26 38,73 35,01
Małopolskie 24,07 45,48 30,45
Mazowieckie 27,00 38,42 34,58
Opolskie 28,20 41,57 30,23
Podkarpackie 26,36 33,18 40,47
Podlaskie 20,20 37,88 41,92
Pomorskie 21,26 46,12 32,61
Śląskie 23,96 41,36 34,67
Świętokrzyskie 26,79 32,91 40,31
Warmińsko-mazurskie 32,22 28,45 39,33
Wielkopolskie 24,13 38,50 37,37
Zachodniopomorskie 22,18 41,86 35,96
Education
Primary and below 35,36 26,05 38,59
Vocational 24,89 34,91 40,21
Secondary 22,32 42,14 35,54
Tertiary/post-secondary 19,50 54,52 25,98
Income per capita
First quartile 22,36 32,24 45,40
Middle 50% 25,44 38,48 36,08
Fourth quartile 26,53 44,26 29,21
Social-professional status
Public sector employees 21,37 51,91 26,72
Private sector employees 19,43 49,12 31,45
Self-employed 16,18 58,91 24,91
Farmers 21,37 30,58 48,05
Disability pensioners 38,21 29,64 32,16
Retirees 40,97 27,86 31,17
Students 9,33 27,33 63,34
Unemployed 19,98 38,70 41,32
Other professionally inactive 19,72 36,06 44,22
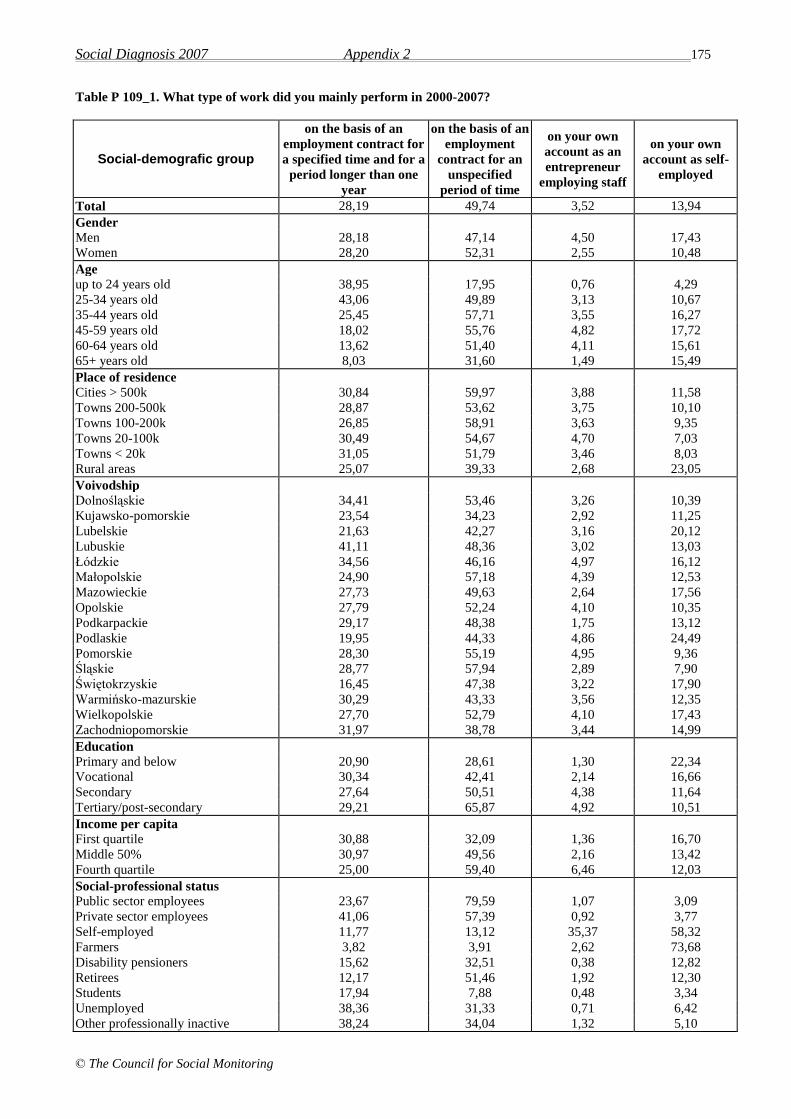
Social Diagnosis 2007 Appendix 2 175
© The Council for Social Monitoring
Table P 109_1. What type of work did you mainly perform in 2000-2007?
Social-demografic group
on the basis of an
employment contract for
a specified time and for a
period longer than one
year
on the basis of an
employment
contract for an
unspecified
period of time
on your own
account as an
entrepreneur
employing staff
on your own
account as self-
employed
Total 28,19 49,74 3,52 13,94
Gender
Men 28,18 47,14 4,50 17,43
Women 28,20 52,31 2,55 10,48
Age
up to 24 years old 38,95 17,95 0,76 4,29
25-34 years old 43,06 49,89 3,13 10,67
35-44 years old 25,45 57,71 3,55 16,27
45-59 years old 18,02 55,76 4,82 17,72
60-64 years old 13,62 51,40 4,11 15,61
65+ years old 8,03 31,60 1,49 15,49
Place of residence
Cities > 500k 30,84 59,97 3,88 11,58
Towns 200-500k 28,87 53,62 3,75 10,10
Towns 100-200k 26,85 58,91 3,63 9,35
Towns 20-100k 30,49 54,67 4,70 7,03
Towns < 20k 31,05 51,79 3,46 8,03
Rural areas 25,07 39,33 2,68 23,05
Voivodship
Dolnośląskie 34,41 53,46 3,26 10,39
Kujawsko-pomorskie 23,54 34,23 2,92 11,25
Lubelskie 21,63 42,27 3,16 20,12
Lubuskie 41,11 48,36 3,02 13,03
Łódzkie 34,56 46,16 4,97 16,12
Małopolskie 24,90 57,18 4,39 12,53
Mazowieckie 27,73 49,63 2,64 17,56
Opolskie 27,79 52,24 4,10 10,35
Podkarpackie 29,17 48,38 1,75 13,12
Podlaskie 19,95 44,33 4,86 24,49
Pomorskie 28,30 55,19 4,95 9,36
Śląskie 28,77 57,94 2,89 7,90
Świętokrzyskie 16,45 47,38 3,22 17,90
Warmińsko-mazurskie 30,29 43,33 3,56 12,35
Wielkopolskie 27,70 52,79 4,10 17,43
Zachodniopomorskie 31,97 38,78 3,44 14,99
Education
Primary and below 20,90 28,61 1,30 22,34
Vocational 30,34 42,41 2,14 16,66
Secondary 27,64 50,51 4,38 11,64
Tertiary/post-secondary 29,21 65,87 4,92 10,51
Income per capita
First quartile 30,88 32,09 1,36 16,70
Middle 50% 30,97 49,56 2,16 13,42
Fourth quartile 25,00 59,40 6,46 12,03
Social-professional status
Public sector employees 23,67 79,59 1,07 3,09
Private sector employees 41,06 57,39 0,92 3,77
Self-employed 11,77 13,12 35,37 58,32
Farmers 3,82 3,91 2,62 73,68
Disability pensioners 15,62 32,51 0,38 12,82
Retirees 12,17 51,46 1,92 12,30
Students 17,94 7,88 0,48 3,34
Unemployed 38,36 31,33 0,71 6,42
Other professionally inactive 38,24 34,04 1,32 5,10
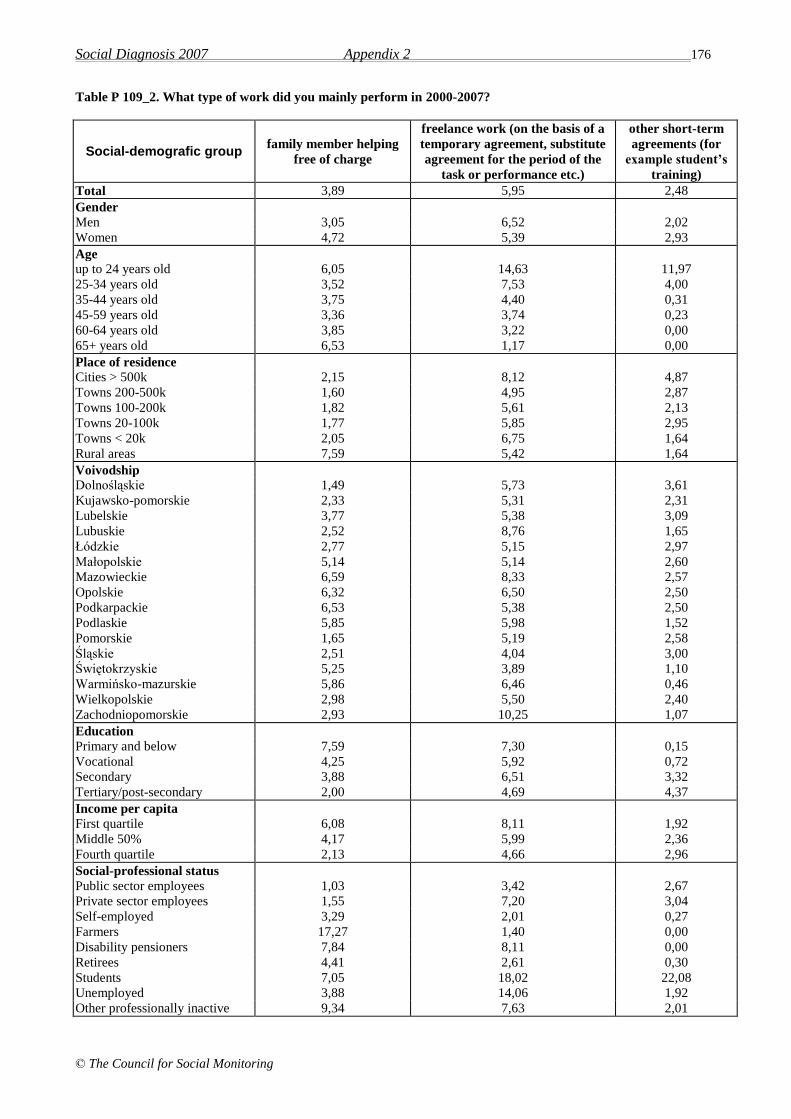
Social Diagnosis 2007 Appendix 2 176
© The Council for Social Monitoring
Table P 109_2. What type of work did you mainly perform in 2000-2007?
Social-demografic group family member helping
free of charge
freelance work (on the basis of a
temporary agreement, substitute
agreement for the period of the
task or performance etc.)
other short-term
agreements (for
example student’s
training)
Total 3,89 5,95 2,48
Gender
Men 3,05 6,52 2,02
Women 4,72 5,39 2,93
Age
up to 24 years old 6,05 14,63 11,97
25-34 years old 3,52 7,53 4,00
35-44 years old 3,75 4,40 0,31
45-59 years old 3,36 3,74 0,23
60-64 years old 3,85 3,22 0,00
65+ years old 6,53 1,17 0,00
Place of residence
Cities > 500k 2,15 8,12 4,87
Towns 200-500k 1,60 4,95 2,87
Towns 100-200k 1,82 5,61 2,13
Towns 20-100k 1,77 5,85 2,95
Towns < 20k 2,05 6,75 1,64
Rural areas 7,59 5,42 1,64
Voivodship
Dolnośląskie 1,49 5,73 3,61
Kujawsko-pomorskie 2,33 5,31 2,31
Lubelskie 3,77 5,38 3,09
Lubuskie 2,52 8,76 1,65
Łódzkie 2,77 5,15 2,97
Małopolskie 5,14 5,14 2,60
Mazowieckie 6,59 8,33 2,57
Opolskie 6,32 6,50 2,50
Podkarpackie 6,53 5,38 2,50
Podlaskie 5,85 5,98 1,52
Pomorskie 1,65 5,19 2,58
Śląskie 2,51 4,04 3,00
Świętokrzyskie 5,25 3,89 1,10
Warmińsko-mazurskie 5,86 6,46 0,46
Wielkopolskie 2,98 5,50 2,40
Zachodniopomorskie 2,93 10,25 1,07
Education
Primary and below 7,59 7,30 0,15
Vocational 4,25 5,92 0,72
Secondary 3,88 6,51 3,32
Tertiary/post-secondary 2,00 4,69 4,37
Income per capita
First quartile 6,08 8,11 1,92
Middle 50% 4,17 5,99 2,36
Fourth quartile 2,13 4,66 2,96
Social-professional status
Public sector employees 1,03 3,42 2,67
Private sector employees 1,55 7,20 3,04
Self-employed 3,29 2,01 0,27
Farmers 17,27 1,40 0,00
Disability pensioners 7,84 8,11 0,00
Retirees 4,41 2,61 0,30
Students 7,05 18,02 22,08
Unemployed 3,88 14,06 1,92
Other professionally inactive 9,34 7,63 2,01

Social Diagnosis 2007 Appendix 2 177
© The Council for Social Monitoring
Table P 109_3. What type of work did you mainly perform in 2000-2007?
Social-demografic group trial period work
employment under civil
law agreements
(agreement for a
specified task,
commission agreement)
employment
without a formal
agreement
and/or verbal
agreement)
other
Total 5,93 9,29 6,11 3,18
Gender
Men 5,79 8,86 8,30 3,69
Women 6,07 9,73 3,94 2,66
Age
up to 24 years old 13,66 19,32 11,77 6,88
25-34 years old 11,34 11,76 7,64 3,09
35-44 years old 3,57 6,53 5,38 2,69
45-59 years old 1,83 6,32 4,33 2,50
60-64 years old 0,25 6,04 2,88 2,49
65+ years old 0,39 9,55 1,88 3,01
Place of residence
Cities > 500k 7,03 18,29 7,65 2,25
Towns 200-500k 5,28 13,30 5,48 3,56
Towns 100-200k 6,31 11,81 5,98 2,98
Towns 20-100k 6,94 9,54 5,39 3,96
Towns < 20k 6,87 8,25 5,40 3,26
Rural areas 4,83 4,41 6,49 2,95
Voivodship
Dolnośląskie 6,38 8,90 4,98 4,28
Kujawsko-pomorskie 4,84 6,77 4,39 3,10
Lubelskie 4,30 7,94 7,43 3,52
Lubuskie 7,36 11,40 9,66 3,21
Łódzkie 6,55 10,50 6,44 3,01
Małopolskie 6,00 8,06 4,92 4,10
Mazowieckie 6,11 13,51 7,37 2,70
Opolskie 4,63 7,96 6,96 3,55
Podkarpackie 7,87 5,29 6,56 5,90
Podlaskie 3,37 6,80 8,33 3,78
Pomorskie 6,81 11,85 6,98 3,07
Śląskie 7,36 10,97 5,37 3,24
Świętokrzyskie 2,67 4,19 3,17 0,55
Warmińsko-mazurskie 3,76 6,02 10,30 2,49
Wielkopolskie 5,95 7,39 3,94 1,63
Zachodniopomorskie 5,20 9,95 6,30 2,99
Education
Primary and below 2,39 6,53 9,15 3,43
Vocational 6,01 5,66 8,00 3,50
Secondary 6,52 9,22 5,94 2,99
Tertiary/post-secondary 6,44 14,88 2,82 2,93
Income per capita
First quartile 6,53 6,83 11,09 4,93
Middle 50% 6,33 8,42 6,03 2,68
Fourth quartile 5,18 12,75 4,26 3,03
Social-professional status
Public sector employees 3,63 9,23 1,80 2,01
Private sector employees 9,98 11,20 8,31 3,11
Self-employed 1,78 5,55 2,96 3,08
Farmers 1,03 1,50 3,44 2,52
Disability pensioners 1,55 7,97 6,15 4,36
Retirees 0,28 7,33 1,78 2,55
Students 9,94 23,94 19,58 3,78
Unemployed 7,72 8,12 12,44 6,43
Other professionally inactive 7,83 12,08 9,76 5,14
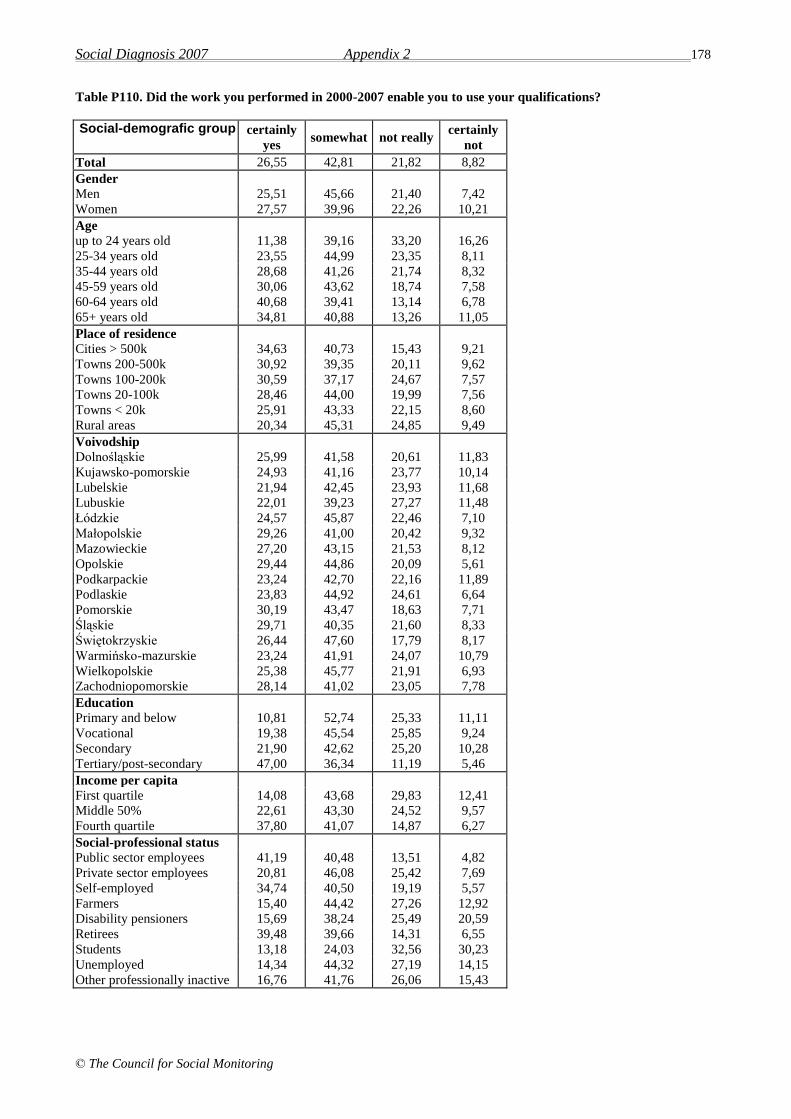
Social Diagnosis 2007 Appendix 2 178
© The Council for Social Monitoring
Table P110. Did the work you performed in 2000-2007 enable you to use your qualifications?
Social-demografic group certainly
yes somewhat not really
certainly
not
Total 26,55 42,81 21,82 8,82
Gender
Men 25,51 45,66 21,40 7,42
Women 27,57 39,96 22,26 10,21
Age
up to 24 years old 11,38 39,16 33,20 16,26
25-34 years old 23,55 44,99 23,35 8,11
35-44 years old 28,68 41,26 21,74 8,32
45-59 years old 30,06 43,62 18,74 7,58
60-64 years old 40,68 39,41 13,14 6,78
65+ years old 34,81 40,88 13,26 11,05
Place of residence
Cities > 500k 34,63 40,73 15,43 9,21
Towns 200-500k 30,92 39,35 20,11 9,62
Towns 100-200k 30,59 37,17 24,67 7,57
Towns 20-100k 28,46 44,00 19,99 7,56
Towns < 20k 25,91 43,33 22,15 8,60
Rural areas 20,34 45,31 24,85 9,49
Voivodship
Dolnośląskie 25,99 41,58 20,61 11,83
Kujawsko-pomorskie 24,93 41,16 23,77 10,14
Lubelskie 21,94 42,45 23,93 11,68
Lubuskie 22,01 39,23 27,27 11,48
Łódzkie 24,57 45,87 22,46 7,10
Małopolskie 29,26 41,00 20,42 9,32
Mazowieckie 27,20 43,15 21,53 8,12
Opolskie 29,44 44,86 20,09 5,61
Podkarpackie 23,24 42,70 22,16 11,89
Podlaskie 23,83 44,92 24,61 6,64
Pomorskie 30,19 43,47 18,63 7,71
Śląskie 29,71 40,35 21,60 8,33
Świętokrzyskie 26,44 47,60 17,79 8,17
Warmińsko-mazurskie 23,24 41,91 24,07 10,79
Wielkopolskie 25,38 45,77 21,91 6,93
Zachodniopomorskie 28,14 41,02 23,05 7,78
Education
Primary and below 10,81 52,74 25,33 11,11
Vocational 19,38 45,54 25,85 9,24
Secondary 21,90 42,62 25,20 10,28
Tertiary/post-secondary 47,00 36,34 11,19 5,46
Income per capita
First quartile 14,08 43,68 29,83 12,41
Middle 50% 22,61 43,30 24,52 9,57
Fourth quartile 37,80 41,07 14,87 6,27
Social-professional status
Public sector employees 41,19 40,48 13,51 4,82
Private sector employees 20,81 46,08 25,42 7,69
Self-employed 34,74 40,50 19,19 5,57
Farmers 15,40 44,42 27,26 12,92
Disability pensioners 15,69 38,24 25,49 20,59
Retirees 39,48 39,66 14,31 6,55
Students 13,18 24,03 32,56 30,23
Unemployed 14,34 44,32 27,19 14,15
Other professionally inactive 16,76 41,76 26,06 15,43

Social Diagnosis 2007 Appendix 2 179
© The Council for Social Monitoring
Table P111. How many times did you change your position in the work place between 2000-2007?
Social-demografic group
0 1 2 3 4 5 6 7 9
Total 68,15 16,79 8,52 4,03 1,65 0,41 0,15 0,16 0,15
Gender
Men 66,14 16,33 9,47 5,08 1,81 0,53 0,26 0,20 0,18
Women 70,26 17,21 7,61 2,96 1,43 0,26 0,06 0,12 0,09
Age
up to 24 years old 68,02 14,04 9,99 5,79 1,30 0,43 0,00 0,43 0,00
25-34 years old 56,85 22,93 11,00 5,58 2,19 0,78 0,42 0,16 0,10
35-44 years old 67,14 16,49 8,89 4,77 1,80 0,39 0,06 0,19 0,26
45-59 years old 75,26 14,01 6,68 2,31 1,35 0,13 0,09 0,09 0,09
60-64 years old 86,43 10,41 1,81 0,90 0,45 0,00 0,00 0,00 0,00
65+ years old 88,41 6,10 5,49 0,00 0,00 0,00 0,00 0,00 0,00
Place of residence
Cities > 500k 60,37 18,88 10,26 7,34 1,75 0,47 0,35 0,35 0,23
Towns 200-500k 66,20 18,00 9,18 4,53 1,63 0,35 0,12 0,00 0,00
Towns 100-200k 63,93 18,21 8,93 5,65 2,73 0,36 0,00 0,00 0,18
Towns 20-100k 66,32 19,00 8,72 3,43 1,19 0,52 0,30 0,30 0,22
Towns < 20k 69,00 15,90 9,24 3,16 2,03 0,45 0,23 0,00 0,00
Rural areas 73,48 14,29 7,21 2,90 1,45 0,30 0,09 0,17 0,13
Voivodship
Dolnośląskie 61,48 20,08 9,84 6,15 2,25 0,00 0,20 0,00 0,00
Kujawsko-pomorskie 65,52 16,93 10,66 4,70 1,57 0,31 0,31 0,00 0,00
Lubelskie 71,48 15,41 8,20 4,26 0,00 0,00 0,33 0,33 0,00
Lubuskie 67,16 17,16 11,76 2,45 0,98 0,49 0,00 0,00 0,00
Łódzkie 68,51 17,62 7,33 3,76 1,58 0,20 0,40 0,20 0,40
Małopolskie 69,11 16,58 7,68 4,71 0,87 0,00 0,35 0,35 0,35
Mazowieckie 65,13 16,63 10,94 3,86 2,36 0,97 0,00 0,11 0,00
Opolskie 63,64 17,17 8,59 6,57 1,52 2,02 0,00 0,51 0,00
Podkarpackie 66,76 19,65 7,23 3,18 2,02 0,58 0,29 0,29 0,00
Podlaskie 72,40 12,80 8,80 2,80 2,00 0,80 0,00 0,40 0,00
Pomorskie 67,45 19,06 7,71 3,64 1,71 0,21 0,21 0,00 0,00
Śląskie 68,91 16,03 7,83 4,04 2,08 0,37 0,12 0,12 0,49
Świętokrzyskie 70,53 15,26 7,89 4,21 1,58 0,00 0,00 0,53 0,00
Warmińsko-mazurskie 73,06 13,70 9,13 1,83 2,28 0,00 0,00 0,00 0,00
Wielkopolskie 72,65 15,67 6,27 3,56 1,57 0,00 0,00 0,14 0,14
Zachodniopomorskie 70,21 16,11 7,90 3,95 0,30 1,22 0,00 0,00 0,30
Education
Primary and below 80,13 8,31 6,51 2,93 0,81 0,33 0,49 0,16 0,33
Vocational 70,24 14,81 8,61 3,30 2,02 0,59 0,15 0,10 0,20
Secondary 68,28 16,82 9,06 3,92 1,17 0,38 0,13 0,21 0,04
Tertiary/post-secondary 61,77 21,82 8,48 5,30 2,06 0,22 0,11 0,11 0,11
Income per capita
First quartile 71,77 13,09 8,30 3,85 1,45 0,68 0,34 0,26 0,26
Middle 50% 68,16 17,31 8,41 3,51 1,72 0,50 0,13 0,20 0,07
Fourth quartile 66,40 17,57 9,36 4,68 1,48 0,14 0,14 0,10 0,14
Social-professional
status
Public sector employees 67,21 19,39 7,58 3,98 1,52 0,13 0,00 0,13 0,06
Private sector employees 57,97 21,32 11,49 5,80 2,15 0,69 0,31 0,15 0,12
Self-employed 79,75 10,86 4,38 2,30 1,88 0,21 0,21 0,00 0,42
Farmers 90,20 6,73 2,04 0,41 0,61 0,00 0,00 0,00 0,00
Disability pensioners 78,19 10,11 8,51 1,60 1,06 0,53 0,00 0,00 0,00
Retirees 85,98 9,16 4,11 0,19 0,37 0,00 0,00 0,00 0,19
Students 80,17 6,90 7,76 2,59 0,86 0,00 0,00 1,72 0,00
Unemployed 67,40 13,68 9,66 5,43 2,21 0,60 0,20 0,60 0,20
Other professionally
inactive
66,57 16,14 11,24 4,03 0,86 0,58 0,29 0,00 0,29

Social Diagnosis 2007 Appendix 2 180
© The Council for Social Monitoring
Table P112. How many times were you promoted between 2000-2007?
Social-demografic group
0 1 2 3 4 5 6 7
Total 80,25 13,55 4,36 1,27 0,39 0,10 0,06 0,01
Gender
Men 80,08 13,06 5,11 1,34 0,30 0,03 0,09 0,00
Women 80,53 14,05 3,62 1,19 0,41 0,15 0,03 0,03
Age
up to 24 years old 86,78 9,99 2,50 0,44 0,00 0,29 0,00 0,00
25-34 years old 71,51 18,85 6,79 2,00 0,68 0,11 0,00 0,05
35-44 years old 78,06 14,80 5,24 1,38 0,46 0,07 0,00 0,00
45-59 years old 85,65 10,32 2,61 0,97 0,18 0,09 0,18 0,00
60-64 years old 89,35 8,33 1,39 0,93 0,00 0,00 0,00 0,00
65+ years old 90,18 5,52 3,68 0,00 0,61 0,00 0,00 0,00
Place of residence
Cities > 500k 65,49 21,79 8,13 3,06 1,06 0,35 0,00 0,12
Towns 200-500k 75,49 17,54 5,34 1,16 0,23 0,12 0,12 0,00
Towns 100-200k 74,53 17,17 5,47 2,08 0,38 0,00 0,38 0,00
Towns 20-100k 79,98 14,25 4,25 1,29 0,15 0,08 0,00 0,00
Towns < 20k 81,84 12,76 4,25 0,69 0,34 0,11 0,00 0,00
Rural areas 88,42 8,17 2,46 0,65 0,26 0,00 0,04 0,00
Voivodship
Dolnośląskie 73,28 16,70 7,52 1,67 0,84 0,00 0,00 0,00
Kujawsko-pomorskie 82,65 10,73 4,42 1,58 0,63 0,00 0,00 0,00
Lubelskie 81,97 12,46 3,61 1,97 0,00 0,00 0,00 0,00
Lubuskie 83,74 12,32 3,45 0,49 0,00 0,00 0,00 0,00
Łódzkie 82,40 13,80 3,20 0,40 0,00 0,00 0,00 0,20
Małopolskie 80,32 14,72 2,48 1,60 0,53 0,35 0,00 0,00
Mazowieckie 75,90 14,90 5,59 2,74 0,66 0,22 0,00 0,00
Opolskie 78,24 14,51 3,11 2,07 0,00 0,52 1,55 0,00
Podkarpackie 77,78 14,11 6,01 2,10 0,00 0,00 0,00 0,00
Podlaskie 82,59 11,34 4,05 0,81 0,81 0,40 0,00 0,00
Pomorskie 76,23 17,13 5,14 0,86 0,43 0,00 0,21 0,00
Śląskie 80,99 13,21 4,94 0,37 0,49 0,00 0,00 0,00
Świętokrzyskie 82,97 9,34 5,49 1,10 1,10 0,00 0,00 0,00
Warmińsko-mazurskie 86,12 10,53 2,39 0,96 0,00 0,00 0,00 0,00
Wielkopolskie 84,58 11,38 3,03 0,72 0,14 0,14 0,00 0,00
Zachodniopomorskie 84,55 12,42 2,73 0,30 0,00 0,00 0,00 0,00
Education
Primary and below 94,39 4,13 1,32 0,17 0,00 0,00 0,00 0,00
Vocational 89,87 7,87 1,70 0,45 0,00 0,05 0,05 0,00
Secondary 81,23 12,43 4,55 1,19 0,43 0,13 0,04 0,00
Tertiary/post-secondary 63,60 24,57 8,15 2,62 0,78 0,11 0,11 0,06
Income per capita
First quartile 91,50 6,50 1,47 0,43 0,09 0,00 0,00 0,00
Middle 50% 82,67 12,60 3,61 0,71 0,27 0,00 0,10 0,03
Fourth quartile 71,06 18,78 6,98 2,31 0,58 0,24 0,05 0,00
Social-professional status
Public sector employees 67,75 22,46 7,00 1,91 0,83 0,00 0,00 0,06
Private sector employees 76,81 16,16 4,88 1,52 0,31 0,23 0,08 0,00
Self-employed 89,03 5,70 3,80 1,27 0,21 0,00 0,00 0,00
Farmers 98,55 0,83 0,41 0,00 0,00 0,00 0,21 0,00
Disability pensioners 95,14 1,62 1,62 1,08 0,54 0,00 0,00 0,00
Retirees 88,51 8,47 2,26 0,38 0,19 0,00 0,19 0,00
Students 96,46 0,00 3,54 0,00 0,00 0,00 0,00 0,00
Unemployed 89,84 6,91 2,24 1,02 0,00 0,00 0,00 0,00
Other professionally
inactive
85,97 10,45 2,69 0,60 0,30 0,00 0,00 0,00
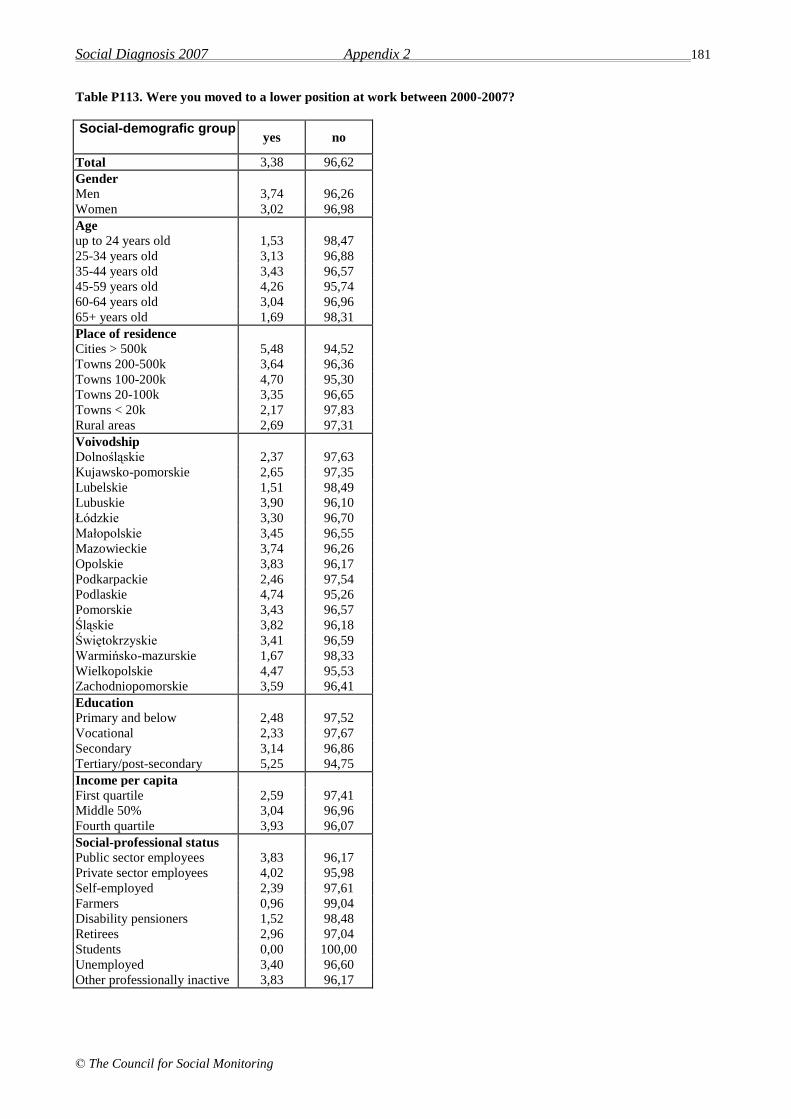
Social Diagnosis 2007 Appendix 2 181
© The Council for Social Monitoring
Table P113. Were you moved to a lower position at work between 2000-2007?
Social-demografic group yes no
Total 3,38 96,62
Gender
Men 3,74 96,26
Women 3,02 96,98
Age
up to 24 years old 1,53 98,47
25-34 years old 3,13 96,88
35-44 years old 3,43 96,57
45-59 years old 4,26 95,74
60-64 years old 3,04 96,96
65+ years old 1,69 98,31
Place of residence
Cities > 500k 5,48 94,52
Towns 200-500k 3,64 96,36
Towns 100-200k 4,70 95,30
Towns 20-100k 3,35 96,65
Towns < 20k 2,17 97,83
Rural areas 2,69 97,31
Voivodship
Dolnośląskie 2,37 97,63
Kujawsko-pomorskie 2,65 97,35
Lubelskie 1,51 98,49
Lubuskie 3,90 96,10
Łódzkie 3,30 96,70
Małopolskie 3,45 96,55
Mazowieckie 3,74 96,26
Opolskie 3,83 96,17
Podkarpackie 2,46 97,54
Podlaskie 4,74 95,26
Pomorskie 3,43 96,57
Śląskie 3,82 96,18
Świętokrzyskie 3,41 96,59
Warmińsko-mazurskie 1,67 98,33
Wielkopolskie 4,47 95,53
Zachodniopomorskie 3,59 96,41
Education
Primary and below 2,48 97,52
Vocational 2,33 97,67
Secondary 3,14 96,86
Tertiary/post-secondary 5,25 94,75
Income per capita
First quartile 2,59 97,41
Middle 50% 3,04 96,96
Fourth quartile 3,93 96,07
Social-professional status
Public sector employees 3,83 96,17
Private sector employees 4,02 95,98
Self-employed 2,39 97,61
Farmers 0,96 99,04
Disability pensioners 1,52 98,48
Retirees 2,96 97,04
Students 0,00 100,00
Unemployed 3,40 96,60
Other professionally inactive 3,83 96,17
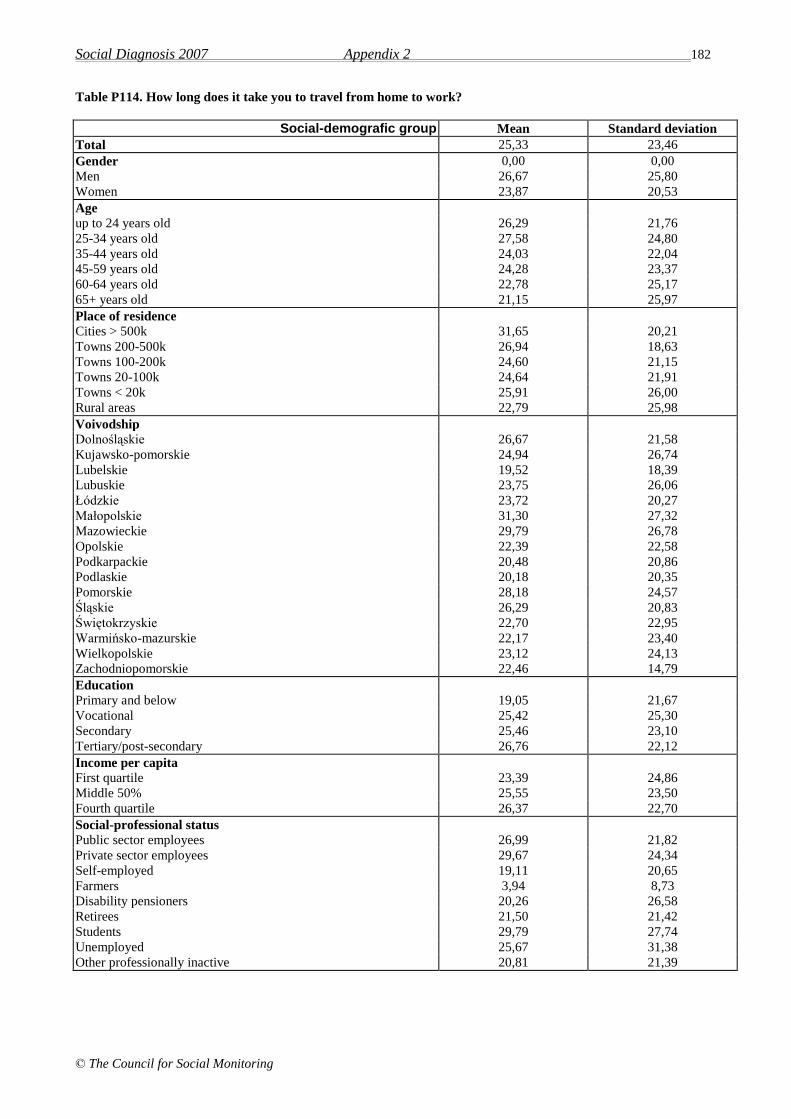
Social Diagnosis 2007 Appendix 2 182
© The Council for Social Monitoring
Table P114. How long does it take you to travel from home to work?
Social-demografic group Mean Standard deviation
Total 25,33 23,46
Gender 0,00 0,00
Men 26,67 25,80
Women 23,87 20,53
Age
up to 24 years old 26,29 21,76
25-34 years old 27,58 24,80
35-44 years old 24,03 22,04
45-59 years old 24,28 23,37
60-64 years old 22,78 25,17
65+ years old 21,15 25,97
Place of residence
Cities > 500k 31,65 20,21
Towns 200-500k 26,94 18,63
Towns 100-200k 24,60 21,15
Towns 20-100k 24,64 21,91
Towns < 20k 25,91 26,00
Rural areas 22,79 25,98
Voivodship
Dolnośląskie 26,67 21,58
Kujawsko-pomorskie 24,94 26,74
Lubelskie 19,52 18,39
Lubuskie 23,75 26,06
Łódzkie 23,72 20,27
Małopolskie 31,30 27,32
Mazowieckie 29,79 26,78
Opolskie 22,39 22,58
Podkarpackie 20,48 20,86
Podlaskie 20,18 20,35
Pomorskie 28,18 24,57
Śląskie 26,29 20,83
Świętokrzyskie 22,70 22,95
Warmińsko-mazurskie 22,17 23,40
Wielkopolskie 23,12 24,13
Zachodniopomorskie 22,46 14,79
Education
Primary and below 19,05 21,67
Vocational 25,42 25,30
Secondary 25,46 23,10
Tertiary/post-secondary 26,76 22,12
Income per capita
First quartile 23,39 24,86
Middle 50% 25,55 23,50
Fourth quartile 26,37 22,70
Social-professional status
Public sector employees 26,99 21,82
Private sector employees 29,67 24,34
Self-employed 19,11 20,65
Farmers 3,94 8,73
Disability pensioners 20,26 26,58
Retirees 21,50 21,42
Students 29,79 27,74
Unemployed 25,67 31,38
Other professionally inactive 20,81 21,39
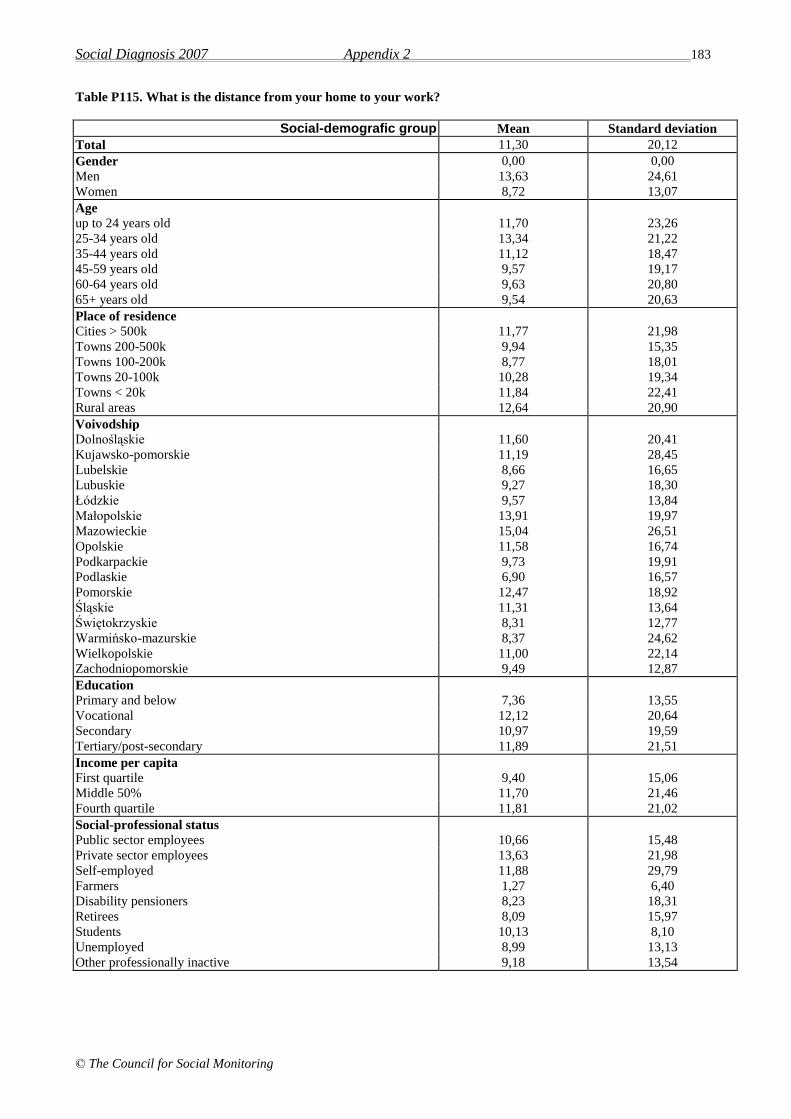
Social Diagnosis 2007 Appendix 2 183
© The Council for Social Monitoring
Table P115. What is the distance from your home to your work?
Social-demografic group Mean Standard deviation
Total 11,30 20,12
Gender 0,00 0,00
Men 13,63 24,61
Women 8,72 13,07
Age
up to 24 years old 11,70 23,26
25-34 years old 13,34 21,22
35-44 years old 11,12 18,47
45-59 years old 9,57 19,17
60-64 years old 9,63 20,80
65+ years old 9,54 20,63
Place of residence
Cities > 500k 11,77 21,98
Towns 200-500k 9,94 15,35
Towns 100-200k 8,77 18,01
Towns 20-100k 10,28 19,34
Towns < 20k 11,84 22,41
Rural areas 12,64 20,90
Voivodship
Dolnośląskie 11,60 20,41
Kujawsko-pomorskie 11,19 28,45
Lubelskie 8,66 16,65
Lubuskie 9,27 18,30
Łódzkie 9,57 13,84
Małopolskie 13,91 19,97
Mazowieckie 15,04 26,51
Opolskie 11,58 16,74
Podkarpackie 9,73 19,91
Podlaskie 6,90 16,57
Pomorskie 12,47 18,92
Śląskie 11,31 13,64
Świętokrzyskie 8,31 12,77
Warmińsko-mazurskie 8,37 24,62
Wielkopolskie 11,00 22,14
Zachodniopomorskie 9,49 12,87
Education
Primary and below 7,36 13,55
Vocational 12,12 20,64
Secondary 10,97 19,59
Tertiary/post-secondary 11,89 21,51
Income per capita
First quartile 9,40 15,06
Middle 50% 11,70 21,46
Fourth quartile 11,81 21,02
Social-professional status
Public sector employees 10,66 15,48
Private sector employees 13,63 21,98
Self-employed 11,88 29,79
Farmers 1,27 6,40
Disability pensioners 8,23 18,31
Retirees 8,09 15,97
Students 10,13 8,10
Unemployed 8,99 13,13
Other professionally inactive 9,18 13,54

Social Diagnosis 2007 Appendix 2 184
© The Council for Social Monitoring
Table P116. Do you take advantage of any group insurance provided by the employer?
Social-demografic group
yes no
Total 43,51 56,49
Gender
Men 41,62 58,38
Women 45,52 54,48
Age
up to 24 years old 26,77 73,23
25-34 years old 43,36 56,64
35-44 years old 47,22 52,78
45-59 years old 46,76 53,24
60-64 years old 33,02 66,98
65+ years old 18,52 81,48
Place of residence
Cities > 500k 42,07 57,93
Towns 200-500k 46,72 53,28
Towns 100-200k 51,60 48,40
Towns 20-100k 49,66 50,34
Towns < 20k 47,81 52,19
Rural areas 35,92 64,08
Voivodship
Dolnośląskie 51,17 48,83
Kujawsko-pomorskie 47,69 52,31
Lubelskie 39,16 60,84
Lubuskie 43,98 56,02
Łódzkie 44,70 55,30
Małopolskie 36,73 63,27
Mazowieckie 36,06 63,94
Opolskie 48,84 51,16
Podkarpackie 40,51 59,49
Podlaskie 40,38 59,62
Pomorskie 45,45 54,55
Śląskie 45,87 54,13
Świętokrzyskie 42,94 57,06
Warmińsko-mazurskie 50,26 49,74
Wielkopolskie 47,11 52,89
Zachodniopomorskie 46,31 53,69
Education
Primary and below 26,75 73,25
Vocational 39,33 60,67
Secondary 42,84 57,16
Tertiary/post-secondary 53,17 46,83
Income per capita
First quartile 31,49 68,51
Middle 50% 44,87 55,13
Fourth quartile 47,45 52,55
Social-professional status
Public sector employees 66,30 33,70
Private sector employees 44,05 55,95
Self-employed 15,91 84,09
Farmers 4,15 95,85
Disability pensioners 19,44 80,56
Retirees 28,57 71,43
Students 3,45 96,55
Unemployed 21,62 78,38
Other professionally
inactive 35,19 64,81

Social Diagnosis 2007 Appendix 2 185
© The Council for Social Monitoring
Table P117. Are the following things possible at your work?
Social-demografic group
to change the time
you start or finish
work
to leave work for an
hour at least
to complete some of
the duties at home
Total 50,52 55,64 26,12
Gender
Men 51,97 55,58 23,81
Women 48,95 55,71 28,63
Age
up to 24 years old 51,20 47,44 15,75
25-34 years old 50,30 54,57 26,17
35-44 years old 49,91 54,92 25,69
45-59 years old 49,65 58,41 28,05
60-64 years old 63,87 62,48 33,63
65+ years old 67,42 72,34 45,45
Place of residence
Cities > 500k 55,24 61,51 29,18
Towns 200-500k 52,47 57,25 28,46
Towns 100-200k 45,61 52,96 25,17
Towns 20-100k 44,62 52,44 23,00
Towns < 20k 44,18 47,24 19,90
Rural areas 54,81 58,35 28,32
Voivodship
Dolnośląskie 43,45 47,49 23,35
Kujawsko-pomorskie 49,56 49,21 28,61
Lubelskie 59,59 64,80 26,93
Lubuskie 46,11 57,70 22,00
Łódzkie 53,03 62,97 28,11
Małopolskie 50,60 52,68 27,03
Mazowieckie 54,92 60,19 28,15
Opolskie 51,15 58,00 26,75
Podkarpackie 54,05 57,33 31,52
Podlaskie 55,39 65,20 27,41
Pomorskie 47,72 54,73 25,93
Śląskie 43,60 44,50 21,19
Świętokrzyskie 50,46 56,84 26,89
Warmińsko-mazurskie 49,25 57,22 22,89
Wielkopolskie 54,01 57,58 28,54
Zachodniopomorskie 44,62 58,95 20,27
Education
Primary and below 57,14 61,31 24,60
Vocational 49,38 50,68 18,03
Secondary 50,20 56,68 22,62
Tertiary/post-secondary 50,26 57,97 39,08
Income per capita
First quartile 52,19 54,70 21,96
Middle 50% 48,71 52,39 21,58
Fourth quartile 51,83 60,39 32,53
Social-professional status
Public sector employees 35,89 44,24 23,02
Private sector employees 44,02 49,76 14,21
Self-employed 84,10 85,35 57,57
Farmers 93,03 94,53 62,21
Disability pensioners 67,31 63,03 25,80
Retirees 60,65 63,22 38,04
Students 61,92 10,39 15,61
Unemployed 61,78 63,31 25,77
Other professionally inactive 52,44 55,64 37,72

Social Diagnosis 2007 Appendix 2 186
© The Council for Social Monitoring
Table P118. On what conditions would you be willing to work abroad?
Social-demografic group
if the
remuneration
was higher than
my present
salary
if the work
was more
interesting
than my
present work
if there were
better
possibilities of
being promoted
if it was
ensured that I
am employed
at least for one
year
I would not
work abroad
on any
conditions
Total 41,25 11,91 9,33 17,42 44,09
Gender
Men 47,68 12,92 9,42 20,71 37,41
Women 34,41 10,85 9,23 13,90 51,21
Age
up to 24 years old 55,68 16,96 16,00 25,60 19,16
25-34 years old 46,64 14,51 14,83 19,40 39,25
35-44 years old 42,97 11,79 7,29 17,36 45,25
45-59 years old 34,65 9,42 5,15 15,05 53,35
60-64 years old 18,87 5,60 1,58 5,84 61,93
65+ years old 6,39 0,00 0,00 2,15 48,07
Place of residence
Cities > 500k 47,29 14,12 16,08 17,30 39,61
Towns 200-500k 42,36 14,08 11,52 18,43 35,94
Towns 100-200k 44,62 11,54 11,03 16,32 43,65
Towns 20-100k 42,17 13,93 12,13 14,69 46,08
Towns < 20k 41,67 11,26 7,26 19,86 44,46
Rural areas 37,34 9,62 5,04 17,95 47,53
Voivodship
Dolnośląskie 41,31 13,23 8,12 17,57 46,86
Kujawsko-pomorskie 31,05 8,32 5,24 13,36 30,87
Lubelskie 39,12 11,33 5,35 12,23 48,73
Lubuskie 49,93 14,11 8,52 27,34 36,41
Łódzkie 43,31 13,43 10,97 18,83 44,70
Małopolskie 44,31 10,65 8,12 20,41 41,81
Mazowieckie 37,86 12,25 12,56 15,52 49,53
Opolskie 49,19 10,64 13,14 20,49 35,45
Podkarpackie 46,42 12,33 9,48 17,56 41,94
Podlaskie 40,09 12,12 9,62 15,59 48,07
Pomorskie 39,51 15,03 9,79 16,46 39,44
Śląskie 41,22 10,39 11,83 14,80 47,89
Świętokrzyskie 37,76 10,49 5,71 20,03 35,97
Warmińsko-mazurskie 44,62 17,39 7,11 22,22 39,48
Wielkopolskie 39,01 11,77 8,20 17,80 51,47
Zachodniopomorskie 54,72 10,35 8,59 24,04 37,21
Education
Primary and below 27,34 5,47 2,84 15,62 51,99
Vocational 43,68 9,19 5,07 20,24 41,37
Secondary 42,92 12,24 9,67 18,87 43,65
Tertiary/post-secondary 41,07 16,48 15,52 13,21 45,00
Income per capita
First quartile 42,48 8,99 6,20 20,85 40,40
Middle 50% 43,58 10,83 8,21 19,05 42,62
Fourth quartile 37,65 14,11 12,28 13,44 48,01
Social-professional status
Public sector employees 41,46 12,84 10,92 14,28 49,00
Private sector employees 51,27 14,26 11,37 23,17 35,78
Self-employed 36,02 12,90 6,60 12,41 52,67
Farmers 20,02 4,98 2,46 11,36 68,94
Disability pensioners 18,62 1,28 0,69 5,58 41,65
Retirees 14,11 2,24 1,24 5,00 52,85
Students 28,48 4,85 12,40 14,63 9,86
Unemployed 15,74 7,70 2,50 21,92 20,85
Other professionally inactive 30,35 9,04 9,75 15,89 34,54

Social Diagnosis 2007 Appendix 2 187
© The Council for Social Monitoring
Table P119. Do you participate in any additional pension insurance?
Social-demografic group
yes no
Total 25,02 74,98
Gender
Men 25,10 74,90
Women 24,89 75,11
Age
up to 24 years old 15,16 84,84
25-34 years old 24,73 75,27
35-44 years old 31,01 68,99
45-59 years old 24,02 75,98
60-64 years old 9,33 90,67
65+ years old 9,38 90,63
Place of residence
Cities > 500k 33,20 66,80
Towns 200-500k 29,89 70,11
Towns 100-200k 23,97 76,03
Towns 20-100k 29,52 70,48
Towns < 20k 24,52 75,48
Rural areas 18,24 81,76
Voivodship
Dolnośląskie 29,58 70,42
Kujawsko-pomorskie 22,47 77,53
Lubelskie 17,55 82,45
Lubuskie 25,00 75,00
Łódzkie 27,74 72,26
Małopolskie 24,38 75,62
Mazowieckie 27,14 72,86
Opolskie 27,33 72,67
Podkarpackie 21,03 78,97
Podlaskie 22,82 77,18
Pomorskie 30,19 69,81
Śląskie 24,52 75,48
Świętokrzyskie 25,00 75,00
Warmińsko-mazurskie 22,03 77,97
Wielkopolskie 22,85 77,15
Zachodniopomorskie 24,79 75,21
Education
Primary and below 12,47 87,53
Vocational 19,72 80,28
Secondary 25,04 74,96
Tertiary/post-secondary 33,98 66,02
Income per capita
First quartile 16,38 83,62
Middle 50% 21,86 78,14
Fourth quartile 32,98 67,02
Social-professional status
Public sector employees 31,24 68,76
Private sector employees 24,45 75,55
Self-employed 33,66 66,34
Farmers 5,08 94,92
Disability pensioners 13,51 86,49
Retirees 12,07 87,93
Students 12,12 87,88
Unemployed 13,04 86,96
Other professionally
inactive 23,15 76,85

Social Diagnosis 2007 Appendix 2 188
© The Council for Social Monitoring
Table P120. - if YES, which one?
Social-demografic group
I save in an
investment fund
I am a member of
Employee Pension
Program, organized
by my employer
I have an Individual
Pension Account
(IKE)
other forms
Total 33,40 19,56 23,59 23,45
Gender
Men 33,94 19,87 24,13 22,06
Women 32,95 19,36 22,83 24,86
Age
up to 24 years old 20,51 16,67 38,46 24,36
25-34 years old 31,96 16,89 26,94 24,20
35-44 years old 37,63 21,99 19,03 21,35
45-59 years old 33,12 20,09 22,22 24,57
60-64 years old 16,67 16,67 33,33 33,33
65+ years old 0,00 66,67 33,33 0,00
Place of residence
Cities > 500k 43,03 9,02 25,41 22,54
Towns 200-500k 31,78 21,96 22,90 23,36
Towns 100-200k 33,06 23,97 21,49 21,49
Towns 20-100k 33,33 18,02 26,43 22,22
Towns < 20k 34,25 19,34 21,55 24,86
Rural areas 28,07 25,40 21,66 24,87
Voivodship
Dolnośląskie 28,79 25,76 22,73 22,73
Kujawsko-pomorskie 25,42 32,20 22,03 20,34
Lubelskie 33,93 23,21 8,93 33,93
Lubuskie 37,50 20,00 30,00 12,50
Łódzkie 40,00 15,65 20,00 24,35
Małopolskie 41,18 18,49 24,37 15,97
Mazowieckie 43,36 10,62 21,68 24,34
Opolskie 22,73 13,64 31,82 31,82
Podkarpackie 40,00 6,67 18,33 35,00
Podlaskie 38,30 21,28 10,64 29,79
Pomorskie 36,04 18,02 31,53 14,41
Śląskie 24,71 24,14 27,01 24,14
Świętokrzyskie 23,81 23,81 28,57 23,81
Warmińsko-mazurskie 25,64 28,21 28,21 17,95
Wielkopolskie 23,24 27,46 26,06 23,24
Zachodniopomorskie 36,07 11,48 21,31 31,15
Education
Primary and below 18,97 41,38 15,52 24,14
Vocational 23,41 29,48 20,81 26,30
Secondary 35,33 15,37 24,75 24,55
Tertiary/post-secondary 39,61 14,92 25,04 20,43
Income per capita
First quartile 17,48 33,57 20,28 28,67
Middle 50% 32,64 22,05 20,14 25,17
Fourth quartile 38,47 15,26 25,32 20,94
Social-professional status
Public sector employees 32,41 25,41 20,63 21,55
Private sector employees 32,63 19,76 22,90 24,70
Self-employed 41,38 1,15 32,76 24,71
Farmers 29,63 14,81 25,93 29,63
Disability pensioners 27,27 27,27 18,18 27,27
Retirees 12,50 62,50 25,00 0,00
Students 25,00 0,00 50,00 25,00
Unemployed 28,57 0,00 71,43 0,00
Other professionally
inactive 36,00 20,00 20,00 24,00

Social Diagnosis 2007 Appendix 2 189
© The Council for Social Monitoring
Table P121. - if NO, are you going to participate in any additional pension insurance?
Social-demografic group
yes, I am going to
have an Individual
Pension Account
(IKE)
yes, in another
form no
Total 5,25 11,67 83,08
Gender
Men 5,34 11,45 83,21
Women 5,16 11,86 82,98
Age
up to 24 years old 11,67 18,33 70,00
25-34 years old 8,34 17,79 73,87
35-44 years old 4,67 9,44 85,88
45-59 years old 1,26 6,01 92,73
60-64 years old 3,13 4,69 92,19
65+ years old 0,00 14,81 85,19
Place of residence
Cities > 500k 6,29 16,56 77,15
Towns 200-500k 9,70 17,30 73,00
Towns 100-200k 4,40 12,91 82,69
Towns 20-100k 6,13 12,91 80,96
Towns < 20k 3,06 10,33 86,62
Rural areas 4,18 7,99 87,83
Voivodship
Dolnośląskie 6,25 12,83 80,92
Kujawsko-pomorskie 8,67 12,24 79,08
Lubelskie 6,05 7,66 86,29
Lubuskie 7,76 13,79 78,45
Łódzkie 1,40 10,88 87,72
Małopolskie 5,75 11,49 82,76
Mazowieckie 4,32 13,82 81,87
Opolskie 8,33 6,48 85,19
Podkarpackie 3,15 13,96 82,88
Podlaskie 5,88 11,11 83,01
Pomorskie 10,16 12,50 77,34
Śląskie 4,78 11,55 83,67
Świętokrzyskie 3,42 14,53 82,05
Warmińsko-mazurskie 4,48 14,18 81,34
Wielkopolskie 4,35 10,00 85,65
Zachodniopomorskie 3,91 8,38 87,71
Education
Primary and below 1,83 4,96 93,21
Vocational 3,14 7,34 89,52
Secondary 5,75 12,05 82,20
Tertiary/post-secondary 8,62 18,97 72,41
Income per capita
First quartile 3,03 8,36 88,62
Middle 50% 4,62 10,57 84,81
Fourth quartile 7,99 14,97 77,04
Social-professional status
Public sector employees 5,24 11,97 82,79
Private sector employees 6,26 12,27 81,47
Self-employed 6,67 18,79 74,55
Farmers 1,20 4,41 94,39
Disability pensioners 1,56 3,13 95,31
Retirees 2,08 10,42 87,50
Students 10,71 25,00 64,29
Unemployed 2,78 5,56 91,67
Other professionally
inactive 5,33 12,00 82,67
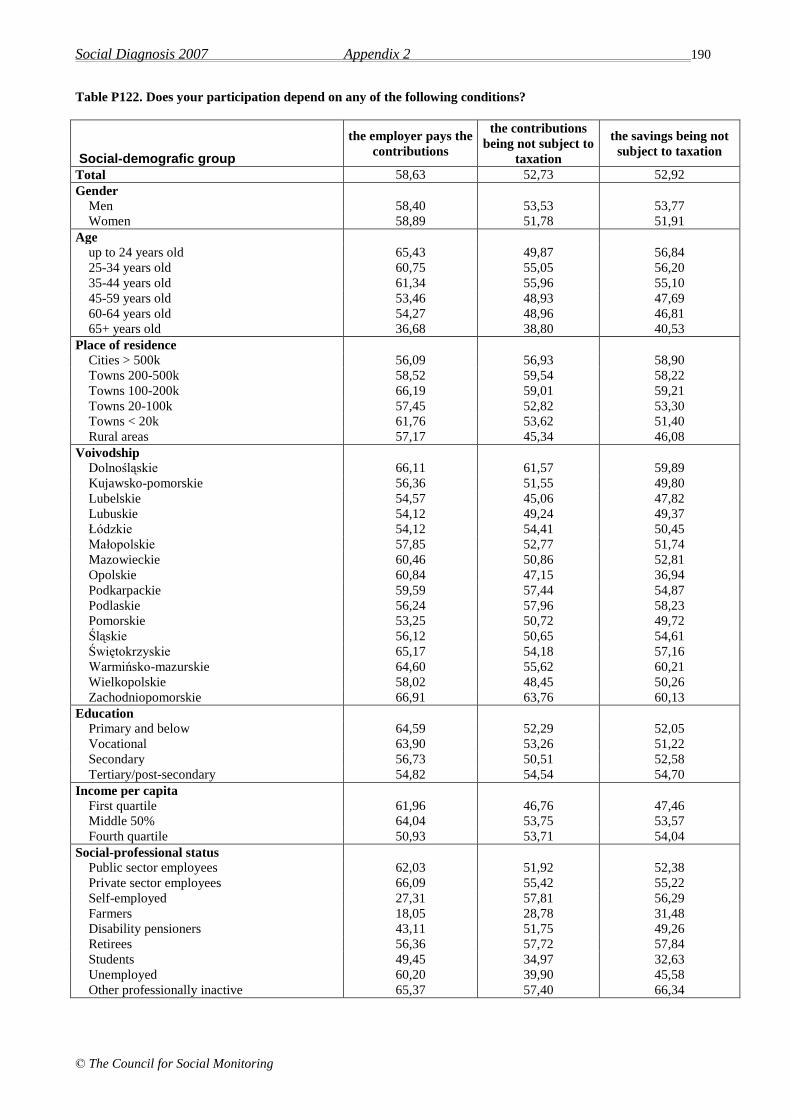
Social Diagnosis 2007 Appendix 2 190
© The Council for Social Monitoring
Table P122. Does your participation depend on any of the following conditions?
Social-demografic group
the employer pays the
contributions
the contributions
being not subject to
taxation
the savings being not
subject to taxation
Total 58,63 52,73 52,92
Gender
Men 58,40 53,53 53,77
Women 58,89 51,78 51,91
Age
up to 24 years old 65,43 49,87 56,84
25-34 years old 60,75 55,05 56,20
35-44 years old 61,34 55,96 55,10
45-59 years old 53,46 48,93 47,69
60-64 years old 54,27 48,96 46,81
65+ years old 36,68 38,80 40,53
Place of residence
Cities > 500k 56,09 56,93 58,90
Towns 200-500k 58,52 59,54 58,22
Towns 100-200k 66,19 59,01 59,21
Towns 20-100k 57,45 52,82 53,30
Towns < 20k 61,76 53,62 51,40
Rural areas 57,17 45,34 46,08
Voivodship
Dolnośląskie 66,11 61,57 59,89
Kujawsko-pomorskie 56,36 51,55 49,80
Lubelskie 54,57 45,06 47,82
Lubuskie 54,12 49,24 49,37
Łódzkie 54,12 54,41 50,45
Małopolskie 57,85 52,77 51,74
Mazowieckie 60,46 50,86 52,81
Opolskie 60,84 47,15 36,94
Podkarpackie 59,59 57,44 54,87
Podlaskie 56,24 57,96 58,23
Pomorskie 53,25 50,72 49,72
Śląskie 56,12 50,65 54,61
Świętokrzyskie 65,17 54,18 57,16
Warmińsko-mazurskie 64,60 55,62 60,21
Wielkopolskie 58,02 48,45 50,26
Zachodniopomorskie 66,91 63,76 60,13
Education
Primary and below 64,59 52,29 52,05
Vocational 63,90 53,26 51,22
Secondary 56,73 50,51 52,58
Tertiary/post-secondary 54,82 54,54 54,70
Income per capita
First quartile 61,96 46,76 47,46
Middle 50% 64,04 53,75 53,57
Fourth quartile 50,93 53,71 54,04
Social-professional status
Public sector employees 62,03 51,92 52,38
Private sector employees 66,09 55,42 55,22
Self-employed 27,31 57,81 56,29
Farmers 18,05 28,78 31,48
Disability pensioners 43,11 51,75 49,26
Retirees 56,36 57,72 57,84
Students 49,45 34,97 32,63
Unemployed 60,20 39,90 45,58
Other professionally inactive 65,37 57,40 66,34
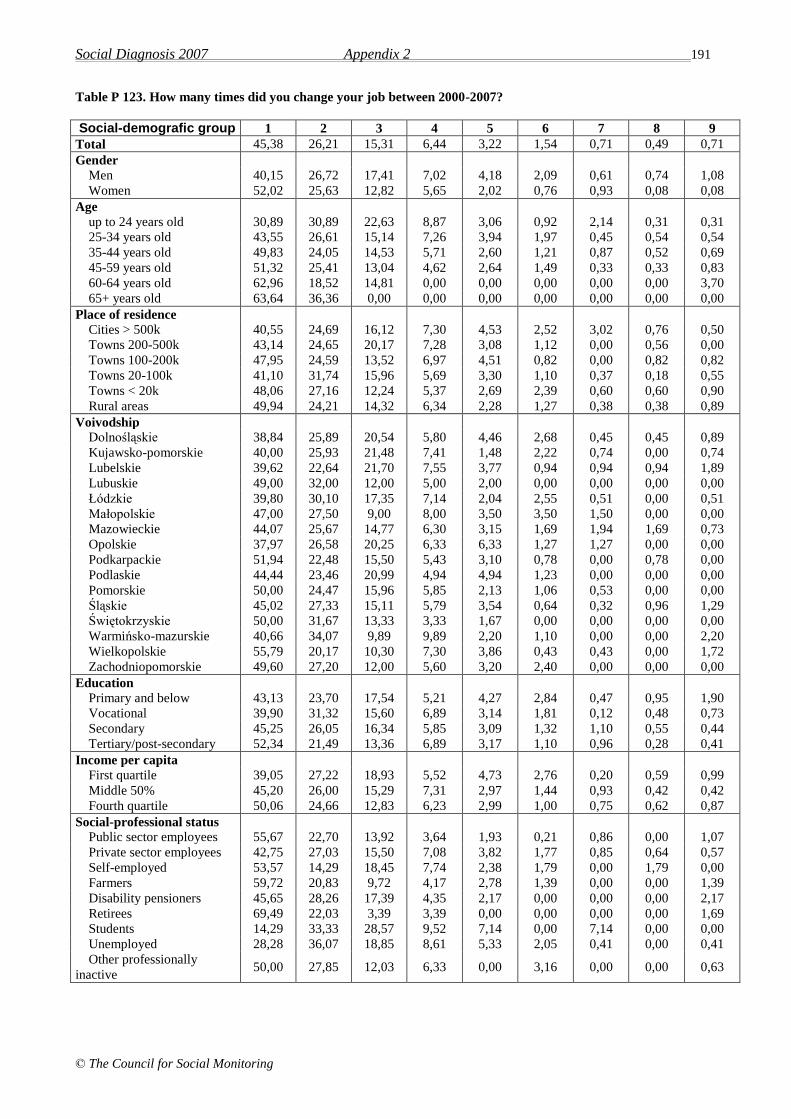
Social Diagnosis 2007 Appendix 2 191
© The Council for Social Monitoring
Table P 123. How many times did you change your job between 2000-2007?
Social-demografic group 1 2 3 4 5 6 7 8 9
Total 45,38 26,21 15,31 6,44 3,22 1,54 0,71 0,49 0,71
Gender
Men 40,15 26,72 17,41 7,02 4,18 2,09 0,61 0,74 1,08
Women 52,02 25,63 12,82 5,65 2,02 0,76 0,93 0,08 0,08
Age
up to 24 years old 30,89 30,89 22,63 8,87 3,06 0,92 2,14 0,31 0,31
25-34 years old 43,55 26,61 15,14 7,26 3,94 1,97 0,45 0,54 0,54
35-44 years old 49,83 24,05 14,53 5,71 2,60 1,21 0,87 0,52 0,69
45-59 years old 51,32 25,41 13,04 4,62 2,64 1,49 0,33 0,33 0,83
60-64 years old 62,96 18,52 14,81 0,00 0,00 0,00 0,00 0,00 3,70
65+ years old 63,64 36,36 0,00 0,00 0,00 0,00 0,00 0,00 0,00
Place of residence
Cities > 500k 40,55 24,69 16,12 7,30 4,53 2,52 3,02 0,76 0,50
Towns 200-500k 43,14 24,65 20,17 7,28 3,08 1,12 0,00 0,56 0,00
Towns 100-200k 47,95 24,59 13,52 6,97 4,51 0,82 0,00 0,82 0,82
Towns 20-100k 41,10 31,74 15,96 5,69 3,30 1,10 0,37 0,18 0,55
Towns < 20k 48,06 27,16 12,24 5,37 2,69 2,39 0,60 0,60 0,90
Rural areas 49,94 24,21 14,32 6,34 2,28 1,27 0,38 0,38 0,89
Voivodship
Dolnośląskie 38,84 25,89 20,54 5,80 4,46 2,68 0,45 0,45 0,89
Kujawsko-pomorskie 40,00 25,93 21,48 7,41 1,48 2,22 0,74 0,00 0,74
Lubelskie 39,62 22,64 21,70 7,55 3,77 0,94 0,94 0,94 1,89
Lubuskie 49,00 32,00 12,00 5,00 2,00 0,00 0,00 0,00 0,00
Łódzkie 39,80 30,10 17,35 7,14 2,04 2,55 0,51 0,00 0,51
Małopolskie 47,00 27,50 9,00 8,00 3,50 3,50 1,50 0,00 0,00
Mazowieckie 44,07 25,67 14,77 6,30 3,15 1,69 1,94 1,69 0,73
Opolskie 37,97 26,58 20,25 6,33 6,33 1,27 1,27 0,00 0,00
Podkarpackie 51,94 22,48 15,50 5,43 3,10 0,78 0,00 0,78 0,00
Podlaskie 44,44 23,46 20,99 4,94 4,94 1,23 0,00 0,00 0,00
Pomorskie 50,00 24,47 15,96 5,85 2,13 1,06 0,53 0,00 0,00
Śląskie 45,02 27,33 15,11 5,79 3,54 0,64 0,32 0,96 1,29
Świętokrzyskie 50,00 31,67 13,33 3,33 1,67 0,00 0,00 0,00 0,00
Warmińsko-mazurskie 40,66 34,07 9,89 9,89 2,20 1,10 0,00 0,00 2,20
Wielkopolskie 55,79 20,17 10,30 7,30 3,86 0,43 0,43 0,00 1,72
Zachodniopomorskie 49,60 27,20 12,00 5,60 3,20 2,40 0,00 0,00 0,00
Education
Primary and below 43,13 23,70 17,54 5,21 4,27 2,84 0,47 0,95 1,90
Vocational 39,90 31,32 15,60 6,89 3,14 1,81 0,12 0,48 0,73
Secondary 45,25 26,05 16,34 5,85 3,09 1,32 1,10 0,55 0,44
Tertiary/post-secondary 52,34 21,49 13,36 6,89 3,17 1,10 0,96 0,28 0,41
Income per capita
First quartile 39,05 27,22 18,93 5,52 4,73 2,76 0,20 0,59 0,99
Middle 50% 45,20 26,00 15,29 7,31 2,97 1,44 0,93 0,42 0,42
Fourth quartile 50,06 24,66 12,83 6,23 2,99 1,00 0,75 0,62 0,87
Social-professional status
Public sector employees 55,67 22,70 13,92 3,64 1,93 0,21 0,86 0,00 1,07
Private sector employees 42,75 27,03 15,50 7,08 3,82 1,77 0,85 0,64 0,57
Self-employed 53,57 14,29 18,45 7,74 2,38 1,79 0,00 1,79 0,00
Farmers 59,72 20,83 9,72 4,17 2,78 1,39 0,00 0,00 1,39
Disability pensioners 45,65 28,26 17,39 4,35 2,17 0,00 0,00 0,00 2,17
Retirees 69,49 22,03 3,39 3,39 0,00 0,00 0,00 0,00 1,69
Students 14,29 33,33 28,57 9,52 7,14 0,00 7,14 0,00 0,00
Unemployed 28,28 36,07 18,85 8,61 5,33 2,05 0,41 0,00 0,41
Other professionally
inactive 50,00 27,85 12,03 6,33 0,00 3,16 0,00 0,00 0,63
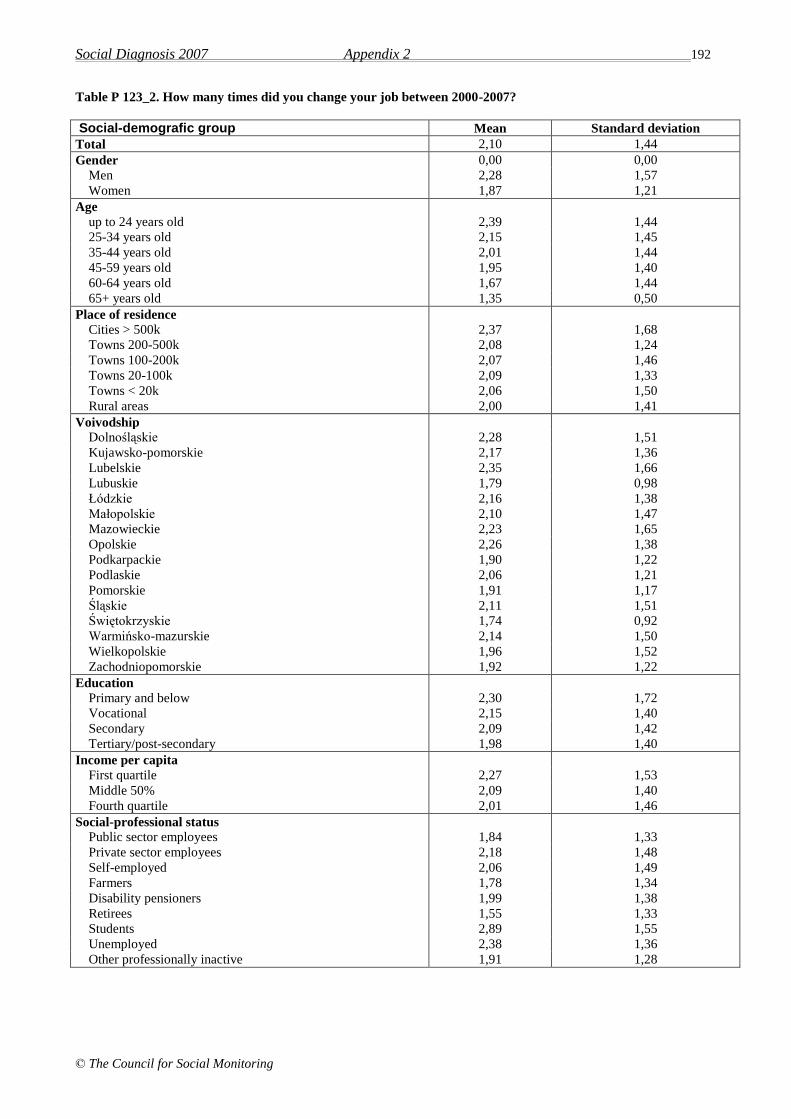
Social Diagnosis 2007 Appendix 2 192
© The Council for Social Monitoring
Table P 123_2. How many times did you change your job between 2000-2007?
Social-demografic group Mean Standard deviation
Total 2,10 1,44
Gender 0,00 0,00
Men 2,28 1,57
Women 1,87 1,21
Age
up to 24 years old 2,39 1,44
25-34 years old 2,15 1,45
35-44 years old 2,01 1,44
45-59 years old 1,95 1,40
60-64 years old 1,67 1,44
65+ years old 1,35 0,50
Place of residence
Cities > 500k 2,37 1,68
Towns 200-500k 2,08 1,24
Towns 100-200k 2,07 1,46
Towns 20-100k 2,09 1,33
Towns < 20k 2,06 1,50
Rural areas 2,00 1,41
Voivodship
Dolnośląskie 2,28 1,51
Kujawsko-pomorskie 2,17 1,36
Lubelskie 2,35 1,66
Lubuskie 1,79 0,98
Łódzkie 2,16 1,38
Małopolskie 2,10 1,47
Mazowieckie 2,23 1,65
Opolskie 2,26 1,38
Podkarpackie 1,90 1,22
Podlaskie 2,06 1,21
Pomorskie 1,91 1,17
Śląskie 2,11 1,51
Świętokrzyskie 1,74 0,92
Warmińsko-mazurskie 2,14 1,50
Wielkopolskie 1,96 1,52
Zachodniopomorskie 1,92 1,22
Education
Primary and below 2,30 1,72
Vocational 2,15 1,40
Secondary 2,09 1,42
Tertiary/post-secondary 1,98 1,40
Income per capita
First quartile 2,27 1,53
Middle 50% 2,09 1,40
Fourth quartile 2,01 1,46
Social-professional status
Public sector employees 1,84 1,33
Private sector employees 2,18 1,48
Self-employed 2,06 1,49
Farmers 1,78 1,34
Disability pensioners 1,99 1,38
Retirees 1,55 1,33
Students 2,89 1,55
Unemployed 2,38 1,36
Other professionally inactive 1,91 1,28
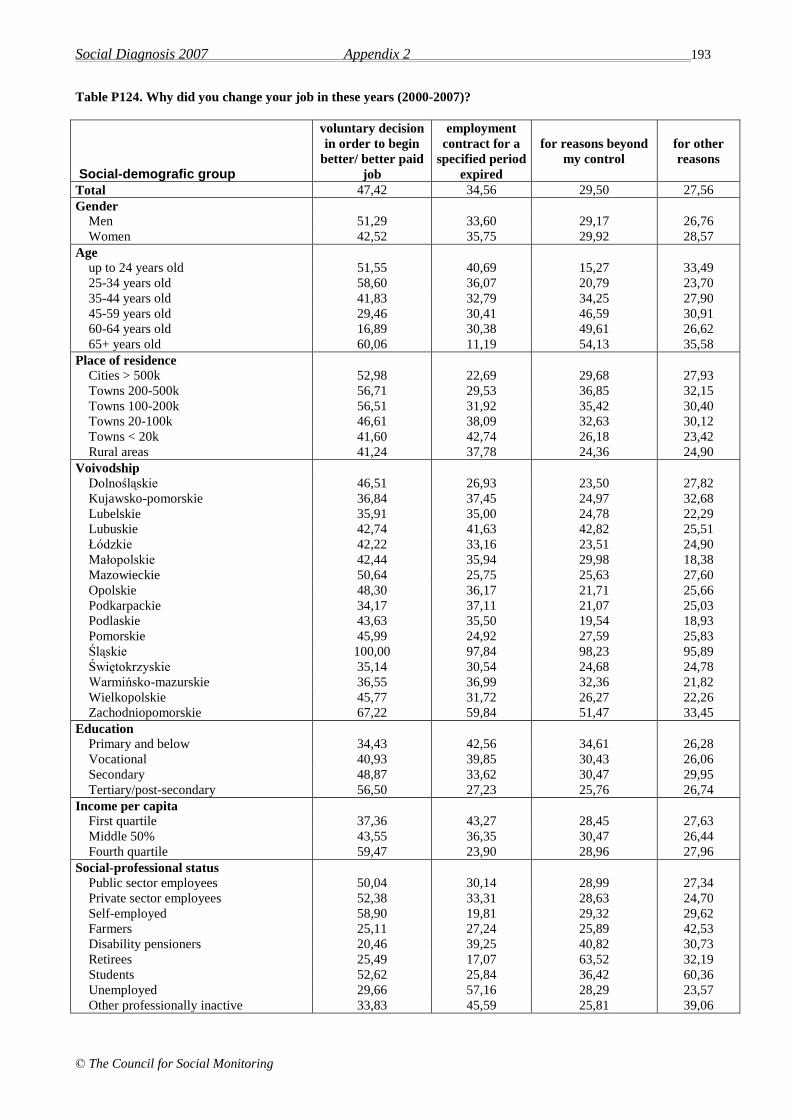
Social Diagnosis 2007 Appendix 2 193
© The Council for Social Monitoring
Table P124. Why did you change your job in these years (2000-2007)?
Social-demografic group
voluntary decision
in order to begin
better/ better paid
job
employment
contract for a
specified period
expired
for reasons beyond
my control
for other
reasons
Total 47,42 34,56 29,50 27,56
Gender
Men 51,29 33,60 29,17 26,76
Women 42,52 35,75 29,92 28,57
Age
up to 24 years old 51,55 40,69 15,27 33,49
25-34 years old 58,60 36,07 20,79 23,70
35-44 years old 41,83 32,79 34,25 27,90
45-59 years old 29,46 30,41 46,59 30,91
60-64 years old 16,89 30,38 49,61 26,62
65+ years old 60,06 11,19 54,13 35,58
Place of residence
Cities > 500k 52,98 22,69 29,68 27,93
Towns 200-500k 56,71 29,53 36,85 32,15
Towns 100-200k 56,51 31,92 35,42 30,40
Towns 20-100k 46,61 38,09 32,63 30,12
Towns < 20k 41,60 42,74 26,18 23,42
Rural areas 41,24 37,78 24,36 24,90
Voivodship
Dolnośląskie 46,51 26,93 23,50 27,82
Kujawsko-pomorskie 36,84 37,45 24,97 32,68
Lubelskie 35,91 35,00 24,78 22,29
Lubuskie 42,74 41,63 42,82 25,51
Łódzkie 42,22 33,16 23,51 24,90
Małopolskie 42,44 35,94 29,98 18,38
Mazowieckie 50,64 25,75 25,63 27,60
Opolskie 48,30 36,17 21,71 25,66
Podkarpackie 34,17 37,11 21,07 25,03
Podlaskie 43,63 35,50 19,54 18,93
Pomorskie 45,99 24,92 27,59 25,83
Śląskie 100,00 97,84 98,23 95,89
Świętokrzyskie 35,14 30,54 24,68 24,78
Warmińsko-mazurskie 36,55 36,99 32,36 21,82
Wielkopolskie 45,77 31,72 26,27 22,26
Zachodniopomorskie 67,22 59,84 51,47 33,45
Education
Primary and below 34,43 42,56 34,61 26,28
Vocational 40,93 39,85 30,43 26,06
Secondary 48,87 33,62 30,47 29,95
Tertiary/post-secondary 56,50 27,23 25,76 26,74
Income per capita
First quartile 37,36 43,27 28,45 27,63
Middle 50% 43,55 36,35 30,47 26,44
Fourth quartile 59,47 23,90 28,96 27,96
Social-professional status
Public sector employees 50,04 30,14 28,99 27,34
Private sector employees 52,38 33,31 28,63 24,70
Self-employed 58,90 19,81 29,32 29,62
Farmers 25,11 27,24 25,89 42,53
Disability pensioners 20,46 39,25 40,82 30,73
Retirees 25,49 17,07 63,52 32,19
Students 52,62 25,84 36,42 60,36
Unemployed 29,66 57,16 28,29 23,57
Other professionally inactive 33,83 45,59 25,81 39,06
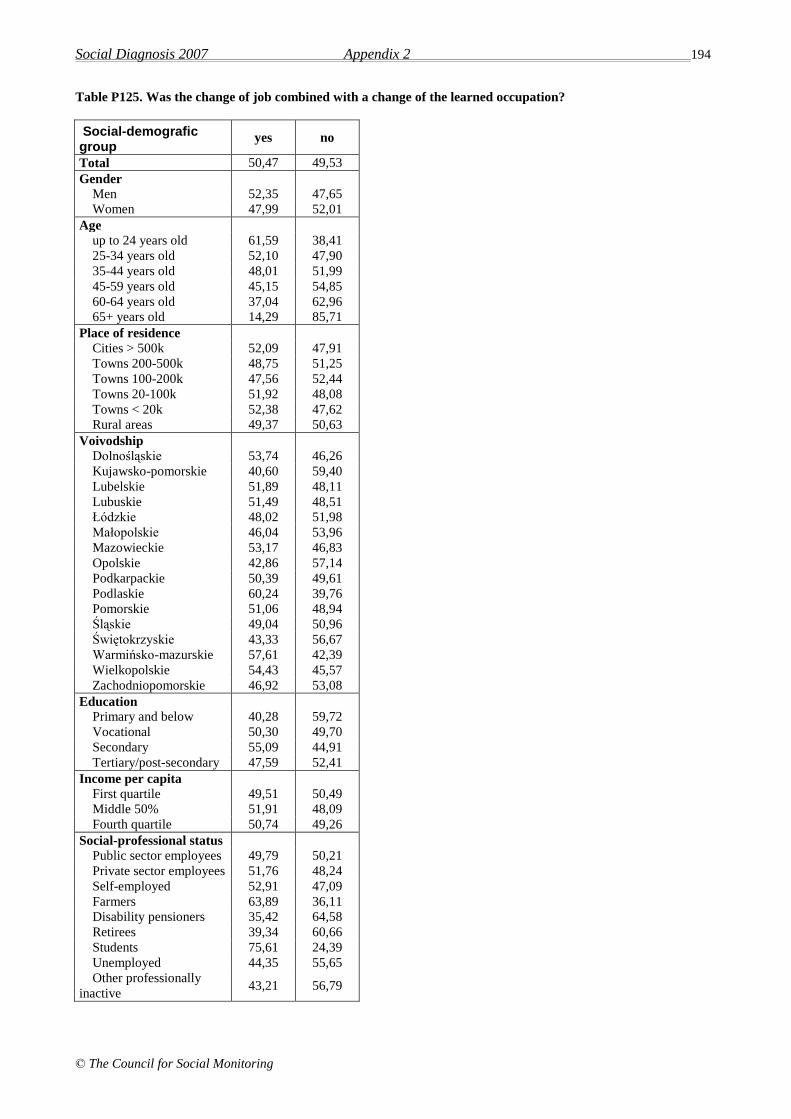
Social Diagnosis 2007 Appendix 2 194
© The Council for Social Monitoring
Table P125. Was the change of job combined with a change of the learned occupation?
Social-demografic group
yes no
Total 50,47 49,53
Gender
Men 52,35 47,65
Women 47,99 52,01
Age
up to 24 years old 61,59 38,41
25-34 years old 52,10 47,90
35-44 years old 48,01 51,99
45-59 years old 45,15 54,85
60-64 years old 37,04 62,96
65+ years old 14,29 85,71
Place of residence
Cities > 500k 52,09 47,91
Towns 200-500k 48,75 51,25
Towns 100-200k 47,56 52,44
Towns 20-100k 51,92 48,08
Towns < 20k 52,38 47,62
Rural areas 49,37 50,63
Voivodship
Dolnośląskie 53,74 46,26
Kujawsko-pomorskie 40,60 59,40
Lubelskie 51,89 48,11
Lubuskie 51,49 48,51
Łódzkie 48,02 51,98
Małopolskie 46,04 53,96
Mazowieckie 53,17 46,83
Opolskie 42,86 57,14
Podkarpackie 50,39 49,61
Podlaskie 60,24 39,76
Pomorskie 51,06 48,94
Śląskie 49,04 50,96
Świętokrzyskie 43,33 56,67
Warmińsko-mazurskie 57,61 42,39
Wielkopolskie 54,43 45,57
Zachodniopomorskie 46,92 53,08
Education
Primary and below 40,28 59,72
Vocational 50,30 49,70
Secondary 55,09 44,91
Tertiary/post-secondary 47,59 52,41
Income per capita
First quartile 49,51 50,49
Middle 50% 51,91 48,09
Fourth quartile 50,74 49,26
Social-professional status
Public sector employees 49,79 50,21
Private sector employees 51,76 48,24
Self-employed 52,91 47,09
Farmers 63,89 36,11
Disability pensioners 35,42 64,58
Retirees 39,34 60,66
Students 75,61 24,39
Unemployed 44,35 55,65
Other professionally
inactive 43,21 56,79

Social Diagnosis 2007 Appendix 2 195
© The Council for Social Monitoring
Table P126. Was the change of job combined with a change of your place of residence?
Social-demografic group
yes no
Total 13,10 86,90
Gender
Men 13,98 86,02
Women 12,15 87,85
Age
up to 24 years old 14,42 85,58
25-34 years old 17,13 82,87
35-44 years old 10,96 89,04
45-59 years old 7,87 92,13
60-64 years old 7,69 92,31
65+ years old 0,00 100,00
Place of residence
Cities > 500k 13,00 87,00
Towns 200-500k 9,80 90,20
Towns 100-200k 12,65 87,35
Towns 20-100k 12,50 87,50
Towns < 20k 11,01 88,99
Rural areas 16,26 83,74
Voivodship
Dolnośląskie 15,93 84,07
Kujawsko-pomorskie 9,85 90,15
Lubelskie 17,14 82,86
Lubuskie 13,13 86,87
Łódzkie 9,64 90,36
Małopolskie 13,86 86,14
Mazowieckie 15,72 84,28
Opolskie 14,29 85,71
Podkarpackie 18,75 81,25
Podlaskie 18,07 81,93
Pomorskie 9,29 90,71
Śląskie 8,88 91,12
Świętokrzyskie 18,64 81,36
Warmińsko-mazurskie 14,29 85,71
Wielkopolskie 12,77 87,23
Zachodniopomorskie 7,03 92,97
Education
Primary and below 12,08 87,92
Vocational 14,70 85,30
Secondary 9,80 90,20
Tertiary/post-secondary 15,99 84,01
Income per capita
First quartile 12,62 87,38
Middle 50% 12,43 87,57
Fourth quartile 13,98 86,02
Social-professional status
Public sector employees 9,94 90,06
Private sector employees 13,94 86,06
Self-employed 13,94 86,06
Farmers 33,33 66,67
Disability pensioners 8,70 91,30
Retirees 5,00 95,00
Students 4,88 95,12
Unemployed 11,69 88,31
Other professionally
inactive 15,19 84,81
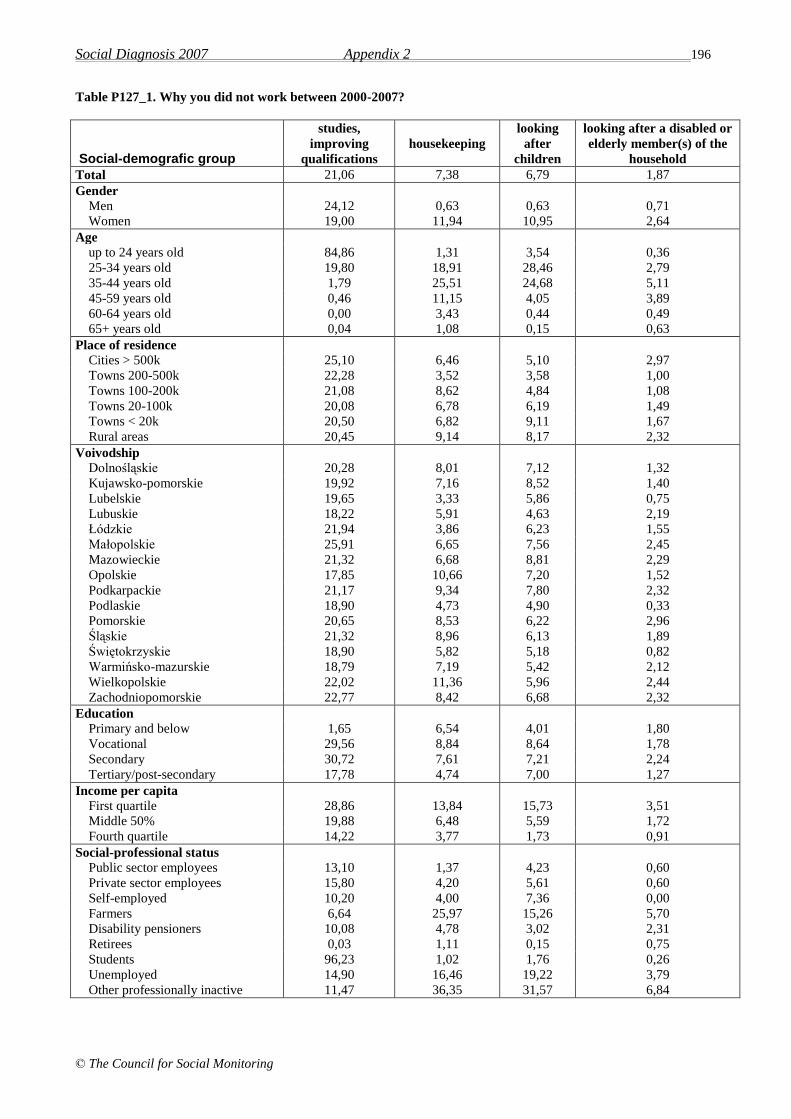
Social Diagnosis 2007 Appendix 2 196
© The Council for Social Monitoring
Table P127_1. Why you did not work between 2000-2007?
Social-demografic group
studies,
improving
qualifications
housekeeping
looking
after
children
looking after a disabled or
elderly member(s) of the
household
Total 21,06 7,38 6,79 1,87
Gender
Men 24,12 0,63 0,63 0,71
Women 19,00 11,94 10,95 2,64
Age
up to 24 years old 84,86 1,31 3,54 0,36
25-34 years old 19,80 18,91 28,46 2,79
35-44 years old 1,79 25,51 24,68 5,11
45-59 years old 0,46 11,15 4,05 3,89
60-64 years old 0,00 3,43 0,44 0,49
65+ years old 0,04 1,08 0,15 0,63
Place of residence
Cities > 500k 25,10 6,46 5,10 2,97
Towns 200-500k 22,28 3,52 3,58 1,00
Towns 100-200k 21,08 8,62 4,84 1,08
Towns 20-100k 20,08 6,78 6,19 1,49
Towns < 20k 20,50 6,82 9,11 1,67
Rural areas 20,45 9,14 8,17 2,32
Voivodship
Dolnośląskie 20,28 8,01 7,12 1,32
Kujawsko-pomorskie 19,92 7,16 8,52 1,40
Lubelskie 19,65 3,33 5,86 0,75
Lubuskie 18,22 5,91 4,63 2,19
Łódzkie 21,94 3,86 6,23 1,55
Małopolskie 25,91 6,65 7,56 2,45
Mazowieckie 21,32 6,68 8,81 2,29
Opolskie 17,85 10,66 7,20 1,52
Podkarpackie 21,17 9,34 7,80 2,32
Podlaskie 18,90 4,73 4,90 0,33
Pomorskie 20,65 8,53 6,22 2,96
Śląskie 21,32 8,96 6,13 1,89
Świętokrzyskie 18,90 5,82 5,18 0,82
Warmińsko-mazurskie 18,79 7,19 5,42 2,12
Wielkopolskie 22,02 11,36 5,96 2,44
Zachodniopomorskie 22,77 8,42 6,68 2,32
Education
Primary and below 1,65 6,54 4,01 1,80
Vocational 29,56 8,84 8,64 1,78
Secondary 30,72 7,61 7,21 2,24
Tertiary/post-secondary 17,78 4,74 7,00 1,27
Income per capita
First quartile 28,86 13,84 15,73 3,51
Middle 50% 19,88 6,48 5,59 1,72
Fourth quartile 14,22 3,77 1,73 0,91
Social-professional status
Public sector employees 13,10 1,37 4,23 0,60
Private sector employees 15,80 4,20 5,61 0,60
Self-employed 10,20 4,00 7,36 0,00
Farmers 6,64 25,97 15,26 5,70
Disability pensioners 10,08 4,78 3,02 2,31
Retirees 0,03 1,11 0,15 0,75
Students 96,23 1,02 1,76 0,26
Unemployed 14,90 16,46 19,22 3,79
Other professionally inactive 11,47 36,35 31,57 6,84
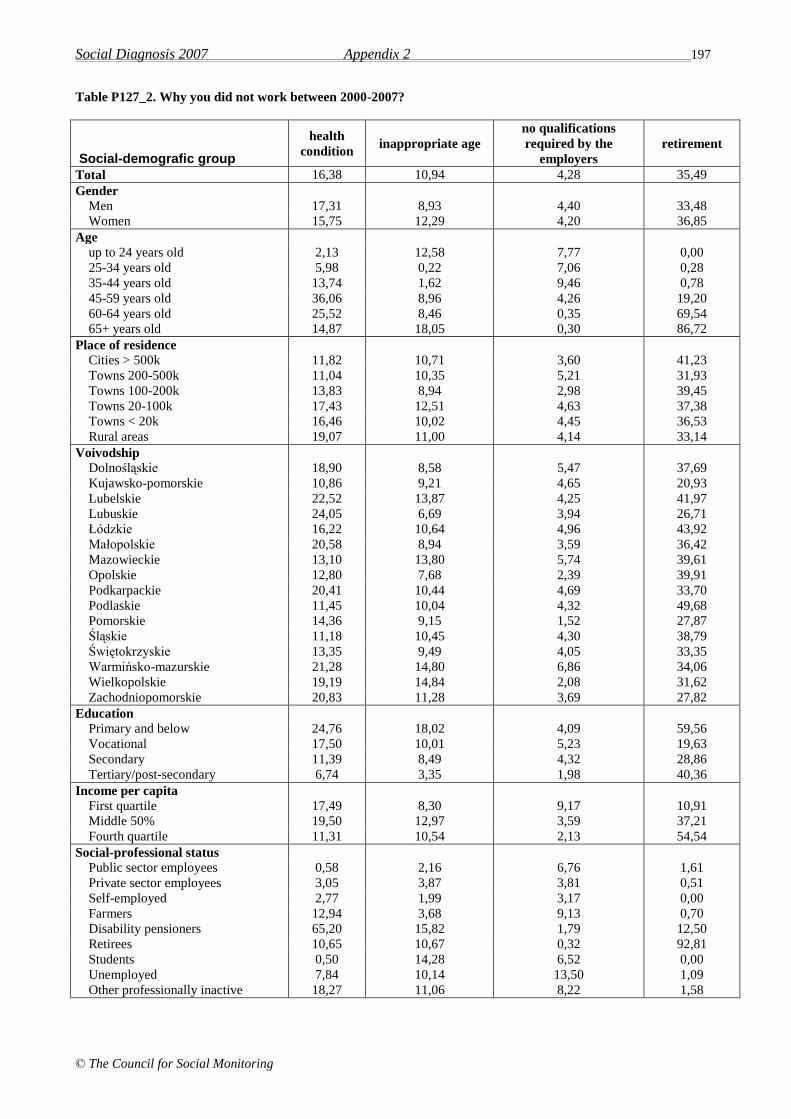
Social Diagnosis 2007 Appendix 2 197
© The Council for Social Monitoring
Table P127_2. Why you did not work between 2000-2007?
Social-demografic group
health
condition inappropriate age
no qualifications
required by the
employers
retirement
Total 16,38 10,94 4,28 35,49
Gender
Men 17,31 8,93 4,40 33,48
Women 15,75 12,29 4,20 36,85
Age
up to 24 years old 2,13 12,58 7,77 0,00
25-34 years old 5,98 0,22 7,06 0,28
35-44 years old 13,74 1,62 9,46 0,78
45-59 years old 36,06 8,96 4,26 19,20
60-64 years old 25,52 8,46 0,35 69,54
65+ years old 14,87 18,05 0,30 86,72
Place of residence
Cities > 500k 11,82 10,71 3,60 41,23
Towns 200-500k 11,04 10,35 5,21 31,93
Towns 100-200k 13,83 8,94 2,98 39,45
Towns 20-100k 17,43 12,51 4,63 37,38
Towns < 20k 16,46 10,02 4,45 36,53
Rural areas 19,07 11,00 4,14 33,14
Voivodship
Dolnośląskie 18,90 8,58 5,47 37,69
Kujawsko-pomorskie 10,86 9,21 4,65 20,93
Lubelskie 22,52 13,87 4,25 41,97
Lubuskie 24,05 6,69 3,94 26,71
Łódzkie 16,22 10,64 4,96 43,92
Małopolskie 20,58 8,94 3,59 36,42
Mazowieckie 13,10 13,80 5,74 39,61
Opolskie 12,80 7,68 2,39 39,91
Podkarpackie 20,41 10,44 4,69 33,70
Podlaskie 11,45 10,04 4,32 49,68
Pomorskie 14,36 9,15 1,52 27,87
Śląskie 11,18 10,45 4,30 38,79
Świętokrzyskie 13,35 9,49 4,05 33,35
Warmińsko-mazurskie 21,28 14,80 6,86 34,06
Wielkopolskie 19,19 14,84 2,08 31,62
Zachodniopomorskie 20,83 11,28 3,69 27,82
Education
Primary and below 24,76 18,02 4,09 59,56
Vocational 17,50 10,01 5,23 19,63
Secondary 11,39 8,49 4,32 28,86
Tertiary/post-secondary 6,74 3,35 1,98 40,36
Income per capita
First quartile 17,49 8,30 9,17 10,91
Middle 50% 19,50 12,97 3,59 37,21
Fourth quartile 11,31 10,54 2,13 54,54
Social-professional status
Public sector employees 0,58 2,16 6,76 1,61
Private sector employees 3,05 3,87 3,81 0,51
Self-employed 2,77 1,99 3,17 0,00
Farmers 12,94 3,68 9,13 0,70
Disability pensioners 65,20 15,82 1,79 12,50
Retirees 10,65 10,67 0,32 92,81
Students 0,50 14,28 6,52 0,00
Unemployed 7,84 10,14 13,50 1,09
Other professionally inactive 18,27 11,06 8,22 1,58

Social Diagnosis 2007 Appendix 2 198
© The Council for Social Monitoring
Table P127_3. Why you did not work between 2000-2007?
Social-demografic group difficulties in finding a
job
the receipt of social
benefits
I didn’t want to
work
Total 14,47 4,51 2,45
Gender
Men 14,74 4,77 2,18
Women 14,30 4,33 2,64
Age
up to 24 years old 13,16 1,53 3,94
25-34 years old 30,56 3,82 2,52
35-44 years old 35,75 4,45 3,88
45-59 years old 21,77 9,99 1,67
60-64 years old 3,97 7,64 1,08
65+ years old 1,26 2,27 1,84
Place of residence
Cities > 500k 13,55 3,06 2,73
Towns 200-500k 12,92 3,80 3,12
Towns 100-200k 13,75 4,81 2,15
Towns 20-100k 17,39 5,16 1,85
Towns < 20k 13,92 3,72 2,75
Rural areas 13,90 4,93 2,46
Voivodship
Dolnośląskie 18,41 3,47 1,87
Kujawsko-pomorskie 14,57 4,42 2,00
Lubelskie 13,88 5,05 2,33
Lubuskie 19,40 10,41 1,12
Łódzkie 13,84 3,45 2,49
Małopolskie 12,00 3,04 1,16
Mazowieckie 16,96 3,38 2,42
Opolskie 13,47 6,16 4,32
Podkarpackie 18,17 8,08 2,83
Podlaskie 13,43 0,68 2,61
Pomorskie 6,89 4,21 4,42
Śląskie 14,66 4,42 3,30
Świętokrzyskie 11,66 2,31 0,91
Warmińsko-mazurskie 19,73 4,21 0,44
Wielkopolskie 8,53 6,82 2,70
Zachodniopomorskie 16,96 5,62 3,62
Education
Primary and below 8,79 4,79 2,66
Vocational 18,00 5,04 2,70
Secondary 16,23 4,40 2,64
Tertiary/post-secondary 13,47 2,70 0,76
Income per capita
First quartile 27,00 4,83 1,79
Middle 50% 13,25 5,55 2,62
Fourth quartile 7,36 2,82 2,31
Social-professional status
Public sector employees 17,83 0,59 0,48
Private sector employees 25,62 2,93 0,25
Self-employed 26,38 1,85 6,54
Farmers 19,91 1,07 5,38
Disability pensioners 6,69 12,27 1,81
Retirees 1,40 2,00 1,40
Students 4,57 0,60 3,98
Unemployed 58,21 11,47 3,02
Other professionally inactive 31,02 4,70 5,76
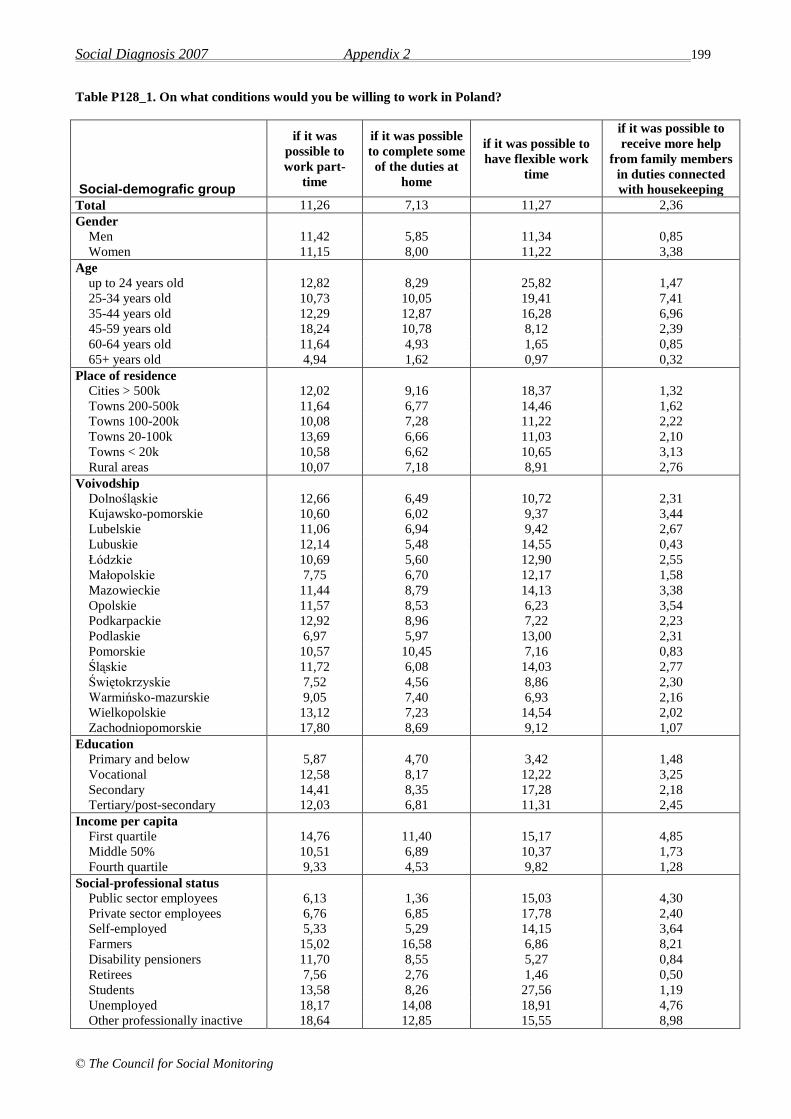
Social Diagnosis 2007 Appendix 2 199
© The Council for Social Monitoring
Table P128_1. On what conditions would you be willing to work in Poland?
Social-demografic group
if it was
possible to
work part-
time
if it was possible
to complete some
of the duties at
home
if it was possible to
have flexible work
time
if it was possible to
receive more help
from family members
in duties connected
with housekeeping
Total 11,26 7,13 11,27 2,36
Gender
Men 11,42 5,85 11,34 0,85
Women 11,15 8,00 11,22 3,38
Age
up to 24 years old 12,82 8,29 25,82 1,47
25-34 years old 10,73 10,05 19,41 7,41
35-44 years old 12,29 12,87 16,28 6,96
45-59 years old 18,24 10,78 8,12 2,39
60-64 years old 11,64 4,93 1,65 0,85
65+ years old 4,94 1,62 0,97 0,32
Place of residence
Cities > 500k 12,02 9,16 18,37 1,32
Towns 200-500k 11,64 6,77 14,46 1,62
Towns 100-200k 10,08 7,28 11,22 2,22
Towns 20-100k 13,69 6,66 11,03 2,10
Towns < 20k 10,58 6,62 10,65 3,13
Rural areas 10,07 7,18 8,91 2,76
Voivodship
Dolnośląskie 12,66 6,49 10,72 2,31
Kujawsko-pomorskie 10,60 6,02 9,37 3,44
Lubelskie 11,06 6,94 9,42 2,67
Lubuskie 12,14 5,48 14,55 0,43
Łódzkie 10,69 5,60 12,90 2,55
Małopolskie 7,75 6,70 12,17 1,58
Mazowieckie 11,44 8,79 14,13 3,38
Opolskie 11,57 8,53 6,23 3,54
Podkarpackie 12,92 8,96 7,22 2,23
Podlaskie 6,97 5,97 13,00 2,31
Pomorskie 10,57 10,45 7,16 0,83
Śląskie 11,72 6,08 14,03 2,77
Świętokrzyskie 7,52 4,56 8,86 2,30
Warmińsko-mazurskie 9,05 7,40 6,93 2,16
Wielkopolskie 13,12 7,23 14,54 2,02
Zachodniopomorskie 17,80 8,69 9,12 1,07
Education
Primary and below 5,87 4,70 3,42 1,48
Vocational 12,58 8,17 12,22 3,25
Secondary 14,41 8,35 17,28 2,18
Tertiary/post-secondary 12,03 6,81 11,31 2,45
Income per capita
First quartile 14,76 11,40 15,17 4,85
Middle 50% 10,51 6,89 10,37 1,73
Fourth quartile 9,33 4,53 9,82 1,28
Social-professional status
Public sector employees 6,13 1,36 15,03 4,30
Private sector employees 6,76 6,85 17,78 2,40
Self-employed 5,33 5,29 14,15 3,64
Farmers 15,02 16,58 6,86 8,21
Disability pensioners 11,70 8,55 5,27 0,84
Retirees 7,56 2,76 1,46 0,50
Students 13,58 8,26 27,56 1,19
Unemployed 18,17 14,08 18,91 4,76
Other professionally inactive 18,64 12,85 15,55 8,98

Social Diagnosis 2007 Appendix 2 200
© The Council for Social Monitoring
Table P128_2. On what conditions would you be willing to work in Poland?
Social-demografic group
if it was possible to
obtain proper care
for children or ill
persons
if it was possible to
maintain the right to
obtain social benefits
presently received
other I don’t want to
work at all
Total 3,52 7,01 19,39 35,03
Gender
Men 1,50 7,86 23,81 31,87
Women 4,88 6,43 16,42 37,16
Age
up to 24 years old 3,28 4,80 35,29 12,49
25-34 years old 12,11 5,01 31,48 4,87
35-44 years old 10,87 10,95 28,34 7,43
45-59 years old 1,94 13,14 20,02 25,98
60-64 years old 0,88 7,24 7,05 54,57
65+ years old 0,44 3,80 3,62 71,37
Place of residence
Cities > 500k 3,39 10,09 20,98 31,70
Towns 200-500k 3,84 7,64 24,13 23,54
Towns 100-200k 2,54 6,09 18,22 35,57
Towns 20-100k 3,91 7,89 18,70 36,92
Towns < 20k 3,99 6,37 19,61 35,73
Rural areas 3,26 5,98 18,03 38,15
Voivodship
Dolnośląskie 3,32 6,22 23,57 33,49
Kujawsko-pomorskie 3,14 3,50 16,48 21,68
Lubelskie 4,21 7,90 23,16 38,87
Lubuskie 4,39 9,40 25,40 24,24
Łódzkie 2,74 10,56 17,72 39,68
Małopolskie 3,26 4,73 15,06 44,37
Mazowieckie 4,93 9,26 22,53 33,50
Opolskie 3,95 7,45 16,32 33,99
Podkarpackie 3,51 7,62 20,38 35,55
Podlaskie 4,69 3,75 20,75 49,25
Pomorskie 3,35 5,94 12,80 34,80
Śląskie 3,47 6,82 19,83 35,90
Świętokrzyskie 1,40 4,94 13,47 31,26
Warmińsko-mazurskie 2,55 5,70 21,68 42,63
Wielkopolskie 3,54 8,17 19,61 35,09
Zachodniopomorskie 3,16 8,13 19,77 28,01
Education
Primary and below 2,18 5,94 9,37 57,85
Vocational 3,95 7,10 26,12 25,95
Secondary 3,83 7,94 22,01 26,45
Tertiary/post-secondary 4,65 6,81 17,16 29,12
Income per capita
First quartile 6,97 7,92 27,11 18,56
Middle 50% 3,00 7,68 19,30 37,72
Fourth quartile 1,68 5,73 13,19 44,91
Social-professional status
Public sector employees 6,57 6,37 23,13 3,00
Private sector employees 5,41 6,74 33,08 1,56
Self-employed 0,00 6,22 26,70 1,81
Farmers 3,56 4,48 30,79 12,13
Disability pensioners 1,66 12,79 14,45 45,62
Retirees 0,41 5,63 4,14 65,69
Students 1,77 4,05 36,72 14,03
Unemployed 8,26 10,24 35,59 6,84
Other professionally inactive 12,98 5,82 22,83 15,83

Social Diagnosis 2007 Appendix 2 201
© The Council for Social Monitoring
Table P129_1. How many hours did you spend using a computer last week?
Social-demografic group
up to 5 6-10 11-20 >20
Total 68,21 10,90 8,58 12,32
Gender
Men 65,69 10,87 9,55 13,89
Women 70,27 10,90 7,79 11,03
Age
up to 24 years old 38,12 22,01 19,19 20,67
25-34 years old 52,78 15,16 10,44 21,63
35-44 years old 67,61 10,83 8,00 13,56
45-59 years old 77,42 7,83 6,20 8,55
60-64 years old 90,64 4,35 3,18 1,84
65+ years old 97,92 0,79 0,89 0,40
Place of residence
Cities > 500k 49,71 12,00 11,21 27,07
Towns 200-500k 57,89 12,48 10,36 19,27
Towns 100-200k 62,42 11,88 9,66 16,04
Towns 20-100k 62,84 13,48 11,12 12,56
Towns < 20k 69,21 11,49 9,37 9,93
Rural areas 80,78 8,26 5,34 5,62
Voivodship
Dolnośląskie 65,87 12,57 10,28 11,28
Kujawsko-pomorskie 71,98 10,06 7,89 10,06
Lubelskie 73,11 7,97 8,65 10,27
Lubuskie 71,51 8,14 8,14 12,21
Łódzkie 71,05 9,42 8,37 11,16
Małopolskie 66,83 11,92 8,48 12,77
Mazowieckie 65,29 10,21 7,73 16,77
Opolskie 69,23 10,54 9,40 10,83
Podkarpackie 70,19 10,73 8,79 10,28
Podlaskie 68,46 11,00 10,51 10,02
Pomorskie 58,67 13,96 11,14 16,22
Śląskie 65,70 11,47 9,38 13,45
Świętokrzyskie 73,20 11,91 5,96 8,93
Warmińsko-mazurskie 78,83 7,86 7,06 6,25
Wielkopolskie 66,27 12,31 7,84 13,58
Zachodniopomorskie 73,38 10,86 6,48 9,28
Education
Primary and below 96,32 1,86 1,20 0,62
Vocational 76,92 10,12 7,49 5,47
Secondary 60,89 13,79 11,04 14,29
Tertiary/post-secondary 39,00 15,94 13,26 31,80
Income per capita
First quartile 80,34 9,92 5,95 3,79
Middle 50% 72,05 9,91 8,07 9,97
Fourth quartile 56,61 11,95 11,03 20,41
Social-professional status
Public sector employees 48,99 15,24 13,06 22,70
Private sector employees 58,11 12,35 8,99 20,55
Self-employed 49,82 15,76 15,76 18,66
Farmers 91,93 4,66 2,80 0,62
Disability pensioners 89,59 4,16 2,87 3,37
Retirees 94,61 2,54 1,73 1,12
Students 28,74 26,60 23,14 21,52
Unemployed 82,23 7,63 4,90 5,24
Other professionally
inactive 80,21 9,90 5,64 4,26
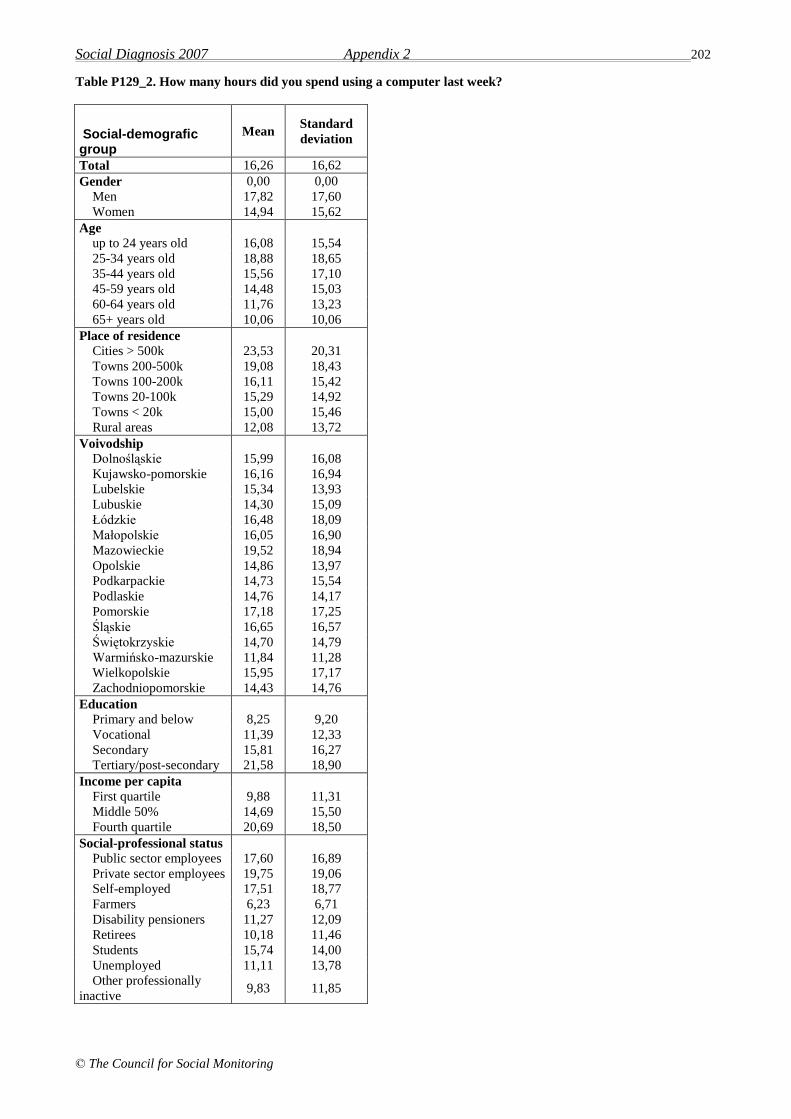
Social Diagnosis 2007 Appendix 2 202
© The Council for Social Monitoring
Table P129_2. How many hours did you spend using a computer last week?
Social-demografic group
Mean Standard
deviation
Total 16,26 16,62
Gender 0,00 0,00
Men 17,82 17,60
Women 14,94 15,62
Age
up to 24 years old 16,08 15,54
25-34 years old 18,88 18,65
35-44 years old 15,56 17,10
45-59 years old 14,48 15,03
60-64 years old 11,76 13,23
65+ years old 10,06 10,06
Place of residence
Cities > 500k 23,53 20,31
Towns 200-500k 19,08 18,43
Towns 100-200k 16,11 15,42
Towns 20-100k 15,29 14,92
Towns < 20k 15,00 15,46
Rural areas 12,08 13,72
Voivodship
Dolnośląskie 15,99 16,08
Kujawsko-pomorskie 16,16 16,94
Lubelskie 15,34 13,93
Lubuskie 14,30 15,09
Łódzkie 16,48 18,09
Małopolskie 16,05 16,90
Mazowieckie 19,52 18,94
Opolskie 14,86 13,97
Podkarpackie 14,73 15,54
Podlaskie 14,76 14,17
Pomorskie 17,18 17,25
Śląskie 16,65 16,57
Świętokrzyskie 14,70 14,79
Warmińsko-mazurskie 11,84 11,28
Wielkopolskie 15,95 17,17
Zachodniopomorskie 14,43 14,76
Education
Primary and below 8,25 9,20
Vocational 11,39 12,33
Secondary 15,81 16,27
Tertiary/post-secondary 21,58 18,90
Income per capita
First quartile 9,88 11,31
Middle 50% 14,69 15,50
Fourth quartile 20,69 18,50
Social-professional status
Public sector employees 17,60 16,89
Private sector employees 19,75 19,06
Self-employed 17,51 18,77
Farmers 6,23 6,71
Disability pensioners 11,27 12,09
Retirees 10,18 11,46
Students 15,74 14,00
Unemployed 11,11 13,78
Other professionally
inactive 9,83 11,85
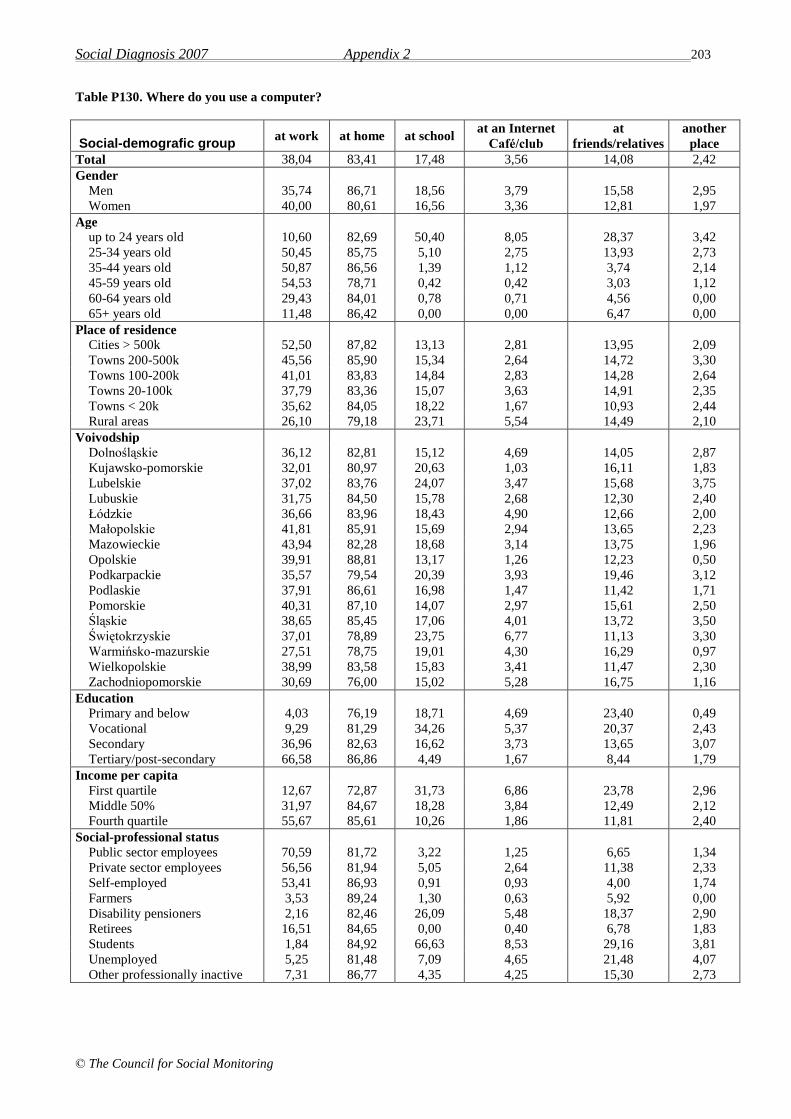
Social Diagnosis 2007 Appendix 2 203
© The Council for Social Monitoring
Table P130. Where do you use a computer?
Social-demografic group at work at home at school
at an Internet
Café/club
at
friends/relatives
another
place
Total 38,04 83,41 17,48 3,56 14,08 2,42
Gender
Men 35,74 86,71 18,56 3,79 15,58 2,95
Women 40,00 80,61 16,56 3,36 12,81 1,97
Age
up to 24 years old 10,60 82,69 50,40 8,05 28,37 3,42
25-34 years old 50,45 85,75 5,10 2,75 13,93 2,73
35-44 years old 50,87 86,56 1,39 1,12 3,74 2,14
45-59 years old 54,53 78,71 0,42 0,42 3,03 1,12
60-64 years old 29,43 84,01 0,78 0,71 4,56 0,00
65+ years old 11,48 86,42 0,00 0,00 6,47 0,00
Place of residence
Cities > 500k 52,50 87,82 13,13 2,81 13,95 2,09
Towns 200-500k 45,56 85,90 15,34 2,64 14,72 3,30
Towns 100-200k 41,01 83,83 14,84 2,83 14,28 2,64
Towns 20-100k 37,79 83,36 15,07 3,63 14,91 2,35
Towns < 20k 35,62 84,05 18,22 1,67 10,93 2,44
Rural areas 26,10 79,18 23,71 5,54 14,49 2,10
Voivodship
Dolnośląskie 36,12 82,81 15,12 4,69 14,05 2,87
Kujawsko-pomorskie 32,01 80,97 20,63 1,03 16,11 1,83
Lubelskie 37,02 83,76 24,07 3,47 15,68 3,75
Lubuskie 31,75 84,50 15,78 2,68 12,30 2,40
Łódzkie 36,66 83,96 18,43 4,90 12,66 2,00
Małopolskie 41,81 85,91 15,69 2,94 13,65 2,23
Mazowieckie 43,94 82,28 18,68 3,14 13,75 1,96
Opolskie 39,91 88,81 13,17 1,26 12,23 0,50
Podkarpackie 35,57 79,54 20,39 3,93 19,46 3,12
Podlaskie 37,91 86,61 16,98 1,47 11,42 1,71
Pomorskie 40,31 87,10 14,07 2,97 15,61 2,50
Śląskie 38,65 85,45 17,06 4,01 13,72 3,50
Świętokrzyskie 37,01 78,89 23,75 6,77 11,13 3,30
Warmińsko-mazurskie 27,51 78,75 19,01 4,30 16,29 0,97
Wielkopolskie 38,99 83,58 15,83 3,41 11,47 2,30
Zachodniopomorskie 30,69 76,00 15,02 5,28 16,75 1,16
Education
Primary and below 4,03 76,19 18,71 4,69 23,40 0,49
Vocational 9,29 81,29 34,26 5,37 20,37 2,43
Secondary 36,96 82,63 16,62 3,73 13,65 3,07
Tertiary/post-secondary 66,58 86,86 4,49 1,67 8,44 1,79
Income per capita
First quartile 12,67 72,87 31,73 6,86 23,78 2,96
Middle 50% 31,97 84,67 18,28 3,84 12,49 2,12
Fourth quartile 55,67 85,61 10,26 1,86 11,81 2,40
Social-professional status
Public sector employees 70,59 81,72 3,22 1,25 6,65 1,34
Private sector employees 56,56 81,94 5,05 2,64 11,38 2,33
Self-employed 53,41 86,93 0,91 0,93 4,00 1,74
Farmers 3,53 89,24 1,30 0,63 5,92 0,00
Disability pensioners 2,16 82,46 26,09 5,48 18,37 2,90
Retirees 16,51 84,65 0,00 0,40 6,78 1,83
Students 1,84 84,92 66,63 8,53 29,16 3,81
Unemployed 5,25 81,48 7,09 4,65 21,48 4,07
Other professionally inactive 7,31 86,77 4,35 4,25 15,30 2,73

Social Diagnosis 2007 Appendix 2 204
© The Council for Social Monitoring
Table P131_1. Do you perform the following actions while using the computer?
Social-demografic group
copying or moving
a file or folder
using copy, cut, and
paste in order to
reproduce or move
selected fragments of a
document
using basic mathematic
functions in spreadsheet
Total 74,06 67,44 40,93
Gender
Men 76,14 68,66 43,41
Women 72,27 66,40 38,78
Age
up to 24 years old 86,20 80,83 47,86
25-34 years old 78,00 69,97 45,31
35-44 years old 66,90 60,54 35,52
45-59 years old 59,91 52,73 31,10
60-64 years old 55,76 49,05 34,16
65+ years old 41,57 39,46 17,70
Place of residence
Cities > 500k 82,21 76,50 48,53
Towns 200-500k 78,73 73,14 45,49
Towns 100-200k 74,99 68,60 42,44
Towns 20-100k 70,75 63,32 38,38
Towns < 20k 73,31 67,59 37,90
Rural areas 69,70 62,22 37,14
Voivodship
Dolnośląskie 71,36 64,70 39,44
Kujawsko-pomorskie 71,20 65,93 38,76
Lubelskie 78,75 71,98 44,73
Lubuskie 70,19 66,17 32,95
Łódzkie 77,36 71,00 41,56
Małopolskie 76,98 68,70 40,92
Mazowieckie 77,73 71,45 44,52
Opolskie 75,50 65,37 39,88
Podkarpackie 75,02 68,10 42,15
Podlaskie 74,64 70,07 40,96
Pomorskie 69,65 65,57 44,12
Śląskie 74,17 66,43 43,84
Świętokrzyskie 69,68 63,10 35,64
Warmińsko-mazurskie 66,47 62,05 30,74
Wielkopolskie 73,95 65,37 39,25
Zachodniopomorskie 68,92 64,54 32,99
Education
Primary and below 53,67 42,00 19,44
Vocational 67,45 59,82 33,56
Secondary 71,54 63,95 39,53
Tertiary/post-secondary 84,32 80,19 50,69
Income per capita
First quartile 67,82 62,33 36,16
Middle 50% 71,51 64,10 38,04
Fourth quartile 79,49 73,21 45,82
Social-professional status
Public sector employees 75,14 69,74 40,72
Private sector employees 74,35 66,63 44,73
Self-employed 71,75 64,15 43,11
Farmers 47,05 37,83 18,38
Disability pensioners 66,09 59,00 34,43
Retirees 49,83 43,47 22,13
Students 88,95 84,39 51,79
Unemployed 58,39 50,96 20,59
Other professionally inactive 63,36 52,31 23,41

Social Diagnosis 2007 Appendix 2 205
© The Council for Social Monitoring
Table P131_2. Do you perform the following actions while using the computer?
Social-demografic group
preparing an electronic
presentation
installing new
devices (printer,
modem, scanner
etc.)
sending an email with
attachments
(documents, graphic
files)
Total 23,62 41,47 64,68
Gender
Men 26,53 55,46 65,89
Women 21,10 29,39 63,64
Age
up to 24 years old 37,01 50,32 71,11
25-34 years old 23,32 47,21 69,89
35-44 years old 16,05 35,64 56,80
45-59 years old 11,06 27,44 55,76
60-64 years old 13,74 30,07 58,93
65+ years old 12,91 20,62 55,37
Place of residence
Cities > 500k 30,71 46,38 79,46
Towns 200-500k 25,32 45,25 72,46
Towns 100-200k 25,46 43,27 71,34
Towns 20-100k 23,26 41,16 63,89
Towns < 20k 22,99 41,91 65,46
Rural areas 18,55 36,05 49,88
Voivodship
Dolnośląskie 20,59 40,17 64,21
Kujawsko-pomorskie 21,81 38,89 56,46
Lubelskie 25,93 41,62 62,76
Lubuskie 19,87 41,05 64,18
Łódzkie 26,17 43,55 65,33
Małopolskie 24,48 41,91 70,01
Mazowieckie 25,17 42,13 67,30
Opolskie 21,96 46,23 61,98
Podkarpackie 24,00 38,07 59,19
Podlaskie 23,23 47,76 68,79
Pomorskie 23,81 45,72 70,66
Śląskie 26,37 44,46 67,50
Świętokrzyskie 16,53 36,30 55,67
Warmińsko-mazurskie 21,10 38,46 63,31
Wielkopolskie 22,45 37,05 59,67
Zachodniopomorskie 21,35 36,05 60,38
Education
Primary and below 11,35 24,93 35,93
Vocational 23,84 38,80 51,71
Secondary 21,02 41,34 63,15
Tertiary/post-secondary 27,76 45,37 79,70
Income per capita
First quartile 23,52 34,88 46,69
Middle 50% 20,79 40,20 60,66
Fourth quartile 26,09 46,17 76,12
Social-professional status
Public sector employees 19,25 37,22 65,62
Private sector employees 20,80 44,00 66,84
Self-employed 23,67 51,19 73,05
Farmers 4,88 25,43 28,24
Disability pensioners 22,53 36,05 57,93
Retirees 7,50 24,16 52,14
Students 42,77 51,52 73,27
Unemployed 12,52 31,41 46,55
Other professionally inactive 13,49 27,52 52,19
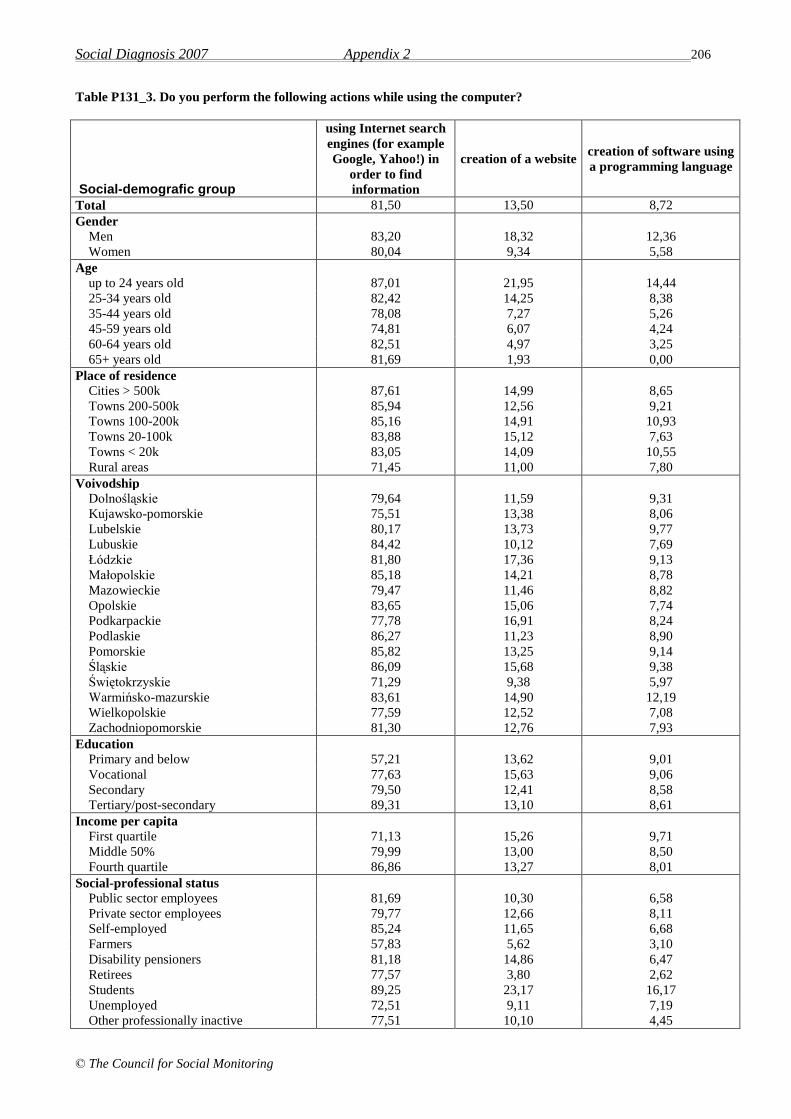
Social Diagnosis 2007 Appendix 2 206
© The Council for Social Monitoring
Table P131_3. Do you perform the following actions while using the computer?
Social-demografic group
using Internet search
engines (for example
Google, Yahoo!) in
order to find
information
creation of a website creation of software using
a programming language
Total 81,50 13,50 8,72
Gender
Men 83,20 18,32 12,36
Women 80,04 9,34 5,58
Age
up to 24 years old 87,01 21,95 14,44
25-34 years old 82,42 14,25 8,38
35-44 years old 78,08 7,27 5,26
45-59 years old 74,81 6,07 4,24
60-64 years old 82,51 4,97 3,25
65+ years old 81,69 1,93 0,00
Place of residence
Cities > 500k 87,61 14,99 8,65
Towns 200-500k 85,94 12,56 9,21
Towns 100-200k 85,16 14,91 10,93
Towns 20-100k 83,88 15,12 7,63
Towns < 20k 83,05 14,09 10,55
Rural areas 71,45 11,00 7,80
Voivodship
Dolnośląskie 79,64 11,59 9,31
Kujawsko-pomorskie 75,51 13,38 8,06
Lubelskie 80,17 13,73 9,77
Lubuskie 84,42 10,12 7,69
Łódzkie 81,80 17,36 9,13
Małopolskie 85,18 14,21 8,78
Mazowieckie 79,47 11,46 8,82
Opolskie 83,65 15,06 7,74
Podkarpackie 77,78 16,91 8,24
Podlaskie 86,27 11,23 8,90
Pomorskie 85,82 13,25 9,14
Śląskie 86,09 15,68 9,38
Świętokrzyskie 71,29 9,38 5,97
Warmińsko-mazurskie 83,61 14,90 12,19
Wielkopolskie 77,59 12,52 7,08
Zachodniopomorskie 81,30 12,76 7,93
Education
Primary and below 57,21 13,62 9,01
Vocational 77,63 15,63 9,06
Secondary 79,50 12,41 8,58
Tertiary/post-secondary 89,31 13,10 8,61
Income per capita
First quartile 71,13 15,26 9,71
Middle 50% 79,99 13,00 8,50
Fourth quartile 86,86 13,27 8,01
Social-professional status
Public sector employees 81,69 10,30 6,58
Private sector employees 79,77 12,66 8,11
Self-employed 85,24 11,65 6,68
Farmers 57,83 5,62 3,10
Disability pensioners 81,18 14,86 6,47
Retirees 77,57 3,80 2,62
Students 89,25 23,17 16,17
Unemployed 72,51 9,11 7,19
Other professionally inactive 77,51 10,10 4,45
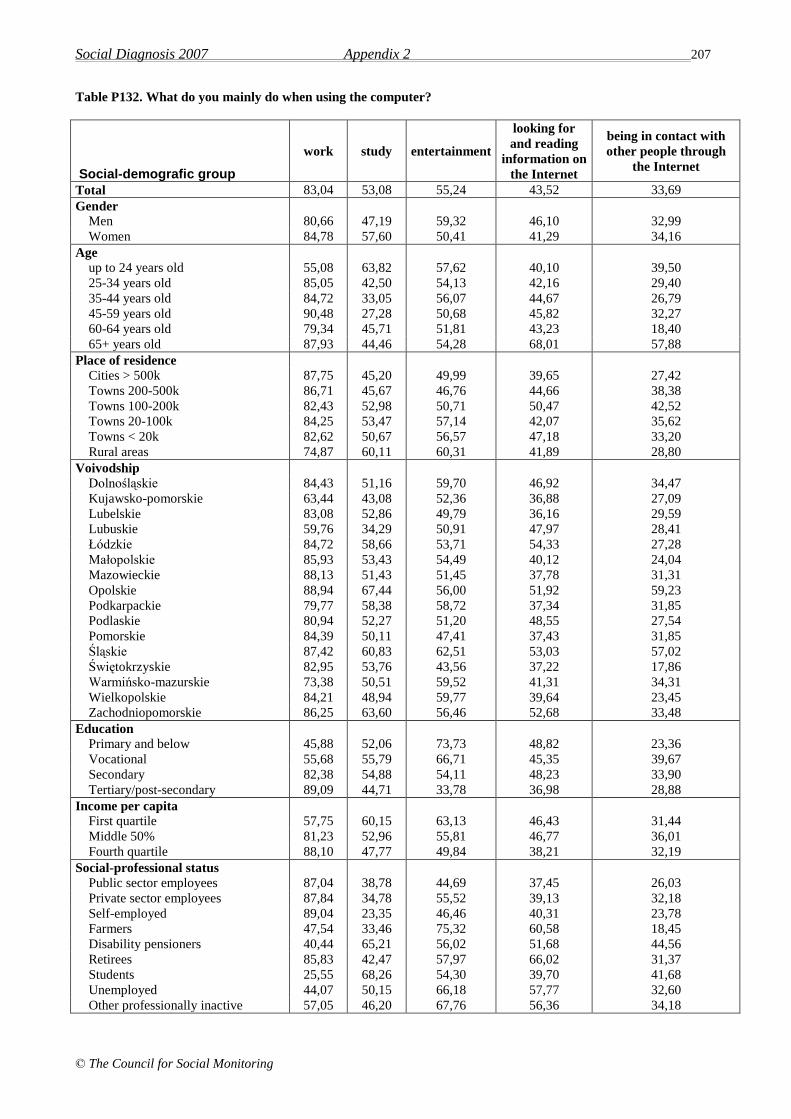
Social Diagnosis 2007 Appendix 2 207
© The Council for Social Monitoring
Table P132. What do you mainly do when using the computer?
Social-demografic group
work study entertainment
looking for
and reading
information on
the Internet
being in contact with
other people through
the Internet
Total 83,04 53,08 55,24 43,52 33,69
Gender
Men 80,66 47,19 59,32 46,10 32,99
Women 84,78 57,60 50,41 41,29 34,16
Age
up to 24 years old 55,08 63,82 57,62 40,10 39,50
25-34 years old 85,05 42,50 54,13 42,16 29,40
35-44 years old 84,72 33,05 56,07 44,67 26,79
45-59 years old 90,48 27,28 50,68 45,82 32,27
60-64 years old 79,34 45,71 51,81 43,23 18,40
65+ years old 87,93 44,46 54,28 68,01 57,88
Place of residence
Cities > 500k 87,75 45,20 49,99 39,65 27,42
Towns 200-500k 86,71 45,67 46,76 44,66 38,38
Towns 100-200k 82,43 52,98 50,71 50,47 42,52
Towns 20-100k 84,25 53,47 57,14 42,07 35,62
Towns < 20k 82,62 50,67 56,57 47,18 33,20
Rural areas 74,87 60,11 60,31 41,89 28,80
Voivodship
Dolnośląskie 84,43 51,16 59,70 46,92 34,47
Kujawsko-pomorskie 63,44 43,08 52,36 36,88 27,09
Lubelskie 83,08 52,86 49,79 36,16 29,59
Lubuskie 59,76 34,29 50,91 47,97 28,41
Łódzkie 84,72 58,66 53,71 54,33 27,28
Małopolskie 85,93 53,43 54,49 40,12 24,04
Mazowieckie 88,13 51,43 51,45 37,78 31,31
Opolskie 88,94 67,44 56,00 51,92 59,23
Podkarpackie 79,77 58,38 58,72 37,34 31,85
Podlaskie 80,94 52,27 51,20 48,55 27,54
Pomorskie 84,39 50,11 47,41 37,43 31,85
Śląskie 87,42 60,83 62,51 53,03 57,02
Świętokrzyskie 82,95 53,76 43,56 37,22 17,86
Warmińsko-mazurskie 73,38 50,51 59,52 41,31 34,31
Wielkopolskie 84,21 48,94 59,77 39,64 23,45
Zachodniopomorskie 86,25 63,60 56,46 52,68 33,48
Education
Primary and below 45,88 52,06 73,73 48,82 23,36
Vocational 55,68 55,79 66,71 45,35 39,67
Secondary 82,38 54,88 54,11 48,23 33,90
Tertiary/post-secondary 89,09 44,71 33,78 36,98 28,88
Income per capita
First quartile 57,75 60,15 63,13 46,43 31,44
Middle 50% 81,23 52,96 55,81 46,77 36,01
Fourth quartile 88,10 47,77 49,84 38,21 32,19
Social-professional status
Public sector employees 87,04 38,78 44,69 37,45 26,03
Private sector employees 87,84 34,78 55,52 39,13 32,18
Self-employed 89,04 23,35 46,46 40,31 23,78
Farmers 47,54 33,46 75,32 60,58 18,45
Disability pensioners 40,44 65,21 56,02 51,68 44,56
Retirees 85,83 42,47 57,97 66,02 31,37
Students 25,55 68,26 54,30 39,70 41,68
Unemployed 44,07 50,15 66,18 57,77 32,60
Other professionally inactive 57,05 46,20 67,76 56,36 34,18
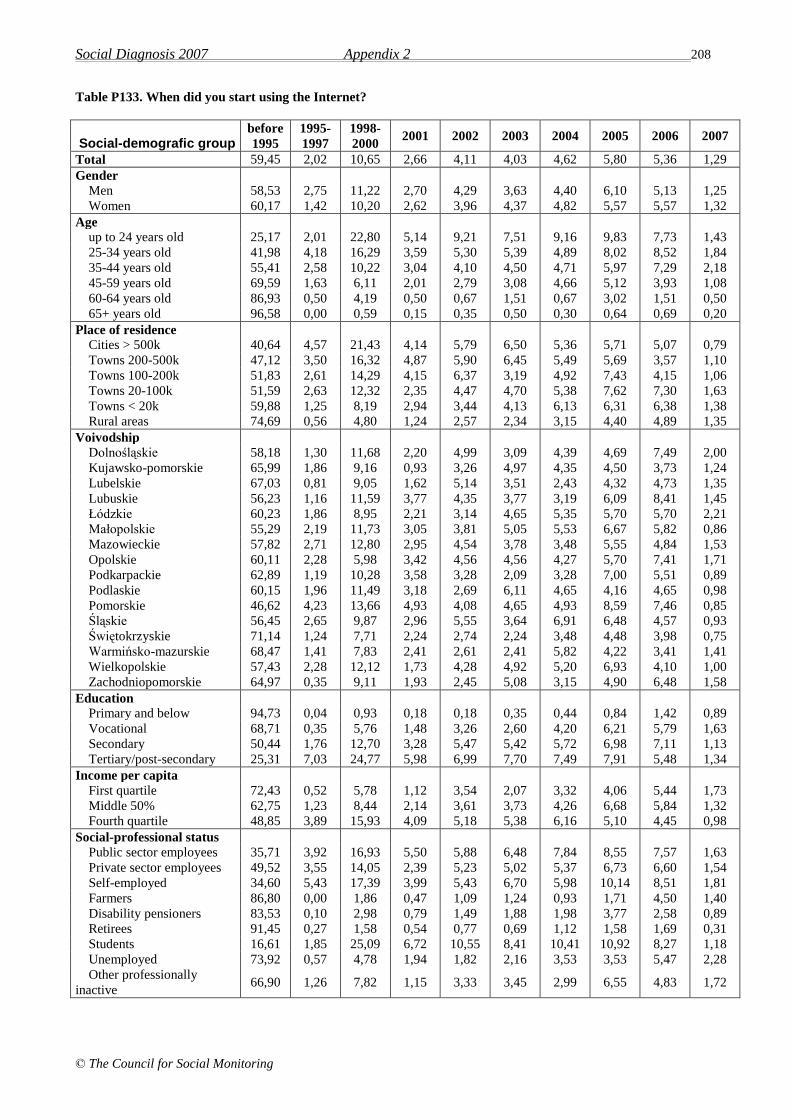
Social Diagnosis 2007 Appendix 2 208
© The Council for Social Monitoring
Table P133. When did you start using the Internet?
Social-demografic group before
1995
1995-
1997
1998-
2000 2001 2002 2003 2004 2005 2006 2007
Total 59,45 2,02 10,65 2,66 4,11 4,03 4,62 5,80 5,36 1,29
Gender
Men 58,53 2,75 11,22 2,70 4,29 3,63 4,40 6,10 5,13 1,25
Women 60,17 1,42 10,20 2,62 3,96 4,37 4,82 5,57 5,57 1,32
Age
up to 24 years old 25,17 2,01 22,80 5,14 9,21 7,51 9,16 9,83 7,73 1,43
25-34 years old 41,98 4,18 16,29 3,59 5,30 5,39 4,89 8,02 8,52 1,84
35-44 years old 55,41 2,58 10,22 3,04 4,10 4,50 4,71 5,97 7,29 2,18
45-59 years old 69,59 1,63 6,11 2,01 2,79 3,08 4,66 5,12 3,93 1,08
60-64 years old 86,93 0,50 4,19 0,50 0,67 1,51 0,67 3,02 1,51 0,50
65+ years old 96,58 0,00 0,59 0,15 0,35 0,50 0,30 0,64 0,69 0,20
Place of residence
Cities > 500k 40,64 4,57 21,43 4,14 5,79 6,50 5,36 5,71 5,07 0,79
Towns 200-500k 47,12 3,50 16,32 4,87 5,90 6,45 5,49 5,69 3,57 1,10
Towns 100-200k 51,83 2,61 14,29 4,15 6,37 3,19 4,92 7,43 4,15 1,06
Towns 20-100k 51,59 2,63 12,32 2,35 4,47 4,70 5,38 7,62 7,30 1,63
Towns < 20k 59,88 1,25 8,19 2,94 3,44 4,13 6,13 6,31 6,38 1,38
Rural areas 74,69 0,56 4,80 1,24 2,57 2,34 3,15 4,40 4,89 1,35
Voivodship
Dolnośląskie 58,18 1,30 11,68 2,20 4,99 3,09 4,39 4,69 7,49 2,00
Kujawsko-pomorskie 65,99 1,86 9,16 0,93 3,26 4,97 4,35 4,50 3,73 1,24
Lubelskie 67,03 0,81 9,05 1,62 5,14 3,51 2,43 4,32 4,73 1,35
Lubuskie 56,23 1,16 11,59 3,77 4,35 3,77 3,19 6,09 8,41 1,45
Łódzkie 60,23 1,86 8,95 2,21 3,14 4,65 5,35 5,70 5,70 2,21
Małopolskie 55,29 2,19 11,73 3,05 3,81 5,05 5,53 6,67 5,82 0,86
Mazowieckie 57,82 2,71 12,80 2,95 4,54 3,78 3,48 5,55 4,84 1,53
Opolskie 60,11 2,28 5,98 3,42 4,56 4,56 4,27 5,70 7,41 1,71
Podkarpackie 62,89 1,19 10,28 3,58 3,28 2,09 3,28 7,00 5,51 0,89
Podlaskie 60,15 1,96 11,49 3,18 2,69 6,11 4,65 4,16 4,65 0,98
Pomorskie 46,62 4,23 13,66 4,93 4,08 4,65 4,93 8,59 7,46 0,85
Śląskie 56,45 2,65 9,87 2,96 5,55 3,64 6,91 6,48 4,57 0,93
Świętokrzyskie 71,14 1,24 7,71 2,24 2,74 2,24 3,48 4,48 3,98 0,75
Warmińsko-mazurskie 68,47 1,41 7,83 2,41 2,61 2,41 5,82 4,22 3,41 1,41
Wielkopolskie 57,43 2,28 12,12 1,73 4,28 4,92 5,20 6,93 4,10 1,00
Zachodniopomorskie 64,97 0,35 9,11 1,93 2,45 5,08 3,15 4,90 6,48 1,58
Education
Primary and below 94,73 0,04 0,93 0,18 0,18 0,35 0,44 0,84 1,42 0,89
Vocational 68,71 0,35 5,76 1,48 3,26 2,60 4,20 6,21 5,79 1,63
Secondary 50,44 1,76 12,70 3,28 5,47 5,42 5,72 6,98 7,11 1,13
Tertiary/post-secondary 25,31 7,03 24,77 5,98 6,99 7,70 7,49 7,91 5,48 1,34
Income per capita
First quartile 72,43 0,52 5,78 1,12 3,54 2,07 3,32 4,06 5,44 1,73
Middle 50% 62,75 1,23 8,44 2,14 3,61 3,73 4,26 6,68 5,84 1,32
Fourth quartile 48,85 3,89 15,93 4,09 5,18 5,38 6,16 5,10 4,45 0,98
Social-professional status
Public sector employees 35,71 3,92 16,93 5,50 5,88 6,48 7,84 8,55 7,57 1,63
Private sector employees 49,52 3,55 14,05 2,39 5,23 5,02 5,37 6,73 6,60 1,54
Self-employed 34,60 5,43 17,39 3,99 5,43 6,70 5,98 10,14 8,51 1,81
Farmers 86,80 0,00 1,86 0,47 1,09 1,24 0,93 1,71 4,50 1,40
Disability pensioners 83,53 0,10 2,98 0,79 1,49 1,88 1,98 3,77 2,58 0,89
Retirees 91,45 0,27 1,58 0,54 0,77 0,69 1,12 1,58 1,69 0,31
Students 16,61 1,85 25,09 6,72 10,55 8,41 10,41 10,92 8,27 1,18
Unemployed 73,92 0,57 4,78 1,94 1,82 2,16 3,53 3,53 5,47 2,28
Other professionally
inactive 66,90 1,26 7,82 1,15 3,33 3,45 2,99 6,55 4,83 1,72
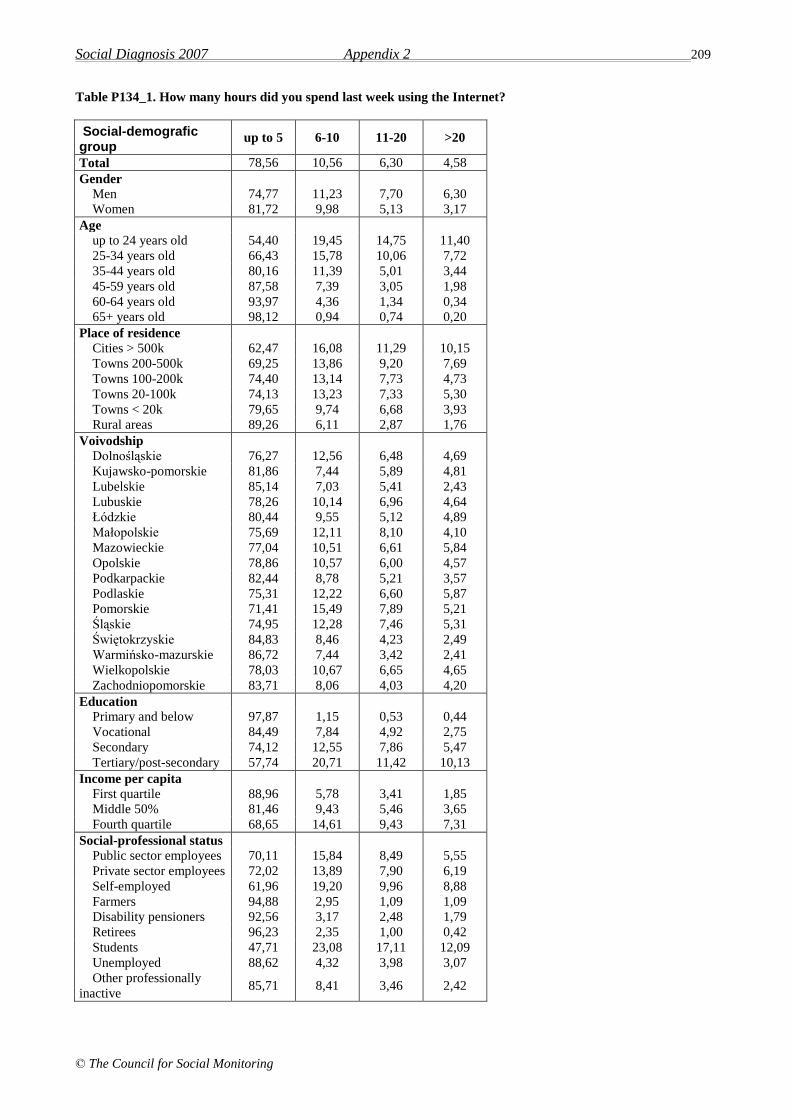
Social Diagnosis 2007 Appendix 2 209
© The Council for Social Monitoring
Table P134_1. How many hours did you spend last week using the Internet?
Social-demografic group
up to 5 6-10 11-20 >20
Total 78,56 10,56 6,30 4,58
Gender
Men 74,77 11,23 7,70 6,30
Women 81,72 9,98 5,13 3,17
Age
up to 24 years old 54,40 19,45 14,75 11,40
25-34 years old 66,43 15,78 10,06 7,72
35-44 years old 80,16 11,39 5,01 3,44
45-59 years old 87,58 7,39 3,05 1,98
60-64 years old 93,97 4,36 1,34 0,34
65+ years old 98,12 0,94 0,74 0,20
Place of residence
Cities > 500k 62,47 16,08 11,29 10,15
Towns 200-500k 69,25 13,86 9,20 7,69
Towns 100-200k 74,40 13,14 7,73 4,73
Towns 20-100k 74,13 13,23 7,33 5,30
Towns < 20k 79,65 9,74 6,68 3,93
Rural areas 89,26 6,11 2,87 1,76
Voivodship
Dolnośląskie 76,27 12,56 6,48 4,69
Kujawsko-pomorskie 81,86 7,44 5,89 4,81
Lubelskie 85,14 7,03 5,41 2,43
Lubuskie 78,26 10,14 6,96 4,64
Łódzkie 80,44 9,55 5,12 4,89
Małopolskie 75,69 12,11 8,10 4,10
Mazowieckie 77,04 10,51 6,61 5,84
Opolskie 78,86 10,57 6,00 4,57
Podkarpackie 82,44 8,78 5,21 3,57
Podlaskie 75,31 12,22 6,60 5,87
Pomorskie 71,41 15,49 7,89 5,21
Śląskie 74,95 12,28 7,46 5,31
Świętokrzyskie 84,83 8,46 4,23 2,49
Warmińsko-mazurskie 86,72 7,44 3,42 2,41
Wielkopolskie 78,03 10,67 6,65 4,65
Zachodniopomorskie 83,71 8,06 4,03 4,20
Education
Primary and below 97,87 1,15 0,53 0,44
Vocational 84,49 7,84 4,92 2,75
Secondary 74,12 12,55 7,86 5,47
Tertiary/post-secondary 57,74 20,71 11,42 10,13
Income per capita
First quartile 88,96 5,78 3,41 1,85
Middle 50% 81,46 9,43 5,46 3,65
Fourth quartile 68,65 14,61 9,43 7,31
Social-professional status
Public sector employees 70,11 15,84 8,49 5,55
Private sector employees 72,02 13,89 7,90 6,19
Self-employed 61,96 19,20 9,96 8,88
Farmers 94,88 2,95 1,09 1,09
Disability pensioners 92,56 3,17 2,48 1,79
Retirees 96,23 2,35 1,00 0,42
Students 47,71 23,08 17,11 12,09
Unemployed 88,62 4,32 3,98 3,07
Other professionally
inactive 85,71 8,41 3,46 2,42

Social Diagnosis 2007 Appendix 2 210
© The Council for Social Monitoring
Table P134_2. How many hours did you spend last week using the Internet?
Social-demografic group
Mean Standard
deviation
Total 10,37 12,07
Gender 0,00 0,00
Men 12,27 13,25
Women 8,71 10,66
Age
up to 24 years old 12,32 13,17
25-34 years old 11,59 13,09
35-44 years old 8,25 9,74
45-59 years old 7,79 10,14
60-64 years old 6,47 6,65
65+ years old 8,59 8,02
Place of residence
Cities > 500k 13,55 14,80
Towns 200-500k 11,54 12,35
Towns 100-200k 9,77 11,02
Towns 20-100k 10,21 11,66
Towns < 20k 9,95 11,61
Rural areas 7,95 10,02
Voivodship
Dolnośląskie 10,98 12,99
Kujawsko-pomorskie 11,83 14,29
Lubelskie 8,15 8,71
Lubuskie 9,71 11,04
Łódzkie 10,20 12,64
Małopolskie 10,57 12,84
Mazowieckie 11,71 13,80
Opolskie 9,72 10,83
Podkarpackie 9,37 12,14
Podlaskie 11,35 11,65
Pomorskie 9,72 11,10
Śląskie 10,86 11,52
Świętokrzyskie 9,00 9,09
Warmińsko-mazurskie 7,97 8,01
Wielkopolskie 9,98 11,56
Zachodniopomorskie 9,58 11,20
Education
Primary and below 7,75 9,15
Vocational 9,22 10,75
Secondary 10,53 12,45
Tertiary/post-secondary 11,17 12,60
Income per capita
First quartile 7,84 9,80
Middle 50% 9,67 11,75
Fourth quartile 12,05 12,91
Social-professional status
Public sector employees 8,94 10,85
Private sector employees 11,36 13,36
Self-employed 11,24 12,60
Farmers 7,79 9,72
Disability pensioners 9,13 10,95
Retirees 7,18 8,18
Students 12,04 12,20
Unemployed 9,82 13,63
Other professionally
inactive 7,69 8,85
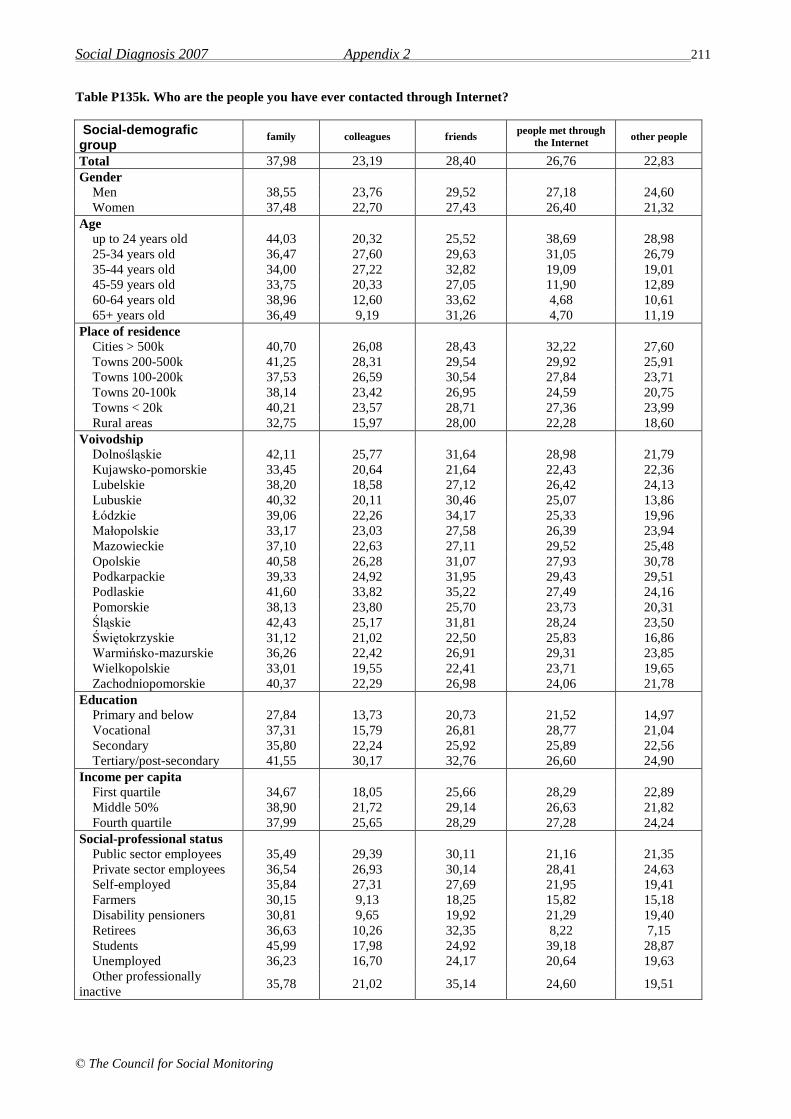
Social Diagnosis 2007 Appendix 2 211
© The Council for Social Monitoring
Table P135k. Who are the people you have ever contacted through Internet?
Social-demografic group
family colleagues friends people met through
the Internet other people
Total 37,98 23,19 28,40 26,76 22,83
Gender
Men 38,55 23,76 29,52 27,18 24,60
Women 37,48 22,70 27,43 26,40 21,32
Age
up to 24 years old 44,03 20,32 25,52 38,69 28,98
25-34 years old 36,47 27,60 29,63 31,05 26,79
35-44 years old 34,00 27,22 32,82 19,09 19,01
45-59 years old 33,75 20,33 27,05 11,90 12,89
60-64 years old 38,96 12,60 33,62 4,68 10,61
65+ years old 36,49 9,19 31,26 4,70 11,19
Place of residence
Cities > 500k 40,70 26,08 28,43 32,22 27,60
Towns 200-500k 41,25 28,31 29,54 29,92 25,91
Towns 100-200k 37,53 26,59 30,54 27,84 23,71
Towns 20-100k 38,14 23,42 26,95 24,59 20,75
Towns < 20k 40,21 23,57 28,71 27,36 23,99
Rural areas 32,75 15,97 28,00 22,28 18,60
Voivodship
Dolnośląskie 42,11 25,77 31,64 28,98 21,79
Kujawsko-pomorskie 33,45 20,64 21,64 22,43 22,36
Lubelskie 38,20 18,58 27,12 26,42 24,13
Lubuskie 40,32 20,11 30,46 25,07 13,86
Łódzkie 39,06 22,26 34,17 25,33 19,96
Małopolskie 33,17 23,03 27,58 26,39 23,94
Mazowieckie 37,10 22,63 27,11 29,52 25,48
Opolskie 40,58 26,28 31,07 27,93 30,78
Podkarpackie 39,33 24,92 31,95 29,43 29,51
Podlaskie 41,60 33,82 35,22 27,49 24,16
Pomorskie 38,13 23,80 25,70 23,73 20,31
Śląskie 42,43 25,17 31,81 28,24 23,50
Świętokrzyskie 31,12 21,02 22,50 25,83 16,86
Warmińsko-mazurskie 36,26 22,42 26,91 29,31 23,85
Wielkopolskie 33,01 19,55 22,41 23,71 19,65
Zachodniopomorskie 40,37 22,29 26,98 24,06 21,78
Education
Primary and below 27,84 13,73 20,73 21,52 14,97
Vocational 37,31 15,79 26,81 28,77 21,04
Secondary 35,80 22,24 25,92 25,89 22,56
Tertiary/post-secondary 41,55 30,17 32,76 26,60 24,90
Income per capita
First quartile 34,67 18,05 25,66 28,29 22,89
Middle 50% 38,90 21,72 29,14 26,63 21,82
Fourth quartile 37,99 25,65 28,29 27,28 24,24
Social-professional status
Public sector employees 35,49 29,39 30,11 21,16 21,35
Private sector employees 36,54 26,93 30,14 28,41 24,63
Self-employed 35,84 27,31 27,69 21,95 19,41
Farmers 30,15 9,13 18,25 15,82 15,18
Disability pensioners 30,81 9,65 19,92 21,29 19,40
Retirees 36,63 10,26 32,35 8,22 7,15
Students 45,99 17,98 24,92 39,18 28,87
Unemployed 36,23 16,70 24,17 20,64 19,63
Other professionally
inactive 35,78 21,02 35,14 24,60 19,51
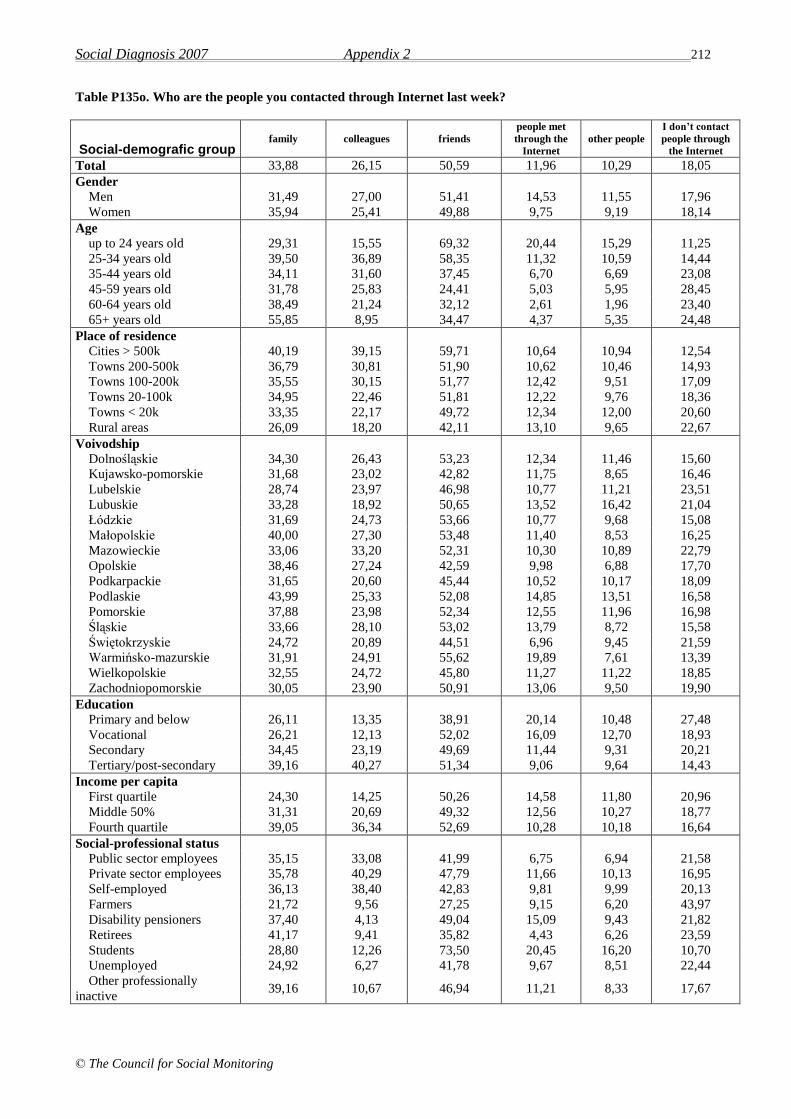
Social Diagnosis 2007 Appendix 2 212
© The Council for Social Monitoring
Table P135o. Who are the people you contacted through Internet last week?
Social-demografic group family colleagues friends
people met
through the
Internet
other people
I don’t contact
people through
the Internet
Total 33,88 26,15 50,59 11,96 10,29 18,05
Gender
Men 31,49 27,00 51,41 14,53 11,55 17,96
Women 35,94 25,41 49,88 9,75 9,19 18,14
Age
up to 24 years old 29,31 15,55 69,32 20,44 15,29 11,25
25-34 years old 39,50 36,89 58,35 11,32 10,59 14,44
35-44 years old 34,11 31,60 37,45 6,70 6,69 23,08
45-59 years old 31,78 25,83 24,41 5,03 5,95 28,45
60-64 years old 38,49 21,24 32,12 2,61 1,96 23,40
65+ years old 55,85 8,95 34,47 4,37 5,35 24,48
Place of residence
Cities > 500k 40,19 39,15 59,71 10,64 10,94 12,54
Towns 200-500k 36,79 30,81 51,90 10,62 10,46 14,93
Towns 100-200k 35,55 30,15 51,77 12,42 9,51 17,09
Towns 20-100k 34,95 22,46 51,81 12,22 9,76 18,36
Towns < 20k 33,35 22,17 49,72 12,34 12,00 20,60
Rural areas 26,09 18,20 42,11 13,10 9,65 22,67
Voivodship
Dolnośląskie 34,30 26,43 53,23 12,34 11,46 15,60
Kujawsko-pomorskie 31,68 23,02 42,82 11,75 8,65 16,46
Lubelskie 28,74 23,97 46,98 10,77 11,21 23,51
Lubuskie 33,28 18,92 50,65 13,52 16,42 21,04
Łódzkie 31,69 24,73 53,66 10,77 9,68 15,08
Małopolskie 40,00 27,30 53,48 11,40 8,53 16,25
Mazowieckie 33,06 33,20 52,31 10,30 10,89 22,79
Opolskie 38,46 27,24 42,59 9,98 6,88 17,70
Podkarpackie 31,65 20,60 45,44 10,52 10,17 18,09
Podlaskie 43,99 25,33 52,08 14,85 13,51 16,58
Pomorskie 37,88 23,98 52,34 12,55 11,96 16,98
Śląskie 33,66 28,10 53,02 13,79 8,72 15,58
Świętokrzyskie 24,72 20,89 44,51 6,96 9,45 21,59
Warmińsko-mazurskie 31,91 24,91 55,62 19,89 7,61 13,39
Wielkopolskie 32,55 24,72 45,80 11,27 11,22 18,85
Zachodniopomorskie 30,05 23,90 50,91 13,06 9,50 19,90
Education
Primary and below 26,11 13,35 38,91 20,14 10,48 27,48
Vocational 26,21 12,13 52,02 16,09 12,70 18,93
Secondary 34,45 23,19 49,69 11,44 9,31 20,21
Tertiary/post-secondary 39,16 40,27 51,34 9,06 9,64 14,43
Income per capita
First quartile 24,30 14,25 50,26 14,58 11,80 20,96
Middle 50% 31,31 20,69 49,32 12,56 10,27 18,77
Fourth quartile 39,05 36,34 52,69 10,28 10,18 16,64
Social-professional status
Public sector employees 35,15 33,08 41,99 6,75 6,94 21,58
Private sector employees 35,78 40,29 47,79 11,66 10,13 16,95
Self-employed 36,13 38,40 42,83 9,81 9,99 20,13
Farmers 21,72 9,56 27,25 9,15 6,20 43,97
Disability pensioners 37,40 4,13 49,04 15,09 9,43 21,82
Retirees 41,17 9,41 35,82 4,43 6,26 23,59
Students 28,80 12,26 73,50 20,45 16,20 10,70
Unemployed 24,92 6,27 41,78 9,67 8,51 22,44
Other professionally
inactive 39,16 10,67 46,94 11,21 8,33 17,67
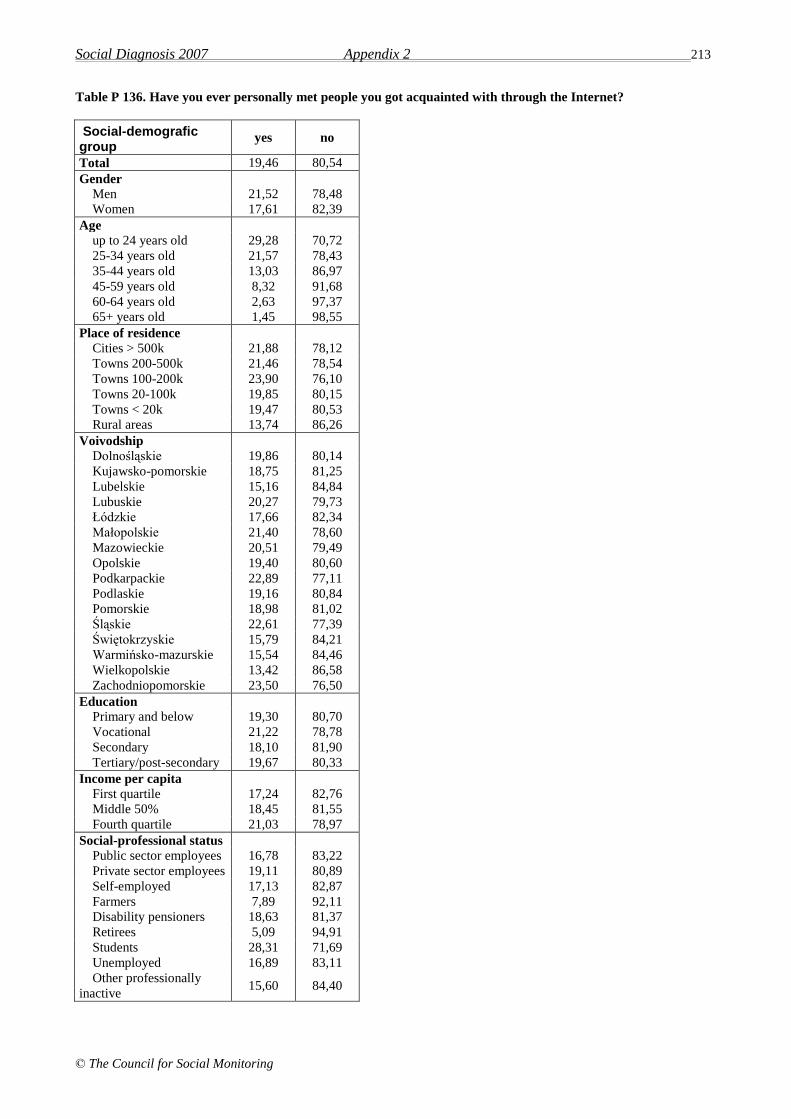
Social Diagnosis 2007 Appendix 2 213
© The Council for Social Monitoring
Table P 136. Have you ever personally met people you got acquainted with through the Internet?
Social-demografic group
yes no
Total 19,46 80,54
Gender
Men 21,52 78,48
Women 17,61 82,39
Age
up to 24 years old 29,28 70,72
25-34 years old 21,57 78,43
35-44 years old 13,03 86,97
45-59 years old 8,32 91,68
60-64 years old 2,63 97,37
65+ years old 1,45 98,55
Place of residence
Cities > 500k 21,88 78,12
Towns 200-500k 21,46 78,54
Towns 100-200k 23,90 76,10
Towns 20-100k 19,85 80,15
Towns < 20k 19,47 80,53
Rural areas 13,74 86,26
Voivodship
Dolnośląskie 19,86 80,14
Kujawsko-pomorskie 18,75 81,25
Lubelskie 15,16 84,84
Lubuskie 20,27 79,73
Łódzkie 17,66 82,34
Małopolskie 21,40 78,60
Mazowieckie 20,51 79,49
Opolskie 19,40 80,60
Podkarpackie 22,89 77,11
Podlaskie 19,16 80,84
Pomorskie 18,98 81,02
Śląskie 22,61 77,39
Świętokrzyskie 15,79 84,21
Warmińsko-mazurskie 15,54 84,46
Wielkopolskie 13,42 86,58
Zachodniopomorskie 23,50 76,50
Education
Primary and below 19,30 80,70
Vocational 21,22 78,78
Secondary 18,10 81,90
Tertiary/post-secondary 19,67 80,33
Income per capita
First quartile 17,24 82,76
Middle 50% 18,45 81,55
Fourth quartile 21,03 78,97
Social-professional status
Public sector employees 16,78 83,22
Private sector employees 19,11 80,89
Self-employed 17,13 82,87
Farmers 7,89 92,11
Disability pensioners 18,63 81,37
Retirees 5,09 94,91
Students 28,31 71,69
Unemployed 16,89 83,11
Other professionally
inactive 15,60 84,40

Social Diagnosis 2007 Appendix 2 214
© The Council for Social Monitoring
Table P137k_1. While using the Internet have you ever performed the following activities?
Social-demografic group
checking and
sending emails
using communicators
enabling contact with
people (such as ICQ,
gadu-gadu etc.)
chatting
writing in
discussion
groups or
forums
conversations
through
Internet
(VoIP, Skype)
Total 32,12 31,99 41,68 32,00 31,63
Gender
Men 32,46 32,26 42,02 32,23 33,46
Women 31,84 31,76 41,38 31,80 30,05
Age
up to 24 years old 30,48 27,50 58,77 43,20 40,13
25-34 years old 31,04 35,23 50,00 39,33 32,53
35-44 years old 34,66 38,32 29,93 24,44 28,04
45-59 years old 33,48 31,05 18,43 14,63 21,63
60-64 years old 37,79 26,87 11,75 8,70 22,45
65+ years old 33,71 15,16 4,59 5,49 18,41
Place of residence
Cities > 500k 23,57 31,29 48,51 38,17 36,92
Towns 200-500k 33,56 29,58 44,42 34,91 35,45
Towns 100-200k 30,76 33,08 45,52 37,19 36,38
Towns 20-100k 32,95 34,26 39,14 28,71 31,02
Towns < 20k 34,18 31,15 39,21 31,88 27,64
Rural areas 35,80 31,75 37,38 26,97 26,20
Voivodship
Dolnośląskie 35,25 36,22 44,65 36,66 31,74
Kujawsko-pomorskie 29,35 26,87 38,10 28,11 30,13
Lubelskie 31,77 29,69 39,72 29,73 33,72
Lubuskie 33,19 30,52 41,48 30,69 27,45
Łódzkie 33,60 37,13 43,04 27,63 31,79
Małopolskie 30,52 30,08 42,38 34,72 32,82
Mazowieckie 26,37 32,24 43,19 34,92 30,64
Opolskie 32,21 26,47 43,58 28,44 30,22
Podkarpackie 38,93 34,84 49,68 30,94 31,35
Podlaskie 38,16 38,25 45,19 40,21 38,56
Pomorskie 30,58 31,32 39,93 31,76 33,06
Śląskie 38,39 31,05 42,91 31,67 33,78
Świętokrzyskie 32,47 23,02 31,18 33,44 28,59
Warmińsko-mazurskie 26,68 37,95 38,19 33,16 29,59
Wielkopolskie 27,57 29,71 34,87 27,16 28,71
Zachodniopomorskie 32,65 34,29 43,20 29,33 30,06
Education
Primary and below 34,22 26,70 31,47 22,10 25,07
Vocational 34,45 28,74 43,51 31,99 33,43
Secondary 31,49 30,94 42,60 31,90 30,21
Tertiary/post-secondary 31,02 35,80 40,03 32,75 32,29
Income per capita
First quartile 37,55 32,54 42,38 32,47 33,46
Middle 50% 34,04 33,06 41,96 32,17 30,82
Fourth quartile 27,34 31,75 42,05 32,59 32,36
Social-professional status
Public sector employees 32,18 34,40 35,56 28,55 26,77
Private sector employees 29,87 34,60 43,85 33,63 33,26
Self-employed 32,47 33,72 34,84 29,99 29,63
Farmers 28,56 28,78 26,55 14,48 13,39
Disability pensioners 36,07 28,31 38,20 30,74 30,40
Retirees 38,89 25,11 9,62 7,11 20,81
Students 30,19 26,80 58,96 42,95 41,74
Unemployed 35,10 29,82 35,10 27,39 24,30
Other professionally
inactive 41,70 36,97 33,54 26,50 26,65

Social Diagnosis 2007 Appendix 2 215
© The Council for Social Monitoring
Table P137k_2. While using the Internet have you ever performed the following activities?
Social-demografic group
videoconferences
looking
through
websites
gathering
materials
needed for
work or study
participation in
courses or
trainings
through the
Internet
looking for a
job, sending
offers of
employment
Total 21,41 31,48 31,17 20,12 29,28
Gender
Men 23,58 32,02 30,45 22,36 30,13
Women 19,54 31,01 31,80 18,19 28,55
Age
up to 24 years old 30,38 26,25 30,68 26,35 32,82
25-34 years old 25,36 30,54 35,59 24,56 39,49
35-44 years old 13,88 35,31 32,56 15,97 24,94
45-59 years old 9,63 37,06 26,90 10,05 17,52
60-64 years old 9,90 37,80 19,54 4,91 6,42
65+ years old 16,36 34,69 16,42 6,42 2,80
Place of residence
Cities > 500k 28,92 25,03 29,10 27,92 39,18
Towns 200-500k 23,56 32,25 32,53 20,32 35,13
Towns 100-200k 25,50 31,51 32,65 24,09 34,49
Towns 20-100k 18,32 31,99 32,02 17,75 26,06
Towns < 20k 17,42 31,57 32,38 18,82 26,62
Rural areas 18,30 34,91 29,61 15,96 21,03
Voivodship
Dolnośląskie 21,44 37,39 35,44 19,10 32,93
Kujawsko-pomorskie 20,96 26,10 23,56 21,50 28,59
Lubelskie 20,50 28,57 29,45 17,14 23,88
Lubuskie 18,62 35,91 28,64 13,21 26,42
Łódzkie 17,33 41,18 33,26 17,66 27,36
Małopolskie 26,08 29,40 28,31 23,64 29,70
Mazowieckie 24,58 27,91 31,84 23,86 33,40
Opolskie 23,99 31,53 38,02 22,62 32,51
Podkarpackie 24,24 34,38 33,66 23,80 28,14
Podlaskie 32,00 35,00 38,41 28,07 33,23
Pomorskie 20,97 29,31 30,68 20,18 31,84
Śląskie 20,28 36,13 33,00 19,19 31,39
Świętokrzyskie 14,09 28,74 31,10 13,88 26,93
Warmińsko-mazurskie 14,92 28,81 28,09 13,57 15,97
Wielkopolskie 17,64 24,19 28,16 17,90 25,82
Zachodniopomorskie 19,11 29,34 26,66 16,61 22,43
Education
Primary and below 19,38 33,30 20,07 17,26 20,63
Vocational 23,38 31,24 27,89 20,71 22,39
Secondary 20,98 32,42 30,51 17,70 30,45
Tertiary/post-secondary 20,57 30,48 34,99 22,52 33,43
Income per capita
First quartile 24,11 34,87 33,32 20,83 25,75
Middle 50% 20,25 33,05 31,55 19,20 28,77
Fourth quartile 22,12 28,75 30,59 20,87 31,14
Social-professional status
Public sector employees 15,04 32,05 34,92 17,95 26,70
Private sector employees 23,70 31,58 32,17 22,02 37,39
Self-employed 19,24 31,33 31,42 18,48 24,12
Farmers 14,21 36,62 26,41 5,86 17,66
Disability pensioners 19,75 31,72 21,55 16,67 21,01
Retirees 8,79 39,09 18,49 4,74 7,81
Students 30,12 25,73 29,14 26,40 29,74
Unemployed 21,25 40,49 32,70 19,82 27,27
Other professionally inactive 17,53 36,37 33,92 15,27 29,64

Social Diagnosis 2007 Appendix 2 216
© The Council for Social Monitoring
Table P137k_3. While using the Internet have you ever performed the following activities?
Social-demografic group
purchasing
products
(except
auctions)
using a bank
account
participation in
Internet auctions
playing
online
games
downloading free
software
Total 30,71 19,32 22,82 28,62 29,14
Gender
Men 33,58 21,04 25,90 32,77 33,05
Women 28,24 17,83 20,16 25,06 25,78
Age
up to 24 years old 34,13 22,09 28,81 39,42 35,50
25-34 years old 36,77 20,74 26,85 32,26 34,48
35-44 years old 27,78 16,62 18,45 21,97 25,32
45-59 years old 21,19 15,43 13,65 15,10 17,54
60-64 years old 18,00 20,92 7,50 9,80 15,10
65+ years old 25,35 16,19 11,91 9,98 12,65
Place of residence
Cities > 500k 36,79 23,70 29,11 34,11 36,98
Towns 200-500k 37,56 23,04 25,72 28,24 32,66
Towns 100-200k 29,17 21,41 26,41 31,63 30,35
Towns 20-100k 30,12 19,58 22,38 27,90 27,02
Towns < 20k 27,91 15,85 20,74 25,74 28,20
Rural areas 24,76 14,55 16,57 26,07 23,52
Voivodship
Dolnośląskie 28,05 18,77 24,99 28,58 30,25
Kujawsko-pomorskie 28,20 15,93 17,09 23,91 28,42
Lubelskie 34,15 17,47 21,22 29,36 30,43
Lubuskie 34,48 16,19 25,16 30,58 27,62
Łódzkie 31,03 20,57 18,90 28,51 31,80
Małopolskie 30,40 18,99 22,97 33,28 28,95
Mazowieckie 33,48 21,94 27,18 31,74 32,46
Opolskie 30,97 15,46 25,50 29,69 27,98
Podkarpackie 27,27 17,13 18,70 32,82 24,18
Podlaskie 37,57 28,11 24,37 30,26 29,13
Pomorskie 34,10 18,27 25,63 27,42 31,00
Śląskie 29,44 23,37 24,82 26,35 26,82
Świętokrzyskie 26,84 17,92 17,37 21,54 19,32
Warmińsko-mazurskie 27,73 18,32 19,25 31,06 31,31
Wielkopolskie 29,19 17,50 20,83 24,82 29,09
Zachodniopomorskie 27,34 10,49 16,73 24,79 27,82
Education
Primary and below 20,64 15,52 15,20 27,78 19,85
Vocational 27,35 17,12 22,25 32,16 25,94
Secondary 28,45 18,03 21,56 29,93 28,98
Tertiary/post-secondary 36,31 22,58 25,08 24,66 32,16
Income per capita
First quartile 25,26 17,03 21,37 31,86 27,51
Middle 50% 29,30 18,57 21,29 29,67 27,51
Fourth quartile 34,00 21,53 24,96 26,84 31,67
Social-professional status
Public sector employees 31,65 18,48 21,06 23,38 27,31
Private sector employees 31,27 20,13 24,11 28,63 30,90
Self-employed 31,21 23,13 20,93 24,89 28,93
Farmers 21,95 8,69 7,83 22,90 14,96
Disability pensioners 21,70 17,58 17,21 29,57 29,39
Retirees 21,11 15,43 11,44 12,23 15,02
Students 35,35 20,80 29,93 40,28 35,66
Unemployed 22,62 15,95 18,17 26,65 21,32
Other professionally inactive 27,05 17,83 18,22 24,78 23,86
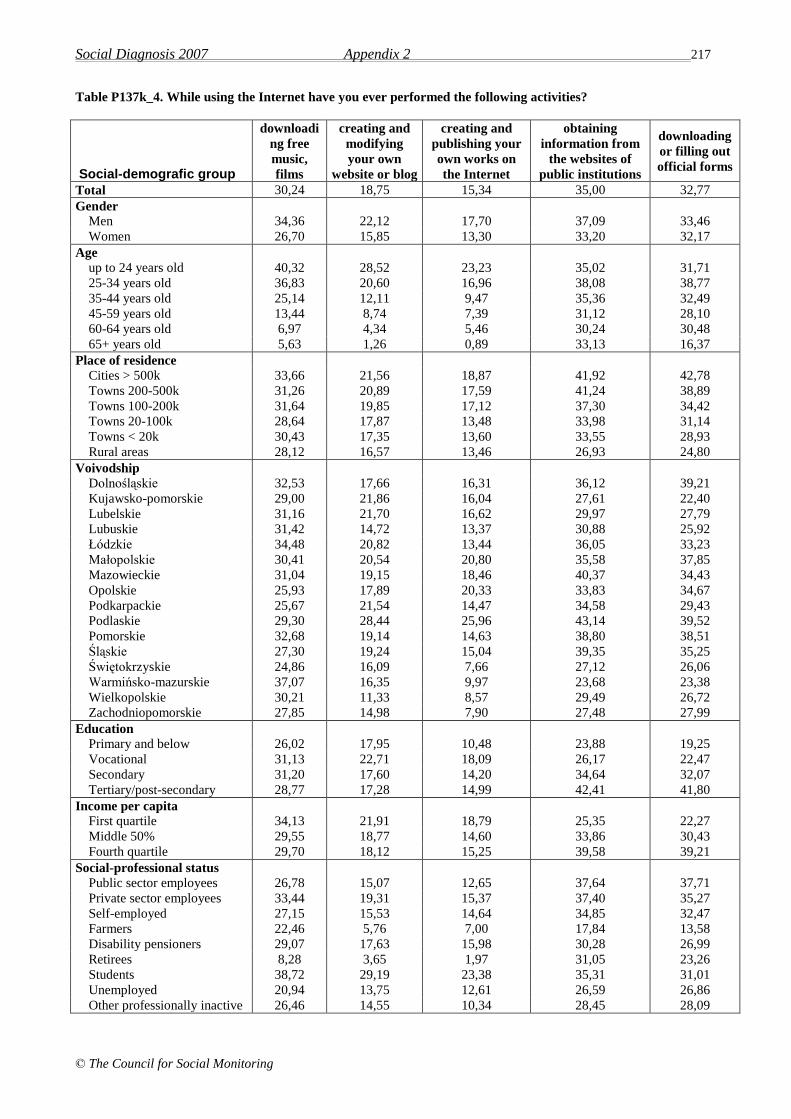
Social Diagnosis 2007 Appendix 2 217
© The Council for Social Monitoring
Table P137k_4. While using the Internet have you ever performed the following activities?
Social-demografic group
downloadi
ng free
music,
films
creating and
modifying
your own
website or blog
creating and
publishing your
own works on
the Internet
obtaining
information from
the websites of
public institutions
downloading
or filling out
official forms
Total 30,24 18,75 15,34 35,00 32,77
Gender
Men 34,36 22,12 17,70 37,09 33,46
Women 26,70 15,85 13,30 33,20 32,17
Age
up to 24 years old 40,32 28,52 23,23 35,02 31,71
25-34 years old 36,83 20,60 16,96 38,08 38,77
35-44 years old 25,14 12,11 9,47 35,36 32,49
45-59 years old 13,44 8,74 7,39 31,12 28,10
60-64 years old 6,97 4,34 5,46 30,24 30,48
65+ years old 5,63 1,26 0,89 33,13 16,37
Place of residence
Cities > 500k 33,66 21,56 18,87 41,92 42,78
Towns 200-500k 31,26 20,89 17,59 41,24 38,89
Towns 100-200k 31,64 19,85 17,12 37,30 34,42
Towns 20-100k 28,64 17,87 13,48 33,98 31,14
Towns < 20k 30,43 17,35 13,60 33,55 28,93
Rural areas 28,12 16,57 13,46 26,93 24,80
Voivodship
Dolnośląskie 32,53 17,66 16,31 36,12 39,21
Kujawsko-pomorskie 29,00 21,86 16,04 27,61 22,40
Lubelskie 31,16 21,70 16,62 29,97 27,79
Lubuskie 31,42 14,72 13,37 30,88 25,92
Łódzkie 34,48 20,82 13,44 36,05 33,23
Małopolskie 30,41 20,54 20,80 35,58 37,85
Mazowieckie 31,04 19,15 18,46 40,37 34,43
Opolskie 25,93 17,89 20,33 33,83 34,67
Podkarpackie 25,67 21,54 14,47 34,58 29,43
Podlaskie 29,30 28,44 25,96 43,14 39,52
Pomorskie 32,68 19,14 14,63 38,80 38,51
Śląskie 27,30 19,24 15,04 39,35 35,25
Świętokrzyskie 24,86 16,09 7,66 27,12 26,06
Warmińsko-mazurskie 37,07 16,35 9,97 23,68 23,38
Wielkopolskie 30,21 11,33 8,57 29,49 26,72
Zachodniopomorskie 27,85 14,98 7,90 27,48 27,99
Education
Primary and below 26,02 17,95 10,48 23,88 19,25
Vocational 31,13 22,71 18,09 26,17 22,47
Secondary 31,20 17,60 14,20 34,64 32,07
Tertiary/post-secondary 28,77 17,28 14,99 42,41 41,80
Income per capita
First quartile 34,13 21,91 18,79 25,35 22,27
Middle 50% 29,55 18,77 14,60 33,86 30,43
Fourth quartile 29,70 18,12 15,25 39,58 39,21
Social-professional status
Public sector employees 26,78 15,07 12,65 37,64 37,71
Private sector employees 33,44 19,31 15,37 37,40 35,27
Self-employed 27,15 15,53 14,64 34,85 32,47
Farmers 22,46 5,76 7,00 17,84 13,58
Disability pensioners 29,07 17,63 15,98 30,28 26,99
Retirees 8,28 3,65 1,97 31,05 23,26
Students 38,72 29,19 23,38 35,31 31,01
Unemployed 20,94 13,75 12,61 26,59 26,86
Other professionally inactive 26,46 14,55 10,34 28,45 28,09

Social Diagnosis 2007 Appendix 2 218
© The Council for Social Monitoring
Table P137k_5. While using the Internet have you ever performed the following activities?
Social-demografic group
listening to
music or the
radio on the
Internet
watching TV
through the
Internet
booking tickets
(e.g. for plane,
cinema,
theater)
reading
newspapers
on the
Internet
using Internet and
email at home for
professional
purposes
Total 33,59 24,59 25,89 35,06 23,87
Gender
Men 36,25 28,62 26,64 35,28 25,10
Women 31,30 21,12 25,24 34,88 22,82
Age
up to 24 years old 40,07 31,25 30,32 35,45 21,97
25-34 years old 38,63 30,13 31,65 36,76 29,52
35-44 years old 31,20 19,29 21,74 35,23 23,57
45-59 years old 21,95 13,13 17,16 32,37 20,98
60-64 years old 10,74 13,00 11,90 33,67 18,75
65+ years old 12,47 10,09 7,07 32,51 11,46
Place of residence
Cities > 500k 34,99 31,02 36,91 37,76 29,36
Towns 200-500k 34,90 27,09 37,59 42,98 31,60
Towns 100-200k 33,53 26,27 28,09 39,14 27,82
Towns 20-100k 33,86 23,50 21,90 34,27 21,10
Towns < 20k 31,24 19,92 20,04 31,31 21,97
Rural areas 32,79 21,37 16,80 29,12 17,16
Voivodship
Dolnośląskie 34,18 29,22 24,96 38,30 25,06
Kujawsko-pomorskie 34,62 21,64 27,85 32,01 21,61
Lubelskie 37,90 21,81 24,86 34,37 25,99
Lubuskie 32,35 20,49 14,35 36,53 20,85
Łódzkie 38,74 26,07 22,08 38,49 23,31
Małopolskie 31,53 26,33 29,22 31,71 23,98
Mazowieckie 35,00 24,59 31,48 34,98 26,22
Opolskie 28,97 25,48 27,81 33,15 22,04
Podkarpackie 32,94 23,39 21,70 34,24 20,63
Podlaskie 37,02 31,17 31,38 46,89 36,28
Pomorskie 33,21 27,19 28,98 36,05 26,36
Śląskie 35,06 24,01 26,32 40,61 24,63
Świętokrzyskie 27,50 18,00 19,80 23,06 16,13
Warmińsko-mazurskie 30,56 21,39 22,66 26,13 16,00
Wielkopolskie 29,13 22,70 20,55 30,08 20,39
Zachodniopomorskie 31,21 22,12 24,84 31,94 23,14
Education
Primary and below 24,04 16,29 15,02 27,70 15,04
Vocational 34,43 23,57 19,80 28,94 15,80
Secondary 33,02 24,26 25,62 35,63 23,20
Tertiary/post-secondary 34,28 26,20 31,28 39,28 30,98
Income per capita
First quartile 36,51 24,67 18,34 29,64 20,05
Middle 50% 33,17 24,23 22,64 33,68 20,96
Fourth quartile 33,75 26,21 31,82 38,45 28,62
Social-professional status
Public sector employees 32,79 23,51 25,03 36,21 29,75
Private sector employees 35,10 25,74 28,99 36,25 25,27
Self-employed 30,26 24,65 25,99 34,16 30,16
Farmers 20,18 8,54 13,37 22,24 13,28
Disability pensioners 29,90 23,63 17,85 31,02 15,64
Retirees 15,88 11,08 13,29 33,15 11,86
Students 39,23 30,57 30,24 35,18 20,07
Unemployed 30,49 21,69 17,69 33,34 17,56
Other professionally inactive 33,72 17,76 21,14 33,94 21,81
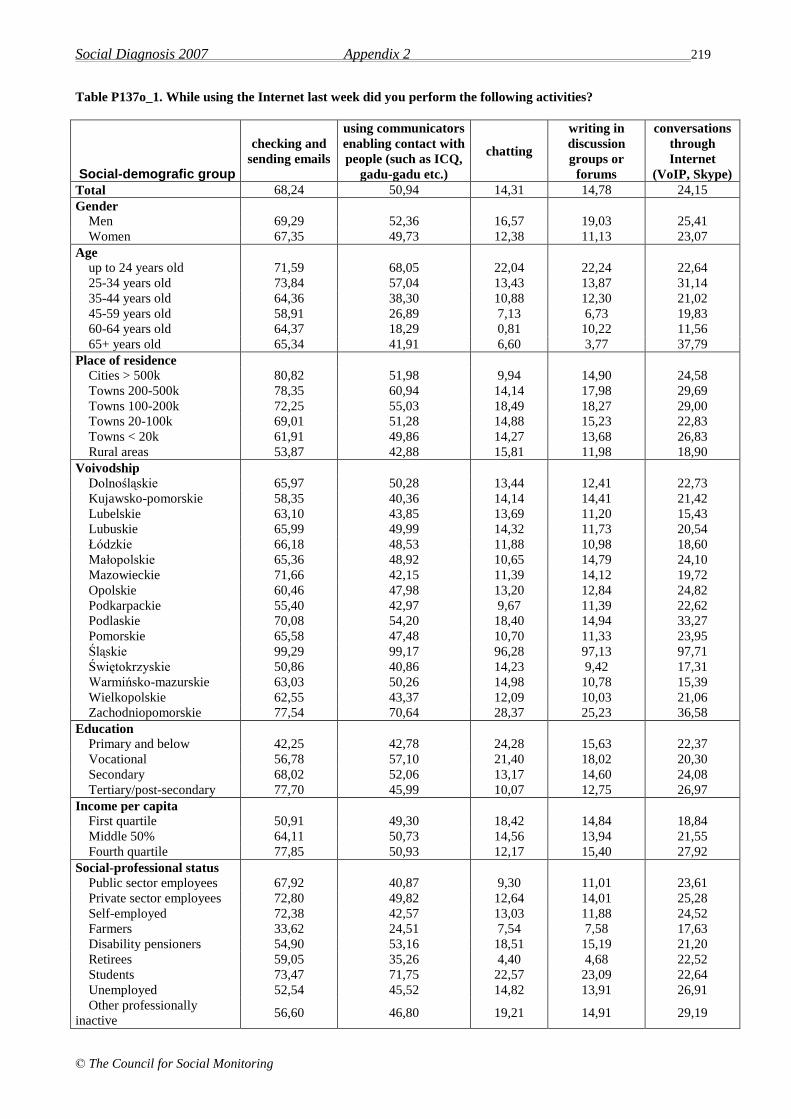
Social Diagnosis 2007 Appendix 2 219
© The Council for Social Monitoring
Table P137o_1. While using the Internet last week did you perform the following activities?
Social-demografic group
checking and
sending emails
using communicators
enabling contact with
people (such as ICQ,
gadu-gadu etc.)
chatting
writing in
discussion
groups or
forums
conversations
through
Internet
(VoIP, Skype)
Total 68,24 50,94 14,31 14,78 24,15
Gender
Men 69,29 52,36 16,57 19,03 25,41
Women 67,35 49,73 12,38 11,13 23,07
Age
up to 24 years old 71,59 68,05 22,04 22,24 22,64
25-34 years old 73,84 57,04 13,43 13,87 31,14
35-44 years old 64,36 38,30 10,88 12,30 21,02
45-59 years old 58,91 26,89 7,13 6,73 19,83
60-64 years old 64,37 18,29 0,81 10,22 11,56
65+ years old 65,34 41,91 6,60 3,77 37,79
Place of residence
Cities > 500k 80,82 51,98 9,94 14,90 24,58
Towns 200-500k 78,35 60,94 14,14 17,98 29,69
Towns 100-200k 72,25 55,03 18,49 18,27 29,00
Towns 20-100k 69,01 51,28 14,88 15,23 22,83
Towns < 20k 61,91 49,86 14,27 13,68 26,83
Rural areas 53,87 42,88 15,81 11,98 18,90
Voivodship
Dolnośląskie 65,97 50,28 13,44 12,41 22,73
Kujawsko-pomorskie 58,35 40,36 14,14 14,41 21,42
Lubelskie 63,10 43,85 13,69 11,20 15,43
Lubuskie 65,99 49,99 14,32 11,73 20,54
Łódzkie 66,18 48,53 11,88 10,98 18,60
Małopolskie 65,36 48,92 10,65 14,79 24,10
Mazowieckie 71,66 42,15 11,39 14,12 19,72
Opolskie 60,46 47,98 13,20 12,84 24,82
Podkarpackie 55,40 42,97 9,67 11,39 22,62
Podlaskie 70,08 54,20 18,40 14,94 33,27
Pomorskie 65,58 47,48 10,70 11,33 23,95
Śląskie 99,29 99,17 96,28 97,13 97,71
Świętokrzyskie 50,86 40,86 14,23 9,42 17,31
Warmińsko-mazurskie 63,03 50,26 14,98 10,78 15,39
Wielkopolskie 62,55 43,37 12,09 10,03 21,06
Zachodniopomorskie 77,54 70,64 28,37 25,23 36,58
Education
Primary and below 42,25 42,78 24,28 15,63 22,37
Vocational 56,78 57,10 21,40 18,02 20,30
Secondary 68,02 52,06 13,17 14,60 24,08
Tertiary/post-secondary 77,70 45,99 10,07 12,75 26,97
Income per capita
First quartile 50,91 49,30 18,42 14,84 18,84
Middle 50% 64,11 50,73 14,56 13,94 21,55
Fourth quartile 77,85 50,93 12,17 15,40 27,92
Social-professional status
Public sector employees 67,92 40,87 9,30 11,01 23,61
Private sector employees 72,80 49,82 12,64 14,01 25,28
Self-employed 72,38 42,57 13,03 11,88 24,52
Farmers 33,62 24,51 7,54 7,58 17,63
Disability pensioners 54,90 53,16 18,51 15,19 21,20
Retirees 59,05 35,26 4,40 4,68 22,52
Students 73,47 71,75 22,57 23,09 22,64
Unemployed 52,54 45,52 14,82 13,91 26,91
Other professionally
inactive 56,60 46,80 19,21 14,91 29,19
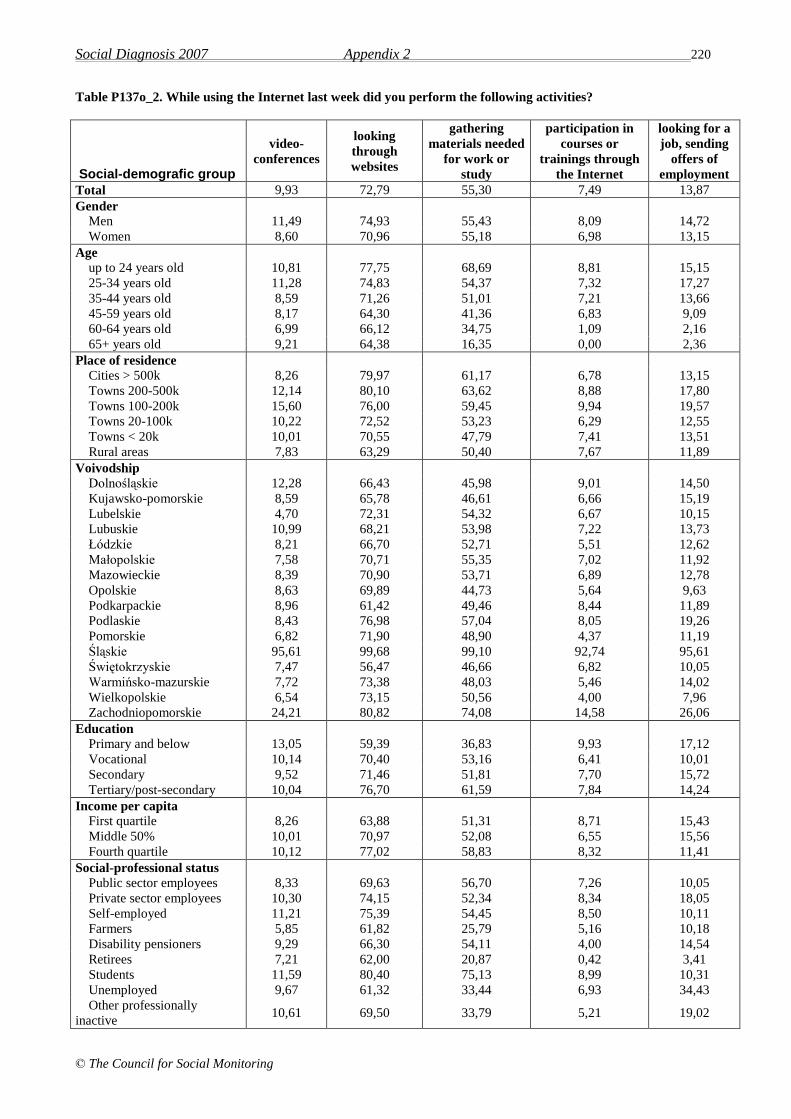
Social Diagnosis 2007 Appendix 2 220
© The Council for Social Monitoring
Table P137o_2. While using the Internet last week did you perform the following activities?
Social-demografic group
video-
conferences
looking
through
websites
gathering
materials needed
for work or
study
participation in
courses or
trainings through
the Internet
looking for a
job, sending
offers of
employment
Total 9,93 72,79 55,30 7,49 13,87
Gender
Men 11,49 74,93 55,43 8,09 14,72
Women 8,60 70,96 55,18 6,98 13,15
Age
up to 24 years old 10,81 77,75 68,69 8,81 15,15
25-34 years old 11,28 74,83 54,37 7,32 17,27
35-44 years old 8,59 71,26 51,01 7,21 13,66
45-59 years old 8,17 64,30 41,36 6,83 9,09
60-64 years old 6,99 66,12 34,75 1,09 2,16
65+ years old 9,21 64,38 16,35 0,00 2,36
Place of residence
Cities > 500k 8,26 79,97 61,17 6,78 13,15
Towns 200-500k 12,14 80,10 63,62 8,88 17,80
Towns 100-200k 15,60 76,00 59,45 9,94 19,57
Towns 20-100k 10,22 72,52 53,23 6,29 12,55
Towns < 20k 10,01 70,55 47,79 7,41 13,51
Rural areas 7,83 63,29 50,40 7,67 11,89
Voivodship
Dolnośląskie 12,28 66,43 45,98 9,01 14,50
Kujawsko-pomorskie 8,59 65,78 46,61 6,66 15,19
Lubelskie 4,70 72,31 54,32 6,67 10,15
Lubuskie 10,99 68,21 53,98 7,22 13,73
Łódzkie 8,21 66,70 52,71 5,51 12,62
Małopolskie 7,58 70,71 55,35 7,02 11,92
Mazowieckie 8,39 70,90 53,71 6,89 12,78
Opolskie 8,63 69,89 44,73 5,64 9,63
Podkarpackie 8,96 61,42 49,46 8,44 11,89
Podlaskie 8,43 76,98 57,04 8,05 19,26
Pomorskie 6,82 71,90 48,90 4,37 11,19
Śląskie 95,61 99,68 99,10 92,74 95,61
Świętokrzyskie 7,47 56,47 46,66 6,82 10,05
Warmińsko-mazurskie 7,72 73,38 48,03 5,46 14,02
Wielkopolskie 6,54 73,15 50,56 4,00 7,96
Zachodniopomorskie 24,21 80,82 74,08 14,58 26,06
Education
Primary and below 13,05 59,39 36,83 9,93 17,12
Vocational 10,14 70,40 53,16 6,41 10,01
Secondary 9,52 71,46 51,81 7,70 15,72
Tertiary/post-secondary 10,04 76,70 61,59 7,84 14,24
Income per capita
First quartile 8,26 63,88 51,31 8,71 15,43
Middle 50% 10,01 70,97 52,08 6,55 15,56
Fourth quartile 10,12 77,02 58,83 8,32 11,41
Social-professional status
Public sector employees 8,33 69,63 56,70 7,26 10,05
Private sector employees 10,30 74,15 52,34 8,34 18,05
Self-employed 11,21 75,39 54,45 8,50 10,11
Farmers 5,85 61,82 25,79 5,16 10,18
Disability pensioners 9,29 66,30 54,11 4,00 14,54
Retirees 7,21 62,00 20,87 0,42 3,41
Students 11,59 80,40 75,13 8,99 10,31
Unemployed 9,67 61,32 33,44 6,93 34,43
Other professionally
inactive 10,61 69,50 33,79 5,21 19,02

Social Diagnosis 2007 Appendix 2 221
© The Council for Social Monitoring
Table P137o_3. While using the Internet last week did you perform the following activities?
Social-demografic group
purchasing
products
(except
auctions)
using a bank
account
participation in
Internet auctions
playing
online
games
downloading free
software
Total 16,48 29,62 17,21 18,21 19,14
Gender
Men 20,15 31,87 22,72 23,17 27,55
Women 13,31 27,69 12,44 13,87 11,75
Age
up to 24 years old 16,76 20,55 18,58 28,71 27,97
25-34 years old 21,19 39,14 22,50 14,56 19,75
35-44 years old 17,23 35,34 16,77 14,25 15,11
45-59 years old 10,02 27,33 9,94 10,17 8,69
60-64 years old 10,25 28,53 6,28 7,16 6,62
65+ years old 7,77 16,77 4,66 14,09 7,01
Place of residence
Cities > 500k 17,25 37,71 17,44 15,64 18,89
Towns 200-500k 18,99 44,63 25,35 19,40 24,17
Towns 100-200k 22,68 33,85 21,91 23,49 25,15
Towns 20-100k 15,60 29,42 15,37 19,31 18,97
Towns < 20k 17,44 24,83 17,19 20,65 18,49
Rural areas 12,74 16,15 12,78 15,34 15,07
Voivodship
Dolnośląskie 14,11 26,61 13,91 17,91 18,39
Kujawsko-pomorskie 15,10 23,66 16,65 15,88 18,49
Lubelskie 11,34 17,51 14,17 13,62 12,63
Lubuskie 17,32 32,38 17,65 16,50 21,36
Łódzkie 14,78 29,61 15,19 15,08 16,34
Małopolskie 16,74 26,29 15,77 14,95 18,24
Mazowieckie 15,83 30,80 14,98 14,55 16,73
Opolskie 11,58 26,28 12,59 18,53 14,87
Podkarpackie 14,77 20,61 18,84 16,94 16,31
Podlaskie 20,36 30,47 20,01 23,44 23,89
Pomorskie 11,85 31,96 16,01 11,89 16,71
Śląskie 96,58 98,24 96,74 97,43 97,30
Świętokrzyskie 10,32 19,03 14,48 15,66 16,88
Warmińsko-mazurskie 11,39 12,89 8,44 24,15 18,47
Wielkopolskie 13,92 24,89 12,21 12,56 11,73
Zachodniopomorskie 27,16 43,87 34,83 33,98 30,25
Education
Primary and below 12,15 12,12 13,48 27,03 19,90
Vocational 14,42 12,52 15,02 29,23 24,61
Secondary 15,90 29,56 16,53 17,29 18,44
Tertiary/post-secondary 18,77 41,76 19,66 10,98 16,13
Income per capita
First quartile 10,85 13,19 11,92 22,03 17,20
Middle 50% 15,22 25,31 16,69 20,53 19,51
Fourth quartile 19,66 38,85 19,55 14,95 19,29
Social-professional status
Public sector employees 14,44 32,00 14,68 11,81 13,09
Private sector employees 19,76 38,13 19,37 16,57 20,49
Self-employed 21,05 45,17 26,03 12,66 17,62
Farmers 13,60 14,37 12,11 16,25 13,58
Disability pensioners 11,05 20,14 12,59 14,83 14,73
Retirees 7,93 23,63 6,62 10,25 6,40
Students 15,86 18,18 18,16 31,30 28,80
Unemployed 14,60 19,75 15,84 17,47 16,43
Other professionally inactive 16,31 21,41 14,45 16,89 15,95

Social Diagnosis 2007 Appendix 2 222
© The Council for Social Monitoring
Table P137o_4. While using the Internet last week did you perform the following activities?
Social-demografic group
downloading
free music,
films
creating and
modifying your
own website or
blog
creating and
publishing
your own
works on the
Internet
obtaining
information from
the websites of
public institutions
downloading
or filling out
official forms
Total 21,78 7,90 7,65 24,53 13,87
Gender
Men 27,93 9,77 9,99 26,03 14,15
Women 16,45 6,31 5,64 23,24 13,63
Age
up to 24 years old 36,49 10,76 10,94 22,14 9,43
25-34 years old 21,25 8,59 8,02 26,49 15,75
35-44 years old 11,87 7,32 6,38 25,85 15,20
45-59 years old 8,15 3,64 3,68 24,99 17,63
60-64 years old 3,65 1,96 2,22 21,35 19,57
65+ years old 6,14 1,71 1,71 23,74 3,20
Place of residence
Cities > 500k 21,53 8,19 7,26 29,20 16,12
Towns 200-500k 26,77 9,65 9,43 33,03 16,81
Towns 100-200k 28,07 12,16 12,64 28,32 17,17
Towns 20-100k 21,50 7,56 6,06 21,12 11,49
Towns < 20k 22,35 8,48 9,45 22,02 13,08
Rural areas 17,05 5,34 5,87 19,55 12,11
Voivodship
Dolnośląskie 21,31 6,88 8,74 18,57 8,50
Kujawsko-pomorskie 19,75 8,07 6,13 17,43 11,56
Lubelskie 16,04 4,17 6,67 28,14 11,75
Lubuskie 24,08 9,82 8,55 26,52 13,80
Łódzkie 19,05 5,47 5,97 22,66 11,98
Małopolskie 20,42 10,17 7,94 21,92 13,66
Mazowieckie 20,90 7,46 5,66 25,47 14,83
Opolskie 14,21 7,88 7,58 20,71 8,53
Podkarpackie 17,56 5,51 6,73 17,91 11,83
Podlaskie 25,80 8,94 8,59 26,10 14,30
Pomorskie 17,56 4,28 4,99 21,53 10,73
Śląskie 97,38 94,56 93,12 97,68 95,81
Świętokrzyskie 18,14 4,80 7,54 16,79 9,99
Warmińsko-mazurskie 21,13 6,68 5,68 16,12 11,48
Wielkopolskie 13,70 3,60 4,60 19,41 12,80
Zachodniopomorskie 43,53 14,50 17,91 44,94 25,34
Education
Primary and below 27,63 10,69 12,21 8,53 8,35
Vocational 31,83 10,09 9,47 18,35 7,01
Secondary 21,98 6,42 7,27 22,61 13,25
Tertiary/post-secondary 14,22 7,84 6,53 31,76 19,40
Income per capita
First quartile 20,89 8,07 8,84 18,98 10,10
Middle 50% 24,48 8,79 8,34 22,09 13,21
Fourth quartile 19,61 6,98 6,81 28,73 15,97
Social-professional status
Public sector employees 11,87 5,65 5,91 28,83 18,73
Private sector employees 21,32 7,65 7,85 23,34 15,51
Self-employed 15,85 10,01 6,73 32,92 22,05
Farmers 12,78 3,46 3,46 14,29 5,52
Disability pensioners 21,56 4,79 6,83 18,94 9,01
Retirees 3,86 0,99 1,54 18,17 8,24
Students 38,90 11,43 11,11 24,17 7,80
Unemployed 22,70 8,06 7,91 19,04 9,78
Other professionally inactive 17,81 9,98 7,53 17,72 10,21

Social Diagnosis 2007 Appendix 2 223
© The Council for Social Monitoring
Table P137o_5. While using the Internet last week did you perform the following activities?
Social-demografic group
listening to
music or the
radio on the
Internet
watching TV
through the
Internet
booking tickets
(e.g. for plane,
cinema,
theater)
reading
newspapers
on the
Internet
using Internet and
email at home for
professional
purposes
Total 30,45 12,13 9,65 30,61 25,58
Gender
Men 34,01 15,90 9,74 32,70 27,09
Women 27,35 8,87 9,57 28,81 24,28
Age
up to 24 years old 41,70 16,22 9,99 25,57 16,10
25-34 years old 33,76 11,47 12,34 32,64 32,87
35-44 years old 24,82 11,62 10,02 33,66 31,74
45-59 years old 15,02 7,71 6,25 32,80 26,47
60-64 years old 6,36 4,47 0,81 27,34 23,12
65+ years old 11,20 6,69 1,71 43,89 11,54
Place of residence
Cities > 500k 28,89 10,40 12,33 34,48 33,99
Towns 200-500k 34,78 15,59 15,40 39,42 33,69
Towns 100-200k 34,46 13,29 10,64 35,55 31,14
Towns 20-100k 32,48 12,63 6,91 30,16 22,52
Towns < 20k 30,37 14,15 8,93 30,35 23,06
Rural areas 26,04 9,76 7,13 21,73 16,92
Voivodship
Dolnośląskie 28,71 11,37 10,49 29,12 21,40
Kujawsko-pomorskie 23,29 8,48 9,40 22,82 20,55
Lubelskie 24,65 11,19 3,78 27,02 20,16
Lubuskie 29,15 10,80 4,75 26,84 22,95
Łódzkie 24,30 10,36 8,55 22,11 23,77
Małopolskie 31,97 12,70 8,20 29,45 24,74
Mazowieckie 27,09 9,21 10,53 28,72 28,55
Opolskie 28,79 7,79 5,89 31,68 23,22
Podkarpackie 28,97 10,50 6,28 24,77 20,68
Podlaskie 35,09 18,34 7,76 35,66 27,33
Pomorskie 25,03 11,44 8,06 27,26 21,11
Śląskie 98,23 95,21 95,08 98,15 97,61
Świętokrzyskie 23,01 8,93 8,43 19,33 20,26
Warmińsko-mazurskie 23,10 9,81 8,76 30,28 14,48
Wielkopolskie 25,37 8,36 6,33 25,93 22,02
Zachodniopomorskie 50,94 27,51 19,17 54,67 35,48
Education
Primary and below 25,30 15,86 5,15 18,21 7,83
Vocational 37,85 14,86 7,13 24,33 11,97
Secondary 30,13 12,48 10,19 29,30 21,46
Tertiary/post-secondary 25,96 9,66 11,02 37,05 39,68
Income per capita
First quartile 32,68 11,96 8,81 23,15 13,77
Middle 50% 31,15 12,69 7,90 27,45 19,44
Fourth quartile 28,75 11,01 10,77 36,41 35,76
Social-professional status
Public sector employees 21,44 8,34 8,31 34,73 34,95
Private sector employees 31,78 13,20 11,79 32,65 31,47
Self-employed 27,22 12,08 13,33 29,74 46,43
Farmers 26,57 11,86 4,92 28,21 13,02
Disability pensioners 31,58 10,30 7,03 28,42 8,25
Retirees 12,83 6,10 1,81 30,37 10,80
Students 42,56 16,80 9,72 26,68 13,49
Unemployed 29,96 11,23 7,97 24,64 7,20
Other professionally inactive 30,61 10,37 9,36 26,52 11,31

Social Diagnosis 2007 Appendix 2 224
© The Council for Social Monitoring
Table P137. Please specify how many times on average you made a call or sent an SMS/MMS from your mobile
phone to other people during one day last week?
Social-demografic group
up to 2 3-4 5-7 8 and
more
Total 43,83 10,98 13,44 31,76
Gender
Men 41,37 10,47 13,03 35,13
Women 45,87 11,38 13,80 28,95
Age
up to 24 years old 13,05 8,67 14,71 63,57
25-34 years old 20,03 13,02 19,12 47,83
35-44 years old 34,11 15,33 18,57 31,98
45-59 years old 54,60 12,16 12,48 20,77
60-64 years old 69,18 13,07 9,38 8,38
65+ years old 89,71 4,11 3,22 2,97
Place of residence
Cities > 500k 33,71 12,43 15,71 38,14
Towns 200-500k 34,50 13,31 15,50 36,69
Towns 100-200k 39,67 12,45 14,38 33,49
Towns 20-100k 39,86 11,56 14,35 34,24
Towns < 20k 41,45 10,99 13,11 34,46
Rural areas 53,66 9,14 11,54 25,67
Voivodship
Dolnośląskie 41,92 8,78 13,27 36,03
Kujawsko-pomorskie 46,13 7,59 12,85 33,44
Lubelskie 56,35 8,24 10,41 25,00
Lubuskie 42,73 15,99 12,21 29,07
Łódzkie 47,73 10,59 13,15 28,52
Małopolskie 48,14 10,68 12,20 28,98
Mazowieckie 39,81 11,40 13,29 35,50
Opolskie 45,71 12,29 11,14 30,86
Podkarpackie 48,51 9,82 13,39 28,27
Podlaskie 49,63 10,76 13,45 26,16
Pomorskie 31,03 16,08 15,09 37,80
Śląskie 38,59 11,53 15,84 34,03
Świętokrzyskie 54,95 8,91 9,65 26,49
Warmińsko-mazurskie 51,41 8,84 10,04 29,72
Wielkopolskie 37,74 12,85 16,13 33,27
Zachodniopomorskie 44,31 11,56 15,24 28,90
Education
Primary and below 79,10 5,09 6,16 9,65
Vocational 43,19 10,46 12,66 33,69
Secondary 34,32 12,47 15,35 37,85
Tertiary/post-secondary 27,36 14,85 18,49 39,29
Income per capita
First quartile 46,61 9,18 12,07 32,13
Middle 50% 47,04 10,48 12,63 29,85
Fourth quartile 39,29 12,27 15,12 33,32
Social-professional status
Public sector employees 29,23 16,11 19,92 34,73
Private sector employees 25,68 12,62 17,41 44,29
Self-employed 15,06 10,71 15,61 58,62
Farmers 66,20 10,23 9,77 13,80
Disability pensioners 68,98 9,61 8,92 12,49
Retirees 81,41 7,01 5,39 6,20
Students 12,76 8,04 15,41 63,79
Unemployed 44,76 11,85 13,90 29,50
Other professionally
inactive 43,38 12,31 13,58 30,72
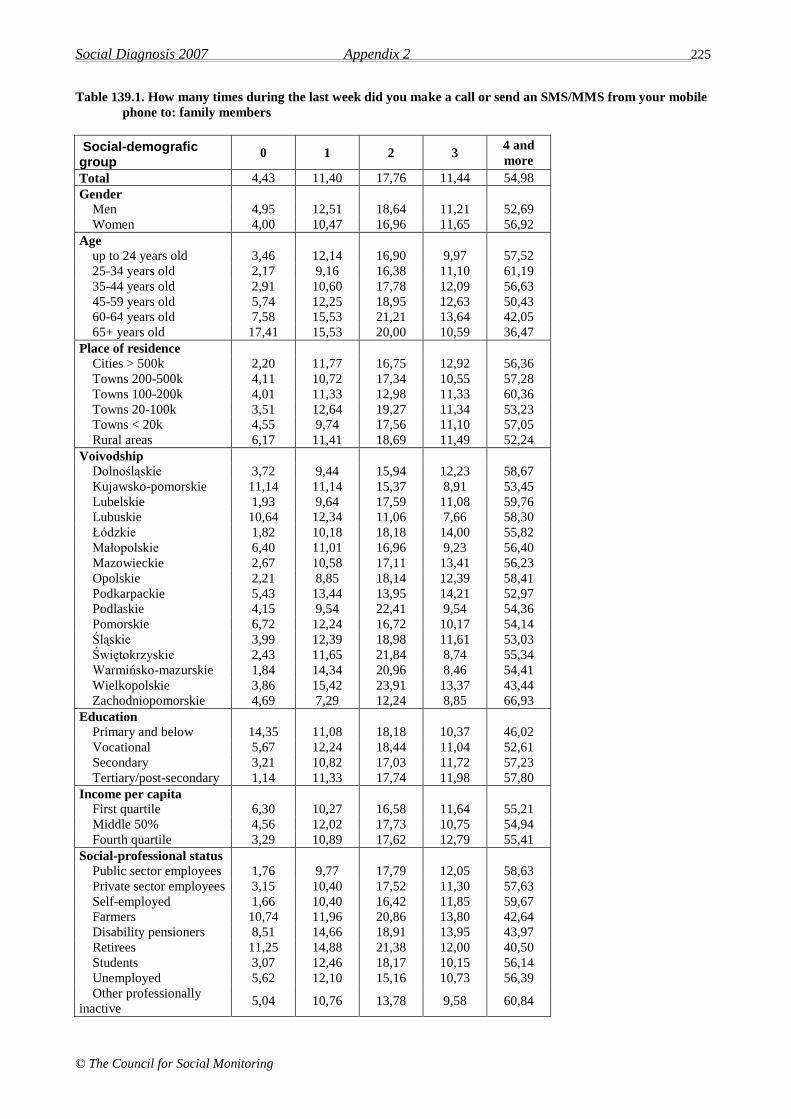
Social Diagnosis 2007 Appendix 2 225
© The Council for Social Monitoring
Table 139.1. How many times during the last week did you make a call or send an SMS/MMS from your mobile
phone to: family members
Social-demografic group
0 1 2 3 4 and
more
Total 4,43 11,40 17,76 11,44 54,98
Gender
Men 4,95 12,51 18,64 11,21 52,69
Women 4,00 10,47 16,96 11,65 56,92
Age
up to 24 years old 3,46 12,14 16,90 9,97 57,52
25-34 years old 2,17 9,16 16,38 11,10 61,19
35-44 years old 2,91 10,60 17,78 12,09 56,63
45-59 years old 5,74 12,25 18,95 12,63 50,43
60-64 years old 7,58 15,53 21,21 13,64 42,05
65+ years old 17,41 15,53 20,00 10,59 36,47
Place of residence
Cities > 500k 2,20 11,77 16,75 12,92 56,36
Towns 200-500k 4,11 10,72 17,34 10,55 57,28
Towns 100-200k 4,01 11,33 12,98 11,33 60,36
Towns 20-100k 3,51 12,64 19,27 11,34 53,23
Towns < 20k 4,55 9,74 17,56 11,10 57,05
Rural areas 6,17 11,41 18,69 11,49 52,24
Voivodship
Dolnośląskie 3,72 9,44 15,94 12,23 58,67
Kujawsko-pomorskie 11,14 11,14 15,37 8,91 53,45
Lubelskie 1,93 9,64 17,59 11,08 59,76
Lubuskie 10,64 12,34 11,06 7,66 58,30
Łódzkie 1,82 10,18 18,18 14,00 55,82
Małopolskie 6,40 11,01 16,96 9,23 56,40
Mazowieckie 2,67 10,58 17,11 13,41 56,23
Opolskie 2,21 8,85 18,14 12,39 58,41
Podkarpackie 5,43 13,44 13,95 14,21 52,97
Podlaskie 4,15 9,54 22,41 9,54 54,36
Pomorskie 6,72 12,24 16,72 10,17 54,14
Śląskie 3,99 12,39 18,98 11,61 53,03
Świętokrzyskie 2,43 11,65 21,84 8,74 55,34
Warmińsko-mazurskie 1,84 14,34 20,96 8,46 54,41
Wielkopolskie 3,86 15,42 23,91 13,37 43,44
Zachodniopomorskie 4,69 7,29 12,24 8,85 66,93
Education
Primary and below 14,35 11,08 18,18 10,37 46,02
Vocational 5,67 12,24 18,44 11,04 52,61
Secondary 3,21 10,82 17,03 11,72 57,23
Tertiary/post-secondary 1,14 11,33 17,74 11,98 57,80
Income per capita
First quartile 6,30 10,27 16,58 11,64 55,21
Middle 50% 4,56 12,02 17,73 10,75 54,94
Fourth quartile 3,29 10,89 17,62 12,79 55,41
Social-professional status
Public sector employees 1,76 9,77 17,79 12,05 58,63
Private sector employees 3,15 10,40 17,52 11,30 57,63
Self-employed 1,66 10,40 16,42 11,85 59,67
Farmers 10,74 11,96 20,86 13,80 42,64
Disability pensioners 8,51 14,66 18,91 13,95 43,97
Retirees 11,25 14,88 21,38 12,00 40,50
Students 3,07 12,46 18,17 10,15 56,14
Unemployed 5,62 12,10 15,16 10,73 56,39
Other professionally
inactive 5,04 10,76 13,78 9,58 60,84
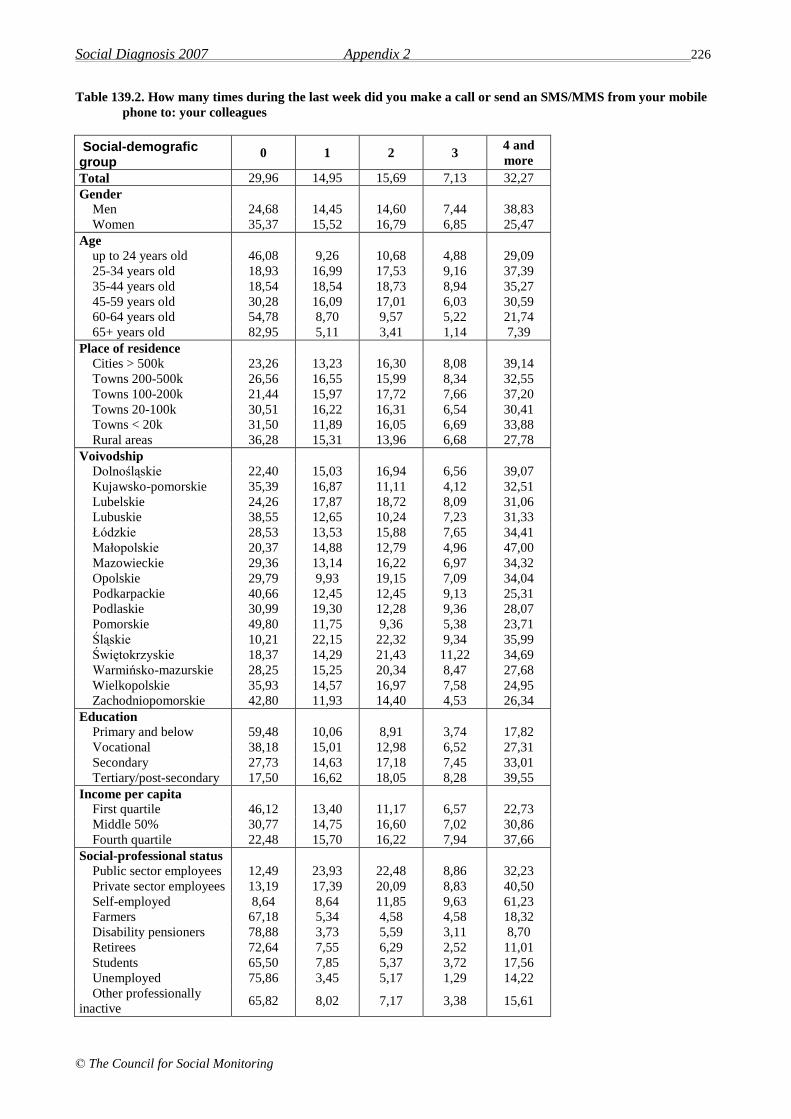
Social Diagnosis 2007 Appendix 2 226
© The Council for Social Monitoring
Table 139.2. How many times during the last week did you make a call or send an SMS/MMS from your mobile
phone to: your colleagues
Social-demografic group
0 1 2 3 4 and
more
Total 29,96 14,95 15,69 7,13 32,27
Gender
Men 24,68 14,45 14,60 7,44 38,83
Women 35,37 15,52 16,79 6,85 25,47
Age
up to 24 years old 46,08 9,26 10,68 4,88 29,09
25-34 years old 18,93 16,99 17,53 9,16 37,39
35-44 years old 18,54 18,54 18,73 8,94 35,27
45-59 years old 30,28 16,09 17,01 6,03 30,59
60-64 years old 54,78 8,70 9,57 5,22 21,74
65+ years old 82,95 5,11 3,41 1,14 7,39
Place of residence
Cities > 500k 23,26 13,23 16,30 8,08 39,14
Towns 200-500k 26,56 16,55 15,99 8,34 32,55
Towns 100-200k 21,44 15,97 17,72 7,66 37,20
Towns 20-100k 30,51 16,22 16,31 6,54 30,41
Towns < 20k 31,50 11,89 16,05 6,69 33,88
Rural areas 36,28 15,31 13,96 6,68 27,78
Voivodship
Dolnośląskie 22,40 15,03 16,94 6,56 39,07
Kujawsko-pomorskie 35,39 16,87 11,11 4,12 32,51
Lubelskie 24,26 17,87 18,72 8,09 31,06
Lubuskie 38,55 12,65 10,24 7,23 31,33
Łódzkie 28,53 13,53 15,88 7,65 34,41
Małopolskie 20,37 14,88 12,79 4,96 47,00
Mazowieckie 29,36 13,14 16,22 6,97 34,32
Opolskie 29,79 9,93 19,15 7,09 34,04
Podkarpackie 40,66 12,45 12,45 9,13 25,31
Podlaskie 30,99 19,30 12,28 9,36 28,07
Pomorskie 49,80 11,75 9,36 5,38 23,71
Śląskie 10,21 22,15 22,32 9,34 35,99
Świętokrzyskie 18,37 14,29 21,43 11,22 34,69
Warmińsko-mazurskie 28,25 15,25 20,34 8,47 27,68
Wielkopolskie 35,93 14,57 16,97 7,58 24,95
Zachodniopomorskie 42,80 11,93 14,40 4,53 26,34
Education
Primary and below 59,48 10,06 8,91 3,74 17,82
Vocational 38,18 15,01 12,98 6,52 27,31
Secondary 27,73 14,63 17,18 7,45 33,01
Tertiary/post-secondary 17,50 16,62 18,05 8,28 39,55
Income per capita
First quartile 46,12 13,40 11,17 6,57 22,73
Middle 50% 30,77 14,75 16,60 7,02 30,86
Fourth quartile 22,48 15,70 16,22 7,94 37,66
Social-professional status
Public sector employees 12,49 23,93 22,48 8,86 32,23
Private sector employees 13,19 17,39 20,09 8,83 40,50
Self-employed 8,64 8,64 11,85 9,63 61,23
Farmers 67,18 5,34 4,58 4,58 18,32
Disability pensioners 78,88 3,73 5,59 3,11 8,70
Retirees 72,64 7,55 6,29 2,52 11,01
Students 65,50 7,85 5,37 3,72 17,56
Unemployed 75,86 3,45 5,17 1,29 14,22
Other professionally
inactive 65,82 8,02 7,17 3,38 15,61

Social Diagnosis 2007 Appendix 2 227
© The Council for Social Monitoring
Table 139.3. How many times during the last week did you make a call or send an SMS/MMS from your mobile
phone to: friends
Social-demografic group
0 1 2 3 4 and
more
Total 8,97 14,81 16,13 8,38 51,70
Gender
Men 9,13 14,63 15,14 8,57 52,53
Women 8,82 14,94 17,03 8,23 50,98
Age
up to 24 years old 1,38 4,30 6,77 6,13 81,42
25-34 years old 5,68 15,38 17,44 8,51 52,99
35-44 years old 8,99 20,09 21,81 10,56 38,55
45-59 years old 16,75 21,28 20,63 9,83 31,50
60-64 years old 21,20 23,37 23,91 7,07 24,46
65+ years old 33,77 20,53 18,87 6,95 19,87
Place of residence
Cities > 500k 7,06 18,24 15,53 8,03 51,14
Towns 200-500k 8,64 16,57 15,55 8,43 50,81
Towns 100-200k 6,91 14,13 17,11 8,32 53,53
Towns 20-100k 6,90 15,66 18,58 8,43 50,43
Towns < 20k 10,30 11,57 15,07 8,39 54,67
Rural areas 11,26 13,63 15,21 8,50 51,40
Voivodship
Dolnośląskie 5,00 12,14 13,57 9,64 59,64
Kujawsko-pomorskie 15,05 13,78 13,27 6,38 51,53
Lubelskie 2,62 14,53 17,15 9,30 56,40
Lubuskie 15,49 9,86 15,96 7,04 51,64
Łódzkie 6,24 15,80 15,59 7,69 54,68
Małopolskie 7,45 17,33 13,52 7,63 54,07
Mazowieckie 8,01 15,22 15,82 8,81 52,15
Opolskie 4,55 13,64 16,16 8,08 57,58
Podkarpackie 9,86 13,24 12,68 7,89 56,34
Podlaskie 8,33 16,20 14,81 9,26 51,39
Pomorskie 19,49 14,34 16,18 7,72 42,28
Śląskie 4,98 17,16 20,23 8,90 48,73
Świętokrzyskie 3,43 14,86 14,86 8,57 58,29
Warmińsko-mazurskie 8,73 10,32 15,87 9,92 55,16
Wielkopolskie 14,33 18,06 20,30 8,81 38,51
Zachodniopomorskie 8,94 9,78 14,53 7,26 59,50
Education
Primary and below 23,60 13,33 16,58 8,65 37,84
Vocational 10,48 12,31 12,69 6,86 57,67
Secondary 6,88 14,85 16,46 8,58 53,23
Tertiary/post-secondary 5,39 18,56 20,09 10,05 45,91
Income per capita
First quartile 9,76 10,30 12,81 6,41 60,72
Middle 50% 9,66 14,19 15,22 8,37 52,56
Fourth quartile 7,92 17,81 18,18 10,21 45,88
Social-professional status
Public sector employees 7,50 21,42 19,26 9,74 42,07
Private sector employees 8,34 16,35 17,62 9,80 47,88
Self-employed 6,47 13,68 19,40 8,71 51,74
Farmers 18,75 19,49 20,22 7,35 34,19
Disability pensioners 17,10 16,52 16,52 8,41 41,45
Retirees 24,35 19,48 22,09 9,22 24,87
Students 0,65 3,16 6,23 5,59 84,37
Unemployed 9,77 12,11 13,87 6,05 58,20
Other professionally
inactive 8,58 14,23 16,76 7,21 53,22
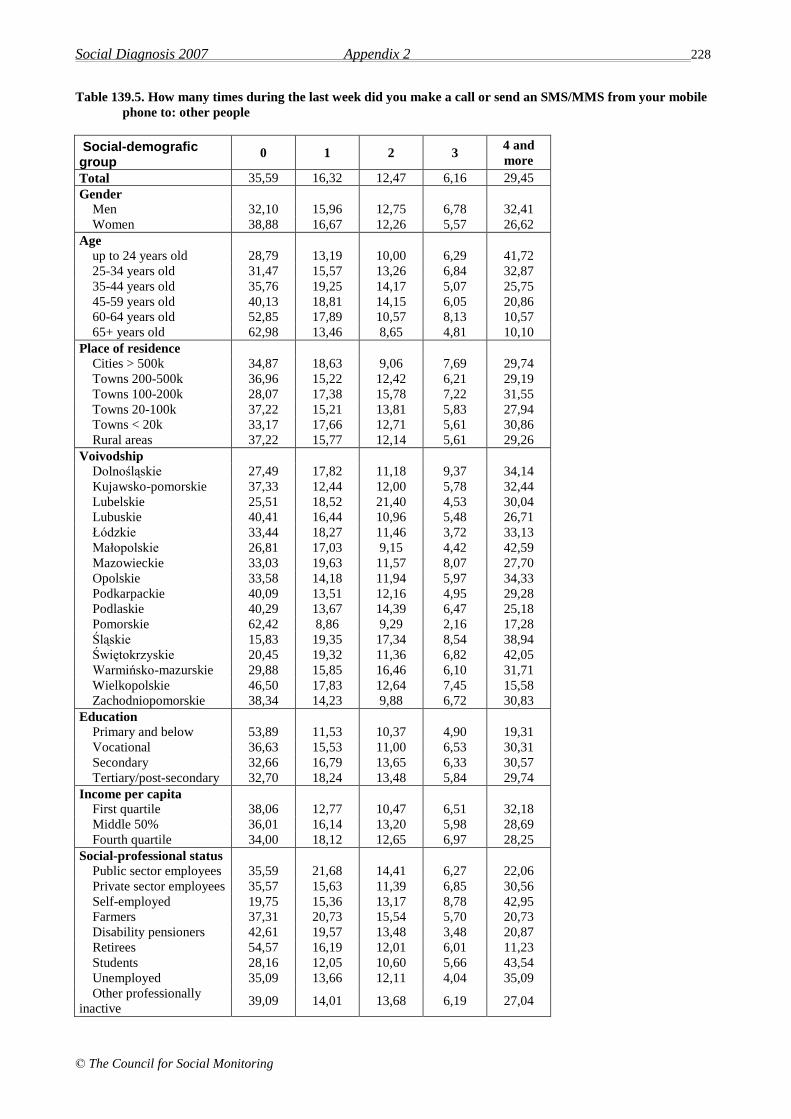
Social Diagnosis 2007 Appendix 2 228
© The Council for Social Monitoring
Table 139.5. How many times during the last week did you make a call or send an SMS/MMS from your mobile
phone to: other people
Social-demografic group
0 1 2 3 4 and
more
Total 35,59 16,32 12,47 6,16 29,45
Gender
Men 32,10 15,96 12,75 6,78 32,41
Women 38,88 16,67 12,26 5,57 26,62
Age
up to 24 years old 28,79 13,19 10,00 6,29 41,72
25-34 years old 31,47 15,57 13,26 6,84 32,87
35-44 years old 35,76 19,25 14,17 5,07 25,75
45-59 years old 40,13 18,81 14,15 6,05 20,86
60-64 years old 52,85 17,89 10,57 8,13 10,57
65+ years old 62,98 13,46 8,65 4,81 10,10
Place of residence
Cities > 500k 34,87 18,63 9,06 7,69 29,74
Towns 200-500k 36,96 15,22 12,42 6,21 29,19
Towns 100-200k 28,07 17,38 15,78 7,22 31,55
Towns 20-100k 37,22 15,21 13,81 5,83 27,94
Towns < 20k 33,17 17,66 12,71 5,61 30,86
Rural areas 37,22 15,77 12,14 5,61 29,26
Voivodship
Dolnośląskie 27,49 17,82 11,18 9,37 34,14
Kujawsko-pomorskie 37,33 12,44 12,00 5,78 32,44
Lubelskie 25,51 18,52 21,40 4,53 30,04
Lubuskie 40,41 16,44 10,96 5,48 26,71
Łódzkie 33,44 18,27 11,46 3,72 33,13
Małopolskie 26,81 17,03 9,15 4,42 42,59
Mazowieckie 33,03 19,63 11,57 8,07 27,70
Opolskie 33,58 14,18 11,94 5,97 34,33
Podkarpackie 40,09 13,51 12,16 4,95 29,28
Podlaskie 40,29 13,67 14,39 6,47 25,18
Pomorskie 62,42 8,86 9,29 2,16 17,28
Śląskie 15,83 19,35 17,34 8,54 38,94
Świętokrzyskie 20,45 19,32 11,36 6,82 42,05
Warmińsko-mazurskie 29,88 15,85 16,46 6,10 31,71
Wielkopolskie 46,50 17,83 12,64 7,45 15,58
Zachodniopomorskie 38,34 14,23 9,88 6,72 30,83
Education
Primary and below 53,89 11,53 10,37 4,90 19,31
Vocational 36,63 15,53 11,00 6,53 30,31
Secondary 32,66 16,79 13,65 6,33 30,57
Tertiary/post-secondary 32,70 18,24 13,48 5,84 29,74
Income per capita
First quartile 38,06 12,77 10,47 6,51 32,18
Middle 50% 36,01 16,14 13,20 5,98 28,69
Fourth quartile 34,00 18,12 12,65 6,97 28,25
Social-professional status
Public sector employees 35,59 21,68 14,41 6,27 22,06
Private sector employees 35,57 15,63 11,39 6,85 30,56
Self-employed 19,75 15,36 13,17 8,78 42,95
Farmers 37,31 20,73 15,54 5,70 20,73
Disability pensioners 42,61 19,57 13,48 3,48 20,87
Retirees 54,57 16,19 12,01 6,01 11,23
Students 28,16 12,05 10,60 5,66 43,54
Unemployed 35,09 13,66 12,11 4,04 35,09
Other professionally
inactive 39,09 14,01 13,68 6,19 27,04