srlf dabor - paris descartes€¦ · page 1 what can we learn from analysis of the toxicokinetic /...
TRANSCRIPT

Page 1
What can we learn from analysis of the
toxicokinetic / toxicodynamic relationships
in acute poisonings?
Bruno Mégarbane, MD, PhD
Réanimation Médicale et Toxicologique,
INSERM U705 - CNRS, UMR 7157, Université Paris 7,
Hôpital Lariboisière, Paris, France
Epidemiology of acute poisonings
Acute poisoning: a leading cause of hospital admission and mortality in youths.
A poisoning should be considered as severe if : • Life-threatening symptoms occur, including hemodynamic instability, heart dysrhythmia or conduction disturbances, coma, seizures, respiratory failure or alveolar hypoventilation • The patient has been exposed to a large amount of toxicant requiring a close monitoring • The patient is more vulnerable (co-morbidities, elderly or infants)
French Society of Critical Care Medicine Réanimation 2006
Acute poisoning, a dynamic process
Increasing symptoms
Possible sequellae
Possible death
time T0
Favorable outcome Delay
24 to 72 h
exposition Danel V, 2005
• Diagnosis in medical toxicology relies on the clinical approach (history + toxidrome) . • Management of poisoned patients is mainly based on supportive treatments and antidotes if available. • For emergent management, the routine biological tests are more important than the toxicological analysis.
Place of toxicological analysis
French Society of Critical Care Medicine Réanimation 2006
• Ethanol poisoning
• Ethylene glycol
• Fluorhydric acid
• Cyanide
• Anti-vitamin K
• Organophosphates
• Iron salts
Intoxication Biological tests Toxicological analysis
Serum glucose
Arterial pH and anionic gap
Serum calcium
Lactate
Prothrombin time
Red cell cholinesterases
Blood iron concentration
Plasma ethanol
Plasma ethylene glycol
Blood fluoride
Blood cyanide - - -
Place of toxicological biochemistry in a situation of emergency
Signal
measurement
Interpretation
- Diagnostic
- Prognostic
- Thérapeutical
Interest
of analysis
Sampling Blood/plasma
Urine
Gastric liquid
But also:
Salive
Sweat
Hair
Detection
Separation +
Detection
Quantification
What is a toxicological analysis?
x
x x x
x
Urine Blood

Page 2
Prognostic value of plasma concentration measurement in the case of injuring toxicants
Acetaminophen poisonings: Prescott normogram
Paraquat poisonings: Proudfoot and Scherrmann normograms
Concentration Target
Temps
Apnea Coma Shock
Toxicodynamics Toxicokinetics
Dual aspects of any toxic phenomenon
Mégarbane B. Expert Opin Drug Metab Toxicol 2008
Definitions …
Intoxication: interaction between a toxicant / target cells (biological mechanisms)
Concentration at the target tissue
(Ir)reversible cellular modifications
Clinical signs and symptoms
Toxicokinetics: Concentration = f (Time)
Toxicodynamics: Effect = f (Dose)
Dynetics: Effect = f (Time)
TK/TD relationship : Effect = f (Time-course concentration)
PK/PD relationships … in pharmacology
Analgesics
Hypnotics
Anticonvulsive drugs
Cardiovascular
Steroids
Antibiotics
Anticancer drugs
Fields of application :
How the drug acts on the organism …
How the organism acts on the drug …
PK/PD relationships … in toxicology
More difficult because: - The ingested dose and ingestion date are generally unknown - Measurement of blood concentrations is not routinely performed
- A reversible PD effect is not directly attributable to the toxicant and easily measurable in clinical practice
Signs:
• Physicians
• Nurses
• Researchers
Analysis:
• LCHP
• LCMS
• GCMS
PK/PD:
• Data base
• Mathematical
analysis
Severity Blood Conc
Functional toxicant – Injuring toxicant
t
x
x x
x
x
I- Functional toxicants : Severity factors
II- Injuring toxicants : Prognosis factors
t
x
x
x
x
x
Severity Blood Conc x

Page 3
The concept of “biophase”
Definition: The virtual compartment containing the receptors that interact with the active compound
Each active compound should reach its target site to exhibit its effects No simple relationship between concentrations in blood and biophase.
Corresponds to the delay between the occurrence of the effects and evolution of the concentrations
The onset of effects depends on: Distribution according to the specificities of the target tissue (anatomy,
perfusion, permeability, …) Metabolism if the ingested compound is inactive. Cellular events (receptor affinity, transduction, post-receptor events, …)
Clockwise hysteresis Effect decreases more quickly than concentrations
Anticlockwise hysteresis Effect decreases more slowly than concentrations
Hypothetical PK/PD relationships showing clockwise or anticlockwise hysteresis
When connected in chronological order, the manner in which the data points appear allows one to define a hysteresis loop, meaning that the time courses of concentration and effect are out of phase.
100
125
150
175
200
225
0 2,5 5 7,5 10 12,5 15
Ex
pir
ato
ry t
ime
(% o
f b
as
al
va
lue
)
Plasma pralidoxime concentrations (mg.L-1)
Concentration = 7,1 mg.L-1
in elimination phase = inefficiency
Theoric limit
Concentration = 7,3 mg.L-1
in resorption phase = efficience
Houzé P. Tox Sci 2010
PK/PD relationships for pralidoxime treatment of OP-related respiratory depression in rats Correlation between toxicity and blood concentrations
in acute ethanol poisoning
0.9 – 2.5 g/l: euphoria - excitation
1.8 - 3 g/l: confusion
2.5 – 4.5 g/l: stupor, coma
> 4.5 g/l: respiratory depression,
death
Are you drunk?
Correlation between toxicity and plasma concentrations in acute theophyline poisonings
10-20 mg/l (55-110 µmol/l): Therapeutic level
20-40 mg/l: Minor toxicity
40-100 mg/l: Moderate toxicity
> 100 mg/l: Severe toxicity
> 120 mg/l: Risk of convulsions (50%)
EXPOSURE
VARIABILITIES
PHARMACODYNAMICS (Receptors : number and affinity)
PHARMACOKINETICS (A.D.M.E)
GENETIC POLYMORPHISM
PHYSIOLOGY (Age, sex, weight, …)
PATHOLOGY (Renal, liver, and cardiac insufficiencies, burnings, …)
CHRONOBIOLOGY
ENVIRONMENT OBSERVANCE TOLERANCE DIFFRENCES BETWEEN
THE ACTIVE CONCENTRATIONS
AND THE EFFECTS
Sources of individual variability

Page 4
Effecting proteins represent the origin of the variability
750 (368 cloned)
10n
40 a
2 a
30 a
Receptors
Signal transducing proteins and other pharmacological targets
Metabolism enzymes
Circulating transport proteins
Membrane transport proteins
PD (TD) PK (TK)
a) Number implicated in chemotherapy
Phase I Phase II
Gene polymorphism in the enzymes implicated in the drug metabolism
Guengerich FP, Mol Interv 2003
Metabolic ratio (log)
Gene polymorphism of CYP 2D6
Rapid
Metabolizers
(85-90 %)
Slow
Metabolizers
(7-10 %)
Ultra-rapid metabolizers
(1-7 %)
Clinical consequences of gene polymorphism of CYP 2D6
CYP 2D6 (MR)
CODEINE CODEINE- 6- GLUCURONIDE
10%
MORPHINE
MORPHINE 3 and 6- GLUCURONIDE
NORCODEINE
CYP 3A4
UGT
CODEINE CODEINE - 6- GLUCURONIDE
NORCODEINE
CYP 3A4
Slow metabolizer
Phenotype
without
analgesic
pattern
CYP 2D6 (MR)
CODEINE CODEINE- 6- GLUCURONIDE
NORCODEINE
CYP 3A4
Rapid metabolizer
Phenotype
with
hyperproduction of
morphine
Case report 1 -
Male 62 yrs, Chronic lymph leukemia
Bilateral pneumonia, fever, cough
D1: ceftriaxone + clarithromycine + voriconazole + codeine (25 mg x 3/d)
D4: consciousness impairment (GCS: 6), with myosis
Naloxone 0,4 mg/h: normal consciousness
Biology
– Creatinine: 182 µmol/L
Pharmaceutical concentrations:
– Codeine 114 µg/L (N: 13-75)
– Morphine 80 µg/L (N: 1-4)
– G6M 136 µg/L (N: 1-13)
Genotyping:
– CYP2D6 ultra-rapid
Gasche et al. NEJM 2004
Case report 2 -
Normal pregnancy and birth
Postpartum pain:
– Codeine 120 mg/d
– Paracetamol 500 mg/d
D7: sleepness, reduced milk intake
D13: death of the new-born
Autopsy:
– No congenital disease
– Morphine in blood 70 µg/L (N: 10-12)
– Paracetamol in blood : 5.9 µg/L
Maternal gentoyping:
– heterozygote CYP2D6*2x2 (ultrarapid)
– UGT2B7*2 (ultrarapid))
Koren et al. Lancet 2007

Page 5
Elkalioubie A. Eur J Clin Pharmacol 2011
Near-fatal tramadol cardiotoxicity in a CYP2D6 ultrarapid metabolizer
- Ultrarapid metabolizer phenotype suggested by tramadol/M1 metabolic ratio
- Heterozygous for duplicated wt allele predictive of CYP2D6 ultrarapid metabolizer
phenotype
+ Ketoconazole at inhibitory concentration of CYP3A/CYPB6 (200 ng/ml)
Tramadol
O-desmethyltramadol (M1)
N-desmethyltramadol (M2)
CYP2D6 CYP2B6/CYP3A4
Steps of the pharmacokinetics
ABSORPTION
DISTRIBUTION
METABOLISM
EXCRETION
Enterocyte
Endothelial cell (BBB)
Hepatocyte
Renal
epithelium
Phase 1: CYP,…
Phase 2: UGT, SULT, GST, NAT…
M
M
M-OH
M-O-R
Phase 0
Phase 3
T
T
M-O-R
INTESTINE (enterocyte)
FECES ORAL EXPOSURE Secretion Absorption
LIVER (hepatocyte)
BILE
Efflux
Uptake
Excretion
BBB (brain
microcapillary endothelial cell)
Efflux Uptake
BRAIN
KIDNEY (tubule proximal cell)
URINE
Secretion
Reabsorption
Filtration
From JM SCHERRMANN-Comprehensive Med Chem 2007
PHARMACOKINETIC ROLE OF TRANSPORTERS
ABC (ATP Binding Cassette) SUPERFAMILY 48 human genes; 9 drug transporters
Two superfamilies involved in drug transport
http://nutrigene.4t.com/human abc.htm
Paulsen, FEBS Lett 1998 ; J Mol Biol 1998
• SLC (Solute Linker Carrier) SUPERFAMILY 362 mammalian genes; ≈ 30 drug transporters
http://www.gene.ulc.ac.uk/nomenclature
INFLUX
EFFLUX
They share commun Substrates and Inhibitors with similar ranges of active concentrations (from µM to mM)
They share similar regulation pathways from gene to protein expression (induction, repression of genes...)
They are sensitive to genetic polymorphisms, physiological and disease states
They follow Michaelis-Menten kinetics like metabolism enzymes
Common Properties between Enzyme and Transporter Proteins
Subfamilies ABCA ABCB ABCC ABCD ABCE ABCF ABCG
Members 12 11 12 4 1 3 5
Important isoforms for PK
? ABCB1
(P-gp)
ABCCs
(MRPs) ? ? ? ABCG2
(BCRP)
N = 48 in humans, 7 subfamilies
Superfamily of ABC (ATP-Binding Cassette) transportors
P-gp: P-glycoprotéine
MRPs: Multidrug resistance-associated proteins
BCRP: Breast cancer resistance protein

Page 6
P-glycoprotein substrates Anticancer agents
– Doxorubicine
– Vincristine
– Irinotecan
– Paclitaxel
– Inhibiteurs tyrosine kinase..
Anticoagulants – Dabigatran, …
Cardiovascular drugs – Digoxine
– Quinidine
– ivabradine
Antiproteases – Indinavir
– Nelfinavir
– Saquinavir
Anti-diarrhea drugs – Loperamide
Antibiotics – Erythromycine, …
Immunosuppressive agents – Cyclosporine – Tacrolimus
Steroids – Dexamethasone
Calcium channel blokers – Verapamil
Adrenergic antagonists – Talinolol
H1 Anti-histamine drugs – fexofenadine
H2 Anti-histamine drugs – Cimetidine
Antidepressants – Amitriptyline
Others – Colchicine – Phenytoine
Transporters expressed at the blood-brain barrier
Brain extracellular liquid
Astrocyte
Pericyte
Endothelial cell
Blood
MRP4
P-gp
BCRP
Basal membrane
Mechanisms of buprenorphine toxicity
BUP
Pharmacological effect
N-BUP
Central respiratory toxicity
Alhaddad. Crit Care Med 2012
Pharmacologic
or Genetic
P-gp inhibition
Pharmacongenetics of PK effectors for opioids
In red: proteins presenting functional SNP
Drug Transport Metabolism Metabolites Active
metabolite
Morphine P-glycoprotein UGT2B7 MM6G, M3G yes (M6G)
Codéine CYP2D6 Morphine yes
Methadone P-glycoprotein CYP3A4 EDDP no
Fentanyl P-glycoprotein CYP3A4 Norfentanyl no
Tramadol P-glycoprotein CYP2D6 M1, M2 yes (M1)
Oxycodone P-glycoprotein CYP2D6 oxymorphone yes
Modeling of individual TK-TD relationships
D --> Cp (t), Ct (t) --> Ce (t) --> E (t)
if Cp(t) and E(t) simultaneous ==> similar Ce(t) and Cp(t) kinetics
if Cp(t) and E(t) with delay ==> different Ce(t) and Cp(t) kinetics
• Mono- and multi-compartment modeling
• Kinetics of the effects E(t) according to the measured concentration (Ce, Cp ou Ct)
Linear model: E = S.C + E0
Semi-log model: E = S.logC + E0
E max model: E = Emax.C/Ec50 + E0
Sigmoidal model: E = Emax.Cen/EC50n + Cen
Cmax
Slope of toxicity
Threshold of toxicity
Emax
a E50
Plateau
EC50
Sigmoidal modeling of individual TK/TD relationships
Page 7
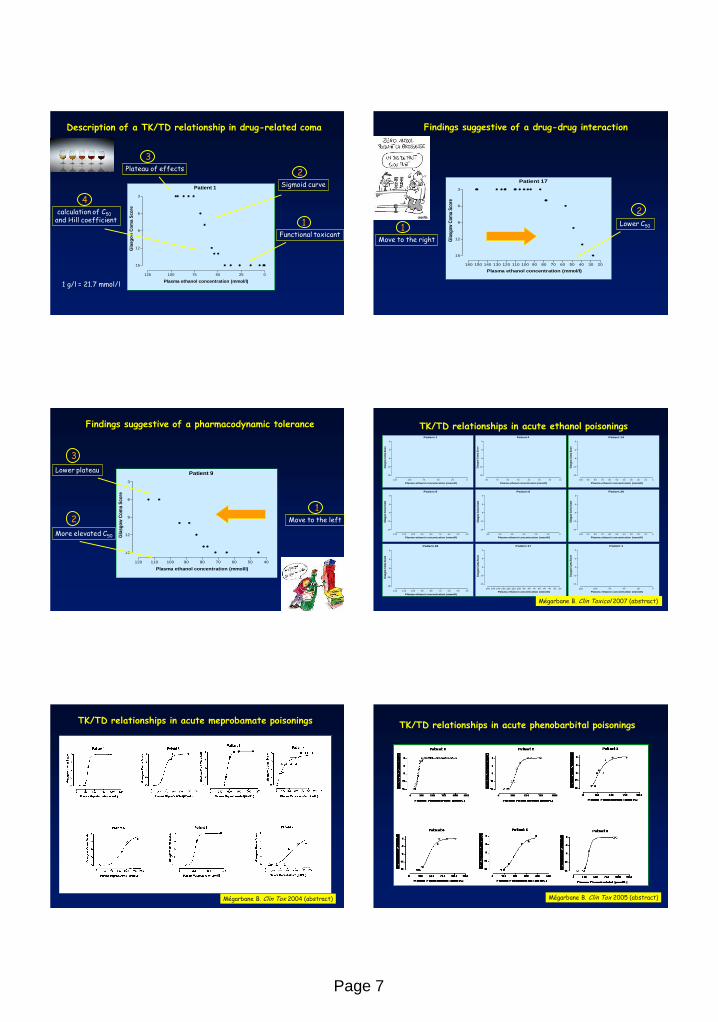
Description of a TK/TD relationship in drug-related coma
Patient 1
0255075100125
3
6
9
12
15
Plasma ethanol concentration (mmol/l)
Gla
sg
ow
Co
ma S
co
re
2 Sigmoid curve
1 Functional toxicant
4 calculation of C50 and Hill coefficient
3 Plateau of effects
1 g/l = 21.7 mmol/l
Patient 17
2030405060708090100110120130140150160
3
6
9
12
15
Plasma ethanol concentration (mmol/l)
Gla
sgo
w C
om
a S
core
2 Lower C50 1
Move to the right
Findings suggestive of a drug-drug interaction
Patient 9
405060708090100110120
3
6
9
12
15
Plasma ethanol concentration (mmol/l)
Gla
sg
ow
Co
ma S
co
re
2
More elevated C50
1 Move to the left
3
Lower plateau
Findings suggestive of a pharmacodynamic tolerance TK/TD relationships in acute ethanol poisonings Patient 1
0255075100125
3
6
9
12
15
Plasma ethanol concentration (mmol/l)
Gla
sgow
Com
a S
core
Patient 9
405060708090100110120
3
6
9
12
15
Plasma ethanol concentration (mmol/l)
Gla
sgow
Com
a S
core
Patient 4
1020304050607080
3
6
9
12
15
Plasma ethanol concentration (mmol/l)
Gla
sgo
w C
om
a S
core
Patient 6
0102030405060
3
6
9
12
15
Plasma ethanol concentration (mmol/l)
Gla
sgow
Com
a S
core
Patient 14
0102030405060708090100
3
6
9
12
15
Plasma ethanol concentration (mmol/l)
Gla
sgow
Com
a S
core
Patient 17
2030405060708090100110120130140150160
3
6
9
12
15
Plasma ethanol concentration (mmol/l)
Gla
sgow
Com
a S
core
Patient 18
405060708090100110120
3
6
9
12
15
Plasma ethanol concentration (mmol/l)
Gla
sgow
Com
a S
core
Patient 20
0102030405060708090100
3
6
9
12
15
Plasma ethanol concentration (mmol/l)
Gla
sgow
Com
a S
core
Patient 1
0255075100125
3
6
9
12
15
Plasma ethanol concentration (mmol/l)
Gla
sgow
Com
a S
core
Mégarbane B. Clin Toxicol 2007 (abstract)
TK/TD relationships in acute meprobamate poisonings
Mégarbane B. Clin Tox 2004 (abstract)
TK/TD relationships in acute phenobarbital poisonings
Mégarbane B. Clin Tox 2005 (abstract)

Page 8
Description of the sigmoidal models to represent
TK/TD relationships in psychoactive drug poisonings
Hill coefficients C50
14.9 [5.7-75.9] 61.2 mmol/l [38.9-96.3]
10.1 [2.8-49.2] 384 µmol/l [116-772]
4.8 [2.5-11.8] 257 µmol/l [160-442]
Ethanol
Meprobamate
Phenobarbital 050100150200250300350400
3
6
9
12
15
Plasma GHB concentration (mg/l)
Gla
sg
ow
Co
ma S
co
re
Case report TK/TD relationship in GHB intoxication
EC50: 189 mg/l Hill coefficient: 9.2 R2: 0.96
M, 26 years Ethanol 36.1 mmol/l GHB 324 mg/l Unique consumption
Mégarbane B. Clin Toxicol 2007 (abstract)
0 5 10 15 20 25 30 35
100
1000
R,S-methadone
R-methadone
S-methadone Naloxone infusion rate
0.1
1
10
100
Time after ingestion (h)
Pla
sma
met
had
on
e co
nce
ntr
atio
ns
(ng
/ml)
Nalo
xon
e infu
sion
rate
(mg
/h)
0 250 500 750 1000 1250 15000.0
0.1
0.2
0.3
0.4
0.5
R,S-methadone concentration (ng/ml)
Nalo
xo
ne i
nfu
sio
n r
ate
(mg
/h)
0 100 200 300 400 500 600 7000.0
0.1
0.2
0.3
0.4
0.5
R-methadone concentration (ng/ml)
Nalo
xo
ne i
nfu
sio
n r
ate
(m
g/h
)
Mégarbane B. Crit Care 2007
Modeling of respiratory effects in methadone overdose
E0 0 Emax 0.78 µg/kg/min EC50 23.9 µmol/l Hill coefficient 1.79 R2 0.99
Mégarbane B. Intensive Care Med 2006
Modeling of cardiac toxicity in venlafaxine poisoning
Hypothesis: Slow CYP 2D6 metabolizer
Therapeutic range: 0.25-0.85 µmol/l
TK/TD variability according to the TD parameter used in flecainide poisonings
0.500.751.001.251.50
0.0
2.5
5.0
7.5
10.0 Patient 2
Flecainide concentration (mg/l)
Dob
utam
ine
infu
sion
(µg
/kg/
min
)
Catecholamine infusion rate QRS duration
Mégarbane B. Clin Tox 2005 (abstract)
Insulin self-poisonings: interests of TK-TD relationships to analyze the needs in dextrose infusion
Patient 1
05001000150020002500
0
5
10
15
Plasma insulin concentration (mIU/l)
Glu
co
se i
nfu
sio
n r
ate
(g
/h)
Patient 2
050100150200250
0
10
20
30
Plasma insulin concentration (mIU/l)
Glu
co
se i
nfu
sio
n r
ate
(g
/h)
Patient 3
02505007501000
0
50
100
150
Plasma insulin concentration (mIU/l)
Glu
co
se i
nfu
sio
n r
ate
(g
/h)
Patient 4
02500500075001000012500
0
10
20
30
40
Plasma insulin concentration (mIU/l)
Glu
co
se i
nfu
sio
n r
ate
(g
/h)
Patient 5
01000200030004000500060007000
0
10
20
30
40
50
60
Plasma insulin concentration (mIU/l)
Glu
co
se i
nfu
sio
n r
ate
(g
/h)
Patient 6
050100150200250
0
5
10
15
Plasma insulin concentration (mIU/l)
Glu
co
se i
nfu
sio
n r
ate
(g
/h)
Mégarbane B. Crit Care 2007

Page 9
TK/TD using blood concentrations TK/TD using plasma concentrations
Chloroquine poisonings: interests of measuring blood concentrations in comparison to plasma concentrations
0 25 50 75 100 125 1500.0
0.5
1.0
1.5
2.0
2.5
3.0
3.5
Blood chloroquine concentration (µmol/L)
Epin
ephr
ine
infu
sion
rat
e (m
g/h)
R2 = 0.96
0 10 20 30 40 500.0
0.5
1.0
1.5
2.0
Blood chloroquine concentration (µmol/L)
Epin
ephr
ine
infu
sion
rat
e (m
g/h) R2 = 0.91
0 1 2 3 4 5 6 7 8 90.0
0.5
1.0
1.5
2.0
Plasma chloroquine concentration (µmol/L)
Epi
neph
rine
infu
sion
rat
e (m
g/h)
0 5 10 15 20 250
1
2
3
4
Plasma chloroquine concentration (µmol/L)
Epin
ephr
ine
infu
sion
rat
e (m
g/h)
R2 = 0.05
R2 = 0.17
Patient 1
Patient 2
Mégarbane B. Clin Tox 2007 (abstract)
Interests of plasma lactate concentrations in acute cyanide poisonings
Baud F, Borron SW, Mégarbane B. Crit Care Med 2002
40 µM 100 µM
- - - - - - - - - - - - - - - - - - - - - - - - - - - - - - - - - - - - - - - F E D C B A
0
Severity
Blood concentrations
Interests of PK/PD relationships to understand the individual response to the treatments
- Is required when data are derived from studies with different designs and with great numbers of individuals with sparse and unbalanced data. - Allows estimation of population mean values of PK parameters, their inter-individual and intra-individual variability, as well as residual variability. - May test the influence of pertinent factors that could explain inter-individual variability including age, use of charcoal, and co-ingestions (CYP metabolism). - The Bayesian approach allows estimation of individual PK parameters from population parameters and concentrations/effects measured in the patient. - However, usually requires numerous statistical assumptions (for random and fixed effects distribution), estimation methods (algorithms & approximations), and softwares (NONMEM, PKBUGS/WinBUGS, S-PLUS, and MLwiN).
Population-based PK/PD methodology
Mégarbane B. Clin Tox2010
Goodness-of-fit plots : population predictions (PRED) versus observations (DV) and population-weighted residuals (WRES) versus predictions
Chloroquine poisoning: Design of a PK/PD model
Mégarbane B. Clin Tox2010
Comparison between the 10th (dash line), 50th (full line), and 90th (dash line) percentile obtained from 1,000 simulations and the observed data (DV, points)
Chloroquine poisoning: Evaluation of the final PK/PD model
Page 10
PK/PD population modelling in chloroquine poisonings
Mégarbane B. Clin Tox2010
Chloroquine poisonings: Simulated probability over time for having an epinephrine
infusion rate >3 mg/h
Mégarbane B. Clin Tox2011
QT prlongation following citalopram poisonings
Isbister G. BJCP2005
Risk reduction in escitalopram-related QT prolongtation with charcoal
No charcoal Charcoal
Van Gorp F. Br J Clin Pharm 2011
Moderate reduction in the risk of abnormal QT interval with SDAC
Dose-related lengthening of the QT interval lagging the increase in drug
concentration.
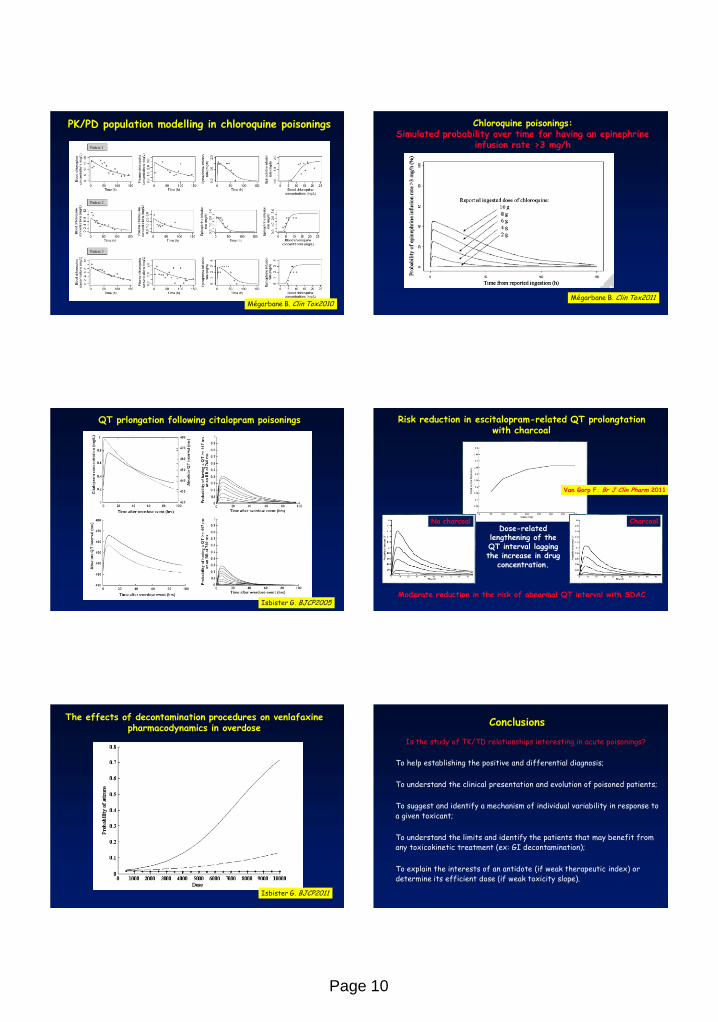
The effects of decontamination procedures on venlafaxine pharmacodynamics in overdose
Isbister G. BJCP2011
Conclusions
To help establishing the positive and differential diagnosis;
To understand the clinical presentation and evolution of poisoned patients;
To suggest and identify a mechanism of individual variability in response to a given toxicant;
To understand the limits and identify the patients that may benefit from any toxicokinetic treatment (ex: GI decontamination);
To explain the interests of an antidote (if weak therapeutic index) or determine its efficient dose (if weak toxicity slope).
Is the study of TK/TD relationships interesting in acute poisonings?