sri y.n.college(autonomous),narsapur
TRANSCRIPT
SRI Y.N.COLLEGE(Autonomous),Narsapur
Affiliated to Adikavi Nannaya University
Thrice accredited by NAAC with ‘A’ Grade
Recognized by UGC as ‘College with potential for Excellence’
I B.Sc. Statistics – Paper I
Descriptive Statistics
(for 2020-23 batch w. e. f 2020-2021)
UNIT-I: Introduction to Statistics: (Shorts -1, Essays– 2)
Importance of Statistics. Scope of Statistics in different fields. Concepts of primary and
secondary data. Diagrammatic and graphical representation of data: Histogram, frequency polygon,
Ogives, Pie. Measures of Central Tendency: Mean, Median, Mode, Geometric Mean and
Harmonic Mean. Median and Mode through graph.
UNIT-II: Measures of Dispersion: (Shorts -2, Essays– 2)
Range, Quartile Deviation, Mean Deviation and Standard Deviation, Variance. Central and
Non-Central moments and their interrelationship. Sheppard's correction for moments. Skewness
and kurtosis.
UNIT – III: Curve fitting and Correlation: ( Shorts -2, Essays – 2)
Bi- variate data, Principle of least squares, fitting of degree polynomial. Fitting of straight line,
Fitting of Second degree polynomial or parabola, Fitting of power curve and exponential curves.
Correlation:
Meaning, Types of Correlation, Measures of Correlation: Scatter diagram, Karl Pearson’s
Coefficient of Correlation, Rank Correlation Coefficient (with and without ties), Bi-variate
frequency distribution, correlation coefficient for bi-variate data and simple problems. Concept of
multiple and partial correlation coefficients (three variables only ) and properties
UNIT _ IV: Regression : (Shorts -1, Essays– 2)
Concept of Regression, Linear Regression: Regression lines, Regression coefficients and it’s
properties, Regressions lines for bi-variate data and simple problems. Correlation vs regression.
UNIT – V : Theory of Attributes : (Shorts -2, Essays– 2)
Notations, Class, Order of class frequencies, Ultimate class frequencies, Consistency of data,
Conditions for consistency of data for 2 and 3 attributes only , Independence of attributes ,
Association of attributes and its measures, Relationship between association and colligation of
attributes, Contingencytable: Square contingency, Mean square contingency, Coefficient of mean
square contingency, Tschuprow’s coefficient of contingency.

Text Books:
1. V.K.Kapoor and S.C.Gupta: Fundamentals of MathematicalStatistics,Sultan
Chand & Sons, NewDelhi.
2. BA/BSc I year statistics - descriptive statistics, probability distribution - Telugu
Academy- Dr M.Jaganmohan Rao,Dr N.Srinivasa Rao, Dr P.Tirupathi Rao,
Smt.D.Vijayalakshmi.
3. K.V.S. Sarma: Statistics Made Simple: Do it yourself on PC. PHI
Reference books:
1. Willam Feller: Introduction to Probability theory and its applications. Volume –I,Wiley
2. Goon AM, Gupta MK, Das Gupta B : Fundamentals of Statistics , Vol-I, the
World Press Pvt.Ltd.,Kolakota.
3. Hoel P.G: Introduction to mathematical statistics, Asia Publishinghouse.
4. M. JaganMohan Rao and Papa Rao: A Text book of StatisticsPaper-I.
5. Sanjay Arora and Bansi Lal: New Mathematical Statistics: Satya Prakashan , NewDelhi

PRACTICALS - PAPER – I
1. Graphical presentation of data (Histogram, frequency polygon,Ogives).
2. Diagrammatic presentation of data (Bar andPie).
3. Computation of measures of central tendency(Mean, Median andMode)
4. Computation of measures of dispersion(Q.D, M.D andS.D)
5. Computation of non-central, central moments, 1 and 2 for ungroupeddata.
6. Computation of non-central, central moments, 1 and 2 and Sheppard’s corrections for
groupeddata.
7. Computation of Karl Pearson’s coefficients of Skewness and Bowley’s coefficients
ofSkewness.
8. Fitting of straight line by the method of leastsquares
9. Fitting of parabola by the method of leastsquares
10. Fitting of power curve of the type by the method of leastsquares.
11. Fitting of exponential curve of the type and by the method of leastsquares.
12. Computation of correlation coefficient and regression lines for ungroupeddata
13. Computation of correlation coefficient, forming regression lines for groupeddata
14. Computation of Yule's coefficient ofassociation
15. Computation of Pearson's, Tcherprows coefficient ofcontingency
Note: Training shall be on establishing formulae in Excel cells and derive the results. The
excel output shall be exported to MS word
Course Learning Outcomes
Students will acquire
1. Ability to distinguish between random and non-random experiments,
2. Knowledge to conceptualize the probabilities of events including frequentist and axiomatic
approach. Simultaneously, they will learn the notion of conditional probability including the
concept of Bayes’ Theorem,
3. Knowledge related to concept of discrete and continuous random variables and their
probability distributions including expectation and moments,

SEMESTER-I
BLUE PRINT
Time: 3Hrs.
Max.Marks:75
PART-I (5 x 5 = 25 M)
Answer any FIVE Questions, each question carries FIVE marks.
Unit - I : 1 question
Unit - II : 2 questions
Unit - III : 2 questions
Unit - IV : 1 question
Unit - V : 2 questions
PART-II(5 x 10 M= 50 M) Answer any FIVE questions. Choosing atleast TWO questions from each section.
Each question carries 10 marks.
SECTION-A
Unit - I : 2 questions
Unit - II : 2 questions
Unit – III : 1 question
SECTION-B
Unit - III : 1 question
Unit - IV : 2 questions
Unit - V : 2 questions

SRI Y.N.COLLEGE(Autonomous),Narsapur
Affiliated to Adikavi Nannaya University
Thrice accredited by NAAC with ‘A’ Grade
Recognized by UGC as ‘College with potential for Excellence’
I B.Sc. Statistics – Paper I
Descriptive Statistics
Model Question Paper (Theory) (for 2020-23 batches w. e. f 2020-2021)
Time: 3Hrs Max Marks: 75
PART-I
Answer any FIVE Questions, each question carries FIVE marks. 5x5M =25M
1. Define Questionnaire and Schedule with examples.
2. Explain about the Sheppard’s corrections.
3. State and prove the Karl Pearson’s coefficient of correlation lies between -1 and +1.
4. Derive the normal equations for the fitting of power curve.
5. Prove that Regression coefficients are independent of change of origin but not scale.
6. Explain about the consistency of data. Write the conditions for consistency.
7. Explain about the concept of kurtosis.
8. Define mean Geometric mean and harmonic mean with formulas.
PART-II
Answer any FIVE questions. Choosing at least TWO questions from each section.
Each question carries 10 marks. 5x10M = 50M
SECTION – A
9. Define primary data and secondary data and explain the sources of primary data.
10. Explain about the measures of central tendency.
11. Derive the central moments in terms of non central moments.
12. Explain about the symmetrical distribution and Skewness.
13. Write the procedure for fitting of second degree parabola. SECTION - B
14. Derive the Spearman’s rank correlation coefficient formula.
15. Derive the two lines of Regression.
16. Distinguish between correlation and regression.
17. Explain about the association of Attributes and derive the relation between coefficient
of association and colligation.
18. Given the following set of frequencies, find all the remaining class frequencies.
( N ) = 23713 (A) = 1618 (B) = 2015 (C) = 770
(AB) = 587 (AC) = 335 (BC) = 428 (ABC) = 156


SRI Y.N.COLLEGE(Autonomous),Narsapur
Affiliated to Adikavi Nannaya University
Thrice accredited by NAAC with ‘A’ Grade
Recognized by UGC as ‘College with potential for Excellence’
I B.Sc. Statistics – Paper II
Probability and Probability Distributions
(for 2020-23 batch w. e. f 2020-2021)
UNIT-I: Introduction to Probability: (Shorts -2, Essays– 2)
Basic Concepts of Probability, random experiments, trial, outcome, sample space, event,
mutually exclusive and exhaustive events, equally likely and favourable outcomes.
Mathematical, Statistical, axiomatic definitions of probability. Conditional Probability and
independence of events, Addition and multiplication theorems of probability for 2 and for n
events. Boole's inequality and Baye's theorem and its applications in real life problems.
UNIT-II: Random variable: (Shorts -1, Essays– 2)
Definition of random variable, discrete and continuous random variables, functions of
random variable. Probability mass function. Probability density function, Distribution function
and its properties. For given pmf, pdf calculation of moments, coefficient of skewness and
kurtosis. Bivariate random variable - meaning, joint, marginal and conditional Distributions,
independence of random variables and simple problems.
UNIT – III :Mathematical expectation : (Shorts -2, Essays– 2)
Mathematical expectation of a random variable and function of a random variable. Moments
and covariance using mathematical expectation with examples. Addition and Multiplication
theorems on expectation. Definitions of M.G.F, C.G.F, P.G.F, C.F and their properties.
Chebyshev and Cauchy - Schwartz inequalities.
UNIT – IV : Discrete Distributions: (Shorts -2, Essays– 2)
Binomial, Poisson, Negative Binomial, Geometric distributions: Definitions, means, variances,
M.G.F, C.F, C.G.F, P.G.F, additive property if exists. Possion approximation to Binomial
distribution. Hyper-geometric distribution: Defination, mean and variance.
UNIT – V : Continuous Distributions: (Shorts -1, Essays– 2)
Rectangular, Exponential, Gamma, Beta Distributions: mean , variance, M.G.F, C.G.F, C.F.
Normal Distribution: Definition, Importance, Properties, M.G.F, CF, additive property.
Text Books:
1. V.K.Kapoor and S.C.Gupta: Fundamentals of
MathematicalStatistics,SultanChand & Sons, NewDelhi.
2 BA/BSc I year statistics - descriptive statistics, probability distribution - Telugu Academy
- Dr M.Jaganmohan Rao,Dr N.Srinivasa Rao, Dr P.Tirupathi Rao, Smt.D.Vijayalakshmi.
3. K.V.S. Sarma: Statistics Made Simple: Do it yourself on PC. PHI
Reference books:
1. Willam Feller: Introduction to Probability theory and its applications. Volume –I,Wiley
2. Goon AM, Gupta MK, Das Gupta B : Fundamentals of Statistics , Vol-I, the World
Press Pvt.Ltd.,Kolakota.
3. Hoel P.G: Introduction to mathematical statistics, Asia Publishinghouse.
4. M. JaganMohan Rao and Papa Rao: A Text book of StatisticsPaper-I.
5. Sanjay Arora and Bansi Lal: New Mathematical Statistics: Satya Prakashan , NewDelhi
6. Hogg Tanis Rao: Probability and Statistical Inference. 7th edition.Pearson.
Practicals Paper – II
1. Fitting of Binomial distribution – Directmethod.
2. Fitting of binomial distribution – Recurrence relationMethod.
3. Fitting of Poisson distribution – Directmethod.
4. Fitting of Poisson distribution - Recurrence relationMethod.
5. Fitting of Negative Binomialdistribution.
6. Fitting of Geometricdistribution.
7. Fitting of Normal distribution – Areasmethod.
8. Fitting of Normal distribution – Ordinatesmethod.
9. Fitting of Exponentialdistribution.
Course Learning Outcomes
Students will acquire
1. ability to distinguish between random and non-random experiments,
2. knowledge of important discrete and continuous distributions such as Binomial, Poisson,
Geometric, Negative Binomial and Hyper-geometric, normal, uniform, exponential, beta
and gamma distributions,
3. acumen to apply standard discrete and continuous probability distributions to
different situations.
4. knowledge of other types of data reflecting quality characteristics including concepts of
independence and association between two attributes,
5. insights into preliminary exploration of different types of data.
6. Knowledge of correlation, regression analysis, regression diagnostics, partial and multiple correlations.
SEMESTER-I
BLUE PRINT
Time: 3Hrs. Max. Marks: 75
PART-I(5 x 5 = 25 M)
Answer any FIVE Questions, each question carries FIVE marks.
Unit - I : 2 questions
Unit - II : 1 question
Unit - III : 2 questions
Unit - IV : 2 questions
Unit - V : 1 question
PART-II(5 x 10 M= 50 M) Answer any FIVE questions. Choosing at least TWO questions from each section.
Each question carries 10 marks. SECTION-A
Unit - I : 2 questions
Unit - II : 2 questions
Unit – III : 1 question
SECTION-B
Unit - III : 1 question
Unit - IV : 2 questions
Unit - V : 2 questions
SRI Y.N.COLLEGE(Autonomous),Narsapur
Affiliated to Adikavi Nannaya University
Thrice accredited by NAAC with ‘A’ Grade
Recognized by UGC as ‘College with potential for Excellence’
I B.Sc. Statistics – Paper I
Probability and Probability Distributions
Model Question Paper (Theory) (for 2020-23 batches w. e. f 2020-2021)
Time: 3Hrs Max Marks: 75
PART-I
Answer any FIVE Questions, each question carries FIVE marks. 5x5M =25M
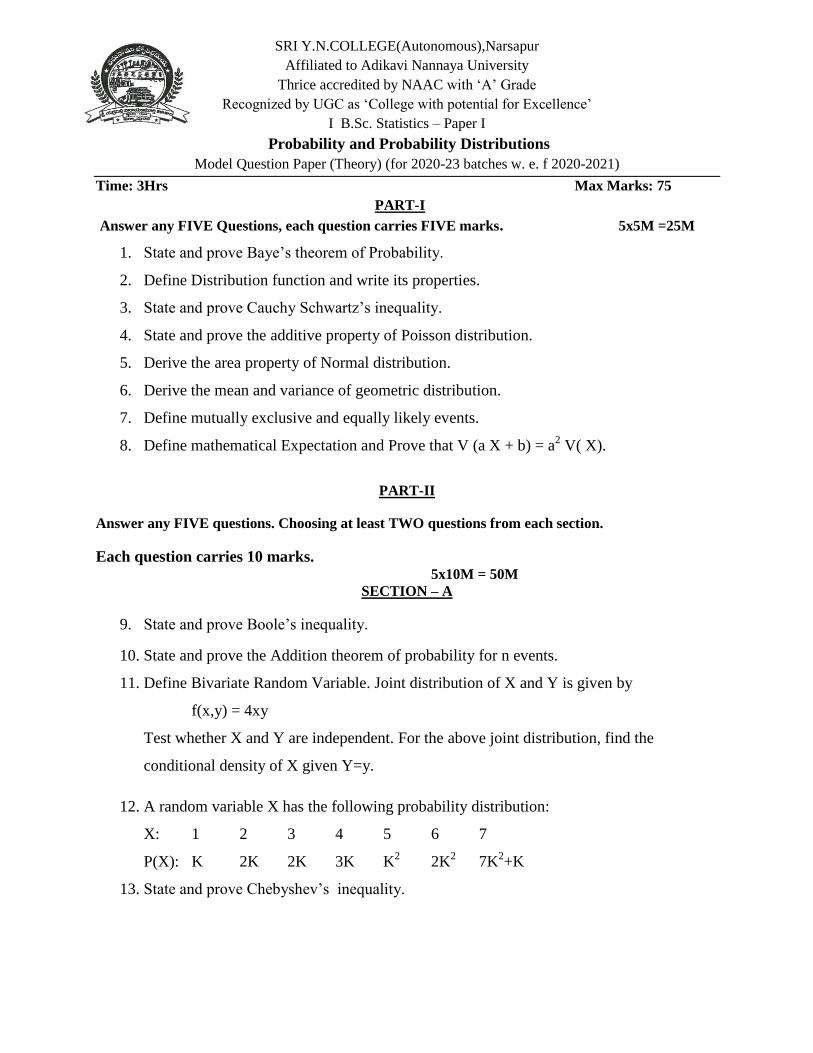
1. State and prove Baye’s theorem of Probability.
2. Define Distribution function and write its properties.
3. State and prove Cauchy Schwartz’s inequality.
4. State and prove the additive property of Poisson distribution.
5. Derive the area property of Normal distribution.
6. Derive the mean and variance of geometric distribution.
7. Define mutually exclusive and equally likely events.
8. Define mathematical Expectation and Prove that V (a X + b) = a2 V( X).
PART-II
Answer any FIVE questions. Choosing at least TWO questions from each section.
Each question carries 10 marks. 5x10M = 50M
SECTION – A
9. State and prove Boole’s inequality.
10. State and prove the Addition theorem of probability for n events.
11. Define Bivariate Random Variable. Joint distribution of X and Y is given by
f(x,y) = 4xy
Test whether X and Y are independent. For the above joint distribution, find the
conditional density of X given Y=y.
12. A random variable X has the following probability distribution:
X: 1 2 3 4 5 6 7
P(X): K 2K 2K 3K K2 2K
2 7K
2+K
13. State and prove Chebyshev’s inequality.

SECTION - B
14. Define Moment Generating Function and state and prove the properties of it.
15. Derive the first four central moments of Binomial Distribution.
16. Define Negative binomial distribution and derive the mean and variance of
Negative binomial distribution.
17. Prove that for Normal distribution QD : MD : SD :: 10 : 12 : 15
18. Define Beta distribution of first kind and derive the mean and variance

SRI Y.N.COLLEGE(Autonomous), Narsapur
Affiliated to Adikavi Nannayya University
Thrice accredited by NAAC with ‘A’ Grade
Recognized by UGC as ‘College with potential for Excellence’
II B.Sc Statistics (for 2019-2022 batch, w.e.f 2018-19)
Paper III, Syllabus for III semester
STATISTICAL METHODS -------------------------------------------------------------------------------------------------------------------------- Unit-I (10 Marks-2,5 Marks-2) Correlation: Def.,scatter diagram ,its coefficient and its properties., scatter diagram, computation of
correlation coefficient for ungrouped data. spearman's rank correlation coefficient, properties of
spearrman's correlation coefficients and problems. Unit-II (10 Marks-2,5 Marks-2) Regression: simple linear regression, properties of regression coefficients. Regression lines, Concept
of Correlation ratio, partial and multiple correlation coefficients, correlation verses regression and
their problems. Unit –III (10 Marks-2,5 Marks-1) Curve fitting: Method of least square - Fitting of linear, quadratic, Exponential and power curves and
their problems. Unit-IV (10 Marks-2,5 Marks-2) Attributes : Introduction, Nature, and consistency and mention its conditions. Independence and
association of attributes, co-efficient of association, coefficients of contingency and their problems.
Unit –V (10 Marks-2,5 Marks-1) Exact sampling distributions: Concept of population, Parameter, random sample, statistic, sampling
distribution, standard error. Statement and Properties of 2, t, F distributions and their
interrelationships. Text books
1. BA/BSc II year statistics - statistical methods and inference - Telugu Academy by A.Mohanrao,
N.Srinivasa Rao, Dr R.Sudhakar Reddy, Dr T.C. Ravichandra Kum.
2. K.V.S. Sarma: Statistics Made Simple: Do it yourself on PC. PHI.
3. Fundamentals of Mathematics statistics: VK Kapoor and SC Guptha.
Reference Books:
1. Outlines of statistics, Vol II : Goon Guptha, M.K.Guptha, Das Guptha B.
2. Introduction to Mathematical Statistics : Hoel P.G.
Practicals Conduct any 6 (Ms -exel is compulsory)
1. Fitting of straight line. 2. Fitting of exponential curves. 3. Fitting of power curve. 4. Computation of correlation coefficient & Fitting of Regression lines. 5. Rank correlation coefficient. 6. Computation of Contingency coefficients. 7. MS-Excel methods any for the Serial Numbers 1,2,4,5.
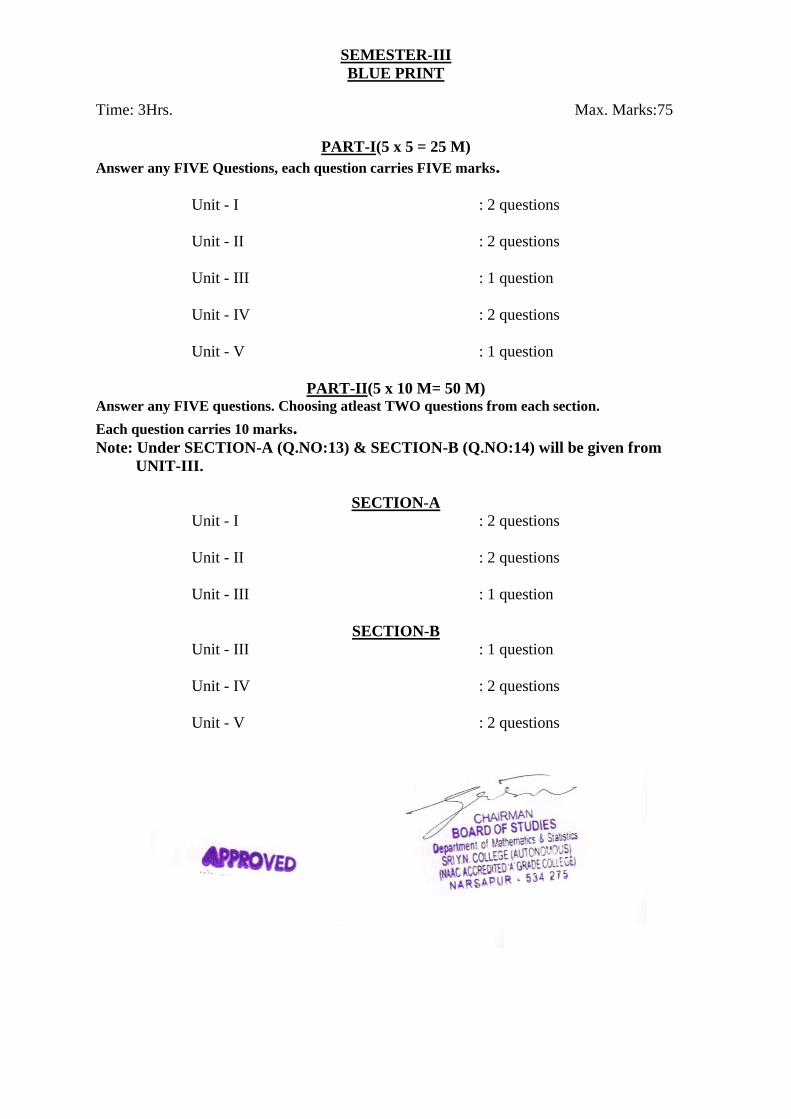
SEMESTER-III
BLUE PRINT
Time: 3Hrs. Max. Marks:75
PART-I(5 x 5 = 25 M)
Answer any FIVE Questions, each question carries FIVE marks.
Unit - I : 2 questions
Unit - II : 2 questions
Unit - III : 1 question
Unit - IV : 2 questions
Unit - V : 1 question
PART-II(5 x 10 M= 50 M) Answer any FIVE questions. Choosing atleast TWO questions from each section.
Each question carries 10 marks. Note: Under SECTION-A (Q.NO:13) & SECTION-B (Q.NO:14) will be given from
UNIT-III.
SECTION-A Unit - I : 2 questions
Unit - II : 2 questions
Unit - III : 1 question
SECTION-B
Unit - III : 1 question
Unit - IV : 2 questions
Unit - V : 2 questions

SRI Y.N.COLLEGE(Autonomous), Narsapur
Affiliated to Adikavi Nannayya University
Thrice accredited by NAAC with ‘A’ Grade
Recognized by UGC as ‘College with potential for Excellence’
II B.Sc Statistics
Statistical Methods Model Question Paper (Theory ) (for 2019-22 batch w. e. f 2018-2019)
Time: 3Hrs Max Marks: 75
PART-I Answer any FIVE Questions, each question carries FIVE marks. 5x5M =25M
1. Explain the types of Correlation.
2. Explain the difference between Correlation Analysis and Regressive Analysis.
3. Explain the method of Least Squares.
4. Explain the independence of attributes .
5. Explain the concept of Standard Error.
6. The ranks of 10 students in Maths & Statistics are as follows.
M 3 6 4 2 1 7 10 9 5 8
S 1 7 4 5 6 8 9 3 2 10
Calculate the rank Correlation Coefficient between two given subjects.
7. Calculate the regression equation of Y on X for the following data.
X 6 2 10 4 8
Y 9 11 5 8 7
8. Examine the consistency of the following data.
N = 1000, (A) = 525 , (B) = 312 , (C) = 470, (AB) = 42 , (BC) = 86, (AC) = 147 &
(ABC) = 25
PART-II
Answer any FIVE questions. Choosing atleast TWO questions from each section.
Each question carries 10 marks. 5x10M = 50M
SECTION – A
9. Define Correlation Coefficient. Derive the limits for Correlation coefficient are 1.
10. State and prove the Edward Spearman’s Rank Correlation Coefficient.
11. Define Regression Coefficients. Derive the Regression Coefficients are not affected
by the change of origin but affected by the change of Scale.
12. Explain Partial and Multiple Correlation Coefficients.
13. How do you fit a straight line using the principle of least squares?
SECTION-B
14. Explain the fitting of an exponential Curve.
15. Derive the relation between Coefficient of association (Q) and Coefficient of
Colligation (Y).
16. Explain the conditions for consistency of three attributes.
17. Derive the relationship between F and 2 distributions.
18. Define and explain the 2, t and F distributions.

SRI Y.N.COLLEGE(Autonomous), Narsapur
Affiliated to Adikavi Nannayya University
Thrice accredited by NAAC with ‘A’ Grade
Recognized by UGC as ‘College with potential for Excellence’
II B.Sc Statistics (for 2019-2022 batch, w.e.f 2018-19)
Paper IV, Syllabus for IV semester
STATISTICAL INFERENCE
----------------------------------------------------------------------------------------------------------------
Unit-I (10 Marks-2,5 Marks-2)
Theory of estimation: Estimation of parameter, criteria of a good estimator- unbiasedness,
consistency, efficiency , sufficiency and Statement of Neyman’s factorization theorem.
Estimation of parameters by the methods of moments and maximum likelihood (M.L),
properties of MLE’s. Binomial, Poisson & Normal Population Parameters estimate by ML
method. Confidence intervals of the parameters of normal population.
Unit-II (10 Marks-2,5 Marks-2)
Concepts of Statistical hypothesis: Null and alternative hypothesis, critical region, two types
of errors, level of significance , power of a test, 1 tailed, 2 tailed tests, Neymann-Pearson’s
lemma. Examples in of Binomial, Poisson , Normal distributions.
Unit-III (10 Marks-2,5 Marks-2)
Large Sample Tests: Large sample tests for single mean, two means, Single proportion . Two
proportions, Standard Deviation of single and double samples and Fisher’s Z transformation.
Unit-IV (10 Marks-2,5 Marks-1)
Small sample tests: Tests of significance based on 2, t and F. 2-test for test for
independence of attributes, t – test for single, double ad paired tests, variance ration test (F-
test).
Unit-V (10 Marks-2,5 Marks-1)
Non-parametric tests – advantages and disadvantages. Two sample run test, Two sample
Median test and Two sample sign test.
TEXT BOOKS
1. BA / BSc II Year statistics – stastical methods and inference – Telugu Academy by A.
Mohanrao, N.Srinivasa Rao, Dr R.Sudhakar Reddy, Dr T.C.Ravichandra Kumar.
2. K.V.S.Sarma: Statistics Made Simple: Do it yourself on PC. PHI.
REFERENCE BOOKS:
1. Fundamentals of Mathematics Statistics: VK Kapoor and SC Guptha.
2. Outlines of Statistics, Vol II: Goon Guptha, M.K.Guptha, Das Guptha B.
3. Introduction to Mathematical Statistics : Hoel P.G.
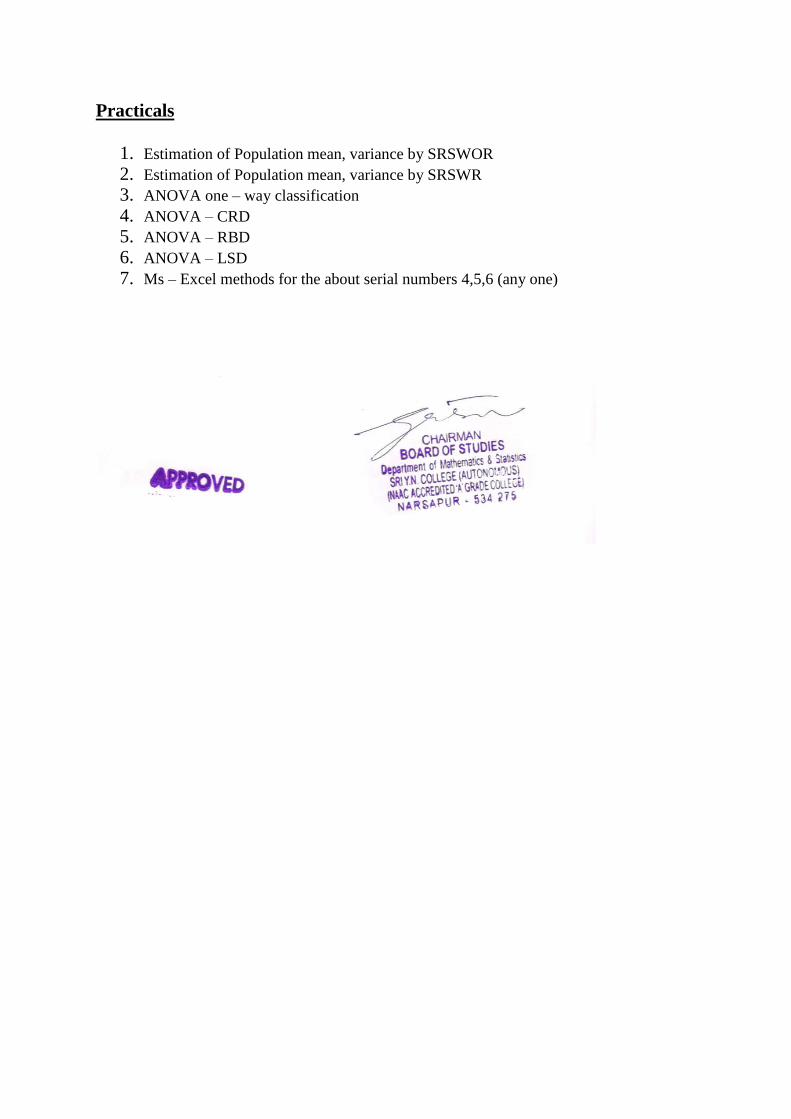
Practicals Semester – IV
Conduct any 6 (Ms-excel is compulsory)
1. Large sample tests for mean(s).
2. Large sample tests for proportion(s).
3. Large sample tests for standard deviation(s).
4. Large sample tests Fisher’s Z-transformation.
5. Small sample tests for Single and Doublet – test
6. Small sample tests for Paired t – test.
7. F – Test.
8. Chi square test for independence of attributes .
9. Non – parametric tests – run test.
10. Non – parametric tests – median test.
11. Non parametric tests – sign tests.
12. MS-Excel methods for the above Serial Numers 1,2,3,4.(any one of above).
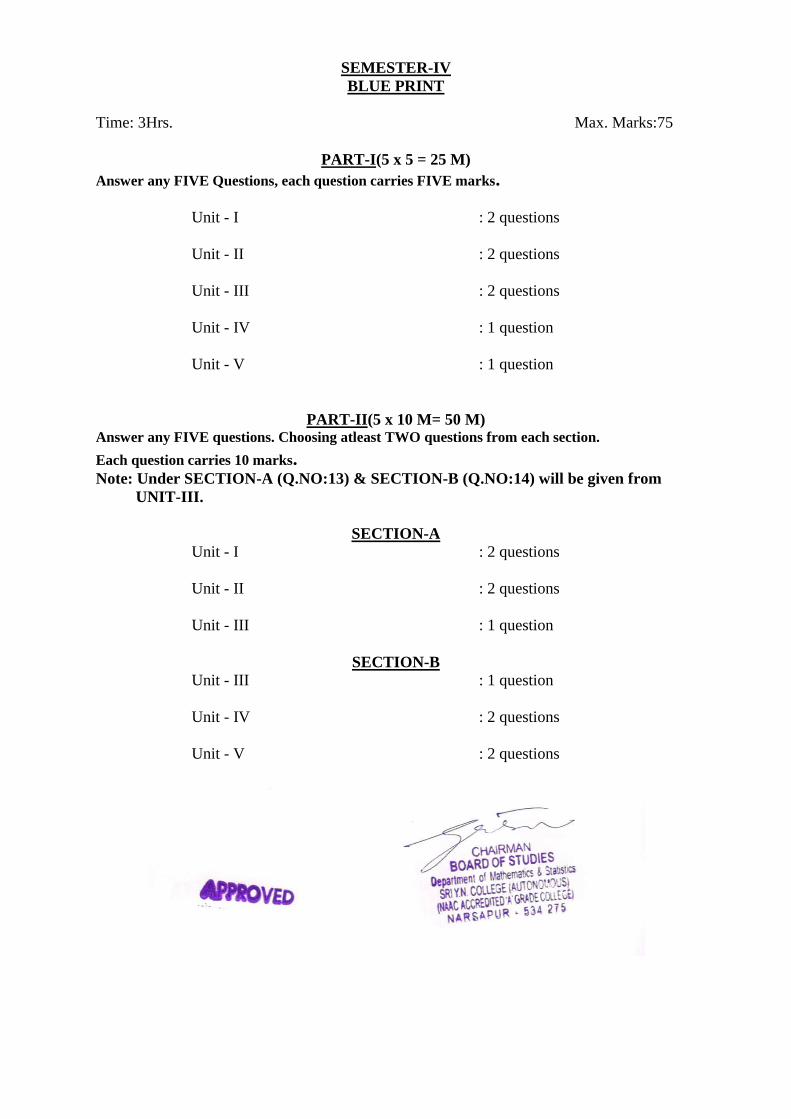
SEMESTER-IV
BLUE PRINT
Time: 3Hrs. Max. Marks:75
PART-I(5 x 5 = 25 M)
Answer any FIVE Questions, each question carries FIVE marks.
Unit - I : 2 questions
Unit - II : 2 questions
Unit - III : 2 questions
Unit - IV : 1 question
Unit - V : 1 question
PART-II(5 x 10 M= 50 M) Answer any FIVE questions. Choosing atleast TWO questions from each section.
Each question carries 10 marks. Note: Under SECTION-A (Q.NO:13) & SECTION-B (Q.NO:14) will be given from
UNIT-III.
SECTION-A Unit - I : 2 questions
Unit - II : 2 questions
Unit - III : 1 question
SECTION-B
Unit - III : 1 question
Unit - IV : 2 questions
Unit - V : 2 questions
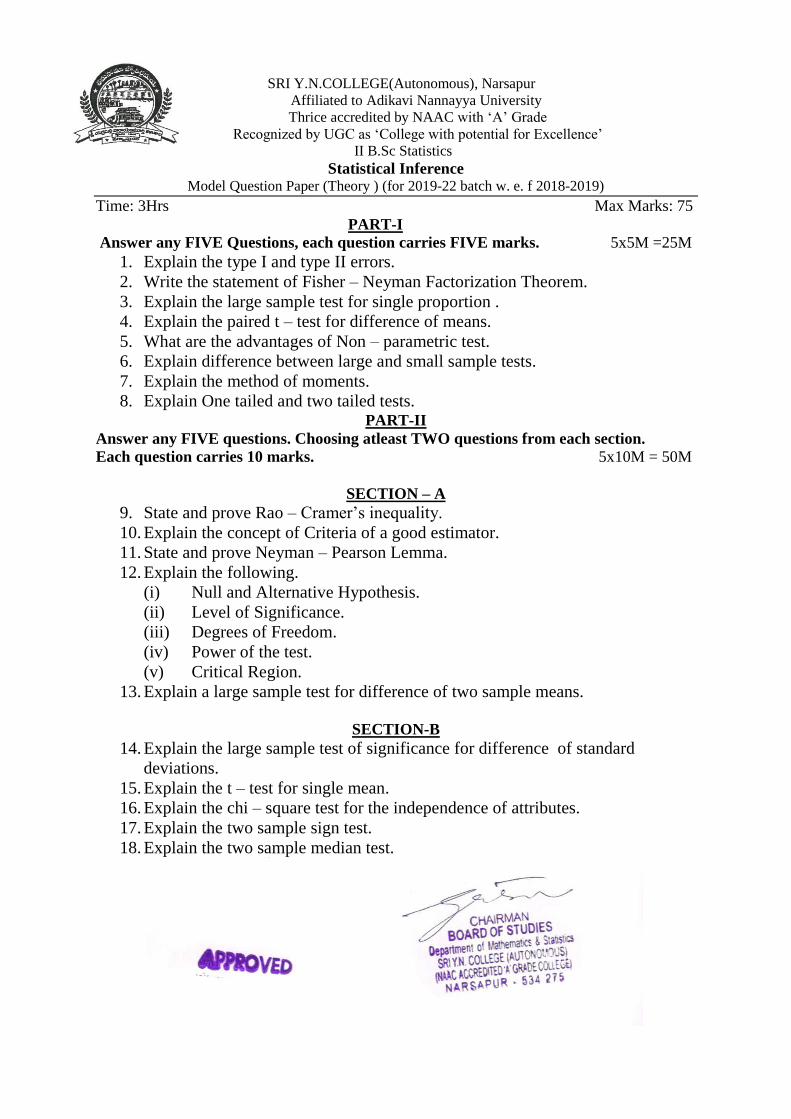
SRI Y.N.COLLEGE(Autonomous), Narsapur
Affiliated to Adikavi Nannayya University
Thrice accredited by NAAC with ‘A’ Grade
Recognized by UGC as ‘College with potential for Excellence’
II B.Sc Statistics
Statistical Inference Model Question Paper (Theory ) (for 2019-22 batch w. e. f 2018-2019)
Time: 3Hrs Max Marks: 75
PART-I Answer any FIVE Questions, each question carries FIVE marks. 5x5M =25M
1. Explain the type I and type II errors.
2. Write the statement of Fisher – Neyman Factorization Theorem.
3. Explain the large sample test for single proportion .
4. Explain the paired t – test for difference of means.
5. What are the advantages of Non – parametric test.
6. Explain difference between large and small sample tests.
7. Explain the method of moments.
8. Explain One tailed and two tailed tests. PART-II
Answer any FIVE questions. Choosing atleast TWO questions from each section.
Each question carries 10 marks. 5x10M = 50M
SECTION – A
9. State and prove Rao – Cramer’s inequality.
10. Explain the concept of Criteria of a good estimator.
11. State and prove Neyman – Pearson Lemma.
12. Explain the following.
(i) Null and Alternative Hypothesis.
(ii) Level of Significance.
(iii) Degrees of Freedom.
(iv) Power of the test.
(v) Critical Region.
13. Explain a large sample test for difference of two sample means.
SECTION-B
14. Explain the large sample test of significance for difference of standard
deviations.
15. Explain the t – test for single mean.
16. Explain the chi – square test for the independence of attributes.
17. Explain the two sample sign test.
18. Explain the two sample median test.

SRI Y.N.COLLEGE(Autonomous), Narsapur
Affiliated to Adikavi Nannayya University
Thrice accredited by NAAC with ‘A’ Grade
Recognized by UGC as ‘College with potential for Excellence’
III B.Sc Statistics (for 2018-2021 batch, w.e.f 2019-20)
Paper V, Syllabus for V semester
SAMPLING TECHNIQUES & DESIGN OF EXPERIMENTS ---------------------------------------------------------------------------------------------------------------- Unit-I (10 Marks-2,5 Marks-2)
Sampling Theory: Principle steps in a sample survey, Census versus Sample survey,
Sampling and Non sampling errors. Types of sampling – Subjective, Probability and mixed
sampling methods.
Unit-II (10 Marks-2,5 Marks-1)
Simple Random Sampling : Meaning of samples and methods to draw, estimation of
population mean, variances in SRSWR & SRSWOR, Advantages and disadvantages of these
methods.
Unit-III (10 Marks-2,5 Marks-2)
Stratified Random Sampling : Proportional and optimum allocation of sample sizes in
stratification. Variances of these methods. Comparison of their relative efficiencies.
Advantages and Disadvantages of Stratified sampling. Concept of Systematic sampling,
Advantages and Disadvantages.
Unit-IV (10 Marks-2,5 Marks-1)
Analysis of Variance: Causes of variation, statement of Cochran’s theorem, One – Way
with equal and unequal classifications and two way classifications.
Unit-V(10 Marks-2,5 Marks-2)
Design of Experiments: Principles of Experimentation in Designs Analysis of Completely
randomized design (CRD) , Randomized block design (RBD) and Latin Square Design
(LSD) , efficiency of these designs. Concept of Factorial experiments.
Text Books: 1. Telugu Academy B.A / B.Sc III year paper – III Statistics – applied statistics – Telugu
Academy by Prof . K Srinivasa Rao, Dr D Giri, Dr A Anand, Dr V Papaiah Sastry.
2. KVS Sarma : Statistics Made Simple : Do it yourself in PC. PHI
Reference books: 1. Fundamentals of applied statistics : VK Kapoor and SC Gupta.
2. Anuvarthita Sankyaka Sastram – Telugu Academy.
Practicals
1. Estimation of Population mean, variance by SRSWOR 2. Estimation of Population mean, variance by SRSWR 3. ANOVA one – way classification 4. ANOVA – CRD 5. ANOVA – RBD 6. ANOVA – LSD 7. Ms – Excel methods for the about serial numbers 4,5,6 (any one)

SEMESTER-V
BLUE PRINT
Time: 3Hrs. Max. Marks:75
PART-I(5 x 5 = 25 M)
Answer any FIVE Questions, each question carries FIVE marks.
Unit - I : 2 questions
Unit - II : 1 question
Unit - III : 2 questions
Unit - IV : 1 question
Unit - V : 2 questions
PART-II(5 x 10 M= 50 M) Answer any FIVE questions. Choosing atleast TWO questions from each section.
Each question carries 10 marks. Note : Under Section –A (Q. No: 13) and Section – B (Q. No: 14) will be given from
UNIT-III
SECTION-A
Unit - I : 2 questions
Unit - II : 2 questions
Unit – III : 1 question
SECTION-B
Unit - III : 1 question
Unit - IV : 2 questions
Unit - V : 2 questions
.

SRI Y.N.COLLEGE(Autonomous),Narsapur
Affiliated to Adikavi Nannaya University
Thrice accredited by NAAC with ‘A’ Grade
Recognized by UGC as ‘College with potential for Excellence’
III B.Sc. Statistics – Paper V
SAMPLING TECHNIQUES & DESIGN OF EXPERIMENTS Model Question Paper (Theory ) (for 2018-21 batch w. e. f 2019-2020)
Time: 3Hrs Max Marks: 75
PART-I Answer any FIVE Questions, each question carries FIVE marks. 5x5M =25M
1. Explain the advantages of Sampling over census.
2. Show that the Sample Mean is an Unbiased estimate of the population mean in
SRSWOR.
3. Explain the proportional allocation method in Stratified Random Sampling.
4. Explain ANOVA and its assumptions.
5. Explain about C.R.D.
6. Explain the Systematic Random Sampling.
7. Explain the concept of Factorial Experiments.
8. Explain Sampling and Non – Sampling errors. PART-II
Answer any FIVE questions. Choosing atleast TWO questions from each section.
Each question carries 10 marks. 5x10M = 50M
SECTION – A
9. What are the principal steps in a Sample Survey. Discuss them briefly.
10. What is the difference between Census Survey and Sample Survey.
11. Derive the Variance of the Sample mean in SRSWOR.
12. Show that the Sample mean square is an unbiased estimate of population mean
square.
13. Define and explain Stratified Random Sampling. What are the advantages and
disadvantages of Stratified Random Sampling. SECTION-B
14. Define Systematic Sampling and also give the advantages and disadvantages of
Systematic Sampling.
15. Explain the analysis of variance of Two –Way classification and also give
ANOVA 2 – way table.
16. What is meant by ANOVA 1 – way classification. Give layout and analysis for
one – way classification.
17. What is Latin Square Design (L.S.D). Give the layout and analysis of a L.S.D.
Discuss its merits and demerits.
18. Explain the analysis of Randomized Block Design (R.B.D).

SRI Y.N.COLLEGE(Autonomous), Narsapur
Affiliated to Adikavi Nannayya University
Thrice accredited by NAAC with ‘A’ Grade
Recognized by UGC as ‘College with potential for Excellence’
III B.Sc Statistics (for 2018-2021 batch, w.e.f 2019-20)
Paper VI, Syllabus for V semester
Quality and Reliability ---------------------------------------------------------------------------------------------------------------- Unit-I (10 Marks-2,5 Marks-2)
Importance of SQC in industry, statistical basis of shewart control charts, uses of control
charts, control limits, natural tolerance limits and specification limits, concept of six – sigma.
Unit-II (10 Marks-2,5 Marks-2)
Variable Control Chart : Construction of mean, R, S.D, charts for variables, interpretation
of control charts.
Attribute control charts – np, p charts, C chart, Interpretation of control charts.
Unit-III (10 Marks-2,5 Marks-1)
Acceptance Sampling Plans –Scope, Producer’s risk and consumer’s risk concepts of AQL
and LTPD.
.
Unit-IV (10 Marks-2,5 Marks-1)
Sampling Plans: Single and double sampling plans, OC and ASN functions, Double and
single Sampling plans for attributes using Binomial.
Unit-V(10 Marks-2,5 Marks-2)
Reliability : Introduction, failure rates, Hazard function, estimation of reliability,
exponential distribution as life model, its memory less property
Text Books: 1. B.A / B.Sc III year paper – IV Statistics – applied statistics – Telugu Academy by Prof . K
Srinivasa Rao, Dr D Giri, Dr A Anand, Dr V Papaiah Sastry
2. Fundamental of Applied Statistics : V.K.Kapoor and S.C.Gupta: 3. S K Sinha : Reliability and life testing . Wiley Eastern
Reference books: 1. R C Gupta : Statistical Quality Control.

Practicals
1. Construction of X , R – Charts
2. Construction of P – Charts
3. Construction of P – Chart – Variable Sample Size
4. Construction of np – Chart
5. Construction of C – Chart
6. Ms – Excel methods for the serial numbers 1.
7. Ms – Excel methods for the serial numbers 2 to 4 (any one)

SEMESTER-V
BLUE PRINT
Time: 3Hrs. Max. Marks:75
PART-I(5 x 5 = 25 M)
Answer any FIVE Questions, each question carries FIVE marks.
Unit - I : 2 questions
Unit - II : 2 questions
Unit - III : 1 question
Unit - IV : 1 question
Unit - V : 2 questions
PART-II(5 x 10 M= 50 M) Answer any FIVE questions. Choosing atleast TWO questions from each section.
Each question carries 10 marks. Note : Under Section –A (Q. No: 13) and Section – B (Q. No: 14) will be given from
UNIT-III
SECTION-A Unit - I : 2 questions
Unit - II : 2 questions
Unit – III : 1 question
SECTION-B
Unit - III : 1 question
Unit - IV : 2 questions
Unit - V : 2 questions
.

SRI Y.N.COLLEGE(Autonomous),Narsapur
Affiliated to Adikavi Nannaya University
Thrice accredited by NAAC with ‘A’ Grade
Recognized by UGC as ‘College with potential for Excellence’
III B.Sc. Statistics – Paper VI
MATHEMATICAL EXPECTATION AND PROBABILITY DISTRIBUTIONS Model Question Paper (Theory ) (for 2018-21 batch w. e. f 2019-2020)
Time: 3Hrs Max Marks: 75
PART-I Answer any FIVE Questions, each question carries FIVE marks. 5x5M =25M
1. Explain the Process Control and Product Control.
2. Explain Standard Deviation Chart.
3. Explain need for Sampling Inspection Plan.
4. Explain Single Sampling Plan.
5. Explain Hazard Function.
6. Explain the Concept of Six – Sigma.
7. Explain Reliability Function.
8. What are the types of Control Charts. PART-II
Answer any FIVE questions. Choosing atleast TWO questions from each section.
Each question carries 10 marks. 5x10M = 50M
SECTION – A
9. Discuss the importance of Statistical Quality Control in industry.
10. Explain Construction of Mean & Range Charts.
11. What are the charts for attributes. Explain np, p – charts?
12. Explain the Double Sampling Plan.
13. Define and explain AQL & LTPD.
SECTION-B
14. Explain (i) Producer’s Risk (ii) Consumer’s Risk
15. Explain the memory less property of Exponential Distribution.
16. Explain Reliability function and give its estimation.
17. Write the O.C and A.S.N. function for Single Sampling Plan.
18. Explain Natural tolerance limits and Specification limits.

SRI Y.N.COLLEGE(Autonomous), Narsapur
Affiliated to Adikavi Nannayya University
Thrice accredited by NAAC with ‘A’ Grade
Recognized by UGC as ‘College with potential for Excellence’
III B.Sc Statistics (for 2018-2021 batch, w.e.f 2019-20)
Paper VII, Syllabus for VI semester
Optimization Techniques ---------------------------------------------------------------------------------------------------------------- Unit-I (10 Marks-2,5 Marks-2)
Operations Research: Origin and development of OR., Nature and features of O.R.,
Scientific method and Modeling in O.R., Advantages and limitations of models, General
solution methods for O.R. models.
Unit-II (10 Marks-2,5 Marks-1)
Linear Programming Problem : Definition, components, basic assumptions, Mathematical
formulation of the problem, Illustrations on mathematical formulation of LPP, LPP –
Graphical solution method, some exceptional cases in graphical method – alternative optima ,
unbounded solution and infeasible solutions.
Unit-III (10 Marks-2,5 Marks-1)
Linear Programming Problem – Simplex Method - I –General LPP – Objective function,
constraints, non negative restrictions, Solution of LPP, feasible solution and optimum
solution, Canonical and standard forms of LPP., Basic solution – definition, degenerate
solution, basic feasible solution, associated cost vector, improved basic feasible solution,
optimum basic feasible solution and net evaluation, Fundamental theorem of LPP., the
computational procedure – Simplex algorithm, Simple linear programming problems.
Unit-IV (10 Marks-2,5 Marks-2)
Linear Programming Problem Simplex method – II: Artificial variable technique, The
Big M method or method of Penalties, Degeneracy, Alternative optima, Unbounded
solutions, Non existing or infeasible solutions
Unit-V(10 Marks-2,5 Marks-2)
Duality in Linear Programming: General Primal – Dual pair, Formulation a dual problem,
Primal – Dual pair in Matrix form, Duality.
Reference books: 1. Operations Research, Kanthi Swaroop.
2. Operations Research Theory, Methods and Applications, SD Sharma.
3. Krishna’s Operations Research, Dr RK Gupta.
4. Operations research : Theory and Applications, JK Sharma.
5. Operations Research : An Introduction, Hamdy A Taha.

Practicals
1. Formulation of LPP
2. Formulation of LPP by Graphical Method (Maximization)
3. Formulation of LPP by Graphical Method (Minimization)
4. Solutions of LPP by Simplex method
5. Solutions of LPP by Big – M method
6. Solutions of LPP by using principal of duality
7. MS Excel is compulsory for serial number 2,4,6

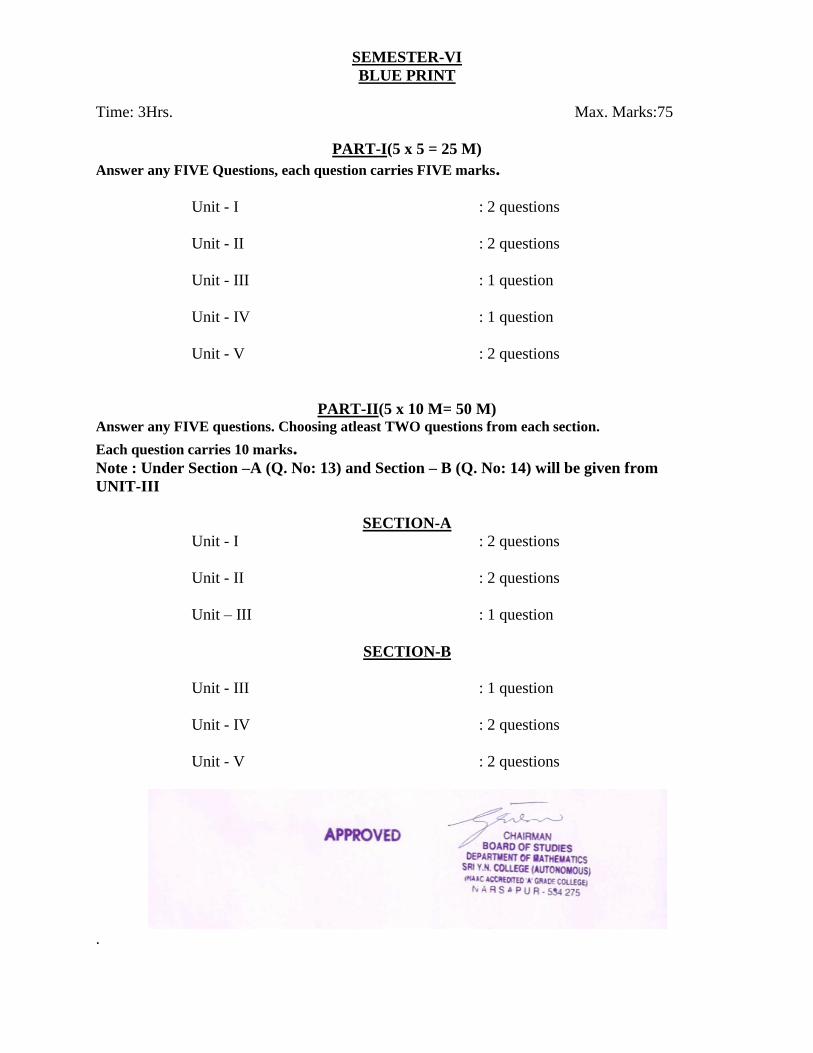
SEMESTER-VI
BLUE PRINT
Time: 3Hrs. Max. Marks:75
PART-I(5 x 5 = 25 M)
Answer any FIVE Questions, each question carries FIVE marks.
Unit - I : 2 questions
Unit - II : 1 question
Unit - III : 1 question
Unit - IV : 2 questions
Unit - V : 2 questions
PART-II(5 x 10 M= 50 M) Answer any FIVE questions. Choosing atleast TWO questions from each section.
Each question carries 10 marks. Note : Under Section –A (Q. No: 13) and Section – B (Q. No: 14) will be given from
UNIT-III
SECTION-A
Unit - I : 2 questions
Unit - II : 2 questions
Unit – III : 1 question
SECTION-B
Unit - III : 1 question
Unit - IV : 2 questions
Unit - V : 2 questions
.

SRI Y.N.COLLEGE(Autonomous),Narsapur
Affiliated to Adikavi Nannaya University
Thrice accredited by NAAC with ‘A’ Grade
Recognized by UGC as ‘College with potential for Excellence’
III B.Sc. Statistics – Paper VII
OPTIMIZATION TECHNIQUES Model Question Paper (Theory ) (for 2017-20 batch w. e. f 2019-2020)
Time: 3Hrs Max Marks: 75
PART-I Answer any FIVE Questions, each question carries FIVE marks. 5x5M =25M
1. Define OR and explain the features of OR.
2. Explain the different models in OR.
3. Explain the Mathematical formulation of LPP.
4. Explain an Optimum basic feasible solution.
5. Explain degeneracy in LPP
6. Explain an unbiased solution.
7. Explain the concept of duality.
8. Explain an economic interpretation of duality problem.
PART-II
Answer any FIVE questions. Choosing atleast TWO questions from each section.
Each question carries 10 marks. 5x10M = 50M
SECTION – A
9. Define OR and discuss the significance and scope of OR.
10. Explain the advantages and limitations of OR.
11. A company produces 3 products P.Q & R from three raw materials A,B & C.
one unit of product P required 2 units of A & 3 units of B. One unit of product
Q requires 2 units of B & 5 units of C. One unit of product R required 3 units
of A, 2 units of B and 4 units of C. The company has 8 units of material A, 10
units of material B and 15 units of material C. Profits as per unit of products
P,Q,R are Rs.3/-, Rs.5/- and Rs.4/- respectively. Formulate the given problem
as LPP.
12. Explain the Graphical method of LPP.
13. State and prove Fundamental Theorem of LPP.
SECTION-B
14. Use Simplex method to solve the following LPP
Max Z = 7x1 +5x2
Subject to the constraints
x1 + 2x2 6
4x1 +3x2 12
and x1 , x2 0

15. Use Charnes Penalty method and Big – M method to solve the following LPP.
Min Z = 2x1 + x2
Subject to the constraints
3x1 + x2 = 3
4x1 +3x2 6
x1 + 2x2 3
and x1 , x2 0
16. Explain Artificial variable technique or Big – M method.
17. Write the rules for converting the primary into its dual with suitable example.
18. Show that Dual of dual of the primal is primal.

SRI Y.N.COLLEGE(Autonomous), Narsapur
Affiliated to Adikavi Nannayya University
Thrice accredited by NAAC with ‘A’ Grade
Recognized by UGC as ‘College with potential for Excellence’
III B.Sc Statistics (for 2018-2021 batch, w.e.f 2020-21)
Syllabus for VI Semester - Cluster Elective 8B
Operation Research - II
UNIT-I : Games and Strategies : (10 Marks – 2, 5 Marks - 2)
Introduction, Two person zero sum games, some basic terms, the Maxima-Minima Principle,
Games without saddle points – mixed Strategies, Algebraic Method, Graphical solution of 2 X n
and m X 2 Games, Dominance property.
UNIT–II: Inventory control – I : (10 Marks – 2, 5 Marks - 2)
Basic concepts of inventory problem, Types of inventories and cost associated with inventories,
Factors affecting inventory control, The concept of EOQ(Economic Order Quantity),
Deterministic inventory Problems (Static Demand Model).
UNIT–III: Inventory Control –II : (10 Marks – 2, 5 Marks - 1)
Price Breaks (Quantity Discounts) : Problems of EOQ with – One price break and More than one
price break, Simple Problems, Probabilistic inventory models, Instantaneous demand, No setup
cost model – Discrete case and Continuous case, Newspaper Boy Problem, Simple Problem.
UNIT–IV: Network Scheduling –I : (10 Marks – 2, 5 Marks - 1)
Basic steps in PERT/CPM techniques Basic components, Logical sequencing (errors in drawing
networks), Rules for network construction, Critical Path analysis(CPM) – Forward pass method,
Backward pass method, Determination of floats and slack times, Simple problems.
UNIT-V: Network Scheduling - II : (10 Marks – 2, 5 Marks - 2)
Probability considerations in PERT (Project Evaluation and Review Technique), Distinction
between PERT and CPM, Applications of network techniques, Limitations and difficulties in
using Network, Project cost, Time Cost optimization algorithm, Simple Problems.
Text Books:
1. Kanthi Swarup , P.K.Guptha, Man Mohan, Operations Research.
2. Operations Research Theory, Methods and Applications, S.D. Sarma.
@@@@@

Practicals
1. Game theory – Saddle Points
2. Graphical solution of 2 X n and m X 2 game
3. Dominance property
4. Inventory models
5. PERT/CPM Techniques
6. M.S. Excel is compulsory for serial number 1, 3
SEMESTER-VI
BLUE PRINT
Time: 3Hrs. Max. Marks:75
PART-I(5 x 5 = 25 M)
Answer any FIVE Questions, each question carries FIVE marks.
Unit - I : 2 questions
Unit - II : 2 questions
Unit - III : 1 question
Unit - IV : 1 question
Unit - V : 2 questions
PART-II(5 x 10 M= 50 M) Answer any FIVE questions. Choosing atleast TWO questions from each section.
Each question carries 10 marks. Note : Under Section –A (Q. No: 13) and Section – B (Q. No: 14) will be given from
UNIT-III
SECTION-A Unit - I : 2 questions
Unit - II : 2 questions
Unit – III : 1 question
SECTION-B
Unit - III : 1 question
Unit - IV : 2 questions
Unit - V : 2 questions
.

SRI Y.N.COLLEGE(Autonomous),Narsapur
Affiliated to Adikavi Nannaya University
Thrice accredited by NAAC with ‘A’ Grade
Recognized by UGC as ‘College with potential for Excellence’
III B.Sc. Statistics – Cluster Elective 8B
Operation Research - II Model Question Paper (Theory ) (for 2018-21 batch w. e. f 2020-2021)
Time: 3Hrs Max Marks: 75
PART-I
Answer any FIVE Questions, each question carries FIVE marks. 5x5M =25M
1. Describe Game and Strategy.
2. Explain Economic Order Quantity.
3. Explain EOQ Problem with one price break.
4. Write the factors affecting inventory control
5. Explain Logical Sequencing in networking.
6. Write the applications of network techniques.
7. Find the Saddle Point of the followingpayoff matrix.
Player B
B1 B2 B3
A1 60 56 34
Player A A2 63 60 55
A3 83 72 60
8. Develop a network diagram for the project specified below
Activity A B C,D E F G
Immediate
Predecessor
- A B C D E,F
PART-II
Answer any FIVE questions. Choosing atleast TWO questions from each section.
Each question carries 10 marks. 5x10M = 50M
9. Explain the graphical method of solving 2 x n game.
10. Solve the following game using the method of dominance
Player B
B1 B2 B3 B4
A1 4 2 3 6
Player A A2 3 4 7 5
A3 6 3 5 4
11. Describe deterministic inventory problems.
12. A manufacturing company purchases 9,000 parts of a machine for its annual requirements,
ordering one month usage at a time. Each part costs Rs.20. The ordering cost per order is
Rs.15 and the carrying charges are 15% of the average inventory per year. You have been
assigned to suggest a more economical purchasing policy for the company. What advice
would you offer and how much would it save the company per year?
13. Explain Probabilistic Inventory Single Period Problem without set-up cost.

SECTION-B
14. The probability distribution of monthly sales of a certain item is as follows:
Monthly sales: 0 1 2 3 4 5 6
Probability 0.02 0.05 0.30 0.27 0.20 0.10 0.06
The cost of carrying inventory is Rs.10 per unit per month. The current policy is to maintain
a stock of four items at the beginning of each month. Assuming that the cost of shortage is
proportional to both time and quantity short, obtain the imputed cost of a shortage of one
item for one unit of time.
15. Describe the rules of network construction.
16. The following details are available regarding a project
Draw the network, determine the Critical Path and find the project completion time.
17. Explain the difference between PERT and CPM.
18. Determination of project completion time in PERT. Find out the time required to complete
the following project and the critical activities
Activity A B C D E F G H I
Predecessor
Activity
- A A B C D, E D, E F G
Pessimistic
Time
6 9 12 15 10 26 26 8 5
Optimistic
Time
2 3 8 9 8 16 19 2 1
Most likely
Time
4 6 10 12 9 21 22 5 3
Activity A B C D E F
Predecessor Activity - A A B C D, E
Duration(week) 3 5 7 10 5 4
SRI Y.N.COLLEGE(Autonomous), Narsapur
Affiliated to Adikavi Nannayya University
Thrice accredited by NAAC with ‘A’ Grade
Recognized by UGC as ‘College with potential for Excellence’
III B.Sc Statistics (for 2018-2021 batch, w.e.f 2020-21)
Syllabus for VI Semester - Cluster Elective 8A
Operation Research - I
UNIT-I : Linear Programming problem - Advanced Techniques :
Revised Simlex Method – Algorithm, Simple Problems (2 and 3 variables),Simplex method
versus revised simplex method, Bounded Variables – Computational procedure, Simple
problems(2 and 3 variables).
UNIT –II :Transportation Problem :
L. P. formation of the Transportation problem, Tabular representation, Initial Basic Feasible
Solution(I.B.F.S) to Transportation Problem, North West Corner, Least Cost and Vogel’s
approximation methods.
UNIT –III: Transportation Problem :
The optimality test - Transportation Algorithm - MODI(Modified Difference Method),
Degeneracy Transportation Problem.
UNIT -IV: Assignment Problem :
Mathematical Formulation of the problem, Hungarian method for assignment problem, Special
cases in Assignment problems – Unbalanced, prohibited, Maximization. Travelling Salesman
Problem, A typical Assignment problem.
UNIT – V : Sequencing Problem :
Problem of Sequencing , Principal Assumptions, Solution of Sequencing , Problem – Processing
n jobs through 2 machines and Processing n jobs through 3 machines - Johnson’s optimal
sequence Algorithm, Processing n jobs through k - machines - Johnson’s Optimal sequence
Algorithm, Simple Problems.
Books for reference:
1. Operations Research - Kanthi Swaroop
2. Operations Research – S.D. Sarma
3. Quality, Reliability and Operation Research – Telugu Academy Publications, Hyderabad
@@@@@

Practicals
1. Revised Simplex.
2. Least Cost Entry Method.
3. VAM of TP.
4. MODI of TP.
5. Assignment problem.
6. M.S. Excel is compulsory for serial number 1,2, 3

SEMESTER-V
BLUE PRINT
Time: 3Hrs. Max. Marks:75
PART-I(5 x 5 = 25 M)
Answer any FIVE Questions, each question carries FIVE marks.
Unit - I : 1 question
Unit - II : 2 questions
Unit - III : 1 question
Unit - IV : 2 questions
Unit - V : 2 questions
PART-II(5 x 10 M= 50 M) Answer any FIVE questions. Choosing atleast TWO questions from each section.
Each question carries 10 marks. Note : Under Section –A (Q. No: 13) and Section – B (Q. No: 14) will be given from
UNIT-III
SECTION-A
Unit - I : 2 questions
Unit - II : 2 questions
Unit – III : 1 question
SECTION-B
Unit - III : 1 question
Unit - IV : 2 questions
Unit - V : 2 questions
.
SRI Y.N.COLLEGE(Autonomous),Narsapur
Affiliated to Adikavi Nannaya University
Thrice accredited by NAAC with ‘A’ Grade
Recognized by UGC as ‘College with potential for Excellence’
III B.Sc. Statistics – Cluster Elective 8A
Operation Research - I Model Question Paper (Theory ) (for 2018-21 batch w. e. f 2020-2021)
Time: 3Hrs Max Marks: 75
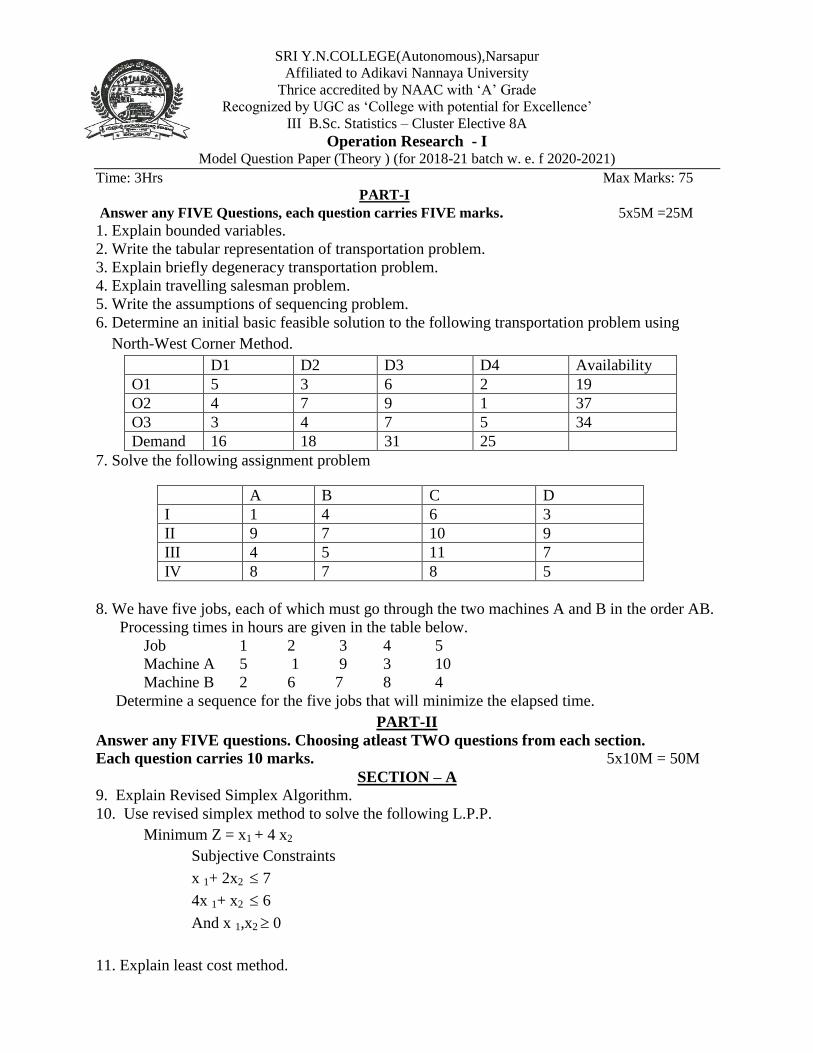
PART-I
Answer any FIVE Questions, each question carries FIVE marks. 5x5M =25M
1. Explain bounded variables.
2. Write the tabular representation of transportation problem.
3. Explain briefly degeneracy transportation problem.
4. Explain travelling salesman problem.
5. Write the assumptions of sequencing problem.
6. Determine an initial basic feasible solution to the following transportation problem using
North-West Corner Method.
D1 D2 D3 D4 Availability
O1 5 3 6 2 19
O2 4 7 9 1 37
O3 3 4 7 5 34
Demand 16 18 31 25
7. Solve the following assignment problem
A B C D
I 1 4 6 3
II 9 7 10 9
III 4 5 11 7
IV 8 7 8 5
8. We have five jobs, each of which must go through the two machines A and B in the order AB.
Processing times in hours are given in the table below.
Job 1 2 3 4 5
Machine A 5 1 9 3 10
Machine B 2 6 7 8 4
Determine a sequence for the five jobs that will minimize the elapsed time.
PART-II
Answer any FIVE questions. Choosing atleast TWO questions from each section.
Each question carries 10 marks. 5x10M = 50M
SECTION – A
9. Explain Revised Simplex Algorithm.
10. Use revised simplex method to solve the following L.P.P.
Minimum Z = x1 + 4 x2
Subjective Constraints
x 1+ 2x2 7
4x 1+ x2 6
And x 1,x2 0
11. Explain least cost method.

12 Determine an initial basic feasible solution to the following transportation problem by using
the VAM-Method.
I II III IV Supply
A 13 11 15 20 2000
B 17 14 12 13 6000
C 18 18 15 12 7000
Demand 3000 3000 4000 5000
13 Explain MODI method. SECTION-B
14. Find the optimum solution to the following problem using UV-Method.
Destination/supply I II III IV SOURCE
O1 21 16 25 13 11
O2 17 18 14 23 13
O3 32 17 18 41 19
DEMAND 6 10 12 15 43
15. Explain an algorithm to solve Assignment Problem by Hungarian method.
16. Solve the following assignment problem of maximization.
EMPLOYEE/JOBS I II III IV V
A 10 5 13 15 16
B 3 9 18 13 6
C 10 7 2 2 2
D 7 11 9 7 12
E 7 9 10 4 12
17. Explain sequential procedure for solving 2 machines ‘n’ jobs problem.
18. Determine the optimal sequence of jobs that minimizes the total elapsed time based on the
following information processing time on machines is given in hours and passing is not
allowed.
Job A B C D E F G
Machine M1 3 8 7 4 9 8 7
Machine M2 4 3 2 5 1 4 3
Machine M3 6 7 5 11 5 6 12