sri lanka the economy report 2013 · 2018. 7. 13. · 6.6 per cent in 2013 and 6.7 per cent in...
TRANSCRIPT

Sri Lanka
State of the Economy Report 2013
Chapter 3 Global Developments and External Sector
Competitiveness
by
Ashani Abayasekera & Raveen Ekanayake

34
3. Global Developments and External Sector Competitiveness
3.1 Introduction
Over the last half century, developing countries aroundthe globe, notably the 'Asian Tigers' (i.e., Singapore,South Korea, Taiwan and Hong Kong), Chile, CostaRica, Malaysia, Thailand, Cambodia, Vietnam, In-dia, Bangladesh and mostly saliently China __ haveincreasingly benefited from integration into the glo-bal economy. In almost all these instances, exportgrowth and diversification have played a pivotal rolein spurring long term growth.
Since the late 1970s, Sri Lanka has also incrementallyreaped the benefits of global integration through ex-ports, though not on the same scale as the countriesnoted above. As of late, however, Sri Lanka's exportperformance has been relatively weak, both at homeand abroad. The ratio of Sri Lanka's exports to GDPhas dropped markedly to just 16.4 per cent in 2012;at the same time, Sri Lanka's exports have also beenlosing its global market share.
The undiversified nature of both Sri Lanka's exportsand export markets are areas of concern, particularlyin light of the global economic turmoil and increasedcompetition from other late-industrializing countries.Weak export performance is raising concerns that SriLanka's export competiveness is deteriorating and thatthe country may not be in a position to reap the fullbenefits of globalization in the long run.
In light of the above, it is critical that the countrybolsters export competitiveness to better exploit theopportunities presented by global integration to raiseand sustain the country's long term growth and de-velopment. The need for attracting the right typesof FDI in building export capacity is also paramount.In this context, this Chapter looks at emerging globalchallenges and Sri Lanka's recent performance in ex-port earnings and FDI flows, and assesses the country'sexport competitiveness vis-à-vis other competitorcountries in Asia.
34
‘‘
The undiversifiednature of both Sri Lanka’sexports and export markets
are areas of concern,particularly in light of the
global economic turmoil andincreased competition fromother late-industrializing
countries
34

Global Developments and External Sector Competitiveness
35
3.2 Global Economic OutlookSupported by strong policy actions of theEuropean Union (EU) and US policymakersto mitigate two looming threats to globalrecovery in 2012 __ a breakup of the EuroZone and a 'fiscal cliff' in the US __ 2013 islikely to see a gradual acceleration in majoradvanced economies. This is expected to beled by the US, which is projected to growby 1.9 per cent in 2013, and by 3 per centin 2014.1 The US economy has shown sev-eral signs of recovery, including a pick-upin credit growth, rising house prices, and agradual upturn in job creation with the un-employment rate being brought to below 8per cent. A growth rate of 1.6 per cent ispredicted for Japan, which is moderatelyhigher than the October 2012 forecast, sup-ported by a new policy package of aggres-sive quantitative easing, a positive inflationtarget, fiscal stimulus, and structural reforms.However, several risks still persist, while newthreats have also emerged. Many risks relateto continued weak economic activity in theEuro Zone,2 uncertainty about the conse-quences of events in Cyprus and politicalissues in Italy. High fiscal deficits and debtin the US and Japan also pose significantrisks to global recovery, and call for strongmedium term fiscal consolidation plans.
The economic performance of Asia as a re-gion in 2012 was rather subdued owing to abroad-based weakening of exports, bothwithin and outside the region, and the imple-mentation of policies by China with a viewto moderate and better balance growth. Theoutlook for 2013, however, is a bit moreupbeat, with the IMF noting that economicactivity in the region has stabilized in thefirst quarter of 2013.3 Exports have recentlypicked up across the region, reflecting firmer
demand in China and the advanced econo-mies (notably the US). Economies across theregion are expected to benefit from internaldemand spillovers, particularly with growingdemand by China and the policy-led pick-upin Japan. Notably, the depreciation of the yenis expected to pose both opportunities andchallenges for other exporters of the region.Some exporters may face more direct compe-tition from Japanese firms in world markets,while others may benefit through increasedsupply chain linkages with Japan.
The Asian Development Bank (ADB) forecastsgrowth in the Asian region to accelerate to6.6 per cent in 2013 and 6.7 per cent in 2014,driven largely by domestic factors this yearand by external demand and a strengtheningglobal economy next year.4 Whilst the re-gion as a whole is expected to grow, growthamongst the various sub-regions is, however,anticipated to recover at various speeds. Thegrowth rebound is anticipated to be largelyfounded on China, which is anticipated togrow at 8.2 per cent in 2013 and 8 per centin 2014, up from 7.8 per cent in 2012, andthe continued resilience in the Associationof Southeast Asian Nations (ASEAN) whichis projected to grow by 5.4 per cent in 2013and 5.7 per cent in 2014. Growth prospectsfor South Asian economies on the other handare largely dependent on India, and its com-mitments to implement needed structural re-forms. Signs of recovery in India are still weak,with the Indian economy expected to recordmodest growth, owing to constraints on do-mestic investment and low optimism amonginvestors. The sub region's growth outlook isanticipated to improve to 5.7 per cent in 2013and 6.2 per cent in 2014 from an anaemicgrowth of 5 per cent in 2012, given the mod-erate outlook for India.
1 IMF (2013), World Economic Outlook, April 2013.2 The IMF has brought down their growth forecast for the EU for 2013 from 0.7 per cent in July 2012 to -0.3 per cent as of present.3 IMF (2013), World Economic Outlook, April 2013.4 ADB (2013), Asian Development Outlook 2013, Asian Development Bank, Manila.

State of the Economy 2013
36
Mirroring the slowdown of economic activ-ity in 2012, world trade growth deceleratedfrom 6 per cent in 2011 to 2.5 per cent in2012, significantly below the growth rate of3.7 per cent projected by the World Bank inits 2012 'World Trade Report'. Export growthin advanced economies fell sharply from 5.6per cent in 2011 to 1.9 per cent in 2012,while import growth also declined from 4.7per cent to a mere 1 per cent in the sameperiod. The spillover effects of this slowdownresulted in a similar drop in export growthin emerging and developing economies from6.4 per cent to 3.7 per cent. World tradegrowth is expected to improve to 3.6 per centin 2013 based on improved global economicprospects.5
Similar to the trend in trade growth, 2012witnessed a sharp drop in global FDI flows.The slow recovery in 'greenfield investments'in 2011was short-lived,6 with FDI growthgrounding to a standstill in 2012, with a 16.4per cent decline in FDI projects over the pre-vious year since the onset of global reces-sion.7 The slowdown was felt the world over,
Table 3.1GDP Growth Projections: Selected Countries/Regional Groupings
Source IMF ADB World BankCountry/Year 2012 2013 2014 2012 2013 2014 2012 2013 2014US 2.2 1.9 3.0 2.2 2.0 2.6 2.2 1.9 2.8Japan 2.0 1.6 1.4 2.0 1.2 1.4 1.9 0.8 1.2Euro Zone -0.6 -0.3 1.1 -0.6 -0.3 1.2 -0.4 -0.1 0.9China 7.8 8.0 8.2 7.8 8.2 8.0 7.9 8.4 8.0India 4.0 5.7 6.2 5.0 6.0 6.5 5.1 6.1 6.8
ASEAN-5 6.1 5.9 5.5 6.1 5.8 6.0 5.4 5.6 5.7Notes: Growth Figures for 2013 and 2014 are projections/estimates; ASEAN-5 (Indonesia, Philippines,
Thailand, Vietnam and Malaysia).Sources: IMF, World Economic Outlook, April 2013; ADB, Asian Development Outlook 2013; World
Bank, Global Economic Prospects 2013.
with all global regions experiencing a de-cline in FDI. Lacklustre economic growth inEurope, Japan and Brazil, slower growth inChina, political instability in the Middle East,and policy uncertainty in the US, all impactedadversely on the global FDI market. The Asia-Pacific region remained the leading regionaldestination for FDI in 2012, securing a glo-bal market share of 31.7 per cent.8
The implications of such global develop-ments on Sri Lanka's external sector have beensubstantial. The export sector, which dem-onstrated notable growth in 2011, suffered amajor setback in 2012, recording a contrac-tion in export earnings of 7.4 per cent, and acontinued contraction of 4.5 per cent in thefirst six months of 2013.9 FDI inflows havealso remained subdued throughout 2012.While the slowdown of global economicactivity no doubt had a sizeable impact onSri Lanka's poor performance, several inter-nal factors constraining external sector com-petitiveness have also contributed to thissituation, as will be discussed in subsequentsections of this Chapter.
5 IMF (2013), World Economic Outlook, April 2013.6 This is a form of FDI where a parent company starts a new venture in a foreign country by constructing new operational facilities from
the ground up.7 fDi Intelligence (2013), The fDi Report: Global Greenfield Investment Trends.8 Ibid.9 CBSL, “External Sector Performance”, June 2013.

Global Developments and External Sector Competitiveness
37
3.3 Sri Lanka's External Sector Perfor-mance3.3.1 Trade Performance: ExportGrowthContrary to the robust performance in exportearnings in 2010 and 2011, 2012 saw a no-table contraction in merchandise export earn-ings of 7.4 per cent, reflecting setbacks inboth industrial and agricultural products.Industrial exports, which account for 75 percent of total exports, recorded a contractionof 7.8 per cent, led by a near 5 per cent con-traction in its key export category, garments(Table 3.2). The sizeable decline in garmentexport earnings has been attributed to a sharpdecline in international cotton prices fromthe peak levels recorded in March 2011, andthe dampened global demand in the contextof the global economic downturn.10 How-ever, this decline could also be due to otherfactors, such as the loss of the GeneralizedSystem of Preference (GSP)+ facility to theEU market in 2010, which has led to clo-sures of some factories. The contraction inexport earnings of tea by 5.3 per cent, con-tributed towards the overall decline in agri-cultural exports. Adverse weather conditions
affected production volumes leading to lowerprices.
Services export earnings showed a more posi-tive picture, with net earnings from servicesexports recording an increase of 13.7 per centto US$ 1,250 in 2012. This was mainlydriven by improved performance in the trans-portation, and computer and information ser-vices sectors. The expansion of port and air-port related activities led to increased inflowsin freight, port, and airport related services,while increased earnings from informationtechnology enabled services (ITES) such asbusiness process outsourcing (BPO) andknowledge process outsourcing (KPO) con-tributed towards the growth of computer andinformation services exports.
The fall in absolute export earnings in 2012has been preceded by a declining trend overthe years in Sri Lanka's export share __ bothas a percentage of GDP and as a percentageof total world exports. The exports-to-GDPratio which stood at 30 per cent in 2000almost halved to 16.4 per cent by 2012, whileSri Lanka's share of global exports has re-
Table 3.2Growth in Goods and Services Exports, 2012
Annual Average Growth (%) Share (%)a
Agriculture -7.8 23.9
Tea -5.3 14.4
Industrial -7.8 75.4
Gems, diamonds and jewellery 5.2 5.7
Textiles and garments -4.8 40.8
Services 31.0
Transportation 21.1 37.0
IT 42.1 34.9
Note: a: In case of goods, values as a percentage of total earnings from goods exports, and in case ofservices, as a percentage of total earnings from services exports.
Source: CBSL, Annual Report 2012.
10 CBSL, Annual Report 2012.

State of the Economy 2013
38
mained stagnant over the years. As shownin Figure 3.1, Sri Lanka's share of goods ex-ports which rose marginally from 0.05 percent in 1980 to 0.08 per cent in 2000, hasfallen again in the post 2000 period, andhas reverted back to 0.05 per cent in 2012.In contrast, Vietnam has demonstrated re-markable export growth, with its global sharerising from a mere 0.02 per cent in 1980 to0.63 per cent by 2012. Bangladesh whichalso started from a lower share than Sri Lanka
in 1980, has surpassed Sri Lanka's share by2012. While Sri Lanka has managed to in-crease its share of global services exports from0.06 per cent to 0.09 per cent during the1980-2012, this is a marginal increment com-pared to the rapid growth of market share inmany other competitor countries.
Sri Lanka's export earnings have continuedto contract by 4.5 per cent in the first sixmonths of 2013 with industrial exports __
Figure 3.1Global Export Share in Goods and Services, 1980-2012
Source: Compiled using data from the UNCTAD Statistical Database, 2013. [http:/unctadstat.unctad.org/ReportFolders/reportFolders.aspx].
0.70.6
0.50.4
0.30.2
0.1
01980 1985 1990
Bangladesh
Tade in Goods
Cambodia Lao People’s Dem. Rep.Sri LankaPakistanMyanmar
Vietnam
1995 2000 2005 2010 2011 2012
Perc
enta
ge
0.70.6
0.50.4
0.30.2
0.1
01980 1985 1990
Bangladesh
Tade in Services
Cambodia Lao People’s Dem. Rep.Sri LankaPakistanMyanmar
Vietnam
1995 2000 2005 2010 2011 2012
Perc
enta
ge
0.70.6
0.50.4
0.30.2
0.1
01980 1985 1990
Bangladesh
Tade in Goods
Cambodia Lao People’s Dem. Rep.Sri LankaPakistanMyanmar
Vietnam
1995 2000 2005 2010 2011 2012
Perc
enta
ge
0.70.6
0.50.4
0.30.2
0.1
01980 1985 1990
Bangladesh
Tade in Services
Cambodia Lao People’s Dem. Rep.Sri LankaPakistanMyanmar
Vietnam
1995 2000 2005 2010 2011 2012
Perc
enta
ge

Global Developments and External Sector Competitiveness
39
which account for the bulk of total exports __
recording a 4.7 per cent decline.11 This sug-gests that its global share is likely to deterio-rate further unless immediate remedial ac-tion is taken to revive export performance.
3.3.2 Trade Performance: Export Diver-sificationWhilst there has been a clear slowdown inSri Lanka's export growth, Sri Lanka's exportbasket has also seen very limited diversifica-tion, both in terms of products and marketsover the past two decades (Figure 3.2). TheUS and the EU have continued to be the majorexport destinations for Sri Lankan products,accounting for well over 50 per cent of totalexports. More recently, there have been signsthat exports have started to penetrate intoIndia, primarily as a result of the India-SriLanka Free Trade Agreement (ISFTA) thatcame into operation in 2000. However, in-roads into other South Asian Association forRegional Cooperation (SAARC) countries havenot been significant. Likewise, in terms ofSri Lanka's export basket, only a very limiteddiversification can be observed; textiles, pe-troleum-based products and primary com-
11 CBSL, “External Sector Performance”, June 2013.12 These are products based on the Standard International Trade Classification (SITC) revision 3 at the 3 digit level which either have a
national export value exceeding US$ 100 or represent more than 0.3 per cent of total national exports.
Figure 3.2Sri Lanka’s Export Market and Product Diversification, 1990, 2000, and 2012
Source: CBSL, Annual Report, various years.
modities such as tea, rubber, coconut, andfisheries products continue to account forwell over 60 per cent of total exports, whilstInformation and Communications Technol-ogy (ICT) based exports have made very mod-est strides into the world market.
More alarmingly, as depicted in Figure 3.3,there has been a dramatic decline in the num-ber of products being exported by Sri Lankato the world,12 contrary to the trend observedin other second-tier exporting countries wherethe number of products exported has tendedto increase as the economy and the industri-alization process gradually matures. WhileSri Lanka also showed improvement in thisregard, specifically by increasing the num-ber of products from 235 in 1995 to 247 in2005, there has been a reversal of these trendsin more recent years. Of significant concernis to note the substantial decline from 238products in 2010 to 175 in 2011, a declinespecific to Sri Lanka alone. Consequently,whereas both Sri Lanka and Vietnam exportedthe same number of products in 1995, Viet-nam is high above Sri Lanka at 248 in 2011,compared to Sri Lanka's 175.
100%90%80%70%60%50%40%30%20%10%
0%1990
USA IndiaEU SAARCMiddle East Others
2000 2003
100%90%80%70%60%50%40%30%20%10%
0%1990
USA IndiaEU SAARCMiddle East Others
2005 2012
100%90%80%70%60%50%40%30%20%10%
0%1990
USA IndiaEU SAARC
Middle East Others
2000 2003
100%90%80%70%60%50%40%30%20%10%
0%1990
Textiles and garmentsPrimary products Others
Petroleum products
2005 2012

State of the Economy 2013
40
Figure 3.3Number of Products Exported to the World, 1995-2011
Source: UNCTAD Statistical Database, 2013.[http://unctadstat.unctad.org/ReportFolders/reportFolders.aspx].
3.3.3 Foreign Direct Investment Per-formanceWhile realized inward FDI to Sri Lanka re-covered from pre-crisis levels in 2011 to reacha record US$ 956 million, inflows in 2012(US$ 898 million) have been subdued, andfallen short of the government's target of US$
1.5 billion. Of the FDI realized in 2012, theinfrastructure sector received the bulk (44.6per cent) consisting of investments in portsand container terminals, telephone and tele-communication networks, power generation,and housing and property development; fol-lowed by investments in the services sector
Figure 3.4Inward FDI Flows, 1994-2011
Source: UNCTAD Statistical Database, 2013 [http://unctadstat.unctad.org/ReportFolders/reportFolders.aspx].
300
250
1995
2005
2011
200
150
100
50
0
Bangladesh
CambodiaIndia
Lao People’s
Dem.Rep.Mala
ysia
Myanmar
Pakista
n
Sri La
mka
Thailan
d
Vietnam
Num
ber o
f pro
duct
s
0
2000
4000
6000
8000
10000
12000
14000
Bangladesh Cambodia Laos Myanmar Pakistan Sri Lanka Vietnam
14000
12000
10000
8000
6000
4000
2000
0
Banga
lades
h
Cambo
dia Laos
Mya
nmar
Pakis
tan
Sri La
nka
Vietna
m
1994-1999
2000-2005
2006-2011US$
mn.
300
250
1995
2005
2011
200
150
100
50
0
Bangladesh
CambodiaIndia
Lao People’s
Dem.Rep.Mala
ysia
Myanmar
Pakista
n
Sri La
nka
Thailan
d
Vietnam
Num
ber o
f pro
duct
s
0
2000
4000
6000
8000
10000
12000
14000
Bangladesh Cambodia Laos Myanmar Pakistan Sri Lanka Vietnam
14000
12000
10000
8000
6000
4000
2000
0
Bangla
desh
Cambo
dia Laos
Mya
nmar
Pakis
tan
Sri La
nka
Vietna
m
1994-1999
2000-2005
2006-2011US$
mn.
State of the Economy 2013
40
Figure 3.3Number of Products Exported to the World, 1995-2011
Source: UNCTAD Statistical Database, 2013.[http://unctadstat.unctad.org/ReportFolders/reportFolders.aspx].
3.3.3 Foreign Direct Investment Per-formanceWhile realized inward FDI to Sri Lanka re-covered from pre-crisis levels in 2011 to reacha record US$ 956 million, inflows in 2012(US$ 898 million) have been subdued, andfallen short of the government's target of US$
1.5 billion. Of the FDI realized in 2012, theinfrastructure sector received the bulk (44.6per cent) consisting of investments in portsand container terminals, telephone and tele-communication networks, power generation,and housing and property development; fol-lowed by investments in the services sector
Figure 3.4Inward FDI Flows, 1994-2011
Source: UNCTAD Statistical Database, 2013 [http://unctadstat.unctad.org/ReportFolders/reportFolders.aspx].
300
250
1995
2005
2011
200
150
100
50
0
Bangladesh
CambodiaIndia
Lao People’s
Dem.Rep.Mala
ysia
Myanmar
Pakista
n
Sri La
mka
Thailan
d
Vietnam
Num
ber o
f pro
duct
s
0
2000
4000
6000
8000
10000
12000
14000
Bangladesh Cambodia Laos Myanmar Pakistan Sri Lanka Vietnam
14000
12000
10000
8000
6000
4000
2000
0
Banga
lades
h
Cambo
dia Laos
Mya
nmar
Pakis
tan
Sri La
nka
Vietna
m
1994-1999
2000-2005
2006-2011US$
mn.

Global Developments and External Sector Competitiveness
41
(31.9 per cent) driven by investments in tour-ism; whilst the manufacturing sector ac-counted for 23 per cent, with a major shareof FDI into the food and beverages industry,and the textile, and wearing apparel indus-try.
In comparison with other competitor coun-tries, Sri Lanka's performance in attractingFDI has been lacklustre, as shown in Figure3.4. Especially over the last decade, late-in-dustrializing countries in both South andSoutheast Asia such as Bangladesh, Vietnam
and Myanmar have been able to attract fargreater volumes of FDI. Sri Lanka's poor per-formance has also been reflected in the FDIAttraction Index,13 compiled by theUNCTAD, which measures and ranks thesuccess of 181 countries in attracting FDIover a rolling three-year period. Sri Lanka'sranking in the index has deteriorated consid-erably over the last decade from 132 in 2000,to 158 in 2011. Bangladesh, Vietnam,Myanmar, and Laos are all ranked above SriLanka.
Box 3.1Attracting FDI: Lessons from other Late Industrializing Countries
Over the last decade or so, a number of second-tier exporting countries in South andSoutheast Asia have been able to attract impressive volumes of FDI.14 Sri Lanka candraw lessons from these countries in designing a more attractive policy package to enticeFDI. In recent times, Myanmar has witnessed a dramatic increase in inward FDI, high-lighting the strong linkage between political stability and FDI. Political and economicreforms coupled with improved international relations have brought about vast improve-ments to the country's investment environment. Investors have responded positively tothese developments, with FDI projects increasing from 10 prior to 2012 to 54 in 2012,which has also led to significant increases in capital investment (152 per cent) and jobcreation from FDI (157 per cent). Indonesia, the Philippines, and Bangladesh also allrecorded impressive inward FDI growth of 7.6 per cent, 11.3 per cent, and 66.7 per cent,respectively. The impressive volume of FDI into Bangladesh indicates an emerging trendwhere a global shift is taking place with a re-allocation of efficiency-seeking FDI awayfrom China and other emerging markets, and towards frontier markets such as Bangladeshwith their vast untapped labour pools, low costs, and market opportunities. Whilst FDIflows to the BRIC (Brazil, Russia, India, China, South Africa) countries experienced aslowdowns, India, China, and Brazil remain amongst the top five destinations for FDI.
Source: fDi Intelligence, 2013, The fDi Report: Global Greenfield Investment Trends.
13 UNCTAD (2012), “World Investment Report: Towards A New Generation of Investment Policies”, United Nations Conference onTrade and Development, Geneva, Switzerland.
14 Refers to developing countries which are gradually orienting themselves towards specializing in manufactured exports in their attemptto replicate the success of the Newly Industrialized Economies (NIEs) of East Asia. Two alternative terms used in the literature are ‘newexporting countries’ and ‘latecomers export-oriented industrialization’.

State of the Economy 2013
42
Despite the poor performance in the past,the UNCTAD in its FDI Potential Index __
which captures four key economic determi-nants of the attractiveness of an economy forFDI __ ranks Sri Lanka at 68 out of 181 coun-tries overall. In the sub-category of attrac-tiveness to low-cost and skilled labour, SriLanka stands out, ranked at 23 out of 181countries, highlighting the country's attrac-tiveness to export-oriented/efficiency seekinginvestments.
3.4 Sri Lanka's Export Competiveness:A DiagnosisThe ensuing section examines Sri Lanka'sexport competitiveness using a frameworkdeveloped by the World Bank.15 The frame-work examines the issues that affect acountry's ability to compete in internationalmarkets under three intertwined components:(1) the presence of an overarching incentiveframework for exports; (2) the reduction oftrade-related costs; and (3) the efficient man-agement of market and government failures.The strengths and weaknesses of each of thethree components in relation to Sri Lanka areanalyzed below.
3.4.1 Incentive FrameworkA key policy challenge is to ensure that do-mestic resources are channeled to their mostproductive activities. Having the right kindsof incentives in place to ensure that factorsof production are moving to sectors in whichthe country has a long term capacity to com-pete is, therefore, critical. Trade, investment,fiscal, and exchange rate policies must begeared towards providing the required incen-tives.
Trade PolicyA country's trade policy has a direct bearingon its ability to compete in an internationalenvironment. Sri Lanka's lacklustre perfor-mance in the export sector in the post 2000period could in part be explained by changesin the country's trade policy over the years.Sri Lanka's decisive move away from the pro-tectionist import-substitution trade policiesin 1977, coupled with trade liberalizationreforms __ particularly, reductions in the av-erage level of import tariffs __ have beensteadily reversed since the beginning of thedecade.
Whilst the increase in tariff protection hasbeen modest in the recent past, the imposi-tion of para-tariffs over and above the stan-dard customs duty rates has resulted in anincreasingly complex and protectionist tradepolicy regime.16 Estimates by the World TradeOrganization (WTO) as set out in Sri Lanka's'Trade Policy Review' of 2010, show thatwhen both the standard customs duties andall other export taxes are taken together, theun-weighted average total protection rate(TPR) turned out to be as high as 31 per cent(compared to the standard customs duty rateof 12 per cent).
Pursell and Ahsan (2011) have undertaken asystematic comparison of Sri Lanka's recenttariff structures (Table 3.3).17 The total pro-tection rate (customs duty + para-tariffs) in-creased marginally between late 2002 andearly 2004, but then more than doubled be-tween 2004 and 2009. Nearly all of the sharpincrease is due to the extra protection pro-vided by para-tariffs. While average customduties in 2009 were low compared to other
15 World Bank (2013), Export Competitiveness: Key Elements of an Export Competitiveness Strategy, Available at http://web.worldbank.org/WBSITE/EXTERNAL/TOPICS/TRADE/EXTEXPCOMNET/0,,contentMDK:21781937~pagePK:64168445~piPK:64168309~theSitePK:2463594,00.html.
16 Para-tariffs are taxes which are only applied to imports and there is no domestic equivalent, and hence add to whatever protection isprovided to domestic production by customs duties.
17 Pursell, G. and F.M. Ziaul Ahsen (2011), “Sri Lanka’s Trade Policies: Back to Protectionism,” ASARC Working Paper 2011/03.

Global Developments and External Sector Competitiveness
43
developing country standards, para-tariffsmore than doubled this rate, thereby makingthe TPR far exceed the developing countryaverage.
Each para-tariff has its own product cover-age, with frequent changes in the productcoverage, especially of the Cess. The exten-sive amount of taxes and the frequent changesin terms of product coverage makes it ex-tremely difficult to calculate the TPRs appli-cable to individual products, and to assessthe changes in trends overtime. Disaggregateddata reported in Pursell and Ahsan (2011)show that para-tariffs have led to 75 differ-ent TPRs ranging from zero to more than 90per cent. The TPRs for agricultural tariff linesare the worst, with almost 40 per cent withinthe range of 70-80 per cent.
Sri Lanka's increasingly restrictive trade policyregime is also reflected in the Enabling TradeIndex (ETI) produced by the World EconomicForum (WEF). The ETI consists of four main
Table 3.3Unweighted Average Protection Rates,a 2002, 2004, 2009 and 2011
Custom Duties Para-tariffs Total Protection RateNovember 2002Agriculture 21.1 5.2 26.3Industryb 7.6 2.5 10.1All tariff lines 9.6 2.9 12.5
January 2004Agriculture 24.6 3.5 28.1Industryb 8.8 1.9 10.7All tariff lines 11.3 2.1 13.4
December 2009Agriculture 24.6 25.0 49.6Industryb 10.3 13.7 24.0All tariff lines 12.4 15.5 27.9
January 2011Agriculture 25.4 21.4 46.8Industryb 9.1 10.6 19.7All tariff lines 11.5 12.2 23.7
Notes: a. All protection rates are percentages of cif import value; b. This predominantly reflectsmanufacturing protection. Mining accounts for a tiny share of industrial output (less than 3 percent).
Source: Pursell, G. and F.M. Ziaul Ahsen (2011), “Sri Lanka’s Trade Policies: Back to Protectionism,”ASARC Working Paper 2011/03.
sub-indices, one of which is the 'market ac-cess' sub-index. This measures the extent towhich the policy framework of the countrywelcomes foreign goods into the country, andenables access to foreign markets for its ex-porters. In particular, it measures the levelof protection of a country's markets, the qual-ity of its trade regime, and the level of pro-tection exporters face in target markets, us-ing indicators such as average applied tar-iffs, the share of goods imported duty free,the variance of tariffs, the frequency of tariffpeaks, the number of distinct tariffs, and themargin of preference in target markets nego-tiated through bilateral or regional agree-ments. Sri Lanka records a low score for thissub-index compared to its competitor coun-tries, and is ranked fairly low at 103 out of132 economies.
Regional and bilateral trading arrange-mentsPreferential trading arrangements betweencountries form an important component of

State of the Economy 2013
44
the incentive framework in place to promoteexports. This works primarily through tariffconcessions or duty free entry provided intoexport markets under these agreements. Suchtariff preferences serve to provide a competi-tive edge in exporting products compared toother competitors, and also motivate export-ers to aggressively explore and exploit exportopportunities in such markets.
The case of the ISFTA which became effec-tive in 2000 provides a good example of atrade agreement that has served to stimulatetrade flows between India and Sri Lanka. In-dia has emerged as Sri Lanka's largest andmost balanced trade partner, with exportsfrom Sri Lanka to India rising from US$ 39million during 1995-2000 to US$ 567 mil-lion in 2012. The number of export itemshas also shown a remarkable increase, witha visible shift from low-value added agricul-tural products to high value added manufac-turing goods. Moreover, although the ISFTAcovers only liberalization of goods, it hasindirectly led to a significant amount of In-dian investments in Sri Lanka, which has inturn strengthened Sri Lanka's supply capaci-ties.
Another important example is Sri Lanka'spenetration into the EU market through itsGSP scheme. Sri Lanka's apparel exports inparticular have benefitted under this scheme,receiving both tariff concessions under thegeneral scheme and duty free entry under theGSP+ scheme. The fall in apparel exports tothe EU in 2012 is in part attributed to theloss of GSP+ concessions in 2010.
Sri Lanka has also entered into a bilateralFree Trade Agreement (FTA) with Pakistan
and is a member of the South Asia Free TradeAgreement (SAFTA) and the Asia-PacificTrade Agreement (APTA), the latter being theoldest preferential trade agreement betweendeveloping countries in the Asia-Pacific re-gion.18 However, these agreements have de-livered limited results in terms of stimulat-ing export flows due to numerous problems,including low product coverage, thin mar-gins of preferences, and non-tariff barriers.
The stalling of multilateral trade negotiationshas led to the increasing proliferation of bi-lateral and regional trade arrangements in therecent past, particularly in the Asia-Pacificregion. Table 3.4 provides a comparativesense of the different types of trade agree-ments some selected Asian countries haveentered into as of January 2013. These in-clude all agreements that are signed and ineffect, signed but not yet in effect, negotia-tions launched and proposed/under consul-tation and study. As is evident, Sri Lanka'sengagement in trade agreements is very lowcompared to its competitor countries. Outof the eight agreements listed below, onlyfour are fully effective __ the bilateral agree-ments with India and Pakistan, the SAFTA,and the APTA __ which all together coveronly 21 per cent of Sri Lanka's total trade.19
Moreover, Sri Lanka's participation in theseagreements is also not satisfactory. For in-stance, Sri Lanka is the only SAARC countrythat is yet to submit its revised sensitive listunder SAFTA and its 'offer and request' listunder the South Asia Trade in Services Agree-ment (SATIS).20
Alternatively, Southeast Asian countries showheavy involvement in all types of agreements,particularly in Comprehensive Economic
18 The APTA, previously named the Bangkok Agreement, was signed in 1975 as an initiative of ESCAP and involved five member states,namely Bangladesh, India, Lao People's Democratic Republic (PDR), Republic of Korea and Sri Lanka. In 2000, China also joinedAPTA. The SAFTA, involving all SAARC countries came into effect in 2006.
19 UNESCAP (2010), “Asia-Pacific Trade and Investment Report 2011: Post-crisis Trade and Investment Opportunities”, United Nations,New York.
20 The SATIS was signed in 2010 with the objective of liberalizing trade in services among SAARC countries, but has not becomeeffective thus far.

Global Developments and External Sector Competitiveness
45
Partnership Agreements (CEPAs) and Com-prehensive Economic Cooperation Agree-ments (CECAs), which cover a broad spec-trum of goods, services, and investment lib-eralization. While India is steaming aheadwith the negotiation of both bilateral agree-ments and comprehensive partnership agree-ments, Pakistan has also embarked on a sig-nificant number of bilateral deals.
Foreign Investment PolicyIt has been increasingly recognized in manydeveloping countries that FDI __ in particu-lar, export-oriented investments __ can playa decisive role in diversifying a country’s ex-port-base. Sri Lanka's FDI policy regime since1977 has increasingly been liberalized; com-plete 100 per cent foreign ownership has beenpermitted for investment in almost all areasof the economy, and restriction on foreignexchange transaction relating to current ac-count payments have increasingly been re-laxed. Constitutional provisions have beenenacted to guard against expropriation of for-eign owned assets. In addition, the GoSL todate has entered into 27 Bilateral InvestmentTreaties, and 38 Double Taxation AvoidanceAgreements. In addition, Sri Lanka offers a
Table 3.4Trade Agreements -- Proposed, Negotiated, Signed, Signed and in Effect
Country RTAs Bilateral Plurilateral CEPAs CECAs TotalFTAs/PTAs PTAs
Bangladesh 3 1 2 - - 6Cambodia 4 4 3 11India 8 14 2 5 5 34Lao PDR 6 1 3 3 13Malaysia 9 7 1 5 4 26Myanmar 6 3 3 12Pakistan 6 18 2 1 - 27Sri Lanka 3 4 - 1 - 8Thailand 8 10 - 5 3 26Vietnam 9 3 - 3 3 18
Notes: RTA: Regional Trade Agreement; FTA: Free Trade Agreement; PTA: Preferential Trade Agreement;CEPA: Comprehensive Economic Partnership Agreement; CECA: Comprehensive EconomicCooperation Agreement:
Source: Compiled from the Asia Regional Integration Centre, Free Trade Agreements Database. [http://aric.adb.org/ftatrends.php].
host of fiscal incentives to attract FDI (Box3.2). Export-oriented ventures qualify for spe-cial fiscal incentives such as customs duty,VAT and Ports and Airports Development Levy(PAL), exemptions on raw-material imports,upon meeting export performance require-ments and meeting a minimum investmentthreshold. The investment threshold currentlystands at US$ 500,000.
However, there are a number of other devel-oping countries vying to attract similar typesof FDI, and offering a lower investmentthreshold. For example, the threshold estab-lished in Malaysia is US$ 200,000, whileThailand has set it at US$ 92,800. By con-trast, Sri Lanka's threshold level seemsuncompetitive. Given the importance of FDIto spurring greater exports, projects shouldalso be considered on the basis of their ex-port and employment generation potential.
Exchange Rate PolicyThe real exchange rate plays a pivotal role indetermining a country's export competitive-ness. Direct policies to sustain an overval-ued or undervalued exchange rate in the longrun may adversely impact export

State of the Economy 2013
46
Box 3.2Overview for FDI Approval Process
The prevailing foreign investment approval process falls under two broad categories; namely (a)Section 16 and 17 of the Board of Investment (BOI) Law (Automatic Approval Route Projects); and(b) Strategic Development Projects Act of 2008. Projects approved under Section 16 of the BOILaw are permitted without any fiscal concessions, and are governed by 'normal laws' of thecountry. Such approvals are made merely to facilitate a foreign investor. The Budgets of 2012 and2013, through the Inland Revenue Department offers a host of various fiscal incentives to pro-mote both foreign and local investments.
At present, nine broad sectors, namely tourism and leisure, infrastructure, knowledge services,utilities, apparels, export manufacturing, export services, agriculture, and education have beenidentified as key investment thrust areas. Eligible investments qualify for fiscal incentives rangingfor tax holidays, tax concessions, and customs duty, PAL and VAT exemptions on imports ofboth capital goods and raw materials. The amount and nature of investment incentives offeredare pre-determined and are based on the sector of investment and investment threshold.
Investments are lumped into three main categories based on the investment thresholds; smalland medium scale investments, medium scale investments, and large-scale investments. Thelarger the investment, the more attractive the incentive package is, in terms extended tax holidaysand special concessions. Incentives offered also vary with the sector of investment. Prioritysectors, which the government aims to encourage investments in, are offered superior incentivepackages and/or are subject to lower investment thresholds. Investments in the agriculture sector,namely fisheries and the production of seeds and planting material, cultivation of crops of renew-able energy, and the manufacture of organic fertilizer and pesticides do not have to meet invest-ment thresholds. Lower investments thresholds are also in place to encourage 'strategic importreplacement' projects pertaining to the manufacture of fabrics, milk powder, cement and phar-maceutical products. Export-oriented ventures qualify for duty free facilitation for both raw-mate-rial and capital good imports, whilst only the large-scale non-export oriented ventures qualify forduty-free facilitation of capital goods.
The second category of investment approvals falls under the Strategic Development Projects ActNo. 14 of 2008 and its subsequent amendments. As laid out in the Act, a Strategic DevelopmentProject (SDP) is defined as a project which is in the national interest, is likely to bring economicand social benefits to the country, and is also likely to change the landscape of the country,primarily through provision of goods and services which will be of benefit to the public, substan-tial inflow of foreign exchange, substantial employment, and technology transfer'. On identifica-tion of a prospective SDP, the BOI in consultation with the Minister of Economic Developmentmay propose a project for consideration via gazette notification, publishing information relatingto the proposed project, and the exemptions to be granted in respect of same. On the expirationof a 30 day period from the date of the gazette notification, the Minster together with the Ministerof Finance must inform and seek approval of the Cabinet of Ministers. Projects deemed SDPs areeligible for a host of 'special investment incentives'.
competiveness. An overvalued exchange rateleads to exports becoming more expensivein foreign markets as a consequence of higherprices of exported goods and services in for-eign currency terms. If the real exchangerate is overvalued as a consequence of a nomi-nal appreciation, the foreign currency priceof exports is higher than exports from com-
petitor countries, thus reducing foreign de-mand for exported goods. On the other hand,if an overvaluation is due to excessively highdomestic inflation relative to global infla-tion, then domestic costs of productionwould be artificially high, reducing profitsfrom exporting and/or coerce firms to raiseprices, leading to a loss in competitiveness.
Global Developments and External Sector Competitiveness
47
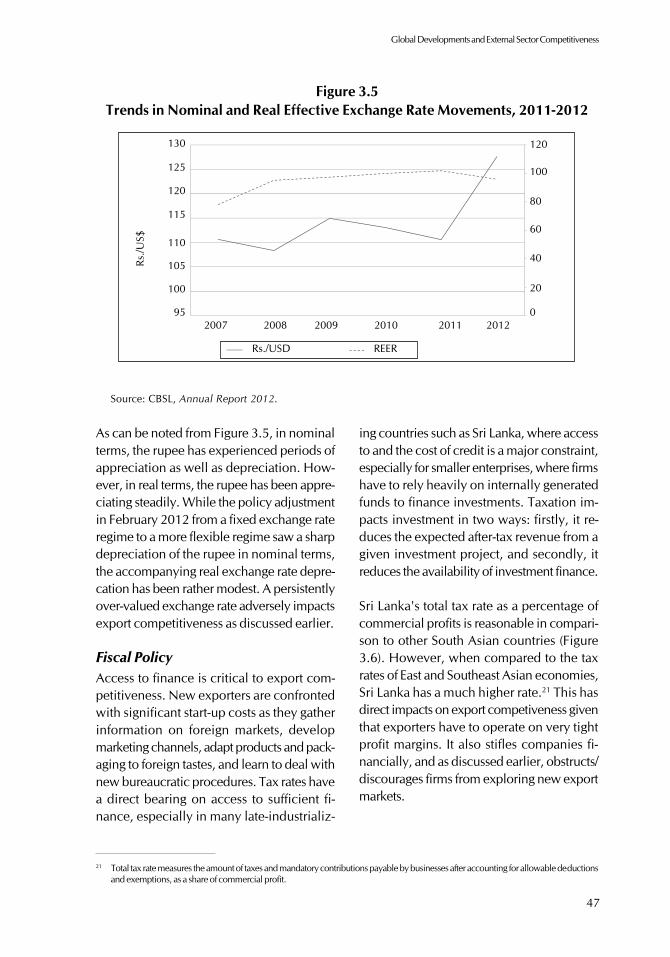
Figure 3.5Trends in Nominal and Real Effective Exchange Rate Movements, 2011-2012
As can be noted from Figure 3.5, in nominalterms, the rupee has experienced periods ofappreciation as well as depreciation. How-ever, in real terms, the rupee has been appre-ciating steadily. While the policy adjustmentin February 2012 from a fixed exchange rateregime to a more flexible regime saw a sharpdepreciation of the rupee in nominal terms,the accompanying real exchange rate depre-cation has been rather modest. A persistentlyover-valued exchange rate adversely impactsexport competitiveness as discussed earlier.
Fiscal PolicyAccess to finance is critical to export com-petitiveness. New exporters are confrontedwith significant start-up costs as they gatherinformation on foreign markets, developmarketing channels, adapt products and pack-aging to foreign tastes, and learn to deal withnew bureaucratic procedures. Tax rates havea direct bearing on access to sufficient fi-nance, especially in many late-industrializ-
ing countries such as Sri Lanka, where accessto and the cost of credit is a major constraint,especially for smaller enterprises, where firmshave to rely heavily on internally generatedfunds to finance investments. Taxation im-pacts investment in two ways: firstly, it re-duces the expected after-tax revenue from agiven investment project, and secondly, itreduces the availability of investment finance.
Sri Lanka's total tax rate as a percentage ofcommercial profits is reasonable in compari-son to other South Asian countries (Figure3.6). However, when compared to the taxrates of East and Southeast Asian economies,Sri Lanka has a much higher rate.21 This hasdirect impacts on export competiveness giventhat exporters have to operate on very tightprofit margins. It also stifles companies fi-nancially, and as discussed earlier, obstructs/discourages firms from exploring new exportmarkets.
21 Total tax rate measures the amount of taxes and mandatory contributions payable by businesses after accounting for allowable deductionsand exemptions, as a share of commercial profit.
Source: CBSL, Annual Report 2012.
130125120115
110105100
952007 2008
Rs./USD REER2009 2010 2011 2012
0
20
40
60
80
100
120Rs
./US$
130
125
120
115
110
105
100
952007 2008
Rs./USD REER
2009 2010 2011 20120
20
40
60
80
100
120Rs
./US$
Global Developments and External Sector Competitiveness
47
Figure 3.5Trends in Nominal and Real Effective Exchange Rate Movements, 2011-2012
As can be noted from Figure 3.5, in nominalterms, the rupee has experienced periods ofappreciation as well as depreciation. How-ever, in real terms, the rupee has been appre-ciating steadily. While the policy adjustmentin February 2012 from a fixed exchange rateregime to a more flexible regime saw a sharpdepreciation of the rupee in nominal terms,the accompanying real exchange rate depre-cation has been rather modest. A persistentlyover-valued exchange rate adversely impactsexport competitiveness as discussed earlier.
Fiscal PolicyAccess to finance is critical to export com-petitiveness. New exporters are confrontedwith significant start-up costs as they gatherinformation on foreign markets, developmarketing channels, adapt products and pack-aging to foreign tastes, and learn to deal withnew bureaucratic procedures. Tax rates havea direct bearing on access to sufficient fi-nance, especially in many late-industrializ-
ing countries such as Sri Lanka, where accessto and the cost of credit is a major constraint,especially for smaller enterprises, where firmshave to rely heavily on internally generatedfunds to finance investments. Taxation im-pacts investment in two ways: firstly, it re-duces the expected after-tax revenue from agiven investment project, and secondly, itreduces the availability of investment finance.
Sri Lanka's total tax rate as a percentage ofcommercial profits is reasonable in compari-son to other South Asian countries (Figure3.6). However, when compared to the taxrates of East and Southeast Asian economies,Sri Lanka has a much higher rate.21 This hasdirect impacts on export competiveness giventhat exporters have to operate on very tightprofit margins. It also stifles companies fi-nancially, and as discussed earlier, obstructs/discourages firms from exploring new exportmarkets.
21 Total tax rate measures the amount of taxes and mandatory contributions payable by businesses after accounting for allowable deductionsand exemptions, as a share of commercial profit.
Source: CBSL, Annual Report 2012.
130125120115
110105100
952007 2008
Rs./USD REER2009 2010 2011 2012
0
20
40
60
80
100
120Rs
./US$

State of the Economy 2013
48
Figure 3.6Total Tax Rate (% of Commercial Profits), 2011-2012
Source: World Bank, World Development Indicators 2013.
3.4.2 Reducing Trade Related CostsIn today's highly competitive globalizedworld, access to efficiently produced criticalbackbone services and inputs are pivotal toensure that domestic firms remain competi-tive. Firms that have to incur more than theircompetitors for energy, telecommunications,customs services, transport and logistics, fi-nance, and security costs will find it hard tocompete in both the domestic and overseasmarkets.
EnergyEnergy costs, electricity in particular, mostoften constitute a major share of direct non-wage costs for firms. Rising electricity pricesand supply reliability pose serious challengesto enterprises, given that it alters productioncost structures, which in turn influence com-petitiveness. The relative importance ofpower costs and reliability will vary acrosssectors; power hungry capital-intensive in-dustries will be far more reliant on powercosts, as opposed light-manufacturing sec-tors and other professional services sectors,which are also reliant on adequate powersupply. Unreliability in terms of power sup-plies may force firms to rely on more costly
energy via generators, thereby increasingcosts. The quality and reliability of electric-ity supplied in Sri Lanka is on or above parwith other late-industrializing countries.However, when considering the electricitytariffs faced by Sri Lankan industrialists, lo-cal firms are at a disadvantage as they haveto pay more for electricity compared to theircompetitors in other countries and as suchlose out on their export competiveness (Fig-ure 3.7).
LabourWages constitute a significant proportion ofproduction costs. Access to cheap and/ormore skilled labour significantly improvescompetitiveness. As can be noted from Table3.4, Sri Lanka competes well in terms ofwages and labour productivity, outperform-ing countries like India, Pakistan, Vietnam,and even Thailand. On the flipside, how-ever, labour regulations currently in place,particularly relating to the redundancy dis-missal may pose challenges to internationalcompetiveness. Under the Termination ofEmployment of Workmen (Special Provisions)Act (TEWA) of 1971, employers require con-sent from the Commissioner of Labour for
2011
2012
0
20
40
60
80
100
120
Bangladesh
CambodiaIndia
Lao People’s
Dem.Rep.Mala
ysia
Myanmar
Pakista
n
Sri La
mka
Thailan
d
Vietnam
Tota
l tax
rate
(% o
f com
mer
cial
pro
fits)
2011
2012
0
20
40
60
80
100
120
Bangladesh
CambodiaIndia
Lao People’s
Dem.Rep.Mala
ysia
Myanmar
Pakista
n
Sri La
nka
Thailan
d
Vietnam
Tota
l tax
rate
(% o
f com
mer
cial
pro
fits)
State of the Economy 2013
48
Figure 3.6Total Tax Rate (% of Commercial Profits), 2011-2012
Source: World Bank, World Development Indicators 2013.
3.4.2 Reducing Trade Related CostsIn today's highly competitive globalizedworld, access to efficiently produced criticalbackbone services and inputs are pivotal toensure that domestic firms remain competi-tive. Firms that have to incur more than theircompetitors for energy, telecommunications,customs services, transport and logistics, fi-nance, and security costs will find it hard tocompete in both the domestic and overseasmarkets.
EnergyEnergy costs, electricity in particular, mostoften constitute a major share of direct non-wage costs for firms. Rising electricity pricesand supply reliability pose serious challengesto enterprises, given that it alters productioncost structures, which in turn influence com-petitiveness. The relative importance ofpower costs and reliability will vary acrosssectors; power hungry capital-intensive in-dustries will be far more reliant on powercosts, as opposed light-manufacturing sec-tors and other professional services sectors,which are also reliant on adequate powersupply. Unreliability in terms of power sup-plies may force firms to rely on more costly
energy via generators, thereby increasingcosts. The quality and reliability of electric-ity supplied in Sri Lanka is on or above parwith other late-industrializing countries.However, when considering the electricitytariffs faced by Sri Lankan industrialists, lo-cal firms are at a disadvantage as they haveto pay more for electricity compared to theircompetitors in other countries and as suchlose out on their export competiveness (Fig-ure 3.7).
LabourWages constitute a significant proportion ofproduction costs. Access to cheap and/ormore skilled labour significantly improvescompetitiveness. As can be noted from Table3.4, Sri Lanka competes well in terms ofwages and labour productivity, outperform-ing countries like India, Pakistan, Vietnam,and even Thailand. On the flipside, how-ever, labour regulations currently in place,particularly relating to the redundancy dis-missal may pose challenges to internationalcompetiveness. Under the Termination ofEmployment of Workmen (Special Provisions)Act (TEWA) of 1971, employers require con-sent from the Commissioner of Labour for
2011
2012
0
20
40
60
80
100
120
Bangladesh
CambodiaIndia
Lao People’s
Dem.Rep.Mala
ysia
Myanmar
Pakista
n
Sri La
mka
Thailan
d
Vietnam
Tota
l tax
rate
(% o
f com
mer
cial
pro
fits)

Global Developments and External Sector Competitiveness
49
the redundancy dismissal of even one worker,with the exemption of dismissal on seriousdisciplinary infraction. In this light, the dis-missal process is viewed as cumbersome andlong-drawn. Further, as can be noted fromTable 3.5, the severance pay for redundancy
Figure 3.7Industrial Electricity Tariffs, 2012
Source: Siyambalapitiya, T., (2013), “Five Year (2013-2017) Road Map for the Revival of the ElectricityIndustry.”
dismissal seems excessive in Sri Lanka. Giventhis type of labour market rigidity, exportersthat operate in a highly competitive globalenvironment lose out on flexibility to restruc-ture their labour force as required, which canseverely constrain their export competiveness.
Table 3.5Selected Labour Market Indicators
Economy Year Annual Wage GDP per Person Third-party Severance(Current US$) Engageda Notificationb Payc
Bangladesh - n.a 4,146 Yes 26.7
Combodia - n.a 5,449 No 11.4
India 2009 2,462 9,200 Yes 11.4
Laos - n.a n.a Yes 40.7
Malaysia 2009 7,662 24,857 No 17.2
Myanmar - n.a 7,670
Pakistan 2006 2,335 8,483 No 22.9
Sri Lanka 2010 1,556 17,985 Yes 54.2Thailand 2006 2,233 16,764 No 31.7
Vietnam 2010 2,010 6,272 No 24.6
Notes: a. At constant 1990 US$ at PPP; b. If one worker is dismissed; c. For redundancy dismissal (inweeks).
Sources: UNIDO (2013), “Competitive Industrial Performance (CIP) Index” database; World Bank, “DoingBusiness” 2007 and 2013; ILO (2013), “Key Indicators of the Labour Market” database.
Bangladesh
Small0
2
4
6
8
10
12
14
16
18
20
MediumUsage class
Large Very Large
MalaysiaPakistanSri LamkaThailandVietnam
Ave
rage
uni
t pri
ce (R
s.)
Bangladesh
Small0
2
4
6
8
10
12
14
16
18
20
MediumUsage class
Large Very Large
Malaysia
Pakistan
Sri LamkaThailandVietnam
Ave
rage
uni
t pric
e (R
s.)
Global Developments and External Sector Competitiveness
49
the redundancy dismissal of even one worker,with the exemption of dismissal on seriousdisciplinary infraction. In this light, the dis-missal process is viewed as cumbersome andlong-drawn. Further, as can be noted fromTable 3.5, the severance pay for redundancy
Figure 3.7Industrial Electricity Tariffs, 2012
Source: Siyambalapitiya, T., (2013), “Five Year (2013-2017) Road Map for the Revival of the ElectricityIndustry.”
dismissal seems excessive in Sri Lanka. Giventhis type of labour market rigidity, exportersthat operate in a highly competitive globalenvironment lose out on flexibility to restruc-ture their labour force as required, which canseverely constrain their export competiveness.
Table 3.5Selected Labour Market Indicators
Economy Year Annual Wage GDP per Person Third-party Severance(Current US$) Engageda Notificationb Payc
Bangladesh - n.a 4,146 Yes 26.7
Combodia - n.a 5,449 No 11.4
India 2009 2,462 9,200 Yes 11.4
Laos - n.a n.a Yes 40.7
Malaysia 2009 7,662 24,857 No 17.2
Myanmar - n.a 7,670
Pakistan 2006 2,335 8,483 No 22.9
Sri Lanka 2010 1,556 17,985 Yes 54.2Thailand 2006 2,233 16,764 No 31.7
Vietnam 2010 2,010 6,272 No 24.6
Notes: a. At constant 1990 US$ at PPP; b. If one worker is dismissed; c. For redundancy dismissal (inweeks).
Sources: UNIDO (2013), “Competitive Industrial Performance (CIP) Index” database; World Bank, “DoingBusiness” 2007 and 2013; ILO (2013), “Key Indicators of the Labour Market” database.
Bangladesh
Small0
2
4
6
8
10
12
14
16
18
20
MediumUsage class
Large Very Large
MalaysiaPakistanSri LamkaThailandVietnam
Ave
rage
uni
t pri
ce (R
s.)
State of the Economy 2013
48
Figure 3.6Total Tax Rate (% of Commercial Profits), 2011-2012
Source: World Bank, World Development Indicators 2013.
3.4.2 Reducing Trade Related CostsIn today's highly competitive globalizedworld, access to efficiently produced criticalbackbone services and inputs are pivotal toensure that domestic firms remain competi-tive. Firms that have to incur more than theircompetitors for energy, telecommunications,customs services, transport and logistics, fi-nance, and security costs will find it hard tocompete in both the domestic and overseasmarkets.
EnergyEnergy costs, electricity in particular, mostoften constitute a major share of direct non-wage costs for firms. Rising electricity pricesand supply reliability pose serious challengesto enterprises, given that it alters productioncost structures, which in turn influence com-petitiveness. The relative importance ofpower costs and reliability will vary acrosssectors; power hungry capital-intensive in-dustries will be far more reliant on powercosts, as opposed light-manufacturing sec-tors and other professional services sectors,which are also reliant on adequate powersupply. Unreliability in terms of power sup-plies may force firms to rely on more costly
energy via generators, thereby increasingcosts. The quality and reliability of electric-ity supplied in Sri Lanka is on or above parwith other late-industrializing countries.However, when considering the electricitytariffs faced by Sri Lankan industrialists, lo-cal firms are at a disadvantage as they haveto pay more for electricity compared to theircompetitors in other countries and as suchlose out on their export competiveness (Fig-ure 3.7).
LabourWages constitute a significant proportion ofproduction costs. Access to cheap and/ormore skilled labour significantly improvescompetitiveness. As can be noted from Table3.4, Sri Lanka competes well in terms ofwages and labour productivity, outperform-ing countries like India, Pakistan, Vietnam,and even Thailand. On the flipside, how-ever, labour regulations currently in place,particularly relating to the redundancy dis-missal may pose challenges to internationalcompetiveness. Under the Termination ofEmployment of Workmen (Special Provisions)Act (TEWA) of 1971, employers require con-sent from the Commissioner of Labour for
2011
2012
0
20
40
60
80
100
120
Bangladesh
CambodiaIndia
Lao People’s
Dem.Rep.Mala
ysia
Myanmar
Pakista
n
Sri La
mka
Thailan
d
Vietnam
Tota
l tax
rate
(% o
f com
mer
cial
pro
fits)

State of the Economy 2013
50
Trade FacilitationWeak trade facilitation, such as lack of and/or poorly maintained transport infrastructure,complex import and export procedures etc.,results in increased transaction costs whichin turn adversely impacts competitiveness.The 'Trading across Borders' indicator of theWorld Bank's 'Doing Business' report mea-sures the time and cost (excluding tariffs)
associated with exporting and importing astandardized cargo of goods by ocean trans-port. Table 3.6 presents this indicator for 2007and 2013. As can be seen, Sri Lanka per-forms relatively well in all three sub indica-tors with respect to other South Asian coun-tries. However, it still lags behind SoutheastAsian countries. In the case of many South-east Asian economies, what stands out is the
Box 3.3Labour and Utility Costs as Impediments to Export Growth: Case of the
Apparel IndustryThe ability of Sri Lanka's apparel industry to successfully face global competition has been furtherdimmed by rising utility and labour costs. In particular, it has been stated that the recent hike inelectricity tariffs will result in a 15 per cent tariff increase for apparel factories, with a significant costincrease for textile manufacturers' washing and dyeing plants.22 This is a severe blow to firmsalready struggling to compete with competitors who have duty free access to the EU market.
The electricity tariff hike would translate into demands for price increases by all stakeholders in thesupply chain. As it stands, the industry is not able to absorb any additional cost given the risinglabour costs and lack of preferential treatment for its exports in major markets. There is evidence tosuggest that apparel factory owners are considering relocating to other countries with more lucra-tive prospects such as Bangladesh, Myanmar and Vietnam __ a trend that has already been ob-served after the removal of GSP+ concessions.23
On the other hand, employees are also heavily burdened by the increase in electricity rates, and asa result demand higher salaries. There is also the fear of employees leaving the industry in searchof alternative job opportunities given the spiraling cost of living __ which is a problem for anindustry that has over 30,000 vacancies.24 This situation has prompted the Apparel Exporters'Association to consider importing workers from Bangladesh, India and Bhutan to fill vacancies atlower costs.25 However, there are also fears that foreign workers may be exploited in terms of bothheavy work and lower salaries, thereby affecting Sri Lanka's reputation of good working conditionsunder initiatives such as "garments without guilt." A failure to maintain labour and other standardscould also pose a threat to Sri Lanka's eligibility for standard GSP concessions in the EU __ aconcession the country cannot afford to lose at this point in time.
Sri Lanka's apparel industry, which successfully competed in a post-MFA environment by buildingan international reputation for quality and reliability, is now faced with the pressing need todevelop a new strategy to remain globally competitive. A possible strategy is to conduct manufac-turing activities in lower cost countries, add value and export the final product from Sri Lanka.However, the viability of such a supply chain management strategy would depend on ensuring theavailability of a proper regulatory framework that facilitates trade, transshipment, logistics, andinnovative manufacturing methods.
22 Warushamana, G., (2013), "Apparel Industry will Overcome Challenges - Secretary General, JAAF," Sunday Observer, TR5 May 2013,Available at http://www.sundayobserver.lk/2013/05/05/fin26.asp.
23 Interviews conducted among garment manufacturers, representatives from industry associations, and government officials between July- September 2012.
24 Warushamana, G., (2013), "Apparel Industry will Overcome Challenges - Secretary General, JAAF," Sunday Observer, 5 May 2013,Available at http://www.sundayobserver.lk/2013/05/05/fin26.asp.
25 Ibid.

Global Developments and External Sector Competitiveness
51
significant reduction in the number of docu-ments and the time required for exportingand importing over the two years under con-sideration. For instance, Laos has succeededin cutting down the number of days requiredfor the export/import procedure by more thanhalf, from 144 in 2007 to 52 in 2013. Cam-bodia, Vietnam, and Malaysia have alsoshown remarkable progress in this regard. Onthe other hand, the progress made by SouthAsian countries, including Sri Lanka, is notas impressive. This indicates the need for SriLanka to undertake more aggressive policymeasures at a pace comparable to its South-east Asian competitors.
3.4.3 Managing Market and Govern-ment FailuresMarket and government failures tend to af-flict countries in the process of expandingexports and growth. The presence of marketfailures such as information asymmetry tendsto constrain competitiveness, thus requiringspecific interventions and institutions alongthe lines of export and investment promo-tion agencies, standards bodies, agencies to
Table 3.6Trading Across Borders, 2007 and 2013
Country Document’s for Exports Time to Export and Import Cost to Export and and Imports (No.) (Days) Import
(US$ per container)2007 2013 2007 2013 2007 2013
Bangladesh 23 14 92 59 2189 2455India 25 20 68 36 2108 2320Pakistan 20 16 43 39 2002 1365Sri Lanka 21 12 52 39 1586 1495Malaysia 18 11 42 19 909 855Thailand 21 10 46 27 1890 1335Vietnam 15 14 71 42 1588 1210Cambodia 20 19 81 48 1552 1655Lao PDR 28 20 144 52 3110 4265
Source: World Bank, ‘Doing Business’ 2007 and 2013.
support innovation and clustering, etc. Thepresence of government failures in many de-veloping countries is a key challenge in de-veloping the necessary institutions, and hin-ders the capacity for effective policy formu-lation.
Export PromotionExport promotion is a critical dimension ofan export competitiveness strategy in a coun-try, and the importance of a relevant exportpromotion policy cannot be overstated. Whilepromotion of traditional exports is neededfor export growth, promotion of new exportproducts is essential for export development.In many countries, the government is theprincipal provider of export assistance to thebusiness community. In Sri Lanka, the Ex-port Development Board (EDB) functions asthe apex organization for export promotionand development.
A main criticism of government promotionschemes in many developing countries is thatthey tend to be poorly targeted.26 Most ex-port promotion schemes appear to be more
26 Gray, B.J., (1997 ), ‘ Profiling Managers to Improve Export Promotion Targeting’, Journal of International Business Studies, Vol. 28, No.2, pp. 387-420.

State of the Economy 2013
52
concerned with identifying and assisting par-ticular types of companies, rather than par-ticular types of managers who make exportmarket development decisions. This, how-ever, may not be a major issue for Sri Lanka,given that the manager and exporter is thesame person in most Sri Lankan companies.Another issue, also relevant to Sri Lanka, isthe need to identify companies at differentstages of internationalization __ pre-export-ing, market entry, and export operationsstages __ rather than extending similar typesof assistance to all firms. The types of ser-vices required, such as matching informa-tion, research, promotion, buyer introduc-tion, and export finance or insurance serviceswould differ depending on the stage of inter-nationalization of a particular company. Ob-taining a better understanding of the needsof managers and targeting segments of man-agers who share similar strengths and weak-nesses is a possible solution.
A well developed and targeted export pro-motion strategy is also crucial in facilitatingthe process of market and product diversifi-cation, which involves taking advantage ofdifferent growth rates in different markets andproducts, and gaining stability by not beingoverly dependent on any particular marketor product. Penetrating new markets wouldrequire adapting to new demand structuresand cultural sensitivities, and the ability tosurvive in a less familiar environment in spiteof higher transaction costs. Remaining com-petitive in such an environment thus requiresa strong facilitating and supportive environ-ment. Sri Lanka's failed attempts at bothmarket and product diversification over theyears stresses the need for a more active ex-port promotion agenda.
As is the case with regard to many initia-tives, the lack of coordination between gov-ernment and private sector organizations, aswell as among different levels of government,is a key weakness of Sri Lanka's current ap-
proach towards an export promotion strat-egy. Sri Lanka in fact currently lacks a con-crete policy framework to boost exportgrowth and development. There is thus a needfor the government (through the EDB) andprivate sector to collaborate in formulating anational export promotion strategy to helpfirms overcome barriers to exporting, andinvolve more businesses in exporting. Sucha strategy should take into account a com-prehensive set of consistent policies and or-ganizations that are responsive to marketconditions, needs of business enterprises, andopportunities offered by new products andtechnologies.
Governance QualityIn economic literature, the quality of insti-tutions and policies is decisive in determin-ing whether countries can benefit from glo-balization. Whilst the institutional environ-ment encompasses macroeconomic stabilityand openness to trade, they also encroachupon the enabling environment for marketsto function efficiently, and cover areas suchas the strength and quality of legal and judi-ciary systems, the financial system, taxationprocedures, labour relations, investment pro-cedures, land tenure, and customs adminis-tration.
Sri Lanka's standing in key governance indi-cators have been improving since the end ofthe hostilities in 2009. As can be observedfrom Table 3.7, while Sri Lanka performs rea-sonably across governance indicators such asrule of law, quality of regulation and gov-ernment effectiveness, it scores poorly in in-dicators with regards to corruption, voiceand accountability, and political stability andabsence of violence, in comparison to othercompetitor countries. Weak governance interms of poor property rights and their en-forcement, red tape, and corruption, etc.,adds to production costs, which in turn ad-versely impacts competitiveness.

Global Developments and External Sector Competitiveness
53
Table 3.7World Governance Indicators, 2011
Country Political Stability Voice & Government Regulatory Rule Control of and Absence Accoun- Effectiveness Quality of Corruption of Violence tability Law
Bangladesh 7.1 37.1 19.9 22.3 28.6 16.1
Cambodia 33 24.9 25.6 35.1 15.5 12.8
India 12.7 59.2 54.5 40.3 52.6 35.1
Lao PDR 47.2 5.6 17.1 19.4 18.3 13.7
Malaysia 52.4 33.8 81 74.4 66.2 57.8
Myanmar 13.7 2.3 2.4 1.4 4.2 0.5
Pakistan 0.5 26.3 22.3 29.9 20.7 15.6
Sri Lanka 28.3 31 52.6 50.7 53.1 40.8
Thailand 16.5 33.3 59.7 56.4 48.8 43.6
Vietnam 52.8 8.5 45 29.4 39.9 33.6
Source: World Bank, World Governance Indicators, 2011.
3.5 ConclusionSri Lanka's poor external sector performancein recent years does not bode well for a smalleconomy aspiring to raise its per capita in-come, and sustain a high growth momen-tum. While the slowdown in world tradegrowth has had an inevitable impact on SriLanka's export performance, the sizeable de-cline of absolute export earnings in 2012 andin the first half of 2013 suggest that there areseveral domestic issues impeding exportgrowth that require urgent attention.
An analysis of Sri Lanka's export competi-tiveness reveals that the country lags signifi-cantly behind neighbouring countries in theAsian region in terms of many competitive-ness indicators. The incentive framework inplace to promote export and investmentgrowth is far from satisfactory. Sri Lanka'strade policy, which has been showing trendsof increased protectionism over this decade__ particularly in the form of proliferatingpara-tarrifs __ is a significant concern. Thecountry's limited involvement in regionaland bilateral FTAs, especially in comparisonwith other Asian countries, has also restrictedexport competitiveness and market penetra-
tion. Moreover, the highly overvalued cur-rency continues to adversely impact the com-petitiveness of Sri Lankan exports in the worldmarket.
While Sri Lanka has made some progress inreducing transport and logistics costs overthe years, there is scope for further improve-ment in comparison to many Southeast Asianeconomies. Additionally, high electricitycosts and stringent labour regulations posesignificant barriers on firms' ability to com-pete in the global market. Dealing with mar-ket and government failures is another es-sential area requiring priority attention. Over-coming problems such as information asym-metry, call for specific interventions and in-stitutions. The role of a well-developed andtargeted export promotion strategy is vital inthis regard. Mitigating government failuresis also vital if firms are to minimize produc-tion-related costs, and compete effectivelyin an international environment. In address-ing numerous challenges in raising its exter-nal sector competitiveness, it is importantfor Sri Lanka to draw lessons from its com-petitor countries.