sri lanka the competitiveness program (tcp)
TRANSCRIPT

Sri Lanka The Competitiveness Program (TCP) Final Report
January 2008
This publication was produced by Nathan Associates Inc. for review by the United States Agency for International Development.

Sri Lanka The Competitiveness Program (TCP) Final Report
Task Order 841 Under Contract No. PCE-I-00-98-00016-00, SEGIR GBTI I July 2004 to November 2007
DISCLAIMER
This document is made possible by the support of the American people through the United States Agency for
International Development (USAID). Its contents are the sole responsibility of the author or authors and do not
necessarily reflect the views of USAID or the United States government.

Contents 1. Introduction 1
Purpose and Approach 1 Results 2 Lessons 3 Report Organization 3
2. Program Review 5
Design and Objectives 5 Funding and Modifications 6 Staffing and Level of Effort 6 Management 7 Achievements 7
3. Ceramics Cluster 15
Industry Competitiveness 16 TCP Achievements 18 Cluster Acheivements 20 Rural Impact 21 Industry Leaders’ Opinions about TCP 21
4. Coir Cluster 23
Industry Competitiveness 23 TCP Achievements 26 Cluster Achievements 28 Rural Impact 29 Industry Leaders’ Opinions about TCP 29
5. Gems & Jewelry Cluster 31
Industry Competitiveness 31 TCP Achievements 34 Cluster Achievements 34 Small Grants 35 Rural Impact 35 Industry Leaders’ Opinions about TCP 36
I I
6. Information & Communication Technology Cluster 37
Industry Competitiveness 37 TCP and Industry Achievements 39 Industry Leaders’ Opinions About TCP 43
7. Rubber Cluster 45
Industry Competitiveness 45 TCP Achievements 48 Rural Impact 50 Small Grants 50 Industry Leaders’ Opinions about TCP 51
8. Spice Cluster 53
Industry Competitiveness 53 TCP Achievements 55 Cluster Achievements 57 Rural Impact 57 Industry Leaders’ Opinions about TCP 58
9. Tea Cluster 59
TCP Achievements 62 Cluster Achievements 63 Rural Impact 64 Small Grants 64 Industry Leaders’ Opinions about TCP 65
10. Tourism Cluster 67
Industry Competitiveness 67 TCP Achievements 69 Cluster Achievements 71 Rural Impact 72 Campaign to Revitalize Tourism 72 Industry Leaders’ Opinions about TCP 74
11. Cross-cutting Activities 75
Customs Regulation Database 75 Logistics Performance 78 Small Grant Program 80
12. Other Activities 87
Workforce Development 87 Global Competitiveness Report 88 Firm Competitiveness Studies 89
I I I
WWW.Competitiveness.LK 91 Monitoring and Reporting 92
13. Lessons Learned and Implications for Other Projects 99
Lessons Learned 99 Implications for Other Projects 101 What Clusters Have Learned 106
Appendixes A. Selected TCP Achievements, 2004-2007 B. TCP Work Plan and Deliverables C. Short-term Technical Assistance Level of Effort D. Technical Assistance Purchase Orders E. Technical Reports F. Cluster Association Development Index G. Executive Opinion Survey of TCP-assisted Clusters, 2007 H. Exports from Sectors with TCP Clusters
Illustrations
Figures Figure 2-1. Exports Earnings of Eight Sectors with TCP Clusters, 1995-2006 9 Figure 2-2. Five Years of Export Earnings Before and After TCP 9 Figure 2-3. Value Added and Non-Value Added Exports for Eight Sectors 10 Figure 3-1. Annual Rate of Growth in Ceramic Exports, 1995-2006 17 Figure 3-2. Composition of Ceramics Exports, 2006 17 Figure 3-3. CENTEC Opening 19 Figure 3-4. Annual Rate of Growth in Coir Exports, 1995–2006 25 Figure 4-1. Composition of Coir Exports, 2006 25 Figure 4-2. Geotextile Loom 28 Figure 5-1. Annual Rate of Growth in Gem and Jewelry Exports, 1995–2006 33 Figure 5-2. Composition of Gem and Jewelry Exports, 2006 33 Figure 5-3. Gem and Jewelry Training 36 Figure 6-1. Estimated Growth of Software Exports 39 Figure 6-2. Overall IT Workforce Growth Trend 39 Figure 6-3. Launch of the National IT Workforce Survey 41 Figure 7-1. Annual Rate of Growth in Rubber Exports 47 Figure 7-2. Composition of Rubber Exports, 2006 48 Figure 7-3. Wellassa Seedlings 49 Figure 8-1. Annual Rate of Growth in Spice Exports 55 Figure 8-2. Composition of Spice Exports, 2006 55 Figure 8-3. Spice Drying Machine 57 Figure 9-1. Annual Rate of Growth in Tea Exports 61

I V
Figure 9-2. Composition of Tea Exports, 2006 61 Figure 9-3. Vacuum Packed Tea 65 Figure 10-1. Annual Rate of Growth in Tourism Earnings 69 Figure 10-2. Top Ten Markets for Tourism, 2006 69 Figure 10-3. Rainforest Ecolodge Brochure 71 Figure 10-4. Smibt Elephant Poster 73 Figure 11-1. CRD Webpage 77 Figure 12-1. Hemas and CBL Case Studies 90 Figure 12-1. Emerging Markets Table 93
Tables Table 2-1. Strategic Initiatives/Investments Specific to a Geographical Location 11 Table 3-1. Executive Opinion Survey, Ceramics Cluster 21 Table 4-1. Executive Opinion Survey, Coir Cluster 30 Table 5-1. Executive Opinion Survey, Gem & Jewelry Cluster 36 Table 6-1. Executive Opinion Survey, ICT Cluster 43 Table 7-1. Executive Opinion Survey, Rubber Cluster 51 Table 8-1. Executive Opinion Survey, Spice Cluster 58 Table 9-1. Executive Opinion Survey, Tea Cluster 65 Table 10-1. Executive Opinion Survey, Tourism Cluster 74 Table 11-1. TCP Small Grants Program 82 Table 12-1. Sri Lanka’s Competitiveness Rankings, 2001–2007 89 Table 12-2. Measurements of Capacity and Indicators 95
Exhibits Exhibit 2-1. Changes in Private Sector and Public Sector Attitudes 12 Exhibit 3-1. Ceramic Sector Snapshot 16 Exhibit 4-1. Coir Sector Snapshot 24 Exhibit 5-1. Gem & Jewelry Sector Snapshot 32 Exhibit 6-1. ICT Sector Snapshot 38 Exhibit 7-1. Rubber Sector Snapshot 46 Exhibit 8-1. Spice Cluster Snapshot 54 Exhibit 9-1. Tea Sector Snapshot 60 Exhibit 10-1. Tourism Sector Snapshot 68
1. Introduction This is the final report on activities under contract PCE-I-00-98-00016-00, SEGIR General Business, Trade and Investment IQC, Task Order 841 for The Competitiveness Program, carried out in Sri Lanka from July 2004 to November 2007. The program was implemented by the Nathan–MSI consortium with Nathan Associates Inc. as the prime contractor and J.E. Austin Associates as the subcontractor.
PURPOSE AND APPROACH The purpose of TCP was to improve the competitiveness of Sri Lanka in the global marketplace by continuing the support provided under the predecessor task order, The Competitiveness Initiative (TCI) (2000-2003). TCP was USAID’s primary private sector development activity in Sri Lanka. It continued working with the eight industry “clusters” that it had formed under TCI: ceramics, coir, gems and jewelry, ICT spices, rubber, tea, and tourism. In 2006, these industries employed an estimated 2.2 million persons or 31 percent of the workforce, and accounted for 58 percent of non-apparel exports, or one-third of all of Sri Lanka’s exports, valued at US$2.3 billion or 21.4 percent of GDP.
The clusters were composed of representatives from across the value chain—from raw material producers to manufactures to traders and even retailers—as well as representatives from government, such as regulators, and from supporting industries such as packaging, shipping, financial services, and information technology. So constituted, clusters served as a proxies for entire value chains in Sri Lanka. Working together, cluster members reached a better understanding of and appreciation for their strategic position in global value chains and jointly pursued policy reforms to advance those positions. They learned about the full scope and opportunities for value addition and their industry’s ability to add value. This enabled them to devise consensus-based strategies and action plans for becoming more competitive.
Using the strategies as a framework, TCP worked with each cluster to devise initiatives and then mobilize expertise and other resources to execute them. From 2004 to 2007, each cluster implemented a half dozen or more such initiatives. TCP provided guidance through resident advisers and short-term technical specialists, helped fund and arrange workshops and conferences, and administered a small grants program. These complementary measures enabled the clusters to act as catalysts for improving their industries. Clusters raised awareness about the opportunities as well as the challenges of globalization and improved the ability of each industry to mobilize resources to face challenges, research options, and take effective action.
2 T C P F I N A L R E P O R T
TCP also worked on trade facilitation and logistics. Its “FastPath” study evaluated the shipping and logistics sectors, and its technical assistance with the Department of Customs put tariff and customs information onto the department’s website in a searchable format, along with other information for importers and exporters. TCP also worked to raise awareness of competitiveness and extend the impact of competitiveness activities to rural areas.
RESULTS TCP helped the clusters coalesce around strategies and initiatives to improve competitiveness and achieve impressive results. Clusters completed 20 initiatives, improved public–private dialogue and regulatory decisions, influenced the content and passage of a new tourism law, and generated eight public-private and joint venture investments in all areas—from market research to energy conservation to workforce development. Numerous individual firms also made strategic investments to improve their own competitiveness.
The best broad measure of competitiveness was improved export performance in industries that worked with TCP. The clusters increased their exports by US$885 millions or 62 percent from 2001 to 2006. That growth was US$576 million or 35 percentage points better than the five years before TCP (1995–2000) when exports increased by only US$309 million or 20 percent. Export growth during TCP more than doubled not only because of favorable economic circumstances, but also because the clusters followed sound strategies to overcome unfavorable events and shocks. Executives in all clusters report that their firms and industries are better positioned to compete in global markets thanks to having been a part of TCP. In fact, those surveyed in 2007 attributed 17 percent of recent improved export performance to participation in TCP and cluster activities.
The faster pace of export growth amounted to an additional US$500 million in export earnings for Sri Lanka, and the 17 percent attribution suggests that TCP was worth US$85 million of those earnings for 2001 to 2006. Three things can be said about the attribution percentage. First, the estimate is conservative because benefits stemming from TCP’s work will continue well after the end of the project in 2007, and range well beyond the domain of export performance. Second, the improved export performance compares very favorably with the total cost of US$25.1 million (including US$12.5 million for TCP) that USAID invested in three competitiveness task orders from 2001 through 2007. Third, while export numbers are factual and attribution of causality is subjective, it is grounded in the opinion of the businessmen who worked most directly with the project. In their opinion, TCP’s impact on competitiveness in Sri Lanka will continue into the future. As project managers, we believe that this indicates that other unquantifiable benefits will also continue and eventually prove to be more important to Sri Lanka’s long-term development than last five years of export results.
Complementary successes included improved dialogue between the private and public sector on the competitiveness of exports. During TCP, all clusters engaged in policy dialogue and advocacy with ministries and government offices important to their sectors. The ICT and tourism clusters succeeded in getting major new legislation passed for their sectors. The coir, rubber, ceramics, and gems and jewelry clusters improved the regulatory environment so businesses can operate and export more competitively.

I N T R O D U C T I O N 3
LESSONS We can draw some lessons from TCP’s approach to providing this particular type of technical assistance. First, private sector commitment is indispensable. Each industry that joined TCP was formally enlisted and committed to work toward consensus on strategic priorities and initiatives. This means that each company or association was a stakeholder and partner in designing and implementing technical assistance assignments. Each cluster member made commitments to their colleagues and to TCP well before any short-term specialists arrived in Sri Lanka. They understood their role in technology and information transfer, and worked with dedication and intelligence to make the best use of foreign and local advisers.
Second, consensual decisions and cost-sharing requirements revealed and confirmed priorities. Because most clusters consisted of private firms, decisions about time and resources were made quickly and simply. Cost-sharing for events assured both the industry and TCP that events dealt with an industry’s true priorities.
Third, highly targeted, high quality assistance built credibility and cooperation. Nathan Associates and J.E. Austin Associates were able to provide the diverse expertise requested by clusters, from specialists in marketing gems at U.S. gem and jewelry trade fairs, to agro-engineers with experience improving survival rates in rubber seedling nurseries, to technical experts in gamma irradiation to sterilize food products and surgical examination gloves of natural rubber. Finding and fielding such experts was not easy, and TCP’s private sector partners cooperated with and made the best use of experts.
Lastly, TCP’s advisers and cluster coordinators acting as neutral parties and facilitators proved vital to the efficient and timely implementation of activities. Many cluster participants had been working with each other for generations and the presence of a neutral party broke negative patterns of the past and imparted a new sense of enthusiasm and dynamism.
REPORT ORGANIZATION This report provides details on TCP’s objectives, activities, and accomplishments and draws lessons from program activities that will help cluster partners, Sri Lanka, and the broader development community advance private sector led development. Chapter 2 describes TCP’s design, purpose, funding and modifications, general quantitative and qualitative achievements, and effect on sector-level economic performance. Chapters 3 through 10 provide details on work in the eight clusters. Chapters 11 and 12 describe cross-cutting and complementary activities, including workforce development, trade facilitation, logistics, customs, and English language training. (TCP’s post-tsunami support to revive tourism is discussed in the chapter on the tourism cluster.) Each of these chapters provides a comprehensive review of major activities, including workshops, reports, and other deliverables, and the results of those activities. The final chapter presents lessons learned, the impact and influence of TCP methods on other projects, the aspects of TCP that can and have been replicated elsewhere, and setbacks—many of them outside the scope of TCP’s influence—that affected program success. The appendixes summarize program achievements, deliverables status, short-term level of effort, purchase order data, and sector export data, and list major reports, criteria for the Cluster Association Development Index, and excerpts from the 2007 executive opinion survey.

2. Program Review DESIGN AND OBJECTIVES The Competitiveness Program (TCP) was funded through a contract from USAID/Sri Lanka as part of the Mission’s country strategic plan for FY 2003–FY2007, Supporting Peace and Reform in Sri Lanka (September 30, 2003). Strategic Objective 4 (later SO 8) of that plan is “foundation set for rapid and sustainable economic growth.” USAID/Sri Lanka identified three intermediate results for that objective: sound economic policy implemented, more competitive products sold in the global market, and improved and more relevant skills for the private sector workforce. TCP was designed to promote and apply the principles of private sector led development to achieve the first two results directly and the third result indirectly. Indicators for the results were as follows:
• Growth in value of exports. • Number of companies investing in competitiveness-enhancing activities. • Amount invested by companies and public sector in competitiveness. • Policy changes supporting or enhancing competitiveness. • Capacity of clusters as member service organizations.
TCP also contributed to the IR 8.3 “Improved workforce skills” through training and other activities implemented by member clusters.
In July 2004 USAID/Sri Lanka entered into a two-year contract with Nathan Associates to provide senior resident advisers and an office to manage short-term technical assistance to be defined and implemented mainly with and by partners in the eight industry clusters that were formed as part of the predecessor project, The Competitiveness Initiative (TCI). The clusters had reached consensus on competitiveness strategies and were implementing a few strategic initiatives. Under TCI, several clusters were already or were in the process of incorporation under Sri Lanka’s Companies Act. TCP would also provide those and other interested clusters with technical assistance to form durable member service associations and become industry “apex” bodies, if desired.
Including modifications, TCP had eight components:
• Cluster strengthening • Administrative and contract management support • Economic growth policy reform • Trade facilitation and logistics practices evaluation • Rural economy linkages
6 T C P F I N A L R E P O R T
• Job skills enhancement and competitiveness awareness • Small grants • Tourism recovery communications support (post-tsunami).
FUNDING AND MODIFICATIONS The initial award for Task Order 841 was made on July 2004 in the amount of US$8,406,361 for a 24-month program. Modification 01 of October 2004 clarified the scope of work, added a small grant component, and increased the ceiling price to US$9,063,701. Modifications 02 and 03 in April and May 2005 added a component and US$3.43 million to support a media campaign in Europe and India and other efforts to help Sri Lanka recover from the drop in tourist arrivals that followed the tsunami of December 2004. The campaign was designed to convey that Sri Lanka was a safe and healthy destination, offering an alternative to the negative images portrayed in the media of the tsunami and conflict. The revised ceiling price was US$12,493,701.
Modification 04 of August 2006 extended the project to September 30, 2007, revised the SOW to include additional technical assistance to clusters and restructured trade capacity building activities to focus on trade facilitation and logistics analysis through two programs. The first was to help the Sri Lanka Customs Authority post tariff and regulatory procedures on its website in a searchable form. The second was to work with shippers, freight forwarders, importers, exporters, and the public sector to review the performance of Colombo and Sri Lanka as a logistics hub and identify how it could improve and maintain its status as a regional hub. Modification 05 of June 2007 and 06 of November 2007 extended the project completion date, allowing for additional time to draft the final report, and arrange for storage of equipment and other assets to be used on contracts to be awarded in 2008.
STAFFING AND LEVEL OF EFFORT The project began in July 2004, a seamless a continuation of TCI, which had run from September 2000 to June 2004. Offices were located in The World Trade Center, East Tower, Level 13, Echelon Square, Colombo 1. More office space was leased in May 2005 to accommodate the tourism recovery communications support component (TPC-2).
Key personnel consisted of the Chief of Party, John Varley, and Deputy Chief of Party, David Dyer, who was replaced by Pradeep Liyanamana after Mr. Dyer left to head the post-tsunami REVIVE project in February 2005. Eight Sri Lankan professionals served as program specialists for the clusters and assisted with other activities:
• Ms Zahra Cader, Coir • Ms. Sharmilla Aboosally, Gems and Jewelry • Mr. Lakna Paranwithana, Rubber • Mr. Alex Ponweera, Spices • Ms. Dilhara Goonewardena, Tea • Mr. Tuan Jamaldeen, ICT • Ms. Pri Ratnayake, Tourism • Mr. Preminda Fernando, Ceramics and Tourism
P R O G R A M R E V I E W 7
The specialists served as cluster coordinators under TCI and many continued to refer to them as such. Early on, clusters graduated from the TCI coordinator-assisted phase of assistance to assume responsibility for all their own administrative and association functions, freeing TCP’s program specialists to concentrate on technical assistance and other work. Three other expatriate advisers worked with the program specialists—Mr. Dyer, James Mudge, and Jagdesh Mirchandani. TCP also had nine support staff, including four drivers.
From July 2004 to October 31, 2007, TCP provided 13,730 person days of professional services. These included 2,775 work days from the four expatriate resident advisers: Mr. Varley (717 days), Mr. Liyanamana (754 days), Dr. Mudge (627 days), and Mr. Mirchandani (677 days) and 5,580 person days from the program specialists. This core group provided technical and management services including management of 5,375 person days of short-term technical assistance: 2,536 person-days from 58 expatriate specialists and 2,839 person-days from 41 local specialists. More than 100 persons worked directly for TCP as individual consultants. Many other Sri Lankans worked with TCP as part of groups contracted under purchase orders for services. The contributions of TCP’s local partners—private sector and government leaders and staff—were neither compensated for nor charged to the project budget, but TCP managers estimate that the contribution exceeded 10,000 person-days over the 40-month life of TCP.
MANAGEMENT Mr. Varley, who had been living in Colombo since May 2002 under TCI, managed TCP. Activities followed the program in the Task Order SOW as amended and specific activities were presented for approval to the CTO. Three staff in Nathan Associates’ home office supported the project at different times: Matt Lutkenhouse, Khalida Fazli, and Alex Bittner. The lead subcontractor, J.E. Austin Associates assisted with all aspects of program implementation, especially in identifying and recruiting specialists for clusters and on procedures for monitoring and evaluating impact. Mr. Liyanamana, Deputy COP, was Austin’s on-site staff and Austin’s home office also provided support, most recently through Jessica Reynolds. TCP also benefited from the technical insight and advice of Kevin Murphy, Austin’s President and designer of TCI.
During TCP, each industry cluster considered 10-15 strategic initiatives and each implemented 5-8. Not all were successful. Those that were tended to have significant results. The initiatives were typically identified by the industry itself in the form of a problem to be addressed. TCP advisers screened, critiqued, and refined identified problems and sometimes suggested or inspired the strategic initiatives. TCP assistance included other components such as policy reform, private-public dialogue, and workforce development, but its distinguishing feature was the focus on working with and through clusters in contrast to a focus on government agencies, firms (e.g. business development services), or sectors (e.g. agro-exports or SME finance).
ACHIEVEMENTS The purpose of TCP was to improve the competitiveness of Sri Lankan products and business practices in the global marketplace. As measured by changes in attitudes and improved export performance by firms and value chains as well as reforms in policy and procedures, TCP was

8 T C P F I N A L R E P O R T
successful. The sections below discuss project achievements, first those that can be relatively easily quantified, and then those that are less or non-quantifiable in the short-run.
Quantitative—Export Growth, Value Added, Cluster Incorporation The most significant and readily quantifiable achievements of the TCP were improved export performance, institutional developments by the eight clusters, and investment activity in the eight clusters.
Export Performance As a group, the eight industry sectors with clusters participating in TCI and TCP significantly improved their export performance from 2000 to 2006—the last full year for which data are available. The best results measure, and the one used in TCP’s performance monitoring plan, was exports by sector using published statistics from the Central Bank of Sri Lanka (CBSL). (Those statistics are usually taken from Inland Revenue data based on export volumes and “cess” collections or industry reports).
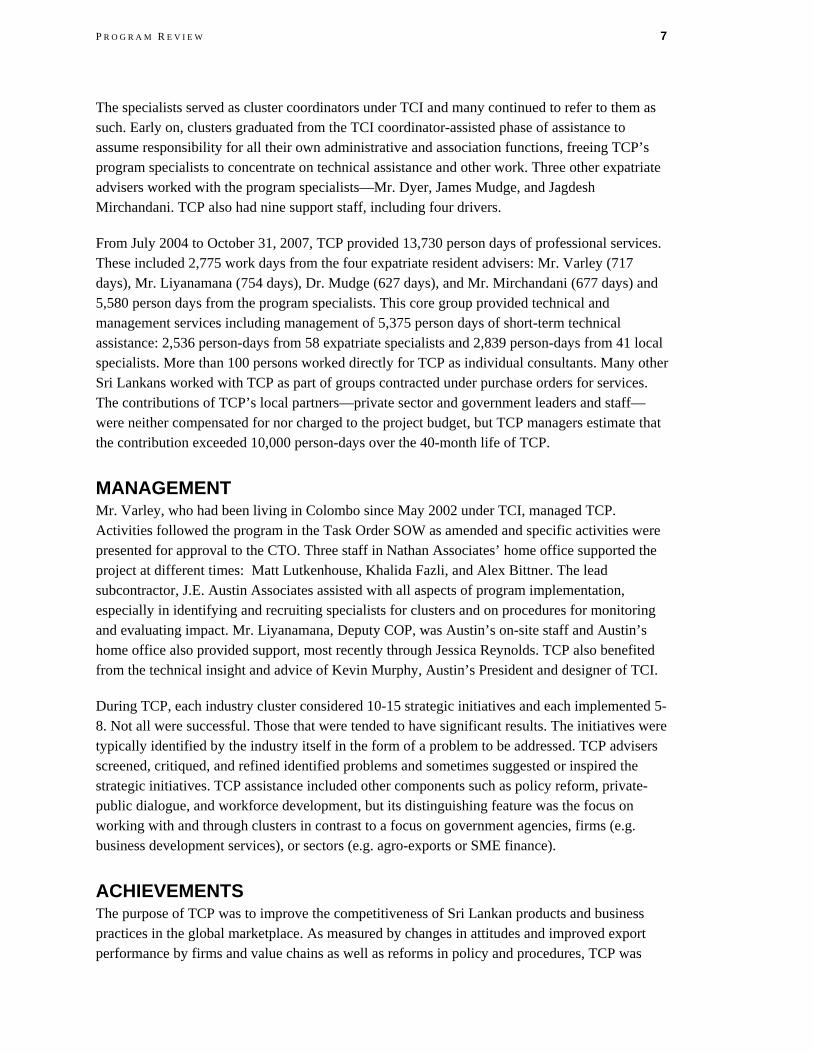
Prior to TCP, in the period from 1995 to 2000, exports from the eight industries increased at an average annual rate of 3.5 percent, from $1.16 billion in 1995 to US$1.46 billion in 2000. As TCP started in 2001, exports first declined to US$1.42 billion, but then rose from 2001 to 2006 at an average annual rate of 10.2 percent, nearly triple the previous pace. By 2006, exports had risen to US$2.3 billion. During the five years after the start of TCP, export earnings from the eight industries increased by US$885 million, roughly triple the US$309 million increase in earnings achieved by all eight sectors from 1995 to 2000. In short, the same industries generated US$550 million more in export earnings for Sri Lanka in 2006 than would have been predicted on the basis of the anemic growth trend of the period before TCP (see Figures 2-1 and 2-2).
A number of demand factors energized this rise in exports, including the growth of the Chinese and Indian economies, the Indo-Lanka free trade agreement, the 2002 cease-fire agreement in Sri Lanka, and generally good weather. But it was still the firms and value-chains in Sri Lanka that responded successfully to those factors against global competition while contending with such adversities as the tsunami of 2004 and nearly continual political instability from 2001 to 2007. TCP’s impact on sector-wide export performance was catalytic; global market conditions and private sector firms and value chains produced the “improved performance” result.
Attribution is an inexact science, even when aided by sophisticated economic modeling. TCP’s attribution methodology was direct and simple. In surveys carried out in 2006 and 2007, we asked Sri Lankan executives who understood the export markets and had worked with TCP to place a percentage value (including zero) on improved export performance they attribute to having worked with TCP and the clusters. The average attribution was 17 percent, ranging from 5.6 percent for tea to a 28.1 percent for rubber. TCP’s professionals had expected a response ranging from 1 to 7 percent. Setting quantitative accuracy aside for a moment makes it easier to appreciate two qualitative results for which the attribution percentages serve as a rough quantitative indicator. First, the attribution figures indicate that CEOs and senior managers who worked with TCP grasped that their export performance could be vastly improved even in competition with economies such as China and Vietnam and the developed world. Second, the
P R O G R A M R E V I E W 9
high percentages confirm their perception that the program was useful and beneficial. In their opinion, it helped them to think strategically and compete more successfully as exporters.
Figure 2-1 Exports Earnings of Eight Sectors with TCP Clusters, 1995-2006
$500
$1,000
$1,500
$2,000
$2,500
1995
1996
1997
1998
1999
2000
2001
2002
2003
2004
2005
2006
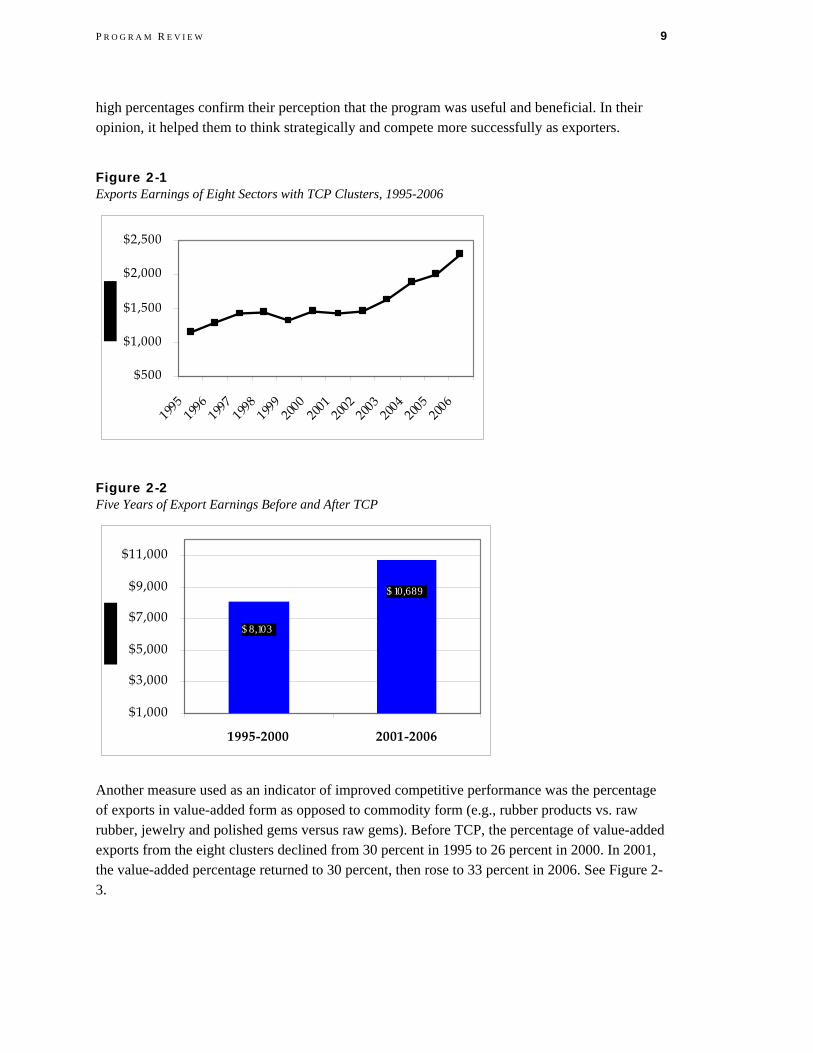
Figure 2-2 Five Years of Export Earnings Before and After TCP
$ 10,689
$ 8,103
$1,000
$3,000
$5,000
$7,000
$9,000
$11,000
1995-2000 2001-2006
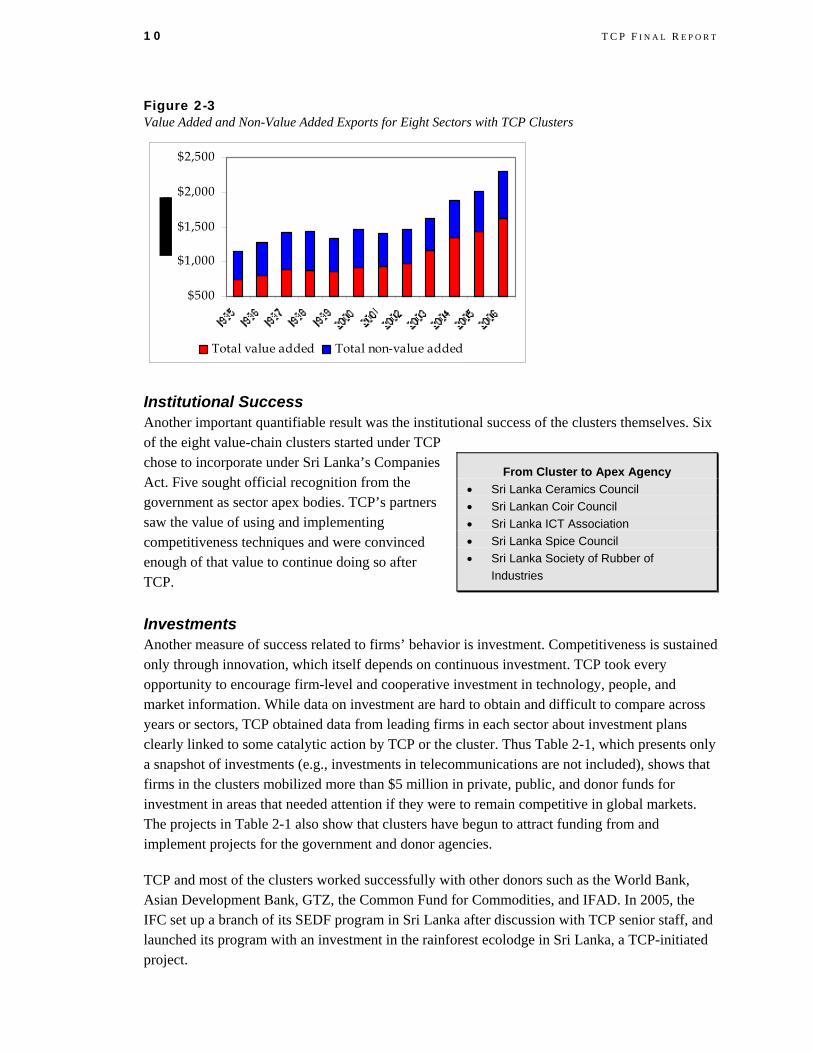
Another measure used as an indicator of improved competitive performance was the percentage of exports in value-added form as opposed to commodity form (e.g., rubber products vs. raw rubber, jewelry and polished gems versus raw gems). Before TCP, the percentage of value-added exports from the eight clusters declined from 30 percent in 1995 to 26 percent in 2000. In 2001, the value-added percentage returned to 30 percent, then rose to 33 percent in 2006. See Figure 2-3.
10 T C P F I N A L R E P O R T
Figure 2-3 Value Added and Non-Value Added Exports for Eight Sectors with TCP Clusters
$500
$1,000
$1,500
$2,000
$2,500
Total value added Total non-value added
Institutional Success Another important quantifiable result was the institutional success of the clusters themselves. Six of the eight value-chain clusters started under TCP chose to incorporate under Sri Lanka’s Companies Act. Five sought official recognition from the government as sector apex bodies. TCP’s partners saw the value of using and implementing competitiveness techniques and were convinced enough of that value to continue doing so after TCP.
From Cluster to Apex Agency • Sri Lanka Ceramics Council • Sri Lankan Coir Council • Sri Lanka ICT Association • Sri Lanka Spice Council • Sri Lanka Society of Rubber of
Industries
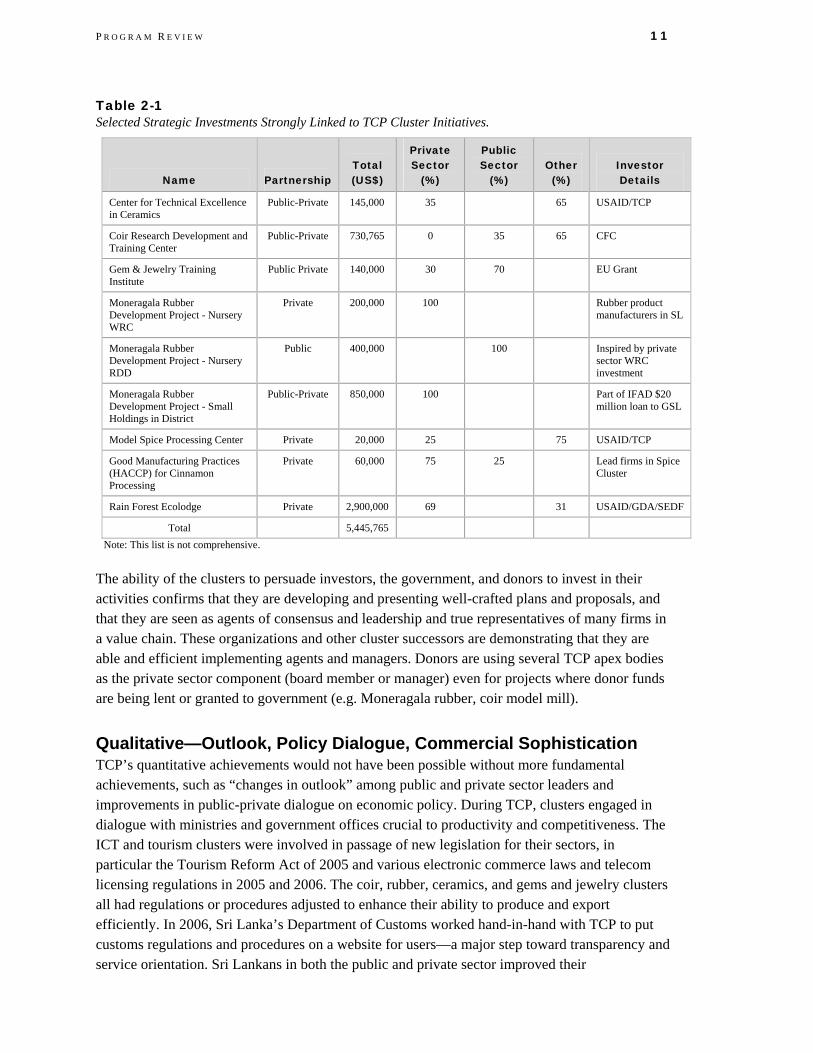
Investments Another measure of success related to firms’ behavior is investment. Competitiveness is sustained only through innovation, which itself depends on continuous investment. TCP took every opportunity to encourage firm-level and cooperative investment in technology, people, and market information. While data on investment are hard to obtain and difficult to compare across years or sectors, TCP obtained data from leading firms in each sector about investment plans clearly linked to some catalytic action by TCP or the cluster. Thus Table 2-1, which presents only a snapshot of investments (e.g., investments in telecommunications are not included), shows that firms in the clusters mobilized more than $5 million in private, public, and donor funds for investment in areas that needed attention if they were to remain competitive in global markets. The projects in Table 2-1 also show that clusters have begun to attract funding from and implement projects for the government and donor agencies.
TCP and most of the clusters worked successfully with other donors such as the World Bank, Asian Development Bank, GTZ, the Common Fund for Commodities, and IFAD. In 2005, the IFC set up a branch of its SEDF program in Sri Lanka after discussion with TCP senior staff, and launched its program with an investment in the rainforest ecolodge in Sri Lanka, a TCP-initiated project.
P R O G R A M R E V I E W 11
Table 2-1 Selected Strategic Investments Strongly Linked to TCP Cluster Initiatives.
Name Partnership Total (US$)
Private Sector
(%)
Public Sector
(%) Other (%)
Investor Details
Center for Technical Excellence in Ceramics
Public-Private 145,000 35 65 USAID/TCP
Coir Research Development and Training Center
Public-Private 730,765 0 35 65 CFC
Gem & Jewelry Training Institute
Public Private 140,000 30 70 EU Grant
Moneragala Rubber Development Project - Nursery WRC
Private 200,000 100 Rubber product manufacturers in SL
Moneragala Rubber Development Project - Nursery RDD
Public 400,000 100 Inspired by private sector WRC investment
Moneragala Rubber Development Project - Small Holdings in District
Public-Private 850,000 100 Part of IFAD $20 million loan to GSL
Model Spice Processing Center Private 20,000 25 75 USAID/TCP
Good Manufacturing Practices (HACCP) for Cinnamon Processing
Private 60,000 75 25 Lead firms in Spice Cluster
Rain Forest Ecolodge Private 2,900,000 69 31 USAID/GDA/SEDF
Total 5,445,765 Note: This list is not comprehensive.
The ability of the clusters to persuade investors, the government, and donors to invest in their activities confirms that they are developing and presenting well-crafted plans and proposals, and that they are seen as agents of consensus and leadership and true representatives of many firms in a value chain. These organizations and other cluster successors are demonstrating that they are able and efficient implementing agents and managers. Donors are using several TCP apex bodies as the private sector component (board member or manager) even for projects where donor funds are being lent or granted to government (e.g. Moneragala rubber, coir model mill).
Qualitative—Outlook, Policy Dialogue, Commercial Sophistication TCP’s quantitative achievements would not have been possible without more fundamental achievements, such as “changes in outlook” among public and private sector leaders and improvements in public-private dialogue on economic policy. During TCP, clusters engaged in dialogue with ministries and government offices crucial to productivity and competitiveness. The ICT and tourism clusters were involved in passage of new legislation for their sectors, in particular the Tourism Reform Act of 2005 and various electronic commerce laws and telecom licensing regulations in 2005 and 2006. The coir, rubber, ceramics, and gems and jewelry clusters all had regulations or procedures adjusted to enhance their ability to produce and export efficiently. In 2006, Sri Lanka’s Department of Customs worked hand-in-hand with TCP to put customs regulations and procedures on a website for users—a major step toward transparency and service orientation. Sri Lankans in both the public and private sector improved their

12 T C P F I N A L R E P O R T
understanding of how global markets work and how competitiveness determines success in global commerce, economic development, and job creation. Clusters and firms gained experience in devising strategies for adding value and competing in export markets.
Perhaps the most important qualitative impact was a fundamental change in the outlook or attitude of private sector leaders (Exhibit 2-1) about their own potential for competing. Industry executives learned how to strategically reposition themselves, to cooperate with other firms on mutually beneficial programs in training, research, marketing, standards, and even technology and product development. Owners and managers who once saw themselves as rival growers or traders of raw materials and commodities or services now recognize possibilities for adding or capturing value as part of a global value chain. Producers now take a far greater interest in understanding and meeting market demand. The spice cluster, for example, sponsored market research about what happens to shipments of cinnamon to Mexico and Central America, learning that “Ceylon Cinnamon” is added to coffee as well a bakery items and is prized for its health properties as well as its flavor. Firms grasp the value of cooperating to meet export standards and to offer quality, brands, and fashions that consumers prefer. Firms are also thinking strategically about investing in “up-market” opportunities and keeping more value Sri Lanka.
Exhibit 2-1 Changes in Private Sector and Public SectorOutlooks
TCP partner firms
• Know they have the ability to compete in global
markets even against countries like China and
India.
• Perceive themselves as important links in a global
value chain
• Explore how to capture value by raising quality and
innovating, not just increasing output
• Are willing to advise government on how policies
affect competitiveness.
• Understand the role of intellectual property and
branding in global markets and are investing in
brands, geographic indicators, and quality marks
(e.g., tea, spice, coir, gems and jewelry and IT).
• Are trying to capitalize on and enhance Sri Lanka’s
status as a South Asian trade hub.
• Understand Sri Lanka’s position as a source of
“lifestyle” products (apparel, tea, spices, ayurvedic
medicine, gems & jewelry, ceramics, specialty
tourism) and are committed to branding Sri Lanka
as supplier of quality goods that surpass
international standards for sustainability and ethical
manufacture.
The public sector now
• Understands the challenge of globalization and the
need for policies that promote competitiveness
• Is more willing to engage with private sector and
uses the “cluster” concept in constructing dialogue
fora with businesses
• Appreciates the leadership of the private sector in
economic growth
• Has interest in developing public-private
partnerships for competitiveness.
Although a “government knows best” legacy still dominates the economy, more leaders recognize the achievements of the private sector and the need for firms to be globally competitive. In 2002, when TCP helped the private sector publicize the World Economic Forum’s first issue of the Global Competitiveness Report (GCR) that included scores for Sri Lanka, an official in Sri

P R O G R A M R E V I E W 13
Lanka’s Central Bank dismissed the ratings as a “beauty contest” for businesses. Today, Sri Lanka’s Board of Investment monitors the GCR and five other international arbiters of competitiveness, analyzing the rankings (e.g. infrastructure, time to start a business, policy, labor regulations) for ways to improve Sri Lanka’s scores. H.E the President and some ministers frequently quote the GCR.
TCP worked directly with the government on customs reform, improving Colombo’s status as a regional transport hub, tourism websites, and English education. We also took every opportunity to discuss the GCR and other issues and specific policies with government leaders. But TCP worked mainly with and through industry clusters. Doing so enhanced not only the credibility of advice offered to the public sector, but also the credibility of private sector leaders as competitiveness advocates. By working with and through the clusters and by achieving the export growth and the value addition described earlier, TCP helped the private sector to recast the reform dialogue. Policies are now judged by the criteria of competitiveness and globalization; only a decade ago these forces were simply not taken into account.
Despite significant changes in outlook, Sri Lanka cannot yet be considered a successful emerging economy. It remains a small island economy with many government and commercial traditions rooted in colonialism and a post-independence embrace of socialism and state management. Its development depends to a large extent on the continued emergence of a more vigorous private sector—one that that can grow quickly, creating jobs in new sectors and improving productivity in the agricultural sector. Many Sri Lankans still embrace the traditional view that future jobs will and should be in the agricultural sector or provided by the government. TCP played a vital role in equipping private and public sector leaders with the knowledge and tools needed to change this view. That will be the most important legacy TCP can lay some claim to.
The sections that follow discuss specific TCP’s achievements and activities to improve competitiveness in each value chain cluster and the cross-cutting activities that will help support Sri Lanka’s reemerging private sector.


3. Ceramics Cluster Sri Lanka’s modern ceramics industry was originally the result of significant tax and investment incentives provided by the government in the 1970s. Over time, the high cost of imported inputs and fuel and inefficient production that made poor use of both compromised the industry’s competitiveness. In addition, Sri Lankan companies were unable to enter into high tech ceramics product lines because the island lacked a facility to research and test new products and the workforce to engage in these activities.
In 2001, with the assistance of TCI, the ceramics industry formed a cluster to devise and implement a unified, industry-wide strategy to enhance sector competitiveness. On November 19, 2003, the Sri Lanka Ceramics Council (SLACC) was incorporated under the Companies Act and has since been operating as the sector’s apex body under the aegis of the Ceylon Chamber of Commerce, the official secretariat. The council’s 25 members represent manufacturing firms (ceramics, cement, glass, and electronics), raw material and energy suppliers, government agencies, and academic and R&D institutions.
Members of the council’s Board of Directors in 2007 include the President, Mr. Dayasiri Warnakulasooriya, of Midaya Ceramics Pvt. Ltd.; the Vice President, Mr. Mahendra Jayasekere of Lanka Tiles Ltd.; the Treasurer, Mr Nimal Perera, of Noritake Lanka Porcelain Ltd.; the Secretary, Mr. Niranjan Jawawickrema, of Lanka Walltiles Ltd.; and the Assistant Secretary, Mr. J. Atuapattu of Royal Ceramics. Mr. Sunil G. Wijesinha, Chairman of Dankotuwa Porcelain Limited and former president of the council holds an honorary position on the board. Membership dues, symposia, and training programs provide funding for the council. An annual report with an audited financial statement is issued to members at the annual general meeting. A part-time program coordinator assists the council with administrative and program activities.
Sri Lanka Ceramics Council President, Dayasiri Warnakulasooriya Contact, Lakmali Udugampola Ceylon Chamber of Commerce Building No 50 Nawam Mawatha, Colombo 2 +941 2423476 [email protected] www.ceramics.lk
Membership has increased 50 percent since 2003. SLACC’s strategy for improving sector competitiveness has resulted in the branding of Sri Lankan ceramics products, the brokering of an agreement on fuel prices, the creation of a center of technical excellence, and workforce upgrades. The center of excellence, operating on a fee-for-service basis, helps companies meet immediate requirements for testing and research and development. The SLACC conducts an international ceramics symposium on a bi-annual basis. Several international manufacturing and supply companies have participated in this program.
16 T C P F I N A L R E P O R T
The SLACC is also a policy focal point. Large exporters and SMEs advocate their policy issues through the cluster. Several issues—such as raw material taxes, monopoly fuel prices, lack of consistent and quality electricity, problems in obtaining a mining licenses, and transportation of clay—have been resolved through dialogue between the SLACC and government ministries.
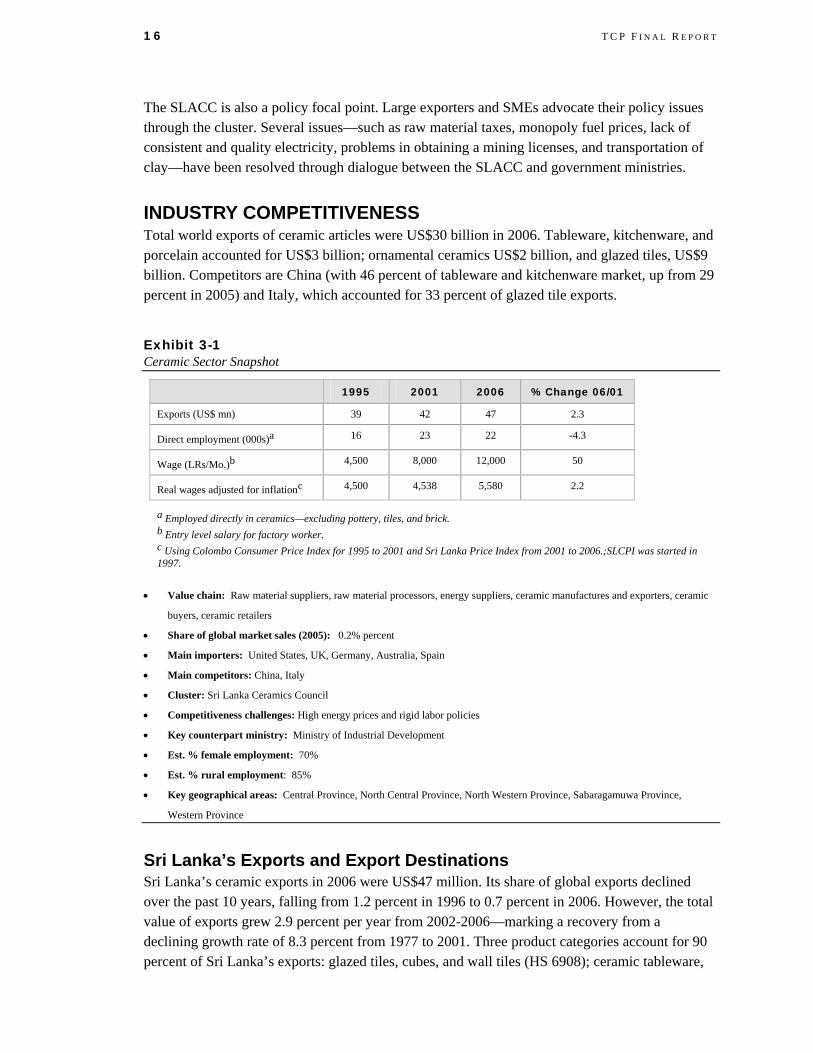
INDUSTRY COMPETITIVENESS Total world exports of ceramic articles were US$30 billion in 2006. Tableware, kitchenware, and porcelain accounted for US$3 billion; ornamental ceramics US$2 billion, and glazed tiles, US$9 billion. Competitors are China (with 46 percent of tableware and kitchenware market, up from 29 percent in 2005) and Italy, which accounted for 33 percent of glazed tile exports.
Exhibit 3-1 Ceramic Sector Snapshot
1995 2001 2006 % Change 06/01
Exports (US$ mn) 39 42 47 2.3
Direct employment (000s)a 16 23 22 -4.3
Wage (LRs/Mo.)b 4,500 8,000 12,000 50
Real wages adjusted for inflationc 4,500 4,538 5,580 2.2
a Employed directly in ceramics—excluding pottery, tiles, and brick. b Entry level salary for factory worker. c Using Colombo Consumer Price Index for 1995 to 2001 and Sri Lanka Price Index from 2001 to 2006.;SLCPI was started in 1997.
• Value chain: Raw material suppliers, raw material processors, energy suppliers, ceramic manufactures and exporters, ceramic
buyers, ceramic retailers
• Share of global market sales (2005): 0.2% percent
• Main importers: United States, UK, Germany, Australia, Spain
• Main competitors: China, Italy
• Cluster: Sri Lanka Ceramics Council
• Competitiveness challenges: High energy prices and rigid labor policies
• Key counterpart ministry: Ministry of Industrial Development
• Est. % female employment: 70%
• Est. % rural employment: 85%
• Key geographical areas: Central Province, North Central Province, North Western Province, Sabaragamuwa Province,
Western Province
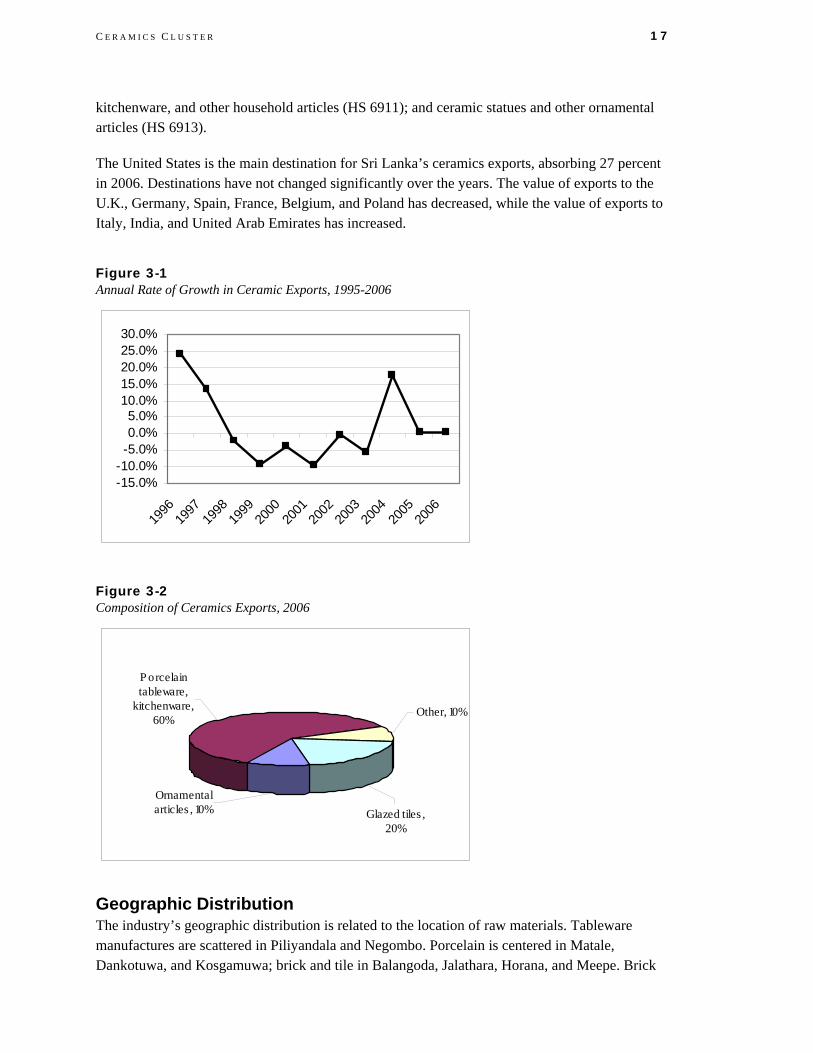
Sri Lanka’s Exports and Export Destinations Sri Lanka’s ceramic exports in 2006 were US$47 million. Its share of global exports declined over the past 10 years, falling from 1.2 percent in 1996 to 0.7 percent in 2006. However, the total value of exports grew 2.9 percent per year from 2002-2006—marking a recovery from a declining growth rate of 8.3 percent from 1977 to 2001. Three product categories account for 90 percent of Sri Lanka’s exports: glazed tiles, cubes, and wall tiles (HS 6908); ceramic tableware,
C E R A M I C S C L U S T E R 17
kitchenware, and other household articles (HS 6911); and ceramic statues and other ornamental articles (HS 6913).
The United States is the main destination for Sri Lanka’s ceramics exports, absorbing 27 percent in 2006. Destinations have not changed significantly over the years. The value of exports to the U.K., Germany, Spain, France, Belgium, and Poland has decreased, while the value of exports to Italy, India, and United Arab Emirates has increased.
Figure 3-1 Annual Rate of Growth in Ceramic Exports, 1995-2006
-15.0%-10.0%-5.0%0.0%5.0%
10.0%15.0%20.0%25.0%30.0%
1996
1997
1998
1999
2000
2001
2002
2003
2004
2005
2006
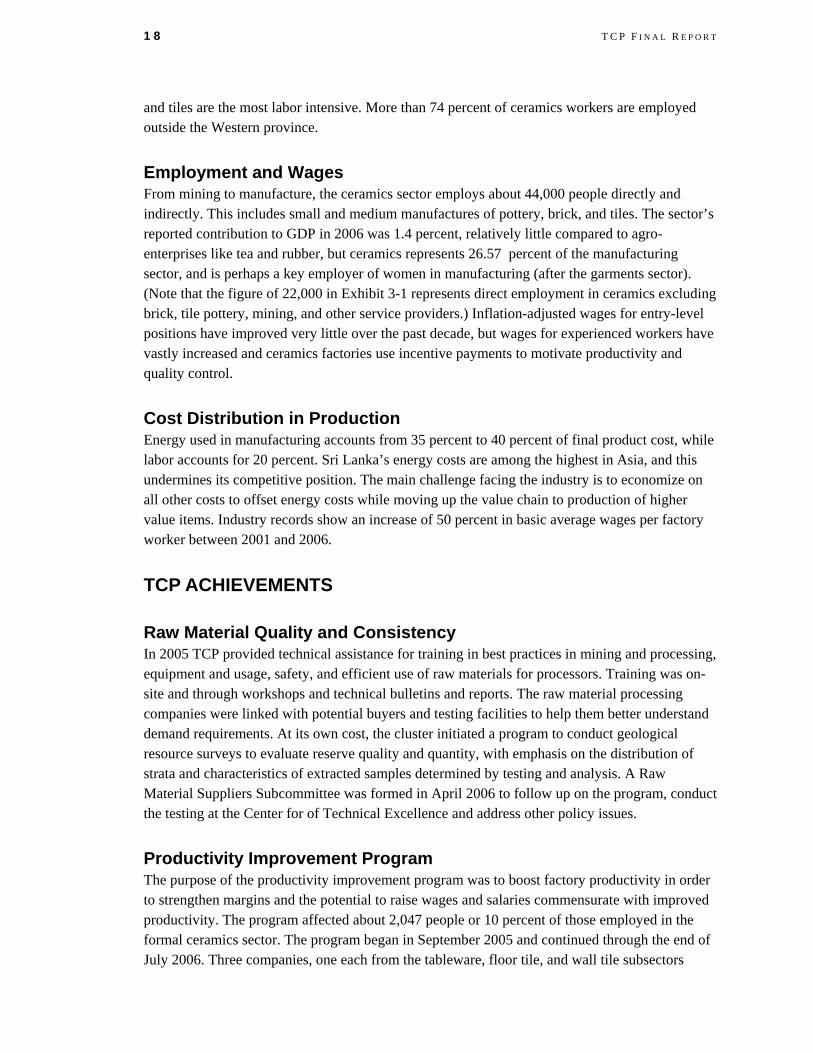
Figure 3-2 Composition of Ceramics Exports, 2006
Other, 10%
Glazed tiles , 20%
Ornamental articles , 10%
P orcelain tableware,
kitchenware, 60%
Geographic Distribution The industry’s geographic distribution is related to the location of raw materials. Tableware manufactures are scattered in Piliyandala and Negombo. Porcelain is centered in Matale, Dankotuwa, and Kosgamuwa; brick and tile in Balangoda, Jalathara, Horana, and Meepe. Brick
18 T C P F I N A L R E P O R T
and tiles are the most labor intensive. More than 74 percent of ceramics workers are employed outside the Western province.
Employment and Wages From mining to manufacture, the ceramics sector employs about 44,000 people directly and indirectly. This includes small and medium manufactures of pottery, brick, and tiles. The sector’s reported contribution to GDP in 2006 was 1.4 percent, relatively little compared to agro-enterprises like tea and rubber, but ceramics represents 26.57 percent of the manufacturing sector, and is perhaps a key employer of women in manufacturing (after the garments sector). (Note that the figure of 22,000 in Exhibit 3-1 represents direct employment in ceramics excluding brick, tile pottery, mining, and other service providers.) Inflation-adjusted wages for entry-level positions have improved very little over the past decade, but wages for experienced workers have vastly increased and ceramics factories use incentive payments to motivate productivity and quality control.
Cost Distribution in Production Energy used in manufacturing accounts from 35 percent to 40 percent of final product cost, while labor accounts for 20 percent. Sri Lanka’s energy costs are among the highest in Asia, and this undermines its competitive position. The main challenge facing the industry is to economize on all other costs to offset energy costs while moving up the value chain to production of higher value items. Industry records show an increase of 50 percent in basic average wages per factory worker between 2001 and 2006.
TCP ACHIEVEMENTS
Raw Material Quality and Consistency In 2005 TCP provided technical assistance for training in best practices in mining and processing, equipment and usage, safety, and efficient use of raw materials for processors. Training was on-site and through workshops and technical bulletins and reports. The raw material processing companies were linked with potential buyers and testing facilities to help them better understand demand requirements. At its own cost, the cluster initiated a program to conduct geological resource surveys to evaluate reserve quality and quantity, with emphasis on the distribution of strata and characteristics of extracted samples determined by testing and analysis. A Raw Material Suppliers Subcommittee was formed in April 2006 to follow up on the program, conduct the testing at the Center for of Technical Excellence and address other policy issues.
Productivity Improvement Program The purpose of the productivity improvement program was to boost factory productivity in order to strengthen margins and the potential to raise wages and salaries commensurate with improved productivity. The program affected about 2,047 people or 10 percent of those employed in the formal ceramics sector. The program began in September 2005 and continued through the end of July 2006. Three companies, one each from the tableware, floor tile, and wall tile subsectors
C E R A M I C S C L U S T E R 19
participated on a cost-share basis. The total cost was US$32,235 of which TCP contributed US$24,044 as a grant to the cluster. Participants covered the balance.
For tableware, the program had modules on strategic and business planning and marketing; for wall and floor tile, it offered modules on continuous improvement and quality, productivity and work study. CEOs developed baseline indicators and TCP consultants implemented the modules. A local firm, 3rd Wave, developed and implemented the continuous improvement program. After six months, factories experienced an average 2 percent increase in productivity, which equates to an estimated annual savings of US$300,000.
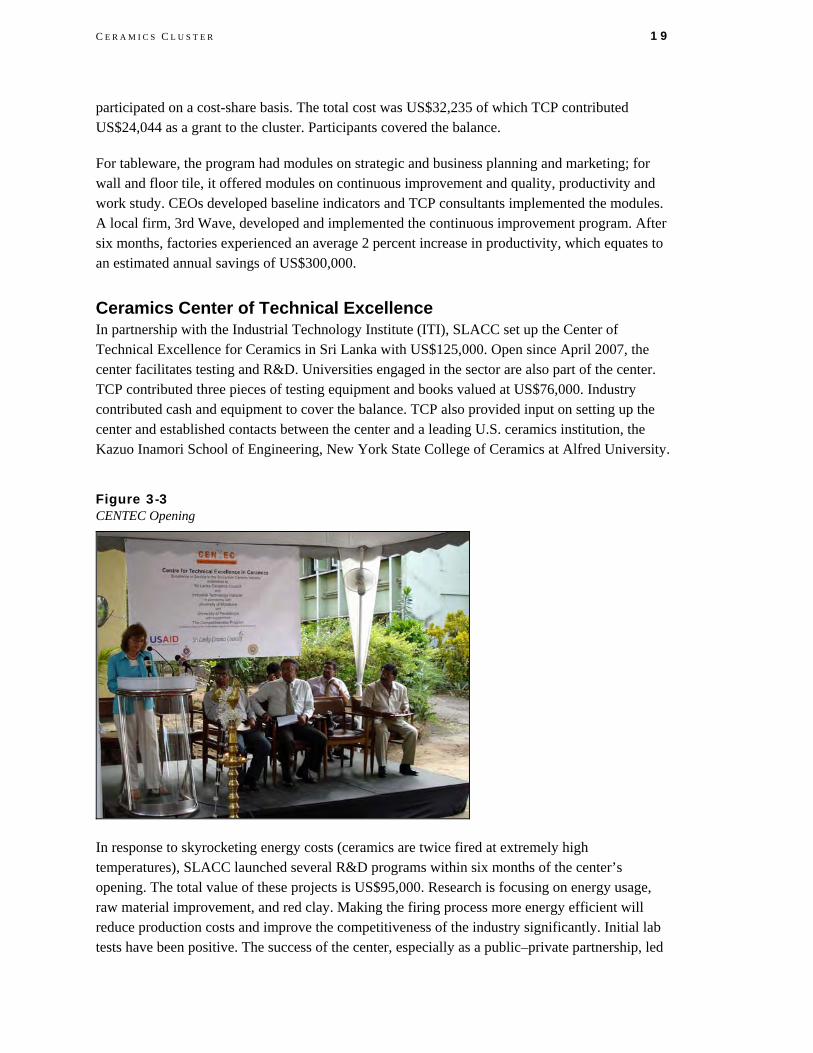
Ceramics Center of Technical Excellence In partnership with the Industrial Technology Institute (ITI), SLACC set up the Center of Technical Excellence for Ceramics in Sri Lanka with US$125,000. Open since April 2007, the center facilitates testing and R&D. Universities engaged in the sector are also part of the center. TCP contributed three pieces of testing equipment and books valued at US$76,000. Industry contributed cash and equipment to cover the balance. TCP also provided input on setting up the center and established contacts between the center and a leading U.S. ceramics institution, the Kazuo Inamori School of Engineering, New York State College of Ceramics at Alfred University.
Figure 3-3 CENTEC Opening
In response to skyrocketing energy costs (ceramics are twice fired at extremely high temperatures), SLACC launched several R&D programs within six months of the center’s opening. The total value of these projects is US$95,000. Research is focusing on energy usage, raw material improvement, and red clay. Making the firing process more energy efficient will reduce production costs and improve the competitiveness of the industry significantly. Initial lab tests have been positive. The success of the center, especially as a public–private partnership, led

20 T C P F I N A L R E P O R T
the Ministry of Industrial Development to urge other industries to replicate the center of excellence concept.
CLUSTER ACHEIVEMENTS
Long-term Pricing Agreement for Liquid Petroleum Gasoline In 2002, the cluster was instrumental in negotiating transparent pricing agreement formulas with Shell Gas. Participating companies received LPG at global market prices with a specified discount for entering into a long-term contract with Shell Lanka. Participants estimate that their annual savings from 2002 through 2006 averaged approximately 5 percent of their pre-contract LPG costs.
Workforce Development Program The council, with technical assistance from TCP and the University of Moratuwa, developed a six-month industry placement program starting in 2005. The purpose was to place third-year materials engineering students in the industry so they could acquire direct experience. After its second session, the program was completely funded by industry. Graduates who participated in the program found jobs more quickly and at higher salaries than those who did not. The university is keen to replicate the program for other industries.
Raw Material Mining Policies The council’s raw material suppliers subcommittee, with support from the Ministry of Industrial Development, pursued an amendment to regulations governing ball clay mining in abandoned paddy fields. Under Agrarian Development Act regulations, cluster firms were forced to either import ball clay—an important raw material—or obtain it from illicit mining. The subcommittee worked with the Ministry of Agrarian Services and the Geographical Services and Mining Bureau (GSMB) to identify problems in obtaining licenses to mine in abandoned paddy lands. Issues resolved included determinations as to which agencies would give approvals for licenses and how land would be refilled and restored after being mined for ball clay. The number of agencies involved in issuing licenses was reduced from 15 to 5 in April 2006.
Renewable Energy The monthly rise in energy prices has driven the ceramics industry to explore alternative energy sources. While significant research on ceramics firing is underway, the cluster has taken the lead in introducing renewable energy to supplement gas and kerosene. In the autumn of 2007, the council began discussions with the Ministry of Science and Technology and potential investors to explore using wood chips made from glyricidia, a renewable energy source. At prevailing prices, the cost of generating heat from glyricidia is 25 percent of the cost of generating the same amount of heat from petroleum fuels. Petroleum fuels are still widely used because glyricidia is not available in sufficient quantities. The ceramics industry consumes 37,000 tons of petroleum fuel, accounting for 14 percent of petroleum fuels consumed by the island’s entire industrial sector. Two leading companies plan to invest more than US$100,000 to test new glyricidia technology.
C E R A M I C S C L U S T E R 21
RURAL IMPACT The ceramics industry employs more than 44,000 persons, including many small and medium manufacturers of pottery, brick, and tiles as well as informal laborers. Seventy-four percent work outside the Western province, and a large percentage are women. Without TCP assistance, it is unlikely that the price negotiations and cooperative industry research and development would have taken place and the industry’s competitive position would have continued to erode. Now the industry is well positioned for growth. In linking rural miners and manufactures to the ceramics center of excellence and in helping the cluster increase exports, TCP had a direct impact on rural areas. (More than 95 percent of cluster members are outside of the Western province.) SLACC is contemplating a program with the Ministry of Industrial Development to provide technical and management assistance to SMEs involved in ceramics.
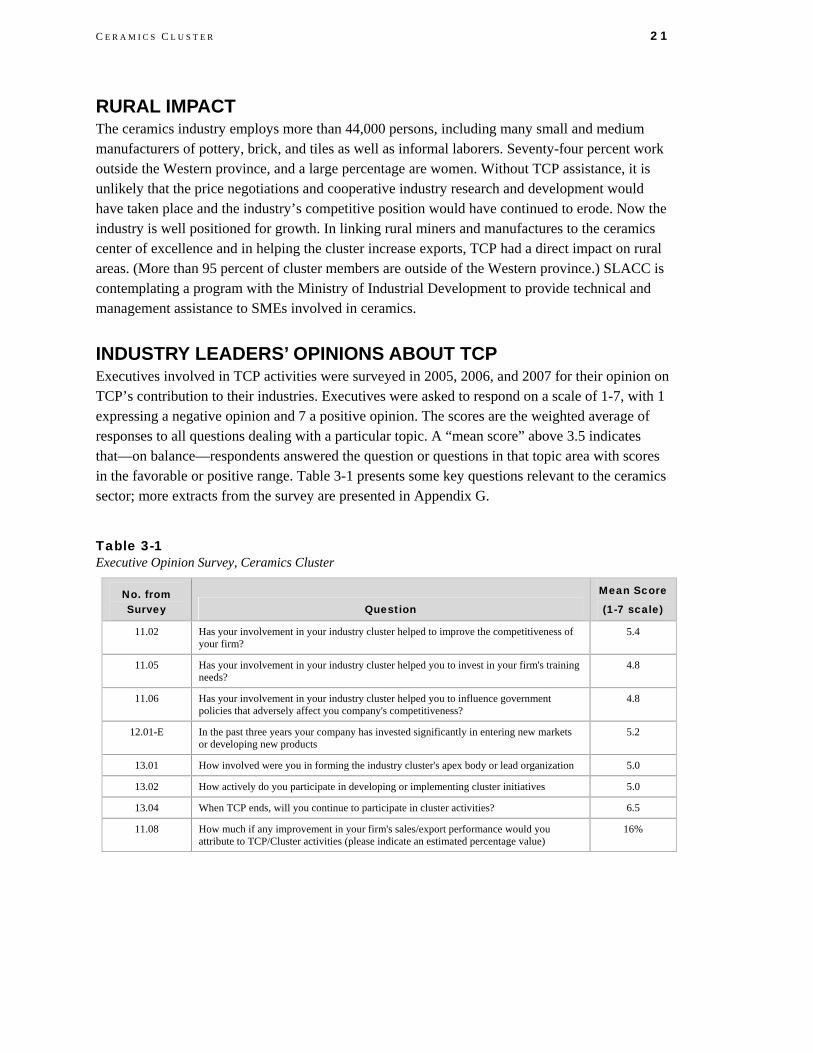
INDUSTRY LEADERS’ OPINIONS ABOUT TCP Executives involved in TCP activities were surveyed in 2005, 2006, and 2007 for their opinion on TCP’s contribution to their industries. Executives were asked to respond on a scale of 1-7, with 1 expressing a negative opinion and 7 a positive opinion. The scores are the weighted average of responses to all questions dealing with a particular topic. A “mean score” above 3.5 indicates that—on balance—respondents answered the question or questions in that topic area with scores in the favorable or positive range. Table 3-1 presents some key questions relevant to the ceramics sector; more extracts from the survey are presented in Appendix G.
Table 3-1 Executive Opinion Survey, Ceramics Cluster
No. from Survey Question
Mean Score
(1-7 scale)
11.02 Has your involvement in your industry cluster helped to improve the competitiveness of your firm?
5.4
11.05 Has your involvement in your industry cluster helped you to invest in your firm's training needs?
4.8
11.06 Has your involvement in your industry cluster helped you to influence government policies that adversely affect you company's competitiveness?
4.8
12.01-E In the past three years your company has invested significantly in entering new markets or developing new products
5.2
13.01 How involved were you in forming the industry cluster's apex body or lead organization 5.0
13.02 How actively do you participate in developing or implementing cluster initiatives 5.0
13.04 When TCP ends, will you continue to participate in cluster activities? 6.5
11.08 How much if any improvement in your firm's sales/export performance would you attribute to TCP/Cluster activities (please indicate an estimated percentage value)
16%


4. Coir Cluster The Coir Council International (CCI) was incorporated under the Companies Act on November 19, 2003, as the apex body of the coir industry. CCI’s membership is a broad cross-section of the coir industry representing growers, millers, manufacturers, and exporters. The 22-member board includes representatives from the Ministry of Industries, Coconut Development Authority (CDA), Coconut Research Institute (CRI), and the Industrial Technology Institute (ITI). CCI has a chairman, an executive committee, and project subcommittees for the model mill, erosion control products, promotional activity, and tsunami rehabilitation.
Coir Council International Chairman, Mr. Indrajith Piyasena c/o Hayley’s Exports Ltd 138/4, Minuwangoda Road, Ekala, Ja-Ela +94112232475
On August 15, 2005, CCI convened a board meeting to agree on changes to its memorandum and articles of association. An executive committee with all powers of the board was appointed to serve between board meetings. To ensure transparency and build confidence among stakeholders, a representative from each of the five member associations was appointed to the committee. Members unanimously agreed to increase dues from LRs 100 to LRs 5,000 per association. Officials of the committee are Chairman Mr. Piyasena; Vice Chairman Mr. Wimalasiri Herath; Secretary Mr. Shalinda Perera; and Treasurer Mr. Murtaza Jafferjee.
Because CCI has been recognized by the government as the private sector apex body for the coir industry, the CDA works directly with it in implementing projects and addressing policy issues. One result of this partnership is that more miller associations in coconut growing areas (the “coconut triangle”) and in the south are working with the council to implement programs. One joint initiative is the setting of standards for coir fiber recognized by the Sri Lanka Standards Institute, industry, and foreign buyers.
Segments of the coir industry in Sri Lanka function as a cottage industry, where women are able to spin coir fiber into yarn in their homes to generate additional income. Increasing competitiveness while preserving this vital link in the supply chain required the industry to develop standards and quality improvement programs, and to research and adopt technology to pursue higher value added technological applications and composites using coir.
INDUSTRY COMPETITIVENESS South East Asia accounts for almost all coir produced in the world. Coir exports from the region amounted to 195,000MT in 2004, with Sri Lanka and India accounting for 32 percent and 40
24 T C P F I N A L R E P O R T
percent, respectively. Coir exports rose by 66 percent in volume from 2000 to 2004 because of growing demand for mattress and twisted fiber in China. This has encouraged Thailand and Vietnam to emerge as producers and exporters. Export volumes from Thailand grew 500 percent, going from 7,255 MT in 2000 to 44,625 MT in 2004. In the same period, exports from Sri Lanka grew only 18 percent in volume.
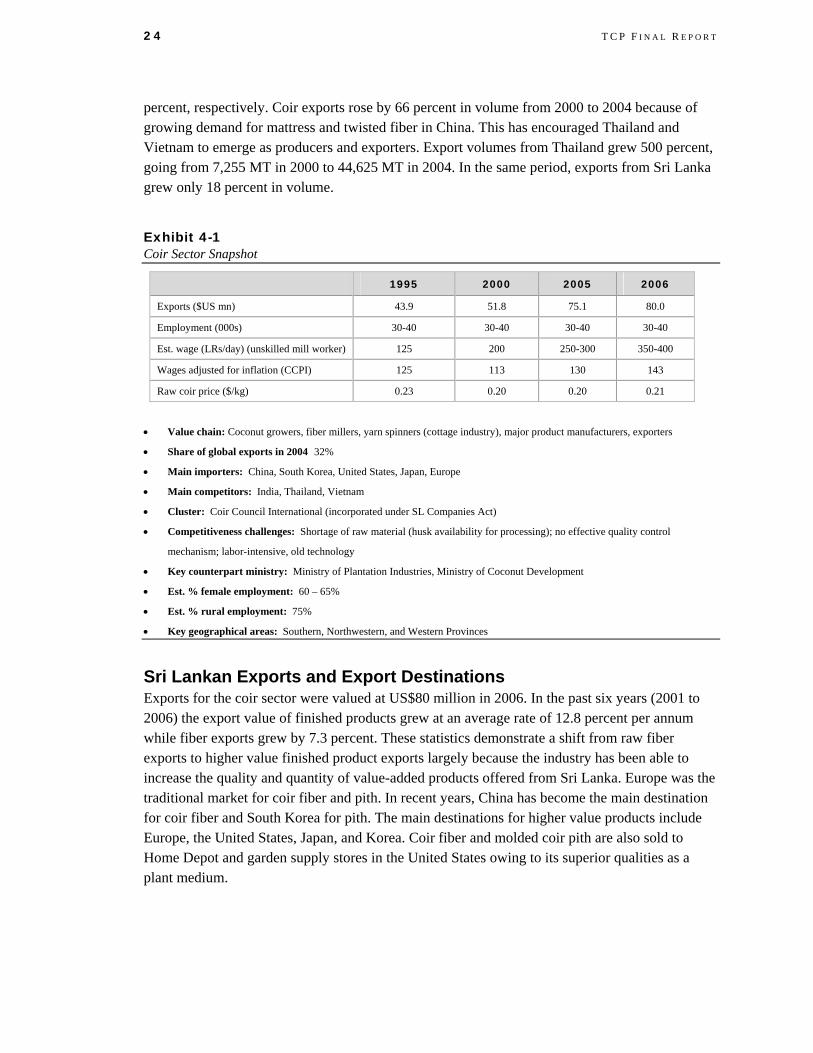
Exhibit 4-1 Coir Sector Snapshot
1995 2000 2005 2006
Exports ($US mn) 43.9 51.8 75.1 80.0
Employment (000s) 30-40 30-40 30-40 30-40
Est. wage (LRs/day) (unskilled mill worker) 125 200 250-300 350-400
Wages adjusted for inflation (CCPI) 125 113 130 143
Raw coir price ($/kg) 0.23 0.20 0.20 0.21
• Value chain: Coconut growers, fiber millers, yarn spinners (cottage industry), major product manufacturers, exporters
• Share of global exports in 2004 32%
• Main importers: China, South Korea, United States, Japan, Europe
• Main competitors: India, Thailand, Vietnam
• Cluster: Coir Council International (incorporated under SL Companies Act)
• Competitiveness challenges: Shortage of raw material (husk availability for processing); no effective quality control
mechanism; labor-intensive, old technology
• Key counterpart ministry: Ministry of Plantation Industries, Ministry of Coconut Development
• Est. % female employment: 60 – 65%
• Est. % rural employment: 75%
• Key geographical areas: Southern, Northwestern, and Western Provinces
Sri Lankan Exports and Export Destinations Exports for the coir sector were valued at US$80 million in 2006. In the past six years (2001 to 2006) the export value of finished products grew at an average rate of 12.8 percent per annum while fiber exports grew by 7.3 percent. These statistics demonstrate a shift from raw fiber exports to higher value finished product exports largely because the industry has been able to increase the quality and quantity of value-added products offered from Sri Lanka. Europe was the traditional market for coir fiber and pith. In recent years, China has become the main destination for coir fiber and South Korea for pith. The main destinations for higher value products include Europe, the United States, Japan, and Korea. Coir fiber and molded coir pith are also sold to Home Depot and garden supply stores in the United States owing to its superior qualities as a plant medium.
C O I R C L U S T E R 25
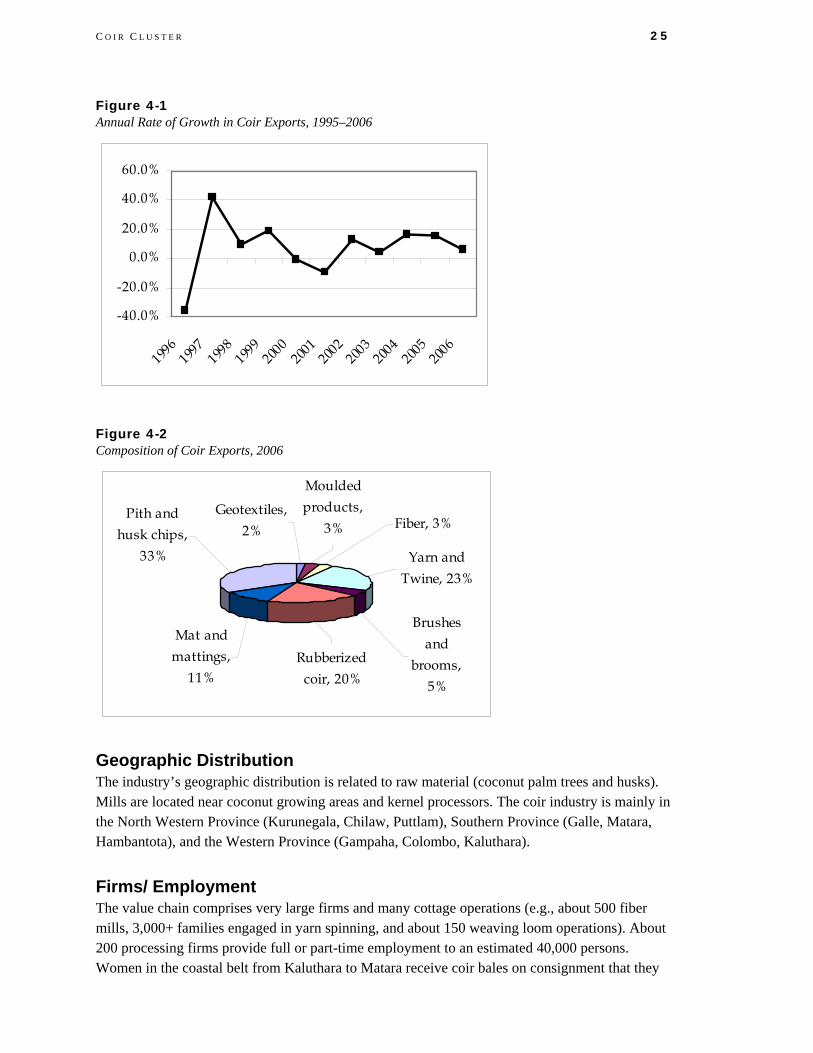
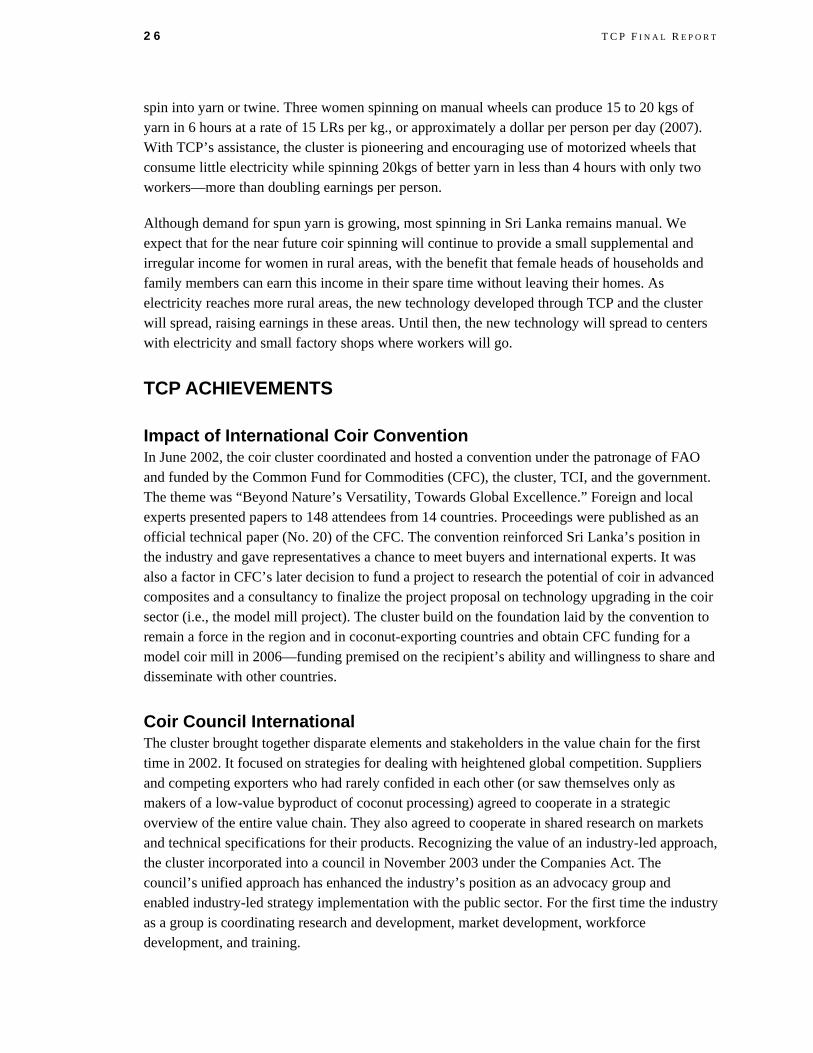
Figure 4-1 Annual Rate of Growth in Coir Exports, 1995–2006
-40.0%
-20.0%
0.0%
20.0%
40.0%
60.0%
1996
1997
1998
1999
2000
2001
2002
2003
2004
2005
2006
Figure 4-2 Composition of Coir Exports, 2006
Mat and mattings,
11%Rubberized
coir, 20%
Brushes and
brooms, 5%
Yarn and Twine, 23%
Fiber, 3%Geotextiles,
2%
Moulded products,
3%Pith and
husk chips, 33%
Geographic Distribution The industry’s geographic distribution is related to raw material (coconut palm trees and husks). Mills are located near coconut growing areas and kernel processors. The coir industry is mainly in the North Western Province (Kurunegala, Chilaw, Puttlam), Southern Province (Galle, Matara, Hambantota), and the Western Province (Gampaha, Colombo, Kaluthara).
Firms/ Employment The value chain comprises very large firms and many cottage operations (e.g., about 500 fiber mills, 3,000+ families engaged in yarn spinning, and about 150 weaving loom operations). About 200 processing firms provide full or part-time employment to an estimated 40,000 persons. Women in the coastal belt from Kaluthara to Matara receive coir bales on consignment that they
26 T C P F I N A L R E P O R T
spin into yarn or twine. Three women spinning on manual wheels can produce 15 to 20 kgs of yarn in 6 hours at a rate of 15 LRs per kg., or approximately a dollar per person per day (2007). With TCP’s assistance, the cluster is pioneering and encouraging use of motorized wheels that consume little electricity while spinning 20kgs of better yarn in less than 4 hours with only two workers—more than doubling earnings per person.
Although demand for spun yarn is growing, most spinning in Sri Lanka remains manual. We expect that for the near future coir spinning will continue to provide a small supplemental and irregular income for women in rural areas, with the benefit that female heads of households and family members can earn this income in their spare time without leaving their homes. As electricity reaches more rural areas, the new technology developed through TCP and the cluster will spread, raising earnings in these areas. Until then, the new technology will spread to centers with electricity and small factory shops where workers will go.
TCP ACHIEVEMENTS
Impact of International Coir Convention In June 2002, the coir cluster coordinated and hosted a convention under the patronage of FAO and funded by the Common Fund for Commodities (CFC), the cluster, TCI, and the government. The theme was “Beyond Nature’s Versatility, Towards Global Excellence.” Foreign and local experts presented papers to 148 attendees from 14 countries. Proceedings were published as an official technical paper (No. 20) of the CFC. The convention reinforced Sri Lanka’s position in the industry and gave representatives a chance to meet buyers and international experts. It was also a factor in CFC’s later decision to fund a project to research the potential of coir in advanced composites and a consultancy to finalize the project proposal on technology upgrading in the coir sector (i.e., the model mill project). The cluster build on the foundation laid by the convention to remain a force in the region and in coconut-exporting countries and obtain CFC funding for a model coir mill in 2006—funding premised on the recipient’s ability and willingness to share and disseminate with other countries.
Coir Council International The cluster brought together disparate elements and stakeholders in the value chain for the first time in 2002. It focused on strategies for dealing with heightened global competition. Suppliers and competing exporters who had rarely confided in each other (or saw themselves only as makers of a low-value byproduct of coconut processing) agreed to cooperate in a strategic overview of the entire value chain. They also agreed to cooperate in shared research on markets and technical specifications for their products. Recognizing the value of an industry-led approach, the cluster incorporated into a council in November 2003 under the Companies Act. The council’s unified approach has enhanced the industry’s position as an advocacy group and enabled industry-led strategy implementation with the public sector. For the first time the industry as a group is coordinating research and development, market development, workforce development, and training.
C O I R C L U S T E R 27
Research Partnerships The cluster was instrumental in providing a forum for R&D partnerships. At the request of the industry, the government research institute for coconut conducted a retting1 study in 2004, recommencing research after a lapse of more than two years. Earlier under TCI, the cluster facilitated and co-funded research on coir in advanced composites with the University of Delft, Holland, and Sri Lanka’s Industrial Technology Institute in 2003-04. The cluster lobbied CFC for co-funding and TCI for the cost of training the ITI research officer in Delft. This project built local research capacity and led to an assessment of opportunities for using coir in natural fiber composites, a market with double-digit growth in Europe.
Restored Livelihoods of Tsunami-affected Spinners Coir spinning thrives in villages along the southern coast and provides extra income for 3,000 families. Thousands of spinning wheels were washed away by the tsunami when homes were destroyed. The impact on livelihoods extended beyond the spinners to manufacturers of geotextiles (used in land erosion control) and handwoven doormats, for which coir-yarn is essential. In February 2005, TCP provided 500 spinning wheel sets complemented with a 25kg bale of coir fiber each to women who had lost their wheels and coir stock in the tsunami. This grant restored a key part of the livelihoods of approximately 1,500 women (3 women per reel set); re-started the value chain supply of coir twine used in the production of geotextiles for export from Sri Lanka to Korea and Japan; and enabled the export companies to fulfill their orders without interruption. Other NGOs and relief agencies followed TCP’s lead and began offering to wheels to hundreds more women in the tsunami-damaged coastal belt. Within four months the spinning capacity was regenerated in the tsunami-affected areas.
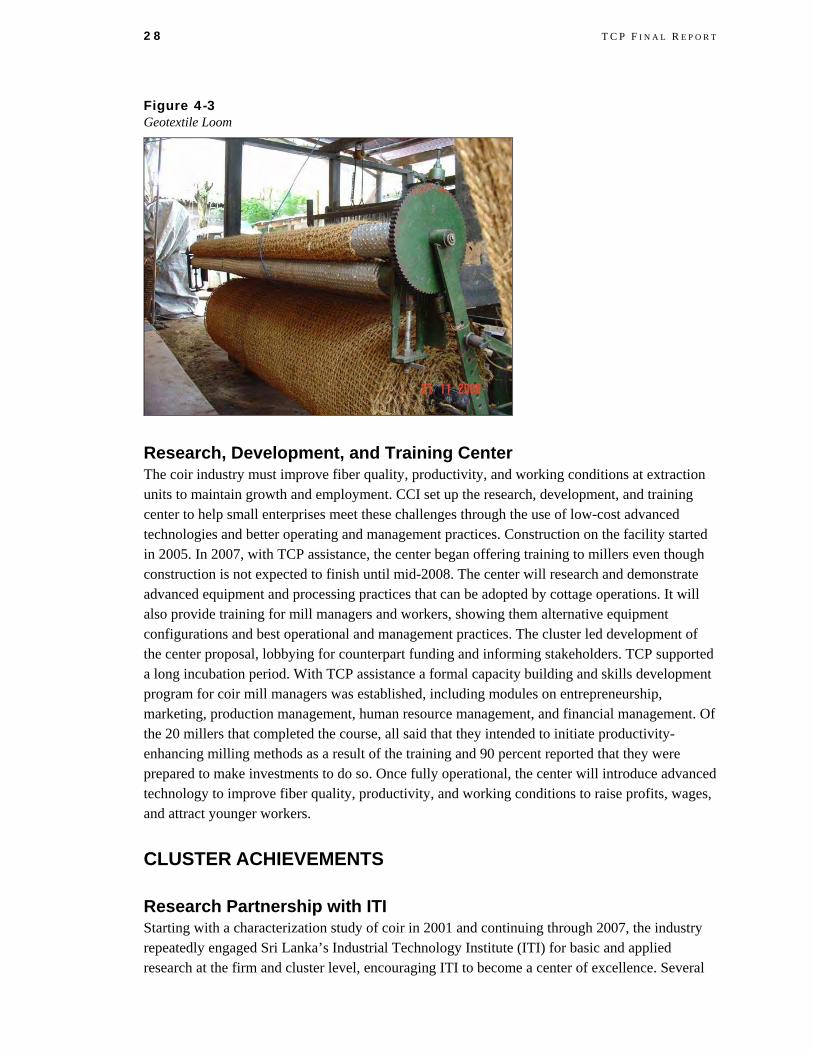
Cottage Weaving Technology for Geotextiles To break into the higher value geotextile market,2 millers found that they needed to be able to produce woven coir netting that met the international standard width of two meters. The cluster developed loom technology for manufacture of wider rolls of high quality geotextiles. A motorized 2-meter wide wooden loom for use in a cottage setting was developed and tested during 2006. Commercialization of the technology requires increasing the speed of the machine, which has a direct effect on productivity. Better specifications were developed for further trials in 2007. The International Erosion Control Association and industry co-funded this effort. The industry has implemented a follow-up program with the Ministry of Industries to test two more looms in 2008. This initiative will provide the industry with an opportunity to capitalize the demand for 2-meter wide, high quality geotextiles in the more discerning and higher priced markets of Europe and the United States.
1 Retting is the process where raw fiber is separated from the husk. In Sri Lanka this is often done in retting ponds, which can be a health hazard.
2 Geotextiles are used by Departments of Transportation and in construction projects to control erosion.
28 T C P F I N A L R E P O R T
Figure 4-3 Geotextile Loom
Research, Development, and Training Center The coir industry must improve fiber quality, productivity, and working conditions at extraction units to maintain growth and employment. CCI set up the research, development, and training center to help small enterprises meet these challenges through the use of low-cost advanced technologies and better operating and management practices. Construction on the facility started in 2005. In 2007, with TCP assistance, the center began offering training to millers even though construction is not expected to finish until mid-2008. The center will research and demonstrate advanced equipment and processing practices that can be adopted by cottage operations. It will also provide training for mill managers and workers, showing them alternative equipment configurations and best operational and management practices. The cluster led development of the center proposal, lobbying for counterpart funding and informing stakeholders. TCP supported a long incubation period. With TCP assistance a formal capacity building and skills development program for coir mill managers was established, including modules on entrepreneurship, marketing, production management, human resource management, and financial management. Of the 20 millers that completed the course, all said that they intended to initiate productivity-enhancing milling methods as a result of the training and 90 percent reported that they were prepared to make investments to do so. Once fully operational, the center will introduce advanced technology to improve fiber quality, productivity, and working conditions to raise profits, wages, and attract younger workers.
CLUSTER ACHIEVEMENTS
Research Partnership with ITI Starting with a characterization study of coir in 2001 and continuing through 2007, the industry repeatedly engaged Sri Lanka’s Industrial Technology Institute (ITI) for basic and applied research at the firm and cluster level, encouraging ITI to become a center of excellence. Several
C O I R C L U S T E R 29
research projects were transferred from ITI to industry; some, such a new bleaching technology have helped reduce costs and improve quality. Others are leading to new marketable coir products including stronger coir pith “bio-pots” in a variety of shapes and sizes for the horticulture industry. The industry and ITI submitted a proposal for a product development and technology transfer center catering to coir SMEs. Accepted in principle by the ADB, the proposal seeks to establish prototypes for erosion control and composite product development, both areas in which TCP facilitated exposure and training for ITI staff.
Yarn Quality and Productivity Geotextile and mat manufacturers demand yarn of exceptional and consistent quality. Those exporting to discerning markets use high value twine to compete with products from India. Better yarn will allow Sri Lanka to tap into a larger segment of U.S. and European markets. The CCI and the Ministry of Industries will embark on a project to improve yarn quality and productivity at the cottage level. They will focus on semi-automation of traditional spinning wheels and testing of semi-automated spinning technology from India. Results will include more efficient and less costly production, higher profits for cottage operations, and better wages for cottage-level workers.
RURAL IMPACT Most of the 40,000 jobs in coir mills and related services are outside of the Western Province. Therefore, almost all cluster initiatives focused on issues upstream in the value chain, catering to the needs of the millers and mill workers in rural Sri Lanka. TCP assistance focused on productivity and quality improvement with the aim of preserving spinning and weaving as a cottage industry. Most spinners work on a per kilogram basis and so productivity enhancements resulted in a direct benefit of increased household income. The model mill and training program also heavily stressed the importance of safety and labor standards in mill operations, which will provide the long-term benefit of fewer workplace accidents and make the coir industry a more attractive employment option in the future.
INDUSTRY LEADERS’ OPINIONS ABOUT TCP Executives involved in TCP activities were surveyed in 2005, 2006, and 2007 for their opinion on how TCP had affected their industries. Executives were asked to respond on a scale of 1-7, with 1 expressing a negative opinion and 7 a positive opinion. A “mean score” above 3.5 indicates that—on balance—respondents answered the question (or questions in that topic area) with scores in the favorable or positive range. Table 4-1 presents some questions relevant to the coir sector; more survey extracts are presented in Appendix G.

30 T C P F I N A L R E P O R T
Table 4-1 Executive Opinion Survey, Coir Cluster
No. from Survey Questions
Mean Score
(1-7 scale)
11.02 Has your involvement in your industry cluster helped to improve the competitiveness of your firm? 4.8
11.05 Has your involvement in your industry cluster helped you to invest in your firm's training needs? 4.4
11.06 Has your involvement in your industry cluster helped you to influence government policies that adversely affect you company's competitiveness?
4.5
12.01-E In the past three years your company has invested significantly in entering new markets or developing new products
4.6
13.01 How involved were you in forming the industry cluster's apex body or lead organization 4 9
13.02 How actively do you participate in developing or implementing cluster initiatives 5.3
13.04 When TCP ends, will you continue to participate in cluster activities? 5.5
11.08 How much if any improvement in your firm's sales/export performance would you attribute to TCP/Cluster activities (please indicate an estimated percentage value)
21%
5. Gems & Jewelry Cluster Although Sri Lankan gems are widely viewed as some of the highest quality gems in the world, the gem industry lacked the capacity and knowledge to translate this competitive advantage into high value jewelry exports. In addition, export and regulatory policy diminished the competitiveness of the sector by heavily taxing jewelry making inputs. To address this situation, the Sri Lanka Gem and Jewelry Association (SLGJA) was incorporated under the Companies Act on November 28, 2003. A merging of four trade associations, it is now the apex body representing Sri Lanka’s gem and jewelry industry. The gem and jewelry cluster is a permanent subcommittee for strategy.
Sri Lanka Gem and Jewelry Association Sr. Spokesperson, Mr. David Hill, CEO Chairman, Chanaka Ellawala No 38, Frankfurt Place, Colombo 4 +94 11 259 7226 [email protected] www.lankajewels.com
The SLGJA has more than 360 members from across the industry value chain including mining, lapidary, jewelry manufacture and retail, as well as gemstone wholesale, retail, and export. It has a 35-member executive committee and committees on lapidary, jewelry, gemstones, and marketing. Funding is provided through membership dues and subscription fees. Co-funding is being sought through earmarking a part of the “cess” (export tax) on exports of gems and jewelry.
The SLGJA executive committee meets on the last Thursday of every month and each subcommittee reports on activities. In August 2005, Chanaka Ellawala was elected chairman. Vice presidents elected were Sheriff Rahuman, gem sector; Ismeth Majeed, jewelry; Donald Perera, lapidary; and Macky Hashim, promotions/trade fairs. The industry portal Lanka Jewels (www.lankajewels.com) is used for promotional and informative purposes.
INDUSTRY COMPETITIVENESS The world gemstone and jewelry market is estimated to be US$170 billion. The principal markets for jewelry are the United States, Japan, Italy, the United Kingdom, Germany, and France. The size of the U.S. market is estimated to be US$48 billion, Japan US$30 billion, and Europe US$30 billion.
Sri Lankan Exports and Export Destinations Sri Lanka’s gem and jewelry exports increased 35 percent to US$135 million in 2006 from $100 million in 2001. Most of the growth came in the form of gem exports, which grew from $81 million in 2001 to $119 in 2006. Jewelry exports actually declined slightly from $18.6 million in 2001 to $15.6 million in 2006. In 2004, the last year before the tsunami and re-escalation of civil

32 T C P F I N A L R E P O R T
conflict, Sri Lanka exported $18.7 million in jewelry. The United States—where spending on jewelry correlates closely with GDP growth and even more so with discretionary spending— remains the main destination for Sri Lanka’s gem and jewelry exports.
Exhibit 5-1 Gem & Jewelry Sector Snapshot
1995 2001 2006
Exports (US$ million) 104.20 100.02 134.73
Type of Employment Official (apprx.)
Unofficial (apprx.) Total 2001
Gem mining 85,000 20,000 105,000
Gem cutting, incl. diamond cutting 20,000 --- 20,000
Gem dealers 3,200 5,000 8,200
Heat treatment 200 --- 200
Jewelry manufacturing 18,000 5,000 23,000
Gemologists 350 --- 350
Total 126,750 30,000 156,750
SOURCE Sectoral Plan for the Gem & Jewellery Industry, Ministry of Enterprise Development, 2002.
• Value chain: Mining, heat treatment, gemstone and jewelry manufacture, retailers
• Share of global market : 0.07 percent of US$170 billion (est.)
• Main importers: United States, Europe, Japan
• Main competitors: Thailand, Madagascar, India
• Cluster: Sri Lanka Gem & Jewellery Association
• Competitiveness challenge: Lack of investment in adding value
• Key counterpart ministry: Ministry of Enterprise Development and Investment Promotion
• Est. % women employed: 6%, mainly in diamond and some gem-cutting companies
• Est. % rural employment: 70%
• Key geographical areas: Main mining areas are Ratnapura, Pelmadulla, Balangoda, Eleliyagoda, Kalawanna and Nivitigala in
the Sabaragamuwa Province. In addition Elehera in the Polunnaruwa District. Manufacture and trading are mainly in Ratnapura,
Colombo, Kandy, Galle and Beruwela.
Geographic Distribution Up to 90 percent of Sri Lanka land area may be gem-bearing, though this estimate has not been confirmed by any scientific geological survey. The gem belt is 80 miles long and 20 miles wide southwest of “upcountry,” a central region whose ridged hills are considered classic formations for the generation of gemstones. Other gem-producing pockets lie downstream on rivers running from the ridges. With more than 50 of 80 known gemstones, Sri Lanka may be one of the world’s largest gemstone repositories, second only to Brazil. The main mining areas are Ratnapura, Pelmadulla, Balangoda, Eleliyagoda, Kalawanna, and Nivitigala in the Sabaragamuwa Province. Manufacture and trading are mainly in and around Ratnapura, Colombo, Kandy, Galle, and
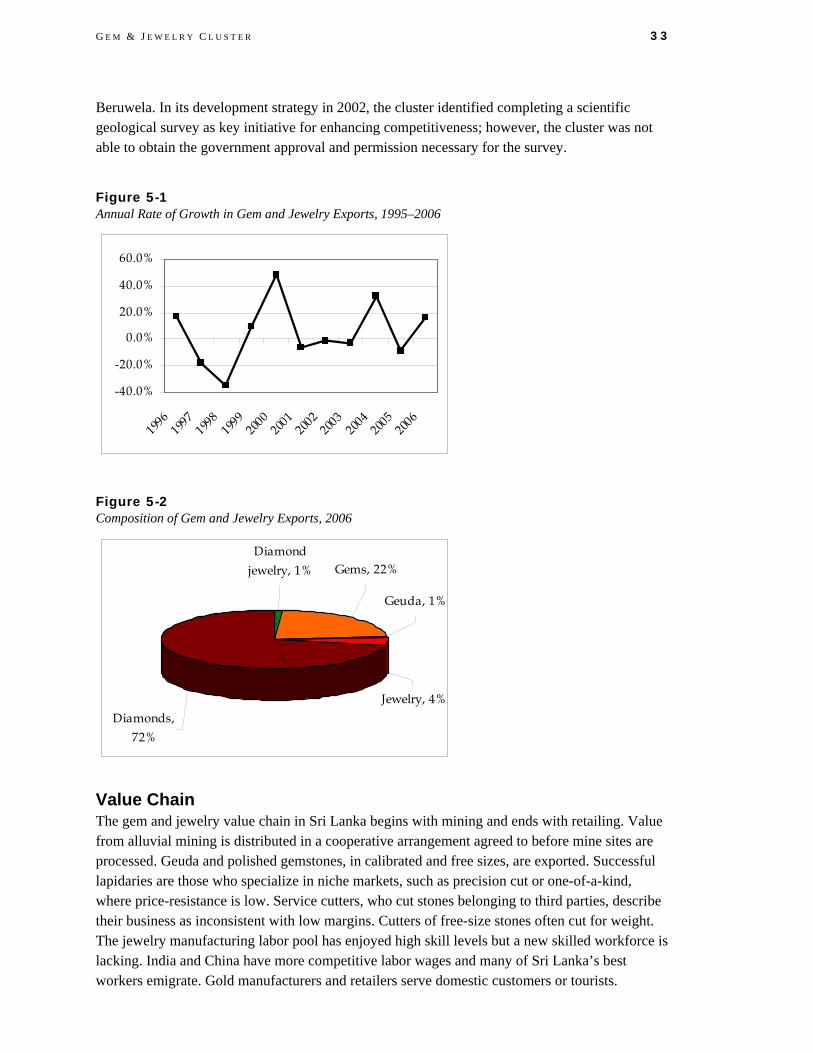
G E M & J E W E L R Y C L U S T E R 33
Beruwela. In its development strategy in 2002, the cluster identified completing a scientific geological survey as key initiative for enhancing competitiveness; however, the cluster was not able to obtain the government approval and permission necessary for the survey.
Figure 5-1 Annual Rate of Growth in Gem and Jewelry Exports, 1995–2006
-40.0%
-20.0%
0.0%
20.0%
40.0%
60.0%
1996
1997
1998
1999
2000
2001
2002
2003
2004
2005
2006
Figure 5-2 Composition of Gem and Jewelry Exports, 2006
Geuda, 1%
Gems, 22%
Jewelry, 4%Diamonds,
72%
Diamond jewelry, 1%
\
Value Chain The gem and jewelry value chain in Sri Lanka begins with mining and ends with retailing. Value from alluvial mining is distributed in a cooperative arrangement agreed to before mine sites are processed. Geuda and polished gemstones, in calibrated and free sizes, are exported. Successful lapidaries are those who specialize in niche markets, such as precision cut or one-of-a-kind, where price-resistance is low. Service cutters, who cut stones belonging to third parties, describe their business as inconsistent with low margins. Cutters of free-size stones often cut for weight. The jewelry manufacturing labor pool has enjoyed high skill levels but a new skilled workforce is lacking. India and China have more competitive labor wages and many of Sri Lanka’s best workers emigrate. Gold manufacturers and retailers serve domestic customers or tourists.
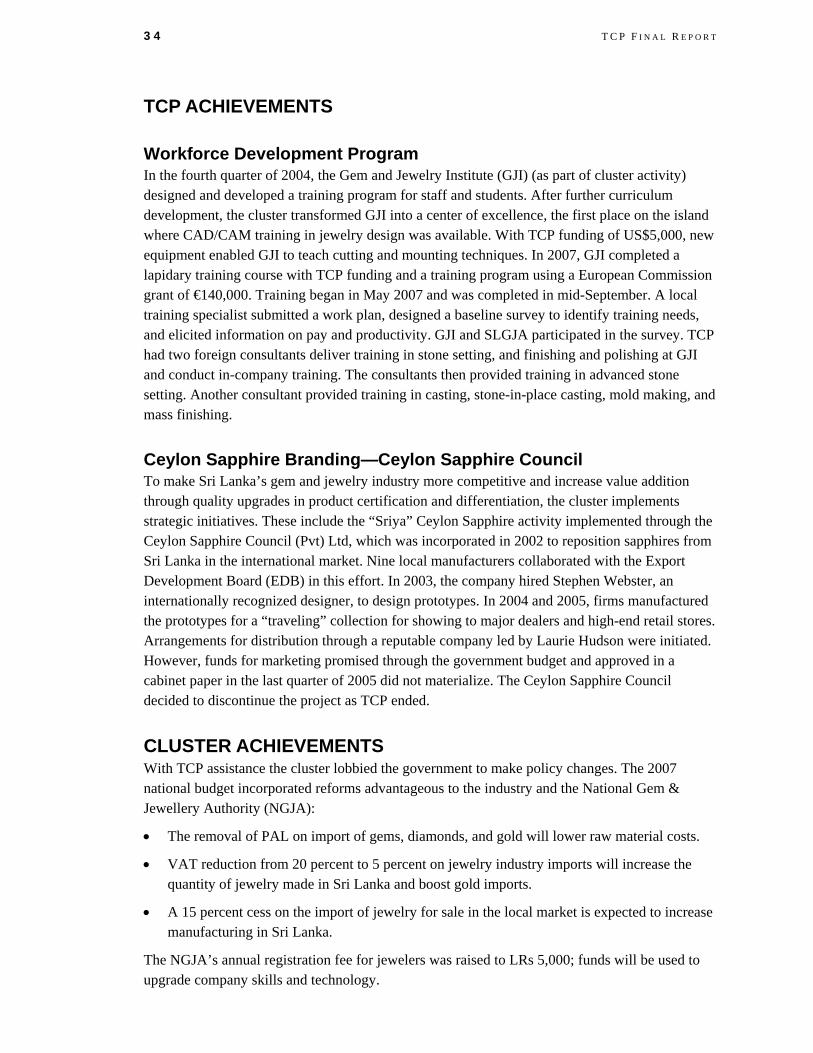
34 T C P F I N A L R E P O R T
TCP ACHIEVEMENTS
Workforce Development Program In the fourth quarter of 2004, the Gem and Jewelry Institute (GJI) (as part of cluster activity) designed and developed a training program for staff and students. After further curriculum development, the cluster transformed GJI into a center of excellence, the first place on the island where CAD/CAM training in jewelry design was available. With TCP funding of US$5,000, new equipment enabled GJI to teach cutting and mounting techniques. In 2007, GJI completed a lapidary training course with TCP funding and a training program using a European Commission grant of €140,000. Training began in May 2007 and was completed in mid-September. A local training specialist submitted a work plan, designed a baseline survey to identify training needs, and elicited information on pay and productivity. GJI and SLGJA participated in the survey. TCP had two foreign consultants deliver training in stone setting, and finishing and polishing at GJI and conduct in-company training. The consultants then provided training in advanced stone setting. Another consultant provided training in casting, stone-in-place casting, mold making, and mass finishing.
Ceylon Sapphire Branding—Ceylon Sapphire Council To make Sri Lanka’s gem and jewelry industry more competitive and increase value addition through quality upgrades in product certification and differentiation, the cluster implements strategic initiatives. These include the “Sriya” Ceylon Sapphire activity implemented through the Ceylon Sapphire Council (Pvt) Ltd, which was incorporated in 2002 to reposition sapphires from Sri Lanka in the international market. Nine local manufacturers collaborated with the Export Development Board (EDB) in this effort. In 2003, the company hired Stephen Webster, an internationally recognized designer, to design prototypes. In 2004 and 2005, firms manufactured the prototypes for a “traveling” collection for showing to major dealers and high-end retail stores. Arrangements for distribution through a reputable company led by Laurie Hudson were initiated. However, funds for marketing promised through the government budget and approved in a cabinet paper in the last quarter of 2005 did not materialize. The Ceylon Sapphire Council decided to discontinue the project as TCP ended.
CLUSTER ACHIEVEMENTS With TCP assistance the cluster lobbied the government to make policy changes. The 2007 national budget incorporated reforms advantageous to the industry and the National Gem & Jewellery Authority (NGJA):
• The removal of PAL on import of gems, diamonds, and gold will lower raw material costs.
• VAT reduction from 20 percent to 5 percent on jewelry industry imports will increase the quantity of jewelry made in Sri Lanka and boost gold imports.
• A 15 percent cess on the import of jewelry for sale in the local market is expected to increase manufacturing in Sri Lanka.
The NGJA’s annual registration fee for jewelers was raised to LRs 5,000; funds will be used to upgrade company skills and technology.
G E M & J E W E L R Y C L U S T E R 35
SMALL GRANTS
Grant to Develop Facets Sri Lanka In April 2005, SLGJA submitted a proposal to TCP’s small grants program requesting assistance to build showcases and tables in time for Facets, an annual trade fair scheduled for August 31. The cost of the project was estimated at US$56,500; the grant agreement of July 14 awarded SLGJA US$42,375. That year the fair changed location, had more exhibitors, and was better advertised. The number of booths increased 43 percent to 150; SLGJA planned to have 200 booths in 2006. Performance indicators show a significant increase in all areas (e.g., exhibitor participation, wider value chain representation, number of local and foreign trade and non-trade visitors, and a significant increase in publicity). Exports of gems and jewelry also increased by 8 percent (US$550,000) and 15 percent (US$157,500), respectively.
Gem & Jewelry Institute Lapidary Training In March 2007, USAID approved a grant for GJI to train 20 people in lapidary and institute a revolving fund for training. GJI had prepared the project and recruited trainees. It sought unemployed persons from underprivileged families in disadvantaged districts who had studied up to the General Certificate of Education-Ordinary Level (GCE-O/L). Trainees were to fulfill a mandatory period of internship with two lapidaries who had expressed interest in employing them. The immediate objective was to train 20 school leavers in lapidary; the long-term objective was to promote lapidary as a viable employment path among youth and school leavers by meeting local and foreign demand for trained lapidaries and to deliver intermediate and advanced training to industry workers to meet their need for continuous professional education.
The three-month program began on March 28 with 16 students. The estimated cost was US$18,539. TCP provided 75 percent, or US$12,495; recipients provided the balance of US$6,044. Training ended in June; the final number trained was 10. All 10 were absorbed for employment by a gem cutting company and agreements were signed with them. Owing to the success of the program, GJI used internal funds to begin a second training program
RURAL IMPACT The SLGJA’s Tsunami Relief committee raised US$40,000. From mid-February to the end of March, a local consultant hired through TCP assessed damage to gem and jewelry companies. Of the 171 companies along the coastal belt that registered damages, the consultant contacted 131. These companies employed approximately 763 people, 351 of whom lost their jobs because of the tsunami. These companies provided for 1,126 families. After three focus group meetings in Galle, Beruwela, and Colombo, the consultant circulated to the EDB, NGJA, and the SLGJA an action plan for restoring livelihoods. Meetings were also held with REVIVE (the tsunami assistance program set up by TCP) to decide on funding for the affected groups and the SLGJA worked with REVIVE and other donors to distribute the funds.

36 T C P F I N A L R E P O R T
Figure 5-3 Gem and Jewelry Training
INDUSTRY LEADERS’ OPINIONS ABOUT TCP Executives involved in TCP activities were surveyed in 2005, 2006, and 2007 for their opinion on how TCP had affected their industries. Executives were asked to respond on a scale of 1-7, with 1 expressing a negative opinion and 7 a positive opinion. The scores are the weighted average of responses to all questions dealing with a particular topic. A “mean score” above 3.5 indicates that—on balance—respondents answered the question or questions in that topic area with scores in the favorable or positive range. Table 5-1 presents some key questions relevant to the gem and jewelry sector; more survey extracts are presented in Appendix G.
Table 5-1 Executive Opinion Survey, Gem & Jewelry Cluster
No. from Survey Questions
Mean Score
(1-7 scale)
11.02 Has your involvement in your industry cluster helped to improve the competitiveness of your firm?
4.9
11.05 Has your involvement in your industry cluster helped you to invest in your firm's training needs? 4.9
11.06 Has your involvement in your industry cluster helped you to influence government policies that adversely affect you company's competitiveness?
5.2
12.01-E In the past three years your company has invested significantly in entering new markets or developing new products
4.9
13.01 How involved were you in forming the industry cluster's apex body or lead organization 5.2
13.02 How actively do you participate in developing or implementing cluster initiatives 5.0
13.04 When TCP ends, will you continue to participate in cluster activities? 5.7
11.08 How much if any improvement in your firm's sales/export performance would you attribute to TCP/Cluster activities (please indicate an estimated percentage value)
23%
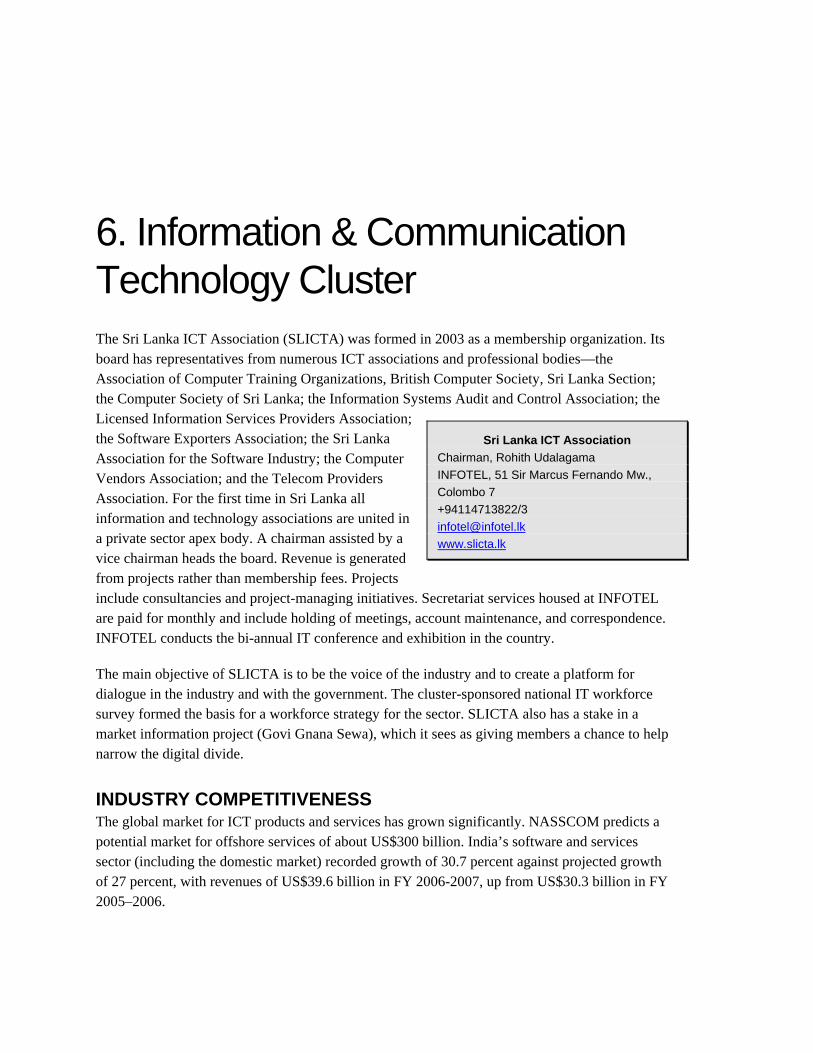
6. Information & Communication Technology Cluster The Sri Lanka ICT Association (SLICTA) was formed in 2003 as a membership organization. Its board has representatives from numerous ICT associations and professional bodies—the Association of Computer Training Organizations, British Computer Society, Sri Lanka Section; the Computer Society of Sri Lanka; the Information Systems Audit and Control Association; the Licensed Information Services Providers Association; the Software Exporters Association; the Sri Lanka Association for the Software Industry; the Computer Vendors Association; and the Telecom Providers Association. For the first time in Sri Lanka all information and technology associations are united in a private sector apex body. A chairman assisted by a vice chairman heads the board. Revenue is generated from projects rather than membership fees. Projects include consultancies and project-managing initiatives. Secretariat services housed at INFOTEL are paid for monthly and include holding of meetings, account maintenance, and correspondence. INFOTEL conducts the bi-annual IT conference and exhibition in the country.
Sri Lanka ICT Association Chairman, Rohith Udalagama INFOTEL, 51 Sir Marcus Fernando Mw., Colombo 7 +94114713822/3 [email protected] www.slicta.lk
The main objective of SLICTA is to be the voice of the industry and to create a platform for dialogue in the industry and with the government. The cluster-sponsored national IT workforce survey formed the basis for a workforce strategy for the sector. SLICTA also has a stake in a market information project (Govi Gnana Sewa), which it sees as giving members a chance to help narrow the digital divide.
INDUSTRY COMPETITIVENESS The global market for ICT products and services has grown significantly. NASSCOM predicts a potential market for offshore services of about US$300 billion. India’s software and services sector (including the domestic market) recorded growth of 30.7 percent against projected growth of 27 percent, with revenues of US$39.6 billion in FY 2006-2007, up from US$30.3 billion in FY 2005–2006.
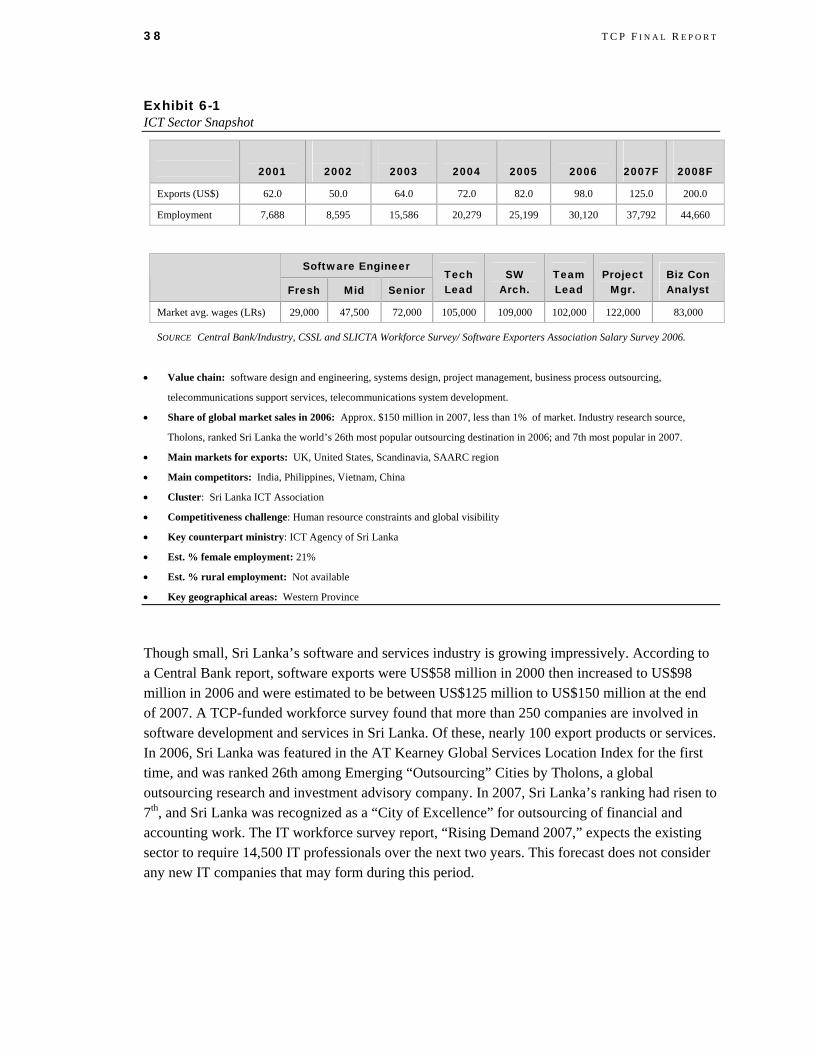
38 T C P F I N A L R E P O R T
Exhibit 6-1 ICT Sector Snapshot
2001
2002
2003
2004
2005
2006
2007F
2008F
Exports (US$) 62.0 50.0 64.0 72.0 82.0 98.0 125.0 200.0
Employment 7,688 8,595 15,586 20,279 25,199 30,120 37,792 44,660
Software Engineer
Fresh Mid Senior Tech Lead
SW Arch.
Team Lead
Project Mgr.
Biz Con Analyst
Market avg. wages (LRs) 29,000 47,500 72,000 105,000 109,000 102,000 122,000 83,000
SOURCE Central Bank/Industry, CSSL and SLICTA Workforce Survey/ Software Exporters Association Salary Survey 2006.
• Value chain: software design and engineering, systems design, project management, business process outsourcing,
telecommunications support services, telecommunications system development.
• Share of global market sales in 2006: Approx. $150 million in 2007, less than 1% of market. Industry research source,
Tholons, ranked Sri Lanka the world’s 26th most popular outsourcing destination in 2006; and 7th most popular in 2007.
• Main markets for exports: UK, United States, Scandinavia, SAARC region
• Main competitors: India, Philippines, Vietnam, China
• Cluster: Sri Lanka ICT Association
• Competitiveness challenge: Human resource constraints and global visibility
• Key counterpart ministry: ICT Agency of Sri Lanka
• Est. % female employment: 21%
• Est. % rural employment: Not available
• Key geographical areas: Western Province
Though small, Sri Lanka’s software and services industry is growing impressively. According to a Central Bank report, software exports were US$58 million in 2000 then increased to US$98 million in 2006 and were estimated to be between US$125 million to US$150 million at the end of 2007. A TCP-funded workforce survey found that more than 250 companies are involved in software development and services in Sri Lanka. Of these, nearly 100 export products or services. In 2006, Sri Lanka was featured in the AT Kearney Global Services Location Index for the first time, and was ranked 26th among Emerging “Outsourcing” Cities by Tholons, a global outsourcing research and investment advisory company. In 2007, Sri Lanka’s ranking had risen to 7th, and Sri Lanka was recognized as a “City of Excellence” for outsourcing of financial and accounting work. The IT workforce survey report, “Rising Demand 2007,” expects the existing sector to require 14,500 IT professionals over the next two years. This forecast does not consider any new IT companies that may form during this period.
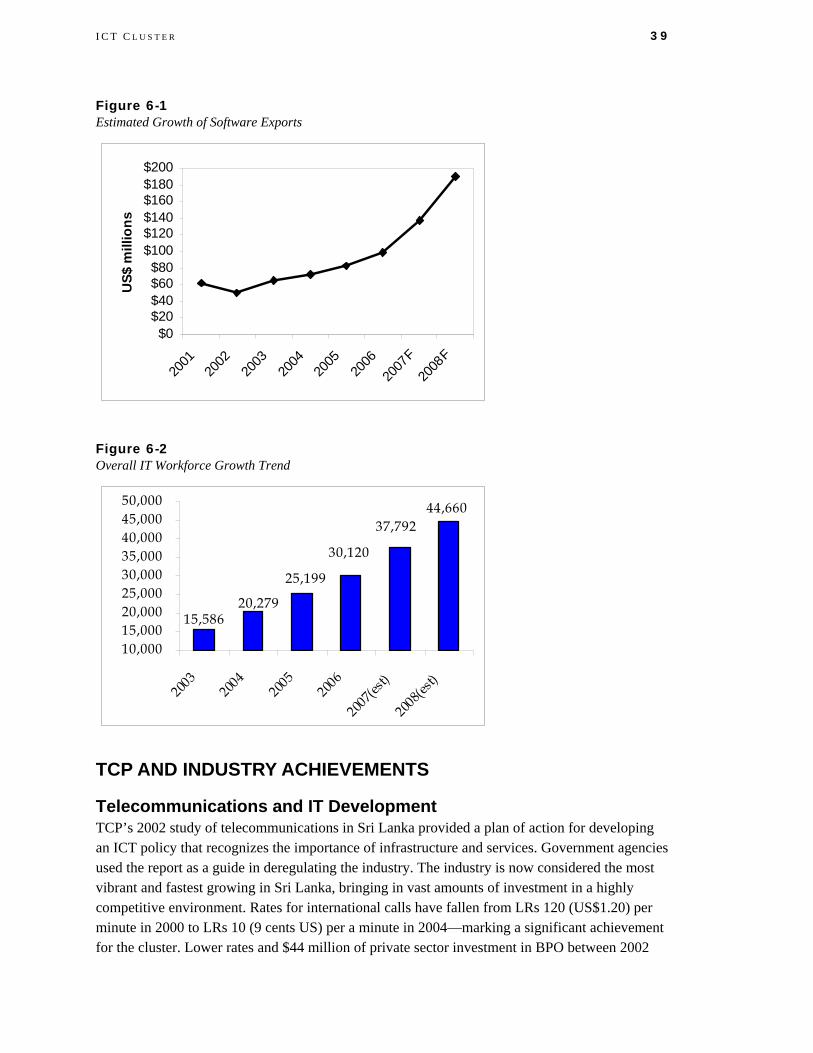
I C T C L U S T E R 39
Figure 6-1 Estimated Growth of Software Exports
$0$20$40$60$80
$100$120$140$160$180$200
2001
2002
2003
2004
2005
2006
2007
F20
08F
US$
mill
ions
Figure 6-2 Overall IT Workforce Growth Trend
15,58620,279
25,199
30,120
37,79244,660
10,00015,00020,00025,00030,00035,00040,00045,00050,000
2003
2004
2005
2006
2007(e
st)
2008(e
st)
TCP AND INDUSTRY ACHIEVEMENTS
Telecommunications and IT Development TCP’s 2002 study of telecommunications in Sri Lanka provided a plan of action for developing an ICT policy that recognizes the importance of infrastructure and services. Government agencies used the report as a guide in deregulating the industry. The industry is now considered the most vibrant and fastest growing in Sri Lanka, bringing in vast amounts of investment in a highly competitive environment. Rates for international calls have fallen from LRs 120 (US$1.20) per minute in 2000 to LRs 10 (9 cents US) per a minute in 2004—marking a significant achievement for the cluster. Lower rates and $44 million of private sector investment in BPO between 2002
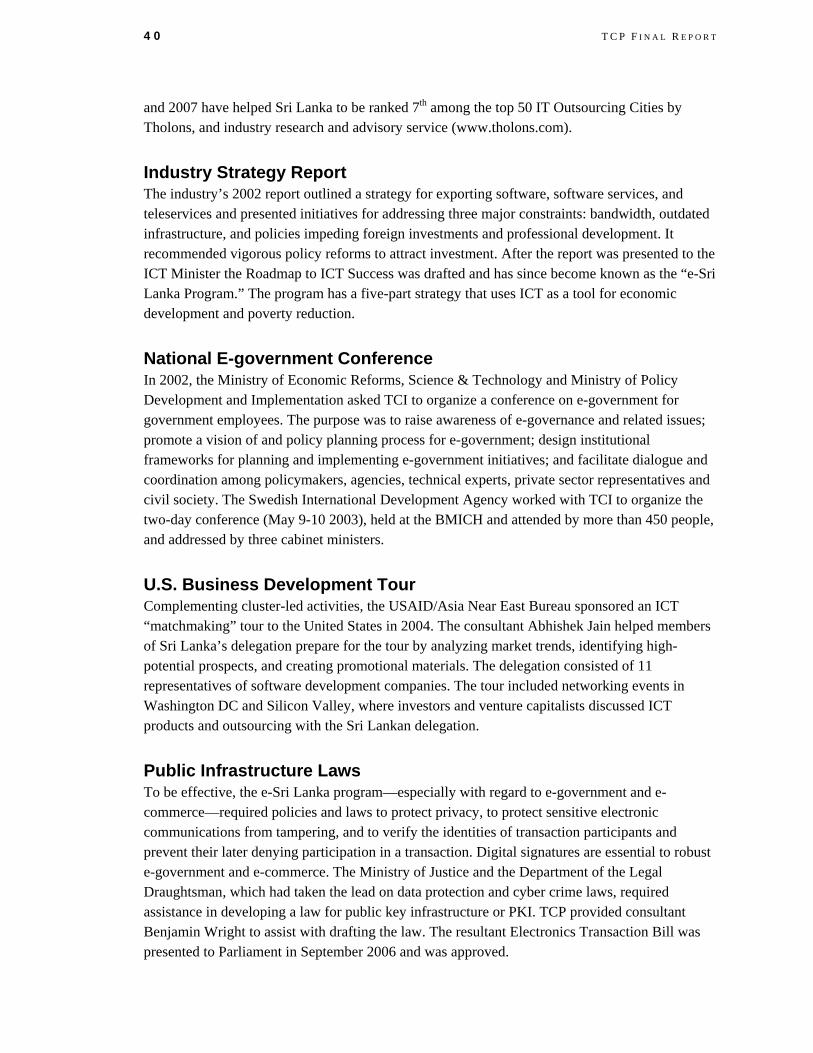
40 T C P F I N A L R E P O R T
and 2007 have helped Sri Lanka to be ranked 7th among the top 50 IT Outsourcing Cities by Tholons, and industry research and advisory service (www.tholons.com).
Industry Strategy Report The industry’s 2002 report outlined a strategy for exporting software, software services, and teleservices and presented initiatives for addressing three major constraints: bandwidth, outdated infrastructure, and policies impeding foreign investments and professional development. It recommended vigorous policy reforms to attract investment. After the report was presented to the ICT Minister the Roadmap to ICT Success was drafted and has since become known as the “e-Sri Lanka Program.” The program has a five-part strategy that uses ICT as a tool for economic development and poverty reduction.
National E-government Conference In 2002, the Ministry of Economic Reforms, Science & Technology and Ministry of Policy Development and Implementation asked TCI to organize a conference on e-government for government employees. The purpose was to raise awareness of e-governance and related issues; promote a vision of and policy planning process for e-government; design institutional frameworks for planning and implementing e-government initiatives; and facilitate dialogue and coordination among policymakers, agencies, technical experts, private sector representatives and civil society. The Swedish International Development Agency worked with TCI to organize the two-day conference (May 9-10 2003), held at the BMICH and attended by more than 450 people, and addressed by three cabinet ministers.
U.S. Business Development Tour Complementing cluster-led activities, the USAID/Asia Near East Bureau sponsored an ICT “matchmaking” tour to the United States in 2004. The consultant Abhishek Jain helped members of Sri Lanka’s delegation prepare for the tour by analyzing market trends, identifying high-potential prospects, and creating promotional materials. The delegation consisted of 11 representatives of software development companies. The tour included networking events in Washington DC and Silicon Valley, where investors and venture capitalists discussed ICT products and outsourcing with the Sri Lankan delegation.
Public Infrastructure Laws To be effective, the e-Sri Lanka program—especially with regard to e-government and e-commerce—required policies and laws to protect privacy, to protect sensitive electronic communications from tampering, and to verify the identities of transaction participants and prevent their later denying participation in a transaction. Digital signatures are essential to robust e-government and e-commerce. The Ministry of Justice and the Department of the Legal Draughtsman, which had taken the lead on data protection and cyber crime laws, required assistance in developing a law for public key infrastructure or PKI. TCP provided consultant Benjamin Wright to assist with drafting the law. The resultant Electronics Transaction Bill was presented to Parliament in September 2006 and was approved.

I C T C L U S T E R 41
National IT Workforce Surveys The World Information Technology and Services Alliance (WITSA) and SLICTA, a member of WITSA, both wanted to improve the skills of IT professionals in Sri Lanka by better aligning training with industry demand. In 2004, SLICTA conducted its first IT workforce survey. The survey report, Geared for Growth (February 2005), documented the structure of demand for labor in ICT for the first time so that universities and other IT training institutions could improve their offerings, students could make better course selections, and graduates could have better prospects for employment. SLICTA, TCP, and the Information and Communication Technology Agency released a second survey—“Rising Demand”—on April 27, 2006.
Figure 6-3 Launch of the National IT Workforce Survey
Rapid IT Conversion Program According to Geared for Growth, demand for IT workers exceeded supply and university graduates were considered unemployable because they lacked skills in presentation, communication, and English language. In 2004, TCP provided a consultant to develop the “Rapid IT Conversion Program” with the cluster and the University of Moratuwa. Created as a pilot program, it was devised to bridge the gap between ICT labor supply and demand by taking university graduates in other skill areas and preparing them for work in the IT industry. The program consisted of a set of training programs, each 4 months long and entailing at least 600 hours of intensive study and practice in IT topics as well as communication, leadership, and English language. Trainees were selected on the basis of aptitude tests and interviews with ICT industry representatives. The IT faculty of the University of Moratuwa assisted by the ICT industry conducted the pilot program; 18 non-IT graduates completed the course and found gainful employment in both the IT and non-IT sectors. The industry provided 12 scholarships and the USAID-funded REVIVE project sponsored 5 tsunami-affected students.
42 T C P F I N A L R E P O R T
Govi Gnana Sewa Project The Govi Gnana Seva (“farmer knowledge service”) market information project provides farmers with accurate and timely information through a simple price capture and dissemination system using 8 x 6 projector screens at various points in the Dambulla Dedicated Economic Center (DDEC). These screens present the daily low and high prices for all produce sold at the market and the “going” price. Data are provided live on the Internet and converted to voice so that they are also available via telephone. The project was piloted under the e-Sri Lanka program funded by the ICT Agency. TCP scaled the project up to the demonstration stage and extended its reach into remote villages via radio and telephone. TCP then assisted with a technical assessment of the data system and devised a business plan to sustain the project. DDEC Trust, SLICTA, Lanka Communication Services, Sewa Lanka Foundation, and Dr. Harsha De Silva signed an MOU in October 2007 to execute Phase 1 of the business plan. The partners have retained a lawyer to draw up a Memorandum and Articles of Association and register the not-for-profit company as recommended in the plan.
Export Strategy Evolution The ICT cluster’s competitiveness strategy report identified three initiatives to increase exports: centers of excellence, virtual business incubators, and a world-class policy environment. Of these, only pursuit of a superior policy environment—a core task of SLICTA—has had impact. The industry then set a goal of becoming a US$1 billion industry by 2012. Reaching that goal required a repositioning strategy and an aggressive action plan. Three strategic initiatives were articulated: raise visibility (including market access and support), develop human resources, and improve infrastructure. An action program was also recommended. With TCP assistance, the industry has developed a brand strategy to increase visibility and a workforce strategy to increase the number of skilled workers.
C-Level Summit To support the industry’s branding strategy, TCP sponsored the participation of Sri Lankan ICT companies at the C-Level summit near Washington DC, June 13–15, 2006. C-Level is a business networking organization of CEOs, CFOs, CTOs, CIOs, and other "C-Level" and senior executives. Six Sri Lankan software development companies participated; representatives of two of the companies were based in the United States. Four secured business potentially worth US$200,000. The summit exposed SMEs to market trends, emerging technologies, and top tier U.S. companies. The representatives learned that most companies are looking for a U.S. presence and reference sites and are interested in security products and services, outsourcing, and business process outsourcing (BPO) services.
Software and Services Marketing Plan TCP provided a marketing expert to work with the firms in Sri Lanka on developing a branding and marketing strategy and a marketing action plan to promote Sri Lanka as premier location for software services. The strategy called for branding Sri Lanka’s software and services industry and using the brand in a multimedia campaign to reach multiple targets in the United States and Europe. The committee selected the TBWA/TAL, a public relations firm, to assist with marketing communications and selected the United Kingdom as the test market. The committee is finalizing
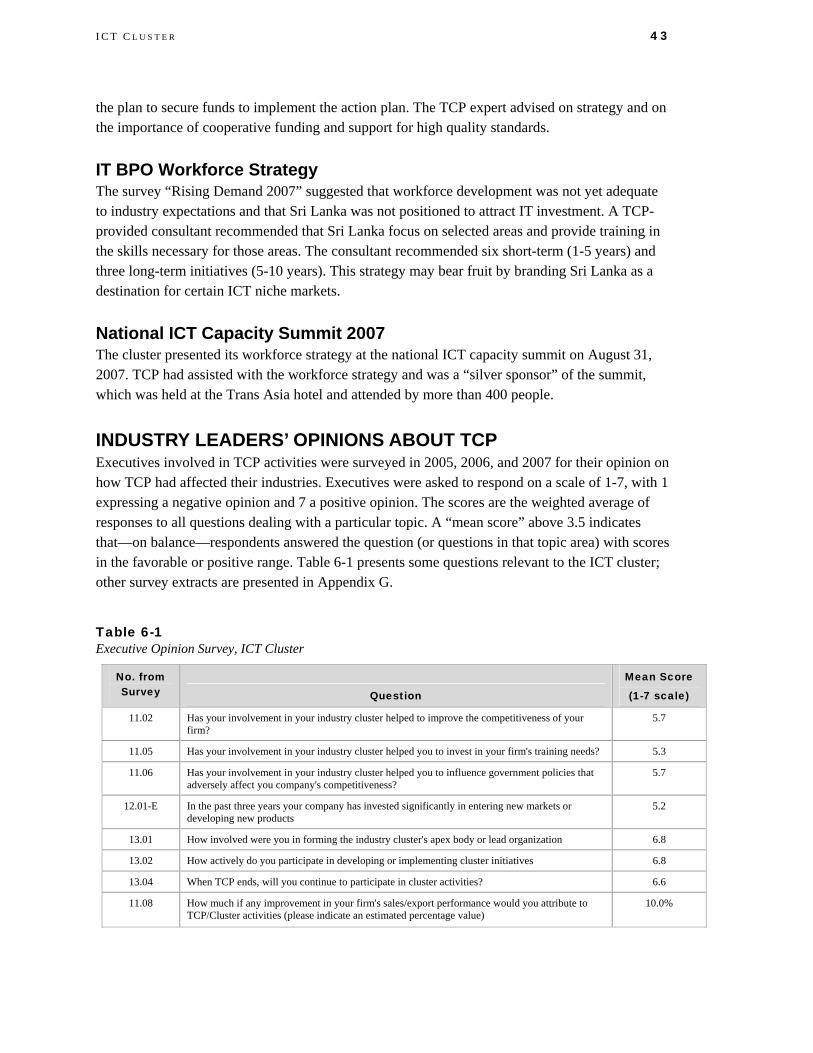
I C T C L U S T E R 43
the plan to secure funds to implement the action plan. The TCP expert advised on strategy and on the importance of cooperative funding and support for high quality standards.
IT BPO Workforce Strategy The survey “Rising Demand 2007” suggested that workforce development was not yet adequate to industry expectations and that Sri Lanka was not positioned to attract IT investment. A TCP-provided consultant recommended that Sri Lanka focus on selected areas and provide training in the skills necessary for those areas. The consultant recommended six short-term (1-5 years) and three long-term initiatives (5-10 years). This strategy may bear fruit by branding Sri Lanka as a destination for certain ICT niche markets.
National ICT Capacity Summit 2007 The cluster presented its workforce strategy at the national ICT capacity summit on August 31, 2007. TCP had assisted with the workforce strategy and was a “silver sponsor” of the summit, which was held at the Trans Asia hotel and attended by more than 400 people.
INDUSTRY LEADERS’ OPINIONS ABOUT TCP Executives involved in TCP activities were surveyed in 2005, 2006, and 2007 for their opinion on how TCP had affected their industries. Executives were asked to respond on a scale of 1-7, with 1 expressing a negative opinion and 7 a positive opinion. The scores are the weighted average of responses to all questions dealing with a particular topic. A “mean score” above 3.5 indicates that—on balance—respondents answered the question (or questions in that topic area) with scores in the favorable or positive range. Table 6-1 presents some questions relevant to the ICT cluster; other survey extracts are presented in Appendix G.
Table 6-1 Executive Opinion Survey, ICT Cluster
No. from Survey Question
Mean Score
(1-7 scale)
11.02 Has your involvement in your industry cluster helped to improve the competitiveness of your firm?
5.7
11.05 Has your involvement in your industry cluster helped you to invest in your firm's training needs? 5.3
11.06 Has your involvement in your industry cluster helped you to influence government policies that adversely affect you company's competitiveness?
5.7
12.01-E In the past three years your company has invested significantly in entering new markets or developing new products
5.2
13.01 How involved were you in forming the industry cluster's apex body or lead organization 6.8
13.02 How actively do you participate in developing or implementing cluster initiatives 6.8
13.04 When TCP ends, will you continue to participate in cluster activities? 6.6
11.08 How much if any improvement in your firm's sales/export performance would you attribute to TCP/Cluster activities (please indicate an estimated percentage value)
10.0%

7. Rubber Cluster With TCP assistance, the rubber industry incorporated the Sri Lanka Society of Rubber Industry (SRI) a limited liability company under the Companies Act on July 20, 2004. As successor to the Rubber Cluster Steering Committee formed in December 1999, SRI is now the apex body of the industry, bringing together associations and professional bodies that had been working in isolation. Founding members are the Plastics and Rubber Institute of Sri Lanka (PRI), the Sri Lanka Association of Manufacturers and Exporters of Rubber Products (SLAMERP), the Colombo Rubber Traders’ Association (CRTA), and the Planters’ Association of Ceylon (PA). These four associations represent the entire supply chain and value chain stakeholders.
SRI consists of general assembly, a policy formulation council (24 members including ex-officio), and an executive board. Board officers are Chairman Mr. W.T Ellawala, Mr. D.K. Rajapaksa, Mr. Tissa Jinasena, Mr. Ranjith Pieris (representing PA), Mr. Ananda Caldera (representing PRI), Mr. Zaheed (representing CRTA), and Mr. Anil Wickremeratne (representing SLAMERP). The current chairman and his office continue to support routine administrative functions and secretarial work. The board decided to levy a LRs10,000 membership fee from corporate members and a membership drive has begun.
Sri Lanka Society of Rubber Industry Chairman, Mr. W T Ellawala 36 D R Wijewardena Mawatha, Colombo 10 +94112325665, +94112323995 [email protected]
Decades of declining raw rubber outputs were making it difficult for rubber products manufacturing firms to obtain adequate supply in quantity and quality that they required. The industry coalesced around a plan to tackle the supply issue while pursuing higher value export products as world demand for natural rubber products grew.
INDUSTRY COMPETITIVENESS Sri Lanka’s rubber industry began in 1876 with the cultivation of Brazilian hevea trees. By the mid-1970s it was the world’s fourth largest rubber producer. Value addition began in 1945 with the rebuilding of tires. Liberal trade policies and government-sponsored FDI promotion spurred growth in the early 1980s, and since the 1990s the manufacturing sector has been on a fast path to growth and competitiveness. Sri Lanka leads the world in solid tire exports. Loadstar Ltd has a 26 percent global market share with a turnover exceeding US$250 million in 2006. Dipped Products Ltd is world’s third largest household rubber glove manufacturer. Sri Lanka’s global brands include Solideal, DPL, Ceat, AMW, ARPICO, DSI, and Lalans. Sri Lanka is famous for latex crepe rubber, the base for Lankaprene, the purest natural rubber product without allergy-causing
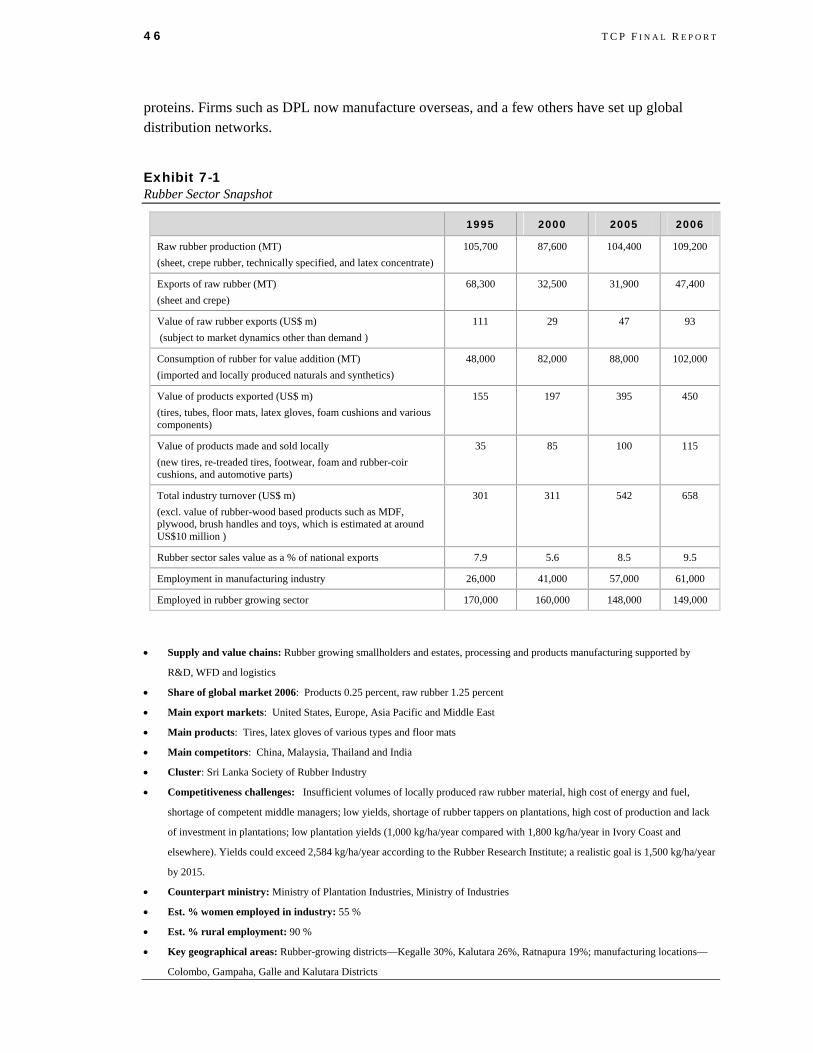
46 T C P F I N A L R E P O R T
proteins. Firms such as DPL now manufacture overseas, and a few others have set up global distribution networks.
Exhibit 7-1 Rubber Sector Snapshot
1995 2000 2005 2006
Raw rubber production (MT) (sheet, crepe rubber, technically specified, and latex concentrate)
105,700 87,600 104,400 109,200
Exports of raw rubber (MT) (sheet and crepe)
68,300 32,500 31,900 47,400
Value of raw rubber exports (US$ m) (subject to market dynamics other than demand )
111 29 47 93
Consumption of rubber for value addition (MT) (imported and locally produced naturals and synthetics)
48,000 82,000 88,000 102,000
Value of products exported (US$ m) (tires, tubes, floor mats, latex gloves, foam cushions and various components)
155 197 395 450
Value of products made and sold locally (new tires, re-treaded tires, footwear, foam and rubber-coir cushions, and automotive parts)
35 85 100 115
Total industry turnover (US$ m) (excl. value of rubber-wood based products such as MDF, plywood, brush handles and toys, which is estimated at around US$10 million )
301 311 542 658
Rubber sector sales value as a % of national exports 7.9 5.6 8.5 9.5
Employment in manufacturing industry 26,000 41,000 57,000 61,000
Employed in rubber growing sector 170,000 160,000 148,000 149,000
• Supply and value chains: Rubber growing smallholders and estates, processing and products manufacturing supported by
R&D, WFD and logistics
• Share of global market 2006: Products 0.25 percent, raw rubber 1.25 percent
• Main export markets: United States, Europe, Asia Pacific and Middle East
• Main products: Tires, latex gloves of various types and floor mats
• Main competitors: China, Malaysia, Thailand and India
• Cluster: Sri Lanka Society of Rubber Industry
• Competitiveness challenges: Insufficient volumes of locally produced raw rubber material, high cost of energy and fuel,
shortage of competent middle managers; low yields, shortage of rubber tappers on plantations, high cost of production and lack
of investment in plantations; low plantation yields (1,000 kg/ha/year compared with 1,800 kg/ha/year in Ivory Coast and
elsewhere). Yields could exceed 2,584 kg/ha/year according to the Rubber Research Institute; a realistic goal is 1,500 kg/ha/year
by 2015.
• Counterpart ministry: Ministry of Plantation Industries, Ministry of Industries
• Est. % women employed in industry: 55 %
• Est. % rural employment: 90 %
• Key geographical areas: Rubber-growing districts—Kegalle 30%, Kalutara 26%, Ratnapura 19%; manufacturing locations—
Colombo, Gampaha, Galle and Kalutara Districts

R U B B E R C L U S T E R 47
The rubber sector is composed of smallholders and small estates (65 percent) and regional plantation companies (35 percent). Together they produce 2.6 percent of Sri Lanka’s GDP, or US$658 million worth of natural latex and rubber products. The government has long been heavily involved in rubber production, providing subsidies to smallholders for new planting and replanting and overseeing the distribution of clonal material and inputs. The Ministry of Plantation Industries is responsible for policies on rubber cultivation and processing. No ministry is responsible specifically for policies affecting rubber manufacturing, but related policies are the responsibility of the Ministry of Industry principally.
The industry employs unskilled school leavers to trained graduates as needed. Plantation workers are less skilled and trained on the job. Universities produce polymer science graduates up to masters level and the private sector (PRI) conducts courses for supervisory level personnel. On the job training is the primary means of workforce development. Personnel trained overseas have graduate degrees.
Prices for rubber and rubber products increased markedly because of the formation of a cartel by the top four rubber producing countries (Indonesia, Malaysia, Thailand and now Vietnam), growing demand from China and the rise in cost of petroleum-based synthetic rubber. The target GDP for the rubber sector is US$1,000 million by 2010.
Prior to TCP, exports went from a negative 17 percent annual growth rate in raw rubber and 12 percent growth in rubber products to a 1 percent increase in raw rubber growth and 23 percent growth in rubber products. That increased rate of growth amounted to US$133 million in additional earnings for the sector. Growth factors included finding new markets, introducing new products, investing in plant and machinery, developing and disseminating new technology, and improving quality, branding, and workforce training.
Figure 7-1 Annual Rate of Growth in Rubber Exports
-20%
-10%
0%
10%
20%
30%
40%
1996
1997
1998
1999
2000
2001
2002
2003
2004
2005
2006
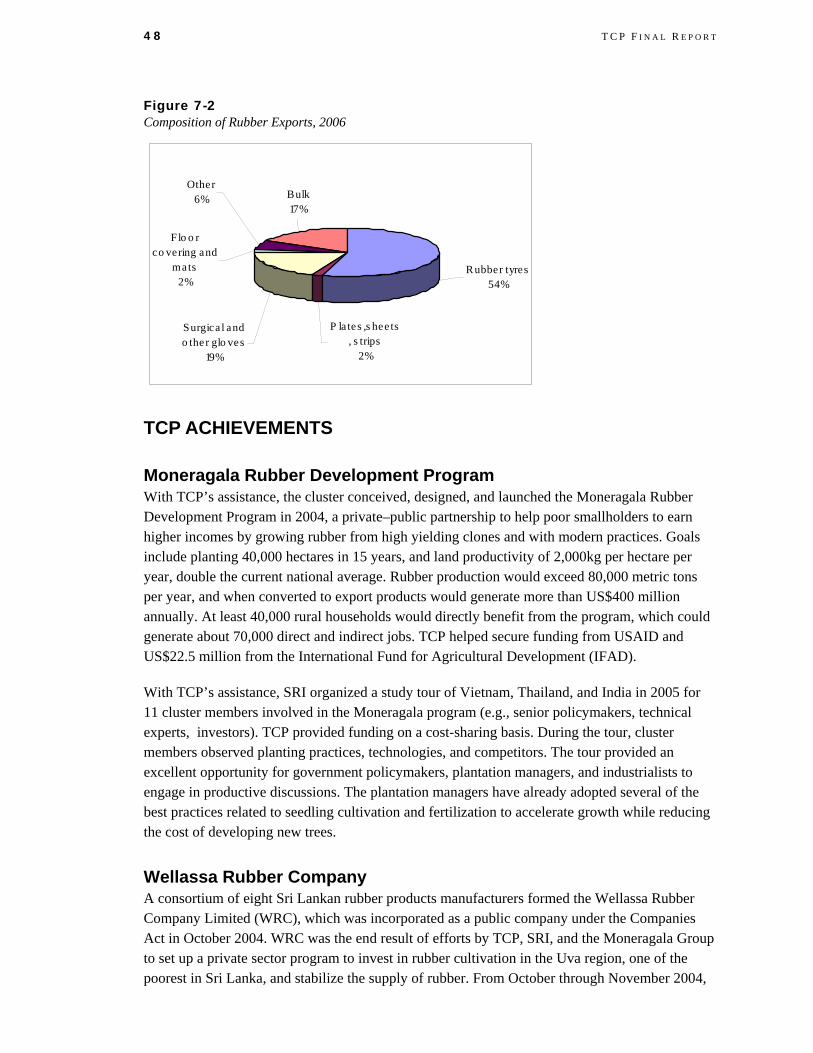
48 T C P F I N A L R E P O R T
Figure 7-2 Composition of Rubber Exports, 2006
Rubber tyres54%
P la tes ,s hee ts, s trips
2%
Surgica l and o the r glo ves
19%
Flo o r co vering and
mats2%
Other6% Bulk
17%
TCP ACHIEVEMENTS
Moneragala Rubber Development Program With TCP’s assistance, the cluster conceived, designed, and launched the Moneragala Rubber Development Program in 2004, a private–public partnership to help poor smallholders to earn higher incomes by growing rubber from high yielding clones and with modern practices. Goals include planting 40,000 hectares in 15 years, and land productivity of 2,000kg per hectare per year, double the current national average. Rubber production would exceed 80,000 metric tons per year, and when converted to export products would generate more than US$400 million annually. At least 40,000 rural households would directly benefit from the program, which could generate about 70,000 direct and indirect jobs. TCP helped secure funding from USAID and US$22.5 million from the International Fund for Agricultural Development (IFAD).
With TCP’s assistance, SRI organized a study tour of Vietnam, Thailand, and India in 2005 for 11 cluster members involved in the Moneragala program (e.g., senior policymakers, technical experts, investors). TCP provided funding on a cost-sharing basis. During the tour, cluster members observed planting practices, technologies, and competitors. The tour provided an excellent opportunity for government policymakers, plantation managers, and industrialists to engage in productive discussions. The plantation managers have already adopted several of the best practices related to seedling cultivation and fertilization to accelerate growth while reducing the cost of developing new trees.
Wellassa Rubber Company A consortium of eight Sri Lankan rubber products manufacturers formed the Wellassa Rubber Company Limited (WRC), which was incorporated as a public company under the Companies Act in October 2004. WRC was the end result of efforts by TCP, SRI, and the Moneragala Group to set up a private sector program to invest in rubber cultivation in the Uva region, one of the poorest in Sri Lanka, and stabilize the supply of rubber. From October through November 2004,

R U B B E R C L U S T E R 49
two local TCP consultants developed a one-year work plan and legal framework for the company. In December the state-owned Janatha Estates Development Board handed over 50 hectares to WRC for its nursery. Nursery work began in Moneragala on December 5, 2004. As TCP closed in November 2007, more than 695 hectares owned by 1,300 smallholders in the Moneragala district were cultivating 385,000 budded young rubber trees from high-yield variety seedlings grown by the WRC and the government nurseries in Moneragala. In five years these trees will reach maturity and produce income for the smallholders, followed by thousands of other smallholders who will receive seedlings in the next five years.
Figure 7-3 Wellassa Seedlings
Crepe Rubber Repositioning—Lankaprene Marketing The cluster decided to develop, promote, and market a specialty natural rubber based on conventional latex crepe rubber (LCR) as an industrial raw material capable of competing with certain grades of higher priced synthetic rubbers (poly isoprene). The cluster requested support from TCI. TCI provided short-term technical assistance to devise a business plan and other recommendations. Under the aegis of the Planters’ Association, an LCR group began implementing the recommendations, one of which was to name the new product “Lankaprene” (prene denotes a polymeric material).
Commercial goals for the Lankaprene program include increasing export volumes and raising average selling prices and profitability. Since a linkage tour in July 2003, trial orders have been shipped to selected consumers for application testing. Among them are product research firms and potential buyers. Consignments have been delivered at a premium of 25 percent over regular latex crepe prices. The Export Development Board (EDB) is assisting with marketing and negotiations are underway to identify other areas of assistance. The Rubber Research Institute of Sri Lanka is providing technological inputs.
In July 2004, the Planters’ Association of Ceylon, which represents the rubber-producing regional plantation companies, assumed responsibility for this initiative. In negotiating with U.S.

50 T C P F I N A L R E P O R T
consumers and agents, they will focus on modernizing facilities and laboratories for quality assurance and R&D. A major issue is setting up a reliable distribution scheme to assure consumers of consistent supplies. On May 26, 2005, Lankaprene Marketing Company Limited (LMC) was registered as a private company with eight regional plantation companies (RPCs) as shareholders. LMC has shipped several trial test quantities of “Lankaprene” to potential partners in the United States and is negotiating marketing, distribution and related matters with a U.S. agent.
RURAL IMPACT
Moneragala Rubber Development Program Of all TCP’s strategic initiatives, the Moneragala Rubber Development Program is having the most impact on rural areas. Since the program began in 2004, more than 2,000 families have become involved and more than 1,200 hectares have been brought under rubber cultivation. The government established two large rubber nurseries in Moneragala, Sri Lanka’s poorest district, and the private sector RRISL substation is being built. IFAD funds have been secured under the SPEnDP and project organizational structures are being established under the Ministry of Plantation Industries.
The goal is to develop 40,000 hectares of rubber smallholdings in Moneragala and the two adjoining districts of Badulla and Ampara. This would benefit about 60,000 peasant families, as well as rubber products manufacturers who need more rubber for value addition. Each hectare of rubber will generate about LRs 36,000 per month from latex sales over the trees’ 25-year lifespan if smallholders follow proper practices. Even if the project reaches only 50 percent of its target (20,000 hectares), total monthly incomes will exceed LRs 700 million. The economic impact of such income in a deprived region would be stunning—and benefits from manufacturing would be diverse and far-reaching.
SMALL GRANTS
Graduate Program in Rubber Technology The industry needs more technology graduates in order to sustain rapid export growth. PRISL received a grant from TCP’s small grants program in July 2007 to support its new graduate program (GradPRI) in rubber technology. TCP covered 75 percent of costs (LRs 2,549,243), providing technology textbooks and equipment, and PRISL covered 25 percent of costs (LRs 847,933). The first batch of 30 students had 5 females and the number of applicants was more than the planned intake. To sustain the program, PRISL is establishing an educational fund with contributions from private firms and is affiliating with the University of Akron, which has some of the world’s best rubber technology programs. GradPRI will also be sustained through scholarships and student fees.
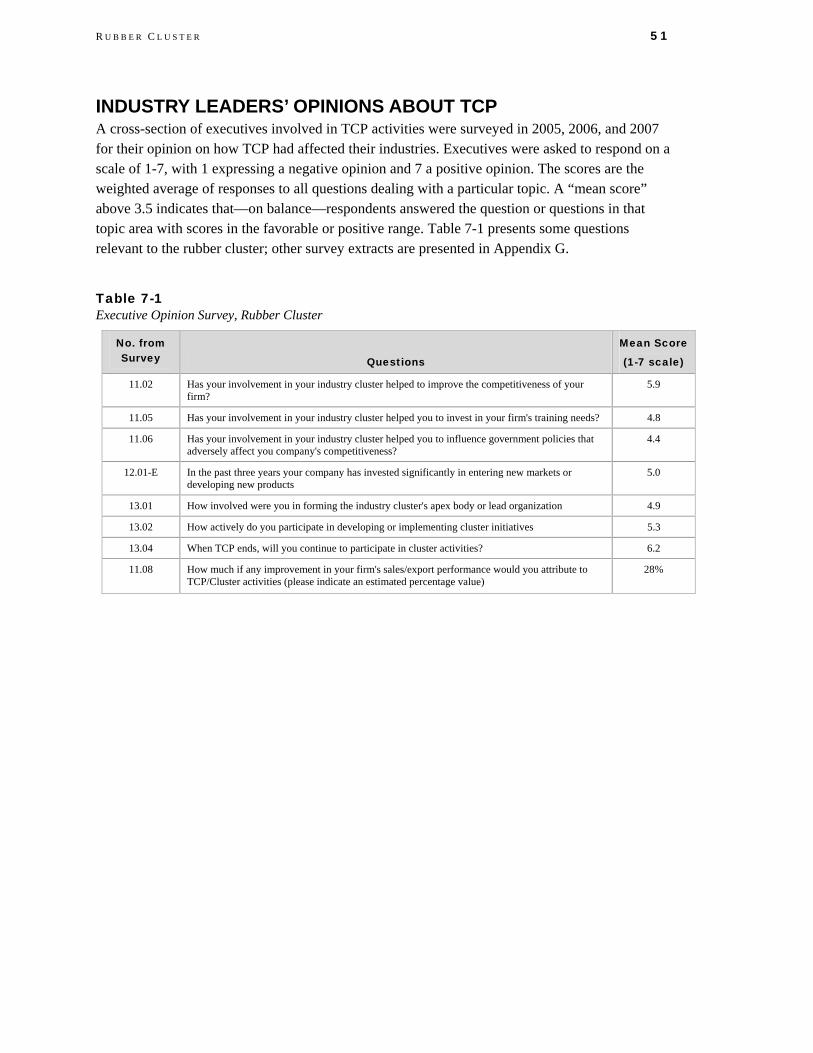
R U B B E R C L U S T E R 51
INDUSTRY LEADERS’ OPINIONS ABOUT TCP A cross-section of executives involved in TCP activities were surveyed in 2005, 2006, and 2007 for their opinion on how TCP had affected their industries. Executives were asked to respond on a scale of 1-7, with 1 expressing a negative opinion and 7 a positive opinion. The scores are the weighted average of responses to all questions dealing with a particular topic. A “mean score” above 3.5 indicates that—on balance—respondents answered the question or questions in that topic area with scores in the favorable or positive range. Table 7-1 presents some questions relevant to the rubber cluster; other survey extracts are presented in Appendix G.
Table 7-1 Executive Opinion Survey, Rubber Cluster
No. from Survey Questions
Mean Score
(1-7 scale)
11.02 Has your involvement in your industry cluster helped to improve the competitiveness of your firm?
5.9
11.05 Has your involvement in your industry cluster helped you to invest in your firm's training needs? 4.8
11.06 Has your involvement in your industry cluster helped you to influence government policies that adversely affect you company's competitiveness?
4.4
12.01-E In the past three years your company has invested significantly in entering new markets or developing new products
5.0
13.01 How involved were you in forming the industry cluster's apex body or lead organization 4.9
13.02 How actively do you participate in developing or implementing cluster initiatives 5.3
13.04 When TCP ends, will you continue to participate in cluster activities? 6.2
11.08 How much if any improvement in your firm's sales/export performance would you attribute to TCP/Cluster activities (please indicate an estimated percentage value)
28%

8. Spice Cluster The spice cluster was formed in June 2001as an informal body representing stakeholders in the value chain. It incorporated as the Spice Council (TSC) on December 9, 2003, under the Companies Act. TSC was officially launched on January 22, 2004. A new Board of Directors and office bearers were appointed on September 19, 2007 at TSC’s Fourth Annual General Meeting in Colombo. Mr. D A Perera of EOAS International (Pvt) Ltd. and Processor Representative was elected as the chairman; Mr. Sarada de Silva of Intercom Ltd had served as chairman for three consecutive years. TSC is a member of the American Spice Trade Association (ASTA), the European Spice Association (ESA), the International Organization of Spice Trading Associations (IOSTA), and the International Pepper Community (IPC). It has been invited by the Spice Board of India to participate in World Spice Congresses. TSC raises funds through membership dues and fees for seminars and workshops to raise funds. It is housed at the National Agribusiness Council and has a part-time coordinator who handles day-to-day activities.
The Spice Council Chairman, D.A. Perera c/o National Agribusiness Council, 503, Sri Jayawardenapura Mawatha, Ethul Kotte, Kotte +94114300619 [email protected] www.srilankaspices.org
An often overlooked sector of the export agriculture industry, TSC has mustered broad support to address policy-related issues on behalf of the industry. It has also has facilitated market linkages for exporters and linked rural farmers to local markets. TSC has secured local and international funding to initiate several other programs.
INDUSTRY COMPETITIVENESS World exports of whole spices and spice derivatives totaled US$2.5 billion in 2005 according to the International Trade Centre. China was the leading exporter (16.6 percent) and India was the second top exporter (11.2 percent). Sri Lanka’s share was 3.9 percent. Vietnam has emerged as a major producer and exporter of pepper—exporting less than 10,000 tons in 2000 then more than 100,000 tons by 2005. Sri Lanka remains the largest exporter of “Ceylon” or “true cinnamon” with more 90 percent of the world market. Ceylon cinnamon accounts for 12.5 percent of the volume of the market, but 50 percent of its value.
Sri Lanka’s Exports and Export Destinations In 2006, Sri Lanka’s spice exports were valued at US$108 million. Its share of global spice exports has declined over the past 10 years from 1.2 percent in 1996 to 0.7 percent in 2006.
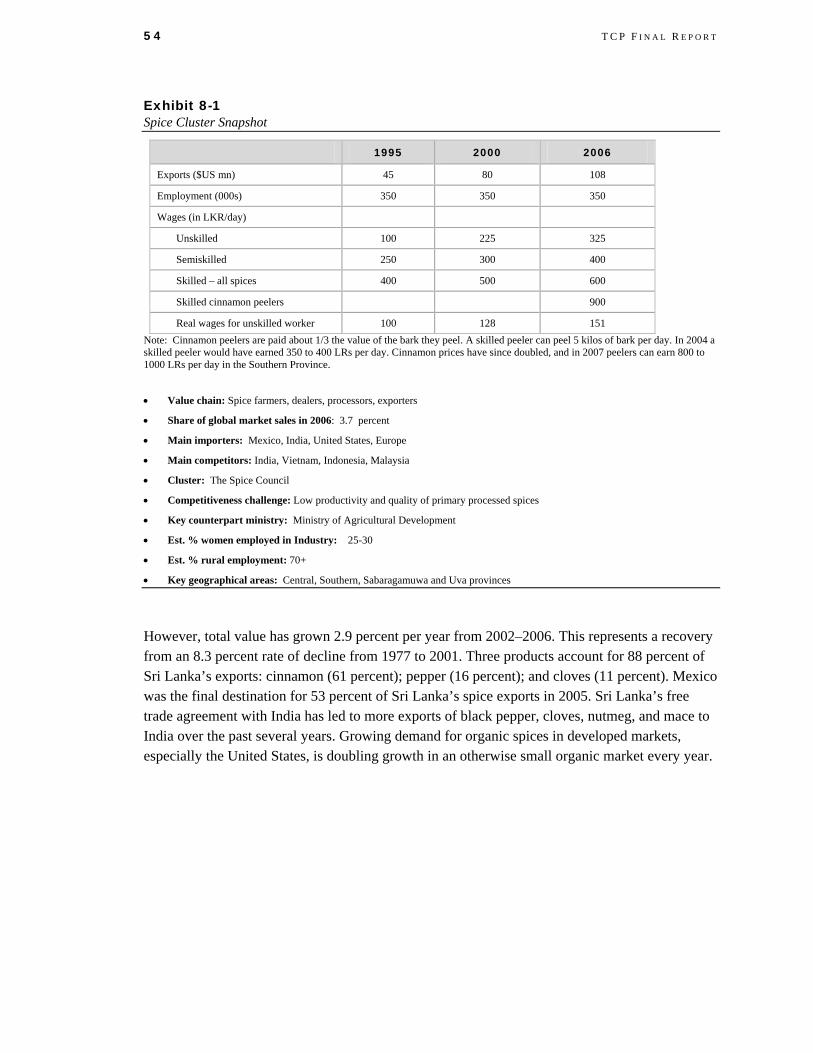
54 T C P F I N A L R E P O R T
Exhibit 8-1 Spice Cluster Snapshot
1995 2000 2006
Exports ($US mn) 45 80 108
Employment (000s) 350 350 350
Wages (in LKR/day)
Unskilled 100 225 325
Semiskilled 250 300 400
Skilled – all spices 400 500 600
Skilled cinnamon peelers 900
Real wages for unskilled worker 100 128 151 Note: Cinnamon peelers are paid about 1/3 the value of the bark they peel. A skilled peeler can peel 5 kilos of bark per day. In 2004 a skilled peeler would have earned 350 to 400 LRs per day. Cinnamon prices have since doubled, and in 2007 peelers can earn 800 to 1000 LRs per day in the Southern Province.
• Value chain: Spice farmers, dealers, processors, exporters
• Share of global market sales in 2006: 3.7 percent
• Main importers: Mexico, India, United States, Europe
• Main competitors: India, Vietnam, Indonesia, Malaysia
• Cluster: The Spice Council
• Competitiveness challenge: Low productivity and quality of primary processed spices
• Key counterpart ministry: Ministry of Agricultural Development
• Est. % women employed in Industry: 25-30
• Est. % rural employment: 70+
• Key geographical areas: Central, Southern, Sabaragamuwa and Uva provinces
However, total value has grown 2.9 percent per year from 2002–2006. This represents a recovery from an 8.3 percent rate of decline from 1977 to 2001. Three products account for 88 percent of Sri Lanka’s exports: cinnamon (61 percent); pepper (16 percent); and cloves (11 percent). Mexico was the final destination for 53 percent of Sri Lanka’s spice exports in 2005. Sri Lanka’s free trade agreement with India has led to more exports of black pepper, cloves, nutmeg, and mace to India over the past several years. Growing demand for organic spices in developed markets, especially the United States, is doubling growth in an otherwise small organic market every year.
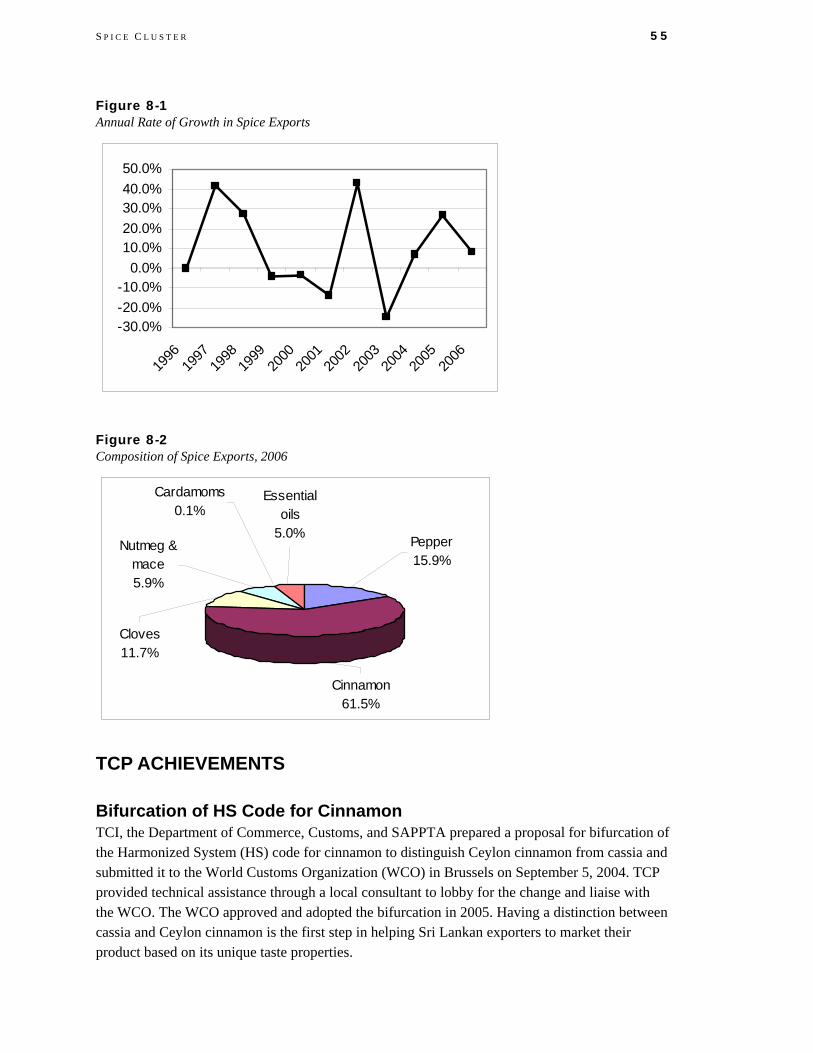
S P I C E C L U S T E R 55
Figure 8-1 Annual Rate of Growth in Spice Exports
-30.0%-20.0%-10.0%
0.0%10.0%20.0%30.0%40.0%50.0%
1996
1997
1998
1999
2000
2001
2002
2003
2004
2005
2006
Figure 8-2 Composition of Spice Exports, 2006
Cinnamon61.5%
Pepper15.9%
Nutmeg & mace5.9%
Cloves11.7%
Essential oils
5.0%
Cardamoms0.1%
TCP ACHIEVEMENTS
Bifurcation of HS Code for Cinnamon TCI, the Department of Commerce, Customs, and SAPPTA prepared a proposal for bifurcation of the Harmonized System (HS) code for cinnamon to distinguish Ceylon cinnamon from cassia and submitted it to the World Customs Organization (WCO) in Brussels on September 5, 2004. TCP provided technical assistance through a local consultant to lobby for the change and liaise with the WCO. The WCO approved and adopted the bifurcation in 2005. Having a distinction between cassia and Ceylon cinnamon is the first step in helping Sri Lankan exporters to market their product based on its unique taste properties.
56 T C P F I N A L R E P O R T
U.S. Market Linkage Program In October 2005, TCP consultant, Derryck Cox, evaluated the readiness of six Sri Lankan spice producers, processors, and exporters to export to the U.S. market. He advised the companies on upgrading operations to meet U.S. market requirements and recommended that they attend the March 2006 Natural Products West Expo in Anaheim, California. TCP arranged for a delegation to attend the expo and to meet with U.S. brokers, importers, and processors. U.S. companies responded very positively and the companies secured US$3.1 million in immediate orders.
Manufacturing Practices for Cinnamon Processing TSC, EDB, GTZ, the Cinnamon Association, and a private grower/processor set up a processing center using good manufacturing practices (GMP) at Kosgoda, Balapitiya. Hon. Kingsley T. Wickremaratne, Governor of the Southern Province, opened the center in August 2005 in the presence of TSC, cinnamon industry personnel, and government officials. The center is the first of its kind in Sri Lanka and is open for observation. TSC member SGS Lanka (Pvt) Ltd. carried out an evaluation and conferred GMP certification on the Dasanayake Walauwa Cinnamon Plantation. The cost of the project was LRs 6 million, of which LRs1 million was provided by the National Council for Economic Development as a grant through the EDB.
Quality and food safety standards for cinnamon and other spices are becoming more stringent every year and the GMP facility will help the industry in meeting those standards. The manual for the center was drafted with the assistance of GTZ with inputs from the Cinnamon Association, cinnamon experts, and practicing peelers. The center received Hazard Analysis at Critical Control Points (HACCP) certification in October 2006.
Model Spice Processing Facility More than 70 percent of pepper production in Sri Lanka originates from smallholders in the remote highlands. Processing is primitive: pepper is sun dried outdoors where it is susceptible to contamination and quality control is difficult. Smallholders generally sell their crops to middle men and receive the same bulk price regardless of quality. TCP provided TSC with a technical assistance and cost reimbursement grant to set up a model spice processing facility in Maradurawala in the Matale district to upgrade growers’ production and processing.
TSC and seven farmers formed Matale Natural Spices (Pvt) Ltd. to run the facility and provide training in best practices. Those with the right attitude, capacity, and resources were selected to join the center. Each farmer invested LRs 20,000, for a total of LRs 140,000, and TSC invested LRs 80,000. The funds were used to acquire land, incorporate, and install infrastructure, including a hot air dryer and other equipment, and train 10 farmers on business plan development and quality assurance. The Department of Export Agriculture will also contribute technical expertise to the project. The facility will enable the farmers to process spices more productively and boost product quality, allowing them to sell directly to retailers or the auction, making farm units economically viable. The value of the grant is US$13,815. The center officially opened in July 2007 and has conducted several training programs. Production work on primary processing was started with the pepper-harvesting season in June/July. In the off-season the hot air dryer is used to dehydrate other produce.

S P I C E C L U S T E R 57
Figure 8-3 Spice Drying Machine
Farmer Study Tour With TCP’s assistance, TSC organized a study tour to India. Fourteen farmers visited Kerala where they observed best practices followed on top Indian farms. The farmers also learned about quality and safety issues. Upon returning to Sri Lanka they shared what they had learned in seminars in their villages.
CLUSTER ACHIEVEMENTS
Cinnamon Training Academy TSC set up the Cinnamon Training Academy (CTA) in the southern province with funding from GTZ’s PMSME, the private sector, and government to develop skills in cinnamon peeling. CTA will conduct a Certificate Course in processing as a broad introduction to a career in the industry. The curriculum is intended to meet the demands of today's labor market and upgrade the profession to attract youth to cinnamon peeling.
RURAL IMPACT In an industry where more than 70 percent of the workforce is in rural areas, the two main thrusts of the cluster strategy—supply improvement and market expansion—had a direct impact on rural incomes. Training in GMP and HACCP certification will provide for continued access to U.S. and European markets. Training in best practices for production and equipping smallholders with a better and more cost-effective way to dry spices will enable producers to capture a higher percentage of the purchase price. TSC aggressively targeted niche markets and specialty buyers for market expansion and is repositioning the spice industry so that producers are not confined to low-value bulk spice markets where they have little comparative advantage.
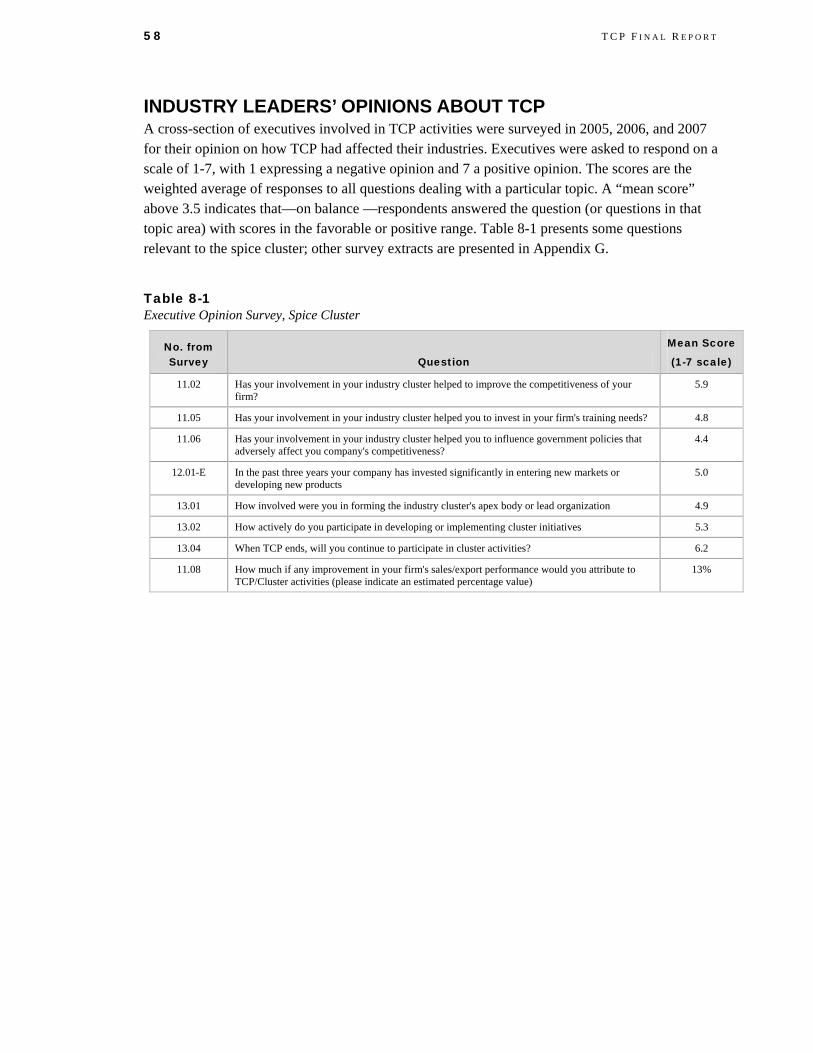
58 T C P F I N A L R E P O R T
INDUSTRY LEADERS’ OPINIONS ABOUT TCP A cross-section of executives involved in TCP activities were surveyed in 2005, 2006, and 2007 for their opinion on how TCP had affected their industries. Executives were asked to respond on a scale of 1-7, with 1 expressing a negative opinion and 7 a positive opinion. The scores are the weighted average of responses to all questions dealing with a particular topic. A “mean score” above 3.5 indicates that—on balance —respondents answered the question (or questions in that topic area) with scores in the favorable or positive range. Table 8-1 presents some questions relevant to the spice cluster; other survey extracts are presented in Appendix G.
Table 8-1 Executive Opinion Survey, Spice Cluster
No. from Survey Question
Mean Score
(1-7 scale)
11.02 Has your involvement in your industry cluster helped to improve the competitiveness of your firm?
5.9
11.05 Has your involvement in your industry cluster helped you to invest in your firm's training needs? 4.8
11.06 Has your involvement in your industry cluster helped you to influence government policies that adversely affect you company's competitiveness?
4.4
12.01-E In the past three years your company has invested significantly in entering new markets or developing new products
5.0
13.01 How involved were you in forming the industry cluster's apex body or lead organization 4.9
13.02 How actively do you participate in developing or implementing cluster initiatives 5.3
13.04 When TCP ends, will you continue to participate in cluster activities? 6.2
11.08 How much if any improvement in your firm's sales/export performance would you attribute to TCP/Cluster activities (please indicate an estimated percentage value)
13%
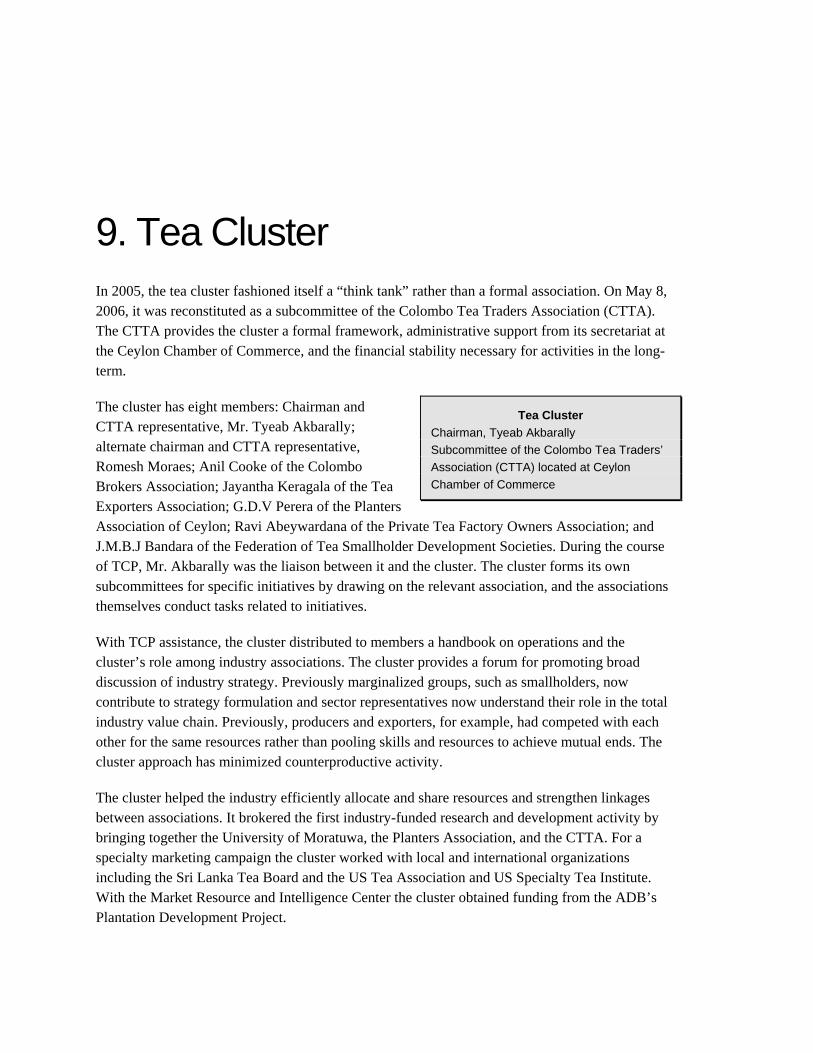
9. Tea Cluster In 2005, the tea cluster fashioned itself a “think tank” rather than a formal association. On May 8, 2006, it was reconstituted as a subcommittee of the Colombo Tea Traders Association (CTTA). The CTTA provides the cluster a formal framework, administrative support from its secretariat at the Ceylon Chamber of Commerce, and the financial stability necessary for activities in the long-term.
The cluster has eight members: Chairman and CTTA representative, Mr. Tyeab Akbarally; alternate chairman and CTTA representative, Romesh Moraes; Anil Cooke of the Colombo Brokers Association; Jayantha Keragala of the Tea Exporters Association; G.D.V Perera of the Planters Association of Ceylon; Ravi Abeywardana of the Private Tea Factory Owners Association; and J.M.B.J Bandara of the Federation of Tea Smallholder Development Societies. During the course of TCP, Mr. Akbarally was the liaison between it and the cluster. The cluster forms its own subcommittees for specific initiatives by drawing on the relevant association, and the associations themselves conduct tasks related to initiatives.
Tea Cluster Chairman, Tyeab Akbarally Subcommittee of the Colombo Tea Traders’ Association (CTTA) located at Ceylon Chamber of Commerce
With TCP assistance, the cluster distributed to members a handbook on operations and the cluster’s role among industry associations. The cluster provides a forum for promoting broad discussion of industry strategy. Previously marginalized groups, such as smallholders, now contribute to strategy formulation and sector representatives now understand their role in the total industry value chain. Previously, producers and exporters, for example, had competed with each other for the same resources rather than pooling skills and resources to achieve mutual ends. The cluster approach has minimized counterproductive activity.
The cluster helped the industry efficiently allocate and share resources and strengthen linkages between associations. It brokered the first industry-funded research and development activity by bringing together the University of Moratuwa, the Planters Association, and the CTTA. For a specialty marketing campaign the cluster worked with local and international organizations including the Sri Lanka Tea Board and the US Tea Association and US Specialty Tea Institute. With the Market Resource and Intelligence Center the cluster obtained funding from the ADB’s Plantation Development Project.
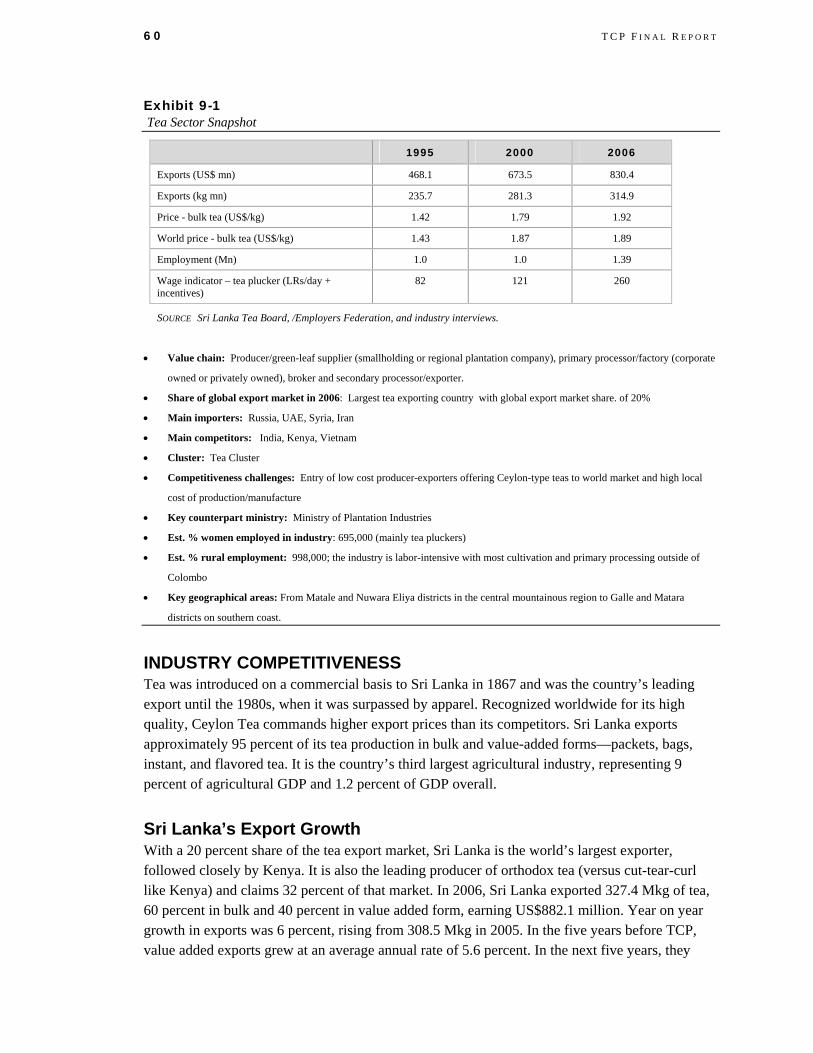
60 T C P F I N A L R E P O R T
Exhibit 9-1 Tea Sector Snapshot
1995 2000 2006
Exports (US$ mn) 468.1 673.5 830.4
Exports (kg mn) 235.7 281.3 314.9
Price - bulk tea (US$/kg) 1.42 1.79 1.92
World price - bulk tea (US$/kg) 1.43 1.87 1.89
Employment (Mn) 1.0 1.0 1.39
Wage indicator – tea plucker (LRs/day + incentives)
82 121 260
SOURCE Sri Lanka Tea Board, /Employers Federation, and industry interviews.
• Value chain: Producer/green-leaf supplier (smallholding or regional plantation company), primary processor/factory (corporate
owned or privately owned), broker and secondary processor/exporter.
• Share of global export market in 2006: Largest tea exporting country with global export market share. of 20%
• Main importers: Russia, UAE, Syria, Iran
• Main competitors: India, Kenya, Vietnam
• Cluster: Tea Cluster
• Competitiveness challenges: Entry of low cost producer-exporters offering Ceylon-type teas to world market and high local
cost of production/manufacture
• Key counterpart ministry: Ministry of Plantation Industries
• Est. % women employed in industry: 695,000 (mainly tea pluckers)
• Est. % rural employment: 998,000; the industry is labor-intensive with most cultivation and primary processing outside of
Colombo
• Key geographical areas: From Matale and Nuwara Eliya districts in the central mountainous region to Galle and Matara
districts on southern coast.
INDUSTRY COMPETITIVENESS Tea was introduced on a commercial basis to Sri Lanka in 1867 and was the country’s leading export until the 1980s, when it was surpassed by apparel. Recognized worldwide for its high quality, Ceylon Tea commands higher export prices than its competitors. Sri Lanka exports approximately 95 percent of its tea production in bulk and value-added forms—packets, bags, instant, and flavored tea. It is the country’s third largest agricultural industry, representing 9 percent of agricultural GDP and 1.2 percent of GDP overall.
Sri Lanka’s Export Growth With a 20 percent share of the tea export market, Sri Lanka is the world’s largest exporter, followed closely by Kenya. It is also the leading producer of orthodox tea (versus cut-tear-curl like Kenya) and claims 32 percent of that market. In 2006, Sri Lanka exported 327.4 Mkg of tea, 60 percent in bulk and 40 percent in value added form, earning US$882.1 million. Year on year growth in exports was 6 percent, rising from 308.5 Mkg in 2005. In the five years before TCP, value added exports grew at an average annual rate of 5.6 percent. In the next five years, they

T E A C L U S T E R 61
grew at an annual rate of 7 percent. Increased demand from traditional markets, such as Russia, Middle East and Gulf nations, fueled by higher oil prices contributed to growth in 2006.
Figure 9-1 Annual Rate of Growth in Tea Exports
-30.0%
-20.0%
-10.0%
0.0%
10.0%
20.0%
30.0%
1996
1997
1998
1999
2000
2001
2002
2003
2004
2005
2006
Figure 9-2 Composition of Tea Exports, 2006
Bulk64%
Packets25%
Green tea1%Tea Bags
6%
Instant0%
Other4%
Firms/Employment The tea value chain comprises producers/green-leaf suppliers (smallholdings and plantations), factories, brokers, and secondary processors/exporters. The industry consists of approximately 370,000 smallholders of whom more than 90 percent own less than one-half hectare, 22 regional plantation companies, 734 corporate and private factories, 9 brokerages, and 211 export companies of which more than 100 are medium to large scale exporters with relatively small capital bases. The industry employs 1.39 million people, 50 percent of them women working on the lowest rung of the employment ladder as tea pluckers.
62 T C P F I N A L R E P O R T
Wages According to the collective agreement now in force, the average daily salary of a tea plucker in 2006 was LRs 170 plus incentives of approximately LRs 90-125. Approximately 90 percent of tea pluckers are women.
Cost Buildup and Distribution Cost buildup and distribution in the tea value chain depends on whether a company is in production or exporting. Members of these two main components of the chain are linked by an auction where they buy and sell product. Costs for a typical producer are 55-60 percent labor, 18 percent overhead (fuel 4 percent, power 5 percent, other 9 percent), and 15-20 percent materials (fertilizer 9, chemicals 2, packaging materials 4). Costs for a typical exporter are 80 percent materials (tea 75 percent), 10 percent overhead (power 7 percent), and 6-7 percent marketing and distribution.
Geographic Distribution Total area planted with tea is 221,969 hectares (third largest in the world) and half the tea lands are in the “low grown” elevation. Tea in Sri Lanka is grown in six agro-climatic regions with distinct soils and climates that influence the teas’ flavor and physical attributes. The geographic distribution of the industry—from Matale and Nuwara Eliya districts in the central mountainous region to Galle and Matara districts on the southern coast—has given rise to a vast array of teas with unique flavors and brews.
TCP ACHIEVEMENTS
Tea Color Separator Bulk tea production uses costly imported tea color separator machines that mechanically separate stalks and impurities from tea leaves. From 2002 to 2006, the industry funded research and development for a locally produced prototype separator through an MOU with the University of Moratuwa’s Engineering Design Center. Commercial manufacture and marketing are to be handled by Metropolitan Engineering Ltd. through an MOU with the Planters’ Association of Ceylon and the university. Initial funding was provided through a LRs 950,000 interest-free loan from CTTA in 2002. The loan is to be repaid through royalty payments once the separator is in production. TCP’s cluster coordinator and program specialist provided management and coordination for the initiative. When commercially manufactured, the separator could lower the price of imported separators from US$12m to US$3m. The initiative has set a precedent for industry cooperation and promises to make otherwise expensive imported technology accessible directly and by exerting downward price pressure on imported machines. It also stands as an organizational model of university-industry linkages and industry-funded R&D, and built the university’s reputation for handling such work to the point that it could become a center for the tea industry’s processing technology.
T E A C L U S T E R 63
Supply Chain Rationalization With technical assistance for a supply chain review from TCP’s specialists in 2003, the industry simplified its supply chain and quantified the costs of transactions that were hindering the “bush to cup” product cycle. The industry was able to clear backlogged teas, ease constraints on working capital, lower auction costs, and reduce transaction times to achieve the shortest product cycle among competitors, enabling it to promote Ceylon Tea as the “freshest” in the world.
Market Intelligence and Resource Center The industry established a market intelligence and resource center in 2003 with the Tea Association of Sri Lanka (TASL) and the Sri Lanka Tea Board, one of the first long-term public–private partnerships the industry. The resulting cooperative agreement obtained funds from the ADB’s Plantation Development Project under the Ministry of Plantation Industry. The center will collect and disseminate market information in a timely and cost-effective manner to support strategic and corporate decisions. This will enable the industry to respond better to market trends, use forecasting and trend analysis, and reduce the impact of global price fluctuations on domestic margins. TCP provided technical assistance to identify information needs, flesh out the center concept, develop a business proposal, and convert the proposal into a format acceptable to the ADB’s Plantation Development Project. The total budget is US$300,000, proposed on a sustainable fee-for-service model . The center is expected to break even within two to three years. Set up costs are to be shared between the Sri Lanka Tea Board and the ADB-funded Tea Association of Sri Lanka.
Strategy to Redefine Sri Lanka as Preferred Provider The cluster began repositioning the industry to break away from commoditization of tea and the downward price pressure exerted by multinationals. Ceylon teas are increasingly recognized in the high-growth specialty tea market as a many-flavored product. This has helped make buyers aware of the varieties of Sri Lankan tea, more diversity than found in other tea origins, such as Kenya. Repositioning occurred at several levels—by origin, by the six agro-climatic regions (Uva, Udapussellawa, Dimbula etc), by estate (e.g., Kenilworth, Aisleby, Loinhorn), and by brand. This strategic initiative gained traction through two marketing campaigns—“Individualtea in Specialtea” and “Diversitea in Specialtea”—two international conventions, a first-time U.S. specialty tea buyer tour, and several “Ceylon Tea of the Year” competitions in Sri Lanka and the United States (in collaboration with the U.S. Tea Association and Specialty Tea Institute). TCP funded industry participation at the U.S. Tea Convention in 2002 and supported the two international conferences with advertising campaigns, tea tours, and tea tasting sessions. The cluster hopes to raise demand for teas from specific regions or estates of Sri Lanka and increase exports of straight-line (ex-estate) teas. The initiative converted a perceived disadvantage—Sri Lankan teas as variables of orthodox teas—into a competitive marketing proposition for a variety of branded products unique to Sri Lanka.
CLUSTER ACHIEVEMENTS With TCI/TCP assistance, firms in the clusters adopted strategic business investment and sustainable business practices and made investments that capitalize on comparative advantages to
64 T C P F I N A L R E P O R T
offer a distinct product in international markets. Firm-level investments increasingly focused on trends in retail marketing, such as product origin and traceability, standards and certifications, sustainable agricultural and business practices, consumer protection mechanisms, and corporate social responsibility. For example, VanRees Ceylon designed and established the world’s first large leaf blending drum, overcoming a challenge facing 60 percent of Sri Lanka’s product. Asia Siyaka Commodities introduced bulk vacuum packaging. Mabroc Tea won a prestigious Addy packaging award with its U.S. partner, The Original Tea Company; and Mabroc/Kelani Valley Plantation registered with the UN Global Compact to become the world’s first “ethical” tea brand.
RURAL IMPACT During the TCP programming period the cluster did not engage in an initiative designed for rural impact. Yet many initiatives had impact because the industry inherently affects the rural economy, providing direct and indirect employment to approximately 1.5 million people—300,000 of them smallholders, 80 percent of whom own less than an acre. More than 80 percent of upstream labor is provided by women. Through a complex network of transactions, the industry is deeply woven into the social fabric of the southern coastal region and the central highlands. It has significant political impact—75 percent of the upcountry workforce is unionized. Approximately 10 percent of the population—including workers, non-workers, and children—depend on the industry for livelihoods.
SMALL GRANTS
Vacuum Packaging Trials TCP and Asia Siyaka Commodities Ltd. (ASC) signed a grant agreement on August 20, 2005, to support testing of bulk vacuum packaging in the tea supply chain over a period of 18 months. Such packaging was expected to reduce transaction costs and, if widely adopted, become a value proposition for overseas buyers and end consumers for its intrinsic benefits (i.e., airtight sealing in of freshness and flavor). ASC was responsible for demonstrating results and the Tea Research Institute (TRI) was its technical partner. ASC held workshops to share progress, and in October 2006 shared information on vacuum packaging and the results of trials with approximately 200 stakeholders. ASC offered free use of the machine and “vacpacs” to other clusters interested in trials for their own products. The spice cluster and representatives of the desiccated coconut industry expressed interest.
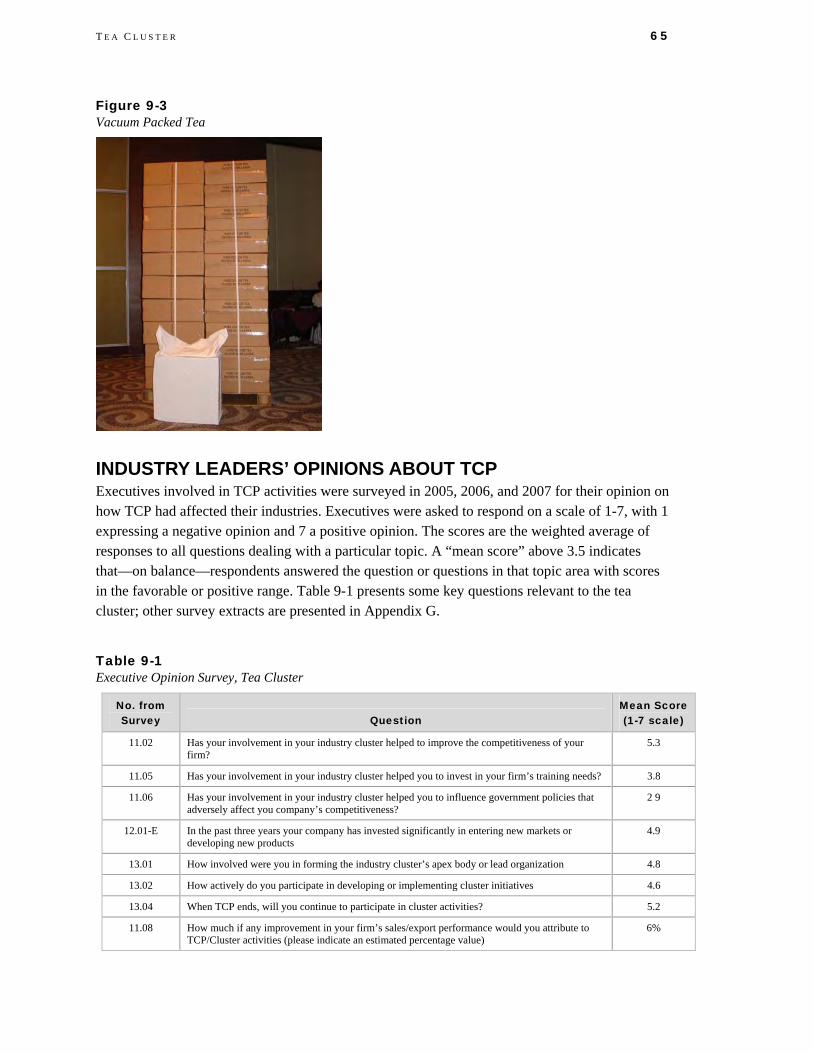
T E A C L U S T E R 65
Figure 9-3 Vacuum Packed Tea
INDUSTRY LEADERS’ OPINIONS ABOUT TCP Executives involved in TCP activities were surveyed in 2005, 2006, and 2007 for their opinion on how TCP had affected their industries. Executives were asked to respond on a scale of 1-7, with 1 expressing a negative opinion and 7 a positive opinion. The scores are the weighted average of responses to all questions dealing with a particular topic. A “mean score” above 3.5 indicates that—on balance—respondents answered the question or questions in that topic area with scores in the favorable or positive range. Table 9-1 presents some key questions relevant to the tea cluster; other survey extracts are presented in Appendix G.
Table 9-1 Executive Opinion Survey, Tea Cluster
No. from Survey Question
Mean Score (1-7 scale)
11.02 Has your involvement in your industry cluster helped to improve the competitiveness of your firm?
5.3
11.05 Has your involvement in your industry cluster helped you to invest in your firm’s training needs? 3.8
11.06 Has your involvement in your industry cluster helped you to influence government policies that adversely affect you company’s competitiveness?
2 9
12.01-E In the past three years your company has invested significantly in entering new markets or developing new products
4.9
13.01 How involved were you in forming the industry cluster’s apex body or lead organization 4.8
13.02 How actively do you participate in developing or implementing cluster initiatives 4.6
13.04 When TCP ends, will you continue to participate in cluster activities? 5.2
11.08 How much if any improvement in your firm’s sales/export performance would you attribute to TCP/Cluster activities (please indicate an estimated percentage value)
6%

10. Tourism Cluster In May 2004, the tourism cluster registered as a nonprofit company with the mandate to develop and implement initiatives to advance competitiveness. It functions as a special umbrella organization and joint venture of two associations, the Tourist Hotels Association of Sri Lanka (THASL) and the Sri Lanka Association of Inbound Tour Operators (SLAITO). The Board of Directors has 10 members, 3 appointed by THASL, 3 by SLAITO, and 3 by others important in the industry, such as the Sri Lanka Tourist Board and Sri Lankan Airlines. The chairman is appointed jointly by THASL and SLAITO. In 2007, SLAITO had 89 registered members and THASL had 148 members.
During the course of TCP, the cluster was a focal point for working with the program, disseminated information to members, and mobilized information and resources for specific initiatives. Cluster members have considered forming an apex body and even including “outbound” tourism services, but discussions have not yet bore results. Some members see this as one reason for the government’s ignoring recommendations from the industry. The Tourism Reform Bill enacted in October 2007, however, will reorganize the Sri Lanka Tourism Board to include more private sector representatives. Most active members of the cluster expect that future competitiveness activities will be under the auspices of the reorganized Sri Lanka Tourism Board.
Tourism Cluster Chairman, Prema Cooray Ceylon Chamber of Commerce No. 50 Nawam Mawatha, Colombo +94112380159 Uses SLTB, SLAITO and THASL websites (www.srilankatourism.org, www.slaito.com, www.touristhotels.lk)
INDUSTRY COMPETITIVENESS In 2006, hotels registered with the Sri Lanka Tourist Board were offering a room capacity of 14,397. The island’s 13 five-star hotels have 2,845 rooms; the four-star hotels have 707 rooms; the three-star hotels have 435 rooms; the two-star hotels have 1,983 rooms; and the one-star hotels have 514 rooms. Nearly half the rooms in Sri Lanka are in unrated hotels, many of them not registered with the Sri Lanka Tourism Board. The Colombo district has 3,468 rooms; Nuwara Eliya (tea country) has 3,446 registered rooms; and the Kalutara province on the southwest coast has 2,297 rooms.

68 T C P F I N A L R E P O R T
Exhibit 10-1 Tourism Sector Snapshot
1995 2001 2006
Earnings (US$ m) 225 211 410
Tourist arrivals (000s) 403 337 560
Avg. spend per tourist day (US$) 56.1 63.1 83.4 (provisional)
Employment (000s)
Direct 35 34 56
Indirect 49 47 78
Wage indicator (LRs/ month) 1,500 3,000 6,000
Wage indicator adjusted for CCPI 1,500 1,700 2,300
SOURCE SLTB and Industry.
• Value chain: Travel agencies, tour operators, hotels, airlines, ground transport, restaurants, shopping, guides, cultural and
natural attractions.
• Share of global market sales in 2006: 565,000 or 0.07 % of 808 million tourist arrivals in 2005
• Main origin countries: India, Europe
• Main competitors: Maldives, Malaysia, India, Thailand, Vietnam, Indonesia
• Cluster: The Tourism Cluster
• Competitiveness challenges: Security concerns related to conflict; intra-island transport, insufficient product development,
insufficient or inadequate marketing.
• Key counterpart ministry: Sri Lanka Tourism Board, Ministry of Tourism
• Est. % women employed in industry: 20%
• Est. % rural employment: 75%
• Key geographical areas: Colombo, North Colombo, South West Coast, Kandy, Hill Country, Cultural Triangle
• Current strategy: Reposition image; move up market; appeal to higher-spending, special niche tourism (culture, nature,
boutique).
According to Sri Lanka Tourist Board, more than 36,000 persons were directly employed by hotels and restaurants in 2006. Tourism is Sri Lanka’s fourth largest foreign exchange earning industry, accounting for 3.5 percent of foreign exchange earnings in 2005. Earnings declined 15 percent in 2005, dropping from US$427 million in 2004 to US$362 million, largely because of the tsunami of December 2004. Industry recovery was undermined in 2006 by an escalation of the conflict with the LTTE, a conflict that has plagued Sri Lanka for three decades and continues unresolved into 2007. The escalation damaged resort hotel business more than Colombo city hotels, which also draw business tourists.

T O U R I S M C L U S T E R 69
Figure 10-1 Annual Rate of Growth in Tourism Earnings
-30.0%-20.0%-10.0%
0.0%10.0%20.0%30.0%40.0%
1996
1997
1998
1999
2000
2001
2002
2003
2004
2005
2006
Figure 10-2 Top Ten Markets for Tourism, 2006
Aus tra lia4%
Netherlands4%
USA4%
France4%
Maldives4%
Germany9%
UK16%
India23%
China3%
J apan3%
Other26%
TCP ACHIEVEMENTS The cluster’s competitiveness strategy of 2001 called for repositioning Sri Lanka “upmarket” by offering new products and experiences to tourists. As recently as 2000, most of the industry focused on cut-rate package plans to beach resorts on the southwest coast. The new strategy emphasizes other attractions (e.g. tea country, nature, elephants, culture, World Heritage sites like Sigiriya) to appeal to high-end niche markets. Increasing the average spend per tourist is considered more important than increasing numbers. The strategy is called “Up from Beaches.” From 2001 to 2007, it created new impressions and images of Sri Lanka. After the cease-fire of 2002, Sri Lankans and foreigners made sizable investments in boutique tourism. These included Tea Trails by the Dilmah Tea Plantation Company, Amman Resorts in Galle, the Fortress in Unawatuna, Aditiya and Lunaganga on the southwest coast, and Vil Ulyana by JetWing near Sigirya. These resorts have inaugurated boutique tourism in Sri Lanka. They cater to nature
70 T C P F I N A L R E P O R T
tourists, especially bird watchers, and include such offerings as the Galle Literary Festival, hot-air ballooning, and elephant polo. TCP helped formulate the strategy and helped firms grasp the benefit of investment. TCP also helped support the Tourism Reform Bill, which aims to increase funding for tourism promotion and private sector participation in the decisions of the Sri Lanka Tourism Board, previously not accountable to the private sector.
Rainforest Ecolodge The program helped plan a joint venture prototype investment for a demonstration “ecolodge” to be built on a tea estate adjacent to the Sinharaja rainforest. Feasibility plans that were started under TCI were finalized under TCP. TCP also provided special assistance so the joint venture qualified for a grant to implement best practices in environmental protection and community development. TCP supported baseline measurements of environmental conditions and community living standards. The resulting grant was to the Alliance to Support Environment and Community through Ecotourism and came to be known as SENCE. The grant provided funds for new housing with better facilities, such as running water, and outreach and research activities with the scientific community.
Post-tsunami Damage Assessments TCP provided assistance with post-tsunami campaigns to convince Europeans and Indians to visit Sri Lanka, and assisted with particular events such as Sri Lanka Day in Trafalgar (2006), the Galle Literary Festival (January 2007), and the culinary tour, Savor Sri Lanka (February 2007). TCP also provided assistance for improvement of tourism information systems. A task force of hotel operators, tourism package firms, the Sri Lanka Tourism Board, Immigration, Sri Lanka Airlines, and the Sri Lanka Airport Authority created reporting forms, airport exit surveys, and a website enabling online reporting (see more details under Campaign to Revitalize Tourism, below). TCP also provided Jetwing Eco Holidays a cost-sharing grant (US$11,118) to produce a pocket-size guidebook on parks in southern Sri Lanka. The guidebook’s photographs of mammals, birds, amphibians, and insects have captions in Sinhala, English, German, and French. The “Guide to Wildlife in the Dry Lowlands” was released on November 9, 2006. TCP funds and private funds were used to produce 1,400 copies that were distributed to guide training programs in 2006 and 2007; 300 copies were given to the cluster in 2007.
SLTB Website Upgrade In October 2007, TCP consultant Simon Jones was assigned to the Sri Lanka Tourism Board to help the board link its website to specialty or niche tourism sites such as those supported and frequented by bird watchers and archeology and gem enthusiasts. The consultant’s report— Outline of a Destination Management System for Sri Lanka Tourist Board—presented steps for turning the website into a gateway for booking rooms or tours with the firms in Sri Lanka.

T O U R I S M C L U S T E R 71
Figure 10-3 Rainforest Ecolodge Brochure
CLUSTER ACHIEVEMENTS The cluster deserves the lion’s share of credit for the following:
• Investing in infrastructure and developments as well as advertising and staff training to develop tourism offerings.
• Drafting the Tourism Bill to improve transparency and accountability in “cess” spending.
• Skilled advocacy that resulted in passage (October 2005) and enactment (October 2007) of the Tourism Bill.
• Continuation of the Tourism Cluster Research Committee and maintenance of its website.
72 T C P F I N A L R E P O R T
RURAL IMPACT Tourism heightens demand for fresh food, clean environments, natural attractions, guides, folklore events, and handicrafts. TCP documented the impact of the ecolodge planned for the Sinharaja rainforest on tea workers living nearby. The joint venture investing in the lodge also received a cooperative grant from USAID to implement best practices in environmental and community development integrated with lodge construction and operation.
CAMPAIGN TO REVITALIZE TOURISM After the tsunami of December 2004, tourism in Sri Lanka declined far out of proportion to the physical damage wreaked on a few resorts. Tourist cancellations extended into the summer largely because media had created a false impression that Sri Lanka could not host tourists at all. Cancellations threatened a second wave of economic hardship in addition to physical destruction. The private sector appealed to donors for help in countering negative publicity.
Task Order 841 was amended on April 28, 2005, to include three new task areas: rapid response and tourism recovery, enabling environment, and capacity building and strengthening. These tasks also furthered the general goal of making Sri Lankan tourism more competitive. TCP had a separate project unit—TCP-2—to handle tasks related to devising a tourism media campaign. TCP
• Formed a communications taskforce • Developed a strategic marketing communications plan • Implemented initiatives in Europe and India • Started cooperative initiatives with private sector groups and with the public sector • Improved tourism information systems.
Campaign activity began on May 10 with a budget of US$3.4 million, 65 percent of which TCP expected to spend in Europe and India. The campaign first targeted travelers and tour operators in Europe with the message that Sri Lanka has recovered from the tsunami enough to ensure a safe, healthy and enjoyable vacation. The cluster created a campaign taskforce that worked, unpaid, on designing the first strategy and then on the specifics of investing in media efforts. TCP-2 joined with another campaign already underway and funded by Sri Lanka Airlines and the Sri Lanka Tourism Board ($2 million). TCP-2 contributed US$289,000 to procure an extended broadcast period in Europe and spent another US$150,000 persuading European tour operators to promote Sri Lanka for the winter of 2005.
Once the European campaign was underway, TCP-2 and the cluster taskforce developed specifications for a media campaign in India. (India was already a growing market with budget airlines offering flights from several cities into Sri Lanka.) The specifications were the basis for a tender to conduct a full media campaign in India. Four firms competed. TCP and the cluster taskforce selected JWT, which has offices in Sri Lanka and India. JWT developed the “Small Island Big Trip” campaign, emphasizing the variety of attractions in Sri Lanka and its beautiful vistas, sea, and landscapes. JWT produced film clips and print ads with Sri Lankan film crews. The campaign ran in India from March to August of 2006 on television, in magazines, and on the Internet. The purchase order issued JWT was for US$1.4 million, the largest single purchase order issued under TCP.
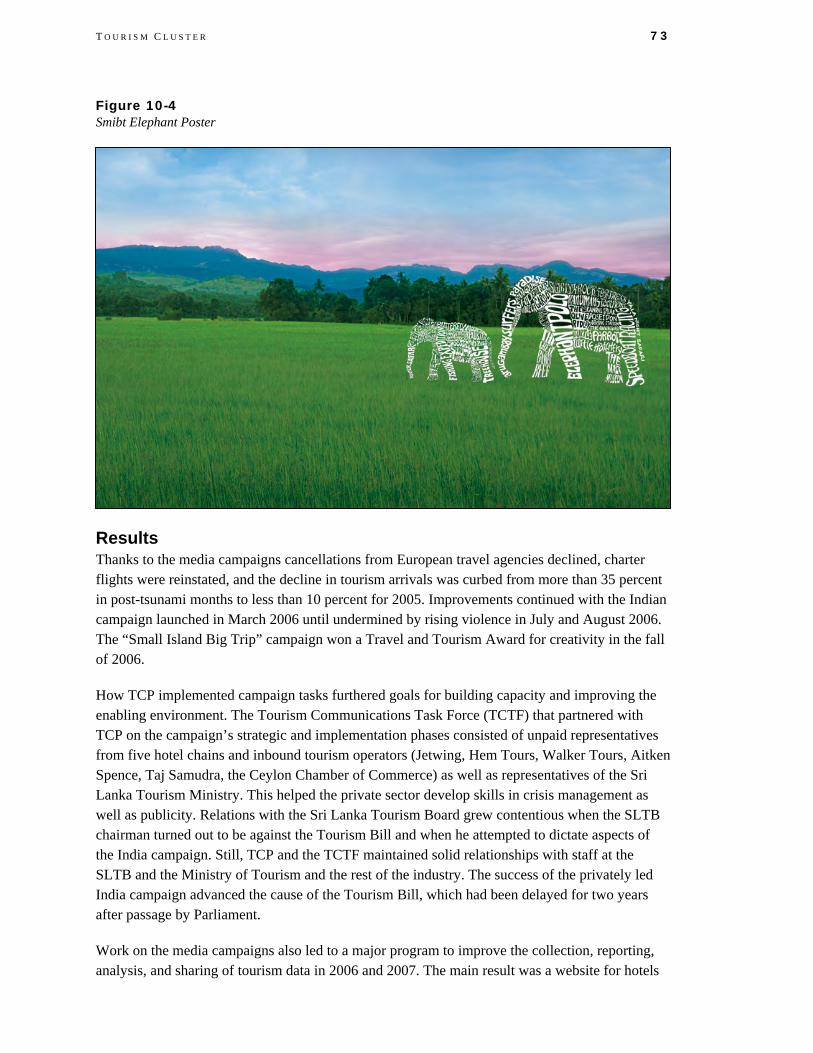
T O U R I S M C L U S T E R 73
Figure 10-4 Smibt Elephant Poster
Results Thanks to the media campaigns cancellations from European travel agencies declined, charter flights were reinstated, and the decline in tourism arrivals was curbed from more than 35 percent in post-tsunami months to less than 10 percent for 2005. Improvements continued with the Indian campaign launched in March 2006 until undermined by rising violence in July and August 2006. The “Small Island Big Trip” campaign won a Travel and Tourism Award for creativity in the fall of 2006.
How TCP implemented campaign tasks furthered goals for building capacity and improving the enabling environment. The Tourism Communications Task Force (TCTF) that partnered with TCP on the campaign’s strategic and implementation phases consisted of unpaid representatives from five hotel chains and inbound tourism operators (Jetwing, Hem Tours, Walker Tours, Aitken Spence, Taj Samudra, the Ceylon Chamber of Commerce) as well as representatives of the Sri Lanka Tourism Ministry. This helped the private sector develop skills in crisis management as well as publicity. Relations with the Sri Lanka Tourism Board grew contentious when the SLTB chairman turned out to be against the Tourism Bill and when he attempted to dictate aspects of the India campaign. Still, TCP and the TCTF maintained solid relationships with staff at the SLTB and the Ministry of Tourism and the rest of the industry. The success of the privately led India campaign advanced the cause of the Tourism Bill, which had been delayed for two years after passage by Parliament.
Work on the media campaigns also led to a major program to improve the collection, reporting, analysis, and sharing of tourism data in 2006 and 2007. The main result was a website for hotels
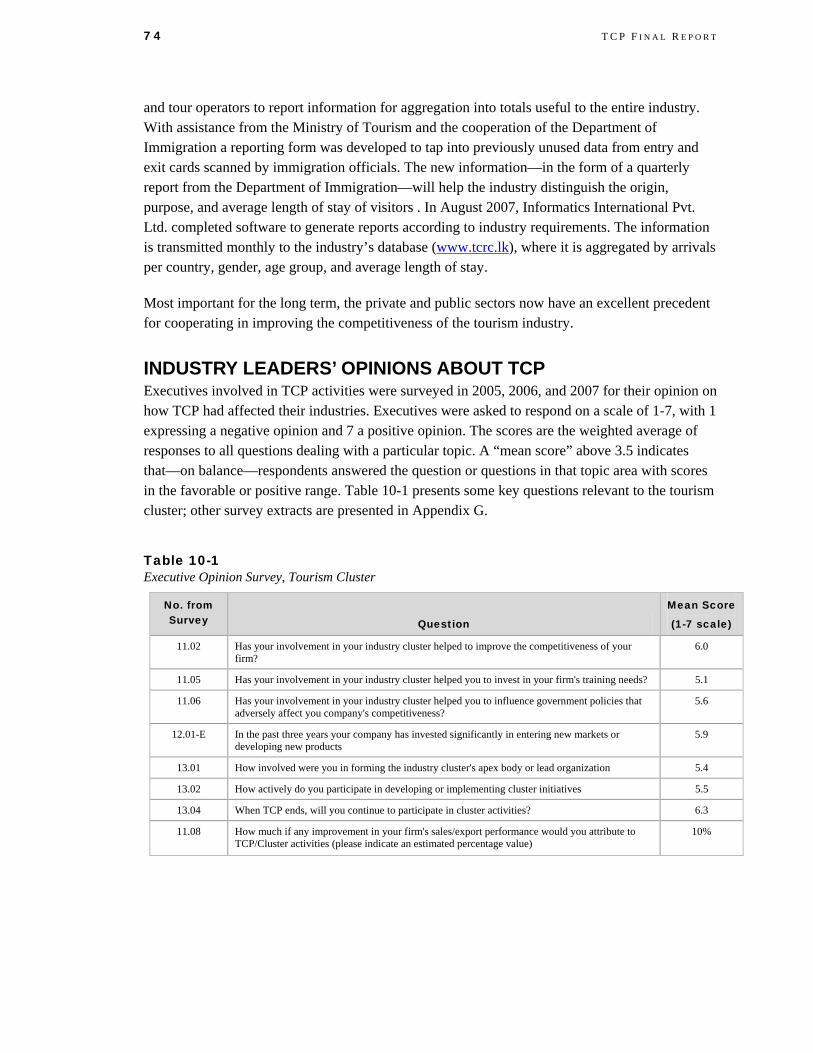
74 T C P F I N A L R E P O R T
and tour operators to report information for aggregation into totals useful to the entire industry. With assistance from the Ministry of Tourism and the cooperation of the Department of Immigration a reporting form was developed to tap into previously unused data from entry and exit cards scanned by immigration officials. The new information—in the form of a quarterly report from the Department of Immigration—will help the industry distinguish the origin, purpose, and average length of stay of visitors . In August 2007, Informatics International Pvt. Ltd. completed software to generate reports according to industry requirements. The information is transmitted monthly to the industry’s database (www.tcrc.lk), where it is aggregated by arrivals per country, gender, age group, and average length of stay.
Most important for the long term, the private and public sectors now have an excellent precedent for cooperating in improving the competitiveness of the tourism industry.
INDUSTRY LEADERS’ OPINIONS ABOUT TCP Executives involved in TCP activities were surveyed in 2005, 2006, and 2007 for their opinion on how TCP had affected their industries. Executives were asked to respond on a scale of 1-7, with 1 expressing a negative opinion and 7 a positive opinion. The scores are the weighted average of responses to all questions dealing with a particular topic. A “mean score” above 3.5 indicates that—on balance—respondents answered the question or questions in that topic area with scores in the favorable or positive range. Table 10-1 presents some key questions relevant to the tourism cluster; other survey extracts are presented in Appendix G.
Table 10-1 Executive Opinion Survey, Tourism Cluster
No. from Survey Question
Mean Score
(1-7 scale)
11.02 Has your involvement in your industry cluster helped to improve the competitiveness of your firm?
6.0
11.05 Has your involvement in your industry cluster helped you to invest in your firm's training needs? 5.1
11.06 Has your involvement in your industry cluster helped you to influence government policies that adversely affect you company's competitiveness?
5.6
12.01-E In the past three years your company has invested significantly in entering new markets or developing new products
5.9
13.01 How involved were you in forming the industry cluster's apex body or lead organization 5.4
13.02 How actively do you participate in developing or implementing cluster initiatives 5.5
13.04 When TCP ends, will you continue to participate in cluster activities? 6.3
11.08 How much if any improvement in your firm's sales/export performance would you attribute to TCP/Cluster activities (please indicate an estimated percentage value)
10%
11. Cross-cutting Activities Sri Lanka’s sea lane location and highly valued spices, gems, and tea have long involved the island country in the global economy. Colombo, a hub port in Asia, handles feeder line business for India as well as for its own trade. This means that many ships call at Colombo, which in turn means favorable freight rates—a competitive advantage to all businesses and a benefit to the economy. It became apparent to TCP that Colombo was not making the most of its position as a hub port and could even lose its hub status if it did not improve trade facilitation and logistics practices. After Modification 4 was signed in August 2006, TCP undertook two cross-cutting activities. The first involved helping Sri Lanka’s Department of Customs improve how it maintains and publicizes regulations. The second involved working with a task force to assess performance in logistics and supply chain management.
CUSTOMS REGULATION DATABASE The purpose of TCP's work with the Department of Customs was to improve access to trade and customs information and thereby boost the productivity of the customs service and its users. Better access to customs information saves time and money and improves decision making. Lower costs and better decisions make the supply chains working through Sri Lanka more efficient and competitive.
The activity was conducted with the Sri Lanka Customs Authority (SLC) and users of customs services drawn from within and outside the TCP clusters. TCP collected, classified, and digitized information on laws, regulations, and customs procedures, and then loaded that information into an online, searchable database accessible through the SLC website (www.customs.gov.lk).
In September 2005, TCP and the Director General of Customs decided on the goal of a Customs Regulations Database (CRD). Both SLC and the trading community were struggling with a paper-based system of regulations that made it difficult to locate rules and procedures. Few officials, for example, could provide a documented, comprehensive answer on which regulations and procedure to follow to conclude a trade transaction. The Director General was aware that his department’s Internet website could be a means for improving internal and external communication.
In early 2006, the Sri Lanka Treasury Department approved the two-phase activity. In the first phase TCP determined technical needs and options, estimated time and resources required, and cultivated stakeholder partners in Customs and the private sector. When stakeholders accepted the database concept and component design, TCP began the second phase, entering into contracts
76 T C P F I N A L R E P O R T
with software developers, customs experts, and others to create the CRD. In October 2006, SLC and TCP signed a Memorandum of Understanding that allowed TCP to contract with trade and IT consultants. Additional features—such as a tax calculator and more user guides—were incorporated into database functions at the request of stakeholders. A trader or official with Internet access can now use Customs’ website to learn about trade regulations and procedures and to obtain guidance on importing a specific good identified by its Harmonized System (HS) code. The CRD also provides importers with other guidelines and a tariff calculator to estimate tariffs applicable for a chosen HS item out of approximately 6,500 HS codes. Well received by traders, these capabilities are making SLC’s services more efficient and reducing nontariff barriers. Since the addition of these facilities, visits to customs’ website have increased approximately 60 percent, from 180 to 285 per day.
Technical Assistance Activity Creating the CRD required obtaining, sorting, scanning, and digitizing laws, regulations and procedures; running quality checks and assigning keywords and designating indexes to enable searches; linking items to HS schedules; developing the database management program, the search engine, index software, other features, and user guides; and modifying the SLC website to accommodate the CRD.
TCP provided technical input from trade and IT experts; computer hardware (e.g., servers, computers, document scanner, an ADSL router and associated software); and training for eight officers from the Automated Data Processing (ADP) Division. The training covered usage and functionality, source code writing to facilitate updating and maintenance, and programming languages. Workshops were conducted for users from SLC and the trading community to raise awareness of the CRD. In total TCP provided 170 hours of training to more than 12 individuals. TCP also partnered with the Ceylon Chamber of Commerce to create a “users group” to be the liaison between traders and the SLC. This group is expected to communicate new information requirements so SLC can keep the database current.
Hardware and training were provided with SLC’s eventual ownership of the CRD in mind. SLC’s ADP Division began using the CRD in August 2007 and the system was officially transferred on October 15, 2007. At the request of the Director of the Policy Planning and Research Division, TCP presented the CRD to senior and middle managers at a workshop on the day of the transfer. The workshop was presided over by the Director General of Customs and was attended by 90 directors, division heads, and officials representing 14 divisions. A representative from the Ceylon Chamber of Commerce was present to emphasize the value of communication between the private sector and SLC to refine CRD functionality.
Results TCP completed or exceeded all deliverables for this assignment. TCP collected legislative enactments and regulations for public access on the CRD, the only known such set of documents; formulated a “total tax calculator,” a tool for estimating taxes on imports and assessing the feasibility of businesses; set up of a Customs Services User Group to liaise with SLC and provide a stimulus to keep the database current; and convinced and enabled SLC to update the tariff table
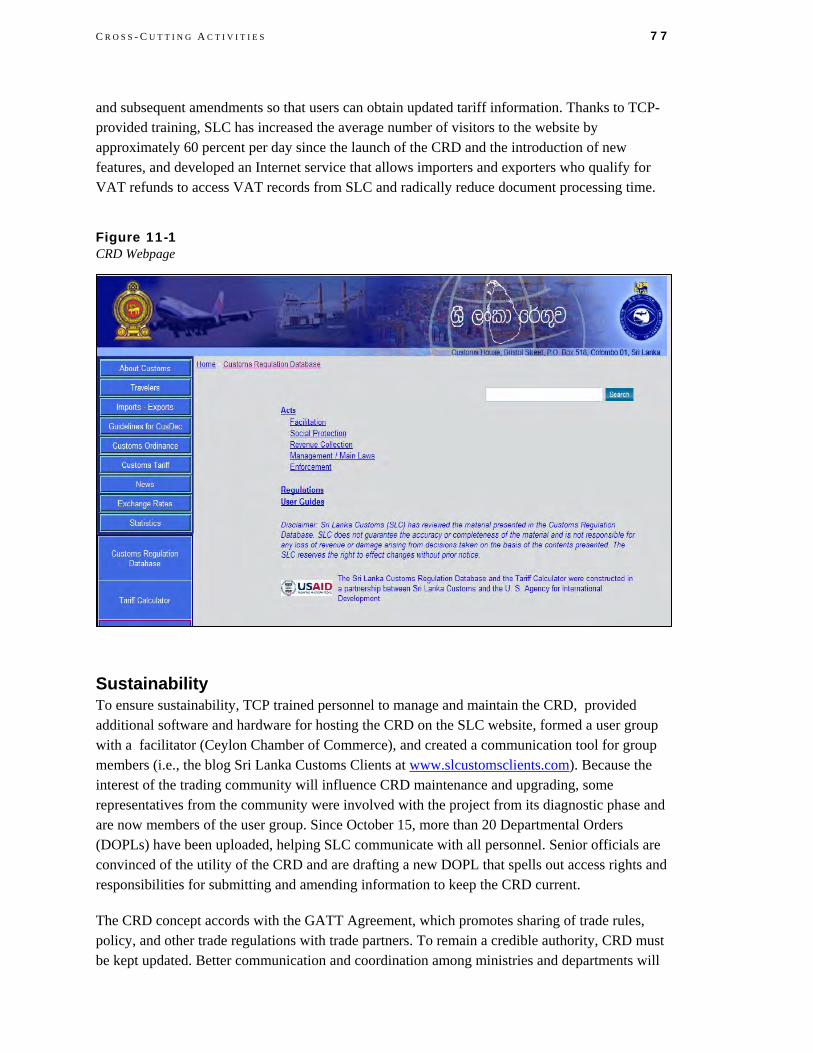
C R O S S - C U T T I N G A C T I V I T I E S 77
and subsequent amendments so that users can obtain updated tariff information. Thanks to TCP-provided training, SLC has increased the average number of visitors to the website by approximately 60 percent per day since the launch of the CRD and the introduction of new features, and developed an Internet service that allows importers and exporters who qualify for VAT refunds to access VAT records from SLC and radically reduce document processing time.
Figure 11-1 CRD Webpage
Sustainability To ensure sustainability, TCP trained personnel to manage and maintain the CRD, provided additional software and hardware for hosting the CRD on the SLC website, formed a user group with a facilitator (Ceylon Chamber of Commerce), and created a communication tool for group members (i.e., the blog Sri Lanka Customs Clients at www.slcustomsclients.com). Because the interest of the trading community will influence CRD maintenance and upgrading, some representatives from the community were involved with the project from its diagnostic phase and are now members of the user group. Since October 15, more than 20 Departmental Orders (DOPLs) have been uploaded, helping SLC communicate with all personnel. Senior officials are convinced of the utility of the CRD and are drafting a new DOPL that spells out access rights and responsibilities for submitting and amending information to keep the CRD current.
The CRD concept accords with the GATT Agreement, which promotes sharing of trade rules, policy, and other trade regulations with trade partners. To remain a credible authority, CRD must be kept updated. Better communication and coordination among ministries and departments will
78 T C P F I N A L R E P O R T
be essential to maintaining current information, and the SLC could appoint an officer to maintain direct contact with the Government Publications Bureau and update the CRD accordingly.
SLC officers and traders alike have recommended revising Sri Lanka’s 163-year old Customs Ordinance Laws. Modern laws will enable SLC to be progressive and improve service. This area should be considered for future technical assistance.
Lessons Learned TCP’s success with the Department of Customs will have a good effect on general competitiveness in Sri Lanka well into the future. In addition, other government offices are taking notice of what the Department has achieved and are trying to make their own websites more useful and attractive for internal as well as external communication. The Inland Revenue Department, for example, is studying the CRD for ways to improve its own database of VAT vendor refunds.
We note that TCP’s work with the Department of Customs occurred during a period when much of the government was discouraged from working with foreign advisers. TCP undertook the work with little or no fanfare and without lectures in economic ideology or outlook, appealing to managers simply on the basis of workload and performance. The lesson: incremental improvements in the business environment may be more readily attained than quantum leaps requiring major or radical changes—but can still be significant.
LOGISTICS PERFORMANCE The World Bank estimates that it takes 25-27 days to import or export from Sri Lanka, an unusually long time for an island country. Logistics and Colombo’s hub status affect not only imports and exports, but also export activities that rely on imported inputs. The purpose of TCP’s study of logistics practices was to help the private sector raise awareness of the threat to Colombo’s hub status if logistics and port performance were not improved. The activity gave private and public stakeholders objective bases and tools to impel debate toward action, and helped support or create a stakeholder group that could take on the cause of logistics performance.
Hidden Costs The logistics chain is a system of links and nodes that represent transport legs and processes. Direct costs such as transportation, warehousing, handling, and port charges are usually obvious, but firms must also contend with indirect costs due to high inventories, stock-outs, obsolescence, delays, or poor truck use. Shippers, for example, can be victims of onerous procedures that delay domestic or cross-border shipments. Slow cargo loading or discharge rates extend a vessel’s time in port, incurring an extraordinary cost that is passed on to shippers in high freight rates.
FastPath for Clear, Credible Assessments With USAID’s support, Nathan Associates Inc. developed “FastPath,” software for assessing the performance of transport logistics chain from a shipper’s perspective. FastPath quantifies performance in terms of time, cost, and reliability for systematic assessing of the impact of any problem and solution in the chain. It prioritizes specific areas for improvement with credibility and transparency evident to all stakeholders.

C R O S S - C U T T I N G A C T I V I T I E S 79
Congestion at the port or warehouse gates increases truck transit times, translating to higher charges for hinterland transport and product loss in the case of perishable goods. These problems also raise concerns about the reliability of the logistics chain. Hence, time, cost, and reliability are all variables in logistics chain performance.
FastPath Methodology Several TCP clusters, and a much wider group of other industries in Sri Lanka, viewed these issues as important to their competitiveness. But the issues were not easy to assess. Discussion was dominated by anecdotal information and complicated if not altogether erroneous comparisons—a problem typical in many developing countries. As part of its evaluation of logistics performance in Sri Lanka, TCP decided to apply the FastPath methodology.
Diagnostic Team In the third quarter of 2006, TCP assembled a diagnostic team consisting of representatives from the clusters, the Sri Lanka Freight Forwarding Association, the Joint Apparel Association Forum, and the University of Moratuwa’s Department of Transport and Logistics, as well as the Chief Manager Port Logistics from the Sri Lanka Ports Authority (SLPA). In the fourth quarter, the Director General of Customs endorsed the activity and appointed Mr. Lalitha Weerasinghe Assistant DGC in charge of automation to join the team. Expatriate consultants included Peter Cook, Mauricio Posada, Paola Pedroza, and Julian Barona Motlak. Twenty people attended the kick-off workshop held on October 31, including representatives from Colombo Port, customs, academia, freight forwarders, and the tea, rubber, spices, coir, apparel, and logistics industries.
Data Collection and Modeling To collect data, the diagnostic team prepared questionnaires, conducted Internet and literature research, interviewed private sector representatives and government officials (e.g. port, customs, railways, highways, transportation). Collection, recording, and auditing continued into the first quarter of 2007. In February, Dr. Jayaweera of the Strategic Enterprise Management Agency (SEMA) joined the FastPath team. SEMA, which is charged with making state enterprises more efficient and which reports to the President’s office, studies initiatives that affect the transport/logistics sector, and aims to pursue public–private partnerships in logistics. Sector performance will have to be monitored and SEMA seemed a likely organization for this responsibility. The team was guided by an inception report and shared findings with stakeholders in a survey report, working papers, and workshop on February 22, 2007.
In the second quarter, data gathered on a sample set of logistics corridors was entered into the FastPath simulation tool to evaluate corridor performance. Modeling and analysis were completed in May and the final workshop was held on May 29, 2007 at Colombo Hilton. About 35 people attended.
Conclusions The final report was distributed to stakeholders in the third quarter of 2007. It described the audit of the transport/logistics system, presented detailed analysis of system performance from the

80 T C P F I N A L R E P O R T
viewpoint of importers and exporters, and analyzed five logistics corridors. The state of various logistics sectors was analyzed along with operations, infrastructure, and policy. The results for Sri Lanka were compared with other countries in the region. Among the most significant findings were the following:
• Customs. Sri Lanka Customs needs to improve clearance processes and electronic data interchange. It needs to set up a single electronic window or portal for customs data and coordinate it with other import and export documentation needs.
• Colombo Port. Recognized as a transshipment port with a full range of container services, Colombo is reaching the capacity limit of its container terminals. Plans for new management software should be expedited. The current turning basin will be unable to handle many of the future large container vessels, but this should be addressed by the South Port extension. Off-dock container yards are not optimized and there are no inland dry ports.
• Freight Transport. There are no modern limited access highways or ring roads in Sri Lanka, but some are being built as toll roads and others are planned. The truck fleet for container transport is very limited. The rail connection to the port is not used. This is far behind other countries.
• Service Providers. Being licensed as a freight forwarder is easy, but there are no standards or quality control. The industry is highly fragmented. Only a few service providers offer information on cargo tracking and other advanced services for shippers. Sri Lanka is behind in this area.
The report documents in detail the analysis of transport/logistics performance and recommends improvement under a number of areas, including Sri Lanka Port, road transport, rail transport, and other logistics services. The final report included an action plan for implementing recommendations.
SMALL GRANT PROGRAM Signed in October 2004, Modification 01 to Task Order 841 equipped TCP with a small grants program, something new to competitiveness task orders in Sri Lanka. The modification provided up to US$500,000 for a subgrant component that would enable TCP to “authorize and commission work with local private sector firms or NGOs” to set precedents for public–private partnerships in development and competitiveness objectives.
TCP designed its program without earmarks for clusters or activities so that applications would be in competition with each other and awarded on merit. Two main requirements were cost-sharing and economic impact as measured by sales, margins/profits, employment, wages and payments to other links in the in the value chain, especially in rural areas, preferably within one year. Beneficiaries also had to document results and be willing to share nonproprietary information with USAID, TCP, other clusters, and the broader public
The program began in November 2004 with the arrival of expatriate consultant, Jeanine Hubler, who prepared a program summary for CTO approval. She also prepared a handbook for beneficiaries—The Competitiveness Program: Small Grants Program—and a manual for internal
C R O S S - C U T T I N G A C T I V I T I E S 81
guidance. TCP officers used the manuals and other materials to explain the program and to encourage and support private sector initiatives, including those that advanced competitiveness at the firm and industry level and that benefited rural areas. Given the tight focus of the program, TCP decided against public advertising.
The tsunami of December 2004 delayed and slowed program implementation. On March 10, 2005, TCP couriered the grant beneficiary handbook along with letters of invitation to clusters. The original deadline for submitting proposals was April 18. The program was offered first to clusters that worked with TCP. TCP selected seven grantees from the first round. Another four were later selected. Three grants were awarded to entities outside the clusters and eight to clusters or to entities in the clusters. At the end of the program in August 2007, TCP audited all grants.
Grants Awarded Over three years, TCP screened more than 24 proposals and awarded 11 grants totaling US$255,936 (see Table 11-1). Grantee contributions raised the value of funded activities to US$358,679. The amount of the awards was less than the planned mainly because of the tsunami. After the tsunami many firms became involved in relief and rehabilitation grant programs from other sources, typically much larger than TCP’s. Interest in the small grant program revived in 2006, but TCP’s requirements for monitoring and evaluation of demonstrated impacts limited the scope for awards to those that could be implemented quickly. The amount of disbursements was less than the amount awarded due to cost savings, and some reduction in scale after the awards. In one case an upsurge in conflict in the area outside Trincomalee impeded implementation and necessitated a major reduction.
Wildlife Guide Training Handbook Sri Lanka was featured in National Geographic wildlife special on leopards in Yala, and is well known among birding enthusiasts for its indigenous species and status as southern terminus for many migratory species. Wildlife tourism is a growing segment of international tourism and tourism to Sri Lanka, but Sri Lanka is not promoting this aspect of its tourism attractions enough and has been slow to develop resources for this niche. To boost development, TCP provided a cost-share grant of US$11,118 to Jetwing Eco Holidays to design and publish a pocket-sized guidebook on fauna likely to be seen in the dry zone national parks and reserves. Photo captions are in English, Sinhala, French, and German. On November 9, 2006, 1,100 copies were officially released to the tourism cluster, the Sri Lanka Tourist Board, the Department of Wildlife Conservation, and the Forest Department for use in guide training and as a field manual for outings.
“Facets Sri Lanka” The Sri Lanka Gem and Jewelry Association was awarded a grant on July 14, 2005, to build showcases and tables in time for the Facets international gem and jewelry exposition in August. That year the fair, organized in large part by the gem and jewelry cluster, succeeded in their goal of achieving a major expansion. Supported by more advertising and a hosted at a new location, the number of booths increased 43 percent to 150; SLGJA planned to have 200 booths in 2006.
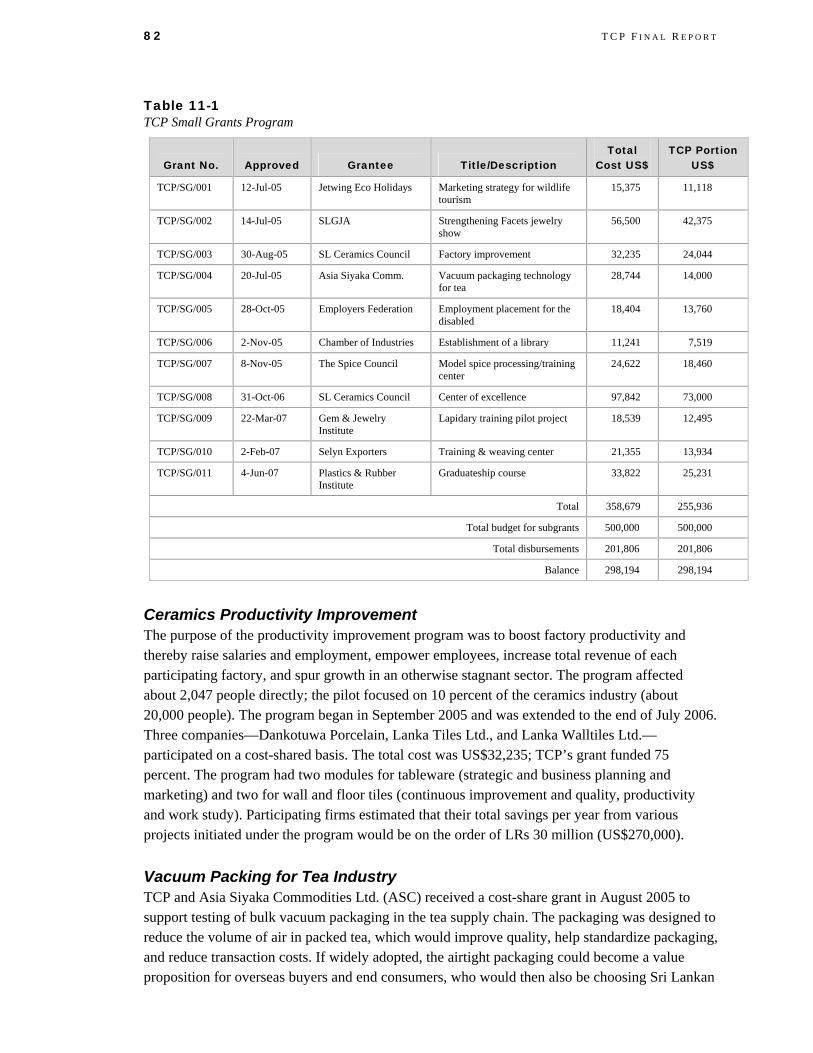
82 T C P F I N A L R E P O R T
Table 11-1 TCP Small Grants Program
Grant No. Approved Grantee Title/Description Total
Cost US$ TCP Portion
US$
TCP/SG/001 12-Jul-05 Jetwing Eco Holidays Marketing strategy for wildlife tourism
15,375 11,118
TCP/SG/002 14-Jul-05 SLGJA Strengthening Facets jewelry show
56,500 42,375
TCP/SG/003 30-Aug-05 SL Ceramics Council Factory improvement 32,235 24,044
TCP/SG/004 20-Jul-05 Asia Siyaka Comm. Vacuum packaging technology for tea
28,744 14,000
TCP/SG/005 28-Oct-05 Employers Federation Employment placement for the disabled
18,404 13,760
TCP/SG/006 2-Nov-05 Chamber of Industries Establishment of a library 11,241 7,519
TCP/SG/007 8-Nov-05 The Spice Council Model spice processing/training center
24,622 18,460
TCP/SG/008 31-Oct-06 SL Ceramics Council Center of excellence 97,842 73,000
TCP/SG/009 22-Mar-07 Gem & Jewelry Institute
Lapidary training pilot project 18,539 12,495
TCP/SG/010 2-Feb-07 Selyn Exporters Training & weaving center 21,355 13,934
TCP/SG/011 4-Jun-07 Plastics & Rubber Institute
Graduateship course 33,822 25,231
Total 358,679 255,936
Total budget for subgrants 500,000 500,000
Total disbursements 201,806 201,806
Balance 298,194 298,194
Ceramics Productivity Improvement The purpose of the productivity improvement program was to boost factory productivity and thereby raise salaries and employment, empower employees, increase total revenue of each participating factory, and spur growth in an otherwise stagnant sector. The program affected about 2,047 people directly; the pilot focused on 10 percent of the ceramics industry (about 20,000 people). The program began in September 2005 and was extended to the end of July 2006. Three companies—Dankotuwa Porcelain, Lanka Tiles Ltd., and Lanka Walltiles Ltd.—participated on a cost-shared basis. The total cost was US$32,235; TCP’s grant funded 75 percent. The program had two modules for tableware (strategic and business planning and marketing) and two for wall and floor tiles (continuous improvement and quality, productivity and work study). Participating firms estimated that their total savings per year from various projects initiated under the program would be on the order of LRs 30 million (US$270,000).
Vacuum Packing for Tea Industry TCP and Asia Siyaka Commodities Ltd. (ASC) received a cost-share grant in August 2005 to support testing of bulk vacuum packaging in the tea supply chain. The packaging was designed to reduce the volume of air in packed tea, which would improve quality, help standardize packaging, and reduce transaction costs. If widely adopted, the airtight packaging could become a value proposition for overseas buyers and end consumers, who would then also be choosing Sri Lankan
C R O S S - C U T T I N G A C T I V I T I E S 83
tea for its well-preserved freshness and flavor. Development and testing combined the resources of the tea cluster and the Tea Research Institute (TRI) in Talawakelle. ASC, with TRI as a technical partner, tested and documented results and held workshops that culminated in a presentation to more than 200 industry stakeholders on October 13, 2006 at the Cinnamon Grande hotel. Test results showed technical improvements and cost savings. ASC has offered free use of the machine and vacpacs to clusters interested in trials for their own products. The spice cluster and representatives of the desiccated coconut industry expressed interest.
Job Fair for the Disabled TCP awarded a grant of US$13,760 to the Employer’s Federation of Ceylon to hold three job fairs for disabled persons seeking employment. The first fair was held on October 31, 2005, in Colombo; 42 employers participated and 100 jobseekers attended. Forty-four applicants secured employment through the fair.
Library The Ceylon National Chamber of Industries wanted to develop and maintain a library on industrial, commercial, and economic matters for the benefit of its members, other chambers and associations, and the general public. TCP awarded a cost-share grant of US$7,519 to set up the library and a computer help desk. TCP paid for furniture, an inaugural plaque, a computer and peripherals, a TV, a DVD player, and books. The library was officially opened by Dr. Carol Becker, the USAID Mission Director, on July 12, 2006.
Model Spice Processing Facility in Matale District In 2002, TCI helped the spice cluster agree on a strategy to “improve the quality, quantity and consistency of the spice supply” to strengthen linkages between exporters and processors. To support one initiative under this strategy, TCP provided a grant for a processing and training center at Rattota in the spice-growing district of Matale in the Central Province. The Department of Export Agriculture and the Economic Strategy Support Program (GTZ) in Kandy recommended that the Spice Producer’s Circle in Maradurawela and Galekoluwa in the Grama Seva Division of Rattota implement the project. Matale Natural Spices (Pvt) Ltd. (MNS)—a collaboration between TSC and the Spice Circle—was incorporated under the Companies Act. TSC invested LRs 80,000 (US$800) and seven members of the Spice Circle each invested LRs 20,000 (US$200) and are company shareholders. The company acquired 20 perches of land to set up the facility.
The total cost of the project was LRs 2.5 million; the TCP grant (75 percent) provided for the following items:
• Artificial spice dryer • Incorporation costs • Infrastructure for the processing and training facility • Equipment and furniture • Training on developing a company business plan • Training on operations and best practices.
84 T C P F I N A L R E P O R T
The artificial dryer was designed and fabricated locally. The facility began trial operations in the first quarter of 2007. It can process 450kg of pepper every 18 hours using dried glyricidia chips as fuel. Glyricidia is an abundant, fast-growing shrub, essentially a renewable resource in the villages. The Department of Export Agriculture provided technical assistance and supplied other primary processing equipment. A smallholder organization was formed to further improve supply quality and consistency and to link smallholders with exporters and processors to boost returns, incomes, and standards of living.
A workshop on quality improvement and best practices was held on June 16, 2007; 50 members of the smallholder organization—6 of them women—attended. The training center will help more than 100 farmers employ best practices in spice cultivation and processing. Several training programs have already been conducted. The center was officially opened by Ms. Rebecca Cohn, USAID Mission Director on July 20, 2007.
Cargills Food City has expressed interest in purchasing packaged spices from MNS according to their specifications at a premium price.
Final total expenditure was LRs 1.9 million, of which the TCP grant funded 73 percent. Separately, TCP recruited a local sociologist to develop a method for evaluating rural impact; the method was shared with TSC and the smallholder organization.
Ceramics Center of Technical Excellence The ceramics industry had no institutes or centers with state-of- the-art testing, laboratory, and plant equipment. The Industrial Technology Institute, the universities, and the Ceramic Research and Development Centre (now owned by Lanka Ceramic Ltd.) did not have equipment to meet the industry’s present demands. The SLACC proposed to establish a center of excellence for ceramics research and development and accreditation. The TCP grant was planned to 75 percent of the total cost with SLACC to fund the balance. Under the grant, SLACC—with TCP assistance in managing procurements—obtained a dilatometer, a three-point bending strength tester, a viscometer, a computer, a printer, UPS, office furniture, membership in U.S. professional bodies, and journals and books. The center will operate as a public-private partnership providing testing and R&D services to the ceramics sector. The USAID Mission Director officially opened CENTEC on April 5, 2007. Based on the audit of qualifying expenditures in August 2007, the total project cost was LRs11.5 million. TCP’s share was 65 percent; CENTEC’s was 35 percent.
Lapidary Training Program In March 2007, USAID approved a small grant for the Gem and Jewelry Institute (GJI) to train 20 entrants in lapidary and begin a revolving fund for training. The program began on March 28 with 16 students. Total cost for the three-month program was US$18,539.
In February, GJI prepared the project and recruited trainees. It sought unemployed persons from underprivileged families in disadvantaged districts who had studied up to the General Certificate of Education-Ordinary Level (GCE-O/L). Trainees would then fulfill a mandatory period of internship with two lapidaries who had expressed interest in employing them. The immediate objective was to train 20 school leavers in lapidary; the long-term objective was to promote

C R O S S - C U T T I N G A C T I V I T I E S 85
lapidary as a viable employment path among youth and school leavers by meeting local and foreign demand for trained lapidaries and to deliver intermediate and advanced training to industry workers to meet their need for continuous professional education.
Training was delivered from April to June 2007; the final number trained was 10. All 10 were absorbed for employment by a gem cutting company and agreements were signed with them. Owing to the success of the program, GJI used internal funds to begin a second training program
Training and Weaving Center Selyn Exporters, a manufacturer of handwoven products, proposed to upgrade supply and production of reed-based and handwoven fabric by creating a center in Manampitiya, a border village in the North Central Province. Selyn would work with 20 to 25 women directly at the center, then another 80 for outsourcing work. By improving quality and weaving new designs, the women at the center and other weavers in the village would be able to increase revenue and sustain incomes year round.
On March 2, 2007, Selyn signed a grant agreement and agreed to a buy-back arrangement and to provide technical assistance in product development and quality improvement. The project was to be implemented as a pilot with the hope of replication in other villages. The total value was US$21,355. The project was to be completed by July.
In the second quarter of 2007, Selyn installed four weaving machines at the center. It trained 2 women from the village, one on reed weaving and the other on handwoven fabric, and 14 other women—9 short of the grant agreement. An upsurge in the conflict situation in the late summer of 2007 around Manampitiya, Dimbulagala, and Thoppigala, however, made it impossible for the grantee to complete activities during the grant period. The grant was scaled down significantly to 1/20th the planned size.
Plastics and Rubber Institute, Graduate Certificate The Plastics and Rubber Institute is the industry’s premier provider of technical training and education. In 2006, nearly 100 employees enrolled in the institute’s four courses. The basic courses were very successful and the industry was keen to fill gaps in advanced training. PRISL sought TCP’s support to set up facilities at Rajagiriya to begin a three-year, part-time graduate course in rubber science and technology for 20 persons, 5 of whom were expected to be women. The course was designed to accommodate employed professionals. In view of demand, PRISL increased the intake of students for the course to 30. Total estimated cost was US$ 33,822 the bulk of which went to upgrade the PRI library with 355 new textbooks on rubber and polymer technology. TCP also provided a multimedia projector, overhead projector, and scanner, all valued at LRs 203,500 (US$ 1,850). The course was officially opened by Ms. Rebecca Cohn, USAID Mission Director on July 7, 2007.

12. Other Activities This section covers other TCP activities to improve Sri Lanka’s competitiveness in global markets: workforce development, global competitiveness rankings and studies, firm-level competitiveness, comparative studies of other emerging economies, and monitoring and reporting.
WORKFORCE DEVELOPMENT In addition to its work with individual clusters on workforce development and training discussed earlier, TCP contributed to two other programs that will have a broad impact on workforce development.
Center of Excellence in English Language Training The TCP industry clusters and other exporters in Sri Lanka all recognize the strategic value of English language skills for competing in the global marketplace. For that reason, they asked TCP and Ministry of Education (MOE) officials to address the core need for a workforce that can communicate in English. In April 2006, TCP fielded a specialist who worked with Pradeep Liyanamana and senior officials in the MOE to develop a business plan for a program and a center to improve English language training skills, especially deficiency was at the secondary school level. Recommendations focused on improving the standards for English teaching and included the following particulars:
• Designate the Center for Excellence in English Language Teaching (CEELT) to provide leadership.
• Establish CEELT as an autonomous degree-granting government-owned institute governed by a council of Directors, one-third of whom would be drawn from the private sector, with oversight by the MOE.
• Make CEELT the sole authority for accreditation of public and private tertiary institutions and organizations training English teachers.
• Authorize CEELT to design and conduct training for English teacher trainers and teachers; manage and supervise training outsourced to accredited institutions and organizations; contract for training with public and private institutions and organizations; conduct research, monitoring and evaluation studies; and carry out other programs and activities to improve the skills of Sri Lanka’s workforce.
88 T C P F I N A L R E P O R T
On the basis of these recommendations, TCP presented a business plan to the Hon. Minister of Education, who endorsed the plan and submitted it to the Asian Development Bank under the Secondary Education Development Program (SEDP) Phase III. In October 2007, the ADB signed a loan agreement with Sri Lanka to develop the secondary education system. A specific component of the new agreement will be to set up CEELT; $US 1 million is earmarked for CEELT, to be established according to the business plan developed with TCP assistance.
Young Entrepreneurs Sri Lanka Program One of TCP’s responsibilities under its July 2004 SOW was to help the Junior Achievement program in Sri Lanka, known as Young Entrepreneurs of Sri Lanka (YESL), improve. YESL is a non-profit group that teaches high school students and other youth how a free market economy operates. It started in 1996 with USAID support and has surpassed its goal of creating 20 programs to reach 1,600 students. Today it operates about 926 programs and reaches 32,000 students. Students form companies, elect officers, devise and execute business plans, sell products or services, and report results to board members and investors.
TCP connected YESL with private sector cluster partners, provided technical assistance for a strategic plan to improve financial sustainability and improve offerings, and recruited mentors to work with students. TCP also funded the attendance of YESL’s CEO, Mr Permasiri Weliwita, at the Junior Achievement Worldwide (JAW) National Leadership Conference in San Antonio, Texas, July 3-11, 2004. YESL has been represented on JAW’s Member Nation Council since 1999, which has given Sri Lanka the opportunity to try out country-specific initiatives and share its perspective in a multinational forum.
Early in 2006 TCP set up a technical assistance mission to help YESL develop a strategic plan and fundraising program. A technical assistance team from JAW—Linda Claflin and Nancy Keel—met senior stakeholders and worked closely with the YESL board and staff, the USAID Mission, TCP, participating schools, and private sector stakeholders in Sri Lanka in February 2006. Their final report submitted in March 2006, called for a significant restructuring of YESL organizational leadership, its links to the private sector and it regional coverage.
YESL began acting on the recommendations in 2006. It changed its organizational structure, created a panel of “Blue Ribbon” private sector advisors, and submitted proposals to several donors, including USAID, for funding under a matching arrangement. Progress on administrative and management changes led USAID to agree to give YESL a US$300,000 two-year grant in November 2006. As TCP closed in November 2007, YESL was one year into implementing its plan with USAID grant funds plus more than LRs 700,000 (US$70,000) from Sri Lanka’s private sector. YESL has also added regional staff and improved its programs in outlying areas.
GLOBAL COMPETITIVENESS REPORT Competitiveness is a mega-trend in globalization. To advance understanding of it, TCP encouraged Sri Lanka to participate in the Global Competitiveness Report (GCR) sponsored annually by the World Economic Forum (WEF). TCI conducted a trial survey on competitiveness measures modeled after WEF’s Executive Opinion Survey (EOS), linking WEF with local partner

O T H E R A C T I V I T I E S 89
the Institute of Policy Studies (IPS). The trial survey produced sound results and generated interest in the public and private sectors. Sri Lanka was ranked for the first time in the official GCR for 2001–2002. Since then, TCP provided IPS with cost-share funding to conduct the EOS and provide other information necessary for Sri Lanka’s inclusion in the GCR.
In 2005, TCP arranged for WEF technical experts to visit Sri Lanka on a cost-shared basis. Senior Economist Dr. Irena Mia and Senior Communications Manager Ms. Ciara Browne explained the GCR methodology and how other countries use rankings to guide dialogue on competitiveness and other economic issues. They also helped TCP make arrangements for Sri Lanka’s continued participation. The Ceylon Chamber of Commerce signed an MOU with WEF to be a local partner along with the IPS to continue annual surveys and reporting to ensure Sri Lanka’s continued inclusion in the GCR. On November 1, 2007, the Ceylon Chamber of Commerce hosted the release of the GCR for 2007–2008. Speakers from the private and public sectors endorsed the report as useful in helping to influence policies and investments that will make Sri Lanka more competitive. The BOI representative described the Board’s commitment to tracking Sri Lanka’s ranking in the GCR and other comparative studies, such as the World Bank’s Doing Business, and to using the report to focus on impediments to better rankings as foreign investors are paying more and more attention to rankings.
When first ranked in 2001, Sri Lanka was 61 out of 75 countries. Today, with 131 countries (56 more than in 2001) Sri Lanka’s stands at 70, better than 61 other countries. As coverage has increased, Sri Lanka’s position has risen from the lowest quartile to near the top of the third quartile. In 2004/05 WEF changed its methodology to place more emphasis on technology, one of Sri Lanka’s weaker areas. Still, Sri Lanka’s progress in this area helped it move from 98 in 2004 to 70 in 2007/08. Scores for “private sector strategy” and “innovation” also improved Sri Lanka’s ranking, while weaknesses in government fiscal policy and infrastructure continue to pull it down.
Table 12-1 Sri Lanka’s Competitiveness Rankings, 2001–2007
2001/02 2002/03 2003/04 2004/05 2005/06 2006/07 2007/08
SL’s score (max =7) 3.74 3.80 3.51 3.57 3.10 3.87 3.99
SL’s rank 61 59 73 98 80 79 70
No. countries ranked 75 80 104 117 117 125 131
SOURCE Global Competitiveness Report, World Economic Forum.
FIRM COMPETITIVENESS STUDIES TCP also produced studies of firms and competitiveness that offer lessons to development professionals and which can be used as case studies by institutes in Sri Lanka.
Business Case Studies After discussions with the Ministry of Industries and Investment Promotion TCP undertook two case studies of firms that had demonstrated best practices in competitiveness: Hemas Group, a

90 T C P F I N A L R E P O R T
manufacturing and services company for transportation, textiles, and tourism and consumer products; and Ceylon Biscuits Limited, a confectioner since 1968. Ministry Secretary Upananda Withanapathirana felt that government and academic institutions needed well-written studies of local firms that had grown while overcoming obstacles, especially in the last two decades. TCP was interested in firms that had made the transition from local marketing to exporting or that had competed against multinationals. The case studies would explore the role of government policy and show how the companies dealt with obstacles to competitiveness and developed managerial, professional, and technical skills. In the second quarter of 2005, TCP recruited two local consultants—Ms. Shehara de Silva and Ms. Christine Dias Bandaranaike—each with backgrounds in marketing/business strategy and investment banking/finance to work with TCP’s Resident Advisor Jagdesh Mirchandani on the studies.
The study of Hemas Group was submitted to USAID and findings were presented to members of the Hemas Board of Directors. The study was very well received by Hemas. CEO Husein Esufally indicated that the report provided “useful insight about Hemas’ business and pointed to certain issues going forward.” Ceylon Biscuits Limited (CBL), a family-owned business and the largest biscuit manufacturer and exporter in Sri Lanka, had risen to market prominence through its Munchee brand and had expanded its manufacturing base to India. It had been diversifying its product portfolio since 2000 through acquisitions and investments in new products as it moved from being a biscuit manufacturer to a snack foods company. Both companies agreed that the studies could be shared with a business school program in Sri Lanka.
Figure 12-1 Hemas and CBL Case Studies
In the second quarter of 2006, the studies were transmitted to USAID. In November 2006, Dr. Uditha Liyanage of the Post Graduate Institute of Management (PIM) agreed to use the studies as course material and as reference material in the library. On April 23, 2007, the studies were introduced to senior MBA students by PIM Director Professor Nanayakkara at a luncheon
O T H E R A C T I V I T I E S 91
seminar covered by the local media. The CBL Chairman and Hemas CEO shared their perspectives on their experiences and their companies’ successes. The USAID Mission Director and the PIM Director also spoke. Two hundred softcover copies and two hardcover copies of each study were handed over to PIM in the third quarter of 2007, officially completing this activity.
On September 15, 2007, PIM opened the PIM International Center in Dubai’s “Knowledge Village,” which provides facilities for foreign universities. PIM has attracted more than 140 applicants to its MBA program and admitted 88 candidates for 2007/09. The center provides 180 students with modern classrooms, seminar rooms, a library, and an IT center. Professor Gunapala Nanayakkara, the head of PIM in Sri Lanka, is the Managing Director in Dubai. TCP’s partner in disseminating the case studies has set a good example by pioneering the “export” of educational services.
Benefits of USAID Technical Assistance Technical assistance for firms aims to help them improve information gathering and decision making processes as well as operations. The effect of better decision making, however, takes time to materialize and is difficult to monitor during the term of most technical assistance contracts. TCP agreed to study two firms—Maxie’s Chicken and Selyn Soft Toys—that had received assistance beginning 10 years or more earlier.
The studies documented that these firms had expanded well beyond their original scope and that the benefits of assistance were far beyond that expected or documented when the assistance programs—TIPS and AGENT—ended in 1999. Maxie’s had grown from a one-room operation to a major producer and retailer with 15 branded outlets and 500+ employees. Selyn Soft Toys, which opened in 1991 with only 5 workers, achieved more than US$1 million in exports and now employs 480 persons, 80 percent of them women.
The studies concluded that assistance to a private firm can generate benefits that extend well beyond the timeframe and estimates typical for monitoring the impact of such assistance. Not every assisted firm will achieve such growth; this is simply not in the nature of markets and private competition. But a few will benefit dramatically. The key is connecting the assistance to a talented and determined entrepreneur. The studies also showed that the companies’ success was partly due to their link into a value chain—even directly with a buyer or buyers eager to see them succeed. Hotels and up-market grocery chains (e.g., Cargills) were eager to have a supplier of chicken that met US standards. Selyn had overseas buyers eager for soft toy products from Sri Lanka. In other words, the markets were not in doubt, provided the entrepreneurs could meet required standards.
WWW.COMPETITIVENESS.LK As part of its outreach program, the TCP project hosted a website that featured its activities and reports and also spotlighted issues related to making the Sri Lankan economy more robust and competitive.
92 T C P F I N A L R E P O R T
To help elevate the debate on higher-level policy reforms that will help Sri Lanka’s competitiveness, TCP agreed with the Ministry of Industry and Investment Promotion to produce a table modeled on the Economic and Financial Indicators table (then the Emerging Markets table) that appears on the last page of weekly editions of The Economist magazine.
In 2005, Dr. Jim Mudge, resident economist for TCP, obtained permission from The Economist to use information from the magazine with acknowledgement. Working with Dr. Mudge, Ms. Savanthi Karunasundera developed a table of financial and economic indicators on Sri Lanka and five comparator countries—India, Indonesia, Malaysia, Pakistan, and Thailand. Data for Sri Lanka are largely from the Central Bank; a few other websites are consulted for historical information on currency and stock markets. Data for comparator countries are directly from The Economist. The format is compatible with tabular presentations in The Economist (see Figure 12-2). The table helped educate the public about comparative fiscal and economic performance. Comparing Sri Lanka’s relatively poor performance in consumer price changes, for example, raised awareness of unsustainable monetary policy and contributed to the monitoring and reporting crucial to government transparency and accountability. In December 2007, TCP contacted the managing editor of Lanka Business Online about continuing the table after the close of TCP, and received permission from The Economist for Lanka Business Online to continue the table under its own auspices.
To facilitate a transition, Nathan Associates has continued to host the website beyond the end date of the task order with USAID at its own expense.
MONITORING AND REPORTING This section reports on TCP’s monitoring and reporting of its activities and of other activities as requested by the Mission in Modification 01 to the TCP SOW.
Assisting USAID Grantees (SENCE Grant) Modification 001 of October 2004 authorized TCP to provide administration and management services to NGOs that had received USAID grants for programs implemented in or affecting areas relevant to TCP. TCP monitored and reported on awardees’ progress reports and vouchers under cooperative grant agreements issued to entities other than TCP, with some on-the-job training also provided as requested by the Mission.
Potential grantees, at the time, included the Young Entrepreneurs of Sri Lanka (YESL) and the Ceylon Chamber of Commerce (CCC) acting for a coalition formed to assist implementation of a new rainforest ecolodge project. Following a special technical assistance assignment that TCP arranged through Junior Achievement International with recommendations for restructuring YESL, the Mission decided to directly monitor activities under that grant. TCP’s only activities in this category were to assist the Alliance to Support Environment and Community through Ecotourism (SENCE), which signed a cooperative agreement grant for $900,000 in June 2005. The SENCE agreement provides auxiliary support through technical assistance and cost-share funding to private sector investment of US$2 million from the Rainforest Ecolodge
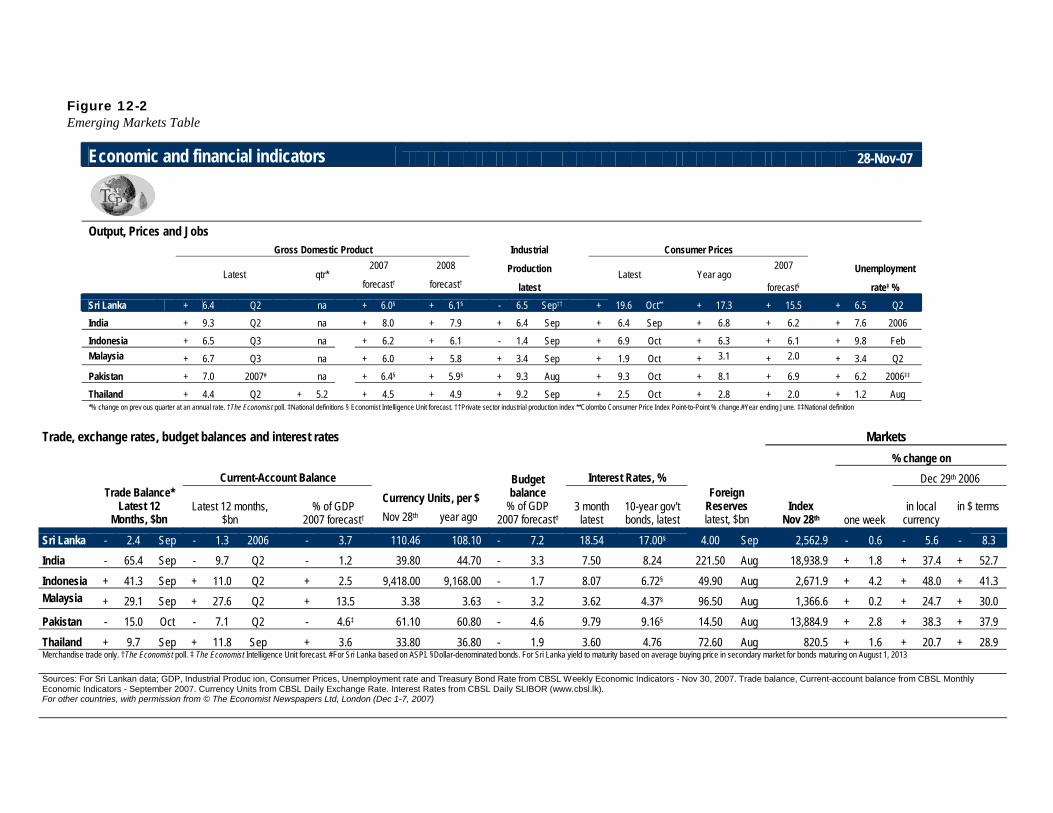
Figure 12-2 Emerging Markets Table
Economic and financial indicators 28-Nov-07
Output, Prices and Jobs Gross Domestic Product Industrial Consumer Prices 2007 2008 Production 2007 Unemployment
Latest qtr*
forecast† forecast† latest Latest
Year ago
forecast§ rate‡ % Sri Lanka + 6.4 Q2 na + 6.0§ + 6.1§ - 6.5 Sep†† + 19.6 Oct** + 17.3 + 15.5 + 6.5 Q2 India + 9.3 Q2 na + 8.0 + 7.9 + 6.4 Sep + 6.4 Sep + 6.8 + 6.2 + 7.6 2006
Indonesia + 6.5 Q3 na + 6.2 + 6.1 - 1.4 Sep + 6.9 Oct + 6.3 + 6.1 + 9.8 Feb Malaysia + 6.7 Q3 na + 6.0 + 5.8 + 3.4 Sep + 1.9 Oct + 3.1 + 2.0 + 3.4 Q2 Pakistan + 7.0 2007# na + 6.4§ + 5.9§ + 9.3 Aug + 9.3 Oct + 8.1 + 6.9 + 6.2 2006‡‡
Thailand + 4.4 Q2 + 5.2 + 4.5 + 4.9 + 9.2 Sep + 2.5 Oct + 2.8 + 2.0 + 1.2 Aug *% change on prev ous quarter at an annual rate. †The Economist poll. ‡National definitions § Economist Intelligence Unit forecast. ††Private sector industrial production index **Colombo Consumer Price Index Point-to-Point % change.#Year ending June. ‡‡National definition
Trade, exchange rates, budget balances and interest rates Markets
% change on Current-Account Balance Interest Rates, % Dec 29th 2006
Currency Units, per $
$ terms
Trade Balance* Latest 12
Months, $bn Latest 12 months,
$bn % of GDP
2007 forecast† Nov 28th year ago
Budget balance
% of GDP 2007 forecast‡
3 month latest
10-year gov't bonds, latest
Foreign Reserves latest, $bn
Index Nov 28th one week
in local currency
in
Sri Lanka - 2.4 Sep - 1.3 2006 - 3.7 110.46 108.10 - 7.2 18.54 17.00§ 4.00 Sep 2,562.9 - 0.6 - 5.6 - 8.3 India - 65.4 Sep - 9.7 Q2 - 1.2 39.80 44.70 - 3.3 7.50 8.24 221.50 Aug 18,938.9 + 1.8 + 37.4 + 52.7
Indonesia + 41.3 Sep + 11.0 Q2 + 2.5 9,418.00 9,168.00 - 1.7 8.07 6.72§ 49.90 Aug 2,671.9 + 4.2 + 48.0 + 41.3 Malaysia + 29.1 Sep + 27.6 Q2 + 13.5 3.38 3.63 - 3.2 3.62 4.37§ 96.50 Aug 1,366.6 + 0.2 + 24.7 + 30.0
Pakistan - 15.0 Oct - 7.1 Q2 - 4.6‡ 61.10 60.80 - 4.6 9.79 9.16§ 14.50 Aug 13,884.9 + 2.8 + 38.3 + 37.9
Thailand + 9.7 Sep + 11.8 Sep + 3.6 33.80 36.80 - 1.9 3.60 4.76 72.60 Aug 820.5 + 1.6 + 20.7 + 28.9 Merchandise trade only. †The Economist poll. ‡ The Economist Intelligence Unit forecast. #For Sri Lanka based on ASPI. §Dollar-denominated bonds. For Sri Lanka yield to maturity based on average buying price in secondary market for bonds maturing on August 1, 2013
Sourc hly EconFor ot
es: For Sri Lankan data; GDP, Industrial Produc ion, Consumer Prices, Unemployment rate and Treasury Bond Rate from CBSL Weekly Economic Indicators - Nov 30, 2007. Trade balance, Current-account balance from CBSL Montomic Indicators - September 2007. Currency Units from CBSL Daily Exchange Rate. Interest Rates from CBSL Daily SLIBOR (www.cbsl.lk). her countries, with permission from © The Economist Newspapers Ltd, London (Dec 1-7, 2007)
94 T C P F I N A L R E P O R T
Company (REC) to develop an ecolodge adjacent to the Sinharaja Rainforest. Beginning in October 2005, TCP helped train SENCE personnel (project coordinator, board of directors and bookkeepers with the CCC) in their responsibilities for implementation, reporting, and record keeping. TCP helped SENCE to set up its workplan, progress reporting systems, bookkeeping systems, and systems for preparing monthly payment vouchers for submission to USAID. TCP continued to help with bookkeeping and vouchers until the second quarter of 2007, when it advised USAID that local political opposition to ecolodge construction would prevent project completion by June 30, 2007. TCP helped SENCE revise its implementation plan and budget, which included deobligating $307,000. As the TCP project ended, REC’s building permits had been confirmed at the Presidential level and local opposition had abated. The SENCE grant had been extended to April 2008, and the TCP program specialist, Dilhara Goonewardena relocated to the Ceylon Chamber of Commerce to assume the SENCE program director position.
Cluster Association Development Index TCP periodically assessed clusters as working groups, then as service organizations. Assessments began with simple questions about the ability of the cluster to serve members. TCP then developed a formal gauge of operational and financial independence. The Cluster Association Development Index (CADI) measured operational and financial capacity and provided a framework for collecting information and feedback on cluster strengthening activities. It covered five measures:
• Legal and administrative infrastructure • Resource mobilization and management • Communication and coordination • Sustainability and accountability • Linkages and alliances.
Evaluators posed 17 questions that could be answered with a simple yes or no—and could be objectively verified. The questions by category are shown in Table 12-2. A “yes” was scored 1 (evaluators sometimes used .5 to show progress). The CADI overlooked some “subjective” aspects of organizational strength but provided an objective measure that could be used consistently over time.
For PMP reporting, TCP created a weighted index summarizing data for all clusters. From 2004 to 2007, the CADI scores for all clusters improved from 83 percent to 91 percent of the maximum possible. This means that most clusters reached and demonstrated the basic capacity needed to function and sustain operations as a body that could represent its members and promote industry competitiveness.
In TCP, the CADI was a benchmark for evaluating the capacity of each cluster to design, finance, and undertake strategic initiatives that promoted competitiveness and private sector development in sustainable ways. Each cluster had to be effective and have representational legitimacy—be in contact with and “represent” the value chain with all that implies for association responsibilities and good governance. Each also had to be able to mobilize resources, write proposals, and manage and implement initiatives. One of TCP’s main accomplishments was helping the private sector create apex bodies and other cluster successors capable of funding and implementing
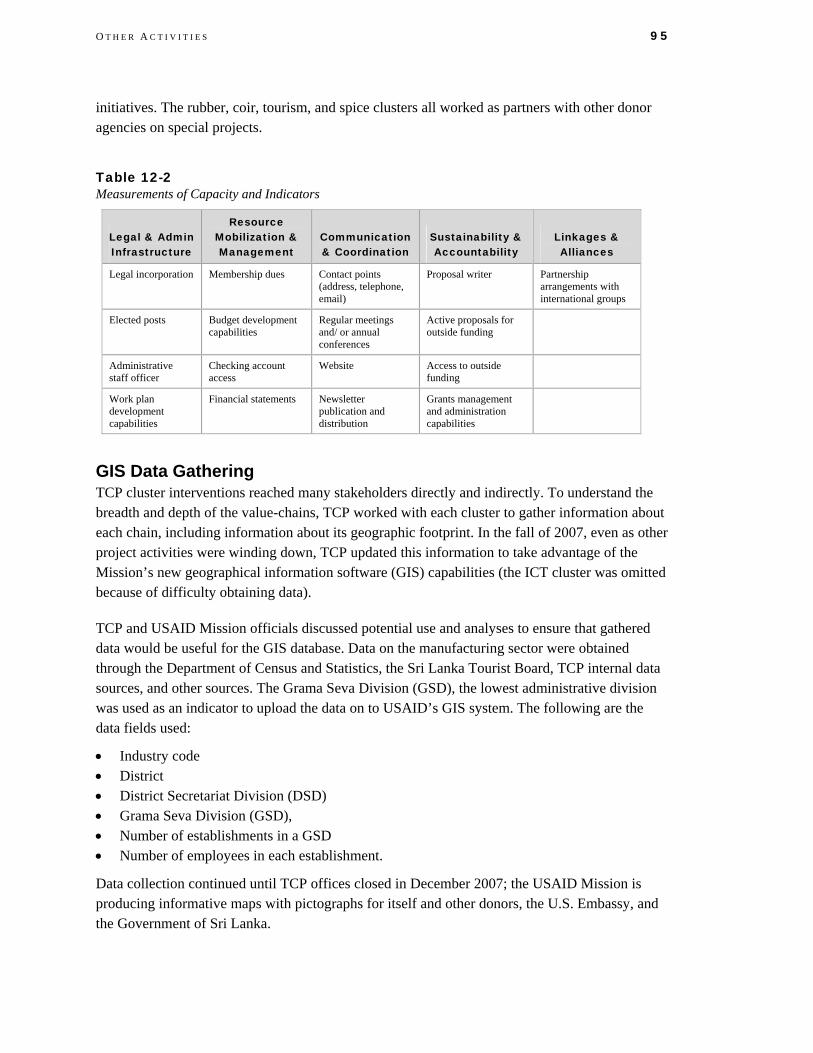
O T H E R A C T I V I T I E S 95
initiatives. The rubber, coir, tourism, and spice clusters all worked as partners with other donor agencies on special projects.
Table 12-2 Measurements of Capacity and Indicators
Legal & Admin Infrastructure
Resource Mobilization & Management
Communication & Coordination
Sustainability & Accountability
Linkages & Alliances
Legal incorporation Membership dues Contact points (address, telephone, email)
Proposal writer Partnership arrangements with international groups
Elected posts Budget development capabilities
Regular meetings and/ or annual conferences
Active proposals for outside funding
Administrative staff officer
Checking account access
Website Access to outside funding
Work plan development capabilities
Financial statements Newsletter publication and distribution
Grants management and administration capabilities
GIS Data Gathering TCP cluster interventions reached many stakeholders directly and indirectly. To understand the breadth and depth of the value-chains, TCP worked with each cluster to gather information about each chain, including information about its geographic footprint. In the fall of 2007, even as other project activities were winding down, TCP updated this information to take advantage of the Mission’s new geographical information software (GIS) capabilities (the ICT cluster was omitted because of difficulty obtaining data).
TCP and USAID Mission officials discussed potential use and analyses to ensure that gathered data would be useful for the GIS database. Data on the manufacturing sector were obtained through the Department of Census and Statistics, the Sri Lanka Tourist Board, TCP internal data sources, and other sources. The Grama Seva Division (GSD), the lowest administrative division was used as an indicator to upload the data on to USAID’s GIS system. The following are the data fields used:
• Industry code • District • District Secretariat Division (DSD) • Grama Seva Division (GSD), • Number of establishments in a GSD • Number of employees in each establishment.
Data collection continued until TCP offices closed in December 2007; the USAID Mission is producing informative maps with pictographs for itself and other donors, the U.S. Embassy, and the Government of Sri Lanka.
96 T C P F I N A L R E P O R T
Executive Opinion Survey In 2005, after meeting with a team from USAID responsible for improving PMPs, TCP decided to develop a formal survey of executives modeled on WEF’s annual survey for scoring and ranking countries in its annual GCR. TCP followed the WEF format of asking respondents to give their opinion on a scale of 1 to 7, with 1 being the lowest or poorest response and 7 being the highest or best. TCP revised some questions to solicit responses from the viewpoint of individual firms or clusters rather than of the entire private sector. The survey was mailed to executives in the eight clusters working closely with TCP. For the final survey conducted in June 2007, TCP mailed 128 questionnaires and received 77 replies. The 2006 and 2007 surveys also asked questions on the impact and value of participation in TCP or cluster activities. A sizeable majority of respondents report making investments and taking other steps at the firm level to improve competitiveness. They are optimistic about accomplishments and prospects, have a high opinion of TCP and its impact on their outlook and strategic decision-making, and credit TCP and cluster activities for as much as 17 percent of the rise in export sales in recent years. While not optimistic about the country’s macroeconomic or policy environment, they remain confident about prospects for progress. Respondents were very positive about remaining involved in cluster activities beyond the end date or TCP in 2007. TCP has provided USAID and CDIE with a complete copy of the EOS survey report. Excerpts from 2007 survey covering responses to questions about participation in the TCP program are presented in Appendix G.
Rural Impact Reports The sectors working with TCP clusters significantly improved export performance. Whether and how much of those gains traveled up the value chain to rural areas and which of those initiatives had the greatest impact in rural areas became increasingly important as an evaluation metric. TCP devised a method for assessing rural impact, especially for clusters with rural links in value chains. In consultation with rural development specialists and local sociologists, TCP altered its approach to include initiatives that could positively affect rural communities and included targeted technical assistance to those communities.
A distinct characteristic of the rural initiatives was their participatory approach. A local team of sociologists and participatory development specialists visited rural communities to discuss opportunities associated with cluster initiatives, communicate the objectives of the initiatives, and consult with community members to make them stakeholders. TCP sponsored training programs to prepare communities for participation in initiatives and to lead them through the process of determining the success of an initiative from a community development perspective, how it should be measured and monitored. Including rural communities and giving them a voice in the planning and implementation of a commercial initiative was a novel approach for Sri Lanka and was well received by the clusters and the rural stakeholders.
Technical assistance also included advice on managing higher earnings and planning for risks and uneven earnings. For projects involving group decisions or group maintenance responsibilities, trainers facilitated and supported the groups in devising and implementing plans for making decisions and clarifying responsibilities and accountability. Such assistance was given to plantation workers near the ecolodge construction site outside the Sinharaja rain forest and to
O T H E R A C T I V I T I E S 97
pepper producers who invested in the joint venture with the spice council to operate a spice drier in Matale. The sociologist, Ms. Mallika Samaranayake visited each community, inviting participation in working groups, developing instructional materials, holding workshops and implementing community-based monitoring programs, including baselines of production techniques, standards of living and welfare.
The timeframe for the realization of tangible benefits from these initiatives was unfortunately beyond the scope of TCP. Additional delays—in construction, securing land from the government and an extended growing season for spices—pushed implementation back even further.
From February through September 2007, agricultural economist Christa Lachenmayr conducted an follow-up impact study specific to three initiatives (coir model mill, rainforest ecolodge, spice processing in Matale) in order to update the indicators and assessment methodology based on progress to-date and provide for the continued monitoring and evaluation after the close of TCP. On the basis of this exercise, we can say that because of TCP each community enjoyed a significant one-time benefit that radically changed how stakeholders participated in activity planning and implementation. The historic concentration of decision-making in Colombo and the Western Province has resulted in the economic disenfranchisement of rural inhabitants. Therefore it is crucial to the long-term success of rural initiatives to take a participatory approach and incorporate rural inhabitants as stakeholders. Consultation with the communities resulted in a better understanding of the needs of stakeholders. As a result, the cluster initiatives were able to provide rural communities with the opportunity to manage group-owned, shared assets—a cooperative store for a resident plantation community, the spice drier—that proved more valuable to them than additional income and will have a more lasting impact on development.
A major lesson of TCP is that financial and human resources for baseline data collection must be freed from even pressing project implementation activities. On the basis of data collected on everything from production techniques and household characteristics to producers’ knowledge of management practices, TCP was able to devise programs that responded directly to stakeholders’ needs, even when those needs were diverse. TCP’s training course for coir millers gave them the means to assess the productivity of individual mill operations and prioritize investments accordingly.
The activity with the most direct and measurable impact on rural economic development was the Wellassa Rubber Nursery in Moneragala. Between 2004 and the close of TCP at the end of 2007, the nursery produced more than 80,000 rubber plants. Using a conservative estimate, the new rubber acreage from those plants alone will generate between US$10 and $20 million over the 25-year productive lifespan of the trees. This is in addition to the direct employment impact of the nursery and the smallholder activity described earlier.

13. Lessons Learned and Implications for Other Projects In August 2007, TCP hosted a conference on what had and had not worked in helping firms and sectors improve their ability to compete in global markets. Cluster representatives delivered 18 presentations on various initiatives, and the follow-up discussions distilled lessons from failures as well as successes. This chapter synthesizes those lessons along with the judgment of TCP’s professional staff, and presents the implications of the project for future USAID strategies to promote private enterprise development and economic growth.
LESSONS LEARNED
1. Private sector leadership makes a difference Of the many mindset changes that resulted from TCP, the most important was the transition to private sector-led strategic initiatives away from over reliance on government-led efforts to designate “thrust” industries and offer development incentives. This paradigm shift was a crucial factor in the program’s success. Rather than waiting for the government to take action on policies to support and protect certain industries with subsidies, tariffs, and financial resources, firms began to generate their own ideas, collectively discuss strategy, plan joint initiatives, and deploy their own resources to identify and seize new market opportunities. Over the life of TCP, the private sector assumed increasing responsibility for industry development, and now has a larger role in promoting, leading, and implementing national economic development programs (e.g., the program to expand rubber production in depressed eastern regions). The clusters’ growing confidence and cohesion, stimulated by TCP, has helped the entire private sector view itself as society’s chief proponent of competitiveness and the reforms needed to build competitiveness as an economic growth strategy.
2. Cluster formation requires a neutral third party Although all cluster initiatives were demand-driven, TCP assumed the convening responsibility for the clusters, soliciting cooperation from industry participants and in raising industries’ sights to focus on opportunities in global markets. Each cluster member was assured that TCP was acting in the best interest of the industry as a whole, rather than advocating for any firm or segment of the industry. For this reason, industry clusters were able to succeed where other apex bodies or industry organizations had failed.
100 T C P F I N A L R E P O R T
3. Technical competence and authority build credibility Project management is important, but TCP’s ability to understand and fulfill each clusters’ needs in terms of production, product development, and marketing was attributed to the technical competence of its full-time staff, short-term industry experts, and other technical experts. Identifying and fielding recognized industry experts in each of the eight clusters and for cross-cutting issues posed an enormous challenge for recruiters, cluster coordinators, and project managers, but this competence lent credibility and authority to TCP activities and guided strategic efforts. Of special importance were the cluster coordinators who served in frontline roles.
4. Consensus-based agendas and fact-based advocacy make for effective dialogue When they approached their public sector counterparts with sound strategies, clusters were able to engage with them on a more equal footing. Prior to TCP, representatives from different segments of the same value chain would lobby separately and often for opposing policies, leaving the government to decide what was in the best interest of the industry. Through clusters, industries were able to devise consensus-based agendas and advocate on behalf of policies that benefited the industry as a whole. They also furthered their agendas by approaching government armed with data and sound technical evidence. Even though the results have been mixed thus far, each cluster embraced this strategy and has committed to cooperation in the future.
5. Let demand drive strategic initiatives Competitiveness projects try to identify markets and develop products simultaneously. Buyers will lose interest if engaged too early—before the product is of acceptable quality or before the product can be delivered on time—or too late—after a product that does not meet their needs is developed. TCP learned the importance of cultivating contacts in destination markets, visiting those markets, participating in trade shows, and meeting with potential buyers to ensure smart investment in product development. For example, too much time was spent testing and refining crepe rubber before exploring markets. It is nearly impossible to promote and sell a technical product without specifications, but it would have been better to have engaged potential end users sooner, more directly, and more continuously. Early engagement can lead to partnerships in marketing, product development, and certification—and a product that directly responds to consumer demands.
6. Don’t underestimate the influence of legacy practices The habit of reacting to the government’s lead has not been eradicated in Sri Lanka, nor has legacy conflict and mistrust within industries. As industries began to implement strategic initiatives, some firms adopted a free-rider or wait and see attitude. Sometimes a cluster waited too long in obtaining consensus and would have been better served by proceeding with a corps of “early adopters.” Once others see that an initiative is succeeding, they react by joining. In addition, the government sometimes worked at cross-purposes by setting up a parallel organization without industry support (e.g., this happened with the tea industry, unfortunately with donor funding).
L E S S O N S L E A R N E D 101
7. Change perspectives early on Industry perspectives consist of mindsets, consensus, trust and cooperation, and strategic sights. Early on, TCP helped shift industry attention from the fixed pie of existing value chains to the broader prospects possible through competitiveness and exports to foreign markets. This allowed the industry to develop enough enthusiasm and momentum to take the lead.
8. Avoid financing pitfalls Having the government act as an industry or cluster collection agency may eliminate “free-riders” but also runs the risk of losing revenue entirely. One cluster imposed a “cess” tax on its own exports to raise funds to finance an initiative. The Treasury collected the tax but did not return funds to the cluster. In two other cases the government did not keep commitments to co-financing. The government did not release funds for the Sriya Celyon Sapphire branding scheme. Other strategic investments fell through when firms that had expressed strong interest in an initiative did not follow up with financial resources—effectively ending implementation.
9. Cluster initiatives can lead to fruitful private-public partnerships Clustering led to some pioneering efforts in a country where state university and research organizations had little history in working with industry and where neither had shown interest in the other as a resource or partner. The University of Moratuwa got involved with the tea industry and venture capitalists to finance development of a tea color separator. The gems and jewelry industry created the first privately led CAD-CAM training facility. The Ceramics Council and ITI, with support from the universities at Moratuwa and Peradeniya, set up a not-for-profit company to conduct research and development. ITI is also acting as project manager in setting up the private coir research development and training center (model mill).
10. Even unsuccessful initiatives can have benefits Some initiatives were ultimately dropped while others eventually succeeded. Reasons for failure varied. Sometimes not all firms were equally ready to act, financing might not have been secured, firms could not engage directly with dealers, key partners backed out, or the implementing group was too large or the initiative was delayed or prolonged past the point of effectiveness. The crepe rubber marketing campaign in the United States and the jewelry design alliance did not achieve their intended results. Still, the participating firms learned about markets, marketing, branding, and consumers, and made valuable business contacts.
IMPLICATIONS FOR OTHER PROJECTS TCI and its follow-on TCP were USAID’s first and longest-running projects of their kind after similar approaches had been tested elsewhere. Short-term work began in 1999 and the two long-term projects were implemented between 2000 and 2007. The approach involves engaging with private leaders in sectors with potential for export competitiveness and willingness to form clusters representing value chains.
TCI and TCP methods have influenced many projects, especially those seeking to use the private sector to transfer technology and spread prosperity. USAID/ Mongolia immediately applied TCI’s methods. The USAID South East Asia Mainland Mission conducted competitiveness exercises in
102 T C P F I N A L R E P O R T
five countries, leading to long-term projects in Thailand, Cambodia, and Vietnam. The Government of Vietnam then commissioned provincial competitiveness reports to spur regional governments to make pro-business reforms; the resulting project directly assisted the software, ceramics, and horticulture clusters. Five industries were assisted in Thailand. Competitiveness approaches have been introduced in five countries of southeast Europe and three countries in the Russia/NIS region. USAID formed Croatia’s national competitiveness council, which now advocates reforms and monitors progress. In Croatia, approaches pioneered in Sri Lanka led to regional economic development councils. And in 2004, Germany’s GTZ restructured its aid program in Sri Lanka to focus on rural links in value chains. GTZ and TCP cooperated in three areas from 2005 to 2007: helping to create a model spice village in Matale, a cinnamon peeling academy in Kosgoda, and training wildlife and nature guides island-wide. TCP’s counterpart Ministry, MID recommended that several other sectors follow the public–private partnership model of the Ceramics Council.
Elements of Project Success From a project design and management perspective, a number of factors drove the success of TCP; some of them are replicable for other projects and some of them unique to Sri Lanka. First, by design TCP was demand driven. Clients and counterparts decided to work with TCP, signing MOUs that set program priorities and scopes of work, funding cluster coordinators at market rates, and committing CEOs to at least two hours per week of strategy development. This level of commitment created continuity that impelled initiatives through four governments without significant interruption.
Second, TCP’s flexibility allowed it to adjust to circumstances. For example, when upstream SMEs could not help pay for a cluster coordinator TCP decided to pay the coordinator and take an all-inclusive approach. This led to more activities being implemented upstream in the value chain. Third, TCP used the dynamism of mutually beneficial competition to build trust among firms and ensure firms’ commitment to strategies. This change in attitude resulted in strong apex bodies that will likely continue well past the end of TCP. Importantly, public–private dialogue was cooperative not confrontational. TCP fostered dialogue as well as implementation of privately led projects. Since government representatives were a part of clusters, strategies were developed with their input. Other replicable elements include the following:
• Diverse portfolio. Risks were spread over eight clusters, four of them based in commodity agriculture, and a variety of initiatives ranging from market research to productivity programs to workforce training.
• High quality partners. Though most partners were experienced exporters before TCP they were challenged by the pace of globalization. A few companies and CEOs had participated in earlier USAID projects promoting private sector development (e.g., TIPS or AGENT). Those projects had laid a good foundation for private sector development and work with USAID. Senior CEOs committed time and energy to TCP. The Ceylon Chamber has averred that TCP succeeded because it facilitated the emergence of local leaders.

L E S S O N S L E A R N E D 103
• Cost-sharing. Many events and activities in the later years of the project required cost sharing. This approach “market tested” private sector interest in an initiative by their willingness to co-invest.
• Private sector led policy reform. Expatriate project managers worked through private sector leaders on policy reform. This sometimes required insisting that the private sector take the lead while TCP provided arguments and supporting evidence for “pro-competitiveness” positions. Each cluster included government representatives from agencies that could help (or hinder) progress. TCP helped create a private stakeholder or “Users’ Group” group to advise and sustain work with the Customs Department to create a regulations database accessible on the Customs Department’s website.
• Timeliness. Concern in Sri Lanka about globalization and Sri Lanka’s options for and ability to compete in global markets was intense. Public and private leaders were interested in what TCP could offer. CEOs, chambers, and a number of government leaders were willing to explore options and test strategic initiatives. Even trade union leaders and regional chambers were interested.
• Experienced and skilled advisers. The high quality of advisers who worked with private sector partners helped fuel and spread interest in TCP. Nathan Associates and its subcontractor JE Austin Associates fielded and managed advisers who won the trust, cooperation, and respect of local counterparts.
A number of other factors supporting TCP’s success were serendipitous. Beginning with TCI in 2001 it was the right time—in the market cycle—to encourage strategic investment in commodity-based agro-industries like rubber and tea. Market prices for commodities such as rubber were at cyclical lows in 2000 and 2001 and started to rise from those lows in 2002. (TCP advisers stressed to plantation owners/managers that investments in productivity and new planting should have been made steadily even during earlier market-slump years, when most plantations had neglected such investments to conserve cash.). It was also the right place. The cease-fire agreement between the government and LTTE signed in 2002 sparked a “peace boom” in the local economy. Robust annual growth in India (8 percent) and China (10+ percent) boosted demand for commodities like rubber and coir, and spurred interest in Sri Lanka’s agriculture sector. Sri Lanka also benefited from a free trade agreement with India. Two years of pro-business government from 2002 to 2004, together with the cease-fire agreement helped lay the groundwork to make businesses confident and willing to invest. And, except for the tsunami of 2004, weather from 2003 to 2007 was mostly good from an agricultural standpoint.
Constraints on Success Some initiatives did not progress as hoped and others could not accomplish more, especially those affected by attitudes and behaviors beyond the influence of TCP. Limits included time and money, political instability, pro-government bias, lack of security, arbitrary actions by the government, and a private sector legacy of complacency.
• Insufficient resources. To work with eight clusters representing dozens of associations and thousands of companies TCP had to maximize resources by partnering with the private sector

104 T C P F I N A L R E P O R T
in Colombo. These partnerships had an impact in rural areas; having more impact would have required more time and money.
⎯ TCP could not respond to demands for “awareness building” from businesses and local government units outside the western provinces and from trade unions, academic institutions, and some government agencies in Colombo. TCP was unable to produce and translate more materials into Sinhala and Tamil—though doing so would have then also required mobilizing resources to make good use of translations. Where TCP could rely on partners, materials were produced in Sinhala (e.g., the coir mill training materials and the wildlife guides produced in multiple languages under a subgrant).
⎯ TCP would have liked to work with importers and local-market firms. The sectors willing to work with TCP were largely those that had or were seriously interested in exporting. TCP was able to work with importers in general through its trade facilitation and customs components, but there was too little time and too few resources to engage with local industries that strive to preserve their tariff-protected status. Working with such industries would have shed light on the costs and highly selective benefits of many of Sri Lanka’s tariffs.
⎯ TCP also would have liked to involve more female-led firms and female entrepreneurs in project activities. More than half of TCP’s staff of local professionals were women, and many government representatives assigned to clusters were women. Few Sri Lankan women, however, are attracted into politics or even leadership of unions whose members are mostly women. And very few own businesses.
• Political instability. Four changes in government delayed initiatives involving the government, and TCP faced a significantly reduced scope for engaging with the public sector immediately after the elections of 2004 and 2005. This situation improved by late 2005 and into 2006.
• Pro-government bias. Many Sri Lankans view the government as benevolent and the private sector exploitative, arbitrary, and corrupt. Many still believe that the government has the ability and inexhaustible funds to control things like the “cost of living.” Parents overwhelmingly prefer that their children “win” a government job even if they can earn more in the private sector.
• Lack of security. Businesses must contend with interruptions and delays caused by road closures, vehicle checks, building security checks, as well as protests and bombings. The escalating civil conflict stymied progress in tourism. Before 2005, for example, the industry had been building a platform for growth, experiencing a 25 percent-plus increase in arrivals both before and after the tsunami. Arrivals now languish below 500,000 per year, less than a fifth of what the country can comfortably host.
• Arbitrary government actions. The government sometimes behaves arbitrarily in economic activities. A campaign to launch a designer line of jewelry through the Export Development Board was tabled because the government did not contribute funds as expected—nor did it release funds collected through an industry cess voluntary increased expressly for the

L E S S O N S L E A R N E D 105
campaign. In addition, the cess is spent with little or no accounting for results, operating licenses for hotels must be renewed annually, requirements for ministry approvals overlap and past approvals are too often unreliable, and the scope for private sector input into government decision-making that affects investment and business operations is still limited)..
• Private sector ambivalence toward change. Industries still bear the export tax or “cess.” A bill passed in October 2007 will allow more input from the tourism industry on how cess funds are spent; and the rubber and coir clusters report better informal access to councils that decide how industry cess funds are spent. Still, the fiscal deficit and private sector ambivalence have combined to leave the cess in effect even where it clearly impedes competitiveness. Tea blending is also still prohibited. Orange pekoe teas are blended in third countries, but the private sector in Sri Lanka is against importing teas and blending them in Sri Lanka. This ensures the “purity” of brand identity but in a way that sacrifices investments and jobs.
• Complacency. Especially outside of Colombo and the western provinces, many Sri Lankans are casual about productivity and adding value. This is due in part to the bounty of nature and the inertia of tradition; the climate is good and food and shelter are sufficient to sustain life, and sometimes sustain it well. Desperation is rare and the pressures of migration to major cities are not severe as in other countries like the Philippines. While rice is valuable enough to conserve and store, vegetables, fruits, and fish are so abundant that selling today’s harvest is difficult and investing the surplus does not seem profitable, much less urgent. Despite strong export experience in rubber, tea and coconut, surprisingly little is done to preserve or export perishables. The local market will not pay a premium for yesterday’s harvest, and no one is trying to capture the value of the surplus for the export market.
Constraints on Rural Development Clusters and competitiveness goals are widening economic opportunities and improving standards of living in Sri Lanka. Certainly the ability to sell “Ceylon” tea for a 100 LRs more per kilo than most other teas boosts wages on tea plantations in Sri Lanka—yet the standard of living in most rural areas is not what most Sri Lankans deem desirable or sustainable. Investment in rural areas has not kept pace with the needs of the population or prospects for creating and improving a link to a global value chain.
Capturing value along a chain requires making money for your link and the next. Operations in rural areas, however, can be difficult and expensive enough to discourage investors, who prefer high-margin, high-return opportunities. If such opportunities (e.g. “organic” cultivation) are not being pursued in rural areas, one should first review costs and potential gains. If those are attractive, one should then investigate incentives and competition. Where nothing is being ventured on viable opportunities, entrenched local interests—private, public, or illegal—may be to blame.
The value-chain approach is still the best for spurring growth in rural areas because it connects investors to markets where they can realize returns. Competition and incentives that are strong at the export interface, however, tend to weaken the further one is physically from the interface.

106 T C P F I N A L R E P O R T
Thus, to improve rural livelihoods, initiatives must be occurring at a link in a value chain with strong links to overseas export markets
WHAT CLUSTERS HAVE LEARNED What have the clusters learned and how will they pursue competitiveness? All have learned how to take a “value chain” approach and study consumer preferences; and all understand the advantage of cooperating and sharing costs in areas in which they are not competing. The ceramics cluster has begun joint procurement and joint investment throughout the value chain from clay mining to research on customer taste in developed countries. Most clusters will refine initiatives that have benefited at least a few firms. What has worked is likely to be shared with other firms and potential investors because the raw data were made available to more than just single firms or joint ventures. All are acutely aware of the need to comply with international standards (e.g., ISO, HAACP). They are also aware of new standards for quality control, health, “traceability,” IPR, and labor, and of consumer demand for sustainability and ethical practices and even corporate social responsibility. While most still regard CSR as a fringe development, leading exporters know that Sri Lanka may be in better position to compete against the giant economies such as India and China in these areas.
Many of Sri Lanka’s exports—apparel, tea, spices, ceramics, gems and jewelry, and tourism—are “lifestyle” products. More and more consumers are choosing such products on the basis of ethical and environmental concerns. They are willing to pay a price that sustains or improves someone’s livelihood and they care about how a product is made. Manufacturers who have ignored this trend and used child labor, for example, have regretted doing so. The clusters in Sri Lanka that are exporting lifestyle products are beginning to study how they can position products and even create a national brand so that consumers concerned with ethical and environmental practices will prefer the Sri Lanka brand.
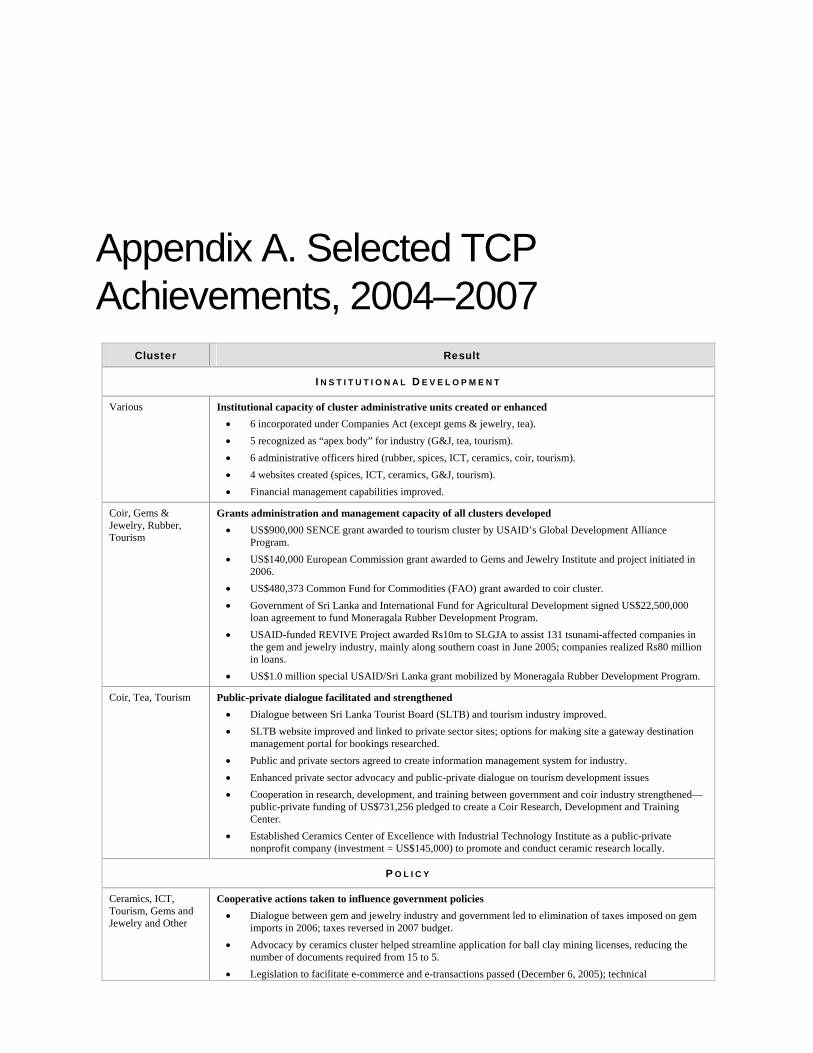
Appendix A. Selected TCP Achievements, 2004–2007
Cluster Result
I N S T I T U T I O N A L D E V E L O P M E N T
Various Institutional capacity of cluster administrative units created or enhanced • 6 incorporated under Companies Act (except gems & jewelry, tea). • 5 recognized as “apex body” for industry (G&J, tea, tourism). • 6 administrative officers hired (rubber, spices, ICT, ceramics, coir, tourism). • 4 websites created (spices, ICT, ceramics, G&J, tourism). • Financial management capabilities improved.
Coir, Gems & Jewelry, Rubber, Tourism
Grants administration and management capacity of all clusters developed • US$900,000 SENCE grant awarded to tourism cluster by USAID’s Global Development Alliance
Program. • US$140,000 European Commission grant awarded to Gems and Jewelry Institute and project initiated in
2006. • US$480,373 Common Fund for Commodities (FAO) grant awarded to coir cluster. • Government of Sri Lanka and International Fund for Agricultural Development signed US$22,500,000
loan agreement to fund Moneragala Rubber Development Program. • USAID-funded REVIVE Project awarded Rs10m to SLGJA to assist 131 tsunami-affected companies in
the gem and jewelry industry, mainly along southern coast in June 2005; companies realized Rs80 million in loans.
• US$1.0 million special USAID/Sri Lanka grant mobilized by Moneragala Rubber Development Program.
Coir, Tea, Tourism Public-private dialogue facilitated and strengthened • Dialogue between Sri Lanka Tourist Board (SLTB) and tourism industry improved. • SLTB website improved and linked to private sector sites; options for making site a gateway destination
management portal for bookings researched. • Public and private sectors agreed to create information management system for industry. • Enhanced private sector advocacy and public-private dialogue on tourism development issues • Cooperation in research, development, and training between government and coir industry strengthened—
public-private funding of US$731,256 pledged to create a Coir Research, Development and Training Center.
• Established Ceramics Center of Excellence with Industrial Technology Institute as a public-private nonprofit company (investment = US$145,000) to promote and conduct ceramic research locally.
P O L I C Y
Ceramics, ICT, Tourism, Gems and Jewelry and Other
Cooperative actions taken to influence government policies • Dialogue between gem and jewelry industry and government led to elimination of taxes imposed on gem
imports in 2006; taxes reversed in 2007 budget. • Advocacy by ceramics cluster helped streamline application for ball clay mining licenses, reducing the
number of documents required from 15 to 5. • Legislation to facilitate e-commerce and e-transactions passed (December 6, 2005); technical

Cluster Result recommendations to guide drafting of legislation provided by TCP short-term adviser, Benjamin Wright.
• Tourism cluster provided institutional support to facilitate passage of Tourism Development Authority Bill (passed October 18, 2005), restructuring the SLTB to include private sector in policy decisions affecting promotion and training expenditures.
• A searchable database of SL customs regulations was created and made publicly accessible through the customs website.
• Conducted study of Sri Lanka’s performance as a hub port and logistics center and recommended steps to maintain Colombo’s hub port status.
• Center of Excellence for English Training was set up under the Ministry of Education with opportunity for private sector to participate in teacher training.
T R A N S A C T I O N A L
All • Improved export performance in sectors with TCP-assisted clusters. • In the five years before TCP (1995-2000) exports from the eight sectors increased by US$309 million or
27 percent; in the five years since 2001 and since working with TCP, exports increased by US$885 million (62 percent).
• Additional export earnings for the 2001-2006 TCP period exceeded US$550 million. • Cluster business leaders responding to survey attributed more than 15 percent of export earnings growth on
average to participation in TCP (or US$82 million in benefits from 2001 to 2006 alone). • Share of value-added products (non-bulk) in total exports from the eight sectors was 64 percent in 2000
and increased to 70 percent in 2006.
Ceramics • Ceramics cluster negotiated group bulk purchase discounts with Shell Gas, saving manufacturers US$500,000 in energy costs per year.
• Assistance provided in setting up a Center of Technical Excellence in Ceramics with research linkages to Alfred University in New York.
• Cluster initiated pilot productivity improvement program based on sharing best practices; saved more than US$300,000 in first year.
Coir • Export Development Board (EDB) allocated US$75,000 to promote sector exports in 2005. • More than 500 families helped through coir cluster and USAID program that replaced spinning wheels and
raw coir yarn lost during the tsunami of December 2004.
Gems and Jewelry • US$1.35 million in public-private funds mobilized and invested to establish Ceylon Sapphire Council. • New jewelry and packaging designs developed; training in bench craft skills organized with U.S. experts. • Promotional strategy developed; better “group” participation at U.S. gem trade shows. • EDB allocated US$477,000 to promote gem and jewelry exports in 2005; of this, US$350,00 was allocated
to Ceylon Sapphire Council. (As TCP ended these amounts had not yet been released to benefit Gem and Jewelry branding and export efforts.)
ICT • Four firms participated in C-Level Summit in Washington D.C. in June 2006, securing leads worth an estimated US$150,000.
• Investments in BPO sector in Sri Lanka still growing thanks to ICT cluster’s early attempts to deregulate telecom– more than 1,500 new jobs created.
Rubber Moneragala Rubber Development Program • Investment made to expand production of natural rubber in impoverished area. • Long-term potential for new jobs in plantations and factories increased. • Long-term potential for rubber production to be increased by US$70 million per year. • Exporters of rubber products formed Wellassa Rubber Company and invested US$200,000 in rubber
seedling nurseries in 2006 and 2007. Upgrading crepe rubber exports (“Lankaprene”) • Quality of crepe rubber exports upgraded to create “standard” specifications. • Marketing trip to Ohio in 2003 still yielding research inquiries from potential U.S. partners and shipments
of trial quantities. • Long-term potential for rubber export earnings increased. • Government’s 2005 budget allocated US$210,000 to EDB to promote rubber exports, including
Lankaprene. • Private investors formed joint venture to produce and market Lankaprene. • Government’s 2006 budget allocated US$1.0 for construction of a gamma irradiation facility to sterilize
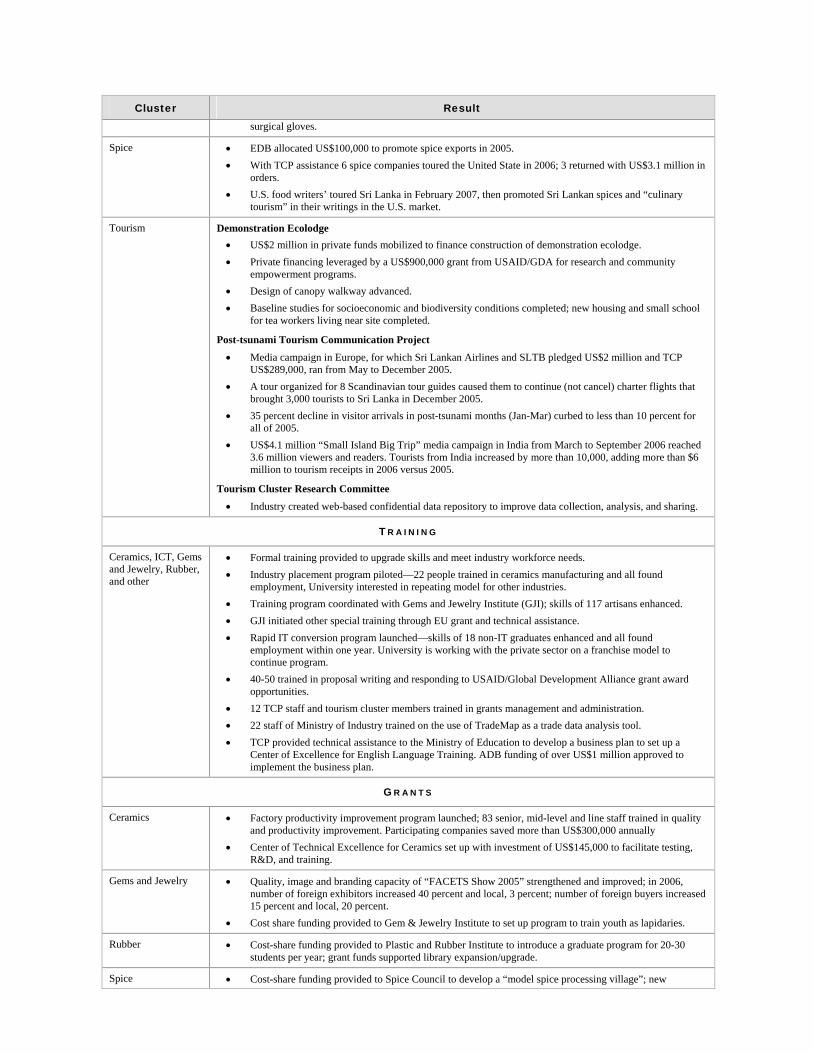
Cluster Result surgical gloves.
Spice • EDB allocated US$100,000 to promote spice exports in 2005. • With TCP assistance 6 spice companies toured the United State in 2006; 3 returned with US$3.1 million in
orders. • U.S. food writers’ toured Sri Lanka in February 2007, then promoted Sri Lankan spices and “culinary
tourism” in their writings in the U.S. market.
Tourism Demonstration Ecolodge • US$2 million in private funds mobilized to finance construction of demonstration ecolodge. • Private financing leveraged by a US$900,000 grant from USAID/GDA for research and community
empowerment programs. • Design of canopy walkway advanced. • Baseline studies for socioeconomic and biodiversity conditions completed; new housing and small school
for tea workers living near site completed.
Post-tsunami Tourism Communication Project
• Media campaign in Europe, for which Sri Lankan Airlines and SLTB pledged US$2 million and TCP US$289,000, ran from May to December 2005.
• A tour organized for 8 Scandinavian tour guides caused them to continue (not cancel) charter flights that brought 3,000 tourists to Sri Lanka in December 2005.
• 35 percent decline in visitor arrivals in post-tsunami months (Jan-Mar) curbed to less than 10 percent for all of 2005.
• US$4.1 million “Small Island Big Trip” media campaign in India from March to September 2006 reached 3.6 million viewers and readers. Tourists from India increased by more than 10,000, adding more than $6 million to tourism receipts in 2006 versus 2005.
Tourism Cluster Research Committee
• Industry created web-based confidential data repository to improve data collection, analysis, and sharing.
T R A I N I N G
Ceramics, ICT, Gems and Jewelry, Rubber, and other
• Formal training provided to upgrade skills and meet industry workforce needs. • Industry placement program piloted—22 people trained in ceramics manufacturing and all found
employment, University interested in repeating model for other industries. • Training program coordinated with Gems and Jewelry Institute (GJI); skills of 117 artisans enhanced. • GJI initiated other special training through EU grant and technical assistance. • Rapid IT conversion program launched—skills of 18 non-IT graduates enhanced and all found
employment within one year. University is working with the private sector on a franchise model to continue program.
• 40-50 trained in proposal writing and responding to USAID/Global Development Alliance grant award opportunities.
• 12 TCP staff and tourism cluster members trained in grants management and administration. • 22 staff of Ministry of Industry trained on the use of TradeMap as a trade data analysis tool. • TCP provided technical assistance to the Ministry of Education to develop a business plan to set up a
Center of Excellence for English Language Training. ADB funding of over US$1 million approved to implement the business plan.
G R A N T S
Ceramics • Factory productivity improvement program launched; 83 senior, mid-level and line staff trained in quality and productivity improvement. Participating companies saved more than US$300,000 annually
• Center of Technical Excellence for Ceramics set up with investment of US$145,000 to facilitate testing, R&D, and training.
Gems and Jewelry • Quality, image and branding capacity of “FACETS Show 2005” strengthened and improved; in 2006, number of foreign exhibitors increased 40 percent and local, 3 percent; number of foreign buyers increased 15 percent and local, 20 percent.
• Cost share funding provided to Gem & Jewelry Institute to set up program to train youth as lapidaries.
Rubber • Cost-share funding provided to Plastic and Rubber Institute to introduce a graduate program for 20-30 students per year; grant funds supported library expansion/upgrade.
Spice • Cost-share funding provided to Spice Council to develop a “model spice processing village”; new

Cluster Result technology introduced to process high quality spices leading to higher farmer incomes.
Tea • Cost-share funding provided for acquisition and field testing of vacuum packaging technology for bulk tea; technology will extend shelf life, minimize transportation costs, curb theft, improve versatility and ease of handling. Information on vacuum packing was disseminated to industry.
Tourism • “Wildlife of the Dry Lowlands,” a guide handbook developed through a TCP small grant, formally released at TCP conference room in presence of USAID officials, Tourism Cluster Chairman, representatives of Hoteliers Association, SLTB officials, and representatives of the Department of Wildlife Conservation and the Forest Department.
Other • Cost-share funding provided to Selyn Exports to develop training and weaving center for reed-based and handwoven fabric in village of Manampitiya.
Various • Cost-share funding for job-placement fair for disabled; fair brought 100 jobseekers and 35 employers together and matched 37 jobseekers with jobs.
• Cost-share funding provided to Ceylon National Chamber of Industries to establish a library and computer help desk.
Appendix B. TCP Work Plan and Deliverables Status as of December 27, 2007

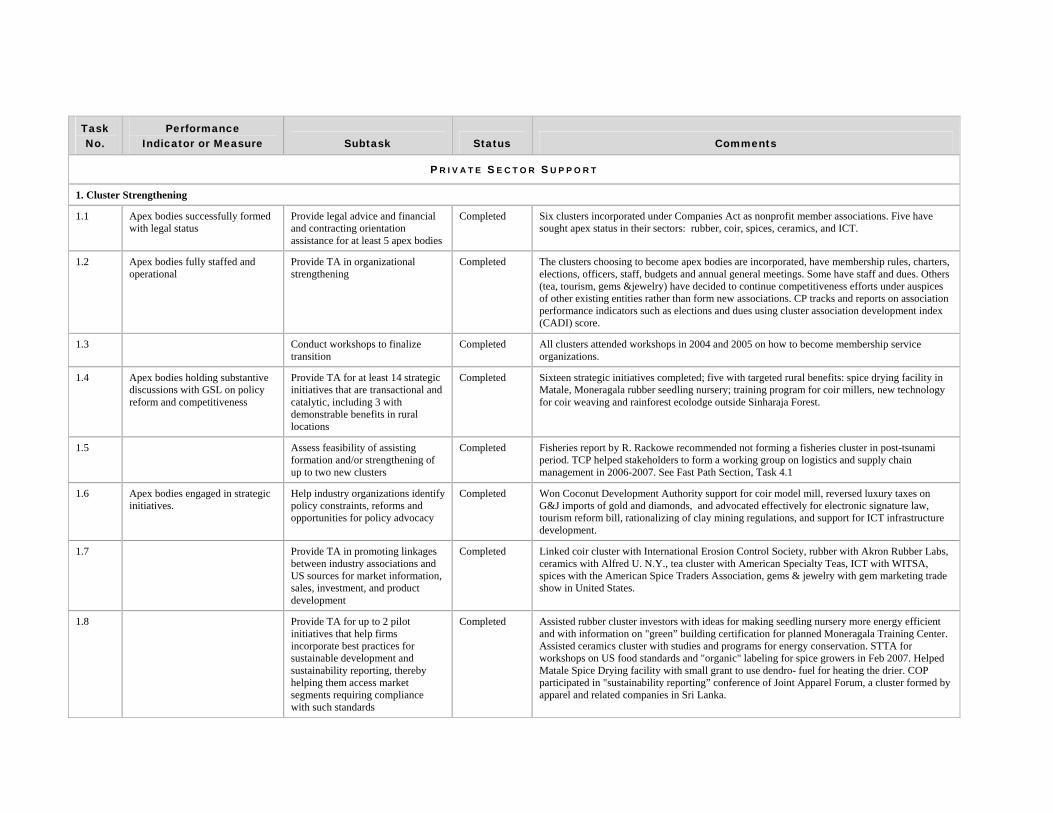
Task No.
Performance Indicator or Measure Subtask Status Comments
P R I V A T E S E C T O R S U P P O R T
1. Cluster Strengthening
1.1 Apex bodies successfully formed with legal status
Provide legal advice and financial and contracting orientation assistance for at least 5 apex bodies
Completed Six clusters incorporated under Companies Act as nonprofit member associations. Five have sought apex status in their sectors: rubber, coir, spices, ceramics, and ICT.
1.2 Apex bodies fully staffed and operational
Provide TA in organizational strengthening
Completed The clusters choosing to become apex bodies are incorporated, have membership rules, charters, elections, officers, staff, budgets and annual general meetings. Some have staff and dues. Others (tea, tourism, gems &jewelry) have decided to continue competitiveness efforts under auspices of other existing entities rather than form new associations. CP tracks and reports on association performance indicators such as elections and dues using cluster association development index (CADI) score.
1.3 Conduct workshops to finalize transition
Completed All clusters attended workshops in 2004 and 2005 on how to become membership service organizations.
1.4 Apex bodies holding substantive discussions with GSL on policy reform and competitiveness
Provide TA for at least 14 strategic initiatives that are transactional and catalytic, including 3 with demonstrable benefits in rural locations
Completed Sixteen strategic initiatives completed; five with targeted rural benefits: spice drying facility in Matale, Moneragala rubber seedling nursery; training program for coir millers, new technology for coir weaving and rainforest ecolodge outside Sinharaja Forest.
1.5 Assess feasibility of assisting formation and/or strengthening of up to two new clusters
Completed Fisheries report by R. Rackowe recommended not forming a fisheries cluster in post-tsunami period. TCP helped stakeholders to form a working group on logistics and supply chain management in 2006-2007. See Fast Path Section, Task 4.1
1.6 Apex bodies engaged in strategic initiatives.
Help industry organizations identify policy constraints, reforms and opportunities for policy advocacy
Completed Won Coconut Development Authority support for coir model mill, reversed luxury taxes on G&J imports of gold and diamonds, and advocated effectively for electronic signature law, tourism reform bill, rationalizing of clay mining regulations, and support for ICT infrastructure development.
1.7 Provide TA in promoting linkages between industry associations and US sources for market information, sales, investment, and product development
Completed Linked coir cluster with International Erosion Control Society, rubber with Akron Rubber Labs, ceramics with Alfred U. N.Y., tea cluster with American Specialty Teas, ICT with WITSA, spices with the American Spice Traders Association, gems & jewelry with gem marketing trade show in United States.
1.8 Provide TA for up to 2 pilot initiatives that help firms incorporate best practices for sustainable development and sustainability reporting, thereby helping them access market segments requiring compliance with such standards
Completed Assisted rubber cluster investors with ideas for making seedling nursery more energy efficient and with information on "green” building certification for planned Moneragala Training Center. Assisted ceramics cluster with studies and programs for energy conservation. STTA for workshops on US food standards and "organic" labeling for spice growers in Feb 2007. Helped Matale Spice Drying facility with small grant to use dendro- fuel for heating the drier. COP participated in "sustainability reporting” conference of Joint Apparel Forum, a cluster formed by apparel and related companies in Sri Lanka.
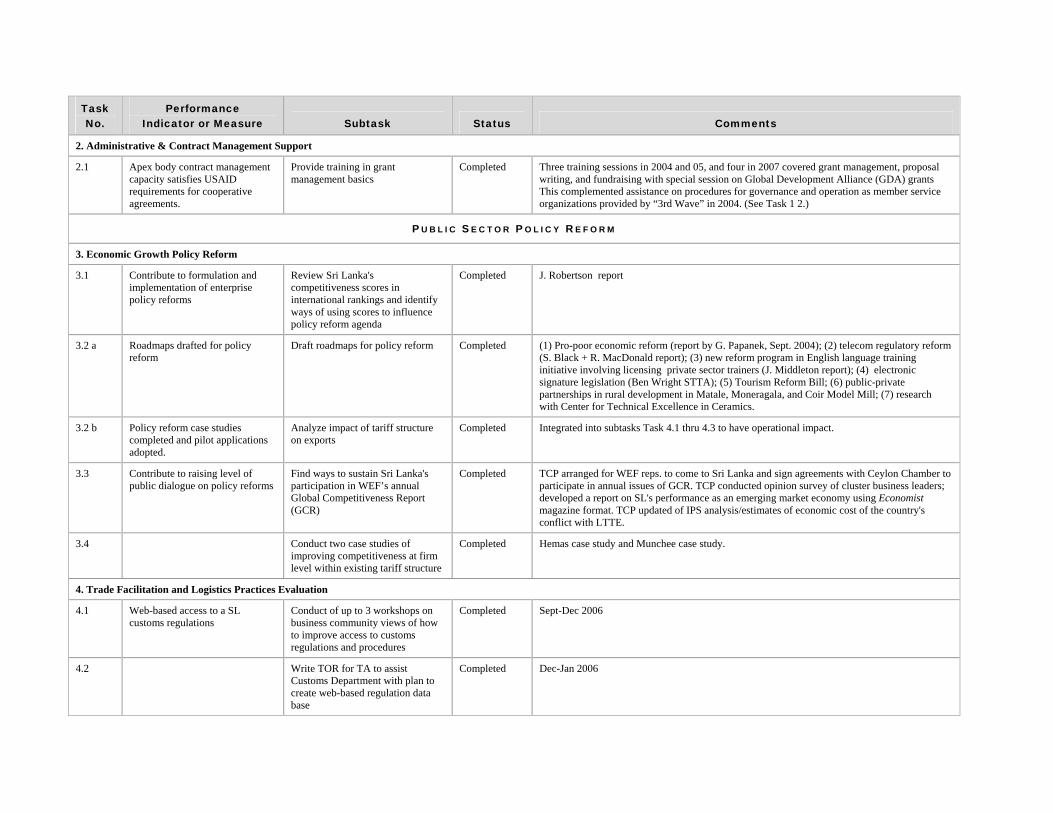
Task Performance No. Indicator or Measure Subtask Status Comments
2. Administrative & Contract Management Support
2.1 Apex body contract management capacity satisfies USAID requirements for cooperative agreements.
Provide training in grant management basics
Completed Three training sessions in 2004 and 05, and four in 2007 covered grant management, proposal writing, and fundraising with special session on Global Development Alliance (GDA) grants This complemented assistance on procedures for governance and operation as member service organizations provided by “3rd Wave” in 2004. (See Task 1 2.)
P U B L I C S E C T O R P O L I C Y R E F O R M
3. Economic Growth Policy Reform
3.1 Contribute to formulation and implementation of enterprise policy reforms
Review Sri Lanka's competitiveness scores in international rankings and identify ways of using scores to influence policy reform agenda
Completed J. Robertson report
3.2 a Roadmaps drafted for policy reform
Draft roadmaps for policy reform Completed (1) Pro-poor economic reform (report by G. Papanek, Sept. 2004); (2) telecom regulatory reform (S. Black + R. MacDonald report); (3) new reform program in English language training initiative involving licensing private sector trainers (J. Middleton report); (4) electronic signature legislation (Ben Wright STTA); (5) Tourism Reform Bill; (6) public-private partnerships in rural development in Matale, Moneragala, and Coir Model Mill; (7) research with Center for Technical Excellence in Ceramics.
3.2 b Policy reform case studies completed and pilot applications adopted.
Analyze impact of tariff structure on exports
Completed Integrated into subtasks Task 4.1 thru 4.3 to have operational impact.
3.3 Contribute to raising level of public dialogue on policy reforms
Find ways to sustain Sri Lanka's participation in WEF’s annual Global Competitiveness Report (GCR)
Completed TCP arranged for WEF reps. to come to Sri Lanka and sign agreements with Ceylon Chamber to participate in annual issues of GCR. TCP conducted opinion survey of cluster business leaders; developed a report on SL's performance as an emerging market economy using Economist magazine format. TCP updated of IPS analysis/estimates of economic cost of the country's conflict with LTTE.
3.4 Conduct two case studies of improving competitiveness at firm level within existing tariff structure
Completed Hemas case study and Munchee case study.
4. Trade Facilitation and Logistics Practices Evaluation
4.1 Web-based access to a SL customs regulations
Conduct of up to 3 workshops on business community views of how to improve access to customs regulations and procedures
Completed Sept-Dec 2006
4.2 Write TOR for TA to assist Customs Department with plan to create web-based regulation data base
Completed Dec-Jan 2006
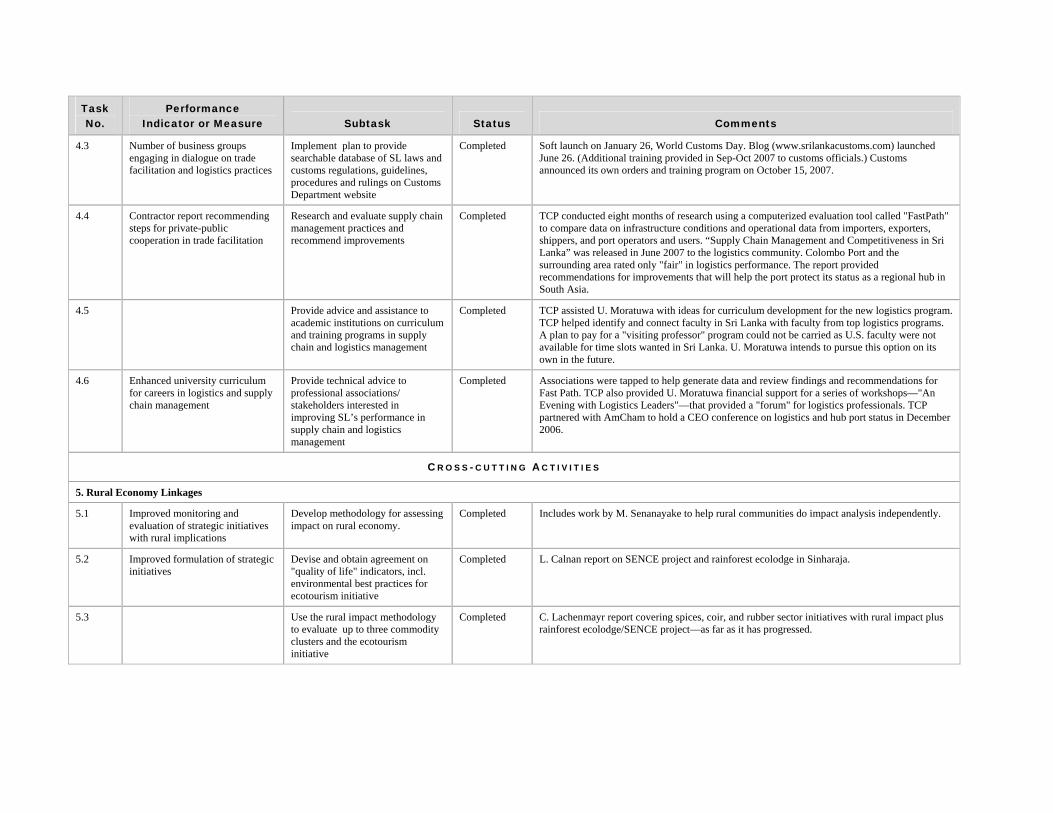
Task Performance No. Indicator or Measure Subtask Status Comments
4.3 Number of business groups engaging in dialogue on trade facilitation and logistics practices
Implement plan to provide searchable database of SL laws and customs regulations, guidelines, procedures and rulings on Customs Department website
Completed Soft launch on January 26, World Customs Day. Blog (www.srilankacustoms.com) launched June 26. (Additional training provided in Sep-Oct 2007 to customs officials.) Customs announced its own orders and training program on October 15, 2007.
4.4 Contractor report recommending steps for private-public cooperation in trade facilitation
Research and evaluate supply chain management practices and recommend improvements
Completed TCP conducted eight months of research using a computerized evaluation tool called "FastPath" to compare data on infrastructure conditions and operational data from importers, exporters, shippers, and port operators and users. “Supply Chain Management and Competitiveness in Sri Lanka” was released in June 2007 to the logistics community. Colombo Port and the surrounding area rated only "fair" in logistics performance. The report provided recommendations for improvements that will help the port protect its status as a regional hub in South Asia.
4.5 Provide advice and assistance to academic institutions on curriculum and training programs in supply chain and logistics management
Completed TCP assisted U. Moratuwa with ideas for curriculum development for the new logistics program. TCP helped identify and connect faculty in Sri Lanka with faculty from top logistics programs. A plan to pay for a "visiting professor" program could not be carried as U.S. faculty were not available for time slots wanted in Sri Lanka. U. Moratuwa intends to pursue this option on its own in the future.
4.6 Enhanced university curriculum for careers in logistics and supply chain management
Provide technical advice to professional associations/ stakeholders interested in improving SL’s performance in supply chain and logistics management
Completed Associations were tapped to help generate data and review findings and recommendations for Fast Path. TCP also provided U. Moratuwa financial support for a series of workshops—"An Evening with Logistics Leaders"—that provided a "forum" for logistics professionals. TCP partnered with AmCham to hold a CEO conference on logistics and hub port status in December 2006.
C R O S S - C U T T I N G A C T I V I T I E S
5. Rural Economy Linkages
5.1 Improved monitoring and evaluation of strategic initiatives with rural implications
Develop methodology for assessing impact on rural economy.
Completed Includes work by M. Senanayake to help rural communities do impact analysis independently.
5.2 Improved formulation of strategic initiatives
Devise and obtain agreement on "quality of life" indicators, incl. environmental best practices for ecotourism initiative
Completed L. Calnan report on SENCE project and rainforest ecolodge in Sinharaja.
5.3 Use the rural impact methodology to evaluate up to three commodity clusters and the ecotourism initiative
Completed C. Lachenmayr report covering spices, coir, and rubber sector initiatives with rural impact plus rainforest ecolodge/SENCE project—as far as it has progressed.
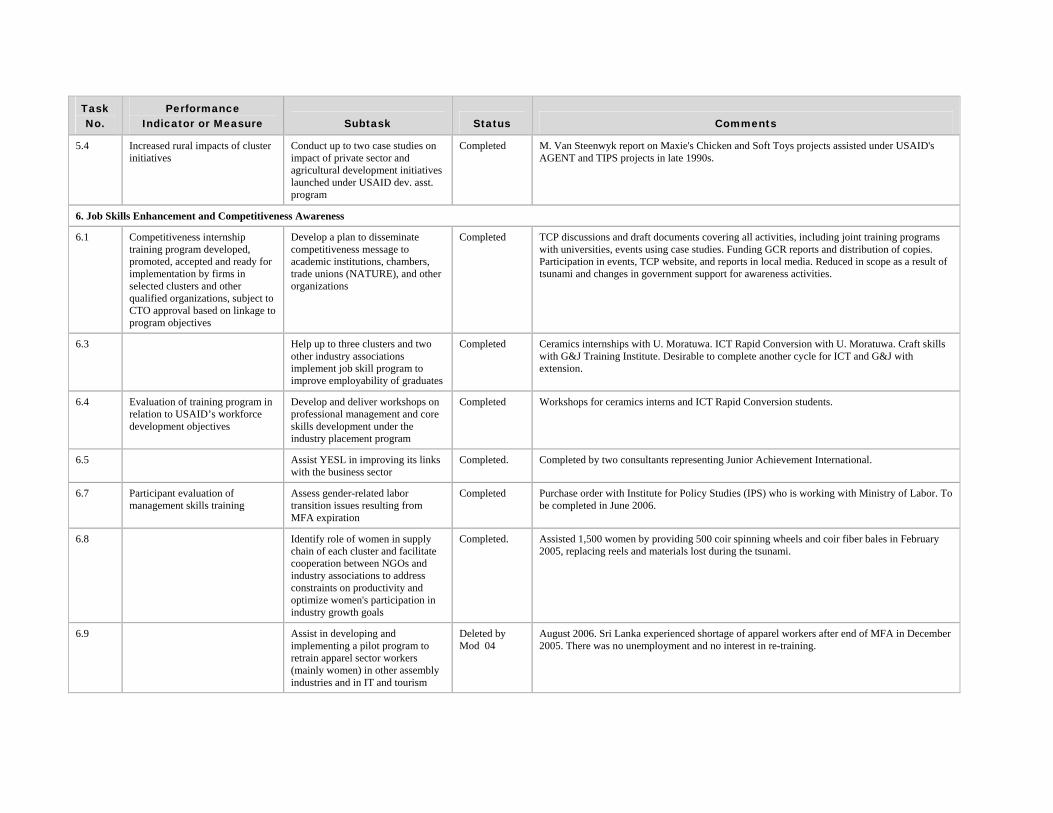
Task Performance No. Indicator or Measure Subtask Status Comments
5.4 Increased rural impacts of cluster initiatives
Conduct up to two case studies on impact of private sector and agricultural development initiatives launched under USAID dev. asst. program
Completed M. Van Steenwyk report on Maxie's Chicken and Soft Toys projects assisted under USAID's AGENT and TIPS projects in late 1990s.
6. Job Skills Enhancement and Competitiveness Awareness
6.1 Competitiveness internship training program developed, promoted, accepted and ready for implementation by firms in selected clusters and other qualified organizations, subject to CTO approval based on linkage to program objectives
Develop a plan to disseminate competitiveness message to academic institutions, chambers, trade unions (NATURE), and other organizations
Completed TCP discussions and draft documents covering all activities, including joint training programs with universities, events using case studies. Funding GCR reports and distribution of copies. Participation in events, TCP website, and reports in local media. Reduced in scope as a result of tsunami and changes in government support for awareness activities.
6.3 Help up to three clusters and two other industry associations implement job skill program to improve employability of graduates
Completed Ceramics internships with U. Moratuwa. ICT Rapid Conversion with U. Moratuwa. Craft skills with G&J Training Institute. Desirable to complete another cycle for ICT and G&J with extension.
6.4 Evaluation of training program in relation to USAID’s workforce development objectives
Develop and deliver workshops on professional management and core skills development under the industry placement program
Completed Workshops for ceramics interns and ICT Rapid Conversion students.
6.5 Assist YESL in improving its links with the business sector
Completed. Completed by two consultants representing Junior Achievement International.
6.7 Participant evaluation of management skills training
Assess gender-related labor transition issues resulting from MFA expiration
Completed Purchase order with Institute for Policy Studies (IPS) who is working with Ministry of Labor. To be completed in June 2006.
6.8 Identify role of women in supply chain of each cluster and facilitate cooperation between NGOs and industry associations to address constraints on productivity and optimize women's participation in industry growth goals
Completed. Assisted 1,500 women by providing 500 coir spinning wheels and coir fiber bales in February 2005, replacing reels and materials lost during the tsunami.
6.9 Assist in developing and implementing a pilot program to retrain apparel sector workers (mainly women) in other assembly industries and in IT and tourism
Deleted by Mod 04
August 2006. Sri Lanka experienced shortage of apparel workers after end of MFA in December 2005. There was no unemployment and no interest in re-training.
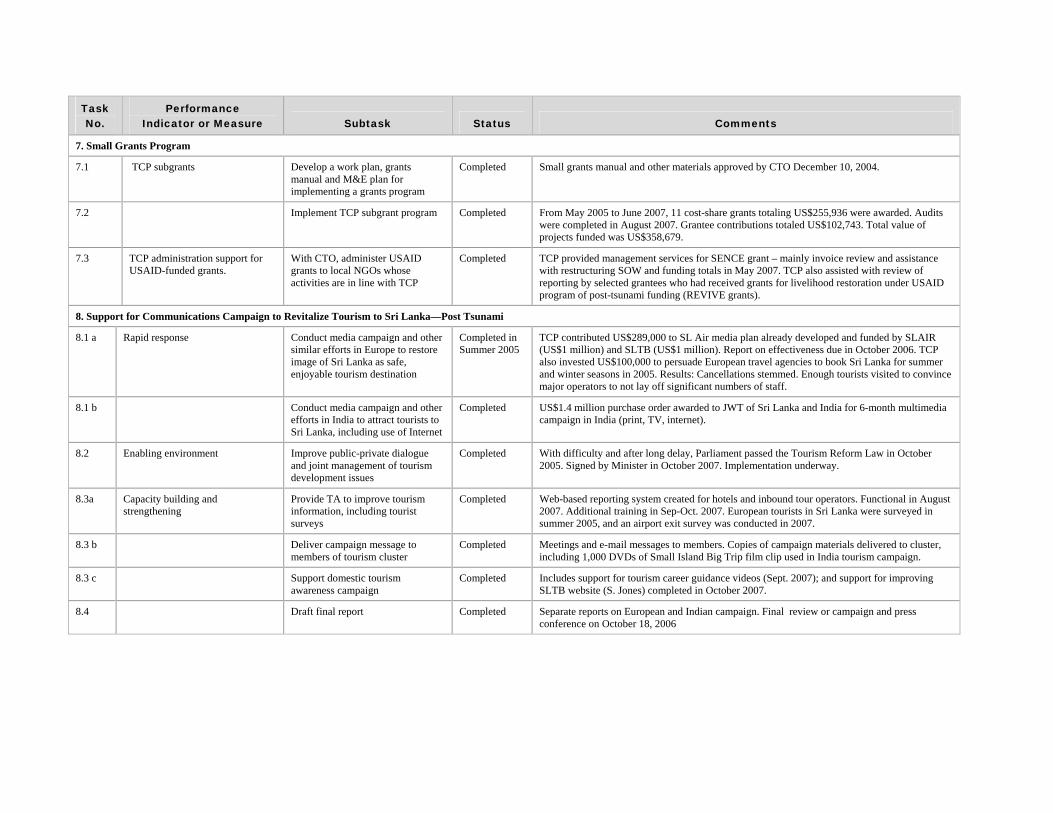
Task No.
Performance Indicator or Measure Subtask Status Comments
7. Small Grants Program
7.1 TCP subgrants Develop a work plan, grants manual and M&E plan for implementing a grants program
Completed Small grants manual and other materials approved by CTO December 10, 2004.
7.2 Implement TCP subgrant program Completed From May 2005 to June 2007, 11 cost-share grants totaling US$255,936 were awarded. Audits were completed in August 2007. Grantee contributions totaled US$102,743. Total value of projects funded was US$358,679.
7.3 TCP administration support for USAID-funded grants.
With CTO, administer USAID grants to local NGOs whose activities are in line with TCP
Completed TCP provided management services for SENCE grant – mainly invoice review and assistance with restructuring SOW and funding totals in May 2007. TCP also assisted with review of reporting by selected grantees who had received grants for livelihood restoration under USAID program of post-tsunami funding (REVIVE grants).
8. Support for Communications Campaign to Revitalize Tourism to Sri Lanka—Post Tsunami
8.1 a Rapid response Conduct media campaign and other similar efforts in Europe to restore image of Sri Lanka as safe, enjoyable tourism destination
Completed in Summer 2005
TCP contributed US$289,000 to SL Air media plan already developed and funded by SLAIR (US$1 million) and SLTB (US$1 million). Report on effectiveness due in October 2006. TCP also invested US$100,000 to persuade European travel agencies to book Sri Lanka for summer and winter seasons in 2005. Results: Cancellations stemmed. Enough tourists visited to convince major operators to not lay off significant numbers of staff.
8.1 b Conduct media campaign and other efforts in India to attract tourists to Sri Lanka, including use of Internet
Completed US$1.4 million purchase order awarded to JWT of Sri Lanka and India for 6-month multimedia campaign in India (print, TV, internet).
8.2 Enabling environment Improve public-private dialogue and joint management of tourism development issues
Completed With difficulty and after long delay, Parliament passed the Tourism Reform Law in October 2005. Signed by Minister in October 2007. Implementation underway.
8.3a Capacity building and strengthening
Provide TA to improve tourism information, including tourist surveys
Completed Web-based reporting system created for hotels and inbound tour operators. Functional in August 2007. Additional training in Sep-Oct. 2007. European tourists in Sri Lanka were surveyed in summer 2005, and an airport exit survey was conducted in 2007.
8.3 b Deliver campaign message to members of tourism cluster
Completed Meetings and e-mail messages to members. Copies of campaign materials delivered to cluster, including 1,000 DVDs of Small Island Big Trip film clip used in India tourism campaign.
8.3 c Support domestic tourism awareness campaign
Completed Includes support for tourism career guidance videos (Sept. 2007); and support for improving SLTB website (S. Jones) completed in October 2007.
8.4 Draft final report Completed Separate reports on European and Indian campaign. Final review or campaign and press conference on October 18, 2006

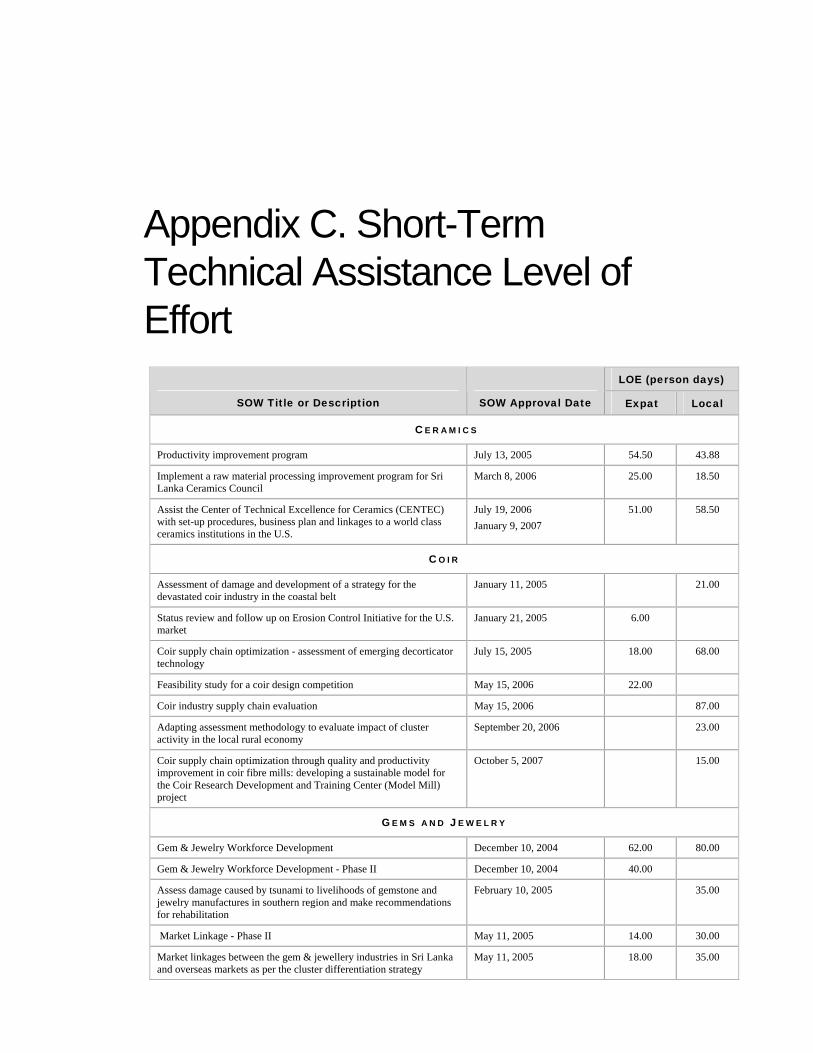
Appendix C. Short-Term Technical Assistance Level of Effort
LOE (person days)
SOW Title or Description SOW Approval Date Expat Local
C E R A M I C S
Productivity improvement program July 13, 2005 54.50 43.88
Implement a raw material processing improvement program for Sri Lanka Ceramics Council
March 8, 2006 25.00 18.50
Assist the Center of Technical Excellence for Ceramics (CENTEC) with set-up procedures, business plan and linkages to a world class ceramics institutions in the U.S.
July 19, 2006 January 9, 2007
51.00 58.50
C O I R
Assessment of damage and development of a strategy for the devastated coir industry in the coastal belt
January 11, 2005 21.00
Status review and follow up on Erosion Control Initiative for the U.S. market
January 21, 2005 6.00
Coir supply chain optimization - assessment of emerging decorticator technology
July 15, 2005 18.00 68.00
Feasibility study for a coir design competition May 15, 2006 22.00
Coir industry supply chain evaluation May 15, 2006 87.00
Adapting assessment methodology to evaluate impact of cluster activity in the local rural economy
September 20, 2006 23.00
Coir supply chain optimization through quality and productivity improvement in coir fibre mills: developing a sustainable model for the Coir Research Development and Training Center (Model Mill) project
October 5, 2007 15.00
G E M S A N D J E W E L R Y
Gem & Jewelry Workforce Development December 10, 2004 62.00 80.00
Gem & Jewelry Workforce Development - Phase II December 10, 2004 40.00
Assess damage caused by tsunami to livelihoods of gemstone and jewelry manufactures in southern region and make recommendations for rehabilitation
February 10, 2005 35.00
Market Linkage - Phase II May 11, 2005 14.00 30.00
Market linkages between the gem & jewellery industries in Sri Lanka and overseas markets as per the cluster differentiation strategy
May 11, 2005 18.00 35.00
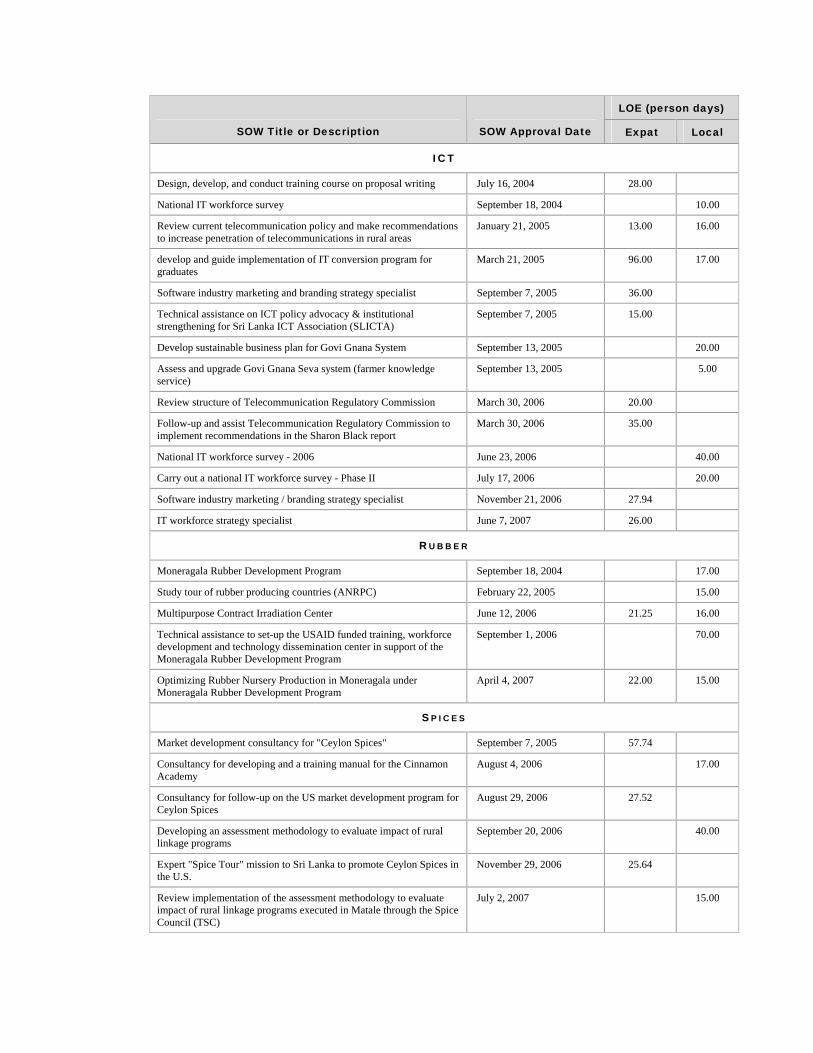
LOE (person days)
SOW Title or Description SOW Approval Date Expat Local
I C T
Design, develop, and conduct training course on proposal writing July 16, 2004 28.00
National IT workforce survey September 18, 2004 10.00
Review current telecommunication policy and make recommendations to increase penetration of telecommunications in rural areas
January 21, 2005 13.00 16.00
develop and guide implementation of IT conversion program for graduates
March 21, 2005 96.00 17.00
Software industry marketing and branding strategy specialist September 7, 2005 36.00
Technical assistance on ICT policy advocacy & institutional strengthening for Sri Lanka ICT Association (SLICTA)
September 7, 2005 15.00
Develop sustainable business plan for Govi Gnana System September 13, 2005 20.00
Assess and upgrade Govi Gnana Seva system (farmer knowledge service)
September 13, 2005 5.00
Review structure of Telecommunication Regulatory Commission March 30, 2006 20.00
Follow-up and assist Telecommunication Regulatory Commission to implement recommendations in the Sharon Black report
March 30, 2006 35.00
National IT workforce survey - 2006 June 23, 2006 40.00
Carry out a national IT workforce survey - Phase II July 17, 2006 20.00
Software industry marketing / branding strategy specialist November 21, 2006 27.94
IT workforce strategy specialist June 7, 2007 26.00
R U B B E R
Moneragala Rubber Development Program September 18, 2004 17.00
Study tour of rubber producing countries (ANRPC) February 22, 2005 15.00
Multipurpose Contract Irradiation Center June 12, 2006 21.25 16.00
Technical assistance to set-up the USAID funded training, workforce development and technology dissemination center in support of the Moneragala Rubber Development Program
September 1, 2006 70.00
Optimizing Rubber Nursery Production in Moneragala under Moneragala Rubber Development Program
April 4, 2007 22.00 15.00
S P I C E S
Market development consultancy for "Ceylon Spices" September 7, 2005 57.74
Consultancy for developing and a training manual for the Cinnamon Academy
August 4, 2006 17.00
Consultancy for follow-up on the US market development program for Ceylon Spices
August 29, 2006 27.52
Developing an assessment methodology to evaluate impact of rural linkage programs
September 20, 2006 40.00
Expert "Spice Tour" mission to Sri Lanka to promote Ceylon Spices in the U.S.
November 29, 2006 25.64
Review implementation of the assessment methodology to evaluate impact of rural linkage programs executed in Matale through the Spice Council (TSC)
July 2, 2007 15.00

LOE (person days)
SOW Title or Description SOW Approval Date Expat Local
T E A
Develop a brand promotion and marketing strategy for Ceylon tea to be implemented by the Sri Lanka Tea Board
May 25, 2005 16.50
Assist TCP to develop a business plan proposal for the market information and resource center for submission to the Min. of Plantation Industries - Plantation Development Project (PDP)
May 25, 2005 20.00
T O U R I S M ( I N C L U D I N G T S U N A M I R E C O V E R Y )
Demonstration ecolodge initiative - rural sociologist September 9, 2004 29.00
Public relations & media strategy advisor January 13, 2005 53.00
Demonstration ecolodge initiative - interpretive designer October 28, 2004 5.00
Support to SENCE Eco-tourism initiative and tourism recovery-redevelopment - STTA
January 21, 2005 14.12
Ecotourism specialist - eco tourism development and training initiatives - STTA
November 2, 2004 20.50
Demonstration ecolodge botanical baseline research study February 8, 2005 39.00
Demonstration ecolodge initiative - facilitator and stakeholder relations specialist
April 12, 2005 40.00
Ecotourism Specialist - grant management and monitoring / evaluation support of SENCE eco-tourism initiative
June 23, 2005 12.25
Industry expert in public relations & media to serve as strategy advisor and project director
October 28, 2005 11.00
Recommendations for a sustainable information management system April 25, 2006 52.00 51.95
Specialist in grant management, to manage and revise a work plan and budget for a USAID-funded grantee - SENCE
June 23, 2006 26.30
Grant coordinator for the tourism research improvement March 5, 2007 15.00
Coordinators to implement tourism research improvement activities March 5, 2007 206.77
Industry expert in marketing, communications and web-based tourism promotion techniques
August 23, 2007 30.00
E C O N O M Y - W I D E A S S I G N M E N T S
Report and presentation on Sri Lanka's rankings in GCR and Index of Economic Freedom
August 25, 2004 34.00
Senior economic advisor to the Ministry of Finance on growth with poverty alleviation reforms (econ policy)
September 2, 2004 25.00
Technical assistance activity with the Sri Lankan Department of Customs (econ policy/customs)
October 13, 2006 25.00 706.00
Diagnostic study for a technical assistance activity with the Sri Lankan Department of Customs (econ policy/customs)
October 13, 2006 22.00 30.00
Trade facilitation and logistics practices evaluation (logistics) October 26, 2006 138.33 75.00
Develop a business plan for a National Center of Excellence for English Language Training (workforce dev. policy)
March 8, 2006 28.00 20.00
C R O S S - C U T T I N G C L U S T E R S A N D C H A M B E R S ( S U B G R A N T S )
Developing a work plan, grants manual and other materials for implementing a small grants program + Completed preparation of a small grants program for final CTO approval
December 10, 2004 24.00
Close out audits of partner organizations subgrants under the TCP Small Grants Program and provide accounting assistance to accountant
Apr il 12 & September 10, 2007
88.00

LOE (person days)
SOW Title or Description SOW Approval Date Expat Local
Provide administrative and contract management training to individuals from industry clusters and other potential grantees in private sector
January 30, 2007 82.12
C A S E S T U D I E S + M O N I T O R I N G A N D R E P O R T I N G
Monitoring, evaluation, and reporting May 9, 2005 265 400
Business case study of private sector firms in Sri Lanka exemplifying competitiveness
May 12, 2005 142.00
Case studies evaluating long term impact of USAID assistance on two mature private sector development projects (Maxi’s Chicken and Selyn Soft Toys)
May 31, 2005 47.00 20.00
Enhancing and documenting rural impact of value-chain linked TCP initiatives
February 5, 2007 57.00
M I S C E L L A N E O U S
Identification & assessment of development assistance opportunities for valued-addition activities in Sri Lanka fisheries sector
June 27, 2005 35.00 15.00
Developing a strategic and a fund raising program for the Young Entrepreneurs Program (YESL)
December 30, 2005 32.00
Assisting rural village weavers and exporters in designing eco-based handicraft products
February 27, 2007 17.00
Report with recommendations for a "Savor Sri Lanka" tour program September 27, 2007 15.00
Other short-term work for admin and general, procurement management, event management, data collection, report preparation editing and miscellaneous tasks.
Various 597 27 77.00
Subtotals (person-days) 2,536.6 2,839.10
Grand total (person days) 5,375

Appendix D. Technical Assistance Purchase Orders
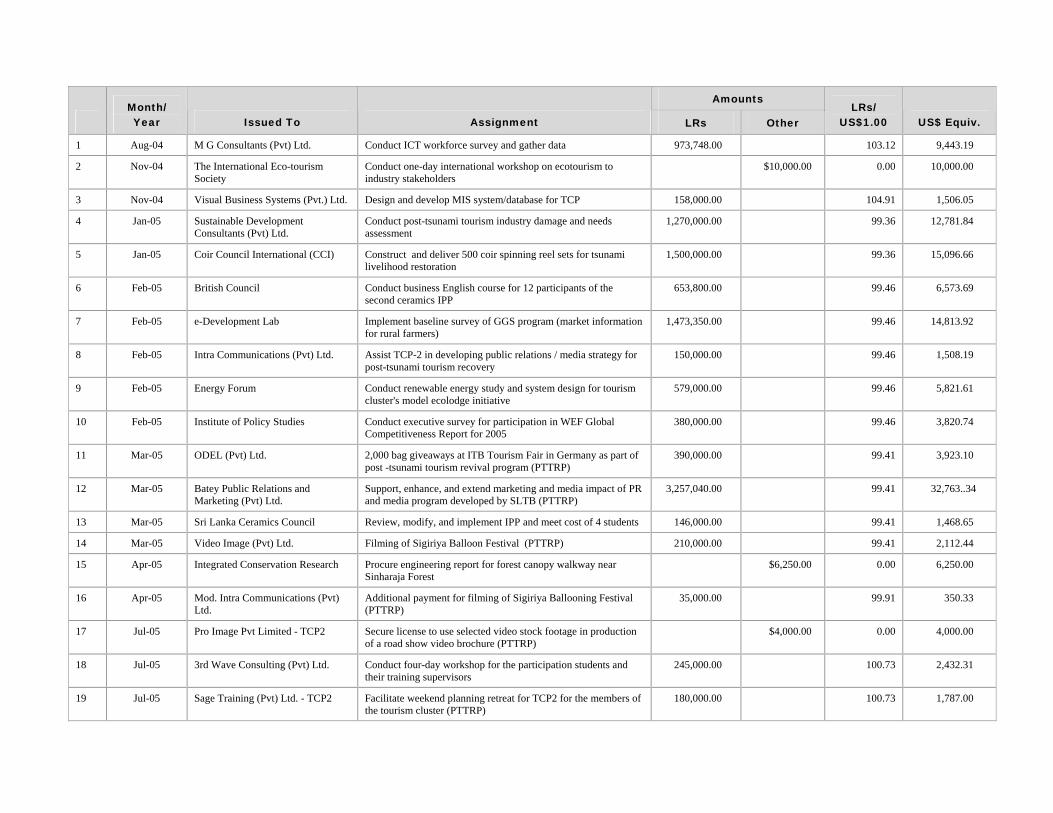
Amounts
Month/ Year Issued To Assignment LRs Other
LRs/ US$1.00 US$ Equiv.
1 Aug-04 M G Consultants (Pvt) Ltd. Conduct ICT workforce survey and gather data 973,748.00 103.12 9,443.19
2 Nov-04 The International Eco-tourism Society
Conduct one-day international workshop on ecotourism to industry stakeholders
$10,000.00 0.00 10,000.00
3 Nov-04 Visual Business Systems (Pvt.) Ltd. Design and develop MIS system/database for TCP 158,000.00 104.91 1,506.05
4 Jan-05 Sustainable Development Consultants (Pvt) Ltd.
Conduct post-tsunami tourism industry damage and needs assessment
1,270,000.00 99.36 12,781.84
5 Jan-05 Coir Council International (CCI) Construct and deliver 500 coir spinning reel sets for tsunami livelihood restoration
1,500,000.00 99.36 15,096.66
6 Feb-05 British Council Conduct business English course for 12 participants of the second ceramics IPP
653,800.00 99.46 6,573.69
7 Feb-05 e-Development Lab Implement baseline survey of GGS program (market information for rural farmers)
1,473,350.00 99.46 14,813.92
8 Feb-05 Intra Communications (Pvt) Ltd. Assist TCP-2 in developing public relations / media strategy for post-tsunami tourism recovery
150,000.00 99.46 1,508.19
9 Feb-05 Energy Forum Conduct renewable energy study and system design for tourism cluster's model ecolodge initiative
579,000.00 99.46 5,821.61
10 Feb-05 Institute of Policy Studies Conduct executive survey for participation in WEF Global Competitiveness Report for 2005
380,000.00 99.46 3,820.74
11 Mar-05 ODEL (Pvt) Ltd. 2,000 bag giveaways at ITB Tourism Fair in Germany as part of post -tsunami tourism revival program (PTTRP)
390,000.00 99.41 3,923.10
12 Mar-05 Batey Public Relations and Marketing (Pvt) Ltd.
Support, enhance, and extend marketing and media impact of PR and media program developed by SLTB (PTTRP)
3,257,040.00 99.41 32,763..34
13 Mar-05 Sri Lanka Ceramics Council Review, modify, and implement IPP and meet cost of 4 students 146,000.00 99.41 1,468.65
14 Mar-05 Video Image (Pvt) Ltd. Filming of Sigiriya Balloon Festival (PTTRP) 210,000.00 99.41 2,112.44
15 Apr-05 Integrated Conservation Research Procure engineering report for forest canopy walkway near Sinharaja Forest
$6,250.00 0.00 6,250.00
16 Apr-05 Mod. Intra Communications (Pvt) Ltd.
Additional payment for filming of Sigiriya Ballooning Festival (PTTRP)
35,000.00 99.91 350.33
17 Jul-05 Pro Image Pvt Limited - TCP2 Secure license to use selected video stock footage in production of a road show video brochure (PTTRP)
$4,000.00 0.00 4,000.00
18 Jul-05 3rd Wave Consulting (Pvt) Ltd. Conduct four-day workshop for the participation students and their training supervisors
245,000.00 100.73 2,432.31
19 Jul-05 Sage Training (Pvt) Ltd. - TCP2 Facilitate weekend planning retreat for TCP2 for the members of the tourism cluster (PTTRP)
180,000.00 100.73 1,787.00
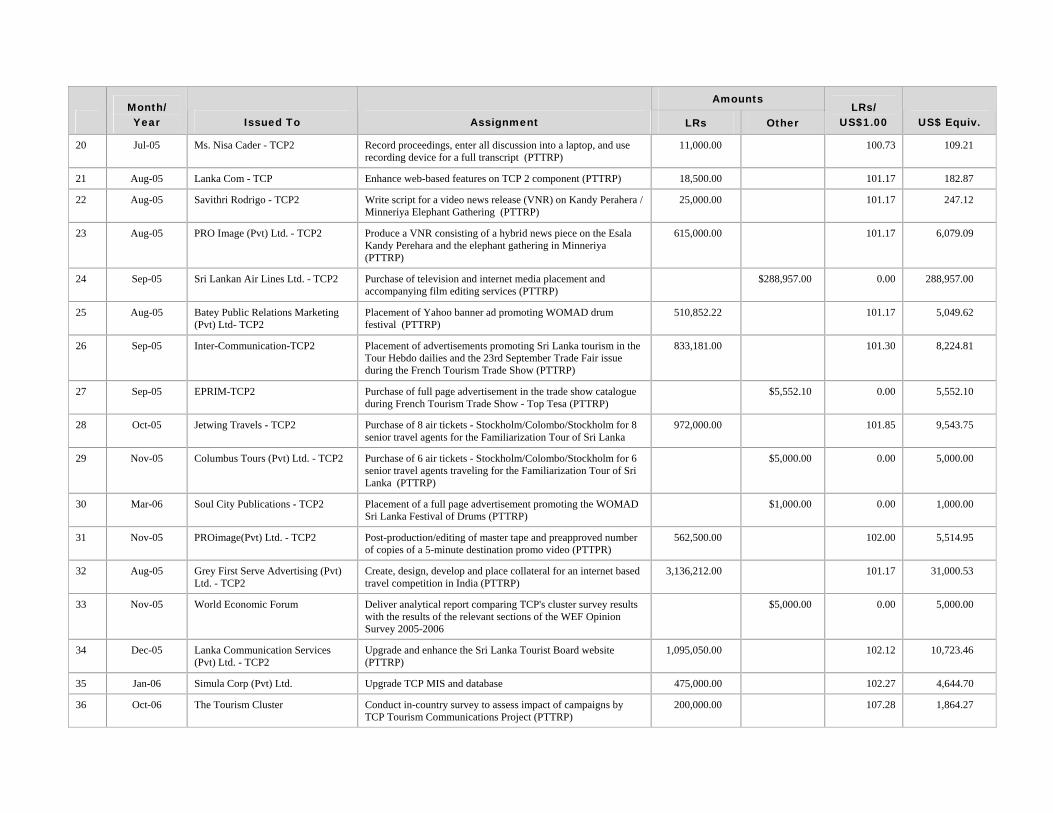
Amounts Month/ LRs/
Year Issued To Assignment US$1.00 US$ Equiv. LRs Other
20 Jul-05 Ms. Nisa Cader - TCP2 Record proceedings, enter all discussion into a laptop, and use recording device for a full transcript (PTTRP)
11,000.00 100.73 109.21
21 Aug-05 Lanka Com - TCP Enhance web-based features on TCP 2 component (PTTRP) 18,500.00 101.17 182.87
22 Aug-05 Savithri Rodrigo - TCP2 Write script for a video news release (VNR) on Kandy Perahera / Minneriya Elephant Gathering (PTTRP)
25,000.00 101.17 247.12
23 Aug-05 PRO Image (Pvt) Ltd. - TCP2 Produce a VNR consisting of a hybrid news piece on the Esala Kandy Perehara and the elephant gathering in Minneriya (PTTRP)
615,000.00 101.17 6,079.09
24 Sep-05 Sri Lankan Air Lines Ltd. - TCP2 Purchase of television and internet media placement and accompanying film editing services (PTTRP)
$288,957.00 0.00 288,957.00
25 Aug-05 Batey Public Relations Marketing (Pvt) Ltd- TCP2
Placement of Yahoo banner ad promoting WOMAD drum festival (PTTRP)
510,852.22 101.17 5,049.62
26 Sep-05 Inter-Communication-TCP2 Placement of advertisements promoting Sri Lanka tourism in the Tour Hebdo dailies and the 23rd September Trade Fair issue during the French Tourism Trade Show (PTTRP)
833,181.00 101.30 8,224.81
27 Sep-05 EPRIM-TCP2 Purchase of full page advertisement in the trade show catalogue during French Tourism Trade Show - Top Tesa (PTTRP)
$5,552.10 0.00 5,552.10
28 Oct-05 Jetwing Travels - TCP2 Purchase of 8 air tickets - Stockholm/Colombo/Stockholm for 8 senior travel agents for the Familiarization Tour of Sri Lanka
972,000.00 101.85 9,543.75
29 Nov-05 Columbus Tours (Pvt) Ltd. - TCP2 Purchase of 6 air tickets - Stockholm/Colombo/Stockholm for 6 senior travel agents traveling for the Familiarization Tour of Sri Lanka (PTTRP)
$5,000.00 0.00 5,000.00
30 Mar-06 Soul City Publications - TCP2 Placement of a full page advertisement promoting the WOMAD Sri Lanka Festival of Drums (PTTRP)
$1,000.00 0.00 1,000.00
31 Nov-05 PROimage(Pvt) Ltd. - TCP2 Post-production/editing of master tape and preapproved number of copies of a 5-minute destination promo video (PTTPR)
562,500.00 102.00 5,514.95
32 Aug-05 Grey First Serve Advertising (Pvt) Ltd. - TCP2
Create, design, develop and place collateral for an internet based travel competition in India (PTTRP)
3,136,212.00 101.17 31,000.53
33 Nov-05 World Economic Forum Deliver analytical report comparing TCP's cluster survey results with the results of the relevant sections of the WEF Opinion Survey 2005-2006
$5,000.00 0.00 5,000.00
34 Dec-05 Lanka Communication Services (Pvt) Ltd. - TCP2
Upgrade and enhance the Sri Lanka Tourist Board website (PTTRP)
1,095,050.00 102.12 10,723.46
35 Jan-06 Simula Corp (Pvt) Ltd. Upgrade TCP MIS and database 475,000.00 102.27 4,644.70
36 Oct-06 The Tourism Cluster Conduct in-country survey to assess impact of campaigns by TCP Tourism Communications Project (PTTRP)
200,000.00 107.28 1,864.27

Amounts Month/ LRs/
Year Issued To Assignment US$1.00 US$ Equiv. LRs Other
37 Jan-06 IPID services (Institute for Participatory Interaction in Development)
Provide services in the field to Mrs. Mallika Samaranayake - Rural Sociologist
355,000.00 102.27 3,471.30
38 Jan-06 PROimage (Pvt) Ltd. - TCP2 One-day production and subsequent transfer of clean broadcast quality B-roll film for a news piece (PTTRP)
70,000.00 102.27 684.48
39 Feb-06 Institute of Policy Studies Conduct executive survey, review and clean data and liaise with WEF for GCR 2006-2007
440,000.00 102.53 4,291.60
40 Feb-06 PROimage (Pvt) Ltd. - TCP2 Assess gender related transition resulting from the expiration of the multi fiber agreement
60,000.00 102.53 585.22
41 Apr-06 Institute of Policy Studies Assessment of gender related transition resulting from the expiration of the multi fiber agreement
1,522,500.00 102.81 14,808.61
42 Apr-06 J. Walter Thompson Pvt. Ltd. - TCP2
Full media campaign in India to promote travel to Sri Lanka Spring Summer 2006 (TV, print, internet) (PTTRP)
1,437,249.00 - 1,437,249.00
43 May-06 Marie De Classique Attire (Pvt) Ltd. - TCP2
5,000 black tote bags with white letter printing "Sri Lanka" on both sides for Sri Lanka Day in London (PTTRP)
893,462.50 102.98 8,676.06
44 May-06 Prominent Print Solutions - TCP2 5,000 - 17x22 glossy paper posters for Sri Lanka Day in London (PTTRP)
110,000.00 102.98 1,068.17
45 May-06 Marie De Classique Attire (Pvt) Ltd. - TCP2
5,000 t-shirts - printed with specifications (PTTRP) 1,250,000.00 102.98 12,138.26
46 May-06 David Pieris Information Technologies Ltd.
Diagnostic study as basis for technical assistance activity to create web-based regulation and procedure database for Sri Lanka Customs
150,000.00 102.98 1,456.59
47 Aug-06 M G Consultants (Pvt) Ltd. Conduct IT Workforce Survey for ICT cluster 1,225,000.00 102.60 11,939.52
48 Nov-06 Moriah Corporate Technologies (Pvt) Ltd.
Edit and format 3 best practices manuals developed by Alberto Silva for the ceramics cluster
65,375.00 108.04 605.10
49 Nov-06 AFFNO (Private) Limited Design and develop customs research database 6,682,001.42 108.04 61,847.48
50 Feb-07 Candela Associates Prepare detailed map of selected transport logistics corridors and the rest of transport system in Sri Lanka and its designated BOI areas
68,000.00 108.75 625.30
51 Feb-07 Singapore Informatics Computer Institute (Pvt.) Ltd.
Provide training for personnel in charge of Customs research database
315,880.00 108.75 2,904.71
52 Mar-07 Simula Corp Develop a web-based tourism research database 1,250,000.00 109.41 11,425.37
53 Apr-07 2,979,100.00 110.20 27,033.16
54 Apr-07
MG Consultants (Pvt) Ltd. Conduct exit survey of tourists departing from Bandaranaiake International Airport (Phased I & II)
1,796,775.00 110.20 16,304.42
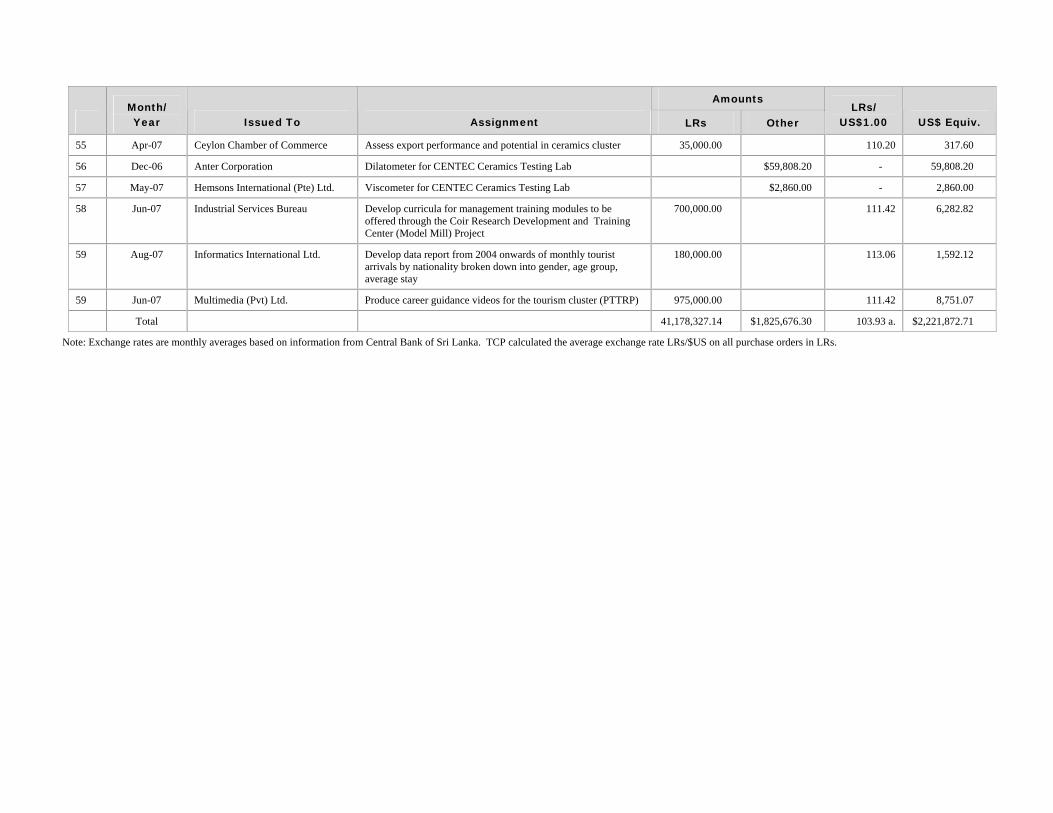
Amounts
Month/ Year Issued To Assignment LRs Other
LRs/ US$1.00 US$ Equiv.
55 Apr-07 Ceylon Chamber of Commerce Assess export performance and potential in ceramics cluster 35,000.00 110.20 317.60
56 Dec-06 Anter Corporation Dilatometer for CENTEC Ceramics Testing Lab $59,808.20 - 59,808.20
57 May-07 Hemsons International (Pte) Ltd. Viscometer for CENTEC Ceramics Testing Lab $2,860.00 - 2,860.00
58 Jun-07 Industrial Services Bureau Develop curricula for management training modules to be offered through the Coir Research Development and Training Center (Model Mill) Project
700,000.00 111.42 6,282.82
59 Aug-07 Informatics International Ltd. Develop data report from 2004 onwards of monthly tourist arrivals by nationality broken down into gender, age group, average stay
180,000.00 113.06 1,592.12
59 Jun-07 Multimedia (Pvt) Ltd. Produce career guidance videos for the tourism cluster (PTTRP) 975,000.00 111.42 8,751.07
Total 41,178,327.14 $1,825,676.30 103.93 a. $2,221,872.71
Note: Exchange rates are monthly averages based on information from Central Bank of Sri Lanka. TCP calculated the average exchange rate LRs/$US on all purchase orders in LRs.

Appendix E. Technical Reports Title Sent to USAID
C E R A M I C S
Raw Materials used in Ceramic Production (report done with Alberto Silva) 21-Jun-06
Technical Assistance Program to Improve the Quality and Consistency of Raw Materials used in Ceramic Production
13-Aug-07
Production of Wall Tiles in a Double Fast Firing Process + Production of Floor Tiles in a Single Fast Firing Process + Production of Tableware Porcelain
13-Aug-07
An Assessment of Export Performance of the Sri Lanka Ceramics Sector - 2006 13-Aug-07
Center for Technical Excellence in Ceramics - Capacity Building - Reports Parts 1 and 2 on Structure and Business Model
27-Sep-07
Center for Technical Excellence in Ceramics - Capacity Building - Establishment of Laboratory Protocols and Educational Program
27-Sep-07
C O I R
Strategy Report for Rehabilitation of Tsunami-damaged Coir Industry 26-Aug-05
Activities to support the CCI's Erosion Control (EC) Initiative for the U.S. Market 24-Aug-05
Distribution of 500 Coir Spinning Reels of traditional design to Spinners - report 17-May-06
International Coir Sustainable Design Competition Assessment 29-Aug-07
Coir Industry Supply Chain Evaluation 27-Sep-07
Coir Research Development and Training Centre Beyond 2008 - A Business Plan Outline for Sustainable Continuance
8-Nov-07
G E M S & J E W E L R Y
Damage to the Gem & Jewellery industry, value chain in the Southern Region due to Tsunami 24-Aug-05
Training in Intermediate to Advance Levels of Stone Setting Techniques 24-Nov-05
Job Skills Enhancement & Competitiveness Awareness in Gems and Jewellry Industry in Sri Lanka 24-Nov-05
Training & Training-of-Trainers + Reading Material + Feedbacks 17-Jan-06
Training & Training-of-Trainers for Industry Competitiveness & Employment Generation 30-Mar-06
Report on Training Program in Stone Setting Techniques 31-Jul-06
Market Linkages between the Gem & Jewelry Industry in Sri Lanka and Overseas Markets (report 3- part report done with Kuehn's)
2-Aug-06
I C T
Geared for Growth: The Improving Stability of the Sri Lankan IT Workforce 24-Aug-05
Review of current Telecommunications Policy in Sri Lanka and Recommendations to increase penetration of Telecommunications into the Rural areas (2-part report w. S. Black)
12-Oct-05
Technical Assistance on ICT Policy Advocacy & Institutional Strengthening for SLICTA 30-Mar-06

Title Sent to USAID
ICT Software Export Strategy Report 17-May-06
A Pilot Program for Helping Unemployed University Graduates to Bridge into Information Technology Careers
13-Jul-06
The Brand and Marketing Strategy and Marketing Action Plan for Software Sector in Sri Lanka 27-Sep-07
R U B B E R
Legal Framework for Wellassa Rubber Company - Moneragala Rubber Program 11-Jun-05
Moneragala Rubber Program - Wellassa Rubber Company Ltd. First Year work plan 11-Jun-05
Multipurpose Gamma Irradiation Facility in Sri Lanka - A Prefeasibiliity Study and Business Model 19-Aug-06
Improving Productivity and Performance in Rubber Nurseries of Moneragala Rubber Development Project 6-Jun-07
Business Plan for Training, Workforce Development & Technology Dissemination Centre (T&TDC) 26-Nov-07
S P I C E
Part I & II- Developing an Assessment Methodology to Evaluate Impact of Rural Linkage Programs implemented through TCP Industry Organizations
2-Aug-06
T O U R I S M
Demonstration Ecolodge Initiative 26-Aug-05
ITB Trade Fair - Trip Report & Draft Strategic Plan for Tourism Marketing Communications 28-Sep-05
A Marketing Communications Strategic Plan (Post Tsunami) 12-Oct-05
Post Tsunami Needs Assessment of the Tourism Industry in selected Coastal Communities 4-Nov-05
Recommended Suitable/Latest Bio-Gas Energy Technologies & Cost benefit Analysis + Study Report 4-Nov-05
SENCE - Summary Proposal & Related Materials 4-Nov-05
Canopy Walkway Proposal : Design & Estimates 25-Nov-05
Improving Sri Lanka's Tourism Data Systems 15-Nov-06
Botanical Baseline Research Study of The Rainforest Ecolodge Sites at Sinharaja Division Enselwatta Plantation - Deniyaya
13-Aug-07
Outline of a Destination Management System for the Sri Lanka Tourism Board 8-Nov-07
Tourism Communications Support Campaign - Post Tsunami 12-Dec-07
O T H E R
TCP Grants Beneficiary Hand book for Small Grants Program 13-Jun-05
TCP Small Grants Manual 13-Jun-05
Alliance Building & Proposal Writing --Training program materials 24-Aug-05
Sri Lanka's Fisheries Sector - Opportunities for Assisting with Value-Addition in the Value Chain (2 part report done w. Robin Rackowe)
26-Aug-05
Competitiveness: Sri Lanka's place in the world, using International Benchmarks to map a path forward 26-Aug-05
A Sri Lankan Case Study of Firm-Level Competitiveness - Ceylon Biscuits Limited 19-Jan-06
A Sri Lankan Case Study of Firm-Level Competitiveness- Hemas Group 19-Jan-06
Business Plan - Center for Excellence for English Language Teaching (2 part report done with John Middleton)
31-May-06
Business Plan for Gove Gnana Seva (Farmer Intelligence Service) 21-Jun-06
Case Studies and Other materials on Evaluating Impact for USAID Assistance for Mature Private Sector Development Projects (report done with Mark Van Steenwyk)
13-Jul-06
Diagnostic Assessment for a Searchable, On-line Database of Legislation, Regulation and Procedures (Customs)
3-Oct-06
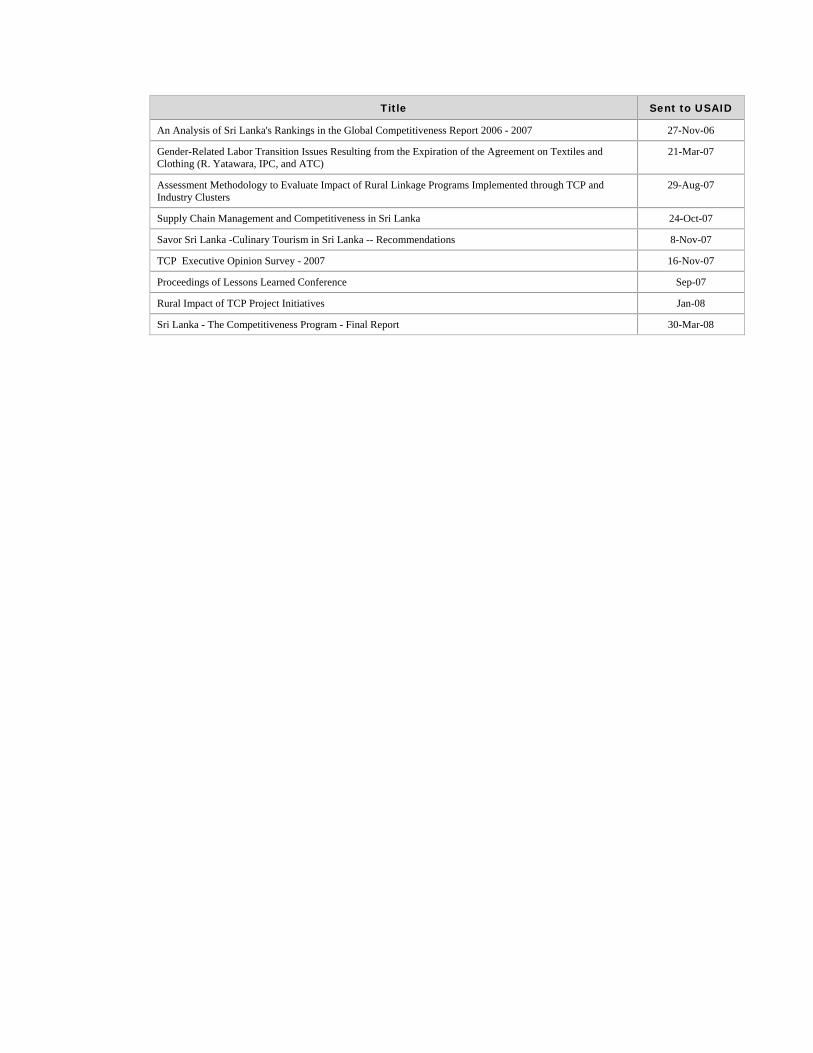
Title Sent to USAID
An Analysis of Sri Lanka's Rankings in the Global Competitiveness Report 2006 - 2007 27-Nov-06
Gender-Related Labor Transition Issues Resulting from the Expiration of the Agreement on Textiles and Clothing (R. Yatawara, IPC, and ATC)
21-Mar-07
Assessment Methodology to Evaluate Impact of Rural Linkage Programs Implemented through TCP and Industry Clusters
29-Aug-07
Supply Chain Management and Competitiveness in Sri Lanka 24-Oct-07
Savor Sri Lanka -Culinary Tourism in Sri Lanka -- Recommendations 8-Nov-07
TCP Executive Opinion Survey - 2007 16-Nov-07
Proceedings of Lessons Learned Conference Sep-07
Rural Impact of TCP Project Initiatives Jan-08
Sri Lanka - The Competitiveness Program - Final Report 30-Mar-08

Appendix F. Cluster Association Development Index (CADI)

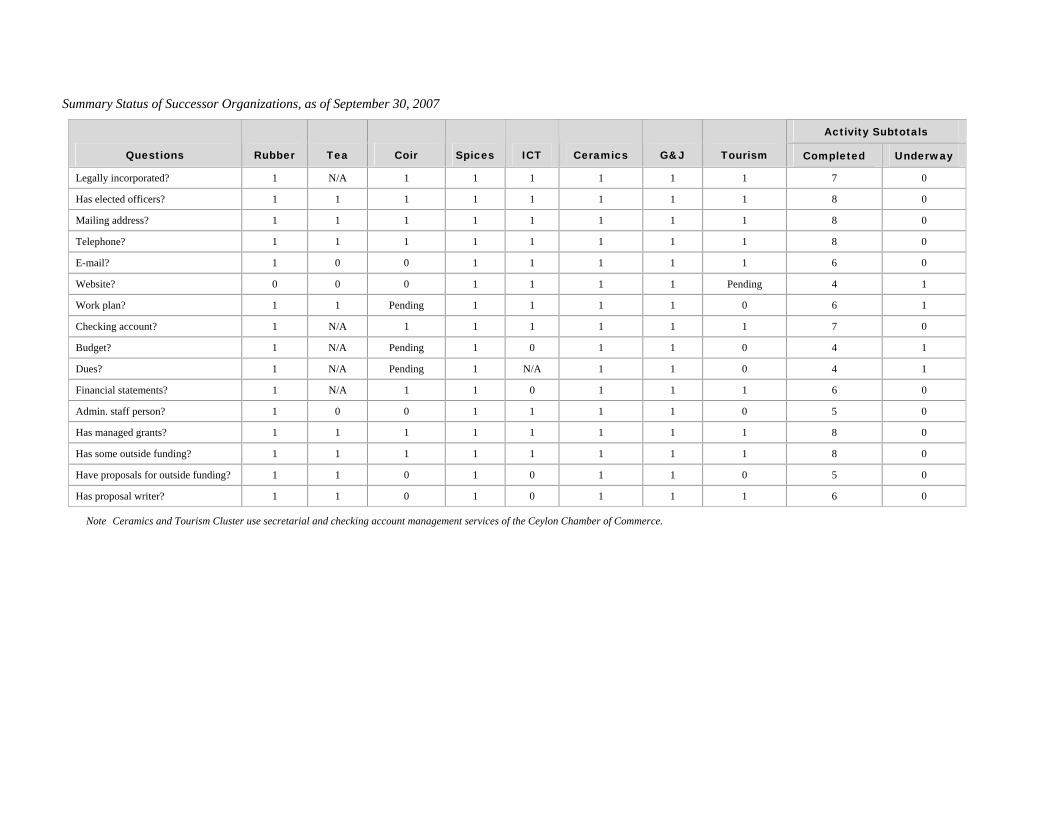
Summary Status of Successor Organizations, as of September 30, 2007
Activity Subtotals
Questions Rubber Tea Coir Spices ICT Ceramics G&J Tourism Completed Underway
Legally incorporated? 1 N/A 1 1 1 1 1 1 7 0
Has elected officers? 1 1 1 1 1 1 1 1 8 0
Mailing address? 1 1 1 1 1 1 1 1 8 0
Telephone? 1 1 1 1 1 1 1 1 8 0
E-mail? 1 0 0 1 1 1 1 1 6 0
Website? 0 0 0 1 1 1 1 Pending 4 1
Work plan? 1 1 Pending 1 1 1 1 0 6 1
Checking account? 1 N/A 1 1 1 1 1 1 7 0
Budget? 1 N/A Pending 1 0 1 1 0 4 1
Dues? 1 N/A Pending 1 N/A 1 1 0 4 1
Financial statements? 1 N/A 1 1 0 1 1 1 6 0
Admin. staff person? 1 0 0 1 1 1 1 0 5 0
Has managed grants? 1 1 1 1 1 1 1 1 8 0
Has some outside funding? 1 1 1 1 1 1 1 1 8 0
Have proposals for outside funding? 1 1 0 1 0 1 1 0 5 0
Has proposal writer? 1 1 0 1 0 1 1 1 6 0
Note Ceramics and Tourism Cluster use secretarial and checking account management services of the Ceylon Chamber of Commerce.
Appendix G. Executive Opinion Survey of TCP-assisted Clusters, 2007 The following tables are excerpted from the report on The Competitiveness Program Executive Opinion Survey, Insight into Cluster Support Activity, 2007. The questions refer to technical assistance and support activities carried out by TCP, by clusters, or by firms to improve the competitiveness of eight industry clusters in Sri Lanka. The 70 survey questions cover three areas: macroeconomic environment, company operations and strategy, and the TCP experience. The scale of 1 to 7, with 7 being a good score, is the same as the scale used in the World Economic Forum’s Executive Opinion Survey, the basis for the annual Global Competitiveness Report. TCP’s first survey was conducted in November 2005, the second in June 2006, and the last in June 2007. The survey results are helpful in identifying best practices and lessons from Sri Lanka’s experience with cluster-based initiatives and TCP.
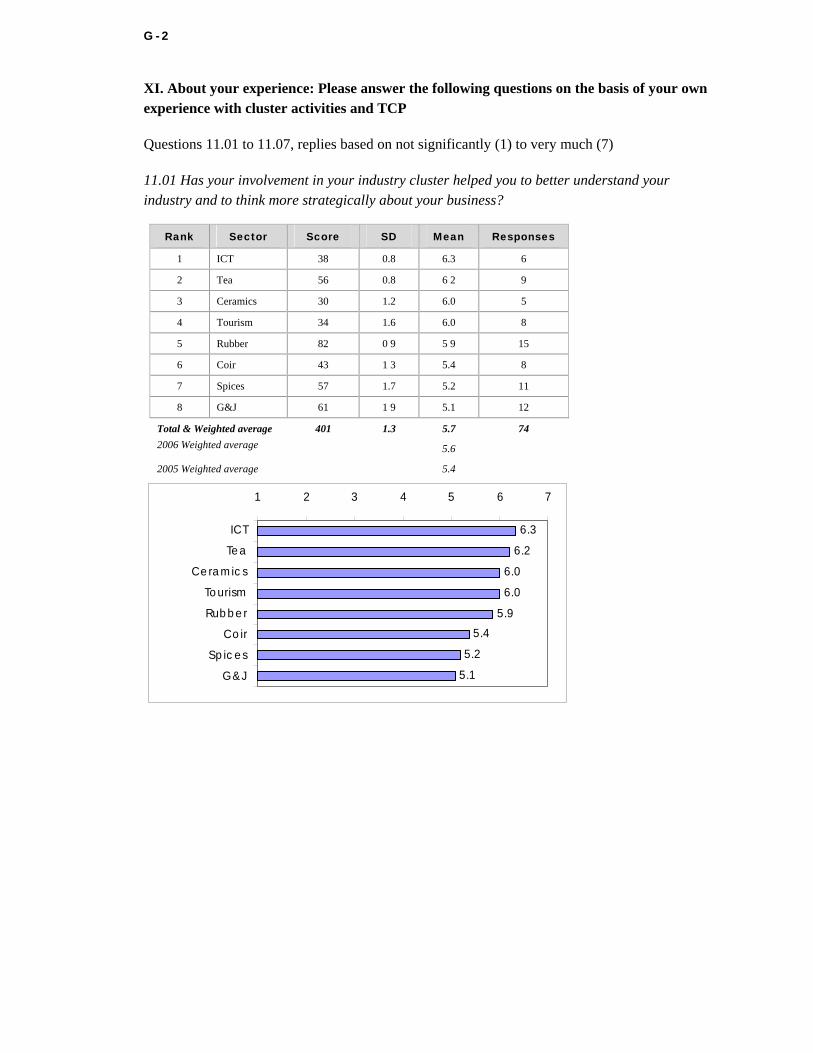
G - 2
XI. About your experience: Please answer the following questions on the basis of your own experience with cluster activities and TCP
Questions 11.01 to 11.07, replies based on not significantly (1) to very much (7)
11.01 Has your involvement in your industry cluster helped you to better understand your industry and to think more strategically about your business?
Rank Sector Score SD Mean Responses
1 ICT 38 0.8 6.3 6
2 Tea 56 0.8 6 2 9
3 Ceramics 30 1.2 6.0 5
4 Tourism 34 1.6 6.0 8
5 Rubber 82 0 9 5 9 15
6 Coir 43 1 3 5.4 8
7 Spices 57 1.7 5.2 11
8 G&J 61 1 9 5.1 12
Total & Weighted average 401 1.3 5.7 74 2006 Weighted average 5.6
2005 Weighted average 5.4
6.3
6.2
6.0
6.0
5.95.4
5.2
5.1
1 2 3 4 5 6 7
ICT
Tea
Ceramics
Tourism
Rubber
Coir
Spices
G&J
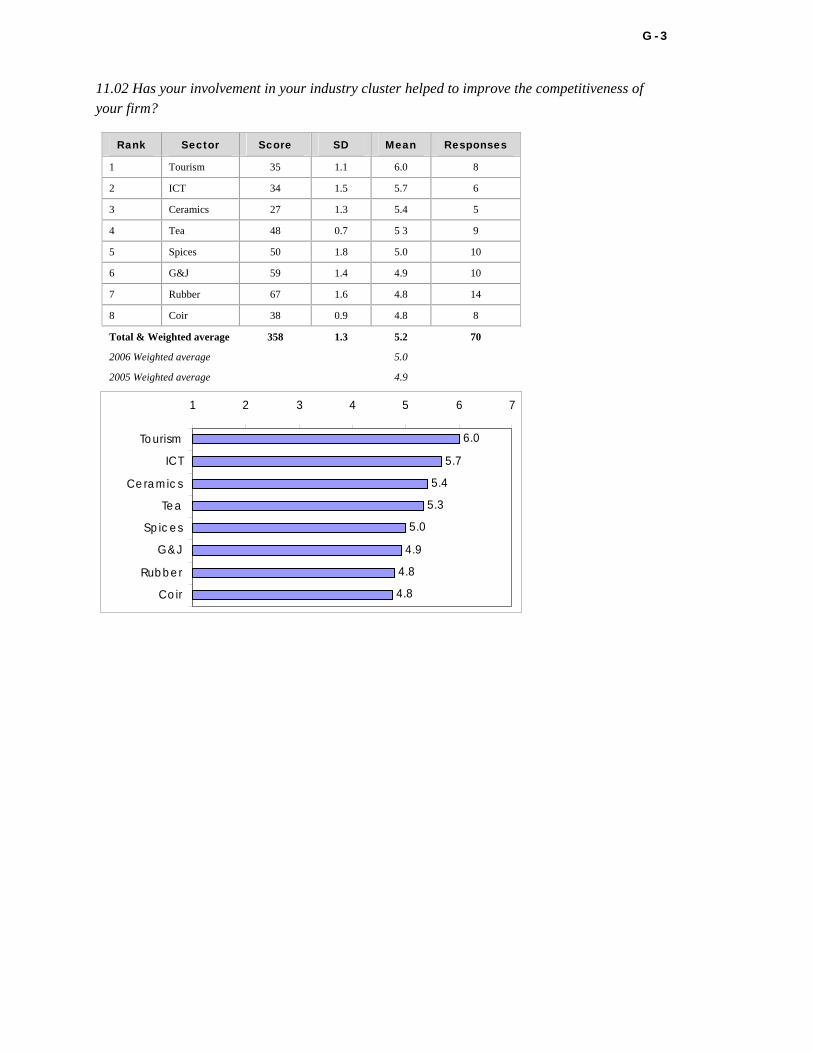
G - 3
11.02 Has your involvement in your industry cluster helped to improve the competitiveness of your firm?
Rank Sector Score SD Mean Responses
1 Tourism 35 1.1 6.0 8
2 ICT 34 1.5 5.7 6
3 Ceramics 27 1.3 5.4 5
4 Tea 48 0.7 5 3 9
5 Spices 50 1.8 5.0 10
6 G&J 59 1.4 4.9 10
7 Rubber 67 1.6 4.8 14
8 Coir 38 0.9 4.8 8
Total & Weighted average 358 1.3 5.2 70
2006 Weighted average 5.0
2005 Weighted average 4.9
6.0
5.7
5.4
5.3
5.0
4.9
4.8
4.8
1 2 3 4 5 6 7
Tourism
ICT
Ceramics
Tea
Spices
G&J
Rubber
Coir
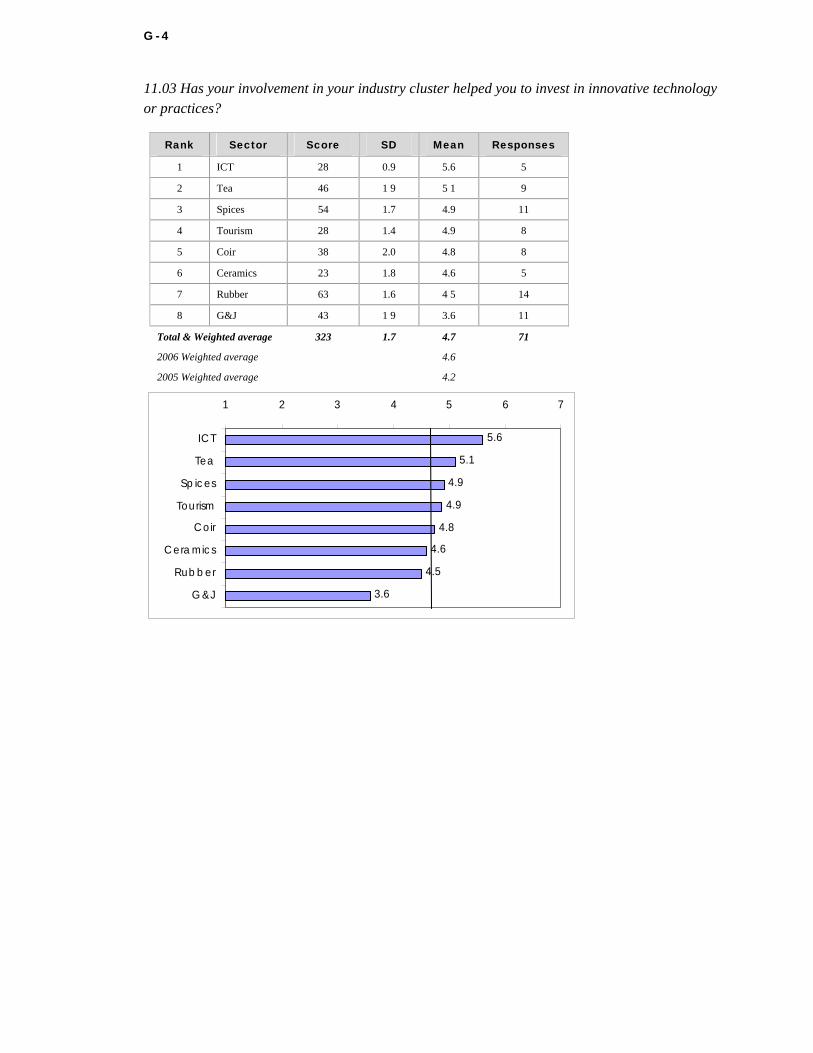
G - 4
11.03 Has your involvement in your industry cluster helped you to invest in innovative technology or practices?
Rank Sector Score SD Mean Responses
1 ICT 28 0.9 5.6 5
2 Tea 46 1 9 5 1 9
3 Spices 54 1.7 4.9 11
4 Tourism 28 1.4 4.9 8
5 Coir 38 2.0 4.8 8
6 Ceramics 23 1.8 4.6 5
7 Rubber 63 1.6 4 5 14
8 G&J 43 1 9 3.6 11
Total & Weighted average 323 1.7 4.7 71
2006 Weighted average 4.6
2005 Weighted average 4.2
5.6
5.1
4.9
4.9
4.8
4.6
4.5
3.6
1 2 3 4 5 6
ICT
Tea
Spices
Tourism
Coir
Ceramics
Rubber
G&J
7
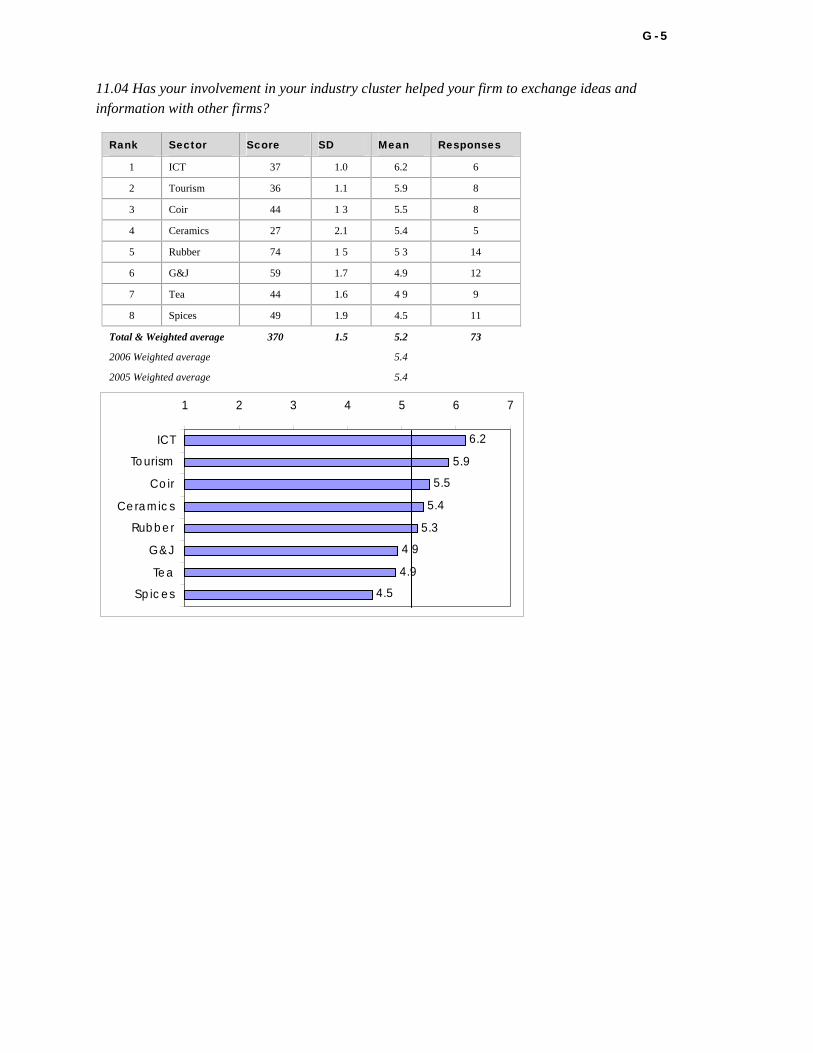
G - 5
11.04 Has your involvement in your industry cluster helped your firm to exchange ideas and information with other firms?
Rank Sector Score SD Mean Responses
1 ICT 37 1.0 6.2 6
2 Tourism 36 1.1 5.9 8
3 Coir 44 1 3 5.5 8
4 Ceramics 27 2.1 5.4 5
5 Rubber 74 1 5 5 3 14
6 G&J 59 1.7 4.9 12
7 Tea 44 1.6 4 9 9
8 Spices 49 1.9 4.5 11
Total & Weighted average 370 1.5 5.2 73
2006 Weighted average 5.4
2005 Weighted average 5.4
6.2
5.9
5.5
5.4
5.3
4 9
4.9
4.5
1 2 3 4 5 6 7
ICT
Tourism
Coir
Ceramics
Rubber
G&J
Tea
Spices

G - 6
11.05 Has your involvement in your industry cluster helped you to invest in your firm's training needs?
Rank Sector Score SD Mean Responses
1 ICT 32 1.4 5.3 6
2 Tourism 31 1.4 5.1 8
3 G&J 59 1 3 4.9 12
4 Ceramics 24 1.6 4.8 5
5 Spices 51 1.8 4.6 11
6 Rubber 63 1.6 4 5 14
7 Coir 35 1 9 4.4 8
8 Tea 34 1 3 3.8 9
Total & Weighted average 329 1.5 4.6 73
2006 Weighted average 4.8
2005 Weighted average 4.7
5.3
5.1
4.9
4.8
4.6
4.5
4.4
3.8
1 2 3 4 5 6 7
ICT
Tourism
G&J
Ceramics
Spices
Rubber
Coir
Tea
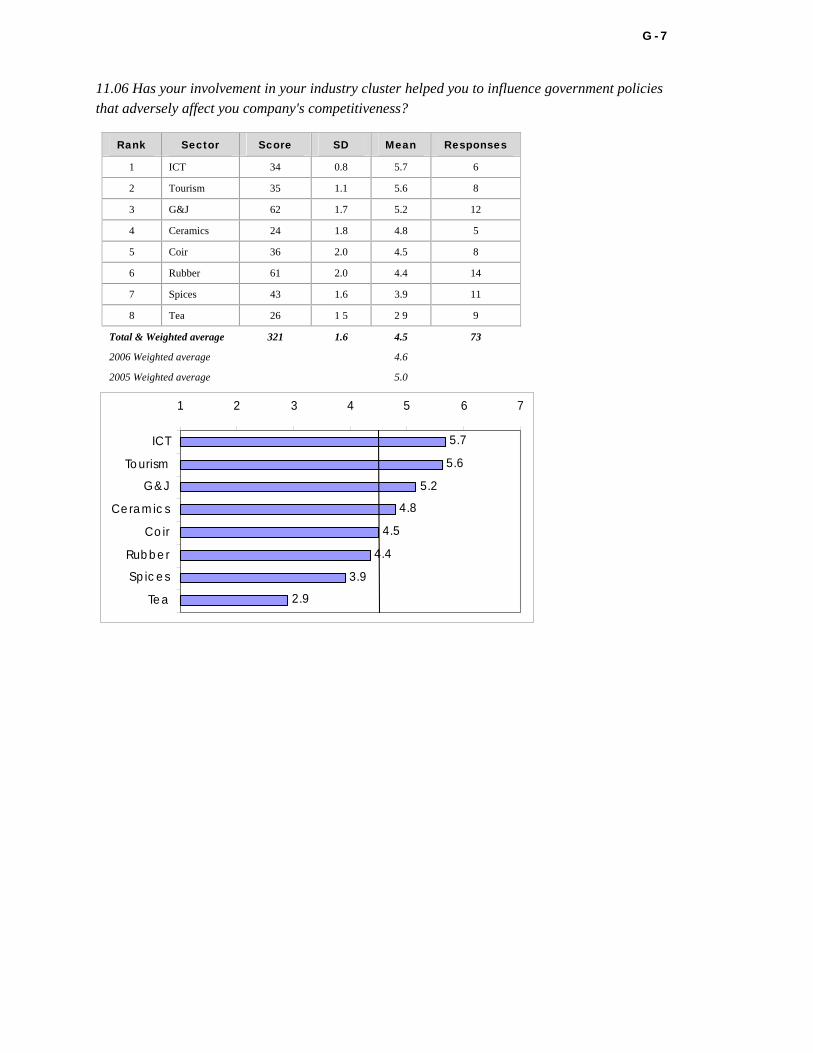
G - 7
11.06 Has your involvement in your industry cluster helped you to influence government policies that adversely affect you company's competitiveness?
Rank Sector Score SD Mean Responses
1 ICT 34 0.8 5.7 6
2 Tourism 35 1.1 5.6 8
3 G&J 62 1.7 5.2 12
4 Ceramics 24 1.8 4.8 5
5 Coir 36 2.0 4.5 8
6 Rubber 61 2.0 4.4 14
7 Spices 43 1.6 3.9 11
8 Tea 26 1 5 2 9 9
Total & Weighted average 321 1.6 4.5 73
2006 Weighted average 4.6
2005 Weighted average 5.0
5.7
5.6
5.2
4.8
4.5
4.4
3.9
2.9
1 2 3 4 5 6
ICT
Tourism
G&J
Ceramics
Coir
Rubber
Spices
Tea
7
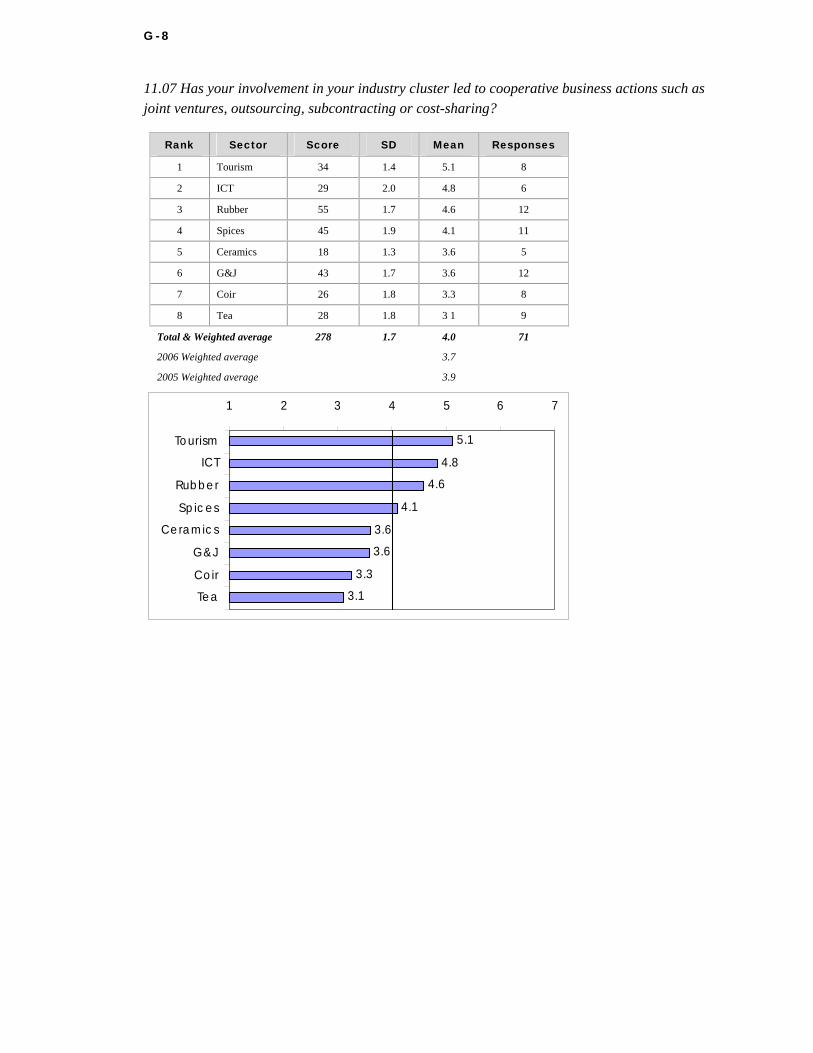
G - 8
11.07 Has your involvement in your industry cluster led to cooperative business actions such as joint ventures, outsourcing, subcontracting or cost-sharing?
Rank Sector Score SD Mean Responses
1 Tourism 34 1.4 5.1 8
2 ICT 29 2.0 4.8 6
3 Rubber 55 1.7 4.6 12
4 Spices 45 1.9 4.1 11
5 Ceramics 18 1.3 3.6 5
6 G&J 43 1.7 3.6 12
7 Coir 26 1.8 3.3 8
8 Tea 28 1.8 3 1 9
Total & Weighted average 278 1.7 4.0 71
2006 Weighted average 3.7
2005 Weighted average 3.9
5.1
4.8
4.6
4.1
3.6
3.6
3.3
3.1
1 2 3 4 5 6
Tourism
ICT
Rubber
Spices
Ceramics
G&J
Coir
Tea
7
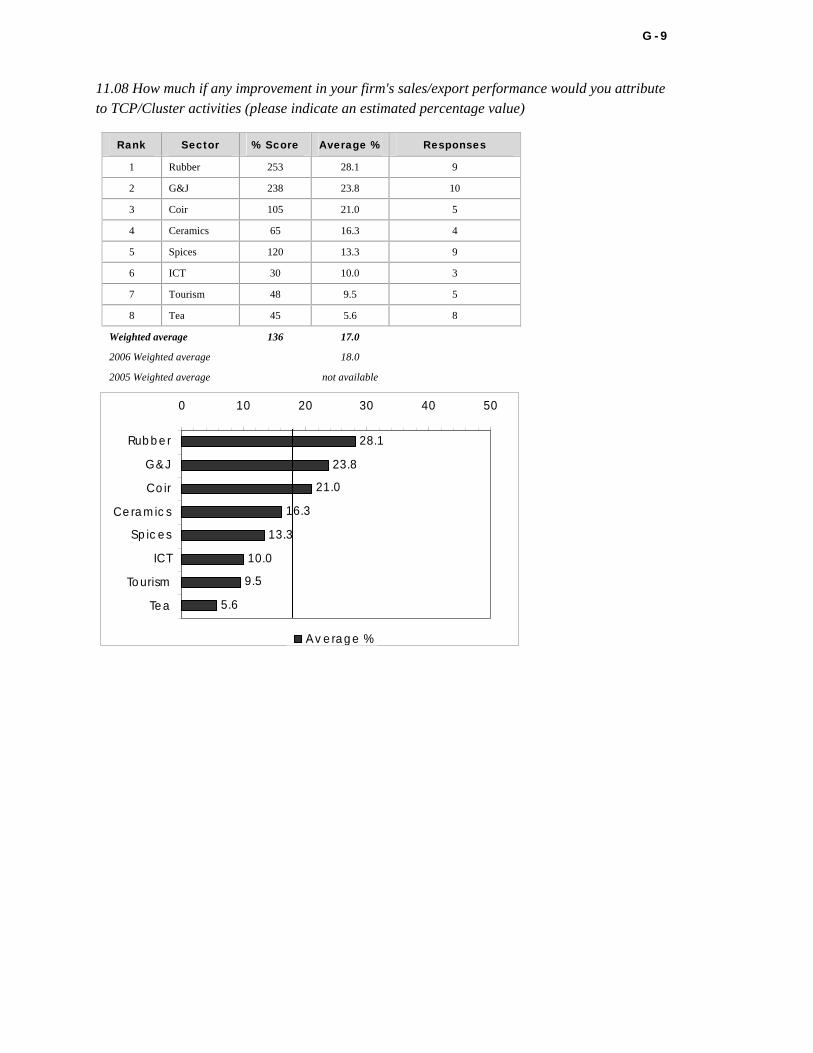
G - 9
11.08 How much if any improvement in your firm's sales/export performance would you attribute to TCP/Cluster activities (please indicate an estimated percentage value)
Rank Sector % Score Average % Responses
1 Rubber 253 28.1 9
2 G&J 238 23.8 10
3 Coir 105 21.0 5
4 Ceramics 65 16.3 4
5 Spices 120 13.3 9
6 ICT 30 10.0 3
7 Tourism 48 9.5 5
8 Tea 45 5.6 8
Weighted average 136 17.0
2006 Weighted average 18.0
2005 Weighted average not available
28.1
23.8
21.0
16.3
13.3
10.0
9.5
5.6
0 10 20 30 40 50
Rubber
G&J
Coir
Ceramics
Spices
ICT
Tourism
Tea
Av erage %

G - 1 0
XII Investments to Improve Competitiveness
12.01 In the past three years your company has invested significantly in ( Not at all (1) Significantly (7)
A - New technology and equipment
Rank Sector Score SD Mean Responses
1 Tourism 35 0.8 5.9 8
2 ICT 34 1.0 5.7 6
3 Ceramics 28 1.1 5.6 5
4 Tea 42 2.2 5.3 9
5 Rubber 65 1.2 5.0 14
6 Spices 50 2.1 4.5 11
7 G&J 50 1.6 4.2 12
8 Coir 30 1.3 3.8 8
Total & Weighted average 334 1.5 4.9 73
2006 Weighted average 5.1
2005 Weighted average 5.2
5.9
5.7
5.6
5.3
5.0
4.5
4.2
3.8
1 2 3 4 5 6 7
Tourism
ICT
Ceramics
Tea
Rubber
Spices
G&J
Coir

G - 1 1
B - Training programs for management and staff
Rank Sector Score SD Mean Responses
1 Tourism 36 0.9 5.6 8
2 ICT 33 1.8 5.5 6
3 Ceramics 26 0.8 5.2 5
4 Tea 43 1.7 4.8 9
5 Rubber 61 1.4 4.7 13
6 G&J 53 2.1 4.4 12
7 Spices 47 1.6 4.3 11
8 Coir 31 1.9 3.9 8
Total & Weighted average 330 1.6 4.7 72
2006 Weighted average 5.1
2005 Weighted average 5.0
5.8
5.7
5.5
5.3
5.2
5.0
4.9
4.3
1 2 3 4 5 6 7
Tourism
Tea
Rubber
ICT
Ceramics
Spices
Coir
G&J

G - 1 2
C . Operation procedures to improve productivity or quality of products/services
Rank Sector Score SD Mean Responses
1 Tourism 36 0.9 5.8 8
2 Tea 51 1.0 5.7 9
3 Rubber 72 0.8 5.5 13
4 ICT 32 1.2 5.3 6
5 Ceramics 26 0.4 5.2 5
6 Spices 55 1.7 5.0 11
7 Coir 39 0.6 4.9 8
8 G&J 51 1.5 4.3 12
Total & Weighted average 362 1.1 5.2 72
2006 Weighted average 5.4
2005 Weighted average 5.3
5.6
5.5
5.2
4.8
4.7
4.4
4.3
3.9
1 2 3 4 5 6 7
Tourism
ICT
Ceramics
Tea
Rubber
G&J
Spices
Coir
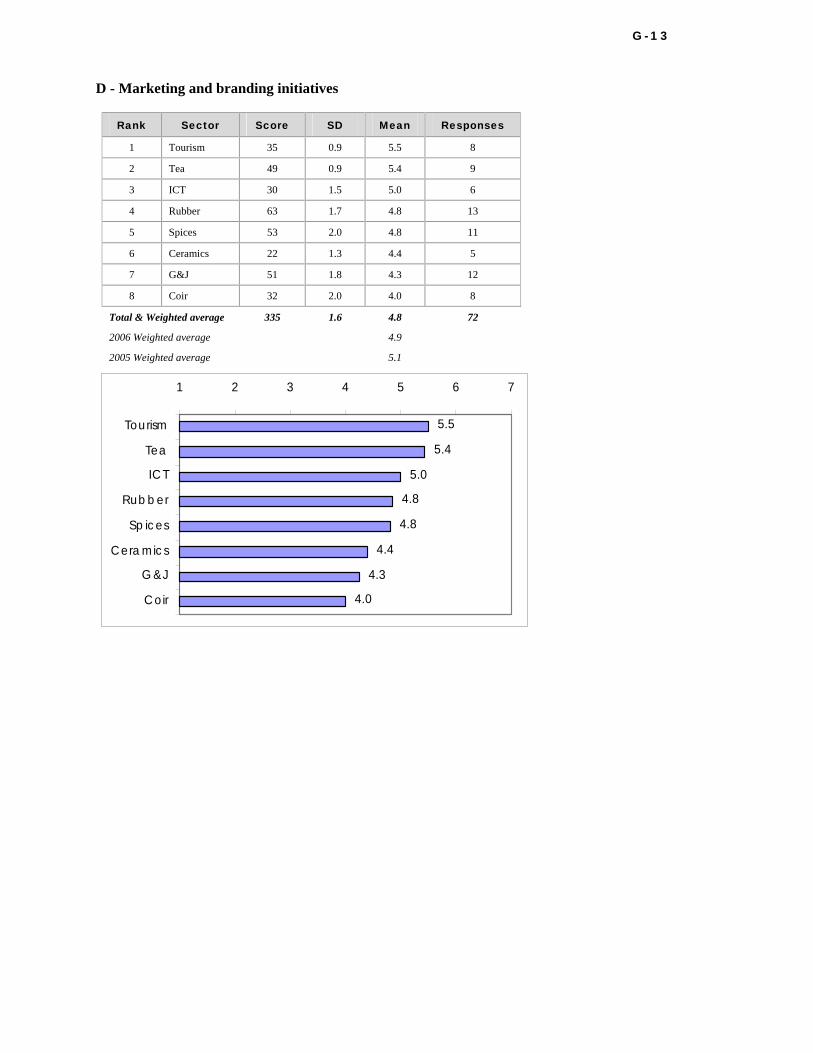
G - 1 3
D - Marketing and branding initiatives
Rank Sector Score SD Mean Responses
1 Tourism 35 0.9 5.5 8
2 Tea 49 0.9 5.4 9
3 ICT 30 1.5 5.0 6
4 Rubber 63 1.7 4.8 13
5 Spices 53 2.0 4.8 11
6 Ceramics 22 1.3 4.4 5
7 G&J 51 1.8 4.3 12
8 Coir 32 2.0 4.0 8
Total & Weighted average 335 1.6 4.8 72
2006 Weighted average 4.9
2005 Weighted average 5.1
5.5
5.4
5.0
4.8
4.8
4.4
4.3
4.0
1 2 3 4 5 6 7
Tourism
Tea
ICT
Rubber
Spices
Ceramics
G&J
Coir
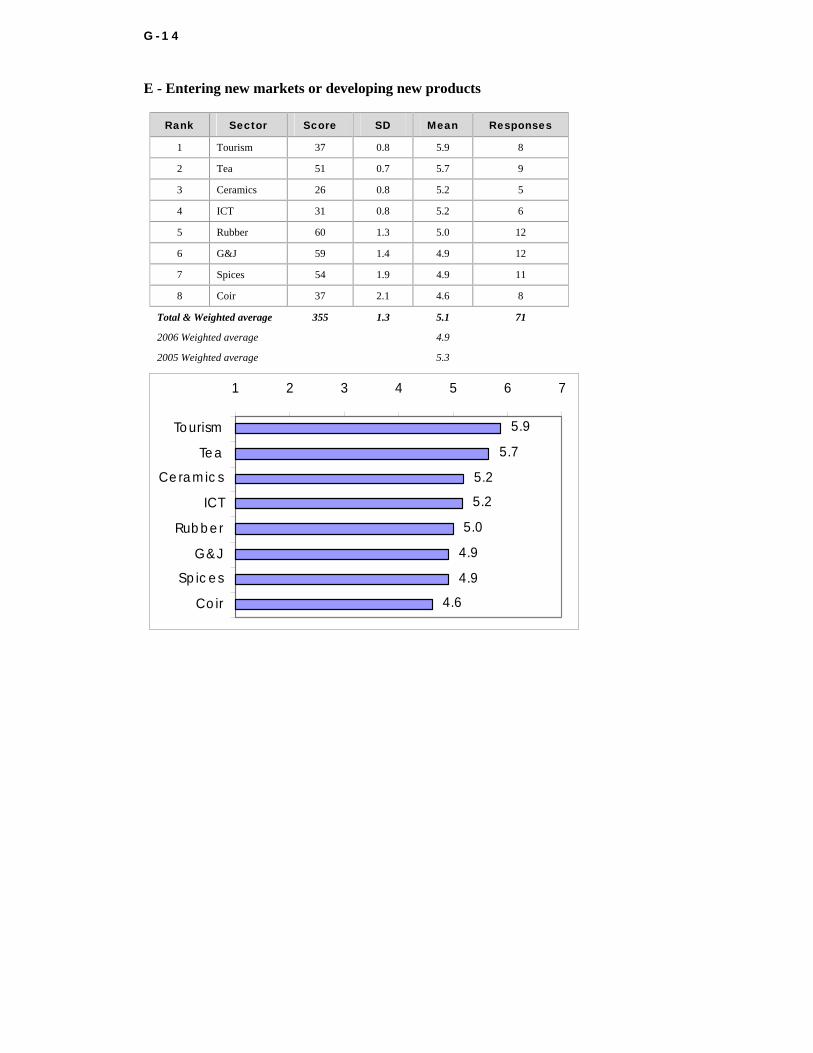
G - 1 4
E - Entering new markets or developing new products
Rank Sector Score SD Mean Responses
1 Tourism 37 0.8 5.9 8
2 Tea 51 0.7 5.7 9
3 Ceramics 26 0.8 5.2 5
4 ICT 31 0.8 5.2 6
5 Rubber 60 1.3 5.0 12
6 G&J 59 1.4 4.9 12
7 Spices 54 1.9 4.9 11
8 Coir 37 2.1 4.6 8
Total & Weighted average 355 1.3 5.1 71
2006 Weighted average 4.9
2005 Weighted average 5.3
5.9
5.7
5.2
5.2
5.0
4.9
4.9
4.6
1 2 3 4 5 6 7
Tourism
Tea
Ceramics
ICT
Rubber
G&J
Spices
Coir
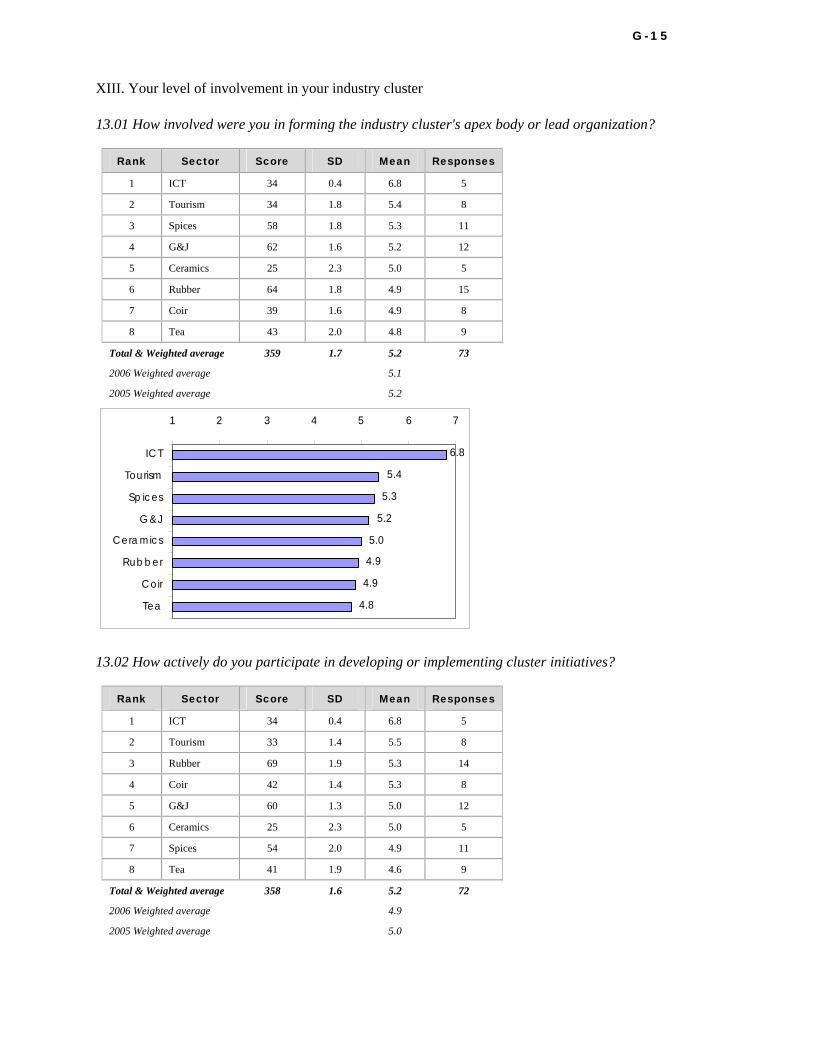
G - 1 5
XIII. Your level of involvement in your industry cluster
13.01 How involved were you in forming the industry cluster's apex body or lead organization?
Rank Sector Score SD Mean Responses
1 ICT 34 0.4 6.8 5
2 Tourism 34 1.8 5.4 8
3 Spices 58 1.8 5.3 11
4 G&J 62 1.6 5.2 12
5 Ceramics 25 2.3 5.0 5
6 Rubber 64 1.8 4.9 15
7 Coir 39 1.6 4.9 8
8 Tea 43 2.0 4.8 9
Total & Weighted average 359 1.7 5.2 73
2006 Weighted average 5.1
2005 Weighted average 5.2
6.8
5.4
5.3
5.2
5.0
4.9
4.9
4.8
1 2 3 4 5 6 7
ICT
Tourism
Spices
G&J
Ceramics
Rubber
Coir
Tea
13.02 How actively do you participate in developing or implementing cluster initiatives?
Rank Sector Score SD Mean Responses
1 ICT 34 0.4 6.8 5
2 Tourism 33 1.4 5.5 8
3 Rubber 69 1.9 5.3 14
4 Coir 42 1.4 5.3 8
5 G&J 60 1.3 5.0 12
6 Ceramics 25 2.3 5.0 5
7 Spices 54 2.0 4.9 11
8 Tea 41 1.9 4.6 9
Total & Weighted average 358 1.6 5.2 72
2006 Weighted average 4.9
2005 Weighted average 5.0

G - 1 6
6.8
5.5
5.3
5.3
5.0
5.0
4.9
4.6
1 2 3 4 5 6 7
ICT
Tourism
Rubber
Coir
G&J
Ceramics
Spices
Tea
13.03 Do you think the benefits of participating in cluster activities justify membership dues? (where applicable)
Rank Sector Score SD Mean Responses
1 ICT 32 0.5 6.4 5
2 Ceramics 31 0.8 6.2 5
3 Rubber 64 1.1 5.8 13
4 Spices 56 1.0 5.6 10
5 Tourism 17 1.3 5.5 6
6 Tea 36 1.6 5.1 7
7 G&J 56 1.4 5.1 11
8 Coir 34 1.3 4.9 7
Total & Weighted average 326 1.2 5.5 64
2006 Weighted average 5.5
2005 Weighted average 5.1
6.4
6.2
5.8
5.6
5.5
5.1
5.1
4.9
1 2 3 4 5 6 7
ICT
Ceramics
Rubber
Spices
Tourism
Tea
G&J
Coir
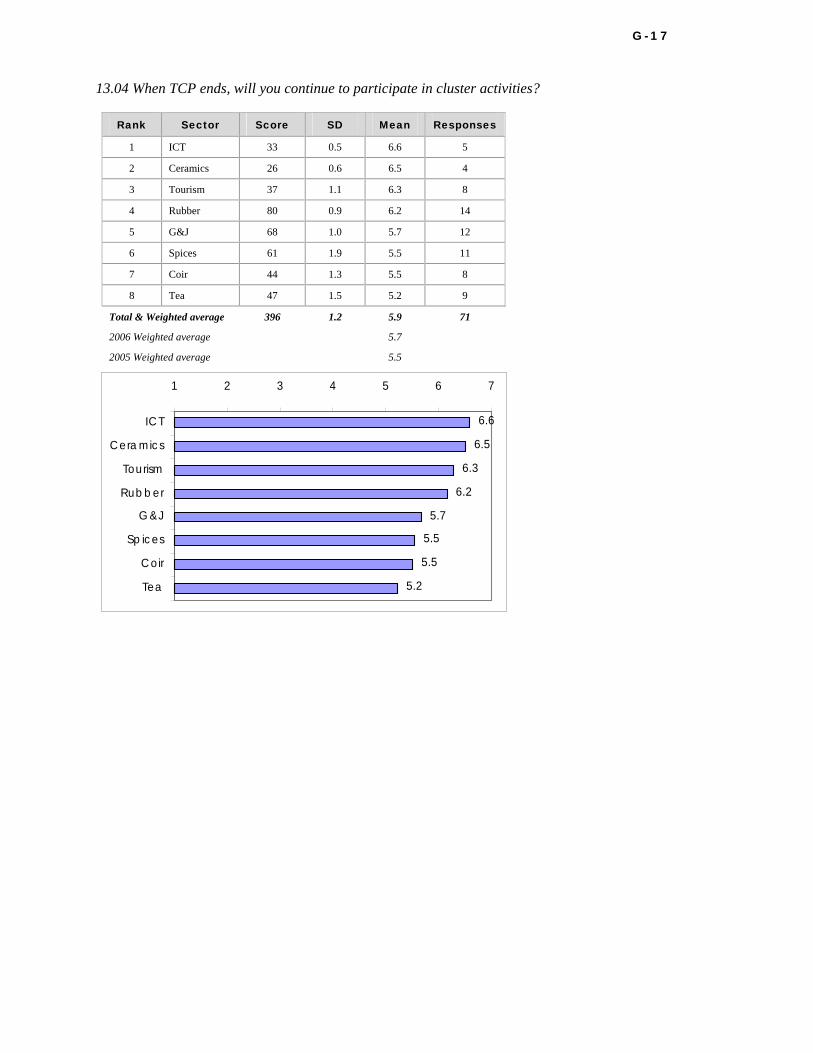
G - 1 7
13.04 When TCP ends, will you continue to participate in cluster activities?
Rank Sector Score SD Mean Responses
1 ICT 33 0.5 6.6 5
2 Ceramics 26 0.6 6.5 4
3 Tourism 37 1.1 6.3 8
4 Rubber 80 0.9 6.2 14
5 G&J 68 1.0 5.7 12
6 Spices 61 1.9 5.5 11
7 Coir 44 1.3 5.5 8
8 Tea 47 1.5 5.2 9
Total & Weighted average 396 1.2 5.9 71
2006 Weighted average 5.7
2005 Weighted average 5.5
6.6
6.5
6.3
6.2
5.7
5.5
5.5
5.2
1 2 3 4 5 6 7
ICT
Ceramics
Tourism
Rubber
G&J
Spices
Coir
Tea

Appendix H. Exports from Sectors with TCP Clusters, 1995–2006

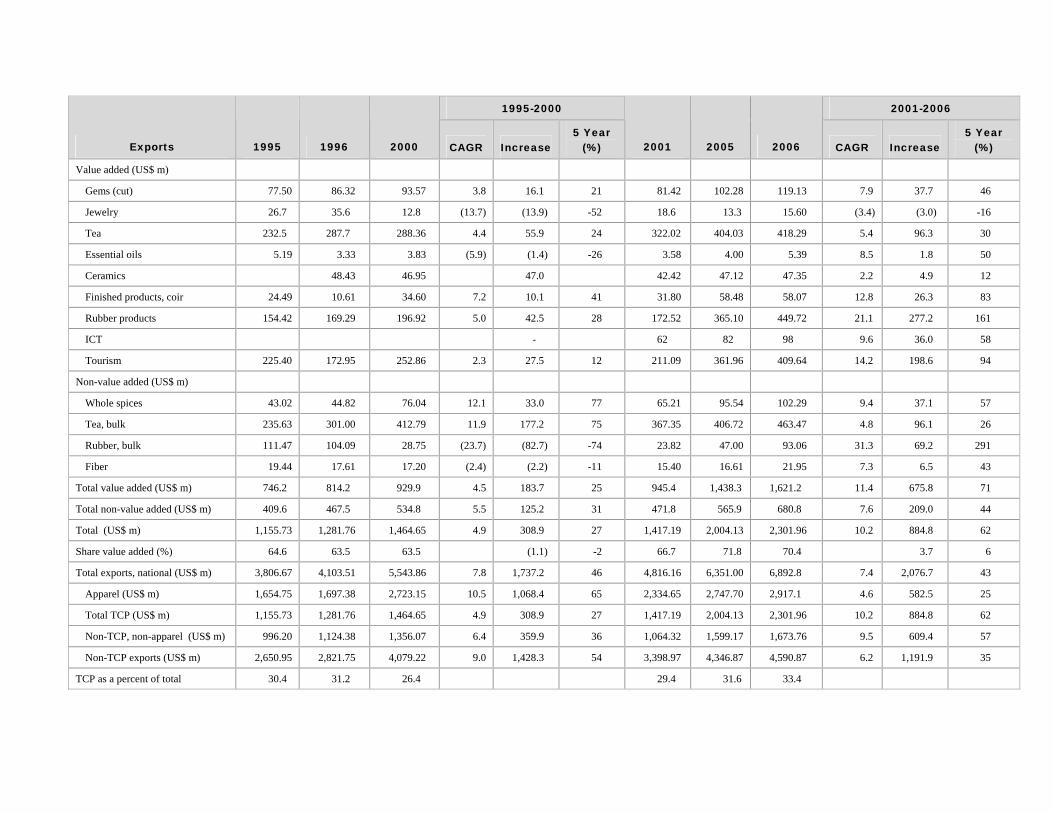
1995-2000 2001-2006
Exports 1995 1996 2000 CAGR Increase 5 Year
(%) 2001 2005 2006 CAGR Increase 5 Year
(%)
Value added (US$ m)
Gems (cut) 77.50 86.32 93.57 3.8 16.1 21 81.42 102.28 119.13 7.9 37.7 46
Jewelry 26.7 35.6 12.8 (13.7) (13.9) -52 18.6 13.3 15.60 (3.4) (3.0) -16
Tea 232.5 287.7 288.36 4.4 55.9 24 322.02 404.03 418.29 5.4 96.3 30
Essential oils 5.19 3.33 3.83 (5.9) (1.4) -26 3.58 4.00 5.39 8.5 1.8 50
Ceramics 48.43 46.95 47.0 42.42 47.12 47.35 2.2 4.9 12
Finished products, coir 24.49 10.61 34.60 7.2 10.1 41 31.80 58.48 58.07 12.8 26.3 83
Rubber products 154.42 169.29 196.92 5.0 42.5 28 172.52 365.10 449.72 21.1 277.2 161
ICT - 62 82 98 9.6 36.0 58
Tourism 225.40 172.95 252.86 2.3 27.5 12 211.09 361.96 409.64 14.2 198.6 94
Non-value added (US$ m)
Whole spices 43.02 44.82 76.04 12.1 33.0 77 65.21 95.54 102.29 9.4 37.1 57
Tea, bulk 235.63 301.00 412.79 11.9 177.2 75 367.35 406.72 463.47 4.8 96.1 26
Rubber, bulk 111.47 104.09 28.75 (23.7) (82.7) -74 23.82 47.00 93.06 31.3 69.2 291
Fiber 19.44 17.61 17.20 (2.4) (2.2) -11 15.40 16.61 21.95 7.3 6.5 43
Total value added (US$ m) 746.2 814.2 929.9 4.5 183.7 25 945.4 1,438.3 1,621.2 11.4 675.8 71
Total non-value added (US$ m) 409.6 467.5 534.8 5.5 125.2 31 471.8 565.9 680.8 7.6 209.0 44
Total (US$ m) 1,155.73 1,281.76 1,464.65 4.9 308.9 27 1,417.19 2,004.13 2,301.96 10.2 884.8 62
Share value added (%) 64.6 63.5 63.5 (1.1) -2 66.7 71.8 70.4 3.7 6
Total exports, national (US$ m) 3,806.67 4,103.51 5,543.86 7.8 1,737.2 46 4,816.16 6,351.00 6,892.8 7.4 2,076.7 43
Apparel (US$ m) 1,654.75 1,697.38 2,723.15 10.5 1,068.4 65 2,334.65 2,747.70 2,917.1 4.6 582.5 25
Total TCP (US$ m) 1,155.73 1,281.76 1,464.65 4.9 308.9 27 1,417.19 2,004.13 2,301.96 10.2 884.8 62
Non-TCP, non-apparel (US$ m) 996.20 1,124.38 1,356.07 6.4 359.9 36 1,064.32 1,599.17 1,673.76 9.5 609.4 57
Non-TCP exports (US$ m) 2,650.95 2,821.75 4,079.22 9.0 1,428.3 54 3,398.97 4,346.87 4,590.87 6.2 1,191.9 35
TCP as a percent of total 30.4 31.2 26.4 29.4 31.6 33.4