sri lanka project
TRANSCRIPT
Accessibility in the District of Hambantota,Southern Sri Lanka
ADRIANA BOTA, HENRIK HAGELIN & JAYAN S. J. WIJESINGHA
DEPT. OF PHYSICAL GEOGRAPHY AND ECOSYSTEM SCIENCE
COURSE CODE: NGEA12
JANUARY 13, 2015
ACCESSIBILITY IN HAMBANTOTA, SRI LANKA January 13, 2015
1 Introduction
Accessibility is a measure of what services in a society, e.g. trade, health care and public services, thatare available for the citizens. A common approach to accessibility studies is to study the relationshipbetween accessibility and the level of poverty. Different studies have shown that the level of povertyincreases with decreasing accessibility to essential services e.g. markets, hospitals and schools[1, 2].
The Hambantota district is located along the shoreline in the Southern Sri Lanka (see mini map in Fig-ure 3). The district occupies about 4% of the country’s 65,610 km2 [4] and was the fifth poorest districtin Sri Lanka with 32% of its inhabitants being poor in 2002 [5]. The road network is built up of roughly1,000 km of roads that connects the district’s 12 DS Divisions, i.e. administrative divisions. The infras-tructure constitutes of basic services within e.g. health and education sectors, and fishery along withagriculture and tourism are the main sources of income for the approximately 600,000 inhabitants[4].
Buddhism is the most common religion (70%) followed by Hinduism (9.6%), Islam (8.5%) and Chris-tianity (8%). 99% of the population in Sri Lanka find religion as an important part of their life [3] andtherefore, accessibility to shrines is considered as essential in this study.
1.1 Aim & Hypothesis
The aim of this study is to examine the grade of accessibility to essential services (Table 3) in theHambantota District, Sri Lanka, based on population density and poverty level.
Our hypothesis is twofold: (1) The highest accessibility is found in regions with high populationdensity. (2) Higher travel cost, i.e. longer travel time required to essential services are found amongpoor people.
2 Methodology
2.1 Data
The GIS data used as input in this study is described in Table 1.
Table 1: Input data for accessibility study in the Hambantota District of Sri Lanka.
No Data Set GIS Data Type Description Source1 Roads Vector (Line) Digitized road data for primary and secondary roads
and tracks in Hambantota from 1:50000 resolution to-pography map
NATEKO, Lund University
2 DEM Raster 30 m resolution GDEM data USGS3 Land Use Raster 30 m resolution land use data NATEKO, Lund University4 Population Density Raster 100 m resolution population density data for 2015 WorldPop5 Fuel Stations Vector (Point) Fuel Stations Google Earth6 Hospitals Vector (Point) Hospitals Google Earth7 Large Markets Vector (Point) Largest Markets NATEKO, Lund University8 Large Towns Vector (Point) Largest towns NATEKO, Lund University9 Schools Vector (Point) Schools Google Earth10 Shrines Vector (Point) Shrines; Temples, Mosques, Churches etc. Google Earth11 Administrative Divisions Vector (Poly) Administrative DS and DN Divisions NATEKO, Lund University
1
ACCESSIBILITY IN HAMBANTOTA, SRI LANKA January 13, 2015
Table 2: Average velocities in which Bus and Land Master can travel depending on ground cover i.e. road oroff-road travel, average walking pace in terrain and induced velocity due to slope.
Type of friction Bus velocity (km/h) Land Master velocity (km/h) Walking pace (km/h) Slope induced velocity (km/h)Primary road 33.0 7.0 — —Secondary road 15.5 7.0 — —Track 3.5 6.5 — —Off-road — 6 5 —0≤5% slope — — — 2.05≤10% slope — — — 1.510≤20% slope — — — 1.020≤X% slope — — — 0.25
2.2 Step Processing
In this study, ArcMap 10.2 were used to perform a GIS-based accessibility modelling using raster im-ages, which was needed in order to perform the aimed analyses. As initial inputs, two cost surface rasterswere used; One raster in which each cell held the maximum possible travel speed in that cell based onvalues from Table 2, and one raster containing cost values of the time needed to reach the nearest road.This operation produced a new cost surface raster with the required time to pass each cell (CellSpeed).Then, a cost distance surface raster (CDS) were computed in which each cell represented the friction,i.e. cost, to travel between a cell and an essential service (Table 3). A CDS for each essential servicewas computed for two different transportation methods, i.e. Bus and Land Master, resulting in 12 CDStotally.
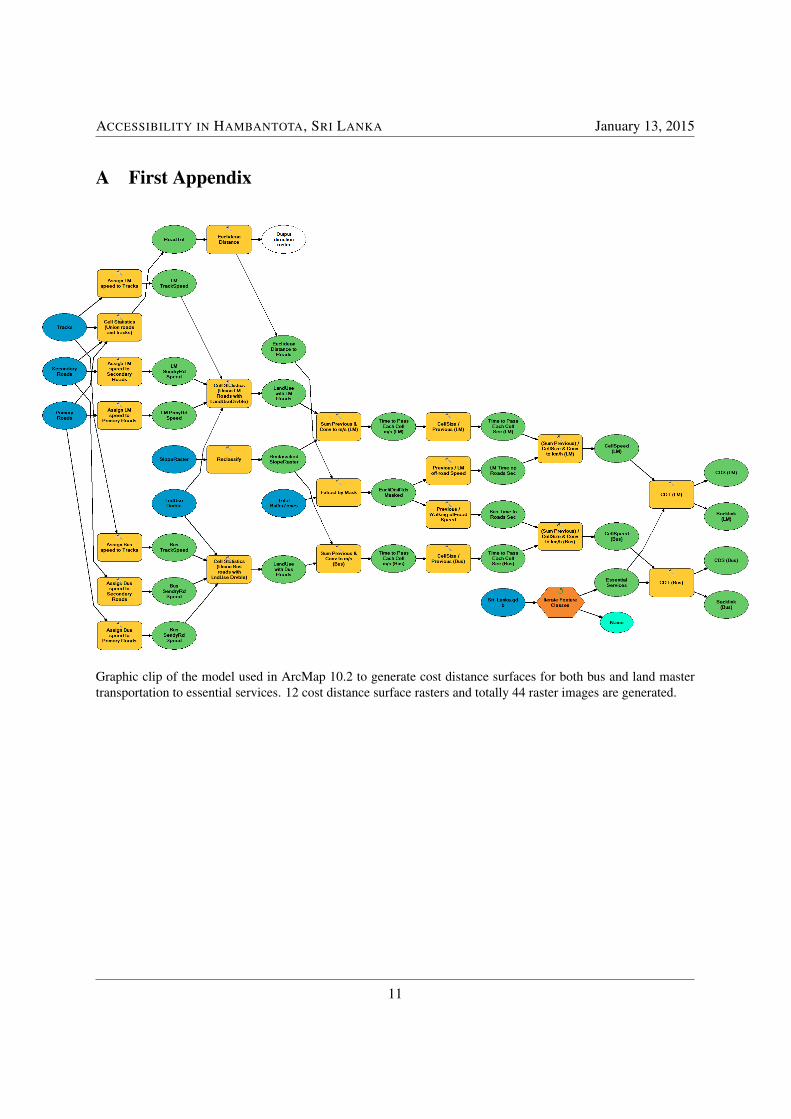
In this study, travel time were used as cost measure though any currency can be used as cost inaccessibility modelling as well. The process of how a CDS was produced is explained in section 2.2.1,and a graphic clip of the full model used to produce CDS rasters is found in A First Appendix. The twoanalyses performed are described in section 2.2.2 and 2.2.3 respectively.
2.2.1 Creating Cost Distance Surface Rasters
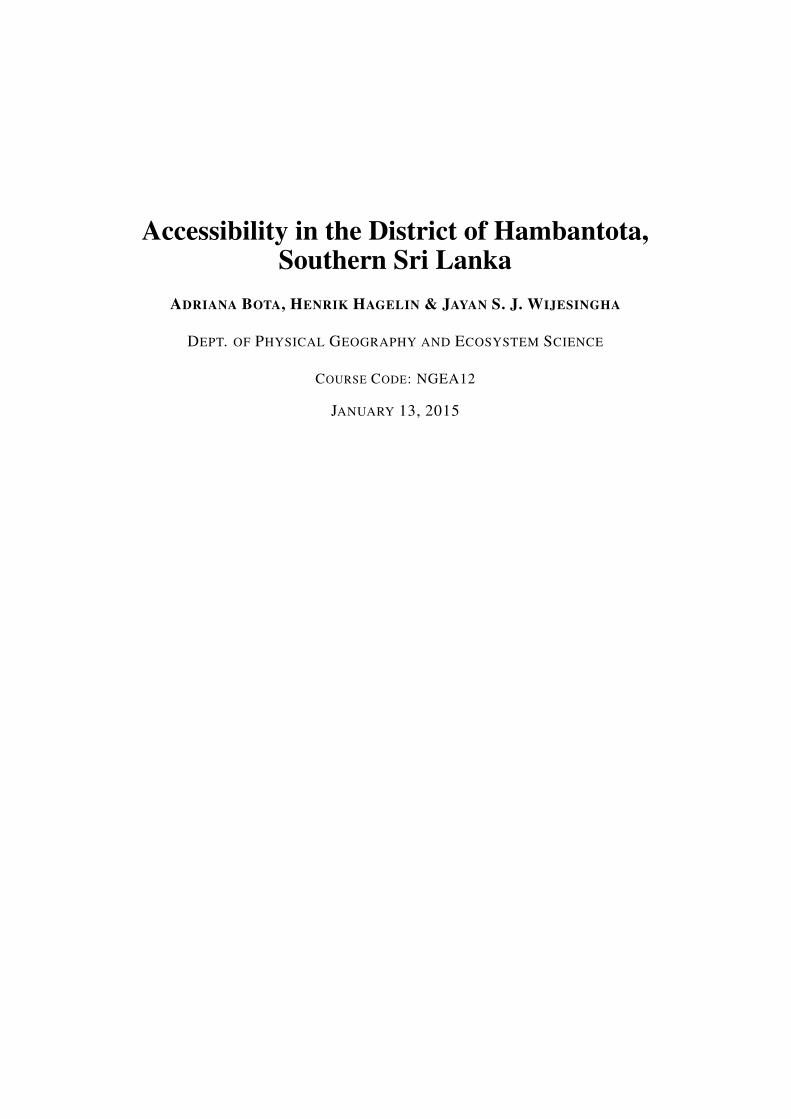
The Cost Distance Tool (CDT) was used to calculate all CDS needed to perform the analyses. The CDTdetermines the least costly path to reach a chosen destination, and then assigns an accumulative costto each cell based on the distance to the location of the destination. In order for the tool to work, acost surface raster is needed and a vector layer with final destinations to where the distance should beestimated. In this study, the CellSpeed raster noted above and a point vector layer with essential serviceswere fed into the CDT. An example operation of the CDT is illustrated by Figure 1.
Table 3: Essentials services used in accessibility modelling in the Hambantota District, Sri Lanka.
Service Reason ChosenFuel stations Fuel Stations are an essential service since fuel are used to power generators and vehiclesHospitals Hospitals are an essential service for healthLarge markets Markets are an essential service where people sell and buy groceriesLarge towns Towns are an essential service due to job opportunities, banks and etc.Schools Schools are an essential service since education can help improve other sectors in the societyShrines Shrines are an essential service since the amount of religious people in Sri Lanka are many
2
ACCESSIBILITY IN HAMBANTOTA, SRI LANKA January 13, 2015
Figure 1: Example of a CDT operation to produce a cost distance sufrace. Values in the example are not relatedto the actual analysis in this study.
2.2.2 Accessibility based on Total Population
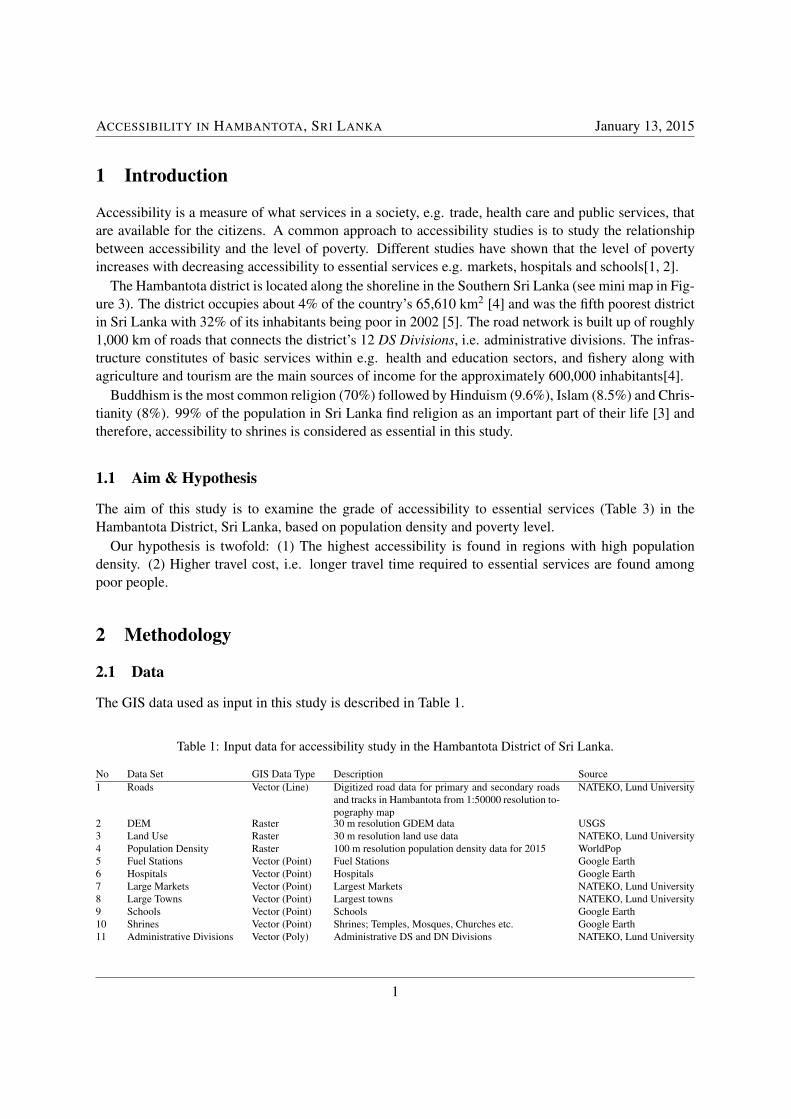
The total amount of population living within a certain travel distance from an essential service werecalculated using the Zonal Statistics tool. The input data used in this operation were a populationdensity raster and the different CDS rasters reclassified into 12 groups based on travel distance in time(h). One table per CDS raster was created, which then were used to create the bar graphs in section 3.2.Figure 2 illustrates an example operation of this analysis.
2.2.3 Accessibility on Poverty Level
In order to analyse the accessibility to large towns of poor people, the large towns CDS raster wasreclassified as Boolean raster using a threshold cost value of 2 h. Total population in each Booleanclass was calculated for different DS Divisions based on transportation with bus. Then within eachDS Division, the total amount of poor people according to Census data [5] was correlated with theestimated population with high cost accessibility, i.e. long travel time. Finally, a regression analysiswere performed of the Household Population Below Poverty Line (HPBPL) and the estimated populationwith high accessibility cost to large towns. HPBPL is the abbreviation of a poverty measure index usedby the Census Department of Sri Lanka. The DS Division Tissamaharama was an outlier due to its greatdeviation from the mean and was therefore removed before the analysis.
Figure 2: Example of a population accessibility analysis similar to the one performed in this study. Values are notthe same as in the real analysis performed.
3
ACCESSIBILITY IN HAMBANTOTA, SRI LANKA January 13, 2015
3 Results & Discussion
This study contains several steps and therefore the results with discussion are presented in the followingsections (3.1–3.3) in accordance to the work flow.
3.1 Accessibility Modelling
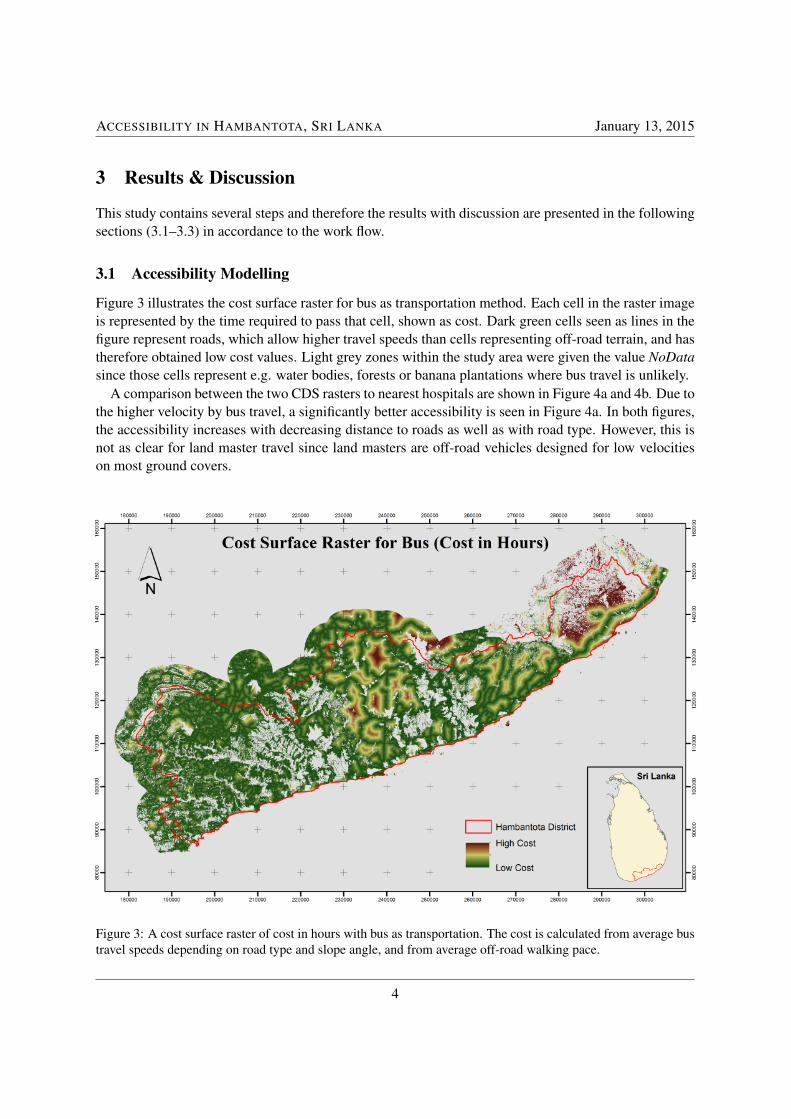
Figure 3 illustrates the cost surface raster for bus as transportation method. Each cell in the raster imageis represented by the time required to pass that cell, shown as cost. Dark green cells seen as lines in thefigure represent roads, which allow higher travel speeds than cells representing off-road terrain, and hastherefore obtained low cost values. Light grey zones within the study area were given the value NoDatasince those cells represent e.g. water bodies, forests or banana plantations where bus travel is unlikely.
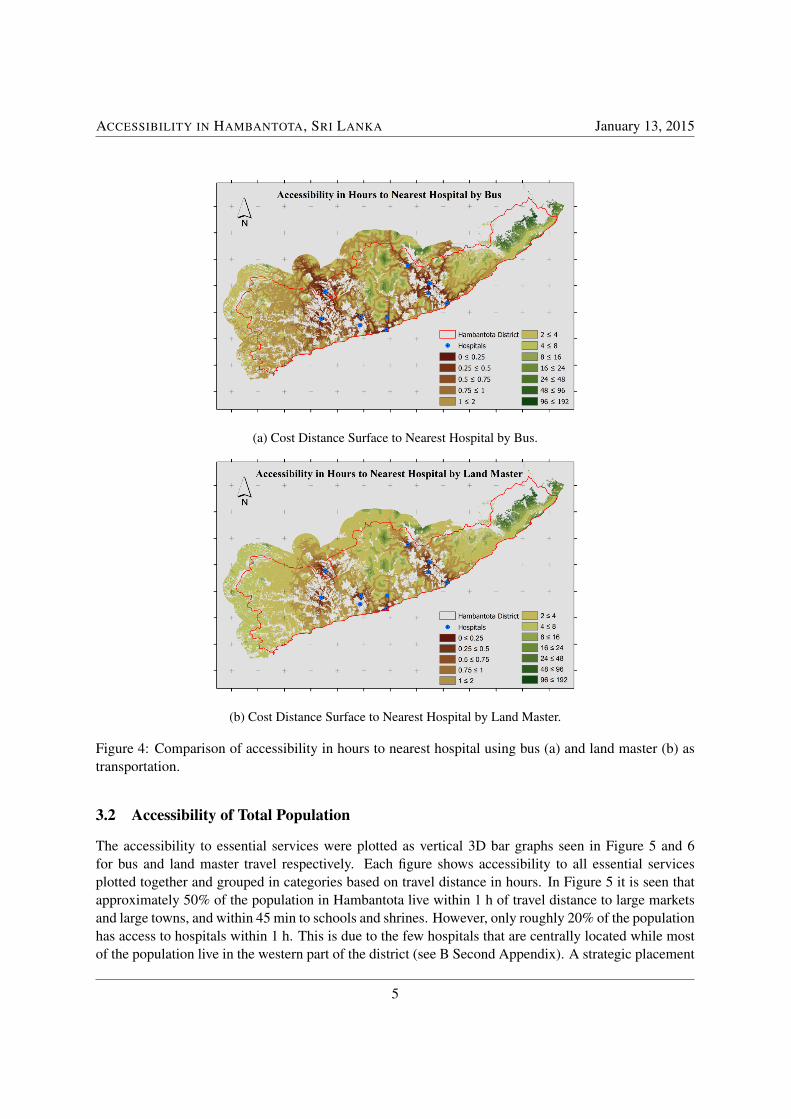
A comparison between the two CDS rasters to nearest hospitals are shown in Figure 4a and 4b. Due tothe higher velocity by bus travel, a significantly better accessibility is seen in Figure 4a. In both figures,the accessibility increases with decreasing distance to roads as well as with road type. However, this isnot as clear for land master travel since land masters are off-road vehicles designed for low velocitieson most ground covers.
Figure 3: A cost surface raster of cost in hours with bus as transportation. The cost is calculated from average bustravel speeds depending on road type and slope angle, and from average off-road walking pace.
4
ACCESSIBILITY IN HAMBANTOTA, SRI LANKA January 13, 2015
(a) Cost Distance Surface to Nearest Hospital by Bus.
(b) Cost Distance Surface to Nearest Hospital by Land Master.
Figure 4: Comparison of accessibility in hours to nearest hospital using bus (a) and land master (b) astransportation.
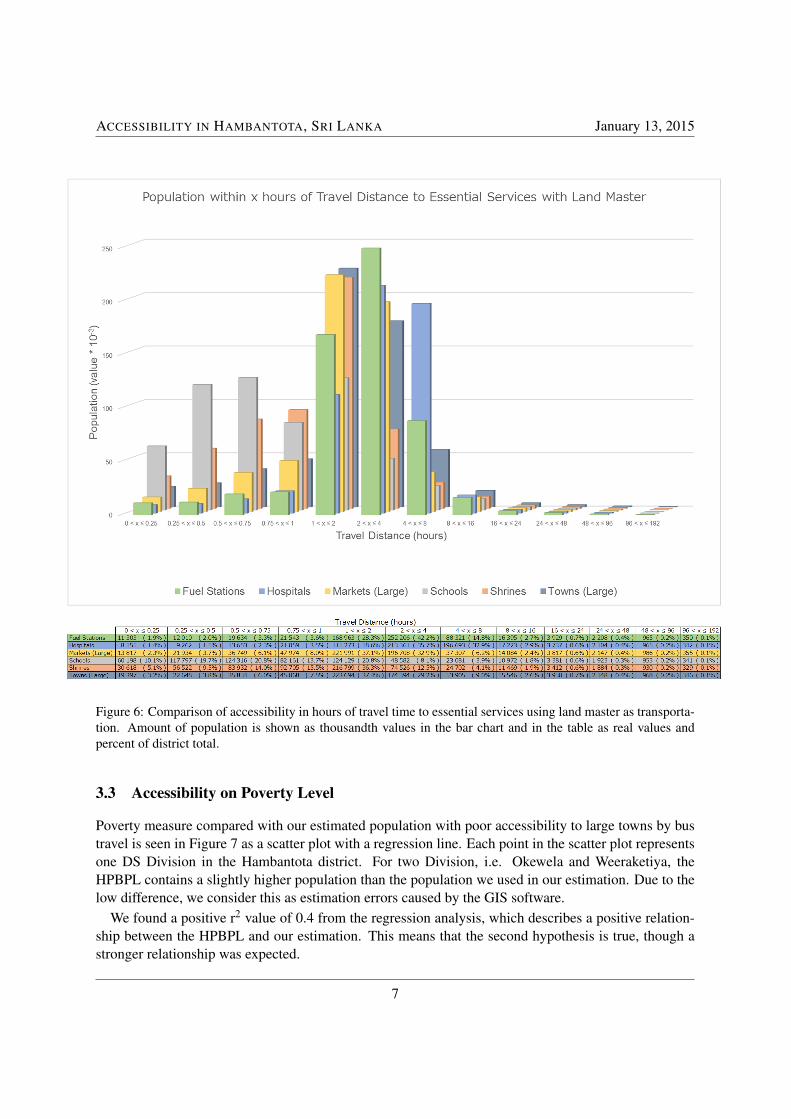
3.2 Accessibility of Total Population
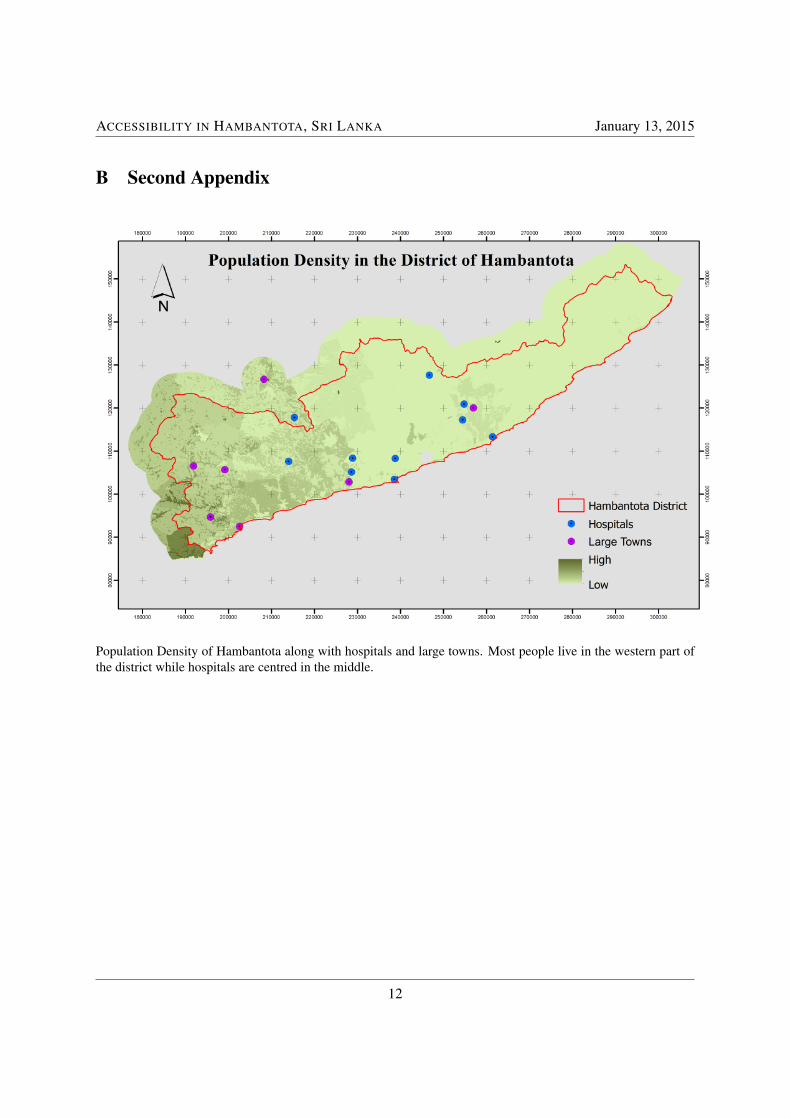
The accessibility to essential services were plotted as vertical 3D bar graphs seen in Figure 5 and 6for bus and land master travel respectively. Each figure shows accessibility to all essential servicesplotted together and grouped in categories based on travel distance in hours. In Figure 5 it is seen thatapproximately 50% of the population in Hambantota live within 1 h of travel distance to large marketsand large towns, and within 45 min to schools and shrines. However, only roughly 20% of the populationhas access to hospitals within 1 h. This is due to the few hospitals that are centrally located while mostof the population live in the western part of the district (see B Second Appendix). A strategic placement
5

ACCESSIBILITY IN HAMBANTOTA, SRI LANKA January 13, 2015
Figure 5: Comparison of accessibility in hours of travel time to essential services using bus as transportation.Amount of population is shown as thousandth values in the bar chart and in the table as real values and percent ofdistrict total.
of hospitals are near towns or cities, or near areas with high population density. That is the case for someof the hospitals, however no hospital were located in the far west of the district where most inhabitantslive. This might be an indicator of an incorrect population density map or missing points in our pointvector layer of hospitals.
When using land master as transportation method, the accessibility is reduced by roughly 50%; 20%live within 1 h from large markets and large towns, and 9% live within 1 h from hospitals. The accessi-bility to schools is unchanged due to the rather high distribution of schools.
In case of emergency, accessibility to a hospital is vital. Therefore we find it concerning that only20% of the population has access to a hospital within 1 h. Though, in this study only bus and land mastertravel were considered. Faster alternatives might be available.
6
ACCESSIBILITY IN HAMBANTOTA, SRI LANKA January 13, 2015
Figure 6: Comparison of accessibility in hours of travel time to essential services using land master as transporta-tion. Amount of population is shown as thousandth values in the bar chart and in the table as real values andpercent of district total.
3.3 Accessibility on Poverty Level
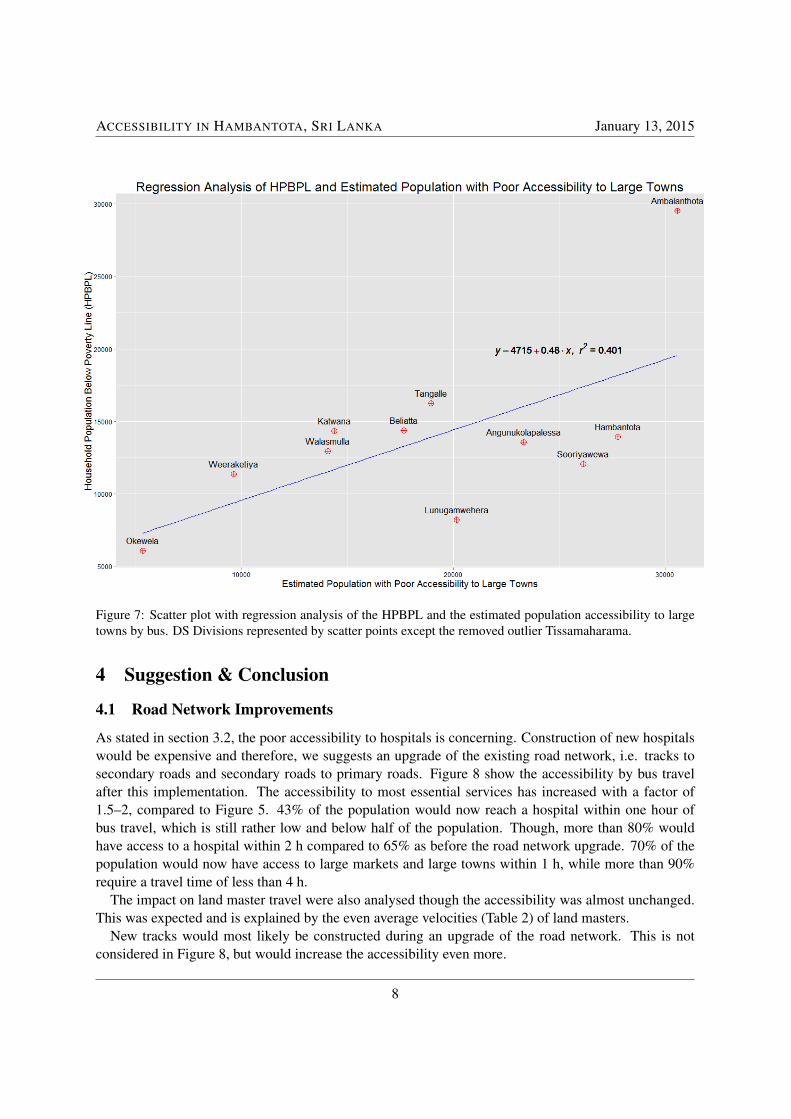
Poverty measure compared with our estimated population with poor accessibility to large towns by bustravel is seen in Figure 7 as a scatter plot with a regression line. Each point in the scatter plot representsone DS Division in the Hambantota district. For two Division, i.e. Okewela and Weeraketiya, theHPBPL contains a slightly higher population than the population we used in our estimation. Due to thelow difference, we consider this as estimation errors caused by the GIS software.
We found a positive r2 value of 0.4 from the regression analysis, which describes a positive relation-ship between the HPBPL and our estimation. This means that the second hypothesis is true, though astronger relationship was expected.
7
ACCESSIBILITY IN HAMBANTOTA, SRI LANKA January 13, 2015
Figure 7: Scatter plot with regression analysis of the HPBPL and the estimated population accessibility to largetowns by bus. DS Divisions represented by scatter points except the removed outlier Tissamaharama.
4 Suggestion & Conclusion
4.1 Road Network Improvements
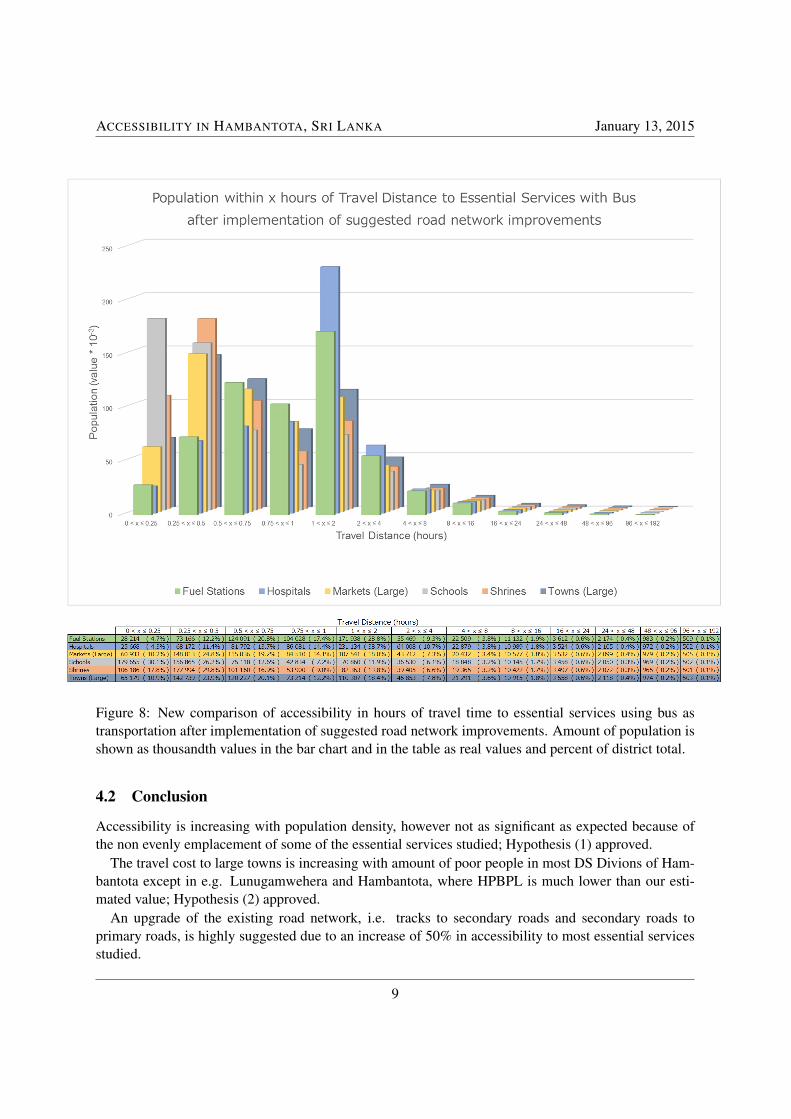
As stated in section 3.2, the poor accessibility to hospitals is concerning. Construction of new hospitalswould be expensive and therefore, we suggests an upgrade of the existing road network, i.e. tracks tosecondary roads and secondary roads to primary roads. Figure 8 show the accessibility by bus travelafter this implementation. The accessibility to most essential services has increased with a factor of1.5–2, compared to Figure 5. 43% of the population would now reach a hospital within one hour ofbus travel, which is still rather low and below half of the population. Though, more than 80% wouldhave access to a hospital within 2 h compared to 65% as before the road network upgrade. 70% of thepopulation would now have access to large markets and large towns within 1 h, while more than 90%require a travel time of less than 4 h.
The impact on land master travel were also analysed though the accessibility was almost unchanged.This was expected and is explained by the even average velocities (Table 2) of land masters.
New tracks would most likely be constructed during an upgrade of the road network. This is notconsidered in Figure 8, but would increase the accessibility even more.
8
ACCESSIBILITY IN HAMBANTOTA, SRI LANKA January 13, 2015
Figure 8: New comparison of accessibility in hours of travel time to essential services using bus astransportation after implementation of suggested road network improvements. Amount of population isshown as thousandth values in the bar chart and in the table as real values and percent of district total.
4.2 Conclusion
Accessibility is increasing with population density, however not as significant as expected because ofthe non evenly emplacement of some of the essential services studied; Hypothesis (1) approved.
The travel cost to large towns is increasing with amount of poor people in most DS Divions of Ham-bantota except in e.g. Lunugamwehera and Hambantota, where HPBPL is much lower than our esti-mated value; Hypothesis (2) approved.
An upgrade of the existing road network, i.e. tracks to secondary roads and secondary roads toprimary roads, is highly suggested due to an increase of 50% in accessibility to most essential servicesstudied.
9

ACCESSIBILITY IN HAMBANTOTA, SRI LANKA January 13, 2015
References
[1] Ahlstrom, A. Accessibility, Poverty and Land Cover in Hambantota District, Sri Lanka. Incorpo-rating local knowledge into a GIS based accessibility model. Technical report, Physical Geographyand Ecosystems Analysis, Lund University, Solvegatan 12, S-223 62, Lund, Sweden, 2008.
[2] Ahlstrom, A., P. Pilesjo, and J. Lindberg. Improved accessibility modeling and its relation to povertye A case study in Southern Sri Lanka. Habitat International, (35):316–326, 2011. doi: 10.1016/j.habitatint.2010.11.002.
[3] NationMaster. Sri lanka religion stats. URL http://www.nationmaster.com/country-info/
profiles/Sri-Lanka/Religion/All-stats#-date. Last checked: 2015-01-11.
[4] Ministry of Public Administration & Home Affairs. Overview. URL http://www.hambantota.
dist.gov.lk/index.php?option=com_content&view=article&id=4&Itemid=63&lang=
en. Last checked: 2015-01-10.
[5] Tilakaratna. K. G. and Dr. A. Satharasinghe. Headcount index and population below poverty lineby ds division – sri lanka: 2002. URL http://www.statistics.gov.lk/poverty/small%
20area%20reportNEW.pdf. Last checked: 2015-01-10.
10
ACCESSIBILITY IN HAMBANTOTA, SRI LANKA January 13, 2015
A First Appendix
Graphic clip of the model used in ArcMap 10.2 to generate cost distance surfaces for both bus and land mastertransportation to essential services. 12 cost distance surface rasters and totally 44 raster images are generated.
11
ACCESSIBILITY IN HAMBANTOTA, SRI LANKA January 13, 2015
B Second Appendix
Population Density of Hambantota along with hospitals and large towns. Most people live in the western part ofthe district while hospitals are centred in the middle.
12