sri lanka economic update - world...
TRANSCRIPT

September, 2009
Economic Policy and Poverty Team
South Asia Region
The World Bank
Sri Lanka Economic Update
1
Overview: From Global Gloom to Hopes of Peace
Food, Fuel and Financial Crises: Sri Lanka has been buffeted by a series of shocks in the past year and a half.
The rapid rise in global food and commodity prices during the first half of 2008 which led to a significant worsening of the Sri Lankan terms of trade. Rising international commodity prices also put significant strain on the balance of payments, with the current account deficit reaching 9.3 percent of GDP in 2008 – the highest in nearly 25 years. The price shocks also helped fuel consumer price inflation, which reached a peak of 28 percent in June 2008.
The onset of the global economic and financial crisis in September 2008 resulted in a sudden outflow of foreign capital, especially foreign investors’ holdings of government T-bills and T-bonds. The subsequent drain in foreign exchange reserves was exacerbated by the Central Bank’s intervention in the foreign exchange market in an effort to limit the depreciation of the rupee against the US dollar. Gross Official Reserves dropped precipitously from US$3.4bn in mid-September to a low of US$1.2bn in mid-March 2009.
The real sector also suffered, as real GDP growth fell to 4.3 percent, year-on-year, in Q4-2008 and declined further to 1.5% in Q1-2009, on the back of a moderation in both domestic and external demand.
Sustaining the End-of-Conflict Dividend. The end of the nearly-three-decade-long armed conflict on May 19 brought a surge in optimism about the potential economic benefits of peace.
The Colombo Stock Exchange surged 30 percent to end September 2009, while Sri Lanka’s sovereign bond spreads narrowed by over 400 bps. Optimism was further boosted by the approval of the IMF Stand-By Arrangement in July. Standard & Poors upgraded the country’s rating outlook from “negative” to “stable” in August and Fitch follow through with a similar upgrade in October. Foreign capital has flowed into government securities. As a result, foreign exchange reserves have reached historical highs and there is pressure on the rupee to appreciate.
Sustaining the positive investor sentiment will be a key challenge in the coming months. A still-weak global economy, uncertainty about the continuation of the preferential access for Sri Lankan exports to the EU market under the GSP+ scheme and persistently high fiscal deficits are risks to the outlook. On the other hand, reconstruction spending in the North is expected to provide a short-term stimulus, while the lagged effects of the recent monetary stimulus would also act as a fillip.
In the longer term, movement towards a sustainable political solution to the underlying causes of the conflict will be key, as will decisive moves on the structural policy agenda to unleash Sri Lanka’s full growth potential.
1 This is note was prepared by Claus Pram Astrup, Kirthisri Rajatha Wijeweera, and Francis Rowe.
Sri Lanka Economic Update1 September 2009
2
1. Impact of the Global Financial Crisis Gradually Recedes
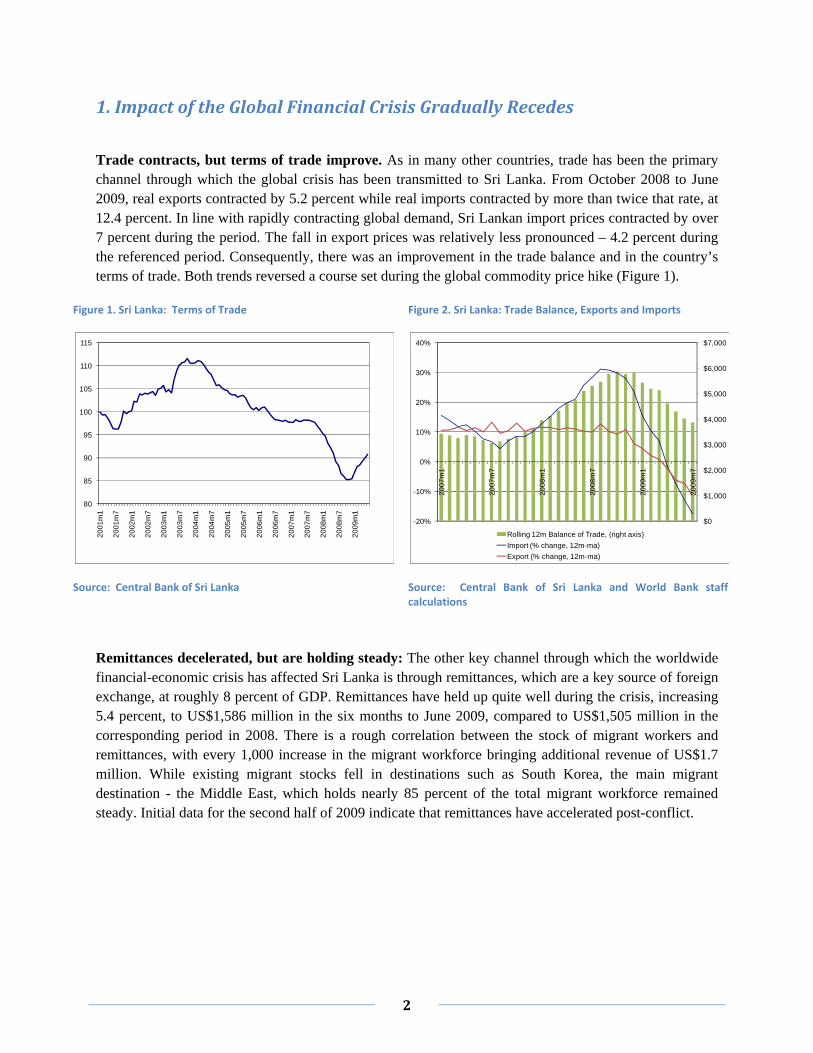
Trade contracts, but terms of trade improve. As in many other countries, trade has been the primary channel through which the global crisis has been transmitted to Sri Lanka. From October 2008 to June 2009, real exports contracted by 5.2 percent while real imports contracted by more than twice that rate, at 12.4 percent. In line with rapidly contracting global demand, Sri Lankan import prices contracted by over 7 percent during the period. The fall in export prices was relatively less pronounced – 4.2 percent during the referenced period. Consequently, there was an improvement in the trade balance and in the country’s terms of trade. Both trends reversed a course set during the global commodity price hike (Figure 1).
Figure 1. Sri Lanka: Terms of Trade Figure 2. Sri Lanka: Trade Balance, Exports and Imports
Source: Central Bank of Sri Lanka Source: Central Bank of Sri Lanka and World Bank staff calculations
Remittances decelerated, but are holding steady: The other key channel through which the worldwide financial-economic crisis has affected Sri Lanka is through remittances, which are a key source of foreign exchange, at roughly 8 percent of GDP. Remittances have held up quite well during the crisis, increasing 5.4 percent, to US$1,586 million in the six months to June 2009, compared to US$1,505 million in the corresponding period in 2008. There is a rough correlation between the stock of migrant workers and remittances, with every 1,000 increase in the migrant workforce bringing additional revenue of US$1.7 million. While existing migrant stocks fell in destinations such as South Korea, the main migrant destination - the Middle East, which holds nearly 85 percent of the total migrant workforce remained steady. Initial data for the second half of 2009 indicate that remittances have accelerated post-conflict.
80
85
90
95
100
105
110
115
20
01
m1
20
01
m7
20
02
m1
20
02
m7
20
03
m1
20
03
m7
20
04
m1
20
04
m7
20
05
m1
20
05
m7
20
06
m1
20
06
m7
20
07
m1
20
07
m7
20
08
m1
20
08
m7
20
09
m1
$0
$1,000
$2,000
$3,000
$4,000
$5,000
$6,000
$7,000
-20%
-10%
0%
10%
20%
30%
40%
20
07
m1
20
07
m7
20
08
m1
20
08
m7
20
09
m1
20
09
m7
Rolling 12m Balance of Trade, (right axis)
Import (% change, 12m-ma)
Export (% change, 12m-ma)

3
Inflation declined sharply: Having reached an historic peak in mid-2008, consumer price inflation eased considerably in the wake of the global crisis. Inflation, which peaked at 28.2 percent (y-o-y) in June 2008, due to the global food and commodity price shock, eased considerably and fell to a low of 0.9 percent in August. Food prices account for nearly 48 percent of the CPI basket and the representative food basket has high import content. Food price inflation turned negative towards April and remained at subdued levels through August (recording 0.6 percent change y-o-y). Core inflation (excluding food and energy prices) also showed a less pronounced reduction over the period, easing to 5.4 percent (y-o-y) in September 2009, from a high of 18.7 percent in September 2008. Core inflation will require close monitoring, given the significant monetary easing that has taken place in recent months.
Box 1. Sri Lanka’s Apparel Sector
In contrast to many other export categories, exports of apparel and textiles - the single largest export item continued to grow during the first two quarters of the global financial crisis (i.e., Oct 08-March 09). Nominal exports of garments grew by 6.3 percent on the back of 5.4 percent growth in volumes. The increased volumes during the period were due mainly to the lagged effects of demand adjustment from buyers as well as, in part, to the aggressive marketing. Garment exporters were also incentivized by the stimulus measures announced in December 2008, which promised a cash premium to firms who could maintain employment/sales levels. However, in the second quarter 2009 garment export volumes declined by 9.2 percent (q-oq-), as the full impact of decline in demand was felt. According to industry sources, however, the outlook for the second half is positive, as many manufacturers’ order books are full. The Sri Lanka apparel sector has been a major export earner as well as employment source for many decades. With the expiry of the Multi-Fiber Agreement (MFA) in 2005 (which afforded protection to the sector through quotas) the sector has been exposed to increased competition. However, the sector weathered the end of the MFA well by strategically positioning itself through (i) establishing niche markets with solid client networks; (ii) effective backward and forward integration through establishment of fabric manufacturing plants as well as moving into fashion design and vendor inventory management, and; (iii) adopting world standards in labor, safety and environmental compliance (branded “garments without guilt”).
Box continued next page
Figure 3. Consumer Price Inflation
Source: Department of Census and Statistics and Central Bank of Sri Lanka
0%
5%
10%
15%
20%
25%
30%
2007m1 2007m7 2008m1 2008m7 2009m1 2009m7
Headline Inflation (yoy) Core inflation (yoy)

4
The transition to the post-MFA situation was also eased by the fact that soon after the tsunami in December 2004, the country was granted preferential access to the EU markets through the GSP+ scheme. (The GSP+ scheme allows duty free access to the EU for some 7,200 products. While initially granted to a large extent in view of the Tsunami, a country’s access to the GSP+ scheme is dependent on adherence to a large number of international conventions.) The GSP+ scheme accelerated an already existing trend of increasing garment export to the EU. By 2008, EU became Sri Lanka’s biggest export destination for garments, surpassing the U.S.A. Currently, the EU is considering an extension taking account of industrial standards as well as overall political and governance developments in partner countries. A final determination in this regard is expected to be made in October and formally announced in December 2009.
Figure 4: Garment export to EU and US, US$ million
Source: Central Bank of Sri Lanka
Economic growth down, but not out: Economic activity decelerated sharply at the onset of the global financial crisis. The decline was particularly pronounced in the industry and services sectors, while the agriculture sector showed strong growth, buoyed by one-off supply-side effects. National Accounts data for Q2-2009 show a modest uptick in growth to 2.1 percent from 1.5 percent in Q1-09.
Figure 5. Real GDP Growth Figure 6. Real GDP Growth in Main Sectors
Source: Department of Census and Statistics Source: Department of Census and Statistics
0
200
400
600
800
1,000
1,200
1,400
1,600
1,800
1995 1997 1999 2001 2003 2005 2007
US EU
0%
1%
2%
3%
4%
5%
6%
7%
8%
2003q1 2004q1 2005q1 2006q1 2007q1 2008q1 2009q1
0%
2%
4%
6%
8%
10%
12%
14%
2007q1 2007q2 2007q3 2007q4 2008q1 2008q2 2008q3 2008q4 2009q1 2009q2
Agriculture Industry Services

5
The service sector initially was impacted more rapidly and more heavily than industry, due to the importance of trade services in GDP, including the large volume of transshipments handled in the Colombo Port. The service sector dropped 0.6 percent (q-o-q, seasonally adjusted) in Q4-2008 and a further 1.4 percent (q-o-q, seasonally adjusted) in Q1-2009. Services related to foreign trade dropped more than twice as fast, on an annualized rate, as the overall service sector. Ports data show that in Q2-2009 volumes dropped to about 15 percent below their long-term trend level, but the pace of decline was abating, as activity picked up up in May and June.2 Overall, the service sector rebounded in Q2-2009, as growth momentum turned positive to reach 2.2 percent (q-o-q, seasonally adjusted). The rebound was evident across a number of service sectors, including banking, telecom, domestic trade, and government services.
Recent industrial production data points to a rebound in Q2-2009. Industrial production increased 3.76 percent (q-o-q, seasonally adjusted) in Q2-2009 following a drop of 3.6 percent (q-o-q, seasonally adjusted) in Q1-20093. The rebound was driven by domestically-oriented industries (e.g., food production and construction) while the more export oriented textile and apparel industries cut back production in response to weak global demand. However, the most recent data (June) showed a sharp rebound in apparel production.
2 Data for shipments through Colombo port show that import and export shipments during Q2-2009 remained depressed (a decline of 5.9 percent, q-o-q). However, transshipments grew by 12.1 percent (q-o-q) reflecting a gradual rebound in world trade. 3 Due to the relatively short time span for which quarterly GDP data is available, estimates of seasonally-adjusted data are subject to a degree of uncertainty.
Figure 7. Container Throughput, TEU, % change yoy
Source: Central Bank of Sri Lanka. Note: “Domestic” throughput only, i.e. excluding transshipments.
Figure 8. Industrial Production Index, % change (yoy)
Source: Central Bank of Sri Lanka
-30%
-25%
-20%
-15%
-10%
-5%
0%
5%
10%
15%
1/2
00
8
2/2
00
8
3/2
00
8
4/2
00
8
5/2
00
8
6/2
00
8
7/2
00
8
8/2
00
8
9/2
00
8
10
/20
08
11/2
00
8
12
/20
08
1/2
00
9
2/2
00
9
3/2
00
9
4/2
00
9
5/2
00
9
6/2
00
9
-4%
-2%
0%
2%
4%
6%
8%
10%
12%
14%
1/2
00
8
2/2
00
8
3/2
00
8
4/2
00
8
5/2
00
8
6/2
00
8
7/2
00
8
8/2
00
8
9/2
00
8
10
/20
08
11/2
00
8
12
/20
08
1/2
00
9
2/2
00
9
3/2
00
9
4/2
00
9
5/2
00
9
6/2
00
9

6
In agriculture, lack of rainfall is expected to reverse recent supply-side gains for the remainder of 2009. Agricultural production has been boosted over the past year by positive supply-side effects from the expansion in cultivable paddy land in the Eastern Province (on a y-o-y basis, total paddy production increased by 50 percent in Q4-2008), and a related boom in vegetable production. The effect of this one-off event is now wearing off, although the 2009 spring (Maha) harvest was still up 12 percent compared to the 2008 Maha harvest. This was due in large part to an increase in the area of cultivated land, resulting in a 10 percent (y-o-y) real growth in Q1-2009 in the paddy sector. Preliminary estimates by the Department of Census and Statistics suggest that the 2009 Yala harvest will be some 30 percent lower than in 20084.
2. The Macroeconomic Response
Monetary policy responds flexibly to crisis: Monetary policy in Sri Lanka has eased significantly in the wake of the global financial crisis. Prior to the crisis, monetary policy was gradually tightened in response to rapidly increasing consumer price inflation, driven in large part by rising commodity prices. Policy easing which commenced in late 2008 continued into 2009. In 2009 to date, the benchmark interest rates of Repurchase (REPO) and the Reverse Repurchase (RREPO) rates were lowered by 225bps and 125bps, while the hitherto applicable “penal rate” on RREPO (applicable to banks which access the Central Bank of Sri Lanka RREPO window more than three times a month) was successively lowered, and eliminated altogether in May. In addition,
4 The Yala harvest normally only account for 30-40 percent of total annual production. If current projections are correct, total annual paddy production in 2009 will be about 8 percent lower than in 2008.
Figure 9. Tea Production, % change (yoy)
Source: Central Bank of Sri Lanka
Figure 10. Short term interest rates
Source: Central Bank of Sri Lanka Note: Reverse Repo includes the “penal rate”
-60%
-40%
-20%
0%
20%
40%
60%
1/2
00
8
2/2
00
8
3/2
00
8
4/2
00
8
5/2
00
8
6/2
00
8
7/2
00
8
8/2
00
8
9/2
00
8
10
/20
08
11/2
00
8
12
/20
08
1/2
00
9
2/2
00
9
3/2
00
9
4/2
00
9
5/2
00
9
6/2
00
9
7/2
00
9
8%
10%
12%
14%
16%
18%
20%
24
.09
.20
09
11.0
8.2
00
9
29
.06
.20
09
15
.05
.20
09
26
.03
.20
09
10
.02
.20
09
23
.12
.20
08
06
.11
.20
08
22
.09
.20
08
08
.08
.20
08
25
.06
.20
08
Call rate Reverse Repo Repo
7
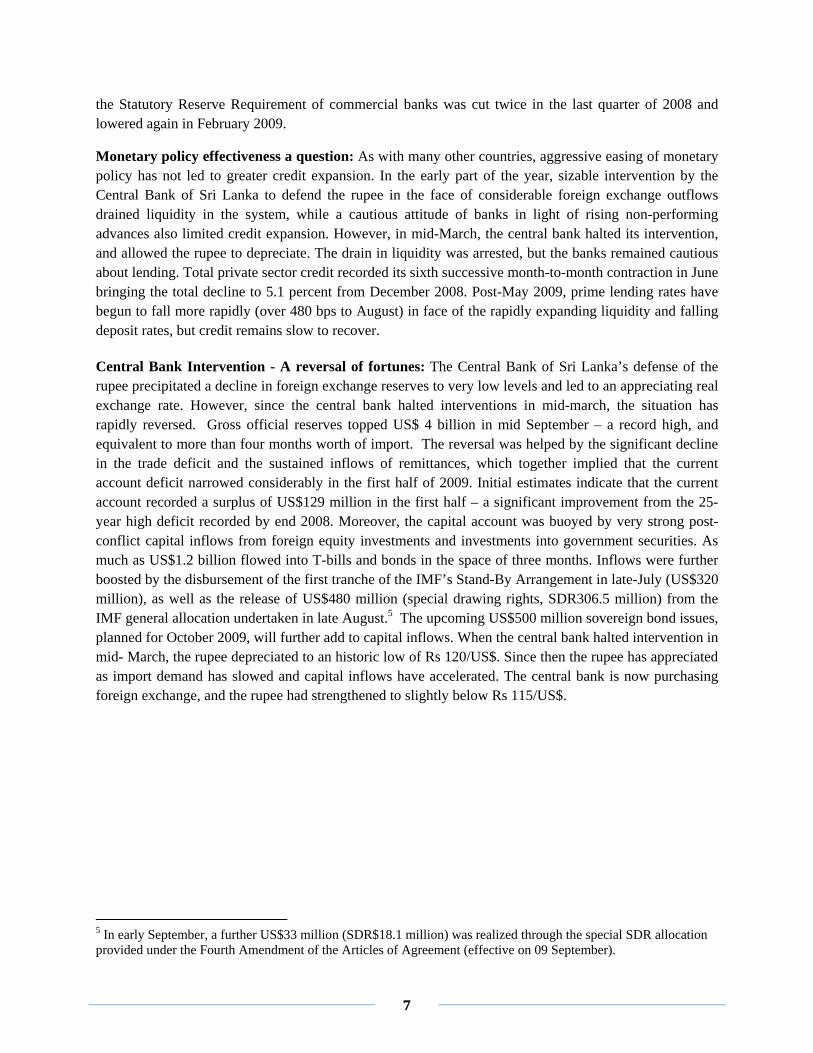
the Statutory Reserve Requirement of commercial banks was cut twice in the last quarter of 2008 and lowered again in February 2009.
Monetary policy effectiveness a question: As with many other countries, aggressive easing of monetary policy has not led to greater credit expansion. In the early part of the year, sizable intervention by the Central Bank of Sri Lanka to defend the rupee in the face of considerable foreign exchange outflows drained liquidity in the system, while a cautious attitude of banks in light of rising non-performing advances also limited credit expansion. However, in mid-March, the central bank halted its intervention, and allowed the rupee to depreciate. The drain in liquidity was arrested, but the banks remained cautious about lending. Total private sector credit recorded its sixth successive month-to-month contraction in June bringing the total decline to 5.1 percent from December 2008. Post-May 2009, prime lending rates have begun to fall more rapidly (over 480 bps to August) in face of the rapidly expanding liquidity and falling deposit rates, but credit remains slow to recover. Central Bank Intervention - A reversal of fortunes: The Central Bank of Sri Lanka’s defense of the rupee precipitated a decline in foreign exchange reserves to very low levels and led to an appreciating real exchange rate. However, since the central bank halted interventions in mid-march, the situation has rapidly reversed. Gross official reserves topped US$ 4 billion in mid September – a record high, and equivalent to more than four months worth of import. The reversal was helped by the significant decline in the trade deficit and the sustained inflows of remittances, which together implied that the current account deficit narrowed considerably in the first half of 2009. Initial estimates indicate that the current account recorded a surplus of US$129 million in the first half – a significant improvement from the 25-year high deficit recorded by end 2008. Moreover, the capital account was buoyed by very strong post-conflict capital inflows from foreign equity investments and investments into government securities. As much as US$1.2 billion flowed into T-bills and bonds in the space of three months. Inflows were further boosted by the disbursement of the first tranche of the IMF’s Stand-By Arrangement in late-July (US$320 million), as well as the release of US$480 million (special drawing rights, SDR306.5 million) from the IMF general allocation undertaken in late August.5 The upcoming US$500 million sovereign bond issues, planned for October 2009, will further add to capital inflows. When the central bank halted intervention in mid- March, the rupee depreciated to an historic low of Rs 120/US$. Since then the rupee has appreciated as import demand has slowed and capital inflows have accelerated. The central bank is now purchasing foreign exchange, and the rupee had strengthened to slightly below Rs 115/US$.
5 In early September, a further US$33 million (SDR$18.1 million) was realized through the special SDR allocation provided under the Fourth Amendment of the Articles of Agreement (effective on 09 September).

8
Figure 11. Exchange Rate, Rs/US$ Figure 12. Gross Official Reserves, US$ mill.
Source: Bloomberg Source: Central Bank of Sri Lanka
Limited fiscal space to respond to the crisis: Persistent fiscal deficits in recent years (on average, 7 percent of GDP) meant that Sri Lanka entered the crisis with little fiscal space to address declining domestic demand. The Government did, however, introduce a modest fiscal stimulus package, amounting to 0.3 percent of GDP in early 2009. The package, a further moderating of revenues in the first half of 2009 and recurrent expenditure recording overruns, was putting the 2009 fiscal deficit on track to exceed 9 percent of GDP. Recognizing that a fiscal deficit of this magnitude would exacerbate macroeconomic imbalances, a key component of the Government’s commitment under the IMF program is to see the fiscal deficit contained to 7 percent of GDP in 2009. Reaching this target will require both expenditure restraint and buoyancy of revenues.
Data for the first six months of the year show a deficit of nearly 12 percent of GDP. Over the same period, public spending has increased by 17 percent to 25 percent of GDP compared to close to 23 percent of GDP in the first half of 2008. The increase in expenditure is mainly due to strong increases in defense, pensions, and interest payments. To meet IMF program targets, total expenditure will have to be contained to 19 percent of GDP in the second half with recurrent expenditure taking the brunt of the adjustment. The revenues outturn in the first half of the year indicates a continuation of the decline, with the revenue-to-GDP ratio dropping to 13.1 percent, compared to 15.1 percent in the first half of 2008. A
110
112
114
116
118
120
122
12
/17
/08
1/6
/09
1/2
6/0
9
2/1
3/0
9
3/5
/09
3/2
5/0
9
4/1
4/0
9
5/4
/09
5/2
2/0
9
6/1
1/0
9
7/1
/09
7/2
1/0
9
8/1
0/0
9
8/2
8/0
9
9/1
7/0
9
$0
$500
$1,000
$1,500
$2,000
$2,500
$3,000
$3,500
$4,000
$4,500
20
08
m8
20
08
m1
0
20
08
m1
2
20
09
m2
20
09
m4
20
09
m6
20
09
m8
Figure 13. Pre‐Crisis macro vulnerability
Source: Department of Census and Statistics and Central Bank of Sri Lanka Note: Fiscal and current account balances are cumulative over 2005‐2007.
-25%
-20%
-15%
-10%
-5%
0%
5%
10%
15%
20%
25%
-100% -80% -60% -40% -20% 0% 20% 40% 60%
Cumulative Fiscal Balance (% of 2007 GDP)
Cumulative Current Account Balance (% of 2007 GDP)
Maldives
Sri Lanka
Lao PDR
Jordan
Chile
China
Bulgaria
Malaysia

9
key driver of the decline has been falling revenues from trade and trade-related taxes6, which comprises the bulk of government tax revenue. Preliminary data indicate that revenue increased sharply in July and August. Continued strong performance will be needed to meet year-end targets.
Table 1. Fiscal Performance through June 2009,
Rs Bn
Full-year targets
Actual Turnout 1H09
Avg. per month 1H09
Balance req. to reach targets
2H09
Avg. per month to reach targets 2H09
Revenue 725 290 48 435 73
Tax 658 266 44 392 65
Non Tax 67 23 4 43 7
Expenditure 1,076 553 92 523 87
Current 811 433 72 378 63
Capital 265 120 20 145 24
Deficit 351 263 44 88 15
Source: Central Bank of Sri Lanka
An important motivation for the fiscal consolidation effort has been concern over debt sustainability. Sri Lanka’s stock of public debt has nearly doubled since 2000, mainly as a result of financing persistent primary fiscal deficits. The government has relied on both external and domestic sources of financing in roughly equal measures until recently, when it had to rely more heavily on domestic debt issuance (to Banks), particularly in late 2008 and most of 2009, when international capital markets were all but closed. While robust GDP growth and a real appreciation of the rupee has led to a decline in the debt-to-GDP ratio from 102.3 percent in 2004 to 81.1 percent in 2008, the structure of the debt portfolio has gradually changed in ways that have increased both its costs and risks, as there has been a shift away from lower-cost external concessional borrowing to higher-cost domestic and non-concessional external borrowing.
Domestic interest costs are estimated to be over 30 percent of government expenditures in 2009. Moreover, more than 40 percent of the domestic debt stock will be maturing in 2009. The recent joint Bank-Fund debt sustainability analysis indicates that the country is at a moderate risk of debt distress, with this conclusion resting heavily on the satisfactory implementation of fiscal consolidation measures.
6 In particular VAT and import duties
Figure 14. Debt sustainability scenarios
Source: World Bank and IMF staff estimates
0
10
20
30
40
50
60
70
80
90
100
2008
2009
2010
2011
2012
2013
2014
2015
2016
2017
2018
2019
2020
2021
2022
2023
2024
2025
2026
2027
2028
Baseline Most extreme shock Fix Primary Balance Historical
PV of Debt-to-GDP Ratio

10
3. PostConflict Prospects
Strong domestic demand has been main driver of growth in recent years. Sustained growth in consumption, and to a certain extent in investments, has been the key driver of growth in the past 3-4 years. Total consumption makes up about 80 percent of GDP and has grown at an average annual rate of 6.5 percent from 2005 to 2008. Growth in public consumption was particularly strong, at an average annual rate of 8.9 percent. The rise in public consumption was due mainly to an increasing in the public sector payroll, which increased by some 300,000 persons from 2005 to 2008. Private consumption grew by an average of 6 percent during this period. Total fixed investments increased by an annual rate of 9.1 percent from 2005 to 2008. Growth in private investments gradually tapered off during the period to only 3.9 percent in 2008, as credit was gradually tightened and global economic prospects dimmed. Public investments have remained high, reflecting the government’s commitment to improve public infrastructure - the average annual growth in public investments was 13.1 percent from 2005 to 2008. Net exports have made only a modest contribution to growth over the period.
After the 2001/2 recession, the output gap gradually closed to become positive from 2006. In the period leading up to the global financial crisis, demand outpaced supply in the Sri Lankan economy, placing pressures on prices and the external account. Real GDP growth averaged 6.8 percent from 2005 to 2008. Measures of the output gap (the difference between actual GDP and “potential” GDP)7 suggest that the Sri Lankan economy has operated above its potential since 2006. An accommodative monetary policy stance, an expansionary fiscal policy, a favorable global environment in terms of both export demand and international capital flows, all fuelled growth. Reconstruction spending in the wake of the 2004 tsunami also boosted domestic
7 We calculate “Potential GDP” by detrending actual GDP, using the Hodrick-Prescott Filter.
Figure 15. Demand component’s contribution to growth
Source: Department of Census and Statistics and World Bank Staff Calculations
Figure 16. Output gap (% of GDP)
Source: World Bank staff estimates
-4%
-2%
0%
2%
4%
6%
8%
10%
2004 2005 2006 2007 2008 2009
Consumption Investments
Net Exports Total GDP
-4%
-3%
-2%
-1%
0%
1%
2%
3%
2001 2002 2003 2004 2005 2006 2007 2008 2009

11
demand. By 2008, the output gap was positive (+2.3% of GDP), but the decline in growth expected for 2009 because of the global downturn should almost eliminate the positive output gap. This suggests that a more neutral macroeconomic policy stance should be pursued in 2009, in comparison to 2008 when a tighter policy was called for.
In the short-to-medium term, prospects for the Sri Lankan economy look positive. First, there are increasing signs that the global economic crisis is bottoming out. Prospects of a global recovery would provide enhanced growth impetus through recovery in exports, increase in tourism and possible greater FDI inflow8 . In a low-inflation environment, the REER can be expected to support export competitiveness. The tourism sector is already showing signs of reaping the end-of-conflict dividend, with July and August arrivals having risen substantially. However, prospects for enhanced FDI inflow would depend on an improvement in the overall investment climate, the elimination of the security threat, the improvement in debt sustainability prospects and the continuation of a low inflation environment.
The end of the armed conflict has inevitably shifted attention to reconstruction efforts. These would provide further growth impetus, at least in the next year or two. Although fiscal constraints may put some limit on reconstruction spending, it is expected that there will be an uptick in remittance inflows to fund household-level reconstruction efforts (e.g., housing). With the gradual resettlement of the displaced and restoration of livelihood, agriculture and SME production is expected to pick up. Domestic banks are seeking opportunities in the North and East, indicated by 67 applications for new branches received by the central bank in May. Private investments in general would also be expected to pick up into 2010 in response to lower interest rates. Overall, growth in 2009 is expected to be in the 3-4 percent range, and to accelerate to above 5 percent in 2010. However, as noted there are several downside risks to these projections, particularly in the event of a slow and anemic recovery in the global economy.
The end of armed conflict provides Sri Lanka with a historic opportunity to achieve a dual transition from a low income country in conflict to a middle income country in peace. For longer-term stability needed to bolster the investment climate it would be necessary to address minorities’ underlying grievances. In terms of devolution of power to provincial councils, the Government has announced that steps to initiate further devolution will only be considered after the upcoming elections.
8 However, this will depend to a large extent on the measures the country would undertake to improve its investment climate.
Figure 17.Consensus Export Market Growth, %
Source: Consensus Economics, IMF and World Bank
-4
-3
-2
-1
0
1
2
3
4
5
Q1
-01
Q3
-01
Q1
-02
Q3
-02
Q1
-03
Q3
-03
Q1
-04
Q3
-04
Q1
-05
Q3
-05
Q1
-06
Q3
-06
Q1
-07
Q3
-07
Q1
-08
Q3
-08
Q1
-09
Q3
-09
Q1
-10
Q3
-10
Export partner weighted GDP growth
Consensus forecast - September 2009 survey
Consensus forecast - March 2009 survey
Forecast

12
Table 2. Selected Macroeconomic indicators
Real Growth, % 2004 2005 2006 2007 2008 2009
GDP 5.4% 6.2% 7.7% 6.8% 6.0% 3.6%
Consumption 4.1% 3.3% 7.1% 4.5% 8.0% 0.3%
-- Private 3.3% 1.7% 6.5% 3.9% 7.6% -1.0%
-- Public 9.3% 12.0% 9.6% 7.4% 9.8% 6.0%
Gross Domestic Fixed Capital Formation 17.8% 9.8% 12.9% 9.1% 5.3% -1.6%
-- Private 19.9% 0.7% 15.4% 5.4% 3.9% -4.0%
-- Government 3.7% 81.9% 2.0% 27.6% 11.1% 7.5%
Trade
-- Export of Goods and Services 7.7% 6.6% 3.8% 7.3% 0.4% -5.0%
-- Imports of Goods and Services 9.0% 2.7% 6.9% 3.7% 4.5% -13.0%
Memorandum Items
GDP US$ bn. 20.7 24.4 28.3 32.6 40.7 41.2
Current account, % of GDP -3.1% -2.7% -5.3% -4.2% -9.3% -1.5%
Source: Department of Census and Statistics and World Bank staff calculations
Preliminary estimates suggest that Sri Lanka’s long-term potential growth rate is around 6 percent. The post-conflict boom may help Sri Lanka to return relatively rapidly to growth rates in this range, but is unlikely to significantly increase the long-term potential growth rate, unless a significant structural policy agenda is implemented. From a simple growth accounting perspective9, there is a need to increase overall investment rates to expand the stock of productive capital. This would require significant increases in domestic savings rates, which, after hovering above 17 percent of GDP between 2005 and 2007, dropped to just over 14 percent in 2008. Human-capital accumulation also needs to be accelerated, which, given that Sri Lanka is already well into its demographic transition, implies that the quality of labor must be improved. Finally, total factor productivity (TFP), a measure that aims to capture structural improvements affecting the efficiency of use of existing production factors, remains rather low in Sri Lanka, although the reforms of the 1990s seem to have increased TFP growth in the last decade.
9 Assuming Cobb-Douglas technology, and parameters as PREMnote 42.
Table 3. Results from Growth Accounting
Real GDP Growth Contribution from: %, p.a. Capital Labor TFP
1960s 4.2% 1.4% 2.0% 0.7% 1970s 3.8% 2.6% 1.8% -0.5% 1980s 3.5% 3.0% 1.4% -0.8% 1990s 4.6% 2.0% 1.3% 1.3% 2000s*/ 5.1% 2.1% 1.3% 1.7% Source: World Bank Staff Calculations
Note: Estimate for 2000s exclude 2001
13
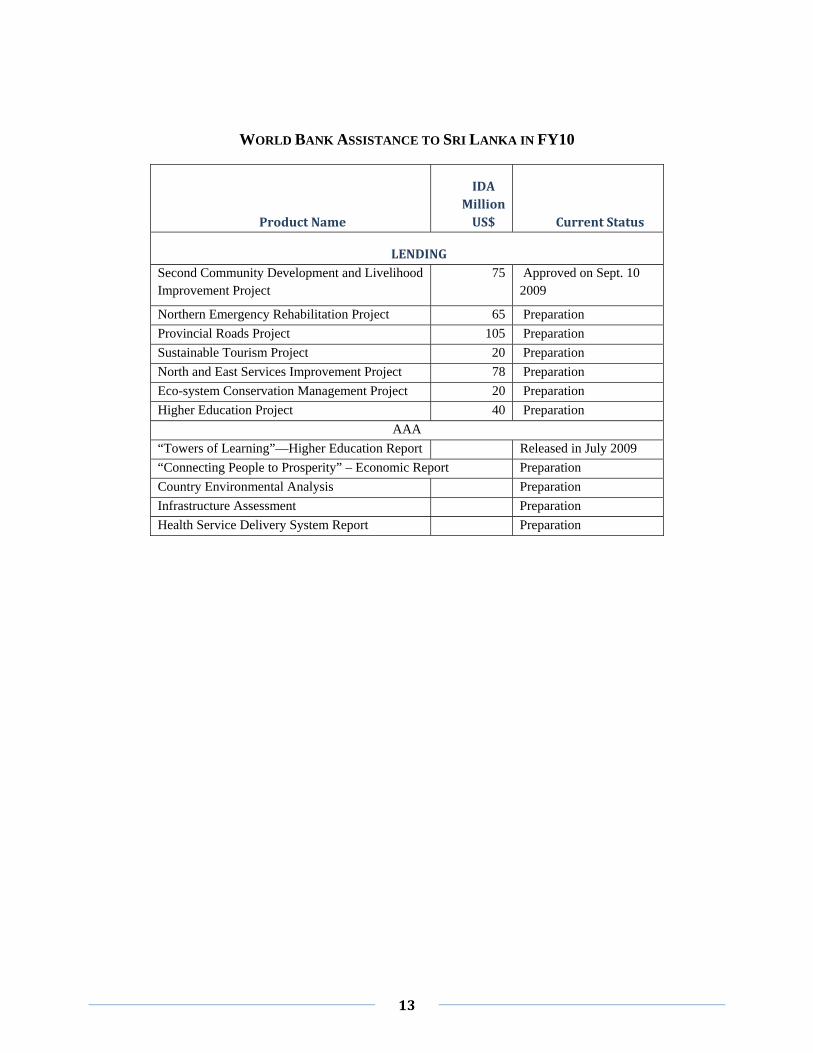
WORLD BANK ASSISTANCE TO SRI LANKA IN FY10
Product Name
IDA Million US$
Current Status
LENDING Second Community Development and Livelihood Improvement Project
75 Approved on Sept. 10 2009
Northern Emergency Rehabilitation Project 65 Preparation
Provincial Roads Project 105 Preparation
Sustainable Tourism Project 20 Preparation
North and East Services Improvement Project 78 Preparation
Eco-system Conservation Management Project 20 Preparation
Higher Education Project 40 Preparation
AAA
“Towers of Learning”—Higher Education Report Released in July 2009
“Connecting People to Prosperity” – Economic Report Preparation
Country Environmental Analysis Preparation
Infrastructure Assessment Preparation
Health Service Delivery System Report Preparation