sr-1454 buckling collapse testing of friction stir · pdf filebuckling collapse testing of...
TRANSCRIPT

SR-1454
BUCKLING COLLAPSE TESTING OF FRICTION STIR WELDED ALUMINUM
STIFFENED PLATE STRUCTURES
This document has been approved for public release and sale; its
distribution is unlimited.
SHIP STRUCTURE COMMITTEE 2009

i
Technical Report Documentation Page
1. Report No. SSC-
2. Government Accession No.
3. Recipient’s Catalog No.
4. Title and Subtitle Buckling Collapse Testing of Friction Stir Welded Aluminum Stiffened Plate Structures
5. Report Date February 3, 2009
6. Performing Organization Code
7. Author(s) Jeom Kee Paik
8. Performing Organization Report No. SR-1454
9. Performing Organization Name and Address LRET Research Centre of Excellence, Pusan National University
10. Work Unit No. (TRAIS)
30 Jangjeon-Dong, Geumjeong-Gu, Busan 609-735 Korea
11. Contract or Grant No. 13. Type of Report Final Report
12. Sponsoring Agency Name and Address Ship Structure Committee U.S. Coast Guard (G-MSE/SSC) 2100 Second Street, SW Washington, DC 20593
14. Sponsoring Agency Code G-M
15. Supplementary Notes Sponsored by the Ship Structure Committee. Jointly funded by its member agencies. 16. Abstract The objectives of this study were to develop a mechanical buckling collapse test database for 5000’s and 6000’s series aluminum stiffened plate structures fabricated by friction stir welding and to compare these structures with similar aluminum plate panels fabricated by fusion welding in terms of weld-induced initial imperfections and ultimate compressive strength performance. The trends or benefits found to be associated with the fusion welding and friction stir welding procedures are discussed. The following is a summary of these discussions. • It is found that the yield and ultimate tensile strengths of friction stir butt-welded aluminum alloys are
equivalent or even better than that of fusion-welded aluminum alloys. • The initial imperfections induced by friction stir welding tend to be smaller than those induced by fusion
welding. Thus, the benefits of the friction stir welding procedure in this respect are clear. • The ultimate strength performance is found to be 10-20% greater in the friction stir-welded aluminum
structures than it is in the fusion-welded aluminum structures. This implies that the friction stir welding procedure is certainly superior to the fusion welding procedure in terms of ultimate compressive strength performance, as long as delamination is prevented.
• All of the friction stir-welded test structures however showed delamination in the welded region after or even before the ultimate strength had been reached. This indicates that the fusion welding procedure is superior to the friction stir welding procedure in terms of compressive strength performance in the welded region.
• It is reconfirmed that nonlinear finite element method computations depend significantly on the structural modeling techniques applied.
17. Key Words Aluminum stiffened plate structures, ultimate strength, friction stir weld, fusion weld, weld-induced initial imperfections, buckling collapse tests, nonlinear finite element method computations
18. Distribution Statement Distribution is available to the public through: National Technical Information Service U.S. Department of Commerce Springfield, VA 22151 Ph. (703) 487-4650
19. Security Classif. (of this report) Unclassified
20. Security Classif. (of this page) Unclassified
21. No. of Pages 206
22. Price

ii
Table of Contents Executive Summary ……………………………………………………………………………………………………….iv Acknowledgements …………………………………………………………………………………………………………v Notation …………………………………………………………………………………………………………………………vi Abbreviation ………………………………………………………………………………………………………………….vi List of Figures ……………………………………………………………………………………………………………….vii List of Tables ………………………………………………………………………………………………………………xvi
1. Introduction ……………………………………………………………………………………………………………….1 1.1 Objectives …………………………………………………………………………………………………………….1 1.2 Background …………………………………………………………………………………………………………..1
1.3 Requirements ……………………………………………………………………………………………………….2 1.3.1 Scope ………………………………………………………………………………………………………….2 1.3.2 Tasks …………………………………………………………………………………………………………..2
1.4 Literature Survey ………………………………………………………………………………………………….3 1.5 Contents of the Report ………………………….…………………………………………………….……..4
2. Fusion Weld versus Friction Stir Weld for Building Aluminum Structures: An Overview …………………………………………………………………………………………………………….6
2.1 Classification of Welding Processes ………………………………………………………………………6 2.2 Fusion Welds ……………………………………………………………………………………………………….6 2.3 Friction Stir Welds ……………………………………………………………………………………………….7 2.3.1 Principles of the Process …………………………………………………………………………….7 2.3.2 Advantages and Limitations ……………………………………………………………………….10
2.3.3 The Softened Zone …………………………………………………………………………………….11
3. Design and Construction of Aluminum Stiffened Plate Structures for Buckling Collapse Testing ……………………………………………………………………………………………………..13
3.1 Selection of Materials …………………………………………………………………………………………13 3.1.1 Combinations for Plate and Extrusions ……………………………………………………..13 3.1.2 Chemical Composition ……………………………………………………………………………….13 3.1.3 Mechanical Properties ……………………………………………………………………………….13 3.1.3(a) Base Material ……………………………………………………………………………….13 3.1.3(b) Welded Material …………………………………………………………………………..20 3.2 Structural Dimensions and Profiles …………………………………………………………………….28 3.2.1 Panel Dimensions ……………………………………………………………………………………….28 3.2.2 Sectional Profiles and Properties of the Extrusions ………………………………….31 3.3 Fusion-welded Structures …………………………………………………………………………………..40 3.4 Friction Stir-welded Structures ………………………………………………………………………….44 3.4.1 Classification of Fabrication Methods ……………………………………………………….44 3.4.2 Butt-joining Methods ………………………………………………………………………………….47 3.4.3 Lap-joining Methods …………………………………………………………………………………..49
4. Weld-induced Initial Imperfections of Test Structures ……………………………………………53
4.1 Types of Weld-induced Initial Imperfections …………………………………………………..53

iii
4.2 SSC-451 Database ……………………………………………………………………………………………….54 4.3 Initial Distortions ………………………………………………………………………………………………..56 4.4 Residual Stresses …………………………………………………………………………………………………78 4.5 Properties of the Softened Zone ………………………………………………………………………..87 4.6 Comparison between Fusion Welds versus Friction Stir Welds ………………………….88
5. Buckling Collapse Testing …………………………………………………………………………………………93
5.1 Test Facilities and Their Set-up ………………………………………………………………………….93 5.2 Test Results and Discussions ……………………………………………………………………………….96 5.2.1 Fusion Fillet-welded Structures 19A and 20A ………………………………………….98 5.2.2 FSW Lap-joined Structures 17D, 18D, 19D1, 19D2, 20D1 and 20D2 ………102 5.2.3 FSW Butt-joined Structures 19C and 20C ………………………………………………114 5.3 SSC-451 Database ……………………………………………………………………………………………..120
6. Nonlinear Finite Element Method Computations …………………………………………………..133
6.1 Structural Modeling ………………………………………………………………………………………….133 6.1.1 Extent of the Analysis ………………………………………………………………………………133 6.1.2 Types of Finite Elements ………………………………………………………………………….135 6.1.3 Size of the Finite Elements ……………………………………………………………………..138 6.1.4 Material Models – Base Material and Softened Zone ……………………………….139 6.1.5 Conditions at the Boundaries and Supports …………………………………………….140 6.1.6 Loading Condition …………………………………………………………………………………….141 6.1.7 Initial Distortions ……………………………………………………………………………………..141 6.1.8 Welding Residual Stresses ………………………………………………………………………..144 6.2 Computational Results and Discussions ……………………………………………………………144 6.3 SSC-451 Database …………………………………………………………………………………………….157
7. Comparison of Ultimate Compressive Strength Performance between Fusion Welds versus Friction Stir Welds ……………….……………………………………..…………………………..171
7.1 Ultimate Compressive Strength Design Formulae for Fusion-welded Structures ……………………………………………………………………………………………………………….………..171 7.2 5083 Plate with β =2.45~2.86 ………………………………………………………………………….172 7.3 5383 Plate with β =2.66~2.72 ………………………………………………………………………….172 7.4 Ultimate Compressive Strength Design Formula for Friction Stir-welded Structures ………………………………………………………………………………………………….…….174
8. Conclusions and Recommendations …………………..………………………………………………….176
References ………………………………………………………………………………………………………………….178
Appendix Mechanical Properties of the Materials after Buckling ……………………………..182

iv
Executive Summary
The objectives of this study were to develop a mechanical buckling collapse test database for 5000’s and 6000’s series aluminum stiffened plate structures fabricated by friction stir welding and to compare these structures with similar aluminum plate panels fabricated by fusion welding in terms of weld-induced initial imperfections and ultimate compressive strength performance. The trends or benefits found to be associated with the fusion welding and friction welding procedures are discussed. The following is a summary of these discussions.
• It is found that the yield and ultimate tensile strengths of friction-stir welded aluminum alloys are equivalent to or can be better than that of fusion-welded aluminum alloys, for butt welds. Tensile coupon tests of friction stir lap-welded aluminum alloys are recommended for the future study to discuss the similar trends of tensile properties.
• The initial imperfections induced by friction stir welding tend to be smaller than those induced by fusion welding. Thus, the benefits of the friction stir welding procedure in this respect are clear.
• The ultimate compressive strength performance is found to be 10-20% greater in the friction stir-welded aluminum structures than it is in the fusion-welded aluminum structures. This implies that the friction stir welding procedure is superior to the fusion welding procedure in terms of ultimate compressive strength performance.
• However, all of the friction stir-welded test structures showed delamination in the welded region after or even before the ultimate strength had been reached. The pre-collapse delamination in the welded region can significantly reduce the ultimate compressive strength performance of the structure. This indicates that the fusion welding procedure is superior to the friction stir welding procedure in terms of compressive strength performance in the welded region, particularly when involving buckling and crushing. Further study is needed to investigate the delamination characteristics in the friction stir-welded region under compressive actions. For the quality assurance of the friction stir welded region, non-destructive test (NDT) methods can be used to find any defects.
• The friction stir lap-weld between plate sheet and extruded stiffener is considered to be a promising welding method to replace the fusion fillet-weld procedure in construction of aluminum structures. The post-collapse delamination is of no major concern for the friction stir lap-welds because it can still maintain the water tightness of the stiffened plate structure, although the pre- or post-collapse delamination is of great concern for the friction stir butt-welds because it can assure no longer the water tightness of the stiffened panel. However, since the pre-collapse delamination reduces the ultimate strength significantly, further study is needed to verify the mechanical property of the friction stir lap-weld and its parameter which will affect the mechanical property and delamination between base plate and stiffener such as width and depth of molten thin-layer, molten temperature, rotating and forwarding speeds, and possible quick cooling, etc.
• It is reconfirmed that nonlinear finite element method computations depend significantly on the structural modeling techniques applied.

v
Acknowledgements
The present study was undertaken at the Lloyd’s Register Educational Trust (LRET) Research Centre of Excellence, Pusan National University, Korea. Thanks are due to graduate students at the Ship and Offshore Structural Mechanics Laboratory of the Pusan National University for their efforts regarding buckling collapse tests and nonlinear finite element method computations.
In addition, this author would like to thank Ship Structure Committee (SSC) for its financial and technical assistance. SSC is an inter-agency organization chaired by US Coast Guard with the goal of eliminating marine structural failures. Member agencies consist of American Bureau of Shipping (ABS), Defence Research Directorate Canada (DRDC), US Maritime Administration (MARAD), Military Sealift Command (MSC), Naval Sea Systems Command (NAVSEA), Transport Canada, Society of Naval Architects and Marine Engineers (SNAME) and the US Coast Guard (USCG). Without the SSC support, it certainly would not have been able to complete this project. Special thanks are due to the members of SSC Project Technical Committee chaired by Mr. Chao Lin, for their valuable comments and advices.

vi
Notation a = panel length between transverse frames
iA = area of the (i)th cross-section in the stiffened panel b = breadth of the plating between longitudinal stiffeners
HAZb = half-breadth of the softened zone
tb = breadth of tensile residual stress block B = breadth of the entire stiffened panel E = elastic modulus (Young’s modulus)
pP = fully plastic axial force without consideration of buckling = i Yii
A σ∑
uP = ultimate axial compressive force t = plate thickness
ocw = maximum column-type initial distortion of stiffener
oplw = maximum initial deflection of plating
osw = maximum sideways initial distortion of stiffener β = plate slenderness ratio λ = column slenderness ratio for either a single stiffener with attached plating or the
entire stiffened panel
rcxσ = compressive residual stress in the x direction
rtxσ = tensile residual stress in the x direction
xσ = applied compressive stress in the x direction
xuσ = ultimate compressive strength of structure
Tσ = ultimate tensile strength of material
Yσ = yield strength of material in general
Yiσ = yield strength of material in the (i)th cross-section
Yeqσ = equivalent yield strength of material in general = i Yi ii i
A / Aσ∑ ∑
YHAZσ = reduced yield strength in the softened zone
Abbreviation
FEA = finite element analysis FSW = friction stir welding GMAW = gas metal arc welding, which is also termed metal inert gas (MIG) welding HAZ = heat-affected zone SSC = The Ship Structure Committee TMAZ = thermo-mechanically affected zone ULS = ultimate limit states

vii
List of Figures
Figure 2.1 Photo of GMAW-based fusion-welding process applied for building the present test structures …………………………………………………………………………………………….7
Figure 2.2 Schematic of the FSW process (Thomas et al. 1991) ……………………………..8 Figure 2.3 Pin and shoulder of the FSW tool (Thomas et al. 1991) ………………………..9 Figure 2.4 Steps of the FSW process (Thomas et al. 1991) ……………………………………..9 Figure 2.5 Photo of the FSW process applied for building the present test
structures ………………………………………………………………………………………………………………..10 Figure 2.6 Keyhole at the end of the friction stir weld ………………………………………….11 Figure 2.7 Schematic of the TMAZ and HAZ associated with FSW (Kramer 2007) .12 Figure 3.1(a) Specimen of tensile coupon tests for the mechanical property
characterization of the base material – rolled plate part …………………………………..14 Figure 3.1(b) Specimen of tensile coupon tests for the mechanical property
characterization of the base material – extruded web part ……………………………….14 Figure 3.1(c) Photos of sample tensile coupon test specimens ……………………………..15 Figure 3.2(a) The stress versus strain curves for the aluminum base material -
5083-H112 (rolled) - obtained from the tensile coupon tests ……………………………15 Figure 3.2(b) The stress versus strain curves for the aluminum base material –
5083-H112 (extruded) – obtained from the tensile coupon tests ……………………..16 Figure 3.2(c) The stress versus strain curves for the aluminum base material –
5083-H116 (rolled) – obtained from the tensile coupon tests …………………………..16 Figure 3.2(d) The stress versus strain curves for the aluminum base material –
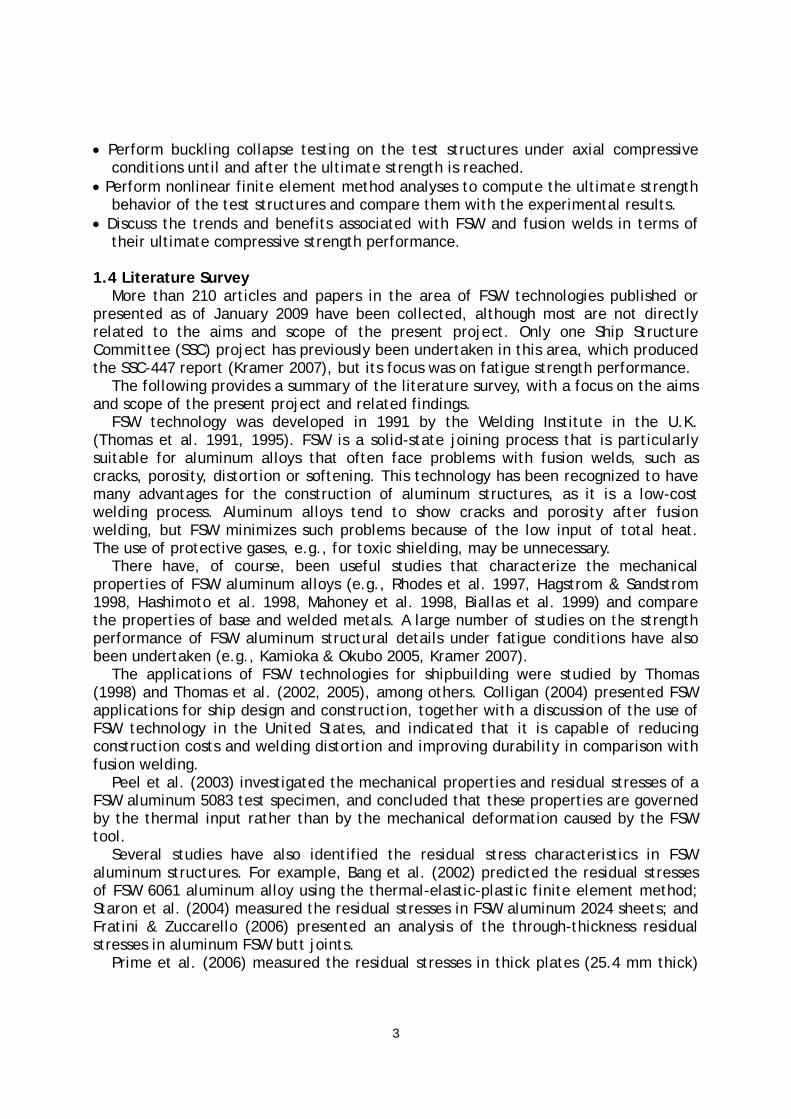
5383-H112 (extruded) – obtained from the tensile coupon tests ……………………..17 Figure 3.2(e) The stress versus strain curves for the aluminum base material –
5383-H116 (rolled) - obtained from the tensile coupon tests …………………………..17 Figure 3.2(f) The stress versus strain curves for the aluminum base material –
6082-T6 (extruded) - obtained from the tensile coupon tests ………………………….18 Figure 3.3 Specimen of tensile coupon tests for the mechanical property
characterization of the welded material ……………………………………………………………..21 Figure 3.4 Nomenclature for FSW tool size ……………………………………………………………..21 Figure 3.5(a) The stress versus strain curves for fusion-welded aluminum material
– 5083-H112 plus 5083-H112 – obtained from the present tensile coupon tests …………………………………………………………………………………………………………………………………..22
Figure 3.5(b) The stress versus strain curves for FSW aluminum material – 5083-H112 plus 5083-H112 – obtained from the present tensile coupon tests …………22
Figure 3.5(c) The stress versus strain curves for fusion welded aluminum material – 5083-H112 plus 5383-H116 – obtained from the tensile coupon tests …………..23
Figure 3.5(d) The stress versus strain curves for FSW aluminum material – 5083-H112 plus 5383-H116 – obtained from the tensile coupon tests ……………………….23
Figure 3.5(e) The stress versus strain curves for fusion-welded aluminum material – 5383-H116 plus 5383-H116 – obtained from the present tensile coupon tests …………………………………………………………………………………………………………………………………..24
Figure 3.5(f) The stress versus strain curves for FSW aluminum material – 5383-H116 plus 5383-H116 – obtained from the present tensile coupon tests …………24
Figure 3.5(g) Comparison of the stress versus strain curves for welded aluminum

viii
material fabricated by fusion welding and FSW – 5083-H112 plus 5083-H112 – obtained from the tensile coupon tests ……………………………………………………………….25
Figure 3.5(h) Comparison of the stress versus strain curves for welded aluminum material fabricated by fusion welding and FSW – 5383-H116 plus 5383-H116 – obtained from the tensile coupon tests ……………………………………………………………….25
Figure 3.5(i) Comparison of the stress versus strain curves for welded aluminum material fabricated by fusion welding and FSW – 5083-H112 plus 5383-H116 – obtained from the tensile coupon tests ……………………………………………………………….26
Figure 3.6 Nomenclature of the structural dimensions ………………………………………….29 Figure 3.7 Cross-sectional profiles of the extrusions ……………………………………………..32 Figure 3.8 Schematic of fillet-type fusion weld (Fabrication method A) ……………….41 Figure 3.9(a) Layout of test structure 19A for fillet-type fusion weld in mm ………41 Figure 3.9(b) Layout of test structure 20A for fillet-type fusion weld in mm ……..41 Figure 3.10(a) Photo of one of the test structures during fusion-weld fabrication
…………………………………………………………………………………………………………………………………..42 Figure 3.10(b) Photo of test structure (19A) after fusion-weld fabrication ………….42 Figure 3.11 Various joint configurations for FSW (Kramer 2007) ………………………….45 Figure 3.12(a) Schematic of FSW for fillet-joining between a continuous plate
sheet and extrusions with taper flange (Method A) …………………………………………….45 Figure 3.12(b) Schematic of FSW for butt-joining between large extrusions only
(Method B) ……………………………………………………………………………………………………………….45 Figure 3.12(c) Schematic of FSW for butt-joining on the extrusion side between
the plate sheet and the extrusion (Method C-1) ………………………………………………….46 Figure 3.12(d) Schematic of FSW for butt-joining on the plate side between the
plate sheet and the extrusion (Method C-2) ………………………………………………………..46 Figure 3.12(e) Schematic of FSW for lap-joining between the plate sheet and the
extrusion (Method D) ………………………………………………………………………………………………46 Figure 3.13(a) Layout of test structure 19C for friction stir butt-joining in mm ….47 Figure 3.13(b) Layout of test structure 20C for friction stir butt-joining in mm …47 Figure 3.14 Support jig design for FSW butt-joining in association with Method C-2
in mm ……………………………………………………………………………………………………………………….48 Figure 3.15(a) Photo of one of the test structures during friction stir butt-joining
…………………………………………………………………………………………………………………………………..48 Figure 3.15(b) Photo of test structure 19C after friction stir butt-joining ……………49 Figure 3.16(a) Layout of test structure 17D for friction stir lap-joining in mm …..49 Figure 3.16(b) Layout of test structure 18D for friction stir lap-joining in mm …..50 Figure 3.16(c) Layout of test structure 19D1 for friction stir lap-joining in mm …50 Figure 3.16(d) Layout of test structure 19D2 for friction stir lap-joining in mm …50 Figure 3.16(e) Layout of test structure 20D1 for friction stir lap-joining in mm ..50 Figure 3.16(f) Layout of test structure 20D2 for friction stir lap-joining in mm ….51 Figure 3.17 Support jig design for FSW lap-joining in association with Method D in
mm ……………………………………………………………………………………………………………………………51 Figure 3.18(a) Photo of a test structure during friction stir lap-joining ……………….52 Figure 3.18(b) Photo of test structure 17D after friction stir lap-joining …………….52 Figure 4.1 Schematic of weld-induced initial distortions ……………………………………….53 Figure 4.2(a) Schematic of fillet weld-induced residual stresses in the plating …..53

ix
Figure 4.2(b) Schematic of fillet weld-induced residual stresses in the stiffener web ………………………………………………………………………………………………………………………….54
Figure 4.3 (a) Photo of the set-up for the plate initial deflection measurements .57 Figure 4.3(b) Photo of the set-up for the stiffener initial distortion measurements
…………………………………………………………………………………………………………………………………..57 Figure 4.4(a) Three-dimensional display of initial distortions (amplified by 30
times) in test structure 19A …………………………………………………………………………………..58 Figure 4.4(b) Three-dimensional display of initial distortions (amplified by 30
times) in test structure 20A …………………………………………………………………………………..58 Figure 4.4(c) Three-dimensional display of initial distortions (amplified by 30
times) in test structure 17D ………………………………………………………………………………….58 Figure 4.4(d) Three-dimensional display of initial distortions (amplified by 30
times) in test structure 18D ………………………………………………………………………………….58 Figure 4.4(e) Three-dimensional display of initial distortions (amplified by 30
times) in test structure 19D1 ………………………………………………………………………………..59 Figure 4.4(f) Three-dimensional display of initial distortions (amplified by 30
times) in test structure 19D2 ………………………………………………………………………………..59 Figure 4.4(g) Three-dimensional display of initial distortions (amplified by 30
times) in test structure 20D1 ………………………………………………………………………………..59 Figure 4.4(h) Three-dimensional display of initial distortions (amplified by 30
times) in test structure 20D2 ………………………………………………………………………………..59 Figure 4.4(i) Three-dimensional display of initial distortions (amplified by 30
times) in test structure 19C …………………………………………………………………………………..60 Figure 4.4(j) Three-dimensional display of initial distortions (amplified by 30
times) in test structure 20C …………………………………………………………………………………..60 Figure 4.5(a) Shape of initial distortions (amplified by 30 times) for the plating and
stiffeners in test structure 19A …………………………………………………………………………….60 Figure 4.5(b) Shape of initial distortions (amplified by 30 times) for the plating and
stiffeners in test structure 20A …………………………………………………………………………….60 Figure 4.5(c) Shape of initial distortions (amplified by 30 times) for the plating and
stiffeners in test structure 17D …………………………………………………………………………….61 Figure 4.5(d) Shape of initial distortions (amplified by 30 times) for the plating and
stiffeners in test structure 18D …………………………………………………………………………….61 Figure 4.5(e) Shape of initial distortions (amplified by 30 times) for the plating and
stiffeners in test structure 19D1 …………………………………………………………………………..61 Figure 4.5(f) Shape of initial distortions (amplified by 30 times) for the plating and
stiffeners in test structure 19D2 …………………………………………………………………………..61 Figure 4.5(g) Shape of initial distortions (amplified by 30 times) for the plating and
stiffeners in test structure 20D1 …………………………………………………………………………..61 Figure 4.5(h) Shape of initial distortions (amplified by 30 times) for the plating and
stiffeners in test structure 20D2 …………………………………………………………………………..62 Figure 4.5(i) Shape of initial distortions (amplified by 30 times) for the plating and
stiffeners in test structure 19C …………………………………………………………………………….62 Figure 4.5(j) Shape of initial distortions (amplified by 30 times) for the plating and
stiffeners in test structure 20C …………………………………………………………………………….62 Figure 4.6(a) Details of initial distortion measurements in test structure 19A ……65

x
Figure 4.6(b) Details of initial distortion measurements in test structure 20A ……66 Figure 4.6(c) Details of initial distortion measurements in the test structure 17D
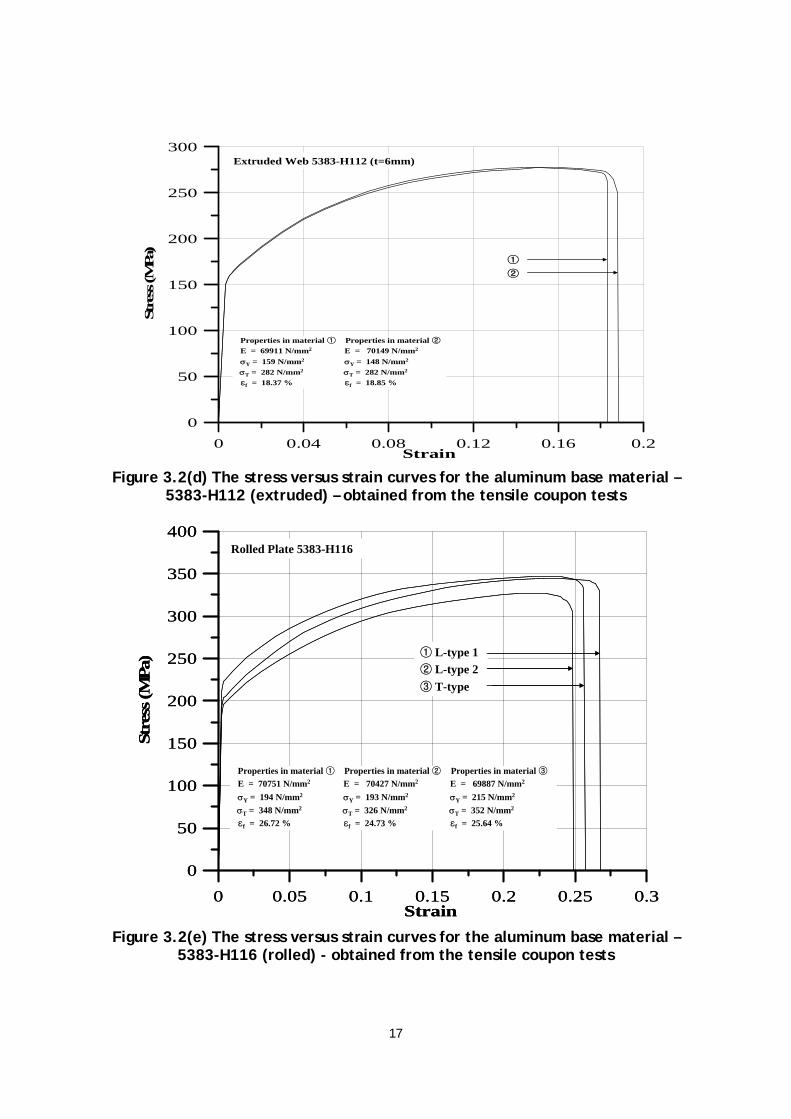
…………………………………………………………………………………………………………………………………..68 Figure 4.6(d) Details of initial distortion measurements in test structure 18D ……69 Figure 4.6(e) Details of initial distortion measurements in test structure 19D1 ….70 Figure 4.6(f) Details of initial distortion measurements in test structure 19D2 ….72 Figure 4.6(g) Details of initial distortion measurements in test structure 20D1 ….73 Figure 4.6(h) Details of initial distortion measurements in test structure 20D2 ….75 Figure 4.6(i) Details of initial distortion measurements in test structure 19C …….76 Figure 4.6(j) Details of initial distortion measurements in test structure 20C …….78 Figure 4.7 Set-up for residual stress measurement using the hole-drilling strain-
gauge method ………………………………………………………………………………………………………….79 Figure 4.8 Relationships between drilling depth and released strain in the panel
longitudinal direction at a location in the compressive residual stress zone …..80 Figure 4.9(a) Distribution of residual stress in test structure 19A …………………………80 Figure 4.9(b) Distribution of residual stress in test structure 20A: (a) plate, (b)
stiffener web …………………………………………………………………………………………………………..81 Figure 4.9(c) Distribution of residual stress in test structure 17D ………………………..82 Figure 4.9(d) Distribution of residual stress in test structure 18D …………………………82 Figure 4.9(e) Distribution of residual stress in test structure 19D1 ……………………. 83 Figure 4.9(f) Distribution of residual stress in test structure 19D2 ……………………….83 Figure 4.9(g) Distribution of residual stress in test structure 20D1: (a) plate, (b)
stiffener web …………………………………………………………………………………………………………..84 Figure 4.9(h) Distribution of residual stress in test structure 20D2: (a) plate, (b)
stiffener web …………………………………………………………………………………………………………..85 Figure 4.9(i) Distribution of residual stress in test structure 19C …………………………86 Figure 4.9(j) Distribution of residual stress in test structure 20C …………………………86 Figure 4.10(a) Comparison of the maximum initial distortion of the plating in
fusion welds versus friction stir welds ………………………………………………………………….89 Figure 4.10(b) Comparison of the maximum column-type initial distortion of the
stiffener in fusion welds versus friction stir welds ……………………………………………..89 Figure 4.10(c) Comparison of the maximum sideways initial distortion of the
stiffener in fusion welds versus friction stir welds ……………………………………………..90 Figure 4.10(d) Comparison of the compressive residual stress at the plating in
fusion welds versus friction stir welds ………………………………………………………………….90 Figure 4.10(e) Comparison of the reduced yield strength in the softened zone in
fusion welds versus friction stir welds ………………………………………………………………….91 Figure 4.10(f) Comparison of the softened zone breadth (half value) in fusion
welds versus friction stir welds …………………………………………………………………………….91 Figure 5.1 Photo of the test set-up for buckling collapse testing ………………………….93 Figure 5.2 Photo of the rigid solid bar inserted into the loaded edge ………………….94 Figure 5.3 Photo of the rigid strips bolted to the test panel at the unloaded edge
…………………………………………………………………………………………………………………………………..94 Figure 5.4 Photo of the strain gauges attached at both the lower and upper ends of
the test structure ……………………………………………………………………………………………………95 Figure 5.5(a) Mode I: Overall collapse after overall buckling …………….………………….96

xi
Figure 5.5(b) Mode II: Collapse of plating without failure of stiffeners …96 Figure 5.5(c) Mode III: Beam-column type collapse as a plate-stiffener combination
……………………………………………………………………………………………………………………………………97 Figure 5.5(d) Mode IV: Local buckling of stiffener web ………………………………………….97 Figure 5.5(e) Mode V: Flexural-torsional buckling (tripping) of stiffener …………….97 Figure 5.6(a) Relationship between axial compressive force and axial compressive
displacement for test structure 19A …………………………………………………………………….99 Figure 5.6(b) Photo of Collapse Mode V in test structure 19A …………………………….100 Figure 5.7(a) Relationship between axial compressive force and axial compressive
displacement for test structure 20A …………………………………………………………………..101 Figure 5.7(b) Photo of Collapse Mode IV in test structure 20A …………………………….102 Figure 5.8(a) Relationship between axial compressive force and axial compressive
displacement for test structure 17D …………………………………………………………………..103 Figure 5.8(b) Photo of Collapse Mode III in test structure 17D …………………………….104 Figure 5.8(c) Photo of the delamination failure in test structure 17D, taken at the
end of testing ………………………………………………………………………………………….…………….104 Figure 5.9(a) Relationship between axial compressive force and axial compressive
displacement for test structure 18D ……………………………………………………………………105 Figure 5.9(b) Photo of the delamination failure in test structure 18D ……………….106 Figure 5.10(a) Relationship between axial compressive force and axial
compressive displacement for test structure 19D1 …………………………………………..107 Figure 5.10(b) Photo of the delamination failure in test structure 19D1, taken at
the end of testing …………………………………………………………………………………….…………..108 Figure 5.11(a) Relationship between axial compressive force and axial
compressive displacement for test structure 19D2 …………………………………………..109 Figure 5.11(b) Photo of the delamination failure in test structure 19D2, taken at
the end of testing ……………………………………………………………………………………….…………110 Figure 5.12(a) Relationship between the axial compressive force and axial
compressive displacement for test structure 20D1 …………………………………………..111 Figure 5.12(b) Photo of the delamination failure in test structure 20D1, taken as
the end of testing ……………………………………………………………………………………….…………112 Figure 5.13(a) Relationship between axial compressive force and axial
compressive displacement for test structure 20D2 …………………………………………..113 Figure 5.13(b) Photo of the delamination failure in test structure 20D2, taken at
the end of testing ……………………………………………………………………………………….…………114 Figure 5.14(a) Relationship between axial compressive force and axial
compressive displacement for test structure 19C …………………………………………….115 Figure 5.14(b) Photo of Collapse Mode II in test structure 19C …..……………………..116 Figure 5.14(c) Photo of the delamination failure in test structure 19C, taken at the
end of testing …………………………………………………………………………………………..…………..117 Figure 5.15(a) Relationship between axial compressive force and axial
compressive displacement for test structure 20C …………………………………………….118 Figure 5.15(b) Photo of Collapse Mode IV in test structure 20C ………………………….119 Figure 5.15(c) Photo of the delamination failure in test structure 20C, taken at the
end of testing …………………………………………………………………………………………..…………..119 Figure 5.16 Relationship between axial compressive force and axial compressive

xii
displacement for test structure 5 in SSC-451 …………………………………………………….121 Figure 5.17 Relationship between axial compressive force and axial compressive
displacement for test structure 6 in SSC-451 ………………………………………………….…122 Figure 5.18 Relationship between axial compressive force and axial compressive
displacement for test structure 7 in SSC-451 …………………………………………………….123 Figure 5.19 Relationship between axial compressive force and axial compressive
displacement for test structure 8 in SSC-451 …………………………………………………….124 Figure 5.20 Relationship between axial compressive force and axial compressive
displacement for test structure 17 in SSC-451 ………………………………………………….125 Figure 5.21 Relationship between axial compressive force and axial compressive
displacement for test structure 18 in SSC-451 ………………………………………………….126 Figure 5.22 Relationship between axial compressive force and axial compressive
displacement for test structure 19 in SSC-451 ………………………………………………….127 Figure 5.23 Relationship between axial compressive force and axial compressive
displacement for test structure 20 in SSC-451 ………………………………………………….128 Figure 5.24 Relationship between axial compressive force and axial compressive
displacement for test structure 29 in SSC-451 ………………………………………………….129 Figure 5.25 Relationship between axial compressive force and axial compressive
displacement for test structure 30 in SSC-451 ………………………………………………….130 Figure 5.26 Relationship between axial compressive force and axial compressive
displacement for test structure 31 in SSC-451 ………………………………………………….131 Figure 5.27 Relationship between axial compressive force and axial compressive
displacement for test structure 32 in SSC-451 ………………………………………………….132 Figure 6.1(a) A quarter model for a rectangular plate under uniaxial compression
…………………………………………………………………………………………………………………………………133 Figure 6.1(b) A one-bay plate-stiffener combination model for a stiffened plate
structure under uniaxial compression ………………………………………………………………..134 Figure 6.1(c) A two-bay plate-stiffener combination model for a stiffened plate
structure under uniaxial compression ………………………………………………………………..134 Figure 6.1(d) A one-bay stiffened panel model for a stiffened plate structure under
uniaxial compression …………………………………………………………………………………………….134 Figure 6.1(e) A two-bay stiffened panel model for a stiffened plate structure under
uniaxial compression …………………………………………………………………………………………….135 Figure 6.1(f) A three-bay stiffened panel model for a stiffened plate structure
under uniaxial compression …………………………………………………………………………………135 Figure 6.2(a) A view of the finite element model of test structure 19A in the y-z
plane ……………………………………………………………………………………………………………………..136 Figure 6.2(b) A view of the finite element model of test structure 20A in the y-z
plane ……………………………………………………………………………………………………………………..136 Figure 6.2(c) A view of the finite element model of test structure 17D in the y-z
plane ……………………………………………………………………………………………………………………..136 Figure 6.2(d) A view of the finite element model of test structure 18D in the y-z
plane ……………………………………………………………………………………………………………………..137 Figure 6.2(e) A view of the finite element model of test structure 19D1 in the y-z
plane ……………………………………………………………………………………………………………………..137 Figure 6.2(f) A view of the finite element model of test structure 19D2 in the y-z

xiii
plane ………………………………………………………………………………………………………………………137 Figure 6.2(g) A view of the finite element model of test structure 20D1 in the y-z
plane ………………………………………………………………………………………………………………………137 Figure 6.2(h) A view of the finite element model of test structure 20D2 in the y-z
plane ………………………………………………………………………………………………………………………138 Figure 6.2(i) A view of the finite element model of test structure 19C in the y-z
plane ………………………………………………………………………………………………………………………138 Figure 6.2(j) A view of the finite element model of test structure 20C in the y-z
plane ……………………………………………………………………………………………………………………..138 Figure 6.3 A material model for materials in the softened zone in terms of the
relationship between the stress (σ ) and the strain ( ε ) …………………………………..140 Figure 6.4 Nonlinear finite element model for the test structures …………………….141 Figure 6.5(a) The CIP type of the column initial distortion of stiffeners in the
central panel of the structure, with the cross sections at the transverse frames rotating with regard to the y axis ……………………………………………………………………….143
Figure 6.5(b) The CIP type of the column initial distortion of stiffeners in the central panel of the structure, with the cross sections at the transverse frames keeping upright ……………………………….………………………………………………………………….143
Figure 6.5(c) The CIS type of the column initial distortion of stiffeners in the central panel of the structure, with the cross sections at the transverse frames rotating with regard to the y axis ……………………………………………………………………….143
Figure 6.5(d) The CIS type of the column initial distortion of stiffeners in the central panel of the structure, with the cross sections at the transverse frames keeping upright ……………………………….………………………………………………………………….143
Figure 6.6 The axial compressive force versus the axial compressive displacement of test structure 19A …………………………………………………………………………………………….147
Figure 6.7 The axial compressive force versus the axial compressive displacement of test structure 20A …………………………………………………………………………………………….148
Figure 6.8 The axial compressive force versus the axial compressive displacement of test structure 17D …………………………………………………………………………………………….149
Figure 6.9 The axial compressive force versus the axial compressive displacement of test structure 18D …………………………………………………………………………………………….150
Figure 6.10 The axial compressive force versus the axial compressive displacement of test structure 19D1 …………………………………………………………………151
Figure 6.11 The axial compressive force versus the axial compressive displacement of test structure 19D2 ………………………………………………………………….152
Figure 6.12 The axial compressive force versus the axial compressive displacement of test structure 20D1 ………………………………………………………………….153
Figure 6.13 The axial compressive force versus the axial compressive displacement of test structure 20D2 ………………………………………………………………….154
Figure 6.14 The axial compressive force versus the axial compressive displacement of test structure 19C …………………………………………………………………….155
Figure 6.15 The axial compressive force versus the axial compressive displacement of test structure 20C …………………………………………………………………….156
Figure 6.16 The axial compressive force versus the axial compressive displacement of test structure 5 …………………………………………………………………………157

xiv
Figure 6.17 The axial compressive force versus the axial compressive displacement of test structure 6 ………………………………………………………………………..158
Figure 6.18 The axial compressive force versus the axial compressive displacement of test structure 7 ………………………………………………………………………..159
Figure 6.19 The axial compressive force versus the axial compressive displacement of test structure 8 ………………………………………………………………………..160
Figure 6.20 The axial compressive force versus the axial compressive displacement of test structure 17 ……………………………………………………………………….161
Figure 6.21 The axial compressive force versus the axial compressive displacement of test structure 18 ……………………………………………………………………….162
Figure 6.22 The axial compressive force versus the axial compressive displacement of test structure 19 ……………………………………………………………………….163
Figure 6.23 The axial compressive force versus the axial compressive displacement of test structure 20 ……………………………………………………………………….164
Figure 6.24 The axial compressive force versus the axial compressive displacement of test structure 29 ……………………………………………………………………….165
Figure 6.25 The axial compressive force versus the axial compressive displacement of test structure 30 ……………………………………………………………………….166
Figure 6.26 The axial compressive force versus the axial compressive displacement of test structure 31 ……………………………………………………………………….167
Figure 6.27 The axial compressive force versus the axial compressive displacement of test structure 32 ……………………………………………………………………….168
Figure 7.1 Variation in the ultimate compressive strength performance of fusion-welded and friction stir-welded aluminum stiffened plate structures with 5083 alloy plates ……………………………………….……………………………………………………………………173
Figure 7.2 Variation in the ultimate compressive strength performance of fusion-welded and friction stir-welded aluminum stiffened plate structures with 5383 alloy plates …………………………………………………………….………………………………………………174
Figure 7.3 Accuracy of the ultimate compressive strength design formula for friction stir-welded aluminum structures ………………………………………………………….175
Figure A.1 The stress-strain relationship of material 5383-H116 after buckling in test structure 19A ………………………………………………………………………………………………..183
Figure A.2 The stress-strain relationship of material 5383-H116 after buckling in test structure 20A ………………………………………………………………………………………………..184
Figure A.3 The stress-strain relationship of material 5083-H112 after buckling in test structure 17D ………………………………………………………………………………………………..184
Figure A.4 The stress-strain relationship of material 5083-H112 after buckling in test structure 18D ………………………………………………………………………………………………..185
Figure A.5 The stress-strain relationship of material 5083-H112 after buckling in test structure 19D1 ………………………………………………………………………………………………185
Figure A.6 The stress-strain relationship of material 5383-H116 after buckling in test structure 19D2 …………………………………………………………………………………………..…186
Figure A.7 The stress-strain relationship of material 5083-H112 after buckling in test structure 20D1 ……………………………………………………………………………………………..186
Figure A.8 The stress-strain relationship of material 5383-H116 after buckling in test structure 20D2 ………………………………………………………………………………………………187

xv
Figure A.9 The stress-strain relationship of material 5083-H112 after buckling in test structure 19C ………………………………………………………………………………………………..187
Figure A.10 The stress-strain relationship of material 5383-H116 after buckling in test structure 20C ………………………………………………………………………………………………..188
Figure A.11 Photo of one of the test structures after the material test specimen had been cut out of the buckling collapsed structure ………………………………………188

xvi
List of Tables
Table 3.1 Chemical composition (wt. %) of aluminum alloys used in the present study …………………………………………………………………………………………………………………………14
Table 3.2 Summary of the mechanical properties of the aluminum alloys (base material), obtained from the tensile coupon tests ……………………………………………..19
Table 3.3 Minimum requirements for the mechanical properties of aluminum alloys - base material (ABS 2006) …………………………………………………………………………………….20
Table 3.4 Summary of the mechanical properties of welded aluminum alloys, obtained from the tensile coupon tests ……………………………………………………………….27
Table 3.5 Minimum yield strength requirements for fusion-welded aluminum alloys, as specified by various regulations (MPa) …………………………………………………………….28
Table 3.6(a) Details of the principal dimensions of the test structures used in the present study ………………………………………………………………………………………………………….30
Table 3.6(b) Details of the principal dimensions of the test structures in SSC-451 …………………………………………………………………………………………………………………………………..31
Table 3.7(a) Details of the cross-sectional properties for a single stiffener with attached plating of the present test structures ………………………………………………….38
Table 3.7(b) Details of the cross-sectional properties for the entire stiffened panel cross section of the present test structures ………………………………………………………..38
Table 3.8(a) Details of the cross-sectional properties for a single stiffener with attached plating of the SSC-451 test structures ………………………………………………….39
Table 3.8(b) Details of the cross-sectional properties for the entire stiffened panel cross section of the SSC-451 test structures ……………………………………………………….40
Table 3.9 Summary of fabrication methods applied in the test structures …..………43 Table 3.10 Sizes of the FSW tool applied to fabricate the test structures, with the
nomenclature defined in Figure 3.4 …………………………………………………………………….47 Table 4.1 Maximum values of the initial distortion measurements in the plating and stiffeners, together with the ABS rule requirements for tolerance ………………………63 Table 4.2 Mechanical properties of the softened zone in terms of breadth and
reduced yield strength ………………………………………………………………………………………….87 Table 4.3 Comparison of initial imperfections in fusion welds versus friction stir
welds ……………………………………………………………………………………………………………………….88
Table 5.1 Summary of the ultimate compressive strength and associated collapse mode of the present test structures …………………………..……………………………………….98
Table 5.2 Summary of the ultimate compressive strength and associated collapse mode for the SSC-451 test structures ………………………..……………………………………..120
Table 6.1 Summary of the ultimate compressive strength computations for the test structures in terms of the ultimate compressive stress normalized by the equivalent yield stress …..……………………………………………………………………………….….143
Table 6.2 Summary of the ultimate compressive strength computations for the test structures in terms of the ultimate compressive force normalized by the fully plastic force ………………………………………………………………………………………………………...144
Table 6.3 Summary of the ultimate compressive strength computations for the SSC-451 test structures in terms of the ultimate compressive stress normalized the equivalent yield stress ………………………………………………….……………………………..168

xvii
Table 6.4 Summary of the ultimate compressive strength computations for the SSC-451 test structures in terms of the ultimate compressive force normalized by the fully plastic force ……………………………………………………………………..………………169
Table A.1 Comparison of the mechanical properties of virgin materials with those of the materials that experienced buckling ……………………………………………………….181

1
Chapter 1 Introduction 1.1 Objectives
The primary objectives of the present study are as follows.
• To develop a mechanical buckling collapse test database of full-scale prototypes of 5000’s and 6000’s series aluminum stiffened plate structures fabricated by the friction stir-welding (FSW) procedure.
• To provide a comparison of these structures with similar aluminum plate panels fabricated by the fusion welding procedure and to note any trends or benefits associated with either procedure.
1.2 Background
The use of high-strength aluminum alloys in the shipbuilding industry provides many benefits, but also presents many challenges (Collette 2005, Sielski 2007, 2008). The benefits of using aluminum rather than steel include its lighter weight, which helps increase cargo capacity and/or reduce power requirements, excellent corrosion resistance and low maintenance. The challenges include reduced stiffness, which results in greater sensitivity to deformation, buckling and plastic collapse, and the need for different welding practices.
The aforementioned benefits are now well-recognized, particularly for the design and construction of war ships, littoral surface craft and combat ships, and fast passenger ships, particularly as such ocean-going vessels are becoming increasingly large in size.
The increasing size of these vessels, however, has resulted in a number of design challenges. Aluminum alloys are less stiff than mild steel, and no refined ultimate limit state (ULS) design methods that involve local and overall ULS assessments exist, unlike the case with steel structures for which the necessary information is plentiful. The use of ULS design methods (ISO 2007), in addition to more conventional structural design standards, will help in the design and construction of very large, high-speed, ocean-going aluminum vessel structures (Paik et al. 2005).
The SSC-451 report (Paik et al. 2008b) presented an extensive investigation of the collapse characteristics of the aluminum stiffened plate structures used for marine applications carried out via mechanical testing and nonlinear finite element method computations. The features of the initial imperfections found were examined together with a statistical database of the fabrication-related initial imperfections in fusion-welded aluminum stiffened plate structures, because such imperfections significantly affect ULS behavior. This database and the insights presented in the SSC-451 report are very useful in the design and construction of high-speed, fusion-welded aluminum ocean-going vessel structures.
Various welding methods are used today to fabricate aluminum ship structures, namely, gas metal arc welding (GMAW), laser welding and FSW. The SSC-451 report focuses on the GMAW technique for the construction of its test structures, as it is currently one of the most popular methods of welding in aluminum ship construction.
FSW, however, has also been recognized as a very attractive joining method for aluminum structures because of its many superior features, such as excellent joint

2
performance, small degree of initial imperfections, low level of energy consumption and lack of harmful emissions (Dawes & Thomas 1995). FSW technology has been applied successfully to various aluminum structures, such as railcars, automobiles and bridges (Thomas & Nicholas 1997, Midling et al. 1998, Sanderson et al. 2000).
However, these applications are mostly suitable for 6000’s series aluminum alloys, and more R&D efforts are required to extend them to such structures as fast ships and spherical liquefied natural gas (LNG) cargo tanks made of 5000’s series aluminum alloys, which are the major alloys used for marine applications (Kallee 2000, Przydatek 2000).
It was once considered to be too difficult to apply FSW to 5000’s series aluminum alloys due to their poor fluidity at welding temperatures. Recently, however, FSW machines have been developed to deal with the fabrication of products made with these alloys, and they are able to produce good-quality welds of up to 25 mm in thickness. Also, it has been confirmed in the literature that the fatigue strength characteristics of 5000’s series aluminum structural details fabricated by FSW are good enough when compared to fillet-welded details (Nicholas 1998).
However, there is no mechanical test database in the literature on the buckling collapse strength of 5000’s and 6000’s series aluminum structures fabricated by FSW. As ultimate buckling strength is today a primary design basis for both aluminum and steel ship structures, the development of a related mechanical buckling collapse test database is a matter of urgency.
Although the SSC-451 report presents a mechanical buckling collapse test database for fusion-welded aluminum plate structures, the results of a comparison of this database with the FSW procedures in terms of the trends and benefits associated with their buckling collapse strength characteristics and fabrication-related initial imperfections would be very useful in the design and construction of large ocean-going aluminum ship structures. 1.3 Requirements 1.3.1 Scope • Investigate FSW fabrication-related initial imperfections. • Perform buckling collapse tests on full-scale prototypes of 5000’s and 6000’s series
aluminum plate structures fabricated by FSW. • Perform non-linear elastic-plastic large deformation finite element method
computations on the test structures. • Perform comparisons between fusion welds and FSW in terms of their fabrication-
related initial imperfections and buckling collapse strength characteristics. 1.3.2 Tasks • Review the state-of-the-art of FSW technologies. • Design and fabricate aluminum stiffened plate structures for buckling collapse
testing. • Identify the chemical composition and mechanical properties of the materials used
for the test structures. • Measure the fabrication-related initial imperfections of these test structures and
compare them with the database of SSC-451 in terms of FSW versus fusion welds.
3
• Perform buckling collapse testing on the test structures under axial compressive conditions until and after the ultimate strength is reached.
• Perform nonlinear finite element method analyses to compute the ultimate strength behavior of the test structures and compare them with the experimental results.
• Discuss the trends and benefits associated with FSW and fusion welds in terms of their ultimate compressive strength performance.
1.4 Literature Survey
More than 210 articles and papers in the area of FSW technologies published or presented as of January 2009 have been collected, although most are not directly related to the aims and scope of the present project. Only one Ship Structure Committee (SSC) project has previously been undertaken in this area, which produced the SSC-447 report (Kramer 2007), but its focus was on fatigue strength performance.
The following provides a summary of the literature survey, with a focus on the aims and scope of the present project and related findings.
FSW technology was developed in 1991 by the Welding Institute in the U.K. (Thomas et al. 1991, 1995). FSW is a solid-state joining process that is particularly suitable for aluminum alloys that often face problems with fusion welds, such as cracks, porosity, distortion or softening. This technology has been recognized to have many advantages for the construction of aluminum structures, as it is a low-cost welding process. Aluminum alloys tend to show cracks and porosity after fusion welding, but FSW minimizes such problems because of the low input of total heat. The use of protective gases, e.g., for toxic shielding, may be unnecessary.
There have, of course, been useful studies that characterize the mechanical properties of FSW aluminum alloys (e.g., Rhodes et al. 1997, Hagstrom & Sandstrom 1998, Hashimoto et al. 1998, Mahoney et al. 1998, Biallas et al. 1999) and compare the properties of base and welded metals. A large number of studies on the strength performance of FSW aluminum structural details under fatigue conditions have also been undertaken (e.g., Kamioka & Okubo 2005, Kramer 2007).
The applications of FSW technologies for shipbuilding were studied by Thomas (1998) and Thomas et al. (2002, 2005), among others. Colligan (2004) presented FSW applications for ship design and construction, together with a discussion of the use of FSW technology in the United States, and indicated that it is capable of reducing construction costs and welding distortion and improving durability in comparison with fusion welding.
Peel et al. (2003) investigated the mechanical properties and residual stresses of a FSW aluminum 5083 test specimen, and concluded that these properties are governed by the thermal input rather than by the mechanical deformation caused by the FSW tool.
Several studies have also identified the residual stress characteristics in FSW aluminum structures. For example, Bang et al. (2002) predicted the residual stresses of FSW 6061 aluminum alloy using the thermal-elastic-plastic finite element method; Staron et al. (2004) measured the residual stresses in FSW aluminum 2024 sheets; and Fratini & Zuccarello (2006) presented an analysis of the through-thickness residual stresses in aluminum FSW butt joints.
Prime et al. (2006) measured the residual stresses in thick plates (25.4 mm thick)

4
of dissimilar aluminum alloys, 7050-T7451 and 2024-T351, that had been butt-joined by FSW. The maximum residual stress was found to be only 43 MPa, whereas the residual stress distribution was quite similar to that in fusion welds, thus indicating that the tensile residual stress develops in the heat-affected zone outside of the weld.
Khandkar et al. (2006) studied the residual stress of such FSW metals as aluminum 2024, aluminum 6061 and stainless steel 304L using a sequentially coupled finite element model with the FSW process. Murphy et al. (2007) performed a very similar study to the one presented here in terms of its aims and scope, including weld-induced initial imperfection measurements, buckling collapse testing and nonlinear finite element computations, although the purpose of their study was to examine aerospace structures made of aluminum 2024-T3 sheet with Z-section stiffeners of aluminum 7075-T76511 extrusions. They used the FSW method to construct three stiffened 332.70-mm × 575-mm panel test structures with 152.4 mm spacing for the three longitudinal stiffeners. The plate (skin) thickness was very thin (1.2 mm thick). Murphy et al. (2007) measured the initial distortions and residual stresses of these structures, as well as the breadth of the heat-affected zone. They carried out buckling collapse tests for the three stiffened panels and compared their experimental results with nonlinear finite element solutions.
Other researchers have investigated the effects of the process parameters on the residual stresses of FSW aluminum alloys (Lombard et al. 2009, Zhang & Zhang 2009a, 2009b), as well as the effects of the welding parameters on the mechanical properties of dissimilar aluminum alloy joints produced by FSW (Cavaliere et al. 2009). The rotating and forwarding speeds were considered as the parameters of influence in these studies.
As we have seen, a large number of studies that deal with micro-structural and fatigue issues in FSW aluminum structures have been undertaken. However, there is a lack of studies on the characterization of FSW-induced initial imperfections and the buckling collapse strength performance of aluminum structures for marine applications. Therefore, research and development are required to identify the characteristics of the ultimate strength performance of FSW aluminum structures. 1.5 Contents of the Report
This report comprises eight chapters and appendix. Chapter 1 addresses the aims and scope of the study together with a literature survey. Chapter 2 presents an outline of the FSW technology in terms of its advantages and limitations. Chapter 3 describes the design and construction of the test structures and documents the chemical composition and mechanical properties of the materials used for these structures, as well as the fabrication methods adopted. Chapter 4 presents the measurements of the weld-induced initial imperfections in the test structures, and a comparison is made between fusion welds and FSW in terms of these imperfections. Chapter 5 summarizes the results of the buckling collapse tests on the test structures, and Chapter 6 presents the nonlinear finite element method computations for these structures by a comparison with the experimental results. Chapter 7 discusses the benefits and trends associated with FSW and fusion welds in terms of their ultimate compressive strength performance, and finally Chapter 8 presents concluding remarks. Appendix presents the mechanical properties of aluminum alloys which experienced

5
buckling collapse. It is hoped and believed that the results of the present project will be very useful
in the design and construction of aluminum ship structures using FSW technologies in association with ULS-based approaches.

6
Chapter 2 Fusion Welds versus Friction Stir Welds for Aluminum Structures: An Overview
2.1 Classification of Welding Processes
Although a large number of methods for joining metals are available today, they may be classified into the following five basic categories (Masubuchi 1980).
• Fusion welding, e.g., gas metal arc welding (GMAW), gas tungsten arc welding (GTAW) • Electrical-resistance welding • Solid-phase welding, e.g., friction stir welding (FSW) • Liquid-solid phase joining • Adhesive bonding
In the fusion-welding process, the parts to be joined are heated until they melt
together, and pressure is not a requisite. Examples of fusion welding include gas welding, arc welding, electron-beam welding and laser welding. Fusion welds that use inert gases, such as gas metal arc welding (GMAW) or gas tungsten arc welding (GTAW), are often applied to join aluminum structures.
In the electrical-resistance welding process, heating is first involved via the passage of an electric current through the parts to be welded, followed by the application of pressure. Examples of electrical-resistance welding include spot welding, upset welding and percussion welding.
The solid-phase welding process is similar to that of electrical-resistance welding in terms of the application of pressure, but the metals to be joined are not melted, except for the very thin layers near the surfaces to be joined. Examples of solid-phase welding include friction welding, forge welding and pressure welding. In this regard, FSW can be considered a type of solid-phase welding.
In the liquid-solid phase joining process, the parts to be joined are heated to a temperature lower than their melting points, and a dissimilar molten metal is then added to form a solid joint upon cooling. Examples of liquid-solid phase joining include brazing and soldering.
Finally, the adhesive bonding process makes use of the molecular attraction exerted between the surface to be bonded and the adhesive. Examples of such bonding include animal and vegetable glues, cements, asphaltums and various plastics (e.g., epoxy).
It should be noted that the processes of the first three categories are termed ‘welding’, whereas those of the latter two are often termed ‘joining’. 2.2 Fusion Welds
Although various fusion-weld technologies are used in the fabrication of large-sized metal structures, inert gas-oriented fusion welds are today the most popular in the construction of aluminum structures.
Fusion-weld technology provides a cost-effective tool in terms of speed, accuracy and weld-joint performance in the fabrication of such structures. However, a number

7
of issues arise from the use of fusion welds in aluminum alloys for marine applications, such as 5000’s or 6000’s series alloys, including fabrication-related initial imperfections and a subsequent reduction in strength performance. Collette (2007) presented an excellent review of the impact of fusion welds in association with the ultimate strength performance of aluminum structures. Figure 2.1 presents a photo of the GMAW-based fusion-welding process.
Figure 2.1 Photo of GMAW-based fusion-welding process applied for building the
present test structures
2.3 Friction Stir Welds 2.3.1 Principles of the Process
FSW is a type of solid-phase welding, as noted in Section 2.1. This technology was developed by the Welding Institute in the U.K. in 1991.
Figure 2.2 illustrates a schematic of the FSW process. The metal plates to be joined are clamped onto a rigid backing body. This set-up is necessary to avoid any movement of the target plates during the welding process, such as movement in the longitudinal, transverse and lateral directions during pressing and plunging. The tip of the FSW tool, with a specially designed and profiled probe called a pin and shoulder, as shown in Figure 2.3, is rotated under sufficient downward force at high speed, and then moves slowly along the joint line.
The FSW process may be classified into the following five steps (see Figure 2.4).

8
• Step 1: Set-up the target plates to be joined, which are clamped onto a rigid
backing body. • Step 2: Equip the machine with the FSW tool (pin) and place it over the starting
point of the joint. • Step 3: Plunge the rotating FSW tool under sufficient downward force. • Step 4: After touchdown, heat and plasticize the local material at the starting point
of the joint. • Step 5: Move the FSW tool along the joint line, thus transporting the plasticized
material around the rotating pin. The pin size (e.g., diameter and length), shoulder width, and rotating and
forwarding speed of the FSW tool are chosen based on the properties of the target plates to be joined, such as plate thickness, material type and others. Figure 2.5 presents a photo of the FSW process.
Sufficient downward force to maintain registered contact
Joint
Leading edge of rotating tool
Pin
Retreating side of weld
Advancing side of weld
Shoulder
Trailing edge of rotating tool
Figure 2.2 Schematic of the FSW process (Thomas et al. 1991)

9
Figure 2.3 Pin and shoulder of the FSW tool (Thomas et al. 1991)
Figure 2.4 Steps of the FSW process (Thomas et al. 1991)

10
Figure 2.5 Photo of the FSW process applied for building the present test
structures 2.3.2 Advantages and Limitations
Compared to the fusion-welding process, that for FSW is considered to be more attractive, although there are some limitations to its application. Kramer (2007) summarized the advantages and limitations of friction stir welds, as discussed below.
The advantages of the FSW process primarily result from the fact that it works in the solid state at a low temperature that is below the melting point of the materials to be joined. This is in contrast to the fusion-welding process. Thus, the level of fabrication related-initial imperfections in structures built by FSW should subsequently be slight and/or less severe than those produced by fusion welds.
The limitations of FSW applications may include the following.
• The pins of the FSW tool are consumable, and their size (diameter and length) differs depending on the properties of the plates to be joined.
• The position of welding is limited due to the orientation of the FSW machine, including the tool. Fillet welding is not relevant because inclining the target plates and/or the FSW machine along the intersections to be joined between the plate and extrusion is not straightforward.
• Butt-joining is relevant, but there must be no obstacles around the FSW machine that can disturb the rotating and forwarding of the tool.
• Lap-joining is relevant, but the pin size must be carefully chosen. • A keyhole is formed at the end of each weld, as shown in Figure 2.6.

11
• The speed of FSW is usually slower than that of fusion welding. • A weld nugget may form at the center of the weld.
Figure 2.6 Keyhole at the end of the friction stir weld
The mechanical property and strength performance in the friction stir welded region is affected by various parameters such as width and depth of molten thin layer, molten temperature, rotating and forwarding speeds, and possible quick cooling, etc. The quality assurance of the friction stir welded region can be performed by non-destructive test (NDT) methods to find any defects.
2.3.3 The Softened Zone In contrast to fusion welding, in which three distinct regions, i.e., the base (parent
or unaffected) material, the weld metal region, and the heat-affected zone (HAZ), typically appear, FSW may produce more complicated micro-structural phenomena, thus exhibiting four regions; A - the unaffected material, B - the heat-affected zone (HAZ), C – the thermo-mechanically affected zone (TMAZ) and D – the weld nugget, as shown in Figure 2.7 (Kramer 2007).
The parent material region is unaffected by heat and/or mechanical deformation. The mechanical properties of this material are supposed to be the same as those of virgin material.
The HAZ of friction stir welds appear to be similar to fusion welds, but have lower peak temperatures. The material in this region undergoes a thermal process cycle during welding, and, subsequently, in the case of aluminum alloys, the mechanical properties of this material are usually softened by micro-structural phenomena in the HAZ, although plasticity may not take place.
The TMAZ typically appears together with plastic deformation in the region in which the FSW tool is plunged and rotated. The TMAZ is often further categorized into two sub-zones, namely, the plastically deformed zone without recrystallization and

12
the recrystallized (weld-nugget) zone. In the case of aluminum alloys, the mechanical properties of material in the TMAZ may differ from those in the HAZ as well as those of the base material.
For the sake of convenience when evaluating ultimate strength performance, however, both the HAZ and TMAZ are often dealt with as a whole in the form of the softened zone, but with the breadth of this zone being equivalent to approximately two times the width of the FSW tool shoulder.
BA C D C B A
A: Unaffected material B: Heat-affected zone (HAZ)
C: Thermo-mechanically affected zone (TMAZ) D: Weld nugget (Part of thermo-mechanically affected zone)
Figure 2.7 Schematic of the TMAZ and HAZ associated with FSW (Kramer 2007)

13
Chapter 3 Design and Construction of Aluminum Stiffened Plate Structures for Buckling Collapse Testing
3.1 Selection of Materials 3.1.1 Combinations for Plate and Extrusions
Although 5000’s and 6000’s series aluminum alloys are typically appropriate for marine applications, the plate part is usually fabricated from 5000’s series alloys and the extrusions from 5000’s or 6000’s series alloys.
Considering this trend and the limitations of material procurement, the following combinations of aluminum alloys for the plate and extrusions were chosen for the present study.
• 5083-H112 alloy for the plate and 6082-T6 alloy for the extrusions • 5083-H112 alloy for the plate and 5083-H112 alloy for the extrusions • 5383-H116 alloy for the plate and 5083-H112 alloy for the extrusions
The SSC-451 database (Paik et al. 2008b) is used in the comparison stage for fusion
welds versus friction stir welds in conjunction with ultimate strength performance. The material combinations for the test structures in SSC-451 are as follows.
• 5083-H116 alloy for the plate and 5383-H112 alloy for the extrusions • 5083-H116 alloy for the plate and 6082-T6 alloy for the extrusions • 5383-H116 alloy for the plate and 5383-H112 alloy for the extrusions The manufacturers (of suppliers) of the aluminum alloys procured for the present
study and the year of their production are as follows. • 5083-H112 alloy for the plate – Alcoa Korea, 2008 • 5083-H112 alloy for the extrusions – Alcoa Korea, 2008 • 5083-H116 alloy for the plate – Alcan France, 2006 • 5383-H112 alloy for the extrusions – Alcan France, 2006 • 5383-H116 alloy for the plate – Alcan France, 2006 • 6082-T6 alloy for the extrusions – Alcoa Korea, 2008
3.1.2 Chemical Composition Table 3.1 lists the chemical composition of all of the alloys investigated in the
present study, which is equivalent to that of the typical aluminum alloys used in marine applications. It should be noted that the chemical composition of rolled plates differs from that of extrusions.
3.1.3 Mechanical Properties 3.1.3(a) Base Material
Tensile coupon tests were carried out to identify the mechanical properties of the base material and the material in the welded parts. Figure 3.1 shows the dimensions

14
of the tensile coupon test specimen in conjunction with the American Society for Testing and Materials (ASTM) standards.
Three types of specimens with plate thicknesses of 6 mm were cut out of the plate part, namely, in the longitudinal (rolled), transverse and diagonal directions, whereas only one type of specimen with a plate thickness of 4 mm or 6 mm was taken from the extrusions in the length direction.
Table 3.1 Chemical composition (wt. %) of aluminum alloys used in the present
study
Alloy & Temper Si (%) Fe (%) Cu (%) Mn (%) Mg (%) Cr (%) Zn (%) Ti (%) Zr (%)
5083-H112 (R)1) 0.12 0.29 0.014 0.65 4.55 0.088 0.006 0.031 0.0
5083-H112 (E)1) 0.14 0.12 0.010 0.64 4.56 0.080 0.010 0.030 0.0
5083-H116 (R)2) Max. 0.40
Max. 0.40
Max. 0.10
0.4 ~1.0
4.0 ~4.9
0.05 ~0.25
Max. 0.25
Max. 0.15 0.0
5383-H112 (E)2) Max. 0.25
Max. 0.25
Max. 0.20
0.7 ~1.0
4.0 ~5.2
Max. 0.25
Max. 0.40
Max. 0.15
Max. 0.20
5383-H116 (R)1) 0.091 0.24 0.077 0.82 4.97 0.088 0.11 0.011 0.002
Al6082-T6 (E)1) 1.22 0.22 0.07 0.69 1.05 0.19 0.01 0.03 0.0
Note: 1)Tested by Alcoa Korea, 2)Provided by Alcan France, (E) = extruded, (R) = rolled.
L-specimen
T-specimen
D-specimen
L-specimen
T-specimen
D-specimen
R12.5
mm
50 mm
200 mm
12.5 mm 20 mm
R12.5
mm
50 mm
200 mm
12.5 mm 20 mm
Figure 3.1(a) Specimen of tensile coupon tests for the mechanical property
characterization of the base material – rolled plate part
R12.5
mm
50 mm
200 mm
12.5 mm 20 mm
R12.5
mm
50 mm
200 mm
12.5 mm 20 mm
Figure 3.1(b) Specimen of tensile coupon tests for the mechanical property
characterization of the base material – extruded web part

15
Figure 3.1(c) Photos of sample tensile coupon test specimens
It should be noted that the mechanical properties of rolled alloys may differ from
those of extruded alloys because their production process is different. Therefore, the specimens corresponding to the plate part and extrusions need to be prepared for testing. For the latter, only the material in the web part was tested in the present study.
Figure 3.2 shows the relationships between the engineering stress and the engineering strain, as obtained from the tensile coupon tests, where some materials were tested with multiple test specimens cut out in the same direction.
Table 3.2 provides a summary of the mechanical properties of the base materials, which were also obtained from these tests. Table 3.3 lists the minimum requirements of the mechanical properties of the base materials, as specified by the classification societies (ABS 2006, LR 2008).
0 0.05 0.1 0.15 0.2 0.25 0.3 0.35Strain
0
50
100
150
200
250
300
350
Stre
ss (M
Pa)
Rolled Plate 5083-H112
① L-type② T-type③ D-type
Properties in material ①E = 69420 N/mm2
σY = 164 N/mm2
σT = 310 N/mm2
εf = 32.28 %
Properties in material ②E = 70700 N/mm2
σY = 167 N/mm2
σT = 308 N/mm2
εf = 33.59 %
Properties in material ③E = 69434 N/mm2
σY = 162 N/mm2
σT = 305 N/mm2
εf = 33.40 %
Figure 3.2(a) The stress versus strain curves for the aluminum base material -
5083-H112 (rolled) - obtained from the tensile coupon tests

16
0 0.05 0.1 0.15 0.2 0.25Strain
0
50
100
150
200
250
300St
ress
(MPa
)
Extruded Web 5083-H112 (t=6mm)
①
②
Properties in material ①E = 70231 N/mm2
σY = 132 N/mm2
σT = 258 N/mm2
εf = 23.58 %
Properties in material ②E = 70149 N/mm2
σY = 148 N/mm2
σT = 271 N/mm2
εf = 19.98 %
Figure 3.2(b) The stress versus strain curves for the aluminum base material –
5083-H112 (extruded) – obtained from the tensile coupon tests
0 0.05 0.1 0.15 0.2 0.25Strain
0
50
100
150
200
250
300
350
400
Stre
ss (M
Pa)
Rolled Plate 5083-H116
T-type
Properties in material E = 73129 N/mm2
σY = 239 N/mm2
σT = 353 N/mm2
εf = 21.4 %
Figure 3.2(c) The stress versus strain curves for the aluminum base material –
5083-H116 (rolled) – obtained from the tensile coupon tests
17
0 0.04 0.08 0.12 0.16 0.2Strain
0
50
100
150
200
250
300St
ress
(MPa
)Extruded Web 5383-H112 (t=6mm)
①
②
Properties in material ①E = 69911 N/mm2
σY = 159 N/mm2
σT = 282 N/mm2
εf = 18.37 %
Properties in material ②E = 70149 N/mm2
σY = 148 N/mm2
σT = 282 N/mm2
εf = 18.85 %
Figure 3.2(d) The stress versus strain curves for the aluminum base material –
5383-H112 (extruded) – obtained from the tensile coupon tests
0 0.05 0.1 0.15 0.2 0.25 0.3Strain
0
50
100
150
200
250
300
350
400
Stre
ss (M
Pa)
Rolled Plate 5383-H116
① L-type 1② L-type 2③ T-type
Properties in material ①E = 70751 N/mm2
σY = 194 N/mm2
σT = 348 N/mm2
εf = 26.72 %
Properties in material ②E = 70427 N/mm2
σY = 193 N/mm2
σT = 326 N/mm2
εf = 24.73 %
Properties in material ③E = 69887 N/mm2
σY = 215 N/mm2
σT = 352 N/mm2
εf = 25.64 %
Figure 3.2(e) The stress versus strain curves for the aluminum base material –
5383-H116 (rolled) - obtained from the tensile coupon tests

18
0 0.04 0.08 0.12 0.16Strain
0
50
100
150
200
250
300
350
400
Stre
ss (M
Pa)
Extruded Web 6082-T6
① t=6mm② t=4mm
Properties in material ①E = 68723 N/mm2
σY = 342.93 N/mm2
σT = 359 N/mm2
εf = 12.93 %
Properties in material ②E = 68359 N/mm2
σY = 304 N/mm2
σT = 306 N/mm2
εf = 11.53 %
Figure 3.2(f) The stress versus strain curves for the aluminum base material –
6082-T6 (extruded) - obtained from the tensile coupon tests

19
Table 3.2 Summary of the mechanical properties of the aluminum alloys (base material), obtained from the tensile coupon tests
Material Specimen E (N/mm2)
Yσ (N/mm2)
Tσ (N/mm2)
Elongation (%)
L-type 69420 164 310 32.28
T-type 70700 167 308 33.59 5083-H112 (R) (t = 6mm)
D-type 69434 162 305 33.40
Average 69856.8 167.2 307.67 33.09
L-type 1 70231 132 258 23.58 5083-H112 (E)
(t = 6mm) L-type 2 70149 148 271 19.98
Average 70190 140 264.5 21.78
5083-H116 (R) (t = 6mm) T-type 73129 239 353 21.4
L-type 1 69911 159 282 18.37 5383-H112 (E) (t = 6mm)
L-type 2 70149 148 282 18.85
Average 70030 153.5 282 18.61
L-type 1 70751 194 348 26.72
L-type 2 70427 193 326 24.73 5383-H116 (R) (t = 6mm)
T-type 69887 215 352 25.64
Average 70355.3 207.9 342 25.85
6082-T6 (E) (t = 4mm) L-type 68359 304 306 11.53
6082-T6 (E) (t = 6mm) L-type 68723 343 359 12.93
Note: (R) = rolled; (E) = extruded; E = elastic modulus; Yσ = yield strength; Tσ = ultimate tensile strength; L-type = Longitudinal; T-Type = Transverse; D-type = Diagonal.

20
Table 3.3 Minimum requirements for the mechanical properties of aluminum alloys - base material (ABS 2006, LR 2008)
Material Thickness (mm)
Yσ (N/mm2)
Tσ (N/mm2)
Elongation in 50 mm
6.5-38.0 124.5 275.4 12 5083-H112 (R)
38.1-76.5 117.6 268.5 12
5083-H112 (E) - 109.8 268.5 12
1.6-38.0 213.6 302.8 10 5083-H116 (R)
38.1-76.5 199.9 282.2 10
1.6-38.0 213.6 302.8 10 5083-H321 (R)
38.1-76.5 199.9 282.8 10
5383-H111 (R) 3.0-5.0 142.1 284.2 17
5383-H111 (E) - 145.0 290.1 17
5383-H112 (E) - 190.1 309.7 13
5383-H116 (R) 3.0-5.0 215.6 298.9 10
5383-H321 (R) 3.0-5.0 215.6 298.9 10
Note: (R) = rolled; (E) = extruded; E = elastic modulus; Yσ = yield strength; Tσ = ultimate tensile strength.
3.1.3(b) Welded Material
To characterize the mechanical properties of the welded aluminum alloys, butt-joined specimens with a plate thickness of 6 mm were prepared via both the fusion-welding and friction stir welding (FSW) processes, as shown in Figure 3.3. The condition of each weld is as follows.
• Fusion weld: Filler metal – 5183 aluminum alloy, diameter of filler wire – 1.2 mm,
shield gas – 100% Ar. inert gas, welding speed – 450 mm/min, electricity – 183 A and 21 V, torch angle – 50 degrees, welding progress angle – 80 degrees.
• Friction stir weld: Rotating speed of FSW tool – 1500 RPM, forwarding speed of FSW tool – 4 mm/s, weld temperature – approximately 370ºC, FSW tool size – d1 = 4mm, d2 = 5 mm, d3 = 15 mm, h = 5.4mm, with the nomenclature in Figure 3.4.
The tensile coupon test specimens for the butt-welds were prepared for the combination of dissimilar alloys as well as for the identical alloys as follows.
• 5083-H112 + 5083-H112

21
• 5383-H116 + 5383-H116 • 5083-H112 + 5383-H116
Figure 3.5 shows the stress versus strain curves of the butt-welded aluminum alloys,
as obtained from the tensile coupon tests. Multiple test specimens with the same weld condition were prepared. It is observed that a somewhat significant deviation exists in elongation of friction stir-welded region. A comparison of these curves for welded aluminum alloys fabricated by fusion welding and by FSW is also shown in this figure. It is found that the mechanical properties of aluminum material fabricated by friction stir welding are equivalent to or can be better than those by fusion welding.
Table 3.4 summarizes the mechanical properties of the butt-welded aluminum alloys, as obtained from the tensile coupon tests. Table 3.5 presents the minimum yield strength requirements for fusion-welded aluminum alloys, which are similar to those of the present study.
It is noted that the tensile coupon tests were performed for butt welds only in the present study, and thus further study is needed to verify the tensile properties of the friction stir lap-welded material. A microscopic examination of the friction stir lap-welded material is recommended to find any defects associated with the width and depth of the molten metal thin layer which potentially cause delamination in pre- or post-collapse range of the structure under compressive actions involving buckling or crushing.
R12.5
mm
50 mm
200 mm
12.5 mm 20 mm
R12.5
mm
50 mm
200 mm
12.5 mm 20 mm
Figure 3.3 Specimen of tensile coupon tests for the mechanical property
characterization of the welded material
Figure 3.4 Nomenclature for FSW tool size
d2
d3
d1
hPin
d2
d3
d1
hPin
d3d3

22
0 0.05 0.1 0.15 0.2 0.25 0.3 0.35Strain
0
50
100
150
200
250
300
350
Stre
ss (M
Pa)
Properties in material ①E = 69856.8 N/mm2
σY = 167.2 N/mm2
σT = 307.67 N/mm2
εf = 33.09 %
Properties in material ②E = 71684.5 N/mm2
σY = 124.7 N/mm2
σT = 176.4 N/mm2
εf = 2.86 %
Properties in material ③E = 68752.9 N/mm2
σY = 135.4 N/mm2
σT = 190.8 N/mm2
εf = 3.46 %
① Base metal (5083-H112)② Butt-welded (GMAW-N1)③ Butt-welded (GMAW-N2)
Butt-welded between 5083-H112 and 5083-H112
Figure 3.5(a) The stress versus strain curves for fusion-welded aluminum material
– 5083-H112 plus 5083-H112 – obtained from the present tensile coupon tests
0 0.05 0.1 0.15 0.2 0.25 0.3 0.35Strain
0
50
100
150
200
250
300
350
Stre
ss (M
Pa)
① Base metal (5083-H112)② Butt-welded (FSW-N1)③ Butt-welded (FSW-N2)
Properties in material ①E = 69856.8 N/mm2
σY = 167.2 N/mm2
σT = 307.67 N/mm2
εf = 33.09 %
Properties in material ②E = 69178.3 N/mm2
σY = 137.0 N/mm2
σT = 236.3 N/mm2
εf = 6.58 %
Properties in material ③E = 70699.5 N/mm2
σY = 134.3 N/mm2
σT = 262.8 N/mm2
εf = 12.32 %
Butt-welded between 5083-H112 and 5083-H112
Figure 3.5(b) The stress versus strain curves for FSW aluminum material – 5083-
H112 plus 5083-H112 – obtained from the present tensile coupon tests

23
0 0.05 0.1 0.15 0.2 0.25 0.3 0.35Strain
0
50
100
150
200
250
300
350St
ress
(MP a
)
Properties in material ①E = 69856.8 N/mm2
σY = 167.2 N/mm2
σT = 307.67 N/mm2
εf = 33.09 %
Properties in material ②E = 70355.3 N/mm2
σY = 207.9 N/mm2
σT = 342.0 N/mm2
εf = 25.85 %
Properties in material ③E = 70733.2 N/mm2
σY = 123.8 N/mm2
σT = 224.4 N/mm2
εf = 5.73 %
Properties in material ④E = 70468.6 N/mm2
σY = 125.4 N/mm2
σT = 204.0 N/mm2
εf = 3.99 %
① Base metal (5083-H112)② Base metal (5383-H116)③ Butt-welded (GMAW-N1)④ Butt-welded (GMAW-N2)
Butt-welded between 5083-H112 and 5383-H116
Figure 3.5(c) The stress versus strain curves for fusion welded aluminum material
– 5083-H112 plus 5383-H116 – obtained from the tensile coupon tests
0 0.05 0.1 0.15 0.2 0.25 0.3 0.35Strain
0
50
100
150
200
250
300
350
Stre
ss (M
Pa) ① Base metal (5383-H116)
② Base metal (5083-H112)③ Butt-welded (FSW-N1)④ Butt-welded (FSW-N2)
Properties in material ③E = 70130.8 N/mm2
σY = 136.8 N/mm2
σT = 271.0 N/mm2
εf = 14.44 %
Properties in material ②E = 69856.8 N/mm2
σY = 167.2 N/mm2
σT = 307.67 N/mm2
εf = 33.09 %
Properties in material ①E = 70355.3 N/mm2
σY = 207.9 N/mm2
σT = 342.0 N/mm2
εf = 25.85 %
Properties in material ④E = 70021.7 N/mm2
σY = 136.5 N/mm2
σT = 269.2 N/mm2
εf = 13.13 %
Butt-welded between 5083-H112 and 5383-H116
Figure 3.5(d) The stress versus strain curves for FSW aluminum material – 5083-
H112 plus 5383-H116 – obtained from the tensile coupon tests

24
0 0.05 0.1 0.15 0.2 0.25 0.3Strain
0
50
100
150
200
250
300
350St
ress
(MPa
)
Properties in material ①E = 70355.3 N/mm2
σY = 207.9 N/mm2
σT = 342.0 N/mm2
εf = 25.85 %
Properties in material ②E = 68175.1 N/mm2
σY = 127.5 N/mm2
σT = 232.0 N/mm2
εf = 6.19 %
Properties in material ③E = 68150.2 N/mm2
σY = 133.6 N/mm2
σT = 246.8 N/mm2
εf = 8.17 %
① Base metal (5383-H116)② Butt-welded (GMAW-N1)③ Butt-welded (GMAW-N2)
Butt-welded between 5383-H116 and 5383-H116
Figure 3.5(e) The stress versus strain curves for fusion-welded aluminum material
– 5383-H116 plus 5383-H116 – obtained from the present tensile coupon tests
0 0.05 0.1 0.15 0.2 0.25 0.3Strain
0
50
100
150
200
250
300
350
Stre
ss (M
Pa)
Properties in material ①E = 70355.3 N/mm2
σY = 207.9 N/mm2
σT = 342.0 N/mm2
εf = 25.85 %
Properties in material ②E = 69809.9 N/mm2
σY = 147.3 N/mm2
σT = 284.8 N/mm2
εf = 10.15 %
Properties in material ③E = 70081.2 N/mm2
σY = 147.9 N/mm2
σT = 239.4 N/mm2
εf = 4.85 %
① Base metal (5383-H116)② Butt-welded (FSW-N1)③ Butt-welded (FSW-N2)
Butt-welded between 5383-H116 and 5383-H116
Figure 3.5(f) The stress versus strain curves for FSW aluminum material – 5383-
H116 plus 5383-H116 – obtained from the present tensile coupon tests

25
0 0.05 0.1 0.15 0.2 0.25 0.3 0.35Strain
0
50
100
150
200
250
300
350
Stre
ss (M
Pa)
Butt-welded between 5083-H112 and 5083-H112
Base metal (5083-H112)Butt-welded (FSW-N1)Butt-welded (FSW-N2)Butt-welded (GMAW-N1)Butt-welded (GMAW-N2)
0 0.05 0.1 0.15 0.2 0.25 0.3 0.35Strain
0
50
100
150
200
250
300
350
Stre
ss (M
Pa)
Butt-welded between 5083-H112 and 5083-H112
Base metal (5083-H112)Butt-welded (FSW-N1)Butt-welded (FSW-N2)Butt-welded (GMAW-N1)Butt-welded (GMAW-N2)
Figure 3.5(g) Comparison of the stress versus strain curves for welded aluminum
material fabricated by fusion welding and FSW – 5083-H112 plus 5083-H112 – obtained from the tensile coupon tests
0 0.05 0.1 0.15 0.2 0.25 0.3Strain
0
50
100
150
200
250
300
350
400
Stre
ss (M
Pa)
Base metal (5383-H116)Butt-welded (FSW-N1)Butt-welded (FSW-N2)Butt-welded (GMAW-N1)Butt-welded (GMAW-N2)
Butt-welded between 5383-H116 and 5383-H116
0 0.05 0.1 0.15 0.2 0.25 0.3Strain
0
50
100
150
200
250
300
350
400
Stre
ss (M
Pa)
Base metal (5383-H116)Butt-welded (FSW-N1)Butt-welded (FSW-N2)Butt-welded (GMAW-N1)Butt-welded (GMAW-N2)
Butt-welded between 5383-H116 and 5383-H116
Figure 3.5(h) Comparison of the stress versus strain curves for welded aluminum
material fabricated by fusion welding and FSW – 5383-H116 plus 5383-H116 – obtained from the tensile coupon tests

26
0 0.05 0.1 0.15 0.2 0.25 0.3 0.35Strain
0
50
100
150
200
250
300
350
400St
ress
(MPa
)
Base metal (5083-H112)Base metal (5383-H116)Butt-welded (FSW-N1)Butt-welded (FSW-N2)Butt-welded (GMAW-N1)Butt-welded (GMAW-N2)
Butt-welded between 5083-H112 and 5383-H116
0 0.05 0.1 0.15 0.2 0.25 0.3 0.35Strain
0
50
100
150
200
250
300
350
400St
ress
(MPa
)
Base metal (5083-H112)Base metal (5383-H116)Butt-welded (FSW-N1)Butt-welded (FSW-N2)Butt-welded (GMAW-N1)Butt-welded (GMAW-N2)
Butt-welded between 5083-H112 and 5383-H116
Figure 3.5(i) Comparison of the stress versus strain curves for welded aluminum
material fabricated by fusion welding and FSW – 5083-H112 plus 5383-H116 – obtained from the tensile coupon tests

27
Table 3.4 Summary of the mechanical properties of welded aluminum alloys, obtained from the tensile coupon tests
Material Weld specimen
E (N/mm2)
Yσ (N/mm2)
Tσ (N/mm2)
Elongation (%)
GMAW 1 71685 125 176 2.86 5083-H112 +
5083-H112 GMAW 2 68753 135 191 3.46
Average 70219 130 183.5 3.16
FSW 1 69178 137 236 6.58 5083-H112 +
5083-H112 FSW 2 70699 134 263 12.32
Average 69938.5 135.5 249.5 9.45
GMAW 1 70733 124 224 5.73 5083-H112 +
5383-H116 GMAW 2 70469 125 204 3.99
Average 70601 124.5 214 4.86
FSW 1 70131 137 271 14.44 5083-H112 +
5383-H116 FSW 2 70022 137 269 13.13
Average 70076.5 137 270 13.79
GMAW 1 68175 128 232 6.19 5383-H116 +
5383-H116 GMAW 2 68150 134 247 8.17
Average 68162.5 131 239.5 7.18
FSW 1 69810 147 285 10.15 5383-H116 +
5383-H116 FSW 2 70081 148 239 4.85
Average 69945.5 147.5 262 7.5
Note: E = elastic modulus; Yσ = yield strength; Tσ = ultimate tensile strength.

28
Table 3.5 Minimum yield strength requirements for fusion-welded aluminum alloys, as specified by various regulations (MPa)
Alloy ABS (2008) DNV (2008) AA (2005) AWS (2004) Alcan (2004)
5083-H111(E) 145 - 110 145 -
5083-H116(R) 165 116 115 165 125
5383-H111(E) 145 - - - 145
5383-H116(R) 145 140 - - 145
Note: (E) = extruded; (R) = rolled; ABS = American Bureau of Shipping; DNV = Det Norske Veritas (Yield strength 1σ is determined from the values of 1f published by the equation
1.1/2401f1 ×=σ ); AA = Aluminum Association; AWS = American Welding Society. 3.2 Structural Dimensions and Profiles 3.2.1 Panel Dimensions
The principal dimensions of the test structures used in the present project were basically the same as those in SSC-451, although some small differences arose because of the different fabrication methods. Figure 3.6 shows a schematic of the dimensions of the test structures with the relevant nomenclature. The panel had a total of four longitudinal stiffeners or extrusions, and the transverse frame was attached at each end of the panel to be used for clamping with the test facility before the buckling collapse testing.
Tables 3.6(a) and 3.6(b) list the details of the principal dimensions of the structures tested in the present study and those in SSC-451, respectively. Twelve models, from a total of 78 test structures, were chosen from SSC-451. These are equivalent to those used in the present study in terms of structural dimensions and material properties, although they were fabricated by fusion welding.

29
B a
bs
bs
b
b
b
B
a
b
b
b
bs
bs
B
a
b
b
b
bs
bs
Figure 3.6 Nomenclature of the structural dimensions

30
Table 3.6(a) Details of the principal dimensions of the test structures used in the present study
Plate Extrusion
Model a
(mm) b
(mm) bs
(mm) t
(mm) Material Stiffener type Material
19A 1200 300 50 6 5383-H116 ST-3 (35504-Type A) 5083-H112
20A 1200 300 50 6 5383-H116 ST-4 (35579-Type A) 5083-H112
17D 1200 300 50 6 5083-H112 ST-5 (35529-Type D) 6082-T6
18D 1200 300 50 6 5083-H112 ST-6 (35548-Type D) 6082-T6
19D1 1200 300 50 6 5083-H112 ST-7 (35504-Type D) 6082-T6
19D2 1200 300 50 6 5383-H116 ST-7 (35504-Type D) 5083-H112
20D1 1200 300 50 6 5083-H112 ST-8 (35579-Type D) 6082-T6
20D2 1200 300 50 6 5383-H116 ST-8 (35579-Type D) 5083-H112
19C 1200 300 40 6 5083-H112 ST-9 (35504-Type C) 5083-H112
20C 1200 300 30 6 5383-H116 ST-10 (35579-Type C) 5083-H112

31
Table 3.6(b) Details of the principal dimensions of the test structures in SSC-451
Plate Extrusion Model a
(mm) b
(mm) bs
(mm) t
(mm) Material Stiffener type Material
5 1200 300 50 6 5083-H116 ST-1 (35529-Type A) 5383-H112
6 1200 300 50 6 5083-H116 ST-2 (35548-TypeA) 5383-H112
7 1200 300 50 6 5083-H116 ST-3 (35504-Type A) 5383-H112
8 1200 300 50 6 5083-H116 ST-4 (35579-Type A) 5383-H112
17 1200 300 50 6 5083-H116 ST-1 (35529-Type A) 6082-T6
18 1200 300 50 6 5083-H116 ST-2 (35548-TypeA) 6082-T6
19 1200 300 50 6 5083-H116 ST-3 (35504-Type A) 6082-T6
20 1200 300 50 6 5083-H116 ST-4 (35579-Type A) 6082-T6
29 1200 300 50 6 5383-H116 ST-1 (35529-Type A) 5383-H112
30 1200 300 50 6 5383-H116 ST-2 (35548-TypeA) 5383-H112
31 1200 300 50 6 5383-H116 ST-3 (35504-Type A) 5383-H112
32 1200 300 50 6 5383-H116 ST-4 (35579-Type A) 5383-H112
3.2.2 Sectional Profiles and Properties of the Extrusions
The shapes and detailed dimensions of the extrusions in the test stiffened plate structures are indicated in Figure 3.7. A total of 10 different extrusion types were applied for the test structures in the present study and/or in SSC-451. Table 3.6 includes information on the extruded shapes for each of these structures. The cross-sectional properties of the extrusions and the plate panels for the present test structures and the SSC-451 test structures are indicated in Tables 3.7 and 3.8, respectively.
Tables 3.7(a) and 3.8(b) indicate the neutral axis measured from the outer surface of the plate (η ) and the moment of inertia (I) calculated for a representative plate-stiffener combination, i.e., a single stiffener with attached plating. These parameters are involved in calculating the column slenderness ratio ( λ ) which is a primary parameter of the ultimate strength design formula for the entire stiffened plate

32
structure. For the purpose of the comparison, Tables 3.7(b) and 3.8(b) give exact solutions of
the sectional properties such as the neutral axis ( η), the moment of inertia (I), and the column slenderness ratio (λ ) calculated for the entire stiffened panel section. It is found that the column slenderness ratio value calculated for the representative plate-stiffener combination model is sufficiently accurate.
In addition, it is noted that the related properties of the extrusions are exact solutions determined for actual cross sections with a non-uniform or varying wall thickness, instead of idealized sections that consist of a uniformly approximated wall thickness. The ratios of the plate and column slenderness for each of the test structures were computed from the following equations.
Yeq1bt E
σβ = , Yeq2a
r Eσ
λ = , and t
IrA
= ,
where 1Yeqσ = the equivalent yield strength of the plate part =
( ) ( )Yp p Ys ep p epA A / A Aσ + σ + ; 2Yeqσ = the equivalent yield strength of the entire
cross section, including the plate and extrusions = ( ) tA/sAYspAYp σ+σ ; Ypσ = the
yield strength of the plate sheet; Ysσ = the yield strength of the extrusions; E = the elastic modulus; b = plate breadth = stiffener spacing; t = plate thickness; a = the plate length between the transverse frames; pA = the total cross-sectional area of
the plate part in the sheet; epA = the total cross-sectional area of the plate part in
the extrusions; esA = the total cross-sectional area of the stiffener part in the extrusions; sA = the total cross-sectional area of the extrusions = esAepA + ; and tA
= the total cross-sectional area of the entire plate panel = sApA + .
ST-135529-Type A
60mm
3.7mm
7mm
40mm
4.34mm
Figure 3.7 Cross-sectional profiles of the extrusions

33
ST-235548-Type A
70mm
4mm
40mm3.9mm 7mm
ST-335504-Type A
45mm
80mm
4mm
6mm
6mm
8mm
3.19mm
Figure 3.7 (Continued) Cross-sectional profiles of the extrusions

34
ST-435579-Type A
55mm
6mm
9mm
10mm
12mm
140mm
5.03mm
ST-535529-Type D
60mm
3.7mm
40mm
25mm
15mm
7mm4.34mm
Figure 3.7 (Continued) Cross-sectional profiles of the extrusions

35
ST-635548-Type D
25mm
15mm
70mm
4mm
40mm3.9mm 7mm
ST-735504-Type D
45mm
80mm
4mm
25mm
15mm
6mm3.19mm
Figure 3.7 (Continued) Cross-sectional profiles of the extrusions

36
ST-835579-Type D
25mm
15mm
55mm
6mm
140mm
9mm5.03mm
ST-935504-Type C
45mm
80mm
4mm
6mm
40mm 40mm
6mm3.19mm
Figure 3.7 (Continued) Cross-sectional profiles of the extrusions

37
ST-1035579-Type C
55mm
6mm
9mm
140mm
30mm30mm
6mm
5.03mm
Figure 3.7 (Continued) Cross-sectional profiles of the extrusions

38
Table 3.7(a) Details of the cross-sectional properties for a single stiffener with attached plating of the present test structures
Model Ypσ
(MPa) Ysσ
(MPa) 1Yeqσ
(MPa) 2Yeqσ
(MPa) pA
(mm2) epA
(mm2) esA
(mm2) sA
(mm2) tA
(mm2) η
(mm) I
(cm4) β λ
19A 207.90 167.20 207.90 197.76 1800 0 597.42 597.42 2397.42 17.37 190.03 2.72 0.72
20A 207.90 167.20 207.90 190.57 1800 0 1334.21 1334.21 3134.21 42.21 944.56 2.72 0.36
17D 167.20 304.20 167.20 210.33 1800 0 826.95 826.95 2626.95 13.37 104.09 2.46 1.06
18D 167.20 304.20 167.20 210.16 1800 0 822.32 822.32 2622.32 14.31 131.96 2.46 0.94
19D1 167.20 304.20 167.20 212.79 1800 0 897.71 897.71 2697.71 16.97 190.95 2.46 0.80
19D2 207.90 167.20 207.90 194.36 1800 0 897.71 897.71 2697.71 16.97 190.95 2.72 0.76
20D1 167.20 342.90 167.20 249.15 1800 0 1573.61 1573.61 3373.61 40.29 965.78 2.46 0.43
20D2 207.90 167.20 207.90 188.92 1800 0 1573.61 1573.61 3373.61 40.29 965.78 2.72 0.37
19C 167.20 167.20 167.20 167.20 1320 480 582.71 1062.71 2382.71 17.42 189.95 2.45 0.66
20C 207.90 167.20 197.73 186.19 1440 360 1286.21 1646.21 3086.21 42.68 940.92 2.66 0.36
Table 3.7(b) Details of the cross-sectional properties for the entire stiffened panel cross section of the present test structures
Model Ypσ
(MPa) Ysσ
(MPa) 1Yeqσ
(MPa) 2Yeqσ
(MPa) pA
(mm2) epA
(mm2) esA
(mm2) sA
(mm2) tA
(mm2) η (mm)
I (cm4)
β λ
19A 207.90 167.20 207.90 196.31 6000 0 2389.68 2389.68 8389.68 19.43 731.40 2.72 0.68
20A 207.90 167.20 207.90 188.74 6000 0 5336.84 5336.84 11336.84 46.36 3576.80 2.72 0.35
17D 167.20 304.20 167.20 215.89 6000 0 3307.82 3307.82 9307.82 14.71 401.44 2.46 1.03
18D 167.20 304.20 167.20 215.71 6000 0 3289.26 3289.26 9289.26 15.77 510.16 2.46 0.91
19D1 167.20 304.20 167.20 218.49 6000 0 3590.83 3590.83 9590.83 18.72 737.10 2.46 0.77
19D2 207.90 167.20 207.90 192.66 6000 0 3590.83 3590.83 9590.83 18.72 737.10 2.72 0.72
20D1 167.20 342.90 167.20 257.15 6000 0 6294.45 6294.45 12294.45 43.93 3679.65 2.46 0.43
20D2 207.90 167.20 207.90 187.06 6000 0 6294.45 6294.45 12294.45 43.93 3679.65 2.72 0.36
19C 167.20 167.20 167.20 167.20 3960 1919.83 3591 5510.83 9470.83 19.75 727.43 2.45 0.67
20C 207.90 167.20 197.73 183.32 4320 1439.84 5145 6584.84 10904.84 47.92 3506.62 2.66 0.34

39
Table 3.8(a) Details of the cross-sectional properties for a single stiffener with attached plating of the SSC-451 test structures
Model Ypσ
(MPa) Ysσ
(MPa) 1Yeqσ
(MPa) 2Yeqσ
(MPa) pA
(mm2) epA
(mm2) esA
(mm2) sA
(mm2) tA
(mm2) η
(mm) I
(cm4) β λ
5 238.93 196.60 238.93 229.65 1800 0 505.74 505.74 2305.74 13.35 103.48 2.86 1.02
6 238.93 196.60 238.93 229.65 1800 0 505.60 505.60 2305.60 14.41 131.34 2.86 0.91
7 238.93 196.60 238.93 228.38 1800 0 597.42 597.42 2397.42 17.37 190.03 2.86 0.77
8 238.93 196.60 238.93 220.91 1800 0 1334.21 1334.21 3134.21 42.21 944.56 2.86 0.39
17 238.93 304.20 238.93 253.25 1800 0 505.74 505.74 2305.74 13.35 103.48 2.86 1.08
18 238.93 304.20 238.93 253.24 1800 0 505.60 505.60 2305.60 14.41 131.34 2.86 0.96
19 238.93 304.20 238.93 255.19 1800 0 597.42 597.42 2397.42 17.37 190.03 2.86 0.81
20 238.93 304.20 238.93 266.71 1800 0 1334.21 1334.21 3134.21 42.21 944.56 2.86 0.43
29 207.90 196.60 207.90 205.42 1800 0 505.74 505.74 2305.74 13.35 103.48 2.72 0.98
30 207.90 196.60 207.90 205.42 1800 0 505.60 505.60 2305.60 14.41 131.34 2.72 0.87
31 207.90 196.60 207.90 205.08 1800 0 597.42 597.42 2397.42 17.37 190.03 2.72 0.73
32 207.90 196.60 207.90 203.09 1800 0 1334.21 1334.21 3134.21 42.21 944.56 2.72 0.37

40
Table 3.8(b) Details of the cross-sectional properties for the entire stiffened panel cross section of the SSC-451 test structures
Model Ypσ
(MPa) Ysσ
(MPa) 1Yeqσ
(MPa)
2Yeqσ
(MPa) pA
(mm2) epA
(mm2) esA
(mm2) sA
(mm2) tA
(mm2) η (mm)
I (cm4)
β λ
5 238.93 196.60 238.93 228.26 6000 0 2022.95 2022.95 8022.95 14.90 398.79 2.86 0.98
6 238.93 196.60 238.93 228.26 6000 0 2022.39 2022.39 8022.39 16.12 507.02 2.86 0.87
7 238.93 196.60 238.93 226.87 6000 0 2389.68 2389.68 8389.68 19.43 731.40 2.86 0.74
8 238.93 196.60 238.93 219.00 6000 0 5336.84 5336.84 11336.84 46.36 3576.80 2.86 0.38
17 238.93 304.20 238.93 255.39 6000 0 2022.95 2022.95 8022.95 14.90 398.79 2.86 1.05
18 238.93 304.20 238.93 255.38 6000 0 2022.39 2022.39 8022.39 16.12 507.02 2.86 0.93
19 238.93 304.20 238.93 257.52 6000 0 2389.68 2389.68 8389.68 19.43 731.40 2.86 0.79
20 238.93 304.20 238.93 269.66 6000 0 5336.84 5336.84 11336.84 46.36 3576.80 2.86 0.43
29 207.90 196.60 207.90 205.05 6000 0 2022.95 2022.95 8022.95 14.90 398.79 2.72 0.93
30 207.90 196.60 207.90 205.05 6000 0 2022.39 2022.39 8022.39 16.12 507.02 2.72 0.82
31 207.90 196.60 207.90 204.68 6000 0 2389.68 2389.68 8389.68 19.43 731.40 2.72 0.70
32 207.90 196.60 207.90 202.58 6000 0 5336.84 5336.84 11336.84 46.36 3576.80 2.72 0.37
3.3 Fusion-welded Structures
Two of the test structure models, 19A and 20A, were fabricated via fusion welds. Figure 3.8 shows a schematic of fillet-type fusion welds. The welding conditions applied to fabricate these test structures were the same as those used to prepare the tensile coupon test specimens, as described in 3.1.3(b).
Figure 3.9 shows the layout of the fusion welds for test structures 19A and 20A. Figure 3.10 shows photos of the test structures during and after fusion fillet-weld fabrication. Test structure 20A is similar to 19A. Table 3.9 summarizes the weld types of the test structures in both the present study and SSC-451.
The fusion fillet-weld work of the present test structures was carried out by Best F.A Ltd. (www.best-fa.co.kr), Changwon, Korea, which is a company of professional fusion weld fabrication in Korea, while that of the SSC-451 test structures was performed by Hanjin Heavy Industries & Construction Co., Ltd. (www.hanjinsc.com), Busan, Korea.

41
Figure 3.8 Schematic of fillet-type fusion weld (Fabrication method A)
Figure 3.9(a) Layout of test structure 19A for fillet-type fusion weld in mm
Figure 3.9(b) Layout of test structure 20A for fillet-type fusion weld in mm

42
Figure 3.10(a) Photo of one of the test structures during fusion-weld fabrication
Figure 3.10(b) Photo of test structure (19A) after fusion-weld fabrication

43
Table 3.9 Summary of fabrication methods applied in the test structures
The present test structures The SSC-451 test structures
Model Weld method Weld type Model Weld method Weld type
19A GMAW – Method A Fillet weld 5 GMAW – Method A Fillet weld
20A GMAW – Method A Fillet weld 6 GMAW – Method A Fillet weld
17D FSW – Method D Lap weld 7 GMAW – Method A Fillet weld
18D FSW – Method D Lap weld 8 GMAW – Method A Fillet weld
19D1 FSW – Method D Lap weld 17 GMAW – Method A Fillet weld
19D2 FSW – Method D Lap weld 18 GMAW – Method A Fillet weld
20D1 FSW – Method D Lap weld 19 GMAW – Method A Fillet weld
20D2 FSW – Method D Lap weld 20 GMAW – Method A Fillet weld
19C FSW – Method C-2 Butt weld 29 GMAW – Method A Fillet weld
20C FSW – Method C-2 Butt weld 30 GMAW – Method A Fillet weld
31 GMAW – Method A Fillet weld
32 GMAW – Method A Fillet weld
Note: Schematic of weld configurations
Fusion (GMAW) fillet-weld
(Fabrication method A)
Friction stir lap-weld
(fabrication method D)
Friction stir butt-weld
(Fabrication method C-2)

44
3.4 Friction Stir-Welded Structures 3.4.1 Classification of Fabrication Methods
The application of various FSW methods may be appropriate, as shown in Figure 3.11, and Figure 3.12 shows possible applications of FSW for the fabrication of stiffened plate structures. Table 3.9 summarizes the weld methods applied to fabricate the test structures.
In reality, however, FSW applications have a number of limitations that are associated with the intervention of the FSW machine in the target structures (including the plate and extrusions) to be fabricated. For the application of Method A (fillet-welding), which is the most widely used method for fusion welding, either the target structure or the FSW machine needs to be tilted about 25 degrees from the upright position as shown in Figure 3.12(a), although Method A can of course become relevant in the future.
Method B applies the butt-joining technique, but it is appropriate only for assembling individual extrusions with large flanges. Method C also applies the butt-joining technique, but only between the narrow plate sheets and the flanges of the extrusions.
Two types of Method C may be considered, namely C-1 and C-2. The method C-1 applies the FSW on the side of the extrusions, whereas the method C-2 applies it on the side of the plate sheet. When the breadth of the extruded flanges on the unwelded side is relatively large, compared to the FSW machine, it is difficult to apply Method C-1 because of possible intervention between the flange and the machine. Method D applies the lap-joining technique between the continuous plate sheet and the short flanges of the extrusions, although a deep penetration weld may be required.
During the fabrication of the test structures used in this project, the following difficulties arose.
• The FSW machine was fixed in the upright position to provide sufficient
downward force during welding. There was no facility to tilt the target structure for FSW fillet-joining.
• No supplier could provide extrusions with large flanges for the application of Method B.
• The breadth of the extruded flanges on the unwelded side was relatively large, meaning that the application of Method C-1 was not relevant.
For these reasons, this study adopted Method C-2 (butt-joining), as shown in Figure
3.12(c), and Method D (lap-joining), as shown in Figure 3.12(d). The welding conditions were similar to those applied to prepare the tensile coupon test specimens, as described in 3.1.3(b), but with different sizes of the FSW tool, as indicated in Table 3.10. The FSW fabrication work of the present test structures was carried out by Winxen Co., Ltd. (www.winxen.com), Changwon, Korea, which is a FSW machine supplier in Korea under the supervision of the Welding Institute in the U.K.

45
Figure 3.11 Various joint configurations for FSW (Kramer 2007)
FSW machine
25°
Taper flange
FSW machine
25°
Taper flange
Figure 3.12(a) Schematic of FSW for fillet-joining between a continuous plate
sheet and extrusions with taper flange (Method A)
Figure 3.12(b) Schematic of FSW for butt-joining between large extrusions only
(Method B)

46
Figure 3.12(c) Schematic of FSW for butt-joining on the extrusion side between
the plate sheet and the extrusion (Method C-1)
Figure 3.12(d) Schematic of FSW for butt-joining on the plate side between the
plate sheet and the extrusion (Method C-2)
Figure 3.12(e) Schematic of FSW for lap-joining between the plate sheet and the
extrusion (Method D)

47
Table 3.10 Sizes of the FSW tool applied to fabricate the test structures, with the nomenclature defined in Figure 3.4
Type d1 d2 d3 h
Butt-joining 4 mm 5 mm 15 mm 5.4 mm
Lap-joining 5 mm 8.9 mm 23 mm 8 mm
3.4.2 Butt-joining Methods
Figure 3.13 shows the layout of the friction stir welds for the butt-joining of test structures 19C and 20C. For the purposes of friction stir butt-welding, a specially designed jig was fabricated, as shown in Figure 3.14, in association with Method C-2. Figure 3.15 shows photos of one of the test structures during and after friction stir butt-joining.
Figure 3.13(a) Layout of test structure 19C for friction stir butt-joining in mm
Figure 3.13(b) Layout of test structure 20C for friction stir butt-joining in mm

48
Figure 3.14 Support jig design for FSW butt-joining in association with Method C-2 in mm
Figure 3.15(a) Photo of one of the test structures during friction stir butt-joining

49
Figure 3.15(b) Photo of test structure 19C after friction stir butt-joining
3.4.3 Lap-joining Methods
Figure 3.16 shows the layout of the friction stir welds for the lap-joining of test structures 17D, 18D, 19D1, 19D2, 20D1 and 20D2. Figure 3.17 presents the design of the support jig for the friction stir lap-joining applied during fabrication of the test structures. Figure 18 shows a photo of test structure 17D after the completion of friction stir lap-joining.
Figure 3.16(a) Layout of test structure 17D for friction stir lap-joining in mm

50
Figure 3.16(b) Layout of test structure 18D for friction stir lap-joining in mm
Figure 3.16(c) Layout of test structure 19D1 for friction stir lap-joining in mm
Figure 3.16(d) Layout of test structure 19D2 for friction stir lap-joining in mm
Figure 3.16(e) Layout of test structure 20D1 for friction stir lap-joining in mm

51
Figure 3.16(f) Layout of test structure 20D2 for friction stir lap-joining in mm
Figure 3.17 Support jig design for FSW lap-joining in association with Method D in
mm

52
Figure 3.18(a) Photo of a test structure during friction stir lap-joining
Figure 3.18(b) Photo of test structure 17D after friction stir lap-joining

53
Chapter 4 Weld-induced Initial Imperfections of Test Structures 4.1 Types of Weld-induced Initial Imperfections
Welding may induce the following six types of initial imperfections in aluminum structures.
• Initial deflection of the plating between the stiffeners (see Figure 4.1) • Column-type initial distortion of the stiffener (see Figure 4.1) • Sideways initial distortion of the stiffener (see Figure 4.1) • Residual stress in the plating between the stiffeners (see Figure 4.2) • Residual stress in the stiffener web (see Figure 4.2) • Softening in the thermo-mechanically affected zone (TMAZ) and the heat- affected zone (HAZ)
y
Plate initial deflection
Sideways initial distortion
x
B
b
b
b
abs
bs
Column initial distortion
Figure 4.1 Schematic of weld-induced initial distortions
++
−−
++
Weld line
Weld linertσ
rcσ
Figure 4.2(a) Schematic of fillet weld-induced residual stresses in the plating

54
++
−−
Weld line
Unweld (extruded)Flange
src σ
srt σ
Figure 4.2(b) Schematic of fillet weld-induced residual stresses in the stiffener
web It should be noted that the first five types of initial imperfections are also of
primary concern in welded steel structures, although the softening phenomenon in the softened zone of these structures is usually insignificant and thus ignored in terms of ultimate compressive strength performance. The properties in the softened zone are often formulated in association with the reduced yield strength and breadth of this zone.
These weld-induced initial imperfections affect (reduce) the ultimate compressive strength performance of structures in a sensitive manner, and thus they must be dealt with as important parameters of influence in structural design and strength assessment.
The SSC-451 report (Paik et al. 2008b) presents an extensive set of initial imperfection measurements in aluminum stiffened plate structures fabricated by fusion welding. The fusion weld-induced initial imperfection measurements presented in SSC-451 are here compared with the database obtained from the present study by friction stir welding (FSW). The details of extrusion profiles and dimensions, and weld methods used to fabricate the present test structures are summarized in Tables 3.6(a) to 3.8(a) and Table 3.9. 4.2 SSC-451 Database
A total of 78 aluminum stiffened plate structures fabricated by fusion welding were studied in SSC-451 (Paik et al. 2008b), as indicated in Tables 3.6(b) to 3.8(b) and Table 3.9. The six types of weld-induced initial imperfections were measured for all of that study’s test structures, and the resulting database of measurements was then analyzed to obtain the statistical characteristics in terms of the means and standard deviations at the three levels of initial imperfections, i.e., slight, average and severe.
The following are the mean values of the initial imperfections obtained from the statistical analysis in SSC-451.
• Maximum initial deflection of the plating between longitudinal stiffeners:

55
2
2opl
2
0.018 t for slight level
w 0.096 t for average level
0.252 t for severe level
⎧ β⎪⎪= β⎨⎪
β⎪⎩
. (4.1)
• Maximum column-type initial distortion of the stiffener:
oc
0.00016a for slight levelw 0.0018a for average level
0.0056a for severe level
⎧⎪= ⎨⎪⎩
. (4.2)
• Maximum sideways initial distortion of the stiffener:
os
0.00019a for slight levelw 0.001a for average level
0.0024a for severe level
⎧⎪= ⎨⎪⎩
. (4.3)
• Compressive residual stress in the plating:
⎪⎩
⎪⎨
⎧
σ−
σ−
σ−
=σ
levelseverefor216.0
levelaveragefor161.0
levelslightfor110.0
Yp
Yp
Yp
rcx . (4.4)
• Compressive residual stress in the stiffener web:
Ys
rcx Ys
Ys
0.078 for slight level0.137 for average level0.195 for severe level
− σ⎧⎪σ = − σ⎨⎪− σ⎩
. (4.5)
• Reduced yield strength in the softened zone (5083-H116):
YHAZ
Y
0.906 for slight level0.777 for average level0.437 for severe level
⎧σ ⎪= ⎨σ ⎪
⎩
. (4.6)

56
• Reduced yield strength in the softened zone (5383-H112):
YHAZ
Y0.891 for average levelσ
=σ
. (4.7)
• Reduced yield strength in the softened zone (5383-H116):
⎪⎩
⎪⎨
⎧=
σσ
levelseverefor640.0levelaveragefor774.0
levelslightfor820.0
Y
YHAZ . (4.8)
• Reduced yield strength in the softened zone (6082-T6):
YHAZ
Y0.703 for average levelσ
=σ
. (4.9)
• Half of the softened zone breadth:
HAZ t
11.3mm for slight levelb b 23.1mm for average level
29.9mm for severe level
⎧⎪= = ⎨⎪⎩
. (4.10)
4.3 Initial Distortions
The three types of initial distortions, i.e., plate initial deflections, column-type initial distortions of the stiffeners, and sideways initial distortions of the stiffeners, were measured at various locations on the structures at intervals of 50 mm.
Figure 4.3 shows photos of the initial distortion measurements. Figure 4.4 presents three-dimensional displays of the initial distortion measurements for the plating and stiffeners in the test structures, where the measured values of the initial distortions were amplified by 30 times. Figure 4.5 depicts the initial distortion patterns for the plating and stiffeners at y = 0mm (the end of the structure) and y = 600mm (mid-span). It can be observed from Figure 4.5 that the initial distortions in the fusion-welded structures (19A, 20A) generally tended to be more severe than those in the FSW structures. It is also interesting to note that the initial distortions of the FSW butt-joined structures (19C, 20C) were more severe than those of the FSW lap-joined structures.
Figure 4.6 presents the details of the initial distortion measurements, and Table 4.1 lists the maximum values of the initial distortions in the plating and stiffeners. The acceptance tolerances of the weld-induced initial distortions in aluminum structures, as specified by classification society rules (ABS 2006), are also compared in this table, indicating that the maximum initial distortions in the test structures were within these tolerances.

57
Figure 4.3 (a) Photo of the set-up for the plate initial deflection measurements
Figure 4.3(b) Photo of the set-up for the stiffener initial distortion measurements

58
Figure 4.4(a) Three-dimensional display of initial distortions (amplified by 30 times) in test structure 19A
Figure 4.4(b) Three-dimensional display of initial distortions (amplified by 30
times) in test structure 20A
Figure 4.4(c) Three-dimensional display of initial distortions (amplified by 30
times) in test structure 17D
Figure 4.4(d) Three-dimensional display of initial distortions (amplified by 30
times) in test structure 18D

59
Figure 4.4(e) Three-dimensional display of initial distortions (amplified by 30
times) in test structure 19D1
Figure 4.4(f) Three-dimensional display of initial distortions (amplified by 30
times) in test structure 19D2
Figure 4.4(g) Three-dimensional display of initial distortions (amplified by 30
times) in test structure 20D1
Figure 4.4(h) Three-dimensional display of initial distortions (amplified by 30
times) in test structure 20D2

60
Figure 4.4(i) Three-dimensional display of initial distortions (amplified by 30
times) in test structure 19C
Figure 4.4(j) Three-dimensional display of initial distortions (amplified by 30
times) in test structure 20C
19Ay = 600mm
y = 0mm
19Ay = 600mm
y = 0mm
Figure 4.5(a) Shape of initial distortions (amplified by 30 times) for the plating and
stiffeners in test structure 19A
20A y = 600mm
y = 0mm
20A y = 600mm
y = 0mm
Figure 4.5(b) Shape of initial distortions (amplified by 30 times) for the plating and
stiffeners in test structure 20A

61
17Dy = 600mm
y = 0mm
17Dy = 600mm
y = 0mm
Figure 4.5(c) Shape of initial distortions (amplified by 30 times) for the plating and
stiffeners in test structure 17D
18D y = 600mm
y = 0mm
18D y = 600mm
y = 0mm
Figure 4.5(d) Shape of initial distortions (amplified by 30 times) for the plating and
stiffeners in test structure 18D
19D1 y = 600mm
y = 0mm
19D1 y = 600mm
y = 0mm
Figure 4.5(e) Shape of initial distortions (amplified by 30 times) for the plating and
stiffeners in test structure 19D1
19D2 y = 600mm
y = 0mm
19D2 y = 600mm
y = 0mm
Figure 4.5(f) Shape of initial distortions (amplified by 30 times) for the plating and
stiffeners in test structure 19D2
20D1 y = 0mm
y = 600mm
20D1 y = 0mm
y = 600mm
Figure 4.5(g) Shape of initial distortions (amplified by 30 times) for the plating and
stiffeners in test structure 20D1

62
20D2 y = 0mm
y = 600mm
20D2 y = 0mm
y = 600mm
Figure 4.5(h) Shape of initial distortions (amplified by 30 times) for the plating and
stiffeners in test structure 20D2
19C y = 0mm
y = 600mm
19C y = 0mm
y = 600mm
Figure 4.5(i) Shape of initial distortions (amplified by 30 times) for the plating and
stiffeners in test structure 19C
20Cy = 600mm
y = 0mm
20Cy = 600mm
y = 0mm
Figure 4.5(j) Shape of initial distortions (amplified by 30 times) for the plating and
stiffeners in test structure 20C

63
Table 4.1 Maximum values of the initial distortion measurements in the plating and stiffeners, together with the ABS rule requirements for tolerance
Tolerance (mm) Model wopl (mm) woc (mm) wos (mm) Plate Stiffener
-1.527 -0.635 -1.254 1.710 -0.252 0.899 2.457 -0.629 19A
-0.751 0.190 0.950
4.76 7.95
-0.882 -0.554 -1.825 0.801 -0.600 -1.474 0.841 0.357 20A
-1.471 -1.568 -0.295
4.76 4.54
-1.428 0.171 0.722 -0.832 -0.316 1.123 0.988 0.287 17D
0.702 -0.544 0.539
4.76 10.6
-0.614 0.426 0.834 1.396 -0.455 1.110 1.064 0.485 18D
0.573 -0.475 -0.433
4.76 9.09
0.561 0.227 1.098 1.120 -0.300 1.180 -0.779 -0.542 19D1
0.934 -0.384 -0.412
4.76 7.95
-0.731 0.739 -1.153 -0.773 0.565 -0.471 -0.356 -0.309 19D2
-0.920 -1.163 0.714
4.76 7.95
-0.469 0.262 0.692 0.452 0.380 0.823 1.222 0.091 20D1
0.878 -0.976 -0.234
4.76 4.54
-1.640 0.294 -0.831 -1.281 0.419 -0.702 -0.666 0.471 20D2
-0.723 -1.290 0.432
4.76 4.54
0.867 0.742 -0.68 -1.077 0.444 -2.053 -1.525 -0.583 19C
-1.104 0.579 -0.774
4.76 7.95
0.802 0.862 -0.381 -0.459 0.589 -0.753 -0.250 -0.682 20C
-0.872 0.466 -0.448
4.76 4.54

64
0 1200
0
1
(a) y = 750mm, wopl /t = 0.125
wo/w
opl
x
mm0 1200
0
1
(a) y = 750mm, wopl /t = 0.125
wo/w
opl
x
mm
0 1200
0
1
(b) y = 450mm, wopl /t = 0.150
wo/w
opl
x
mm0 1200
0
1
(b) y = 450mm, wopl /t = 0.150
wo/w
opl
x
mm
0 1200
0
1
(c) y = 150mm, wopl /t = 0.209
wo/w
opl
x
mm0 1200
0
1
(c) y = 150mm, wopl /t = 0.209
wo/w
opl
x
mm
0 1200
0
1
(a) y = 900mm, woc/a = 0.0002wo/w
oc x
mm0 1200
0
1
(a) y = 900mm, woc/a = 0.0002wo/w
oc x
mm
0 1200
0
1
(b) y = 600mm, woc/a = 0.0020wo/w
oc x
mm0 1200
0
1
(b) y = 600mm, woc/a = 0.0020wo/w
oc x
mm
0 1200
0
1
(c) y = 300mm, woc/a = 0.0014wo/w
oc x
mm0 1200
0
1
(c) y = 300mm, woc/a = 0.0014wo/w
oc x
mm
0 1200
0
1
(d) y = 0mm, woc/a = 0.0013wo/w
oc x
mm0 1200
0
1
(d) y = 0mm, woc/a = 0.0013wo/w
oc x
mm
0 1200
0
1
(a) y = 900mm, wos/a = 0.0008wo/w
os x
mm0 1200
0
1
(a) y = 900mm, wos/a = 0.0008wo/w
os x
mm

65
0 1200
0
1
(b) y = 600mm, wos/a = 0.0005wo/w
os x
mm0 1200
0
1
(b) y = 600mm, wos/a = 0.0005wo/w
os x
mm
0 1200
0
1
(c) y = 300mm, wos/a = 0.0002wo/w
os x
mm0 1200
0
1
(c) y = 300mm, wos/a = 0.0002wo/w
os x
mm
0 1200
0
1
(d) y = 0mm, wos/a = 0.0005wo/w
os x
mm0 1200
0
1
(d) y = 0mm, wos/a = 0.0005wo/w
os x
mm
Figure 4.6(a) Details of initial distortion measurements in test structure 19A
0 1200
0
1
(a) y = 750mm, wopl /t = 0.245
wo/w
opl
x
mm0 1200
0
1
(a) y = 750mm, wopl /t = 0.245
wo/w
opl
x
mm
0 1200
0
1
(b) y = 450mm, wopl /t = 0.246
wo/w
opl
x
mm0 1200
0
1
(b) y = 450mm, wopl /t = 0.246
wo/w
opl
x
mm
0 1200
0
1
(c) y = 150mm, wopl /t = 0.304
wo/w
opl
x
mm0 1200
0
1
(c) y = 150mm, wopl /t = 0.304
wo/w
opl
x
mm
0 1200
0
1
(a) y = 900mm, woc/a = 0.0012wo/w
oc x
mm0 1200
0
1
(a) y = 900mm, woc/a = 0.0012wo/w
oc x
mm

66
0 1200
0
1
(b) y = 600mm, woc/a = 0.0007wo/w
oc x
mm0 1200
0
1
(b) y = 600mm, woc/a = 0.0007wo/w
oc x
mm
0 1200
0
1
(c) y = 300mm, woc/a = 0.0007wo/w
oc x
mm0 1200
0
1
(c) y = 300mm, woc/a = 0.0007wo/w
oc x
mm
0 1200
0
1
(d) y = 0mm, woc/a = 0.0007wo/w
oc x
mm0 1200
0
1
(d) y = 0mm, woc/a = 0.0007wo/w
oc x
mm
0 1200
0
1
(a) y = 900mm, wos/a = 0.0002wo/w
os x
mm0 1200
0
1
(a) y = 900mm, wos/a = 0.0002wo/w
os x
mm
0 1200
0
1
(b) y = 600mm, wos/a = 0.0003wo/w
os x
mm0 1200
0
1
(b) y = 600mm, wos/a = 0.0003wo/w
os x
mm
0 1200
0
1
(c) y = 300mm, wos/a = 0.0005wo/w
os x
mm0 1200
0
1
(c) y = 300mm, wos/a = 0.0005wo/w
os x
mm
0 1200
0
1
(d) y = 0mm, wos/a = 0.0005wo/w
os x
mm0 1200
0
1
(d) y = 0mm, wos/a = 0.0005wo/w
os x
mm
Figure 4.6(b) Details of initial distortion measurements in test structure 20A
0 1200
0
1
(a) y = 750mm, wopl /t = 0.117
wo/w
opl
x
mm0 1200
0
1
(a) y = 750mm, wopl /t = 0.117
wo/w
opl
x
mm

67
0 1200
0
1
(b) y = 450mm, wopl /t = 0.187
wo/w
opl
x
mm0 1200
0
1
(b) y = 450mm, wopl /t = 0.187
wo/w
opl
x
mm
0 1200
0
1
(c) y = 150mm, wopl /t = 0.120
wo/w
opl
x
mm0 1200
0
1
(c) y = 150mm, wopl /t = 0.120
wo/w
opl
x
mm
0 1200
0
1
(a) y = 900mm, woc/a = 0.0003wo/w
oc x
mm0 1200
0
1
(a) y = 900mm, woc/a = 0.0003wo/w
oc x
mm
0 1200
0
1
(b) y = 600mm, woc/a = 0.0011wo/w
oc x
mm0 1200
0
1
(b) y = 600mm, woc/a = 0.0011wo/w
oc x
mm
0 1200
0
1
(c) y = 300mm, woc/a = 0.0009wo/w
oc x
mm0 1200
0
1
(c) y = 300mm, woc/a = 0.0009wo/w
oc x
mm
0 1200
0
1
(d) y = 0mm, woc/a = 0.0003wo/w
oc x
mm0 1200
0
1
(d) y = 0mm, woc/a = 0.0003wo/w
oc x
mm
0 1200
0
1
(a) y = 900mm, wos/a = 0.0004wo/w
os x
mm0 1200
0
1
(a) y = 900mm, wos/a = 0.0004wo/w
os x
mm
0 1200
0
1
(b) y = 600mm, wos/a = 0.0002wo/w
os x
mm0 1200
0
1
(b) y = 600mm, wos/a = 0.0002wo/w
os x
mm

68
0 1200
0
1
(c) y = 300mm, wos/a = 0.0002wo/w
os x
mm0 1200
0
1
(c) y = 300mm, wos/a = 0.0002wo/w
os x
mm
0 1200
0
1
(d) y = 0mm, wos/a = 0.0001wo/w
os x
mm0 1200
0
1
(d) y = 0mm, wos/a = 0.0001wo/w
os x
mm
Figure 4.6(c) Details of initial distortion measurements in the test structure 17D
0 1200
0
1
(a) y = 750mm, wopl /t = 0.096
wo/w
opl
x
mm0 1200
0
1
(a) y = 750mm, wopl /t = 0.096
wo/w
opl
x
mm
0 1200
0
1
(b) y = 450mm, wopl /t = 0.185
wo/w
opl
x
mm0 1200
0
1
(b) y = 450mm, wopl /t = 0.185
wo/w
opl
x
mm
0 1200
0
1
(c) y = 150mm, wopl /t = 0.139
wo/w
opl
x
mm0 1200
0
1
(c) y = 150mm, wopl /t = 0.139
wo/w
opl
x
mm
0 1200
0
1
(a) y = 900mm, woc/a = 0.0002
wo/w
oc x
mm0 1200
0
1
(a) y = 900mm, woc/a = 0.0002
wo/w
oc x
mm
0 1200
0
1
(b) y = 600mm, woc/a = 0.0011wo/w
oc x
mm0 1200
0
1
(b) y = 600mm, woc/a = 0.0011wo/w
oc x
mm
0 1200
0
1
(c) y = 300mm, woc/a = 0.0012wo/w
oc x
mm0 1200
0
1
(c) y = 300mm, woc/a = 0.0012wo/w
oc x
mm

69
0 1200
0
1
(d) y = 0mm, woc/a = 0.0006wo/w
oc x
mm0 1200
0
1
(d) y = 0mm, woc/a = 0.0006wo/w
oc x
mm
0 1200
0
1
(a) y = 900mm, wos/a = 0.0003wo/w
os x
mm0 1200
0
1
(a) y = 900mm, wos/a = 0.0003wo/w
os x
mm
0 1200
0
1
(b) y = 600mm, wos/a = 0.0004wo/w
os x
mm0 1200
0
1
(b) y = 600mm, wos/a = 0.0004wo/w
os x
mm
0 1200
0
1
(c) y = 300mm, wos/a = 0.0004wo/w
os x
mm0 1200
0
1
(c) y = 300mm, wos/a = 0.0004wo/w
os x
mm
0 1200
0
1
(d) y = 0mm, wos/a = 0.0002wo/w
os x
mm0 1200
0
1
(d) y = 0mm, wos/a = 0.0002wo/w
os x
mm
Figure 4.6(d) Details of initial distortion measurements in test structure 18D
0 1200
0
1
(a) y = 750mm, wopl /t = 0.156
wo/w
opl
x
mm0 1200
0
1
(a) y = 750mm, wopl /t = 0.156
wo/w
opl
x
mm
0 1200
0
1
(b) y = 450mm, wopl /t = 0.197
wo/w
opl
x
mm0 1200
0
1
(b) y = 450mm, wopl /t = 0.197
wo/w
opl
x
mm
0 1200
0
1
(c) y = 150mm, wopl /t = 0.183
wo/w
opl
x
mm0 1200
0
1
(c) y = 150mm, wopl /t = 0.183
wo/w
opl
x
mm

70
0 1200
0
1
(a) y = 900mm, woc/a = 0.0003w
o/woc x
mm0 1200
0
1
(a) y = 900mm, woc/a = 0.0003w
o/woc x
mm
0 1200
0
1
(b) y = 600mm, woc/a = 0.0008wo/w
oc x
mm0 1200
0
1
(b) y = 600mm, woc/a = 0.0008wo/w
oc x
mm
0 1200
0
1
(c) y = 300mm, woc/a = 0.0008wo/w
oc x
mm0 1200
0
1
(c) y = 300mm, woc/a = 0.0008wo/w
oc x
mm
0 1200
0
1
(d) y = 0mm, woc/a = 0.0005
wo/w
oc x
mm0 1200
0
1
(d) y = 0mm, woc/a = 0.0005
wo/w
oc x
mm
0 1200
0
1
(a) y = 900mm, wos/a = 0.0003wo/w
os x
mm0 1200
0
1
(a) y = 900mm, wos/a = 0.0003wo/w
os x
mm
0 1200
0
1
(b) y = 600mm, wos/a = 0.0005wo/w
os x
mm0 1200
0
1
(b) y = 600mm, wos/a = 0.0005wo/w
os x
mm
0 1200
0
1
(c) y = 300mm, wos/a = 0.0003wo/w
os x
mm0 1200
0
1
(c) y = 300mm, wos/a = 0.0003wo/w
os x
mm
0 1200
0
1
(d) y = 0mm, wos/a = 0.0002wo/w
os x
mm0 1200
0
1
(d) y = 0mm, wos/a = 0.0002wo/w
os x
mm
Figure 4.6(e) Details of initial distortion measurements in test structure 19D1

71
0 1200
0
1
(a) y = 750mm, wopl /t = 0.146
wo/w
opl
x
mm0 1200
0
1
(a) y = 750mm, wopl /t = 0.146
wo/w
opl
x
mm
0 1200
0
1
(b) y = 450mm, wopl /t = 0.122
wo/w
opl
x
mm0 1200
0
1
(b) y = 450mm, wopl /t = 0.122
wo/w
opl
x
mm
0 1200
0
1
(c) y = 150mm, wopl /t = 0.115
wo/w
opl
x
mm0 1200
0
1
(c) y = 150mm, wopl /t = 0.115
wo/w
opl
x
mm
0 1200
0
1
(a) y = 900mm, woc/a = 0.0004wo/w
oc x
mm0 1200
0
1
(a) y = 900mm, woc/a = 0.0004wo/w
oc x
mm
0 1200
0
1
(b) y = 600mm, woc/a = 0.0008wo/w
oc x
mm0 1200
0
1
(b) y = 600mm, woc/a = 0.0008wo/w
oc x
mm
0 1200
0
1
(c) y = 300mm, woc/a = 0.0004wo/w
oc x
mm0 1200
0
1
(c) y = 300mm, woc/a = 0.0004wo/w
oc x
mm
0 1200
0
1
(d) y = 0mm, woc/a = 0.0004wo/w
oc x
mm0 1200
0
1
(d) y = 0mm, woc/a = 0.0004wo/w
oc x
mm
0 1200
0
1
(a) y = 900mm, wos/a = 0.0002wo/w
os x
mm0 1200
0
1
(a) y = 900mm, wos/a = 0.0002wo/w
os x
mm
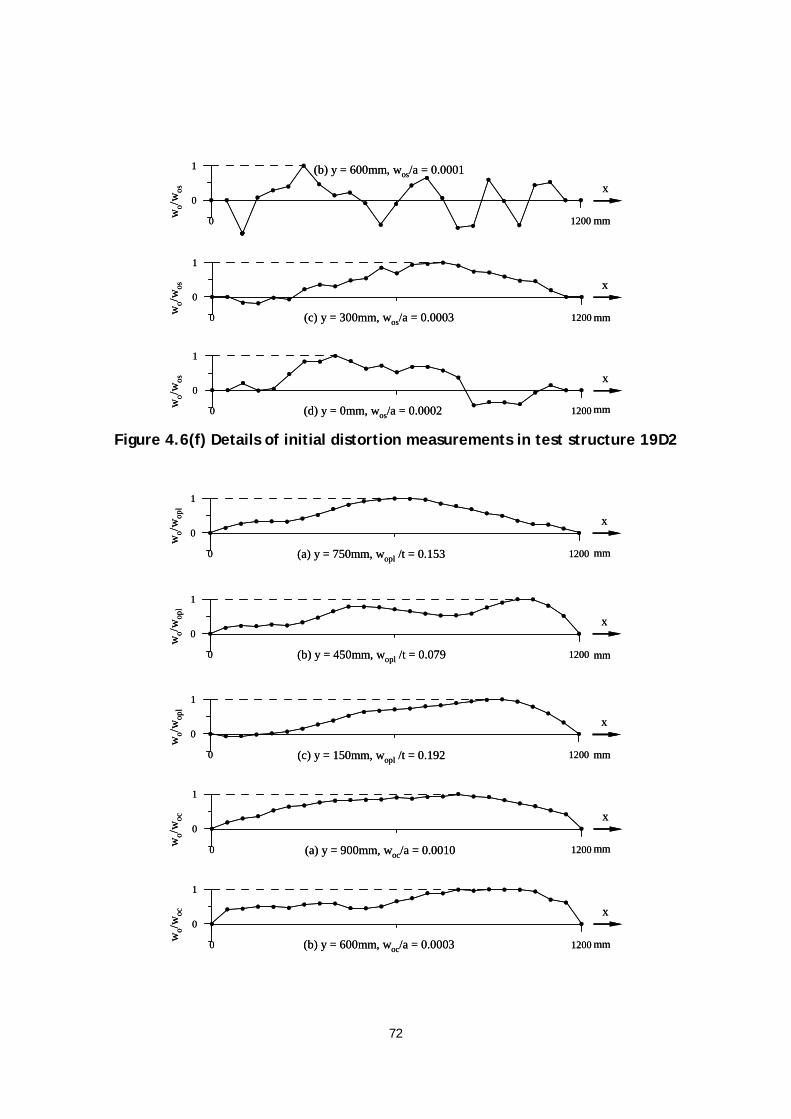
72
0 1200
0
1 (b) y = 600mm, wos/a = 0.0001w
o/wos x
mm0 1200
0
1 (b) y = 600mm, wos/a = 0.0001w
o/wos x
mm
0 1200
0
1
(c) y = 300mm, wos/a = 0.0003wo/
wos x
mm0 1200
0
1
(c) y = 300mm, wos/a = 0.0003wo/
wos x
mm
0 1200
0
1
(d) y = 0mm, wos/a = 0.0002wo/w
os x
mm0 1200
0
1
(d) y = 0mm, wos/a = 0.0002wo/w
os x
mm
Figure 4.6(f) Details of initial distortion measurements in test structure 19D2
0 1200
0
1
(a) y = 750mm, wopl /t = 0.153
wo/w
opl
x
mm0 1200
0
1
(a) y = 750mm, wopl /t = 0.153
wo/w
opl
x
mm
0 1200
0
1
(b) y = 450mm, wopl /t = 0.079
wo/w
opl
x
mm0 1200
0
1
(b) y = 450mm, wopl /t = 0.079
wo/w
opl
x
mm
0 1200
0
1
(c) y = 150mm, wopl /t = 0.192
wo/w
opl
x
mm0 1200
0
1
(c) y = 150mm, wopl /t = 0.192
wo/w
opl
x
mm
0 1200
0
1
(a) y = 900mm, woc/a = 0.0010wo/w
oc x
mm0 1200
0
1
(a) y = 900mm, woc/a = 0.0010wo/w
oc x
mm
0 1200
0
1
(b) y = 600mm, woc/a = 0.0003wo/w
oc x
mm0 1200
0
1
(b) y = 600mm, woc/a = 0.0003wo/w
oc x
mm

73
0 1200
0
1
(c) y = 300mm, woc/a = 0.0006wo/w
oc x
mm0 1200
0
1
(c) y = 300mm, woc/a = 0.0006wo/w
oc x
mm
0 1200
0
1
(d) y = 0mm, woc/a = 0.0006wo/w
oc x
mm0 1200
0
1
(d) y = 0mm, woc/a = 0.0006wo/w
oc x
mm
0 1200
0
1
(a) y = 900mm, wos/a = 0.0003wo/w
os x
mm0 1200
0
1
(a) y = 900mm, wos/a = 0.0003wo/w
os x
mm
0 1200
0
1
(b) y = 600mm, wos/a = 0.0003wo/w
os x
mm0 1200
0
1
(b) y = 600mm, wos/a = 0.0003wo/w
os x
mm
0 1200
0
1
(c) y = 300mm, wos/a = 0.0004wo/w
os x
mm0 1200
0
1
(c) y = 300mm, wos/a = 0.0004wo/w
os x
mm
0 1200
0
1
(d) y = 0mm, wos/a = 0.0004wo/w
os x
mm0 1200
0
1
(d) y = 0mm, wos/a = 0.0004wo/w
os x
mm
Figure 4.6(g) Details of initial distortion measurements in test structure 20D1
0 1200
0
1
(a) y = 750mm, wopl /t = 0.121
wo/w
opl
x
mm0 1200
0
1
(a) y = 750mm, wopl /t = 0.121
wo/w
opl
x
mm
0 1200
0
1
(b) y = 450mm, wopl /t = 0.117
wo/w
opl
x
mm0 1200
0
1
(b) y = 450mm, wopl /t = 0.117
wo/w
opl
x
mm

74
0 1200
0
1
(c) y = 150mm, wopl /t = 0.139
wo/w
opl
x
mm0 1200
0
1
(c) y = 150mm, wopl /t = 0.139
wo/w
opl
x
mm
0 1200
0
1
(a) y = 900mm, woc/a = 0.0009wo/w
oc x
mm0 1200
0
1
(a) y = 900mm, woc/a = 0.0009wo/w
oc x
mm
0 1200
0
1
(b) y = 600mm, woc/a = 0.0006wo/w
oc x
mm0 1200
0
1
(b) y = 600mm, woc/a = 0.0006wo/w
oc x
mm
0 1200
0
1
(c) y = 300mm, woc/a = 0.0008wo/w
oc x
mm0 1200
0
1
(c) y = 300mm, woc/a = 0.0008wo/w
oc x
mm
0 1200
0
1
(d) y = 0mm, woc/a = 0.0009wo/w
oc x
mm0 1200
0
1
(d) y = 0mm, woc/a = 0.0009wo/w
oc x
mm
0 1200
0
1
(a) y = 900mm, wos/a = 0.0002wo/w
os x
mm0 1200
0
1
(a) y = 900mm, wos/a = 0.0002wo/w
os x
mm
0 1200
0
1
(b) y = 600mm, wos/a = 0.0003wo/w
os x
mm0 1200
0
1
(b) y = 600mm, wos/a = 0.0003wo/w
os x
mm
0 1200
0
1 (c) y = 300mm, wos/a = 0.0001
wo/w
os x
mm0 1200
0
1 (c) y = 300mm, wos/a = 0.0001
wo/w
os x
mm

75
0 1200
0
1
(d) y = 0mm, wos/a = 0.0002wo/w
os x
mm0 1200
0
1
(d) y = 0mm, wos/a = 0.0002wo/w
os x
mm
Figure 4.6(h) Details of initial distortion measurements in test structure 20D2
0 1200
0
1
(a) y = 750mm, wopl /t = 0.184
wo/w
opl
x
mm0 1200
0
1
(a) y = 750mm, wopl /t = 0.184
wo/w
opl
x
mm
0 1200
0
1
(b) y = 450mm, wopl /t = 0.342
wo/w
opl
x
mm0 1200
0
1
(b) y = 450mm, wopl /t = 0.342
wo/w
opl
x
mm
0 1200
0
1
(c) y = 150mm, wopl /t = 0.113
wo/w
opl
x
mm0 1200
0
1
(c) y = 150mm, wopl /t = 0.113
wo/w
opl
x
mm
0 1200
0
1
(a) y = 900mm, woc/a = 0.0004wo/
woc x
mm0 1200
0
1
(a) y = 900mm, woc/a = 0.0004wo/
woc x
mm
0 1200
0
1
(b) y = 600mm, woc/a = 0.0013wo/w
oc x
mm0 1200
0
1
(b) y = 600mm, woc/a = 0.0013wo/w
oc x
mm
0 1200
0
1
(c) y = 300mm, woc/a = 0.0009wo/w
oc x
mm0 1200
0
1
(c) y = 300mm, woc/a = 0.0009wo/w
oc x
mm

76
0 1200
0
1
(d) y = 0mm, woc/a = 0.0006wo/w
oc x
mm0 1200
0
1
(d) y = 0mm, woc/a = 0.0006wo/w
oc x
mm
0 1200
0
1
(a) y = 900mm, wos/a = 0.0006wo/w
os x
mm0 1200
0
1
(a) y = 900mm, wos/a = 0.0006wo/w
os x
mm
0 1200
0
1
(b) y = 600mm, wos/a = 0.0005wo/w
os x
mm0 1200
0
1
(b) y = 600mm, wos/a = 0.0005wo/w
os x
mm
0 1200
0
1
(c) y = 300mm, wos/a = 0.0004wo/w
os x
mm0 1200
0
1
(c) y = 300mm, wos/a = 0.0004wo/w
os x
mm
0 1200
0
1
(d) y = 0mm, wos/a = 0.0006wo/w
os x
mm0 1200
0
1
(d) y = 0mm, wos/a = 0.0006wo/w
os x
mm
Figure 4.6(i) Details of initial distortion measurements in test structure 19C
0 1200
0
1
(a) y = 750mm, wopl /t = 0.145
wo/w
opl
x
mm0 1200
0
1
(a) y = 750mm, wopl /t = 0.145
wo/w
opl
x
mm
0 1200
0
1
(b) y = 450mm, wopl /t = 0.126
wo/w
opl
x
mm0 1200
0
1
(b) y = 450mm, wopl /t = 0.126
wo/w
opl
x
mm

77
0 1200
0
1
(c) y = 150mm, wopl /t = 0.064
wo/w
opl
x
mm0 1200
0
1
(c) y = 150mm, wopl /t = 0.064
wo/w
opl
x
mm
0 1200
0
1
(a) y = 900mm, woc/a = 0.0004wo/w
oc x
mm0 1200
0
1
(a) y = 900mm, woc/a = 0.0004wo/w
oc x
mm
0 1200
0
1
(b) y = 600mm, woc/a = 0.0002wo/w
oc x
mm0 1200
0
1
(b) y = 600mm, woc/a = 0.0002wo/w
oc x
mm
0 1200
0
1
(c) y = 300mm, woc/a = 0.0004wo/w
oc x
mm0 1200
0
1
(c) y = 300mm, woc/a = 0.0004wo/w
oc x
mm
0 1200
0
1
(d) y = 0mm, woc/a = 0.0007wo/w
oc x
mm0 1200
0
1
(d) y = 0mm, woc/a = 0.0007wo/w
oc x
mm
0 1200
0
1
(a) y = 900mm, wos/a = 0.0004wo/w
os x
mm0 1200
0
1
(a) y = 900mm, wos/a = 0.0004wo/w
os x
mm
0 1200
0
1
(b) y = 600mm, wos/a = 0.0006wo/w
os x
mm0 1200
0
1
(b) y = 600mm, wos/a = 0.0006wo/w
os x
mm
0 1200
0
1
(c) y = 300mm, wos/a = 0.0005wo/w
os x
mm0 1200
0
1
(c) y = 300mm, wos/a = 0.0005wo/w
os x
mm

78
0 1200
0
1
(d) y = 0mm, wos/a = 0.0007wo/w
os x
mm0 1200
0
1
(d) y = 0mm, wos/a = 0.0007wo/w
os x
mm
Figure 4.6(j) Details of initial distortion measurements in test structure 20C
4.4 Residual Stresses
The hole-drilling strain-gauge method (Inter Technology 2005) is the most widely-used modern technique applied today to measure residual stresses. Therefore, this method was employed to measure the weld-induced residual stresses in the test structures in the present study and those in SSC-451.
The residual stress measurement procedure involves the following six steps (Inter Technology 2005).
• Step 1: A special three- (or six-) element strain-gauge rosette is installed at the
target location where the residual stresses are to be measured. • Step 2: The gauge grids are wired and connected to a multi-channel static strain
indicator or through a switch-and-balance unit (six-element gauge). • Step 3: A precision milling guide is attached to the test part and accurately
centered over a drilling target on the rosette. • Step 4: After zero-balancing the gauge circuits, a small, shallow hole is drilled
through the geometric center of the rosette. • Step 5: Readings are taken of the relaxed strains that correspond to the residual
stress. • Step 6: Using special data-reduction relationships, the principal residual stresses
and their angular orientations are calculated from these measured strains.
Figure 4.7 shows the residual stress measurement set-up using the hole-drilling strain-gauge method. With regard to Step 4, the hole was drilled in the target location up to a depth of 2.3 mm in the plate thickness direction where the released strain became almost constant. Figure 4.8 shows typical examples of the relationship between the drilling depth and the released strain in the panel longitudinal direction at a location in the compressive residual stress zone.
It was found that there is no change in the released strain after a drilling depth of 2.0 mm, regardless of the fabrication method used. It is also interesting to note that this strain (and the subsequent compressive residual stress) was greater in the following order: GMAW (19A), FSW (19D2) and FSW (19C).
Figure 4.9 shows the residual stress distributions, both measured and as idealized for the test structures. The idealized distributions of the residual stress were determined based on the hypothesis that the compressive residual stress must be in equilibrium with the tensile residual stress over the cross-sectional area in the plating or stiffener web.

79
Figure 4.7 Set-up for residual stress measurement using the hole-drilling strain-
gauge method

80
0 0.5 1 1.5 2 2.5Drilling depth (mm)
-0.7
-0.6
-0.5
-0.4
-0.3
-0.2
-0.1
0
Stra
in (×
10-3)
GMAW(19A)
FSW(19C)FSW(19D2)
0 0.5 1 1.5 2 2.5Drilling depth (mm)
-0.7
-0.6
-0.5
-0.4
-0.3
-0.2
-0.1
0
Stra
in (×
10-3)
GMAW(19A)
FSW(19C)FSW(19D2)
Figure 4.8 Relationships between drilling depth and released strain in the panel
longitudinal direction at a location in the compressive residual stress zone
Figure 4.9(a) Distribution of residual stress in test structure 19A
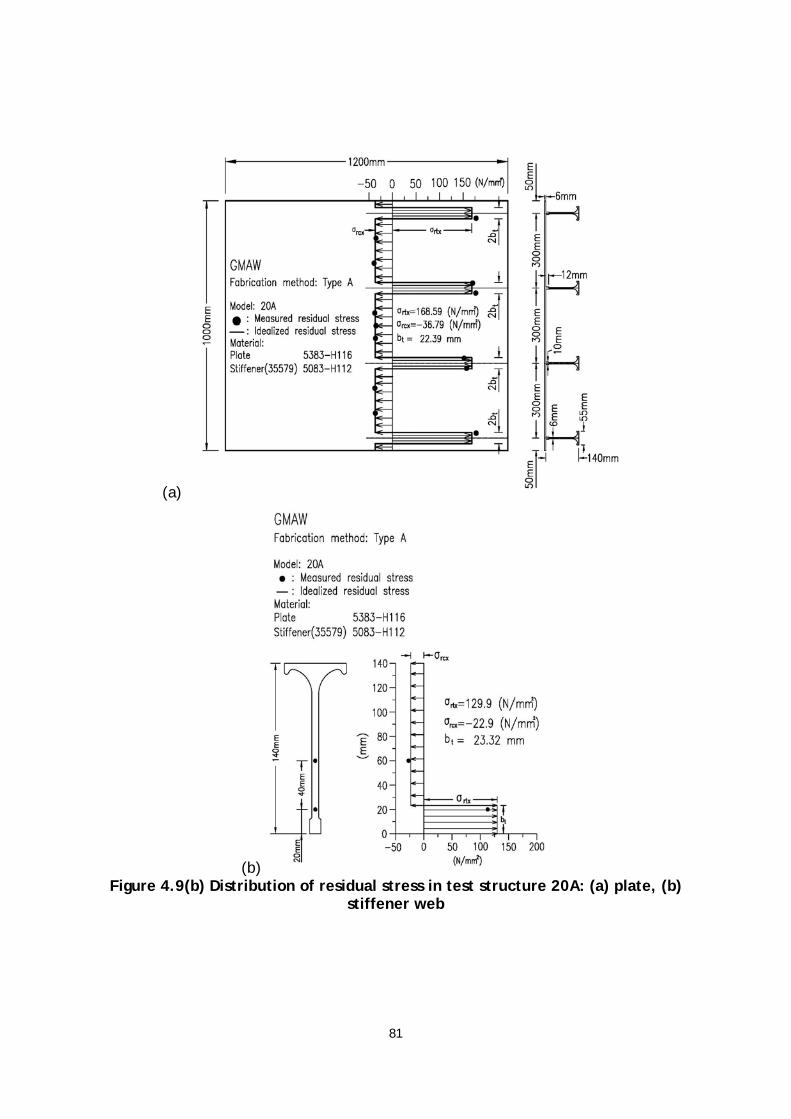
81
(a)
(b) Figure 4.9(b) Distribution of residual stress in test structure 20A: (a) plate, (b)
stiffener web

82
Figure 4.9(c) Distribution of residual stress in test structure 17D
Figure 4.9(d) Distribution of residual stress in test structure 18D

83
Figure 4.9(e) Distribution of residual stress in test structure 19D1
Figure 4.9(f) Distribution of residual stress in test structure 19D2

84
(a)
(b)
Figure 4.9(g) Distribution of residual stress in test structure 20D1: (a) plate, (b) stiffener web

85
(a)
(b)
Figure 4.9(h) Distribution of residual stress in test structure 20D2: (a) plate, (b) stiffener web

86
Figure 4.9(i) Distribution of residual stress in test structure 19C
Figure 4.9(j) Distribution of residual stress in test structure 20C

87
4.5 Properties of the Softened Zone The micro-structural characteristics of the TMAZ may differ from those of the HAZ,
as is illustrated in Figure 2.7 in Chapter 2. For the sake of simplicity, however, the present study applies the following hypotheses.
• The properties of the TMAZ are similar to those of the HAZ. This is because the
two zones exhibit a similar tendency in terms of reduced yield strength, which is of primary concern when evaluating ultimate compressive strength performance.
• The yield strength in the softened zone is equivalent to the tensile residual stress in the corresponding zone. This is based on the fact that the tensile residual stress in the HAZ easily reaches the material yield stress in the case of mild steel (Masubuchi 1980, Paik & Thayamballi 2003).
• The compressive residual stress is in equilibrium with the tensile residual stress over the plate cross-sectional area.
Table 4.2 Mechanical properties of the softened zone in terms of breadth and
reduced yield strength
Full breadth of the softened zone (mm) Reduced yield strength (MPa)
Model Plate Web Plate Web
19A 45.06 23.32* 169.50 129.90*
20A 44.78 23.32 168.59 129.90
17D 37.70 2.67* 163.53 273.78*
18D 36.02 2.49* 163.53 273.78*
19D1 33.76 2.69* 163.53 273.78*
19D2 39.68 2.69* 166.53 150.48*
20D1 34.74 4.74 163.53 308.64
20D2 38.94 4.74 166.53 150.48
19C 16.96 0.0* 141.24 0.0*
20C 19.40 0.0* 147.29 0.0*
Note: *Assumed values; the rest are measured values. Table 4.2 summarizes the mechanical properties of the softened zone in terms of
breadth and reduced yield strength. All of the properties of the plate part are obtained from direct measurements. The properties of the stiffener web are mostly

88
assumed where the reduced yield strength in the softened zone of the stiffener web is considered to be 90% of the yield strength of the base material from the measurements indicated in Figures 4.9(g) and 4.9(h).
Table 4.3 Comparison of initial imperfections in fusion welds versus friction stir welds
Model wopl/(β2t) woc/a wos/a rcx Yp/σ σ YHAZ Yp/σ σ bHAZ
19A 0.022 0.0012 0.00051 -0.179 0.815 22.53
20A 0.036 0.0009 0.00038 -0.177 0.811 22.39
17D 0.023 0.0008 0.00027 -0.174 0.978 18.85
18D 0.023 0.0007 0.00037 -0.165 0.978 18.01
19D1 0.029 0.0006 0.00031 -0.153 0.978 16.88
19D2 0.019 0.0006 0.00048 -0.151 0.801 19.84
20D1 0.022 0.0006 0.00020 -0.158 0.978 17.37
20D2 0.017 0.0010 0.00034 -0.148 0.801 19.47
19C 0.036 0.0008 0.00053 -0.098 0.845 8.48
20C 0.016 0.0004 0.00054 -0.098 0.708 9.70
SSC-4511) 0.096 0.0018 0.001 -0.161 0.7~0.9 23.10
Note: 1) Indicates the average values of initial imperfections due to fusion fillet-welds, obtained from SSC-451.
It is confirmed that the 1 inch rule applies in terms of the breadth of the softened
zone for fusion welds (Models 19A and 20A), as is also indicated in Equation (4.10). For FSW structures, however, it is found that the breadth of the softened zone is equivalent to approximately two times the width of the FSW tool shoulder for lap-joining, where the width of the FSW tool shoulder is denoted by 3d , as defined in Figure 3.4 in Chapter 3, and the breadth of this zone for butt-joining is equivalent to the width of the FSW tool shoulder.
It should be noted that the softened zone properties presented in Table 4.2 are used for the nonlinear finite element method computations of ultimate strength that are discussed in Chapter 6. 4.6 Comparison between Fusion Welds and Friction Stir Welds
The weld-induced initial imperfections of FSW aluminum structures are here compared with those of fusion fillet-welded aluminum structures.

89
0 1 2 3 4 5 6 7 8 9 10 11
0
0.05
0.1
19A 20A 17D 18D 19D1 19D2 20D1 20D2 19C 20C
wop
l/ (β
2 t)
Maximum initial distortion of plating
Fusion weld average level (0.096)
Fusion weld slight level (0.018)
0.022
0.036
0.023 0.023
0.029
0.0190.022
0.017
0.036
0.016
0 1 2 3 4 5 6 7 8 9 10 11
0
0.05
0.1
19A 20A 17D 18D 19D1 19D2 20D1 20D2 19C 20C
wop
l/ (β
2 t)
Maximum initial distortion of plating
Fusion weld average level (0.096)
Fusion weld slight level (0.018)
0.022
0.036
0.023 0.023
0.029
0.0190.022
0.017
0.036
0.016
Figure 4.10(a) Comparison of the maximum initial distortion of the plating in
fusion welds versus friction stir welds
0 1 2 3 4 5 6 7 8 9 10 11
0
0.001
0.002
19A 20A 17D 18D 19D1 19D2 20D1 20D2 19C 20C
Maximum column type initial distortion of stiffener
0.0012
0.0009
0.0008
0.0007
0.0006 0.0006 0.0006
0.0010
0.0008
0.0004
Fusion weld average level (0.0018)
Fusion weld slight level (0.00016)woc
/ a
Figure 4.10(b) Comparison of the maximum column-type initial distortion of the
stiffener in fusion welds versus friction stir welds

90
0 1 2 3 4 5 6 7 8 9 10 11
0
0.0005
0.001
19A 20A 17D 18D 19D1 19D2 20D1 20D2 19C 20C
wos
/ aFusion weld average level (0.001)
Fusion weld slight level (0.000019)
0.00051
0.00038
0.00027
0.00037
0.00031
0.00048
0.00020
0.00034
0.000530.00054
Maximum sideways initial distortion of stiffener
0 1 2 3 4 5 6 7 8 9 10 11
0
0.0005
0.001
19A 20A 17D 18D 19D1 19D2 20D1 20D2 19C 20C
wos
/ aFusion weld average level (0.001)
Fusion weld slight level (0.000019)
0.00051
0.00038
0.00027
0.00037
0.00031
0.00048
0.00020
0.00034
0.000530.00054
Maximum sideways initial distortion of stiffener
Figure 4.10(c) Comparison of the maximum sideways initial distortion of the
stiffener in fusion welds versus friction stir welds
0 1 2 3 4 5 6 7 8 9 10 11
0
0.15
0.3
19A 20A 17D 18D 19D1 19D2 20D1 20D2 19C 20C
σrc
x/ σ
Yp
Compressive residual stress at plating
Fusion weld average level (-0.161)
Fusion weld slight level (-0.110)
-0.179 -0.177 -0.174-0.165
-0.153 -0.151-0.158
-0.148
-0.098 -0.098
Figure 4.10(d) Comparison of the compressive residual stress at the plating in
fusion welds versus friction stir welds

91
0 1 2 3 4 5 6 7 8 9 10 11
0
0.5
1
1.5
σY
HA
Z / σ
Y
Reduced yield strength in the softened zone
0.815 0.811
0.978 0.978 0.978
0.801
0.978
0.8010.845
0.708
19A 20A 17D 18D 19D1 19D2 20D1 20D2 19C 20C
Fusion weld average level :
0.891 (5383-H112)0.777 (5083-H116)
0.774 (5383-H116)0.703 (6082-T6)
Figure 4.10(e) Comparison of the reduced yield strength in the softened zone in
fusion welds versus friction stir welds
0 1 2 3 4 5 6 7 8 9 10 11
0
10
20
30
40
19A 20A 17D 18D 19D1 19D2 20D1 20D2 19C 20C
b HA
Z(m
m)
Breadth of the softened zone
Fusion weld average level (23.1mm)
Fusion weld slight level (11.3mm)
22.53 22.39
18.8518.01
16.58
19.84
17.37
19.47
8.489.70
Figure 4.10(f) Comparison of the softened zone breadth (half value) in fusion
welds versus friction stir welds

92
Table 4.3 and Figure 4.10 present the average values of these initial imperfections, as obtained from the measurements of the test structures in the present study, as well as the slight and average values of the initial imperfections obtained from SSC-451 by fusion fillet-welds (GMAW).
The insights and findings obtained from this comparison of the initial imperfections in fusion fillet-welds versus friction stir lap- and butt-welds are as follows.
• The FSW-induced initial distortions are, in general, smaller than the fusion-weld
induced initial distortions. The plate initial deflection due to friction stir welds is close to the slight level of such deflection due to fusion fillet-welds. The column-type or sideways initial distortion of the stiffeners due to friction stir welds is some 50% of that due to fusion fillet-welds.
• It is observed that the level of the sideways initial distortions of the stiffeners due to FSW butt-joining for test structures 19C and 20C appears to be comparatively large. It is thought, however, that these distortions were inherent in the extrusion production process for these structures rather than arising during FSW. The extrusions of test structures 19C and 20C had wide flanges that may exhibit non-uniform temperature distribution over the flange and web during the cooling process, thus causing larger sideways initial distortions than those in extruded short flanges.
• The level of the compressive residual stress in FSW lap-welds is similar to that in fusion fillet-welds, but the level of the compressive residual in FSW butt-welds is closer to the slight level in fusion fillet-welds.
• The trend in the yield strength reduction in the softened zone depends on the material type. The reduction in this zone due to friction stir welds is similar to that due to fusion welds.
• The breadth of the softened zone in FSW aluminum structures is equal to approximately two times the width of the FSW tool shoulder for lap-joining, but approximately equal to the width of the FSW tool shoulder for butt-joining. This may be because the lap-joining process requires a deeper penetration of the FSW pin than does the butt-joining process, and, subsequently, the HAZ tends to be more likely to expand.

93
Chapter 5 Buckling Collapse Testing 5.1 Test Facilities and Their Set-up
Buckling collapse testing on the stiffened plate structures was performed in a test frame that facilitates a 2000 kN loading actuator at the Ship and Offshore Structural Mechanics Laboratory, the Lloyd’s Register Educational Trust (LRET) Research Centre of Excellence at Pusan National University.
Figure 5.1 shows a typical test structure set-up using this facility. The target structure was positioned vertically in the test frame. The loading actuator generated axial compressive forces in the longitudinal direction of the test plate panels. To apply these forces uniformly over the cross-sectional area of the loaded panel edges, a rigid steel plate was attached to each of the loaded panel edges.
Both the loaded and unloaded edges of the test structures were kept straight and in a simply supported condition, i.e., with zero lateral deflection and zero rotational restraints, during testing.
To accomplish the simply supported condition at the loaded edges, a rigid solid bar with a circular cross section was inserted into each edge, as shown in Figure 5.2. The unloaded edges were supported by a set of two rigid strips bolted to the test panels, as shown in Figure 5.3.
Figure 5.1 Photo of the test set-up for buckling collapse testing

94
Figure 5.2 Photo of the rigid solid bar inserted into the loaded edge
Figure 5.3 Photo of the rigid strips bolted to the test panel at the unloaded edge

95
Figure 5.4 Photo of the strain gauges attached at both the lower and upper ends
of the test structure The axial compressive forces were applied at the neutral axis of the panel cross
section, as shown in Figure 5.2, until and after the test structure had reached its ultimate strength. This was important in avoiding any unnecessary eccentricity-causing additional end moments and ensuring that pure axial compressive forces could be applied. The neutral axis of each test structure was determined using structural mechanics before the start of buckling collapse testing.
It was also important to confirm the precision of the test set-up for each of the test structures in which the test plate panels were subjected to pure and uniform axial compressive forces. For this purpose, a total of eight strain gauges were attached to the plating and stiffeners at both the lower and upper ends of each structure, as shown in Figure 5.4. The axial strains of the structures were measured until axial compressive forces of some 150 kN had been reached, with comparisons made among them, and the neutral axis position of each of those in the test frame was readjusted until the axial strains become almost identical. This was repeated prior to starting the actual buckling collapse testing. However, it was impossible to adjust the change of the neutral axis position in the middle of buckling collapse testing, which can occur due to the local failure of test structures.
The relationships between the axial force and axial displacement of the test structures were recorded with a personal computer. Photographs of the test structures were taken before, during and after ultimate strength was reached.

96
5.2 Test Results and Discussions It is recognized that the following six types of collapse modes are relevant to
stiffened plate structures until ultimate strength is reached (Paik & Thayamballi 2003, Paik & Thayamballi 2007).
• Mode I: Overall collapse after overall buckling, see Figure 5.5(a) • Mode II: Collapse of plating between stiffeners without failure of stiffeners, see Figure 5.5(b) • Mode III: Beam-column type collapse as a plate-stiffener combination, see Figure 5.5(c) • Mode IV: Local buckling of stiffener web, see Figure 5.5(d) • Mode V: Flexural-torsional buckling (tripping) of stiffener, see Figure 5.5(e) • Mode VI: Gross yielding without local buckling
Figure 5.5(a) Mode I: Overall collapse after overall buckling
Figure 5.5(b) Mode II: Collapse of plating without failure of stiffeners

97
Figure 5.5(c) Mode III: Beam-column type collapse as a plate-stiffener combination
Figure 5.5(d) Mode IV: Local buckling of stiffener web
Figure 5.5(e) Mode V: Flexural-torsional buckling (tripping) of stiffener

98
Table 5.1 Summary of the ultimate compressive strength and associated collapse mode of the present test structures
Experiment Model
(Fig. No.) Pp (kN)
Pu (kN) Pu/Pp Collapse
mode Delamination failure
19A (5.6) 1646.9 697.1 0.423 V No delam
20A (5.7) 2139.7 1401.1 0.655 IV No delam
17D (5.8) 2009.4 1006.4 0.501 III One severe delam in post-ULS
18D (5.9) 2003.8 1036.2 0.517 III Two severe delams in post-ULS
19D1 (5.10) 2095.5 1111.9 0.531 III Two severe and one slight delams in post-ULS
19D2 (5.11) 1847.8 939.7 0.509 IV One slight delam in post-ULS
20D1 (5.12) 3161.6 1563.7 0.495 V Two severe delams before ULS
20D2 (5.13) 2299.8 1561.9 0.679 IV Three slight delams in post-ULS
19C (5.14) 1583.5 784.6 0.495 II Two severe and one slight delams in post-ULS
20C (5.15) 1999.1 1166.0 0.583 IV Two severe and one slight delams before ULS
Note: Pu = ultimate compressive force; Pp = fully plastic axial force = i Yii
A σ∑ , with iA =
area of (i)th cross-section and Yiσ = material yield strength of the (i)th cross-section.
In the following sections, the buckling collapse strength characteristics of each of
the test structures are described, where the details of extrusion profiles and dimensions, and weld methods are indicated in Tables 3.6(a) to 3.8(a) and Table 3.9. Table 5.1 summarizes the ultimate compressive strength and associated collapse mode of the test structures obtained from the buckling collapse testing.
5.2.1 Fusion Fillet-welded Structures 19A and 20A
Figures 5.6(a) and 5.7(a) show the relationships between the axial compressive

99
force and axial compressive displacement for test structures 19A and 20A, respectively. The fully plastic axial force of each structure without consideration of buckling is also plotted. The details of the test structures in terms of material type, extrusion type, and weld method together with the structural dimensions are described in Chapter 3.
The ultimate compressive strength ( uP ) normalized by the fully plastic force ( pP ) is indicated in Table 5.1. The ultimate strength ratio to the fully plastic axial force is an indicator of representing the severity of local failures in which the ultimate strength ratio becomes smaller as local failure occurs earlier and/or more severely.
Test structure 19A reached its ultimate strength via Collapse Mode V (tripping), as shown in Figure 5.6(b), while test structure 20A collapsed via Mode IV (local buckling of stiffener web), as shown in Figure 5.7(b). No local failure including delamination in the fusion welded area occurred in both 19A and 20A until and after ultimate strength had been reached.
0 4 8 12 16
0
400
800
1200
1600
2000
Displacement (mm)
Forc
e (k
N)
Experiment
Pu=697.1kN
Pp=1646.9kN
Model 19A
Pu: Ultimate strength
Pp: Full plastic strength
Figure 5.6(a) Relationship between axial compressive force and axial compressive
displacement for test structure 19A

100
Figure 5.6(b) Photo of Collapse Mode V in test structure 19A

101
Displacement (mm)
Forc
e (k
N)
Experiment
Model 20A
Pp=2139.7kN
Pu=1404.1kN
0 4 8 12 16
0
500
1000
1500
2000
2500
Pu: Ultimate strength
Pp: Full plastic strength
Figure 5.7(a) Relationship between axial compressive force and axial compressive
displacement for test structure 20A

102
Figure 5.7(b) Photo of Collapse Mode IV in test structure 20A
5.2.2 FSW Lap-joined Structures 17D, 18D, 19D1, 19D2, 20D1 and 20D2
Figures 5.8(a) to 5.13(a) show the relationships between the axial compressive force and axial compressive displacement for test structures 17D, 18D, 19D1, 19D2, 20D1, and 20D2, respectively. The fully plastic axial force of each structure without consideration of buckling is also plotted. The ultimate strength of each structure normalized by the fully plastic capacity is presented in Table 5.1.
Each of three test structures 17D, 18D and 19D1 reached its ultimate strength via Collapse Mode III (beam column-type collapse), as shown in Figure 5.8(b). Test structure 20D1 showed Collapse Mode V (flexural-torsional buckling of the stiffener) similar to that as shown in Figure 5.6(b), while test structures 19D2 and 20D2 reached their ultimate strength via Collapse Mode IV (local buckling of stiffener web) similar to that as shown in Figure 5.7(b).
For all the FSW lap-joined test structures, delamination occurred across the entire width of the friction stir-welded area of stiffeners, as those shown in Figures 5.8(b) to 5.13(b) which are photos taken at the end of testing. Most structures showed the delamination failure after ultimate strength had been reached. However, in test structure 20D1, severe delamination in two stiffeners occurred, starting before the ultimate compressive strength had been reached.
It is surmised that such a delamination must have contributed to the collapse of this structure to some large extent. In fact, the ultimate strength ratio of test structure 20D1 to the fully plastic axial force is unusually small as will be discussed in Chapter 6, by a comparison with nonlinear finite element method computations.
This caused speculation about the quality of the friction stir-welding (FSW) lap-

103
joining technology, although the delamination mostly occurred after the structures had reached ultimate strength, except for one structure, i.e., 20D1.
The post-collapse delamination in lap-welded structures, i.e., with base plate and extruded stiffeners, may not be of major concern because it can still maintain the water tightness of the stiffened plate structures. However, the pre-collapse delamination can reduce the ultimate compressive strength significantly.
It is recognized that the performance of friction stir-welded region is significantly affected by the welding parameters such as width and depth of molten metal thin layer, molten temperature, rotating and forwarding speeds, and possible quick cooling, etc. (Cavaliere et al. 2009, Lombard et al. 2009, Zhang & Zhang 2009a, 2009b). Therefore, further study is required to establish optimum parameters of the FSW process and also investigate the compressive strength properties and delamination in the friction stir lap-welded region.
0 4 8 12 16
0
500
1000
1500
2000
2500
Displacement (mm)
Forc
e (k
N)
Experiment
Model 17D
Pu=1006.4kN
Pp=2009.4kN
Pu: Ultimate strength
Pp: Full plastic strength
Figure 5.8(a) Relationship between axial compressive force and axial compressive
displacement for test structure 17D

104
Figure 5.8(b) Photo of Collapse Mode III in test structure 17D
Model 17DSevere
Delamination length= 140mm
Figure 5.8(c) Photo of the delamination failure in test structure 17D, taken at the end of testing

105
0 4 8 12 16
0
500
1000
1500
2000
2500
Displacement (mm)
Forc
e (k
N)
Experiment
Pu=1036.2kN
Pp=2003.8kN
Model 18D
Pu: Ultimate strength
Pp: Full plastic strength
Figure 5.9(a) Relationship between axial compressive force and axial compressive
displacement for test structure 18D

106
Model 18DSevere
Delamination length= 360mmDelamination length= 400mm
Figure 5.9(b) Photo of the delamination failure in test structure 18D, taken at the end of testing

107
Displacement (mm)
Forc
e (k
N)
Experiment
Model 19D1
Pp=2095.5kN
Pu=1111.9kN
0 4 8 12 16
0
500
1000
1500
2000
2500
Pu: Ultimate strength
Pp: Full plastic strength
Figure 5.10(a) Relationship between axial compressive force and axial compressive displacement for test structure 19D1

108
Model 19D1SevereSlight
Delamination length= 300mmDelamination length= 160mm
Delamination length= 210mm Figure 5.10(b) Photo of the delamination failure in test structure 19D1, taken at
the end of testing

109
Displacement (mm)
Forc
e (kN
)
Experiment
Model 19D2
Pp=1847.8kN
Pu=939.7kN
0 4 8 12 16
0
500
1000
1500
2000
2500
Pu: Ultimate strength
Pp: Full plastic strength
Figure 5.11(a) Relationship between axial compressive force and axial compressive displacement for test structure 19D2

110
Model 19D2Slight
Delamination length= 140mm
Figure 5.11(b) Photo of the delamination failure in test structure 19D2, taken at
the end of testing

111
Displacement (mm)
Forc
e (k
N)
Experiment
Model 20D1Pp=3161.6kN
Pu=1563.7kN
0 5 10 15 20
0
500
1000
1500
2000
2500
3000
3500
Pu: Ultimate strength
Pp: Full plastic strength
Figure 5.12(a) Relationship between the axial compressive force and axial compressive displacement for test structure 20D1

112
Model 20D1Severe
Delamination length= 300mmDelamination length= 140mm
Figure 5.12(b) Photo of the delamination failure in test structure 20D1, taken at the end of testing

113
0 4 8 12 16
0
500
1000
1500
2000
2500
Displacement (mm)
Forc
e (k
N)
Experiment
Model 20D2Pp=2299.8kN
Pu=1561.9kN
Pu: Ultimate strength
Pp: Full plastic strength
Figure 5.13(a) Relationship between axial compressive force and axial compressive displacement for test structure 20D2

114
Model 20D2Slight
Delamination length= 230mmDelamination length= 230mm
Delamination length= 220mm Figure 5.13(b) Photo of the delamination failure in test structure 20D2, taken at
the end of testing
5.2.3 FSW Butt-joined Structures 19C and 20C Figures 5.14(a) and 5.15(a) show the relationships between the axial compressive
force and axial compressive displacement for test structures 19C and 20C, respectively. The fully plastic axial force without consideration of buckling is also plotted. The ultimate strength of these structures normalized by the fully plastic capacity is indicated in Table 5.1. Test structure 19C reached its ultimate strength via Collapse Mode II (collapse of the plating without failure of the stiffeners), as shown in Figure 5.14(b), while test structure 20C showed Collapse Mode IV (local buckling of stiffener web), as shown in Figure 5.15(b).
Delamination also occurred in the FSW butt-joined area between plates, as those shown in Figure 5.14(c) and 5.15(b). Test structure 19C showed delamination after the ultimate strength had been reached, but delamination occurred in test structure 20C prior to the ultimate strength. Again, it is thought that the ultimate strength of test structure 20C is unusually small compared to nonlinear finite element computations presented in Chapter 6.

115
0 4 8 12 16
0
400
800
1200
1600
2000
Displacement (mm)
Forc
e (k
N)
Experiment
Model 19C
Pp=1583.5kN
Pu=784.6kN
Pu: Ultimate strength
Pp: Full plastic strength
Figure 5.14(a) Relationship between axial compressive force and axial compressive displacement for test structure 19C
It is interesting to note that the delaminations in the friction stir butt-welds have
occurred only at one free edge of the butt joint but not at both free edges, with the configuration of the butt welds described in Table 3.9 of Chapter 3.
The pre-collapse delamination in friction stir butt-welded structures can of course reduce the ultimate compressive strength performance significantly. Also, the pre- or post-collapse delamination in friction stir butt-welded structures should be of great concern because the water tightness of the stiffened plate structure can not be assured anymore. In this regard, the friction stir lap-weld method may be more promising than the friction stir butt-weld method, because the post-collapse delamination is not of major concern in the friction stir lap-welded structures.

116
Further study is recommended to manage the quality assurance in the friction stir butt-welded region in association with the mechanical property and delamination, similar to the friction stir lap-welded region as described in Section 5.2.2.
Figure 5.14(b) Photo of Collapse Mode II in test structure 19C

117
Model 19CSevereSlight
Delamination length= 240mmDelamination length= 170mm
Delamination length= 200mm Figure 5.14(c) Photo of the delamination failure in test structure 19C, taken at the
end of testing
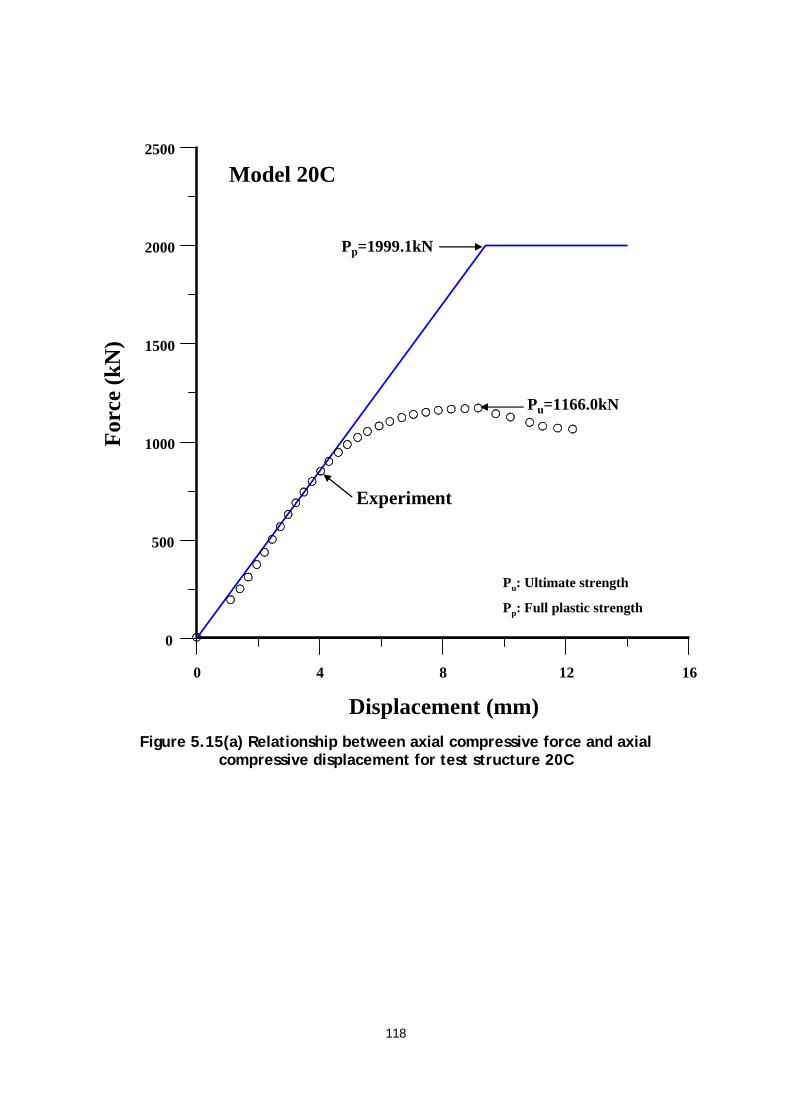
118
Displacement (mm)
Forc
e (k
N)
Experiment
Model 20C
Pp=1999.1kN
Pu=1166.0kN
0 4 8 12 16
0
500
1000
1500
2000
2500
Pu: Ultimate strength
Pp: Full plastic strength
Figure 5.15(a) Relationship between axial compressive force and axial compressive displacement for test structure 20C

119
Figure 5.15(b) Photo of Collapse Mode IV in test structure 20C
Model 20CSevereSlight
Delamination length= 100mm
Delamination length= 130mm
Delamination length= 140mm
Delamination length= 210mm
Figure 5.15(c) Photo of the delamination failure in test structure 20C, taken at the
end of testing

120
5.3 SSC-451 Database Figures 5.16 to 5.27 show the relationships between the axial compressive force
and axial compressive displacement for the fusion-welded test structures in SSC-451, until and after ultimate strength had been reached, where the details of the extrusion profiles and dimensions, and weld methods are indicated in Tables 3.6(b) to 3.8(b) and Table 3.9. Table 5.2 summarizes the ultimate compressive strength and associated collapse mode of the structures.
Table 5.2 Summary of the ultimate compressive strength and associated collapse mode for the SSC-451 test structures
Experiment Model
(Fig. No.) Pp (kN)
Pu (kN) Pu/Pp Collapse mode Delamination failure
5 (5.16) 1831.3 777.8 0.425 III No
6 (5.17) 1831.2 918.0 0.501 III No
7 (5.18) 1903.4 931.8 0.490 III No
8 (5.19) 2482.8 1513.8 0.610 V No
17 (5.20) 2049.0 778.0 0.380 III No
18 (5.21) 2048.8 829.6 0.405 III No
19 (5.22) 2160.5 970.5 0.449 III,IV No
20 (5.23) 3057.1 1659.2 0.543 III,IV No
29 (5.24) 1645.1 791.0 0.481 V No
30 (5.25) 1645.0 908.7 0.552 V No
31 (5.26) 1717.2 895.9 0.522 III,IV No
32 (5.27) 2296.6 1367.3 0.595 III,IV No
Note: Pu = ultimate compressive force; Pp = fully plastic axial force = i Yii
A σ∑ where iA =
area of the (i)the cross-section and Yiσ = material yield strength of the (i)th cross-section.

121
All the test structures reached the ultimate strength by an anticipated collapse mode. Most structures showed one distinct collapse mode until ultimate strength had been reached, but test structures 19, 20, 31 and 32 collapsed via combined modes of III (beam-column type collapse) and IV (local buckling of stiffener web). No delamination failure occurred in the fusion welded area of all the SSC-451 test structures.
The ultimate compressive strength performance of these test structures was then compared with that for the FSW test structures investigated in the present project as discussed in Chapters 6 and 7.
Displacement (mm)
Forc
e (k
N)
Experiment
Model 5
Pu: Ultimate strength
Pp: Full plastic strength
Pp=1831.3kN
Pu=777.8kN
0 4 8 12 16
0
500
1000
1500
2000
2500
Figure 5.16 Relationship between axial compressive force and axial compressive displacement for test structure 5 in SSC-451

122
Displacement (mm)
Forc
e (k
N)
Experiment
Model 6
0 4 8 12 16
0
500
1000
1500
2000
2500
Pu: Ultimate strength
Pp: Full plastic strength
Pu=917.97kN
Pp=1831.18kN
Figure 5.17 Relationship between axial compressive force and axial compressive
displacement for test structure 6 in SSC-451

123
Displacement (mm)
Forc
e (k
N)
Experiment
Model 7
Pp=1903.4kN
Pu=931.8kN
0 4 8 12 16
0
500
1000
1500
2000
2500
Pu: Ultimate strength
Pp: Full plastic strength
Figure 5.18 Relationship between axial compressive force and axial compressive
displacement for test structure 7 in SSC-451

124
0 4 8 12 16
0
500
1000
1500
2000
2500
3000
Model 8
Experiment
Pu=1513.75kN
Pp=2482.8kN
Pu: Ultimate strength
Pp: Full plastic strength
Figure 5.19 Relationship between axial compressive force and axial compressive
displacement for test structure 8 in SSC-451

125
0 4 8 12 16
0
500
1000
1500
2000
2500
Displacement (mm)
Forc
e (k
N)
Experiment
Pu=778.0kN
Pp=2049.0kN
Model 17
Pu: Ultimate strength
Pp: Full plastic strength
Figure 5.20 Relationship between axial compressive force and axial compressive
displacement for test structure 17 in SSC-451

126
Displacement (mm)
Forc
e (k
N)
Experiment
Model 18
Pp=2048.8kN
Pu=829.6kN
0 4 8 12 16
0
500
1000
1500
2000
2500
Pu: Ultimate strength
Pp: Full plastic strength
Figure 5.21 Relationship between axial compressive force and axial compressive
displacement for test structure 18 in SSC-451

127
Displacement (mm)
Forc
e (k
N)
Experiment
Model 19
Pp=2160.5kN
Pu=970.5kN
0 4 8 12 16
0
500
1000
1500
2000
2500
Pu: Ultimate strength
Pp: Full plastic strength
Figure 5.22 Relationship between axial compressive force and axial compressive
displacement for test structure 19 in SSC-451

128
Displacement (mm)
Forc
e (k
N)
Experiment
Model 20Pp=3057.1kN
Pu=1659.2kN
0 5 10 15 20
0
500
1000
1500
2000
2500
3000
3500
Pu: Ultimate strength
Pp: Full plastic strength
Figure 5.23 Relationship between axial compressive force and axial compressive
displacement for test structure 20 in SSC-451

129
0 4 8 12 16
0
400
800
1200
1600
2000
Displacement (mm)
Forc
e (k
N)
Experiment
Model 29
Pp=1645.1kN
Pu=791.0kN
Pu: Ultimate strength
Pp: Full plastic strength
Figure 5.24 Relationship between axial compressive force and axial compressive
displacement for test structure 29 in SSC-451

130
0 4 8 12 16
0
400
800
1200
1600
2000
Displacement (mm)
Forc
e (k
N)
Experiment
Model 30
Pp=1645.0kN
Pu=908.7kN
Pu: Ultimate strength
Pp: Full plastic strength
Figure 5.25 Relationship between axial compressive force and axial compressive
displacement for test structure 30 in SSC-451

131
0 4 8 12 16
0
400
800
1200
1600
2000
Displacement (mm)
Forc
e (k
N)
Model 31
Pu: Ultimate strength
Pp: Full plastic strength
Experiment
Pp=1717.2kN
Pu=895.9kN
Figure 5.26 Relationship between axial compressive force and axial compressive
displacement for test structure 31 in SSC-451

132
Displacement (mm)
Forc
e (k
N)
Experiment
Model 32 Pp=2296.6kN
Pu=1367.3kN
0 4 8 12 16
0
500
1000
1500
2000
2500
Pu: Ultimate strength
Pp: Full plastic strength
Figure 5.27 Relationship between axial compressive force and axial compressive
displacement for test structure 32 in SSC-451

133
Chapter 6 Nonlinear Finite Element Method Computations 6.1 Structural Modeling
The ANSYS (2008) nonlinear finite element method was employed to compute the ultimate strength behavior of the test structures. The following describes the structural modeling technique applied in the present study.
6.1.1 Extent of the Analysis
It is desirable to extend the extent of the analysis to the entire structure under consideration. If the funds available for structural modeling and computation are limited, however, only a part of the target structure may be included in the finite element modeling.
If only a partial structure is involved in the analysis, then it is important to realize that an artificial boundary is often formed for the target structure, and thus it must be modeled as appropriate in conjunction with mathematics and engineering.
Current practices in the maritime industry show that structural modeling with analysis to a partial extent provides reasonable solutions that are good enough for the practical purposes of structural design and strength assessment as long as the boundary conditions among the other factors are idealized in a relevant way.
The analysis of a partial structure usually involves a cut out of the target structure with respect to the symmetric boundary in terms of structural deformations and failure modes. The extent of the analysis should, in fact, be expanded if possible to reflect the boundary conditions of the target structure more realistically.
Figure 6.1 presents some examples that show the extent of the analysis for the plates and stiffened plate structures. In SSC-451, the two-bay plate-stiffener combination model shown in Figure 6.1(c) was employed to save computational efforts on the 78 test structures.
b2
b2
a2
a2
Figure 6.1(a) A quarter model for a rectangular plate under uniaxial compression

134
be
Figure 6.1(b) A one-bay plate-stiffener combination model for a stiffened plate
structure under uniaxial compression
be
Transverse frames
Figure 6.1(c) A two-bay plate-stiffener combination model for a stiffened plate
structure under uniaxial compression
Transverse frames
Figure 6.1(d) A one-bay stiffened panel model for a stiffened plate structure under
uniaxial compression

135
Transverse frames
Figure 6.1(e) A two-bay stiffened panel model for a stiffened plate structure under
uniaxial compression
Figure 6.1(f) A three-bay stiffened panel model for a stiffened plate structure
under uniaxial compression
In the present study, the three-bay stiffened panel model shown in Figure 6.1(f)
was employed, although the target structure is the plate panel in the middle. This model was adopted because it was able to reflect the nonlinear behavior of the entire stiffened plate structure more realistically. However, transverse frames were not included in the structural modeling, although the support condition at the transverse frames was modeled as appropriate, as will be described in Section 6.1.7. 6.1.2 Types of Finite Elements
A variety of finite element types are available in practice, but it is difficult to establish specific guidelines about which types of finite elements are the best to apply. For the nonlinear analysis of thin-walled or plated structures, however, current practice indicates that the rectangular type of plate-shell elements is more appropriate than the triangular type, because this type more easily defines the membrane stress components inside each element when the Cartesian coordinate system is applied.
For the nonlinear analysis of ships and offshore structures, in association with ultimate limit states and structural crashworthiness, therefore, four-node plate-shell elements are more often employed, in which the nodal points in the plate thickness direction are located in the mid-thickness of each element, thus indicating that no

136
element mesh is assigned to the thickness layers. To reflect nonlinear behavior more accurately, the use of plate-shell elements is
desirable in the modeling of support members, including both webs and flanges as well as plate parts, although beam elements are sometimes more efficient for modeling these members or at least the flanges.
In the present study, four-node plate-shell elements were employed for the structural modeling. The stiffener web and flange and the plating were all modeled using four-node plate-shell elements.
Figure 6.2 represents a view of the finite element models of all the test structures at the y-z plane. It is noted that the sectional profile of extruded stiffener web has non-uniform wall thickness as shown in Figure 3.9 of Chapter 3, and thus it is modeled by multiple elements with a uniform-thickness per each element as shown in Figure 6.2. Also, a single element is allocated for the softened zone of the stiffener web as of the plate part.
Model 19A
yz
Figure 6.2(a) A view of the finite element model of test structure 19A in the y-z
plane
Figure 6.2(b) A view of the finite element model of test structure 20A in the y-z
plane
zy
Model 17D Figure 6.2(c) A view of the finite element model of test structure 17D in the y-z
plane

137
zy
Model 18D Figure 6.2(d) A view of the finite element model of test structure 18D in the y-z
plane
Model 19D1y
z
Figure 6.2(e) A view of the finite element model of test structure 19D1 in the y-z
plane
Model 19D2y
z
Figure 6.2(f) A view of the finite element model of test structure 19D2 in the y-z
plane
zy
Model 20D1 Figure 6.2(g) A view of the finite element model of test structure 20D1 in the y-z
plane

138
zy
Model 20D2 Figure 6.2(h) A view of the finite element model of test structure 20D2 in the y-z
plane
Model 19C
yz
Figure 6.2(i) A view of the finite element model of test structure 19C in the y-z
plane
Model 20C
yz
Figure 6.2(j) A view of the finite element model of test structure 20C in the y-z
plane
6.1.3 Size of the Finite Elements
Although finer mesh modeling certainly results in more accurate solutions, it is not necessarily the best practice. A similar degree of accuracy can actually be attained with coarser mesh modeling, which requires less computational cost.
A convergence study is usually required to determine the ‘best size’ for the finite element mesh by balancing computational cost with the resulting accuracy. In such a study, sample applications of the corresponding nonlinear analysis are made by varying the element mesh size and searching for the largest finite element size that provides a sufficient level of accuracy.
Although a convergence study is often able to provide best practice for nonlinear finite element modeling in terms of a determination of the relevant mesh size, such a study itself sometimes requires a lot of computational effort. Therefore, useful guidance is necessary to define the finite element mesh size without a convergence

139
study. Current practice for the ultimate strength analysis of stiffened plate structures
that involve an elastic-plastic large deflection response indicates that at least eight four-node plate-shell elements are required to model the plating in between the small support members (e.g., the longitudinal stiffeners). The size of these plate-shell elements is assigned in the plate length direction so that the aspect ratio of each finite element is almost unity, which is desirable. The number of stiffener webs in the web height direction may be more than six using four-node plate-shell elements, and the number of stiffener flanges in the flange breadth direction may be at least two.
In the present study, a total of 16 four-node plate-shell elements were allocated for the plating between the longitudinal stiffeners in the transverse direction. For the stiffener web, a total of eight four-node plate-shell elements were assigned in the stiffener height direction for test structures 20D1 and 20D2, which had a deeper web height. For the remaining test structures, a total of six elements were employed. The stiffener flanges were modeled using four plate-shell elements, i.e., there were two elements on each side of the flanges with respect to the center line. Figure 6.2 also represents the size of the finite elements for the test structures.
As also discussed in Section 6.1.6, non-continuity or a sharp change in the material properties and residual stresses occurs around the softened zone. This may cause additional nonlinearity, and therefore a finer set of finite elements may need to be assigned in this region. However, it has been found that the finite element method model with a single element in the softened zone in the transverse (panel-breadth) direction gives sufficiently good computations within 0.5% deviations in terms of the ultimate strength behavior. Thus, the present study assigned a single element in the softened zone for the nonlinear finite element method computations. 6.1.4 Material Models – Base Material and Softened Zone
The ultimate strength behavior of structures almost always involves material nonlinearity in association with plasticity or yielding, among other factors. For nonlinear finite element analysis, therefore, the characteristics of material behavior should be modeled as appropriate in terms of the stress versus strain relationship.
It is, of course, desirable to employ a realistic relationship between the stresses and strains of the materials that is obtained by a direct test program that covers pre-yielding behavior, yielding, post-yielding behavior, including the strain-hardening effect, ultimate strength, and post-ultimate strength behavior, including the necking effect. This is particularly important for the analysis of structural crashworthiness made necessary by accidental events.
In the present study, the stress-strain curves of the base materials used for the test structures were obtained by tensile coupon tests, as described in Chapter 3. These data were used directly for the finite element analyses presented here, i.e., the entire history of the stress-strain relationship, including the strain-hardening effect, is considered.
However, it was not possible to obtain test results for the stress-strain curves of the materials in the softened zone, although their reduced yield strength was approximately defined, as described in Chapter 4. For the finite element method computations presented here, therefore, the material model illustrated in Figure 6.3

140
was applied to the materials in the softened zone. In this model, the post-yield behavior of these materials was considered to be similar to that of the base material, whereas the elastic modulus remained unchanged and the yield strength was reduced.
Base material
Material in the softened zone
Base material
Material in the softened zone
Figure 6.3 A material model for materials in the softened zone in terms of the
relationship between the stress (σ ) and the strain ( ε ) 6.1.5 Conditions at the Boundaries and Supports
Figure 6.4 shows the nonlinear finite element model applied to compute the ultimate strength behavior of the test structures.
The boundary and support conditions applied in the numerical computations are as follows.
• Loaded edges (AB, GH): These remain straight in both the x and z directions over their entirety, including the plate part and the extruded stiffeners. The extruded stiffeners remain upright in both the x and y directions, although they are able to move in parallel in the transverse (y) direction. The deformations in the z direction, i.e., the lateral deflections, are unrestrained.
• Unloaded edges (ACEG, BDFH): These remain straight in the y direction over their entirety. The deformations in the z direction are unrestrained.
• Supports at the transverse frames (CD, EF): The deformations of the plate part in the z direction are restrained. The extruded stiffeners remain upright in the y direction, and may or may not rotate about the y axis, i.e., at the transverse frames in the x direction. For the long and slender stiffeners with a relatively large column slenderness ratio (λ ) value, the transverse frames may keep them upright in both the x and y directions. The extruded stocky-stiffeners with a relatively small column slenderness ratio value, however, are able to rotate in the x direction, but remain upright in the y direction. Test structures 17D and 18D, which have a column

141
slenderness ratio greater than 0.9, are modeled such that the extruded stiffeners at the transverse frames keep them upright in both the x and y directions. For the remainder of the test structures, the extruded stiffeners at the transverse frames are able to rotate about the y axis, although they remain upright in the y direction. To resolve this issue more satisfactorily, it is desirable to include the transverse frames themselves in the finite element modeling, but allow the rotational degree of freedom associated with the upright condition of the stiffeners at the transverse frames in both the x and y directions. Further studies are recommended in this regard.
X
YZ
σx
σx
Trans. frame
Trans. frame
A
C
D
G
H
E
F
xy
z
a
a
a
B
b
b
b
B
bs
bs
X
YZ
X
YZ
σx
σx
Trans. frame
Trans. frame
A
C
D
G
H
E
F
xy
z
a
a
a
B
bb
bb
bb
B
bsbs
bsbs
Figure 6.4 Nonlinear finite element model for the test structures
6.1.6 Loading Condition Longitudinal axial compressive actions are applied via the nodal points at the two
loaded edges, thus generating uniformly distributed axial compressive stresses in the x direction. 6.1.7 Initial Distortions
Three types of initial distortions, namely, plate initial deflection, the column-type initial distortion of the stiffener, and the sideways initial distortion of the stiffener are considered here. For plate initial deflection, the maximum value of the initial deflection on the three plates of each test structure is taken as the reference initial

142
deflection value *oplw , and the shape of the initial deflection for each plate is
assumed to be as follows.
*opl opl
m x yw w sin sina bπ π
= , (6.1)
where m is the buckling half-wave number of the plate, which is taken as 4 for the test structures.
The maximum value of the column-type initial distortions on the four stiffeners of
each test structure is taken as the reference initial distortion value *ocw , and the
shape of the initial distortion for the entire plate panel is assumed to be as follows.
*oc oc
x yw w sin sina Bπ π
= . (6.2)
Finally, the maximum value of the sideways initial distortions of the four stiffeners
of each test structure is taken as the reference initial distortion value *osw , and the
shape of the initial distortion for each stiffener is assumed to be as follows.
*os os
w
z xw w sinh a
π= , (6.3)
where z is the coordinate in the stiffener height direction.
These three types of initial distortions are superimposed on the target structures and allocated in the coordinates via the nodal points, as appropriate.
Directions of column-type initial distortions of stiffeners can govern the stiffened panel collapse patterns and result in the plate-induced failure or stiffener-induced failure. In this regard, two types of the column-type initial distortion direction of stiffeners, i.e., compression in plate (CIP) and compression in stiffener (CIS), are considered in the present finite element method computations.
The CIP type represents the column-type initial distortion of stiffeners in the central panel of the structure in which the plate part is subjected to compression and the stiffener side is subjected to tension. The CIS type indicates an opposite situation to that of the CIP type. Figure 6.5 represents schematics of the abovementioned CIP and CIS types of the column initial distortion of stiffeners, which reflect the conditions at the boundaries and supports as described in Section 6.1.5. While the cross sections of the structure at the loaded edges are kept both plane and upright, the cross sections of the structure at the transverse frames may or may not keep upright, that is, may not or may rotate with regard to the y axis, although they still remain plane.
As discussed in Section 6.1.5, the nonlinear finite element method computations of test structures 17D and 18D with the slender stiffeners presume the condition in that the cross sections at the transverse frames remain upright.
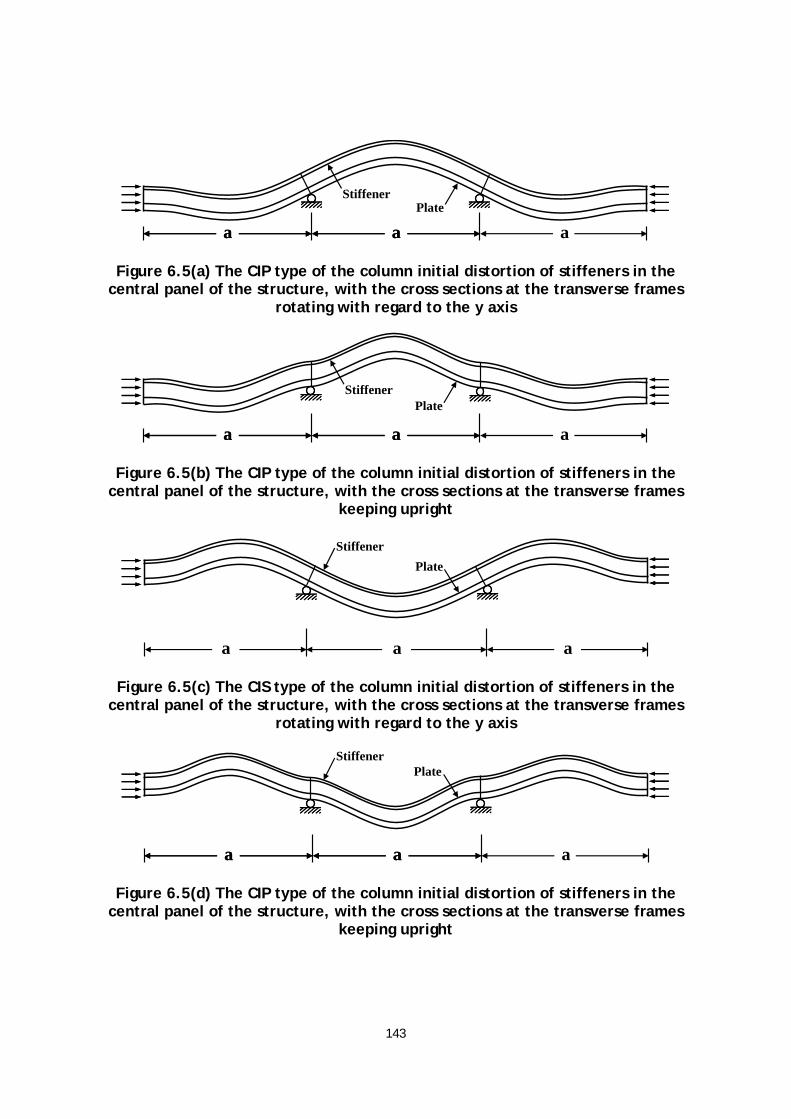
143
StiffenerPlate
aa aaa
Figure 6.5(a) The CIP type of the column initial distortion of stiffeners in the central panel of the structure, with the cross sections at the transverse frames
rotating with regard to the y axis
StiffenerPlate
aa aaa
Figure 6.5(b) The CIP type of the column initial distortion of stiffeners in the central panel of the structure, with the cross sections at the transverse frames
keeping upright
PlateStiffener
a aa
Figure 6.5(c) The CIS type of the column initial distortion of stiffeners in the central panel of the structure, with the cross sections at the transverse frames
rotating with regard to the y axis
PlateStiffener
aa aaa
Figure 6.5(d) The CIP type of the column initial distortion of stiffeners in the central panel of the structure, with the cross sections at the transverse frames
keeping upright

144
6.1.8 Welding Residual Stresses Welding residual stresses, which are composed of tensile residual stress blocks and
compressive residual stress blocks, were dealt with as initial stresses in the structures. Initial strains, which are possibly caused by heating and cooling down in association
with residual stresses, may or may not affect the ultimate strength behavior, but the present study neglects the effects of such strains. Further studies are recommended to consider this issue.
One remaining issue is how to allocate the number of finite elements in the region of the tensile residual stress blocks that corresponds to the softened zone. This is important, because non-continuity or a sharp change in the residual stress distribution occurs around this zone. However, it was found that a single finite element in the softened zone was sufficient for the nonlinear finite element method computations, as described in Section 6.2. This finding is also available for steel-plated structures (Paik & Sohn 2009).
In the present study, the idealized distributions of the residual stresses described in Chapter 4 were applied for the numerical computations.
6.2 Computational Results and Discussions
Figures 6.6 to 6.15 show the relationships between the axial compressive force and the axial compressive displacement of the test structures.
The results of the CIS computations indicate an opposite condition to those of the CIP, that is, the stiffener flange side is subjected to compression while the plate side is subjected to tension. These computations were also carried out both with and without residual stresses and softening effects.
Tables 6.1 and 6.2 summarize the ultimate compressive strength computations by a comparison with experimental results. In Table 6.2, the ultimate compressive forces Pu obtained by FEA indicates a smaller value of the ultimate compressive forces computed by either CIP or CIS with the residual stress and softening effects. The ultimate strength ratio to the fully plastic force indicates the severity of local failures in the structures until the ultimate strength reached. In other words, the ultimate strength ratio becomes smaller as the local failures occur earlier and/or more severely. In general, more stocky structures will have a larger value of the ultimate strength ratio or more slender structures will have a smaller value of the ultimate strength ratio. This is because the stocky structures may buckle involving a certain degree of plasticity although the slender structures may buckle in the elastic regime.
It is found from Figures 6.6 to 6.15 that the residual stresses and softening phenomena significantly reduce the ultimate strength performance. The nonlinear finite element method computations for both the CIP and CIS column-type initial distortions of the stiffeners taking into account the effects of residual stresses and softening provide good agreement with the experimental results, except for structures 20D1 and 20C, which unintentionally collapsed earlier through delamination in the friction stir-welded region rather than via buckling collapse. However, it is important to realize that the nonlinear finite element method computations depend significantly on the structural modeling techniques applied.

145
Table 6.1 Summary of the ultimate compressive strength computations for the test structures in terms of the ultimate compressive stress normalized by the
equivalent yield stress
FEA
Without residual stress and softening
With residual stress and softening Experiment
CIP CIS CIP CIS
Model (Fig. No.)
σxu/σYeq Collapse
mode σxu/σYeq σxu/σYeq σxu/σYeq σxu/σYeq
19A (6.6) 0.429 Ⅴ 0.514 0.512 0.433 0.433
20A (6.7) 0.649 Ⅳ 0.759 0.745 0.692 0.663
17D (6.8) 0.512 Ⅲ 0.616 0.609 0.549 0.536
18D (6.9) 0.531 Ⅲ 0.649 0.649 0.599 0.590
19D1 (6.10) 0.545 Ⅲ 0.572 0.569 0.500 0.499
19D2 (6.11) 0.504 Ⅴ 0.591 0.588 0.530 0.529
20D11) (6.12) 0.511 Ⅳ 0.837 0.835 0.779 0.779
20D2 (6.13) 0.673 Ⅳ 0.837 0.823 0.753 0.733
19C (6.14) 0.571 Ⅱ 0.612 0.621 0.598 0.606
20C1) (6.15) 0.577 Ⅳ 0.780 0.777 0.753 0.749
Note: 1) Test structure that unintentionally collapsed through delamination in the friction stir-welded region; Collapse mode is as defined in Section 5.1; CIP = column-type initial distortion of the stiffeners in the x direction with compression on the plate side; CIS = column-type initial distortion of the stiffeners in the x direction with compression on the stiffener side; xu u tP / Aσ = where tA = total cross-sectional area of the entire stiffened panel.

146
Table 6.2 Summary of the ultimate compressive strength computations for the test structures in terms of the ultimate compressive force normalized by the fully
plastic force
Experiment FEA Model
(Fig. No.) Pp (kN)
Pu (kN) Pu/Pp Pu (kN) Pu/Pp
19A (6.6) 1646.9 697.1 0.423 715.4 0.434
20A (6.7) 2139.7 1401.1 0.655 1382.9 0.646
17D (6.8) 2009.4 1006.4 0.501 1053.2 0.524
18D (6.9) 2003.8 1036.2 0.517 1152.5 0.575
19D1 (6.10) 2095.5 1111.9 0.531 1109.1 0.529
19D2 (6.11) 1847.8 939.7 0.509 987.2 0.534
20D11) (6.12) 3161.6 1563.7 0.495 2382.1 0.753
20D2 (6.13) 2299.8 1561.9 0.679 1700.3 0.739
19C (6.14) 1583.5 784.6 0.495 821.5 0.519
20C1) (6.15) 1999.1 1166.0 0.583 1517.3 0.759
Note: 1) Test structure that unintentionally collapsed through delamination in the friction stir-welded region; Collapse mode is as defined in Section 5.1; Pu = ultimate compressive force; Pp = fully plastic axial force; xu u tP / Aσ = where tA = total cross-sectional area of the entire stiffened panel.

147
3 2
1
5
4
0 4 8 12 16
0
400
800
1200
1600
2000
Forc
e (k
N)
Displacement (mm)
1: CIP without residual stress and softening
2: CIS without residual stress and softening
3: CIP with residual stress and softening
4: CIS with residual stress and softening
5: Experiment
Model 19A
Pp=1646.9kN
Figure 6.6 The axial compressive force versus the axial compressive displacement of test structure 19A

148
32
0 4 8 12 16
0
500
1000
1500
2000
2500
Model 20A
1: CIP without residual stress and softening
2: CIS without residual stress and softening
3: CIP with residual stress and softening
4: CIS with residual stress and softening
5: Experiment
4
1
5
Pp=2139.7kN
Displacement (mm)
Forc
e (kN
)
Figure 6.7 The axial compressive force versus the axial compressive displacement
of test structure 20A

149
4
1
0 4 8 12 16
0
500
1000
1500
2000
2500
Model 17D
5
32
1: CIP without residual stress and softening
2: CIS without residual stress and softening
3: CIP with residual stress and softening
4: CIS with residual stress and softening
5: Experiment
Pp=2009.4kN
Displacement (mm)
Forc
e (kN
)
Figure 6.8 The axial compressive force versus the axial compressive displacement
of test structure 17D

150
4
0 4 8 12 16
0
500
1000
1500
2000
2500
Model 18D
1
5
3
2
1: CIP without residual stress and softening
2: CIS without residual stress and softening
3: CIP with residual stress and softening
4: CIS with residual stress and softening
5: Experiment
Pp=2003.8kN
Displacement (mm)
Forc
e (kN
)
Figure 6.9 The axial compressive force versus the axial compressive displacement
of test structure 18D

151
0 4 8 12 16
0
500
1000
1500
2000
2500
1: CIP without residual stress and softening
2: CIS without residual stress and softening
3: CIP with residual stress and softening
4: CIS with residual stress and softening
5: Experiment
Model 19D1
4
5
21
3
Pp=2095.5kN
Displacement (mm)
Forc
e (kN
)
Figure 6.10 The axial compressive force versus the axial compressive
displacement of test structure 19D1

152
0 4 8 12 16
0
500
1000
1500
2000
2500
Model 19D2
1: CIP without residual stress and softening
2: CIS without residual stress and softening
3: CIP with residual stress and softening
4: CIS with residual stress and softening
5: Experiment
4
1
5
3
2
Pp=1847.8kN
Displacement (mm)
Forc
e (kN
)
Figure 6.11 The axial compressive force versus the axial compressive
displacement of test structure 19D2

153
4
3
2
0 4 8 12 16 20
0
500
1000
1500
2000
2500
3000
3500
Model 20D1
1: CIP without residual stress and softening
2: CIS without residual stress and softening
3: CIP with residual stress and softening
4: CIS with residual stress and softening
5: Experiment
1
5
Pp=3161.6kN
Displacement (mm)
Forc
e (k
N)
Figure 6.12 The axial compressive force versus the axial compressive
displacement of test structure 20D1

154
3
2
0 4 8 12 16
0
500
1000
1500
2000
2500
1: CIP without residual stress and softening
2: CIS without residual stress and softening
3: CIP with residual stress and softening
4: CIS with residual stress and softening
5: Experiment
1
5
4
Model 20D2 Pp=2299.8kN
Displacement (mm)
Forc
e (kN
)
Figure 6.13 The axial compressive force versus the axial compressive
displacement of test structure 20D2

155
4 3
0 4 8 12 16
0
400
800
1200
1600
2000
1: CIP without residual stress and softening
2: CIS without residual stress and softening
3: CIP with residual stress and softening
4: CIS with residual stress and softening
5: Experiment
Model 19C
21
5
Pp=1583.5kN
Displacement (mm)
Forc
e (kN
)
Figure 6.14 The axial compressive force versus the axial compressive
displacement of test structure 19C

156
0 4 8 12 16
0
500
1000
1500
2000
2500
1: CIP without residual stress and softening
2: CIS without residual stress and softening
3: CIP with residual stress and softening
4: CIS with residual stress and softening
5: Experiment
Model 20C
321
5
4
Full plastic =1999.1kN
Displacement (mm)
Forc
e (kN
)
Figure 6.15 The axial compressive force versus the axial compressive
displacement of test structure 20C

157
6.3 SSC-451 Database Figures 6.15 to 6.26 show the relationships between the axial compressive force
versus the axial compressive displacement of the test structures studied in SSC-451 via fusion welds. Tables 6.3 and 6.4 present a summary of the ultimate strength computations for these structures. It is found that the nonlinear finite element computations for all the test structures are comparable with the experimental results. This implies that the SSC-451 test structures collapsed intentionally via buckling collapse unlike the present test structures in which two structures collapsed unintentionally by delamination before the ultimate strength had been reached.
This database is utilized for a comparison of the ultimate strength performance of fusion welds versus that of friction stir welds, which is described in Chapter 7.
2
Displacement (mm)
Forc
e (kN
)
Model 5
Pp=1831.3kN
0 4 8 12 16
0
500
1000
1500
2000
2500
3 1: CIP with residual stress and softening
2: CIS with residual stress and softening
3: Experiment
1
Figure 6.16 The axial compressive force versus the axial compressive
displacement of test structure 5

158
Displacement (mm)
Forc
e (kN
)
Model 6
0 4 8 12 16
0
500
1000
1500
2000
2500
Pp=1831.18kN
1: CIP with residual stress and softening
2: CIS with residual stress and softening
3: Experiment
2
3
1
Figure 6.17 The axial compressive force versus the axial compressive
displacement of test structure 6

159
3
Displacement (mm)
Forc
e (kN
)
Model 7
Pp=1903.4kN
0 4 8 12 16
0
500
1000
1500
2000
2500
1: CIP with residual stress and softening
2: CIS with residual stress and softening
3: Experiment
1
2
Figure 6.18 The axial compressive force versus the axial compressive
displacement of test structure 7

160
3
0 4 8 12 16
0
500
1000
1500
2000
2500
3000
Model 8
Pu=1513.75kN
Pp=2482.8kN
1: CIP with residual stress and softening
2: CIS with residual stress and softening
3: Experiment
1
2
Figure 6.19 The axial compressive force versus the axial compressive
displacement of test structure 8

161
0 4 8 12 16
0
500
1000
1500
2000
2500
Displacement (mm)
Forc
e (kN
)
Pp=2049.0kN
Model 17
1: CIP with residual stress and softening
2: CIS with residual stress and softening
3: Experiment
3
1
2
Figure 6.20 The axial compressive force versus the axial compressive
displacement of test structure 17

162
2
Displacement (mm)
Forc
e (kN
)
Model 18
Pp=2048.8kN
0 4 8 12 16
0
500
1000
1500
2000
2500
1: CIP with residual stress and softening
2: CIS with residual stress and softening
3: Experiment
3
1
Figure 6.21 The axial compressive force versus the axial compressive
displacement of test structure 18

163
Displacement (mm)
Forc
e (kN
)
Model 19
Pp=2160.5kN
0 4 8 12 16
0
500
1000
1500
2000
2500
1: CIP with residual stress and softening
2: CIS with residual stress and softening
3: Experiment
3
1
2
Figure 6.22 The axial compressive force versus the axial compressive
displacement of test structure 19

164
1
Displacement (mm)
Forc
e (kN
)
Model 20Pp=3057.1kN
0 5 10 15 20
0
500
1000
1500
2000
2500
3000
3500
1: CIP with residual stress and softening
2: CIS with residual stress and softening
3: Experiment
3
2
Figure 6.23 The axial compressive force versus the axial compressive
displacement of test structure 20

165
3
0 4 8 12 16
0
400
800
1200
1600
2000
Displacement (mm)
Forc
e (kN
)
Model 29
Pp=1645.1kN
1: CIP with residual stress and softening
2: CIS with residual stress and softening
3: Experiment
21
Figure 6.24 The axial compressive force versus the axial compressive
displacement of test structure 29

166
2
0 4 8 12 16
0
400
800
1200
1600
2000
Displacement (mm)
Forc
e (kN
)
Model 30
Pp=1645.0kN
1: CIP with residual stress and softening
2: CIS with residual stress and softening
3: Experiment
3
1
Figure 6.25 The axial compressive force versus the axial compressive
displacement of test structure 30

167
0 4 8 12 16
0
400
800
1200
1600
2000
Displacement (mm)
Forc
e (kN
)
Model 31
Pp=1717.2kN
1: CIP with residual stress and softening
2: CIS with residual stress and softening
3: Experiment
3
1
2
Figure 6.26 The axial compressive force versus the axial compressive
displacement of test structure 31

168
3
Displacement (mm)
Forc
e (kN
)
Model 32 Pp=2296.6kN
0 4 8 12 16
0
500
1000
1500
2000
2500
1: CIP with residual stress and softening
2: CIS with residual stress and softening
3: Experiment
1
2
Figure 6.27 The axial compressive force versus the axial compressive
displacement of test structure 32

169
Table 6.3 Summary of the ultimate compressive strength computations for the SSC-451 test structures in terms of the ultimate compressive stress normalized the
equivalent yield stress
FEA
With residual stress and softening Experiment
CIP CIS
Model (Fig. No.)
σxu/σYeq Collapse
mode σxu/σYeq σxu/σYeq
5 (6.16) 0.448 Ⅲ 0.478 0.471
6 (6.17) 0.530 Ⅲ 0.516 0.495
7 (6.18) 0.516 Ⅲ 0.554 0.526
8 (6.19) 0.615 Ⅴ 0.604 0.590
17 (6.20) 0.431 Ⅲ 0.506 0.491
18 (6.21) 0.460 Ⅲ 0.532 0.500
19 (6.22) 0.513 Ⅲ, IV 0.602 0.556
20 (6.23) 0.627 Ⅲ, IV 0.575 0.582
29 (6.24) 0.447 Ⅴ 0.486 0.475
30 (6.25) 0.515 Ⅴ 0.532 0.508
31 (6.26) 0.494 Ⅲ, IV 0.564 0.543
32 (6.27) 0.548 Ⅲ, IV 0.608 0.594
Note: Collapse mode is as defined in Section 5.1; CIP = column-type initial distortion of the stiffeners in the x direction with compression on the plate side; CIS = column-type initial distortion of the stiffeners in the x direction with compression on the stiffener side;
xu u tP / Aσ = where tA = total cross-sectional area of the entire stiffened panel.

170
Table 6.4 Summary of the ultimate strength computations for the SSC-451 test structures in terms of the ultimate force normalized by the fully plastic force
Experiment FEA Model
(Fig. No.) Pp (kN)
Pu (kN) Pu/Pp Pu (kN) Pu/Pp
5 (6.16) 1831.3 777.8 0.425 816.6 0.446
6 (6.17) 1831.2 918.0 0.501 857.3 0.468
7 (6.18) 1903.4 931.8 0.490 954.6 0.502
8 (6.19) 2482.8 1513.8 0.610 1451.0 0.584
17 (6.20) 2049.0 778.0 0.380 884.4 0.432
18 (6.21) 2048.8 829.6 0.405 901.2 0.440
19 (6.22) 2160.5 970.5 0.449 1053.1 0.487
20 (6.23) 3057.1 1659.2 0.543 1757.6 0.575
29 (6.24) 1645.1 791.0 0.481 858.6 0.522
30 (6.25) 1645.0 908.7 0.552 835.2 0.508
31 (6.26) 1717.2 895.9 0.522 931.4 0.542
32 (6.27) 2296.6 1367.3 0.595 1363.0 0.593
Note: Pu = ultimate compressive force; Pp = fully plastic axial force.

171
Chapter 7 Comparison of Ultimate Compressive Strength Performance between Fusion Welds and Friction Stir Welds
7.1 Ultimate Compressive Strength Design Formulae for Fusion-welded Structures
When a continuous stiffened plate structure is modeled as an assembly of plate-stiffener combinations, it is recognized that the ultimate compressive strength of the representative plate-stiffener combination model can be given by the following equation (Paik & Thayamballi 2003).
xu
2 2 2 2 4Yeq 1 2 3 4 5
1
C C C C C
σ=
σ + λ + β + λ β + λ, (7.1)
where 1C ~ 5C = the coefficients to be determined from a database, Yeqσ = equivalent yield strength calculated from the average yield strength as described in Section 3.2.2.
The ultimate strength, xuσ , computed from Equation (7.1) should be smaller than the elastic buckling strength as a column, namely
xu2Yeq
1σ≤
σ λ. (7.2)
For welded steel stiffened plate structures, the following coefficients for Equation
(7.1) have been suggested (Paik & Thayamballi 2003).
1C = 0.995, 2C = 0.963, 3C = 0.170, 4C = 0.188, and 5C = -0.067. (7.3) The coefficients of Equation (7.1) for fusion fillet-welded aluminum stiffened plate
structures were determined based on the SSC-451 database, depending on the type of stiffener, as follows (Paik 2007, Paik et al. 2008a).
• Tee or angle type (extruded or built-up):
1C = 1.318, 2C = 2.759, 3C = 0.185, 4C = -0.177, and 5C = 1.003. (7.4) • Flat bar type:
1C = 2.50, 2C = -0.588, 3C = 0.084, 4C = 0.069, and 5C = 1.217. (7.5) For fusion-welded aluminum stiffened plate structures with flat bar-type stiffeners,
the ultimate compressive strength, xuσ , computed from Equation (7.1), together with the coefficients of Equation (7.5), should be smaller than the following value and the elastic buckling stress defined in Equation (7.2), that is,

172
xu
Yeq
116.297 18.776 17.716 22.507
σ≤
σ − + λ + β− λβ. (7.6)
7.2 5083 Plates with β = 2.45~2.86
Figure 7.1 provides a comparison between the ultimate strength performance of fusion welds and friction stir welds for the test structures in which the plate part is made of 5083 alloys. Plate slenderness ratio β is in the range of 2.45 to 2.86, and the variation in the ultimate strength performance is represented as a function of column slenderness ratio λ which is computed as a representative plate-stiffener combination, i.e., for a single stiffener with attached plating.
The shaded region in Figure 7.1 indicates the ultimate strength of friction stir-welded test structures. The ultimate strength design formula solutions using Equation (7.1), together with the coefficients of Equation (7.4), are also compared.
It should be noted that test structure 20D-1, which was fabricated via friction stir-welded lap-joining, reached its ultimate strength unintentionally through delamination in the welded region rather than via buckling collapse.
It is evident from Figure 7.1 together with Tables 5.1, 5.2 and 6.1 to 6.4 that the ultimate strength performance of friction stir-welded aluminum structures is superior to that of fusion-welded aluminum structures. It is observed that the use of friction stir welds can increase the ultimate strength performance by 10~20% compared to fusion welds, as long as the quality of the friction stir-welded region is assured. 7.3 5383 Plates with β = 2.66~2.72
A similar comparison of the ultimate strength performance of fusion and friction stir welds for 5083 alloy plates is shown in Figure 7.2 for the test structures in which the plate part is made of 5383 alloys. Plate slenderness ratio β is in the range of 2.66 to 2.72, and the ultimate strength design formula solutions using Equation (7.1), together with the coefficients of Equation (7.4), are also compared. The shaded region in Figure 7.2 indicates the ultimate strength of friction stir-welded test structures.
It should be noted that test structure 20C, which was fabricated via friction stir-welded butt-joining, reached its ultimate strength unintentionally through delamination in the welded region rather than via buckling collapse. It is evident that a similar conclusion to that for the 5083 plates is reached for the friction stir-welded aluminum structures with 5383 alloy plates.

173
0.2 0.4 0.6 0.8 1.0 1.2
0
0.2
0.4
0.6
0.8
1.0
17D18D
19C
20D1
20D119D1
17518
6
19
7
8 20
β = 2.46
β = 2.86
σxu
/σYe
q
Yeq[a / ( r)] / Eλ = π σ
5083 Plate
: β = 2.46: β = 2.86
: β = 2.45
Design formula
Experiment: GMAW: FSW
FEA
: GMAW
: GMAW: FSW
Figure 7.1 Variation in the ultimate compressive strength performance of fusion-welded and friction stir-welded aluminum stiffened plate structures with 5083
alloy plates

174
0.2 0.4 0.6 0.8 1.0 1.2
0
0.2
0.4
0.6
0.8
1.0
20D2
20C
20C
19A
3031
29
20A β = 2.66
β = 2.72
σxu
/σYe
q
Yeq[a / ( r)] / Eλ = π σ
19D232
5383 Plate
: β = 2.72: β = 2.66
Design formula
Experiment: GMAW: FSW
FEA
: GMAW
: GMAW: FSW
Figure 7.2 Variation in the ultimate compressive strength performance of fusion-welded and friction stir-welded aluminum stiffened plate structures with 5383
alloy plates
7.4 Ultimate Compressive Strength Design Formula for Friction Stir-welded Structures
The number of test data points valid for the anticipated buckling collapse mode of friction stir-welded structures is six, while the results of test structures 20D1 and 20C which had reached the ultimate limit state by an unintended collapse mode due to delamination in the friction stir-welded region are excluded.
Due to the limited amount of test data points, it is not straightforward to develop

175
ultimate strength design formula for friction stir-welded structures. Nevertheless, the present study attempts to determine the coefficients 1C through 5C of Equation (7.1) applying direct optimization and least square techniques as follows.
1C = 0.2870, 2C = 0.0, 3C = 0.2096, 4C = 0.4937, and 5C = -0.6790. (7.7) In terms of implementing the coefficients of Equation (7.7) into Equation (7.1),
Equation (7.2) is applied. Also, the coefficients of Equation (7.7) are found to be valid for the column slenderness ratio smaller than 1.4. Figure 7.3 presents the accuracy of Equation (7.1) together with Equation (7.7) by a comparison with experimental results. It is seen from Figure 7.3 that the solutions of the ultimate strength design formula, i.e., Equation (7.1) with the coefficients of Equation (7.7), are in reasonably good agreement with the test data points of the friction stir-welded aluminum structures.
: Experiment: FEA
0.2 0.4 0.6 0.8 1.0 1.2
0
0.2
0.4
0.6
0.8
1.0
σxu
/σYe
q
Yeq[a / ( r)] / Eλ = π σ
: Design formula
: β = 2.46: β = 2.72
20D2
19C18D
17D19D1
19D2
β = 2.46
β = 2.72
Figure 7.3 Accuracy of the ultimate compressive strength design formula for friction stir-welded aluminum structures

176
Chapter 8 Conclusions and Recommendations
The objectives of this study were to develop a mechanical buckling collapse test database for 5000’s and 6000’s series aluminum stiffened plate structures fabricated by friction stir welding and to compare these structures with similar aluminum plate panels fabricated by fusion welding in terms of weld-induced initial imperfections and ultimate compressive strength performance.
In SSC-451, the ultimate strength characteristics of 78 aluminum stiffened plate structures fabricated by fusion fillet welding were investigated through buckling collapse tests and the nonlinear finite element method. The statistics for the fusion weld-induced initial imperfections were analyzed in terms of the mean values and standard deviations at three levels, namely, the slight, average, and severe levels. Ultimate compressive strength design formulae were also developed for the fusion-welded aluminum stiffened plate structures based on the database of the buckling collapse tests and nonlinear finite element method computations. A total of 12 test structures in SSC-451 that had extruded stiffeners were selected and utilized for a comparison with a total of 10 test structures in the present study in which 8 test structures were fabricated by friction stir welding (6 lap-welds and 2 butt-welds) and 2 test structures were fabricated by fusion fillet welding.
The trends or benefits found to be associated with the fusion welding and friction stir welding procedures are discussed in Chapters 3 to 7. The following is a summary of these discussions.
Chapter 3 presents the mechanical properties of aluminum alloys in fusion- and friction-stir welded region of butt welds as well as in base (parent) material, which were obtained from tensile coupon tests. It is found that the tensile property in the butt-welded material of friction stir welding is equivalent or even better than that of fusion welding.
Chapter 4 presents the database of weld-induced initial imperfections for the aluminum stiffened plate structures obtained from SSC-451 and the present study, and also provides a comparison of the initial imperfections induced by fusion welds and those induced by friction stir welds. It is concluded that the initial imperfections induced by friction stir welding are smaller than those induced by fusion welding. Thus, the benefits of the friction stir welding procedure in this respect are clear.
Chapter 5 presents the database of the buckling collapse tests on the friction stir-welded aluminum stiffened plate structures. Most of the test structures fabricated by both friction stir and fusion welds (Models 19A and 20A) reached their ultimate strength through the anticipated collapse mode. However, all of the friction stir-welded test structures showed delamination in the welded region after or even before the ultimate strength had been reached. For example, delamination occurred in test structures 20D1 and 20C in the pre-collapse range. In contrast, no crack failure was observed in the fusion-welded region of test structures 19A and 20A as well as in the test structures studied in SSC-451 by fusion welds, before and after the ultimate strength had been reached. This indicates that the fusion-weld procedure is superior to the friction stir-weld procedure in terms of compressive strength performance in the welded region.

177
Since the pre-collapse delamination can significantly reduce the ultimate compressive strength of the structure, the quality assurance in the friction stir-welded region is highly required to prevent delamination failure. In friction stir lap-welded structures, i.e., joined between base plate and extruded stiffeners, delamination may not be of major concern in terms of the water tightness. However, delamination shall be of great concern in friction stir butt-welded structures, i.e., joined between flange free edges of extrusions because the water tightness is no longer assured after delamination. In this regard, the friction stir lap-welding may be more promising than the friction stir butt-welding to replace the fusion fillet-welding, as long as the delamination is concerned.
It is recognized that the mechanical property and delamination in the friction stir-welded region is significantly affected by the welding parameters such as width and depth of molten metal thin layer, molten temperature, rotating and forwarding speeds, and possible quick cooling, etc. It is thus important to establish optimum parameters of friction stir welding to assure the quality of the welded region and also to prevent any weld defects and delamination. Non-destructive test (NDT) methods can be used for the quality assurance in the friction stir welded region.
Chapter 6 presents a comparison of the nonlinear finite element method computations with the experimental results. It is found that this method is able to compute the ultimate strength behavior of welded aluminum structures with a reasonable degree of accuracy. However, it is important to realize that the computational results depend significantly on the structural modeling techniques applied. Through the comparison of the nonlinear finite element computations with experimental results, it turns out that test structures 20D1 and 20C must have collapsed unintentionally earlier.
Chapter 7 presents a comparison of the ultimate compressive strength performance of fusion fillet welds and friction stir butt- or lap-welds. It is found that this performance is 10-20% greater in the friction stir-welded aluminum structures than it is in the fusion-welded aluminum structures. This implies that the friction stir welding procedure is certainly superior to the fusion welding procedure in terms of ultimate compressive strength performance, as long as the delamination in the friction stir welded region is prevented.
It is considered that there are still a lot of challenging issues to be resolved to apply the friction stir welding technology for marine applications. Further studies are recommended as follows.
• Tensile coupon tests for friction stir lap-welds as well as friction stir butt-welds in terms of the mechanical property characterization,
• Microscopic examination of friction stir lap-welds as well as friction stir butt-welds,
• Additional buckling collapse tests for friction stir butt-welds by fabrication method C-2,
• Additional buckling collapse tests for friction stir lap-welds by fabrication method D with different parameters of friction stir welding process such as width and depth of molten thin layer to evaluate the pre- and post-collapse delamination phenomena and their causes.

178
References AA (2005). Aluminum design manual, Table 3.3-2, The Aluminum Association,
Arlington, Virginia, USA. ABS (2006). Rules for material and welding, Part 2 Aluminum and fiber reinforced
plastics, Chapter 5, Appendix 1, Table 2, American Bureau of Shipping, Houston, USA.
Alcan (2004). Aluminum and the sea, Paris, France. ANSYS (2008). User’s manual (version 11.0), ANSYS Inc., Canonsburg, PA, USA. AWS (2004). Guide for aluminum hull welding, AWS D3.7, American Welding Society,
USA. Bang, H.S., Kim, H.J., Go, M.S., Chang, W.S. and Lee, C.W. (2002). A study on welding
residual stress by numerical simulation on friction stir welding, International Journal of Korea Welding Society, Vol. 2, No. 1, pp. 62-66.
Biallas, G., Braun, R., Dalle Donne, C., Staniek, G. and Kaysser, W.A. (1999). Mechanical properties and corrosion behavior of friction stir welded 2024-T3, Proceedings of the 1st International Friction Stir Welding Symposium, Thousand Oaks, California.
Cavaliere, P., De Santis, A., Panella, F. and Squillace, A. (2009). Effect of welding parameters on mechanical and microstructural properties of dissimilar AA6082-AA2024 joints produced by friction stir welding, Materials and Design, Vol. 30, pp. 609-616.
Collette, M.D. (2005). Strength and reliability of aluminum stiffened panels, Ph.D. Thesis, University of Newcastle, Newcastle upon Tyne, UK.
Collette, M.D. (2007). The impact of fusion welds on the ultimate strength of aluminum structures, Proceedings of 10th International Symposium on Practical Design of Ships and Other Floating Structures (PRADS 2007), Houston, USA.
Colligan, K.J. (2004). Friction stir welding for ship construction, Concurrent Technologies Corporation, Harrisburg, PA.
Dawes, C.J. and Thomas, W.M. (1995). Friction stir joining of aluminum alloys, TWI Bulletin, The Welding Institute, November/December.
DNV (2008). Rules for classification of high speed, light craft and naval surface craft, Part 3, Chapter 3, Section 2, Table B4, Oslo, Norway.
Fratini, L. and Zuccarello, B. (2006). An analysis of though-thickness residual stresses in aluminum FSW butt joints, International Journal of Machine Tools & Manufacture, Vol. 46, pp. 611-619.
Hagstrom, J. and Sandstrom, R. (1998). Static and dynamic properties of joints in thin-walled aluminum extrusions, welded with different methods, Proceedings of 6th International Conference on Aluminum Alloys, Toyohashi, Japan, pp. 1447-1452.
Hashimoto, T., Nishikawa, N., Tazaki, S. and Enomoto, M. (1998). Mechanical properties of joints for aluminum alloys with friction stir welding process, Proceedings of 7th International Conference on Joints in Aluminum, Cambridge, UK, 15-17 April.
Inter Technology (2005). Measurement of residual stresses by the hole-drilling strain gauge method, Technical Note TN-503-6, Vishay Micro-Measurements, Don Mills, Ontario, Canada (www.intertechnology.com).

179
ISO (2007). International standard ISO 18072-1: Ships and marine technology – Ship structures – Part 1: General requirements for their limit state assessment, International Organization for Standardization, Geneva, Switzerland.
James, M.N., Hughes, D.J., Hattingh, D.G., Mills, G. and Webster, P.J. (2009). Residual stress and strain in MIG butt welds in 5083-H321 aluminum: As welded and fatigue cycled, International Journal of Fatigue, Vol. 31, pp. 28-40.
Kallee, S. (2000). Application of friction stir welding in the shipbuilding industry, Proceedings of International Conference on Lightweight Construction – Latest developments, RINA, 24-25 February, London.
Kamioka, M. and Okubo, K. (2005). Studies on fatigue properties of friction stir welded joints in structural thin aluminum alloys, Proceedings of the 5th International Forum on Aluminum Ships, Tokyo, Japan, 11-13 October, pp. 115-124.
Khandkar, M.H., Khan, J.A., Reynolds, A.P. and Sutton, M.A. (2006). Predicting residual thermal stresses in friction stir welded metals, Journal of Materials Processing Technology, Vol. 174, pp. 195-203.
Kramer, R. (2007). In-service performance of aluminum structural details, Ship Structure Committee Report, SSC-447, Washington DC.
Lombard, H., Hattingh, D.G., Steuwer, A. and James, M.N. (2009). Effect of process parameters on the residual stresses in AA5083-H321 friction stir welds, Materials Science and Engineering A, Vol. 501, pp. 119-124.
LR (2008). Lloyd’s Register rules and regulations for the classification of special service craft, Vol.1, Part 2 Rules for the maintenance, testing and certification of materials, Chapter 8 – Aluminum alloys and Part 7 – Hull construction in aluminum, London, UK.
Mahoney, M.W., Rhodes, C.G., Flintoff, J.G., Spurling, R.A. and Bingel, W.H. (1998). Properties of friction stir welded 7075-T651 aluminum, Metallurgical and Materials Transactions A, Vol. 29A, pp. 1955-1964.
Masubuchi, K. (1980). Analysis of welded structures, Pergamon Press, Oxford, UK. Midling, O.T., Oosterkamp, L.D. and Bersaas, J. (1998). Friction stir welding – Process
and applications, Proceedings of 7th International Conference on Joints in Aluminum, Cambridge, UK, 15-17 April.
Mohlkert, L. (2005). New opportunities with friction stir welding, Proceedings of the 5th International Forum on Aluminum Ships, Tokyo, Japan, 11-13 October, pp. 111-113.
Murphy, A., McCune, W., Quinn, D. and Price, M. (2007). The characterization of friction stir welding process effects on stiffened panel buckling performance, Thin-Walled Structures, Vol. 5, pp. 339-351.
Nicholas, E.D. (1998). Developments in the friction stir welding of metals, Proceedings of 6th International Conference on Aluminum Alloys, Toyohashi, Japan, pp. 139-151.
Paik, J.K. (2007). Empirical formulations for predicting the ultimate compressive strength of welded aluminum stiffened panels, Thin-Walled Structures, Vol.45, pp.171-184.
Paik, J.K., Andrieu, C. and Cojeen, H.P. (2008a). Mechanical collapse testing on aluminum stiffened plate structures for marine applications, Marine Technology, Vol.45, No.4, pp. 228-240.
Paik, J.K., Hughes, O.F., Hess, P.E. and Renaud, C. (2005). Ultimate limit state design

180
technology for aluminum multi-hull ship structures, Trans. SNAME, Vol. 113, pp. 270-305.
Paik, J.K. and Sohn, J.M. (2009). Effects of welding residual stresses on high tensile steel plate ultimate strength: Nonlinear finite element method investigations, Proceedings of the 28th International Conference on Offshore Mechanics and Arctic Engineering (OMAE 2009), OMAE2009-79297, Honolulu, Hawaii, 31 May-5 June.
Paik, J.K. and Thayamballi, A.K. (2003). Ultimate limit state design of steel-plated structures, John Wiley & Sons, Chichester, UK.
Paik, J.K. and Thayamballi, A.K. (2007). Ship-shaped offshore installations: Design, building, and operation, Cambridge University Press, Cambridge, UK.
Paik, J.K., Thayamballi, A.K. Ryu, J.Y., Jang, J.H., Seo, J.K., Park, S.W., Seo, S.K., Renaud, C., Cojeen, H.P., and Kim, N.I. (2006). The statistics of weld induced initial imperfections in aluminum stiffened plate structures for marine applications, International Journal of Maritime Engineering, Vol.148, A4, pp.19-63.
Paik, J.K., Thayamballi, A.K., Ryu, J.Y., Jang, J.H., Seo, J.K., Park, S.W., Seo, S.K., Andrieu, C. and Kim, N.I. (2008b). Mechanical collapse testing on aluminum stiffened panels for marine applications, Ship Structure Committee Report, SSC-451, Washington DC.
Peel, M., Steuwer, A., Preuss, M. and Withers, P.J. (2003). Microstructure, mechanical properties and residual stresses as a function of welding speed in aluminum AA5083 friction stir welds, Acta Materialia, Vol. 51, pp. 4791-4801.
Prime, M.B., Gnaupel-Herold, T., Baumann, J.A., Lederich, R.J., Bowden, D.M. and Sebring, R.J. (2006). Residual stress measurements in a thick, dissimilar aluminum alloy friction stir weld, Acta Materialia, Vol. 54, pp. 4013-4021.
Przydatek, J. (2000). Friction stir welding with Lloyd’s Register, Proceedings of International Conference on Lightweight Construction – Latest developments, RINA, 24-25 February, London.
Rhodes, C.G., Mahoney, M.W. and Bingel, W.H. (1997). Effects of friction stir welding on microstructure of 7075 aluminum, Scripta Materialia, Vol. 36, No. 1, pp. 69-75.
Sanderson, A., Punshon, C.S. and Russell, J.D. (2000). Advanced welding processes for fusion reactor fabrication, Fusion Engineering and Design, Vol. 49-50, pp. 77-87.
Sielski, R.A. (2007). Review of structural design of aluminum ships and crafts, Trans. SNAME, Vol. 115, pp. 1-30.
Sielski, R.A. (2008). Research needs in aluminum structure, Ships and Offshore Structures, Vol. 3, No. 1, pp. 57-65.
Staron, P., Kocak, M., Williams, S. and Wescott, A. (2004). Residual stress in friction stir-welded Al sheets, Physica B, Vol. 350, pp. e491-e493.
Thomas, W.M. (1998). Friction stir welding and related friction process characteristics, Proceedings of the 7th International Conference on Joints in Aluminum (INALCO’98), Cambridge, UK, April.
Thomas, W.M. and Nicholas, E.D. (1997). Friction stir welding for the transportation industry, Materials & Design, Vol. 18, Nos. 4/6, pp. 269-273.
Thomas, W.M., Nicholas, E.D., Needham, J.C., Murch, P., Temple-Smith, P. and Dawes, C.J. (1991). Friction stir welding, International Patent Application PCT/GB92/02203, GB Patent Application 9125978.8, December 6.
Thomas, W.M., Nicholas, E.D., Needham, J.C., Murch, P., Temple-Smith, P. and Dawes,

181
C.J. (1995). Friction stir welding, US Patent No. 5460317, October 25. Thomas, W.M., Nicholas, E.D., Watts, E.R. and Staines, D.G. (2002). Friction based
welding technology for aluminum, Proceedings of the 8th International Conference on Aluminum Alloys, Cambridge, UK, 2-5 July.
Thomas, W.M., Staines, D.G., Oakley, P.J. and Watts, E.R. (2005). Friction stir welding for aluminum applications – Process development, Proceedings of the 5th International Forum on Aluminum Ships, Tokyo, Japan, 11-13 October, pp. 137-144.
Zhang, Z. and Zhang, H.W. (2009a). Numerical studies on the effect of transverse speed in friction stir welding, Materials and Design, Vol. 30, pp. 900-907.
Zhang, Z. and Zhang, H.W. (2009b). Numerical studies on controlling of process parameters in friction stir welding, Journal of Materials Processing Technology, Vol. 209, pp. 241-270.

182
Appendix Mechanical Properties of the Materials after Buckling
Figures A.1 to A.10 show the stress-strain relationships of the materials that underwent buckling, as obtained from the tensile coupon tests. These materials were cut out of the test structures after the buckling collapse test, as shown in Figure A.11.
Table A.1 Comparison of the mechanical properties of virgin materials with those of the materials that experienced buckling
Material Model Elastic
modulus (N/mm2)
Yield stress
(N/mm2)
Ultimate tensile stress
(N/mm2)
Elongation (%)
Virgin 69856.8 167.2 307.67 33.09
17D 69691.9 154.7 267.4 24.39
18D 68326.1 140.1 266.5 22.35
19D1 70202.7 138.3 264.6 23.35
20D1 68675.5 138.7 267.5 22.94
5083-H112
19C 69439.5 145.8 271.0 22.05
Virgin 70355.3 207.9 342.0 25.85
19A 70254.6 194.6 307.1 12.67
20A 70668.7 173.1 296.2 13.97
19D2 70151.5 199.9 316.0 14.63
20D2 69665.1 174.2 297.0 17.17
5383-H116
20C 68044.7 173.5 297.1 15.20
Table A.1 presents a comparison of the mechanical properties of the materials that
experienced buckling with those of virgin materials. All the tensile coupon test specimens of the materials after buckling were cut out in the plate longitudinal direction, although the mechanical properties of virgin materials are their average values in the longitudinal, transverse or diagonal directions as those indicated in Chapter 3.
As can be seen from Table A.1, the mechanical properties of the buckling-

183
experienced materials are inferior to those of the virgin materials. The yield stress, ultimate tensile stress and elongation of the materials that had undergone buckling are significantly reduced when compared to those of virgin materials, although the elastic modulus remains almost unchanged.
0 0.05 0.1 0.15 0.2 0.25 0.3Strain
0
50
100
150
200
250
300
350
Stre
ss (M
Pa)
Model 19A (5383-H116)
Properties in material ②E = 70254.6 N/mm2
σY = 194.6 N/mm2
σT = 307.1 N/mm2
εf = 12.67 %
Properties in material ①E = 70355.3 N/mm2
σY = 207.9 N/mm2
σT = 342 N/mm2
εf = 25.85 %
① Virgin material (before collapse)② Buckling-experienced material
(after collapse)
②
①
Figure A.1 The stress-strain relationship of material 5383-H116 after buckling in
test structure 19A

184
0 0.05 0.1 0.15 0.2 0.25 0.3Strain
0
50
100
150
200
250
300
350St
ress
(MPa
)Model 20A (5383-H116)
Properties in material ②E = 70668.7 N/mm2
σY = 173.1 N/mm2
σT = 296.2 N/mm2
εf = 13.97 %
Properties in material ①E = 70355.3 N/mm2
σY = 207.9 N/mm2
σT = 342 N/mm2
εf = 25.85 %
① Virgin material (before collapse)② Buckling-experienced material
(after collapse)
②
①
Figure A.2 The stress-strain relationship of material 5383-H116 after buckling in
test structure 20A
0 0.05 0.1 0.15 0.2 0.25 0.3 0.35Strain
0
50
100
150
200
250
300
350
Stre
ss (M
Pa)
Model 17D (5083-H112)
Properties in material ②E = 69691.9 N/mm2
σY = 154.7 N/mm2
σT = 267.4 N/mm2
εf = 24.39 %
Properties in material ①E = 69856.8 N/mm2
σY = 167.2 N/mm2
σT = 307.67 N/mm2
εf = 33.09 %
① Virgin material (before collapse)② Buckling-experienced material
(after collapse)
②①
Figure A.3 The stress-strain relationship of material 5083-H112 after buckling in
test structure 17D

185
0 0.05 0.1 0.15 0.2 0.25 0.3 0.35Strain
0
50
100
150
200
250
300
350St
ress
(MPa
)Model 18D (5083-H112)
Properties in material ②E = 68326.1 N/mm2
σY = 140.1 N/mm2
σT = 266.5 N/mm2
εf = 22.35 %
Properties in material ①E = 69856.8 N/mm2
σY = 167.2 N/mm2
σT = 307.67 N/mm2
εf = 33.09 %
① Virgin material (before collapse)② Buckling-experienced material
(after collapse)
②
①
Figure A.4 The stress-strain relationship of material 5083-H112 after buckling in
test structure 18D
0 0.05 0.1 0.15 0.2 0.25 0.3 0.35Strain
0
50
100
150
200
250
300
350
Stre
ss (M
Pa)
Model 19D1 (5083-H112)
Properties in material ②E = 70202.7 N/mm2
σY = 138.3 N/mm2
σT = 264.6 N/mm2
εf = 23.35 %
Properties in material ①E = 69856.8 N/mm2
σY = 167.2 N/mm2
σT = 307.67 N/mm2
εf = 33.09 %
① Virgin material (before collapse)② Buckling-experienced material
(after collapse)
②
①
Figure A.5 The stress-strain relationship of material 5083-H112 after buckling in
test structure 19D1

186
0 0.05 0.1 0.15 0.2 0.25 0.3Strain
0
50
100
150
200
250
300
350St
ress
(MPa
)Model 19D2 (5383-H116)
Properties in material ②E = 70151.5 N/mm2
σY = 199.9 N/mm2
σT = 316.0 N/mm2
εf = 14.63 %
Properties in material ①E = 70355.3 N/mm2
σY = 207.9 N/mm2
σT = 342 N/mm2
εf = 25.85 %
① Virgin material (before collapse)② Buckling-experienced material
(after collapse)
②①
Figure A.6 The stress-strain relationship of material 5383-H116 after buckling in
test structure 19D2
0 0.05 0.1 0.15 0.2 0.25 0.3 0.35Strain
0
50
100
150
200
250
300
350
Stre
ss (M
Pa)
Model 20D1 (5083-H112)
Properties in material ②E = 68675.5 N/mm2
σY = 138.7 N/mm2
σT = 267.5 N/mm2
εf = 22.94 %
Properties in material ①E = 69856.8 N/mm2
σY = 167.2 N/mm2
σT = 307.67 N/mm2
εf = 33.09 %
① Virgin material (before collapse)② Buckling-experienced material
(after collapse)
②
①
Figure A.7 The stress-strain relationship of material 5083-H112 after buckling in
test structure 20D1

187
0 0.05 0.1 0.15 0.2 0.25 0.3Strain
0
50
100
150
200
250
300
350St
ress
(MPa
)Model 20D2 (5383-H116)
Properties in material ②E = 69665.1 N/mm2
σY = 174.2 N/mm2
σT = 297.0 N/mm2
εf = 17.17 %
Properties in material ①E = 70355.3 N/mm2
σY = 207.9 N/mm2
σT = 342 N/mm2
εf = 25.85 %
① Virgin material (before collapse)② Buckling-experienced material
(after collapse)
②
①
Figure A.8 The stress-strain relationship of material 5383-H116 after buckling in
test structure 20D2
0 0.05 0.1 0.15 0.2 0.25 0.3 0.35Strain
0
50
100
150
200
250
300
350
Stre
ss (M
Pa)
Model 19C (5083-H112)
Properties in material ②E = 69439.5 N/mm2
σY = 145.8 N/mm2
σT = 271.0 N/mm2
εf = 22.05 %
Properties in material ①E = 69856.8 N/mm2
σY = 167.2 N/mm2
σT = 307.67 N/mm2
εf = 33.09 %
① Virgin material (before collapse)② Buckling-experienced material
(after collapse)
②
①
Figure A.9 The stress-strain relationship of material 5083-H112 after buckling in
test structure 19C

188
0 0.05 0.1 0.15 0.2 0.25 0.3Strain
0
50
100
150
200
250
300
350St
ress
(MPa
)
Model 20C (5383-H116)
Properties in material ②E = 68044.7 N/mm2
σY = 173.5 N/mm2
σT = 297.1 N/mm2
εf = 15.20 %
Properties in material ①E = 70355.3 N/mm2
σY = 207.9 N/mm2
σT = 342 N/mm2
εf = 25.85 %
① Virgin material (before collapse)② Buckling-experienced material
(after collapse)
②
①
Figure A.10 The stress-strain relationship of material 5383-H116 after buckling in
test structure 20C
Figure A.11 Photo of one of the test structures after the material test specimen
had been cut out of the buckling collapsed structure