squid amendment - squarespace amendment atlantic mackerel, squid, and butterfish fishery management...
TRANSCRIPT
SQUID AMENDMENT ATLANTIC MACKEREL, SQUID, AND BUTTERFISH
FISHERY MANAGEMENT PLAN
Measures to Reduce Latent Squid Fishery Permits and
Modify Trimester 2 Longfin Squid Management
Public Hearing Document – April 2017
2
1.0 EXECUTIVE SUMMARY
In this Amendment to the Atlantic Mackerel, Squid, and Butterfish Fishery Management Plan (MSB FMP)
the Council considers measures to reduce latent (unused or minimally used) longfin and Illex squid permits
and also measures to modify how Trimester 2 (T2) (May-August) of the longfin squid fishery is managed.
The objectives of this action are to:
A. Consider the appropriate number of vessels in the directed longfin squid and Illex squid fisheries
and design appropriate management measures for permitted vessels. The Council is considering
this action because there is considerable latent effort in both fisheries - a relatively small portion
of vessels with limited access (“moratorium”) squid permits account for the majority of landings
in most years, and the Council is concerned that activation of latent permits in the squid fisheries
could lead to excessive fishing effort in a shortened season on these semeparous, sub-annual
species, as well as increased catch of non-target species if racing to fish increases due to shortened
seasons.
B. Re-evaluate the management of longfin squid in Trimester 2 (T2). The Council is considering this
action because the productivity of the longfin squid stock may be negatively impacted if excessive
fishing effort in T2, which occurs on the inshore spawning grounds, does not allow sufficient
spawning and/or hatching from egg mops.
After reviewing Advisory Panel and other public comments, the Council developed a range of alternatives
and associated analyses described in this document. The Council plans to select from the alternatives
described in this document at its June 2017 Council meeting. The Council will consider comments
received during public hearings and a written comment period in April and May 2017. During the
selection of alternatives, the Council can also modify the alternatives pending sufficient information and
rationale.
The Council will then recommend the selected alternatives to NOAA Fisheries. Assuming the Council
recommends some action alternatives, NOAA Fisheries will then publish a proposed rule along with an
Environmental Assessment for public comment. After considering public comments on the proposed rule,
NOAA Fisheries will publish a final rule with implementation details.
This document first provides general background and describes the alternatives. It then describes the
environment and the fisheries that may be affected, and concludes with information about the likely
impacts from the alternatives under considerations. An overview of the alternatives is provided in the
table below. Some alternatives may be combined with other alternatives, as detailed in Section 5.
3
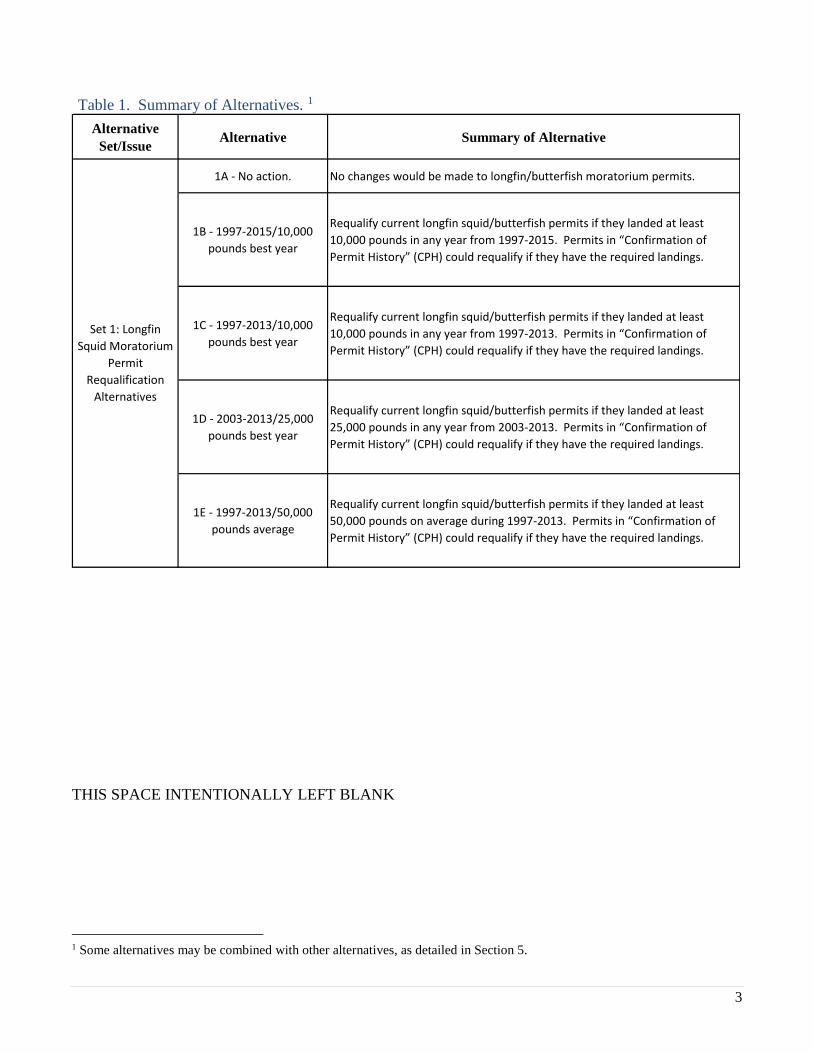
Table 1. Summary of Alternatives. 1
Alternative
Set/IssueAlternative Summary of Alternative
1A - No action. No changes would be made to longfin/butterfish moratorium permits.
1B - 1997-2015/10,000
pounds best year
Requalify current longfin squid/butterfish permits if they landed at least
10,000 pounds in any year from 1997-2015. Permits in “Confirmation of
Permit History” (CPH) could requalify if they have the required landings.
1C - 1997-2013/10,000
pounds best year
Requalify current longfin squid/butterfish permits if they landed at least
10,000 pounds in any year from 1997-2013. Permits in “Confirmation of
Permit History” (CPH) could requalify if they have the required landings.
1D - 2003-2013/25,000
pounds best year
Requalify current longfin squid/butterfish permits if they landed at least
25,000 pounds in any year from 2003-2013. Permits in “Confirmation of
Permit History” (CPH) could requalify if they have the required landings.
1E - 1997-2013/50,000
pounds average
Requalify current longfin squid/butterfish permits if they landed at least
50,000 pounds on average during 1997-2013. Permits in “Confirmation of
Permit History” (CPH) could requalify if they have the required landings.
Set 1: Longfin
Squid Moratorium
Permit
Requalification
Alternatives
THIS SPACE INTENTIONALLY LEFT BLANK
1 Some alternatives may be combined with other alternatives, as detailed in Section 5.
4
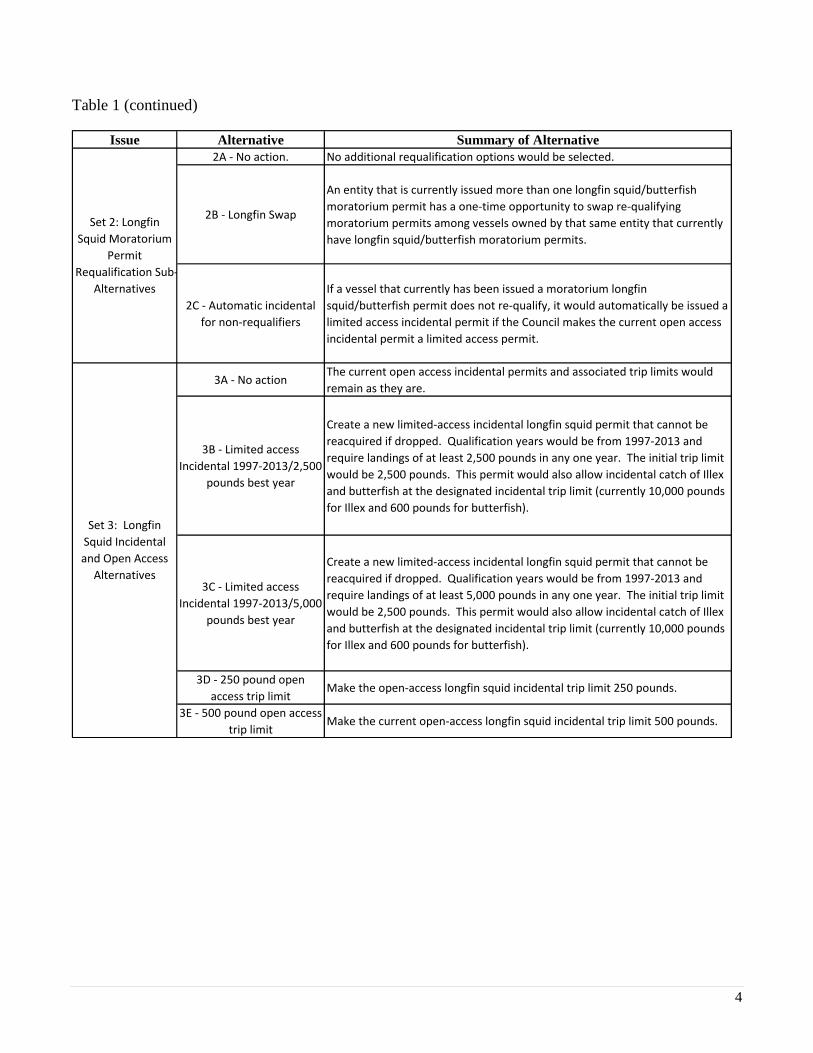
Table 1 (continued)
Issue Alternative Summary of Alternative
2A - No action. No additional requalification options would be selected.
2B - Longfin Swap
An entity that is currently issued more than one longfin squid/butterfish
moratorium permit has a one-time opportunity to swap re-qualifying
moratorium permits among vessels owned by that same entity that currently
have longfin squid/butterfish moratorium permits.
2C - Automatic incidental
for non-requalifiers
If a vessel that currently has been issued a moratorium longfin
squid/butterfish permit does not re-qualify, it would automatically be issued a
limited access incidental permit if the Council makes the current open access
incidental permit a limited access permit.
3A - No actionThe current open access incidental permits and associated trip limits would
remain as they are.
3B - Limited access
Incidental 1997-2013/2,500
pounds best year
Create a new limited-access incidental longfin squid permit that cannot be
reacquired if dropped. Qualification years would be from 1997-2013 and
require landings of at least 2,500 pounds in any one year. The initial trip limit
would be 2,500 pounds. This permit would also allow incidental catch of Illex
and butterfish at the designated incidental trip limit (currently 10,000 pounds
for Illex and 600 pounds for butterfish).
3C - Limited access
Incidental 1997-2013/5,000
pounds best year
Create a new limited-access incidental longfin squid permit that cannot be
reacquired if dropped. Qualification years would be from 1997-2013 and
require landings of at least 5,000 pounds in any one year. The initial trip limit
would be 2,500 pounds. This permit would also allow incidental catch of Illex
and butterfish at the designated incidental trip limit (currently 10,000 pounds
for Illex and 600 pounds for butterfish).
3D - 250 pound open
access trip limitMake the open-access longfin squid incidental trip limit 250 pounds.
3E - 500 pound open access
trip limitMake the current open-access longfin squid incidental trip limit 500 pounds.
Set 2: Longfin
Squid Moratorium
Permit
Requalification Sub-
Alternatives
Set 3: Longfin
Squid Incidental
and Open Access
Alternatives
5
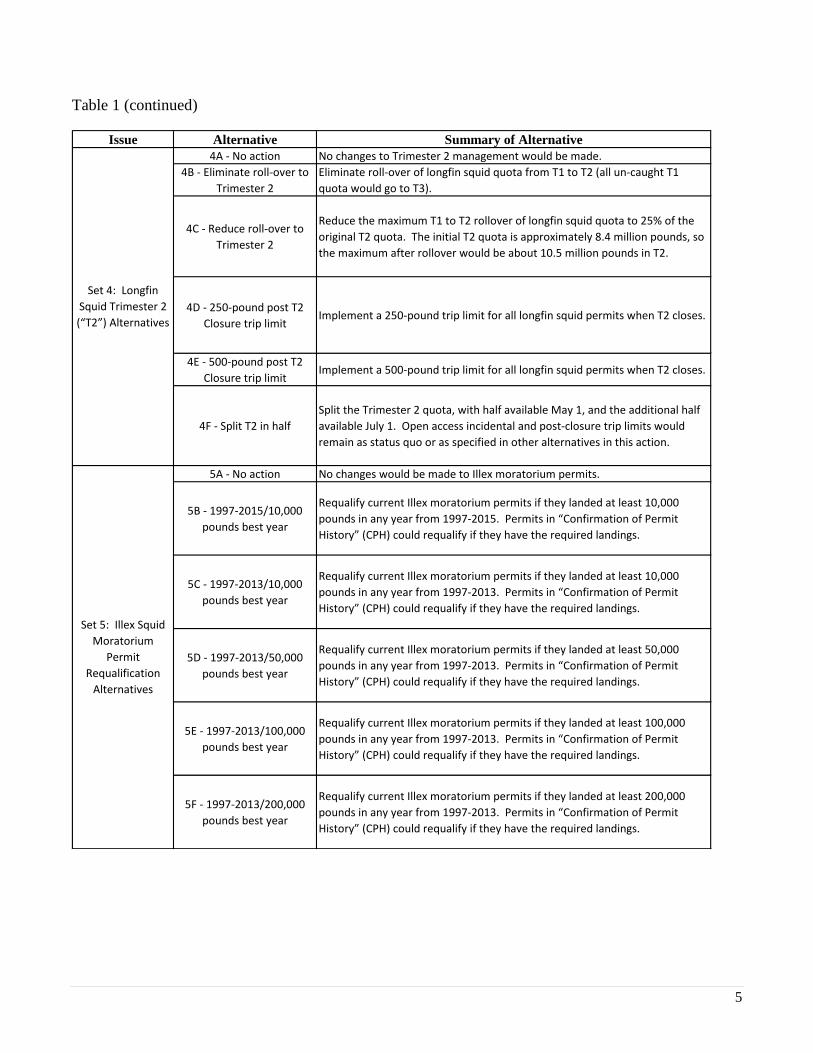
Table 1 (continued)
Issue Alternative Summary of Alternative
4A - No action No changes to Trimester 2 management would be made.
4B - Eliminate roll-over to
Trimester 2
Eliminate roll-over of longfin squid quota from T1 to T2 (all un-caught T1
quota would go to T3).
4C - Reduce roll-over to
Trimester 2
Reduce the maximum T1 to T2 rollover of longfin squid quota to 25% of the
original T2 quota. The initial T2 quota is approximately 8.4 million pounds, so
the maximum after rollover would be about 10.5 million pounds in T2.
4D - 250-pound post T2
Closure trip limitImplement a 250-pound trip limit for all longfin squid permits when T2 closes.
4E - 500-pound post T2
Closure trip limitImplement a 500-pound trip limit for all longfin squid permits when T2 closes.
4F - Split T2 in half
Split the Trimester 2 quota, with half available May 1, and the additional half
available July 1. Open access incidental and post-closure trip limits would
remain as status quo or as specified in other alternatives in this action.
5A - No action No changes would be made to Illex moratorium permits.
5B - 1997-2015/10,000
pounds best year
Requalify current Illex moratorium permits if they landed at least 10,000
pounds in any year from 1997-2015. Permits in “Confirmation of Permit
History” (CPH) could requalify if they have the required landings.
5C - 1997-2013/10,000
pounds best year
Requalify current Illex moratorium permits if they landed at least 10,000
pounds in any year from 1997-2013. Permits in “Confirmation of Permit
History” (CPH) could requalify if they have the required landings.
5D - 1997-2013/50,000
pounds best year
Requalify current Illex moratorium permits if they landed at least 50,000
pounds in any year from 1997-2013. Permits in “Confirmation of Permit
History” (CPH) could requalify if they have the required landings.
5E - 1997-2013/100,000
pounds best year
Requalify current Illex moratorium permits if they landed at least 100,000
pounds in any year from 1997-2013. Permits in “Confirmation of Permit
History” (CPH) could requalify if they have the required landings.
5F - 1997-2013/200,000
pounds best year
Requalify current Illex moratorium permits if they landed at least 200,000
pounds in any year from 1997-2013. Permits in “Confirmation of Permit
History” (CPH) could requalify if they have the required landings.
Set 4: Longfin
Squid Trimester 2
(“T2”) Alternatives
Set 5: Illex Squid
Moratorium
Permit
Requalification
Alternatives
6
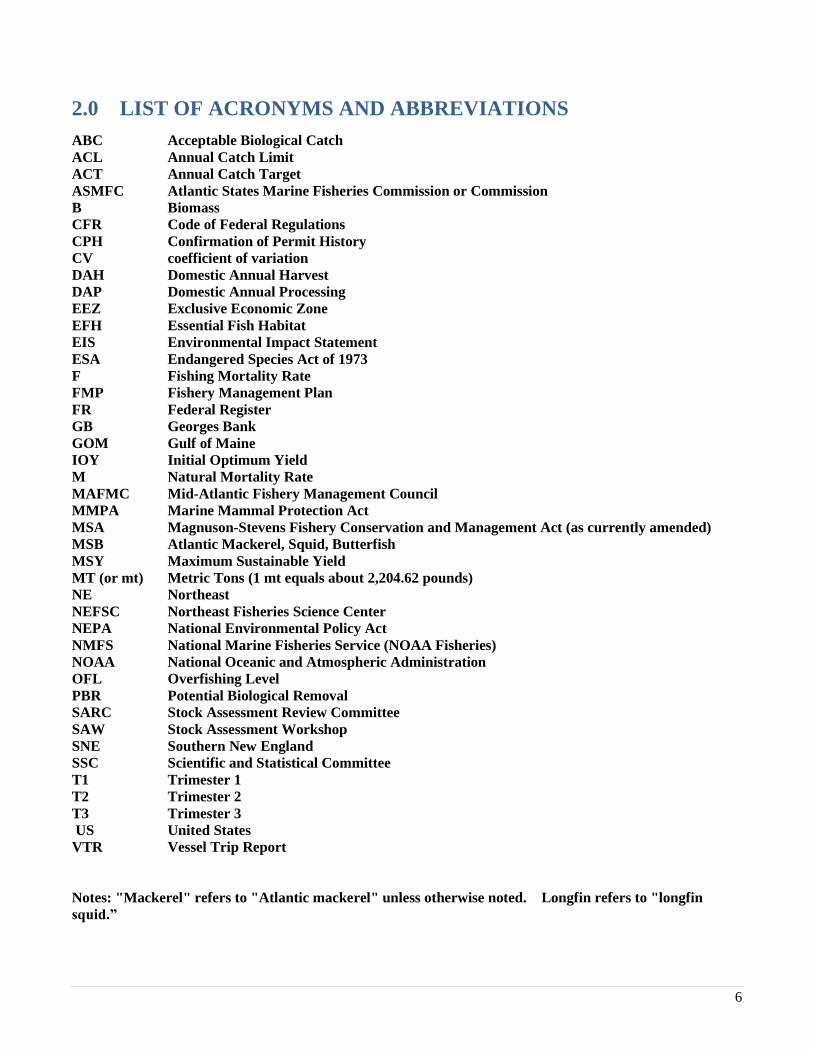
2.0 LIST OF ACRONYMS AND ABBREVIATIONS
ABC Acceptable Biological Catch
ACL Annual Catch Limit
ACT Annual Catch Target
ASMFC Atlantic States Marine Fisheries Commission or Commission
B Biomass
CFR Code of Federal Regulations
CPH Confirmation of Permit History
CV coefficient of variation
DAH Domestic Annual Harvest
DAP Domestic Annual Processing
EEZ Exclusive Economic Zone
EFH Essential Fish Habitat
EIS Environmental Impact Statement
ESA Endangered Species Act of 1973
F Fishing Mortality Rate
FMP Fishery Management Plan
FR Federal Register
GB Georges Bank
GOM Gulf of Maine
IOY Initial Optimum Yield
M Natural Mortality Rate
MAFMC Mid-Atlantic Fishery Management Council
MMPA Marine Mammal Protection Act
MSA Magnuson-Stevens Fishery Conservation and Management Act (as currently amended)
MSB Atlantic Mackerel, Squid, Butterfish
MSY Maximum Sustainable Yield
MT (or mt) Metric Tons (1 mt equals about 2,204.62 pounds)
NE Northeast
NEFSC Northeast Fisheries Science Center
NEPA National Environmental Policy Act
NMFS National Marine Fisheries Service (NOAA Fisheries)
NOAA National Oceanic and Atmospheric Administration
OFL Overfishing Level
PBR Potential Biological Removal
SARC Stock Assessment Review Committee
SAW Stock Assessment Workshop
SNE Southern New England
SSC Scientific and Statistical Committee
T1 Trimester 1
T2 Trimester 2
T3 Trimester 3
US United States
VTR Vessel Trip Report
Notes: "Mackerel" refers to "Atlantic mackerel" unless otherwise noted. Longfin refers to "longfin
squid.”
7
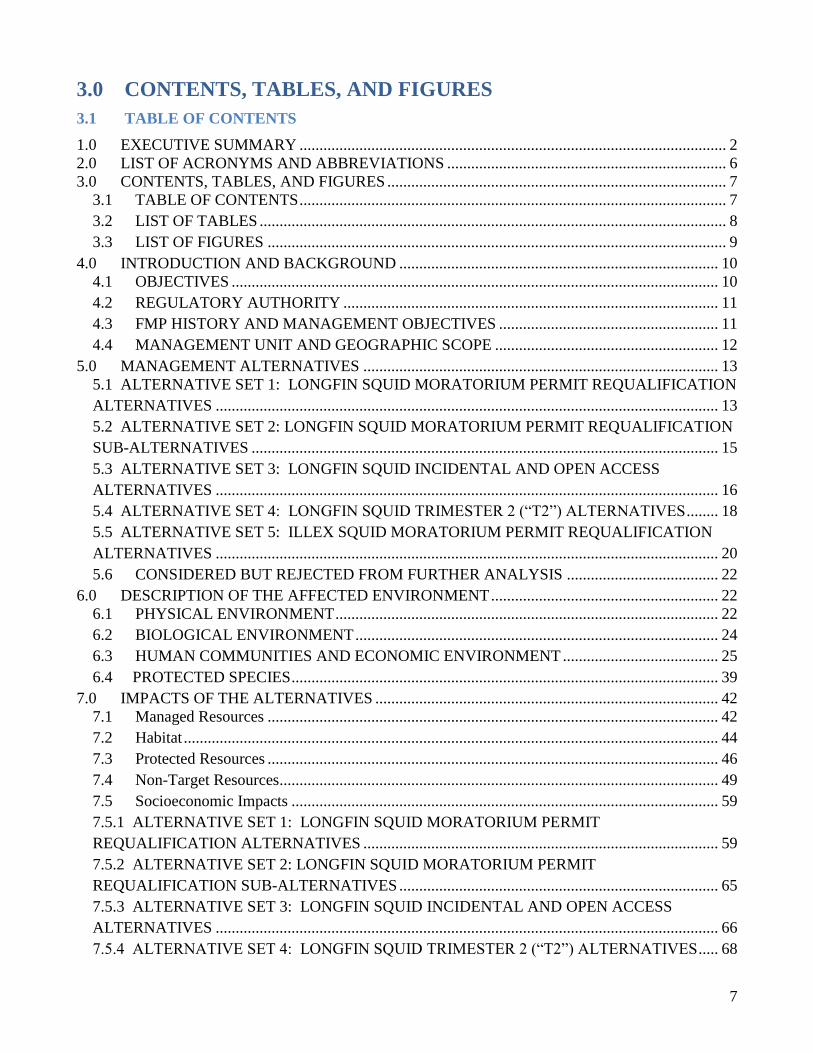
3.0 CONTENTS, TABLES, AND FIGURES
3.1 TABLE OF CONTENTS
1.0 EXECUTIVE SUMMARY ........................................................................................................... 2 2.0 LIST OF ACRONYMS AND ABBREVIATIONS ...................................................................... 6 3.0 CONTENTS, TABLES, AND FIGURES ..................................................................................... 7
3.1 TABLE OF CONTENTS ........................................................................................................... 7
3.2 LIST OF TABLES ..................................................................................................................... 8
3.3 LIST OF FIGURES ................................................................................................................... 9
4.0 INTRODUCTION AND BACKGROUND ................................................................................ 10
4.1 OBJECTIVES .......................................................................................................................... 10
4.2 REGULATORY AUTHORITY .............................................................................................. 11
4.3 FMP HISTORY AND MANAGEMENT OBJECTIVES ....................................................... 11
4.4 MANAGEMENT UNIT AND GEOGRAPHIC SCOPE ........................................................ 12
5.0 MANAGEMENT ALTERNATIVES ......................................................................................... 13
5.1 ALTERNATIVE SET 1: LONGFIN SQUID MORATORIUM PERMIT REQUALIFICATION
ALTERNATIVES .............................................................................................................................. 13
5.2 ALTERNATIVE SET 2: LONGFIN SQUID MORATORIUM PERMIT REQUALIFICATION
SUB-ALTERNATIVES ..................................................................................................................... 15
5.3 ALTERNATIVE SET 3: LONGFIN SQUID INCIDENTAL AND OPEN ACCESS
ALTERNATIVES .............................................................................................................................. 16
5.4 ALTERNATIVE SET 4: LONGFIN SQUID TRIMESTER 2 (“T2”) ALTERNATIVES ........ 18
5.5 ALTERNATIVE SET 5: ILLEX SQUID MORATORIUM PERMIT REQUALIFICATION
ALTERNATIVES .............................................................................................................................. 20
5.6 CONSIDERED BUT REJECTED FROM FURTHER ANALYSIS ...................................... 22
6.0 DESCRIPTION OF THE AFFECTED ENVIRONMENT ......................................................... 22 6.1 PHYSICAL ENVIRONMENT ................................................................................................ 22
6.2 BIOLOGICAL ENVIRONMENT ........................................................................................... 24
6.3 HUMAN COMMUNITIES AND ECONOMIC ENVIRONMENT ....................................... 25
6.4 PROTECTED SPECIES ........................................................................................................... 39
7.0 IMPACTS OF THE ALTERNATIVES ...................................................................................... 42 7.1 Managed Resources ................................................................................................................. 42
7.2 Habitat ...................................................................................................................................... 44
7.3 Protected Resources ................................................................................................................. 46
7.4 Non-Target Resources.............................................................................................................. 49
7.5 Socioeconomic Impacts ........................................................................................................... 59
7.5.1 ALTERNATIVE SET 1: LONGFIN SQUID MORATORIUM PERMIT
REQUALIFICATION ALTERNATIVES ......................................................................................... 59
7.5.2 ALTERNATIVE SET 2: LONGFIN SQUID MORATORIUM PERMIT
REQUALIFICATION SUB-ALTERNATIVES ................................................................................ 65
7.5.3 ALTERNATIVE SET 3: LONGFIN SQUID INCIDENTAL AND OPEN ACCESS
ALTERNATIVES .............................................................................................................................. 66
7.5.4 ALTERNATIVE SET 4: LONGFIN SQUID TRIMESTER 2 (“T2”) ALTERNATIVES ..... 68
8
7.5.5 ALTERNATIVE SET 5: ILLEX SQUID MORATORIUM PERMIT REQUALIFICATION
ALTERNATIVES .............................................................................................................................. 73
8.0 LITERATURE CITED AND SELECTED BACKGROUND DOCUMENTS ............................. 79
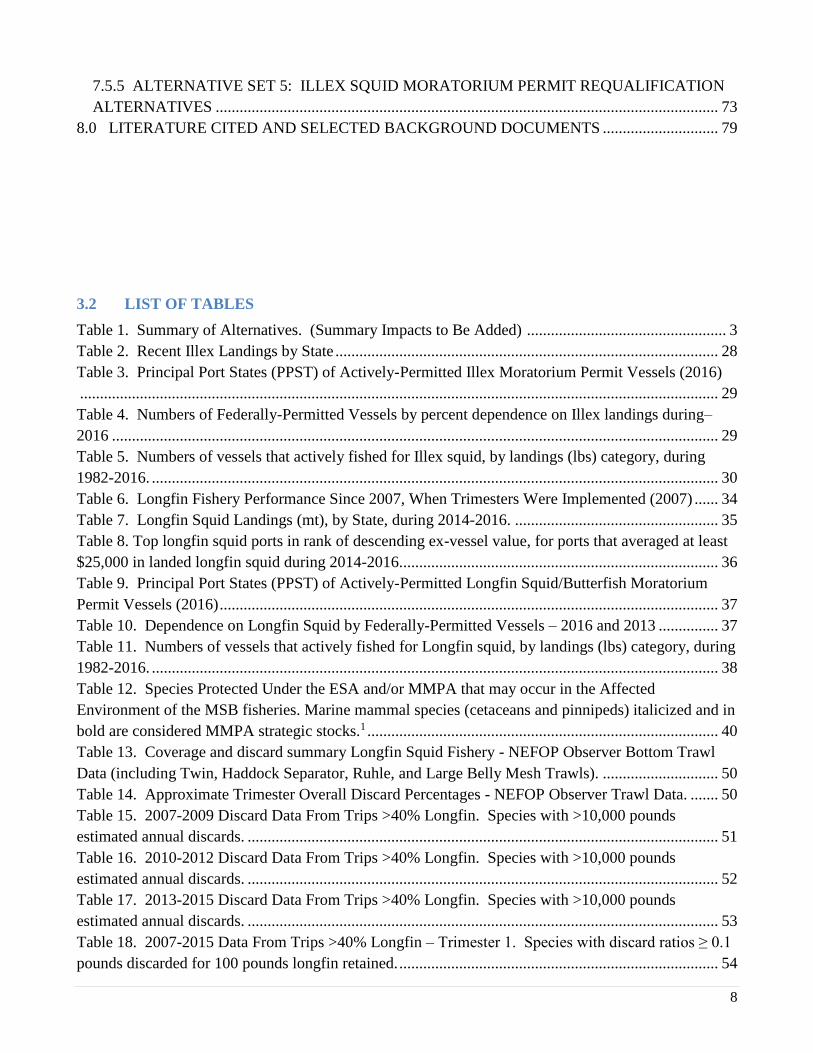
3.2 LIST OF TABLES
Table 1. Summary of Alternatives. (Summary Impacts to Be Added) .................................................. 3
Table 2. Recent Illex Landings by State ................................................................................................ 28
Table 3. Principal Port States (PPST) of Actively-Permitted Illex Moratorium Permit Vessels (2016)
................................................................................................................................................................ 29
Table 4. Numbers of Federally-Permitted Vessels by percent dependence on Illex landings during–
2016 ........................................................................................................................................................ 29
Table 5. Numbers of vessels that actively fished for Illex squid, by landings (lbs) category, during
1982-2016. .............................................................................................................................................. 30
Table 6. Longfin Fishery Performance Since 2007, When Trimesters Were Implemented (2007) ...... 34
Table 7. Longfin Squid Landings (mt), by State, during 2014-2016. ................................................... 35
Table 8. Top longfin squid ports in rank of descending ex-vessel value, for ports that averaged at least
$25,000 in landed longfin squid during 2014-2016. ............................................................................... 36
Table 9. Principal Port States (PPST) of Actively-Permitted Longfin Squid/Butterfish Moratorium
Permit Vessels (2016) ............................................................................................................................. 37
Table 10. Dependence on Longfin Squid by Federally-Permitted Vessels – 2016 and 2013 ............... 37
Table 11. Numbers of vessels that actively fished for Longfin squid, by landings (lbs) category, during
1982-2016. .............................................................................................................................................. 38
Table 12. Species Protected Under the ESA and/or MMPA that may occur in the Affected
Environment of the MSB fisheries. Marine mammal species (cetaceans and pinnipeds) italicized and in
bold are considered MMPA strategic stocks.1 ........................................................................................ 40
Table 13. Coverage and discard summary Longfin Squid Fishery - NEFOP Observer Bottom Trawl
Data (including Twin, Haddock Separator, Ruhle, and Large Belly Mesh Trawls). ............................. 50
Table 14. Approximate Trimester Overall Discard Percentages - NEFOP Observer Trawl Data. ....... 50
Table 15. 2007-2009 Discard Data From Trips >40% Longfin. Species with >10,000 pounds
estimated annual discards. ...................................................................................................................... 51
Table 16. 2010-2012 Discard Data From Trips >40% Longfin. Species with >10,000 pounds
estimated annual discards. ...................................................................................................................... 52
Table 17. 2013-2015 Discard Data From Trips >40% Longfin. Species with >10,000 pounds
estimated annual discards. ...................................................................................................................... 53
Table 18. 2007-2015 Data From Trips >40% Longfin – Trimester 1. Species with discard ratios ≥ 0.1
pounds discarded for 100 pounds longfin retained. ................................................................................ 54
9
Table 19. 2007-2015 Data From Trips >40% Longfin – Trimester 2. Species with discard ratios ≥ 0.1
pounds discarded for 100 pounds longfin retained. ................................................................................ 55
Table 20. 2007-2015 Data From Trips >40% Longfin – Trimester 3. Species with discard ratios ≥ 0.1
pounds discarded for 100 pounds longfin retained. ................................................................................ 56
Table 21. Principal Port States (PPST) of Currently-Active Longfin Vessels ...................................... 60
Table 22. Principal Port States (PPST) of Requalifying Vessels for 1B. .............................................. 61
Table 23. Principal Port States (PPST) of Requalifying Vessels for 1C. .............................................. 62
Table 24. Principal Port States (PPST) of Requalifying Vessels for 1D. ............................................... 63
Table 25. Principal Port States (PPST) of Requalifying Vessels for 1E. ............................................... 64
Table 26. Principal Port States (PPST) of Currently-Active Illex Vessels ............................................. 73
Table 27. Principal Port States (PPST) of Requalifying Vessels for 5B ............................................... 74
Table 28. Principal Port States (PPST) of Requalifying Vessels for 5C ............................................... 75
Table 29. Principal Port States (PPST) of Requalifying Vessels for 5D ............................................... 76
Table 30. Principal Port States (PPST) of Requalifying Vessels for 5E ............................................... 77
Table 31. Principal Port States (PPST) of Requalifying Vessels for 5F ............................................... 78
3.3 LIST OF FIGURES
Figure 1. Illex squid landings in NAFO Subareas 5 and 6, between the Gulf of Maine and Cape
Hatteras, NC during 1963-2016. ............................................................................................................. 26
Figure 2. Nominal Ex-Vessel Revenues for Illex landings during 1982-2016...................................... 26
Figure 3. Inflation-adjusted ex-vessel Prices for Illex landings during 1982-2016. ............................. 27
Figure 4. Distribution of landings (mt) from bottom trawl trips with Illex landings > 4.536 mt (10,000
lbs), by ten-minute square, during 2008-2011 and 2012-2015. .............................................................. 28
Figure 5. Longfin Squid Landings in NAFO Subareas 5 and 6 during 1963-2016. .............................. 31
Figure 6. Nominal Longfin Ex-Vessel Revenues Dealer Data ............................................................... 32
Figure 7. Inflation adjusted Longfin Prices ........................................................................................... 32
Figure 8. Distribution of landings (mt) from bottom trawl trips with longfin squid landings by
trimester and ten-minute square, during 2008-2011. .............................................................................. 33
Figure 9. Distribution of landings (mt) from bottom trawl trips with longfin squid landings by
trimester and ten-minute square, during 2012-2015. .............................................................................. 33
Figure 10. Butterfish Catch in U.S. Waters ........................................................................................... 39
Figure 11. Negative Relationship Between Effort (days fished) in the longfin squid fishery during
April-September and October-March LPUE (landings per unit effort) (top) and vice versa (bottom)
during 1982-2015. ................................................................................................................................... 44
10
4.0 INTRODUCTION AND BACKGROUND
Both the Illex and longfin squid fisheries are managed based on annual quotas, but since 2007, the longfin
squid fishery has also been subject to trimester-based quotas of 43% (T1: Jan-Apr), 17% (T2: May-Aug)
and 40% (T3: Sep-Dec), respectively. Landings from the longfin squid (longfin) and Illex squid (Illex)
bottom trawl fisheries are highly variable, but during 2012-2016, landings generated average nominal
ex-vessel revenues of $33.0 million for longfin and $5.5 million for Illex. On average during these time
periods, the longfin fishery landed 59% of its annual quota and the Illex fishery landed 29% of its quota.
However, seasonal longfin fishery closures have suppressed annual landings. Since 2007, T1 has only
closed due to attaining the T1 quota during April of 20072. T2 has closed in July of 2008, August of
2009, August of 2011, July of 2012, August of 2014, and June of 2016. Additionally, a relatively small
portion of the moratorium permits during 2012-2016 accounted for most of the landings in each fishery.
Also, during peak landings in 2016 the longfin squid fishery landed up to 3.5 million pounds in a week,
which means that the vessels that fished in 2016 alone have the capacity to land the entire annual quota
in approximately 14 weeks (though the Trimester allocations would spread catch out temporally).
Likewise, in 2011 the Illex fishery caught as much as 4.5 million pounds in a week, which means that
the vessels that fished in 2011 alone have the capacity to land the entire annual quota in approximately
11 weeks. Based on these observations fishery participants requested that the Council consider removing
latent permits from the directed fishery to ensure access to the quota for the participants that have been
active in the fishery and have come to depend on access to the squid fisheries. This is the focus of most
of the alternatives in this action (generally Sets 1, 2, 3, and 5).
Other alternatives (generally Set 4) address a concern raised by some fishery participants and other
interested parties that the productivity of the longfin squid stock may be negatively impacted if excessive
fishing in T2, which occurs on the spawning grounds, does not allow sufficient spawning and/or hatching
of longfin squid egg mops which are attached to the seabed and vegetation. These concerns relate to
both overall productivity of the stock and the availability of longfin in localized areas.
4.1 OBJECTIVES
Aligned with the issues identified in the Introduction, the objectives of this action are to:
A. Consider the appropriate number of vessels in the directed longfin squid and Illex squid fisheries
and design appropriate management measures for permitted vessels. The Council is considering
this action because there is considerable latent effort in both fisheries - a relatively small portion
of vessels with limited access (“moratorium”) squid permits account for the majority of landings
in most years, and the Council is concerned that activation of latent permits in the squid fisheries
could lead to excessive fishing effort in a shortened season on these semeparous, sub-annual
species, as well as increased catch of non-target species if racing to fish increases.
B. Re-evaluate the management of longfin squid in Trimester 2 (T2). The Council is considering
this action because the productivity of the longfin squid stock may be negatively impacted if
2 An April 2012 closure of the longfin squid fishery was due the fishery’s attainment of the butterfish bycatch cap. The
butterfish bycatch cap is tracked here:
https://www.greateratlantic.fisheries.noaa.gov/ro/fso/reports/ButterfishMortalityCapReport/butterfish_cap.htm

11
excessive fishing effort in T2, which occurs on the inshore spawning grounds, does not allow
sufficient spawning and/or hatching from egg mops.
4.2 REGULATORY AUTHORITY
As discretionary provisions of FMPs, the Magnuson-Stevens Fishery Conservation and Management
Act (MSA) states that any FMP may establish a limited access system for the fishery in order to achieve
optimum yield if, in developing such system, the Council and the Secretary take into account—
(A) present participation in the fishery;
(B) historical fishing practices in, and dependence on, the fishery;
(C) the economics of the fishery;
(D) the capability of fishing vessels used in the fishery to engage in other fisheries;
(E) the cultural and social framework relevant to the fishery and any affected fishing
communities;
(F) the fair and equitable distribution of access privileges in the fishery; and
(G) any other relevant considerations.
As discretionary provisions of FMPs the MSA also allows restriction of fishing by time/season. Both
limited access and seasonal management have been previously incorporated into the MSB FMP and this
action would modify the existing provisions.
4.3 FMP HISTORY AND MANAGEMENT OBJECTIVES
Management of the MSB fisheries began through the implementation of three separate FMPs (one each
for mackerel, squid, and butterfish) in 1978. The plans were merged in 1983. Over time a wide variety
of management issues have been addressed including stock rebuilding, habitat conservation, bycatch
minimization, and limiting participation in the fisheries. The history of the plan and its amendments can
be found at http://www.mafmc.org/fisheries/fmp/msb.
The management goals and objectives, as described in the current FMP are listed below.
1. Enhance the probability of successful (i.e., the historical average) recruitment to the fisheries.
2. Promote the growth of the U.S. commercial fishery, including the fishery for export.
3. Provide the greatest degree of freedom and flexibility to all harvesters of these resources
consistent with the attainment of the other objectives of this FMP.
4. Provide marine recreational fishing opportunities, recognizing the contribution of recreational
fishing to the national economy.
5. Increase understanding of the conditions of the stocks and fisheries.
6. Minimize harvesting conflicts among U.S. commercial, U.S. recreational, and foreign fishermen.
12
4.4 MANAGEMENT UNIT AND GEOGRAPHIC SCOPE
The management unit (fish stock definition) for the MSB FMP is all Atlantic mackerel (Scomber
scombrus), longfin inshore squid (Doryteuthis (Amerigo) pealeii ),3 Northern shortfin squid (Illex
illecebrosus), and Atlantic butterfish (Peprilus triacanthus) under U.S. jurisdiction in the Northwest
Atlantic, with a core fishery management area from Maine to North Carolina.
THIS SPACE INTENTIONALLY LEFT BLANK
3 For longfin squid there was a scientific name change from Loligo pealeii to Doryteuthis (Amerigo) pealeii. To avoid
confusion, this document will utilize the common name “longfin squid” or just “longfin” wherever possible, but this squid is
often referred to as "Loligo" by interested parties.
13
5.0 MANAGEMENT ALTERNATIVES
5.1 ALTERNATIVE SET 1: LONGFIN SQUID MORATORIUM PERMIT
REQUALIFICATION ALTERNATIVES
Alternatives in this set could be selected in addition to alternatives in other sets or on their own if no
action is selected for other sets. This action would not allow new entrants to qualify for a moratorium
permit. The Council would only choose one action alternative within this set.
Alternative 1A. No action. No changes would be made to longfin/butterfish moratorium permits. The
existing system of longfin squid/butterfish moratorium permits and incidental permits would remain in
place. In 2016 there were approximately 286 vessels with active moratorium permits and
approximately another 97 that had their permits/histories held in Confirmation of Permit History4
(CPH). There were approximately 1,500 incidental permits in 2016. A summary of regulations for
these permits may be found at https://www.greateratlantic.fisheries.noaa.gov/regs/info.html.
Alternative 1B. Requalify current longfin squid/butterfish permits if they landed at least 10,000
pounds in any year from 1997-2015. Permits in “Confirmation of Permit History” (CPH) could
requalify if they have the required landings.
Rational: The general rationale for the longfin squid moratorium permit alternatives is that an influx of
entrants may dilute the amount of quota available to those vessels that have become dependent on
longfin squid fishing, so latent permits should be removed. This option would include a long
qualifying period and a low threshold to enable more vessels to requalify; only the least active vessels
would be impacted by this alternative. For example, 10,000 pounds could be landed in just four trips
at the current incidental trip limit, so any vessels that would not re-qualify would have had very low
activity during the re-qualification period. 2016 is not included due to the influx of effort in 2016.
Catch data is most accurate after 1997 due to permitting and reporting requirements.
Alternative 1C. Requalify current longfin squid/butterfish permits if they landed at least 10,000
pounds in any year from 1997-2013. Permits in “Confirmation of Permit History” (CPH) could
requalify if they have the required landings.
Rational: The general rationale for the longfin squid moratorium permit alternatives is that an influx of
entrants may dilute the amount of quota available to those vessels that have become dependent on
longfin squid fishing, so latent permits should be removed. This option would include a relatively long
qualifying period and a low threshold to enable more vessels to requalify; only the least active vessels
4 A CPH is required when a vessel that has been issued a limited access permit has sunk, been destroyed, or has been sold
to another person without its permit history. Possession of a CPH allows maintaining of the landings history of the permit
without owning a vessel.

14
or those entering after the control date5 year would be impacted by this alternative. For example,
10,000 pounds could be landed in just four trips at the incidental trip limit, so any vessels that would
not re-qualify would have had very low activity during the re-qualification period. Using the control
date excludes the newest entrants (or re-entrants) into the directed fishery (entry of new participants
may dilute quota availability). Catch data is most accurate after 1997 due to permitting and reporting
requirements.
Alternative 1D. Requalify current longfin squid/butterfish permits if they landed at least 25,000
pounds in any year from 2003-2013. Permits in “Confirmation of Permit History” (CPH) could
requalify if they have the required landings.
Rational: The general rationale for the longfin squid moratorium permit alternatives is that an influx of
entrants may dilute the amount of quota available to those vessels that have become dependent on
longfin squid fishing, so latent permits should be removed. This option would include a more recent
qualifying period that ends at the recent control date year and has a moderately low requalifying
threshold. For example, 25,000 pounds could be landed in ten trips at the incidental trip limit or 1-2
directed trips, so any vessels that would not re-qualify would have had relatively low activity during
the re-qualification period. Beginning in 2003 means qualifying participation would have to be
relatively recent. Using the control date excludes the newest entrants (or re-entrants) into the directed
fishery (entry of new participants may dilute quota availability). A start date of 2003 was based on
2003 being a break point in the numbers of active vessels and 2003 being a long enough time period to
encompass a range of squid fishery conditions.
Alternative 1E. Requalify current longfin squid/butterfish permits if they landed at least 50,000
pounds on average during 1997-2013. Permits in “Confirmation of Permit History” (CPH) could
requalify if they have the required landings.
Rational: The general rationale for the longfin squid moratorium permit alternatives is that an influx of
entrants may dilute the amount of quota available to those vessels that have become dependent on
longfin squid fishing, so latent permits should be removed. This option would include a higher
landings threshold for directed fishing, but still considers a relatively long time period. A 50,000-
pound average threshold means that qualifying vessels would have spent more effort directing on
longfin squid than those that qualify under the lower threshold options. Using the control date
excludes the newest entrants (or re-entrants) into the directed fishery (entry of new participants may
dilute quota availability). Catch data is most accurate after 1997 due to permitting and reporting
requirements.
5 The current control date for the longfin squid fishery is May 16, 2013.
15
5.2 ALTERNATIVE SET 2: LONGFIN SQUID MORATORIUM PERMIT
REQUALIFICATION SUB-ALTERNATIVES
2B or 2C could be selected if an action alternative from Set 1 is selected. Alternatives in this set could
also be selected in addition to alternatives from Sets 3, 4, and 5. 2C would only apply if either 3B or
3C is selected. Within the action alternatives in this set, the Council could select both 2B and 2C or
just one.
Alternative 2A. No action. No additional requalification options would be selected.
Alternative 2B. An entity that is currently issued more than one longfin squid/butterfish moratorium
permit has a one-time opportunity to swap re-qualifying moratorium permits among vessels owned by
that same entity that currently have longfin squid/butterfish moratorium permits. All histories would
remain the same for all vessels, and the swap would have to occur between vessels that are within the
10% length - 20% horsepower upgrade restrictions. The swap could occur during the re-qualification
implementation period, and the baseline of the vessel from which the re-qualified permit came would
be the baseline of the final re-qualified permit.
Rational: This would help maximize potential fishing opportunities and associated revenue for entities
that have been issued multiple moratorium permits on separate vessels. Allowing a one-time permit
swap among vessels would allow an entity to place a moratorium permit on a vessel that would be
more likely to target squid based on other permits issued to that vessel. For example, a vessel issued
moratorium squid permit and a limited access full-time Atlantic sea scallop permit is likely to
concentrate fishing efforts on sea scallops due to the higher potential fishing revenue associated with
the scallop fishery. This alternative may also mitigate the loss of a permit for entities that own
multiple permits. Ultimately, the same number of permits would be removed from the fishery if 2B is
selected, but this option could help entities that are losing one or more permits to balance their permit
suites across vessels.
Alternative 2C. If a vessel that currently has been issued a moratorium longfin squid/butterfish permit
does not re-qualify, it would automatically be issued a limited access incidental permit if the Council
makes the current open access incidental permit a limited access permit (see Alternatives 3B and 3C).
Rational: This alternative addresses the historical participation of vessels that qualified for the original
longfin squid/butterfish moratorium permit, but would not have landings to re-qualify for a moratorium
permit or a limited access incidental permit. Their historical participation would allow them a higher
level of access than the proposed lower open access trip limits by qualifying them for the new limited
access incidental permit.
16
5.3 ALTERNATIVE SET 3: LONGFIN SQUID INCIDENTAL AND OPEN ACCESS
ALTERNATIVES
Alternatives in this set could be selected in addition to alternatives in other sets or on their own if no
action is selected for other sets. Within the action alternatives in this set, the Council could select
either 3B or 3C, possibly combined with either 3D or 3E.
Alternative 3A. No action. The current open access squid/butterfish incidental permit and associated
trip limits would remain as they are, which allow 2,500 pounds of longfin squid, 10,000 pounds of
Illex squid, and 600 pounds of butterfish.
Alternative 3B. Create a new limited-access incidental longfin squid permit that cannot be reacquired
if dropped. Qualification years would be from 1997-2013 and require landings of at least 2,500
pounds in any one year. Possession of a commercial squid permit at some point during the
qualification period could also be required6 but has not been specified to date. The trip limit would be
2,500 pounds. There would be no vessel upgrade baselines associated with this incidental permit.
Rational: The current open access incidental permit can be dropped and added at any time within a
year, allowing vessels to access Federal waters at times with the permit, and fish above Federal limits
in some state waters at other times without the permit. Making the permit a limited access permit that
could not be dropped and re-issued at any time would eliminate this loophole and help restrict landings
after Trimester closures, especially T2. The qualification threshold would be low – the equivalent of
only one incidental trip limit so that most vessels would qualify and would be minimally impacted
besides closing the loophole. The initial possession limit would be 2,500 pounds per trip. If
Alternative 2C is also selected, a vessel that currently has been issued a moratorium longfin
squid/butterfish permit but does not re-qualify under this amendment would automatically be issued
this limited access incidental permit
Alternative 3C. Create a new limited-access incidental longfin squid permit that cannot be reacquired
if dropped. Qualification years would be from 1997-2013 and require landings of at least 5,000
pounds in any one year. Possession of a commercial squid permit at some point during the
qualification period could also be required7 but has not been specified to date. The initial trip limit
would be 2,500 pounds. There would be no vessel upgrade baselines associated with this
incidental permit.
Rational: The current open access incidental permit can be dropped and added at any time within a
year, allowing vessels to access Federal waters at times with the permit, and fish above Federal limits
6 This has not been explicitly addressed by the Council yet but is a standard practice with most limited access qualifications. 7 This has not been explicitly addressed by the Council yet but is a standard practice with most limited access qualifications.
17
in some state waters at other times without the permit. Making the permit a limited access permit that
could not be dropped and re-issued at any time would eliminate this loophole. The qualification
threshold would be low – the equivalent of only two incidental trip limits so that most vessels would
qualify and would be minimally impacted besides closing the loophole. The initial possession limit
would be 2,500 pounds per trip. If Alternative 2C is also selected, a vessel that currently has been
issued a moratorium longfin squid/butterfish permit but does not re-qualify under this amendment
would automatically be issued this limited access incidental permit
Alternative 3D. Reduce the open-access longfin squid incidental trip limit to 250 pounds.
Rational: This option would reduce the current open access incidental trip limit from 2,500 pounds to
reduce incentives to target longfin squid under this incidental permit, particularly after a trimester
quota is caught. Landings following the closure of T2 in June 2016 resulted in a harvest that was about
50% higher than the quota. However, this alternative would allow some post-closure landings for open
access permit holders to minimize regulatory discards.
Alternative 3E. Reduce the open-access longfin squid incidental trip limit to 500 pounds.
Rational: This option would reduce the current open access incidental trip limit from 2,500 pounds to
reduce incentives to target longfin squid under this incidental permit, particularly once a trimester
quota is caught. Landings following the closure of T2 in June 2016 resulted in landings that were
about 50% higher than the quota. However, this Alternative would allow some post-closure landings
for open access permit holders to minimize regulatory discards.
THIS SPACE INTENTIONALLY LEFT BLANK
18
5.4 ALTERNATIVE SET 4: LONGFIN SQUID TRIMESTER 2 (“T2”) ALTERNATIVES
Alternatives in this set could be selected in addition to alternatives in other sets or on their own if no
action is selected for other sets. Within the action alternatives in this set, the Council could select
either 4B or 4C, possibly combined with either 4D or 4E, possibly combined with 4F.
Alternative 4A. No action. The annual quota is divided among three 4-month trimesters, with the
initial Trimester 2 (T2, May through August) allocation set at 17% of the annual quota (8.4 million
pounds in 2017). Trimester 1 (T1) is allocated 43% of the annual quota (21.3 million pounds) and
Trimester 3 (T3) is initially allocated 40% of the annual quota (19.8 million pounds). Any underages
for T1 that are greater than 25 percent are reallocated to Trimesters 2 and 3 (split equally between both
trimesters) of the same year. The reallocation is limited, such that T2 may only be increased by 50
percent (i.e. to a maximum of 12.6 million pounds under the current annual quota); the remaining
portion of the underage is reallocated to T3. Any underages for T1 that are less than 25 percent of the
T1 quota are applied to T3 of the same year. Any overages for T1 and T2 are subtracted from T3 of the
same year. Also, the trip limit in Federal waters after a Trimester closure is 2,500 pounds.
Alternative 4B. Eliminate roll-over of longfin squid quota from T1 to T2 (all un-caught T1 quota
would be rolled-over to T3).
Rational: The productivity of the longfin squid stock may be negatively impacted if excessive fishing
in T2 does not allow sufficient spawning and/or hatching from the species’ egg “mops,” which are
attached to the seabed. In addition, fishery observer data from the NEFOP indicate that certain other
commercial and recreationally fished species, including scup, striped bass, summer flounder, winter
flounder, and black sea bass have had relatively higher bycatch rates during T2 than during T1 and T3.
Alternative 4C. Reduce the maximum T1 to T2 rollover of longfin squid quota to 25% of the original
T2 quota. The initial T2 quota (17% of annual quota) is approximately 8.4 million pounds, so the
maximum T2 quota after rollover would be 10.5 million pounds.
Rational: The productivity of the longfin squid stock may be negatively impacted if excessive fishing
in T2 does not allow sufficient spawning and/or hatching from egg “mops” that are attached to the
seabed. In addition, fishery observer data from the NEFOP indicate that certain other commercial and
recreationally fished species, including scup, striped bass, summer flounder, winter flounder, and black
sea bass have had relatively higher bycatch rates during T2 than during T1 and T3.
Alternative 4D. Implement a reduced 250-pound trip limit for all longfin squid permits when the
directed T2 fishery closes.
19
Rational: Substantial landings have occurred after T2 closures in recent years at the current 2,500
pound trip limit. Catch following the closure of Trimester II in June 2016 resulted in harvest that was
about 50% higher than the quota. The productivity of the longfin squid stock may be negatively
impacted if excessive fishing in T2 does not allow sufficient spawning and/or hatching from egg
“mops” that are attached to the seabed. In addition, fishery observer data from the NEFOP indicate
that certain other commercial and recreationally fished species, including scup, striped bass, summer
flounder, winter flounder, and black sea bass have relatively higher bycatch rates during T2 than
during T1 and T3. Input from the MSB AP indicated that a lower post-closure trip limit will reduce
targeting of longfin squid after the directed fishery closes.
Alternative 4E. Implement a reduced 500-pound trip limit for all longfin squid permits when the
directed T2 fishery closes.
Rational: Substantial landings have occurred after T2 closures in recent years at the current 2,500
pound trip limit. Catch following the closure of Trimester II in June 2016 resulted in harvest that was
about 50% higher than the quota. The productivity of the longfin squid stock may be negatively
impacted if excessive fishing in T2 does not allow sufficient spawning and/or hatching from egg
“mops” that are attached to the seabed. In addition, fishery observer data from the NEFOP indicate
that certain other commercial and recreationally fished species, including scup, striped bass, summer
flounder, winter flounder, and black sea bass have relatively higher bycatch rates during T2 than
during T1 and T3. Input from the MSB AP indicated that a lower post-closure trip limit will reduce
targeting of longfin squid after the directed fishery closes.
Alternative 4F. Split the Trimester 2 quota, with half available May 1- June 30, and the additional half
available July 1-August 31. Open access incidental and post-closure trip limits would remain as status
quo or as specified in other alternatives in this action (see above).
Rational: Rapid landings in some recent years have caused a market glut of squid in T2 according to
AP members, which lowers product quality and prices. This alternative would force longfin squid
fishing to be spread out over a longer time period in T2.
20
5.5 ALTERNATIVE SET 5: ILLEX SQUID MORATORIUM PERMIT REQUALIFICATION
ALTERNATIVES
Alternatives in this set could be selected in addition to alternatives in other sets or on their own if no
action is selected for other sets. This action would not allow new entrants to qualify for a moratorium
permit. The Council would only choose one alternative within this set.
Alternative 5A. No action. No changes would be made to Illex moratorium permits.
Alternative 5B. Requalify current Illex moratorium permits if they landed at least 10,000 pounds in
any year from 1997-2015. Permits in “Confirmation of Permit History” (CPH) could requalify if they
have the required landings.
Rational: The general rationale for the Illex squid moratorium permit alternatives is that an influx of
entrants may dilute the amount of quota available to those vessels that have become dependent on Illex
squid fishing, so latent permits should be removed. This option would include a long qualifying period
and a low threshold to enable more vessels to requalify; only the least active vessels would be
impacted by this alternative. For example, 10,000 pounds could be landed in just one trip at the
current incidental trip limit, so any vessels that would not re-qualify would have had very low activity
during the re-qualification period. Catch data is most accurate after 1997 due to permitting and
reporting requirements.
Alternative 5C. Requalify current Illex moratorium permits if they landed at least 10,000 pounds in
any year from 1997-2013. Permits in “Confirmation of Permit History” (CPH) could requalify if they
have the required landings.
Rational: The general rationale for the Illex squid moratorium permit alternatives is that an influx of
entrants may dilute the amount of quota available to those vessels that have become dependent on Illex
squid fishing, so latent permits should be removed. This option would include a relatively long
qualifying period that ends at the recent control date8 year. 10,000 pounds could be landed in just one
trip at the incidental trip limit, so any vessels that would not re-qualify would have had very low
activity during the re-qualification period. Using the control date excludes newest entrants (or re-
entrants) into the directed fishery (entry of new participants may dilute quota availability). Catch data
is most accurate after 1997 due to permitting and reporting requirements.
8 The current control date for the Illex fishery is August 2, 2013.
21
Alternative 5D. Requalify current Illex moratorium permits if they landed at least 50,000 pounds in
any year from 1997-2013. Permits in “Confirmation of Permit History” (CPH) could requalify if they
have the required landings.
Rational: The general rationale for the Illex squid moratorium permit alternatives is that an influx of
entrants may dilute the amount of quota available to those vessels that have become dependent on Illex
squid fishing, so latent permits should be removed. This option would include a moderately low
qualification threshold to identify vessels that have been somewhat more active in the fishery than the
lowest thresholds. Using the control date excludes newest entrants (or re-entrants) into the directed
fishery (entry of new participants may dilute quota availability). Catch data is most accurate after
1997 due to permitting and reporting requirements.
Alternative 5E. Requalify current Illex moratorium permits if they landed at least 100,000 pounds in
any year from 1997-2013. Permits in “Confirmation of Permit History” (CPH) could requalify if they
have the required landings.
Rational: The general rationale for the Illex squid moratorium permit alternatives is that an influx of
entrants may dilute the amount of quota available to those vessels that have become dependent on Illex
squid fishing, so latent permits should be removed. This option would include a moderately high
qualification threshold to identify vessels that have been more active in the fishery. Using the control
date excludes newest entrants (or re-entrants) into the directed fishery (entry of new participants may
dilute quota availability). Catch data is most accurate after 1997 due to permitting and reporting
requirements.
Alternative 5F. Requalify current Illex moratorium permits if they landed at least 200,000 pounds in
any year from 1997-2013. Permits in “Confirmation of Permit History” (CPH) could requalify if they
have the required landings.
Rational: The general rationale for the Illex squid moratorium permit alternatives is that an influx of
entrants may dilute the amount of quota available to those vessels that have become dependent on Illex
squid fishing, so latent permits should be removed. This option would include a relatively high
qualification threshold to identify vessels that have been most active in the fishery. Using the control
date excludes newest entrants (or re-entrants) into the directed fishery (entry of new participants may
dilute quota availability). Catch data is most accurate after 1997 due to permitting and reporting
requirements.
22
5.6 CONSIDERED BUT REJECTED FROM FURTHER ANALYSIS
The Council considered the possibility of granting vessels from Maine new longfin squid permits
based on a request from the State of Maine related to a higher abundance of longfin squid off Maine in
some recent years. However, the MSA does not allow measures that discriminate against residents of
different states, and it does not appear fair to take permits from some current permit holders and give
new permits to residents of just one state. Residents from Maine can purchase permits that could allow
directed fishing on longfin squid. In addition, adding new participants generally runs counter to the
primary latent permit reduction objective of this action.
The Council also considered adding to the scope of the Amendment by looking at buffer areas south of
Martha’s Vineyard and Nantucket to resolve a user conflict that has developed there due to longfin
squid fishing just outside Massachusetts state waters during the T2. Ultimately the Council decided to
potentially consider this issue in a separate action, and it was added as a possible deliverable in the
Council’s 2017 Implementation Plan (http://www.mafmc.org/strategic-plan/). This approach allows
the current Amendment to proceed in an efficient fashion and for the buffer area issue to be addressed
separately. In addition, some of the possible measures in this Amendment could indirectly address this
user conflict issue by limiting overall squid catch/effort in T2 - addressing the issue of the overall
catch/effort in T2 first will allow a better assessment of whether additional buffer areas are appropriate.
The Council also considered allowing a permit swap option for Illex similar to Alternative 2B for
longfin squid, but decided that the public request for a permit swap option was specific to longfin squid
and not needed or appropriate for Illex squid.
6.0 DESCRIPTION OF THE AFFECTED ENVIRONMENT
The affected environment consists of those physical, biological, and human components of the
environment that are or will be meaningfully connected to commercial longfin and Illex fishing
operations, and are described below.
6.1 PHYSICAL ENVIRONMENT
The managed resources inhabit the Northeast U.S. Shelf Ecosystem, which has been described as
including the area from the Gulf of Maine south to Cape Hatteras, extending from the coast seaward to
the edge of the continental shelf, including the slope sea offshore to the Gulf Stream. The continental
slope includes the area east of the shelf, out to a depth of 2000 m. Four distinct sub-regions comprise the
NOAA Fisheries Northeast Region: the Gulf of Maine, Georges Bank, the Mid-Atlantic Bight, and the
continental slope. The areas of interest in this action include the Mid-Atlantic Bight and the continental
slope. The Mid-Atlantic Bight is comprised of the sandy, relatively flat, gently sloping continental shelf
from southern New England to Cape Hatteras, NC. The continental slope begins at the continental shelf
break and continues eastward with increasing depth until it becomes the continental rise.
The continental shelf slopes gently from shore out to between 100 and 200 km offshore where it
transforms to the slope at the shelf break (100-200 m water depth), continuing eastward with increasing
23
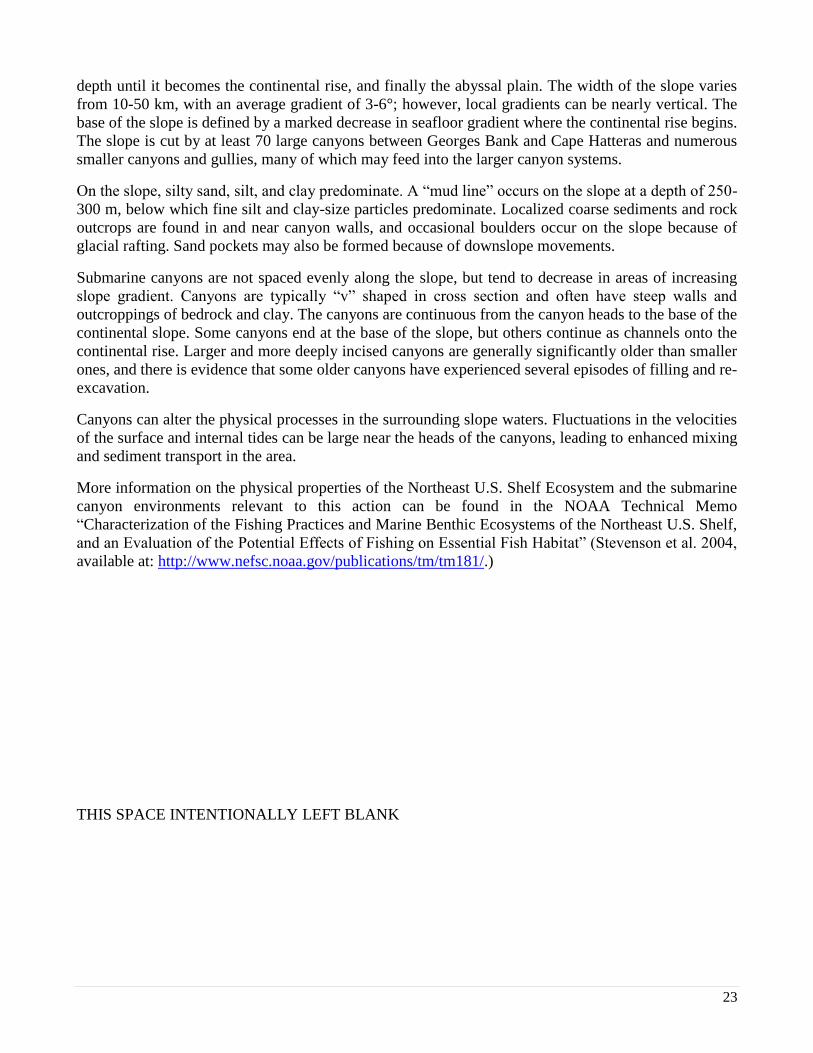
depth until it becomes the continental rise, and finally the abyssal plain. The width of the slope varies
from 10-50 km, with an average gradient of 3-6°; however, local gradients can be nearly vertical. The
base of the slope is defined by a marked decrease in seafloor gradient where the continental rise begins.
The slope is cut by at least 70 large canyons between Georges Bank and Cape Hatteras and numerous
smaller canyons and gullies, many of which may feed into the larger canyon systems.
On the slope, silty sand, silt, and clay predominate. A “mud line” occurs on the slope at a depth of 250-
300 m, below which fine silt and clay-size particles predominate. Localized coarse sediments and rock
outcrops are found in and near canyon walls, and occasional boulders occur on the slope because of
glacial rafting. Sand pockets may also be formed because of downslope movements.
Submarine canyons are not spaced evenly along the slope, but tend to decrease in areas of increasing
slope gradient. Canyons are typically “v” shaped in cross section and often have steep walls and
outcroppings of bedrock and clay. The canyons are continuous from the canyon heads to the base of the
continental slope. Some canyons end at the base of the slope, but others continue as channels onto the
continental rise. Larger and more deeply incised canyons are generally significantly older than smaller
ones, and there is evidence that some older canyons have experienced several episodes of filling and re-
excavation.
Canyons can alter the physical processes in the surrounding slope waters. Fluctuations in the velocities
of the surface and internal tides can be large near the heads of the canyons, leading to enhanced mixing
and sediment transport in the area.
More information on the physical properties of the Northeast U.S. Shelf Ecosystem and the submarine
canyon environments relevant to this action can be found in the NOAA Technical Memo
“Characterization of the Fishing Practices and Marine Benthic Ecosystems of the Northeast U.S. Shelf,
and an Evaluation of the Potential Effects of Fishing on Essential Fish Habitat” (Stevenson et al. 2004,
available at: http://www.nefsc.noaa.gov/publications/tm/tm181/.)
THIS SPACE INTENTIONALLY LEFT BLANK
24
6.2 BIOLOGICAL ENVIRONMENT
6.2.1 Description of the Managed Resources in the FMP
Atlantic mackerel is a semi-pelagic/semi-demersal (may be found near the bottom or higher in the water
column) schooling fish species primarily distributed between Labrador (Newfoundland, Canada) and
North Carolina. Additional life history information is detailed in the Essential Fish Habitat (EFH)
document for the species, located at: http://www.nefsc.noaa.gov/nefsc/habitat/efh/. The status of Atlantic
mackerel is unknown with respect to being overfished or not, and unknown with respect to experiencing
overfishing or not. Recent results from the Northeast Fisheries Science Center (NEFSC) Spring Trawl
survey (the spring survey catches the most mackerel) are highly variable, and are graphed in the “NEFSC
Biological Update” that is created as part of the annual quota setting process. These are available at:
http://www.mafmc.org/ssc-meeting-documents/ (see May 2016 Meeting Materials). Atlantic mackerel
has a stock assessment scheduled for 2017. Acceptable Biological Catches (ABCs) are set by the
Council’s Scientific and Statistical Committee (SSC) to avoid overfishing given the best available
science. See http://www.mafmc.org/ssc for details on how ABCs are set for this species.
Atlantic butterfish is a semi-pelagic/semi-demersal schooling fish species primarily distributed
between Nova Scotia, Canada and Florida. Additional life history information is detailed in the EFH
document for the species, located at: http://www.nefsc.noaa.gov/nefsc/habitat/efh/. The status of
butterfish is not overfished (above target biomass) with no overfishing occurring according to a recently
accepted assessment (NEFSC 2014, available at: http://nefsc.noaa.gov/publications/crd/crd1403/).
Butterfish has a stock assessment update scheduled for 2017. ABCs are set by the Council’s SSC to
avoid overfishing given the best available science. See http://www.mafmc.org/ssc for details on how
ABCs are set for this species.
Longfin squid is a neritic (from the shore to the edge of the continental shelf), semi-pelagic schooling
cephalopod species primarily distributed between Georges Bank and Cape Hatteras, NC. Additional life
history information is detailed in the EFH document for the species (Jacobson 2005), located at:
http://www.nefsc.noaa.gov/nefsc/habitat/efh/. Information about the fishery, management and life
history is presented in Arkhipkin et al. (2015). Based on a new biomass reference point from the 2010
stock assessment, the longfin squid stock was not overfished in 2009, but overfishing status was not
determined because no overfishing threshold was recommended (though the assessment did describe the
stock as “lightly exploited’). The most recent stock assessment document (NEFSC 2011) is available
at: http://www.nefsc.noaa.gov/saw/reports.html. Longfin squid relative abundance and biomass indices
from the NEFSC fall bottom trawl surveys are highly variable, and are graphed in the “NEFSC
Biological Update” that is created as part of the annual quota setting process. These are available at:
http://www.mafmc.org/ssc-meeting-documents/ (see May 2016 Meeting Materials). Longfin squid has
a stock assessment update scheduled for 2017, which should be posted by May 1, 2017 to
http://www.mafmc.org/ssc-meetings/2017/may-17-18. Acceptable Biological Catches (ABCs) are set
by the Council’s Scientific and Statistical Committee to avoid overfishing given the best available
science. See http://www.mafmc.org/ssc for details on how ABCs are set for this species.
Illex squid is an oceanic, semi-pelagic schooling cephalopod species distributed between Newfoundland
and the Florida Straits. Additional life history information is detailed in the EFH document for the
species (Hendrickson and Holmes 2004), located at: http://www.nefsc.noaa.gov/nefsc/habitat/efh/.
Information about the fishery, management and life history is presented in Arkhipkin et al. (2015). The
status of Illex is unknown with respect to being overfished and is unknown with respect to overfishing.
25
Illex squid relative abundance and biomass indices from the NEFSC fall bottom trawl surveys are highly
variable, and are graphed in the “NEFSC Biological Update” that is created as part of the annual quota
setting process. These are available at: http://www.mafmc.org/ssc-meeting-documents/ (see May 2016
Meeting Materials). ABCs are set by the Council’s SSC to avoid overfishing given the best available
science. See http://www.mafmc.org/ssc for details on how ABCs are set for this species.
6.3 HUMAN COMMUNITIES AND ECONOMIC ENVIRONMENT
This section describes the socio-economic importance of the MSB fisheries, with a focus on the squid
fisheries. Recent Amendments to the MSB FMP contain additional information about the MSB fisheries,
especially demographic information on ports that land MSB species. See Amendments 11 and 14 at
http://www.mafmc.org/msb/ for more information or visit NMFS’ communities page at:
http://www.nefsc.noaa.gov/read/socialsci/community_profiles/. In general, the MSB fisheries saw high
foreign landings in the 1970s followed by a domestication of the fishery, and domestic landings have
been lower than the peak foreign landings. The current regulations for the MSB fisheries are
summarized by NMFS at https://www.greateratlantic.fisheries.noaa.gov/regs/info.html, and detailed in
the Federal Register at http://www.ecfr.gov/cgi-bin/text-
idx?c=ecfr&SID=1e9802ffddb05d0243d9c657fade956c&rgn=div5&view=text&node=50:12.0.1.1.5&i
dno=50.
6.3.1 Atlantic Mackerel
US commercial landings of mackerel increased steadily from roughly 3,000 metric tons (mt) in the
early 1980s to greater than 31,000 mt by 1990. US mackerel landings declined to relatively low levels
1992-2000 before increasing in the early 2000s. The most recent years have seen a significant drop-off
in harvest. Additional information on this fishery can be found in the specifications’ Environmental
Assessment, available at
http://www.greateratlantic.fisheries.noaa.gov/regs/2014/November/14msb2015174specspr.html. The
most recent Advisory Panel (AP) Fishery Information Document and AP Fishery Performance Report
(available at http://www.mafmc.org/ssc-meetings/2016/may-25-26) also have recent details on fishery
performance.
6.3.2 Illex Squid
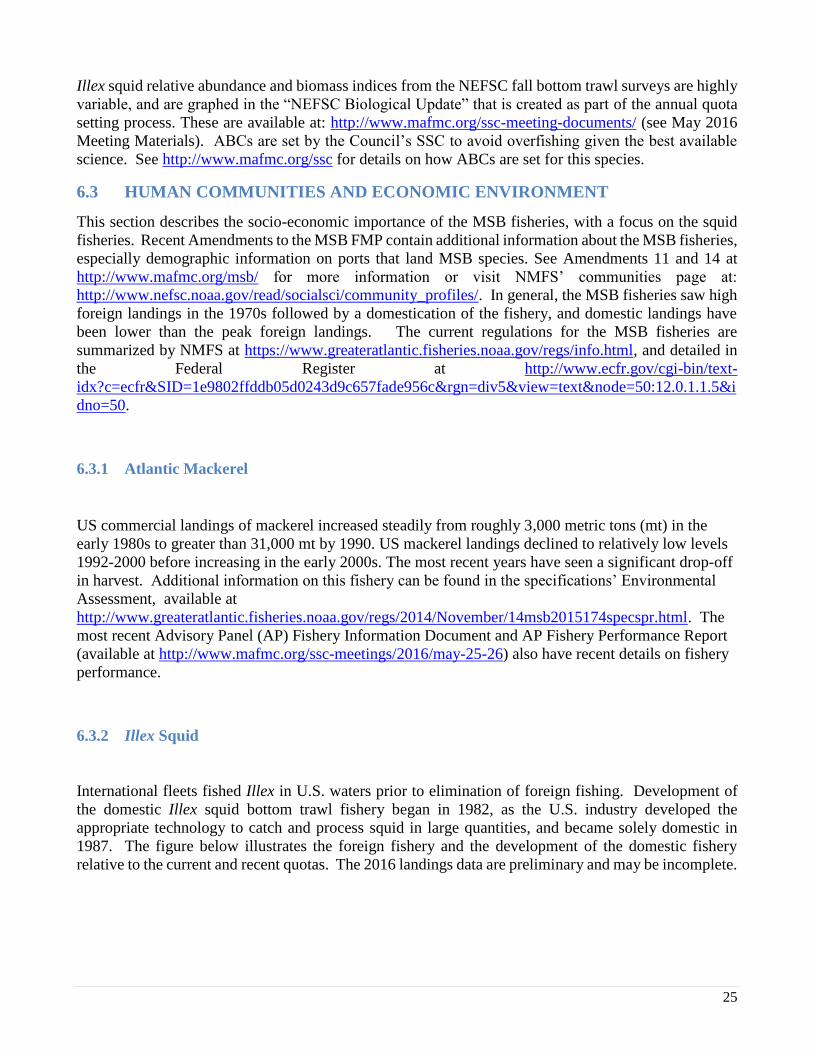
International fleets fished Illex in U.S. waters prior to elimination of foreign fishing. Development of
the domestic Illex squid bottom trawl fishery began in 1982, as the U.S. industry developed the
appropriate technology to catch and process squid in large quantities, and became solely domestic in
1987. The figure below illustrates the foreign fishery and the development of the domestic fishery
relative to the current and recent quotas. The 2016 landings data are preliminary and may be incomplete.
26
Figure 1. Illex squid landings in NAFO Subareas 5 and 6, between the Gulf of Maine and Cape Hatteras,
NC during 1963-2016.
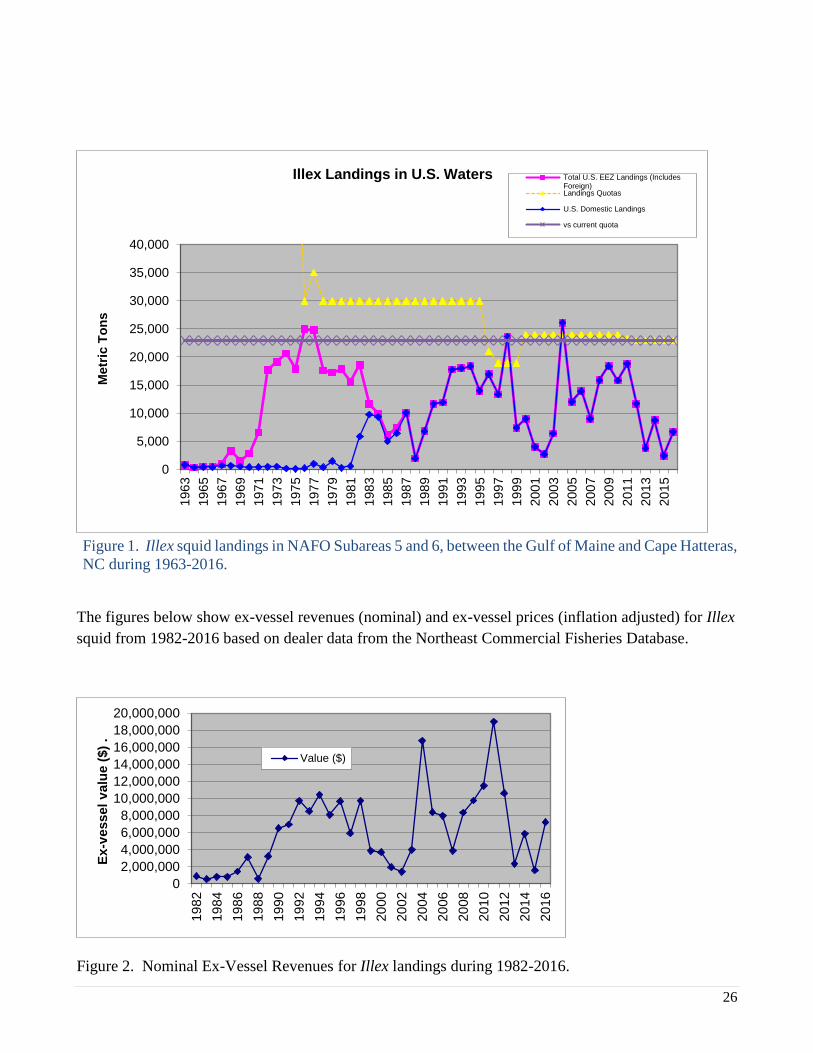
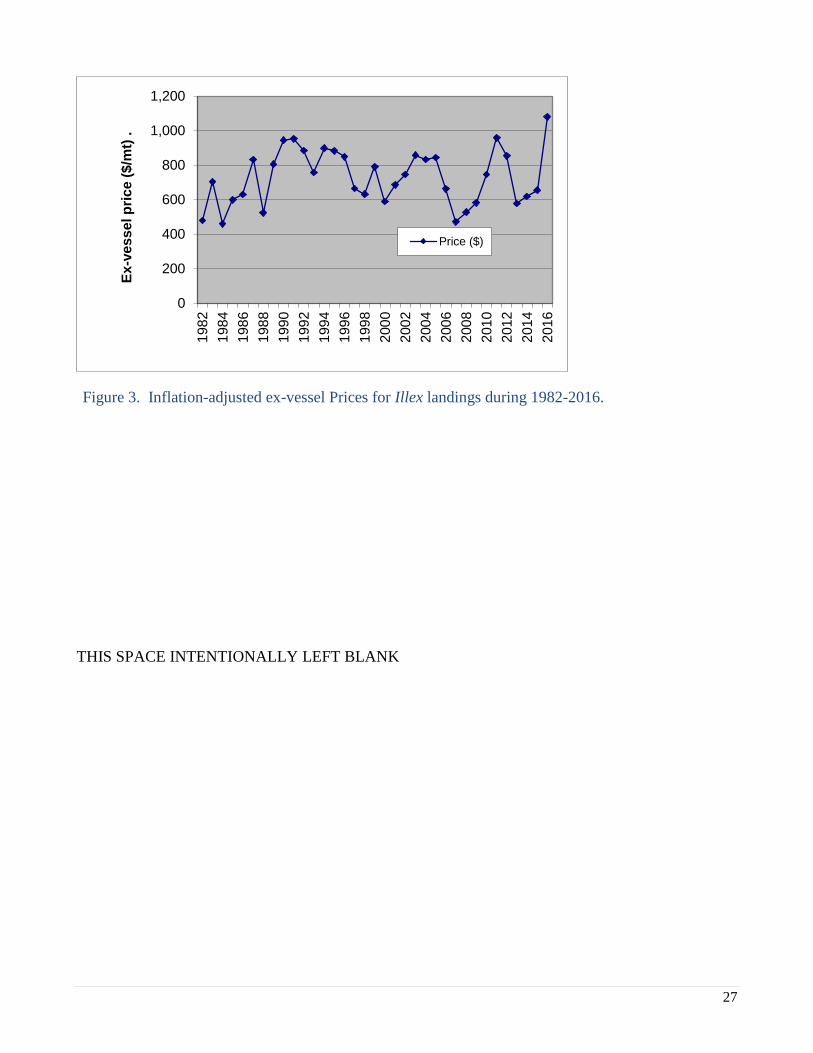
The figures below show ex-vessel revenues (nominal) and ex-vessel prices (inflation adjusted) for Illex
squid from 1982-2016 based on dealer data from the Northeast Commercial Fisheries Database.
Figure 2. Nominal Ex-Vessel Revenues for Illex landings during 1982-2016.
0
5,000
10,000
15,000
20,000
25,000
30,000
35,000
40,000
196
3
19
65
19
67
19
69
19
71
19
73
19
75
19
77
19
79
19
81
19
83
19
85
19
87
19
89
19
91
19
93
19
95
19
97
19
99
200
1
20
03
200
5
20
07
20
09
20
11
20
13
20
15
Me
tric
To
ns
Illex Landings in U.S. Waters Total U.S. EEZ Landings (IncludesForeign)Landings Quotas
U.S. Domestic Landings
vs current quota
0
2,000,000
4,000,000
6,000,000
8,000,000
10,000,000
12,000,000
14,000,000
16,000,000
18,000,000
20,000,000
19
82
19
84
19
86
19
88
19
90
19
92
19
94
19
96
19
98
20
00
20
02
20
04
20
06
20
08
20
10
20
12
20
14
20
16
Ex-v
essel
valu
e (
$)
.
Value ($)
27
Figure 3. Inflation-adjusted ex-vessel Prices for Illex landings during 1982-2016.
THIS SPACE INTENTIONALLY LEFT BLANK
0
200
400
600
800
1,000
1,200
198
2
198
4
198
6
198
8
199
0
199
2
199
4
199
6
199
8
2000
200
2
200
4
200
6
200
8
201
0
2012
201
4
201
6
Ex
-ve
ss
el p
ric
e (
$/m
t) .
Price ($)
28
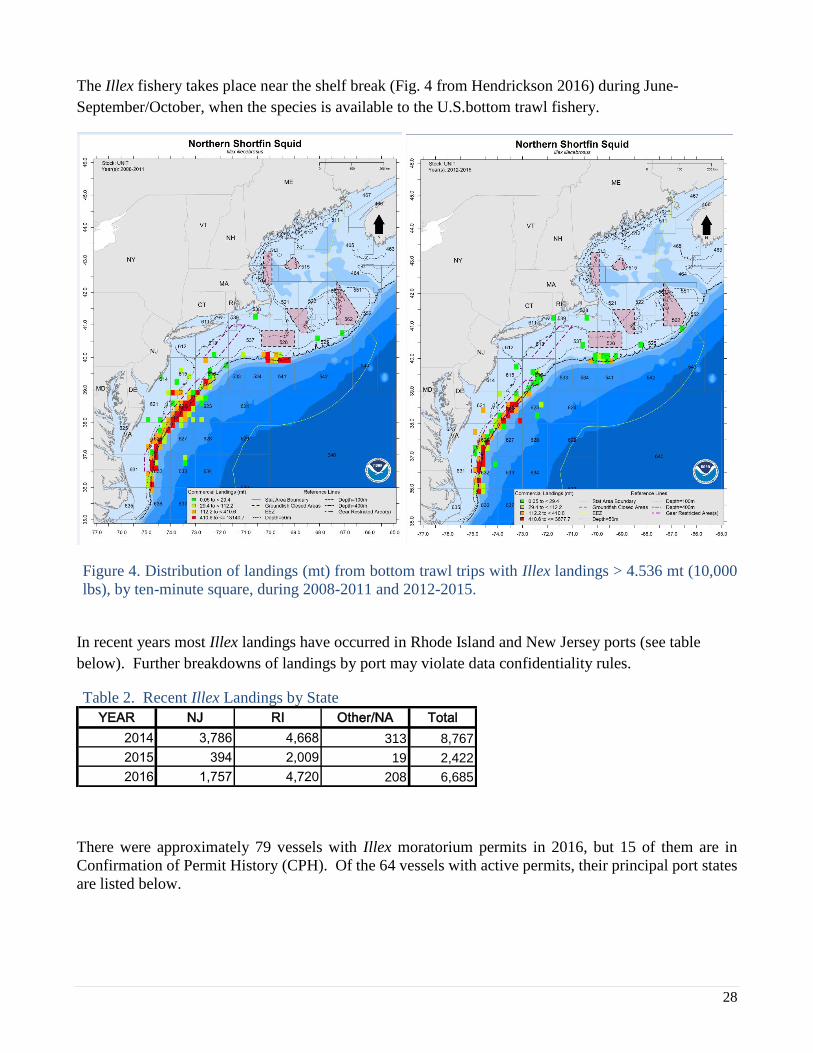
The Illex fishery takes place near the shelf break (Fig. 4 from Hendrickson 2016) during June-
September/October, when the species is available to the U.S.bottom trawl fishery.
Figure 4. Distribution of landings (mt) from bottom trawl trips with Illex landings > 4.536 mt (10,000
lbs), by ten-minute square, during 2008-2011 and 2012-2015.
In recent years most Illex landings have occurred in Rhode Island and New Jersey ports (see table
below). Further breakdowns of landings by port may violate data confidentiality rules.
Table 2. Recent Illex Landings by State
YEAR NJ RI Other/NA Total
2014 3,786 4,668 313 8,767
2015 394 2,009 19 2,422
2016 1,757 4,720 208 6,685
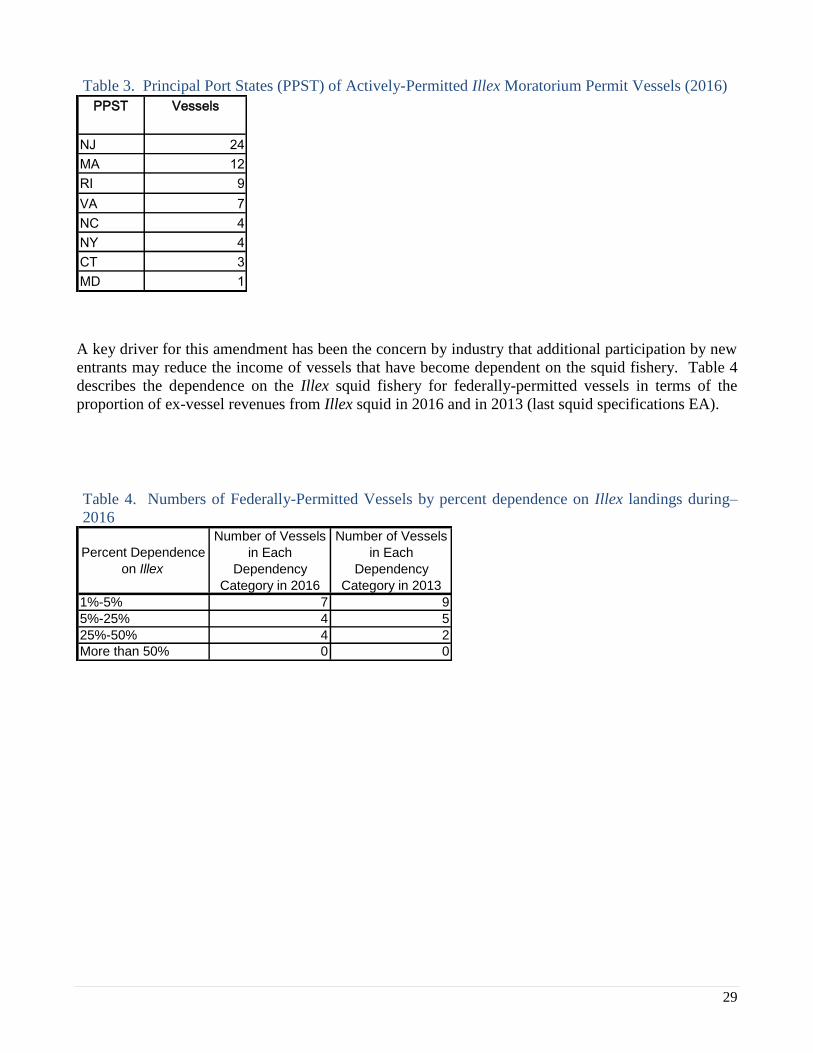
There were approximately 79 vessels with Illex moratorium permits in 2016, but 15 of them are in
Confirmation of Permit History (CPH). Of the 64 vessels with active permits, their principal port states
are listed below.
29
Table 3. Principal Port States (PPST) of Actively-Permitted Illex Moratorium Permit Vessels (2016)
PPST Vessels
NJ 24
MA 12
RI 9
VA 7
NC 4
NY 4
CT 3
MD 1
A key driver for this amendment has been the concern by industry that additional participation by new
entrants may reduce the income of vessels that have become dependent on the squid fishery. Table 4
describes the dependence on the Illex squid fishery for federally-permitted vessels in terms of the
proportion of ex-vessel revenues from Illex squid in 2016 and in 2013 (last squid specifications EA).
Table 4. Numbers of Federally-Permitted Vessels by percent dependence on Illex landings during–
2016
Percent Dependence
on Illex
Number of Vessels
in Each
Dependency
Category in 2016
Number of Vessels
in Each
Dependency
Category in 2013
1%-5% 7 9
5%-25% 4 5
25%-50% 4 2
More than 50% 0 0
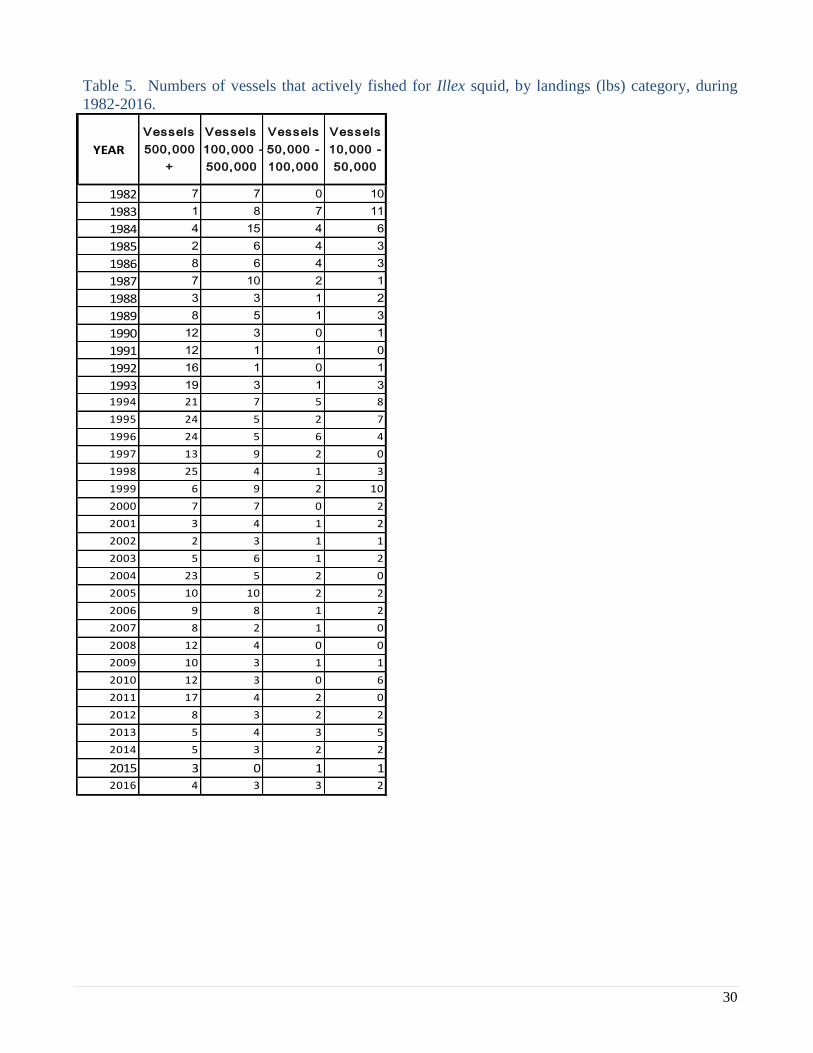
30
Table 5. Numbers of vessels that actively fished for Illex squid, by landings (lbs) category, during
1982-2016.
YEAR
Vessels
500,000
+
Vessels
100,000 -
500,000
Vessels
50,000 -
100,000
Vessels
10,000 -
50,000
1982 7 7 0 10
1983 1 8 7 11
1984 4 15 4 6
1985 2 6 4 3
1986 8 6 4 3
1987 7 10 2 1
1988 3 3 1 2
1989 8 5 1 3
1990 12 3 0 1
1991 12 1 1 0
1992 16 1 0 1
1993 19 3 1 3
1994 21 7 5 8
1995 24 5 2 7
1996 24 5 6 4
1997 13 9 2 0
1998 25 4 1 3
1999 6 9 2 10
2000 7 7 0 2
2001 3 4 1 2
2002 2 3 1 1
2003 5 6 1 2
2004 23 5 2 0
2005 10 10 2 2
2006 9 8 1 2
2007 8 2 1 0
2008 12 4 0 0
2009 10 3 1 1
2010 12 3 0 6
2011 17 4 2 0
2012 8 3 2 2
2013 5 4 3 5
2014 5 3 2 2
2015 3 0 1 1
2016 4 3 3 2
31
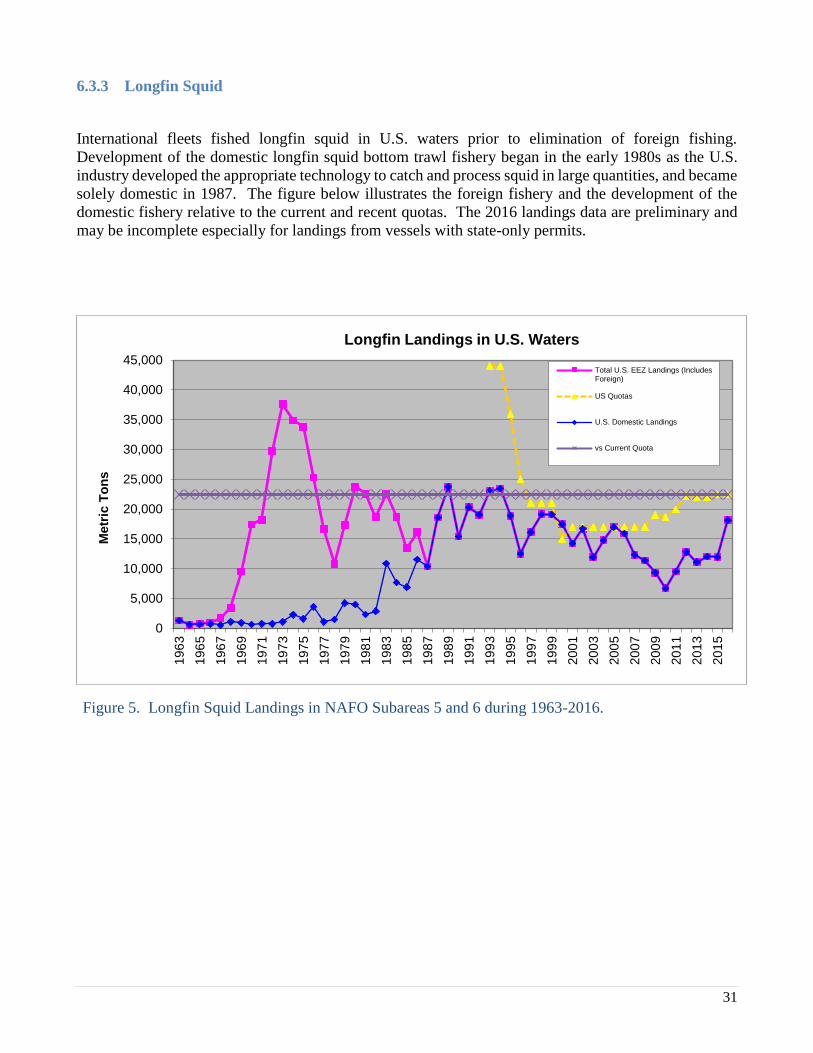
6.3.3 Longfin Squid
International fleets fished longfin squid in U.S. waters prior to elimination of foreign fishing.
Development of the domestic longfin squid bottom trawl fishery began in the early 1980s as the U.S.
industry developed the appropriate technology to catch and process squid in large quantities, and became
solely domestic in 1987. The figure below illustrates the foreign fishery and the development of the
domestic fishery relative to the current and recent quotas. The 2016 landings data are preliminary and
may be incomplete especially for landings from vessels with state-only permits.
Figure 5. Longfin Squid Landings in NAFO Subareas 5 and 6 during 1963-2016.
0
5,000
10,000
15,000
20,000
25,000
30,000
35,000
40,000
45,000
19
63
19
65
19
67
19
69
197
1
19
73
19
75
19
77
19
79
19
81
19
83
19
85
19
87
19
89
19
91
19
93
19
95
19
97
19
99
20
01
20
03
20
05
20
07
200
9
20
11
20
13
20
15
Me
tric
To
ns
Longfin Landings in U.S. Waters
Total U.S. EEZ Landings (IncludesForeign)
US Quotas
U.S. Domestic Landings
vs Current Quota
32
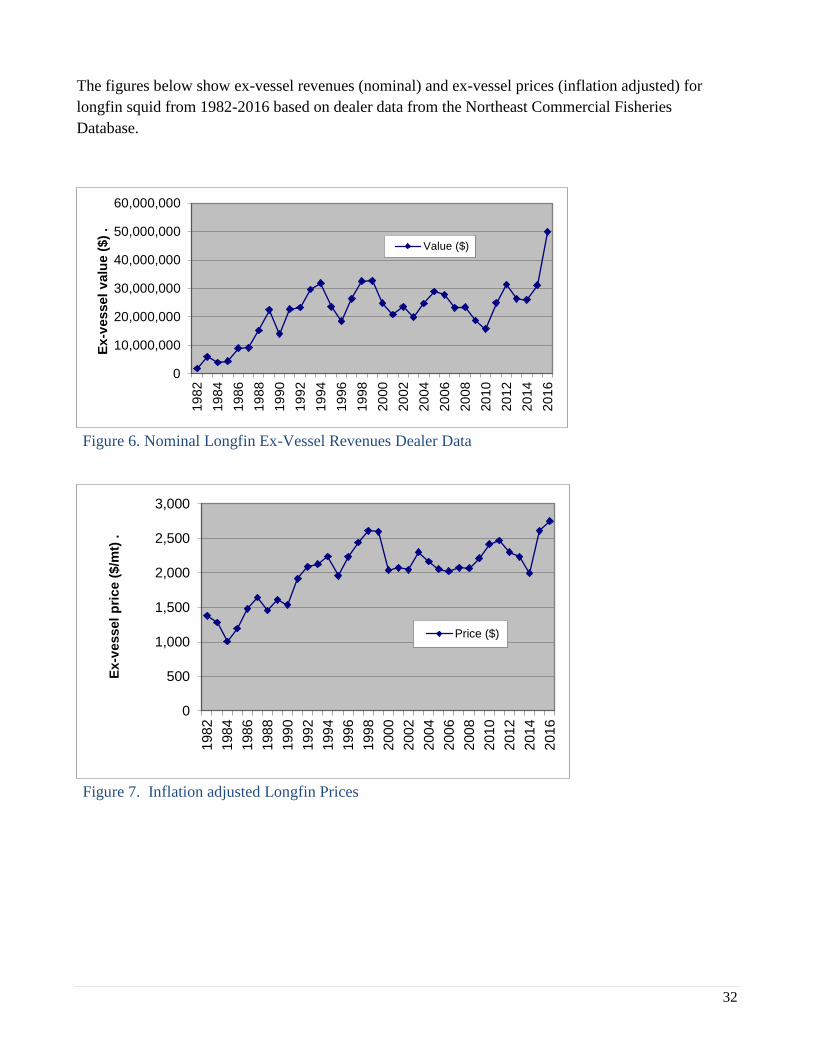
The figures below show ex-vessel revenues (nominal) and ex-vessel prices (inflation adjusted) for
longfin squid from 1982-2016 based on dealer data from the Northeast Commercial Fisheries
Database.
Figure 6. Nominal Longfin Ex-Vessel Revenues Dealer Data
Figure 7. Inflation adjusted Longfin Prices
0
10,000,000
20,000,000
30,000,000
40,000,000
50,000,000
60,000,00019
82
19
84
19
86
19
88
19
90
19
92
19
94
19
96
19
98
20
00
20
02
20
04
20
06
20
08
20
10
20
12
20
14
20
16
Ex-v
essel
valu
e (
$)
.
Value ($)
0
500
1,000
1,500
2,000
2,500
3,000
198
2
198
4
198
6
198
8
199
0
199
2
199
4
199
6
199
8
200
0
200
2
200
4
2006
200
8
201
0
201
2
201
4
201
6
Ex-v
essel
pri
ce (
$/m
t) .
Price ($)
33
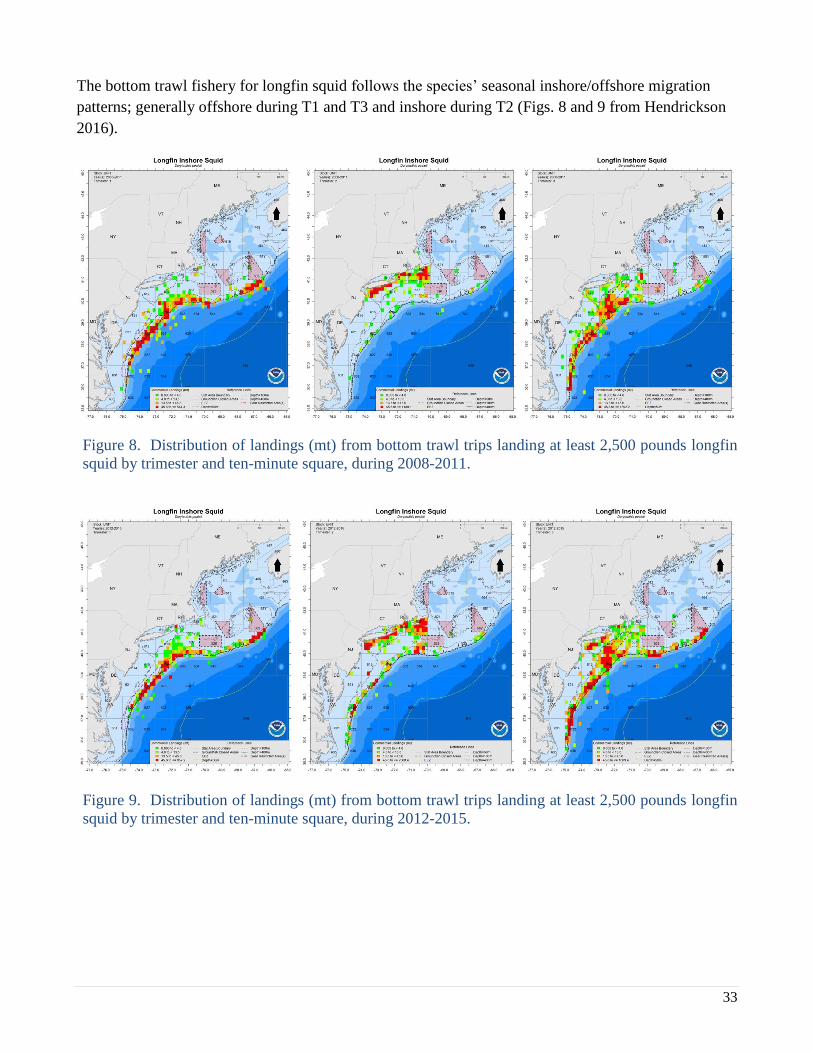
The bottom trawl fishery for longfin squid follows the species’ seasonal inshore/offshore migration
patterns; generally offshore during T1 and T3 and inshore during T2 (Figs. 8 and 9 from Hendrickson
2016).
Figure 8. Distribution of landings (mt) from bottom trawl trips landing at least 2,500 pounds longfin
squid by trimester and ten-minute square, during 2008-2011.
Figure 9. Distribution of landings (mt) from bottom trawl trips landing at least 2,500 pounds longfin
squid by trimester and ten-minute square, during 2012-2015.
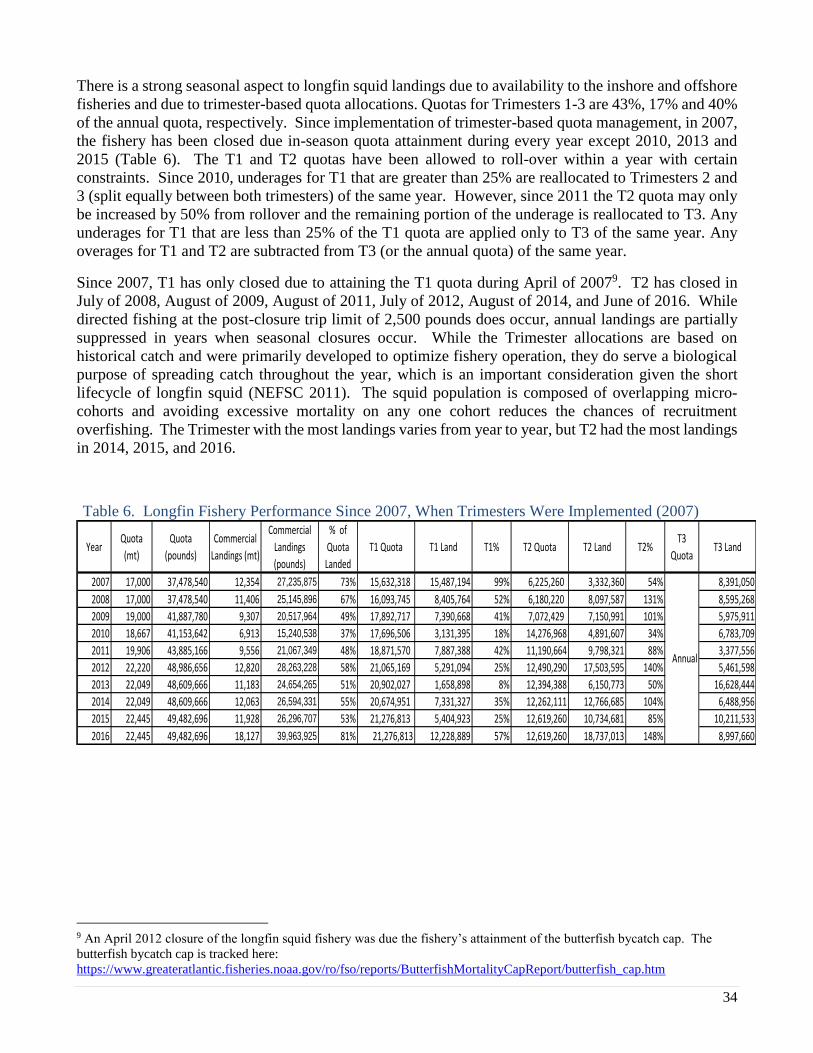
34
There is a strong seasonal aspect to longfin squid landings due to availability to the inshore and offshore
fisheries and due to trimester-based quota allocations. Quotas for Trimesters 1-3 are 43%, 17% and 40%
of the annual quota, respectively. Since implementation of trimester-based quota management, in 2007,
the fishery has been closed due in-season quota attainment during every year except 2010, 2013 and
2015 (Table 6). The T1 and T2 quotas have been allowed to roll-over within a year with certain
constraints. Since 2010, underages for T1 that are greater than 25% are reallocated to Trimesters 2 and
3 (split equally between both trimesters) of the same year. However, since 2011 the T2 quota may only
be increased by 50% from rollover and the remaining portion of the underage is reallocated to T3. Any
underages for T1 that are less than 25% of the T1 quota are applied only to T3 of the same year. Any
overages for T1 and T2 are subtracted from T3 (or the annual quota) of the same year.
Since 2007, T1 has only closed due to attaining the T1 quota during April of 20079. T2 has closed in
July of 2008, August of 2009, August of 2011, July of 2012, August of 2014, and June of 2016. While
directed fishing at the post-closure trip limit of 2,500 pounds does occur, annual landings are partially
suppressed in years when seasonal closures occur. While the Trimester allocations are based on
historical catch and were primarily developed to optimize fishery operation, they do serve a biological
purpose of spreading catch throughout the year, which is an important consideration given the short
lifecycle of longfin squid (NEFSC 2011). The squid population is composed of overlapping micro-
cohorts and avoiding excessive mortality on any one cohort reduces the chances of recruitment
overfishing. The Trimester with the most landings varies from year to year, but T2 had the most landings
in 2014, 2015, and 2016.
Table 6. Longfin Fishery Performance Since 2007, When Trimesters Were Implemented (2007)
YearQuota
(mt)
Quota
(pounds)
Commercial
Landings (mt)
Commercial
Landings
(pounds)
% of
Quota
Landed
T1 Quota T1 Land T1% T2 Quota T2 Land T2%T3
QuotaT3 Land
2007 17,000 37,478,540 12,354 27,235,875 73% 15,632,318 15,487,194 99% 6,225,260 3,332,360 54% 8,391,050
2008 17,000 37,478,540 11,406 25,145,896 67% 16,093,745 8,405,764 52% 6,180,220 8,097,587 131% 8,595,268
2009 19,000 41,887,780 9,307 20,517,964 49% 17,892,717 7,390,668 41% 7,072,429 7,150,991 101% 5,975,911
2010 18,667 41,153,642 6,913 15,240,538 37% 17,696,506 3,131,395 18% 14,276,968 4,891,607 34% 6,783,709
2011 19,906 43,885,166 9,556 21,067,349 48% 18,871,570 7,887,388 42% 11,190,664 9,798,321 88% 3,377,556
2012 22,220 48,986,656 12,820 28,263,228 58% 21,065,169 5,291,094 25% 12,490,290 17,503,595 140% 5,461,598
2013 22,049 48,609,666 11,183 24,654,265 51% 20,902,027 1,658,898 8% 12,394,388 6,150,773 50% 16,628,444
2014 22,049 48,609,666 12,063 26,594,331 55% 20,674,951 7,331,327 35% 12,262,111 12,766,685 104% 6,488,956
2015 22,445 49,482,696 11,928 26,296,707 53% 21,276,813 5,404,923 25% 12,619,260 10,734,681 85% 10,211,533
2016 22,445 49,482,696 18,127 39,963,925 81% 21,276,813 12,228,889 57% 12,619,260 18,737,013 148% 8,997,660
Annual
9 An April 2012 closure of the longfin squid fishery was due the fishery’s attainment of the butterfish bycatch cap. The
butterfish bycatch cap is tracked here:
https://www.greateratlantic.fisheries.noaa.gov/ro/fso/reports/ButterfishMortalityCapReport/butterfish_cap.htm
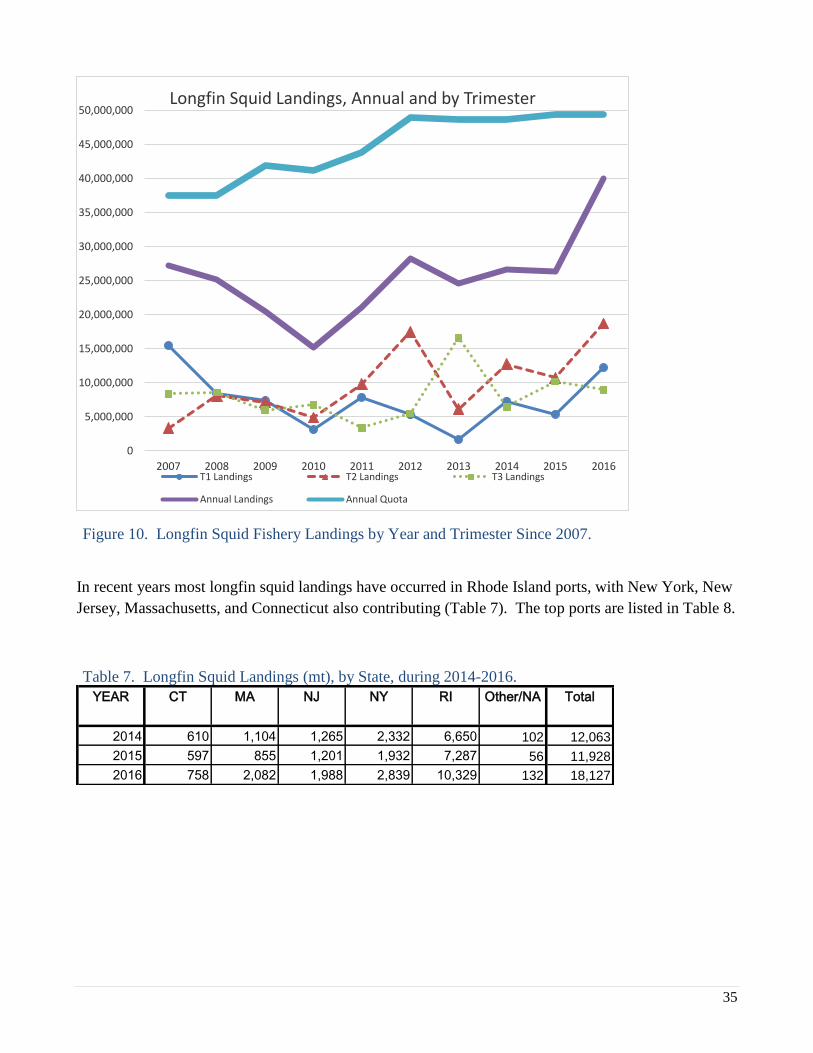
35
Figure 10. Longfin Squid Fishery Landings by Year and Trimester Since 2007.
In recent years most longfin squid landings have occurred in Rhode Island ports, with New York, New
Jersey, Massachusetts, and Connecticut also contributing (Table 7). The top ports are listed in Table 8.
Table 7. Longfin Squid Landings (mt), by State, during 2014-2016.
YEAR CT MA NJ NY RI Other/NA Total
2014 610 1,104 1,265 2,332 6,650 102 12,063
2015 597 855 1,201 1,932 7,287 56 11,928
2016 758 2,082 1,988 2,839 10,329 132 18,127
0
5,000,000
10,000,000
15,000,000
20,000,000
25,000,000
30,000,000
35,000,000
40,000,000
45,000,000
50,000,000
2007 2008 2009 2010 2011 2012 2013 2014 2015 2016
Longfin Squid Landings, Annual and by Trimester
T1 Landings T2 Landings T3 Landings
Annual Landings Annual Quota
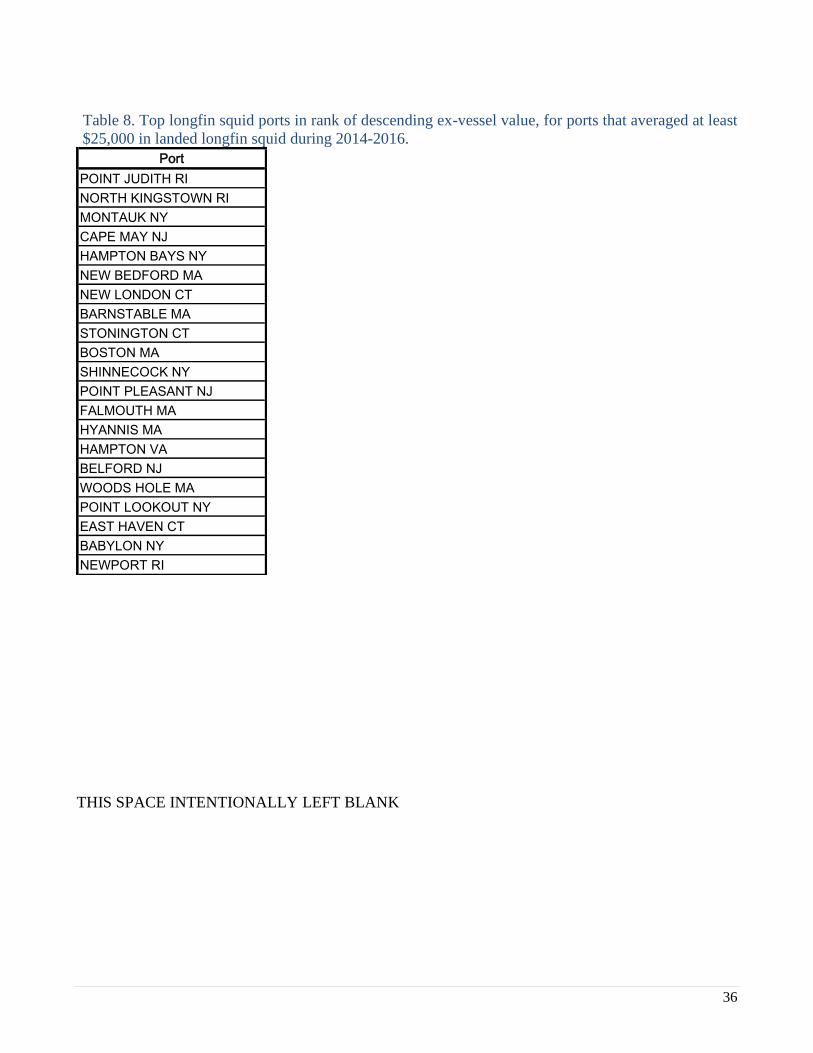
36
Table 8. Top longfin squid ports in rank of descending ex-vessel value, for ports that averaged at least
$25,000 in landed longfin squid during 2014-2016.
Port
POINT JUDITH RI
NORTH KINGSTOWN RI
MONTAUK NY
CAPE MAY NJ
HAMPTON BAYS NY
NEW BEDFORD MA
NEW LONDON CT
BARNSTABLE MA
STONINGTON CT
BOSTON MA
SHINNECOCK NY
POINT PLEASANT NJ
FALMOUTH MA
HYANNIS MA
HAMPTON VA
BELFORD NJ
WOODS HOLE MA
POINT LOOKOUT NY
EAST HAVEN CT
BABYLON NY
NEWPORT RI
THIS SPACE INTENTIONALLY LEFT BLANK

37
Approximately 383 vessels had longfin squid/butterfish moratorium permits during 2016?, but 97 of
them were in Confirmation of Permit History (CPH), leaving 286 active permits for vessels in the
following states.
Table 9. Principal Port States (PPST) of Actively-Permitted Longfin Squid/Butterfish Moratorium
Permit Vessels (2016) PPST Vessels
NJ 74
MA 67
RI 49
NY 36
VA 23
NC 15
CT 10
ME 7
MD 3
AK 1
NH 1
A key driver for this amendment has been the concern by industry that additional participation by new
entrants may reduce the income of vessels that have become dependent on the squid fishery. Table 10
describes the dependence on the longfin squid fishery for federally-permitted vessels in terms of the
proportion of ex-vessel revenues from longfin squid in 2016 and in 2013 (last squid specifications EA)
Table 10. Dependence on Longfin Squid by Federally-Permitted Vessels – 2016 and 2013
Percent Dependence
on Longfin
Number of Vessels
in Each
Dependency
Category in 2016
Number of Vessels
in Each
Dependency
Category in 2013
1%-5% 80 49
5%-25% 79 68
25%-50% 64 35
More than 50% 42 31
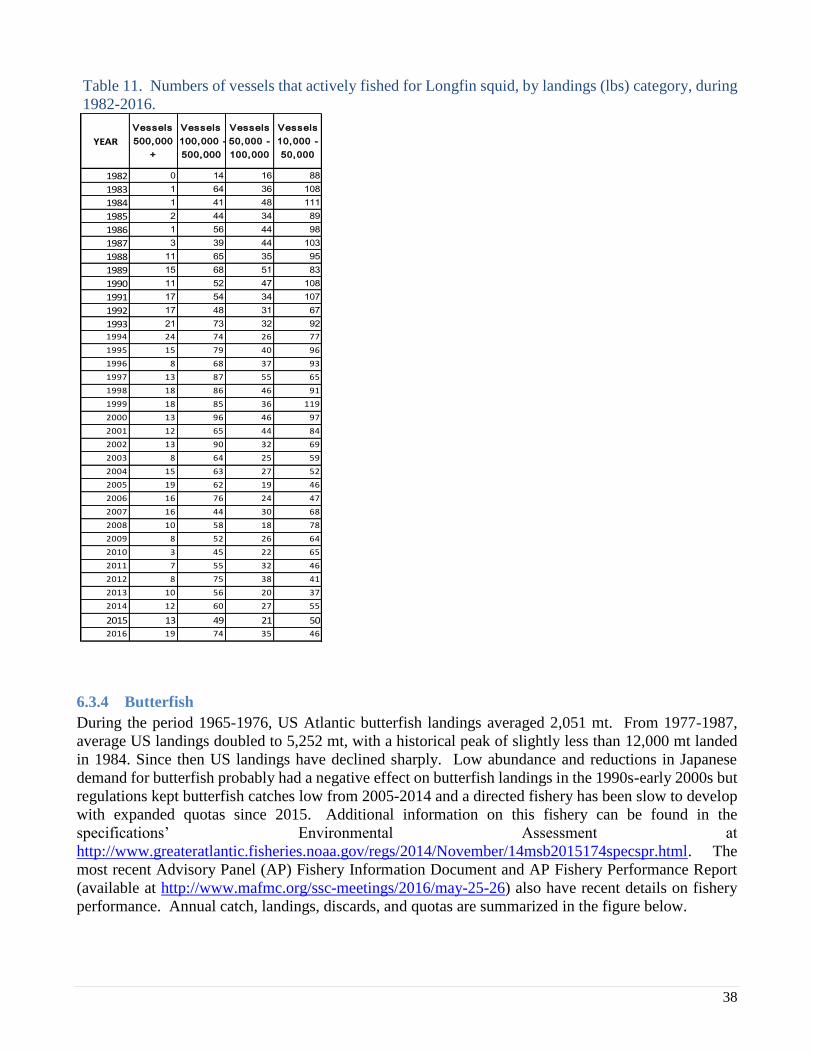
38
Table 11. Numbers of vessels that actively fished for Longfin squid, by landings (lbs) category, during
1982-2016.
YEAR
Vessels
500,000
+
Vessels
100,000 -
500,000
Vessels
50,000 -
100,000
Vessels
10,000 -
50,000
1982 0 14 16 88
1983 1 64 36 108
1984 1 41 48 111
1985 2 44 34 89
1986 1 56 44 98
1987 3 39 44 103
1988 11 65 35 95
1989 15 68 51 83
1990 11 52 47 108
1991 17 54 34 107
1992 17 48 31 67
1993 21 73 32 92
1994 24 74 26 77
1995 15 79 40 96
1996 8 68 37 93
1997 13 87 55 65
1998 18 86 46 91
1999 18 85 36 119
2000 13 96 46 97
2001 12 65 44 84
2002 13 90 32 69
2003 8 64 25 59
2004 15 63 27 52
2005 19 62 19 46
2006 16 76 24 47
2007 16 44 30 68
2008 10 58 18 78
2009 8 52 26 64
2010 3 45 22 65
2011 7 55 32 46
2012 8 75 38 41
2013 10 56 20 37
2014 12 60 27 55
2015 13 49 21 50
2016 19 74 35 46
6.3.4 Butterfish
During the period 1965-1976, US Atlantic butterfish landings averaged 2,051 mt. From 1977-1987,
average US landings doubled to 5,252 mt, with a historical peak of slightly less than 12,000 mt landed
in 1984. Since then US landings have declined sharply. Low abundance and reductions in Japanese
demand for butterfish probably had a negative effect on butterfish landings in the 1990s-early 2000s but
regulations kept butterfish catches low from 2005-2014 and a directed fishery has been slow to develop
with expanded quotas since 2015. Additional information on this fishery can be found in the
specifications’ Environmental Assessment at
http://www.greateratlantic.fisheries.noaa.gov/regs/2014/November/14msb2015174specspr.html. The
most recent Advisory Panel (AP) Fishery Information Document and AP Fishery Performance Report
(available at http://www.mafmc.org/ssc-meetings/2016/may-25-26) also have recent details on fishery
performance. Annual catch, landings, discards, and quotas are summarized in the figure below.

39
Figure 10. Butterfish Catch in U.S. Waters
6.4 PROTECTED SPECIES
There are numerous species of fish, marine mammals, and sea turtles which inhabit the environment
within the management unit of this FMP and are afforded protection under the Endangered Species Act
(ESA) of 1973 (i.e., for those designated as threatened or endangered) and/or the Marine Mammal
Protection Act (MMPA) of 1972. A subset of the species identified in Error! Reference source not
found. table below are known to have the potential to interact with gear types (i.e., bottom otter trawls)
considered in this amendment. Additional details on the interactions of these species with bottom otter
trawls will be added to the Environmental Assessment for this action, and the most recent
specifications Environmental Assessment (2016, available at
https://www.greateratlantic.fisheries.noaa.gov/regs/2016/January/16msb2016specspr.html) can also be
consulted for additional information. See also the protected resources impacts section, below.
0
5,000
10,000
15,000
20,000
25,000
30,000
35,000
40,000
45,000
19
65
19
67
19
69
19
71
19
73
19
75
19
77
19
79
19
81
19
83
19
85
19
87
19
89
19
91
19
93
19
95
19
97
19
99
20
01
20
03
20
05
20
07
20
09
20
11
20
13
20
15
Me
tric
To
ns
Butterfish Catch in U.S. Waters
Total Catch (IncDiscards)
Total Landings
Discards
US Landing Quotas
Most Landings Foreign Until 1978
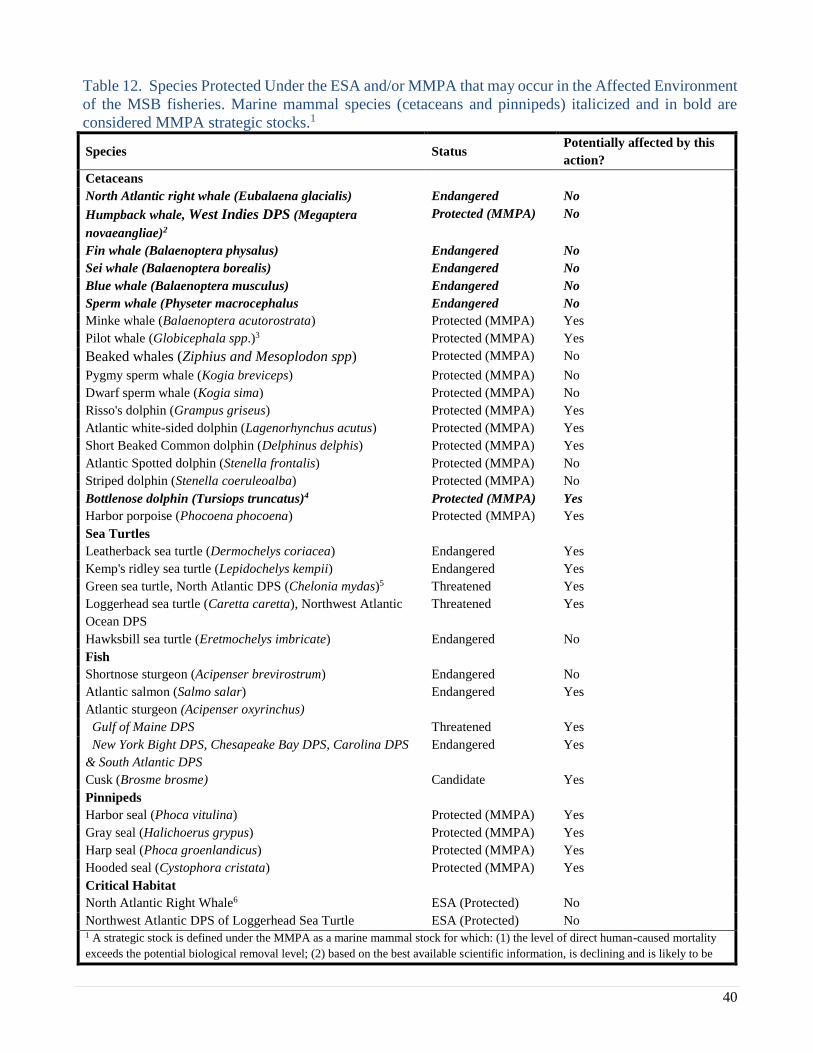
40
Table 12. Species Protected Under the ESA and/or MMPA that may occur in the Affected Environment
of the MSB fisheries. Marine mammal species (cetaceans and pinnipeds) italicized and in bold are
considered MMPA strategic stocks.1
Species Status Potentially affected by this
action?
Cetaceans
North Atlantic right whale (Eubalaena glacialis) Endangered No
Humpback whale, West Indies DPS (Megaptera
novaeangliae)2
Protected (MMPA) No
Fin whale (Balaenoptera physalus) Endangered No
Sei whale (Balaenoptera borealis) Endangered No
Blue whale (Balaenoptera musculus) Endangered No
Sperm whale (Physeter macrocephalus Endangered No
Minke whale (Balaenoptera acutorostrata) Protected (MMPA) Yes
Pilot whale (Globicephala spp.)3 Protected (MMPA) Yes
Beaked whales (Ziphius and Mesoplodon spp) Protected (MMPA) No
Pygmy sperm whale (Kogia breviceps) Protected (MMPA) No
Dwarf sperm whale (Kogia sima) Protected (MMPA) No
Risso's dolphin (Grampus griseus) Protected (MMPA) Yes
Atlantic white-sided dolphin (Lagenorhynchus acutus) Protected (MMPA) Yes
Short Beaked Common dolphin (Delphinus delphis) Protected (MMPA) Yes
Atlantic Spotted dolphin (Stenella frontalis) Protected (MMPA) No
Striped dolphin (Stenella coeruleoalba) Protected (MMPA) No
Bottlenose dolphin (Tursiops truncatus)4 Protected (MMPA) Yes
Harbor porpoise (Phocoena phocoena) Protected (MMPA) Yes
Sea Turtles
Leatherback sea turtle (Dermochelys coriacea) Endangered Yes
Kemp's ridley sea turtle (Lepidochelys kempii) Endangered Yes
Green sea turtle, North Atlantic DPS (Chelonia mydas)5 Threatened Yes
Loggerhead sea turtle (Caretta caretta), Northwest Atlantic
Ocean DPS
Threatened Yes
Hawksbill sea turtle (Eretmochelys imbricate) Endangered No
Fish
Shortnose sturgeon (Acipenser brevirostrum) Endangered No
Atlantic salmon (Salmo salar) Endangered Yes
Atlantic sturgeon (Acipenser oxyrinchus)
Gulf of Maine DPS Threatened Yes
New York Bight DPS, Chesapeake Bay DPS, Carolina DPS
& South Atlantic DPS
Cusk (Brosme brosme)
Endangered
Candidate
Yes
Yes
Pinnipeds
Harbor seal (Phoca vitulina) Protected (MMPA) Yes
Gray seal (Halichoerus grypus) Protected (MMPA) Yes
Harp seal (Phoca groenlandicus) Protected (MMPA) Yes
Hooded seal (Cystophora cristata) Protected (MMPA) Yes
Critical Habitat
North Atlantic Right Whale6 ESA (Protected) No
Northwest Atlantic DPS of Loggerhead Sea Turtle ESA (Protected) No 1 A strategic stock is defined under the MMPA as a marine mammal stock for which: (1) the level of direct human-caused mortality
exceeds the potential biological removal level; (2) based on the best available scientific information, is declining and is likely to be
41
Species Status Potentially affected by this
action?
listed as a threatened species under the ESA within the foreseeable future; and/or (3) is listed as a threatened or endangered species
under the ESA, or is designated as depleted under the MMPA (Section 3 of the MMPA of 1972). 2 On September 8, 2016, a final rule was issued revising the ESA listing status of humpback whales (81 FR 62259). Fourteen DPSs
were designated: one as threatened, four as endangered, and nine as not warranting listing. The DPS found in U.S. Atlantic waters, the
West Indies DPS, is delisted under the ESA; however, this DPS is still protected under the MMPA. 3There are 2 species of pilot whales: short finned (G. melas melas) and long finned (G. macrorhynchus). Due to the difficulties in
identifying the species at sea, they are often just referred to as Globicephala spp. 4 This includes the Western North Atlantic Offshore, Northern Migratory Coastal, and Southern Migratory Coastal Stocks of
Bottlenose Dolphins. See Waring et al. (2016) for further details. 5 On April 6, 2016, a final rule was issued removing the current range-wide listing of green sea turtles and, in its place, listing eight
green sea turtle DPSs as threatened and three DPSs as endangered (81 FR 20057). The green sea turtle DPS located in the Northwest
Atlantic is the North Atlantic DPS of green sea turtles; this DPS is considered threatened under the ESA 6Originally designated June 3, 1994 (59 FR 28805); Expanded on January 27, 2016 (81 FR 4837)..
THIS SPACE INTENTIONALLY LEFT BLANK
42
7.0 IMPACTS OF THE ALTERNATIVES
7.1 Managed Resources
The mackerel, butterfish, and Illex stocks are unlikely to be adversely or positively impacted by any of
the alternatives. The fishing that results from the status quo or any of the action alternatives should
continue to be limited to the Acceptable Biological Catches (ABC) from the Council’s Scientific and
Statistical Committee per the risk policy of the Council, which mandates the use of the best available
scientific information to avoid overfishing. There is substantial interaction with butterfish in the longfin
squid fishery, but discarding in that fishery is directly limited through a discard cap with in-season
management that is not proposed to change in this action. Regardless of any alternatives that are chosen,
the sustainable management of these stocks will continue. While any fishing will lower the population
of a stock compared to zero fishing, sustainable management should have a positive impact on these
MSB stocks by avoiding overfishing, and overall sustainable management should continue for the
mackerel, butterfish, and Illex stocks under any of the no action or action alternatives because catch will
be limited to the ABC to avoid overfishing.
For longfin squid, any of the permitting alternatives, from Alternative Sets 1, 2, and 5 should still result
in a fleet that can fully harvest the squid quotas (see socioeconomic impact discussion in Section 7.5),
but will be limited to the ABC in any given year. Therefore, the action alternatives in Alternative Sets
1, 2 and 5 should have no change in impacts compared to no action (i.e. the positive impacts from
sustainable management should persist). However, the action alternatives in Alternative Sets 3 and 4
will have additional impacts compared to no action and are described in more detail below.
Analyses conducted by NEFSC staff indicate a significant negative correlation (p = 0.0014), during
1983-2015, between effort (days fished on trips landing more than 40% longfin squid) during April-
September and longfin squid landings-per-unit-effort (LPUE, mt per day fished) during the following
October-March (Fig. 10). A similar significant negative correlation (p < 0.0001) was found between
effort and LPUE for the October-March and April-September fishing periods, respectively. Ageing
studies indicate that these two time periods represent the two primary seasonal cohorts; summer-hatched
squid are taken in the winter fishery and vice versa (Brodziak and Macy 1996; Macy and Brodziak 2001).
The negative relationship between the two seasonal cohorts is especially evident during 1983-1999 when
in-season closures and the related trip limits were not in effect. Additional reasons for considering effort
restrictions during T2 related to the life history of squid include:
-The potential susceptibility of squid to recruitment overfishing due to their short-lived (sub-
annual), semelparous life history and highly variable interannual abundance levels (Pierce and
Guerra 1994);
-The T2 fishery operates on highly aggregated spawning squid (which exhibit complex
communal mating and spawning behaviors) (Shashar and Hanlon 2013);
- Females can lay multiple egg clutches over a period of weeks, so harvesting them before they
are able to deposit all of their eggs reduces future recruitment;
- Longfin squid egg mops are attached to the seabed (or vegetation, rocks and other fixed
surfaces) presumably so that embryonic development occurs in waters with temperatures

43
adequate for normal embryonic development and with adequate food supplies for hatchlings. The
T2 fishery dislodges egg mops during bottom trawling and has higher squid egg mop bycatch
than during T1 and T2 (see non-target impact section, Tables 18-20); and
-Lab studies have demonstrated that squid eggs that hatch prematurely have very high mortality
rates due to incomplete absorption of the outer yolk sac and that mechanical disturbance can
easily cause premature hatching (Adelman et al. 2013, Boletzky and Hanlon 1983, Hanlon 1990,
Jones and McCarthy 2013, Vidal 2002, Vidal 2014).
These reasons, considered together with the NEFSC effort and LPUE analysis, suggest that excessive
effort during T2 would have a negative impact on the relative abundance of the subsequent Oct-March
cohort of longfin squid. Since the most recent assessment found that the longfin squid stock is “lightly
exploited” the overall impact is likely low. A pending assessment update will be integrated into the final
analysis for this action.
To the degree that effort during T2 is having a negative impact on the squid stock, Alternatives 3B and
3C may have positive impacts because they should reduce directed fishery effort and catch following
closures by limiting Federally-permitted vessels from fishing in state waters after closures. Alternatives
3D and 3E would likely have similar positive impacts by limiting overall effort and catch. The greatest
reduction to T2 effort/catch would occur by combining Alternatives 4B and 4D. This would eliminate
T1 to T2 rollover and reduce catch after a T2 closure by reducing the trip limit to 250 pounds. Alternative
4C (reducing T1 to T2 rollover) and Alternative 4E (post-closure trip limit of 500 pounds) would also
limit effort/catch in T2 but not as much. 4F (splitting T2 in half) would slow landings in T2 but not
appreciably affect overall effort/catch.
It is not possible to currently identify the optimal level of T2 landings/effort, only to identify that
excessive effort in T2 appears likely to suppress overall productivity.
THIS SPACE INTENTIONALLY LEFT BLANK
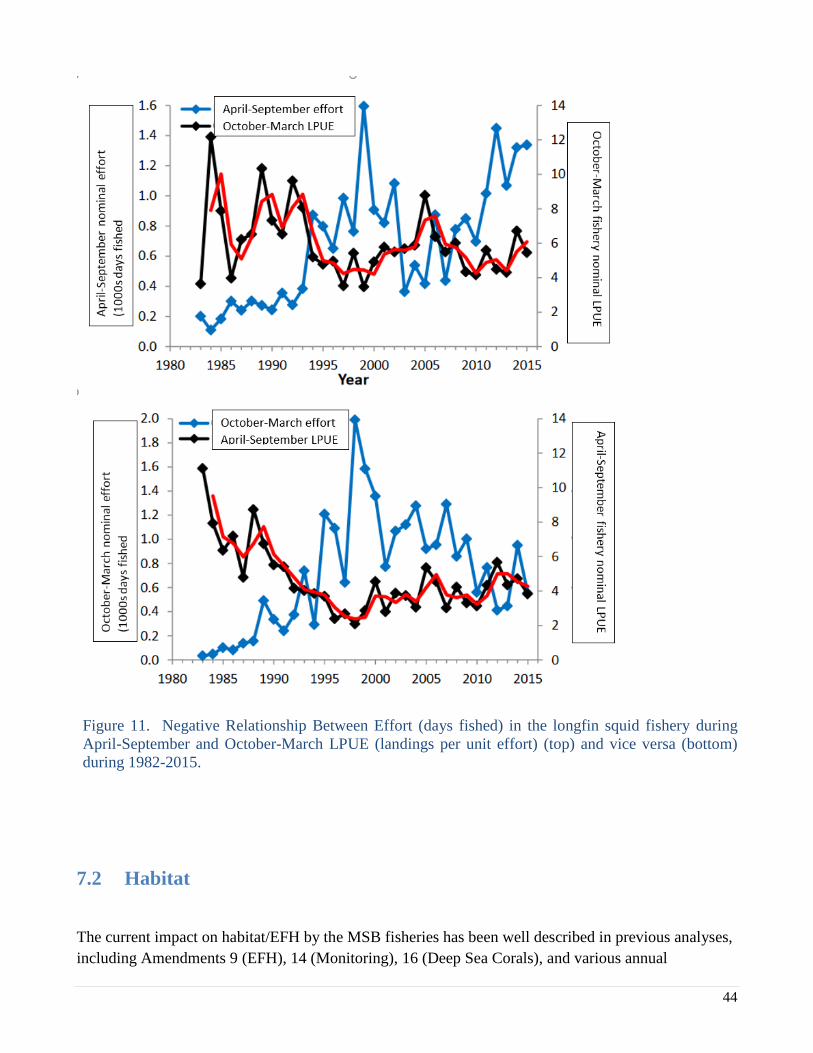
44
Figure 11. Negative Relationship Between Effort (days fished) in the longfin squid fishery during
April-September and October-March LPUE (landings per unit effort) (top) and vice versa (bottom)
during 1982-2015.
7.2 Habitat
The current impact on habitat/EFH by the MSB fisheries has been well described in previous analyses,
including Amendments 9 (EFH), 14 (Monitoring), 16 (Deep Sea Corals), and various annual

45
specifications analyses. The MSB Fisheries do predominantly use bottom-trawling; Amendment 9
summarized Stevenson et al. 2004’s findings on bottom-trawling’s habitat impacts as:
“In studies examining the effect of bottom otter trawling on a variety of substrate types, it
was demonstrated that the physical effects of trawl doors contacting the bottom produced
furrows and some shifts in surface sediment composition, although there is a large
variation in the duration of these impacts. Typically the more dynamic environment and
less structured bottom composition, the shorter the duration of impact. This type of
fishing was demonstrated to have some effects on composition and biomass of benthic
species in the effected areas, but the directionality and duration of these effects varied by
study and substrate types.”
Because of previous efforts to reduce impacts to habitat10 and the focus of the MSB fisheries on
sand/mud bottoms, the impact of no action, i.e. the continuance of the MSB fisheries, is likely a
continuing low negative.
Alternatives in Alternatives Sets 1 and 5 should have minimal impacts because they primarily impact
who can catch squid rather than how much overall effort occurs. Alternative 2b allows a one-time
permit swap and would reduce the number of vessels effectively eliminated from the squid fishery, but
because of the limited application (both vessels must have now-current moratorium permits and be
owned by the same entity) and baseline limitations, 2b is unlikely to substantially change effort (but
still could activate some additional effort). 2c allows non-requalifying longfin squid/butterfish
moratorium vessels a higher incidental trip limit than might occur otherwise, but the overall effect with
adding 2b and/or 2c to an action alternative from Set 1 would still be to further restrict access. Again,
these alternatives are going to impact who catches squid, not the overall amount of squid effort, which
is controlled by availability and the overall quota.
Because the action alternatives in Set 3 and 4 may reduce bottom-trawling effort in the longfin squid
fishery, those alternatives may have positive impacts on habitat. However since effort may just shift to
other times of the year (from T2 to late in T3) due to the potential limitations from those Alternatives
(if longfin squid are available later in the year), the impact is likely low. The action Alternatives in
Alternative Set 4 could also transfer some effort from inshore to offshore as T2 fishing is generally
inshore while fishing late in T3 is generally offshore. Offshore substrates tend to be in lower energy
environments where bottom trawling can have more impacts, but since T3 has not closed or been
constrained by the quota since the implementation of Trimesters in 2007, reserving more quota for T3
is unlikely to impact actual effort or habitat impacts in T3.
10 In Amendment 9 the Council determined that bottom trawls used in MSB fisheries do have the potential to adversely
affect EFH for some federally-managed fisheries in the region and closed portions of two offshore canyons (Lydonia and
Oceanographer) to squid trawling. Subsequent closures were implemented in these and two other canyons (Veatch and
Norfolk) to protect tilefish EFH by prohibiting all bottom trawling activity. The Council has also limited bottom trawling
near known areas of dee-sea corals via Amendment 16 to the MSB FMP.
46
7.3 Protected Resources
No Action
The MSB fisheries use a mix of gear types, some of which may have protected species interactions.
Impacts of the No Action to Marine Mammal Protection Act (MMPA) protected species and
Endangered Species Act (ESA) listed species are discussed below.
No Action Impacts: MMPA Protected Species
The MSB FMP fisheries do overlap with the distribution of marine mammals (cetaceans and
pinnipeds). As a result, marine mammal interactions with bottom or mid-water trawl gear are possible
(see section 6.4); however, ascertaining the risk of an interaction and the resultant potential impacts of
the No Action on cetaceans and pinnipeds are difficult and somewhat uncertain, as quantitative
analysis has not been performed. However, we have considered, to the best of our ability, available
information on marine mammal interactions with commercial fisheries, of which, the MSB FMP is a
component (Waring et al. 2014, 2015, 2016). Aside from several large whale species (e.g., North
Atlantic right, humpback, and fin), harbor porpoise, and several stocks of bottlenose dolphin, there has
been no indication that takes of any other marine mammal species in commercial fisheries has
exceeded potential biological removal (PBR) thresholds, and therefore, gone above and beyond levels
which would result in the inability of each species population to sustain itself (Waring et al. 2014,
2015, 2016). Although several species of large whales, harbor porpoise, and several stocks of
bottlenose dolphin have experienced levels of take that have resulted in the exceedance of each species
PBR, take reduction plans have been implemented to reduce bycatch in the fisheries affecting these
species (Harbor Porpoise Take Reduction Plan (HPTRP), effective January 1, 1999 (63 FR 71041);
Bottlenose Dolphin Take Reduction Plan (BDTRP), effective April 26, 2006 (71 FR 24776)). These
plans are still in place and are continuing to assist in decreasing bycatch levels for these species.
Although the information presented in Waring et al. (2014, 2015, 2016) is a collective representation
of commercial fisheries interactions with non-ESA listed species of marine mammals, and does not
address the effects of the MSB FMP specifically, the information does demonstrate that to date,
operation of the MSB FMP, or any other fishery, has not resulted in a collective level of take that
threatens the continued existence of marine mammal populations (aside from those species noted
above).
In conjunction with the above, additional analysis on the impacts of the operation of fisheries in the
northeast region have also been conducted by NMFS, pursuant to section 7 of the ESA, for ESA-listed
species of marine mammals. Specifically, NMFS issued a Biological Opinion in 2013, concluding that
the operation of the MSB FMP, in addition to six other FMPs, may adversely affect, but is not likely to
jeopardize the continued existence of any ESA listed species of marine mammals. Since issuance of
this Opinion, there has been no indication that these fisheries have changed in any significant manner
(e.g., increases in gear quantity and soak/tow time, new areas fished) such that there are new
interaction risks to listed marine mammal species that have not already been considered by NMFS to
date. Taking the latter into consideration, and the fact that the No Action will retain status quo
47
operating conditions, we do not expect interactions with listed marine mammal species to go above and
beyond that which has already been considered by NMFS to date under the No Action (NMFS 2013;
Waring et al. 2014; Waring et al. 2015; Waring et al. 2016). As a result, the No Action, and the
resultant fishing behavior under this Alternative, is not, as concluded by NMFS, expected to result in
interaction levels that are likely to jeopardize the continued existence of ESA listed species of marine
mammals.
Based on this information, and the fact that there is continual monitoring of marine mammal species
bycatch, and that voluntary measures exist that reduce serious injury and mortality to marine mammal
species incidentally caught in trawl fisheries (see the Atlantic Trawl Gear Take Reduction Strategy,
section 6.4.1.1), it is not expected that the No Action will introduce any new risks or additional takes to
marine mammal species that have not already been considered by NMFS to date and therefore, is not
expected to affect the continued existence of marine mammal species. For these reasons, the no action
is expected to have low negative impacts on marine mammal species, similar to past years.
No-action Impacts: ESA Listed Species
The MSB FMP fisheries do overlap with ESA listed species distribution. As a result, ESA listed
species interactions with bottom or mid-water trawl gear are possible (see section 6.4); however,
ascertaining the risk of an interaction and the resultant potential impacts of the No Action on ESA-
listed species (i.e., species of sea turtles, whales, and sturgeon) are difficult and somewhat uncertain, as
quantitative analysis has not been performed. However, we have considered, to the best of our ability,
how the fishery has operated in regards to listed species since 2013, when NMFS issued a Biological
Opinion (Opinion) on the operation of seven commercial fisheries, including the MSB FMP (NMFS
2013). Specifically, we have focused on available information on ESA-listed species interactions with
commercial fisheries, of which, the MSB FMP is a component (NMFS 2013; see section 6.4). The
Opinion issued on December 16, 2013, included an incidental take statement authorizing the take of
specific numbers of ESA listed species of sea turtles, Atlantic salmon, and Atlantic sturgeon. The MSB
FMP is currently covered by the incidental take statement authorized in NMFS 2013 Opinion.
The 2013 biological opinion concluded that the MSB fisheries may affect, but not jeopardize the
continued existence of any ESA listed species. The No Action will retain status quo operating
conditions in the MSB FMP and therefore, changes in fishing effort or behavior would not be
expected. As a result, the No Action is not expected to result in the introduction of any new risks or
additional takes to ESA listed species that have not already been considered and authorized by NMFS
to date (NMFS 2013). Further, the MSB FMP has not resulted in the exceedance of NMFS authorized
take of any ESA listed species from 2013 to the present. Thus as concluded in the NMFS 2013
Opinion, No Action / the Status Quo is not expected to result in levels of take that would jeopardize the
continued existence of ESA listed species. For these reasons, the no action is expected to have low
negative impacts on ESA-listed species, similar to past years.
48
Action Alternatives
Impacts to protected resources should generally follow impacts to effort. As effort is increased,
negative impacts increase, and as effort decreases, negative impacts should decrease. Substantial shifts
in effort spatially or temporally my also cause impacts.
Alternatives in Alternatives Sets 1, 2, and 5 should have minimal impacts because they primarily
impact who can catch squid rather than how much overall effort occurs. Alternative 2b allows a one-
time permit swap but because of the limited application (both vessels must have now-current
moratorium permits and be owned by the same entity) and baseline limitations, 2b is unlikely to
substantially change effort (but still could activate some additional effort). 2c allows non-requalifying
longfin squid/butterfish moratorium vessels a higher incidental trip limit than might occur otherwise,
but the overall effect would still be to restrict participation from the status quo. Alternative Sets 1, 2,
and 5 are thus unlikely to substantially affect overall effort in the squid fisheries (availability and the
overall quota control overall effort), so they are likely to result in similar impacts (i.e., low negative) to
protected species as provided in and compared to the No Action alternative.
The action alternatives in Alternative Sets 3 and 4 would likely reduce effort in T2 in some years by
reducing the T2 quota and/or by more effectively limiting landings/effort once the T2 directed fishery
closes. Due to rollover provisions described previously, any reduction in catch in T2 results in more
quota being available in T3. The abundance and availability of longfin squid are highly variable - the
fishery intensifies when squid are abundant/available and wanes when longfin squid are not
abundant/available. It is not currently possible to predict which part of the season may be particularly
productive due to the species’ inherent variability. If squid are not unusually available in T3, then the
overall effect would be a reduction in longfin squid effort (primarily bottom otter trawl), with that
reduction taking place in T2, probably during June, July, and/or August (there has never been a May
closure). This would benefit protected resources, but the benefit would be low due to only partially
reducing the fishery in T2, and because the no-action only has low negative impacts to being with (see
above).
A slightly more complicated situation arises if more quota is available in T3 and longfin squid are
relatively available for harvest in T3. The fishery would start as usual in September, and could close at
some point. However, the fishery, with rollover into T2 (2010-2016) or without rollover into T2
(2007-2009) has never closed at all in T3 under the Trimester system so the T3 quota has not been
limiting. Other constraints on the operation of the fleet (squid availability, weather, fuel costs, other
regulations, etc.) have limited longfin squid effort in T3. An increase to a quota that has not been
limiting should not change the operation of the fishery; if simply having quota available was going to
drive up effort in T3, then that effort increase should already have occurred.
In the apparently unlikely event that higher quota in T3 did lead to higher effort, since closures are
most likely to occur at the end of the year (when the greatest possible fishing time has elapsed since
the start of T3), a higher T3 quota would mean that the most likely change to the fishery would be that
49
instead of closing sometime in December, the fishery would remain open in December. Again, this is
only theoretical since the fishery has never closed at all during T3 despite the availability of quota.
Thus the final result in this low probability scenario would be to shift effort from June/July/August to
December. This shift would not be expected to negatively impact any protected species, since the
highest observed longfin squid interactions with sea turtle, small cetacean, and pinniped species are
observed during the months of September and October, when the fishery is expected to be open
regardless due to the fresh T3 quota being available on September 1. Observed Atlantic sturgeon
interactions with vessels targeting longfin squid were greatest during T2, so there could be benefits to
Atlantic sturgeon from reduced T2 effort.
Because squid effort is primarily driven by availability, it is not expected that lowering the T2 quota
would cause a substantial relative shift in effort earlier in the Trimester as fishermen anticipate a
possible early closure. If squid are available effort will be high (e.g. 2012 and 2016).
The reductions in T2 landings being considered are designed to increase the overall productivity of the
longfin squid stock. This could have indirect benefits to protected resources that eat squid, primarily
small cetacean and pinniped species.
7.4 Non-Target Resources
The MSB fisheries would continue to have impacts on non-target species under the “no action”
Alternative. This Amendment only addresses the squid fisheries so this public hearing document
focuses solely on the squid fisheries. Previous analyses have shown that the Illex fishery has very low
bycatch of commercially fished species but some bycatch of swordfish (incidental retention of up to 15
swordfish are allowed per trip depending on a vessel’s permits, landings, and gear -
http://www.nmfs.noaa.gov/sfa/hms/compliance/guides/documents/comm_compliance_guide_qr_sword
fish.pdf). Given the low level of discards in the Illex fishery, and given the Illex alternatives may
impact who catches Illex squid more than the overall effort in the Illex fishery, negligible impacts are
expected on non-target resources from Alternative Set 5.
As described in the tables below, the longfin squid fishery does discard a substantial quantity of catch,
with a variety of discarded species. Because discards have been previously reduced to the extent
practicable (Scup Gear Restricted Areas, the Butterfish Discard Cap, mesh increases, voluntary
avoidance programs, etc.) and discards are considered in the management of other fisheries, the no
action impact is low negative for non-target species.
Northeast Fishery Observer Program data for 2016 were not yet fully available when this document
was compiled, so the analysis of observer data uses 2015 data as a terminal year. 2016 data is
undergoing analysis and will be presented during public hearings and to the Council in June 2017 to
the degree practicable. Trips that retained (i.e., the estimated kept weight of longfin squid) greater than
40% longfin squid by weight account for more than 90% of longfin squid landings, so that definition
was used to define directivity for observed trips included in the following analyses. The longfin squid
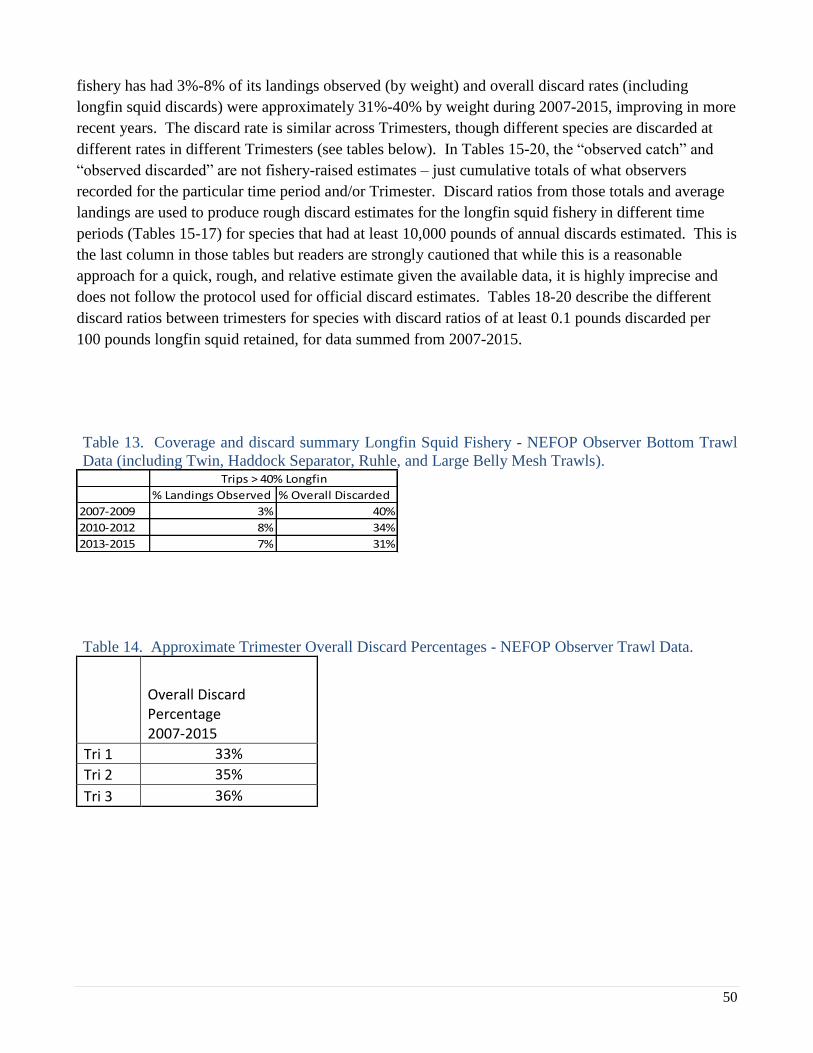
50
fishery has had 3%-8% of its landings observed (by weight) and overall discard rates (including
longfin squid discards) were approximately 31%-40% by weight during 2007-2015, improving in more
recent years. The discard rate is similar across Trimesters, though different species are discarded at
different rates in different Trimesters (see tables below). In Tables 15-20, the “observed catch” and
“observed discarded” are not fishery-raised estimates – just cumulative totals of what observers
recorded for the particular time period and/or Trimester. Discard ratios from those totals and average
landings are used to produce rough discard estimates for the longfin squid fishery in different time
periods (Tables 15-17) for species that had at least 10,000 pounds of annual discards estimated. This is
the last column in those tables but readers are strongly cautioned that while this is a reasonable
approach for a quick, rough, and relative estimate given the available data, it is highly imprecise and
does not follow the protocol used for official discard estimates. Tables 18-20 describe the different
discard ratios between trimesters for species with discard ratios of at least 0.1 pounds discarded per
100 pounds longfin squid retained, for data summed from 2007-2015.
Table 13. Coverage and discard summary Longfin Squid Fishery - NEFOP Observer Bottom Trawl
Data (including Twin, Haddock Separator, Ruhle, and Large Belly Mesh Trawls).
% Landings Observed % Overall Discarded
2007-2009 3% 40%
2010-2012 8% 34%
2013-2015 7% 31%
Trips > 40% Longfin
Table 14. Approximate Trimester Overall Discard Percentages - NEFOP Observer Trawl Data.
Overall Discard Percentage 2007-2015
Tri 1 33%
Tri 2 35%
Tri 3 36%

51
Table 15. 2007-2009 Discard Data From Trips >40% Longfin. Species with >10,000 pounds estimated
annual discards.
NESPP4Observed
Catch
Observed
Discarded
% of total
discards
Percent of
particular
species
discarded
Common Name
Pounds
Discarded per
100 pounds
longfin retained
Rough annual discards
(pounds) based on 24
million pounds of squid
landings (average 2007-
2009)
511 295,226 273,885 15% 93% BUTTERFISH 11.7 2,807,0253521 179,861 179,418 10% 100% DOGFISH, SPINY 7.7 1,838,8368020 169,176 168,533 9% 100% SQUID, SHORT-FIN 7.2 1,727,281
5090 204,661 165,370 9% 81% HAKE, SILVER (WHITING) 7.1 1,694,8571520 147,690 134,196 7% 91% HAKE, RED (LING) 5.7 1,375,3656602 122,270 116,333 6% 95% HAKE, SPOTTED 5.0 1,192,2853660 102,672 102,189 6% 100% SKATE, LITTLE 4.4 1,047,3241270 74,181 74,013 4% 100% FLOUNDER, FOURSPOT 3.2 758,550
2120 198,423 63,787 4% 32% MACKEREL, ATLANTIC 2.7 653,7443295 89,677 62,011 3% 69% SCUP 2.6 635,5443670 48,934 48,745 3% 100% SKATE, WINTER (BIG) 2.1 499,5848010 2,385,899 44,187 2% 2% SQUID, ATL LONG-FIN 1.9 452,8691219 58,136 39,159 2% 67% FLOUNDER, SUMMER (FLUKE) 1.7 401,3391685 26,812 26,661 1% 99% HERRING, ATLANTIC 1.1 273,2433511 24,808 23,101 1% 93% DOGFISH, SMOOTH 1.0 236,7604180 22,715 22,016 1% 97% BASS, STRIPED 0.9 225,6448009 24,973 20,379 1% 82% SCALLOP, SEA 0.9 208,8591200 17,955 17,434 1% 97% FLOUNDER, WINTER (BLACKBACK) 0.7 178,6811670 16,508 16,508 1% 100% HERRING, NK 0.7 169,1897010 15,585 15,585 1% 100% CRAB, LADY 0.7 159,7248171 13,685 13,685 1% 100% SEAWEED, NK 0.6 140,2571539 14,127 13,346 1% 94% HAKE, WHITE 0.6 136,777
230 31,815 13,256 1% 42% BLUEFISH 0.6 135,8553350 14,615 11,167 1% 76% SEA BASS, BLACK 0.5 114,449
124 18,730 10,110 1% 54% MONKFISH (GOOSEFISH) 0.4 103,6213420 10,421 9,964 1% 96% SEA ROBIN, STRIPED 0.4 102,1213680 9,007 8,946 0% 99% SKATE, BARNDOOR 0.4 91,6893650 8,437 8,437 0% 100% SKATE, NK 0.4 86,4711880 10,424 7,272 0% 70% DORY, BUCKLER (JOHN) 0.3 74,5303720 6,925 6,868 0% 99% SKATE, CLEARNOSE 0.3 70,3866600 11,031 6,524 0% 59% HAKE, NK 0.3 66,8607110 5,782 5,775 0% 100% CRAB, JONAH 0.2 59,1858030 5,754 4,984 0% 87% SQUID, NK 0.2 51,0827270 6,676 4,934 0% 74% LOBSTER, AMERICAN 0.2 50,5631250 4,490 4,470 0% 100% FLOUNDER, SAND DAB (WINDOWPANE) 0.2 45,8167240 4,494 4,467 0% 99% CRAB, HORSESHOE 0.2 45,7843460 4,206 4,206 0% 100% DOGFISH, CHAIN 0.2 43,103
900 3,850 3,661 0% 95% CROAKER, ATLANTIC 0.2 37,5221220 3,557 3,531 0% 99% FLOUNDER, WITCH (GREY SOLE) 0.2 36,1933400 3,398 3,394 0% 100% SEA ROBIN, NORTHERN 0.1 34,7836867 3,150 3,150 0% 100% SPONGE, NK 0.1 32,2826623 2,927 2,927 0% 100% BOARFISH, DEEPBODY 0.1 29,9934380 3,189 2,842 0% 89% TAUTOG (BLACKFISH) 0.1 29,1235080 2,774 2,596 0% 94% WHITING, BLACK (HAKE, OFFSHORE) 0.1 26,6106649 2,438 2,438 0% 100% MACKEREL, NK 0.1 24,9885260 1,982 1,939 0% 98% FISH, NK 0.1 19,8701477 1,880 1,880 0% 100% HADDOCK 0.1 19,2697120 1,761 1,757 0% 100% CRAB, ROCK 0.1 18,0068280 1,724 1,710 0% 99% STARFISH, SEASTAR,NK 0.1 17,5297150 1,535 1,535 0% 100% CRAB, SPIDER, NK 0.1 15,7343640 1,470 1,470 0% 100% SKATE, ROSETTE 0.1 15,0633474 1,396 1,329 0% 95% SHAD, AMERICAN 0.1 13,6173430 1,318 1,318 0% 100% SEA ROBIN, ARMORED 0.1 13,5066865 1,275 1,275 0% 100% CRAB, SPECKLED, NK 0.1 13,0671551 1,267 1,267 0% 100% HAKE, RED/WHITE MIX 0.1 12,982
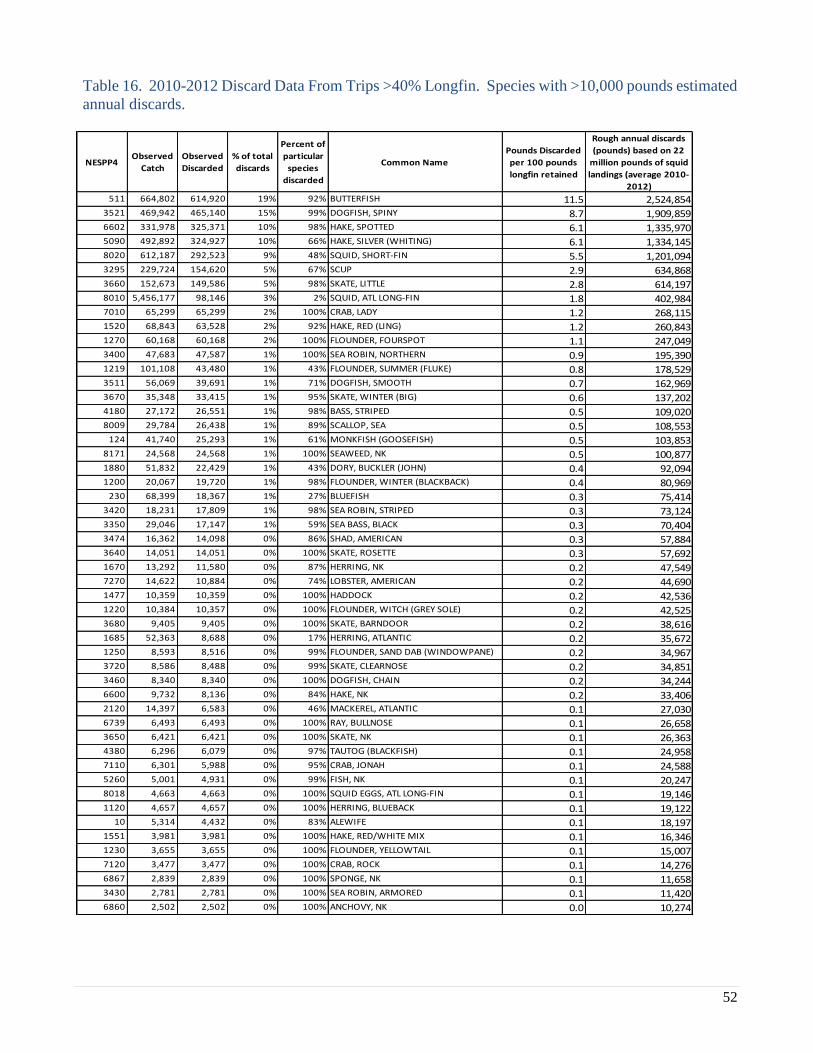
52
Table 16. 2010-2012 Discard Data From Trips >40% Longfin. Species with >10,000 pounds estimated
annual discards.
NESPP4Observed
Catch
Observed
Discarded
% of total
discards
Percent of
particular
species
discarded
Common Name
Pounds Discarded
per 100 pounds
longfin retained
Rough annual discards
(pounds) based on 22
million pounds of squid
landings (average 2010-
2012)
511 664,802 614,920 19% 92% BUTTERFISH 11.5 2,524,8543521 469,942 465,140 15% 99% DOGFISH, SPINY 8.7 1,909,8596602 331,978 325,371 10% 98% HAKE, SPOTTED 6.1 1,335,9705090 492,892 324,927 10% 66% HAKE, SILVER (WHITING) 6.1 1,334,1458020 612,187 292,523 9% 48% SQUID, SHORT-FIN 5.5 1,201,0943295 229,724 154,620 5% 67% SCUP 2.9 634,8683660 152,673 149,586 5% 98% SKATE, LITTLE 2.8 614,1978010 5,456,177 98,146 3% 2% SQUID, ATL LONG-FIN 1.8 402,9847010 65,299 65,299 2% 100% CRAB, LADY 1.2 268,1151520 68,843 63,528 2% 92% HAKE, RED (LING) 1.2 260,8431270 60,168 60,168 2% 100% FLOUNDER, FOURSPOT 1.1 247,0493400 47,683 47,587 1% 100% SEA ROBIN, NORTHERN 0.9 195,3901219 101,108 43,480 1% 43% FLOUNDER, SUMMER (FLUKE) 0.8 178,5293511 56,069 39,691 1% 71% DOGFISH, SMOOTH 0.7 162,9693670 35,348 33,415 1% 95% SKATE, WINTER (BIG) 0.6 137,2024180 27,172 26,551 1% 98% BASS, STRIPED 0.5 109,0208009 29,784 26,438 1% 89% SCALLOP, SEA 0.5 108,553
124 41,740 25,293 1% 61% MONKFISH (GOOSEFISH) 0.5 103,8538171 24,568 24,568 1% 100% SEAWEED, NK 0.5 100,8771880 51,832 22,429 1% 43% DORY, BUCKLER (JOHN) 0.4 92,0941200 20,067 19,720 1% 98% FLOUNDER, WINTER (BLACKBACK) 0.4 80,969
230 68,399 18,367 1% 27% BLUEFISH 0.3 75,4143420 18,231 17,809 1% 98% SEA ROBIN, STRIPED 0.3 73,1243350 29,046 17,147 1% 59% SEA BASS, BLACK 0.3 70,4043474 16,362 14,098 0% 86% SHAD, AMERICAN 0.3 57,8843640 14,051 14,051 0% 100% SKATE, ROSETTE 0.3 57,6921670 13,292 11,580 0% 87% HERRING, NK 0.2 47,5497270 14,622 10,884 0% 74% LOBSTER, AMERICAN 0.2 44,6901477 10,359 10,359 0% 100% HADDOCK 0.2 42,5361220 10,384 10,357 0% 100% FLOUNDER, WITCH (GREY SOLE) 0.2 42,5253680 9,405 9,405 0% 100% SKATE, BARNDOOR 0.2 38,6161685 52,363 8,688 0% 17% HERRING, ATLANTIC 0.2 35,6721250 8,593 8,516 0% 99% FLOUNDER, SAND DAB (WINDOWPANE) 0.2 34,9673720 8,586 8,488 0% 99% SKATE, CLEARNOSE 0.2 34,8513460 8,340 8,340 0% 100% DOGFISH, CHAIN 0.2 34,2446600 9,732 8,136 0% 84% HAKE, NK 0.2 33,4062120 14,397 6,583 0% 46% MACKEREL, ATLANTIC 0.1 27,0306739 6,493 6,493 0% 100% RAY, BULLNOSE 0.1 26,6583650 6,421 6,421 0% 100% SKATE, NK 0.1 26,3634380 6,296 6,079 0% 97% TAUTOG (BLACKFISH) 0.1 24,9587110 6,301 5,988 0% 95% CRAB, JONAH 0.1 24,5885260 5,001 4,931 0% 99% FISH, NK 0.1 20,2478018 4,663 4,663 0% 100% SQUID EGGS, ATL LONG-FIN 0.1 19,1461120 4,657 4,657 0% 100% HERRING, BLUEBACK 0.1 19,122
10 5,314 4,432 0% 83% ALEWIFE 0.1 18,1971551 3,981 3,981 0% 100% HAKE, RED/WHITE MIX 0.1 16,3461230 3,655 3,655 0% 100% FLOUNDER, YELLOWTAIL 0.1 15,0077120 3,477 3,477 0% 100% CRAB, ROCK 0.1 14,2766867 2,839 2,839 0% 100% SPONGE, NK 0.1 11,6583430 2,781 2,781 0% 100% SEA ROBIN, ARMORED 0.1 11,4206860 2,502 2,502 0% 100% ANCHOVY, NK 0.0 10,274

53
Table 17. 2013-2015 Discard Data From Trips >40% Longfin. Species with >10,000 pounds estimated
annual discards.
NESPP4Observed
Catch
Observed
Discarded
% of total
discards
Percent of
particular
species
discarded
Common Name
Pounds
Discarded per
100 pounds
longfin retained
Rough annual discards
(pounds) based on 26
million pounds of squid
landings (average 2013-
2015)
511 711,378 388,391 14% 55% BUTTERFISH 7.5 1,961,4936602 291,774 285,881 10% 98% HAKE, SPOTTED 5.6 1,443,7858020 345,605 248,680 9% 72% SQUID, SHORT-FIN 4.8 1,255,9083660 215,948 212,661 8% 98% SKATE, LITTLE 4.1 1,074,0033521 200,535 199,510 7% 99% DOGFISH, SPINY 3.9 1,007,5855090 284,782 172,782 6% 61% HAKE, SILVER (WHITING) 3.4 872,6028010 5,294,139 145,931 5% 3% SQUID, ATL LONG-FIN 2.8 736,9971520 128,942 120,556 4% 93% HAKE, RED (LING) 2.3 608,8443511 87,893 81,839 3% 93% DOGFISH, SMOOTH 1.6 413,3133295 191,291 80,550 3% 42% SCUP 1.6 406,8003670 76,811 73,796 3% 96% SKATE, WINTER (BIG) 1.4 372,6921270 54,519 54,419 2% 100% FLOUNDER, FOURSPOT 1.1 274,8338171 52,459 52,459 2% 100% SEAWEED, NK 1.0 264,9343400 48,075 47,870 2% 100% SEA ROBIN, NORTHERN 0.9 241,7571219 93,060 40,047 1% 43% FLOUNDER, SUMMER (FLUKE) 0.8 202,2513730 39,677 39,616 1% 100% SKATE, LITTLE/WINTER, NK 0.8 200,0723350 46,672 37,747 1% 81% SEA BASS, BLACK 0.7 190,6361477 37,397 37,389 1% 100% HADDOCK 0.7 188,8247010 36,173 36,173 1% 100% CRAB, LADY 0.7 182,6833650 35,176 34,821 1% 99% SKATE, NK 0.7 175,8562150 51,692 32,705 1% 63% MACKEREL, CHUB 0.6 165,1718009 27,958 21,605 1% 77% SCALLOP, SEA 0.4 109,1133720 18,986 18,188 1% 96% SKATE, CLEARNOSE 0.4 91,856
124 26,011 17,360 1% 67% MONKFISH (GOOSEFISH) 0.3 87,6711880 32,482 15,998 1% 49% DORY, BUCKLER (JOHN) 0.3 80,7951200 16,130 15,867 1% 98% FLOUNDER, WINTER (BLACKBACK) 0.3 80,134
230 24,502 13,583 0% 55% BLUEFISH 0.3 68,6001250 12,197 12,165 0% 100% FLOUNDER, SAND DAB (WINDOWPANE) 0.2 61,4373420 10,946 10,403 0% 95% SEA ROBIN, STRIPED 0.2 52,5393474 9,146 9,113 0% 100% SHAD, AMERICAN 0.2 46,0223680 8,992 8,992 0% 100% SKATE, BARNDOOR 0.2 45,4133460 8,301 8,301 0% 100% DOGFISH, CHAIN 0.2 41,9237120 8,284 8,281 0% 100% CRAB, ROCK 0.2 41,8234180 8,633 7,999 0% 93% BASS, STRIPED 0.2 40,3991660 7,614 7,614 0% 100% HERRING, ROUND 0.1 38,4506626 7,391 7,391 0% 100% BEARDFISH 0.1 37,327
10 7,183 7,079 0% 99% ALEWIFE 0.1 35,7494060 7,013 6,881 0% 98% SPOT 0.1 34,7533640 6,670 6,670 0% 100% SKATE, ROSETTE 0.1 33,6876867 6,059 6,059 0% 100% SPONGE, NK 0.1 30,5977110 5,977 5,621 0% 94% CRAB, JONAH 0.1 28,3863430 5,144 5,144 0% 100% SEA ROBIN, ARMORED 0.1 25,9776871 4,839 4,839 0% 100% JELLYFISH, NK 0.1 24,4362120 10,084 4,490 0% 45% MACKEREL, ATLANTIC 0.1 22,6731551 4,837 4,461 0% 92% HAKE, RED/WHITE MIX 0.1 22,5301220 4,453 4,445 0% 100% FLOUNDER, WITCH (GREY SOLE) 0.1 22,4501670 4,491 4,431 0% 99% HERRING, NK 0.1 22,3785260 4,482 4,429 0% 99% FISH, NK 0.1 22,3658018 4,397 4,397 0% 100% SQUID EGGS, ATL LONG-FIN 0.1 22,2042210 4,311 4,237 0% 98% MENHADEN, ATLANTIC 0.1 21,3967270 5,705 4,028 0% 71% LOBSTER, AMERICAN 0.1 20,3456739 3,118 3,118 0% 100% RAY, BULLNOSE 0.1 15,7447150 3,092 3,092 0% 100% CRAB, SPIDER, NK 0.1 15,6147240 3,527 3,039 0% 86% CRAB, HORSESHOE 0.1 15,3451230 2,926 2,838 0% 97% FLOUNDER, YELLOWTAIL 0.1 14,3351539 2,944 2,097 0% 71% HAKE, WHITE 0.0 10,5883310 2,046 1,992 0% 97% SCAD, ROUGH 0.0 10,058

54
Table 18. 2007-2015 Data From Trips >40% Longfin – Trimester 1. Species with discard ratios ≥ 0.1
pounds discarded for 100 pounds longfin retained.
NESPP4Observed
Catch
Observed
Discarded
% of total
discards
Percent of
particular
species
discarded
Common Name
Pounds
Discarded per
100 pounds
longfin
retained
3521 510,585 510,135 18% 100% DOGFISH, SPINY 10.7511 558,052 488,395 18% 88% BUTTERFISH 10.2
8020 624,425 347,156 13% 56% SQUID, SHORT-FIN 7.35090 371,955 239,345 9% 64% HAKE, SILVER (WHITING) 5.06602 170,857 161,285 6% 94% HAKE, SPOTTED 3.41520 135,773 122,830 4% 90% HAKE, RED (LING) 2.68010 4,901,760 117,440 4% 2% SQUID, ATL LONG-FIN 2.51270 96,348 96,187 3% 100% FLOUNDER, FOURSPOT 2.03295 203,756 73,089 3% 36% SCUP 1.52120 208,599 66,803 2% 32% MACKEREL, ATLANTIC 1.43400 60,558 60,538 2% 100% SEA ROBIN, NORTHERN 1.38171 55,628 55,628 2% 100% SEAWEED, NK 1.21219 102,543 52,179 2% 51% FLOUNDER, SUMMER (FLUKE) 1.13670 42,676 42,378 2% 99% SKATE, WINTER (BIG) 0.93660 32,961 31,720 1% 96% SKATE, LITTLE 0.7
124 38,477 27,050 1% 70% MONKFISH (GOOSEFISH) 0.63350 37,078 24,278 1% 65% SEA BASS, BLACK 0.53420 24,225 23,960 1% 99% SEA ROBIN, STRIPED 0.5
230 65,454 23,881 1% 36% BLUEFISH 0.51880 43,708 23,165 1% 53% DORY, BUCKLER (JOHN) 0.51685 64,032 20,606 1% 32% HERRING, ATLANTIC 0.43511 19,211 18,813 1% 98% DOGFISH, SMOOTH 0.41220 17,052 17,006 1% 100% FLOUNDER, WITCH (GREY SOLE) 0.43680 16,276 16,215 1% 100% SKATE, BARNDOOR 0.31539 12,255 11,356 0% 93% HAKE, WHITE 0.23474 11,357 10,220 0% 90% SHAD, AMERICAN 0.21670 9,233 9,233 0% 100% HERRING, NK 0.23460 9,197 9,197 0% 100% DOGFISH, CHAIN 0.23640 7,723 7,723 0% 100% SKATE, ROSETTE 0.27110 6,939 6,715 0% 97% CRAB, JONAH 0.13430 6,468 6,468 0% 100% SEA ROBIN, ARMORED 0.16600 11,121 4,971 0% 45% HAKE, NK 0.18009 5,126 4,550 0% 89% SCALLOP, SEA 0.11551 3,981 3,981 0% 100% HAKE, RED/WHITE MIX 0.17120 3,246 3,246 0% 100% CRAB, ROCK 0.11477 2,666 2,658 0% 100% HADDOCK 0.1

55
Table 19. 2007-2015 Data From Trips >40% Longfin – Trimester 2. Species with discard ratios ≥ 0.1
pounds discarded for 100 pounds longfin retained.
NESPP4Observed
Catch
Observed
Discarded
% of total
discards
Percent of
particular
species
discarded
Common Name
Pounds
Discarded per
100 pounds
longfin
retained
3660 228,422 224,849 13% 98% SKATE, LITTLE 7.63295 248,446 190,212 11% 77% SCUP 6.4
511 169,514 145,604 9% 86% BUTTERFISH 4.93521 142,253 137,814 8% 97% DOGFISH, SPINY 4.67010 114,113 114,113 7% 100% CRAB, LADY 3.83670 102,599 100,252 6% 98% SKATE, WINTER (BIG) 3.43511 104,187 85,030 5% 82% DOGFISH, SMOOTH 2.95090 96,766 68,538 4% 71% HAKE, SILVER (WHITING) 2.38010 3,019,577 53,231 3% 2% SQUID, ATL LONG-FIN 1.88020 51,249 51,131 3% 100% SQUID, SHORT-FIN 1.74180 52,476 50,565 3% 96% BASS, STRIPED 1.71219 81,696 43,910 3% 54% FLOUNDER, SUMMER (FLUKE) 1.51200 43,051 42,180 2% 98% FLOUNDER, WINTER
(BLACKBACK) 1.43730 37,811 37,810 2% 100% SKATE, LITTLE/WINTER, NK 1.38171 34,715 34,715 2% 100% SEAWEED, NK 1.23650 33,851 33,717 2% 100% SKATE, NK 1.13350 39,838 31,565 2% 79% SEA BASS, BLACK 1.13400 27,120 26,889 2% 99% SEA ROBIN, NORTHERN 0.96602 23,315 22,677 1% 97% HAKE, SPOTTED 0.81270 18,318 18,307 1% 100% FLOUNDER, FOURSPOT 0.63720 19,218 18,265 1% 95% SKATE, CLEARNOSE 0.61250 17,623 17,519 1% 99% FLOUNDER, SAND DAB
(WINDOWPANE) 0.61520 13,834 11,344 1% 82% HAKE, RED (LING) 0.42150 16,173 10,619 1% 66% MACKEREL, CHUB 0.44380 10,088 9,472 1% 94% TAUTOG (BLACKFISH) 0.33420 9,907 9,429 1% 95% SEA ROBIN, STRIPED 0.38018 8,874 8,874 1% 100% SQUID EGGS, ATL LONG-FIN 0.36867 8,200 8,200 0% 100% SPONGE, NK 0.37120 7,038 7,036 0% 100% CRAB, ROCK 0.27270 9,652 7,013 0% 73% LOBSTER, AMERICAN 0.24060 7,014 6,882 0% 98% SPOT 0.26739 6,876 6,876 0% 100% RAY, BULLNOSE 0.27150 4,988 4,988 0% 100% CRAB, SPIDER, NK 0.22120 6,769 4,024 0% 59% MACKEREL, ATLANTIC 0.17110 3,670 3,670 0% 100% CRAB, JONAH 0.1
10 3,447 3,347 0% 97% ALEWIFE 0.15260 3,249 3,249 0% 100% FISH, NK 0.1
230 21,265 3,143 0% 15% BLUEFISH 0.11670 2,997 2,996 0% 100% HERRING, NK 0.11120 2,619 2,595 0% 99% HERRING, BLUEBACK 0.16871 2,317 2,317 0% 100% JELLYFISH, NK 0.16882 2,197 2,197 0% 100% SHELL, NK 0.13474 2,057 2,036 0% 99% SHAD, AMERICAN 0.17240 2,442 1,952 0% 80% CRAB, HORSESHOE 0.18280 1,648 1,648 0% 100% STARFISH, SEASTAR,NK 0.18050 1,603 1,603 0% 100% SEA URCHIN, NK 0.18009 2,656 1,514 0% 57% SCALLOP, SEA 0.1
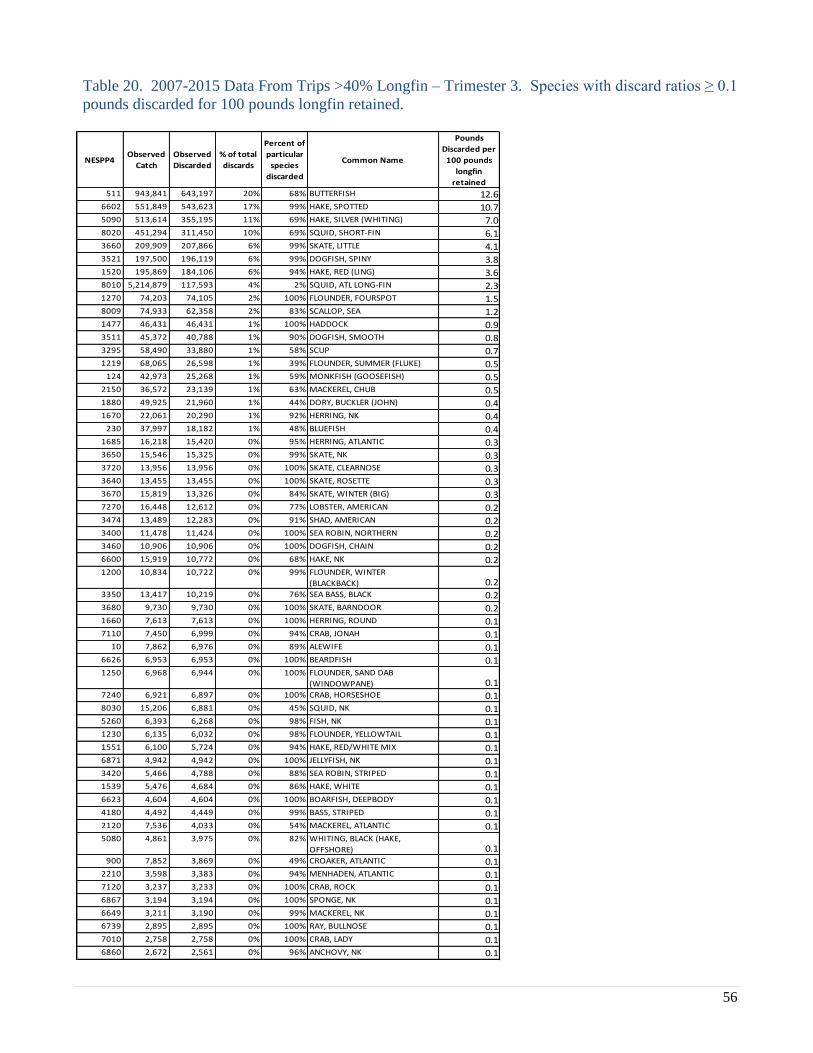
56
Table 20. 2007-2015 Data From Trips >40% Longfin – Trimester 3. Species with discard ratios ≥ 0.1
pounds discarded for 100 pounds longfin retained.
NESPP4Observed
Catch
Observed
Discarded
% of total
discards
Percent of
particular
species
discarded
Common Name
Pounds
Discarded per
100 pounds
longfin
retained
511 943,841 643,197 20% 68% BUTTERFISH 12.66602 551,849 543,623 17% 99% HAKE, SPOTTED 10.75090 513,614 355,195 11% 69% HAKE, SILVER (WHITING) 7.08020 451,294 311,450 10% 69% SQUID, SHORT-FIN 6.13660 209,909 207,866 6% 99% SKATE, LITTLE 4.13521 197,500 196,119 6% 99% DOGFISH, SPINY 3.81520 195,869 184,106 6% 94% HAKE, RED (LING) 3.68010 5,214,879 117,593 4% 2% SQUID, ATL LONG-FIN 2.31270 74,203 74,105 2% 100% FLOUNDER, FOURSPOT 1.58009 74,933 62,358 2% 83% SCALLOP, SEA 1.21477 46,431 46,431 1% 100% HADDOCK 0.93511 45,372 40,788 1% 90% DOGFISH, SMOOTH 0.83295 58,490 33,880 1% 58% SCUP 0.71219 68,065 26,598 1% 39% FLOUNDER, SUMMER (FLUKE) 0.5
124 42,973 25,268 1% 59% MONKFISH (GOOSEFISH) 0.52150 36,572 23,139 1% 63% MACKEREL, CHUB 0.51880 49,925 21,960 1% 44% DORY, BUCKLER (JOHN) 0.41670 22,061 20,290 1% 92% HERRING, NK 0.4
230 37,997 18,182 1% 48% BLUEFISH 0.41685 16,218 15,420 0% 95% HERRING, ATLANTIC 0.33650 15,546 15,325 0% 99% SKATE, NK 0.33720 13,956 13,956 0% 100% SKATE, CLEARNOSE 0.33640 13,455 13,455 0% 100% SKATE, ROSETTE 0.33670 15,819 13,326 0% 84% SKATE, WINTER (BIG) 0.37270 16,448 12,612 0% 77% LOBSTER, AMERICAN 0.23474 13,489 12,283 0% 91% SHAD, AMERICAN 0.23400 11,478 11,424 0% 100% SEA ROBIN, NORTHERN 0.23460 10,906 10,906 0% 100% DOGFISH, CHAIN 0.26600 15,919 10,772 0% 68% HAKE, NK 0.21200 10,834 10,722 0% 99% FLOUNDER, WINTER
(BLACKBACK) 0.23350 13,417 10,219 0% 76% SEA BASS, BLACK 0.23680 9,730 9,730 0% 100% SKATE, BARNDOOR 0.21660 7,613 7,613 0% 100% HERRING, ROUND 0.17110 7,450 6,999 0% 94% CRAB, JONAH 0.1
10 7,862 6,976 0% 89% ALEWIFE 0.16626 6,953 6,953 0% 100% BEARDFISH 0.11250 6,968 6,944 0% 100% FLOUNDER, SAND DAB
(WINDOWPANE) 0.17240 6,921 6,897 0% 100% CRAB, HORSESHOE 0.18030 15,206 6,881 0% 45% SQUID, NK 0.15260 6,393 6,268 0% 98% FISH, NK 0.11230 6,135 6,032 0% 98% FLOUNDER, YELLOWTAIL 0.11551 6,100 5,724 0% 94% HAKE, RED/WHITE MIX 0.16871 4,942 4,942 0% 100% JELLYFISH, NK 0.13420 5,466 4,788 0% 88% SEA ROBIN, STRIPED 0.11539 5,476 4,684 0% 86% HAKE, WHITE 0.16623 4,604 4,604 0% 100% BOARFISH, DEEPBODY 0.14180 4,492 4,449 0% 99% BASS, STRIPED 0.12120 7,536 4,033 0% 54% MACKEREL, ATLANTIC 0.15080 4,861 3,975 0% 82% WHITING, BLACK (HAKE,
OFFSHORE) 0.1900 7,852 3,869 0% 49% CROAKER, ATLANTIC 0.1
2210 3,598 3,383 0% 94% MENHADEN, ATLANTIC 0.17120 3,237 3,233 0% 100% CRAB, ROCK 0.16867 3,194 3,194 0% 100% SPONGE, NK 0.16649 3,211 3,190 0% 99% MACKEREL, NK 0.16739 2,895 2,895 0% 100% RAY, BULLNOSE 0.17010 2,758 2,758 0% 100% CRAB, LADY 0.16860 2,672 2,561 0% 96% ANCHOVY, NK 0.1
57
Similar to protected resources, impacts to non-target species should generally follow impacts to effort.
As effort is increased, negative impacts increase, and as effort decreases, negative impacts should
decrease. Substantial shifts in effort spatially or temporally my also cause impacts.
Alternatives in Alternatives Sets 1 and 2 should have minimal impacts because they primarily impact
who can catch squid rather than how much overall effort occurs. Action Alternatives in Alternative
Set 1, by reducing the number of directed longfin squid permits, could reduce the race to fish which
may have some low positive impacts for non-target species (fishermen may fish more carefully).
Alternative 2b allows a one-time permit swap but because of the limited application (both vessels must
have now-current moratorium permits and be owned by the same entity) and baseline limitations, 2b is
unlikely to substantially change effort (but still could activate some additional effort). 2c allows non-
requalifying longfin squid/butterfish moratorium vessels a higher incidental trip limit than might occur
otherwise, but the overall effect would still be to restrict participation from the status quo. Alternative
Sets 1 and 2 are thus unlikely to substantially affect overall effort in the squid fisheries (availability
and the overall quota control overall effort), so they are likely to result in approximately similar
impacts (i.e., low negative) to non-target species as described for and compared to the No Action
alternative above.
The action alternatives in Alternative Sets 3 and 4 would likely reduce effort in T2 in some years by
reducing the T2 quota and/or by more effectively limiting landings/effort once the T2 directed fishery
closes. Due to rollover provisions described previously, any reduction in catch in T2 results in more
quota being available in T3. The abundance and availability of longfin squid are highly variable - the
fishery intensifies when squid are abundant/available and wanes when longfin squid are not
abundant/available. It is not currently possible to predict which part of the season may be particularly
productive due to the species’ inherent variability. If squid are not unusually available in T3, then the
overall effect would be a reduction in longfin squid effort (primarily bottom otter trawl), with that
reduction taking place in T2, probably during June, July, and/or August (there has never been a May
closure). This would benefit non-target species, but the benefit would be low due to only partially
reducing the fishery in T2, and because the no-action has low negative impacts (see above).
A slightly more complicated situation arises if more quota is available in T3 and longfin squid are
relatively available for harvest in T3. The fishery would start as usual in September, and could close at
some point. However, the fishery, with rollover into T2 (2010-2016) or without rollover into T2
(2007-2009) has never closed at all in T3 so the T3 quota has not been limiting. Other constraints on
the operation of the fleet (squid availability, weather, fuel costs, other regulations, etc.) have limited
longfin squid effort in T3. An increase to a quota that has not been limiting should not change the
operation of the fishery; if simply having quota available was going to drive up effort in T3, then that
effort increase should already have occurred.
In the apparently unlikely event that higher quota in T3 did lead to higher effort, since closures are
most likely to occur at the end of the year (when the greatest possible fishing time has elapsed since
the start of T3), a higher T3 quota would mean that the most likely change to the fishery would be that
instead of closing sometime in December, the fishery would remain open in December. Again, this is
only theoretical since the fishery has never closed at all during T3 despite the availability of quota.
58
Thus the final result in this low probability scenario would be to shift some effort from June/July/
August to December.
From the tables above, several species which have high T2 discard rates would experience positive
discard impact differentials (higher to lower rates) from effort shifting from T2 to T3 including little
skate, scup, lady crab, winter skate, smooth dogfish, striped bass, summer flounder, winter flounder,
and black sea bass. Species which have high T3 discard rates would experience negative discard
impact differentials (lower to higher rates) from effort shifting from T2 to T3 including butterfish,
hakes, fourspot flounder, scallops, and haddock.
Overall impacts on non-targets from the action alternatives in Sets 3 and 4 are thus likely to be low-
positive because in some years the transferred quota from T2 to T3 will not be used due to low
availability later in the year in some years, which means that over time overall catch/effort will likely
be somewhat lower with the action alternatives in Sets 3 and 4. However in any given year, the
species with higher relative T3 discard rates may have low negative impacts and the species with
higher T2 rates would have additional benefits. 3B, 3C, 3D and 3E would likely have lower chances
of limiting effort and causing the effort reductions/shifts described above. The greatest reduction to or
shift from T2 effort/catch would occur by combining 4B and 4D. This would eliminate T1 to T2
rollover and reduce catch after a T2 closure by reducing the trip limit to 250 pounds. 4C (reducing T1
to T2 rollover) and 4E (post-closure trip limit of 500 pounds) would have similar but lesser effects.
4F (splitting T2 in half) would slow landings in T2 but may not appreciably affect overall effort/catch.
THIS SPACE INTENTIONALLY LEFT BLANK
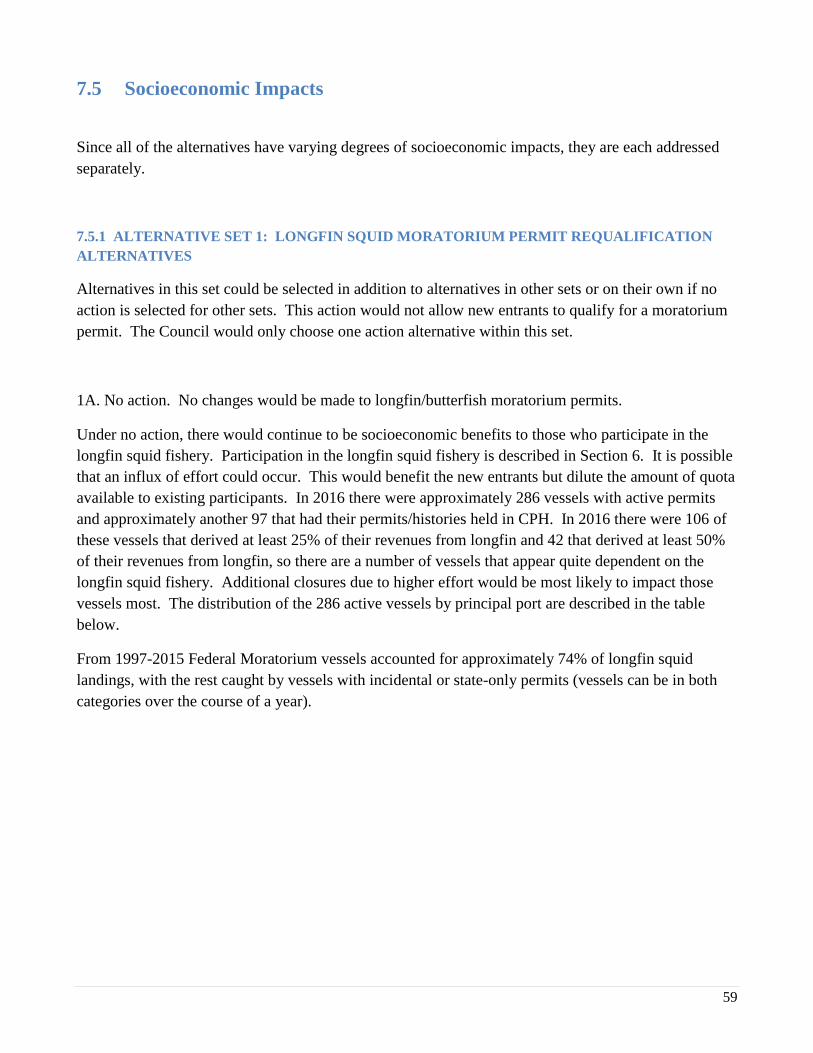
59
7.5 Socioeconomic Impacts
Since all of the alternatives have varying degrees of socioeconomic impacts, they are each addressed
separately.
7.5.1 ALTERNATIVE SET 1: LONGFIN SQUID MORATORIUM PERMIT REQUALIFICATION
ALTERNATIVES
Alternatives in this set could be selected in addition to alternatives in other sets or on their own if no
action is selected for other sets. This action would not allow new entrants to qualify for a moratorium
permit. The Council would only choose one action alternative within this set.
1A. No action. No changes would be made to longfin/butterfish moratorium permits.
Under no action, there would continue to be socioeconomic benefits to those who participate in the
longfin squid fishery. Participation in the longfin squid fishery is described in Section 6. It is possible
that an influx of effort could occur. This would benefit the new entrants but dilute the amount of quota
available to existing participants. In 2016 there were approximately 286 vessels with active permits
and approximately another 97 that had their permits/histories held in CPH. In 2016 there were 106 of
these vessels that derived at least 25% of their revenues from longfin and 42 that derived at least 50%
of their revenues from longfin, so there are a number of vessels that appear quite dependent on the
longfin squid fishery. Additional closures due to higher effort would be most likely to impact those
vessels most. The distribution of the 286 active vessels by principal port are described in the table
below.
From 1997-2015 Federal Moratorium vessels accounted for approximately 74% of longfin squid
landings, with the rest caught by vessels with incidental or state-only permits (vessels can be in both
categories over the course of a year).
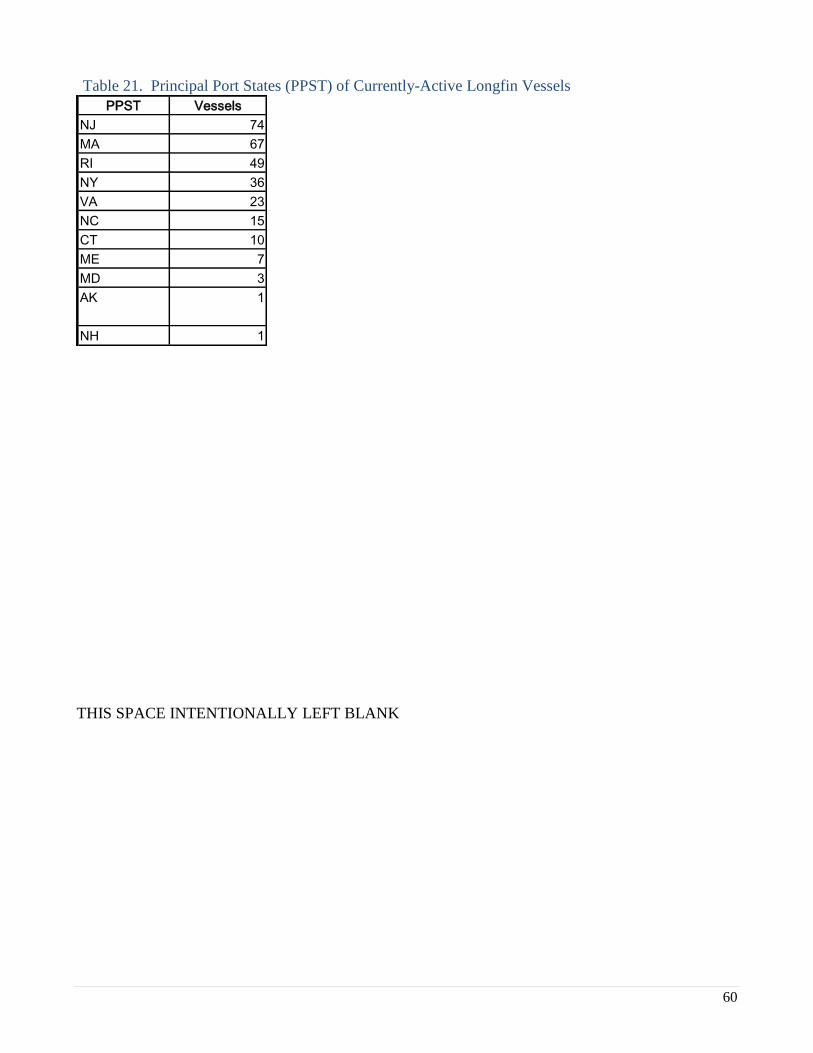
60
Table 21. Principal Port States (PPST) of Currently-Active Longfin Vessels
PPST Vessels
NJ 74
MA 67
RI 49
NY 36
VA 23
NC 15
CT 10
ME 7
MD 3
AK 1
NH 1
THIS SPACE INTENTIONALLY LEFT BLANK
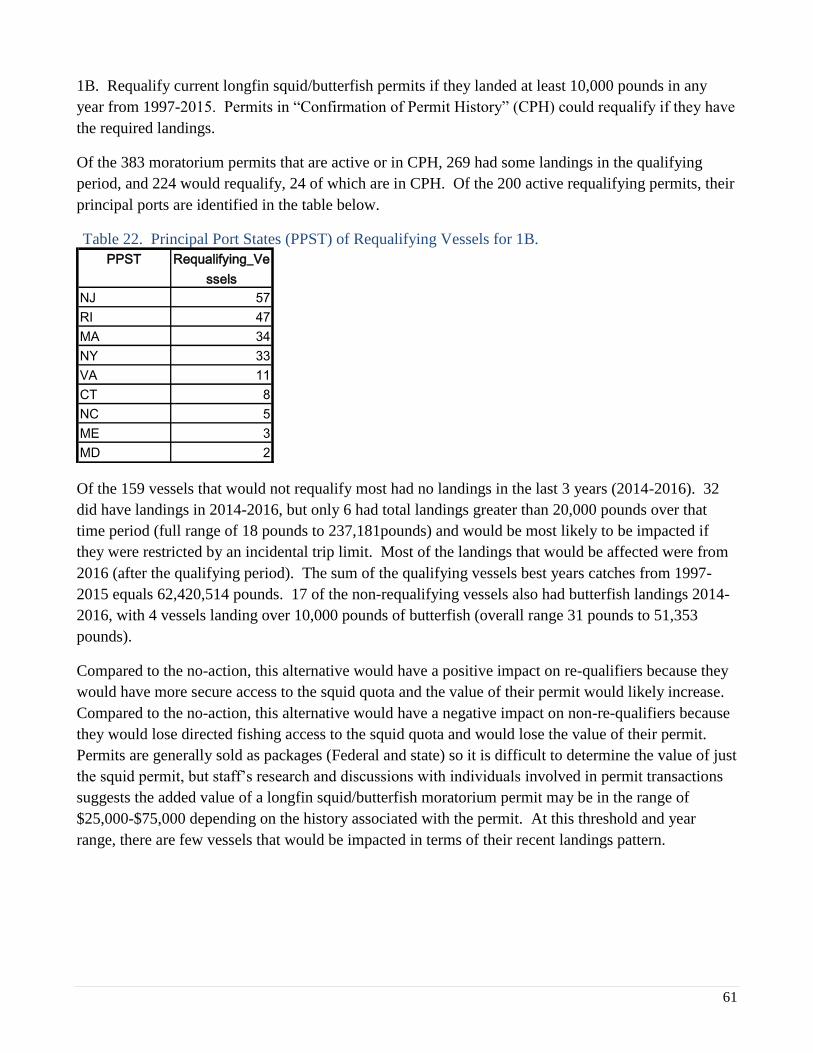
61
1B. Requalify current longfin squid/butterfish permits if they landed at least 10,000 pounds in any
year from 1997-2015. Permits in “Confirmation of Permit History” (CPH) could requalify if they have
the required landings.
Of the 383 moratorium permits that are active or in CPH, 269 had some landings in the qualifying
period, and 224 would requalify, 24 of which are in CPH. Of the 200 active requalifying permits, their
principal ports are identified in the table below.
Table 22. Principal Port States (PPST) of Requalifying Vessels for 1B.
PPST Requalifying_Ve
ssels
NJ 57
RI 47
MA 34
NY 33
VA 11
CT 8
NC 5
ME 3
MD 2
Of the 159 vessels that would not requalify most had no landings in the last 3 years (2014-2016). 32
did have landings in 2014-2016, but only 6 had total landings greater than 20,000 pounds over that
time period (full range of 18 pounds to 237,181pounds) and would be most likely to be impacted if
they were restricted by an incidental trip limit. Most of the landings that would be affected were from
2016 (after the qualifying period). The sum of the qualifying vessels best years catches from 1997-
2015 equals 62,420,514 pounds. 17 of the non-requalifying vessels also had butterfish landings 2014-
2016, with 4 vessels landing over 10,000 pounds of butterfish (overall range 31 pounds to 51,353
pounds).
Compared to the no-action, this alternative would have a positive impact on re-qualifiers because they
would have more secure access to the squid quota and the value of their permit would likely increase.
Compared to the no-action, this alternative would have a negative impact on non-re-qualifiers because
they would lose directed fishing access to the squid quota and would lose the value of their permit.
Permits are generally sold as packages (Federal and state) so it is difficult to determine the value of just
the squid permit, but staff’s research and discussions with individuals involved in permit transactions
suggests the added value of a longfin squid/butterfish moratorium permit may be in the range of
$25,000-$75,000 depending on the history associated with the permit. At this threshold and year
range, there are few vessels that would be impacted in terms of their recent landings pattern.

62
1C. Requalify current longfin squid/butterfish permits if they landed at least 10,000 pounds in any
year from 1997-2013. Permits in “Confirmation of Permit History” (CPH) could requalify if they have
the required landings.
Of the 383 moratorium permits that are active or in CPH, 265 had some landings in the qualifying
period, and 214 would requalify, 23 of which are in CPH. Of the 191 active requalifying permits, their
principal ports are identified in the table below.
Table 23. Principal Port States (PPST) of Requalifying Vessels for 1C.
PPST Requalifying_Ve
ssels
NJ 54
RI 46
NY 32
MA 31
VA 10
CT 8
NC 5
ME 3
MD 2
Of the 169 vessels that would not requalify most had no landings in the last 3 years (2014-2016). 42
did have landings in 2014-2016, and 16 had total landings greater than 20,000 pounds over that time
period (full range of 18 pounds to 522,748 pounds) and would be most likely to be impacted if they
were restricted by an incidental trip limit. The sum of the qualifying vessels best years catches from
1997-2015 equals 61,859,629 pounds. 26 of the non-requalifying vessels also had butterfish landings
2014-2016, with 6 vessels landing over 10,000 pounds of butterfish (overall range 6 pounds to 51,353
pounds).
Compared to the no-action, this alternative would have a positive impact on re-qualifiers because they
would have more secure access to the squid quota and the value of their permit would likely increase.
Compared to the no-action, this alternative would have a negative impact on non-re-qualifiers because
they would lose directed fishing access to the squid quota and would lose the value of their permit.
Permits are generally sold as packages (Federal and state) so it is difficult to determine the value of just
the squid permit, but staff’s research and discussions with individuals involved in permit transactions
suggests the added value of a longfin squid/butterfish moratorium permit may be in the range of
$25,000-$75,000 depending on the history associated with the permit. At this threshold and year
range, there are few vessels that would be impacted in terms of their recent landings pattern, but more
than with 1B.
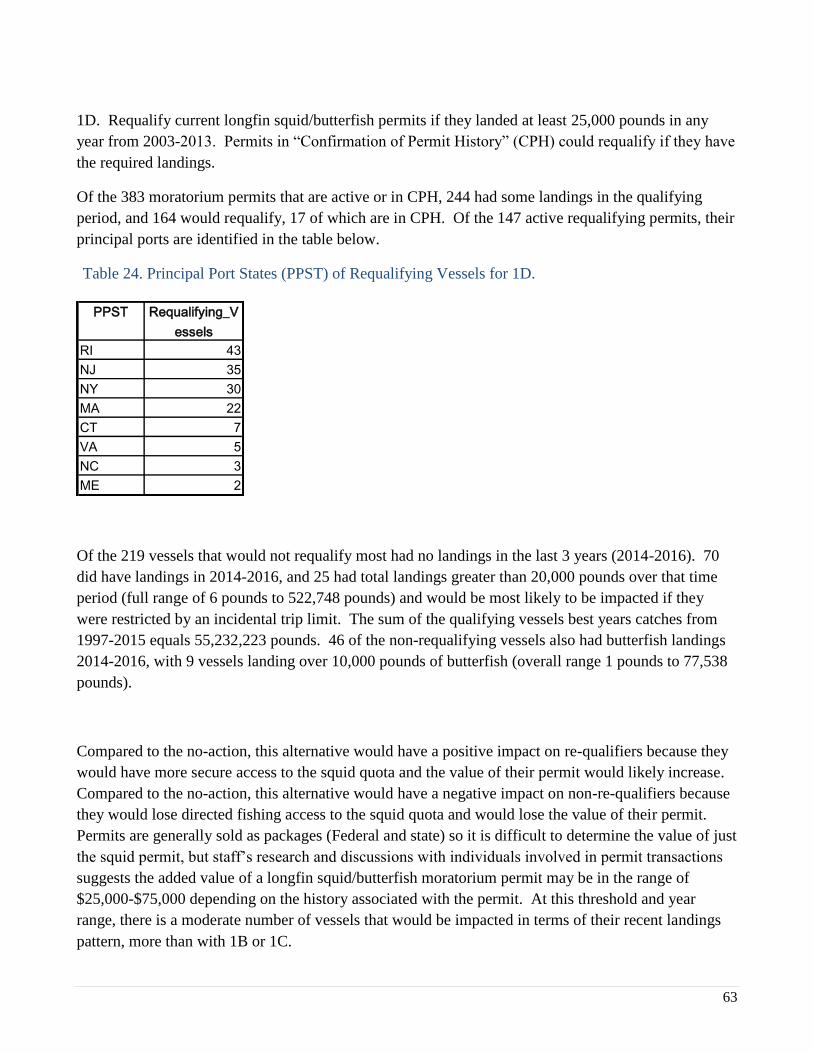
63
1D. Requalify current longfin squid/butterfish permits if they landed at least 25,000 pounds in any
year from 2003-2013. Permits in “Confirmation of Permit History” (CPH) could requalify if they have
the required landings.
Of the 383 moratorium permits that are active or in CPH, 244 had some landings in the qualifying
period, and 164 would requalify, 17 of which are in CPH. Of the 147 active requalifying permits, their
principal ports are identified in the table below.
Table 24. Principal Port States (PPST) of Requalifying Vessels for 1D.
PPST Requalifying_V
essels
RI 43
NJ 35
NY 30
MA 22
CT 7
VA 5
NC 3
ME 2
Of the 219 vessels that would not requalify most had no landings in the last 3 years (2014-2016). 70
did have landings in 2014-2016, and 25 had total landings greater than 20,000 pounds over that time
period (full range of 6 pounds to 522,748 pounds) and would be most likely to be impacted if they
were restricted by an incidental trip limit. The sum of the qualifying vessels best years catches from
1997-2015 equals 55,232,223 pounds. 46 of the non-requalifying vessels also had butterfish landings
2014-2016, with 9 vessels landing over 10,000 pounds of butterfish (overall range 1 pounds to 77,538
pounds).
Compared to the no-action, this alternative would have a positive impact on re-qualifiers because they
would have more secure access to the squid quota and the value of their permit would likely increase.
Compared to the no-action, this alternative would have a negative impact on non-re-qualifiers because
they would lose directed fishing access to the squid quota and would lose the value of their permit.
Permits are generally sold as packages (Federal and state) so it is difficult to determine the value of just
the squid permit, but staff’s research and discussions with individuals involved in permit transactions
suggests the added value of a longfin squid/butterfish moratorium permit may be in the range of
$25,000-$75,000 depending on the history associated with the permit. At this threshold and year
range, there is a moderate number of vessels that would be impacted in terms of their recent landings
pattern, more than with 1B or 1C.
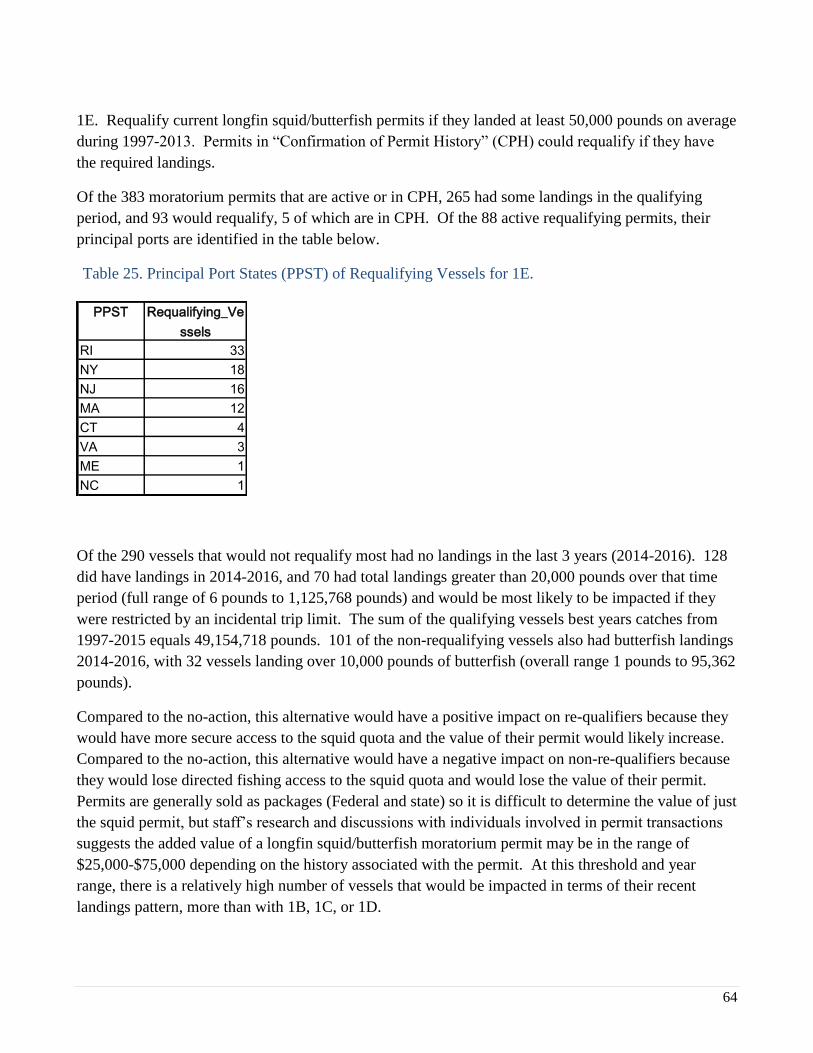
64
1E. Requalify current longfin squid/butterfish permits if they landed at least 50,000 pounds on average
during 1997-2013. Permits in “Confirmation of Permit History” (CPH) could requalify if they have
the required landings.
Of the 383 moratorium permits that are active or in CPH, 265 had some landings in the qualifying
period, and 93 would requalify, 5 of which are in CPH. Of the 88 active requalifying permits, their
principal ports are identified in the table below.
Table 25. Principal Port States (PPST) of Requalifying Vessels for 1E.
PPST Requalifying_Ve
ssels
RI 33
NY 18
NJ 16
MA 12
CT 4
VA 3
ME 1
NC 1
Of the 290 vessels that would not requalify most had no landings in the last 3 years (2014-2016). 128
did have landings in 2014-2016, and 70 had total landings greater than 20,000 pounds over that time
period (full range of 6 pounds to 1,125,768 pounds) and would be most likely to be impacted if they
were restricted by an incidental trip limit. The sum of the qualifying vessels best years catches from
1997-2015 equals 49,154,718 pounds. 101 of the non-requalifying vessels also had butterfish landings
2014-2016, with 32 vessels landing over 10,000 pounds of butterfish (overall range 1 pounds to 95,362
pounds).
Compared to the no-action, this alternative would have a positive impact on re-qualifiers because they
would have more secure access to the squid quota and the value of their permit would likely increase.
Compared to the no-action, this alternative would have a negative impact on non-re-qualifiers because
they would lose directed fishing access to the squid quota and would lose the value of their permit.
Permits are generally sold as packages (Federal and state) so it is difficult to determine the value of just
the squid permit, but staff’s research and discussions with individuals involved in permit transactions
suggests the added value of a longfin squid/butterfish moratorium permit may be in the range of
$25,000-$75,000 depending on the history associated with the permit. At this threshold and year
range, there is a relatively high number of vessels that would be impacted in terms of their recent
landings pattern, more than with 1B, 1C, or 1D.
65
7.5.2 ALTERNATIVE SET 2: LONGFIN SQUID MORATORIUM PERMIT REQUALIFICATION
SUB-ALTERNATIVES
2B or 2C could be selected if an action alternative from Set 1 is selected. Alternatives in this set could
also be selected in addition to alternatives from Sets 3, 4, and 5. 2C would only apply if either 3B or
3C is selected. Within the action alternatives in this set, the Council could select both 2B and 2C or
just one.
2A. No action. No additional requalification options would be selected.
By not allowing the limited permit swap afforded under 2B, owners of vessels may have a less
efficient fleet than under 2B. Assuming that the Council moves forward with a new limited access
incidental longfin permit, not granting current moratorium permits that do not requalify for a
moratorium permit a new limited access incidental longfin permit will be a negative for those vessels
that would not otherwise qualify based on their landings.
2B. An entity that is currently issued more than one longfin squid/butterfish moratorium permit has a
one-time opportunity to swap re-qualifying moratorium permits among vessels owned by that same
entity that currently have longfin squid/butterfish moratorium permits. All baselines and histories
would remain the same for all vessels.
It cannot currently be determined how many vessels this might apply to. Owners of multiple vessels
with longfin/butterfish moratorium permits who would not re-qualify all of their existing permits for
the directed longfin/butterfish moratorium permit could realize some benefit by being able to
somewhat re-balance their permit portfolio on their vessels. Thus there would likely be a low-positive
socioeconomic benefit compared to no action for such entities by increasing the efficiency of their
longfin squid permit. Alternative 2B would reduce the number of vessels effectively eliminated from
the squid fishery, but because of the limited application (both vessels must have now-current
moratorium permits and be owned by the same entity) and baseline limitations, 2B is unlikely to
substantially change overall effort. For this alternative, it was reported that the squid permit would be
moved from a vessel already engaged in other fisheries (e.g. scallops and/or monkfish) so there would
not be indirect effects related to increasing effort in other fisheries in such cases (only less of a
decrease in active squid permits than would otherwise occur). This is not possible to confirm and it is
theoretically possible that permit rebalancing could lead to additional effort in other fisheries.
However, because of the limited instances where permits could be swapped and the baseline
limitations, such indirect effects would be expected to be minimal.
66
2C. If a vessel that currently has been issued a moratorium longfin squid/butterfish permit does not re-
qualify, it would automatically be issued a limited access incidental permit if the Council makes the
current open access incidental permit a limited access permit.
For the longfin squid requalification options, approximately 159-290 vessels would not requalify. In
those cases, approximately 150 vessels would not even meet the proposed criteria for the incidental
permit and without this option could have to obtain the proposed open access permit, which is
proposed to have a 250-500 pound trip limit versus the 2,500 pound trip limit that the limited access
incidental permit is proposed to have. For those 150 vessels, this option would provide a benefit both
in terms of the possibility of landing squid at a higher level, and because the incidental permit would
have some value. Because they have not been landing squid at substantial levels and the current
incidental permit is open access, the benefits are not possible to quantify.
7.5.3 ALTERNATIVE SET 3: LONGFIN SQUID INCIDENTAL AND OPEN ACCESS
ALTERNATIVES
Alternatives in this set could be selected in addition to alternatives in other sets or on their own if no
action is selected for other sets. Within the action alternatives in this set, the Council could select
either 3B or 3C, possibly combined with either 3D or 3E.
3A. No action. The current open access incidental permits and associated trip limits would remain as
they are.
Under no action, individuals who switch between having and not having an incidental permit to target
longfin squid in Federal or state waters as the optimal case for their situation could continue to do so.
Conversely, less restricted fishing in state waters after a Federal closure reduces the available quota
later in the season for Federal moratorium permit holders. New participants could also acquire
incidental permits to land up to 2,500 pounds of longfin squid without cost.
3B. Create a new limited-access incidental longfin squid permit that cannot be reacquired if dropped.
Qualification years would be from 1997-2013 and require landings of at least 2,500 pounds in any one
year. The initial trip limit would be 2,500 pounds. This permit would also allow incidental catch of
Illex and butterfish at the designated incidental trip limit (currently 10,000 pounds for Illex and 600
pounds for butterfish).
With these criteria, there would be approximately 375 Federally-permitted vessels that would qualify
for a new limited-access incidental longfin squid permit. Currently state-only licensed vessels may
also apply. Since the proposed trip limit is the same as the best year qualification threshold, requiring
this permit should not limit current participants’ fishing compared to no action. It would create a cost
to new participants who wanted/needed to purchase a limited access permit from an existing holder to

67
catch the proposed 2,500 pound trip limit. It also would create a cost to dropping the incidental permit
to fish in state waters when Federal waters close, which is the primary point of this alternative. Staff
will add additional information about the extent of this issue before public hearings.
3C. Create a new limited-access incidental longfin squid permit that cannot be reacquired if dropped.
Qualification years would be from 1997-2013 and require landings of at least 5,000 pounds in any one
year. The initial trip limit would be 2,500 pounds. This permit would also allow incidental catch of
Illex and butterfish at the designated incidental trip limit (currently 10,000 pounds for Illex and 600
pounds for butterfish).
With these criteria, there would be approximately 325 Federally-permitted vessels that would qualify
for a new limited-access incidental longfin squid permit. Currently state-only licensed vessels may
also apply. Since the proposed trip limit is half of the best year qualification threshold, requiring this
permit should not limit participants’ fishing compared to no action. It would create a cost to new
participants who wanted/needed to purchase a limited access permit from an existing holder to catch
the proposed 2,500 pound trip limit. It also would create a cost to dropping the incidental permit to
fish in state waters when Federal waters close, which is the primary point of this alternative. Staff will
add additional information about the extent of this issue before public hearings.
3D. Make the open-access longfin squid incidental trip limit 250 pounds.
Because the qualification threshold for a new limited-access incidental longfin squid permit would be
low (2,500 pounds or 5,000 pounds in any one year 1997-2013), only vessels with minimal landings
would not qualify for the new limited-access incidental longfin squid permit. Therefore this alternative
should not affect current substantial participants because they would get at least the new limited-access
incidental longfin squid permit. This permit would address truly incidental, small scale catch. Of
current federally-permitted vessels that would not qualify for the proposed limited access incidental
permit but had some longfin squid landings, their average longfin squid trip landing during the
qualification period was 71 pounds if a 2,500 pound threshold is used (471 vessels) and 74 pounds if a
5,000 pound threshold is used (520 vessels).
3E. Make the current open-access longfin squid incidental trip limit 500 pounds.
Because the qualification threshold for a new limited-access incidental longfin squid permit would be
low (2,500 pounds or 5,000 pounds in any one year 1997-2013), only vessels with minimal landings
would not qualify for the new limited-access incidental longfin squid permit. Therefore this alternative
should not affect current substantial participants because they would get at least the new limited-access
incidental longfin squid permit. This permit would address truly incidental, small scale catch. Of
68
current federally-permitted vessels that would not qualify for the proposed limited access incidental
permit but had some longfin squid landings, their average longfin squid trip landing during the
qualification period was 71 pounds if a 2,500 pound threshold is used (471 vessels) and 74 pounds if a
5,000 pound threshold is used (520 vessels).
7.5.4 ALTERNATIVE SET 4: LONGFIN SQUID TRIMESTER 2 (“T2”) ALTERNATIVES
Alternatives in this set could be selected in addition to alternatives in other sets or on their own if no
action is selected for other sets. Within the action alternatives in this set, the Council could select
either 4B or 4C, possibly combined with either 4D or 4E, possibly combined with 4F.
4A. No action. The annual quota is divided among three 4-month trimesters, with the initial T2 (T2,
May through August) allocation set at 17% of the annual quota (8.4 million pounds in 2017-2018).
Any underages for T1 that are greater than 25 percent will be reallocated to Trimesters 2 and 3 (split
equally between both trimesters) of the same year. The reallocation is limited, such that T2 may only
be increased by 50 percent; the remaining portion of the underage will be reallocated to T3. Any
underages for T1 that are less than 25 percent of the T1 quota will be applied to T3 of the same year.
Any overages for T1 and T2 will be subtracted from T3 of the same year. This means that the post-
rollover T2 quota can be as high as 12.6 million pounds (8.4 plus (half of 8.4) = 12.6). Also, the trip
limit in Federal waters after a Trimester closure is 2,500 pounds.
4B. Eliminate roll-over of longfin squid quota from T1 to T2 (all un-caught T1 quota would go to T3).
Compared to the no action, this could reduce the available quota in T2 but increase the available quota
in T3. However, squid are highly mobile and availability can be fleeting, so there is no guarantee that
squid not caught in T2 would be available for harvest in T3. Currently approximately 4.2 million
pounds of longfin squid can be rolled over from T1 to T2. If that squid can no longer be rolled-over, at
2016 prices that could amount to approximately $5.2 million in lost revenues in years with roll-over
and sufficient T2 squid abundance/availability if the squid cannot be caught later in the year. This is a
real possibility due to the variable nature of squid abundance and availability. If more squid can be
caught later in the year, then this alternative would result in a transfer in revenues from the smaller
vessels that tend to fish inshore in the summer to those vessels that are active late in the year, which
are generally the larger offshore vessels. If catching less squid in any given T2 leads to increased
squid productivity (through there being more squid to spawn or better hatching of eggs due to less
bottom trawling on spawning grounds), there could be benefits related to higher future commercial
catches, improved recreational opportunities (fishing/whale-watching), or additional ecosystem
services via squid’s role in the ecosystem. However, since the quantitative relationships between
catching roll-over squid and the general abundance/productivity of squid are not known, these possible
69
benefits from reduced squid fishing cannot be quantified. The analyses above regarding negative
correlations between squid fishing effort in one time period and catch per unit of effort in the
subsequent time period do suggest that limiting catch in T2 will have a general positive effect on future
squid abundance in the following winter however, and spreading out catch throughout the year to some
degree is advisable given the short-lived and overlapping micro-cohort characteristics of longfin squid.
There is not sufficient assessment information available however to suggest what the optimum amount
in each Trimester should be in terms of maximizing productivity. Because of the higher encounter rate
with squid egg mops in the summer, negative impacts to productivity from fishing may be greater
during T2.
Compared to 4C, this alternative would have more impacts, both in terms of potential immediate lost
revenues and potential future gains. Impacts would be additive to 4D/4E/4F.
4C. Reduce the maximum T1 to T2 rollover of longfin squid quota to 25% of the original T2 quota.
The initial T2 quota is approximately 8.4 million pounds, so the maximum after rollover would be
about 10.5 million pounds in T2.
Compared to the no action, this could reduce the available quota in T2 but increase the available quota
in T3. However, squid are highly mobile and availability can be fleeting, so there is no guarantee that
squid not caught in T2 would be available for harvest in T3. Currently approximately 4.2 million
pounds of longfin squid can be rolled over from T1 to T2. If half of that squid can no longer be rolled-
over, at 2016 prices that could amount to approximately $2.6 million in lost revenues in years with
roll-over and sufficient T2 squid abundance/availability if the squid cannot be caught later in the year.
This is a real possibility due to the variable nature of squid abundance and availability. If more squid
can be caught later in the year, then this alternative would result in a transfer in revenues from the
smaller vessels that tend to fish inshore in the summer to those vessels that are active late in the year,
which are generally the larger offshore vessels. If catching less squid in any given T2 leads to
increased squid productivity (through there being more squid to spawn or better hatching of eggs due
to less bottom trawling on spawning grounds), there could be benefits related to higher future
commercial catches, improved recreational opportunities (fishing/whale-watching), or additional
ecosystem services via squid’s role in the ecosystem. However, since the quantitative relationships
between catching roll-over squid and the general abundance/productivity of squid are not known, these
possible benefits from reduced squid fishing cannot be quantified. The analyses above regarding
negative correlations between squid fishing effort in one time period and catch per unit of effort in the
subsequent time period do suggest that limiting catch in T2 will have a general positive effect on future
squid abundance in the following winter however, and spreading out catch throughout the year to some
degree is advisable given the short-lived and overlapping micro-cohort characteristics of longfin squid.
There is not sufficient assessment information available however to suggest what the optimum amount
in each Trimester should be in terms of maximizing productivity. Because of the higher encounter rate
with squid egg mops in the summer, negative impacts to productivity from fishing may be greater
during T2.
70
Compared to 4B, this alternative would have less impacts, both in terms of potential immediate lost
revenues and potential future gains. Impacts would be additive to 4D/4E/4F.
4D. Implement a 250-pound trip limit for all longfin squid permits with higher initial trip limits when
the T2 quota is predicted to be reached.
Compared to the no action, this alternative would reduce revenues in T2 in some years when T2 closes.
Directed fishing at a 2,500 pound trip limit does occur after closures and can lead to substantial T2
quota overages. For example, in T2 of 2016, an additional 6.1 million pounds of longfin squid beyond
the quota were caught post-closure when the federal limit was 2,500 pounds, generating approximately
$8 million in ex-vessel sales. While preliminary, about 99% of T2 landings in 2016 after the closure
date occurred on trips greater than 250 pounds and could be impacted by this alternative. However,
the same productivity concerns about rolling over squid into T2 would apply to T2 quota overages, as
the result is the same (more squid caught). In addition, Council staff received multiple reports from
some fishery participants about high-grade discarding of squid post-closure at the 2,500 pound trip
limit during T2 of 2016, which could further reduce future productivity. A disproportionate number of
2,500 pound trips during the closure supports that some amount of high-grade discarding was
occurring.
Based on consensus input from the Council’s Advisory Panel, it is expected that substantially less
directed fishing would occur in Federal waters if the trip limit is reduced to 250 pounds. If more squid
can be caught later in the year, then this alternative would result in a transfer in revenues from the
smaller vessels that tend to fish inshore in the summer to those vessels that are active late in the year,
which are generally the larger offshore vessels. If catching less squid in any given T2 leads to
increased squid productivity (through there being more squid to spawn or better hatching of eggs due
to less bottom trawling on spawning grounds), there could be benefits related to higher future
commercial catches, improved recreational opportunities (fishing/whale-watching), or additional
ecosystem services via squid’s role in the ecosystem. However, since the quantitative relationships
between catching roll-over squid and the general abundance/productivity of squid are not known, these
possible benefits from reduced squid fishing cannot be quantified. The analyses above regarding
negative correlations between squid fishing effort in one time period and catch per unit of effort in the
subsequent time period do suggest that limiting catch in T2 will have a general positive effect on future
squid abundance in the following winter however, and spreading out catch throughout the year to some
degree is advisable given the short-lived and overlapping micro-cohort characteristics of longfin squid.
There is not sufficient assessment information available however to suggest what the optimum amount
in each Trimester should be in terms of maximizing productivity. Because of the higher encounter rate
with squid egg mops in the summer, negative impacts to productivity from fishing may be greater
during T2. Compared to 4E, this alternative would have more impacts, both in terms of potential
immediate lost revenues and potential future gains. Impacts would be additive to 4B/4C/4F.
71
4E. Implement a 500-pound trip limit for all longfin squid permits with higher initial trip limits when
the T2 quota is predicted to be reached.
Compared to the no action, this alternative would reduce revenues in T2 in some years when T2 closes.
Directed fishing at a 2,500 pound trip limit does occur after closures and can lead to substantial T2
quota overages. For example, in T2 of 2016, an additional 6.1 million pounds of longfin squid beyond
the quota were caught post closure when the federal limit was 2,500 pounds, generating approximately
$8 million in ex-vessel sales. While preliminary, about 97% of T2 landings in 2016 after the closure
date occurred on trips greater than 500 pounds and could be impacted by this alternative. However,
the same productivity concerns about rolling over squid into T2 would apply to T2 quota overages, as
the result is the same (more squid caught). In addition, Council staff received multiple reports from
some fishery participants about high-grade discarding of squid post-closure at the 2,500 pound trip
limit during T2 of 2016, which could further reduce future productivity. A disproportionate number of
2,500 pound trips during the closure supports that some amount of high-grade discarding was
occurring.
Based on consensus input from the Council’s Advisory Panel, it is expected that substantially less
directed fishing would occur in Federal waters if the trip limit is reduced to 500 pounds. If more squid
can be caught later in the year, then this alternative would result in a transfer in revenues from the
smaller vessels that tend to fish inshore in the summer to those vessels that are active late in the year,
which are generally the larger offshore vessels. If catching less squid in any given T2 leads to
increased squid productivity (through there being more squid to spawn or better hatching of eggs due
to less bottom trawling on spawning grounds), there could be benefits related to higher future
commercial catches, improved recreational opportunities (fishing/whale-watching), or additional
ecosystem services via squid’s role in the ecosystem. However, since the quantitative relationships
between catching roll-over squid and the general abundance/productivity of squid are not known, these
possible benefits from reduced squid fishing cannot be quantified. The analyses above regarding
negative correlations between squid fishing effort in one time period and catch per unit of effort in the
subsequent time period do suggest that limiting catch in T2 will have a general positive effect on future
squid abundance in the following winter however, and spreading out catch throughout the year to some
degree is advisable given the short-lived and overlapping micro-cohort characteristics of longfin squid.
There is not sufficient assessment information available however to suggest what the optimum amount
in each Trimester should be in terms of maximizing productivity. Because of the higher encounter rate
with squid egg mops in the summer, negative impacts to productivity from fishing may be greater
during T2. Compared to 4D, this alternative would have less impacts, both in terms of potential
immediate lost revenues and potential future gains. Impacts would be additive to 4B/4C/4F.

72
4F. Split the T2 quota, with half available May 1, and the additional half available July 1. Open
access incidental and post-closure trip limits would remain as status quo or as specified in other
alternatives in this action.
Compared to the no action, splitting the T2 quota should not have a substantial impact on overall squid
catch since the time frame when catch would be shifted is minimal (perhaps by a month from June to
July within T2). However, Council staff received multiple reports from some fishery participants
about fish spoilage during the 2016 T2 season because processors could not keep up with landings. A
split T2 could slow the pace of landings and avoid such spoilage. However, the amount of spoilage
and any possible benefits to avoiding such spoilage cannot be quantified with the available
information.
THIS SPACE INTENTIONALLY LEFT BLANK

73
7.5.5 ALTERNATIVE SET 5: ILLEX SQUID MORATORIUM PERMIT REQUALIFICATION
ALTERNATIVES
Alternatives in this set could be selected in addition to alternatives in other sets or on their own if no
action is selected for other sets. This action would not allow new entrants to qualify for a moratorium
permit. The Council would only choose one alternative within this set.
5A. No action. No changes would be made to Illex moratorium permits.
Under no action, there would continue to be socioeconomic benefits to those who participate in the
Illex squid fishery. Participation in the Illex squid fishery is described in Section 6. It is possible that
an influx of effort could occur. This would benefit the new entrants but dilute the amount of quota
available to existing participants. In 2016 there were approximately 64 vessels with active permits and
approximately another 15 that had their permits/histories held in CPH. From 2014-2016 there were 4
of these vessels that derived at least 25% of their revenues from Illex, so there are some vessels that
appear somewhat dependent on the Illex squid fishery. Closures due to higher effort would be most
likely to impact those vessels most. The distribution of the 64 active vessels by principal port are
described in the table below.
Table 26. Principal Port States (PPST) of Currently-Active Illex Vessels
PPST Vessels
NJ 24
MA 12
RI 9
VA 7
NC 4
NY 4
CT 3
MD 1
From 1997-2015 Federal Moratorium vessels accounted for approximately 93% of Illex squid
landings, with almost all of the rest caught by vessels with incidental permits (this is an offshore
fishery, state-only landings are minimal).
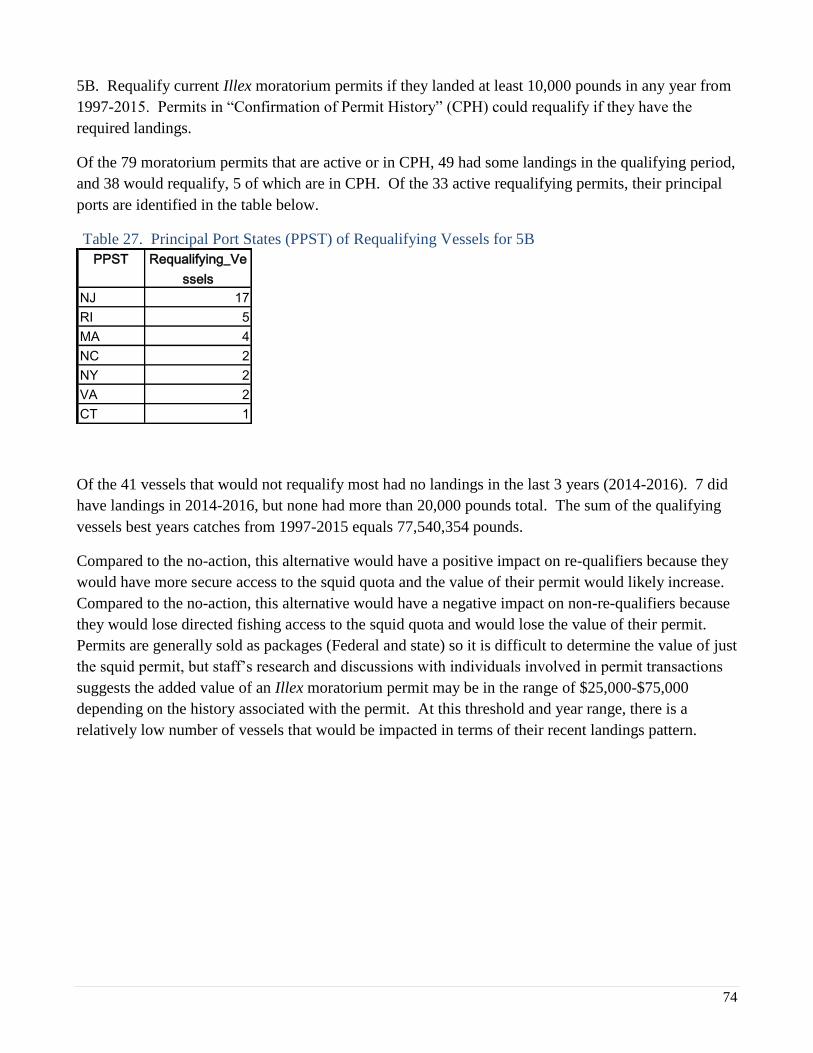
74
5B. Requalify current Illex moratorium permits if they landed at least 10,000 pounds in any year from
1997-2015. Permits in “Confirmation of Permit History” (CPH) could requalify if they have the
required landings.
Of the 79 moratorium permits that are active or in CPH, 49 had some landings in the qualifying period,
and 38 would requalify, 5 of which are in CPH. Of the 33 active requalifying permits, their principal
ports are identified in the table below.
Table 27. Principal Port States (PPST) of Requalifying Vessels for 5B
PPST Requalifying_Ve
ssels
NJ 17
RI 5
MA 4
NC 2
NY 2
VA 2
CT 1
Of the 41 vessels that would not requalify most had no landings in the last 3 years (2014-2016). 7 did
have landings in 2014-2016, but none had more than 20,000 pounds total. The sum of the qualifying
vessels best years catches from 1997-2015 equals 77,540,354 pounds.
Compared to the no-action, this alternative would have a positive impact on re-qualifiers because they
would have more secure access to the squid quota and the value of their permit would likely increase.
Compared to the no-action, this alternative would have a negative impact on non-re-qualifiers because
they would lose directed fishing access to the squid quota and would lose the value of their permit.
Permits are generally sold as packages (Federal and state) so it is difficult to determine the value of just
the squid permit, but staff’s research and discussions with individuals involved in permit transactions
suggests the added value of an Illex moratorium permit may be in the range of $25,000-$75,000
depending on the history associated with the permit. At this threshold and year range, there is a
relatively low number of vessels that would be impacted in terms of their recent landings pattern.

75
5C. Requalify current Illex moratorium permits if they landed at least 10,000 pounds in any year from
1997-2013. Permits in “Confirmation of Permit History” (CPH) could requalify if they have the
required landings.
Of the 79 moratorium permits that are active or in CPH, 47 had some landings in the qualifying period,
and 37 would requalify, 5 of which are in CPH. Of the 32 active requalifying permits, their principal
ports are identified in the table below.
Table 28. Principal Port States (PPST) of Requalifying Vessels for 5C
PPST Requalifying_Ve
ssels
NJ 17
RI 5
MA 3
NC 2
NY 2
VA 2
CT 1
Of the 42 vessels that would not requalify most had no landings in the last 3 years (2014-2016). 8 did
have landings in 2014-2016, but only 1 had more than 20,000 pounds total (About 92,000 pounds).
The sum of the qualifying vessels best years catches from 1997-2015 equals 77,448,424 pounds.
Compared to the no-action, this alternative would have a positive impact on re-qualifiers because they
would have more secure access to the squid quota and the value of their permit would likely increase.
Compared to the no-action, this alternative would have a negative impact on non-re-qualifiers because
they would lose directed fishing access to the squid quota and would lose the value of their permit.
Permits are generally sold as packages (Federal and state) so it is difficult to determine the value of just
the squid permit, but staff’s research and discussions with individuals involved in permit transactions
suggests the added value of an Illex moratorium permit may be in the range of $25,000-$75,000
depending on the history associated with the permit. At this threshold and year range, there is a
relatively low number of vessels that would be impacted in terms of their recent landings pattern.
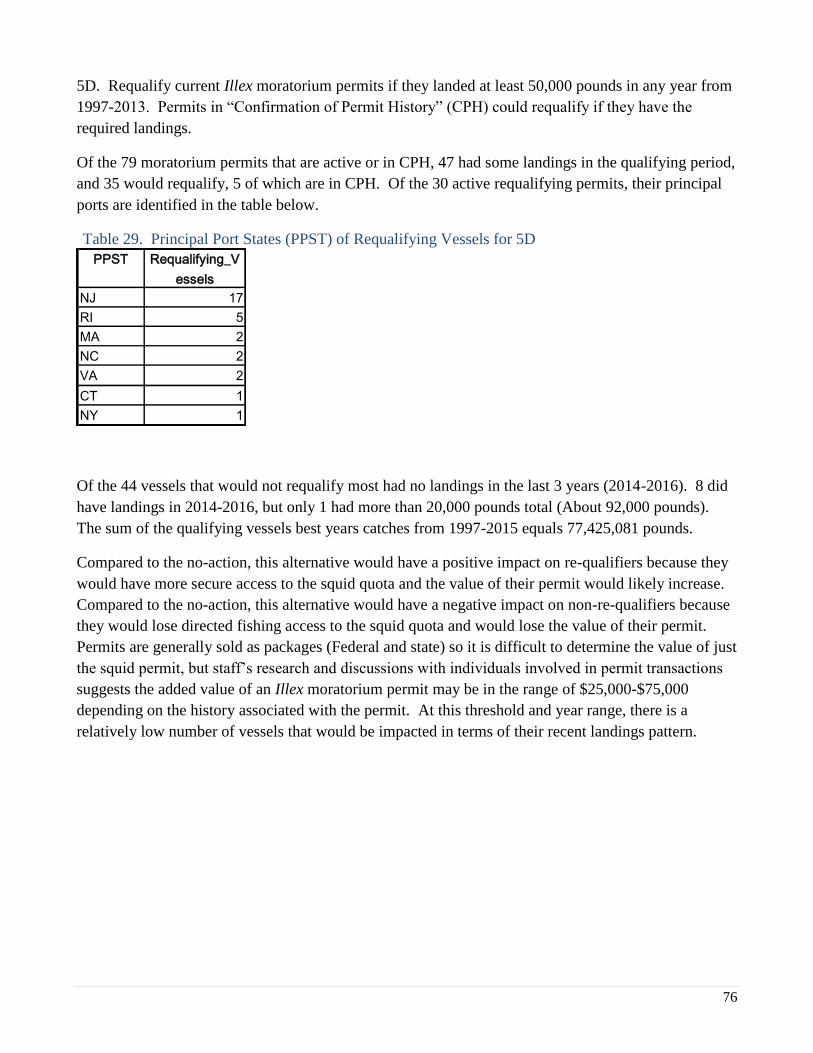
76
5D. Requalify current Illex moratorium permits if they landed at least 50,000 pounds in any year from
1997-2013. Permits in “Confirmation of Permit History” (CPH) could requalify if they have the
required landings.
Of the 79 moratorium permits that are active or in CPH, 47 had some landings in the qualifying period,
and 35 would requalify, 5 of which are in CPH. Of the 30 active requalifying permits, their principal
ports are identified in the table below.
Table 29. Principal Port States (PPST) of Requalifying Vessels for 5D
PPST Requalifying_V
essels
NJ 17
RI 5
MA 2
NC 2
VA 2
CT 1
NY 1
Of the 44 vessels that would not requalify most had no landings in the last 3 years (2014-2016). 8 did
have landings in 2014-2016, but only 1 had more than 20,000 pounds total (About 92,000 pounds).
The sum of the qualifying vessels best years catches from 1997-2015 equals 77,425,081 pounds.
Compared to the no-action, this alternative would have a positive impact on re-qualifiers because they
would have more secure access to the squid quota and the value of their permit would likely increase.
Compared to the no-action, this alternative would have a negative impact on non-re-qualifiers because
they would lose directed fishing access to the squid quota and would lose the value of their permit.
Permits are generally sold as packages (Federal and state) so it is difficult to determine the value of just
the squid permit, but staff’s research and discussions with individuals involved in permit transactions
suggests the added value of an Illex moratorium permit may be in the range of $25,000-$75,000
depending on the history associated with the permit. At this threshold and year range, there is a
relatively low number of vessels that would be impacted in terms of their recent landings pattern.
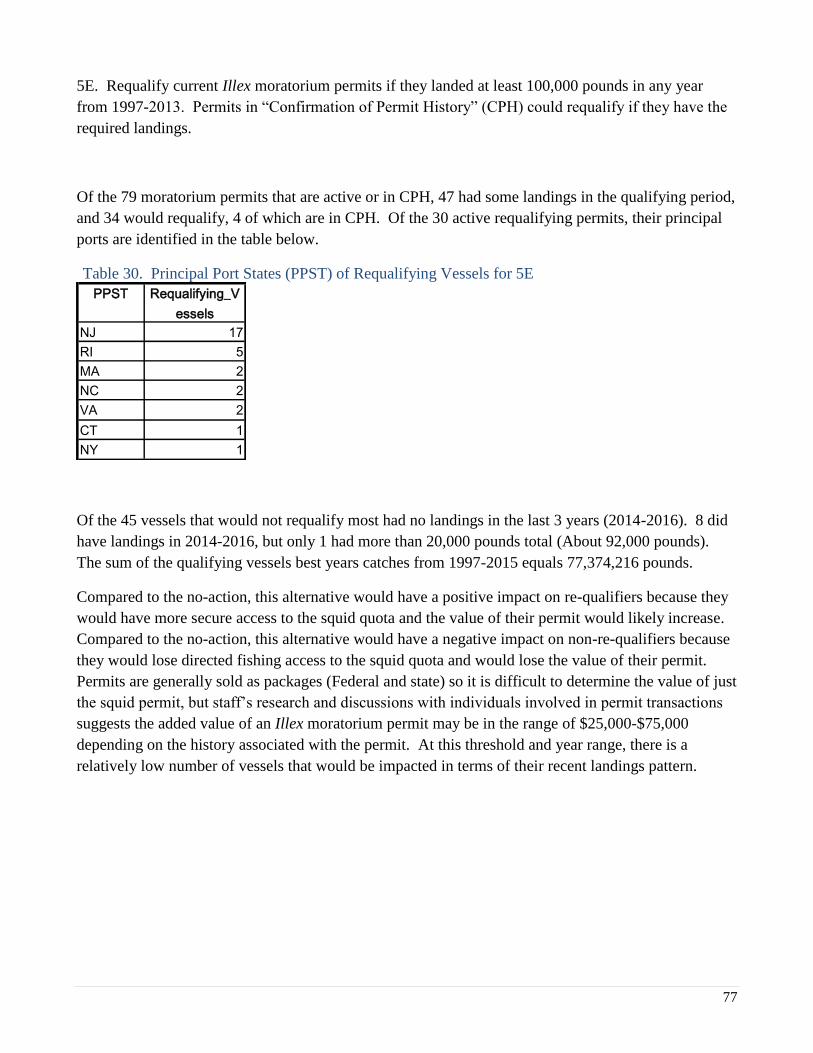
77
5E. Requalify current Illex moratorium permits if they landed at least 100,000 pounds in any year
from 1997-2013. Permits in “Confirmation of Permit History” (CPH) could requalify if they have the
required landings.
Of the 79 moratorium permits that are active or in CPH, 47 had some landings in the qualifying period,
and 34 would requalify, 4 of which are in CPH. Of the 30 active requalifying permits, their principal
ports are identified in the table below.
Table 30. Principal Port States (PPST) of Requalifying Vessels for 5E
PPST Requalifying_V
essels
NJ 17
RI 5
MA 2
NC 2
VA 2
CT 1
NY 1
Of the 45 vessels that would not requalify most had no landings in the last 3 years (2014-2016). 8 did
have landings in 2014-2016, but only 1 had more than 20,000 pounds total (About 92,000 pounds).
The sum of the qualifying vessels best years catches from 1997-2015 equals 77,374,216 pounds.
Compared to the no-action, this alternative would have a positive impact on re-qualifiers because they
would have more secure access to the squid quota and the value of their permit would likely increase.
Compared to the no-action, this alternative would have a negative impact on non-re-qualifiers because
they would lose directed fishing access to the squid quota and would lose the value of their permit.
Permits are generally sold as packages (Federal and state) so it is difficult to determine the value of just
the squid permit, but staff’s research and discussions with individuals involved in permit transactions
suggests the added value of an Illex moratorium permit may be in the range of $25,000-$75,000
depending on the history associated with the permit. At this threshold and year range, there is a
relatively low number of vessels that would be impacted in terms of their recent landings pattern.

78
5F. Requalify current Illex moratorium permits if they landed at least 200,000 pounds in any year
from 1997-2013. Permits in “Confirmation of Permit History” (CPH) could requalify if they have the
required landings.
Of the 79 moratorium permits that are active or in CPH, 47 had some landings in the qualifying period,
and 33 would requalify, 4 of which are in CPH. Of the 29 active requalifying permits, their principal
ports are identified in the table below.
Table 31. Principal Port States (PPST) of Requalifying Vessels for 5F
PPST Requalifying_V
essels
NJ 17
RI 5
MA 2
VA 2
CT 1
NC 1
NY 1
Of the 46 vessels that would not requalify most had no landings in the last 3 years (2014-2016). 9 did
have landings in 2014-2016, but only 1 had more than 20,000 pounds total (About 92,000 pounds).
The sum of the qualifying vessels best years catches from 1997-2015 equals 77,263,237 pounds.
Compared to the no-action, this alternative would have a positive impact on re-qualifiers because they
would have more secure access to the squid quota and the value of their permit would likely increase.
Compared to the no-action, this alternative would have a negative impact on non-re-qualifiers because
they would lose directed fishing access to the squid quota and would lose the value of their permit.
Permits are generally sold as packages (Federal and state) so it is difficult to determine the value of just
the squid permit, but staff’s research and discussions with individuals involved in permit transactions
suggests the added value of an Illex moratorium permit may be in the range of $25,000-$75,000
depending on the history associated with the permit. At this threshold and year range, there is a
relatively low number of vessels that would be impacted in terms of their recent landings pattern.
79
8.0 LITERATURE CITED AND SELECTED BACKGROUND
DOCUMENTS
Adelman, W.J., Jr., Arnold, J.M., and Gilbert, D.L. 2013. Squid as Experimental Animals. Springer
Science & Business Media, N.Y., NY.
Arkhipkin, Alexander, I., Paul G. K. Rodhouse, Graham J. Pierce, Warwick Sauer, Mitsuo Sakai,
Louise Allcock, Juan Arguelles, John R. Bower, Gladis Castillo, Luca Ceriola, Chih-Shin Chen,
Xinjun Chen, Mariana Diaz-Santana, Nicola Downey, Angel F. González, Jasmin Granados Amores,
Corey P. Green, Angel Guerra, Lisa C. Hendrickson, Christian Ibáñez, Kingo Ito, Patrizia Jereb,
Yoshiki Kato, Oleg N. Katugin, Mitsuhisa Kawano, Hideaki Kidokoro, Vladimir V. Kulik, Vladimir
V. Laptikhovsky, Marek R. Lipinski, Bilin Liu, Luis Mariátegui, Wilbert Marin, Ana Medina,
Katsuhiro Miki, Kazutaka Miyahara, Natalie Moltschaniwskyj, Hassan Moustahfid, Jaruwat
Nabhitabhata, Nobuaki Nanjo, Chingis M. Nigmatullin, Tetsuya Ohtani, Gretta Pecl, J. Angel A.
Perez, Uwe Piatkowski, Pirochana Saikliang, Cesar A. Salinas-Zavala, Michael Steer, Yongjun Tian,
Yukio Ueta, Dharmamony Vijai, Toshie Wakabayashi, Tadanori Yamaguchi, Carmen Yamashiro,
Norio Yamashita & Louis D. Zeidberg. 2015. World squid fisheries. Rev. in Fish. Sci. & Aquacult.,
23:2, 92-252.
Beanlands, G.E. and Duinker, P.N. (1984) ‘An Ecological Framework for Environmental Impact
Assessment’, Journal of Environmental Management, 18: 267-277.
Boletzky Sv, Hanlon RT. 1983. A review of the laboratory maintenance, rearing and culture of
cephalopod molluscs. Mem Natl Mus Vic 44:147–187
Christensen, D.J., W.J. Clifford, P.G. Scarlett, R.W. Smith, and D. Zachea. 1979. A survey of the 1978
spring recreational fishery for the Atlantic mackerel, Scomber scombrus, in the Middle Atlantic region.
NMFS Sandy Hook Lab Report No. 78-43. 22 p.
Chetrick, Joel. 2006. Record Six-Month Exports of U.S. Frozen Mackerel to EU Eclipse 2005 Sales.
FAS Worldwide. United States Department of Agriculture, Foreign Agricultural Service. Available
online at: http://www.fas.usda.gov/info/fasworldwide/2006/10-2006/EUMackerel.pdf.
Cross, J.N., C.A. Zetlin, P.L. Berrien, D.L. Johnson, and C. McBride. 1999. Essential fish habitat
source document: Butterfish, Peprilus triacanthus, life history and habitat characteristics, NOAA Tech.
Memo. NMFS NE-145. 50 p.
Ecosystem Assessment Program (EAP). 2009. Ecosystem Assessment Report for the Northeast U.S.
Continental Shelf Large Marine Ecosystem. US Dept Commer, Northeast Fish Sci Cent Ref Doc. 09-
11; 61 p. Available from: National Marine Fisheries Service, 166 Water Street, Woods Hole, MA
02543-1026, or online at http://www.nefsc.noaa.gov/publications/crd/crd0911/crd0911.pdf.
Hanlon RT. 1990. Maintenance, rearing and culture of teuthoid and sepioid squids. In: Gilbert DL,
Adelman Jr WJ, Arnold JM (eds) Squid as experimental animals. Plenum Press, New York, pp 35–62.

80
Hendrickson, L. 2016. Report to the Mid-Atlantic Fishery Management Council: Fishery and
Survey Data Updates Regarding the Northern Shortfin Squid (Illex illecebrosus) and Longfin Inshore
Squid (Doryteuthis (Amerigo) pealeii) stocks through 2015. 29 pp.
Hendrickson, L. C., and E. M. Holmes. Essential fish habitat source document: northern shortfin squid,
Illex illecebrosus, life history and habitat characteristics, 2nd Ed. NOAA Tech. Memo. NMFS-NE-
191.Iglesias, José, Fuentes, Lidia, Villanueva, Roger, Editors. 2014. Cephalopod Culture. Springer
Netherlands. Chapter: Vidal, Erica et al. Loligo vulgaris and Doryteuthis opalescens.
Jacobson, L.D. 2005. Essential fish habitat source document: Longfin inshore squid, Loligo Pealei ,
life history and habitat characteristics (2nd edition) NOAA Tech. Memo. NMFS NE-193. 52 p.
Johnson, M.R., C. Boelke, L.A. Chiarella, P.D. Colosi, K. Greene, K. Lellis-Dibble, H. Ludemann, M.
Ludwig, S. McDermott, J. Ortiz, D. Rusanowsky, M. Scott, J. Smith 2008. Impacts to marine fisheries
habitat from nonfishing activities in the Northeastern United States. NOAA Tech. Memo. NMFS-NE-
209, 328 p.
Jones, Nicholas, and McCarthy, Ian, Editors. 2013. Aquaculture rearing techniques for the common
cuttlefish Sepia officinalis and the Atlantic bobtail squid Sepiola atlantica. SEAFARE project (project
number 2009-1/123). Work Funded under the European Union Atlantic Area Transitional Programme
(2007-2013).
Lenfest 2012. Pikitch, E. et al. 2012. Little Fish, Big Impact: Managing a Crucial Link in Ocean
Food Webs. Lenfest Ocean Program. Washington, DC. 108 pp. Available at:
http://www.oceanconservationscience.org/foragefish/.
Leos 1998. The Biological CCharacteristics fo the Monterey Bay Squid Catch and the Effect of a
Two-Day-Per-Week Fishing Closure. CalCOFI Report, Volume 39.
MAFMC 2008. Amendment 9 to the Atlantic Mackerel, Squid, and Butterfish Fishery Management
Plan. Available at: http://www.mafmc.org/fisheries/fmp/msb.
MAFMC 2010. Amendment 10 to the Atlantic Mackerel, Squid, and Butterfish Fishery Management
Plan. Available at: http://www.mafmc.org/fisheries/fmp/msb.
MAFMC 2014. Report of May 2014 SSC, available at http://www.mafmc.org/s/SSC-2014-May-
Report.pdf.
Miller T., Adams, C., and Rago, P. 2013. Feasible Bounds on Historic Butterfish Stock Size and
Fishing Mortality Rates from Survey and Catch Data. Report to the MAFMC SSC. Available at:
http://www.mafmc.org/ssc-meetings/2013/april-may.
Miller, T. and G. Shepard. 2011. Summary of Discard Estimates for Atlantic Sturgeon. Northeast
Fisheries Science Center, Population Dynamics Branch, August 2011.

81
Moltschaniwskyj et al 2002. An assessment of the use of short-term closures to protect spawning
southern calamary aggregations from fishing pressure in Tasmania, Australia, Bulletin of Marine
Science, 2002, vol. 71 (pg. 501-514).
Murawski S.A. and G.T. Waring. 1979. A population assessment of butterfish, Peprilus triacanthus, in
the Northwest Atlantic Ocean. Tran. Am. Fish. Soc. 108(5): 427-439.
NEFSC 2004. Northeast Fisheries Science Center. 2004. Report of the 38th Northeast Regional Stock
Assessment Workshop (38th SAW): advisory report. Northeast Fish. Sci. Cent. Ref. Doc. 04-04; 24 p.
Available at: http://www.nefsc.noaa.gov/nefsc/publications/.
NEFSC 2005. 42nd Northeast Regional Stock Assessment Workshop (42nd SAW): 42nd SAW
assessment summary report. US Dep Commer, Northeast Fish Sci Cent Ref Doc. 06-01; 61 p.
Available at: http://www.nefsc.noaa.gov/publications/crd/crd0601/.
NEFSC 2010. Northeast Fisheries Science Center. 2010. 49th Northeast Regional Stock Assessment
Workshop (49th SAW) Assessment Report. US Dept Commer, Northeast Fish Sci Cent Ref Doc. 10-
01; 383 p. Available at: http://www.nefsc.noaa.gov/nefsc/publications/
NEFSC 2011. 51st Northeast Regional Stock Assessment Workshop (51st SAW) Assessment Report.
US Dept Commer, Northeast Fish Sci Cent Ref Doc. 11-01; 70 p. Available from: National Marine
Fisheries Service, 166 Water Street, Woods Hole, MA 02543-1026, or online at
http://nefsc.noaa.gov/publications/
NEFSC. 2014. 58th Northeast Regional Stock Assessment Workshop (58th SAW) Assessment Report.
US Dept Commer, Northeast Fish Sci Cent Ref Doc. 14-04; 784 p. Available from: National Marine
Fisheries Service, 166 Water Street, Woods Hole, MA 02543-1026, or online at
http://nefsc.noaa.gov/publications/crd/crd1404/.
NMFS. 1994. Report of 17th NEFSC Stock Assessment Workshop. NEFSC, Woods Hole Lab. Ref.
Doc. 94-03.
NMFS. 1996. Draft Report of the 20th Northeast Regional Stock Assessment Workshop, Northeast
Fishery Science Center. Woods Hole, MA.
NMFS. 1996. Report of the 21th Northeast Regional Stock Assessment Workshop, Northeast Fishery
Science Center. Woods Hole, MA. June 1996.
NMFS. 1998. Guidelines for Regulatory Analysis of Fishery Management Actions. Office of
Sustainable Fisheries, National Marine Fisheries Service, Silver Spring, Maryland 20910. Revised
April 15, 1998.
NMFS. 1999. Report of the 29th Northeast Regional Stock Assessment Workshop, Northeast Fishery
Science Center. Woods Hole, MA. June 1999.
82
NMFS 1999. Essential Fish Habitat Source Document: Butterfish, Peprilus triacanthus, Life History
and Habitat Characteristics. NOAA Technical Memorandum NMFS-NE-145. Available at:
http://www.nefsc.noaa.gov/nefsc/publications/tm/tm145/tm145.pdf.
NMFS. 2001. Report of the 34th Northeast Regional Stock Assessment Workshop, Northeast Fishery
Science Center. Woods Hole, MA. June 1999.
NMFS 2005. Final Environmental Impact Statement for Minimizing Impacts of the Atlantic Herring
Fishery on Essential Fish Habitat. NOAA/NMFS NE Regional Office, Gloucester, MA, 273 pp.
NMFS 2012. Year-end Butterfish Mortality Cap Report for the 2011 Fishing Year. Available at:
http://www.mafmc.org/meeting_materials/SSC/2012-05/3-2011-Butterfish-Cap-
Report%28May%202012%29.pdf.
NMFS 2013. ENDANGERED SPECIES ACT SECTION 7 CONSULTATION BIOLOGICAL
OPINION. Endangered Species Act Section 7 Consultation on the Continued Implementation of
Management Measures for the Northeast Multispecies, Monkfish, Spiny Dogfish, Atlantic Bluefish,
Northeast Skate Complex, Mackerel, Squid/Butterfish, and Summer Flounder/Scup/Black Sea Bass
Fisheries [Consultation No. F/NER/2012/01956].
NMFS 2014. Northeast Fisheries Observer Program: Incidental Take Reports. Omnibus data request +
supplemental data for 2013 from http://www.nefsc.noaa.gov/fsb/take_reports/nefop.html.
Okutani, T. 1977. Stock assessment of cephalopod resources fished by Japan. U.N. Food and
Agriculture Organization Fish. Tech. paper No. 173. 62 p.
Overholtz, W.J. 1989. Density-dependent growth in the Northwest Atlantic stock of Atlantic mackerel
(Scomber scombrus). J. Northw. Atl. Fish. Sci. (9):115-121.
W.J. Overholtz, J.A. Hare & C.M. Keith (2011): Impacts of Interannual Environmental Forcing and
Climate Change on the Distribution of Atlantic Mackerel on the U.S. Northeast Continental Shelf,
Marine and Coastal Fisheries, 3:1, 219-232
Patterson, K. (1992). Fisheries for small pelagic species: an empirical approach to management
targets. Reviews in Fish and Fisheries 2:321-338.
Pierce and Guerra 1994. Stock Assessment Methods Used for Cephalopod Fisheries. Fisheries
Research. Elsevier.
Shashar, Nadav and Hanlon, Rodger. 2013. Spawning behavior dynamics at communal egg beds in
the squid Doryteuthis (Loligo) pealeii. Journal of Experimental Marine Biology and Ecology 447
(2013) 65–74. Available at:
https://www.researchgate.net/profile/Roger_Hanlon/publication/275163046_Spawning_behavior_dyna
mics_at_communal_egg_beds_in_the_squid_Doryteuthis_Loligo_pealeii/links/56b216fd08aed7ba3fed
b656.pdf?origin=publication_list.
Stevenson D, Chiarella L, Stephan D, Reid R, Wilhelm K, McCarthy J, Pentony M. 2004.
Characterization of the fishing practices and marine benthic ecosystems of the Northeast
U.S. Shelf, and an evaluation of the potential effects of fishing on essential fish habitat.
83
Woods Hole (MA): National Marine Fisheries Service, Northeast Fisheries Science Center,
NOAA Technical Memorandum NMFS-NE-181. 179 p.
TRAC 2010. Transboundary Resources Assessment Committee (TRAC). TRAC Summary Report
(TSR). Available online at: http://www.mar.dfo-mpo.gc.ca/science/trac/tsr.html.
Vidal, Erica. 2002. Optimizing rearing conditions of hatchling loligbid squid. Marine Biology.
January 2002.
Vidal, Erica, Editor. 2014. Advances in Marine Biology Volume 67. Advances in Cephalopod
Science: Biology, Ecology, Cultivation, and Fisheries. Elsevier Academic Press. London, UK.
Waring, G. 1975. A preliminary analysis of the status of the butterfish in ICNAF subarea 5 and
statistical area 6. International Commission for the Northwest Atlantic Fisheries. Res. Doc. 74/74,
Dartmouth, Canada.
Wiedenmann, J. 2015. Application of data-poor harvest control rules to Atlantic mackerel. Report to
the Mid-Atlantic Fishery Management Council. 52pp. Available at: http://www.mafmc.org/ssc-
meetings/2015/may-13-14.
THIS IS THE END OF THE DOCUMENT