square pulse galvanostatic synthesis and characterization
TRANSCRIPT
Int. J. Electrochem. Sci., 12 (2017) 1492 – 1505, doi: 10.20964/2017.02.50
International Journal of
ELECTROCHEMICAL SCIENCE
www.electrochemsci.org
Square Pulse Galvanostatic Synthesis and Characterization of
Nano- Copper Oxide
Hassan Karami1,2,*
, Boshra Afshari2
1Department of Chemistry, Payame Noor University, 19395-4697, Tehran, I.R. of Iran
2Nano Research Laboratory, Department of Chemistry, Payame Noor University, Abhar, Iran
*E-mail: [email protected]
Received: 27 June 2016/ Accepted: 28 August 2016 / Published: 30 December 2016
In this study, the copper oxide nanoparticles are synthesized by the square pulse galvanostatic method
(SPGM) through anodic oxidation of copper electrode in sodium sulfate solution. The released Cu2+
ions are precipitated slowly as Cu(OH)2 nanoparticles. In the temperature more than 40 ºC, the copper
hydroxide is decomposed to CuO nanoparticles. The electrochemical cell includes one copper positive
electrode (anode) and two copper negative electrodes (cathodes) in the sodium sulfate solution as
electrolyte. The effects of some parameters such as solution temperature, electrolyte concentration,
pule time, relaxation time and pulse amplitude were studied and optimized. The optimum conditions
for the electrosynthesis of copper oxide nanoparticles includes 1x10⁻⁴
M sodium sulfate solution, the
square pulse amplitude of 20 mA cm-2
, pulse time of 2 s, relaxation time of 1 s and temperature of
60°C. The produced samples are filtered and washed 3 times with water and finally with acetone and
then dried at 600°C for 1 h. The prepared samples are characterized by SEM, TEM and XRD
techniques. The experimental data show the optimized copper oxide sample includes uniform
CuOnanorods with 35 nm average diameter and 550 nm average length.
Keywords: Square pulse, galvanostatic, electrosynthesis, copper oxide, nanorods.
1. INTRODUCTION
In recent years, there is a lot of interest about the semiconductor nano- crystals because of their
properties such as increased chemical activity, a large surface area, electronic and optical properties as
compared to those of the bulk materials [1,2]. The transition semiconductors have wide applications in
various fields such as solar energy transformation, magnetic storage media, catalysis and electronics
[3–12]. Copper oxide as a transition metal oxides has shown particular chemical reactivity due to their
large surface areas and high dislocations [13]. CuO powder is a typical p type semiconductor with the
narrow band gap of 1.2 eV and has promising applications in many fields such as in the active catalyst

Int. J. Electrochem. Sci., Vol. 12, 2017
1493
[14,15], gas sensor [16-19], high efficiency thermal conducting material [20], magnetic recording
media [21] and in solar cell applications [22].
Recently, some methods have been reported for the preparation of CuO nano- crystals such as
co-implantation of metal and oxygen ions [23], thermal decomposition [24], the sonochemical
technique[25], sol- gel method [26], chemical solid state reaction at room temperature [27],
andlectrochemical method [28].
In this study, the copper oxide nanorods were synthesized by the square pulse galvanostatic
method (SPGM) through anodic oxidation of copper electrode in sodium sulfate solution. In this
method, the effects of synthesis parameters such as pulse amplitude (pulse height), pulse time,
relaxation time, electrolyte concentration and solution temperature. In this work, the effects of pulse
time, relaxation time and solution temperature were investigated and optimized by the "one factor at a
time" method.
2. EXPERIMENTAL
2.1. Materials
Sodium sulfate, glycerol, sodium dodecyl sulfate (SDS), Cetyltrimethyl ammonium bromide
(CTAB), Triton x-114 and acetone were purchased from Merck. The pure copper sheets (purity> %99.
5) were produced from Shaheed Bahonar copper Co. (Kerman, Iran). Double- distilled water was used
in all experiments.
2.2. Instrumental
All the electrochemical experiments were carried out by means of a pulse electrolyzer (BTE 06
model), were made by Karami technical group (KTG) in Iran.The structures of synthesized samples
were identified by Bruker XRD (D8 Adavance model) withcopper Kα incident radiation. Philips XL-30
SEM and Zeiss CEM902A TEM were used to study the morphology and particle size of the samples.
All SEM images were analyzed by Microstructure Measurement software to determine the average
particle size. Size distribution was studied by dynamic light scattering (DLS) method ((Malvern,
Zetasizer Nano ZS3600).
2.3. Electrosynthesis procedure
Before any electrode position, the copper electrodes were put in the concentrated HNO3 (65%
w/w) for 30 s and then washed with double- distilled water to remove any surface oxidized impurities
exposed to the air. Two copper cathodes were coupled with a copper anode, and immersed in sodium
sulfate solution. The pulsed current were applied at different rates for the direct anodic oxidizing of
copper electrode. The effects of the parameters such as pH, concentration of Na2S, type and
Int. J. Electrochem. Sci., Vol. 12, 2017
1494
concentration of the additive, the solution temperature, pulse time (ton), relaxation time (toff), and the
pulsed current amplitude were optimized by the "one at a time" method.
3. RESULTS AND DISCUSSION
3.1. Pulse characterization
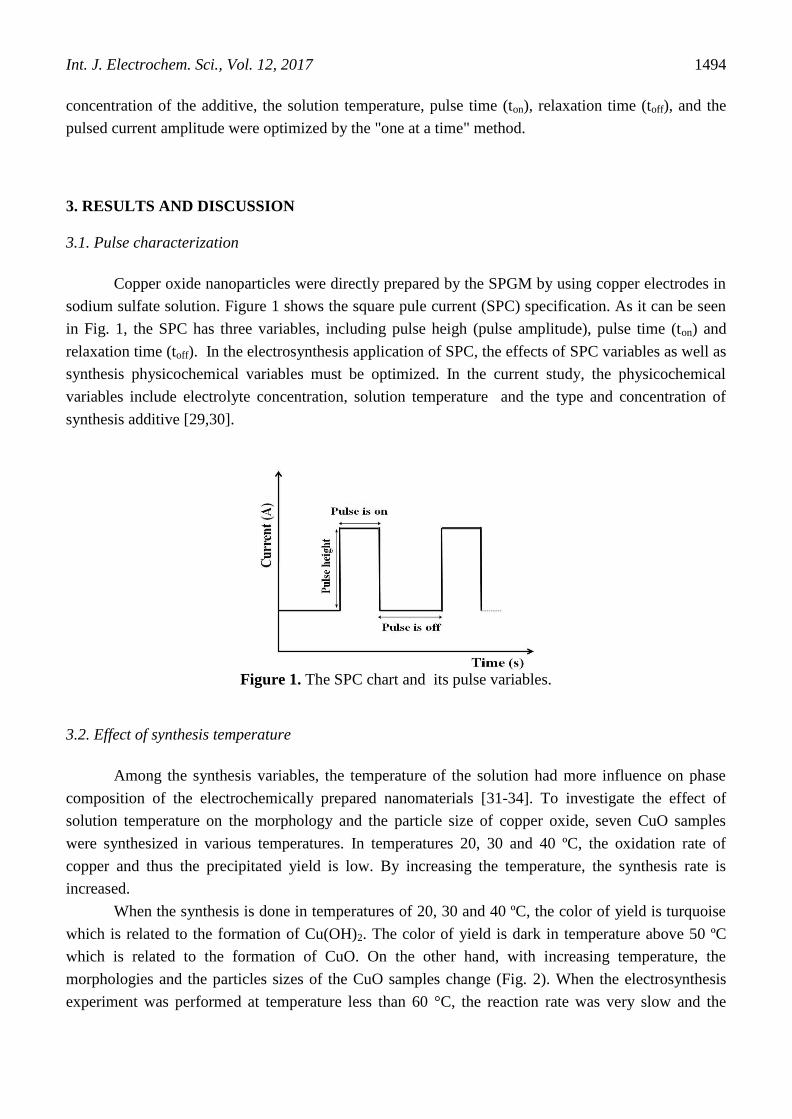
Copper oxide nanoparticles were directly prepared by the SPGM by using copper electrodes in
sodium sulfate solution. Figure 1 shows the square pule current (SPC) specification. As it can be seen
in Fig. 1, the SPC has three variables, including pulse heigh (pulse amplitude), pulse time (ton) and
relaxation time (toff). In the electrosynthesis application of SPC, the effects of SPC variables as well as
synthesis physicochemical variables must be optimized. In the current study, the physicochemical
variables include electrolyte concentration, solution temperature and the type and concentration of
synthesis additive [29,30].
Figure 1. The SPC chart and its pulse variables.
3.2. Effect of synthesis temperature
Among the synthesis variables, the temperature of the solution had more influence on phase
composition of the electrochemically prepared nanomaterials [31-34]. To investigate the effect of
solution temperature on the morphology and the particle size of copper oxide, seven CuO samples
were synthesized in various temperatures. In temperatures 20, 30 and 40 ºC, the oxidation rate of
copper and thus the precipitated yield is low. By increasing the temperature, the synthesis rate is
increased.
When the synthesis is done in temperatures of 20, 30 and 40 ºC, the color of yield is turquoise
which is related to the formation of Cu(OH)2. The color of yield is dark in temperature above 50 ºC
which is related to the formation of CuO. On the other hand, with increasing temperature, the
morphologies and the particles sizes of the CuO samples change (Fig. 2). When the electrosynthesis
experiment was performed at temperature less than 60 °C, the reaction rate was very slow and the

Int. J. Electrochem. Sci., Vol. 12, 2017
1495
synthesized nanoparticles were smaller than others but, not uniform. At temperatures higher than 60
ºC, the reaction was fast, but the prepared samples also show non-uniform particles with more
agglomeration. The results confirm that the copper oxide example, synthesized at 60°C has a
homogeneous morphology and small particle size. The average particle size of the sample synthesized
at 60 ºC is 64 nm.
Figure 2. The SEM images of copper oxide samples which synthesized at temperatures 20 ºC (a), 30
ºC (b), 40 ºC (c) 50 ºC (d), 60 ºC (e), 70 ºC (f) and 80 ºC (g); The other parameters were kept
constant as sodium sulfide 0.01 M, toff=1 s and ton=1 s.

Int. J. Electrochem. Sci., Vol. 12, 2017
1496
3.3. Effect of the current amplitude
In the chemical synthesis, the current amplitude is the main synthesis factor [29,30]. The
effects of the height of the pulsed current was investigated on the morphology and the particle size of
copper oxide samples. The amplitude of pulsed current varied from 5 to 77 mA cm-2
while, the other
parameters were kept constant (solution temperature of 60 °C, 0.01 M sodium sulfide, toff= 1 s and ton=
1 s). The synthesized copper oxide samples were characterized by SEM technique. Figure 3 shows the
SEM images of the resultant copper oxide samples in various amplitudes of the current pulse.
Figure 3. The SEM images of the synthesized copper oxide samples in various pulse amplitudes; 5
mA.cm-2
(a), 10 mA.cm-2
(b), 20 mA cm-2
(c), 39 mA.cm-2
(d) and 77 mA cm-2
(e). The other
experimental parameters were kept constant (solution temperature 60 °C, sodium sulfide 0.01
M, toff=1 s and ton=1 s).
Int. J. Electrochem. Sci., Vol. 12, 2017
1497
It is obvious in Fig. 3 that the sample morphology as well as particles sizes strongly changes by
variation in pulse height. Exerting of small current pulses causes to decrease the synthesis rate and
form the big particles [32, 34]. In pulse height of 20 mA cm-2
, the sample consists uniform and small
and nanoparticles. When the pulse heights above 20 mA cm-2
is used, the synthesis rate is increased.
Nevertheless, the synthesized copper oxide particles not only are not uniform and homogeneous, but
also are bigger than that’s about 20 mA cm-2
.
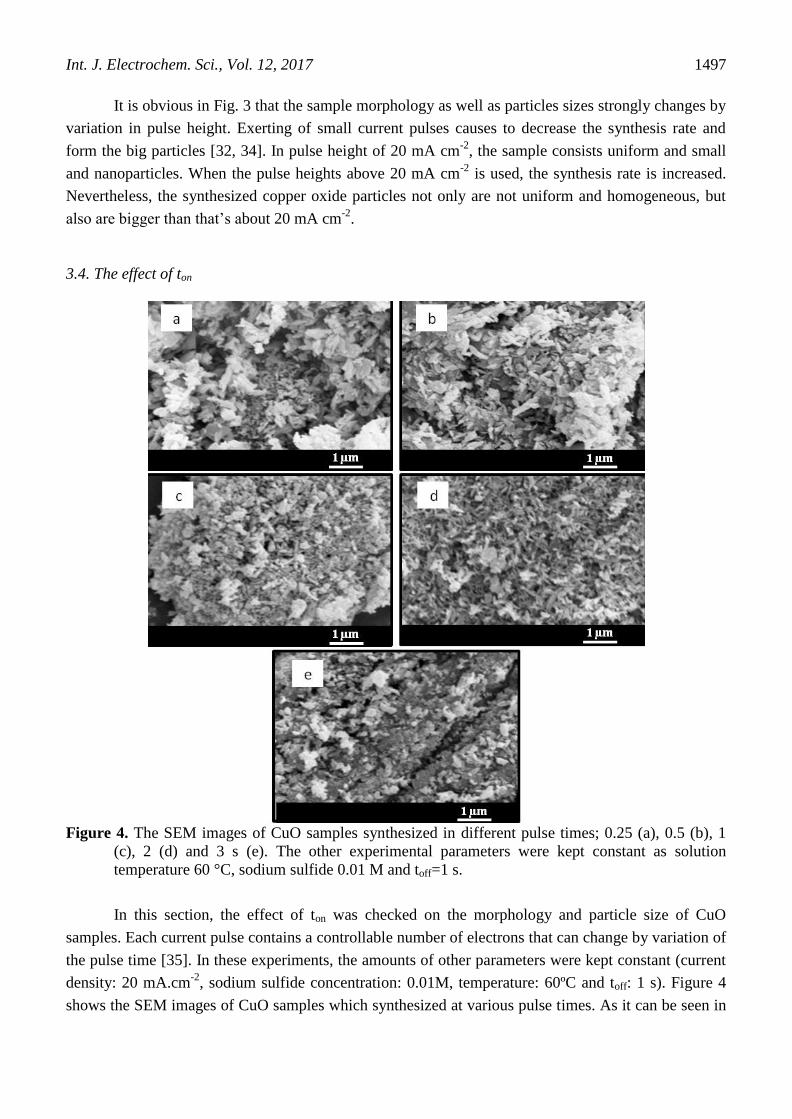
3.4. The effect of ton
Figure 4. The SEM images of CuO samples synthesized in different pulse times; 0.25 (a), 0.5 (b), 1
(c), 2 (d) and 3 s (e). The other experimental parameters were kept constant as solution
temperature 60 °C, sodium sulfide 0.01 M and toff=1 s.
In this section, the effect of ton was checked on the morphology and particle size of CuO
samples. Each current pulse contains a controllable number of electrons that can change by variation of
the pulse time [35]. In these experiments, the amounts of other parameters were kept constant (current
density: 20 mA.cm-2
, sodium sulfide concentration: 0.01M, temperature: 60ºC and toff: 1 s). Figure 4
shows the SEM images of CuO samples which synthesized at various pulse times. As it can be seen in

Int. J. Electrochem. Sci., Vol. 12, 2017
1498
Fig. 4, at 0.25 s pulse time, the CuO particles were synthesized without any specific morphology. At
the pulse time of 0.5 s, the particles become larger than those of 0.25 s without any uniform
morphology but, the nanoplates begin to form. As Fig. 4c shows, the synthesized sample contains the
small uniform nanoparticles somewhat. In the pulse time of 2 s, the particles size decrease and the
morphology of particles are more uniform than previous samples. At the pulse time of 3 s, as it can be
seen in Fig. 4f, the particles without uniform morphology are dispersed among the agglomerated
particles. It can be resulted that the mechanism of synthesis is changed by increasing the pulse time
and, more regular particles with better morphology are synthesized. However, with respect both
particle size and morphology, pulse time of 2 s was selected as the optimal value.
The summary of SEM results of five different CuO samples which were synthesized at the
different pulse times is shown in Table 1.
Table 1. The summary results of SEM studies of the five different CuO samples were synthesized in
five different pulse times.
shape Average of
diameter
Average of length ton Sample
Nanorod and
Nanorice
87
40
380
87
0.25 a
Nanorod 67 270 0.5 b
Spherical particle 64 - 1 c
Nanorod 56 213 2 d
Nanorod and
spherical particle
70
127
157
-
3 e
3.5. The effect of toff
The importance of this parameter was noted in some previous reports [29,30]. To study the
relaxation time effect, six synthesis was performed at different levels of toff. Figure 5 shows the SEM
images of the synthesized CuO samples at various relaxation times. As it can be seen in Fig. 5,
relaxation time as well as the previous variables can strongly change the CuO morphology. When
exerting a current pulse into the cell, copper atoms are oxidized and copper oxide nanoparticles are
formed. In relaxation time, the formed particles in the last current pulse can have a rearrangement in
particle morphologies. Based on Fig. 6d, at the relaxation time of 2 s, CuO nanorods can be formed
and selected as the best sample. The average particle size of all the samples was measured by the
Microstructure software. The obtained results were summarized in Table 2. The results show when the
relaxation time is increased, the morphology of CuO particles changes from spherical nanoparticles to
nanorod particles as well as their sizes change.

Int. J. Electrochem. Sci., Vol. 12, 2017
1499
Figure 5. The SEM images of CuO samples synthesized in various relaxation times; 0 (a), 0.25 (b), 0.5
(c), 1 (d) 1.5 (e), and 2 s (f). The other parameters were kept constant as solution temperature
60 °C, sodium sulfide0.01 M and ton=1 s.
At relaxation time above 1 s, uniform nanorods is rearranged into spherical nanoparticles.
Table 2. The morphology and particle size of six different CuO samples were synthesized in different
relaxation times.
shape Average of diameter Average of length toff sample
Spherical
clooney
72
485
- 0 a
Nanorod and
Spherical
72
52
163
-
0.25 b
Spherical and
clooney
60
288
- 0.5 c
Nanorod 56 205 1 d
Nanorod and
Spherical
25
72
190 1.5 e
Spherical 95 - 2 f

Int. J. Electrochem. Sci., Vol. 12, 2017
1500
3.6. Effect of sodium sulfate concentration
Figure 6. The SEM images of CuO samples which synthesized at sodium sulfide concentrations of
0.0001 M (a), 0.001 M (b), 0.005 M (c), 0.01 M (d), 0.1 M (e) and 0.5 M (f).
Table 3. Effect of electrolyte concentration on the morphology and particle size of CuO samples.
Shape Average diameter
(nm)
Average length
(nm)
Sodium
sulfate(M)
sample
Nanorod 30 521 0.0001 a
Nanodendrite 35 399 0.001 b
Nanodendrite and nanorod 40 266 0.005 c
Nanorod 45 482 0.01 d
Sub-microrod 75 214 0.1 e
Microrod 110 268 0.5 f
Int. J. Electrochem. Sci., Vol. 12, 2017
1501
For the investigation of the effects of electrolyte concentration on the particle size and
morphology of CuO samples, the amount of this parameter was changed from 0.0001 to 0.5 M while
the other parameters were kept constant. The SEM images of CuO examples synthesized in various
concentrations of sodium sulfide were shown in Fig. 6. In all previous samples, sodium sulfide
concentration was 0.01 M. Based on the previous results, CuO nanorods can be synthesized in 0.01 M
sodium sulfide solution (Fig. 5d and Fig. 6c). As Fig. 6 shows, electrolyte concentration has a strong
effect on the sample morphology. In pure water (without sodium sulfide), the cell potential increases
and the synthesis rate are negligible. In 0.0001 M sodium sulfide, synthesis rate is acceptable and the
nanodendrites are formed. By increasing the electrolyte concentration from 0.0001 to 0.01 M (Figs. 6a,
6b, 6c and 6d), the CuO nanodendrites slowly converted to nanorods. At electrolyte concentration
above than 0.01 M, the solution resistance and thus the cell potential are decreased during exerting
current pulse. Therefore, CuO nanorods grow and become bigger (microrod in Fig. 6f). The average
particles sizes of all samples of Fig. 6 were measured and the results were shown in Table 3.
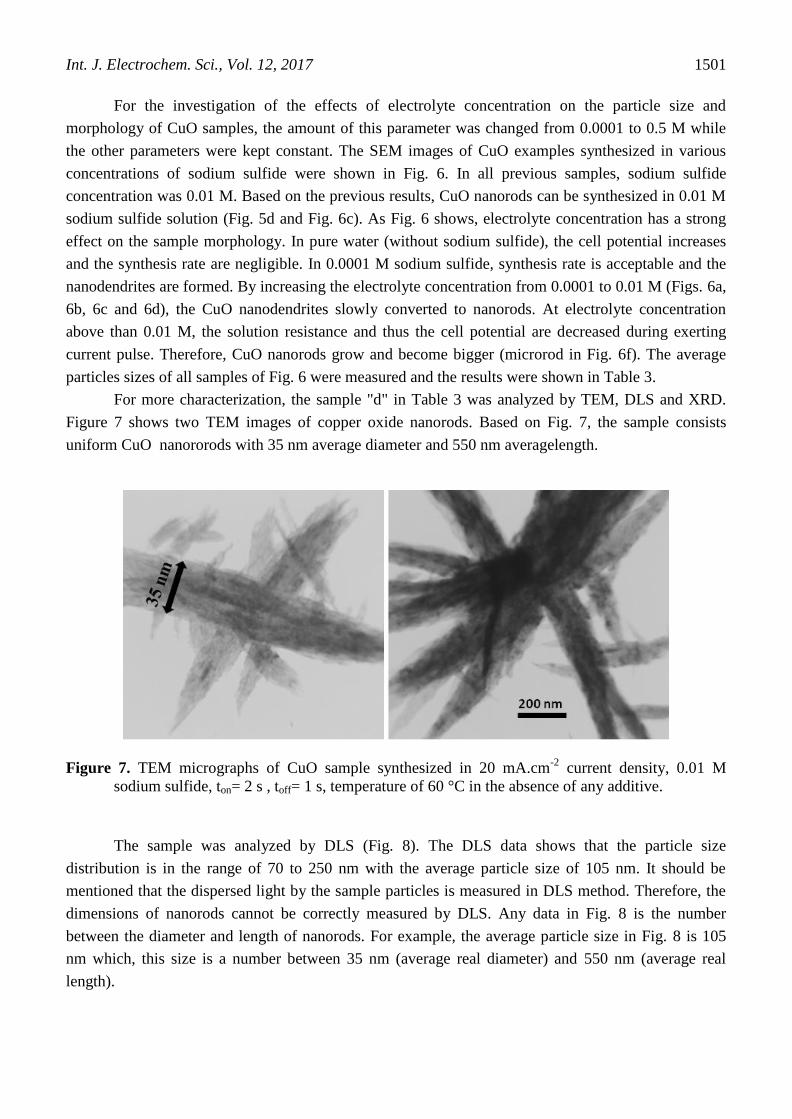
For more characterization, the sample "d" in Table 3 was analyzed by TEM, DLS and XRD.
Figure 7 shows two TEM images of copper oxide nanorods. Based on Fig. 7, the sample consists
uniform CuO nanororods with 35 nm average diameter and 550 nm averagelength.
Figure 7. TEM micrographs of CuO sample synthesized in 20 mA.cm-2
current density, 0.01 M
sodium sulfide, ton= 2 s , toff= 1 s, temperature of 60 °C in the absence of any additive.
The sample was analyzed by DLS (Fig. 8). The DLS data shows that the particle size
distribution is in the range of 70 to 250 nm with the average particle size of 105 nm. It should be
mentioned that the dispersed light by the sample particles is measured in DLS method. Therefore, the
dimensions of nanorods cannot be correctly measured by DLS. Any data in Fig. 8 is the number
between the diameter and length of nanorods. For example, the average particle size in Fig. 8 is 105
nm which, this size is a number between 35 nm (average real diameter) and 550 nm (average real
length).
Int. J. Electrochem. Sci., Vol. 12, 2017
1502
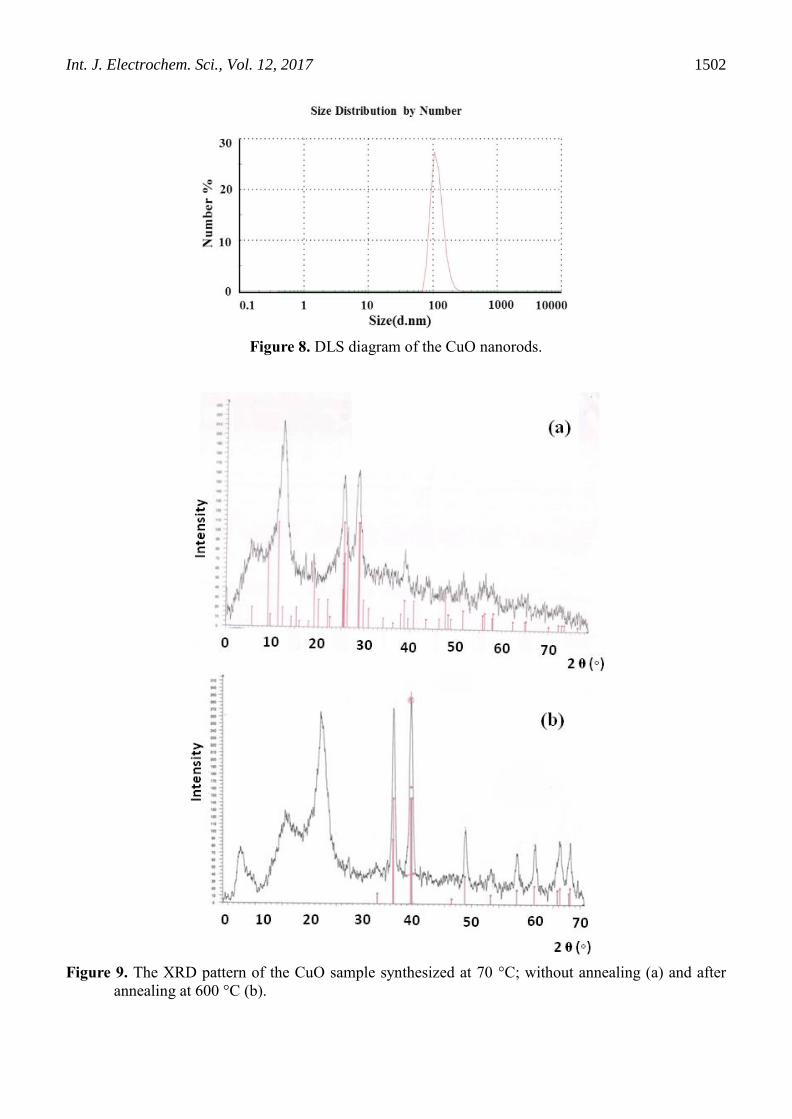
Figure 8. DLS diagram of the CuO nanorods.
Figure 9. The XRD pattern of the CuO sample synthesized at 70 °C; without annealing (a) and after
annealing at 600 °C (b).
Int. J. Electrochem. Sci., Vol. 12, 2017
1503
In XRD quantitative analysis, by comparing the integrated peaks of the known phases, their
fraction can be identified. Based on this method, the phase structure and the composition of the CuO
sample synthesized at 60 °C was twice characterized by XRD. In first time, the sample was
synthesized at 60° C, filtered and dried at 70 ºC for 24 h, and then, without any other thermal step was
analyzed by XRD (Fig. 9a).
In second time, the dried sample was annealed at 600 °C (Fig. 9b). The results show that the
sample without annealing step contains high amounts of impurity, but the annealed sample contains
only pure copper oxide (CuO). In annealing process, all impurities are converted into CuO.
Based on the main peak in XRD patterns (Fig. 9b; 2θ= 40) and by the Debye- Scherrer
equation, the average particle size was calculated 25 nm which confirmed by that's of TEM result.
3.7. The effect of synthesis additive
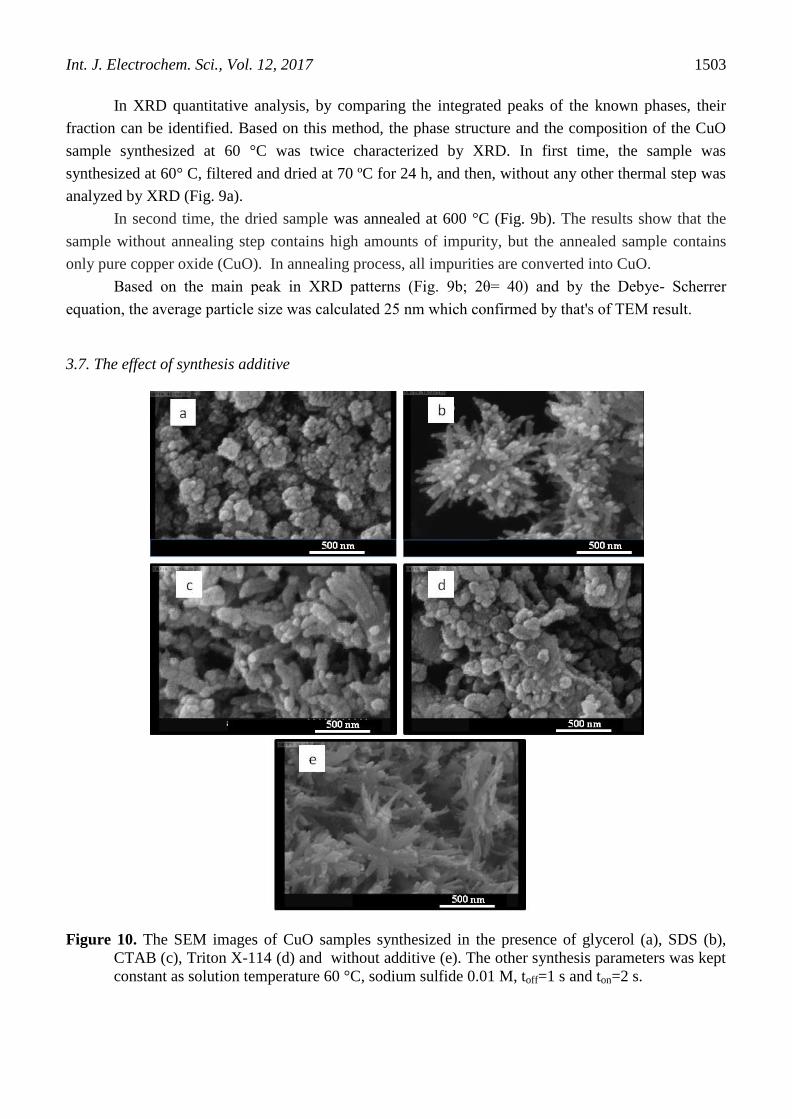
Figure 10. The SEM images of CuO samples synthesized in the presence of glycerol (a), SDS (b),
CTAB (c), Triton X-114 (d) and without additive (e). The other synthesis parameters was kept
constant as solution temperature 60 °C, sodium sulfide 0.01 M, toff=1 s and ton=2 s.

Int. J. Electrochem. Sci., Vol. 12, 2017
1504
Our previous studies shows some compounds like sodium dodecyl sulfate (SDS),
cetyltrimethyl ammonium bromide (CTAB), glycerol and Triton X-114 can be used as the manager of
structure to achieve more uniform nanomaterials [36-38].Therefore, the effects of all of the mentioned
additives were investigated on the morphology and the particle sizes of CuO. In these experiments, all
syntheses were done in sodium sulfate concentration of 0.0001 M. In Fig. 10, the SEM images of
CuOsamplessynthesized in the presence of different additives were shown. As it can be seen in Fig.
10, in the absence of any additive, the CuOsampleconsistsnanodendrites (Fig. 10e). The presence of
glycerol (Fig. 10a), SDS (Fig. 10b), CTAB (Fig. 10c) and Triton X-114 (Fig. 10d) in synthesis solution
of CuO causes to form agglomerated spherical nanoparticles. Based on the previous reports [36-38],
synthesis additives can change the nucleation and crystal growth rates. The obtained results showed
that the presence of additive does not have a positive effect on the synthesized samples, thus, the
CuOnanorodsshouldbesynthesizedwithoutany additive.
4. CONCLUSION
The presented results revealed that the square pulse galvanostatic method can be used as a
confidence and effective technique for the synthesis of various copper oxide nanostructures by the
direct anodic oxidation of the copper electrode in sodium sulfate. The times of pulse and relaxation
steps, sodium sulfate concentration, the amplitude of pulsed current and synthesis temperature are the
effective parameters can change the morphology and the particles sizes of the copper oxide samples.
By changing synthesis conditions, snow can be synthesized in different morphologies such as
nanoparticles, nanosheets, nanorods and etc.
ACKNOWLEDGEMENT
The authors would like to thank the financial support of this work by Abhar Payame Noor University
Research Council.
References
1. A. Henglein, Chem. Rev. 89 (1989) 1861.
2. A. Agfeldt, M. Gratzel, Chem. Rev. 95 (1995) 49.
3. E.P. Wolhfarth, Ferromagnetic Materials, Vol. II, NorthHolland, Amsterdam, New York, Oxford,
Tokyo, (1980) P. 405.
4. J.C. Mallinson, The Foundations of Magnetic Recording, Academic Press, Berkeley, CA, (1987),
Chapter 3.
5. F.N. Bradley, Materials for Magnetic Funtions, Hayden, New York, (1976), Chapter 2.
6. W. Oelerich, T. Klassen and R. Bormann, J. Alloys. Compd., 315 (2001) 237.
7. O. Regan, M. Gratzel, Nature 353 (1991) 737.
8. K. Naazeeruddin, A. Kay, M. Gratzel, J. Am. Chem. Soc. 115 (1993) 6832.
9. U. Bjoerksten, J. Moser, M. Gratzel, Chem. Mater. 6 (1994) 858.
10. W.P. Dow, T.J. Huang, J. Catal. 160 (1996) 171.
11. P.O. Larsson, A. Andersson, R.L. Wallengerg, B. Svensson, J. Catal. 163 (1996) 279.
12. Y. Jiang, S. Decker, C. Mohs, K.J. Klabunde, J. Catal. 180 (1998) 24.
13. A.E. Rakhshni, Solid State Electron. 29 (1986) 7.
Int. J. Electrochem. Sci., Vol. 12, 2017
1505
14. Y. Yecheskel, I. Dror, and B. Berkowitz, Chemosphere, 93 (2013) 172.
15. Q. Zhang, K. Zhang, D. Xu, G. Yang, H. Huang, F. Nie, C. Liu and S. Yang, Prog. Mater. Sci., 60
(2014) 208.
16. P. Raksa, A. Gardchareon, T. Chairuangsri, P. Mangkorntong, N. Mangkorntong, S. Choopun,
Ceramics Int., 35 (2009) 649.
17. A. Aslani, V. Oroojpour, Physica B: Cond. Mater., 406 (2011) 144.
18. M. Yang, J. He, X. Hu, C. Yan, Z. Cheng, Environ. Sci. Tech., 45 (2011) 6088.
19. Y. Li, J. Liang, Z. Tao, J. Chen, Mater. Res. Bull. 43 (2008) 2380.
20. X. Wang, X. Xu, S.U.S Choi, J. Thermophys. Heat Transfer 13 (1999) 474.
21. S.Ishio, T. Narisawa, S. Takahashi, Y. Kamata, S. Shibata, T. Hasegawa, Z. Yan, X. Liu, H.
Yamane, Y. Kondo and J. Ariake, J. Magn. Magn. Mater. 324 (2012) 295.
22. V. Kumar, S. Masudy-Panah, C. C. Tan, T. K. S. Wong, D. Z. Chi, G. K. Dalapati, Proceedings of
the IEEE 5th International Nanoelectronics Conference (INEC '13) (2013) 443.
23. S. Nakao, M. Ikeyama, T. Mizota, P. Jin, M. Tazawa, Y. Miyagawa, S. Miyagawa, S. Wang, L.
Wang, Rep. Res. Cent. Ion Beam Technol., Hosei Univ. Suppl. 18 (2000) 153.
24. J.Q. Yu, Z. Xu, D.Z. Jia, Chin. J. Functional Mater. Instrum. 5 (1999) 267.
25. R.V. Kumar, Y. Diamant, A. Gedanken, Chem. Mater. 12 (2000) 2301.
26. A.A. Eliseev, A.V. Lukashin, A.A. Vertegel, L.I. Heifets, A.I. Zhirov, Y.D. Tretyakov, Mater. Res.
Innovations 3 (2000) 308.
27. J.F. Xu, W. Ji, Z.X. Shen, S.H. Tang, X.R. Ye, D.Z. Jia, X.Q. Xin, J. Solid State Chem. 147 (2000)
516.
28. K. Borgohain, J.B. Singh, M.V. Rama Rao, T. Shripathi, S. Mahamuni, Phys. Rev. 61 (2000)
11093.
29. H. Karami, A. Yaghoobi, A. Ramezani, Int. J. Electrochem. Sci., 5 (2010) 1046. 30. H. Karami,M. Alipour, Int. J. Electrochem. Sci., 4 (2009) 1511.
31. J. Park, J. Kim, H. Kwon, H. Song, Adv. Mater. 21 (2009) 803.
32. H. Karami, O. Rostami-ostadKalayeh, J. Clus.Sci.(2009).
33. E. Mazario, M. P. Morales, R. Galindo,P. Herrasti, N. Menendez, J. Alloys Compd., 536, (2012)
222.
34. H. Karami, A. Kaboli, Int. J. Elctrochem. Sci., 5 (2010) 706.
35. G.p. Ocon, P. Herrasti, S. Rojas, Polymer. 42 (2001) 2439.
36. H. Karami, M. GhaleAsadi, M. Mansoori, Electrochim. Acta, 61 (2012) 154.
37. H. Karami, M.R. Hormozinezhad, S. Mohammadi, Nanosci. Nanotech. Ind. J., 2 (2008) 70.
38. H. Karami, Z. Bigdeli, S. Matini, Int. J. Elctrochem. Sci., 11 (2016) 3095.
© 2017 The Authors. Published by ESG (www.electrochemsci.org). This article is an open access
article distributed under the terms and conditions of the Creative Commons Attribution license
(http://creativecommons.org/licenses/by/4.0/).