sql tuning revisited roy boxwell, software engineering … · 25 years of missed opportunities? -...
TRANSCRIPT

25 years of missed opportunities? - SQL Tuning Revisited Roy Boxwell, SOFTWARE ENGINEERING GmbH
Session Code: V06 Tuesday, 17th November 11:30 Platform: z/OS DB2

AGENDA
1. Tuning SQL • How we have always done it • Single SQL, Package, Application… • Year 2004 – AP comparisons and simulation
2. Tuning SQL Revisited – A new methodology 3. Harvesting the low hanging fruit
2

Tuning SQL – How we have always done it
• Get an SQL from development • EXPLAIN it • Tune it if required • Stage to next Level (Dev -> QA, QA -> Prod) • Fire fight
3
Single SQL, Package, Application…
• Get an SQL, Package or list of Packages from development • Fight for (and against!) Dynamic SQL • EXPLAIN them all • See if any have gone belly up • Tune it if required and if you have the time • Stage to next Level (Dev -> QA, QA -> Prod) • Fire fight
4

Tuning SQL - Year 2004
• Get an SQL, Package or list of Packages from development • Propagate Production statistics down the environment
chain (Prod -> QA, Prod -> Dev) • Simulate Hardware, ZPARMS, and BUFFERPOOLS • Fight for (and against!) Dynamic SQL • EXPLAIN them all • Compare with existing Access Paths – Reject any that have
got worse • Tune it if required and if you have the time • Stage to next Level (Dev -> QA, QA -> Prod) • Fire fight
5

Tuning SQL Revisited
• Get *all* Dynamic and Static SQL running in the Plex • Propagate Production statistics down the environment
chain (Prod -> QA, Prod -> Dev) • Simulate Hardware, ZPARMS, and BUFFERPOOLS • EXPLAIN them all • Compare with existing Access Paths – Tune any that have
got worse • Pick the „low hanging fruit“
• Stage to next Level (Dev -> QA, QA -> Prod)
6

Tuning SQL Revisited
So how to get there?
1. Collect as much data as you can 2. Store it in a Data Warehouse 3. Analyze it 4. Take Actions!
7

Collect as much data as you can
• How many resources do you spend on capturing DB2 SQL workload and its metrics?
• There seems to be out-of-the-box metrics delivered by DB2, but does it give me all the data I need, when I need it?
• How does the smarter database, how does DB2 10, or 11 for z/OS deal with it?...
8

Collect as much data as you can
• DB2 10 Monitoring Enhancements and Changes: • Statement Level Statistics
• Enhanced messages and traces to capture statement level information • Statement information in real-time
• STMT_ID – unique statement identifier assigned when statement first inserted into DSC
• Statement type – static or dynamic • Bind TS – 10 byte TS when stmt was bound, or prepared • Statement level execution statistics (per execution)
• New Monitor class 29 for statement detail level monitoring • Monitor Class 29 (overhead is ~1-3%) • New for statement level detail
9

Collect as much data as you can What‘s exactly new since DB2 10: • IFCID 316 was enhanced to externalize the data from the
Dynamic Statement Cache (DSC) when a flushing situation occurs (LRU, RUNSTATs, ALTER, DROP, REVOKE, …) – NO DATA LOSS
• New IFCIDs 400* and 401 additionally EDM pool data – let’s call it the Static Statement Cache • Memory resident storage of static SQL statements • Like with the enhanced 316, data is externalized when the EDM
pool is full. – NO DATA LOSS
10

Collect as much data as you can
DSC and EDM provide detailed workload insights: • SQL text • Statement ID • Date/time • Current status • Resource consumption • Identification/environmental data
11
Who When What
Where

Collect as much data as you can
DB2 10 also introduced some additional information from the DSC IFCIDs we all know today: • Wait time accumulation for
• Latch requests • Page latches • Drain locks • Drains during waits for claims to be released • Log writers
12

Collect as much data as you can
• Date and time in store clock format for Stmt insertion and update (along with internal format)
• Number of times that • a RID list overflowed because of
• storage shortage • # of RIDs exceeded internal limit(s)
• a RID list append for a hybrid join interrupted • because of RID pool storage shortage • # of RIDs exceeded internal limit(s)
• a RID list retrieval failed for multiple IX access. The result of IX AND/OR-ing could not be determined
13

Collect as much data as you can
14

Store it in the WLX Data Warehouse
15
Captures the hard-to-get SQLs, even the ones that disappear …

Store it in the WLX Data Warehouse
• Capture the data using an STC: Runs as a started task 24x7 to catch all the IFCIDs that DB2 will be throwing and stores the data.
• Process the workload: Externalize and process the data, such as every 60 min:
• allow Ad hoc data refresh triggered via operator command for the started task (MODIFY)
• capture the SQL Text at trace time • gather additional catalog and RTS data • add explain data if needed 16

Store it in the WLX Data Warehouse Exploit and integrate into Eclipse based GUI front ends • GUIs can come as a Plug-in for
• IBM Rational • IBM Data Studio • Eclipse native
• Existing DB2 connections are used to connect to the mainframe
• Interactive dialogs allow complex and powerful analysis • Export features can create PDF reports and allow MS Excel
hand over • Additional plug-ins interface with other tools,
such as SQL PerformanceExpert (SPX) and Bind ImpactExpert (BIX)
17

Store it in the WLX Data Warehouse
The WLX Data Warehouse is a set of DB2 tables that can also be created in LUW on a x86 server (E.g. DB2 Express-C). • If this is done then you can simply unload from the z/OS
DB2 tables and then load the LUW Tables directly from within DataStudio which enables you to run all the analytics queries “locally”.
• This can obviously save a lot of space on the z/OS side! • And remember that all of the Type 4 JAVA SQL is ziiP
eligible!
18

Analyze it
19
button
Execute query Select query New
Copy
Edit
Save
Delete
Import/Export
SQL MS Excel export Selected database connection
GUI features – button overview

Analyze it
20
Various Use Case’s drop down box

Analyze it
21
Example of application workload and SQL text drill down

Analyze it
22
Compare view: Select any two SQLs for detailed comparison

Analyze it
23
Report generation dialog and selection
Harvesting the low hanging fruit
OK, so assuming you have all the data where shall we begin???
1. How about Intensive CPU?
24

Harvesting the low hanging fruit
The definition is simply the percentage of the CPU for a given period of time for an SQL. Here is two days of data:
As you can see one SQL executed over 20,000 times and soaked up the lion’s share of the machine! Drilling down reveals the SQL: WHERE KA_BEARB_ZK <> '1' AND KA_BEARB_ZK <> 'L' WITH CS
25

Harvesting the low hanging fruit
OK, so assuming you have all the data where shall we begin???
1. How about Intensive CPU? 2. What about by Application?
26

Harvesting the low hanging fruit
The Application definition is simply the Primary Authorization Id or the Collection/Package. Here is one snapshot of data: The average CPU is pretty high and the „highest“ is very high! Drilling on down: Only one execution for this guy and the SQL was a pretty horrible three table join with about 20 predicates.
27

Harvesting the low hanging fruit
• Here is a high CPU Static application: • Drill down to Package level:
28

Harvesting the low hanging fruit
• Drill down to SQL level:
• For every physical object a select from SYSSTOGROUP…
Rewrite to a LEFT OUTER JOIN and the problem is solved!
29

Harvesting the low hanging fruit
OK, so assuming you have all the data where shall we begin???
1. How about Intensive CPU? 2. What about by Application? 3. Auditing???
30

Harvesting the low hanging fruit Choose how you like to find out who did what and when…
31

Harvesting the low hanging fruit
Choose how you like to find out who did what and when…
32

Harvesting the low hanging fruit
OK, so assuming you have all the data where shall we begin???
1. How about Intensive CPU? 2. What about by Application? 3. Auditing? 4. Disk I/O Performance?
33

Harvesting the low hanging fruit
Any Wait time per synchronous IO over 0.002 seconds is bad:
For OLTP transactions any with more than one Synchronous IOs per statement is “sub optimal”! Drill down shows details:
34
Harvesting the low hanging fruit
OK, so assuming you have all the data where shall we begin???
1. How about Intensive CPU? 2. What about by Application? 3. Auditing? 4. Disk I/O Performance? 5. Up and Down Scaling?
35

Harvesting the low hanging fruit
Up and Down scaling is all about getting a “level playing field” when looking at the cache data. Simply displaying the data for SQLs that have been in the cache a week next to SQLs that have been in the cache for only 10 minutes is a bit biased!
Here you can easily see the “normal Top 10” values and the “adjusted” values. Your “Top 10” suddenly contains completely new candidates that you were *never* even aware of!
36

Harvesting the low hanging fruit
OK, so assuming you have all the data where shall we begin???
1. How about Intensive CPU? 2. What about by Application? 3. Auditing? 4. Disk I/O Performance? 5. Up and Down Scaling? 6. KPIs for your Enterprise?
37

Harvesting the low hanging fruit
Naturally all this data also lets you build up a great set of KPIs to keep track of how many, what type, and how CPU & I/O hungry everything is:
Not just CPU but GetPages etc. are also available.
38

Harvesting the low hanging fruit Then you can play with radar charts:
39

Harvesting the low hanging fruit
OK, so assuming you have all the data where shall we begin???
1. How about Intensive CPU? 2. What about by Application? 3. Auditing? 4. Disk I/O Performance? 5. Up and Down Scaling? 6. KPIs for your Enterprise? 7. Searching for SQL?
40

Harvesting the low hanging fruit
These days it is sometimes pretty neat to see what text is in the SQL. Currently two things spring to mind, first is CHAR9 usage and then dodgy Timestamp casting.
41

Harvesting the low hanging fruit
And then… Drill down to get a better view
42

Harvesting the low hanging fruit
OK, so assuming you have all the data where shall we begin???
1. Third How about Intensive CPU? 2. What about by Application? 3. Auditing? 4. Disk I/O Performance? 5. Up and Down Scaling? 6. KPIs for your Enterprise? 7. Searching for SQL? 8. Flushed with success?
43

Harvesting the low hanging fruit
If you are catching and storing all the SQL then you can easily see how good the size and performance of your cache is:
Rule of thumb is to make the EDMSTMTC as big as it can be! 200,000 is a good start! DB2 10 ranges are now from 5,000 to 1,048,576 with default 113,386 and in DB2 11 the highest is now 4,194,304 !!
44

Harvesting the low hanging fruit
OK, so assuming you have all the data where shall we begin???
1. How about Intensive CPU? 2. What about by Application? 3. Auditing? 4. Disk I/O Performance? 5. Up and Down Scaling? 6. KPIs for your Enterprise? 7. Searching for SQL? 8. Flushed with success? 9. Index Comparison?
45
Harvesting the low hanging fruit
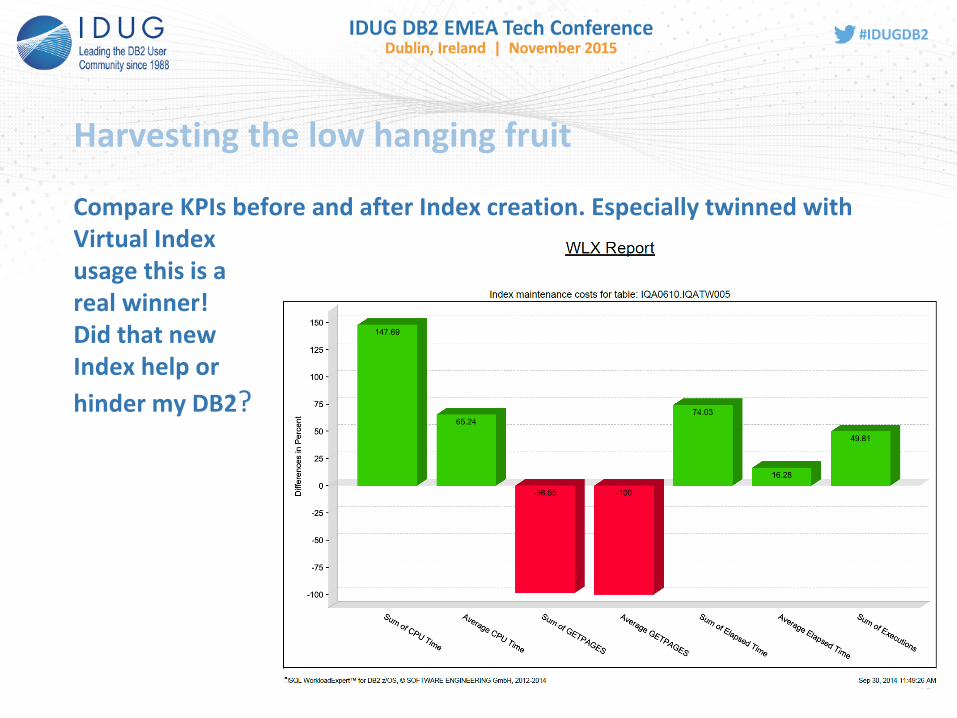
Compare KPIs before and after Index creation. Especially twinned with Virtual Index usage this is a real winner! Did that new Index help or hinder my DB2?
46

Harvesting the low hanging fruit OK, so assuming you have all the data where shall we begin???
1. How about Intensive CPU? 2. What about by Application? 3. Auditing? 4. Disk I/O Performance? 5. Up and Down Scaling? 6. KPIs for your Enterprise? 7. Searching for SQL? 8. Flushed with success? 9. Index Comparison? 10. Miscellaneous other possibilities…
47

Harvesting the low hanging fruit
Again, if you are catching and storing all the SQL then you can do:
1. Sub-system loading checking 2. Delay detection 3. Object Quiet Times – Alter & Reorg 4. Find all non-executed Packages - Free 5. Never executed SQLs within executed Packages - Delete 6. Never referenced Tables/Indexes - Drop 7. Select only usage of objects – Locksize tuning
48
Harvesting the low hanging fruit
Why stop with just these IFCIDs? We are extending the technology all the time so next on the list are: 172 – Deadlocks 196 – Timeouts 337 – Lock Escalations 359 – Index page Splits Already fully incorporated are: - 62,140,141 & 142 for all Audit Use Cases including DDL - 23,24,25,219 & 220 for all Utility Use Cases - 366 & 376 – BIF Usage
49

Harvesting the low hanging fruit
BIF Usage is a major area of concern and so how do you check what is currently running in your shop?
50

Harvesting the low hanging fruit
BIF Usage is a major area of concern and so how do you check what is currently running in your shop? We also have a Freeware BIF Checker software package so you can check your site *now* to see if you have a BIF problem!
51

Harvesting the low hanging fruit Some real world numbers to amaze and astound: • On one member of a Data Sharing group the SQLs that normally ran
fast were running 45% slower than on other members. After using WLX it was discovered that this member had orders of magnitude more updates – Increase Log Buffer, Active Log, and Archive Log sizes then redirect some traffic. Et Voila!
• 450,000,000 Get pages per hour saved! -- New index created which gave a knock on performance boost effect to the whole DB2 sub-system.
• CPU Reduction from 17,111 seconds per hour to 16 seconds per hour! – One “Bad Guy” query tuned.
• Elapsed time from 30,000 seconds per hour to 30 seconds per hour! – Another single SQL “Bad Guy” query tuned.
52

Appendix
DB2 APARs to check for: • PI07461 DB2 10 UI19041 DB2 11 UI19042 – Incons. QA0401EU, GL and GP • PI09147 DB2 10 UI15679 DB2 11 UI15680 – Abend S04E • PI09408 DB2 10 UI15740 DB2 11 UI15741 – Abend S04E • PI09788 DB2 11 UI15739 – SOS with IFCID400 • PI16183 DB2 10 UI18350 DB2 11 UI18352 - Missing IFCID401 • PI18260 DB2 11 UI20560 – QA0401EXR is not initialized • PI35766 DB2 11 UI31693 – Elapsed time incorrect for parallel queries • PI46967 DB2 10 UI31646 DB2 11 UI31647 – Invalid IFCID 401 after IDAA
APAR PI23083/PI30005
53

Roy Boxwell SOFTWARE ENGINEERING GmbH [email protected]
25 years of missed opportunities?
V06 - SQL Tuning Revisited
Please fill out your session evaluation before leaving!