spwla-1972-a neglected sp curve
DESCRIPTION
SPWLA-1972-A Neglected SP CurveTRANSCRIPT

SPWLA THIRTEENTH ANNUAL LOGGING SYMPOSIUM, MAY 7.10, 1972
THE NEGLECTED SP CURVE
S. J. Pirson F. S. Wong K. Y.
University of Texas Ministry of Mines and Hydrocarbons
Austin, Texas 78712 Caracas, Venezuela
Abstract
From its inception, the SP curve has consistently been run with un- stable electrodes; some less unstable than others such as the lead elec- trodes and some absolutely worthless such as the iron electrodes. It is shown that base line drifts are a function of the electrode metal, the formation temperature and the mud composition. Great improvements in the SP curves would be realized by the use of pressure compensated reference electrodes such as Ag-Ag Cl. In addition SP curve interpretation has been hampered by the universal use of the Nernst's fallacious concept that electron transfer at the electrodes are thermodynamically reversible.
Discussion
Investigations of the SP have revealed it to be influenced by the combination of electrochemical, streaming (or electrokinetic) and contact potentials. In conventional log interpretation, only electrochemical potential components are considered. Electrochemical potentials are a combination of diffusion and of thermodynamic (membrane) potentials. Usually, little or no significance is given to electrokinetic and to elec- trode contact potentials although the measurement of the streaming poten- tial was the original intent of the self potential measurements in well logging.
The introduction of drilling mud or water in a bore hole creates a condition which is responsible for the relatively large potentials observed in rotary-drilled wells. For an efficient use of the SP curve of electric logs, it is necessary not only to understand the influence of each perti- nent factor, but also to be aware of the role which the SP electrode plays in the generation of the bore hole potentials.
In the practice of well logging, the actual SP electrodes used are made of metal (iron, lead, etc.) Since electrode potentials are found at the boundary between a metal and an electralyte, in the case of the SP elec- trode on a logging sonde in contact with drilling-mud, electrode potentials are also generated.
The electrode potentials vary with the nature of the metal, with the electrolyte, with concentrations, with common ions, etc. Variations in electrode potential may account for some of the electromotive forces (emf) measured in the SP curve when the well is not properly circulated before logging, when differences in salinity exist in the well water or when elec- trodes are not given sufficient time to come into equilibrium with well fluid.
-l-
SPWLA THIRTEENTH ANNUAL LOGGING SYMPOSIUM, MAY 7-10, 1972
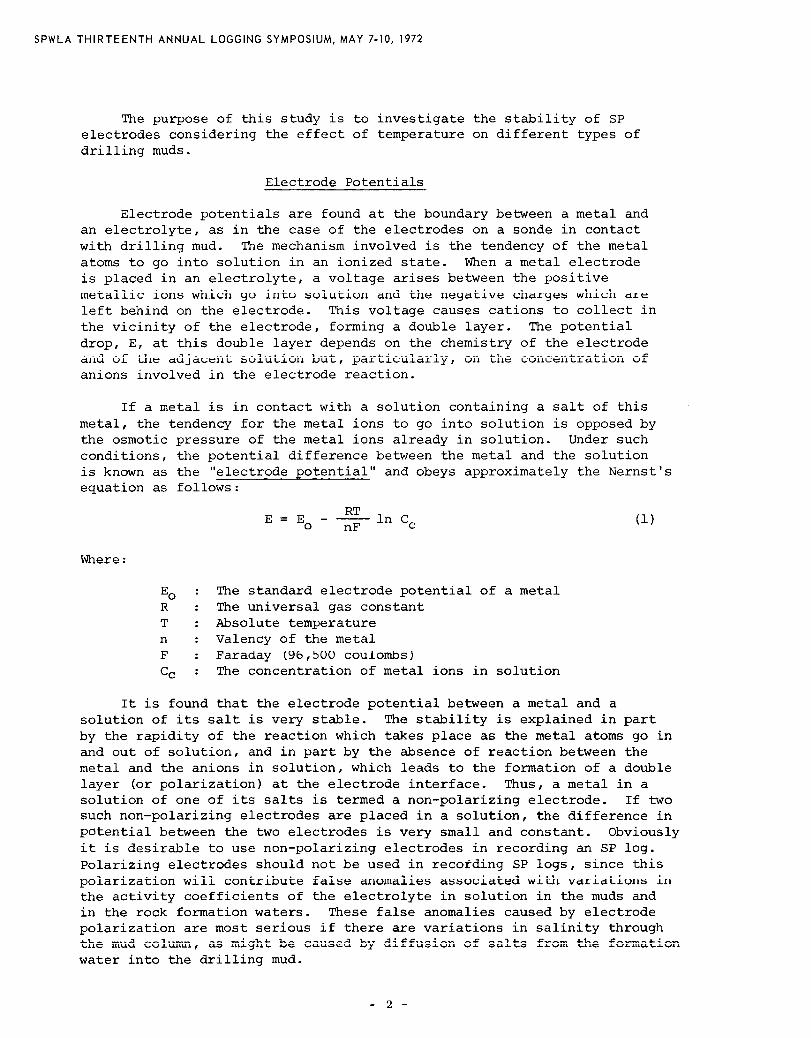
The purpose of this study is to investigate the stability of SP electrodes considering the effect of temperature on different types of drilling muds.
Electrode Potentials
Electrode potentials are found at the boundary between a metal and an electrolyte, as in the case of the electrodes on a sonde in contact with drilling mud. The mechanism involved is the tendency of the metal atoms to go into solution in an ionized state. When a metal electrode is placed in an electrolyte, a voltage arises between the positive metallic ions which go into solution and the negative charges which are left behind on the electrode. This voltage causes cations to collect in the vicinity of the electrode, forming a double layer. The potential
drop, E, at this double layer depends on the chemistry of the electrode and of the adjacent solution but, particularly, on the concentration of anions involved in the electrode reaction.
If a metal is in contact with a solution containing a salt of this
metal, the tendency for the metal ions to go into solution is opposed by the osmotic pressure of the metal ions already in solution. Under such conditions, the potential difference between the metal and the solution is known as the "electrode potential" and obeys approximately the Nernst's equation as follows:
E = E, - -$-In Cc
Where :
E. : The standard electrode potential of a metal R : The universal gas constant T : Absolute temperature n : Valency of the metal F : Faraday (96,500 coulombs) cc : The concentration of metal ions in solution
It is found that the electrode potential between a metal and a solution of its salt is very stable. The stability is explained in part by the rapidity of the reaction which takes place as the metal atoms go in and out of solution, and in part by the absence of reaction between the metal and the anions in solution, which leads to the formation of a double layer (or polarization) at the electrode interface. Thus, a metal in a solution of one of its salts is termed a non-polarizing electrode. If two such non-polarizing electrodes are placed in a solution, the difference in potential between the two electrodes is very small and constant. Obviously it is desirable to use non-polarizing electrodes in recording an SP log. Polarizing electrodes should not be used in recording SP logs, since this polarization will contribute false anomalies associated with variations in the activity coefficients of the electrolyte in solution in the muds and in the rock formation waters. These false anomalies caused by electrode polarization are most serious if there are variations in salinity through the mud column, as might be caused by diffusion of salts from the formation water into the drilling mud.
- 2-

SPWLA THIRTEENTH ANNUAL LOGGING SYMPOSIUM, MAY 7-10, 1972
The electrode potential is proportional to the absolute temperature. The temperature in a well increases with depth, so that the recorded SP curve should show a drift caused by the temperature-induced changes in electrode potential of the moving electrode. This may be seen as follows:
6E = EM - EN = [ E. - +$--ln Ccl -[E M
0 - +$- In Cc3
N (2)
where the indices M and N refer to a moving electrode M in the hole and to a non-moving surface reference electrode N.
While the Nernst equation discussed above applies under thermody- namic equilibrium conditions, i.e. when the cell does not supply any cur-
rent or energy, Bockris (1) has shown that it no longer applies when cur- rent is drawn from the cell and the concept of the overpotential must then be substituted in order to explain the behavior of the metallic contact potential under non-equilibrium conditions. Such conditions exist no matter how small the current intensity drawn from the circuit, such as in order to activate the recording galvanometers of the SP curves. Some ex- amples are on record of SP curves logged by different service companies in the same bore-hole and immediately after one another, where the SP curve details recorded are obviously a function of the SP current withdrawn from the SP cell. This observation will not be elaborated upon but it is an obvious neglected aspect of the SP curve. The Nernst hypothesis is merely unsatisfactory in explaining the fine features of the SP curve.
In the experiments to be described, the emf measurements of the metal electrode potentials were made with a very high input impedance meter so as to minimize the non-equilibrium conditions at the electrodes and thus nearly approach the Nernstian equilibrium conditions.
Experimental Work
Electrode potenti+ measurements were conducted under temperatures ranging from 25 to 80 C. In order to make these measurements, ten drilling muds were prepared in the laboratory and five metallic electrodes were used. In all cases, the cell was formed by immersing a metallic electrode and a reference calomel electrode into a beaker of mud sample.
It may justly be claimed that no two drilling muds are ever identical. Although this does not mean that modern muds cannot be roughly grouped ac- cording to their principal components and chemical additives, it does neces- sarily render rather difficult the choice of suitable muds for a limited series of experiments intended to obtain results of general applicability. With this in mind the following arbitrary selection was made. Ten laboratory- prepared aqueous-base drilling muds, representing common mud types, were made in the laboratory in order to carry out this experimental investigation. These muds, although relatively artificial, covered a wide range of types. Their preparation is given in detail in Table I.
The assembled cell used to measure the electrode potential is shown in Figure 1.
- 3 -

SPWLA THIRTEENTH ANNUAL LOGGING SYMPOSIUM, MAY 7-10, 1972
The electrochemical cells studied were as follows:
(A) Metal // Mud // Sat-KC1 / Hg2 Cl2 / Hg
(B) Metal // Mud / Sat.KCl Salt bridge / Mud // Sat-KC1 /
Hg2 Cl2 / Hg
The five metallic electrodes investigated were: Silver, Platinum, Iron, Lead, and 'ITungsten. Silver and Platinum electrodes manufactured by Beckman Instruments, Inc. were used. Iron, Lead, and Tungsten electrodes were made by the junior author in the laboratory. The wire connections for these last three electrodes were insulated with epoxy and with plastic tape in order to achieve electrical and heat insulation.
1. 2.
3.
4.
5. 6.
7.
The experiments were performed in the following manner:
A sample of 50 ml of mud was placed into a beaker. A calomel electrode calibrated according to instructions and a metallic electrode were rinsed with distilled water and were both immersed into
this beaker. A thermometer, scale O-100
0 C, was positioned between these two elec-
trodes. The two electrodes were connected to a Photovolt electronic pH meter, Model 115. This apparatus is a special type of millivolt potentio- meter designed to measure the emf of a cell at 10 meghoms input im- pedance. The temperature of the system was controlled with a resistance heater. After the cell was mounted and left in equilibrium for a period of at least 30 minutes, a measurement of the emf was taken. This procedure was repeated at least three times, at 5 minute intervals, in order to verify that there was no drift in the emf. The temperature of the system was increased by increments of 5 'C while recording the observed values of electrode potentials.
Another source of temperature dependence was studied for metallic electrodes in the ten muds by a simple experiment. Here, a calomel and a metallic electrode were placed in separate beakers containing identical mud samples connected by means of a saturated KC1 salt bridge. The beaker containing the caiomel electrode was maintained at constant room tempera- ture (21.7 + 0.3 C). The same steps as those just described for the de- termination-of electrode potentials were followed.
Results
The experimentally determined electrode potentials of the five metallic electrodes, considering the effect of temperature of the ten drilling muds used are plotted on Figures 2 to 7. Some of the preliminary conclusions are:
(A1 The electrode potential values of Tungsten, Lead, and Iron glee- trodes were positive in the range of temperature (25 to 80 C) investigated on all the muds.
- 4 -

SPWLA THIRTEENTH ANNUAL LOGGING SYMPOSIUM, MAY 7-10, 1972
(B) The potential of Lead and Iron electrodes became less positive with increase in temperature. To the contrary, the potential of the Tungsten electrode became more positive. For these three electrodes the results are considered relatively stable because the observed variations in electrode potentials were within a
narrow range (3 to 12 mv) and also because the curve pattern is maintained.
(C) The results obtained with the Silver electrode were also satis- factory because the potential was increasing all the time with temperature. It shows almost the same pattern as the Tungsten electrode.
The main difference resides in the changes observed with the Silver electrode. These are:
(1) Negative potentials decreasing with increasing temperature. This kind of pattern is observed with the mud samples No. 1, 5, 7, and 8.
(2) Positive potentials were observed in testing the muds No. 3 and 6. These potentials were increasing with temperature.
(3) Another kind of variation occurred when testing the muds No. 2, 4, 9, and 10. Here, the electrode potential changed from neg- ative to positive while temperature was increasing.
(D) With the Platinum electrode the results obtained were unstable. The degree of instability is indicated by erratic potential variations increasing or decreasing with temperature of the mud. The different unstable patterns observed were as follows:
(1) The potential is negative. Its negativity is larger when in- creasing the temperature.
(2) The potential is negative but the negativity decreases with tem- perature.
(3) The potential is positive and it became less positive with an increasing temperature.
(4) The potential is positive but it increases with higher temperatures.
(5) The potential changes from negative to positive when increasing temperature.
(6) The potential is positive but changing to negative when the tem- perature increases.
The platinum electrode instability is also mentioned by ZoBell (9), who measured redox potentials for four different marine muds with a similar pair of electrodes as used here. He pointed out that "for complex systems,
- 5-

SPWLA THIRTEENTH ANNUAL LOGGING SYMPOSIUM, MAY 7-10, 1972
the effect of temperature on the redox-potential is inconsistant and capricious because of the multiple and unpredictable effects of temper- ature on the stability of reactants, dissociation constants, ionization, hydration, chemical reactivities, solubilities, etc..."
Another reason may be that for a metallic electrode in a drilling mud containing a mixture of many ions, the exact electrode reaction is not readily predictable.
Thirty more experiments were carried-out with more stable electrodes (lead, tungsten, and iron). These measurements were made using a satu-
rated KC1 bridge between the mud and metal electrode tested and the ref- erence electrolyte and calomel electrode. The results obtained were sat- isfactory although the electrode potentials were higher than obtained when working with the first cell. The reason for this increase in potential difference is because the calomelcelectrode has a constant potential (248 mv) at a fixed temperature (21.7 C) whereas its value varied in the pre- vious experiments.
The results are plotted on Fig. 8 to 10. It is observed that the same curve patterns, as before, were obtained for all these three elec- trodes. They indicate that the lead electrode is a more desirable SP electrode, because its variations are less by comparison with the other
metal electrodes.
Finally, forty more experiments were performed in order to investi- gate the reproducibility of the measurements. The results obtained varied from 5 to 10 mv. This variation may be due to poorly poised systems, a characteristic of drilling mud. According to Garrels (2) : "Careful work cannot be duplicated closer than about 5 millivolts and differences in re- plication of measurements on natural media may be of the order of 10 to 20 millivolts."
Field Examples
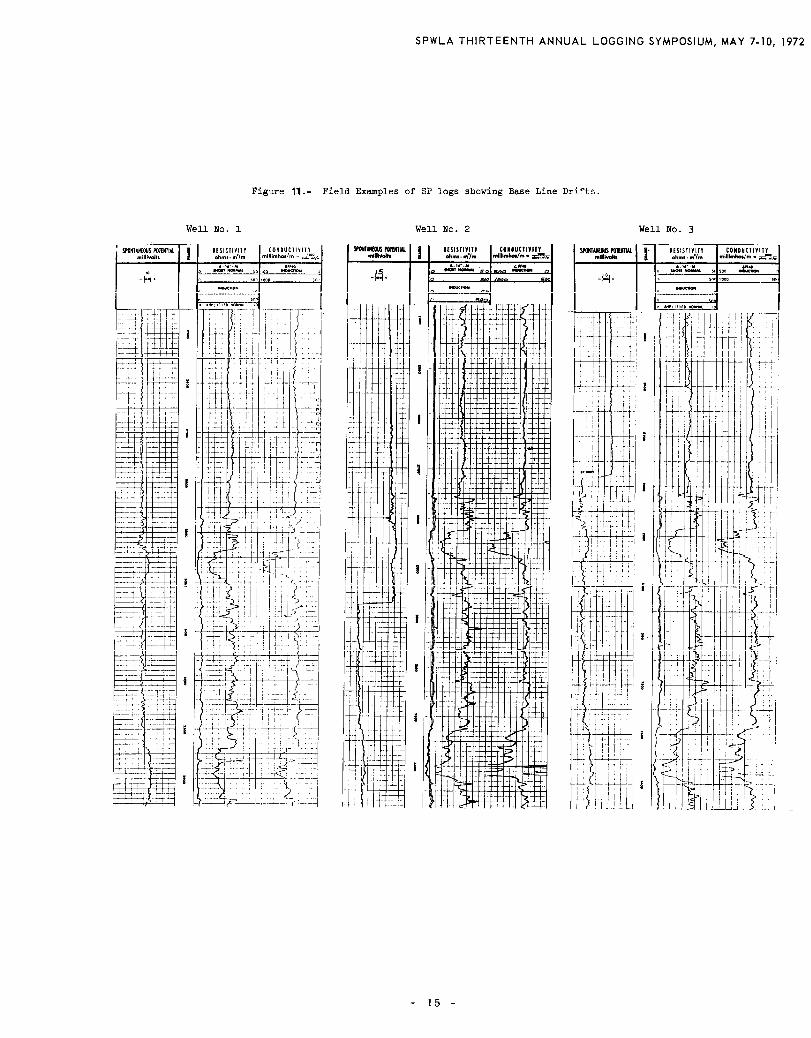
The SP curve obtained in shales is usually approximately a straight line over long distances. For this reason, it is often used as a reference and is called the "shale line" or "base-line" on the SP log. Field expe- rience shows, however, that in certain fields, there are systematic shifts on the shale base-line which occurs always at the same levels in the geo- logical column. In fact, in certain cases, such base-line shifts constitute excellent stratigraphic markers.
A similar remark can be made regarding the drift of the self potential curve observed frequently in the shales associated with fresh water sands. This drift is probably caused by changes in the salinity of the water con- tained in the shale which in turn produces changes in the electromotive force generated in the ground.
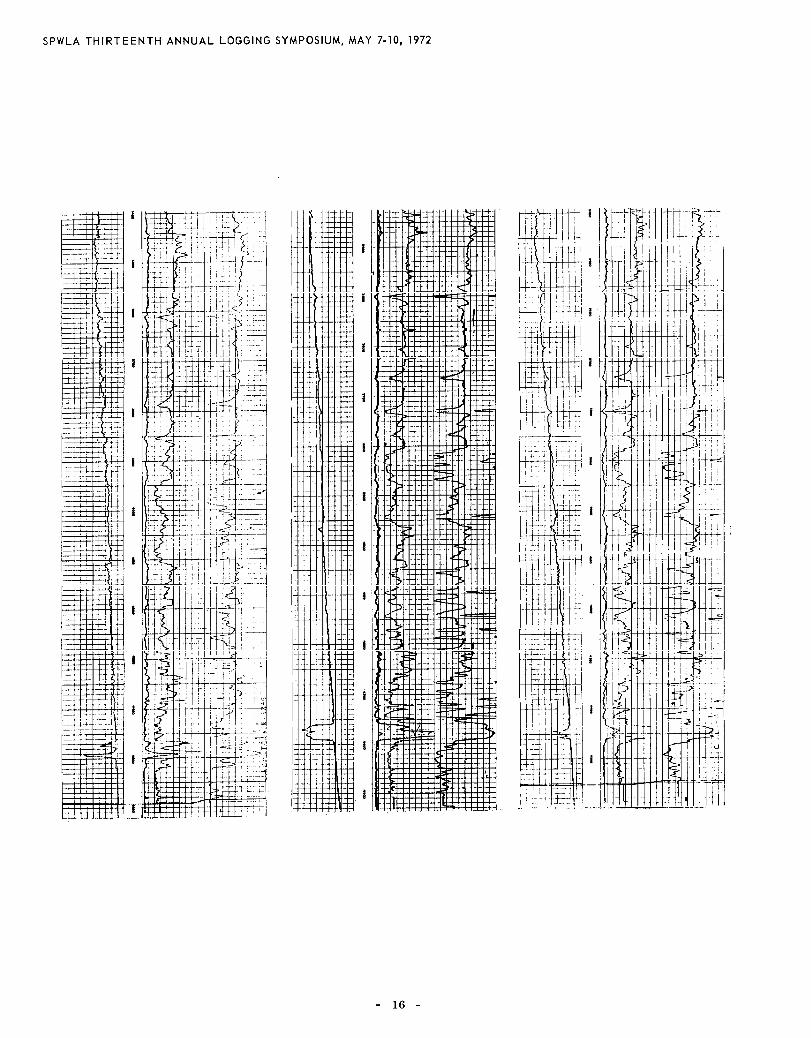
In Fig. 11 are shown three examples of the shale base-line drift. These wells were logged with iron electrodes and it may be that the drift
- 6 -

SPWLA THIRTEENTH ANNUAL LOGGING SYMPOSIUM, MAY 7-10, 1972
is due to temperature effect on the electrode potentials. These drifts
in the three wells are respectively +47, +70, and +60 mv for an increase in depth of 2000', 1400', and 1200'.
The exact cause of this anomaly in the SP curve is unknown. It is so regular that it is logical to assume that one or several of the fol- lowing factors might be responsible for it:
1. Instability and polarization of the electrodes. 2. A variable potential exists between the SP electrode and the mud. 3. Bimetallism 4. Magnetization 5. Telluric currents 6. Temperature and pressure 7. Active electrolytic corrosion 8. Oxidation - reduction potential 9. Stratigraphic potentials 10. Salinity gradient
All these factors have been discussed in the literature cited and will not be further discussed here. The most likely factor, however, appears to be iron electrode instability as a result of temperature vari- ations with depth.
Editor's note: A biography and photo of S. J. Pirson appears with Paper D.
- 7 -

SPWLA THIRTEENTH ANNUAL LOGGING SYMPOSIUM, MAY 7-10, 1972
References
1. Bockris, J. 0. M. - "Overpotential - A Lacuna in Scientific Knowledge" - Journal of Chemical Education 48 - No. 6 (June, 1971) pp. 352-358. -
2. Garrels, R. M.: Mineral Equilibria at Low Temperature and Pressure, Harper & Brothers, Publishers, N.Y. (1960) pp. 61-74
3. Gondouin, M., Tixier, M. P., and Simard, G. L. : “An Experimental Study of the Influence of the Chemical Composition of Electrolytes on the SP Curve", Trans. AIME (1957), Vol. 210, pp. 58-72 ~-
4. Guyod, H.: "Electrical Potentials in Bore Holes". Oil Weekly, (Nov. 20- 27, 1944), Vol. 115, Nos. 12 and 13.
5. Lynch, E. J.: Formation Evaluation, First Ed., Harper and Row, Publishers, N.Y. (1962) pp. 83-226
6. Pirson, S. J.: Handbook of Well Log Analysis, Prentice-Hall, Inc. Engle- wood Cliffs, N.Y. (1963) pp. 65-70
7. Pirson, S. J.: "A Study of the SP Curve", The Oil and Gas Journal, (Oct. 4, 1947) Vol. 46 pp. 72-88
8. Pirson, S. J.: "Redox Log Interprets Reservoir Potential". The Oil and Gas Journal, (July 29, 1968) Vol. 66 pp. 69-75
9. ZoBell, C. E.: "Studies on Redox Potentials of Marine Sediments", Bulletin of the American Association of Petroleum Geologist; Vol. 30 (April, 1946) pp. 477-513
- 8 -

SPWLA THIRTEENTH ANNUAL LOGGING SYMPOSIUM, MAY 7-10, 1972
MUD No. 1
MUD No. 2
MUD No. 3
MUD No. 4
MUD No. 5
MUD No. 6
MUD No. 7
MUD No. 8
MUD No. 9
MUD No.10
TABLE I
TYPE OF DRILLING MUDS USED
Tap water: Aquagel: Caustic Lignite:
Tap water: Aquagel: Q. Broxin: Caustic Soda Soln:
Tap water Aquagel:
Tap water Aquagel: Quebracho: Caustic Soda Soln:
Distilled Water: Aquagel:
Zeogel: Tap water + 30% Nacl:
Tap water: Aquagel: Q. Broxin: Cellex: Caustic Soda Soln:
Natural Mud
Tap water Aquagel: &. Broxin Caus.tic Soda Soln: Diesel Oil:
Tap water: Aquagel: Q. Broxin: Caustic Soda Soln: Imperrrex: Impermex Preservative:
350 cc 20.0 prms 2.0 gms
350 cc 20 gms 2.0 gms 1.05 cc
350 cc 20 gms
350 cc 20 gms 2.0 gms 1.05 cc
350 cc 21.0 gms
21.0 gms 350 cc
350 cc 20 gms 2.0 gms
0.5 gms 1.05 cc
350 cc 20. gms 2.0 gms 1.05 cc 35.0 cc
350 cc 20 gms 2.0 gms 1.05 cc 3.0 gms 0.5 Qms
- 9 -

Thermometer
Calomel Electrode
Yetal Electrode
Electrode wire connections
Electrode support Rod
110 volts, cycles, AC
Figure l.- Assembled Cell for Electrode-Potential Measurements.
+200
+150
+100 1
-150
F
LEGEND
3 Mud 1
3 Mud 2
> Mud 3
!l Mud 4
~Mud 5
D Mud 6
n Mud 7
0 Mud 6
3 Mud 9
n Mud10
-200 10 20 30 40 50 60 70 80
Temperature ('C)
Figure 2.- Effect of Mud Type on Electrode Potential Cells without Saturated KC1 Bridge Calomel - Platinum Electrodes
L D r r

SPWLA
TH
IRTEEN
TH
AN
NU
AL
LOG
GIN
G
SYMPO
SIUM
, M
AY
7-10, 1972

570
550
530
510
~
7 s A 490 -
.A z J !z 470 - $
I :: % c 0
N d 450 -
I
430 -
410
390
LEGESD
OMud 1
OMud 2
OMud 3
AM~CI 4
AMud 5
bMud 6
0 Mud 7
OMud 8
OMud 9
0 Mud 10
10 20 30 40 50 60 70 80
Temperature (Oc)
440’ ’ ’ ’ ’ ’ 1 ’ ’ ’ ’ ’ ’ ’ ’ 10 20 30 40 50 60 70 80
Temperature ('C)
Figure 5.- Effect of Mud Type on Electrode Potential Cells without Saturated KC1 Bridge
Figure 6.- Effect of Mud Type on Electrode Potential Cells without Saturated KC1 Bridge
Calomel - Lead Electrodes Calomel - Iron Electrodes
620 -
600 -
580 -
560 -
‘;‘ s
? ‘;t 540 -
B z a
3 E 520 -
%
d
500 -
480 -
460 -
LEGEKE
OMud 1
0 Mud 2
3Mud 3
AMud 4
h Mud 5
bMud 6
cl Mud 7
OMud 8
OMud 9
0 Mud 10
P r r
0
2 ?i
p

SP
WLA
T
HIR
TE
EN
TH
A
NN
UA
L LO
GG
ING
S
YM
PO
SIU
M,
MA
Y
7- 10, 1972

580 -
560 -
540 -
520 -
7 b
7d 500 -
.A s s
& 480 -
2 , 9
z :: z - w 460
I
440 -
420 -
400 t-
LEGEND
0 !.Qlud 1
0 Mud 2
0 Mud 3
A Mud 4
h Mud 5
b Mud 6
0 Mud 7
0 Mud 8
0 Mud 9
0 Mud 10
10 20 30 40 50 60
Temperature ('C)
Figure 9.- Effect of Mud Type on Electrode Potential Cells with saturated KC1 Bridge Calomel - Leaa Electrodes
640 r
620
600
580
560
540
520
50C
48C
I -
I_
,- 46C
LEEND
0 Mud 1
Cl Mud 2
0 Mud 3
A Mud 4
kMud 5
b Mud 6
0 Mud 7
0 Mud 8
0 Mud 9
n Mud 10
10
I I 11 1 ’ 1 ” ” ” 20 30 40 50 60 70 80
Temperature ?C)
Figure lO.- Potential Effect of Mud Type on Electrade Cells with Saturated KC1 Bridge Caiomel - Iron Electrodes
SPWLA THIRTEENTH ANNUAL LOGGING SYMPOSIUM, MAY 7-10, 1972
Figure II.- Field Examples of SP logs showing Base Line Dri?s.
Well No. 3
- 15 -
SPWLA THIRTEENTH ANNUAL LOGGING SYMPOSIUM, MAY 7-10, 1972
- 16 -